UNITED STATES
SECURITIES AND EXCHANGE COMMISSION
Washington, D.C. 20549
FORM N-CSRS
CERTIFIED SHAREHOLDER REPORT OF REGISTERED
MANAGEMENT INVESTMENT COMPANIES
Investment Company Act file number: 811-22311
Schwab Strategic Trust – Schwab U.S. REIT ETF and Fundamental Index ETFs
(Exact name of registrant as specified in charter)
211 Main Street, San Francisco, California 94105
(Address of principal executive offices) (Zip code)
Marie Chandoha
Schwab Strategic Trust
211 Main Street, San Francisco, California 94105
(Name and address of agent for service)
Registrant’s telephone number, including area code: (415) 627-7000
Date of fiscal year end: February 28
Date of reporting period: August 31, 2017
Item 1: Report(s) to Shareholders.
Semiannual Report | August 31, 2017
Schwab U.S. REIT ETF™
Fund investment adviser: Charles Schwab Investment Management, Inc. (CSIM).
Distributor: SEI Investments Distribution Co. (SIDCO)
The Sector/Industry classifications in this report use the Global Industry Classification Standard (GICS), which was developed by and is the exclusive property of MSCI Inc. (MSCI) and Standard & Poor’s (S&P). GICS is a service mark of MSCI and S&P and has been licensed for use by Charles Schwab & Co., Inc. The Industry classifications used in the schedule of Portfolio Holdings are sub-categories of Sector classifications.
Schwab U.S. REIT ETF | Semiannual Report
The performance data quoted represents past performance. Past performance does not guarantee future results. Investment return and principal value of an investment will fluctuate so that an investor’s shares, when sold or redeemed, may be worth more or less than the original cost. Current performance may be lower or higher than the performance quoted. To obtain performance information current to the most recent month end, please visit www.schwabfunds.com/schwabetfs_prospectus.
| Total Returns for the 6 Months Ended August 31, 2017 |
| Schwab U.S. REIT ETF (Ticker Symbol: SCHH) | |
| Market Price Return1 | -1.10% |
| NAV Return1 | -1.17% |
| Dow Jones U.S. Select REIT IndexTM | -1.11% |
| ETF Category: Morningstar Real Estate2 | 1.02% |
| Performance Details | pages 7-8 |
All total returns on this page assume dividends and distributions were reinvested. Index figures do not include trading and management costs, which would lower performance. Indices are unmanaged and cannot be invested in directly. Performance results less than one year are not annualized.
For index definitions, please see the Glossary.
Small-company stocks are subject to greater volatility than many other asset classes.
The fund is subject to risks associated with the direct ownership of real estate securities and an investment in the fund will be closely linked to the performance of the real estate markets.
Performance does not reflect the deduction of taxes that a shareholder would pay on fund distributions or on the redemption of fund shares.
Shares are bought and sold at market price, which may be higher or lower than the net asset value (NAV). Brokerage commissions will reduce returns.
Index ownership — Dow Jones® is a registered trademark of Dow Jones Trademark Holdings LLC (Dow Jones). The Dow Jones U.S. Select REIT Index is a product of S&P Dow Jones Indices LLC and/or its affiliates, and has been licensed for use by CSIM. The Schwab U.S. REIT ETF is not sponsored, endorsed, sold or promoted by S&P Dow Jones Indices LLC, Dow Jones, or any of their respective affiliates and neither S&P Dow Jones Indices LLC, Dow Jones, nor any of their respective affiliates make any representation regarding the advisability of investing in such product.
| 1 | ETF performance must be shown based on both a market price and NAV basis. The fund’s per share NAV is the value of one share of the fund. NAV is calculated by taking the fund’s total assets (including the market value of securities owned), subtracting liabilities, and dividing by the number of shares outstanding. The NAV Return is based on the NAV of the fund, and the Market Price Return is based on the market price per share of the fund. The price used to calculate market return (Market Price) is determined by using the midpoint between the highest bid and the lowest offer on the primary stock exchange on which the shares of the fund are listed for trading, as of the time that the fund’s NAV is calculated. Market Price and NAV returns assume that dividends and capital gain distributions have been reinvested in the fund at Market Price and NAV, respectively. |
| 2 | Source for category information: Morningstar, Inc. The Morningstar Category return represents all passively- and actively-managed ETFs within the category as of the report date. |
Schwab U.S. REIT ETF | Semiannual Report
Marie Chandoha
President and CEO of
Charles Schwab Investment
Management, Inc. and the
fund covered in this report.
Dear Shareholder,
For more than 25 years, Charles Schwab Investment Management has been driven to give investors what they want and need—without confusion. One of our goals has been to reduce the complexity of investing. Our mutual funds and exchange-traded funds (ETFs) support this mission by reducing the complexity involved with building a diversified portfolio.
Investing in real estate can seem daunting to some investors, involving a layer of difficulty above and beyond traditional investments. The Schwab U.S. REIT ETF has made real estate equity investing more manageable by eliminating the need to select individual securities, saving shareholders both time and money. And with expenses among the lowest in the industry, the fund’s benefits are accessible to everyone.
At Charles Schwab Investment Management, we also strive to take a straightforward approach in our communications. In this and in every shareholder report, we provide the fund’s financial statements and other information in a consistent format that we believe will help you to evaluate the performance of the fund. We aim to help you understand not only the fund’s return, but also how its investments are managed.
Our commitment to quality and transparency continues to win us both new business and recognition. In this year’s second quarter, we achieved the largest ETF asset inflows in our history, topping $6 billion in quarterly flows for
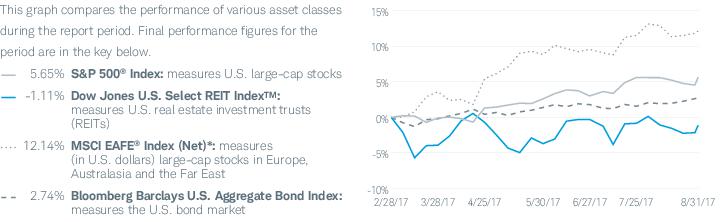
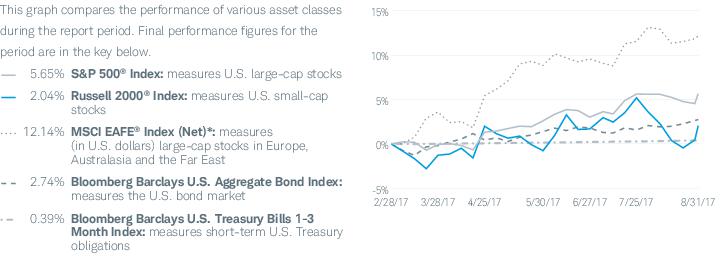
Asset Class Performance Comparison % returns during the 6 months ended August 31, 2017
These figures assume dividends and distributions were reinvested. Index figures do not include trading and management costs, which would lower performance. Indices are unmanaged and you cannot invest in them directly. Remember that past performance is not a guarantee of future results.
For index definitions, please see the Glossary.
Data source: Index provider websites and CSIM.
Nothing in this report represents a recommendation of a security by the investment adviser.
Management views may have changed since the report date.
| * | The net version of the index reflects reinvested dividends net of withholding taxes, but reflects no deductions for expenses or other taxes. |
Schwab U.S. REIT ETF | Semiannual Report
From the President (continued)
“ Our commitment to quality and transparency continues to win us both new business and recognition.”
the second time since we began offering ETFs in 2009. And recently, we were selected as one of Morningstar’s “9 Partners for the Next Decade,”1 reflecting our differentiation, low costs, repeatable investment processes, and adaptable business models.
We’re proud of these achievements, but more importantly, we’re honored to serve our investors. We’re committed to putting investors first by reducing complexity—a commitment that will continue to inform how we operate and the decisions that we make.
Thank you for investing with Charles Schwab Investment Management. For more information about the Schwab U.S. REIT ETF, please continue reading this report. In addition, you can find further details about this fund by visiting our website at www.schwabfunds.com. We are also happy to hear from you at 1-877-824-5615.
Sincerely,
| 1 | Morningstar, “9 Partners for the Next Decade.” Laura Pavlenko Lutton and Greggory Warren, CFA: April 27, 2017. Morningstar looked collectively across four traits (differentiation, low costs, repeatable investment processes, and adaptable business models) to identify firms that they believe are representative of these trends. |
Schwab U.S. REIT ETF | Semiannual Report
The Investment Environment
Over the six-month reporting period ended August 31, 2017, U.S. REITs produced mixed returns, with the Industrial and Diversified sectors producing solid returns while the Office and Retail sectors fell behind. The broader U.S. economy continued its slow but steady recovery and overall real estate fundamentals stayed resilient. Driven by a strong job market and low mortgage rates, housing demand remained strong, with foreign investment in the U.S. housing market reaching record highs over the reporting period. In this environment, the Dow Jones U.S. Select REIT IndexTM returned -1.11% for the six-month reporting period, and the FTSE EPRA/NAREIT Global Index (Net), representing general trends in eligible real estate securities worldwide, returned 5.28%. The overall U.S. stock market, as measured by the S&P 500® Index, returned 5.65% for the reporting period.
The U.S. economy continued to chug along over the reporting period as it entered its ninth year of expansion. Nonfarm payrolls were steady and U.S. gross domestic product (GDP) grew modestly, while consumer confidence remained high. A stable economy, combined with relatively low short-term interest rates, generally supported the overall U.S. real estate market. A positive consumer outlook was especially evident in the residential housing market, with the Fannie Mae Home Purchase Sentiment Index®, matching its all-time high in June. Over the reporting period, the office market saw tenant demand solidify as new supply increased, while industrial rents maintained an upward trajectory and reached an all-time high in the second quarter of 2017. The U.S. retail market fell over the reporting period with a decline in overall retail investments and headwinds from the sustained growth of e-commerce. Some additional signs of weakness were present during the six-month reporting period, including rising commercial mortgage defaults and softening rental growth in the U.S. family property market, though overall positive economic measurements helped offset some of these negative factors.
During the reporting period, the Federal Reserve (Fed) continued making progress toward a more normalized monetary policy environment. The Fed raised the target federal funds rate by 0.25% at meetings in March and in June, with short-term interest rates ending the reporting period in a target range of 1.00% to 1.25%. The Fed also communicated plans to begin unwinding its massive balance sheet later in 2017 by allowing securities to mature without reinvesting the proceeds. According to Fed Chair Janet Yellen, the Fed anticipates “…reducing reserve balances and our overall balance sheet to levels appreciably below those seen in recent years but larger than before the financial crisis.” These shifts in policy signaled the Fed’s increasing confidence in the strength of the U.S. economy, as well as in its progress toward goals of price stability and maximum sustainable employment. While dividend-paying investments (including REITs) are subject to interest-rate risk and can lose ground in a rising rate environment, continued strength in U.S. economic fundamentals provided a tailwind to some of these types of securities over the reporting period.
Over the six-month reporting period, the performance of U.S. REITs was mixed. Retail REITs had the worst returns in the Dow Jones U.S. Select REIT Index, due in large part to the negative performance of regional malls amid the closing of anchor stores and tenant bankruptcies. Continued competition from e-commerce and declining occupancy rates also played a role, as did rising short-term interest rates. By comparison, Industrial REITs generated double-digit returns and continued to be a top performer in the Dow Jones U.S. Select REIT Index. Industrial rents maintained an upward trajectory and reached an all-time high in the second quarter of 2017 as demand for space from e-commerce companies was greater than available supply. Industrials are also less sensitive to rising interest rates, helped even further by the high rent growth, and so were less affected by the Fed’s federal funds rate increases.
All total returns on this page assume dividends and distributions were reinvested. Index figures do not include trading and management costs, which would lower performance. Indices are unmanaged and cannot be invested in directly. Performance results less than one year are not annualized.
For index definitions, please see the Glossary.
Nothing in this report represents a recommendation of a security by the investment adviser.
Management views may have changed since the report date.
Schwab U.S. REIT ETF | Semiannual Report
 | Christopher Bliss, CFA, Vice President and Head of the Passive Equity Team, leads the portfolio management team for Schwab’s Passive Equity Funds and ETFs. He also has overall responsibility for all aspects of the management of the fund. Prior to joining CSIM in 2016, Mr. Bliss spent 12 years at BlackRock (formerly Barclays Global Investors) managing and leading institutional index teams, most recently as a Managing Director and Head of Americas Institutional Index team. Prior to BlackRock, he worked as an equity analyst and portfolio manager for Harris Bretall and before that, as a research analyst for JP Morgan. |
 | Ferian Juwono, CFA, Senior Portfolio Manager, is responsible for the day-to-day co-management of the fund. Prior to joining CSIM in 2010, Mr. Juwono worked at BlackRock (formerly Barclays Global Investors), where he spent more than three years as a portfolio manager, managing equity index funds for institutional clients, and nearly two years as a senior business analyst. Prior to that, Mr. Juwono worked for more than four years as a senior financial analyst with Union Bank of California. |
 | Sabya Sinha, Portfolio Manager, is responsible for the day-to-day co-management of the fund. Prior to joining CSIM in 2015, Mr. Sinha spent a year at F-Squared Investments on the product development and analytics team. Prior to F-Squared, he worked at IndexIQ Advisors as a senior index portfolio manager for three years and for Bank of America’s Columbia Management subsidiary as a portfolio manager for three years. |
Schwab U.S. REIT ETF | Semiannual Report
The performance data quoted represents past performance. Past performance does not guarantee future results. Investment return and principal value of an investment will fluctuate so that an investor’s shares, when sold or redeemed, may be worth more or less than the original cost. Current performance may be lower or higher than the performance quoted. To obtain performance information current to the most recent month end, please visit www.schwabfunds.com/schwabetfs_prospectus.
Average Annual Total Returns1
| Fund and Inception Date | 6 Months | 1 Year | 5 Years | Since Inception* |
| Fund: Schwab U.S. REIT ETF (1/13/11) | | | | |
| Market Price Return2 | -1.10% | -3.28% | 8.52% | 10.36% |
| NAV Return2 | -1.17% | -3.32% | 8.54% | 10.35% |
| Dow Jones U.S. Select REIT IndexTM | -1.11% | -3.13% | 8.67% | 10.50% |
| ETF Category: Morningstar Real Estate3 | 1.02% | 0.32% | 8.52% | 9.82% |
| Fund Expense Ratio4: 0.07% |
All total returns on this page assume dividends and distributions were reinvested. Index figures do not include trading and management costs, which would lower performance. Indices are unmanaged and cannot be invested in directly. Performance results less than one year are not annualized.
For index definitions, please see the Glossary.
Small-company stocks may be subject to greater volatility than many other asset classes.
The fund is subject to risks associated with the direct ownership of real estate securities, and an investment in the fund will be closely linked to the performance of the real estate markets.
Shares are bought and sold at market price, which may be higher or lower than the net asset value (NAV). Brokerage commissions will reduce returns.
Index ownership — Dow Jones® is a registered trademark of Dow Jones Trademark Holdings LLC (Dow Jones). The Dow Jones U.S. Select REIT Index is a product of S&P Dow Jones Indices LLC and/or its affiliates, and has been licensed for use by CSIM. The Schwab U.S. REIT ETF is not sponsored, endorsed, sold or promoted by S&P Dow Jones Indices LLC, Dow Jones, or any of their respective affiliates and neither S&P Dow Jones Indices LLC, Dow Jones, nor any of their respective affiliates make any representation regarding the advisability of investing in such product.
| * | Inception (1/13/11) represents the date that the shares began trading in the secondary market. |
| 1 | Performance does not reflect the deduction of taxes that a shareholder would pay on fund distributions or on the redemption of fund shares. |
| 2 | ETF performance must be shown based on both a market price and NAV basis. The fund’s per share NAV is the value of one share of the fund. NAV is calculated by taking the fund’s total assets (including the market value of securities owned), subtracting liabilities, and dividing by the number of shares outstanding. The NAV Return is based on the NAV of the fund, and the Market Price Return is based on the market price per share of the fund. The price used to calculate market return (Market Price) is determined by using the midpoint between the highest bid and the lowest offer on the primary stock exchange on which the shares of the fund are listed for trading, as of the time that the fund’s NAV is calculated. NAV is used as a proxy for purposes of calculating Market Price Return on inception date. Market Price and NAV returns assume that dividends and capital gain distributions have been reinvested in the fund at Market Price and NAV, respectively. |
| 3 | Source for category information: Morningstar, Inc. The Morningstar Category return represents all passively- and actively-managed ETFs within the category as of the report date. |
| 4 | As stated in the prospectus. |
Schwab U.S. REIT ETF | Semiannual Report
Performance and Fund Facts as of August 31, 2017
| Number of Holdings | 108 |
| Weighted Average Market Cap (millions) | $16,740 |
| Price/Earnings Ratio (P/E) | 34.6 |
| Price/Book Ratio (P/B) | 2.3 |
| Portfolio Turnover Rate2,3 | 5% |
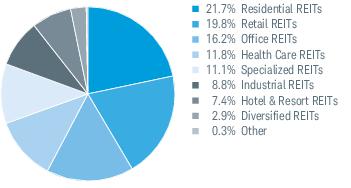
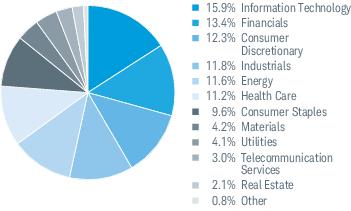
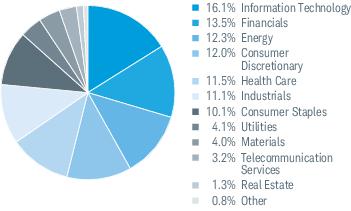
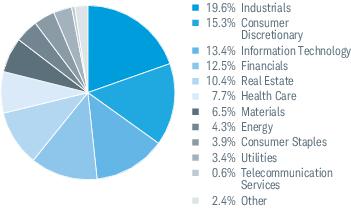
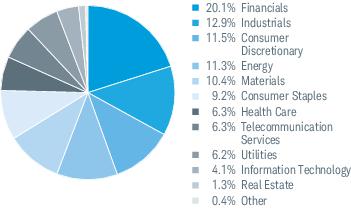
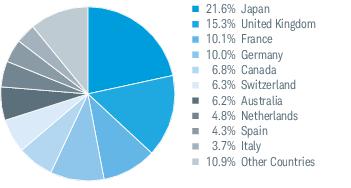
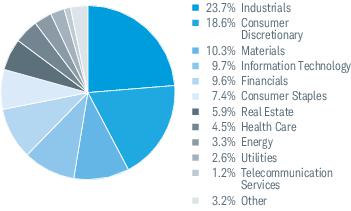
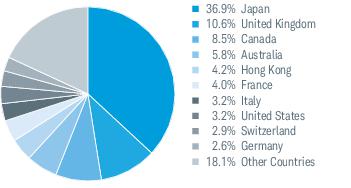
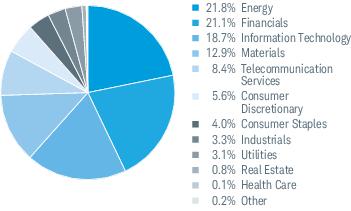
Sector Weightings % of Investments4
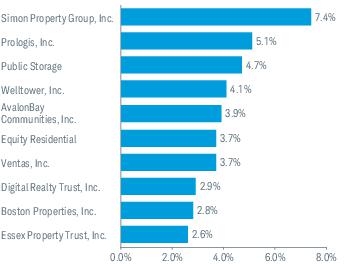
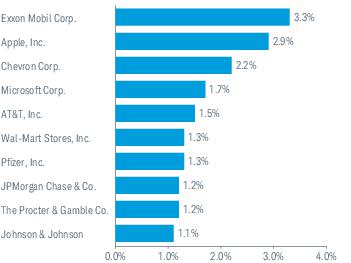
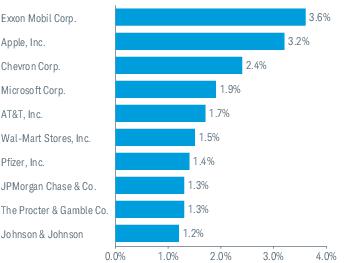
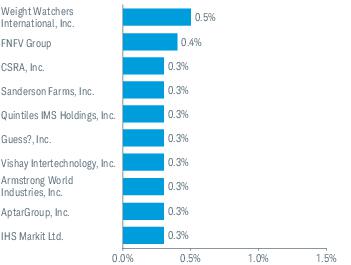
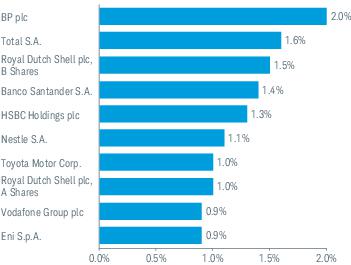
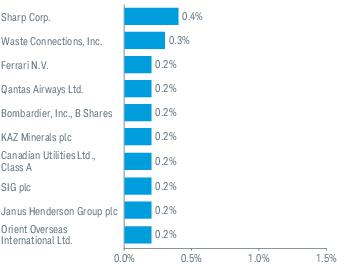
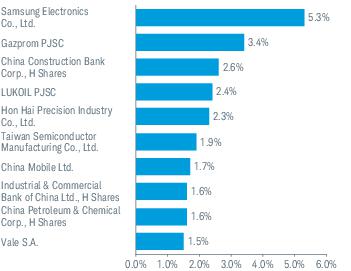
Top Equity Holdings % of Net Assets5
Portfolio holdings may have changed since the report date.
An index is a statistical composite of a specified financial market or sector. Unlike the fund, an index does not actually hold a portfolio of securities and its return is not inclusive of trading and management costs incurred by the fund.
Source of Sector Classification: S& P and MSCI.
| 1 | Excludes derivatives. |
| 2 | Not annualized. |
| 3 | Portfolio turnover rate excludes securities received or delivered from processing of in-kind creations or redemptions. |
| 4 | The percentage may differ from the Portfolio Holdings because the above calculation is based on a percentage of total investments, excluding derivatives, whereas the calculation in the Portfolio Holdings is based on a percentage of net assets. |
| 5 | This list is not a recommendation of any security by the investment adviser. |
Schwab U.S. REIT ETF | Semiannual Report
Fund Expenses (Unaudited)
Examples for a $1,000 Investment
As a fund shareholder, you may incur two types of costs: (1) transaction costs, including brokerage commissions on purchases and sales of fund shares; and, (2) ongoing costs, including management fees.
The expense examples below are intended to help you understand your ongoing cost (in dollars) of investing in the fund and to compare this cost with the ongoing cost of investing in other mutual funds. These examples are based on an investment of $1,000 invested for six months beginning March 1, 2017 and held through August 31, 2017.
Actual Return line in the table below provides information about actual account values and actual expenses. You may use this information, together with the amount you invested, to estimate the expenses that you paid over the period. To do so, simply divide your account value by $1,000 (for example, an $8,600 account value ÷ $1,000 = 8.6), then multiply the result by the number given for the fund under the heading entitled “Expenses Paid During Period.”
Hypothetical Return line in the table below provides information about hypothetical account values and hypothetical expenses based on the fund’s actual expense ratio and an assumed return of 5% per year before expenses. Because the return used is not an actual return, it may not be used to estimate the actual ending account value or expenses you paid for the period.
You may use this information to compare the ongoing costs of investing in the fund and other funds. To do so, compare this 5% hypothetical example with the 5% hypothetical examples that appear in the shareholder reports of the other funds.
Please note that the expenses shown in the table are meant to highlight your ongoing costs only, and do not reflect any transactional costs, including any brokerage commissions you may pay when purchasing or selling shares of a fund. Therefore, the hypothetical return lines of the table are useful in comparing ongoing costs only, and will not help you determine the relative total costs of owning different funds. In addition, if these transactional costs were included, your costs would have been higher.
| | Expense Ratio
(Annualized)1 | Beginning
Account Value
at 3/1/17 | Ending
Account Value
(Net of Expenses)
at 8/31/17 | Expenses Paid
During Period
3/1/17-8/31/172 |
| Schwab U.S. REIT ETF | | | | |
| Actual Return | 0.07% | $1,000.00 | $ 988.30 | $0.35 |
| Hypothetical 5% Return | 0.07% | $1,000.00 | $1,024.85 | $0.36 |
| 1 | Based on the most recent six-month expense ratio; may differ from the expense ratio provided in the Financial Highlights which covers a 12-month period. |
| 2 | Expenses for the fund are equal to its annualized expense ratio, multiplied by the average account value over the period, multiplied by the 184 days of the period, and divided by 365 days of the fiscal year. |
Schwab U.S. REIT ETF | Semiannual Report
Financial Statements
Financial Highlights
| | 3/1/17–
8/31/17* | 3/1/16–
2/28/17 | 3/1/15–
2/29/16 | 3/1/14–
2/28/15 | 3/1/13–
2/28/14 | 3/1/12–
2/28/13 |
| Per-Share Data |
| Net asset value at beginning of period | $42.08 | $37.71 | $40.04 | $33.06 | $31.96 | $28.30 |
| Income (loss) from investment operations: | | | | | | |
| Net investment income (loss) | 0.75 1 | 1.04 1 | 1.03 1 | 0.92 | 0.80 | 0.72 |
| Net realized and unrealized gains (losses) | (1.24) | 4.48 | (2.38) | 6.91 | 1.08 | 3.71 |
| Total from investment operations | (0.49) | 5.52 | (1.35) | 7.83 | 1.88 | 4.43 |
| Less distributions: | | | | | | |
| Distributions from net investment income | (0.36) | (1.15) | (0.98) | (0.85) | (0.78) | (0.77) |
| Net asset value at end of period | $41.23 | $42.08 | $37.71 | $40.04 | $33.06 | $31.96 |
| Total return | (1.17%) 2 | 14.74% | (3.41%) | 24.04% | 6.08% | 15.83% |
| Ratios/Supplemental Data |
| Ratios to average net assets: | | | | | | |
| Total expenses | 0.07% 3 | 0.07% | 0.07% | 0.07% | 0.07% | 0.10% 4 |
| Net investment income (loss) | 3.65% 3 | 2.50% | 2.70% | 2.56% | 2.52% | 2.43% |
| Portfolio turnover rate5 | 5% 2 | 14% | 12% | 15% | 11% | 7% |
| Net assets, end of period (x 1,000) | $3,613,831 | $3,037,968 | $1,823,208 | $1,269,306 | $790,052 | $466,567 |
| |
1
Calculated based on the average shares outstanding during the period.
2
Not annualized.
3
Annualized.
4
Effective September 20, 2012, the annual operating expense ratio was reduced. The ratio presented for the period ended 2/28/13 is a blended ratio.
5
Portfolio turnover rate excludes securities received or delivered from processing of in-kind creations or redemptions.
Schwab U.S. REIT ETF | Semiannual Report
Portfolio Holdings as of August 31, 2017 (Unaudited)
This section shows all the securities in the fund's portfolio and their values as of the report date.
The fund files its complete schedule of portfolio holdings with the SEC for the first and third quarters of each fiscal year on Form N-Q. The fund's Form N-Q is available on the SEC's website at www.sec.gov and may be viewed and copied at the SEC's Public Reference Room in Washington, D.C. Call 1-800-SEC-0330 for information on the operation of the Public Reference Room. The fund also makes available its complete schedule of portfolio holdings on a daily basis on the fund's website at www.schwabfunds.com/schwabetfs_prospectus.
| Security | Number
of Shares | Value ($) |
| Common Stock 99.8% of net assets |
| |
| Diversified REITs 2.9% |
| American Assets Trust, Inc. | 227,728 | 9,250,311 |
| First Potomac Realty Trust | 326,469 | 3,633,600 |
| Forest City Realty Trust, Inc., Class A | 1,193,514 | 28,596,596 |
| Liberty Property Trust | 808,000 | 34,420,800 |
| PS Business Parks, Inc. | 106,036 | 14,326,524 |
| Washington Real Estate Investment Trust | 420,112 | 13,804,880 |
| | | 104,032,711 |
| |
| Health Care REITs 11.8% |
| HCP, Inc. | 2,572,252 | 76,678,832 |
| Healthcare Realty Trust, Inc. | 676,659 | 22,519,212 |
| LTC Properties, Inc. | 216,052 | 10,506,609 |
| Quality Care Properties, Inc. * | 505,913 | 6,941,126 |
| Senior Housing Properties Trust | 1,291,216 | 25,462,779 |
| Universal Health Realty Income Trust | 71,062 | 5,380,104 |
| Ventas, Inc. | 1,943,504 | 133,013,414 |
| Welltower, Inc. | 2,004,746 | 146,787,502 |
| | | 427,289,578 |
| |
| Hotel & Resort REITs 7.5% |
| Apple Hospitality REIT, Inc. | 856,929 | 15,578,969 |
| Ashford Hospitality Prime, Inc. | 174,060 | 1,674,457 |
| Ashford Hospitality Trust, Inc. | 435,954 | 2,707,274 |
| Chesapeake Lodging Trust | 332,449 | 8,507,370 |
| DiamondRock Hospitality Co. | 1,110,087 | 12,199,856 |
| FelCor Lodging Trust, Inc. | 722,841 | 5,276,739 |
| Hersha Hospitality Trust | 228,818 | 4,242,286 |
| Hospitality Properties Trust | 894,375 | 24,470,100 |
| Host Hotels & Resorts, Inc. | 4,047,127 | 73,333,941 |
| LaSalle Hotel Properties | 620,180 | 17,600,709 |
| Park Hotels & Resorts, Inc. | 783,889 | 20,921,998 |
| Pebblebrook Hotel Trust | 379,783 | 12,756,911 |
| RLJ Lodging Trust | 689,213 | 13,908,318 |
| Ryman Hospitality Properties, Inc. | 278,038 | 16,521,018 |
| Summit Hotel Properties, Inc. | 583,692 | 8,661,989 |
| Sunstone Hotel Investors, Inc. | 1,200,408 | 18,966,447 |
| Xenia Hotels & Resorts, Inc. | 583,268 | 11,642,029 |
| | | 268,970,411 |
| |
| Industrial REITs 8.8% |
| DCT Industrial Trust, Inc. | 505,742 | 29,510,046 |
| Duke Realty Corp. | 1,948,174 | 57,899,731 |
| EastGroup Properties, Inc. | 185,869 | 16,516,319 |
| First Industrial Realty Trust, Inc. | 640,010 | 19,827,510 |
| Prologis, Inc. | 2,901,765 | 183,855,831 |
| Rexford Industrial Realty, Inc. | 389,120 | 11,693,056 |
| | | 319,302,493 |
| |
| Office REITs 16.2% |
| Alexandria Real Estate Equities, Inc. | 498,953 | 60,527,988 |
| Boston Properties, Inc. | 842,451 | 101,599,591 |
| Security | Number
of Shares | Value ($) |
| Brandywine Realty Trust | 956,745 | 16,436,879 |
| Columbia Property Trust, Inc. | 678,656 | 14,251,776 |
| Corporate Office Properties Trust | 550,341 | 18,359,376 |
| Cousins Properties, Inc. | 2,315,175 | 21,646,886 |
| Douglas Emmett, Inc. | 846,462 | 32,978,160 |
| Easterly Government Properties, Inc. | 142,928 | 2,867,136 |
| Equity Commonwealth * | 679,406 | 21,020,822 |
| Franklin Street Properties Corp. | 585,016 | 5,832,610 |
| Highwoods Properties, Inc. | 558,715 | 29,181,684 |
| Hudson Pacific Properties, Inc. | 853,801 | 28,175,433 |
| JBG SMITH Properties * | 470,043 | 15,384,507 |
| Kilroy Realty Corp. | 536,749 | 37,159,133 |
| Mack-Cali Realty Corp. | 488,949 | 11,192,043 |
| NorthStar Realty Europe Corp. | 307,590 | 3,823,344 |
| Paramount Group, Inc. | 1,003,063 | 15,828,334 |
| Parkway, Inc. | 236,413 | 5,428,042 |
| Piedmont Office Realty Trust, Inc., Class A | 793,120 | 16,060,680 |
| SL Green Realty Corp. | 557,731 | 53,754,114 |
| Tier REIT, Inc. | 267,301 | 4,921,011 |
| Vornado Realty Trust | 942,602 | 70,214,423 |
| | | 586,643,972 |
| |
| Residential REITs 21.7% |
| American Campus Communities, Inc. | 736,341 | 35,042,468 |
| American Homes 4 Rent, Class A | 1,294,341 | 28,682,597 |
| Apartment Investment & Management Co., Class A | 861,547 | 39,053,926 |
| AvalonBay Communities, Inc. | 754,410 | 141,625,389 |
| Camden Property Trust | 480,376 | 42,984,045 |
| Education Realty Trust, Inc. | 404,605 | 15,633,937 |
| Equity LifeStyle Properties, Inc. | 445,803 | 39,743,337 |
| Equity Residential | 2,010,269 | 134,989,563 |
| Essex Property Trust, Inc. | 359,126 | 95,516,742 |
| Independence Realty Trust, Inc. | 319,193 | 3,284,496 |
| Invitation Homes, Inc. | 428,880 | 9,924,283 |
| Mid-America Apartment Communities, Inc. | 621,966 | 66,214,500 |
| Monogram Residential Trust, Inc. | 911,749 | 10,940,988 |
| NexPoint Residential Trust, Inc. | 94,799 | 2,208,817 |
| Starwood Waypoint Homes | 687,762 | 25,605,379 |
| Sun Communities, Inc. | 386,225 | 34,879,980 |
| UDR, Inc. | 1,459,801 | 56,669,475 |
| | | 782,999,922 |
| |
| Retail REITs 19.8% |
| Acadia Realty Trust | 463,248 | 13,290,585 |
| Brixmor Property Group, Inc. | 1,430,112 | 26,771,697 |
| CBL & Associates Properties, Inc. | 944,915 | 7,559,320 |
| Cedar Realty Trust, Inc. | 452,574 | 2,280,973 |
| DDR Corp. | 1,681,318 | 16,275,158 |
| Federal Realty Investment Trust | 396,424 | 50,318,098 |
| GGP, Inc. | 3,188,962 | 66,170,962 |
| Kimco Realty Corp. | 2,322,275 | 45,563,036 |
| Kite Realty Group Trust | 459,738 | 9,249,929 |
| Pennsylvania Real Estate Investment Trust | 377,365 | 3,784,971 |
| Ramco-Gershenson Properties Trust | 436,225 | 5,736,359 |
| Regency Centers Corp. | 801,039 | 51,522,828 |
| Retail Opportunity Investments Corp. | 600,514 | 11,914,198 |
Schwab U.S. REIT ETF | Semiannual Report
Portfolio Holdings as of August 31, 2017 (Unaudited) (continued)
| Security | Number
of Shares | Value ($) |
| Retail Properties of America, Inc., Class A | 1,288,274 | 17,172,692 |
| Saul Centers, Inc. | 64,666 | 3,918,760 |
| Seritage Growth Properties, Class A (a) | 138,624 | 6,662,269 |
| Simon Property Group, Inc. | 1,708,771 | 268,020,731 |
| Tanger Factory Outlet Centers, Inc. | 534,038 | 12,496,489 |
| Taubman Centers, Inc. | 329,889 | 17,233,401 |
| The Macerich Co. | 650,739 | 34,339,497 |
| Urban Edge Properties | 572,664 | 14,402,500 |
| Washington Prime Group, Inc. | 1,033,854 | 8,632,681 |
| Weingarten Realty Investors | 644,582 | 20,652,407 |
| | | 713,969,541 |
| |
| Specialized REITs 11.1% |
| CubeSmart | 991,059 | 24,429,605 |
| Digital Realty Trust, Inc. | 876,048 | 103,671,520 |
| DuPont Fabros Technology, Inc. | 426,280 | 27,435,381 |
| Extra Space Storage, Inc. | 689,491 | 53,525,186 |
| Life Storage, Inc. | 253,780 | 18,675,670 |
| National Storage Affiliates Trust | 250,557 | 5,592,432 |
| Public Storage | 818,700 | 168,111,858 |
| | | 401,441,652 |
| Total Common Stock |
| (Cost $3,440,694,472) | | 3,604,650,280 |
|
| Other Investment Companies 0.3% of net assets |
| |
| Money Market Fund 0.2% |
| State Street Institutional U.S. Government Money Market Fund, Premier Class 0.93% (b) | 7,140,294 | 7,140,294 |
| |
| Security | Number
of Shares | Value ($) |
| Securities Lending Collateral 0.1% |
| Wells Fargo Government Money Market Fund, Select Class 0.92% (b) | 4,923,750 | 4,923,750 |
| Total Other Investment Companies |
| (Cost $12,064,044) | | 12,064,044 |
| | Number of
Contracts | Notional
Amount
($) | Current Value/
Unrealized
Appreciation
($) |
| Futures Contracts | | | |
| Long | |
| S&P 500 Index, e-mini, expires 09/15/17 | 70 | 8,645,350 | 29,224 |
| * | Non-income producing security. |
| (a) | All or a portion of this security is on loan. Securities on loan were valued at $4,854,060. |
| (b) | The rate shown is the 7-day yield. |
| | |
| REIT — | Real Estate Investment Trust |
The following is a summary of the inputs used to value the fund’s investments as of August 31, 2017 (see financial note 2(a) for additional information):
| Description | Quoted Prices in
Active Markets for
Identical Assets
(Level 1) | Other Significant
Observable Inputs
(Level 2) | Significant
Unobservable Inputs
(Level 3) | Total | |
| Assets | | | | | |
| Common Stock1 | $3,604,650,280 | $— | $— | $3,604,650,280 | |
| Other Investment Companies1 | 12,064,044 | — | — | 12,064,044 | |
| Futures Contracts2 | 29,224 | — | — | 29,224 | |
| Total | $3,616,743,548 | $— | $— | $3,616,743,548 | |
| 1 | As categorized in Portfolio Holdings. |
| 2 | Futures contracts are valued at unrealized appreciation or depreciation. |
The fund's policy is to recognize transfers between Level 1, Level 2 and Level 3 as of the beginning of the fiscal year. There were no transfers between Level 1, Level 2 and Level 3 for the period ended August 31, 2017.
Schwab U.S. REIT ETF | Semiannual Report
Statement of Assets and Liabilities
As of August 31, 2017; unaudited
| Assets |
| Investments in unaffiliated issuers, at value (cost $3,447,834,766) including securities on loan of $4,854,060 | | $3,611,790,574 |
| Collateral invested for securities on loan, at value (cost $4,923,750) | | 4,923,750 |
| Deposit with broker for futures contracts | | 415,800 |
| Receivables: | | |
| Fund shares sold | | 2,061,512 |
| Dividends | | 1,765,082 |
| Variation margin on futures contracts | | 48,027 |
| Income from securities on loan | + | 15,822 |
| Total assets | | 3,621,020,567 |
| Liabilities |
| Collateral held for securities on loan | | 4,923,750 |
| Payables: | | |
| Investments bought | | 2,053,906 |
| Investment adviser fees | + | 211,962 |
| Total liabilities | | 7,189,618 |
| Net Assets |
| Total assets | | 3,621,020,567 |
| Total liabilities | – | 7,189,618 |
| Net assets | | $3,613,830,949 |
| Net Assets by Source | | |
| Capital received from investors | | 3,446,112,834 |
| Net investment income not yet distributed | | 33,355,241 |
| Net realized capital losses | | (29,622,158) |
| Net unrealized capital appreciation | | 163,985,032 |
| Net Asset Value (NAV) |
| Net Assets | ÷ | Shares
Outstanding | = | NAV |
| $3,613,830,949 | | 87,650,000 | | $41.23 |
| | | | | |
Schwab U.S. REIT ETF | Semiannual Report
Statement of Operations
For the period March 1, 2017 through August 31, 2017; unaudited
| Investment Income |
| Dividends | | $61,772,328 |
| Securities on loan, net | + | 81,349 |
| Total investment income | | 61,853,677 |
| Expenses |
| Investment adviser fees | | 1,163,888 |
| Total expenses | – | 1,163,888 |
| Net investment income | | 60,689,789 |
| Realized and Unrealized Gains (Losses) |
| Net realized losses on investments | | (29,276,726) |
| Net realized gains on in-kind redemptions | | 12,021,811 |
| Net realized gains on futures contracts | + | 410,085 |
| Net realized losses | | (16,844,830) |
| Net change in unrealized appreciation (depreciation) on investments | | (76,609,118) |
| Net change in unrealized appreciation (depreciation) on futures contracts | + | (162,255) |
| Net change in unrealized appreciation (depreciation) | + | (76,771,373) |
| Net realized and unrealized losses | | (93,616,203) |
| Decrease in net assets resulting from operations | | ($32,926,414) |
Schwab U.S. REIT ETF | Semiannual Report
Statement of Changes in Net Assets
For the current and prior report periods
Figures for the current period are unaudited
| Operations | |
| | 3/1/17-8/31/17 | 3/1/16-2/28/17 |
| Net investment income | | $60,689,789 | $64,188,275 |
| Net realized gains (losses) | | (16,844,830) | 28,034,704 |
| Net change in unrealized appreciation (depreciation) | + | (76,771,373) | 194,880,849 |
| Increase (decrease) in net assets resulting from operations | | (32,926,414) | 287,103,828 |
| Distributions to Shareholders | |
| Distributions from net investment income | | ($28,367,700) | ($71,668,635) |
| Transactions in Fund Shares | | | |
| | | 3/1/17-8/31/17 | 3/1/16-2/28/17 |
| | | SHARES | VALUE | SHARES | VALUE |
| Shares sold | | 16,900,000 | $696,227,893 | 27,750,000 | $1,158,636,462 |
| Shares redeemed | + | (1,450,000) | (59,070,909) | (3,900,000) | (159,311,136) |
| Net transactions in fund shares | | 15,450,000 | $637,156,984 | 23,850,000 | $999,325,326 |
| Shares Outstanding and Net Assets | | | |
| | | 3/1/17-8/31/17 | 3/1/16-2/28/17 |
| | | SHARES | NET ASSETS | SHARES | NET ASSETS |
| Beginning of period | | 72,200,000 | $3,037,968,079 | 48,350,000 | $1,823,207,560 |
| Total increase | + | 15,450,000 | 575,862,870 | 23,850,000 | 1,214,760,519 |
| End of period | | 87,650,000 | $3,613,830,949 | 72,200,000 | $3,037,968,079 |
| Net investment income not yet distributed | | | $33,355,241 | | $1,033,152 |
Schwab U.S. REIT ETF | Semiannual Report
Financial Notes, unaudited
1. Business Structure of the Fund:
Schwab U.S. REIT ETF is a series of Schwab Strategic Trust (the trust), a no-load, open-end management investment company. The trust is organized as a Delaware statutory trust and is registered under the Investment Company Act of 1940, as amended (the 1940 Act). The list below shows all the operational funds in the trust as of the end of the period, including the fund discussed in this report, which is highlighted:
| SCHWAB STRATEGIC TRUST (ORGANIZED JANUARY 27, 2009) |
| Schwab U.S. REIT ETF | Schwab U.S. TIPS ETF™ |
| Schwab U.S. Broad Market ETF™ | Schwab Short-Term U.S. Treasury ETF™ |
| Schwab U.S. Large-Cap ETF™ | Schwab Intermediate-Term U.S. Treasury ETF™ |
| Schwab U.S. Large-Cap Growth ETF™ | Schwab U.S. Aggregate Bond ETF™ |
| Schwab U.S. Large-Cap Value ETF™ | Schwab Fundamental U.S. Broad Market Index ETF |
| Schwab U.S. Mid-Cap ETF™ | Schwab Fundamental U.S. Large Company Index ETF |
| Schwab U.S. Small-Cap ETF™ | Schwab Fundamental U.S. Small Company Index ETF |
| Schwab U.S. Dividend Equity ETF™ | Schwab Fundamental International Large Company Index ETF |
| Schwab International Equity ETF™ | Schwab Fundamental International Small Company Index ETF |
| Schwab International Small-Cap Equity ETF™ | Schwab Fundamental Emerging Markets Large Company Index ETF |
| Schwab Emerging Markets Equity ETF™ | |
The fund issues and redeems shares at its net asset value per share (NAV) only in large blocks of shares, typically 50,000 shares or more (Creation Units). These transactions are usually in exchange for a basket of securities and/or an amount of cash. As a practical matter, only institutions or large investors purchase or redeem Creation Units. Except when aggregated in Creation Units, shares of the fund are not redeemable securities.
Individual shares of the fund trade on national securities exchanges and elsewhere during the trading day and can only be bought and sold at market prices throughout the trading day through a broker-dealer. Because fund shares trade at market prices rather than NAV, shares may trade at a price greater than NAV (premium) or less than NAV (discount).
The fund maintains its own account for purposes of holding assets and accounting, and is considered a separate entity for tax purposes. Within its account, the fund may also keep certain assets in segregated accounts, as required by securities law.
2. Significant Accounting Policies:
The following is a summary of the significant accounting policies the fund uses in its preparation of financial statements. The fund follows the investment company accounting and reporting guidance of the Financial Accounting Standards Board Accounting Standard Codification Topic 946 Financial Services — Investment Companies. The accounting policies are in conformity with accounting principles generally accepted in the United States of America (GAAP).
The fund may invest in certain other investment companies (underlying funds). For more information about the underlying funds' operations and policies, please refer to those funds' semiannual and annual reports, which are filed with the U.S. Securities and Exchange Commission (SEC).
Effective August 1, 2017, the fund adopted disclosure requirement changes for SEC Regulation S-X. The adopted changes are reflected throughout this report.
(a) Security Valuation:
Under procedures approved by the fund's Board of Trustees (the Board), the investment adviser has formed a Pricing Committee to administer the pricing and valuation of portfolio securities and other assets and to ensure that prices used for internal purposes or provided by third parties reasonably reflect fair market value. Among other things, these procedures allow the fund to utilize independent pricing services, quotations from securities and financial instrument dealers and other market sources to determine fair value.
The fund values the securities in its portfolio every business day. The fund uses the following policies to value various types of securities:
Schwab U.S. REIT ETF | Semiannual Report
Financial Notes, unaudited (continued)
2. Significant Accounting Policies (continued):
• Securities traded on an exchange or over-the-counter: Traded securities are valued at the closing value for the day, or, on days when no closing value has been reported, at the mean of the most recent bid and ask quotes. Securities that are primarily traded on foreign exchanges are valued at the official closing price or the last sales price on the exchange where the securities are principally traded with these values then translated into U.S. dollars at the current exchange rate, unless these securities are fair valued as discussed below.
• Securities for which no quoted value is available: The Board has adopted procedures to fair value the fund’s securities when market prices are not “readily available” or are unreliable. For example, a fund may fair value a security when it is de-listed or its trading is halted or suspended; when a security’s primary pricing source is unable or unwilling to provide a price; or when a security’s primary trading market is closed during regular market hours. The fund makes fair value determinations in good faith in accordance with the fund’s valuation procedures. The Pricing Committee considers a number of factors, including unobservable market inputs when arriving at fair value. The Pricing Committee may employ techniques such as the review of related or comparable assets or liabilities, related market activities, recent transactions, market multiples, book values, transactional back-testing, disposition analysis and other relevant information. The Pricing Committee regularly reviews these inputs and assumptions to calibrate the valuations. Due to the subjective and variable nature of fair value pricing, there can be no assurance that the fund could obtain the fair value assigned to the security upon the sale of such security. The Board convenes on a regular basis to review fair value determinations made by the fund pursuant to the valuation procedures.
• Futures contracts: Futures contracts are valued at their settlement prices as of the close of their exchanges.
• Underlying funds: Mutual funds are valued at their respective NAVs. Exchange-traded funds (ETFs) traded on a recognized securities exchange are valued at the last reported sale price that day or the official closing price, if applicable.
In accordance with the authoritative guidance on fair value measurements and disclosures under GAAP, the fund discloses the fair value of its investments in a hierarchy that prioritizes the significant inputs to valuation techniques used to measure the fair value. The hierarchy gives the highest priority to valuations based upon unadjusted quoted prices in active markets for identical assets or liabilities (Level 1 measurements) and the lowest priority to valuations based upon unobservable inputs that are significant to the valuation (Level 3 measurements). If inputs used to measure the financial instruments fall within different levels of the hierarchy, the categorization is based on the lowest level input that is significant to the valuation. If the fund determines that either the volume and/or level of activity for an asset or liability has significantly decreased (from normal conditions for that asset or liability) or price quotations or observable inputs are not associated with orderly transactions, increased analysis and management judgment will be required to estimate fair value.
The three levels of the fair value hierarchy are as follows:
• Level 1—quoted prices in active markets for identical securities—Investments whose values are based on quoted market prices in active markets, and whose values are therefore classified as Level 1 prices, include active listed equities, ETFs and futures contracts. Investments in mutual funds are valued daily at their NAV, and investments in ETFs are valued daily at the last reported sale price or the official closing price, which are classified as Level 1 prices, without consideration to the classification level of the specific investments held by an underlying fund.
• Level 2—other significant observable inputs (including quoted prices for similar securities, interest rates, prepayment speeds, credit risk, etc.)—Investments that trade in markets that are not considered to be active, but whose values are based on quoted market prices, dealer quotations or valuations provided by alternative pricing sources supported by observable inputs are classified as Level 2 prices. These generally include U.S. government and sovereign obligations, most government agency securities, investment-grade corporate bonds, certain mortgage products, less liquid listed equities, and state, municipal and provincial obligations.
• Level 3—significant unobservable inputs (including the fund's own assumptions in determining the fair value of investments)—Investments whose values are classified as Level 3 prices have significant unobservable inputs, as they may trade infrequently or not at all. When observable prices are not available for these securities, the fund uses one or more valuation techniques for which sufficient and reliable data is available. The inputs used by the fund in estimating the value of Level 3 prices may include the original transaction price, quoted prices for similar securities or assets in active markets, completed or pending third-party transactions in the underlying investment or comparable issuers, and changes in financial ratios or cash flows. Level 3 prices may also be adjusted to reflect illiquidity and/or non-transferability, with the amount of such discount estimated by the fund in the absence of market information. Assumptions used by the fund due to the lack of observable inputs may significantly impact the resulting fair value and therefore the fund’s results of operations.
Schwab U.S. REIT ETF | Semiannual Report
Financial Notes, unaudited (continued)
2. Significant Accounting Policies (continued):
The inputs or methodology used for valuing securities are not necessarily an indication of the risk associated with investing in those securities.
The levels associated with valuing the fund's investments as of August 31, 2017 are disclosed in the Portfolio Holdings.
(b) Accounting Policies for certain Portfolio Investments (if held):
Futures Contracts: Futures contracts are instruments that represent an agreement between two parties that obligates one party to buy, and the other party to sell, specific instruments at an agreed upon price on a stipulated future date. The fund must give the broker a deposit of cash and/or securities (initial margin) whenever it enters into a futures contract. The amount of the deposit may vary from one contract to another. Subsequent payments (variation margin) are made or received by the fund depending on the daily fluctuations in the value of the futures contract and are accounted for as unrealized appreciation or depreciation until the contract is closed, at which time the gains or losses are realized. Futures contracts are traded publicly on exchanges, and their market value may change daily.
Securities Lending: Under the trust's Securities Lending Program, the fund (lender) may make short-term loans of its securities to another party (borrower) to generate additional revenue for the fund. The borrower pledges collateral in the form of cash, securities issued or fully guaranteed by the U.S. government or foreign governments, or letters of credit issued by a bank. Collateral at the individual loan level is required to be maintained on a daily marked-to-market basis in an amount at least equal to the current value of the securities loaned. The lending agent provides the fund with indemnification against borrower default (the borrower fails to return the security on loan) reducing the risk of loss as a result of default. The cash collateral of securities loaned is currently invested in money market portfolios operating under Rule 2a-7 of the 1940 Act. The fund bears the risk of loss with respect to the investment of cash collateral. The terms of the securities lending agreement allow the fund or the lending agent to terminate any loan at any given time and the securities must be returned within the earlier of the standard trade settlement period or the specified time period under the relevant securities lending agreements. Securities lending income, as disclosed in the fund’s Statement of Operations, if applicable, represents the income earned from the investment of the cash collateral plus any fees paid by borrowers, less the fees paid to the lending agent and broker rebates which are subject to adjustments pursuant to the securities lending agreement. On loans not collateralized by cash, a fee is received from the borrower, and is allocated between the fund and the lending agent. The aggregate market value of securities loaned will not at any time exceed one-third of the total assets of the fund, including collateral received from the loan. Total costs and expenses, including lending agent fees and broker rebates, associated with securities lending activities under the trust’s Securities Lending Program paid to the unaffiliated lending agents start at 10% of gross lending revenue, with subsequent breakpoints to a low of 7.5%.
As of August 31, 2017, the fund had securities on loan, all of which were classified as common stocks. The value of the securities on loan and the related collateral as of August 31, 2017 are disclosed in the fund's Portfolio Holdings. The value of the securities on loan and investment of cash collateral are also disclosed in the fund's Statement of Assets and Liabilities.
(c) Security Transactions:
Security transactions are recorded as of the date the order to buy or sell the security is executed. Realized gains and losses from security transactions are based on the identified costs of the securities involved.
When the fund closes out a futures contract position, it calculates the difference between the value of the position at the beginning and at the end of the contract, and records a realized gain or loss accordingly.
The fund invests in real estate investment trusts (REITs) which report information on the source of their distributions annually. The fund policy is to record all REIT distributions initially as dividend income on the ex-dividend date and then re-designate them as return of capital and/or capital gain distributions at the end of the reporting period based on information provided annually by each REIT, and management estimates such re-designations when actual information has not yet been reported.
(d) Investment Income:
Interest income is recorded as it accrues. Dividends and distributions from portfolio securities and underlying funds are recorded on the date they are effective (the ex-dividend date), although the fund records certain foreign security dividends on the day it learns of the ex-dividend date. Any distributions from underlying funds are recorded in accordance with the character of the distributions as designated by the underlying funds.
Schwab U.S. REIT ETF | Semiannual Report
Financial Notes, unaudited (continued)
2. Significant Accounting Policies (continued):
(e) Expenses:
Pursuant to the Investment Advisory Agreement (Advisory Agreement) between Charles Schwab Investment Management, Inc. (CSIM or the investment adviser) and the trust, the investment adviser will pay the operating expenses of the fund, excluding taxes, any brokerage expenses, and extraordinary or non-routine expenses. Taxes, any brokerage expenses and extraordinary or non-routine expenses that are specific to the fund are charged directly to the fund.
(f) Distributions to Shareholders:
The fund makes distributions from net investment income, if any, quarterly and from net realized capital gains, if any, once a year.
(g) Accounting Estimates:
The accounting policies described in this report conform to GAAP. Notwithstanding this, shareholders should understand that in order to follow these principles, fund management has to make estimates and assumptions that affect the information reported in the financial statements. It’s possible that once the results are known, they may turn out to be different from these estimates and these differences may be material.
(h) Federal Income Taxes:
The fund intends to meet federal income and excise tax requirements for regulated investment companies under subchapter M of the Internal Revenue Code, as amended. Accordingly, the fund distributes substantially all of its net investment income and net realized capital gains, if any, to its shareholders each year. As long as the fund meets the tax requirements, it is not required to pay federal income tax.
(i) Indemnification:
Under the fund's organizational documents, the officers and trustees are indemnified against certain liabilities arising out of the performance of their duties to the fund. In addition, in the normal course of business the fund enters into contracts with its vendors and others that provide general indemnifications. The fund's maximum exposure under these arrangements is unknown as this would involve future claims that may be made against the fund. However, based on experience, the fund expects the risk of loss attributable to these arrangements to be remote.
3. Risk Factors:
Investing in the fund may involve certain risks, as discussed in the fund’s prospectus, including, but not limited to, those described below. Any of these risks could cause an investor to lose money.
Market Risk. Financial markets rise and fall in response to a variety of factors, sometimes rapidly and unpredictable. As with any investment whose performance is tied to these markets, the value of an investment in the fund will fluctuate, which means that an investor could lose money over short or long periods.
Investment Style Risk. The fund is not actively managed. Therefore, the fund follows the securities included in the index during upturns as well as downturns. Because of its indexing strategy, the fund does not take steps to reduce market exposure or to lessen the effects of a declining market. In addition, because of the fund's expenses, the fund’s performance may be below that of the index.
Equity Risk. The prices of equity securities rise and fall daily. These price movements may result from factors affecting individual companies, industries or the securities market as a whole. In addition, equity markets tend to move in cycles which may cause stock prices to fall over short or extended periods of time.
Market Capitalization Risk. Securities issued by companies of different market capitalizations tend to go in and out of favor based on market and economic conditions. During a period when securities of a particular market capitalization fall behind other types of investments, the fund’s performance could be impacted.
Large-Cap Company Risk. Large-cap companies are generally more mature and the securities issued by these companies may not be able to reach the same levels of growth as the securities issued by small- or mid-cap companies.
Mid-Cap Company Risk. Mid-cap companies may be more vulnerable to adverse business or economic events than larger, more established companies and the value of securities issued by these companies may move sharply.
Schwab U.S. REIT ETF | Semiannual Report
Financial Notes, unaudited (continued)
3. Risk Factors (continued):
Small-Cap Company Risk. Securities issued by small-cap companies may be risker than those issued by larger companies, and their prices may move sharply, especially during market upturns and downturns.
Real Estate Investment Risk. Due to the composition of the index, the fund concentrates its investments in real estate companies and companies related to the real estate industry. As such, the fund is subject to risks associated with the direct ownership of real estate securities and an investment in the fund will be closely linked to the performance of the real estate markets. These risks include, among others: declines in the value of real estate; risks related to general and local economic conditions; possible lack of availability of mortgage funds or other limits to accessing the credit or capital markets; defaults by borrowers or tenants, particularly during an economic downturn; and changes in interest rates.
REITs Risk. In addition to the risks associated with investing in securities of real estate companies and real estate related companies, REITs are subject to certain additional risks. Equity REITs may be affected by changes in the value of the underlying properties owned by the trusts. Further, REITs are dependent upon specialized management skills and cash flows, and may have their investments in relatively few properties, or in a small geographic area or a single property type. Failure of a company to qualify as a REIT under federal tax law may have adverse consequences to the fund. In addition, REITs have their own expenses, and the fund will bear a proportionate share of those expenses.
Tracking Error Risk. As an index fund, the fund seeks to track the performance of its benchmark index, although it may not be successful in doing so. The divergence between the performance of the fund and its benchmark index, positive or negative, is called “tracking error.” Tracking error can be caused by many factors and it may be significant.
Derivatives Risk. The principal types of derivatives used by the fund are futures contracts. A futures contract is an agreement to buy or sell a financial instrument at a specific price on a specific day. The fund’s use of derivative instruments involves risks different from, or possibly greater than, the risks associated with investing directly in securities and other traditional investments. Certain of these risks, such as leverage risk, market risk and liquidity risk, are discussed elsewhere. The fund's use of derivatives that are subject to regulation by the Commodity Futures Trading Commission (CFTC) could cause the fund to become a commodity pool, which would require the fund to comply with certain CFTC rules.
The fund’s use of derivatives is also subject to credit risk, lack-of-availability risk, valuation risk, correlation risk and tax risk. Credit risk is the risk that the counterparty to a derivative transaction may not fulfill its contractual obligations. Lack-of-availability risk is the risk that suitable derivative transactions may not be available in all circumstances for risk management or other purposes. Valuation risk is the risk that a particular derivative may be valued incorrectly. Correlation risk is the risk that changes in the value of the derivative may not correlate perfectly with the underlying asset, rate or index. Tax risk is the risk that the use of derivatives may cause the fund to realize higher amounts of short-term capital gains. The fund’s use of derivatives could reduce the fund’s performance, increase the fund’s volatility, and cause the fund to lose more than the initial amount invested.
Concentration Risk. To the extent that the fund's or the index's portfolio is concentrated in the securities of issuers in a particular market, industry, group of industries, sector or asset class (including the real estate industry, as described above), the fund may be adversely affected by the performance of those securities, may be subject to increased price volatility and may be more susceptible to adverse economic, market, political or regulatory occurrences affecting that market, industry, group of industries, sector or asset class.
Liquidity Risk. The fund may be unable to sell certain securities, such as illiquid securities, readily at a favorable time or price, or the fund may have to sell them at a loss.
Market Trading Risk. Although fund shares are listed on national securities exchanges, there can be no assurance that an active trading market for fund shares will develop or be maintained. If an active market is not maintained, investors may find it difficult to buy or sell fund shares.
Shares of the Fund May Trade at Prices Other Than NAV. Fund shares may be bought and sold in the secondary market at market prices. Although it is expected that the market price of the shares of the fund will approximate the fund’s NAV, there may be times when the market price and the NAV vary significantly. An investor may pay more than NAV when buying shares of the fund in the secondary market, and an investor may receive less than NAV when selling those shares in the secondary market. The market price of the fund shares may deviate, sometimes significantly, from NAV during periods of market volatility.
Please refer to the fund’s prospectus for a more complete description of the principal risks of investing in the fund.
Schwab U.S. REIT ETF | Semiannual Report
Financial Notes, unaudited (continued)
4. Affiliates and Affiliated Transactions:
Investment Adviser
CSIM, a wholly owned subsidiary of The Charles Schwab Corporation, serves as the fund’s investment adviser pursuant to an Advisory Agreement between CSIM and the trust.
For its advisory services to the fund, CSIM is entitled to receive an annual fee, payable monthly, equal to 0.07% of the fund's average daily net assets.
Investment from Affiliates
Certain Schwab funds may own shares of other Schwab funds. The table below reflects the percentage of shares of the fund that are owned by other Schwab funds as of August 31, 2017.
| Schwab VIT Balanced Portfolio | 0.1% |
| Schwab VIT Balanced with Growth Portfolio | 0.2% |
| Schwab VIT Growth Portfolio | 0.2% |
| Schwab Target 2010 Index Fund | 0.0%* |
| Schwab Target 2015 Index Fund | 0.0%* |
| Schwab Target 2020 Index Fund | 0.0%* |
| Schwab Target 2025 Index Fund | 0.0%* |
| Schwab Target 2030 Index Fund | 0.0%* |
| Schwab Target 2035 Index Fund | 0.0%* |
| Schwab Target 2040 Index Fund | 0.0%* |
| Schwab Target 2045 Index Fund | 0.0%* |
| Schwab Target 2050 Index Fund | 0.0%* |
| Schwab Target 2055 Index Fund | 0.0%* |
| Schwab Target 2060 Index Fund | 0.0%* |
Interfund Transactions
The fund may engage in direct transactions with certain other Schwab funds when practical. When one fund is seeking to sell a security that another is seeking to buy, an interfund transaction can allow both funds to benefit by reducing transaction costs. This practice is limited to funds that share the same investment adviser, trustees and/or officers. For the period ended August 31, 2017, the fund's total aggregate security transactions with other Schwab funds was $22,366,005 and includes realized losses of $2,475,264.
Interfund Borrowing and Lending
Pursuant to an exemptive order issued by the SEC, the fund may enter into interfund borrowing and lending transactions with other funds in the Fund Complex (for definition refer to Trustees and Officers section). All loans are for temporary or emergency purposes and the interest rate to be charged will be the average of the overnight repurchase agreement rate and the short-term bank loan rate. All loans are subject to numerous conditions designed to ensure fair and equitable treatment of all participating funds/portfolios. The interfund lending facility is subject to the oversight and periodic review of the Board. The fund had no interfund borrowing or lending activity during the period.
5. Other Service Providers:
SEI Investments Distribution Co. is the principal underwriter and distributor of shares of the fund.
State Street Bank and Trust Company (State Street) serves as the fund’s transfer agent. As part of these services, the transfer agent maintains records pertaining to the sale, redemption and transfer of the fund’s shares.
State Street also serves as custodian and accountant for the fund. The custodian is responsible for the daily safekeeping of securities and cash held by the fund. The fund’s accountant maintains all books and records related to the fund’s transactions.
Schwab U.S. REIT ETF | Semiannual Report
Financial Notes, unaudited (continued)
6. Board of Trustees:
The Board may include people who are officers and/or directors of CSIM or its affiliates. Federal securities law limits the percentage of such “interested persons” who may serve on a trust’s board, and the trust was in compliance with these limitations throughout the report period. The trust does not pay any interested or non-interested trustees (independent trustees). The independent trustees are paid by CSIM. For information regarding the trustees, please refer to the Trustees and Officers table at the end of this report.
7. Borrowing from Banks:
During the period, the fund was a participant with other U.S. registered investment companies managed by CSIM in a joint, syndicated, committed $555 million line of credit (the Credit Facility). Under the terms of the Credit Facility, in addition to the interest charged on any borrowings by the fund, the fund paid a commitment fee of 0.15% per annum on its proportionate share of the unused portion of the Credit Facility. Effective March 1, 2017, where applicable, CSIM paid the commitment fee and any interest expense charged on any borrowings by the fund, since these expenses are now included in the advisory fee. There were no borrowings from the line of credit during the period.
The fund also has access to custodian overdraft facilities. The fund may have utilized the overdraft facility and incurred an interest expense. Since March 1, 2017, where applicable, CSIM paid any interest expense charged. The interest expense is determined based on a negotiated rate above the Federal Funds Rate.
8. Derivatives:
The fund entered into equity index futures contracts during the report period. The fund invested in futures contracts to equitize available cash. The current value and variation margin for futures contracts held at August 31, 2017 are presented on the Portfolio Holdings and Statement of Assets and Liabilities, respectively. The net realized and change in unrealized gains (losses) on futures contracts are presented on the Statement of Operations. Refer to financial note 2(b) for the fund’s accounting policies with respect to futures contracts and financial note 3 for disclosures concerning the risks of investing in futures contracts. During the period ended August 31, 2017, the month-end average notional amounts of futures contracts held by the fund was $9,744,423 and the month-end average number of contracts held was 81.
9. Purchases and Sales/Maturities of Investment Securities:
For the period ended August 31, 2017, purchases and sales/maturities of securities (excluding in-kind transactions and short-term obligations) were as follows:
| | Purchases
of Securities | Sales/Maturities
of Securities |
| Schwab U.S. REIT ETF | $213,124,117 | $177,583,879 |
10. In-Kind Transactions:
The consideration for the purchase of Creation Units of the fund often consists of the in-kind deposit of a designated portfolio of equity securities, which constitutes an optimized representation of the securities involved in a relevant fund’s underlying index, and an amount of cash. Investors purchasing and redeeming Creation Units are subject to a standard creation transaction fee and a standard redemption transaction fee paid to the custodian to offset transfer and other transaction costs associated with the issuance and redemption of Creation Units. Purchasers and redeemers of Creation Units for cash are subject to an additional variable charge paid to the fund that will offset the transaction costs to the fund of buying or selling portfolio securities. In addition, purchasers and redeemers of shares in Creation Units are responsible for payment of the costs of transferring securities to or out of the fund. From time to time, CSIM may cover the cost of any transaction fees when believed to be in the best interests of the fund.
The in-kind transactions for the period ended August 31, 2017, were as follows:
| | In-Kind Purchases
of Securities | In-Kind Sales
of Securities |
| Schwab U.S. REIT ETF | $686,406,058 | $52,621,925 |
Schwab U.S. REIT ETF | Semiannual Report
Financial Notes, unaudited (continued)
10. In-Kind Transactions (continued):
For the period ended August 31, 2017, the fund realized net capital gains or losses resulting from in-kind redemptions of Creation Units. Because such gains or losses are not taxable to the fund and are not distributed to existing fund shareholders, the gains or losses are reclassified from accumulated net realized gains or losses to capital received from investors at the end of the fund's tax year. These reclassifications have no effect on net assets or net asset values per share. The net realized in-kind gains or losses for the period ended August 31, 2017 are disclosed in the fund's Statement of Operations.
11. Federal Income Taxes
As of August 31, 2017, the tax basis cost of the fund's investments and gross unrealized appreciation and depreciation were as follows:
| Tax cost | $3,458,163,149 |
| Gross unrealized appreciation | $308,566,275 |
| Gross unrealized depreciation | (150,334,006) |
| Net unrealized appreciation (depreciation) | $158,232,269 |
Capital loss carryforwards may be used to offset future realized capital gains for federal income tax purposes. As of February 28, 2017, the fund had no capital loss carryforwards.
As of February 28, 2017, management has reviewed the tax positions for open periods (for federal purposes, three years from the date of filing and for state purposes, four years from the date of filing) as applicable to the fund, and has determined that no provision for income tax is required in the fund's financial statements. The fund recognizes interest and penalties, if any, related to unrecognized tax benefits as income tax expense in the Statement of Operations. During the period ended February 28, 2017, the fund did not incur any interest or penalties.
12. Subsequent Events:
Management has determined there are no subsequent events or transactions through the date the financial statements were issued that would have materially impacted the financial statements as presented.
Schwab U.S. REIT ETF | Semiannual Report
Investment Advisory Agreement Approval
The Investment Company Act of 1940 (the 1940 Act) requires that initial approval of, as well as the continuation of, a fund’s investment advisory agreement must be specifically approved (1) by the vote of the trustees or by a vote of the shareholders of the fund, and (2) by the vote of a majority of the trustees who are not parties to the investment advisory agreement or “interested persons” of any party (the Independent Trustees), cast in person at a meeting called for the purpose of voting on such approval. In connection with such approvals, the fund’s trustees must request and evaluate, and the investment adviser is required to furnish, such information as may be reasonably necessary to evaluate the terms of the investment advisory agreement.
The Board of Trustees (the Board or the Trustees, as appropriate) calls and holds one or more meetings each year that are dedicated, in part, to considering whether to renew the investment advisory agreement (the Agreement) between Schwab Strategic Trust (the Trust) and Charles Schwab Investment Management, Inc. (CSIM) with respect to the existing funds in the Trust, including Schwab U.S. REIT ETF (the Fund), and to review certain other agreements pursuant to which CSIM provides investment advisory services to certain other registered investment companies. In preparation for the meeting(s), the Board requests and reviews a wide variety of materials provided by CSIM, including information about affiliates, personnel, business goals and priorities, profitability, third-party oversight, corporate structure and operations. The Board also receives data provided by an independent provider of investment company data. This information is in addition to the detailed information about the Fund that the Board reviews during the course of each year, including information that relates to the Fund’s operations and performance, legal and compliance matters, risk management, portfolio turnover, and sales and marketing activity. In addition, the Independent Trustees meet in executive session outside the presence of fund management and participate in question and answer sessions with representatives of CSIM.
The Board, including a majority of the Independent Trustees, considered information specifically relating to its consideration of the continuance of the Agreement with respect to the Fund at meetings held on April 19, 2017 and June 6, 2017, and approved the renewal of the Agreement with respect to the Fund for an additional one-year term at the meeting held on June 6, 2017. As part of the Board’s consideration of the continuance of the Agreement, the Board considered information it reviewed in connection with an amended and restated advisory agreement between the Trust and CSIM that was approved by the Board at a meeting held on January 18, 2017. A discussion regarding the basis for the Board’s approval of the amended and restated advisory agreement is available in the Fund’s 2017 annual report, which covers the period from March 1, 2016 through February 28, 2017. The
Board’s approval of the continuance of the Agreement with respect to the Fund was based on consideration and evaluation of a variety of specific factors discussed at these meetings and at prior meetings, including:
| 1. | the nature, extent and quality of the services provided to the Fund under the Agreement, including the resources of CSIM and its affiliates dedicated to the Fund; |
| 2. | the Fund’s investment performance and how it compared to that of certain other comparable exchange-traded funds; |
| 3. | the Fund’s expenses and how those expenses compared to those of certain other comparable exchange-traded funds; |
| 4. | the profitability of CSIM and its affiliates, including Charles Schwab & Co., Inc. (Schwab), with respect to the Fund, including both direct and indirect benefits accruing to CSIM and its affiliates; and |
| 5. | the extent to which economies of scale would be realized as the Fund grow and whether fee levels in the Agreement reflect those economies of scale for the benefit of Fund investors. |
Nature, Extent and Quality of Services. The Board considered the nature, extent and quality of the services provided by CSIM to the Fund and the resources of CSIM and its affiliates dedicated to the Fund. In this regard, the Trustees evaluated, among other things, CSIM’s experience, track record, compliance program, resources dedicated to hiring and retaining qualified personnel, and information security resources. The Trustees also considered information provided by CSIM relating to the Fund’s portfolio management team, portfolio strategy and risk oversight structure, and internal investment guidelines. The Trustees also considered Schwab’s reputation in connection with the OneSource exchange-traded fund offering and its overall financial condition. Following such evaluation, the Board concluded, within the context of its full deliberations, that the nature, extent and quality of services provided by CSIM to the Fund and the resources of CSIM and its affiliates dedicated to the Fund supported renewal of the Agreement with respect to the Fund.
Fund Performance. The Board considered the Fund’s performance in determining whether to renew the Agreement with respect to the Fund. Specifically, the Trustees considered the Fund’s performance relative to a peer category of other exchange-traded funds and relevant indices/benchmarks, in light of total return, yield, and market trends. As part of this review, the Trustees considered the composition of the peer category and the selection criteria. In evaluating the performance of the Fund, the Trustees considered the risk profile for the Fund and the appropriateness of the benchmark used to compare the performance of the Fund. The Trustees further considered the level of Fund performance in the
Schwab U.S. REIT ETF | Semiannual Report
context of their review of Fund expenses and adviser profitability discussed below and also noted that performance is reviewed throughout the year by a designated committee of the Board and by the Board. Following such evaluation, the Board concluded, within the context of its full deliberations, that the performance of the Fund supported renewal of the Agreement with respect to the Fund.
Fund Expenses. With respect to the Fund’s expenses, the Trustees considered the rate of compensation called for by the Agreement and the Fund’s operating expense ratio, in comparison to those of other comparable exchange-traded funds, such peer groups and comparisons having been selected and calculated by an independent provider of investment company data. The Trustees noted that the Fund’s operating expense ratio was well below the average operating expense ratio charged by other funds in its peer group. The Trustees also considered fees charged by CSIM to mutual funds that it manages. Following such evaluation, the Board concluded, within the context of its full deliberations, that the expenses of the Fund are reasonable and supported renewal of the Agreement with respect to the Fund.
Profitability. The Trustees considered the compensation flowing to CSIM and its affiliates, directly or indirectly, and reviewed profitability on a pre-tax basis, without regard to distribution expenses. In this connection, the Trustees reviewed management’s profitability analyses and methodology. The Trustees also reviewed profitability of CSIM relating to the Schwab fund complex as a whole, noting the benefit to Fund shareholders of being part of the Schwab fund complex, including the allocations of certain fixed costs across the funds in the complex. The Trustees also considered any
other benefits derived by CSIM from its relationship with the Fund, such as whether, by virtue of its management of the Fund, CSIM obtains investment information or other research resources that aid it in providing advisory services to other clients. The Trustees considered whether the varied levels of compensation and profitability with respect to the Fund under the Agreement and other service agreements were reasonable and justified in light of the quality of all services rendered to the Fund by CSIM and its affiliates. Based on this evaluation, the Board concluded, within the context of its full deliberations, that the profitability of CSIM is reasonable and supported renewal of the Agreement with respect to the Fund.
Economies of Scale. The Trustees considered the existence of any economies of scale and whether those are passed along to the Fund’s shareholders by way of the relatively low advisory fee and unitary fee structure of the Fund. Based on this evaluation, the Board concluded, within the context of its full deliberations, that the Fund obtains reasonable benefit from economies of scale.
In the course of their deliberations, the Trustees did not identify any particular information or factor that was all important or controlling. Based on the Trustees’ deliberation and their evaluation of the information described above, the Board, including all of the Independent Trustees, approved the continuation of the Agreement with respect to the Fund and concluded that the compensation under the Agreement with respect to the Fund is fair and reasonable in light of such services and expenses and such other matters as the Trustees have considered to be relevant in the exercise of their reasonable judgment.
Schwab U.S. REIT ETF | Semiannual Report
Trustees and Officers
The tables below give information about the trustees and officers for the Schwab Strategic Trust, which includes the fund covered in this report. The “Fund Complex” includes The Charles Schwab Family of Funds, Schwab Capital Trust, Schwab Investments, Schwab Annuity Portfolios, Schwab Strategic Trust and Laudus Trust. The Fund Complex includes 105 funds.
The address for all trustees and officers is 211 Main Street, San Francisco, CA 94105. You can find more information about the trustees and officers in the Statement of Additional Information, which is available free by calling 1-877-824-5615.
| Independent Trustees |
Name, Year of Birth, and
Position(s) with the trust
(Terms of office, and
length of Time Served1) | Principal Occupations
During the Past Five Years | Number of
Portfolios in
Fund Complex
Overseen by
the Trustee | Other Directorships |
Robert W. Burns
1959
Trustee
(Trustee of Schwab Strategic Trust since 2009; The Charles Schwab Family of Funds, Schwab Investments, Schwab Capital Trust, Schwab Annuity Portfolios and Laudus Trust since 2016) | Retired/Private Investor (Jan. 2009 – present). Formerly, Managing Director, Pacific Investment Management Company, LLC (PIMCO) (investment management firm) and President, PIMCO Funds. | 105 | Director, PS Business Parks, Inc. (2005 – 2012) |
John F. Cogan
1947
Trustee
(Trustee of The Charles Schwab Family of Funds, Schwab Investments, Schwab Capital Trust and Schwab Annuity Portfolios since 2008; Laudus Trust since 2010; Schwab Strategic Trust since 2016) | Senior Fellow, The Hoover Institution at Stanford University (Oct. 1979 – present); Senior Fellow, Stanford Institute for Economic Policy Research (2000 – present); Professor of Public Policy, Stanford University (1994 – 2015). | 105 | Director, Gilead Sciences, Inc. (2005 – present) |
Stephen Timothy Kochis
1946
Trustee
(Trustee of Schwab Strategic Trust since 2012; The Charles Schwab Family of Funds, Schwab Investments, Schwab Capital Trust, Schwab Annuity Portfolios and Laudus Trust since 2016) | CEO and Owner, Kochis Global (wealth management consulting) (May 2012 – present); Chairman and CEO, Aspiriant, LLC (wealth management) (Jan. 2008 – Apr. 2012). | 105 | None |
David L. Mahoney
1954
Trustee
(Trustee of The Charles Schwab Family of Funds, Schwab Investments, Schwab Capital Trust, Schwab Annuity Portfolios and Laudus Trust since 2011; Schwab Strategic Trust since 2016) | Private Investor. | 105 | Director, Symantec Corporation (2003 – present)
Director, Corcept Therapeutics Incorporated (2004 – present)
Director, Adamas Pharmaceuticals, Inc. (2009 – present) |
Schwab U.S. REIT ETF | Semiannual Report
| Independent Trustees (continued) |
Name, Year of Birth, and
Position(s) with the trust
(Terms of office, and
length of Time Served1) | Principal Occupations
During the Past Five Years | Number of
Portfolios in
Fund Complex
Overseen by
the Trustee | Other Directorships |
Kiran M. Patel
1948
Trustee
(Trustee of The Charles Schwab Family of Funds, Schwab Investments, Schwab Capital Trust, Schwab Annuity Portfolios and Laudus Trust since 2011; Schwab Strategic Trust since 2016) | Retired. Executive Vice President and General Manager of Small Business Group, Intuit, Inc. (financial software and services firm for consumers and small businesses) (Dec. 2008 – Sept. 2013). | 105 | Director, KLA-Tencor Corporation (2008 – present) |
Kimberly S. Patmore
1956
Trustee
(Trustee of The Charles Schwab Family of Funds, Schwab Investments, Schwab Capital Trust, Schwab Annuity Portfolios, Schwab Strategic Trust and Laudus Trust since 2016) | Consultant, Patmore Management Consulting (management consulting) (2008 – present). | 105 | None |
Charles A. Ruffel
1956
Trustee
(Trustee of Schwab Strategic Trust since 2009; The Charles Schwab Family of Funds, Schwab Investments, Schwab Capital Trust, Schwab Annuity Portfolios and Laudus Trust since 2015) | Co-Chief Executive Officer, Kudu Investment Management, LLC (financial services) (Jan. 2015 – present); Partner, Kudu Advisors, LLC (financial services) (June 2008 – Jan. 2015); Advisor, Asset International, Inc. (publisher of financial services information) (Aug. 2008 – Jan. 2015). | 105 | None |
Gerald B. Smith
1950
Trustee
(Trustee of The Charles Schwab Family of Funds, Schwab Investments, Schwab Capital Trust and Schwab Annuity Portfolios since 2000; Laudus Trust since 2010; Schwab Strategic Trust since 2016) | Chairman, Chief Executive Officer and Founder of Smith Graham & Co. (investment advisors) (Mar. 1990 – present). | 105 | Director, Eaton (2012 – present)
Director and Chairman of the Audit Committee, Oneok Partners LP (2003 – 2013)
Director, Oneok, Inc. (2009 – 2013)
Lead Independent Director, Board of Cooper Industries (2002 – 2012) |
Joseph H. Wender
1944
Trustee
(Trustee of The Charles Schwab Family of Funds, Schwab Investments, Schwab Capital Trust and Schwab Annuity Portfolios since 2008; Laudus Trust since 2010; Schwab Strategic Trust since 2016) | Senior Consultant, Goldman Sachs & Co., Inc. (investment banking and securities firm) (Jan. 2008 – present); Partner, Colgin Partners, LLC (vineyards) (Feb. 1998 – present). | 105 | Board Member and Chairman of the Audit Committee, Ionis Pharmaceuticals (1994 – present)
Lead Independent Director and Chair of Audit Committee, OUTFRONT Media Inc. (2014 – present) |
Schwab U.S. REIT ETF | Semiannual Report
| Interested Trustees |
Name, Year of Birth, and
Position(s) with the trust
(Terms of office, and
length of Time Served1) | Principal Occupations
During the Past Five Years | Number of
Portfolios in
Fund Complex
Overseen by
the Trustee | Other Directorships |
Walter W. Bettinger II2
1960
Chairman and Trustee
(Trustee of The Charles Schwab Family of Funds, Schwab Investments, Schwab Capital Trust and Schwab Annuity Portfolios since 2008; Schwab Strategic Trust since 2009; Laudus Trust since 2010) | Director, President and Chief Executive Officer, The Charles Schwab Corporation (Oct. 2008 – present); President and Chief Executive Officer (Oct. 2008 – present), Director (May 2008 – present), Charles Schwab & Co., Inc.; Director, Charles Schwab Bank (Apr. 2006 – present); Director, Schwab Holdings, Inc. (May 2008 – present); and Director, Charles Schwab Investment Management, Inc. (July 2016 – present). | 105 | Director, The Charles Schwab Corporation (2008 – present) |
Marie A. Chandoha2
1961
Trustee
(Trustee of The Charles Schwab Family of Funds, Schwab Investments, Schwab Capital Trust, Schwab Annuity Portfolios, Schwab Strategic Trust and Laudus Trust since 2016) | Director, President and Chief Executive Officer (Dec. 2010 – present), Chief Investment Officer (Sept. 2010 – Oct. 2011), Charles Schwab Investment Management, Inc.; Trustee (Jan. 2016 – present), President, Chief Executive Officer (Dec. 2010 – present), and Chief Investment Officer (Sept. 2010 – Oct. 2011), Schwab Funds, Laudus Funds and Schwab ETFs; Director, Charles Schwab Worldwide Funds plc and Charles Schwab Asset Management (Ireland) Limited (Jan. 2011 – present); Global Head of Fixed Income Business Division, BlackRock, Inc. (formerly Barclays Global Investors) (Mar. 2007 – Aug. 2010). | 105 | None |
Joseph R. Martinetto2
1962
Trustee
(Trustee of The Charles Schwab Family of Funds, Schwab Investments, Schwab Capital Trust, Schwab Annuity Portfolios, Schwab Strategic Trust and Laudus Trust since 2016) | Senior Executive Vice President (July 2015 – present), Chief Financial Officer (July 2015 – May 2017), Executive Vice President and Chief Financial Officer (May 2007 – July 2015), The Charles Schwab Corporation and Charles Schwab & Co., Inc.; Director, Charles Schwab & Co., Inc. (May 2007 – present); Director (Apr. 2010 – present) and Chief Executive Officer (July 2013 – Apr. 2015), Charles Schwab Bank; Director (May 2007 – present), Chief Financial Officer (May 2007 – May 2017), Senior Executive Vice President (Feb. 2016 – present), and Executive Vice President (May 2007 – Feb. 2016), Schwab Holdings, Inc. | 105 | None |
| Officers of the Trust |
Name, Year of Birth, and Position(s) with the trust
(Terms of office, and length of Time Served3) | Principal Occupations During the Past Five Years |
Marie A. Chandoha
1961
President and Chief Executive Officer
(Officer of The Charles Schwab Family of Funds, Schwab Investments, Schwab Capital Trust, Schwab Annuity Portfolios, Schwab Strategic Trust and Laudus Trust since 2010) | Director, President and Chief Executive Officer (Dec. 2010 – present), Chief Investment Officer (Sept. 2010 – Oct. 2011), Charles Schwab Investment Management, Inc.; Trustee (Jan. 2016 – present), President, Chief Executive Officer (Dec. 2010 – present), and Chief Investment Officer (Sept. 2010 – Oct. 2011), Schwab Funds, Laudus Funds and Schwab ETFs; Director, Charles Schwab Worldwide Funds plc and Charles Schwab Asset Management (Ireland) Limited (Jan. 2011 – present); Global Head of Fixed Income Business Division, BlackRock, Inc. (formerly Barclays Global Investors) (Mar. 2007 – Aug. 2010). |
Mark Fischer
1970
Treasurer and Chief Financial Officer
(Officer of The Charles Schwab Family of Funds, Schwab Investments, Schwab Capital Trust, Schwab Annuity Portfolios, Schwab Strategic Trust and Laudus Trust since 2013) | Treasurer and Chief Financial Officer, Schwab Funds, Laudus Funds and Schwab ETFs (Jan. 2016 – present); Assistant Treasurer, Schwab Funds and Laudus Funds (Dec. 2013 – Dec. 2015), Schwab ETFs (Nov. 2013 – Dec. 2015); Vice President, Charles Schwab Investment Management, Inc. (Oct. 2013 – present); Executive Director, J.P. Morgan Investor Services (Apr. 2011 – Sept. 2013); Assistant Treasurer, Massachusetts Financial Service Investment Management (May 2005 – Mar. 2011). |
Schwab U.S. REIT ETF | Semiannual Report
| Officers of the Trust (continued) |
Name, Year of Birth, and Position(s) with the trust
(Terms of office, and length of Time Served3) | Principal Occupations During the Past Five Years |
George Pereira
1964
Senior Vice President and Chief Operating Officer
(Officer of The Charles Schwab Family of Funds, Schwab Investments, Schwab Capital Trust and Schwab Annuity Portfolios since 2004; Laudus Trust since 2006; Schwab Strategic Trust since 2009) | Senior Vice President and Chief Financial Officer (Nov. 2004 – present), Chief Operating Officer (Jan. 2011 – present), Charles Schwab Investment Management, Inc.; Senior Vice President and Chief Operating Officer (Jan. 2016 – present), Treasurer and Chief Financial Officer, Laudus Funds (June 2006 – Dec. 2015); Treasurer and Principal Financial Officer, Schwab Funds (Nov. 2004 – Dec. 2015) and Schwab ETFs (Oct. 2009 – Dec. 2015); Director, Charles Schwab Worldwide Funds plc and Charles Schwab Asset Management (Ireland) Limited (Apr. 2005 – present). |
Omar Aguilar
1970
Senior Vice President and Chief Investment Officer – Equities and Multi-Asset Strategies
(Officer of The Charles Schwab Family of Funds, Schwab Investments, Schwab Capital Trust, Schwab Annuity Portfolios, Schwab Strategic Trust and Laudus Trust since 2011) | Senior Vice President and Chief Investment Officer – Equities and Multi-Asset Strategies, Charles Schwab Investment Management, Inc. (Apr. 2011 – present); Senior Vice President and Chief Investment Officer – Equities, Schwab Funds, Laudus Funds and Schwab ETFs (June 2011 – present); Head of the Portfolio Management Group and Vice President of Portfolio Management, Financial Engines, Inc. (May 2009 – Apr. 2011); Head of Quantitative Equity, ING Investment Management (July 2004 – Jan. 2009). |
Brett Wander
1961
Senior Vice President and Chief Investment Officer – Fixed Income
(Officer of The Charles Schwab Family of Funds, Schwab Investments, Schwab Capital Trust, Schwab Annuity Portfolios, Schwab Strategic Trust and Laudus Trust since 2011) | Senior Vice President and Chief Investment Officer – Fixed Income, Charles Schwab Investment Management, Inc. (Apr. 2011 – present); Senior Vice President and Chief Investment Officer – Fixed Income, Schwab Funds, Laudus Funds and Schwab ETFs (June 2011 – present); Senior Managing Director, Global Head of Active Fixed-Income Strategies, State Street Global Advisors (Jan. 2008 – Oct. 2010); Director of Alpha Strategies Loomis, Sayles & Company (Apr. 2006 – Jan. 2008). |
David Lekich
1964
Chief Legal Officer and Secretary, Schwab Funds and Schwab ETFs
Vice President and Assistant Clerk, Laudus Funds
(Officer of The Charles Schwab Family of Funds, Schwab Investments, Schwab Capital Trust, Schwab Annuity Portfolios, Schwab Strategic Trust and Laudus Trust since 2011) | Senior Vice President (Sept. 2011 – present), Vice President (Mar. 2004 – Sept. 2011), Charles Schwab & Co., Inc.; Senior Vice President and Chief Counsel (Sept. 2011 – present), Vice President (Jan. 2011 – Sept. 2011), Charles Schwab Investment Management, Inc.; Secretary (Apr. 2011 – present) and Chief Legal Officer (Dec. 2011 – present), Schwab Funds; Vice President and Assistant Clerk, Laudus Funds (Apr. 2011 – present); Secretary (May 2011 – present) and Chief Legal Officer (Nov. 2011 – present), Schwab ETFs. |
Catherine MacGregor
1964
Vice President and Assistant Secretary, Schwab Funds and Schwab ETFs
Chief Legal Officer, Vice President and Clerk, Laudus Funds
(Officer of The Charles Schwab Family of Funds, Schwab Investments, Schwab Capital Trust, Schwab Annuity Portfolios and Laudus Trust since 2005; Schwab Strategic Trust since 2009) | Vice President, Charles Schwab & Co., Inc., Charles Schwab Investment Management, Inc. (July 2005 – present); Vice President (Dec. 2005 – present), Chief Legal Officer and Clerk (Mar. 2007 – present), Laudus Funds; Vice President (Nov. 2005 – present) and Assistant Secretary (June 2007 – present), Schwab Funds; Vice President and Assistant Secretary, Schwab ETFs (Oct. 2009 – present). |
| 1 | Each Trustee shall hold office until the election and qualification of his or her successor, or until he or she dies, resigns or is removed. The retirement policy requires that each independent trustee retire by December 31 of the year in which the Trustee turns 74 or the Trustee’s twentieth year of service as an independent trustee on any trust in the Fund Complex, whichever occurs first. |
| 2 | Mr. Bettinger, Ms. Chandoha and Mr. Martinetto are Interested Trustees because they own stock of The Charles Schwab Corporation, the parent company of the investment adviser. |
| 3 | The President, Treasurer and Secretary/Clerk hold office until their respective successors are chosen and qualified or until he or she sooner dies, resigns, is removed or becomes disqualified. Each of the other officers serves at the pleasure of the Board. |
Schwab U.S. REIT ETF | Semiannual Report
ask See “offer.”
asset allocation The practice of dividing a portfolio among different asset classes, with each asset class assigned a particular percentage to help offset risks and rewards, based on your goals, time horizon and risk tolerance.
asset class A group of securities with similar structure and basic characteristics. Stocks, bonds and cash are the three main examples of asset classes.
authorized participant (AP) A large institutional investor that places orders for creation units with the funds’ distributor.
beta A historical measure of an investment’s volatility relative to a market index (usually the S&P 500®). The index is defined as having a beta of 1.00. Investments with a beta higher than 1.00 have been more volatile than the index; those with a beta of less than 1.00 have been less volatile.
bid The highest price at which someone is willing to buy a security.
Bloomberg Barclays U.S. Aggregate Bond Index An index that represents securities that are SEC registered, taxable, and dollar denominated. The index covers the U.S. investment grade fixed rate bond market, with index components for government and corporate securities, mortgage pass-through securities, and asset-backed securities. The index excludes certain types of securities, including state and local government series bonds, structured notes embedded with swaps or other special features, private placements, floating rate securities, inflation-linked bonds and Eurobonds.
cap, capitalization See “market cap.”
capital gain, capital loss The difference between the amount paid for an investment and its value at a later time. If the investment has been sold, the capital gain or loss is considered a realized gain or loss. If the investment is still held, the gain or loss is still “on paper” and is considered unrealized.
commencement of operations The date that the first NAV was calculated.
creation unit (C.U.) A basket of securities that is delivered by an authorized participant (AP) to the fund equal to the current holdings of the ETF, plus a designated cash component. In return, the APs receive a large block of ETF shares (typically 50,000 shares), which investors can then buy and sell in the secondary market.
Dow Jones U.S. Select REIT Index An index that is a float-adjusted market-capitalization weighted index comprised of real estate investment trusts (REITs). REITs are real estate companies that own and commonly operate income-producing commercial and/or residential real estate. The index excludes mortgage REITs, net-lease REITs, real estate finance companies, mortgage brokers and bankers, commercial and residential real estate brokers and estate agents, homebuilders, large landowners and sub dividers of unimproved land, hybrid REITs, timber REITs and companies that have more than 25% of their assets in direct mortgage investments.
exchange A marketplace, or any organization or group that provides or maintains a marketplace for trading securities, options, futures, or commodities.
expense ratio The amount that is taken from the fund’s assets each year to cover the operating expenses. An expense ratio of 0.50% means that a fund’s expenses amount to half of one percent of its average net assets a year.
FTSE EPRA/NAREIT Global Index (Net) An index that provides a diverse representation of publicly traded equity real estate investment trusts (REITs) and listed property companies worldwide. The index constituents are free-float adjusted, and screened on liquidity, size and revenue. The index is comprised of countries in developed and emerging markets. The Net of Tax Index is calculated based on the maximum withholding tax rates applicable to dividends received by institutional investors who are not resident in the same country as the remitting company and who do not benefit from double taxation treaties.
inception date The date that the shares began trading in the secondary market.
indicative optimized portfolio value (IOPV) A calculation disseminated by the stock exchange that approximates the fund’s NAV every 15 seconds throughout the trading day.
liquidity The ability to convert a security or asset quickly into cash.
market cap, market capitalization The value of a company as determined by the total value of all shares of its stock outstanding.
market price return The return based on the change in market price per share of the fund over a given time period. Market price returns assume that dividends and capital gain distributions have been reinvested in the fund at market price.
median market cap The midpoint of the range of market caps of the stocks held by a fund. There are different ways of calculating median market cap. With a simple median, half of the stocks in the fund’s portfolio would be larger than the median, and half would be smaller. With a weighted median (the type that is calculated for these funds), half of the fund’s assets are invested in stocks that are larger than the median market cap, and half in stocks that are smaller.
MSCI EAFE Index (Net) A free float-adjusted market capitalization index that is designed to measure the equity market performance of developed markets in Europe, Australasia, and the Far East. The Net version of the index reflects reinvested dividends net of withholding taxes, but reflects no deductions for expenses or other taxes; returns are calculated applying dividend withholding rates applicable to non-resident persons who do not benefit from double taxation treaties.
MSCI Emerging Markets Index (Net) A free float-adjusted market capitalization weighted index that is designed to measure equity market performance in the global emerging markets. This series approximates the minimum possible dividend reinvestment. The returns are calculated applying dividend withholding rates applicable to non-resident persons who do not benefit from double taxation treaties.
net asset value (NAV) The value of one share of a fund. NAV is calculated by taking the fund’s total assets, subtracting liabilities, and dividing by the number of shares outstanding.
NAV return The return based on the change in NAV of the fund over a given time period. NAV returns assume that dividends and capital gain distributions have been reinvested in the fund.
offer (ask) The lowest price at which an individual is willing to sell a security.
open The price at which a security opened for trading on a given day.
outstanding shares, shares outstanding When speaking of the fund, indicates all shares currently held by investors.
Schwab U.S. REIT ETF | Semiannual Report
price-to-book ratio (P/B) The market price of a company’s stock compared with its “book value.” A mutual fund’s P/B is the weighted average of the P/B of all stocks in the fund’s portfolio.
price-to-earnings ratio (P/E) The market price of a company’s stock compared with earnings over the past year. A mutual fund’s P/E is the weighted average of the P/E of all stocks in the fund’s portfolio.
primary market The market that deals with the issuance of new securities.
real estate investment trust (REIT) Real estate companies that own and commonly operate income producing commercial and/or residential real estate.
rights and warrants Rights and warrants are types of securities that entitle the holder to purchase a proportionate amount of common stock at a specified price for a specific period of time. Rights allow a shareholder to buy more shares directly from the company, usually at a price somewhat lower than the current market price of the outstanding shares. Warrants are usually issued with bonds and preferred stock. Rights and warrants can trade on the market separately from the company’s stock. The prices of rights and warrants do not necessarily move parallel to the prices of the underlying common stock. Rights usually expire within a few weeks of issuance, while warrants may not expire for several years. If a right or warrant is not exercised within the specified time period, it will become worthless and a fund will lose the purchase price it paid for the right or warrant and the right to purchase the underlying security.
S&P 500 Index An index that is designed to measure the performance of 500 leading publicly traded companies from a broad range of industries.
sampling If a fund uses a sampling method, the fund will not fully replicate the benchmark index and may hold securities not included in the index. A fund that utilizes a sampling approach may not track the return of the index.
secondary market The market in which investors purchase securities from other investors rather than directly from the issuing companies. Organized exchanges facilitate the trading of securities in the secondary market.
spread The gap between bid and ask prices of a security.
stock A share of ownership, or equity, in the issuing company.
total return The percentage that an investor would have earned or lost on an investment in the fund assuming dividends and distributions were reinvested.
tracking error The difference between the performance of the fund and its benchmark index, positive or negative.
Schwab U.S. REIT ETF | Semiannual Report
Schwab ETFs™
Schwab ETFs are designed to be low-cost, diversified investments which follow broad market indices and provide exposure to specific segments of the market. These ETFs can serve as part of the foundation of a diversified portfolio. The list below shows all currently available Schwab ETFs.
Investors should carefully consider information contained in the prospectus, or if available, the summary prospectus, including investment objectives, risks, charges and expenses before investing. Please call 1-877-824-5615 for a prospectus and brochure for any Schwab ETF. Please read the prospectus carefully before you invest. This report must be preceded or accompanied by a current prospectus.
Proxy Voting Policies, Procedures and Results
A description of the proxy voting policies and procedures used to determine how to vote proxies on behalf of the funds is available without charge, upon request, by visiting the Schwab ETFs’ website at www.schwabfunds.com/schwabetfs_prospectus, the SEC’s website at www.sec.gov, or by contacting Schwab ETFs at 1-877-824-5615.
Information regarding how a fund voted proxies relating to portfolio securities during the most recent twelve-month period ended June 30 is available, without charge, by visiting the fund’s website at www.schwabfunds.com/schwabetfs_prospectus or the SEC’s website at www.sec.gov.
U.S. ETFs
Schwab U.S. Broad Market ETF™
Schwab 1000 Index® ETF
Schwab U.S. Large-Cap ETF™
Schwab U.S. Large-Cap Growth ETF™
Schwab U.S. Large-Cap Value ETF™
Schwab U.S. Mid-Cap ETF™
Schwab U.S. Small-Cap ETF™
Schwab U.S. Dividend Equity ETF™
Schwab U.S. REIT ETF™
International ETFs
Schwab International Equity ETF™
Schwab International Small-Cap Equity ETF™
Schwab Emerging Markets Equity ETF™
Fixed Income ETFs
Schwab U.S. TIPS ETF™
Schwab Short-Term U.S. Treasury ETF™
Schwab Intermediate-Term U.S. Treasury ETF™
Schwab U.S. Aggregate Bond ETF™
Fundamental Index* ETFs
Schwab Fundamental U.S. Broad Market Index ETF
Schwab Fundamental U.S. Large Company Index ETF
Schwab Fundamental U.S. Small Company Index ETF
Schwab Fundamental International Large Company Index ETF
Schwab Fundamental International Small Company Index ETF
Schwab Fundamental Emerging Markets Large Company
Index ETF
Investment Adviser
Charles Schwab Investment Management, Inc.
211 Main Street, San Francisco, CA 94105
Schwab ETFs™
1-877-824-5615
© 2017 Charles Schwab Investment Management, Inc. All rights reserved.
Printed on recycled paper.
| * | FUNDAMENTAL INDEX is a registered trademark of Research Affiliates LLC. |
This page is intentionally left blank.
Semiannual Report | August 31, 2017
Schwab Fundamental Index* ETFs
Schwab Fundamental
U.S. Broad Market Index ETF
Schwab Fundamental
U.S. Large Company Index ETF
Schwab Fundamental
U.S. Small Company Index ETF
Schwab Fundamental
International Large Company
Index ETF
Schwab Fundamental
International Small Company
Index ETF
Schwab Fundamental
Emerging Markets Large
Company Index ETF
| * | SCHWAB is a registered trademark of Charles Schwab & Co., Inc.
FUNDAMENTAL INDEX is a registered trademark of Research
Affiliates LLC. |
Fund investment adviser: Charles Schwab Investment Management, Inc. (CSIM).
Distributor: SEI Investments Distribution Co. (SIDCO)
The Sector/Industry classifications in this report use the Global Industry Classification Standard (GICS), which was developed by and is the exclusive property of MSCI Inc. (MSCI) and Standard & Poor’s (S&P). GICS is a service mark of MSCI and S&P and has been licensed for use by Charles Schwab & Co., Inc. The Industry classifications used in the schedules of Condensed Portfolio Holdings are sub-categories of Sector classifications.
Schwab Fundamental Index ETFs | Semiannual Report
Schwab Fundamental Index ETFs
The performance data quoted represents past performance. Past performance does not guarantee future results. Investment return and principal value of an investment will fluctuate so that an investor’s shares, when sold or redeemed, may be worth more or less than the original cost. Current performance may be lower or higher than the performance quoted. To obtain performance information current to the most recent month end, please visit www.schwabfunds.com/schwabetfs_prospectus.
| Total Returns for the 6 Months Ended August 31, 2017 |
Schwab Fundamental U.S. Broad Market Index ETF
(Ticker Symbol: FNDB) | |
| Market Price Return1 | 1.55% |
| NAV Return1 | 1.67% |
| Russell RAFITM US Index | 1.74% |
| Russell 3000® Index | 5.23% |
| ETF Category: Morningstar Large Value2 | 1.62% |
| Performance Details | pages 7-8 |
| |
Schwab Fundamental U.S. Large Company Index ETF
(Ticker Symbol: FNDX) | |
| Market Price Return1 | 1.93% |
| NAV Return1 | 1.90% |
| Russell RAFITM US Large Company Index | 1.96% |
| Russell 1000® Index | 5.50% |
| ETF Category: Morningstar Large Value2 | 1.62% |
| Performance Details | pages 9-10 |
| |
Schwab Fundamental U.S. Small Company Index ETF
(Ticker Symbol: FNDA) | |
| Market Price Return1 | -0.68% |
| NAV Return1 | -0.71% |
| Russell RAFITM US Small Company Index | -0.69% |
| Russell 2000® Index | 2.04% |
| ETF Category: Morningstar Small Blend2 | 0.69% |
| Performance Details | pages 11-12 |
| Total Returns for the 6 Months Ended August 31, 2017 |
Schwab Fundamental International Large Company Index ETF
(Ticker Symbol: FNDF) | |
| Market Price Return1 | 11.42% |
| NAV Return1 | 11.00% |
| Russell RAFITM Developed ex US Large Company Index (Net)* | 10.90% |
| MSCI EAFE® Index (Net)* | 12.14% |
| ETF Category: Morningstar Foreign Large Value2 | 11.01% |
| Performance Details | pages 13-14 |
| |
Schwab Fundamental International Small Company Index ETF
(Ticker Symbol: FNDC) | |
| Market Price Return1 | 13.45% |
| NAV Return1 | 12.77% |
| Russell RAFITM Developed ex US Small Company Index (Net)* | 12.74% |
| S&P Developed ex-U.S. Small Cap Index (Net)* | 14.62% |
| ETF Category: Morningstar Foreign Small/Mid Blend2 | 15.28% |
| Performance Details | pages 15-16 |
| |
Schwab Fundamental Emerging Markets Large Company Index ETF
(Ticker Symbol: FNDE) | |
| Market Price Return1 | 11.15% |
| NAV Return1 | 10.28% |
| Russell RAFITM Emerging Markets Large Company Index (Net)* | 10.47% |
| MSCI Emerging Markets Index (Net)* | 18.02% |
| ETF Category: Morningstar Diversified Emerging Markets2 | 16.68% |
| Performance Details | pages 17-18 |
All total returns on this page assume dividends and distributions were reinvested. Index figures do not include trading and management costs, which would lower performance. Indices are unmanaged and cannot be invested in directly. Performance results less than one year are not annualized.
The first index listed for each fund is the fund’s primary benchmark, as shown in the prospectus. Additional indices shown are provided for comparative purposes.
For index definitions, please see the Glossary.
Performance does not reflect the deduction of taxes that a shareholder would pay on fund distributions or on the redemption of fund shares.
Shares are bought and sold at market price, which may be higher or lower than the net asset value (NAV). Brokerage commissions will reduce returns.
Index ownership — Russell® is a trademark owned by Frank Russell Company (Russell). The Russell RAFI™ Index Series are calculated by Russell in conjunction with Research Affiliates® LLC (RA). Neither Russell nor RA sponsor, endorse or promote the Schwab Fundamental Index ETFs and are not in any way connected to them and do not accept any liability in relation to their issue, operation and trading. Any intellectual property rights in the index values and constituent list vests in Russell. “Research Affiliates®”, “Fundamental Index®” and “RAFI®” trade names are the exclusive property of RA. CSIM has obtained full license from Russell to use such intellectual property rights in the creation of the funds. For full disclaimer please see the funds' statement of additional information. Effective December 1, 2016, the name of the index was changed by the index provider. No other changes to the index have occurred.
| * | The net version of the index reflects reinvested dividends net of withholding taxes, but reflects no deductions for expenses or other taxes. |
| 1 | ETF performance must be shown based on both a market price and NAV basis. The fund’s per share NAV is the value of one share of the fund. NAV is calculated by taking the fund’s total assets (including the market value of securities owned), subtracting liabilities, and dividing by the number of shares outstanding. The NAV Return is based on the NAV of the fund, and the Market Price Return is based on the market price per share of the fund. The price used to calculate market return (Market Price) is determined by using the midpoint between the highest bid and the lowest offer on the primary stock exchange on which the shares of the fund are listed for trading, as of the time that the fund’s NAV is calculated. Market Price and NAV returns assume that dividends and capital gain distributions have been reinvested in the fund at Market Price and NAV, respectively. |
| 2 | Source for category information: Morningstar, Inc. The Morningstar Category return represents all passively- and actively-managed ETFs within the category as of the report date. |
Schwab Fundamental Index ETFs | Semiannual Report
Schwab Fundamental Index ETFs
Marie Chandoha
President and CEO of
Charles Schwab Investment
Management, Inc. and the
funds covered in this report.
Dear Shareholder,
For more than 25 years, Charles Schwab Investment Management has been driven to give investors what they want and need—without confusion. One of our goals has been to reduce the complexity of investing. Our mutual funds and exchange-traded funds (ETFs) support this mission by reducing the complexity involved with building a diversified portfolio. The Schwab Fundamental Index ETFs have made equity investing more straightforward by eliminating the need to select individual stocks, saving shareholders time and money.
We have taken important steps over the years to democratize the investing landscape even further on behalf of investors by simplifying and lowering the cost of investing. For instance, earlier this year we reduced the expenses on all of the Fundamental Index ETFs, giving these funds among the lowest costs in the industry.
At Charles Schwab Investment Management, we also strive to take a straightforward approach in our communications. In this and in every shareholder report, we provide the funds’ financial statements and other information in a consistent format that we believe will help you to evaluate the
Asset Class Performance Comparison % returns during the 6 months ended August 31, 2017
These figures assume dividends and distributions were reinvested. Index figures do not include trading and management costs, which would lower performance. Indices are unmanaged and you cannot invest in them directly. Remember that past performance is not a guarantee of future results.
For index definitions, please see the Glossary.
Data source: Index provider websites and CSIM.
Nothing in this report represents a recommendation of a security by the investment adviser.
Management views may have changed since the report date.
| * | The net version of the index reflects reinvested dividends net of withholding taxes, but reflects no deductions for expenses or other taxes. |
Schwab Fundamental Index ETFs | Semiannual Report
Schwab Fundamental Index ETFs
From the President (continued)
“ We have taken important steps over the years to democratize the investing landscape even further on behalf of investors by simplifying and lowering the cost of investing.”
performance of the funds. We aim to help you understand not only each fund’s return, but also how its investments are managed.
Our commitment to quality and transparency continues to win us both new business and recognition. During the second quarter, we achieved the largest ETF asset inflows in our history, topping $6 billion in quarterly flows for the second time since we began offering ETFs in 2009. And as of July, investors have entrusted us with $20 billion of their assets held in our Fundamental Index mutual funds and ETFs, reflecting the growing popularity of Fundamental Index strategies. Additionally, we were recently selected as one of Morningstar’s “9 Partners for the Next Decade,”1 reflecting our differentiation, low costs, repeatable investment processes, and adaptable business models.
We’re proud of these achievements, but more importantly, we’re honored to serve our investors. We’re committed to putting investors first by reducing cost and complexity—a commitment that will continue to inform how we operate and the decisions that we make.
Thank you for investing with Charles Schwab Investment Management. For more information about the Schwab Fundamental Index ETFs, please continue reading this report. In addition, you can find further details about these funds by visiting our website at www.schwabfunds.com. We are also happy to hear from you at 1-877-824-5615.
Sincerely,
| 1 | Morningstar, “9 Partners for the Next Decade.” Laura Pavlenko Lutton and Greggory Warren, CFA: April 27, 2017. Morningstar looked collectively across four traits (differentiation, low costs, repeatable investment processes, and adaptable business models) to identify firms that they believe are representative of these trends. |
Schwab Fundamental Index ETFs | Semiannual Report
Schwab Fundamental Index ETFs
The Investment Environment
Over the six-month reporting period ended August 31, 2017, most equity markets performed well amid generally accommodative monetary policies and a strengthening global economy. Even with several spikes over the reporting period, overall market volatility lessened, and many stocks, both in the U.S. and abroad, continued to rise in the wake of expectations for policy changes from the Trump administration. Meanwhile, the U.S. dollar weakened against many major currencies over the reporting period, including the euro and the British pound. In this environment, the S&P 500® Index, a bellwether for the overall U.S. stock market, returned 5.65%, while the Russell RAFI™ US Large Company Index returned 1.96% over the same timeframe. In U.S. small-cap markets, the Russell 2000® Index and the Russell RAFI™ US Small Company Index returned 2.04% and -0.69%, respectively. Internationally, the MSCI EAFE ® Index (Net), a broad measure of developed international equity performance, returned 12.14%, while the Russell RAFI™ Developed ex US Large Company Index (Net) returned 10.90%. In emerging markets, the MSCI Emerging Markets Index (Net) and the Russell RAFI™ Emerging Markets Large Company Index (Net) returned 18.02% and 10.47%, respectively.
Central bank policies remained fairly accommodative over the six-month reporting period as inflation generally remained below targets, supporting both the global economy and global stock markets. Though the Federal Reserve (Fed) took additional steps toward a more normalized monetary policy environment, including raising the federal funds rate in March and June, short-term interest rates in the U.S. remained low compared to historical averages. Outside the U.S., the Bank of Japan maintained negative interest rates and continued to utilize yield curve management as a policy tool, while emphasizing that Japan’s policy stance would not change until inflation moved above the 2% target. The Bank of England left key interest rates at record lows and the European Central Bank (ECB) kept its interest rates unchanged, including a negative deposit facility rate. The ECB also reiterated on several occasions that though policy normalization was on the horizon, its bond purchase program would continue until at least the end of 2017. In emerging markets, central banks remained in different phases of monetary policy. For example, the People’s Bank of China maintained a “prudent and neutral” policy stance amid a generally stabilized Chinese economy, while the Central Bank of Brazil cut short-term interest rates several times over the six-month reporting period.
Global economic growth continued to improve over the reporting period, with the world’s major economies growing together for the first time in 10 years.1 In the U.S., the economy continued to chug along as it entered its ninth year of expansion. Nonfarm payrolls were steady and U.S. gross domestic product (GDP) grew modestly, while consumer confidence remained high and unemployment hovered near a 16-year low. Outside the U.S., many international economies continued to gain momentum. Unemployment in the eurozone fell to its lowest level in more than eight years, and solid retail sales and manufacturing Purchasing Managers Index helped propel economic growth in the region. Meanwhile Japan’s economy grew for the sixth straight quarter amid robust domestic demand and increased business spending. China’s economic outlook was positive as growth remained steady, and according to the International Monetary Fund, the country has the potential to sustain strong growth over the medium term. Low oil prices and U.S. sanctions continued to negatively affect the Russian economy, while Brazil emerged from its worst recession on record in 2017 amid two consecutive quarters of growth. However, charges of corruption against Brazil’s president weighed on local stocks and threatened to derail the fragile recovery.
All total returns on this page assume dividends and distributions were reinvested. Index figures do not include trading and management costs, which would lower performance. Indices are unmanaged and cannot be invested in directly. Performance results less than one year are not annualized.
For index definitions, please see the Glossary.
Nothing in this report represents a recommendation of a security by the investment adviser.
Management views may have changed since the report date.
| 1 | As of August 2017, Organization for Economic Cooperation and Development. |
Schwab Fundamental Index ETFs | Semiannual Report
Schwab Fundamental Index ETFs
 | Christopher Bliss, CFA, Vice President and Head of the Passive Equity Team, leads the portfolio management team for Schwab’s Passive Equity Funds and ETFs. He also has overall responsibility for all aspects of the management of the funds. Prior to joining CSIM in 2016, Mr. Bliss spent 12 years at BlackRock (formerly Barclays Global Investors) managing and leading institutional index teams, most recently as a Managing Director and Head of Americas Institutional Index team. Prior to BlackRock, he worked as an equity analyst and portfolio manager for Harris Bretall and before that, as a research analyst for JP Morgan. |
 | Chuck Craig, CFA, Senior Portfolio Manager, is responsible for the day-to-day co-management of the Schwab Fundamental International Large Company Index ETF, Schwab Fundamental International Small Company Index ETF, and Schwab Fundamental Emerging Markets Large Company Index ETF. Prior to joining CSIM in 2012, Mr. Craig worked at Guggenheim Funds (formerly Claymore Group), where he spent more than five years as a managing director of portfolio management and supervision, and three years as vice president of product research and development. Prior to that, he worked as an equity research analyst at First Trust Portfolios (formerly Niké Securities), and a trader and analyst at PMA Securities, Inc. |
 | Ferian Juwono, CFA, Senior Portfolio Manager, is responsible for the day-to-day co-management of the Schwab Fundamental U.S. Broad Market Index ETF, Schwab Fundamental U.S. Large Company Index ETF, and Schwab Fundamental U.S. Small Company Index ETF. Prior to joining CSIM in 2010, Mr. Juwono worked at BlackRock (formerly Barclays Global Investors), where he spent more than three years as a portfolio manager, managing equity index funds for institutional clients, and nearly two years as a senior business analyst. Prior to that, Mr. Juwono worked for more than four years as a senior financial analyst with Union Bank of California. |
 | Jane Qin, Portfolio Manager, is responsible for the day-to-day co-management of the Schwab Fundamental International Large Company Index ETF, Schwab Fundamental International Small Company Index ETF, and Schwab Fundamental Emerging Markets Large Company Index ETF. Prior to joining CSIM in 2012, Ms. Qin spent more than four years at The Bank of New York Mellon Corporation. During that time, Ms. Qin spent more than two years as an associate equity portfolio manager and nearly two years as a performance analyst. She also worked at Wells Fargo Funds Management as a mutual fund analyst and at CIGNA Reinsurance in Risk Management group as a risk analyst. |
 | David Rios, Portfolio Manager, is responsible for the day-to-day co-management of the Schwab Fundamental International Large Company Index ETF, Schwab Fundamental International Small Company Index ETF, and Schwab Fundamental Emerging Markets Large Company Index ETF. He joined CSIM in 2008 and became a Portfolio Manager in September 2014. Prior to this role, Mr. Rios served as an Associate Portfolio Manager on the Schwab Equity Index Strategies team for four years. His first role with CSIM was as a trade operation specialist. He also previously worked as a senior fund accountant at Investors Bank & Trust (subsequently acquired by State Street Corporation). |
 | Sabya Sinha, Portfolio Manager, is responsible for the day-to-day co-management of the Schwab Fundamental U.S. Broad Market Index ETF, Schwab Fundamental U.S. Large Company Index ETF, and Schwab Fundamental U.S. Small Company Index ETF. Prior to joining CSIM in 2015, Mr. Sinha spent a year at F-Squared Investments on the product development and analytics team. Prior to F-Squared, he worked at IndexIQ Advisors as a senior index portfolio manager for three years and for Bank of America’s Columbia Management subsidiary as a portfolio manager for three years. |
Schwab Fundamental Index ETFs | Semiannual Report
Schwab Fundamental U.S. Broad Market Index ETF
The performance data quoted represents past performance. Past performance does not guarantee future results. Investment return and principal value of an investment will fluctuate so that an investor’s shares, when sold or redeemed, may be worth more or less than the original cost. Current performance may be lower or higher than the performance quoted. To obtain performance information current to the most recent month end, please visit www.schwabfunds.com/schwabetfs_prospectus.
Average Annual Total Returns1
| Fund and Inception Date | 6 Months | 1 Year | 3 Years | Since Inception* |
| Fund: Schwab Fundamental U.S. Broad Market Index ETF (8/15/13) | | | | |
| Market Price Return2 | 1.55% | 12.02% | 7.03% | 10.08% |
| NAV Return2 | 1.67% | 12.22% | 7.04% | 10.11% |
| Russell RAFITM US Index | 1.74% | 12.46% | 7.33% | 10.43% |
| Russell 3000® Index | 5.23% | 16.06% | 9.08% | 11.82% |
| ETF Category: Morningstar Large Value3 | 1.62% | 12.48% | 6.11% | 8.61% |
| Fund Expense Ratio4: 0.25% |
All total returns on this page assume dividends and distributions were reinvested. Index figures do not include trading and management costs, which would lower performance. Indices are unmanaged and cannot be invested in directly. Performance results less than one year are not annualized.
The first index listed for the fund is the fund’s primary benchmark, as shown in the prospectus. Additional indices shown are provided for comparative purposes.
For index definitions, please see the Glossary.
Shares are bought and sold at market price, which may be higher or lower than the net asset value (NAV). Brokerage commissions will reduce returns.
Index ownership — Russell® is a trademark owned by Frank Russell Company (Russell). The Russell RAFI™ Index Series are calculated by Russell in conjunction with Research Affiliates® LLC (RA). Neither Russell nor RA sponsor, endorse or promote the Schwab Fundamental U.S. Broad Market Index ETF and are not in any way connected to it and do not accept any liability in relation to its issue, operation and trading. Any intellectual property rights in the index values and constituent list vests in Russell. “Research Affiliates®”, “Fundamental Index®” and “RAFI®” trade names are the exclusive property of RA. CSIM has obtained full license from Russell to use such intellectual property rights in the creation of this fund. For full disclaimer please see the fund’s statement of additional information. Effective December 1, 2016, the name of the index was changed by the index provider. No other changes to the index have occurred.
| * | Inception (8/15/13) represents the date that the shares began trading in the secondary market. |
| 1 | Performance does not reflect the deduction of taxes that a shareholder would pay on fund distributions or on the redemption of fund shares. |
| 2 | ETF performance must be shown based on both a market price and NAV basis. The fund’s per share NAV is the value of one share of the fund. NAV is calculated by taking the fund’s total assets (including the market value of securities owned), subtracting liabilities, and dividing by the number of shares outstanding. The NAV Return is based on the NAV of the fund, and the Market Price Return is based on the market price per share of the fund. The price used to calculate market return (Market Price) is determined by using the midpoint between the highest bid and the lowest offer on the primary stock exchange on which the shares of the fund are listed for trading, as of the time that the fund’s NAV is calculated. NAV is used as a proxy for purposes of calculating Market Price Return on inception date. Market Price and NAV returns assume that dividends and capital gain distributions have been reinvested in the fund at Market Price and NAV, respectively. |
| 3 | Source for category information: Morningstar, Inc. The Morningstar Category return represents all passively- and actively-managed ETFs within the category as of the report date. |
| 4 | As stated in the prospectus. |
Schwab Fundamental Index ETFs | Semiannual Report
Schwab Fundamental U.S. Broad Market Index ETF
Performance and Fund Facts as of August 31, 2017
| Number of Holdings | 1,411 |
| Weighted Average Market Cap (millions) | $131,311 |
| Price/Earnings Ratio (P/E) | 19.7 |
| Price/Book Ratio (P/B) | 2.3 |
| Portfolio Turnover Rate2,3 | 5% |
Sector Weightings % of Investments4
Top Equity Holdings % of Net Assets5
Portfolio holdings may have changed since the report date.
An index is a statistical composite of a specified financial market or sector. Unlike the fund, an index does not actually hold a portfolio of securities and its return is not inclusive of trading and management costs incurred by the fund.
Source of Sector Classification: S& P and MSCI.
| 1 | Excludes derivatives. |
| 2 | Not annualized. |
| 3 | Portfolio turnover rate excludes securities received or delivered from processing of in-kind creations or redemptions. |
| 4 | The percentage may differ from the Portfolio Holdings because the above calculation is based on a percentage of total investments, excluding derivatives, whereas the calculation in the Portfolio Holdings is based on a percentage of net assets. |
| 5 | This list is not a recommendation of any security by the investment adviser. |
Schwab Fundamental Index ETFs | Semiannual Report
Schwab Fundamental U.S. Large Company Index ETF
The performance data quoted represents past performance. Past performance does not guarantee future results. Investment return and principal value of an investment will fluctuate so that an investor’s shares, when sold or redeemed, may be worth more or less than the original cost. Current performance may be lower or higher than the performance quoted. To obtain performance information current to the most recent month end, please visit www.schwabfunds.com/schwabetfs_prospectus.
Average Annual Total Returns1
| Fund and Inception Date | 6 Months | 1 Year | 3 Years | Since Inception* |
| Fund: Schwab Fundamental U.S. Large Company Index ETF (8/15/13) | | | | |
| Market Price Return2 | 1.93% | 12.16% | 7.06% | 10.15% |
| NAV Return2 | 1.90% | 12.20% | 7.06% | 10.15% |
| Russell RAFITM US Large Company Index | 1.96% | 12.45% | 7.36% | 10.47% |
| Russell 1000® Index | 5.50% | 16.16% | 9.21% | 12.07% |
| ETF Category: Morningstar Large Value3 | 1.62% | 12.48% | 6.11% | 8.61% |
| Fund Expense Ratio4: 0.25% |
All total returns on this page assume dividends and distributions were reinvested. Index figures do not include trading and management costs, which would lower performance. Indices are unmanaged and cannot be invested in directly. Performance results less than one year are not annualized.
The first index listed for the fund is the fund’s primary benchmark, as shown in the prospectus. Additional indices shown are provided for comparative purposes.
For index definitions, please see the Glossary.
Shares are bought and sold at market price, which may be higher or lower than the net asset value (NAV). Brokerage commissions will reduce returns.
Index ownership — Russell® is a trademark owned by Frank Russell Company (Russell). The Russell RAFI™ Index Series are calculated by Russell in conjunction with Research Affiliates® LLC (RA). Neither Russell nor RA sponsor, endorse or promote the Schwab Fundamental U.S. Large Company Index ETF and are not in any way connected to it and do not accept any liability in relation to its issue, operation and trading. Any intellectual property rights in the index values and constituent list vests in Russell. “Research Affiliates®”, “Fundamental Index®” and “RAFI®” trade names are the exclusive property of RA. CSIM has obtained full license from Russell to use such intellectual property rights in the creation of this fund. For full disclaimer please see the fund’s statement of additional information. Effective December 1, 2016, the name of the index was changed by the index provider. No other changes to the index have occurred.
| * | Inception (8/15/13) represents the date that the shares began trading in the secondary market. |
| 1 | Performance does not reflect the deduction of taxes that a shareholder would pay on fund distributions or on the redemption of fund shares. |
| 2 | ETF performance must be shown based on both a market price and NAV basis. The fund’s per share NAV is the value of one share of the fund. NAV is calculated by taking the fund’s total assets (including the market value of securities owned), subtracting liabilities, and dividing by the number of shares outstanding. The NAV Return is based on the NAV of the fund, and the Market Price Return is based on the market price per share of the fund. The price used to calculate market return (Market Price) is determined by using the midpoint between the highest bid and the lowest offer on the primary stock exchange on which the shares of the fund are listed for trading, as of the time that the fund’s NAV is calculated. NAV is used as a proxy for purposes of calculating Market Price Return on inception date. Market Price and NAV returns assume that dividends and capital gain distributions have been reinvested in the fund at Market Price and NAV, respectively. |
| 3 | Source for category information: Morningstar, Inc. The Morningstar Category return represents all passively- and actively-managed ETFs within the category as of the report date. |
| 4 | As stated in the prospectus. |
Schwab Fundamental Index ETFs | Semiannual Report
Schwab Fundamental U.S. Large Company Index ETF
Performance and Fund Facts as of August 31, 2017
| Number of Holdings | 665 |
| Weighted Average Market Cap (millions) | $142,543 |
| Price/Earnings Ratio (P/E) | 19.6 |
| Price/Book Ratio (P/B) | 2.4 |
| Portfolio Turnover Rate2,3 | 5% |
Sector Weightings % of Investments4
Top Equity Holdings % of Net Assets5
Portfolio holdings may have changed since the report date.
An index is a statistical composite of a specified financial market or sector. Unlike the fund, an index does not actually hold a portfolio of securities and its return is not inclusive of trading and management costs incurred by the fund.
Source of Sector Classification: S& P and MSCI.
| 1 | Excludes derivatives. |
| 2 | Not annualized. |
| 3 | Portfolio turnover rate excludes securities received or delivered from processing of in-kind creations or redemptions. |
| 4 | The percentage may differ from the Portfolio Holdings because the above calculation is based on a percentage of total investments, excluding derivatives, whereas the calculation in the Portfolio Holdings is based on a percentage of net assets. |
| 5 | This list is not a recommendation of any security by the investment adviser. |
Schwab Fundamental Index ETFs | Semiannual Report
Schwab Fundamental U.S. Small Company Index ETF
The performance data quoted represents past performance. Past performance does not guarantee future results. Investment return and principal value of an investment will fluctuate so that an investor’s shares, when sold or redeemed, may be worth more or less than the original cost. Current performance may be lower or higher than the performance quoted. To obtain performance information current to the most recent month end, please visit www.schwabfunds.com/schwabetfs_prospectus.
Average Annual Total Returns1
| Fund and Inception Date | 6 Months | 1 Year | 3 Years | Since Inception* |
| Fund: Schwab Fundamental U.S. Small Company Index ETF (8/15/13) | | | | |
| Market Price Return2 | -0.68% | 12.22% | 6.76% | 9.61% |
| NAV Return2 | -0.71% | 12.26% | 6.74% | 9.60% |
| Russell RAFITM US Small Company Index | -0.69% | 12.46% | 6.99% | 9.91% |
| Russell 2000® Index | 2.04% | 14.91% | 7.67% | 9.02% |
| ETF Category: Morningstar Small Blend3 | 0.69% | 12.67% | 5.80% | 7.72% |
| Fund Expense Ratio4: 0.25% |
All total returns on this page assume dividends and distributions were reinvested. Index figures do not include trading and management costs, which would lower performance. Indices are unmanaged and cannot be invested in directly. Performance results less than one year are not annualized.
The first index listed for the fund is the fund’s primary benchmark, as shown in the prospectus. Additional indices shown are provided for comparative purposes.
For index definitions, please see the Glossary.
Shares are bought and sold at market price, which may be higher or lower than the net asset value (NAV). Brokerage commissions will reduce returns.
Small-company stocks may be subject to greater volatility than many other asset classes.
Index ownership — Russell® is a trademark owned by Frank Russell Company (Russell). The Russell RAFI™ Index Series are calculated by Russell in conjunction with Research Affiliates® LLC (RA). Neither Russell nor RA sponsor, endorse or promote the Schwab Fundamental U.S. Small Company Index ETF and are not in any way connected to it and do not accept any liability in relation to its issue, operation and trading. Any intellectual property rights in the index values and constituent list vests in Russell. “Research Affiliates®”, “Fundamental Index®” and “RAFI®” trade names are the exclusive property of RA. CSIM has obtained full license from Russell to use such intellectual property rights in the creation of this fund. For full disclaimer please see the fund’s statement of additional information. Effective December 1, 2016, the name of the index was changed by the index provider. No other changes to the index have occurred.
| * | Inception (8/15/13) represents the date that the shares began trading in the secondary market. |
| 1 | Performance does not reflect the deduction of taxes that a shareholder would pay on fund distributions or on the redemption of fund shares. |
| 2 | ETF performance must be shown based on both a market price and NAV basis. The fund’s per share NAV is the value of one share of the fund. NAV is calculated by taking the fund’s total assets (including the market value of securities owned), subtracting liabilities, and dividing by the number of shares outstanding. The NAV Return is based on the NAV of the fund, and the Market Price Return is based on the market price per share of the fund. The price used to calculate market return (Market Price) is determined by using the midpoint between the highest bid and the lowest offer on the primary stock exchange on which the shares of the fund are listed for trading, as of the time that the fund’s NAV is calculated. NAV is used as a proxy for purposes of calculating Market Price Return on inception date. Market Price and NAV returns assume that dividends and capital gain distributions have been reinvested in the fund at Market Price and NAV, respectively. |
| 3 | Source for category information: Morningstar, Inc. The Morningstar Category return represents all passively- and actively-managed ETFs within the category as of the report date. |
| 4 | As stated in the prospectus. |
Schwab Fundamental Index ETFs | Semiannual Report
Schwab Fundamental U.S. Small Company Index ETF
Performance and Fund Facts as of August 31, 2017
| Number of Holdings | 910 |
| Weighted Average Market Cap (millions) | $4,740 |
| Price/Earnings Ratio (P/E) | 20.6 |
| Price/Book Ratio (P/B) | 1.9 |
| Portfolio Turnover Rate2,3 | 14% |
Sector Weightings % of Investments4
Top Equity Holdings % of Net Assets5
Portfolio holdings may have changed since the report date.
An index is a statistical composite of a specified financial market or sector. Unlike the fund, an index does not actually hold a portfolio of securities and its return is not inclusive of trading and management costs incurred by the fund.
Source of Sector Classification: S& P and MSCI.
| 1 | Excludes derivatives. |
| 2 | Not annualized. |
| 3 | Portfolio turnover rate excludes securities received or delivered from processing of in-kind creations or redemptions. |
| 4 | The percentage may differ from the Portfolio Holdings because the above calculation is based on a percentage of total investments, excluding derivatives, whereas the calculation in the Portfolio Holdings is based on a percentage of net assets. |
| 5 | This list is not a recommendation of any security by the investment adviser. |
Schwab Fundamental Index ETFs | Semiannual Report
Schwab Fundamental International Large Company Index ETF
The performance data quoted represents past performance. Past performance does not guarantee future results. Investment return and principal value of an investment will fluctuate so that an investor’s shares, when sold or redeemed, may be worth more or less than the original cost. Current performance may be lower or higher than the performance quoted. To obtain performance information current to the most recent month end, please visit www.schwabfunds.com/schwabetfs_prospectus.
Average Annual Total Returns1
| Fund and Inception Date | 6 Months | 1 Year | 3 Years | Since Inception* |
| Fund: Schwab Fundamental International Large Company Index ETF (8/15/13) | | | | |
| Market Price Return2 | 11.42% | 19.65% | 2.32% | 5.30% |
| NAV Return2 | 11.00% | 19.68% | 2.29% | 5.20% |
| Russell RAFITM Developed ex US Large Company Index (Net)3 | 10.90% | 19.79% | 2.39% | 5.39% |
| MSCI EAFE® Index (Net)3 | 12.14% | 17.64% | 2.83% | 4.84% |
| ETF Category: Morningstar Foreign Large Value4 | 11.01% | 17.42% | 1.24% | 4.25% |
| Fund Expense Ratio5: 0.25% |
All total returns on this page assume dividends and distributions were reinvested. Index figures do not include trading and management costs, which would lower performance. Indices are unmanaged and cannot be invested in directly. Performance results less than one year are not annualized.
The first index listed for the fund is the fund’s primary benchmark, as shown in the prospectus. Additional indices shown are provided for comparative purposes.
For index definitions, please see the Glossary.
Shares are bought and sold at market price, which may be higher or lower than the net asset value (NAV). Brokerage commissions will reduce returns.
International investing may involve risk of capital loss from unfavorable fluctuations in currency values, from differences in generally accepted accounting principles, or from economic or political instability in other nations.
Index ownership — Russell® is a trademark owned by Frank Russell Company (Russell). The Russell RAFI™ Index Series are calculated by Russell in conjunction with Research Affiliates® LLC (RA). Neither Russell nor RA sponsor, endorse or promote the Schwab Fundamental International Large Company Index ETF and are not in any way connected to it and do not accept any liability in relation to its issue, operation and trading. Any intellectual property rights in the index values and constituent list vests in Russell. “Research Affiliates®”, “Fundamental Index®” and “RAFI®” trade names are the exclusive property of RA. CSIM has obtained full license from Russell to use such intellectual property rights in the creation of this fund. For full disclaimer please see the fund’s statement of additional information. Effective December 1, 2016, the name of the index was changed by the index provider. No other changes to the index have occurred.
| * | Inception (8/15/13) represents the date that the shares began trading in the secondary market. |
| 1 | Performance does not reflect the deduction of taxes that a shareholder would pay on fund distributions or on the redemption of fund shares. |
| 2 | ETF performance must be shown based on both a market price and NAV basis. The fund’s per share NAV is the value of one share of the fund. NAV is calculated by taking the fund’s total assets (including the market value of securities owned), subtracting liabilities, and dividing by the number of shares outstanding. The NAV Return is based on the NAV of the fund, and the Market Price Return is based on the market price per share of the fund. The price used to calculate market return (Market Price) is determined by using the midpoint between the highest bid and the lowest offer on the primary stock exchange on which the shares of the fund are listed for trading, as of the time that the fund’s NAV is calculated. NAV is used as a proxy for purposes of calculating Market Price Return on inception date. Market Price and NAV returns assume that dividends and capital gain distributions have been reinvested in the fund at Market Price and NAV, respectively. |
| 3 | The net version of the index reflects reinvested dividends net of withholding taxes, but reflects no deductions for expenses or other taxes. |
| 4 | Source for category information: Morningstar, Inc. The Morningstar Category return represents all passively- and actively-managed ETFs within the category as of the report date. |
| 5 | As stated in the prospectus. |
Schwab Fundamental Index ETFs | Semiannual Report
Schwab Fundamental International Large Company Index ETF
Performance and Fund Facts as of August 31, 2017
| Number of Holdings | 843 |
| Weighted Average Market Cap (millions) | $53,631 |
| Price/Earnings Ratio (P/E) | 15.0 |
| Price/Book Ratio (P/B) | 1.4 |
| Portfolio Turnover Rate2,3 | 5% |
Sector Weightings % of Investments1
Top Equity Holdings % of Net Assets4
Country Weightings % of Investments5
Portfolio holdings may have changed since the report date.
An index is a statistical composite of a specified financial market or sector. Unlike the fund, an index does not actually hold a portfolio of securities and its return is not inclusive of trading and management costs incurred by the fund.
Source of Sector Classification: S&P and MSCI.
| 1 | Excludes derivatives. |
| 2 | Not annualized. |
| 3 | Portfolio turnover rate excludes securities received or delivered from processing of in-kind creations or redemptions. |
| 4 | This list is not a recommendation of any security by the investment adviser. |
| 5 | The percentage may differ from the Portfolio Holdings because the above calculation is based on a percentage of total investments, excluding derivatives, whereas the calculation in the Portfolio Holdings is based on a percentage of net assets. |
Schwab Fundamental Index ETFs | Semiannual Report
Schwab Fundamental International Small Company Index ETF
The performance data quoted represents past performance. Past performance does not guarantee future results. Investment return and principal value of an investment will fluctuate so that an investor’s shares, when sold or redeemed, may be worth more or less than the original cost. Current performance may be lower or higher than the performance quoted. To obtain performance information current to the most recent month end, please visit www.schwabfunds.com/schwabetfs_prospectus.
Average Annual Total Returns1
| Fund and Inception Date | 6 Months | 1 Year | 3 Years | Since Inception* |
| Fund: Schwab Fundamental International Small Company Index ETF (8/15/13) | | | | |
| Market Price Return2 | 13.45% | 22.08% | 7.80% | 9.18% |
| NAV Return2 | 12.77% | 21.86% | 7.81% | 9.05% |
| Russell RAFITM Developed ex US Small Company Index (Net)3 | 12.74% | 22.18% | 8.17% | 9.55% |
| S&P Developed ex-U.S. Small Cap Index (Net)3 | 14.62% | 20.16% | 6.54% | 8.63% |
| ETF Category: Morningstar Foreign Small/Mid Blend4 | 15.28% | 22.16% | 6.16% | 7.92% |
| Fund Expense Ratio5: 0.39% |
All total returns on this page assume dividends and distributions were reinvested. Index figures do not include trading and management costs, which would lower performance. Indices are unmanaged and cannot be invested in directly. Performance results less than one year are not annualized.
The first index listed for the fund is the fund’s primary benchmark, as shown in the prospectus. Additional indices shown are provided for comparative purposes.
For index definitions, please see the Glossary.
Shares are bought and sold at market price, which may be higher or lower than the net asset value (NAV). Brokerage commissions will reduce returns.
International investing may involve risk of capital loss from unfavorable fluctuations in currency values, from differences in generally accepted accounting principles, or from economic or political instability in other nations.
Small-company stocks may be subject to greater volatility than many other asset classes.
Index ownership — Russell® is a trademark owned by Frank Russell Company (Russell). The Russell RAFI™ Index Series are calculated by Russell in conjunction with Research Affiliates® LLC (RA). Neither Russell nor RA sponsor, endorse or promote the Schwab Fundamental International Small Company Index ETF and are not in any way connected to it and do not accept any liability in relation to its issue, operation and trading. Any intellectual property rights in the index values and constituent list vests in Russell. “Research Affiliates®”, “Fundamental Index®” and “RAFI®” trade names are the exclusive property of RA. CSIM has obtained full license from Russell to use such intellectual property rights in the creation of this fund. For full disclaimer please see the fund’s statement of additional information. Effective December 1, 2016, the name of the index was changed by the index provider. No other changes to the index have occurred.
| * | Inception (8/15/13) represents the date that the shares began trading in the secondary market. |
| 1 | Performance does not reflect the deduction of taxes that a shareholder would pay on fund distributions or on the redemption of fund shares. |
| 2 | ETF performance must be shown based on both a market price and NAV basis. The fund’s per share NAV is the value of one share of the fund. NAV is calculated by taking the fund’s total assets (including the market value of securities owned), subtracting liabilities, and dividing by the number of shares outstanding. The NAV Return is based on the NAV of the fund, and the Market Price Return is based on the market price per share of the fund. The price used to calculate market return (Market Price) is determined by using the midpoint between the highest bid and the lowest offer on the primary stock exchange on which the shares of the fund are listed for trading, as of the time that the fund’s NAV is calculated. NAV is used as a proxy for purposes of calculating Market Price Return on inception date. Market Price and NAV returns assume that dividends and capital gain distributions have been reinvested in the fund at Market Price and NAV, respectively. |
| 3 | The net version of the index reflects reinvested dividends net of withholding taxes, but reflects no deductions for expenses or other taxes. |
| 4 | Source for category information: Morningstar, Inc. The Morningstar Category return represents all passively- and actively-managed ETFs within the category as of the report date. |
| 5 | As stated in the prospectus. |
Schwab Fundamental Index ETFs | Semiannual Report
Schwab Fundamental International Small Company Index ETF
Performance and Fund Facts as of August 31, 2017
| Number of Holdings | 1,475 |
| Weighted Average Market Cap (millions) | $3,863 |
| Price/Earnings Ratio (P/E) | 16.2 |
| Price/Book Ratio (P/B) | 1.4 |
| Portfolio Turnover Rate2,3 | 10% |
Sector Weightings % of Investments1
Top Equity Holdings % of Net Assets4
Country Weightings % of Investments5
Portfolio holdings may have changed since the report date.
An index is a statistical composite of a specified financial market or sector. Unlike the fund, an index does not actually hold a portfolio of securities and its return is not inclusive of trading and management costs incurred by the fund.
Source of Sector Classification: S&P and MSCI.
| 1 | Excludes derivatives. |
| 2 | Not annualized. |
| 3 | Portfolio turnover rate excludes securities received or delivered from processing of in-kind creations or redemptions. |
| 4 | This list is not a recommendation of any security by the investment adviser. |
| 5 | The percentage may differ from the Portfolio Holdings because the above calculation is based on a percentage of total investments, excluding derivatives, whereas the calculation in the Portfolio Holdings is based on a percentage of net assets. |
Schwab Fundamental Index ETFs | Semiannual Report
Schwab Fundamental Emerging Markets Large Company Index ETF
The performance data quoted represents past performance. Past performance does not guarantee future results. Investment return and principal value of an investment will fluctuate so that an investor’s shares, when sold or redeemed, may be worth more or less than the original cost. Current performance may be lower or higher than the performance quoted. To obtain performance information current to the most recent month end, please visit www.schwabfunds.com/schwabetfs_prospectus.
Average Annual Total Returns1
| Fund and Inception Date | 6 Months | 1 Year | 3 Years | Since Inception* |
| Fund: Schwab Fundamental Emerging Markets Large Company Index ETF (8/15/13) | | | | |
| Market Price Return2 | 11.15% | 26.91% | 1.70% | 4.90% |
| NAV Return2 | 10.28% | 26.39% | 1.68% | 4.83% |
| Russell RAFITM Emerging Markets Large Company Index (Net)3 | 10.47% | 27.07% | 2.22% | 5.43% |
| MSCI Emerging Markets Index (Net)3 | 18.02% | 24.53% | 2.38% | 5.41% |
| ETF Category: Morningstar Diversified Emerging Markets4 | 16.68% | 21.69% | 1.68% | 4.54% |
| Fund Expense Ratio5: 0.39% |
All total returns on this page assume dividends and distributions were reinvested. Index figures do not include trading and management costs, which would lower performance. Indices are unmanaged and cannot be invested in directly. Performance results less than one year are not annualized.
The first index listed for the fund is the fund’s primary benchmark, as shown in the prospectus. Additional indices shown are provided for comparative purposes.
For index definitions, please see the Glossary.
Shares are bought and sold at market price, which may be higher or lower than the net asset value (NAV). Brokerage commissions will reduce returns.
International investing may involve risk of capital loss from unfavorable fluctuations in currency values, from differences in generally accepted accounting principles, or from economic or political instability in other nations.
Emerging markets involve heightened risks related to the same factors as international investing, as well as increased volatility and lower trading volume.
Index ownership — Russell® is a trademark owned by Frank Russell Company (Russell). The Russell RAFI™ Index Series are calculated by Russell in conjunction with Research Affiliates® LLC (RA). Neither Russell nor RA sponsor, endorse or promote the Schwab Fundamental Emerging Markets Large Company Index ETF and are not in any way connected to it and do not accept any liability in relation to its issue, operation and trading. Any intellectual property rights in the index values and constituent list vests in Russell. “Research Affiliates®”, “Fundamental Index®” and “RAFI®” trade names are the exclusive property of RA. CSIM has obtained full license from Russell to use such intellectual property rights in the creation of this fund. For full disclaimer please see the fund’s statement of additional information. Effective December 1, 2016, the name of the index was changed by the index provider. No other changes to the index have occurred.
| * | Inception (8/15/13) represents the date that the shares began trading in the secondary market. |
| 1 | Performance does not reflect the deduction of taxes that a shareholder would pay on fund distributions or on the redemption of fund shares. |
| 2 | ETF performance must be shown based on both a market price and NAV basis. The fund’s per share NAV is the value of one share of the fund. NAV is calculated by taking the fund’s total assets (including the market value of securities owned), subtracting liabilities, and dividing by the number of shares outstanding. The NAV Return is based on the NAV of the fund, and the Market Price Return is based on the market price per share of the fund. The price used to calculate market return (Market Price) is determined by using the midpoint between the highest bid and the lowest offer on the primary stock exchange on which the shares of the fund are listed for trading, as of the time that the fund’s NAV is calculated. NAV is used as a proxy for purposes of calculating Market Price Return on inception date. Market Price and NAV returns assume that dividends and capital gain distributions have been reinvested in the fund at Market Price and NAV, respectively. |
| 3 | The net version of the index reflects reinvested dividends net of withholding taxes, but reflects no deductions for expenses or other taxes. |
| 4 | Source for category information: Morningstar, Inc. The Morningstar Category return represents all passively- and actively-managed ETFs within the category as of the report date. |
| 5 | As stated in the prospectus. |
Schwab Fundamental Index ETFs | Semiannual Report
Schwab Fundamental Emerging Markets Large Company Index ETF
Performance and Fund Facts as of August 31, 2017
| Number of Holdings | 310 |
| Weighted Average Market Cap (millions) | $69,410 |
| Price/Earnings Ratio (P/E) | 11.9 |
| Price/Book Ratio (P/B) | 1.2 |
| Portfolio Turnover Rate2,3 | 8% |
Sector Weightings % of Investments1
Top Equity Holdings % of Net Assets4
Country Weightings % of Investments5
Portfolio holdings may have changed since the report date.
An index is a statistical composite of a specified financial market or sector. Unlike the fund, an index does not actually hold a portfolio of securities and its return is not inclusive of trading and management costs incurred by the fund.
Source of Sector Classification: S&P and MSCI.
| 1 | Excludes derivatives. |
| 2 | Not annualized. |
| 3 | Portfolio turnover rate excludes securities received or delivered from processing of in-kind creations or redemptions. |
| 4 | This list is not a recommendation of any security by the investment adviser. |
| 5 | The percentage may differ from the Portfolio Holdings because the above calculation is based on a percentage of total investments, excluding derivatives, whereas the calculation in the Portfolio Holdings is based on a percentage of net assets. |
Schwab Fundamental Index ETFs | Semiannual Report
Schwab Fundamental Index ETFs
Fund Expenses (Unaudited)
Examples for a $1,000 Investment
As a fund shareholder, you may incur two types of costs: (1) transaction costs, including brokerage commissions on purchases and sales of fund shares; and, (2) ongoing costs, including management fees.
The expense examples below are intended to help you understand your ongoing cost (in dollars) of investing in a fund and to compare this cost with the ongoing cost of investing in other mutual funds. These examples are based on an investment of $1,000 invested for six months beginning March 1, 2017 and held through August 31, 2017.
Actual Return lines in the table below provide information about actual account values and actual expenses. You may use this information, together with the amount you invested, to estimate the expenses that you paid over the period. To do so, simply divide your account value by $1,000 (for example, an $8,600 account value ÷ $1,000 = 8.6), then multiply the result by the number given for your fund under the heading entitled “Expenses Paid During Period.”
Hypothetical Return lines in the table below provide information about hypothetical account values and hypothetical expenses based on a fund’s actual expense ratio and an assumed return of 5% per year before expenses. Because the return used is not an actual return, it may not be used to estimate the actual ending account value or expenses you paid for the period.
You may use this information to compare the ongoing costs of investing in a fund and other funds. To do so, compare this 5% hypothetical example with the 5% hypothetical examples that appear in the shareholder reports of the other funds.
Please note that the expenses shown in the table are meant to highlight your ongoing costs only, and do not reflect any transactional costs, including any brokerage commissions you may pay when purchasing or selling shares of a fund. Therefore, the hypothetical return lines of the table are useful in comparing ongoing costs only, and will not help you determine the relative total costs of owning different funds. In addition, if these transactional costs were included, your costs would have been higher.
| | Expense Ratio
(Annualized)1 | Beginning
Account Value
at 3/1/17 | Ending
Account Value
(Net of Expenses)
at 8/31/17 | Expenses Paid
During Period
3/1/17-8/31/172 |
| Schwab Fundamental U.S. Broad Market Index ETF | | | | |
| Actual Return | 0.25% | $1,000.00 | $1,016.70 | $1.27 |
| Hypothetical 5% Return | 0.25% | $1,000.00 | $1,023.94 | $1.28 |
| Schwab Fundamental U.S. Large Company Index ETF | | | | |
| Actual Return | 0.25% | $1,000.00 | $1,019.00 | $1.27 |
| Hypothetical 5% Return | 0.25% | $1,000.00 | $1,023.94 | $1.28 |
| Schwab Fundamental U.S. Small Company Index ETF | | | | |
| Actual Return | 0.25% | $1,000.00 | $ 992.90 | $1.26 |
| Hypothetical 5% Return | 0.25% | $1,000.00 | $1,023.94 | $1.28 |
| Schwab Fundamental International Large Company Index ETF | | | | |
| Actual Return | 0.25% | $1,000.00 | $1,110.00 | $1.33 |
| Hypothetical 5% Return | 0.25% | $1,000.00 | $1,023.94 | $1.28 |
| Schwab Fundamental International Small Company Index ETF | | | | |
| Actual Return | 0.39% | $1,000.00 | $1,127.70 | $2.09 |
| Hypothetical 5% Return | 0.39% | $1,000.00 | $1,023.23 | $1.99 |
| Schwab Fundamental Emerging Markets Large Company Index ETF | | | | |
| Actual Return | 0.39% | $1,000.00 | $1,102.80 | $2.07 |
| Hypothetical 5% Return | 0.39% | $1,000.00 | $1,023.23 | $1.99 |
| 1 | Based on the most recent six-month expense ratio; may differ from the expense ratio provided in the Financial Highlights. |
| 2 | Expenses for each fund or share class are equal to its annualized expense ratio, multiplied by the average account value over the period, multiplied by 184 days of the period, and divided by 365 days of the fiscal year. |
Schwab Fundamental Index ETFs | Semiannual Report
Schwab Fundamental U.S. Broad Market Index ETF
Financial Statements
Financial Highlights
| | 3/1/17–
8/31/17* | 3/1/16–
2/28/17 | 3/1/15–
2/29/16 | 3/1/14–
2/28/15 | 8/14/13 1–
2/28/14 | |
| Per-Share Data |
| Net asset value at beginning of period | $33.82 | $27.37 | $30.54 | $27.36 | $25.00 | |
| Income (loss) from investment operations: | | | | | | |
| Net investment income (loss) | 0.40 2 | 0.67 2 | 0.65 2 | 0.54 | 0.21 | |
| Net realized and unrealized gains (losses) | 0.16 | 6.45 | (3.18) | 3.14 | 2.28 | |
| Total from investment operations | 0.56 | 7.12 | (2.53) | 3.68 | 2.49 | |
| Less distributions: | | | | | | |
| Distributions from net investment income | (0.32) | (0.67) | (0.64) | (0.50) | (0.13) | |
| Net asset value at end of period | $34.06 | $33.82 | $27.37 | $30.54 | $27.36 | |
| Total return | 1.67% 3 | 26.32% | (8.34%) | 13.54% | 9.99% 3 | |
| Ratios/Supplemental Data |
| Ratios to average net assets: | | | | | | |
| Total expenses | 0.25% 4 | 0.32% | 0.32% | 0.32% | 0.32% 4 | |
| Net investment income (loss) | 2.33% 4 | 2.17% | 2.23% | 2.14% | 2.11% 4 | |
| Portfolio turnover rate5 | 5% 3 | 10% | 12% | 10% | 5% 3 | |
| Net assets, end of period (x 1,000) | $267,385 | $263,785 | $166,985 | $212,247 | $58,823 | |
| |
1
Commencement of operations.
2
Calculated based on the average shares outstanding during the period.
3
Not annualized.
4
Annualized.
5
Portfolio turnover rate excludes securities received or delivered from processing of in-kind creations or redemptions.
Schwab Fundamental Index ETFs | Semiannual Report
Schwab Fundamental U.S. Broad Market Index ETF
Condensed Portfolio Holdings as of August 31, 2017 (Unaudited)
This section shows the fund's 50 largest portfolio holdings in unaffiliated issuers, any holdings exceeding 1% of the fund's net assets as of the report date, and any affiliated issuers. The remaining securities held by the fund are grouped as "Other Securities" in each category. You can request a complete schedule of portfolio holdings as of the report date, free of charge, by calling Schwab ETFs™ at 1-877-824-5615. This complete schedule, filed on the fund's Form N-CSR(S), is also available on the SEC's website at www.sec.gov.
In addition, the fund files its complete schedule of portfolio holdings with the SEC for the first and third quarters of each fiscal year on Form N-Q. The fund's Form N-Q is available on the SEC's website and may be viewed and copied at the SEC's Public Reference Room in Washington, D.C. Call 1-800-SEC-0330 for information on the operation of the Public Reference Room. The fund also makes available its complete schedule of portfolio holdings on a daily basis on the fund's website at www.schwabfunds.com/schwabetfs_prospectus.
| Security | Number
of Shares | % of Net
Assets | Value ($) |
| Common Stock 99.5% of net assets | |
| |
| Automobiles & Components 1.4% | |
| General Motors Co. | 34,235 | 0.5 | 1,250,947 |
| Other Securities | | 0.9 | 2,584,905 |
| | | 1.4 | 3,835,852 |
| |
| Banks 5.0% | |
| Bank of America Corp. | 61,555 | 0.5 | 1,470,549 |
| Citigroup, Inc. | 30,675 | 0.8 | 2,086,820 |
| JPMorgan Chase & Co. | 34,472 | 1.2 | 3,133,160 |
| Wells Fargo & Co. | 46,819 | 0.9 | 2,391,046 |
| Other Securities | | 1.6 | 4,392,487 |
| | | 5.0 | 13,474,062 |
| |
| Capital Goods 8.6% | |
| 3M Co. | 6,149 | 0.5 | 1,256,364 |
| Caterpillar, Inc. | 10,223 | 0.4 | 1,201,100 |
| General Electric Co. | 96,647 | 0.9 | 2,372,684 |
| The Boeing Co. | 5,903 | 0.5 | 1,414,713 |
| United Technologies Corp. | 11,913 | 0.5 | 1,426,224 |
| Other Securities | | 5.8 | 15,433,958 |
| | | 8.6 | 23,105,043 |
| |
| Commercial & Professional Services 1.0% | |
| Other Securities | | 1.0 | 2,589,605 |
| |
| Consumer Durables & Apparel 1.3% | |
| Other Securities | | 1.3 | 3,577,622 |
| |
| Consumer Services 2.2% | |
| McDonald's Corp. | 11,108 | 0.7 | 1,776,947 |
| Other Securities | | 1.5 | 4,033,494 |
| | | 2.2 | 5,810,441 |
| |
| Diversified Financials 4.7% | |
| Berkshire Hathaway, Inc., Class B * | 15,230 | 1.0 | 2,759,067 |
| The Charles Schwab Corp. (a) | 3,526 | 0.1 | 140,687 |
| The Goldman Sachs Group, Inc. | 5,734 | 0.5 | 1,282,925 |
| Other Securities | | 3.1 | 8,430,902 |
| | | 4.7 | 12,613,581 |
| |
| Energy 11.7% | |
| Chevron Corp. | 54,950 | 2.2 | 5,913,719 |
| ConocoPhillips | 49,392 | 0.8 | 2,156,455 |
| Security | Number
of Shares | % of Net
Assets | Value ($) |
| Exxon Mobil Corp. | 115,992 | 3.3 | 8,853,669 |
| Marathon Petroleum Corp. | 20,312 | 0.4 | 1,065,364 |
| Phillips 66 | 18,243 | 0.6 | 1,528,946 |
| Schlumberger Ltd. | 17,783 | 0.4 | 1,129,398 |
| Valero Energy Corp. | 22,100 | 0.6 | 1,505,010 |
| Other Securities | | 3.4 | 9,049,126 |
| | | 11.7 | 31,201,687 |
| |
| Food & Staples Retailing 3.4% | |
| Costco Wholesale Corp. | 6,692 | 0.4 | 1,048,904 |
| CVS Health Corp. | 26,412 | 0.8 | 2,042,704 |
| Wal-Mart Stores, Inc. | 46,095 | 1.3 | 3,598,637 |
| Other Securities | | 0.9 | 2,349,260 |
| | | 3.4 | 9,039,505 |
| |
| Food, Beverage & Tobacco 4.4% | |
| PepsiCo, Inc. | 15,652 | 0.7 | 1,811,406 |
| Philip Morris International, Inc. | 18,333 | 0.8 | 2,143,678 |
| The Coca-Cola Co. | 39,497 | 0.7 | 1,799,088 |
| Other Securities | | 2.2 | 6,031,939 |
| | | 4.4 | 11,786,111 |
| |
| Health Care Equipment & Services 5.5% | |
| Anthem, Inc. | 7,700 | 0.6 | 1,509,508 |
| Express Scripts Holding Co. * | 16,777 | 0.4 | 1,053,931 |
| UnitedHealth Group, Inc. | 11,403 | 0.8 | 2,268,057 |
| Other Securities | | 3.7 | 9,964,652 |
| | | 5.5 | 14,796,148 |
| |
| Household & Personal Products 1.8% | |
| The Procter & Gamble Co. | 33,715 | 1.2 | 3,110,883 |
| Other Securities | | 0.6 | 1,704,567 |
| | | 1.8 | 4,815,450 |
| |
| Insurance 3.7% | |
| American International Group, Inc. | 24,466 | 0.6 | 1,479,704 |
| Other Securities | | 3.1 | 8,478,775 |
| | | 3.7 | 9,958,479 |
| |
| Materials 4.2% | |
| Other Securities | | 4.2 | 11,338,915 |
| |
| Media 3.0% | |
| Comcast Corp., Class A | 44,750 | 0.7 | 1,817,297 |
| The Walt Disney Co. | 15,655 | 0.6 | 1,584,286 |
Schwab Fundamental Index ETFs | Semiannual Report
Schwab Fundamental U.S. Broad Market Index ETF
Condensed Portfolio Holdings as of August 31, 2017 (Unaudited) (continued)
| Security | Number
of Shares | % of Net
Assets | Value ($) |
| Time Warner, Inc. | 13,673 | 0.5 | 1,382,340 |
| Other Securities | | 1.2 | 3,117,042 |
| | | 3.0 | 7,900,965 |
| |
| Pharmaceuticals, Biotechnology & Life Sciences 5.7% | |
| Amgen, Inc. | 6,249 | 0.4 | 1,110,885 |
| Johnson & Johnson | 22,411 | 1.1 | 2,966,544 |
| Merck & Co., Inc. | 34,070 | 0.8 | 2,175,710 |
| Pfizer, Inc. | 100,247 | 1.3 | 3,400,378 |
| Other Securities | | 2.1 | 5,679,837 |
| | | 5.7 | 15,333,354 |
| |
| Real Estate 2.1% | |
| Other Securities | | 2.1 | 5,519,925 |
| |
| Retailing 4.4% | |
| Lowe's Cos., Inc. | 14,947 | 0.4 | 1,104,434 |
| The Home Depot, Inc. | 12,858 | 0.7 | 1,927,028 |
| Other Securities | | 3.3 | 8,792,136 |
| | | 4.4 | 11,823,598 |
| |
| Semiconductors & Semiconductor Equipment 2.9% | |
| Intel Corp. | 83,849 | 1.1 | 2,940,584 |
| Other Securities | | 1.8 | 4,715,450 |
| | | 2.9 | 7,656,034 |
| |
| Software & Services 7.2% | |
| International Business Machines Corp. | 19,940 | 1.1 | 2,852,018 |
| Microsoft Corp. | 62,087 | 1.7 | 4,642,245 |
| Oracle Corp. | 36,643 | 0.7 | 1,844,242 |
| Other Securities | | 3.7 | 9,854,722 |
| | | 7.2 | 19,193,227 |
| |
| Technology Hardware & Equipment 6.0% | |
| Apple, Inc. | 47,356 | 2.9 | 7,766,384 |
| Cisco Systems, Inc. | 58,073 | 0.7 | 1,870,531 |
| Other Securities | | 2.4 | 6,288,530 |
| | | 6.0 | 15,925,445 |
| |
| Telecommunication Services 3.0% | |
| AT&T, Inc. | 110,586 | 1.5 | 4,142,551 |
| Verizon Communications, Inc. | 58,699 | 1.1 | 2,815,791 |
| Other Securities | | 0.4 | 1,013,094 |
| | | 3.0 | 7,971,436 |
| |
| Security | Number
of Shares | % of Net
Assets | Value ($) |
| Transportation 2.2% | |
| Union Pacific Corp. | 10,062 | 0.4 | 1,059,529 |
| Other Securities | | 1.8 | 4,835,506 |
| | | 2.2 | 5,895,035 |
| |
| Utilities 4.1% | |
| Other Securities | | 4.1 | 10,947,916 |
| Total Common Stock |
| (Cost $235,599,208) | | | 266,109,436 |
|
| Other Investment Companies 0.8% of net assets | |
| |
| Money Market Fund 0.2% | |
| Other Securities | | 0.2 | 526,652 |
| |
| Securities Lending Collateral 0.6% | |
| Wells Fargo Government Money Market Fund, Select Class 0.92% (c) | | 0.6 | 1,646,898 |
| Total Other Investment Companies |
| (Cost $2,173,550) | | | 2,173,550 |
| | Number of
Contracts | Notional
Amount
($) | Current Value/
Unrealized
Appreciation
($) |
| Futures Contracts | |
| Long | |
| S&P 500 Index, e-mini, expires 09/15/17 | 10 | 1,235,050 | 7,219 |
For the following notes, please refer to the complete schedule of portfolio holdings.
| * | Non-income producing security. |
| (a) | Issuer is affiliated with the fund's investment adviser. |
| (b) | All or a portion of this security is on loan. Securities on loan were valued at $1,592,372. |
| (c) | The rate shown is the 7-day yield. |
| | |
| REIT — | Real Estate Investment Trust |
The fund may engage in certain transactions involving affiliates. For instance, the fund may own shares of The Charles Schwab Corporation (CSC) if that company is included in its index. Below is the summary of investment activities involving CSC shares owned by the fund during the report period:
| | Balance
of Shares
Held at
2/28/17 | Gross
Purchases | Gross
Sales | Balance
of Shares
Held at
8/31/17 | Net change
in unrealized
appreciation
(depreciation) | Realized
Gains(Losses)
3/1/17
to 8/31/17 | Dividends
Received
3/1/17
to 8/31/17 |
| The Charles Schwab Corp. | 3,460 | 154 | (88) | 3,526 | ($3,435) | $1,440 | $566 |
Schwab Fundamental Index ETFs | Semiannual Report
Schwab Fundamental U.S. Broad Market Index ETF
Condensed Portfolio Holdings as of August 31, 2017 (Unaudited) (continued)
The following is a summary of the inputs used to value the fund’s investments as of August 31, 2017 (see financial note 2(a) for additional information):
| Description | Quoted Prices in
Active Markets for
Identical Assets
(Level 1) | Other Significant
Observable Inputs
(Level 2) | Significant
Unobservable Inputs
(Level 3) | Total | |
| Assets | | | | | |
| Common Stock1 | $266,109,436 | $— | $— | $266,109,436 | |
| Other Investment Companies1 | 2,173,550 | — | — | 2,173,550 | |
| Futures Contracts2 | 7,219 | — | — | 7,219 | |
| Total | $268,290,205 | $— | $— | $268,290,205 | |
| 1 | As categorized in the complete schedule of Portfolio Holdings. |
| 2 | Futures contracts are valued at unrealized appreciation or depreciation. |
The fund's policy is to recognize transfers between Level 1, Level 2 and Level 3 as of the beginning of the fiscal year. There were no transfers between Level 1, Level 2 and Level 3 for the period ended August 31, 2017.
Schwab Fundamental Index ETFs | Semiannual Report
Schwab Fundamental U.S. Broad Market Index ETF
Statement of Assets and Liabilities
As of August 31, 2017; unaudited
| Assets |
| Investments in affiliated issuers, at value (cost $101,692) | | $140,687 |
| Investments in unaffiliated issuers, at value (cost $236,024,168) including securities on loan of $1,592,372 | | 266,495,401 |
| Collateral invested for securities on loan, at value (cost $1,646,898) | | 1,646,898 |
| Deposit with broker for futures contracts | | 37,800 |
| Receivables: | | |
| Dividends | | 758,021 |
| Variation margin on futures contracts | | 6,476 |
| Income from securities on loan | + | 3,066 |
| Total assets | | 269,088,349 |
| Liabilities |
| Collateral held for securities on loan | | 1,646,898 |
| Payables: | | |
| Investment adviser fees | + | 56,521 |
| Total liabilities | | 1,703,419 |
| Net Assets |
| Total assets | | 269,088,349 |
| Total liabilities | – | 1,703,419 |
| Net assets | | $267,384,930 |
| Net Assets by Source | | |
| Capital received from investors | | 235,247,524 |
| Net investment income not yet distributed | | 1,369,637 |
| Net realized capital gains | | 250,322 |
| Net unrealized capital appreciation | | 30,517,447 |
| Net Asset Value (NAV) |
| Net Assets | ÷ | Shares
Outstanding | = | NAV |
| $267,384,930 | | 7,850,000 | | $34.06 |
| | | | | |
Schwab Fundamental Index ETFs | Semiannual Report
Schwab Fundamental U.S. Broad Market Index ETF
Statement of Operations
For the period March 1, 2017 through August 31, 2017; unaudited
| Investment Income |
| Dividends received from affiliated issuer | | $566 |
| Dividends received from unaffiliated issuers (net of foreign withholding tax of $420) | | 3,440,497 |
| Securities on loan, net | + | 16,217 |
| Total investment income | | 3,457,280 |
| Expenses |
| Investment adviser fees | | 335,155 |
| Total expenses | – | 335,155 |
| Net investment income | | 3,122,125 |
| Realized and Unrealized Gains (Losses) |
| Net realized gains on affiliated issuer | | 1,440 |
| Net realized losses on unaffiliated investments | | (274,715) |
| Net realized gains on in-kind redemptions on unaffiliated investments | | 3,248,150 |
| Net realized gains on futures contracts | + | 46,513 |
| Net realized gains | | 3,021,388 |
| Net change in unrealized appreciation (depreciation) on affiliated issuer | | (3,435) |
| Net change in unrealized appreciation (depreciation) on unaffiliated investments | | (1,682,506) |
| Net change in unrealized appreciation (depreciation) on futures contracts | + | 1,265 |
| Net change in unrealized appreciation (depreciation) | + | (1,684,676) |
| Net realized and unrealized gains | | 1,336,712 |
| Increase in net assets resulting from operations | | $4,458,837 |
Schwab Fundamental Index ETFs | Semiannual Report
Schwab Fundamental U.S. Broad Market Index ETF
Statement of Changes in Net Assets
For the current and prior report periods
Figures for the current period are unaudited
| Operations | |
| | 3/1/17-8/31/17 | 3/1/16-2/28/17 |
| Net investment income | | $3,122,125 | $4,494,021 |
| Net realized gains (losses) | | 3,021,388 | (1,845,642) |
| Net change in unrealized appreciation (depreciation) | + | (1,684,676) | 45,114,560 |
| Increase in net assets resulting from operations | | 4,458,837 | 47,762,939 |
| Distributions to Shareholders | |
| Distributions from net investment income | | ($2,520,160) | ($4,414,601) |
| Transactions in Fund Shares | | | |
| | | 3/1/17-8/31/17 | 3/1/16-2/28/17 |
| | | SHARES | VALUE | SHARES | VALUE |
| Shares sold | | 350,000 | $11,763,644 | 1,700,000 | $53,451,725 |
| Shares redeemed | + | (300,001) | (10,101,985) | — | — |
| Net transactions in fund shares | | 49,999 | $1,661,659 | 1,700,000 | $53,451,725 |
| Shares Outstanding and Net Assets | | | |
| | | 3/1/17-8/31/17 | 3/1/16-2/28/17 |
| | | SHARES | NET ASSETS | SHARES | NET ASSETS |
| Beginning of period | | 7,800,001 | $263,784,594 | 6,100,001 | $166,984,531 |
| Total increase | + | 49,999 | 3,600,336 | 1,700,000 | 96,800,063 |
| End of period | | 7,850,000 | $267,384,930 | 7,800,001 | $263,784,594 |
| Net investment income not yet distributed | | | $1,369,637 | | $767,672 |
Schwab Fundamental Index ETFs | Semiannual Report
Schwab Fundamental U.S. Large Company Index ETF
Financial Statements
Financial Highlights
| | 3/1/17–
8/31/17* | 3/1/16–
2/28/17 | 3/1/15–
2/29/16 | 3/1/14–
2/28/15 | 8/14/13 1–
2/28/14 | |
| Per-Share Data |
| Net asset value at beginning of period | $33.91 | $27.57 | $30.55 | $27.27 | $25.00 | |
| Income (loss) from investment operations: | | | | | | |
| Net investment income (loss) | 0.41 2 | 0.70 2 | 0.69 2 | 0.52 | 0.21 | |
| Net realized and unrealized gains (losses) | 0.23 | 6.29 | (3.10) | 3.25 | 2.18 | |
| Total from investment operations | 0.64 | 6.99 | (2.41) | 3.77 | 2.39 | |
| Less distributions: | | | | | | |
| Distributions from net investment income | (0.31) | (0.65) | (0.57) | (0.49) | (0.12) | |
| Net asset value at end of period | $34.24 | $33.91 | $27.57 | $30.55 | $27.27 | |
| Total return | 1.90% 3 | 25.66% | (7.92%) | 13.92% | 9.59% 3 | |
| Ratios/Supplemental Data |
| Ratios to average net assets: | | | | | | |
| Total expenses | 0.25% 4 | 0.32% | 0.32% | 0.32% | 0.32% 4 | |
| Net investment income (loss) | 2.42% 4 | 2.26% | 2.39% | 2.24% | 2.20% 4 | |
| Portfolio turnover rate5 | 5% 3 | 10% | 11% | 10% | 6% 3 | |
| Net assets, end of period (x 1,000) | $3,018,195 | $2,197,623 | $893,389 | $336,043 | $72,259 | |
| |
1
Commencement of operations.
2
Calculated based on the average shares outstanding during the period.
3
Not annualized.
4
Annualized.
5
Portfolio turnover rate excludes securities received or delivered from processing of in-kind creations or redemptions.
Schwab Fundamental Index ETFs | Semiannual Report
Schwab Fundamental U.S. Large Company Index ETF
Condensed Portfolio Holdings as of August 31, 2017 (Unaudited)
This section shows the fund's 50 largest portfolio holdings in unaffiliated issuers, any holdings exceeding 1% of the fund's net assets as of the report date, and any affiliated issuers. The remaining securities held by the fund are grouped as "Other Securities" in each category. You can request a complete schedule of portfolio holdings as of the report date, free of charge, by calling Schwab ETFs™ at 1-877-824-5615. This complete schedule, filed on the fund's Form N-CSR(S), is also available on the SEC's website at www.sec.gov.
In addition, the fund files its complete schedule of portfolio holdings with the SEC for the first and third quarters of each fiscal year on Form N-Q. The fund's Form N-Q is available on the SEC's website and may be viewed and copied at the SEC's Public Reference Room in Washington, D.C. Call 1-800-SEC-0330 for information on the operation of the Public Reference Room. The fund also makes available its complete schedule of portfolio holdings on a daily basis on the fund's website at www.schwabfunds.com/schwabetfs_prospectus.
| Security | Number
of Shares | % of Net
Assets | Value ($) |
| Common Stock 99.7% of net assets | |
| |
| Automobiles & Components 1.5% | |
| General Motors Co. | 422,688 | 0.5 | 15,445,020 |
| Other Securities | | 1.0 | 29,619,190 |
| | | 1.5 | 45,064,210 |
| |
| Banks 5.0% | |
| Bank of America Corp. | 773,323 | 0.6 | 18,474,687 |
| Citigroup, Inc. | 380,595 | 0.9 | 25,891,878 |
| JPMorgan Chase & Co. | 425,633 | 1.3 | 38,685,783 |
| Wells Fargo & Co. | 575,195 | 1.0 | 29,375,209 |
| Other Securities | | 1.2 | 39,257,786 |
| | | 5.0 | 151,685,343 |
| |
| Capital Goods 8.4% | |
| 3M Co. | 74,613 | 0.5 | 15,244,928 |
| Caterpillar, Inc. | 127,242 | 0.5 | 14,949,663 |
| General Electric Co. | 1,198,752 | 1.0 | 29,429,362 |
| The Boeing Co. | 71,943 | 0.6 | 17,241,859 |
| United Technologies Corp. | 145,045 | 0.6 | 17,364,787 |
| Other Securities | | 5.2 | 158,197,468 |
| | | 8.4 | 252,428,067 |
| |
| Commercial & Professional Services 0.6% | |
| Other Securities | | 0.6 | 17,760,740 |
| |
| Consumer Durables & Apparel 1.2% | |
| Other Securities | | 1.2 | 36,466,138 |
| |
| Consumer Services 1.9% | |
| McDonald's Corp. | 135,480 | 0.7 | 21,672,736 |
| Other Securities | | 1.2 | 36,110,534 |
| | | 1.9 | 57,783,270 |
| |
| Diversified Financials 4.8% | |
| Berkshire Hathaway, Inc., Class B * | 188,230 | 1.1 | 34,099,747 |
| The Charles Schwab Corp. (a) | 39,188 | 0.1 | 1,563,601 |
| The Goldman Sachs Group, Inc. | 70,774 | 0.5 | 15,834,975 |
| Other Securities | | 3.1 | 92,036,618 |
| | | 4.8 | 143,534,941 |
| |
| Energy 12.3% | |
| Chevron Corp. | 678,362 | 2.4 | 73,005,318 |
| ConocoPhillips | 606,301 | 0.9 | 26,471,102 |
| Security | Number
of Shares | % of Net
Assets | Value ($) |
| Exxon Mobil Corp. | 1,429,908 | 3.6 | 109,144,878 |
| Marathon Petroleum Corp. | 247,457 | 0.4 | 12,979,120 |
| Phillips 66 | 225,298 | 0.6 | 18,882,225 |
| Schlumberger Ltd. | 219,094 | 0.5 | 13,914,660 |
| Valero Energy Corp. | 270,179 | 0.6 | 18,399,190 |
| Other Securities | | 3.3 | 99,517,538 |
| | | 12.3 | 372,314,031 |
| |
| Food & Staples Retailing 3.6% | |
| Costco Wholesale Corp. | 82,128 | 0.4 | 12,872,743 |
| CVS Health Corp. | 326,947 | 0.8 | 25,286,081 |
| Wal-Mart Stores, Inc. | 570,659 | 1.5 | 44,551,348 |
| Other Securities | | 0.9 | 26,738,531 |
| | | 3.6 | 109,448,703 |
| |
| Food, Beverage & Tobacco 4.6% | |
| PepsiCo, Inc. | 193,814 | 0.7 | 22,430,094 |
| Philip Morris International, Inc. | 223,728 | 0.9 | 26,160,515 |
| The Coca-Cola Co. | 488,740 | 0.7 | 22,262,107 |
| Other Securities | | 2.3 | 67,771,021 |
| | | 4.6 | 138,623,737 |
| |
| Health Care Equipment & Services 5.6% | |
| Anthem, Inc. | 93,514 | 0.6 | 18,332,485 |
| Express Scripts Holding Co. * | 206,018 | 0.4 | 12,942,051 |
| UnitedHealth Group, Inc. | 139,966 | 0.9 | 27,839,237 |
| Other Securities | | 3.7 | 110,487,201 |
| | | 5.6 | 169,600,974 |
| |
| Household & Personal Products 1.9% | |
| The Procter & Gamble Co. | 414,353 | 1.3 | 38,232,351 |
| Other Securities | | 0.6 | 19,087,165 |
| | | 1.9 | 57,319,516 |
| |
| Insurance 3.8% | |
| American International Group, Inc. | 302,470 | 0.6 | 18,293,386 |
| Other Securities | | 3.2 | 96,255,634 |
| | | 3.8 | 114,549,020 |
| |
| Materials 4.0% | |
| Other Securities | | 4.0 | 122,221,308 |
| |
| Media 3.0% | |
| Comcast Corp., Class A | 556,650 | 0.7 | 22,605,557 |
| The Walt Disney Co. | 195,422 | 0.7 | 19,776,706 |
Schwab Fundamental Index ETFs | Semiannual Report
Schwab Fundamental U.S. Large Company Index ETF
Condensed Portfolio Holdings as of August 31, 2017 (Unaudited) (continued)
| Security | Number
of Shares | % of Net
Assets | Value ($) |
| Time Warner, Inc. | 166,607 | 0.6 | 16,843,968 |
| Other Securities | | 1.0 | 32,123,910 |
| | | 3.0 | 91,350,141 |
| |
| Pharmaceuticals, Biotechnology & Life Sciences 6.0% | |
| Amgen, Inc. | 77,660 | 0.5 | 13,805,618 |
| Johnson & Johnson | 277,186 | 1.2 | 36,691,111 |
| Merck & Co., Inc. | 419,768 | 0.9 | 26,806,385 |
| Pfizer, Inc. | 1,234,277 | 1.4 | 41,866,676 |
| Other Securities | | 2.0 | 61,085,465 |
| | | 6.0 | 180,255,255 |
| |
| Real Estate 1.3% | |
| Other Securities | | 1.3 | 39,697,138 |
| |
| Retailing 4.4% | |
| Lowe's Cos., Inc. | 181,150 | 0.4 | 13,385,174 |
| The Home Depot, Inc. | 157,730 | 0.8 | 23,638,995 |
| Other Securities | | 3.2 | 96,038,139 |
| | | 4.4 | 133,062,308 |
| |
| Semiconductors & Semiconductor Equipment 2.9% | |
| Intel Corp. | 1,034,522 | 1.2 | 36,280,687 |
| Other Securities | | 1.7 | 52,128,717 |
| | | 2.9 | 88,409,404 |
| |
| Software & Services 7.3% | |
| International Business Machines Corp. | 244,801 | 1.2 | 35,013,887 |
| Microsoft Corp. | 761,965 | 1.9 | 56,972,123 |
| Oracle Corp. | 454,149 | 0.8 | 22,857,319 |
| Other Securities | | 3.4 | 104,070,726 |
| | | 7.3 | 218,914,055 |
| |
| Technology Hardware & Equipment 6.0% | |
| Apple, Inc. | 583,903 | 3.2 | 95,760,092 |
| Cisco Systems, Inc. | 714,369 | 0.8 | 23,009,825 |
| Other Securities | | 2.0 | 63,905,641 |
| | | 6.0 | 182,675,558 |
| |
| Telecommunication Services 3.2% | |
| AT&T, Inc. | 1,360,526 | 1.7 | 50,965,304 |
| Verizon Communications, Inc. | 718,401 | 1.1 | 34,461,696 |
| Other Securities | | 0.4 | 10,930,374 |
| | | 3.2 | 96,357,374 |
| |
| Security | Number
of Shares | % of Net
Assets | Value ($) |
| Transportation 2.2% | |
| Union Pacific Corp. | 122,586 | 0.4 | 12,908,306 |
| Other Securities | | 1.8 | 52,374,664 |
| | | 2.2 | 65,282,970 |
| |
| Utilities 4.2% | |
| Other Securities | | 4.2 | 125,520,762 |
| Total Common Stock |
| (Cost $2,769,717,336) | | | 3,010,324,963 |
|
| Other Investment Companies 0.8% of net assets | |
| |
| Money Market Fund 0.2% | |
| Other Securities | | 0.2 | 6,604,197 |
| |
| Securities Lending Collateral 0.6% | |
| Wells Fargo Government Money Market Fund, Select Class 0.92% (c) | | 0.6 | 17,801,055 |
| Total Other Investment Companies |
| (Cost $24,405,252) | | | 24,405,252 |
| | Number of
Contracts | Notional
Amount
($) | Current Value/
Unrealized
Appreciation
($) |
| Futures Contracts | |
| Long | |
| S&P 500 Index, e-mini, expires 09/15/17 | 62 | 7,657,310 | 82,252 |
For the following notes, please refer to the complete schedule of portfolio holdings.
| * | Non-income producing security. |
| (a) | Issuer is affiliated with the fund's adviser. |
| (b) | All or a portion of this security is on loan. Securities on loan were valued at $17,201,227. |
| (c) | The rate shown is the 7-day yield. |
The fund may engage in certain transactions involving affiliates. For instance, the fund may own shares of The Charles Schwab Corporation (CSC) if that company is included in its index. Below is the summary of investment activities involving CSC shares owned by the fund during the report period:
| | Balance
of Shares
Held at
2/28/17 | Gross
Purchases | Gross
Sales | Balance
of Shares
Held at
8/31/17 | Net change
in unrealized
appreciation
(depreciation) | Realized
Gains(Losses)
3/1/17
to 8/31/17 | Dividends
Received
3/1/17
to 8/31/17 |
| The Charles Schwab Corp. | 31,379 | 11,024 | (3,215) | 39,188 | ($19,007) | ($2,065) | $5,956 |
Schwab Fundamental Index ETFs | Semiannual Report
Schwab Fundamental U.S. Large Company Index ETF
Condensed Portfolio Holdings as of August 31, 2017 (Unaudited) (continued)
The following is a summary of the inputs used to value the fund’s investments as of August 31, 2017 (see financial note 2(a) for additional information):
| Description | Quoted Prices in
Active Markets for
Identical Assets
(Level 1) | Other Significant
Observable Inputs
(Level 2) | Significant
Unobservable Inputs
(Level 3) | Total | |
| Assets | | | | | |
| Common Stock1 | $3,010,324,963 | $— | $— | $3,010,324,963 | |
| Other Investment Companies1 | 24,405,252 | — | — | 24,405,252 | |
| Futures Contracts2 | 82,252 | — | — | 82,252 | |
| Total | $3,034,812,467 | $— | $— | $3,034,812,467 | |
| 1 | As categorized in the complete schedule of Portfolio Holdings. |
| 2 | Futures contracts are valued at unrealized appreciation or depreciation. |
The fund's policy is to recognize transfers between Level 1, Level 2 and Level 3 as of the beginning of the fiscal year. There were no transfers between Level 1, Level 2 and Level 3 for the period ended August 31, 2017.
Schwab Fundamental Index ETFs | Semiannual Report
Schwab Fundamental U.S. Large Company Index ETF
Statement of Assets and Liabilities
As of August 31, 2017; unaudited
| Assets |
| Investments in affiliated issuers, at value (cost $1,295,834) | | $1,563,601 |
| Investments in unaffiliated issuers, at value (cost $2,775,025,699) including securities on loan of $17,201,227 | | 3,015,365,559 |
| Collateral invested for securities on loan, at value (cost $17,801,055) | | 17,801,055 |
| Deposit with broker for futures contracts | | 474,600 |
| Receivables: | | |
| Fund shares sold | | 18,757,537 |
| Dividends | | 8,857,274 |
| Variation margin on futures contracts | | 40,958 |
| Income from securities on loan | + | 29,402 |
| Total assets | | 3,062,889,986 |
| Liabilities |
| Collateral held for securities on loan | | 17,801,055 |
| Payables: | | |
| Investments bought | | 26,270,149 |
| Investment adviser fees | + | 624,059 |
| Total liabilities | | 44,695,263 |
| Net Assets |
| Total assets | | 3,062,889,986 |
| Total liabilities | – | 44,695,263 |
| Net assets | | $3,018,194,723 |
| Net Assets by Source | | |
| Capital received from investors | | 2,778,867,353 |
| Net investment income not yet distributed | | 15,088,156 |
| Net realized capital losses | | (16,450,665) |
| Net unrealized capital appreciation | | 240,689,879 |
| Net Asset Value (NAV) |
| Net Assets | ÷ | Shares
Outstanding | = | NAV |
| $3,018,194,723 | | 88,150,000 | | $34.24 |
| | | | | |
Schwab Fundamental Index ETFs | Semiannual Report
Schwab Fundamental U.S. Large Company Index ETF
Statement of Operations
For the period March 1, 2017 through August 31, 2017; unaudited
| Investment Income |
| Dividends received from affiliated issuer | | $5,956 |
| Dividends received from unaffiliated issuers (net of foreign withholding tax of $2,879) | | 34,972,067 |
| Securities on loan, net | + | 169,091 |
| Total investment income | | 35,147,114 |
| Expenses |
| Investment adviser fees | | 3,291,374 |
| Total expenses | – | 3,291,374 |
| Net investment income | | 31,855,740 |
| Realized and Unrealized Gains (Losses) |
| Net realized losses on affiliated issuer | | (2,065) |
| Net realized losses on unaffiliated investments | | (9,594,454) |
| Net realized gains on in-kind redemptions on unaffiliated investments | | 2,174,371 |
| Net realized gains on futures contracts | + | 415,695 |
| Net realized losses | | (7,006,453) |
| Net change in unrealized appreciation (depreciation) on affiliated issuer | | (19,007) |
| Net change in unrealized appreciation (depreciation) on unaffiliated investments | | 28,972,880 |
| Net change in unrealized appreciation (depreciation) on futures contracts | + | 21,151 |
| Net change in unrealized appreciation (depreciation) | + | 28,975,024 |
| Net realized and unrealized gains | | 21,968,571 |
| Increase in net assets resulting from operations | | $53,824,311 |
Schwab Fundamental Index ETFs | Semiannual Report
Schwab Fundamental U.S. Large Company Index ETF
Statement of Changes in Net Assets
For the current and prior report periods
Figures for the current period are unaudited
| Operations | |
| | 3/1/17-8/31/17 | 3/1/16-2/28/17 |
| Net investment income | | $31,855,740 | $32,934,872 |
| Net realized gains (losses) | | (7,006,453) | 22,627 |
| Net change in unrealized appreciation (depreciation) | + | 28,975,024 | 284,349,812 |
| Increase in net assets resulting from operations | | 53,824,311 | 317,307,311 |
| Distributions to Shareholders | |
| Distributions from net investment income | | ($23,436,435) | ($29,673,625) |
| Transactions in Fund Shares | | | |
| | | 3/1/17-8/31/17 | 3/1/16-2/28/17 |
| | | SHARES | VALUE | SHARES | VALUE |
| Shares sold | | 23,800,000 | $805,455,576 | 33,300,000 | $1,044,664,871 |
| Shares redeemed | + | (450,001) | (15,271,681) | (900,000) | (28,064,322) |
| Net transactions in fund shares | | 23,349,999 | $790,183,895 | 32,400,000 | $1,016,600,549 |
| Shares Outstanding and Net Assets | | | |
| | | 3/1/17-8/31/17 | 3/1/16-2/28/17 |
| | | SHARES | NET ASSETS | SHARES | NET ASSETS |
| Beginning of period | | 64,800,001 | $2,197,622,952 | 32,400,001 | $893,388,717 |
| Total increase | + | 23,349,999 | 820,571,771 | 32,400,000 | 1,304,234,235 |
| End of period | | 88,150,000 | $3,018,194,723 | 64,800,001 | $2,197,622,952 |
| Net investment income not yet distributed | | | $15,088,156 | | $6,668,851 |
Schwab Fundamental Index ETFs | Semiannual Report
Schwab Fundamental U.S. Small Company Index ETF
Financial Statements
Financial Highlights
| | 3/1/17–
8/31/17* | 3/1/16–
2/28/17 | 3/1/15–
2/29/16 | 3/1/14–
2/28/15 | 8/14/13 1–
2/28/14 | |
| Per-Share Data |
| Net asset value at beginning of period | $34.89 | $26.47 | $30.68 | $28.44 | $25.00 | |
| Income (loss) from investment operations: | | | | | | |
| Net investment income (loss) | 0.30 2 | 0.45 2 | 0.41 2 | 0.34 | 0.12 | |
| Net realized and unrealized gains (losses) | (0.55) | 8.37 | (4.25) | 2.22 | 3.41 | |
| Total from investment operations | (0.25) | 8.82 | (3.84) | 2.56 | 3.53 | |
| Less distributions: | | | | | | |
| Distributions from net investment income | (0.20) | (0.40) | (0.37) | (0.32) | (0.09) | |
| Net asset value at end of period | $34.44 | $34.89 | $26.47 | $30.68 | $28.44 | |
| Total return | (0.71%) 3 | 33.56% | (12.60%) | 9.06% | 14.14% 3 | |
| Ratios/Supplemental Data |
| Ratios to average net assets: | | | | | | |
| Total expenses | 0.25% 4 | 0.32% | 0.32% | 0.32% | 0.32% 4 | |
| Net investment income (loss) | 1.71% 4 | 1.43% | 1.43% | 1.32% | 1.16% 4 | |
| Portfolio turnover rate5 | 14% 3 | 23% | 23% | 22% | 9% 3 | |
| Net assets, end of period (x 1,000) | $2,024,968 | $1,568,402 | $608,865 | $187,141 | $55,465 | |
| |
1
Commencement of operations.
2
Calculated based on the average shares outstanding during the period.
3
Not annualized.
4
Annualized.
5
Portfolio turnover rate excludes securities received or delivered from processing of in-kind creations or redemptions.
Schwab Fundamental Index ETFs | Semiannual Report
Schwab Fundamental U.S. Small Company Index ETF
Condensed Portfolio Holdings as of August 31, 2017 (Unaudited)
This section shows the fund's 50 largest portfolio holdings in unaffiliated issuers, any holdings exceeding 1% of the fund's net assets as of the report date, and any affiliated issuers. The remaining securities held by the fund are grouped as "Other Securities" in each category. You can request a complete schedule of portfolio holdings as of the report date, free of charge, by calling Schwab ETFs™ at 1-877-824-5615. This complete schedule, filed on the fund's Form N-CSR(S), is also available on the SEC's website at www.sec.gov.
In addition, the fund files its complete schedule of portfolio holdings with the SEC for the first and third quarters of each fiscal year on Form N-Q. The fund's Form N-Q is available on the SEC's website and may be viewed and copied at the SEC's Public Reference Room in Washington, D.C. Call 1-800-SEC-0330 for information on the operation of the Public Reference Room. The fund also makes available its complete schedule of portfolio holdings on a daily basis on the fund's website at www.schwabfunds.com/schwabetfs_prospectus.
| Security | Number
of Shares | % of Net
Assets | Value ($) |
| Common Stock 99.8% of net assets | |
| |
| Automobiles & Components 0.8% | |
| Other Securities | | 0.8 | 15,699,771 |
| |
| Banks 5.4% | |
| East West Bancorp, Inc. | 89,155 | 0.2 | 4,936,512 |
| Other Securities | | 5.2 | 104,222,110 |
| | | 5.4 | 109,158,622 |
| |
| Capital Goods 12.0% | |
| Armstrong World Industries, Inc. * | 134,605 | 0.3 | 6,393,737 |
| GATX Corp. (a) | 80,446 | 0.2 | 4,873,419 |
| Kennametal, Inc. | 151,375 | 0.3 | 5,298,125 |
| Triumph Group, Inc. | 209,431 | 0.3 | 5,508,035 |
| Other Securities | | 10.9 | 220,651,121 |
| | | 12.0 | 242,724,437 |
| |
| Commercial & Professional Services 5.2% | |
| Copart, Inc. * | 155,937 | 0.3 | 5,097,581 |
| IHS Markit Ltd. * | 134,805 | 0.3 | 6,314,266 |
| The Brink's Co. | 64,062 | 0.2 | 5,025,664 |
| Verisk Analytics, Inc. * | 75,104 | 0.3 | 6,087,179 |
| Other Securities | | 4.1 | 82,806,215 |
| | | 5.2 | 105,330,905 |
| |
| Consumer Durables & Apparel 2.9% | |
| Other Securities | | 2.9 | 59,152,144 |
| |
| Consumer Services 5.2% | |
| Graham Holdings Co., Class B | 8,584 | 0.2 | 5,040,525 |
| Hilton Worldwide Holdings, Inc. | 78,323 | 0.2 | 5,038,519 |
| Weight Watchers International, Inc. * | 214,616 | 0.5 | 10,046,175 |
| Other Securities | | 4.3 | 85,170,750 |
| | | 5.2 | 105,295,969 |
| |
| Diversified Financials 4.4% | |
| E*TRADE Financial Corp. * | 134,381 | 0.3 | 5,510,965 |
| FNFV Group * | 503,697 | 0.4 | 8,487,294 |
| Other Securities | | 3.7 | 74,454,513 |
| | | 4.4 | 88,452,772 |
| |
| Security | Number
of Shares | % of Net
Assets | Value ($) |
| Energy 4.4% | |
| Cimarex Energy Co. | 49,732 | 0.2 | 4,957,783 |
| Other Securities | | 4.2 | 83,648,749 |
| | | 4.4 | 88,606,532 |
| |
| Food & Staples Retailing 0.8% | |
| Other Securities | | 0.8 | 15,523,105 |
| |
| Food, Beverage & Tobacco 2.5% | |
| Sanderson Farms, Inc. | 44,754 | 0.3 | 6,602,110 |
| Other Securities | | 2.2 | 44,595,596 |
| | | 2.5 | 51,197,706 |
| |
| Health Care Equipment & Services 4.7% | |
| IDEXX Laboratories, Inc. * | 34,865 | 0.3 | 5,419,067 |
| Select Medical Holdings Corp. * | 291,489 | 0.3 | 5,421,695 |
| The Cooper Cos., Inc. | 20,633 | 0.3 | 5,175,375 |
| Other Securities | | 3.8 | 79,245,516 |
| | | 4.7 | 95,261,653 |
| |
| Household & Personal Products 0.7% | |
| Edgewell Personal Care Co. * | 64,741 | 0.2 | 4,916,431 |
| Other Securities | | 0.5 | 10,126,735 |
| | | 0.7 | 15,043,166 |
| |
| Insurance 3.0% | |
| Other Securities | | 3.0 | 60,515,778 |
| |
| Materials 6.7% | |
| AptarGroup, Inc. | 76,331 | 0.3 | 6,382,035 |
| Cabot Corp. | 100,734 | 0.3 | 5,306,667 |
| Olin Corp. | 152,466 | 0.2 | 4,913,979 |
| Southern Copper Corp. | 145,602 | 0.3 | 5,926,001 |
| Other Securities | | 5.6 | 112,873,069 |
| | | 6.7 | 135,401,751 |
| |
| Media 2.2% | |
| Sirius XM Holdings, Inc. (a) | 847,949 | 0.2 | 4,875,707 |
| Time, Inc. | 387,970 | 0.3 | 5,101,805 |
| Other Securities | | 1.7 | 35,714,228 |
| | | 2.2 | 45,691,740 |
| |
Schwab Fundamental Index ETFs | Semiannual Report
Schwab Fundamental U.S. Small Company Index ETF
Condensed Portfolio Holdings as of August 31, 2017 (Unaudited) (continued)
| Security | Number
of Shares | % of Net
Assets | Value ($) |
| Pharmaceuticals, Biotechnology & Life Sciences 3.2% | |
| PerkinElmer, Inc. | 76,978 | 0.3 | 5,156,756 |
| Quintiles IMS Holdings, Inc. * | 67,844 | 0.3 | 6,515,059 |
| Other Securities | | 2.6 | 52,517,577 |
| | | 3.2 | 64,189,392 |
| |
| Real Estate 10.7% | |
| Camden Property Trust | 56,912 | 0.3 | 5,092,486 |
| Liberty Property Trust | 115,495 | 0.2 | 4,920,087 |
| Mid-America Apartment Communities, Inc. | 53,463 | 0.3 | 5,691,671 |
| SBA Communications Corp. * | 35,054 | 0.3 | 5,382,542 |
| UDR, Inc. | 135,671 | 0.3 | 5,266,748 |
| Other Securities | | 9.3 | 190,038,099 |
| | | 10.7 | 216,391,633 |
| |
| Retailing 4.5% | |
| Aaron's, Inc. | 119,858 | 0.3 | 5,306,114 |
| Guess?, Inc. | 413,063 | 0.3 | 6,435,521 |
| Other Securities | | 3.9 | 79,802,027 |
| | | 4.5 | 91,543,662 |
| |
| Semiconductors & Semiconductor Equipment 2.0% | |
| Teradyne, Inc. | 163,231 | 0.3 | 5,812,656 |
| Other Securities | | 1.7 | 35,836,401 |
| | | 2.0 | 41,649,057 |
| |
| Software & Services 6.7% | |
| CSRA, Inc. | 214,833 | 0.3 | 6,769,388 |
| Gartner, Inc. * | 40,655 | 0.2 | 4,902,586 |
| Red Hat, Inc. * | 55,679 | 0.3 | 5,985,493 |
| Synopsys, Inc. * | 61,933 | 0.2 | 4,980,652 |
| VeriSign, Inc. * | 57,089 | 0.3 | 5,922,984 |
| Other Securities | | 5.4 | 107,554,679 |
| | | 6.7 | 136,115,782 |
| |
| Technology Hardware & Equipment 4.9% | |
| Insight Enterprises, Inc. * | 129,208 | 0.3 | 5,178,657 |
| Trimble, Inc. * | 133,155 | 0.3 | 5,150,435 |
| Vishay Intertechnology, Inc. | 361,468 | 0.3 | 6,397,984 |
| Other Securities | | 4.0 | 82,806,680 |
| | | 4.9 | 99,533,756 |
| |
| Telecommunication Services 0.6% | |
| Other Securities | | 0.6 | 11,777,529 |
| |
| Security | Number
of Shares | % of Net
Assets | Value ($) |
| Transportation 2.8% | |
| Copa Holdings S.A., Class A | 44,244 | 0.3 | 5,489,353 |
| Landstar System, Inc. | 56,820 | 0.3 | 5,304,147 |
| Other Securities | | 2.2 | 46,418,995 |
| | | 2.8 | 57,212,495 |
| |
| Utilities 3.5% | |
| Hawaiian Electric Industries, Inc. | 148,332 | 0.2 | 4,957,255 |
| PNM Resources, Inc. | 126,025 | 0.3 | 5,343,460 |
| Portland General Electric Co. | 106,255 | 0.2 | 5,048,175 |
| Other Securities | | 2.8 | 54,840,125 |
| | | 3.5 | 70,189,015 |
| Total Common Stock |
| (Cost $1,864,811,114) | | | 2,021,658,372 |
|
| Other Investment Companies 2.5% of net assets | |
| |
| Money Market Fund 0.1% | |
| Other Securities | | 0.1 | 1,132,435 |
| |
| Securities Lending Collateral 2.4% | |
| Wells Fargo Government Money Market Fund, Select Class 0.92% (b) | | 2.4 | 49,095,431 |
| Total Other Investment Companies |
| (Cost $50,227,866) | | | 50,227,866 |
| | Number of
Contracts | Notional
Amount
($) | Current Value/
Unrealized
Appreciation
($) |
| Futures Contracts | | | |
| Long | |
| Russell 2000 Index, e-mini expires 09/15/17 | 45 | 3,161,250 | 50,418 |
For the following notes, please refer to the complete schedule of portfolio holdings.
| * | Non-income producing security. |
| (a) | All or a portion of this security is on loan. Securities on loan were valued at $47,820,174. |
| (b) | The rate shown is the 7-day yield. |
| | |
| REIT — | Real Estate Investment Trust |
Schwab Fundamental Index ETFs | Semiannual Report
Schwab Fundamental U.S. Small Company Index ETF
Condensed Portfolio Holdings as of August 31, 2017 (Unaudited) (continued)
The following is a summary of the inputs used to value the fund’s investments as of August 31, 2017 (see financial note 2(a) for additional information):
| Description | Quoted Prices in
Active Markets for
Identical Assets
(Level 1) | Other Significant
Observable Inputs
(Level 2) | Significant
Unobservable Inputs
(Level 3) | Total | |
| Assets | | | | | |
| Common Stock1 | $2,021,658,372 | $— | $— | $2,021,658,372 | |
| Other Investment Companies1 | 50,227,866 | — | — | 50,227,866 | |
| Futures Contracts2 | 50,418 | — | — | 50,418 | |
| Total | $2,071,936,656 | $— | $— | $2,071,936,656 | |
| 1 | As categorized in the complete schedule of Portfolio Holdings. |
| 2 | Futures contracts are valued at unrealized appreciation or depreciation. |
The fund's policy is to recognize transfers between Level 1, Level 2 and Level 3 as of the beginning of the fiscal year. There were no transfers between Level 1, Level 2 and Level 3 for the period ended August 31, 2017.
Schwab Fundamental Index ETFs | Semiannual Report
Schwab Fundamental U.S. Small Company Index ETF
Statement of Assets and Liabilities
As of August 31, 2017; unaudited
| Assets |
| Investments in unaffiliated issuers, at value (cost $1,865,943,549) including securities on loan of $47,820,174 | | $2,022,790,807 |
| Collateral invested for securities on loan, at value (cost $49,095,431) | | 49,095,431 |
| Deposit with broker for futures contracts | | 130,000 |
| Receivables: | | |
| Fund shares sold | | 11,972,153 |
| Dividends | | 2,100,025 |
| Income from securities on loan | | 179,281 |
| Variation margin on futures contracts | + | 23,052 |
| Total assets | | 2,086,290,749 |
| Liabilities |
| Collateral held for securities on loan | | 49,095,431 |
| Payables: | | |
| Investments bought | | 11,809,886 |
| Investment adviser fees | | 416,938 |
| Due to custodian | + | 118 |
| Total liabilities | | 61,322,373 |
| Net Assets |
| Total assets | | 2,086,290,749 |
| Total liabilities | – | 61,322,373 |
| Net assets | | $2,024,968,376 |
| Net Assets by Source | | |
| Capital received from investors | | 1,867,422,014 |
| Net investment income not yet distributed | | 7,079,209 |
| Net realized capital losses | | (6,430,523) |
| Net unrealized capital appreciation | | 156,897,676 |
| Net Asset Value (NAV) |
| Net Assets | ÷ | Shares
Outstanding | = | NAV |
| $2,024,968,376 | | 58,800,000 | | $34.44 |
| | | | | |
Schwab Fundamental Index ETFs | Semiannual Report
Schwab Fundamental U.S. Small Company Index ETF
Statement of Operations
For the period March 1, 2017 through August 31, 2017; unaudited
| Investment Income |
| Dividends (net of foreign withholding tax of $7,691) | | $16,884,332 |
| Interest | | 814 |
| Securities on loan, net | + | 842,413 |
| Total investment income | | 17,727,559 |
| Expenses |
| Investment adviser fees | | 2,266,175 |
| Total expenses | – | 2,266,175 |
| Net investment income | | 15,461,384 |
| Realized and Unrealized Gains (Losses) |
| Net realized losses on investments | | (19,452,224) |
| Net realized gains on in-kind redemptions | | 30,850,982 |
| Net realized gains on futures contracts | | 491,258 |
| Net realized gains on foreign currency transactions | + | 512 |
| Net realized gains | | 11,890,528 |
| Net change in unrealized appreciation (depreciation) on investments | | (37,769,244) |
| Net change in unrealized appreciation (depreciation) on futures contracts | + | 86,054 |
| Net change in unrealized appreciation (depreciation) | + | (37,683,190) |
| Net realized and unrealized losses | | (25,792,662) |
| Decrease in net assets resulting from operations | | ($10,331,278) |
Schwab Fundamental Index ETFs | Semiannual Report
Schwab Fundamental U.S. Small Company Index ETF
Statement of Changes in Net Assets
For the current and prior report periods
Figures for the current period are unaudited
| Operations | |
| | 3/1/17-8/31/17 | 3/1/16-2/28/17 |
| Net investment income | | $15,461,384 | $14,363,230 |
| Net realized gains | | 11,890,528 | 2,593,652 |
| Net change in unrealized appreciation (depreciation) | + | (37,683,190) | 256,841,338 |
| Increase (decrease) in net assets resulting from operations | | (10,331,278) | 273,798,220 |
| Distributions to Shareholders | |
| Distributions from net investment income | | ($10,231,075) | ($12,680,080) |
| Transactions in Fund Shares | | | |
| | | 3/1/17-8/31/17 | 3/1/16-2/28/17 |
| | | SHARES | VALUE | SHARES | VALUE |
| Shares sold | | 18,150,000 | $625,942,364 | 23,300,000 | $741,815,537 |
| Shares redeemed | + | (4,300,001) | (148,813,924) | (1,350,000) | (43,396,411) |
| Net transactions in fund shares | | 13,849,999 | $477,128,440 | 21,950,000 | $698,419,126 |
| Shares Outstanding and Net Assets | | | |
| | | 3/1/17-8/31/17 | 3/1/16-2/28/17 |
| | | SHARES | NET ASSETS | SHARES | NET ASSETS |
| Beginning of period | | 44,950,001 | $1,568,402,289 | 23,000,001 | $608,865,023 |
| Total increase | + | 13,849,999 | 456,566,087 | 21,950,000 | 959,537,266 |
| End of period | | 58,800,000 | $2,024,968,376 | 44,950,001 | $1,568,402,289 |
| Net investment income not yet distributed | | | $7,079,209 | | $1,848,900 |
Schwab Fundamental Index ETFs | Semiannual Report
Schwab Fundamental International Large Company Index ETF
Financial Statements
Financial Highlights
| | 3/1/17–
8/31/17* | 3/1/16–
2/28/17 | 3/1/15–
2/29/16 | 3/1/14–
2/28/15 | 8/14/13 1–
2/28/14 | |
| Per-Share Data |
| Net asset value at beginning of period | $26.00 | $22.08 | $27.17 | $28.26 | $25.00 | |
| Income (loss) from investment operations: | | | | | | |
| Net investment income (loss) | 0.55 2 | 0.74 2 | 0.70 2 | 0.30 | 0.36 | |
| Net realized and unrealized gains (losses) | 2.31 | 3.79 | (5.30) | (0.92) 3 | 3.04 | |
| Total from investment operations | 2.86 | 4.53 | (4.60) | (0.62) | 3.40 | |
| Less distributions: | | | | | | |
| Distributions from net investment income | — | (0.61) | (0.49) | (0.47) | (0.14) | |
| Net asset value at end of period | $28.86 | $26.00 | $22.08 | $27.17 | $28.26 | |
| Total return | 11.00% 4 | 20.62% | (17.02%) | (2.11%) | 13.60% 4 | |
| Ratios/Supplemental Data |
| Ratios to average net assets: | | | | | | |
| Total expenses | 0.25% 5 | 0.32% | 0.32% | 0.32% | 0.32% 5 | |
| Net investment income (loss) | 3.95% 5 | 2.98% | 2.80% | 2.50% | 4.00% 5 | |
| Portfolio turnover rate6 | 5% 4 | 11% | 12% | 11% | 8% 4 | |
| Net assets, end of period (x 1,000) | $2,854,221 | $1,928,861 | $885,348 | $290,670 | $62,164 | |
| |
1
Commencement of operations.
2
Calculated based on the average shares outstanding during the period.
3
The per share amount does not accord with the change in aggregate gains and losses in securities during the period because of the timing of sales and repurchases of fund shares in relation to fluctuating market values.
4
Not annualized.
5
Annualized.
6
Portfolio turnover rate excludes securities received or delivered from processing of in-kind creations or redemptions.
Schwab Fundamental Index ETFs | Semiannual Report
Schwab Fundamental International Large Company Index ETF
Condensed Portfolio Holdings as of August 31, 2017 (Unaudited)
This section shows the fund's 50 largest portfolio holdings in unaffiliated issuers, any holdings exceeding 1% of the fund's net assets as of the report date, and any affiliated issuers. The remaining securities held by the fund are grouped as "Other Securities" in each category. You can request a complete schedule of portfolio holdings as of the report date, free of charge, by calling Schwab ETFs™ at 1-877-824-5615. This complete schedule, filed on the fund's Form N-CSR(S), is also available on the SEC's website at www.sec.gov.
In addition, the fund files its complete schedule of portfolio holdings with the SEC for the first and third quarters of each fiscal year on Form N-Q. The fund's Form N-Q is available on the SEC's website and may be viewed and copied at the SEC's Public Reference Room in Washington, D.C. Call 1-800-SEC-0330 for information on the operation of the Public Reference Room. The fund also makes available its complete schedule of portfolio holdings on a daily basis on the fund's website at www.schwabfunds.com/schwabetfs_prospectus.
| Security | Number
of Shares | % of Net
Assets | Value ($) |
| Common Stock 98.9% of net assets | |
| |
| Australia 6.2% | |
| Australia & New Zealand Banking Group Ltd. | 538,456 | 0.4 | 12,556,041 |
| BHP Billiton Ltd. | 1,087,235 | 0.8 | 23,610,873 |
| Commonwealth Bank of Australia | 247,674 | 0.5 | 14,890,346 |
| National Australia Bank Ltd. | 485,092 | 0.4 | 11,619,468 |
| Wesfarmers Ltd. | 386,171 | 0.5 | 13,054,140 |
| Westpac Banking Corp. | 578,762 | 0.5 | 14,354,335 |
| Other Securities | | 3.1 | 85,769,325 |
| | | 6.2 | 175,854,528 |
| |
| Austria 0.4% | |
| Other Securities | | 0.4 | 12,690,445 |
| |
| Belgium 0.8% | |
| Other Securities | | 0.8 | 23,666,525 |
| |
| Canada 6.8% | |
| Royal Bank of Canada | 176,268 | 0.5 | 13,030,124 |
| Suncor Energy, Inc. | 418,664 | 0.5 | 13,066,658 |
| Other Securities | | 5.8 | 167,602,556 |
| | | 6.8 | 193,699,338 |
| |
| Denmark 1.0% | |
| Other Securities | | 1.0 | 27,116,191 |
| |
| Finland 0.9% | |
| Other Securities | | 0.9 | 27,022,794 |
| |
| France 10.1% | |
| BNP Paribas S.A. | 196,842 | 0.5 | 14,956,560 |
| Engie S.A. | 1,052,297 | 0.6 | 17,540,077 |
| Orange S.A. | 816,436 | 0.5 | 13,856,176 |
| Sanofi | 205,513 | 0.7 | 19,952,339 |
| Societe Generale S.A. | 240,979 | 0.5 | 13,474,086 |
| Total S.A. | 903,617 | 1.6 | 46,673,389 |
| Other Securities | | 5.7 | 162,186,065 |
| | | 10.1 | 288,638,692 |
| |
| Germany 9.4% | |
| Allianz SE | 85,642 | 0.6 | 18,302,096 |
| BASF SE | 234,683 | 0.8 | 22,703,410 |
| Bayer AG | 113,584 | 0.5 | 14,516,796 |
| Security | Number
of Shares | % of Net
Assets | Value ($) |
| Daimler AG | 276,626 | 0.7 | 20,137,354 |
| Deutsche Telekom AG | 886,999 | 0.6 | 15,987,018 |
| E.ON SE | 2,026,200 | 0.8 | 22,872,963 |
| RWE AG * | 513,503 | 0.4 | 12,793,100 |
| Siemens AG | 134,195 | 0.6 | 17,517,971 |
| Other Securities | | 4.4 | 123,067,408 |
| | | 9.4 | 267,898,116 |
| |
| Hong Kong 1.4% | |
| Other Securities | | 1.4 | 39,410,557 |
| |
| Ireland 0.6% | |
| Other Securities | | 0.6 | 16,522,309 |
| |
| Israel 0.3% | |
| Other Securities | | 0.3 | 8,305,537 |
| |
| Italy 3.7% | |
| Enel S.p.A. | 3,344,182 | 0.7 | 20,217,432 |
| Eni S.p.A. | 1,576,558 | 0.9 | 24,685,440 |
| UniCredit S.p.A. * | 749,050 | 0.5 | 15,219,417 |
| Other Securities | | 1.6 | 45,142,210 |
| | | 3.7 | 105,264,499 |
| |
| Japan 21.6% | |
| Hitachi Ltd. | 2,111,117 | 0.5 | 14,520,403 |
| Honda Motor Co., Ltd. | 517,423 | 0.5 | 14,484,647 |
| Mitsubishi UFJ Financial Group, Inc. | 2,088,134 | 0.4 | 12,789,489 |
| Nippon Telegraph & Telephone Corp. | 302,675 | 0.5 | 15,037,497 |
| Toyota Motor Corp. | 515,071 | 1.0 | 28,935,889 |
| Other Securities | | 18.7 | 529,768,352 |
| | | 21.6 | 615,536,277 |
| |
| Luxembourg 0.5% | |
| Other Securities | | 0.5 | 14,235,048 |
| |
| Netherlands 4.8% | |
| Royal Dutch Shell plc, A Shares | 1,006,182 | 1.0 | 27,687,189 |
| Royal Dutch Shell plc, B Shares | 1,544,668 | 1.5 | 43,002,209 |
| Unilever N.V. CVA | 191,404 | 0.4 | 11,380,281 |
| Other Securities | | 1.9 | 55,183,293 |
| | | 4.8 | 137,252,972 |
| |
Schwab Fundamental Index ETFs | Semiannual Report
Schwab Fundamental International Large Company Index ETF
Condensed Portfolio Holdings as of August 31, 2017 (Unaudited) (continued)
| Security | Number
of Shares | % of Net
Assets | Value ($) |
| New Zealand 0.1% | |
| Other Securities | | 0.1 | 3,130,925 |
| |
| Norway 1.0% | |
| Statoil A.S.A. | 633,750 | 0.4 | 11,974,685 |
| Other Securities | | 0.6 | 15,466,721 |
| | | 1.0 | 27,441,406 |
| |
| Portugal 0.2% | |
| Other Securities | | 0.2 | 6,709,216 |
| |
| Singapore 0.8% | |
| Other Securities | | 0.8 | 23,696,934 |
| |
| Spain 4.3% | |
| Banco Santander S.A. | 6,012,382 | 1.4 | 39,021,575 |
| Repsol S.A. | 735,379 | 0.4 | 12,616,029 |
| Telefonica S.A. | 2,170,095 | 0.8 | 23,372,445 |
| Other Securities | | 1.7 | 48,447,897 |
| | | 4.3 | 123,457,946 |
| |
| Sweden 2.4% | |
| Other Securities | | 2.4 | 69,895,733 |
| |
| Switzerland 6.3% | |
| Glencore plc * | 4,770,498 | 0.8 | 22,098,559 |
| Nestle S.A. | 385,403 | 1.1 | 32,624,905 |
| Novartis AG | 291,600 | 0.9 | 24,547,804 |
| Roche Holding AG | 75,007 | 0.7 | 19,005,416 |
| Other Securities | | 2.8 | 80,767,206 |
| | | 6.3 | 179,043,890 |
| |
| United Kingdom 15.3% | |
| AstraZeneca plc | 258,807 | 0.5 | 15,143,591 |
| BHP Billiton plc | 731,653 | 0.5 | 13,920,023 |
| BP plc | 9,896,855 | 2.0 | 56,768,174 |
| British American Tobacco plc | 246,681 | 0.5 | 15,355,858 |
| GlaxoSmithKline plc | 803,856 | 0.6 | 15,884,128 |
| HSBC Holdings plc | 3,726,985 | 1.3 | 36,042,067 |
| Rio Tinto plc | 337,985 | 0.6 | 16,316,406 |
| Vodafone Group plc | 8,863,873 | 0.9 | 25,287,301 |
| Other Securities | | 8.4 | 242,612,935 |
| | | 15.3 | 437,330,483 |
| Total Common Stock |
| (Cost $2,540,212,981) | | | 2,823,820,361 |
|
| Preferred Stock 0.6% of net assets | |
| |
| Germany 0.6% | |
| Volkswagen AG | 88,671 | 0.5 | 13,214,511 |
| Other Securities | | 0.1 | 3,076,163 |
| | | 0.6 | 16,290,674 |
| |
| Security | Number
of Shares | % of Net
Assets | Value ($) |
| Italy 0.0% | |
| Other Securities | | 0.0 | 750,564 |
| |
| Spain 0.0% | |
| Other Securities | | 0.0 | 397,696 |
| Total Preferred Stock |
| (Cost $17,280,713) | | | 17,438,934 |
|
| Other Investment Companies 0.4% of net assets | |
| |
| United States 0.4% | |
| Money Market Fund 0.2% | |
| Other Securities | | 0.2 | 6,320,727 |
| |
| Securities Lending Collateral 0.2% | |
| Other Securities | | 0.2 | 4,647,234 |
| Total Other Investment Companies |
| (Cost $10,967,961) | | | 10,967,961 |
| | Number of
Contracts | Notional
Amount
($) | Current Value/
Unrealized
Appreciation
($) |
| Futures Contracts | | | |
| Long | |
| MSCI EAFE Index, e-mini, expires 09/15/17 | 114 | 11,028,360 | 43,962 |
For the following notes, please refer to the complete schedule of portfolio holdings.
| * | Non-income producing security. |
| (a) | All or a portion of this security is on loan. Securities on loan were valued at $4,429,591. |
| (b) | Fair-valued by management in accordance with procedures approved by the Board of Trustees. |
| (c) | The rate shown is the 7-day yield. |
| | |
| CDI — | CHESS Depositary Interest |
| CVA — | Dutch Certificate |
| GDR — | Global Depositary Receipt |
| REIT — | Real Estate Investment Trust |
| RSP — | Risparmio (Convertible Savings Shares) |
Schwab Fundamental Index ETFs | Semiannual Report
Schwab Fundamental International Large Company Index ETF
Condensed Portfolio Holdings as of August 31, 2017 (Unaudited) (continued)
The following is a summary of the inputs used to value the fund’s investments as of August 31, 2017 (see financial note 2(a) for additional information):
| Description | Quoted Prices in
Active Markets for
Identical Assets
(Level 1) | Other Significant
Observable Inputs
(Level 2) | Significant
Unobservable Inputs
(Level 3) | Total | |
| Assets | | | | | |
| Common Stock1 | $1,927,165,057 | $— | $— | $1,927,165,057 | |
| Australia | 175,854,528 | — | — * | 175,854,528 | |
| Italy | 104,934,086 | — | 330,413 | 105,264,499 | |
| Japan | 612,996,384 | — | 2,539,893 | 615,536,277 | |
| Preferred Stock1 | 17,438,934 | — | — | 17,438,934 | |
| Other Investment Companies1 | 10,967,961 | — | — | 10,967,961 | |
| Futures Contracts2 | 43,962 | — | — | 43,962 | |
| Total | $2,849,400,912 | $— | $2,870,306 | $2,852,271,218 | |
| * | Level 3 amount shown includes securities determined to have no value at August 31, 2017. |
| 1 | As categorized in the complete schedule of Portfolio Holdings. |
| 2 | Futures contracts are valued at unrealized appreciation or depreciation. |
The fund's policy is to recognize transfers between Level 1, Level 2 and Level 3 as of the beginning of the fiscal year. There were security transfers out of Level 1 to Level 3 due to the result of fair valued securities for which no quoted value was available. There were no transfers between any other Levels for the period ended August 31, 2017.
Schwab Fundamental Index ETFs | Semiannual Report
Schwab Fundamental International Large Company Index ETF
Statement of Assets and Liabilities
As of August 31, 2017; unaudited
| Assets |
| Investments in unaffiliated issuers, at value (cost $2,563,814,421) including securities on loan of $4,429,591 | | $2,847,580,022 |
| Collateral invested for securities on loan, at value (cost $4,647,234) | | 4,647,234 |
| Deposit with broker for futures contracts | | 745,500 |
| Foreign currency, at value (cost $833,403) | | 832,289 |
| Receivables: | | |
| Investments sold | | 12,907 |
| Dividends | | 8,471,503 |
| Foreign tax reclaims | | 1,931,640 |
| Variation margin on futures contracts | | 83,790 |
| Income from securities on loan | + | 58,470 |
| Total assets | | 2,864,363,355 |
| Liabilities |
| Collateral held for securities on loan | | 4,647,234 |
| Payables: | | |
| Investments bought | | 4,898,737 |
| Investment adviser fees | + | 596,859 |
| Total liabilities | | 10,142,830 |
| Net Assets |
| Total assets | | 2,864,363,355 |
| Total liabilities | – | 10,142,830 |
| Net assets | | $2,854,220,525 |
| Net Assets by Source | | |
| Capital received from investors | | 2,560,323,276 |
| Net investment income not yet distributed | | 51,639,448 |
| Net realized capital losses | | (41,673,112) |
| Net unrealized capital appreciation | | 283,930,913 |
| Net Asset Value (NAV) |
| Net Assets | ÷ | Shares
Outstanding | = | NAV |
| $2,854,220,525 | | 98,900,000 | | $28.86 |
| | | | | |
Schwab Fundamental Index ETFs | Semiannual Report
Schwab Fundamental International Large Company Index ETF
Statement of Operations
For the period March 1, 2017 through August 31, 2017; unaudited
| Investment Income |
| Dividends (net of foreign withholding tax of $4,590,811) | | $50,590,419 |
| Securities on loan, net | + | 525,396 |
| Total investment income | | 51,115,815 |
| Expenses |
| Investment adviser fees | | 3,044,871 |
| Total expenses | – | 3,044,871 |
| Net investment income | | 48,070,944 |
| Realized and Unrealized Gains (Losses) |
| Net realized losses on investments | | (12,164,532) |
| Net realized gains on in-kind redemptions | | 3,715,731 |
| Net realized gains on futures contracts | | 1,013,400 |
| Net realized gains on foreign currency transactions | + | 323,771 |
| Net realized losses | | (7,111,630) |
| Net change in unrealized appreciation (depreciation) on investments | | 204,955,669 |
| Net change in unrealized appreciation (depreciation) on futures contracts | | 47,974 |
| Net change in unrealized appreciation (depreciation) on foreign currency translations | + | 133,160 |
| Net change in unrealized appreciation (depreciation) | + | 205,136,803 |
| Net realized and unrealized gains | | 198,025,173 |
| Increase in net assets resulting from operations | | $246,096,117 |
Schwab Fundamental Index ETFs | Semiannual Report
Schwab Fundamental International Large Company Index ETF
Statement of Changes in Net Assets
For the current and prior report periods
Figures for the current period are unaudited
| Operations | |
| | 3/1/17-8/31/17 | 3/1/16-2/28/17 |
| Net investment income | | $48,070,944 | $39,216,892 |
| Net realized losses | | (7,111,630) | (25,018,453) |
| Net change in unrealized appreciation (depreciation) | + | 205,136,803 | 219,421,896 |
| Increase in net assets resulting from operations | | 246,096,117 | 233,620,335 |
| Distributions to Shareholders | |
| Distributions from net investment income | | $— | ($37,964,160) |
| Transactions in Fund Shares | | | |
| | | 3/1/17-8/31/17 | 3/1/16-2/28/17 |
| | | SHARES | VALUE | SHARES | VALUE |
| Shares sold | | 25,300,000 | $695,929,069 | 34,100,000 | $847,856,850 |
| Shares redeemed | + | (600,001) | (16,665,778) | — | — |
| Net transactions in fund shares | | 24,699,999 | $679,263,291 | 34,100,000 | $847,856,850 |
| Shares Outstanding and Net Assets | | | |
| | | 3/1/17-8/31/17 | 3/1/16-2/28/17 |
| | | SHARES | NET ASSETS | SHARES | NET ASSETS |
| Beginning of period | | 74,200,001 | $1,928,861,117 | 40,100,001 | $885,348,092 |
| Total increase | + | 24,699,999 | 925,359,408 | 34,100,000 | 1,043,513,025 |
| End of period | | 98,900,000 | $2,854,220,525 | 74,200,001 | $1,928,861,117 |
| Net investment income not yet distributed | | | $51,639,448 | | $3,568,504 |
Schwab Fundamental Index ETFs | Semiannual Report
Schwab Fundamental International Small Company Index ETF
Financial Statements
Financial Highlights
| | 3/1/17–
8/31/17* | 3/1/16–
2/28/17 | 3/1/15–
2/29/16 | 3/1/14–
2/28/15 | 8/14/13 1–
2/28/14 | |
| Per-Share Data |
| Net asset value at beginning of period | $29.99 | $24.81 | $27.22 | $27.75 | $25.00 | |
| Income (loss) from investment operations: | | | | | | |
| Net investment income (loss) | 0.42 2 | 0.55 2 | 0.43 2 | 0.41 | 0.15 | |
| Net realized and unrealized gains (losses) | 3.41 | 5.18 | (2.49) | (0.53) 3 | 2.78 | |
| Total from investment operations | 3.83 | 5.73 | (2.06) | (0.12) | 2.93 | |
| Less distributions: | | | | | | |
| Distributions from net investment income | — | (0.55) | (0.35) | (0.41) | (0.18) | |
| Net asset value at end of period | $33.82 | $29.99 | $24.81 | $27.22 | $27.75 | |
| Total return | 12.77% 4 | 23.26% | (7.64%) | (0.32%) | 11.73% 4 | |
| Ratios/Supplemental Data |
| Ratios to average net assets: | | | | | | |
| Total expenses | 0.39% 5 | 0.46% | 0.46% | 0.46% | 0.46% 5 | |
| Net investment income (loss) | 2.58% 5 | 1.94% | 1.65% | 1.73% | 1.09% 5 | |
| Portfolio turnover rate6 | 10% 4 | 25% | 22% | 21% | 18% 4 | |
| Net assets, end of period (x 1,000) | $1,342,466 | $866,749 | $379,667 | $68,046 | $24,977 | |
| |
1
Commencement of operations.
2
Calculated based on the average shares outstanding during the period.
3
The per share amount does not accord with the change in aggregate gains and losses in securities during the period because of the timing of sales and repurchases of fund shares in relation to fluctuating market values.
4
Not annualized.
5
Annualized.
6
Portfolio turnover rate excludes securities received or delivered from processing of in-kind creations or redemptions.
Schwab Fundamental Index ETFs | Semiannual Report
Schwab Fundamental International Small Company Index ETF
Condensed Portfolio Holdings as of August 31, 2017 (Unaudited)
This section shows the fund's 50 largest portfolio holdings in unaffiliated issuers, any holdings exceeding 1% of the fund's net assets as of the report date, and any affiliated issuers. The remaining securities held by the fund are grouped as "Other Securities" in each category. You can request a complete schedule of portfolio holdings as of the report date, free of charge, by calling Schwab ETFs™ at 1-877-824-5615. This complete schedule, filed on the fund's Form N-CSR(S), is also available on the SEC's website at www.sec.gov.
In addition, the fund files its complete schedule of portfolio holdings with the SEC for the first and third quarters of each fiscal year on Form N-Q. The fund's Form N-Q is available on the SEC's website and may be viewed and copied at the SEC's Public Reference Room in Washington, D.C. Call 1-800-SEC-0330 for information on the operation of the Public Reference Room. The fund also makes available its complete schedule of portfolio holdings on a daily basis on the fund's website at www.schwabfunds.com/schwabetfs_prospectus.
| Security | Number
of Shares | % of Net
Assets | Value ($) |
| Common Stock 99.6% of net assets | |
| |
| Australia 5.9% | |
| ALS Ltd. | 328,224 | 0.2 | 2,074,836 |
| Qantas Airways Ltd. | 687,940 | 0.2 | 3,121,057 |
| Other Securities | | 5.5 | 74,406,432 |
| | | 5.9 | 79,602,325 |
| |
| Austria 1.1% | |
| Other Securities | | 1.1 | 14,654,632 |
| |
| Belgium 1.3% | |
| Other Securities | | 1.3 | 17,186,305 |
| |
| Canada 8.7% | |
| Bombardier, Inc., B Shares * | 1,562,340 | 0.2 | 3,115,334 |
| Canadian Utilities Ltd., Class A | 95,136 | 0.2 | 2,953,295 |
| IAMGOLD Corp. * | 337,325 | 0.2 | 2,230,448 |
| IGM Financial, Inc. | 74,488 | 0.2 | 2,429,363 |
| Kinross Gold Corp. * | 542,160 | 0.2 | 2,460,531 |
| Quebecor, Inc., Class B | 67,032 | 0.2 | 2,555,102 |
| Waste Connections, Inc. | 56,239 | 0.3 | 3,737,006 |
| Yamana Gold, Inc. | 756,520 | 0.2 | 2,226,567 |
| Other Securities | | 7.0 | 95,806,713 |
| | | 8.7 | 117,514,359 |
| |
| Denmark 1.5% | |
| FLSmidth & Co. A/S | 38,026 | 0.2 | 2,391,232 |
| Other Securities | | 1.3 | 17,231,085 |
| | | 1.5 | 19,622,317 |
| |
| Finland 1.5% | |
| Other Securities | | 1.5 | 19,601,026 |
| |
| France 4.1% | |
| Aeroports de Paris | 12,058 | 0.2 | 2,148,212 |
| Neopost S.A. | 58,991 | 0.2 | 2,560,606 |
| Other Securities | | 3.7 | 49,954,900 |
| | | 4.1 | 54,663,718 |
| |
| Security | Number
of Shares | % of Net
Assets | Value ($) |
| Germany 2.6% | |
| Fraport AG Frankfurt Airport Services Worldwide | 21,217 | 0.2 | 2,090,890 |
| STADA Arzneimittel AG | 25,047 | 0.2 | 2,339,984 |
| Other Securities | | 2.2 | 30,487,022 |
| | | 2.6 | 34,917,896 |
| |
| Hong Kong 4.3% | |
| Orient Overseas International Ltd. | 308,287 | 0.2 | 2,851,865 |
| Other Securities | | 4.1 | 55,285,412 |
| | | 4.3 | 58,137,277 |
| |
| Ireland 0.8% | |
| Other Securities | | 0.8 | 10,313,218 |
| |
| Israel 0.8% | |
| Other Securities | | 0.8 | 11,181,435 |
| |
| Italy 3.3% | |
| A2A S.p.A. | 1,322,076 | 0.2 | 2,217,832 |
| Ferrari N.V. | 27,759 | 0.2 | 3,171,556 |
| Hera S.p.A. | 678,376 | 0.2 | 2,167,928 |
| Leonardo S.p.A. | 141,987 | 0.2 | 2,398,765 |
| Other Securities | | 2.5 | 34,926,769 |
| | | 3.3 | 44,882,850 |
| |
| Japan 37.9% | |
| Benesse Holdings, Inc. | 67,780 | 0.2 | 2,605,028 |
| FamilyMart UNY Holdings Co., Ltd. | 50,928 | 0.2 | 2,757,867 |
| Fujikura Ltd. | 282,475 | 0.2 | 2,294,500 |
| Kamigumi Co., Ltd. | 204,440 | 0.2 | 2,260,617 |
| Kanematsu Corp. | 954,197 | 0.2 | 2,245,475 |
| Kinden Corp. | 147,212 | 0.2 | 2,402,260 |
| Konami Holdings Corp. | 46,067 | 0.2 | 2,398,364 |
| Kurita Water Industries Ltd. | 74,264 | 0.2 | 2,135,613 |
| Otsuka Corp. | 32,908 | 0.2 | 2,176,724 |
| Sharp Corp. *(a) | 1,663,560 | 0.4 | 4,987,959 |
| Shikoku Electric Power Co., Inc. | 194,660 | 0.2 | 2,532,738 |
| THK Co., Ltd. | 65,327 | 0.2 | 2,178,358 |
| TIS, Inc. | 78,004 | 0.2 | 2,299,864 |
| Yaskawa Electric Corp. | 91,882 | 0.2 | 2,780,002 |
| Other Securities | | 34.9 | 473,503,175 |
| | | 37.9 | 509,558,544 |
| |
Schwab Fundamental Index ETFs | Semiannual Report
Schwab Fundamental International Small Company Index ETF
Condensed Portfolio Holdings as of August 31, 2017 (Unaudited) (continued)
| Security | Number
of Shares | % of Net
Assets | Value ($) |
| Luxembourg 0.6% | |
| Other Securities | | 0.6 | 7,620,596 |
| |
| Netherlands 2.4% | |
| Aalberts Industries N.V. | 52,561 | 0.2 | 2,335,554 |
| VEON Ltd. ADR | 541,481 | 0.2 | 2,285,050 |
| Other Securities | | 2.0 | 27,102,589 |
| | | 2.4 | 31,723,193 |
| |
| New Zealand 1.0% | |
| Other Securities | | 1.0 | 12,888,304 |
| |
| Norway 1.4% | |
| Other Securities | | 1.4 | 19,302,126 |
| |
| Portugal 0.5% | |
| Other Securities | | 0.5 | 7,409,117 |
| |
| Singapore 2.0% | |
| City Developments Ltd. | 270,542 | 0.2 | 2,332,877 |
| Genting Singapore plc | 2,511,682 | 0.2 | 2,191,711 |
| Venture Corp., Ltd. | 212,890 | 0.2 | 2,476,923 |
| Yangzijiang Shipbuilding Holdings Ltd. | 2,023,542 | 0.2 | 2,227,684 |
| Other Securities | | 1.2 | 17,386,959 |
| | | 2.0 | 26,616,154 |
| |
| Spain 1.7% | |
| Other Securities | | 1.7 | 22,252,474 |
| |
| Sweden 2.3% | |
| Other Securities | | 2.3 | 31,189,426 |
| |
| Switzerland 3.0% | |
| GAM Holding AG * | 141,367 | 0.2 | 2,169,785 |
| Sonova Holding AG | 12,908 | 0.2 | 2,177,302 |
| Other Securities | | 2.6 | 35,862,258 |
| | | 3.0 | 40,209,345 |
| |
| United Kingdom 10.9% | |
| Berendsen plc | 142,797 | 0.2 | 2,327,614 |
| Evraz plc | 513,592 | 0.2 | 2,218,317 |
| Hays plc | 879,208 | 0.2 | 2,073,214 |
| Janus Henderson Group plc | 82,599 | 0.2 | 2,854,621 |
| KAZ Minerals plc * | 281,721 | 0.2 | 3,051,113 |
| SIG plc | 1,276,901 | 0.2 | 2,930,370 |
| Other Securities | | 9.7 | 131,180,872 |
| | | 10.9 | 146,636,121 |
| Total Common Stock |
| (Cost $1,154,545,466) | | | 1,337,682,758 |
| Security | Number
of Shares | % of Net
Assets | Value ($) |
| Preferred Stock 0.1% of net assets | |
| |
| Germany 0.1% | |
| Other Securities | | 0.1 | 688,804 |
| |
| Sweden 0.0% | |
| Other Securities | | 0.0 | 520,385 |
| Total Preferred Stock |
| (Cost $1,215,927) | | | 1,209,189 |
|
| Other Investment Companies 3.3% of net assets | |
| |
| United States 3.3% | |
| Money Market Fund 0.2% | |
| State Street Institutional U.S. Government Money Market Fund, Premier Class 0.93% (c) | | 0.2 | 2,638,859 |
| |
| Securities Lending Collateral 3.1% | |
| Wells Fargo Government Money Market Fund, Select Class 0.92% (c) | | 3.1 | 41,240,693 |
| Total Other Investment Companies |
| (Cost $43,879,552) | | | 43,879,552 |
| | Number of
Contracts | Notional
Amount
($) | Current Value/
Unrealized
Appreciation
($) |
| Futures Contracts | | | |
| Long | |
| MSCI EAFE Index, e-mini, expires 09/15/17 | 36 | 3,482,640 | 17,840 |
For the following notes, please refer to the complete schedule of portfolio holdings.
| * | Non-income producing security. |
| (a) | All or a portion of this security is on loan. Securities on loan were valued at $39,283,192. |
| (b) | Fair-valued by management in accordance with procedures approved by the Board of Trustees. |
| (c) | The rate shown is the 7-day yield. |
| | |
| ADR — | American Depositary Receipt |
| CDI — | CHESS Depositary Interest |
| CVA — | Dutch Certificate |
| REIT — | Real Estate Investment Trust |
| RSP — | Risparmio (Convertible Savings Shares) |
Schwab Fundamental Index ETFs | Semiannual Report
Schwab Fundamental International Small Company Index ETF
Condensed Portfolio Holdings as of August 31, 2017 (Unaudited) (continued)
The following is a summary of the inputs used to value the fund’s investments as of August 31, 2017 (see financial note 2(a) for additional information):
| Description | Quoted Prices in
Active Markets for
Identical Assets
(Level 1) | Other Significant
Observable Inputs
(Level 2) | Significant
Unobservable Inputs
(Level 3) | Total | |
| Assets | | | | | |
| Common Stock1 | $1,296,036,891 | $— | $— | $1,296,036,891 | |
| Luxembourg | 7,620,596 | — | — * | 7,620,596 | |
| Portugal | 7,409,117 | — | — * | 7,409,117 | |
| Singapore | 26,516,858 | — | 99,296 | 26,616,154 | |
| Preferred Stock1 | 1,209,189 | — | — | 1,209,189 | |
| Other Investment Companies1 | 43,879,552 | — | — | 43,879,552 | |
| Futures Contracts2 | 17,840 | — | — | 17,840 | |
| Total | $1,382,690,043 | $— | $99,296 | $1,382,789,339 | |
| * | Level 3 amount shown includes securities determined to have no value at August 31, 2017. |
| 1 | As categorized in the complete schedule of Portfolio Holdings. |
| 2 | Futures contracts are valued at unrealized appreciation or depreciation. |
The fund's policy is to recognize transfers between Level 1, Level 2 and Level 3 as of the beginning of the fiscal year. There were no transfers between Level 1, Level 2 and Level 3 for the period ended August 31, 2017.
Schwab Fundamental Index ETFs | Semiannual Report
Schwab Fundamental International Small Company Index ETF
Statement of Assets and Liabilities
As of August 31, 2017; unaudited
| Assets |
| Investments in unaffiliated issuers, at value (cost $1,158,400,252) including securities on loan of $39,283,192 | | $1,341,530,806 |
| Collateral invested for securities on loan, at value (cost $41,240,693) | | 41,240,693 |
| Deposit with broker for futures contracts | | 234,500 |
| Foreign currency, at value (cost $1,221,886) | | 1,224,434 |
| Receivables: | | |
| Dividends | | 1,830,505 |
| Foreign tax reclaims | | 380,787 |
| Income from securities on loan | | 161,204 |
| Variation margin on futures contracts | + | 22,725 |
| Total assets | | 1,386,625,654 |
| Liabilities |
| Collateral held for securities on loan | | 41,240,693 |
| Payables: | | |
| Investments bought | | 2,481,220 |
| Investment adviser fees | + | 437,317 |
| Total liabilities | | 44,159,230 |
| Net Assets |
| Total assets | | 1,386,625,654 |
| Total liabilities | – | 44,159,230 |
| Net assets | | $1,342,466,424 |
| Net Assets by Source | | |
| Capital received from investors | | 1,155,002,144 |
| Net investment income not yet distributed | | 12,404,604 |
| Net realized capital losses | | (8,108,781) |
| Net unrealized capital appreciation | | 183,168,457 |
| Net Asset Value (NAV) |
| Net Assets | ÷ | Shares
Outstanding | = | NAV |
| $1,342,466,424 | | 39,700,000 | | $33.82 |
| | | | | |
Schwab Fundamental Index ETFs | Semiannual Report
Schwab Fundamental International Small Company Index ETF
Statement of Operations
For the period March 1, 2017 through August 31, 2017; unaudited
| Investment Income |
| Dividends (net of foreign withholding tax of $1,619,668) | | $16,256,133 |
| Securities on loan, net | + | 583,288 |
| Total investment income | | 16,839,421 |
| Expenses |
| Investment adviser fees | | 2,213,045 |
| Total expenses | – | 2,213,045 |
| Net investment income | | 14,626,376 |
| Realized and Unrealized Gains (Losses) |
| Net realized losses on investments (net of foreign capital gains tax of $3,963) | | (4,823,149) |
| Net realized gains on in-kind redemptions | | 13,369,978 |
| Net realized gains on futures contracts | | 554,738 |
| Net realized gains on foreign currency transactions | + | 149,791 |
| Net realized gains | | 9,251,358 |
| Net change in unrealized appreciation (depreciation) on investments | | 108,624,924 |
| Net change in unrealized appreciation (depreciation) on futures contracts | | 22,512 |
| Net change in unrealized appreciation (depreciation) on foreign currency translations | + | 12,333 |
| Net change in unrealized appreciation (depreciation) | + | 108,659,769 |
| Net realized and unrealized gains | | 117,911,127 |
| Increase in net assets resulting from operations | | $132,537,503 |
Schwab Fundamental Index ETFs | Semiannual Report
Schwab Fundamental International Small Company Index ETF
Statement of Changes in Net Assets
For the current and prior report periods
Figures for the current period are unaudited
| Operations | |
| | 3/1/17-8/31/17 | 3/1/16-2/28/17 |
| Net investment income | | $14,626,376 | $11,098,149 |
| Net realized gains (losses) | | 9,251,358 | (10,038,314) |
| Net change in unrealized appreciation (depreciation) | + | 108,659,769 | 109,298,861 |
| Increase in net assets resulting from operations | | 132,537,503 | 110,358,696 |
| Distributions to Shareholders | |
| Distributions from net investment income | | $— | ($13,315,200) |
| Transactions in Fund Shares | | | |
| | | 3/1/17-8/31/17 | 3/1/16-2/28/17 |
| | | SHARES | VALUE | SHARES | VALUE |
| Shares sold | | 13,300,000 | $424,696,839 | 14,100,000 | $403,432,348 |
| Shares redeemed | + | (2,500,001) | (81,516,821) | (500,000) | (13,394,058) |
| Net transactions in fund shares | | 10,799,999 | $343,180,018 | 13,600,000 | $390,038,290 |
| Shares Outstanding and Net Assets | | | |
| | | 3/1/17-8/31/17 | 3/1/16-2/28/17 |
| | | SHARES | NET ASSETS | SHARES | NET ASSETS |
| Beginning of period | | 28,900,001 | $866,748,903 | 15,300,001 | $379,667,117 |
| Total increase | + | 10,799,999 | 475,717,521 | 13,600,000 | 487,081,786 |
| End of period | | 39,700,000 | $1,342,466,424 | 28,900,001 | $866,748,903 |
| Net investment income not yet distributed/Distributions in excess of net investment income | | | $12,404,604 | | ($2,221,772) |
Schwab Fundamental Index ETFs | Semiannual Report
Schwab Fundamental Emerging Markets Large Company Index ETF
Financial Statements
Financial Highlights
| | 3/1/17–
8/31/17* | 3/1/16–
2/28/17 | 3/1/15–
2/29/16 | 3/1/14–
2/28/15 | 8/14/13 1–
2/28/14 | |
| Per-Share Data |
| Net asset value at beginning of period | $26.06 | $17.78 | $24.16 | $24.98 | $25.00 | |
| Income (loss) from investment operations: | | | | | | |
| Net investment income (loss) | 0.56 2 | 0.49 2 | 0.57 2 | 0.37 | 0.12 | |
| Net realized and unrealized gains (losses) | 2.12 | 8.18 | (6.58) | (0.87) | (0.00) 3 | |
| Total from investment operations | 2.68 | 8.67 | (6.01) | (0.50) | 0.12 | |
| Less distributions: | | | | | | |
| Distributions from net investment income | — | (0.39) | (0.37) | (0.32) | (0.14) | |
| Net asset value at end of period | $28.74 | $26.06 | $17.78 | $24.16 | $24.98 | |
| Total return | 10.28% 4 | 49.03% | (24.92%) | (1.98%) | 0.45% 4 | |
| Ratios/Supplemental Data |
| Ratios to average net assets: | | | | | | |
| Total expenses | 0.39% 5 | 0.46% | 0.46% | 0.46% | 0.46% 5 | |
| Net investment income (loss) | 4.17% 5 | 2.14% | 2.80% | 2.20% | 1.01% 5 | |
| Portfolio turnover rate6 | 8% 4 | 14% | 20% | 13% | 6% 4 | |
| Net assets, end of period (x 1,000) | $1,523,232 | $1,011,273 | $359,092 | $96,642 | $22,482 | |
| |
1
Commencement of operations.
2
Calculated based on the average shares outstanding during the period.
3
Per-share amount was less than $0.005.
4
Not annualized.
5
Annualized.
6
Portfolio turnover rate excludes securities received or delivered from processing of in-kind creations or redemptions.
Schwab Fundamental Index ETFs | Semiannual Report
Schwab Fundamental Emerging Markets Large Company Index ETF
Condensed Portfolio Holdings as of August 31, 2017 (Unaudited)
This section shows the fund's 50 largest portfolio holdings in unaffiliated issuers, any holdings exceeding 1% of the fund's net assets as of the report date, and any affiliated issuers. The remaining securities held by the fund are grouped as "Other Securities" in each category. You can request a complete schedule of portfolio holdings as of the report date, free of charge, by calling Schwab ETFs™ at 1-877-824-5615. This complete schedule, filed on the fund's Form N-CSR(S), is also available on the SEC's website at www.sec.gov.
In addition, the fund files its complete schedule of portfolio holdings with the SEC for the first and third quarters of each fiscal year on Form N-Q. The fund's Form N-Q is available on the SEC's website and may be viewed and copied at the SEC's Public Reference Room in Washington, D.C. Call 1-800-SEC-0330 for information on the operation of the Public Reference Room. The fund also makes available its complete schedule of portfolio holdings on a daily basis on the fund's website at www.schwabfunds.com/schwabetfs_prospectus.
| Security | Number
of Shares | % of Net
Assets | Value ($) |
| Common Stock 89.9% of net assets | |
| |
| Brazil 5.9% | |
| Ambev S.A. | 1,303,666 | 0.5 | 8,228,577 |
| Banco do Brasil S.A. | 1,000,807 | 0.6 | 9,764,902 |
| Petroleo Brasileiro S.A. * | 3,646,808 | 1.1 | 16,191,552 |
| Vale S.A. | 2,061,472 | 1.5 | 22,983,501 |
| Other Securities | | 2.2 | 32,206,850 |
| | | 5.9 | 89,375,382 |
| |
| Chile 0.6% | |
| Other Securities | | 0.6 | 9,417,121 |
| |
| China 17.4% | |
| Bank of China Ltd., H Shares | 36,962,224 | 1.3 | 19,457,655 |
| China Construction Bank Corp., H Shares | 44,439,398 | 2.6 | 38,951,794 |
| China Mobile Ltd. | 2,381,011 | 1.7 | 25,250,773 |
| China Petroleum & Chemical Corp., H Shares | 31,545,477 | 1.6 | 24,143,438 |
| China Unicom (Hong Kong) Ltd. * | 4,227,937 | 0.4 | 6,158,409 |
| CNOOC Ltd. | 12,316,657 | 1.0 | 14,730,038 |
| Industrial & Commercial Bank of China Ltd., H Shares | 32,906,062 | 1.6 | 24,638,185 |
| PetroChina Co., Ltd., H Shares | 17,232,381 | 0.7 | 11,009,066 |
| Tencent Holdings Ltd. | 136,133 | 0.4 | 5,722,615 |
| Other Securities | | 6.1 | 94,178,534 |
| | | 17.4 | 264,240,507 |
| |
| Colombia 0.5% | |
| Other Securities | | 0.5 | 6,778,645 |
| |
| Czech Republic 0.2% | |
| Other Securities | | 0.2 | 3,360,669 |
| |
| Greece 1.0% | |
| Other Securities | | 1.0 | 15,132,702 |
| |
| Hungary 0.5% | |
| Other Securities | | 0.5 | 8,004,680 |
| |
| Security | Number
of Shares | % of Net
Assets | Value ($) |
| India 4.7% | |
| Infosys Ltd. | 428,949 | 0.4 | 6,139,370 |
| Reliance Industries Ltd. GDR | 328,994 | 1.1 | 16,268,753 |
| Other Securities | | 3.2 | 48,887,545 |
| | | 4.7 | 71,295,668 |
| |
| Indonesia 1.3% | |
| Other Securities | | 1.3 | 20,483,764 |
| |
| Malaysia 2.0% | |
| Other Securities | | 2.0 | 29,745,039 |
| |
| Mexico 3.2% | |
| America Movil S.A.B. de C.V., Series L | 15,706,204 | 1.0 | 14,646,287 |
| Other Securities | | 2.2 | 34,739,010 |
| | | 3.2 | 49,385,297 |
| |
| Peru 0.1% | |
| Other Securities | | 0.1 | 1,992,294 |
| |
| Philippines 0.2% | |
| Other Securities | | 0.2 | 2,403,946 |
| |
| Poland 2.6% | |
| KGHM Polska Miedz S.A. | 207,610 | 0.5 | 7,326,250 |
| Polski Koncern Naftowy Orlen S.A. | 310,504 | 0.7 | 10,244,703 |
| Other Securities | | 1.4 | 22,587,059 |
| | | 2.6 | 40,158,012 |
| |
| Republic of Korea 18.1% | |
| Hyundai Mobis Co., Ltd. | 35,294 | 0.5 | 7,386,825 |
| Hyundai Motor Co. | 104,517 | 0.9 | 13,022,915 |
| KB Financial Group, Inc. | 123,496 | 0.4 | 6,067,469 |
| Kia Motors Corp. | 284,183 | 0.6 | 8,934,274 |
| Korea Electric Power Corp. | 166,021 | 0.4 | 6,316,336 |
| LG Chem Ltd. | 27,306 | 0.6 | 9,177,877 |
| LG Display Co., Ltd. | 266,490 | 0.5 | 7,361,798 |
| LG Electronics, Inc. | 133,775 | 0.6 | 9,668,910 |
| POSCO | 73,675 | 1.5 | 22,443,564 |
| Samsung Electronics Co., Ltd. | 38,964 | 5.3 | 80,028,932 |
| Shinhan Financial Group Co., Ltd. | 169,535 | 0.5 | 7,818,216 |
| SK Hynix, Inc. | 189,392 | 0.8 | 11,522,074 |
Schwab Fundamental Index ETFs | Semiannual Report
Schwab Fundamental Emerging Markets Large Company Index ETF
Condensed Portfolio Holdings as of August 31, 2017 (Unaudited) (continued)
| Security | Number
of Shares | % of Net
Assets | Value ($) |
| SK Innovation Co., Ltd. | 68,720 | 0.8 | 11,487,868 |
| Other Securities | | 4.7 | 74,704,744 |
| | | 18.1 | 275,941,802 |
| |
| Russia 10.1% | |
| Gazprom PJSC | 25,715,131 | 3.4 | 52,236,148 |
| LUKOIL PJSC | 729,810 | 2.4 | 36,952,325 |
| MMC Norilsk Nickel PJSC | 37,708 | 0.4 | 6,356,630 |
| Sberbank of Russia PJSC | 2,985,500 | 0.6 | 9,433,819 |
| Surgutneftegas OJSC | 33,531,917 | 1.0 | 15,589,525 |
| Tatneft PJSC | 1,131,969 | 0.5 | 7,562,703 |
| Other Securities | | 1.8 | 25,406,244 |
| | | 10.1 | 153,537,394 |
| |
| South Africa 5.9% | |
| MTN Group Ltd. | 1,710,761 | 1.1 | 17,009,551 |
| Sasol Ltd. | 525,032 | 1.0 | 15,829,932 |
| Standard Bank Group Ltd. | 600,822 | 0.5 | 7,739,614 |
| Other Securities | | 3.3 | 49,857,902 |
| | | 5.9 | 90,436,999 |
| |
| Taiwan 12.2% | |
| Hon Hai Precision Industry Co., Ltd. | 9,181,911 | 2.3 | 35,749,181 |
| Innolux Corp. | 15,435,000 | 0.5 | 7,518,291 |
| Taiwan Semiconductor Manufacturing Co., Ltd. | 3,990,352 | 1.9 | 28,626,237 |
| Other Securities | | 7.5 | 114,364,245 |
| | | 12.2 | 186,257,954 |
| |
| Thailand 1.6% | |
| PTT PCL NVDR | 743,600 | 0.6 | 8,935,293 |
| Other Securities | | 1.0 | 15,697,656 |
| | | 1.6 | 24,632,949 |
| |
| Turkey 1.7% | |
| Other Securities | | 1.7 | 25,209,304 |
| |
| United Arab Emirates 0.1% | |
| Other Securities | | 0.1 | 1,786,063 |
| Total Common Stock |
| (Cost $1,168,771,966) | | | 1,369,576,191 |
|
| Preferred Stock 9.7% of net assets | |
| |
| Brazil 7.1% | |
| Banco Bradesco S.A. | 1,350,052 | 0.9 | 14,408,221 |
| Itau Unibanco Holding S.A. | 1,713,782 | 1.4 | 21,977,500 |
| Security | Number
of Shares | % of Net
Assets | Value ($) |
| Petroleo Brasileiro S.A. * | 4,503,287 | 1.3 | 19,536,261 |
| Vale S.A. | 2,409,938 | 1.6 | 24,946,108 |
| Other Securities | | 1.9 | 26,396,214 |
| | | 7.1 | 107,264,304 |
| |
| Colombia 0.1% | |
| Other Securities | | 0.1 | 2,115,631 |
| |
| Republic of Korea 1.1% | |
| Samsung Electronics Co., Ltd. | 7,070 | 0.8 | 11,818,863 |
| Other Securities | | 0.3 | 5,273,504 |
| | | 1.1 | 17,092,367 |
| |
| Russia 1.4% | |
| AK Transneft OAO | 5,524 | 1.1 | 16,954,851 |
| Other Securities | | 0.3 | 4,720,247 |
| | | 1.4 | 21,675,098 |
| Total Preferred Stock |
| (Cost $99,347,013) | | | 148,147,400 |
|
| Other Investment Company 0.2% of net assets | |
| |
| United States 0.2% | |
| Money Market Fund 0.2% | |
| Other Securities | | 0.2 | 2,812,293 |
| Total Other Investment Company |
| (Cost $2,812,293) | | | 2,812,293 |
| | Number of
Contracts | Notional
Amount
($) | Current Value/
Unrealized
Appreciation
($) |
| Futures Contracts | |
| Long | |
| MSCI Emerging Markets Index, e-mini, expires 09/15/17 | 89 | 4,833,590 | 66,696 |
For the following notes, please refer to the complete schedule of portfolio holdings.
| * | Non-income producing security. |
| (a) | The rate shown is the 7-day yield. |
| | |
| ADR — | American Depositary Receipt |
| GDR — | Global Depositary Receipt |
| NVDR — | Non-Voting Depositary Receipt |
Schwab Fundamental Index ETFs | Semiannual Report
Schwab Fundamental Emerging Markets Large Company Index ETF
Condensed Portfolio Holdings as of August 31, 2017 (Unaudited) (continued)
The following is a summary of the inputs used to value the fund’s investments as of August 31, 2017 (see financial note 2(a) for additional information):
| Description | Quoted Prices in
Active Markets for
Identical Assets
(Level 1) | Other Significant
Observable Inputs
(Level 2) | Significant
Unobservable Inputs
(Level 3) | Total | |
| Assets | | | | | |
| Common Stock1 | $1,369,576,191 | $— | $— | $1,369,576,191 | |
| Preferred Stock1 | 148,147,400 | — | — | 148,147,400 | |
| Other Investment Company1 | 2,812,293 | — | — | 2,812,293 | |
| Futures Contracts2 | 66,696 | — | — | 66,696 | |
| Total | $1,520,602,580 | $— | $— | $1,520,602,580 | |
| 1 | As categorized in the complete schedule of Portfolio Holdings. |
| 2 | Futures contracts are valued at unrealized appreciation or depreciation. |
The fund's policy is to recognize transfers between Level 1, Level 2 and Level 3 as of the beginning of the fiscal year. There were no transfers between Level 1, Level 2 and Level 3 for the period ended August 31, 2017.
Schwab Fundamental Index ETFs | Semiannual Report
Schwab Fundamental Emerging Markets Large Company Index ETF
Statement of Assets and Liabilities
As of August 31, 2017; unaudited
| Assets |
| Investments in unaffiliated issuers, at value (cost $1,270,931,272) | | $1,520,535,884 |
| Deposit with broker for futures contracts | | 252,000 |
| Foreign currency, at value (cost $660,417) | | 660,051 |
| Receivables: | | |
| Dividends | | 2,889,068 |
| Foreign tax reclaims | | 2,209 |
| Variation margin on futures contracts | | 1,780 |
| Income from securities on loan | + | 23 |
| Total assets | | 1,524,341,015 |
| Liabilities |
| Payables: | | |
| Investment adviser fees | | 483,707 |
| Foreign capital gains tax | + | 624,921 |
| Total liabilities | | 1,108,628 |
| Net Assets |
| Total assets | | 1,524,341,015 |
| Total liabilities | – | 1,108,628 |
| Net assets | | $1,523,232,387 |
| Net Assets by Source | | |
| Capital received from investors | | 1,267,532,198 |
| Net investment income not yet distributed | | 27,539,881 |
| Net realized capital losses | | (20,893,470) |
| Net unrealized capital appreciation | | 249,053,778 |
| Net Asset Value (NAV) |
| Net Assets | ÷ | Shares
Outstanding | = | NAV |
| $1,523,232,387 | | 53,000,000 | | $28.74 |
| | | | | |
Schwab Fundamental Index ETFs | Semiannual Report
Schwab Fundamental Emerging Markets Large Company Index ETF
Statement of Operations
For the period March 1, 2017 through August 31, 2017; unaudited
| Investment Income |
| Dividends (net of foreign withholding tax of $4,113,466) | | $28,759,839 |
| Securities on loan, net | + | 9,367 |
| Total investment income | | 28,769,206 |
| Expenses |
| Investment adviser fees | | 2,459,444 |
| Total expenses | – | 2,459,444 |
| Net investment income | | 26,309,762 |
| Realized and Unrealized Gains (Losses) |
| Net realized losses on investments | | (1,392,167) |
| Net realized gains on futures contracts | | 980,016 |
| Net realized losses on foreign currency transactions | + | (67,357) |
| Net realized losses | | (479,508) |
| Net change in unrealized appreciation (depreciation) on investments (net of change in foreign capital gains tax of $128,327) | | 104,459,455 |
| Net change in unrealized appreciation (depreciation) on futures contracts | | 72,942 |
| Net change in unrealized appreciation (depreciation) on foreign currency translations | + | (151,070) |
| Net change in unrealized appreciation (depreciation) | + | 104,381,327 |
| Net realized and unrealized gains | | 103,901,819 |
| Increase in net assets resulting from operations | | $130,211,581 |
Schwab Fundamental Index ETFs | Semiannual Report
Schwab Fundamental Emerging Markets Large Company Index ETF
Statement of Changes in Net Assets
For the current and prior report periods
Figures for the current period are unaudited
| Operations | |
| | 3/1/17-8/31/17 | 3/1/16-2/28/17 |
| Net investment income | | $26,309,762 | $13,726,905 |
| Net realized losses | | (479,508) | (9,584,840) |
| Net change in unrealized appreciation (depreciation) | + | 104,381,327 | 226,124,106 |
| Increase in net assets resulting from operations | | 130,211,581 | 230,266,171 |
| Distributions to Shareholders | |
| Distributions from net investment income | | $— | ($12,995,400) |
| Transactions in Fund Shares | | | |
| | | 3/1/17-8/31/17 | 3/1/16-2/28/17 |
| | | SHARES | VALUE | SHARES | VALUE |
| Shares sold | | 14,200,000 | $381,747,441 | 18,600,000 | $434,910,865 |
| Shares redeemed | + | (1) | (26) | — | — |
| Net transactions in fund shares | | 14,199,999 | $381,747,415 | 18,600,000 | $434,910,865 |
| Shares Outstanding and Net Assets | | | |
| | | 3/1/17-8/31/17 | 3/1/16-2/28/17 |
| | | SHARES | NET ASSETS | SHARES | NET ASSETS |
| Beginning of period | | 38,800,001 | $1,011,273,391 | 20,200,001 | $359,091,755 |
| Total increase | + | 14,199,999 | 511,958,996 | 18,600,000 | 652,181,636 |
| End of period | | 53,000,000 | $1,523,232,387 | 38,800,001 | $1,011,273,391 |
| Net investment income not yet distributed | | | $27,539,881 | | $1,230,119 |
Schwab Fundamental Index ETFs | Semiannual Report
Schwab Fundamental Index ETFs
Financial Notes, unaudited
1. Business Structure of the Funds:
Each of the funds in this report is a series of Schwab Strategic Trust (the trust), a no-load, open-end management investment company. The trust is organized as a Delaware statutory trust and is registered under the Investment Company Act of 1940, as amended (the 1940 Act). The list below shows all the operational funds in the trust as of the end of the period, including the funds discussed in this report, which are highlighted:
| SCHWAB STRATEGIC TRUST (ORGANIZED JANUARY 27, 2009) |
| Schwab Fundamental U.S. Broad Market Index ETF | Schwab U.S. Small-Cap ETF™ |
| Schwab Fundamental U.S. Large Company Index ETF | Schwab U.S. Dividend Equity ETF™ |
| Schwab Fundamental U.S. Small Company Index ETF | Schwab U.S. REIT ETF™ |
| Schwab Fundamental International Large Company Index ETF | Schwab International Equity ETF™ |
| Schwab Fundamental International Small Company Index ETF | Schwab International Small-Cap Equity ETF™ |
| Schwab Fundamental Emerging Markets Large Company Index ETF | Schwab Emerging Markets Equity ETF™ |
| Schwab U.S. Broad Market ETF™ | Schwab U.S. TIPS ETF™ |
| Schwab U.S. Large-Cap ETF™ | Schwab Short-Term U.S. Treasury ETF™ |
| Schwab U.S. Large-Cap Growth ETF™ | Schwab Intermediate-Term U.S. Treasury ETF™ |
| Schwab U.S. Large-Cap Value ETF™ | Schwab U.S. Aggregate Bond ETF™ |
| Schwab U.S. Mid-Cap ETF™ | |
The funds issue and redeem shares at their net asset value per share (NAV) only in large blocks of shares, typically 50,000 shares or more (Creation Units). These transactions are usually in exchange for a basket of securities and/or an amount of cash. As a practical matter, only institutions or large investors purchase or redeem Creation Units. Except when aggregated in Creation Units, shares of the funds are not redeemable securities.
Individual shares of the funds trade on national securities exchanges and elsewhere during the trading day and can only be bought and sold at market prices throughout the trading day through a broker-dealer. Because fund shares trade at market prices rather than NAV, shares may trade at a price greater than NAV (premium) or less than NAV (discount).
Each fund maintains its own account for purposes of holding assets and accounting, and is considered a separate entity for tax purposes. Within its account, each fund may also keep certain assets in segregated accounts, as required by securities law.
2. Significant Accounting Policies:
The following is a summary of the significant accounting policies the funds use in their preparation of financial statements. The funds follow the investment company accounting and reporting guidance of the Financial Accounting Standards Board Accounting Standard Codification Topic 946 Financial Services — Investment Companies. The accounting policies are in conformity with accounting principles generally accepted in the United States of America (GAAP).
The funds may invest in certain other investment companies (underlying funds). For specific investments in underlying funds, please refer to the complete schedule of portfolio holdings on Form N-CSR(S) for this reporting period, which is filed with the U.S. Securities and Exchange Commission (SEC). For more information about the underlying funds’ operations and policies, please refer to those funds’ semiannual and annual reports, which are filed with the SEC.
Effective August 1, 2017, the funds adopted disclosure requirement changes for SEC Regulation S-X. The adopted changes are reflected throughout this report.
(a) Security Valuation:
Under procedures approved by the funds’ Board of Trustees (the Board), the investment adviser has formed a Pricing Committee to administer the pricing and valuation of portfolio securities and other assets and to ensure that prices used for internal purposes or provided by third parties reasonably reflect fair market value. Among other things, these procedures allow the funds to utilize independent pricing services, quotations from securities and financial instrument dealers and other market sources to determine fair value.
The funds value the securities in their portfolios every business day. The funds use the following policies to value various types of securities:
Schwab Fundamental Index ETFs | Semiannual Report
Schwab Fundamental Index ETFs
Financial Notes, unaudited (continued)
2. Significant Accounting Policies (continued):
• Securities traded on an exchange or over-the-counter: Traded securities are valued at the closing value for the day, or, on days when no closing value has been reported, at the mean of the most recent bid and ask quotes. Securities that are primarily traded on foreign exchanges are valued at the official closing price or the last sales price on the exchange where the securities are principally traded with these values then translated into U.S. dollars at the current exchange rate, unless these securities are fair valued as discussed below.
• Securities for which no quoted value is available: The Board has adopted procedures to fair value each fund’s securities when market prices are not “readily available” or are unreliable. For example, a fund may fair value a security when it is de-listed or its trading is halted or suspended; when a security’s primary pricing source is unable or unwilling to provide a price; or when a security’s primary trading market is closed during regular market hours. Each fund makes fair value determinations in good faith in accordance with the fund’s valuation procedures. The Pricing Committee considers a number of factors, including unobservable market inputs when arriving at fair value. The Pricing Committee may employ techniques such as the review of related or comparable assets or liabilities, related market activities, recent transactions, market multiples, book values, transactional back-testing, disposition analysis and other relevant information. The Pricing Committee regularly reviews these inputs and assumptions to calibrate the valuations. Due to the subjective and variable nature of fair value pricing, there can be no assurance that a fund could obtain the fair value assigned to the security upon the sale of such security. The Board convenes on a regular basis to review fair value determinations made by the funds pursuant to the valuation procedures.
• Futures contracts: Futures contracts are valued at their settlement prices as of the close of their exchanges.
• Underlying funds: Mutual funds are valued at their respective NAVs.
In accordance with the authoritative guidance on fair value measurements and disclosures under GAAP, the funds disclose the fair value of their investments in a hierarchy that prioritizes the significant inputs to valuation techniques used to measure the fair value. The hierarchy gives the highest priority to valuations based upon unadjusted quoted prices in active markets for identical assets or liabilities (Level 1 measurements) and the lowest priority to valuations based upon unobservable inputs that are significant to the valuation (Level 3 measurements). If inputs used to measure the financial instruments fall within different levels of the hierarchy, the categorization is based on the lowest level input that is significant to the valuation. If the funds determine that either the volume and/or level of activity for an asset or liability has significantly decreased (from normal conditions for that asset or liability) or price quotations or observable inputs are not associated with orderly transactions, increased analysis and management judgment will be required to estimate fair value.
The three levels of the fair value hierarchy are as follows:
• Level 1—quoted prices in active markets for identical securities—Investments whose values are based on quoted market prices in active markets, and whose values are therefore classified as Level 1 prices, include active listed equities and futures contracts. Investments in mutual funds are valued daily at their NAVs, which are classified as Level 1 prices, without consideration to the classification level of the specific investments held by an underlying fund.
• Level 2—other significant observable inputs (including quoted prices for similar securities, interest rates, prepayment speeds, credit risk, etc.)—Investments that trade in markets that are not considered to be active, but whose values are based on quoted market prices, dealer quotations or valuations provided by alternative pricing sources supported by observable inputs are classified as Level 2 prices. These generally include U.S. government and sovereign obligations, most government agency securities, investment-grade corporate bonds, certain mortgage products, less liquid listed equities, and state, municipal and provincial obligations.
• Level 3—significant unobservable inputs (including the funds’ own assumptions in determining the fair value of investments)—Investments whose values are classified as Level 3 prices have significant unobservable inputs, as they may trade infrequently or not at all. When observable prices are not available for these securities, the funds use one or more valuation techniques for which sufficient and reliable data is available. The inputs used by the funds in estimating the value of Level 3 prices may include the original transaction price, quoted prices for similar securities or assets in active markets, completed or pending third-party transactions in the underlying investment or comparable issuers, and changes in financial ratios or cash flows. Level 3 prices may also be adjusted to reflect illiquidity and/or non-transferability, with the amount of such discount estimated by the funds in the absence of market information. Assumptions used by the funds due to the lack of observable inputs may significantly impact the resulting fair value and therefore the funds’ results of operations.
The inputs or methodology used for valuing securities are not necessarily an indication of the risk associated with investing in those securities.
Schwab Fundamental Index ETFs | Semiannual Report
Schwab Fundamental Index ETFs
Financial Notes, unaudited (continued)
2. Significant Accounting Policies (continued):
The levels associated with valuing the funds' investments as of August 31, 2017 are disclosed in the Condensed Portfolio Holdings.
(b) Accounting Policies for certain Portfolio Investments (if held):
Futures Contracts: Futures contracts are instruments that represent an agreement between two parties that obligates one party to buy, and the other party to sell, specific instruments at an agreed upon price on a stipulated future date. A fund must give the broker a deposit of cash and/or securities (initial margin) whenever it enters into a futures contract. The amount of the deposit may vary from one contract to another. Subsequent payments (variation margin) are made or received by a fund depending on the daily fluctuations in the value of the futures contract and are accounted for as unrealized appreciation or depreciation until the contract is closed, at which time the gains or losses are realized. Futures contracts are traded publicly on exchanges, and their market value may change daily.
Securities Lending: Under the trust’s Securities Lending Program, a fund (lender) may make short-term loans of its securities to another party (borrower) to generate additional revenue for the fund. The borrower pledges collateral in the form of cash, securities issued or fully guaranteed by the U.S. government or foreign governments, or letters of credit issued by a bank. Collateral at the individual loan level is required to be maintained on a daily marked-to-market basis in an amount at least equal to the current value of the securities loaned. The lending agent provides a fund with indemnification against borrower default (the borrower fails to return the security on loan) reducing the risk of loss as a result of default. The cash collateral of securities loaned is currently invested in money market portfolios operating under Rule 2a-7 of the 1940 Act. Each fund bears the risk of loss with respect to the investment of cash collateral. The terms of the securities lending agreement allow the funds or the lending agent to terminate any loan at any given time and the securities must be returned within the earlier of the standard trade settlement period or the specified time period under the relevant securities lending agreement. Securities lending income, as disclosed in each fund’s Statement of Operations, if applicable, represents the income earned from the investment of the cash collateral plus any fees paid by borrowers, less the fees paid to the lending agent and broker rebates which are subject to adjustments pursuant to the securities lending agreement. On loans not collateralized by cash, a fee is received from the borrower, and is allocated between a fund and the lending agent. The aggregate market value of securities loaned will not at any time exceed one-third of the total assets of a fund, including collateral received from the loan. Total costs and expenses, including lending agent fees and broker rebates, associated with securities lending activities under the trust’s Securities Lending Program paid to the unaffiliated lending agents start at 10% of gross lending revenue, with subsequent breakpoints to a low of 7.5%.
As of August 31, 2017, the funds had securities on loan, all of which were classified as common stocks. The value of the securities on loan and the related collateral as of August 31, 2017, if any, are disclosed in each fund's Condensed Portfolio Holdings. The value of the securities on loan and the investment of cash collateral are also disclosed in each fund's Statement of Assets and Liabilities.
(c) Security Transactions:
Security transactions are recorded as of the date the order to buy or sell the security is executed. Realized gains and losses from security transactions are based on the identified costs of the securities involved.
Assets and liabilities denominated in foreign currencies are reported in U.S. dollars. For assets and liabilities held on a given date, the dollar value is based on market exchange rates in effect on that date. Transactions involving foreign currencies, including purchases, sales, income receipts and expense payments, are calculated using exchange rates in effect on the transaction date. Realized foreign exchange gains or losses arise from sales of foreign currencies, currency gains or losses realized between the trade and settlement dates on securities transactions and the difference between the recorded amounts of dividends, interest, and foreign withholding taxes and the U.S. dollar equivalent of the amounts actually received or paid. Net unrealized foreign exchange appreciation or depreciation arises from changes in foreign exchange rates on foreign denominated assets and liabilities other than investments in securities held at the end of the reporting period. These realized and unrealized foreign exchange gains or losses are reported in foreign currency transactions or translations on the Statement of Operations. The funds do not isolate the portion of the fluctuations on investments resulting from changes in foreign currency exchange rates from the fluctuations in market prices of investments held. Such fluctuations are included with the net realized and unrealized gain or loss from investments.
Gains realized by the funds on the sale of securities in certain foreign countries may be subject to non-U.S. taxes. In those instances, the funds record a liability based on unrealized gains to provide for potential non-U.S. taxes payable upon the sale of these securities.
When a fund closes out a futures contract position, it calculates the difference between the value of the position at the beginning and at the end of the contract, and records a realized gain or loss accordingly.
Schwab Fundamental Index ETFs | Semiannual Report
Schwab Fundamental Index ETFs
Financial Notes, unaudited (continued)
2. Significant Accounting Policies (continued):
(d) Investment Income:
Interest income is recorded as it accrues. Dividends and distributions from portfolio securities and underlying funds are recorded on the date they are effective (the ex-dividend date), although the funds record certain foreign security dividends on the day they learn of the ex-dividend date. Any distributions from underlying funds are recorded in accordance with the character of the distributions as designated by the underlying funds.
Income received from foreign sources may result in withholding tax. Withholding taxes are accrued at the same time as the related income if the tax rate is fixed and known, unless a tax withheld is reclaimable from the local tax authorities in which case it is recorded as receivable. If the tax rate is not known or estimable, such expense or reclaim receivable is recorded when the net proceeds are received.
(e) Expenses:
Pursuant to the Amended and Restated Investment Advisory Agreement (Advisory Agreement) between Charles Schwab Investment Management, Inc. (CSIM or the investment adviser) and the trust, the investment adviser will pay the operating expenses of each fund, excluding taxes, any brokerage expenses, and extraordinary or non-routine expenses. Taxes, any brokerage expenses and extraordinary or non-routine expenses that are specific to a fund are charged directly to the fund. Prior to March 1, 2017, under the previous investment advisory agreement, the funds were responsible for interest expenses.
(f) Distributions to Shareholders:
Schwab Fundamental U.S. Broad Market Index ETF, Schwab Fundamental U.S. Large Company Index ETF, and Schwab Fundamental U.S. Small Company Index ETF generally make distributions from net investment income, if any, quarterly. Schwab Fundamental International Large Company Index ETF, Schwab Fundamental International Small Company Index ETF, and Schwab Fundamental Emerging Markets Large Company Index ETF generally make distributions from net investment income, if any, annually. All funds generally make distributions from net realized capital gains, if any, once a year.
(g) Accounting Estimates:
The accounting policies described in this report conform to GAAP. Notwithstanding this, shareholders should understand that in order to follow these principles, fund management has to make estimates and assumptions that affect the information reported in the financial statements. It’s possible that once the results are known, they may turn out to be different from these estimates and these differences may be material.
(h) Federal Income Taxes:
The funds intend to meet federal income and excise tax requirements for regulated investment companies under subchapter M of the Internal Revenue Code, as amended. Accordingly, the funds distribute substantially all of their net investment income and net realized capital gains, if any, to their respective shareholders each year. As long as a fund meets the tax requirements, it is not required to pay federal income tax.
(i) Foreign Taxes:
The funds may be subject to foreign taxes (a portion of which may be reclaimable) on income, corporate events, foreign currency exchanges and capital gains on investments. All foreign taxes are recorded in accordance with the applicable foreign tax regulations and rates that exist in foreign markets in which the funds invest. These foreign taxes, if any, are paid by the funds and are disclosed in the Statement of Operations. Foreign taxes payable as of August 31, 2017, if any, are reflected in each fund's Statement of Assets and Liabilities.
(j) Indemnification:
Under the funds’ organizational documents, the officers and trustees are indemnified against certain liabilities arising out of the performance of their duties to the funds. In addition, in the normal course of business the funds enter into contracts with their vendors and others that provide general indemnifications. The funds’ maximum exposure under these arrangements is unknown as this would involve future claims that may be made against the funds. However, based on experience, the funds expect the risk of loss attributable to these arrangements to be remote.
Schwab Fundamental Index ETFs | Semiannual Report
Schwab Fundamental Index ETFs
Financial Notes, unaudited (continued)
3. Risk Factors:
Investing in the funds may involve certain risks, as discussed in the funds’ prospectus, including, but not limited to, those described below. Any of these risks could cause an investor to lose money.
Market Risk. Financial markets rise and fall in response to a variety of factors, sometimes rapidly and unpredictably. As with any investment whose performance is tied to these markets, the value of an investment in a fund will fluctuate, which means that the investors could lose money over short or long periods.
Investment Style Risk. The funds are not actively managed. Therefore, each fund follows the securities included in its respective index during upturns as well as downturns. Because of their indexing strategies, the funds do not take steps to reduce market exposure or to lessen the effects of a declining market. In addition, because of the funds' expenses, the funds' performance may be below that of their respective index.
Equity Risk. The prices of equity securities rise and fall daily. These price movements may result from factors affecting individual companies, industries or the securities market as a whole. In addition, equity markets tend to move in cycles which may cause stock prices to fall over short or extended periods of time.
Market Capitalization Risk. Securities issued by companies of different market capitalizations tend to go in and out of favor based on market and economic conditions. During a period when securities of a particular market capitalization fall behind other types of investments, a fund’s performance could be impacted.
Large-Cap Company Risk. Certain funds invest in large-cap company stocks. Large-cap companies are generally more mature and the securities issued by these companies may not be able to reach the same levels of growth as the securities issued by small- or mid-cap companies.
Mid-Cap Company Risk. Certain funds invest in mid-cap company stocks. Mid-cap companies may be more vulnerable to adverse business or economic events than larger, more established companies and the value of securities issued by these companies may move sharply.
Small-Cap Company Risk. Certain funds invest in small-cap company stocks. Securities issued by small-cap companies may be riskier than those issued by larger companies, and their prices may move sharply, especially during market upturns and downturns.
Foreign Investment Risk. A fund’s investments in securities of foreign issuers may involve certain risks that are greater than those associated with investments in securities of U.S. issuers. These include risks of adverse changes in foreign economic, political, regulatory and other conditions; changes in currency exchange rates or exchange control regulations (including limitations on currency movements and exchanges); the imposition of economic sanctions or other government restrictions; differing accounting, auditing, financial reporting and legal standards and practices; differing securities market structures; and higher transaction costs. These risks may negatively impact the value or liquidity of a fund's investments, and could impair the fund's ability to meet its investment objective or invest in accordance with its investment strategy. There is a risk that investments in securities denominated in, and/or receiving revenues in, foreign currencies will decline in value relative to the U.S. dollar. Foreign securities also include American Depositary receipts (ADRs), Global Depositary receipts (GDRs) and European Depositary receipts (EDRs) which may be less liquid than the underlying shares in their primary trading market and GDRs, many of which are issued by companies in emerging markets, may be more volatile. To the extent the fund’s investments in a single country or a limited number of countries represent a large percentage of the fund’s assets, a fund’s performance may be adversely affected by the economic, political, regulatory and social conditions in those countries, and the fund’s price may be more volatile than the price of a fund that is geographically diversified.
Emerging Markets Risk. Certain funds invest in emerging markets. Emerging market countries may be more likely to experience political turmoil or rapid changes in market or economic conditions than more developed countries. Emerging market countries often have less uniformity in accounting and reporting requirements and greater risk associated with the custody of securities. In addition, the financial stability of issuers (including governments) in emerging market countries may be more precarious than in developed countries. As a result, there may be an increased risk of liquidity and price volatility associated with a fund’s investments in emerging market countries, which may be magnified by currency fluctuations relative to the U.S. dollar and, at times, it may be difficult to value such investments.
Sampling Index Tracking Risk. Certain funds may not fully replicate the index and may hold securities not included in the index. As a result, a fund is subject to the risk that the investment adviser’s investment management strategy, the implementation of which is subject to a number of constraints, may not produce the intended results. Because certain funds utilize a sampling approach they may not track the return of their respective index as well as they would if the funds purchased all of the securities in their respective index.
Schwab Fundamental Index ETFs | Semiannual Report
Schwab Fundamental Index ETFs
Financial Notes, unaudited (continued)
3. Risk Factors (continued):
Tracking Error Risk. As index funds, each fund seeks to track the performance of its respective index, although it may not be successful in doing so. The divergence between the performance of a fund and the index, positive or negative, is called “tracking error.” Tracking error can be caused by many factors and it may be significant.
Derivatives Risk. Each fund may use derivatives to enhance returns or hedge against market declines. Examples of derivatives are options, futures, options on futures and swaps. An option is the right to buy or sell an instrument at a specific price before a specific date. A future is an agreement to buy or sell a financial instrument at a specific price on a specific day. A swap is an agreement whereby two parties agree to exchange payment streams calculated in relation to a rate, index, instrument or certain securities and a predetermined amount. A fund's use of derivatives that are subject to regulation by the Commodity Futures Trading Commission (CFTC) could cause the fund to become a commodity pool, which would require the fund to comply with certain CFTC rules.
A fund’s use of derivative instruments involves risks different from, or possibly greater than, the risks associated with investing directly in securities and other traditional investments. Certain of these risks, such as liquidity risk and market risk, are discussed elsewhere in this section. The fund’s use of derivatives is also subject to lack of availability risk, credit risk, leverage risk, valuation risk, correlation risk and tax risk. Lack of availability risk is the risk that suitable derivative transactions may not be available in all circumstances for risk management or other purposes. Credit risk is the risk that the counterparty to a derivatives transaction may not fulfill its obligations. Leverage risk is the risk that a small percentage of assets invested in derivatives can have a disproportionately large impact on the fund. Valuation risk is the risk that a particular derivative may be valued incorrectly. Correlation risk is the risk that changes in the value of the derivative may not correlate perfectly with the underlying asset, rate or index. Tax risk is the risk that the use of derivatives may cause the fund to realize higher amounts of short-term capital gains. A fund's use of derivatives could reduce the fund's performance, increase the fund's volatility, and could cause the fund to lose more than the initial amount invested.
Liquidity Risk. A fund may be unable to sell certain securities, such as illiquid securities, readily at a favorable time or price, or a fund may have to sell them at a loss.
Securities Lending Risk. Securities lending involves the risk of loss of rights in, or delay in recovery of, the loaned securities if the borrower fails to return the security loaned or becomes insolvent.
Concentration Risk. To the extent that a fund's or an index's portfolio is concentrated in the securities of issuers in a particular market, industry, group of industries, sector or asset class, the fund may be adversely affected by the performance of those securities, may be subject to increased price volatility and may be more vulnerable to adverse economic, market, political or regulatory occurrences affecting that market, industry, group of industries, sector or asset class.
Market Trading Risk. Although fund shares are listed on national securities exchanges, there can be no assurance that an active trading market for fund shares will develop or be maintained. If an active market is not maintained, investors may find it difficult to buy or sell fund shares.
Shares of the Fund May Trade at Prices Other Than NAV. Fund shares may be bought and sold in the secondary market at market prices. Although it is expected that the market price of the shares of a fund will approximate the fund’s NAV, there may be times when the market price and the NAV vary significantly. An investor may pay more than NAV when buying shares of a fund in the secondary market, and an investor may receive less than NAV when selling those shares in the secondary market. The market price of the fund shares may deviate, sometimes significantly, from NAV during periods of market volatility or as a result of other factors impacting foreign securities, including liquidity, irregular trading activity and timing differences between foreign markets where securities trade and the secondary market where fund shares are sold.
Please refer to the funds’ prospectus for a more complete description of the principal risks of investing in the funds.
4. Affiliates and Affiliated Transactions:
Investment Adviser
CSIM, a wholly owned subsidiary of The Charles Schwab Corporation, serves as each fund’s investment adviser pursuant to an Advisory Agreement between CSIM and the trust.
Schwab Fundamental Index ETFs | Semiannual Report
Schwab Fundamental Index ETFs
Financial Notes, unaudited (continued)
4. Affiliates and Affiliated Transactions (continued):
For its advisory services to the funds, CSIM is entitled to receive an annual fee, payable monthly, based on a percentage of each fund’s average daily net assets as follows:
Schwab
Fundamental
U.S. Broad
Market
Index ETF | Schwab
Fundamental
U.S. Large
Company
Index ETF | Schwab
Fundamental
U.S. Small
Company
Index ETF | Schwab
Fundamental
International
Large
Company
Index ETF | Schwab
Fundamental
International
Small
Company
Index ETF | Schwab
Fundamental
Emerging
Markets Large
Company
Index ETF |
| 0.25% | 0.25% | 0.25% | 0.25% | 0.39% | 0.39% |
Interfund Transactions
The funds may engage in direct transactions with certain other Schwab funds when practical. When one fund is seeking to sell a security that another is seeking to buy, an interfund transaction can allow both funds to benefit by reducing transaction costs. This practice is limited to funds that share the same investment adviser, trustees and/or officers. For the period ended August 31, 2017, each fund's total aggregate security transactions with other Schwab funds as well as any realized gains (losses) were as follows:
| | Total Aggregate Transactions | Realized Gains (Losses) |
| Schwab Fundamental U.S. Broad Market Index ETF | $1,704,665 | ($482,171) |
| Schwab Fundamental U.S. Large Company Index ETF | 47,052,920 | (4,043,894) |
| Schwab Fundamental U.S. Small Company Index ETF | 17,489,052 | (1,864,177) |
| Schwab Fundamental International Large Company Index ETF | 32,727,359 | (561,487) |
| Schwab Fundamental International Small Company Index ETF | 4,280,788 | (747,564) |
| Schwab Fundamental Emerging Markets Large Company Index ETF | 283,282 | (94,028) |
Interfund Borrowing and Lending
Pursuant to an exemptive order issued by the SEC, the funds may enter into interfund borrowing and lending transactions with other funds in the Fund Complex (for definition refer to Trustees and Officers section). All loans are for temporary or emergency purposes and the interest rate to be charged will be the average of the overnight repurchase agreement rate and the short-term bank loan rate. All loans are subject to numerous conditions designed to ensure fair and equitable treatment of all participating funds/portfolios. The interfund lending facility is subject to the oversight and periodic review of the Board. The funds had no interfund borrowing or lending activity during the period.
5. Other Service Providers:
SEI Investments Distribution Co. is the principal underwriter and distributor of shares of the funds.
State Street Bank and Trust Company (State Street) serves as the funds’ transfer agent. As part of these services, the transfer agent maintains records pertaining to the sale, redemption and transfer of the funds’ shares.
State Street also serves as custodian and accountant for the funds. The custodian is responsible for the daily safekeeping of securities and cash held by the funds. The funds’ accountant maintains all books and records related to the funds’ transactions.
6. Board of Trustees:
The Board may include people who are officers and/or directors of CSIM or its affiliates. Federal securities law limits the percentage of such “interested persons” who may serve on a trust’s board, and the trust was in compliance with these limitations throughout the report period. The trust does not pay any interested or non-interested trustees (independent trustees). The independent trustees are paid by CSIM. For information regarding the trustees, please refer to the Trustees and Officers table at the end of this report.
Schwab Fundamental Index ETFs | Semiannual Report
Schwab Fundamental Index ETFs
Financial Notes, unaudited (continued)
7. Borrowing from Banks:
During the period, the funds were participants with other U.S. registered investment companies managed by CSIM in a joint, syndicated, committed $555 million line of credit (the Credit Facility). Under the terms of the Credit Facility, in addition to the interest charged on any borrowings by a fund, each fund paid a commitment fee of 0.15% per annum on its proportionate share of the unused portion of the Credit Facility. Effective March 1, 2017, where applicable, CSIM paid the commitment fee and any interest expense charged on any borrowings by a fund, since these expenses are now included in the advisory fee. There were no borrowings from the line of credit during the period.
The funds also have access to custodian overdraft facilities. A fund may have utilized the overdraft facility and incurred an interest expense. Since March 1, 2017, where applicable, CSIM paid any interest expense charged. The interest expense is determined based on a negotiated rate above the Federal Funds Rate.
8. Derivatives:
Certain funds entered into equity index futures contracts during the report period. The funds invested in futures contracts to equitize available cash. The current value and variation margin for futures contracts held at August 31, 2017 are presented on the Condensed Portfolio Holdings and Statement of Assets and Liabilities, respectively. The net realized and change in unrealized gains (losses) on futures contracts are presented on the Statement of Operations. Refer to financial note 2(b) for the funds’ accounting policies with respect to futures contracts and financial note 3 for disclosures concerning the risks of investing in futures contracts. During the period ended August 31, 2017, the month-end average notional amounts of futures contracts held by the funds and the month-end average number of contracts held were as follows:
| | Notional Amounts | Number of Contracts |
| Schwab Fundamental U.S. Broad Market Index ETF | $810,399 | 7 |
| Schwab Fundamental U.S. Large Company Index ETF | 7,133,571 | 59 |
| Schwab Fundamental U.S. Small Company Index ETF | 4,422,704 | 63 |
| Schwab Fundamental International Large Company Index ETF | 10,494,947 | 113 |
| Schwab Fundamental International Small Company Index ETF | 4,742,888 | 51 |
| Schwab Fundamental Emerging Markets Large Company Index ETF | 5,899,316 | 116 |
9. Purchases and Sales/Maturities of Investment Securities:
For the period ended August 31, 2017, purchases and sales/maturities of securities (excluding in-kind transactions and short-term obligations) were as follows:
| | Purchases
of Securities | Sales/Maturities
of Securities |
| Schwab Fundamental U.S. Broad Market Index ETF | $13,775,684 | $12,391,470 |
| Schwab Fundamental U.S. Large Company Index ETF | 163,995,466 | 133,333,973 |
| Schwab Fundamental U.S. Small Company Index ETF | 311,523,073 | 253,371,569 |
| Schwab Fundamental International Large Company Index ETF | 167,402,662 | 111,897,835 |
| Schwab Fundamental International Small Company Index ETF | 153,514,762 | 107,061,255 |
| Schwab Fundamental Emerging Markets Large Company Index ETF | 437,881,624 | 98,893,864 |
10. In-Kind Transactions:
The consideration for the purchase of Creation Units of a fund often consists of the in-kind deposit of a designated portfolio of equity securities, which constitutes an optimized representation of the securities involved in a relevant fund’s underlying index, and an amount of cash. Investors purchasing and redeeming Creation Units are subject to a standard creation transaction fee and a standard redemption transaction fee paid to the custodian to offset transfer and other transaction costs associated with the issuance and redemption of Creation Units. Purchasers and redeemers of Creation Units for cash are subject to an additional variable charge paid to the fund that will offset the transaction costs to the fund of buying or selling portfolio securities. In addition, purchasers and redeemers of shares in Creation Units are responsible for payment of the costs of transferring securities to or out of the fund. From time to time, CSIM may cover the cost of any transaction fees when believed to be in the best interests of a fund.
Schwab Fundamental Index ETFs | Semiannual Report
Schwab Fundamental Index ETFs
Financial Notes, unaudited (continued)
10. In-Kind Transactions (continued):
The in-kind transactions for the period ended August 31, 2017, were as follows:
| | In-Kind Purchases
of Securities | In-Kind Sales
of Securities |
| Schwab Fundamental U.S. Broad Market Index ETF | $11,506,594 | $9,825,824 |
| Schwab Fundamental U.S. Large Company Index ETF | 784,594,020 | 8,366,556 |
| Schwab Fundamental U.S. Small Company Index ETF | 596,709,701 | 141,831,483 |
| Schwab Fundamental International Large Company Index ETF | 680,767,866 | 15,881,193 |
| Schwab Fundamental International Small Company Index ETF | 391,573,681 | 78,042,832 |
| Schwab Fundamental Emerging Markets Large Company Index ETF | 70,752,185 | — |
For the period ended August 31, 2017, where applicable, the funds realized net capital gains or losses resulting from in-kind redemptions of Creation Units. Because such gains or losses are not taxable to the funds and are not distributed to existing fund shareholders, the gains or losses are reclassified from accumulated net realized gains or losses to capital received from investors at the end of the funds' tax year. These reclassifications have no effect on net assets or net asset values per share. The net realized in-kind gains or losses for the period ended August 31, 2017 are disclosed in the funds' Statements of Operations, if any.
11. Federal Income Taxes
As of August 31, 2017, the tax basis cost of the funds' investments and gross unrealized appreciation and depreciation were as follows:
| | Schwab
Fundamental
U.S. Broad
Market
Index ETF | | Schwab
Fundamental
U.S. Large
Company
Index ETF | | Schwab
Fundamental
U.S. Small
Company
Index ETF | | Schwab
Fundamental
International
Large
Company
Index ETF | | Schwab
Fundamental
International
Small
Company
Index ETF | | Schwab
Fundamental
Emerging
Markets Large
Company
Index ETF |
| Tax cost | $237,792,799 | | $2,794,526,062 | | $1,916,427,009 | | $2,571,185,116 | | $1,200,999,448 | | $1,287,583,336 |
| Gross unrealized appreciation | $44,716,769 | | $346,133,867 | | $258,667,376 | | $342,993,326 | | $211,006,384 | | $257,645,289 |
| Gross unrealized depreciation | (14,219,363) | | (105,847,462) | | (103,157,729) | | (61,907,224) | | (29,216,493) | | (24,626,045) |
| Net unrealized appreciation (depreciation) | $30,497,406 | | $240,286,405 | | $155,509,647 | | $281,086,102 | | $181,789,891 | | $233,019,244 |
Capital loss carryforwards may be used to offset future realized capital gains for federal income tax purposes. As of February 28, 2017, the funds had capital loss carryforwards available to offset future net capital gains as follows:
| Expiration Date | Schwab
Fundamental
U.S. Broad
Market
Index ETF | | Schwab
Fundamental
U.S. Large
Company
Index ETF | | Schwab
Fundamental
U.S. Small
Company
Index ETF | | Schwab
Fundamental
International
Large
Company
Index ETF | | Schwab
Fundamental
International
Small
Company
Index ETF | | Schwab
Fundamental
Emerging
Markets Large
Company
Index ETF |
| No expiration | $2,886,323 | | $9,735,348 | | $18,248,707 | | $32,967,455 | | $16,086,481 | | $7,761,845 |
| Total | $2,886,323 | | $9,735,348 | | $18,248,707 | | $32,967,455 | | $16,086,481 | | $7,761,845 |
As of February 28, 2017, management has reviewed the tax positions for open periods (for federal purposes, three years from the date of filing and for state purposes, four years from the date of filing) as applicable to the funds, and has determined that no provision for income tax is required in the funds' financial statements. The funds recognize interest and penalties, if any, related to unrecognized tax benefits as income tax expense in the Statement of Operations. During the period ended February 28, 2017, the funds did not incur any interest or penalties.
12. Subsequent Events:
Management has determined there are no subsequent events or transactions through the date the financial statements were issued that would have materially impacted the financial statements as presented.
Schwab Fundamental Index ETFs | Semiannual Report
Schwab Fundamental Index ETFs
Investment Advisory Agreement Approval
The Investment Company Act of 1940 (the 1940 Act) requires that initial approval of, as well as the continuation of, a fund’s investment advisory agreement must be specifically approved (1) by the vote of the trustees or by a vote of the shareholders of the fund, and (2) by the vote of a majority of the trustees who are not parties to the investment advisory agreement or “interested persons” of any party (the Independent Trustees), cast in person at a meeting called for the purpose of voting on such approval. In connection with such approvals, the fund’s trustees must request and evaluate, and the investment adviser is required to furnish, such information as may be reasonably necessary to evaluate the terms of the investment advisory agreement.
The Board of Trustees (the Board or the Trustees, as appropriate) calls and holds one or more meetings each year that are dedicated, in part, to considering whether to renew the investment advisory agreement (the Agreement) between Schwab Strategic Trust (the Trust) and Charles Schwab Investment Management, Inc. (CSIM) with respect to the existing funds in the Trust, including Schwab Fundamental U.S. Broad Market Index ETF, Schwab Fundamental U.S. Large Company Index ETF, Schwab Fundamental U.S. Small Company Index ETF, Schwab Fundamental International Large Company Index ETF, Schwab Fundamental International Small Company Index ETF, and Schwab Fundamental Emerging Markets Large Company Index ETF (the Funds), and to review certain other agreements pursuant to which CSIM provides investment advisory services to certain other registered investment companies. In preparation for the meeting(s), the Board requests and reviews a wide variety of materials provided by CSIM, including information about affiliates, personnel, business goals and priorities, profitability, third-party oversight, corporate structure and operations. The Board also receives data provided by an independent provider of investment company data. This information is in addition to the detailed information about the Funds that the Board reviews during the course of each year, including information that relates to the Funds’ operations and performance, legal and compliance matters, risk management, portfolio turnover, and sales and marketing activity. In addition, the Independent Trustees meet in executive session outside the presence of fund management and participate in question and answer sessions with representatives of CSIM.
The Board, including a majority of the Independent Trustees, considered information specifically relating to its consideration of the continuance of the Agreement with respect to the Funds at meetings held on April 19, 2017 and June 6, 2017, and approved the renewal of the Agreement with respect to the Funds for an additional one-year term at the meeting held on June 6, 2017. As part of the Board’s consideration of the continuance of the Agreement, the Board considered information it reviewed in connection with an amended and
restated advisory agreement between the Trust and CSIM that was approved by the Board at a meeting held on January 18, 2017. A discussion regarding the basis for the Board’s approval of the amended and restated advisory agreement is available in the Funds’ 2017 annual report, which covers the period from March 1, 2016 through February 28, 2017. The Board’s approval of the continuance of the Agreement with respect to the Funds was based on consideration and evaluation of a variety of specific factors discussed at these meetings and at prior meetings, including:
| 1. | the nature, extent and quality of the services provided to the Funds under the Agreement, including the resources of CSIM and its affiliates dedicated to the Funds; |
| 2. | each Fund’s investment performance and how it compared to that of certain other comparable exchange-traded funds; |
| 3. | each Fund’s expenses and how those expenses compared to those of certain other comparable exchange-traded funds; |
| 4. | the profitability of CSIM and its affiliates, including Charles Schwab & Co., Inc. (Schwab), with respect to the Funds, including both direct and indirect benefits accruing to CSIM and its affiliates; and |
| 5. | the extent to which economies of scale would be realized as the Funds grow and whether fee levels in the Agreement reflect those economies of scale for the benefit of Fund investors. |
Nature, Extent and Quality of Services. The Board considered the nature, extent and quality of the services provided by CSIM to the Funds and the resources of CSIM and its affiliates dedicated to the Funds. In this regard, the Trustees evaluated, among other things, CSIM’s experience, track record, compliance program, resources dedicated to hiring and retaining qualified personnel, and information security resources. The Trustees also considered information provided by CSIM relating to the Funds’ portfolio management team, portfolio strategy and risk oversight structure, and internal investment guidelines. The Trustees also considered Schwab’s reputation in connection with the OneSource exchange-traded fund offering and its overall financial condition. Following such evaluation, the Board concluded, within the context of its full deliberations, that the nature, extent and quality of services provided by CSIM to the Funds and the resources of CSIM and its affiliates dedicated to the Funds supported renewal of the Agreement with respect to the Funds.
Fund Performance. The Board considered each Fund’s performance in determining whether to renew the Agreement with respect to the Funds. Specifically, the Trustees considered each Fund’s performance relative to a peer category of other exchange-traded funds and relevant indices/benchmarks, in
Schwab Fundamental Index ETFs | Semiannual Report
Schwab Fundamental Index ETFs
light of total return and market trends. As part of this review, the Trustees considered the composition of the peer category and the selection criteria. In evaluating the performance of each Fund, the Trustees considered the risk profile for such Fund and the appropriateness of the benchmark used to compare the performance of the Fund. The Trustees further considered the level of Fund performance in the context of their review of Fund expenses and adviser profitability discussed below and also noted that performance is reviewed throughout the year by a designated committee of the Board and by the Board. Following such evaluation, the Board concluded, within the context of its full deliberations, that the performance of the Funds supported renewal of the Agreement with respect to the Funds.
Fund Expenses. With respect to the Funds’ expenses, the Trustees considered the rate of compensation called for by the Agreement and each Fund’s operating expense ratio, in each case in comparison to those of other comparable exchange-traded funds, such peer groups and comparisons having been selected and calculated by an independent provider of investment company data. The Trustees noted that each Fund’s operating expense ratio was well below the average operating expense ratio charged by other funds in its peer group. The Trustees also considered fees charged by CSIM to mutual funds that it manages. Following such evaluation, the Board concluded, within the context of its full deliberations, that the expenses of the Funds are reasonable and supported renewal of the Agreement with respect to the Funds.
Profitability. The Trustees considered the compensation flowing to CSIM and its affiliates, directly or indirectly, and reviewed profitability on a pre-tax basis, without regard to distribution expenses. In this connection, the Trustees reviewed management’s profitability analyses and methodology. The Trustees also reviewed profitability of CSIM
relating to the Schwab fund complex as a whole, noting the benefit to Fund shareholders of being part of the Schwab fund complex, including the allocations of certain fixed costs across the funds in the complex. The Trustees also considered any other benefits derived by CSIM from its relationship with the Funds, such as whether, by virtue of its management of the Funds, CSIM obtains investment information or other research resources that aid it in providing advisory services to other clients. The Trustees considered whether the varied levels of compensation and profitability with respect to the Funds under the Agreement and other service agreements were reasonable and justified in light of the quality of all services rendered to the Funds by CSIM and its affiliates. Based on this evaluation, the Board concluded, within the context of its full deliberations, that the profitability of CSIM is reasonable and supported renewal of the Agreement with respect to the Funds.
Economies of Scale. The Trustees considered the existence of any economies of scale and whether those are passed along to the Funds’ shareholders by way of the relatively low advisory fee and unitary fee structure of the Funds. Based on this evaluation, the Board concluded, within the context of its full deliberations, that the Funds obtain reasonable benefit from economies of scale.
In the course of their deliberations, the Trustees did not identify any particular information or factor that was all important or controlling. Based on the Trustees’ deliberation and their evaluation of the information described above, the Board, including all of the Independent Trustees, approved the continuation of the Agreement with respect to the Funds and concluded that the compensation under the Agreement with respect to the Funds is fair and reasonable in light of such services and expenses and such other matters as the Trustees have considered to be relevant in the exercise of their reasonable judgment.
Schwab Fundamental Index ETFs | Semiannual Report
Schwab Fundamental Index ETFs
Trustees and Officers
The tables below give information about the trustees and officers for the Schwab Strategic Trust, which includes the funds covered in this report. The “Fund Complex” includes The Charles Schwab Family of Funds, Schwab Capital Trust, Schwab Investments, Schwab Annuity Portfolios, Schwab Strategic Trust and Laudus Trust. The Fund Complex includes 105 funds.
The address for all trustees and officers is 211 Main Street, San Francisco, CA 94105. You can find more information about the trustees and officers in the Statement of Additional Information, which is available free by calling 1-877-824-5615.
| Independent Trustees |
Name, Year of Birth, and
Position(s) with the trust
(Terms of office, and
length of Time Served1) | Principal Occupations
During the Past Five Years | Number of
Portfolios in
Fund Complex
Overseen by
the Trustee | Other Directorships |
Robert W. Burns
1959
Trustee
(Trustee of Schwab Strategic Trust since 2009; The Charles Schwab Family of Funds, Schwab Investments, Schwab Capital Trust, Schwab Annuity Portfolios and Laudus Trust since 2016) | Retired/Private Investor (Jan. 2009 – present). Formerly, Managing Director, Pacific Investment Management Company, LLC (PIMCO) (investment management firm) and President, PIMCO Funds. | 105 | Director, PS Business Parks, Inc. (2005 – 2012) |
John F. Cogan
1947
Trustee
(Trustee of The Charles Schwab Family of Funds, Schwab Investments, Schwab Capital Trust and Schwab Annuity Portfolios since 2008; Laudus Trust since 2010; Schwab Strategic Trust since 2016) | Senior Fellow, The Hoover Institution at Stanford University (Oct. 1979 – present); Senior Fellow, Stanford Institute for Economic Policy Research (2000 – present); Professor of Public Policy, Stanford University (1994 – 2015). | 105 | Director, Gilead Sciences, Inc. (2005 – present) |
Stephen Timothy Kochis
1946
Trustee
(Trustee of Schwab Strategic Trust since 2012; The Charles Schwab Family of Funds, Schwab Investments, Schwab Capital Trust, Schwab Annuity Portfolios and Laudus Trust since 2016) | CEO and Owner, Kochis Global (wealth management consulting) (May 2012 – present); Chairman and CEO, Aspiriant, LLC (wealth management) (Jan. 2008 – Apr. 2012). | 105 | None |
David L. Mahoney
1954
Trustee
(Trustee of The Charles Schwab Family of Funds, Schwab Investments, Schwab Capital Trust, Schwab Annuity Portfolios and Laudus Trust since 2011; Schwab Strategic Trust since 2016) | Private Investor. | 105 | Director, Symantec Corporation (2003 – present)
Director, Corcept Therapeutics Incorporated (2004 – present)
Director, Adamas Pharmaceuticals, Inc. (2009 – present) |
Schwab Fundamental Index ETFs | Semiannual Report
Schwab Fundamental Index ETFs
| Independent Trustees (continued) |
Name, Year of Birth, and
Position(s) with the trust
(Terms of office, and
length of Time Served1) | Principal Occupations
During the Past Five Years | Number of
Portfolios in
Fund Complex
Overseen by
the Trustee | Other Directorships |
Kiran M. Patel
1948
Trustee
(Trustee of The Charles Schwab Family of Funds, Schwab Investments, Schwab Capital Trust, Schwab Annuity Portfolios and Laudus Trust since 2011; Schwab Strategic Trust since 2016) | Retired. Executive Vice President and General Manager of Small Business Group, Intuit, Inc. (financial software and services firm for consumers and small businesses) (Dec. 2008 – Sept. 2013). | 105 | Director, KLA-Tencor Corporation (2008 – present) |
Kimberly S. Patmore
1956
Trustee
(Trustee of The Charles Schwab Family of Funds, Schwab Investments, Schwab Capital Trust, Schwab Annuity Portfolios, Schwab Strategic Trust and Laudus Trust since 2016) | Consultant, Patmore Management Consulting (management consulting) (2008 – present). | 105 | None |
Charles A. Ruffel
1956
Trustee
(Trustee of Schwab Strategic Trust since 2009; The Charles Schwab Family of Funds, Schwab Investments, Schwab Capital Trust, Schwab Annuity Portfolios and Laudus Trust since 2015) | Co-Chief Executive Officer, Kudu Investment Management, LLC (financial services) (Jan. 2015 – present); Partner, Kudu Advisors, LLC (financial services) (June 2008 – Jan. 2015); Advisor, Asset International, Inc. (publisher of financial services information) (Aug. 2008 – Jan. 2015). | 105 | None |
Gerald B. Smith
1950
Trustee
(Trustee of The Charles Schwab Family of Funds, Schwab Investments, Schwab Capital Trust and Schwab Annuity Portfolios since 2000; Laudus Trust since 2010; Schwab Strategic Trust since 2016) | Chairman, Chief Executive Officer and Founder of Smith Graham & Co. (investment advisors) (Mar. 1990 – present). | 105 | Director, Eaton (2012 – present)
Director and Chairman of the Audit Committee, Oneok Partners LP (2003 – 2013)
Director, Oneok, Inc. (2009 – 2013)
Lead Independent Director, Board of Cooper Industries (2002 – 2012) |
Joseph H. Wender
1944
Trustee
(Trustee of The Charles Schwab Family of Funds, Schwab Investments, Schwab Capital Trust and Schwab Annuity Portfolios since 2008; Laudus Trust since 2010; Schwab Strategic Trust since 2016) | Senior Consultant, Goldman Sachs & Co., Inc. (investment banking and securities firm) (Jan. 2008 – present); Partner, Colgin Partners, LLC (vineyards) (Feb. 1998 – present). | 105 | Board Member and Chairman of the Audit Committee, Ionis Pharmaceuticals (1994 – present)
Lead Independent Director and Chair of Audit Committee, OUTFRONT Media Inc. (2014 – present) |
Schwab Fundamental Index ETFs | Semiannual Report
Schwab Fundamental Index ETFs
| Interested Trustees |
Name, Year of Birth, and
Position(s) with the trust
(Terms of office, and
length of Time Served1) | Principal Occupations
During the Past Five Years | Number of
Portfolios in
Fund Complex
Overseen by
the Trustee | Other Directorships |
Walter W. Bettinger II2
1960
Chairman and Trustee
(Trustee of The Charles Schwab Family of Funds, Schwab Investments, Schwab Capital Trust and Schwab Annuity Portfolios since 2008; Schwab Strategic Trust since 2009; Laudus Trust since 2010) | Director, President and Chief Executive Officer, The Charles Schwab Corporation (Oct. 2008 – present); President and Chief Executive Officer (Oct. 2008 – present), Director (May 2008 – present), Charles Schwab & Co., Inc.; Director, Charles Schwab Bank (Apr. 2006 – present); Director, Schwab Holdings, Inc. (May 2008 – present); and Director, Charles Schwab Investment Management, Inc. (July 2016 – present). | 105 | Director, The Charles Schwab Corporation (2008 – present) |
Marie A. Chandoha2
1961
Trustee
(Trustee of The Charles Schwab Family of Funds, Schwab Investments, Schwab Capital Trust, Schwab Annuity Portfolios, Schwab Strategic Trust and Laudus Trust since 2016) | Director, President and Chief Executive Officer (Dec. 2010 – present), Chief Investment Officer (Sept. 2010 – Oct. 2011), Charles Schwab Investment Management, Inc.; Trustee (Jan. 2016 – present), President, Chief Executive Officer (Dec. 2010 – present), and Chief Investment Officer (Sept. 2010 – Oct. 2011), Schwab Funds, Laudus Funds and Schwab ETFs; Director, Charles Schwab Worldwide Funds plc and Charles Schwab Asset Management (Ireland) Limited (Jan. 2011 – present); Global Head of Fixed Income Business Division, BlackRock, Inc. (formerly Barclays Global Investors) (Mar. 2007 – Aug. 2010). | 105 | None |
Joseph R. Martinetto2
1962
Trustee
(Trustee of The Charles Schwab Family of Funds, Schwab Investments, Schwab Capital Trust, Schwab Annuity Portfolios, Schwab Strategic Trust and Laudus Trust since 2016) | Senior Executive Vice President (July 2015 – present), Chief Financial Officer (July 2015 – May 2017), Executive Vice President and Chief Financial Officer (May 2007 – July 2015), The Charles Schwab Corporation and Charles Schwab & Co., Inc.; Director, Charles Schwab & Co., Inc. (May 2007 – present); Director (Apr. 2010 – present) and Chief Executive Officer (July 2013 – Apr. 2015), Charles Schwab Bank; Director (May 2007 – present), Chief Financial Officer (May 2007 – May 2017), Senior Executive Vice President (Feb. 2016 – present), and Executive Vice President (May 2007 – Feb. 2016), Schwab Holdings, Inc. | 105 | None |
| Officers of the Trust |
Name, Year of Birth, and Position(s) with the trust
(Terms of office, and length of Time Served3) | Principal Occupations During the Past Five Years |
Marie A. Chandoha
1961
President and Chief Executive Officer
(Officer of The Charles Schwab Family of Funds, Schwab Investments, Schwab Capital Trust, Schwab Annuity Portfolios, Schwab Strategic Trust and Laudus Trust since 2010) | Director, President and Chief Executive Officer (Dec. 2010 – present), Chief Investment Officer (Sept. 2010 – Oct. 2011), Charles Schwab Investment Management, Inc.; Trustee (Jan. 2016 – present), President, Chief Executive Officer (Dec. 2010 – present), and Chief Investment Officer (Sept. 2010 – Oct. 2011), Schwab Funds, Laudus Funds and Schwab ETFs; Director, Charles Schwab Worldwide Funds plc and Charles Schwab Asset Management (Ireland) Limited (Jan. 2011 – present); Global Head of Fixed Income Business Division, BlackRock, Inc. (formerly Barclays Global Investors) (Mar. 2007 – Aug. 2010). |
Mark Fischer
1970
Treasurer and Chief Financial Officer
(Officer of The Charles Schwab Family of Funds, Schwab Investments, Schwab Capital Trust, Schwab Annuity Portfolios, Schwab Strategic Trust and Laudus Trust since 2013) | Treasurer and Chief Financial Officer, Schwab Funds, Laudus Funds and Schwab ETFs (Jan. 2016 – present); Assistant Treasurer, Schwab Funds and Laudus Funds (Dec. 2013 – Dec. 2015), Schwab ETFs (Nov. 2013 – Dec. 2015); Vice President, Charles Schwab Investment Management, Inc. (Oct. 2013 – present); Executive Director, J.P. Morgan Investor Services (Apr. 2011 – Sept. 2013); Assistant Treasurer, Massachusetts Financial Service Investment Management (May 2005 – Mar. 2011). |
Schwab Fundamental Index ETFs | Semiannual Report
Schwab Fundamental Index ETFs
| Officers of the Trust (continued) |
Name, Year of Birth, and Position(s) with the trust
(Terms of office, and length of Time Served3) | Principal Occupations During the Past Five Years |
George Pereira
1964
Senior Vice President and Chief Operating Officer
(Officer of The Charles Schwab Family of Funds, Schwab Investments, Schwab Capital Trust and Schwab Annuity Portfolios since 2004; Laudus Trust since 2006; Schwab Strategic Trust since 2009) | Senior Vice President and Chief Financial Officer (Nov. 2004 – present), Chief Operating Officer (Jan. 2011 – present), Charles Schwab Investment Management, Inc.; Senior Vice President and Chief Operating Officer (Jan. 2016 – present), Treasurer and Chief Financial Officer, Laudus Funds (June 2006 – Dec. 2015); Treasurer and Principal Financial Officer, Schwab Funds (Nov. 2004 – Dec. 2015) and Schwab ETFs (Oct. 2009 – Dec. 2015); Director, Charles Schwab Worldwide Funds plc and Charles Schwab Asset Management (Ireland) Limited (Apr. 2005 – present). |
Omar Aguilar
1970
Senior Vice President and Chief Investment Officer – Equities and Multi-Asset Strategies
(Officer of The Charles Schwab Family of Funds, Schwab Investments, Schwab Capital Trust, Schwab Annuity Portfolios, Schwab Strategic Trust and Laudus Trust since 2011) | Senior Vice President and Chief Investment Officer – Equities and Multi-Asset Strategies, Charles Schwab Investment Management, Inc. (Apr. 2011 – present); Senior Vice President and Chief Investment Officer – Equities, Schwab Funds, Laudus Funds and Schwab ETFs (June 2011 – present); Head of the Portfolio Management Group and Vice President of Portfolio Management, Financial Engines, Inc. (May 2009 – Apr. 2011); Head of Quantitative Equity, ING Investment Management (July 2004 – Jan. 2009). |
Brett Wander
1961
Senior Vice President and Chief Investment Officer – Fixed Income
(Officer of The Charles Schwab Family of Funds, Schwab Investments, Schwab Capital Trust, Schwab Annuity Portfolios, Schwab Strategic Trust and Laudus Trust since 2011) | Senior Vice President and Chief Investment Officer – Fixed Income, Charles Schwab Investment Management, Inc. (Apr. 2011 – present); Senior Vice President and Chief Investment Officer – Fixed Income, Schwab Funds, Laudus Funds and Schwab ETFs (June 2011 – present); Senior Managing Director, Global Head of Active Fixed-Income Strategies, State Street Global Advisors (Jan. 2008 – Oct. 2010); Director of Alpha Strategies Loomis, Sayles & Company (Apr. 2006 – Jan. 2008). |
David Lekich
1964
Chief Legal Officer and Secretary, Schwab Funds and Schwab ETFs
Vice President and Assistant Clerk, Laudus Funds
(Officer of The Charles Schwab Family of Funds, Schwab Investments, Schwab Capital Trust, Schwab Annuity Portfolios, Schwab Strategic Trust and Laudus Trust since 2011) | Senior Vice President (Sept. 2011 – present), Vice President (Mar. 2004 – Sept. 2011), Charles Schwab & Co., Inc.; Senior Vice President and Chief Counsel (Sept. 2011 – present), Vice President (Jan. 2011 – Sept. 2011), Charles Schwab Investment Management, Inc.; Secretary (Apr. 2011 – present) and Chief Legal Officer (Dec. 2011 – present), Schwab Funds; Vice President and Assistant Clerk, Laudus Funds (Apr. 2011 – present); Secretary (May 2011 – present) and Chief Legal Officer (Nov. 2011 – present), Schwab ETFs. |
Catherine MacGregor
1964
Vice President and Assistant Secretary, Schwab Funds and Schwab ETFs
Chief Legal Officer, Vice President and Clerk, Laudus Funds
(Officer of The Charles Schwab Family of Funds, Schwab Investments, Schwab Capital Trust, Schwab Annuity Portfolios and Laudus Trust since 2005; Schwab Strategic Trust since 2009) | Vice President, Charles Schwab & Co., Inc., Charles Schwab Investment Management, Inc. (July 2005 – present); Vice President (Dec. 2005 – present), Chief Legal Officer and Clerk (Mar. 2007 – present), Laudus Funds; Vice President (Nov. 2005 – present) and Assistant Secretary (June 2007 – present), Schwab Funds; Vice President and Assistant Secretary, Schwab ETFs (Oct. 2009 – present). |
| 1 | Each Trustee shall hold office until the election and qualification of his or her successor, or until he or she dies, resigns or is removed. The retirement policy requires that each independent trustee retire by December 31 of the year in which the Trustee turns 74 or the Trustee’s twentieth year of service as an independent trustee on any trust in the Fund Complex, whichever occurs first. |
| 2 | Mr. Bettinger, Ms. Chandoha and Mr. Martinetto are Interested Trustees because they own stock of The Charles Schwab Corporation, the parent company of the investment adviser. |
| 3 | The President, Treasurer and Secretary/Clerk hold office until their respective successors are chosen and qualified or until he or she sooner dies, resigns, is removed or becomes disqualified. Each of the other officers serves at the pleasure of the Board. |
Schwab Fundamental Index ETFs | Semiannual Report
Schwab Fundamental Index ETFs
144A securities These securities may be sold only to qualified institutional buyers under Securities Act Rule 144A.
American Depositary Receipt (ADR) U.S. dollar-denominated receipts issued by U.S. banks or trust companies that represent shares of foreign-based corporations.
ask See “offer.”
asset allocation The practice of dividing a portfolio among different asset classes, with each asset class assigned a particular percentage to help offset risks and rewards, based on your goals, time horizon and risk tolerance.
asset class A group of securities with similar structure and basic characteristics. Stocks, bonds and cash are the three main examples of asset classes.
authorized participant (AP) A large institutional investor that places orders for creation units with the funds’ distributor.
beta A historical measure of an investment’s volatility relative to a market index (usually the S&P 500®). The index is defined as having a beta of 1.00. Investments with a beta higher than 1.00 have been more volatile than the index; those with a beta of less than 1.00 have been less volatile.
bid The highest price at which someone is willing to buy a security.
Bloomberg Barclays U.S. Aggregate Bond Index An index that represents securities that are SEC registered, taxable, and dollar denominated. The index covers the U.S. investment grade fixed rate bond market, with index components for government and corporate securities, mortgage pass-through securities, and asset-backed securities. The index excludes certain types of securities, including state and local government series bonds, structured notes embedded with swaps or other special features, private placements, floating rate securities, inflation-linked bonds and Eurobonds.
Bloomberg Barclays U.S. Treasury Bills 1 – 3 Month Index An index that includes all publicly issued zero-coupon U.S. Treasury Bills that have a remaining maturity of less than 3 months but more than 1 month, are rated investment grade and have $250 million or more of outstanding face value. It excludes zero-coupon STRIPS.
cap, capitalization See “market cap.”
capital gain, capital loss The difference between the amount paid for an investment and its value at a later time. If the investment has been sold, the capital gain or loss is considered a realized gain or loss. If the investment is still held, the gain or loss is still “on paper” and is considered unrealized.
commencement of operations The date that the first NAV was calculated.
creation unit (C.U.) A basket of securities that is delivered by an authorized participant (AP) to the fund equal to the current holdings of the ETF, plus a designated cash component. In return, the APs receive a large block of ETF shares (typically 50,000 shares), which investors can then buy and sell in the secondary market.
European Depositary Receipt (EDR) A negotiable security (receipt) that is issued by a European bank, and that represents shares of foreign-based corporations.
exchange A marketplace, or any organization or group that provides or maintains a marketplace for trading securities, options, futures, or commodities.
expense ratio The amount that is taken from the fund’s assets each year to cover the operating expenses. An expense ratio of 0.50% means that a fund’s expenses amount to half of one percent of its average net assets a year.
Global Depositary Receipt (GDR) A negotiable security (receipt) that is issued by a foreign bank, and that represents shares of foreign-based corporations.
gross domestic product (GDP) The output of goods and services produced by labor and property located in the United States.
inception date The date that the shares began trading in the secondary market.
indicative optimized portfolio value (IOPV) A calculation disseminated by the stock exchange that approximates the fund’s NAV every 15 seconds throughout the trading day.
liquidity The ability to convert a security or asset quickly into cash.
market cap, market capitalization The value of a company as determined by the total value of all shares of its stock outstanding.
market price return The return based on the change in market price per share of the fund over a given time period. Market price returns assume that dividends and capital gain distributions have been reinvested in the fund at market price.
median market cap The midpoint of the range of market caps of the stocks held by a fund. There are different ways of calculating median market cap. With a simple median, half of the stocks in the fund’s portfolio would be larger than the median, and half would be smaller. With a weighted median (the type that is calculated for these funds), half of the fund’s assets are invested in stocks that are larger than the median market cap, and half in stocks that are smaller.
MSCI EAFE Index (Net) A free float-adjusted market capitalization index that is designed to measure the equity market performance of developed markets in Europe, Australasia, and the Far East. The Net version of the index reflects reinvested dividends net of withholding taxes, but reflects no deductions for expenses or other taxes; returns are calculated applying dividend withholding rates applicable to non-resident persons who do not benefit from double taxation treaties.
MSCI Emerging Markets Index (Net) A free float-adjusted market capitalization weighted index that is designed to measure equity market performance in the global emerging markets. This series approximates the minimum possible dividend reinvestment. The returns are calculated applying dividend withholding rates applicable to non-resident persons who do not benefit from double taxation treaties.
net asset value (NAV) The value of one share of a fund. NAV is calculated by taking the fund’s total assets, subtracting liabilities, and dividing by the number of shares outstanding.
NAV return The return based on the change in NAV of the fund over a given time period. NAV returns assume that dividends and capital gain distributions have been reinvested in the fund.
offer (ask) The lowest price at which an individual is willing to sell a security.
open The price at which a security opened for trading on a given day.
outstanding shares, shares outstanding When speaking of the fund, indicates all shares currently held by investors.
Schwab Fundamental Index ETFs | Semiannual Report
Schwab Fundamental Index ETFs
price-to-book ratio (P/B) The market price of a company’s stock compared with its “book value.” A mutual fund’s P/B is the weighted average of the P/B of all stocks in the fund’s portfolio.
price-to-earnings ratio (P/E) The market price of a company’s stock compared with earnings over the past year. A mutual fund’s P/E is the weighted average of the P/E of all stocks in the fund’s portfolio.
primary market The market that deals with the issuance of new securities.
rights and warrants Rights and warrants are types of securities that entitle the holder to purchase a proportionate amount of common stock at a specified price for a specific period of time. Rights allow a shareholder to buy more shares directly from the company, usually at a price somewhat lower than the current market price of the outstanding shares. Warrants are usually issued with bonds and preferred stock. Rights and warrants can trade on the market separately from the company’s stock. The prices of rights and warrants do not necessarily move parallel to the prices of the underlying common stock. Rights usually expire within a few weeks of issuance, while warrants may not expire for several years. If a right or warrant is not exercised within the specified time period, it will become worthless and a fund will lose the purchase price it paid for the right or warrant and the right to purchase the underlying security.
Russell 1000 Index An index that measures the performance of the 1,000 largest companies in the Russell 3000 Index, and represents approximately 92% of the total market capitalization of the Russell 3000 Index. The Russell 3000 Index measures the performance of the largest 3,000 U.S. companies representing approximately 98% of the investable U.S. equity market.
Russell 2000 Index An index that measures the performance of the 2,000 smallest companies in the Russell 3000 Index. The Russell 3000 Index measures the performance of the largest 3,000 U.S. companies representing approximately 98% of the investable U.S. equity market.
Russell 3000 Index An index that measures the performance of the 3,000 largest companies in the U.S., representing approximately 98% of the investable U.S. equity market.
Russell RAFI Developed ex US Large Company Index (Net) An index that ranks companies in the Russell Developed ex-U.S. Index by fundamental measures of size and tracks the performance of those companies whose fundamental scores are in the top 87.5% of the Russell Developed ex-U.S. Index. The index uses a partial quarterly reconstitution methodology in which the index is split into four equal segments at the annual reconstitution and each segment is then rebalanced on a rolling quarterly basis. The Net series reduces index performance by adjusting for local taxes. The Russell Developed ex-U.S. Index measures the performance of the largest investable securities in developed countries globally, excluding companies assigned to the United States.
Russell RAFI Developed ex US Small Company Index (Net) An index that ranks companies in the Russell Developed ex-U.S. Index by fundamental measures of size and tracks the performance of those companies whose fundamental scores are in the bottom 12.5% of the Russell Developed ex-U.S. Index. The index uses a partial quarterly reconstitution methodology in which the index is split into four equal segments at the annual reconstitution and each segment is then rebalanced on a rolling quarterly basis. The Net series reduces index performance by adjusting for local taxes. The Russell Developed ex-U.S. Index measures the performance of the largest investable securities in developed countries globally, excluding companies assigned to the United States.
Russell RAFI Emerging Markets Large Company Index (Net) An index that ranks companies in the Russell Emerging Markets Index by measures of fundamental size and tracks the performance of those companies whose fundamental scores are in the top 87.5% of the Russell Emerging Markets Index. The index uses a partial quarterly reconstitution methodology in which the index is split into four equal segments at the annual reconstitution and each segment is then rebalanced on a rolling quarterly basis. The Net series reduces index performance by adjusting for local taxes. The Russell Emerging Markets Index measures the performance of the investable securities in emerging countries globally.
Russell RAFI US Index An index that selects, ranks, and weights securities by fundamental measures of company size rather than market capitalization. The index measures the performance of the constituent companies by fundamental overall company scores, which are created using as the universe the companies included in the Russell 3000 Index. Securities are grouped in order of decreasing company score and each company receives a weight based on its percentage of the total scores of the companies in the Russell 3000 Index. The index uses a partial quarterly reconstitution methodology in which the index is split into four equal segments at the annual reconstitution and each segment is then rebalanced on a rolling quarterly basis. The Russell 3000 Index measures the performance of the largest 3,000 U.S. companies representing approximately 98% of the investable U.S. equity market.
Russell RAFI US Large Company Index An index that ranks companies in the Russell 3000 Index by fundamental measures of size and tracks the performance of those companies whose fundamental scores are in the top 87.5% of the Russell 3000 Index. The index uses a partial quarterly reconstitution methodology in which the index is split into four equal segments at the annual reconstitution and each segment is then rebalanced on a rolling quarterly basis. The Russell 3000 Index measures the performance of the largest 3,000 U.S. companies representing approximately 98% of the investable U.S. equity market.
Russell RAFI US Small Company Index An index that ranks companies in the Russell 3000 Index by fundamental measures of size and tracks the performance of those companies whose fundamental scores are in the bottom 12.5% of the Russell 3000 Index. The index uses a partial quarterly reconstitution methodology in which the index is split into four equal segments at the annual reconstitution and each segment is then rebalanced on a rolling quarterly basis. The Russell 3000 Index measures the performance of the largest 3,000 U.S. companies representing approximately 98% of the investable U.S. equity market.
S&P 500 Index An index that is designed to measure the performance of 500 leading publicly traded companies from a broad range of industries.
S&P Developed ex-U.S. Small Cap Index (Net) An index composed of the stocks representing the lowest 15% of float-adjusted market cap in each developed market country, excluding the U.S. The returns are calculated applying dividend withholding rates applicable to non-resident persons who do not benefit from double taxation treaties.
sampling If a fund uses a sampling method, the fund will not fully replicate the benchmark index and may hold securities not included in the index. A fund that utilizes a sampling approach may not track the return of the index.
secondary market The market in which investors purchase securities from other investors rather than directly from the issuing companies. Organized exchanges facilitate the trading of securities in the secondary market.
spread The gap between bid and ask prices of a security.
stock A share of ownership, or equity, in the issuing company.
Schwab Fundamental Index ETFs | Semiannual Report
Schwab Fundamental Index ETFs
total return The percentage that an investor would have earned or lost on an investment in the fund assuming dividends and distributions were reinvested.
tracking error The difference between the performance of the fund and its benchmark index, positive or negative.
Schwab Fundamental Index ETFs | Semiannual Report
Schwab Fundamental Index ETFs
Schwab ETFs™
Schwab ETFs are designed to be low-cost, diversified investments which follow broad market indices and provide exposure to specific segments of the market. These ETFs can serve as part of the foundation of a diversified portfolio. The list below shows all currently available Schwab ETFs.
Investors should carefully consider information contained in the prospectus, or if available, the summary prospectus, including investment objectives, risks, charges and expenses before investing. Please call 1-877-824-5615 for a prospectus and brochure for any Schwab ETF. Please read the prospectus carefully before you invest. This report must be preceded or accompanied by a current prospectus.
Proxy Voting Policies, Procedures and Results
A description of the proxy voting policies and procedures used to determine how to vote proxies on behalf of the funds is available without charge, upon request, by visiting the Schwab ETFs’ website at www.schwabfunds.com/schwabetfs_prospectus, the SEC’s website at www.sec.gov, or by contacting Schwab ETFs at 1-877-824-5615.
Information regarding how a fund voted proxies relating to portfolio securities during the most recent twelve-month period ended June 30 is available, without charge, by visiting the fund’s website at www.schwabfunds.com/schwabetfs_prospectus or the SEC’s website at www.sec.gov.
U.S. ETFs
Schwab U.S. Broad Market ETF™
Schwab 1000 Index® ETF
Schwab U.S. Large-Cap ETF™
Schwab U.S. Large-Cap Growth ETF™
Schwab U.S. Large-Cap Value ETF™
Schwab U.S. Mid-Cap ETF™
Schwab U.S. Small-Cap ETF™
Schwab U.S. Dividend Equity ETF™
Schwab U.S. REIT ETF™
International ETFs
Schwab International Equity ETF™
Schwab International Small-Cap Equity ETF™
Schwab Emerging Markets Equity ETF™
Fixed Income ETFs
Schwab U.S. TIPS ETF™
Schwab Short-Term U.S. Treasury ETF™
Schwab Intermediate-Term U.S. Treasury ETF™
Schwab U.S. Aggregate Bond ETF™
Fundamental Index* ETFs
Schwab Fundamental U.S. Broad Market Index ETF
Schwab Fundamental U.S. Large Company Index ETF
Schwab Fundamental U.S. Small Company Index ETF
Schwab Fundamental International Large Company Index ETF
Schwab Fundamental International Small Company Index ETF
Schwab Fundamental Emerging Markets Large Company
Index ETF
Investment Adviser
Charles Schwab Investment Management, Inc.
211 Main Street, San Francisco, CA 94105
Schwab ETFs™
1-877-824-5615
© 2017 Charles Schwab Investment Management, Inc. All rights reserved.
Printed on recycled paper.
| * | FUNDAMENTAL INDEX is a registered trademark of Research Affiliates LLC. |
This page is intentionally left blank.
Item 2: Code of Ethics.
Not applicable to this semi-annual report.
Item 3: Audit Committee Financial Expert.
Not applicable to this semi-annual report.
Item 4: Principal Accountant Fees and Services.
Not applicable to this semi-annual report.
Item 5: Audit Committee of Listed Registrants.
Not applicable.
Item 6: Schedule of Investments.
Except as noted below, the schedules of investments are included as part of the report to shareholders filed under Item 1 of this Form. The schedules of investments for the Schwab Fundamental U.S. Broad Market Index ETF, Schwab Fundamental U.S. Large Company Index ETF, Schwab Fundamental U.S. Small Company Index ETF, Schwab Fundamental International Large Company Index ETF, Schwab Fundamental International Small Company Index ETF, and Schwab Fundamental Emerging Markets Large Company Index ETF are filed under this Item.
Schwab Fundamental U.S. Broad Market Index ETF
Portfolio Holdings as of August 31, 2017 (Unaudited)
This section shows all the securities in the fund's portfolio and their values as of the report date.
The fund files its complete schedule of portfolio holdings with the SEC for the first and third quarters of each fiscal year on Form N-Q. The fund's Form N-Q is available on the SEC's website at www.sec.gov and may be viewed and copied at the SEC's Public Reference Room in Washington, D.C. Call 1-800-SEC-0330 for information on the operation of the Public Reference Room. The fund also makes available its complete schedule of portfolio holdings on a daily basis on the fund's website at www.schwabfunds.com/schwabetfs_prospectus.
| Security | Number
of Shares | Value ($) |
| Common Stock 99.5% of net assets |
| |
| Automobiles & Components 1.4% |
| Adient plc | 1,424 | 100,648 |
| American Axle & Manufacturing Holdings, Inc. * | 698 | 10,198 |
| BorgWarner, Inc. | 4,021 | 186,615 |
| Cooper Tire & Rubber Co. | 972 | 32,659 |
| Cooper-Standard Holding, Inc. * | 219 | 22,027 |
| Dana, Inc. | 3,566 | 85,834 |
| Delphi Automotive plc | 3,209 | 309,348 |
| Dorman Products, Inc. * | 251 | 16,671 |
| Ford Motor Co. | 90,238 | 995,325 |
| General Motors Co. | 34,235 | 1,250,947 |
| Gentex Corp. | 2,544 | 46,479 |
| Harley-Davidson, Inc. | 2,839 | 133,461 |
| LCI Industries | 318 | 31,418 |
| Lear Corp. | 1,335 | 199,636 |
| Modine Manufacturing Co. * | 785 | 12,678 |
| Standard Motor Products, Inc. | 477 | 21,036 |
| Superior Industries International, Inc. | 754 | 11,046 |
| Tenneco, Inc. | 883 | 47,859 |
| The Goodyear Tire & Rubber Co. | 4,618 | 139,925 |
| Thor Industries, Inc. | 663 | 72,028 |
| Visteon Corp. * | 953 | 110,014 |
| | | 3,835,852 |
| |
| Banks 5.0% |
| Associated Banc-Corp. | 1,527 | 33,441 |
| Astoria Financial Corp. | 908 | 17,788 |
| BancorpSouth, Inc. | 430 | 12,492 |
| Bank of America Corp. | 61,555 | 1,470,549 |
| Bank of Hawaii Corp. | 636 | 49,691 |
| BankUnited, Inc. | 479 | 15,941 |
| BB&T Corp. | 7,377 | 340,006 |
| BOK Financial Corp. | 159 | 12,796 |
| Capitol Federal Financial, Inc. | 2,940 | 40,337 |
| Cathay General Bancorp | 172 | 6,066 |
| CIT Group, Inc. | 3,080 | 138,138 |
| Citigroup, Inc. | 30,675 | 2,086,820 |
| Citizens Financial Group, Inc. | 4,012 | 132,918 |
| Comerica, Inc. | 1,155 | 78,829 |
| Commerce Bancshares, Inc. | 720 | 39,593 |
| Community Bank System, Inc. | 159 | 8,182 |
| Cullen/Frost Bankers, Inc. | 557 | 46,899 |
| CVB Financial Corp. | 795 | 16,457 |
| East West Bancorp, Inc. | 636 | 35,215 |
| F.N.B. Corp. | 1,113 | 14,124 |
| Fifth Third Bancorp | 9,331 | 243,819 |
| First Citizens BancShares, Inc., Class A | 35 | 11,918 |
| First Financial Bancorp | 806 | 19,304 |
| First Financial Bankshares, Inc. | 411 | 16,461 |
| First Horizon National Corp. | 3,021 | 51,991 |
| First Republic Bank | 639 | 62,015 |
| Fulton Financial Corp. | 1,908 | 33,295 |
| Glacier Bancorp, Inc. | 479 | 15,908 |
| Great Western Bancorp, Inc. | 419 | 15,050 |
| Security | Number
of Shares | Value ($) |
| Hancock Holding Co. | 418 | 18,371 |
| Huntington Bancshares, Inc. | 9,759 | 122,866 |
| IBERIABANK Corp. | 159 | 12,179 |
| International Bancshares Corp. | 636 | 22,864 |
| JPMorgan Chase & Co. | 34,472 | 3,133,160 |
| KeyCorp | 9,782 | 168,348 |
| M&T Bank Corp. | 876 | 129,525 |
| MB Financial, Inc. | 477 | 18,970 |
| NBT Bancorp, Inc. | 318 | 10,440 |
| New York Community Bancorp, Inc. | 6,957 | 83,832 |
| Northwest Bancshares, Inc. | 1,855 | 28,623 |
| Ocwen Financial Corp. * | 4,838 | 14,175 |
| Old National Bancorp | 636 | 10,399 |
| PacWest Bancorp | 198 | 8,940 |
| People's United Financial, Inc. | 3,180 | 53,106 |
| PHH Corp. * | 5,511 | 78,256 |
| Popular, Inc. | 1,497 | 59,745 |
| Prosperity Bancshares, Inc. | 229 | 13,683 |
| Regions Financial Corp. | 10,487 | 147,972 |
| Signature Bank * | 93 | 11,936 |
| SunTrust Banks, Inc. | 4,807 | 264,866 |
| SVB Financial Group * | 159 | 26,925 |
| Synovus Financial Corp. | 638 | 26,873 |
| TCF Financial Corp. | 2,226 | 34,570 |
| The PNC Financial Services Group, Inc. | 4,445 | 557,447 |
| Trustmark Corp. | 636 | 18,838 |
| U.S. Bancorp | 14,349 | 735,386 |
| UMB Financial Corp. | 224 | 15,035 |
| Umpqua Holdings Corp. | 1,193 | 20,878 |
| United Bankshares, Inc. | 477 | 16,003 |
| Valley National Bancorp | 2,226 | 24,909 |
| Washington Federal, Inc. | 954 | 29,812 |
| Webster Financial Corp. | 636 | 29,688 |
| Wells Fargo & Co. | 46,819 | 2,391,046 |
| Westamerica Bancorp | 268 | 13,815 |
| Wintrust Financial Corp. | 159 | 11,577 |
| Zions Bancorp | 984 | 42,961 |
| | | 13,474,062 |
| |
| Capital Goods 8.6% |
| 3M Co. | 6,149 | 1,256,364 |
| A.O. Smith Corp. | 954 | 53,128 |
| AAR Corp. | 954 | 34,401 |
| Actuant Corp., Class A | 636 | 15,296 |
| Acuity Brands, Inc. | 162 | 28,640 |
| AECOM * | 2,894 | 96,949 |
| Aegion Corp. * | 477 | 10,337 |
| AGCO Corp. | 2,067 | 141,486 |
| Air Lease Corp. | 663 | 26,944 |
| Aircastle Ltd. | 825 | 18,497 |
| Albany International Corp., Class A | 477 | 25,567 |
| Allegion plc | 548 | 43,133 |
| Allison Transmission Holdings, Inc. | 852 | 29,590 |
| AMETEK, Inc. | 1,781 | 112,648 |
| Apogee Enterprises, Inc. | 188 | 8,216 |
| Applied Industrial Technologies, Inc. | 956 | 54,492 |
| Arconic, Inc. | 6,444 | 164,129 |
| Armstrong World Industries, Inc. * | 1,839 | 87,352 |
Schwab Fundamental Index ETFs | Semiannual Report
Schwab Fundamental U.S. Broad Market Index ETF
Portfolio Holdings as of August 31, 2017 (Unaudited) (continued)
| Security | Number
of Shares | Value ($) |
| Astec Industries, Inc. | 318 | 15,798 |
| AZZ, Inc. | 176 | 8,606 |
| Babcock & Wilcox Enterprises, Inc. * | 1,244 | 2,811 |
| Barnes Group, Inc. | 636 | 39,763 |
| Beacon Roofing Supply, Inc. * | 477 | 22,467 |
| Briggs & Stratton Corp. | 1,113 | 23,306 |
| BWX Technologies, Inc. | 722 | 39,508 |
| Carlisle Cos., Inc. | 636 | 60,223 |
| Caterpillar, Inc. | 10,223 | 1,201,100 |
| Chart Industries, Inc. * | 372 | 12,551 |
| Chicago Bridge & Iron Co. N.V. (b) | 2,768 | 34,157 |
| CIRCOR International, Inc. | 159 | 7,635 |
| Colfax Corp. * | 795 | 31,705 |
| Comfort Systems USA, Inc. | 735 | 25,027 |
| Crane Co. | 477 | 35,408 |
| Cubic Corp. | 395 | 16,965 |
| Cummins, Inc. | 2,669 | 425,385 |
| Curtiss-Wright Corp. | 636 | 61,578 |
| Deere & Co. | 7,161 | 830,175 |
| DigitalGlobe, Inc. * | 477 | 16,409 |
| Donaldson Co., Inc. | 1,515 | 71,584 |
| Dover Corp. | 2,727 | 231,468 |
| Dycom Industries, Inc. * | 350 | 28,238 |
| Eaton Corp. plc | 5,407 | 388,006 |
| EMCOR Group, Inc. | 1,272 | 84,003 |
| Emerson Electric Co. | 11,853 | 699,801 |
| Encore Wire Corp. | 477 | 20,463 |
| EnerSys | 477 | 30,576 |
| EnPro Industries, Inc. | 159 | 11,205 |
| ESCO Technologies, Inc. | 483 | 26,299 |
| Esterline Technologies Corp. * | 318 | 27,157 |
| Fastenal Co. | 2,627 | 112,094 |
| Flowserve Corp. | 2,577 | 101,225 |
| Fluor Corp. | 5,898 | 227,486 |
| Fortive Corp. | 1,640 | 106,551 |
| Fortune Brands Home & Security, Inc. | 1,000 | 62,530 |
| Franklin Electric Co., Inc. | 318 | 12,259 |
| GATX Corp. | 795 | 48,161 |
| Generac Holdings, Inc. * | 861 | 34,767 |
| General Cable Corp. | 3,215 | 54,494 |
| General Dynamics Corp. | 3,177 | 639,689 |
| General Electric Co. | 96,647 | 2,372,684 |
| Graco, Inc. | 477 | 55,098 |
| Granite Construction, Inc. | 954 | 52,689 |
| Griffon Corp. | 1,053 | 19,533 |
| H&E Equipment Services, Inc. | 642 | 15,113 |
| Harsco Corp. * | 3,645 | 62,329 |
| HD Supply Holdings, Inc. * | 760 | 25,308 |
| Herc Holdings, Inc. * | 745 | 31,454 |
| Hexcel Corp. | 477 | 25,648 |
| Hillenbrand, Inc. | 636 | 22,737 |
| Honeywell International, Inc. | 6,208 | 858,380 |
| Hubbell, Inc. | 674 | 76,020 |
| Huntington Ingalls Industries, Inc. | 383 | 81,947 |
| Hyster-Yale Materials Handling, Inc. | 167 | 11,887 |
| IDEX Corp. | 477 | 56,086 |
| Illinois Tool Works, Inc. | 3,975 | 546,602 |
| Ingersoll-Rand plc | 2,907 | 248,229 |
| ITT, Inc. | 402 | 16,225 |
| Jacobs Engineering Group, Inc. | 2,436 | 132,738 |
| Johnson Controls International plc | 11,934 | 472,467 |
| Kaman Corp. | 318 | 15,595 |
| KBR, Inc. | 6,588 | 107,187 |
| Kennametal, Inc. | 1,844 | 64,540 |
| KLX, Inc. * | 855 | 40,989 |
| Lennox International, Inc. | 367 | 60,823 |
| Lincoln Electric Holdings, Inc. | 795 | 69,038 |
| Lindsay Corp. | 77 | 6,666 |
| Security | Number
of Shares | Value ($) |
| Lockheed Martin Corp. | 2,605 | 795,541 |
| Masco Corp. | 1,596 | 58,685 |
| Masonite International Corp. * | 159 | 10,065 |
| MasTec, Inc. * | 1,057 | 43,126 |
| Moog, Inc., Class A * | 477 | 36,615 |
| MRC Global, Inc. * | 3,115 | 49,124 |
| MSC Industrial Direct Co., Inc., Class A | 496 | 34,164 |
| Mueller Industries, Inc. | 1,508 | 44,984 |
| MYR Group, Inc. * | 688 | 17,757 |
| Nordson Corp. | 318 | 34,757 |
| Northrop Grumman Corp. | 2,538 | 690,869 |
| NOW, Inc. * | 3,584 | 41,789 |
| Orbital ATK, Inc. | 354 | 39,499 |
| Oshkosh Corp. | 1,991 | 148,529 |
| Owens Corning | 1,928 | 142,923 |
| PACCAR, Inc. | 4,669 | 309,695 |
| Parker-Hannifin Corp. | 1,853 | 298,129 |
| Pentair plc | 1,847 | 114,606 |
| Primoris Services Corp. | 672 | 19,226 |
| Quanex Building Products Corp. | 636 | 12,466 |
| Quanta Services, Inc. * | 3,976 | 142,858 |
| Raven Industries, Inc. | 900 | 25,200 |
| Raytheon Co. | 3,847 | 700,192 |
| RBC Bearings, Inc. * | 109 | 12,019 |
| Regal Beloit Corp. | 894 | 67,408 |
| Rexnord Corp. * | 568 | 13,564 |
| Rockwell Automation, Inc. | 1,183 | 194,083 |
| Rockwell Collins, Inc. | 1,737 | 227,634 |
| Roper Technologies, Inc. | 477 | 110,025 |
| Rush Enterprises, Inc., Class A * | 636 | 26,070 |
| Sensata Technologies Holding N.V. * | 603 | 26,930 |
| Simpson Manufacturing Co., Inc. | 477 | 20,883 |
| Snap-on, Inc. | 477 | 70,391 |
| Spirit AeroSystems Holdings, Inc., Class A | 1,202 | 89,549 |
| SPX Corp. * | 1,099 | 26,486 |
| SPX FLOW, Inc. * | 826 | 27,646 |
| Standex International Corp. | 92 | 8,781 |
| Stanley Black & Decker, Inc. | 1,447 | 208,368 |
| Teledyne Technologies, Inc. * | 318 | 47,719 |
| Tennant Co. | 159 | 9,691 |
| Terex Corp. | 2,107 | 81,225 |
| Textainer Group Holdings Ltd. * | 2,219 | 39,387 |
| Textron, Inc. | 3,293 | 161,653 |
| The Boeing Co. | 5,903 | 1,414,713 |
| The Greenbrier Cos., Inc. | 281 | 12,055 |
| The Middleby Corp. * | 168 | 20,446 |
| The Timken Co. | 2,187 | 98,087 |
| The Toro Co. | 977 | 60,261 |
| Titan International, Inc. | 3,085 | 26,469 |
| TransDigm Group, Inc. | 326 | 84,975 |
| TriMas Corp. * | 394 | 9,535 |
| Trinity Industries, Inc. | 3,542 | 102,151 |
| Triumph Group, Inc. | 2,174 | 57,176 |
| Tutor Perini Corp. * | 1,296 | 33,890 |
| United Rentals, Inc. * | 1,339 | 158,082 |
| United Technologies Corp. | 11,913 | 1,426,224 |
| Universal Forest Products, Inc. | 413 | 36,018 |
| Valmont Industries, Inc. | 394 | 56,559 |
| W.W. Grainger, Inc. | 997 | 162,082 |
| Wabash National Corp. | 1,006 | 21,146 |
| WABCO Holdings, Inc. * | 477 | 68,507 |
| Wabtec Corp. | 477 | 33,662 |
| Watsco, Inc. | 318 | 46,860 |
| Watts Water Technologies, Inc., Class A | 318 | 19,621 |
| WESCO International, Inc. * | 998 | 50,349 |
Schwab Fundamental Index ETFs | Semiannual Report
Schwab Fundamental U.S. Broad Market Index ETF
Portfolio Holdings as of August 31, 2017 (Unaudited) (continued)
| Security | Number
of Shares | Value ($) |
| Woodward, Inc. | 477 | 33,490 |
| Xylem, Inc. | 1,749 | 108,560 |
| | | 23,105,043 |
| |
| Commercial & Professional Services 1.0% |
| ABM Industries, Inc. | 1,431 | 63,579 |
| ACCO Brands Corp. * | 1,202 | 13,162 |
| Brady Corp., Class A | 826 | 27,547 |
| CBIZ, Inc. * | 1,119 | 16,953 |
| Cintas Corp. | 743 | 100,312 |
| Clean Harbors, Inc. * | 530 | 28,668 |
| Copart, Inc. * | 2,208 | 72,179 |
| Covanta Holding Corp. | 1,384 | 19,860 |
| Deluxe Corp. | 636 | 44,107 |
| Equifax, Inc. | 638 | 90,896 |
| Essendant, Inc. | 1,788 | 21,206 |
| FTI Consulting, Inc. * | 799 | 27,094 |
| Healthcare Services Group, Inc. | 477 | 24,422 |
| Herman Miller, Inc. | 954 | 32,102 |
| HNI Corp. | 589 | 21,587 |
| ICF International, Inc. * | 318 | 15,280 |
| IHS Markit Ltd. * | 1,509 | 70,682 |
| Insperity, Inc. | 183 | 14,695 |
| Interface, Inc. | 477 | 9,063 |
| KAR Auction Services, Inc. | 638 | 28,767 |
| Kelly Services, Inc., Class A | 1,749 | 37,831 |
| Kforce, Inc. | 636 | 11,448 |
| Knoll, Inc. | 636 | 11,480 |
| Korn/Ferry International | 636 | 21,192 |
| LSC Communications, Inc. | 700 | 11,277 |
| ManpowerGroup, Inc. | 2,581 | 287,807 |
| Matthews International Corp., Class A | 477 | 28,739 |
| McGrath RentCorp | 318 | 12,838 |
| Mobile Mini, Inc. | 815 | 24,654 |
| MSA Safety, Inc. | 318 | 23,169 |
| Navigant Consulting, Inc. * | 1,113 | 17,062 |
| Nielsen Holdings plc | 2,980 | 115,773 |
| On Assignment, Inc. * | 157 | 7,489 |
| Pitney Bowes, Inc. | 4,759 | 61,153 |
| Quad/Graphics, Inc. | 1,945 | 37,072 |
| R.R. Donnelley & Sons Co. | 1,978 | 18,257 |
| Republic Services, Inc. | 3,225 | 210,399 |
| Resources Connection, Inc. | 1,113 | 14,191 |
| Robert Half International, Inc. | 1,818 | 82,355 |
| Rollins, Inc. | 477 | 21,184 |
| Steelcase, Inc., Class A | 2,101 | 27,733 |
| Stericycle, Inc. * | 686 | 49,317 |
| Team, Inc. * | 159 | 1,964 |
| Tetra Tech, Inc. | 942 | 40,129 |
| The Brink's Co. | 687 | 53,895 |
| The Dun & Bradstreet Corp. | 636 | 70,876 |
| TrueBlue, Inc. * | 1,507 | 30,818 |
| UniFirst Corp. | 159 | 22,832 |
| Verisk Analytics, Inc. * | 857 | 69,460 |
| Viad Corp. | 477 | 26,211 |
| Waste Management, Inc. | 4,952 | 381,849 |
| West Corp. | 727 | 16,990 |
| | | 2,589,605 |
| |
| Consumer Durables & Apparel 1.3% |
| American Outdoor Brands Corp. * | 713 | 11,636 |
| Brunswick Corp. | 829 | 43,506 |
| CalAtlantic Group, Inc. | 840 | 29,190 |
| Carter's, Inc. | 481 | 41,708 |
| Coach, Inc. | 6,595 | 275,011 |
| Columbia Sportswear Co. | 318 | 18,218 |
| Security | Number
of Shares | Value ($) |
| Crocs, Inc. * | 1,798 | 16,056 |
| D.R. Horton, Inc. | 2,257 | 81,591 |
| Deckers Outdoor Corp. * | 870 | 55,593 |
| Ethan Allen Interiors, Inc. | 503 | 14,713 |
| Fossil Group, Inc. * | 4,555 | 37,761 |
| G-III Apparel Group Ltd. * | 764 | 21,010 |
| Garmin Ltd. | 1,846 | 95,069 |
| Hanesbrands, Inc. | 2,443 | 59,267 |
| Hasbro, Inc. | 1,370 | 134,602 |
| Helen of Troy Ltd. * | 318 | 28,715 |
| Iconix Brand Group, Inc. * | 2,811 | 15,713 |
| KB Home | 746 | 15,964 |
| La-Z-Boy, Inc. | 954 | 22,753 |
| Leggett & Platt, Inc. | 1,908 | 87,711 |
| Lennar Corp., Class A | 1,352 | 69,980 |
| Lululemon Athletica, Inc. * | 401 | 23,078 |
| M.D.C Holdings, Inc. | 332 | 10,375 |
| Mattel, Inc. | 6,751 | 109,501 |
| Meritage Homes Corp. * | 318 | 12,943 |
| Michael Kors Holdings Ltd. * | 1,923 | 81,189 |
| Mohawk Industries, Inc. * | 480 | 121,498 |
| Newell Brands, Inc. | 1,907 | 92,070 |
| NIKE, Inc., Class B | 11,949 | 631,027 |
| NVR, Inc. * | 50 | 136,042 |
| Oxford Industries, Inc. | 104 | 6,012 |
| Polaris Industries, Inc. (b) | 890 | 82,975 |
| PulteGroup, Inc. | 4,461 | 115,183 |
| PVH Corp. | 814 | 102,474 |
| Ralph Lauren Corp. | 1,657 | 145,634 |
| Skechers U.S.A., Inc., Class A * | 795 | 21,012 |
| Steven Madden Ltd. * | 1,181 | 50,074 |
| Sturm Ruger & Co., Inc. | 205 | 9,389 |
| Tempur Sealy International, Inc. * | 553 | 34,231 |
| Toll Brothers, Inc. | 490 | 19,090 |
| Tupperware Brands Corp. | 872 | 50,463 |
| Under Armour, Inc., Class A * | 654 | 10,562 |
| Under Armour, Inc., Class C * | 319 | 4,817 |
| Unifi, Inc. * | 503 | 15,633 |
| VF Corp. | 4,183 | 262,985 |
| Vista Outdoor, Inc. * | 1,006 | 20,623 |
| Whirlpool Corp. | 1,230 | 211,093 |
| Wolverine World Wide, Inc. | 832 | 21,882 |
| | | 3,577,622 |
| |
| Consumer Services 2.2% |
| Adtalem Global Education, Inc. | 2,410 | 82,422 |
| Aramark | 2,657 | 108,113 |
| Bloomin' Brands, Inc. | 1,850 | 31,468 |
| Bob Evans Farms, Inc. | 730 | 50,209 |
| Boyd Gaming Corp. | 536 | 14,172 |
| Brinker International, Inc. | 1,337 | 41,741 |
| Buffalo Wild Wings, Inc. * | 80 | 8,220 |
| Caesars Entertainment Corp. * | 1,342 | 15,567 |
| Capella Education Co. | 377 | 25,391 |
| Career Education Corp. * | 1,681 | 16,154 |
| Carnival Corp. | 4,991 | 346,775 |
| Chipotle Mexican Grill, Inc. * | 194 | 61,442 |
| Choice Hotels International, Inc. | 478 | 29,660 |
| Churchill Downs, Inc. | 49 | 9,575 |
| Cracker Barrel Old Country Store, Inc. | 163 | 24,232 |
| Darden Restaurants, Inc. | 1,624 | 133,314 |
| Domino's Pizza, Inc. | 289 | 52,673 |
| Dunkin' Brands Group, Inc. | 369 | 19,026 |
| Extended Stay America, Inc. | 603 | 11,813 |
| Graham Holdings Co., Class B | 76 | 44,627 |
| Grand Canyon Education, Inc. * | 218 | 17,887 |
| H&R Block, Inc. | 3,884 | 103,858 |
Schwab Fundamental Index ETFs | Semiannual Report
Schwab Fundamental U.S. Broad Market Index ETF
Portfolio Holdings as of August 31, 2017 (Unaudited) (continued)
| Security | Number
of Shares | Value ($) |
| Hilton Worldwide Holdings, Inc. | 993 | 63,880 |
| Houghton Mifflin Harcourt Co. * | 1,006 | 10,261 |
| Hyatt Hotels Corp., Class A * | 318 | 18,924 |
| International Game Technology plc | 2,788 | 56,792 |
| International Speedway Corp., Class A | 477 | 17,005 |
| Jack in the Box, Inc. | 560 | 52,427 |
| K12, Inc. * | 1,336 | 23,941 |
| La Quinta Holdings, Inc. * | 969 | 15,310 |
| Las Vegas Sands Corp. | 3,504 | 217,984 |
| Marriott International, Inc., Class A | 3,134 | 324,620 |
| Marriott Vacations Worldwide Corp. | 217 | 25,250 |
| McDonald's Corp. | 11,108 | 1,776,947 |
| MGM Resorts International | 3,960 | 130,522 |
| Norwegian Cruise Line Holdings Ltd. * | 867 | 51,552 |
| Penn National Gaming, Inc. * | 1,015 | 22,523 |
| Red Robin Gourmet Burgers, Inc. * | 395 | 22,515 |
| Regis Corp. * | 1,389 | 18,446 |
| Royal Caribbean Cruises Ltd. | 1,547 | 192,540 |
| SeaWorld Entertainment, Inc. | 2,317 | 30,075 |
| Service Corp. International | 1,698 | 60,007 |
| ServiceMaster Global Holdings, Inc. * | 400 | 18,848 |
| Six Flags Entertainment Corp. | 318 | 17,353 |
| Sotheby's * | 339 | 15,211 |
| Starbucks Corp. | 5,843 | 320,547 |
| Strayer Education, Inc. | 407 | 32,564 |
| Texas Roadhouse, Inc. | 636 | 30,178 |
| The Cheesecake Factory, Inc. | 795 | 32,937 |
| The Wendy's Co. | 4,452 | 66,424 |
| Vail Resorts, Inc. | 190 | 43,310 |
| Weight Watchers International, Inc. * | 2,123 | 99,378 |
| Wyndham Worldwide Corp. | 1,989 | 198,263 |
| Wynn Resorts Ltd. | 1,362 | 189,304 |
| Yum China Holdings, Inc. * | 2,246 | 79,418 |
| Yum! Brands, Inc. | 3,734 | 286,846 |
| | | 5,810,441 |
| |
| Diversified Financials 4.7% |
| Affiliated Managers Group, Inc. | 408 | 72,089 |
| AGNC Investment Corp. | 4,251 | 91,567 |
| Ally Financial, Inc. | 17,057 | 385,488 |
| American Express Co. | 11,827 | 1,018,305 |
| Ameriprise Financial, Inc. | 2,384 | 330,208 |
| Annaly Capital Management, Inc. | 13,752 | 171,900 |
| Berkshire Hathaway, Inc., Class B * | 15,230 | 2,759,067 |
| BGC Partners, Inc., Class A | 1,802 | 23,408 |
| BlackRock, Inc. | 860 | 360,349 |
| Capital One Financial Corp. | 8,228 | 655,031 |
| Capstead Mortgage Corp. | 954 | 9,225 |
| CBOE Holdings, Inc. | 481 | 48,528 |
| Chimera Investment Corp. | 2,556 | 48,743 |
| CME Group, Inc. | 1,986 | 249,839 |
| Credit Acceptance Corp. * | 53 | 14,432 |
| CYS Investments, Inc. | 1,509 | 13,264 |
| Discover Financial Services | 6,128 | 361,246 |
| Donnelley Financial Solutions, Inc. * | 754 | 16,143 |
| E*TRADE Financial Corp. * | 2,067 | 84,768 |
| Eaton Vance Corp. | 1,137 | 54,098 |
| Evercore, Inc., Class A | 234 | 17,655 |
| EZCORP, Inc., Class A * | 2,716 | 24,580 |
| FactSet Research Systems, Inc. | 188 | 29,550 |
| Federated Investors, Inc., Class B | 1,749 | 47,765 |
| FirstCash, Inc. | 559 | 32,813 |
| FNFV Group * | 5,495 | 92,591 |
| Franklin Resources, Inc. | 6,773 | 292,797 |
| Greenhill & Co., Inc. | 1,272 | 19,144 |
| Intercontinental Exchange, Inc. | 1,095 | 70,814 |
| Invesco Ltd. | 4,884 | 160,097 |
| Security | Number
of Shares | Value ($) |
| Invesco Mortgage Capital, Inc. | 1,309 | 22,227 |
| Lazard Ltd., Class A | 1,187 | 50,910 |
| Legg Mason, Inc. | 3,190 | 121,826 |
| Leucadia National Corp. | 2,812 | 66,588 |
| LPL Financial Holdings, Inc. | 1,925 | 90,167 |
| MarketAxess Holdings, Inc. | 86 | 16,594 |
| MFA Financial, Inc. | 5,250 | 46,095 |
| Moody's Corp. | 1,074 | 143,948 |
| Morgan Stanley | 7,094 | 322,777 |
| Morningstar, Inc. | 94 | 7,774 |
| MSCI, Inc. | 397 | 45,500 |
| Nasdaq, Inc. | 1,090 | 82,164 |
| Navient Corp. | 11,428 | 150,850 |
| Nelnet, Inc., Class A | 423 | 20,063 |
| New Residential Investment Corp. | 1,350 | 22,248 |
| Northern Trust Corp. | 1,259 | 111,421 |
| OneMain Holdings, Inc. * | 1,471 | 40,261 |
| PennyMac Mortgage Investment Trust | 1,308 | 22,615 |
| PRA Group, Inc. * | 682 | 19,710 |
| Raymond James Financial, Inc. | 636 | 49,811 |
| Redwood Trust, Inc. | 954 | 15,913 |
| S&P Global, Inc. | 1,639 | 252,947 |
| Santander Consumer USA Holdings, Inc. * | 3,975 | 56,763 |
| SEI Investments Co. | 1,272 | 74,361 |
| SLM Corp. * | 10,121 | 102,931 |
| Starwood Property Trust, Inc. | 1,332 | 29,584 |
| State Street Corp. | 3,621 | 334,906 |
| Stifel Financial Corp. | 397 | 18,957 |
| Synchrony Financial | 10,537 | 324,434 |
| T. Rowe Price Group, Inc. | 2,861 | 241,354 |
| TD Ameritrade Holding Corp. | 1,279 | 55,406 |
| The Bank of New York Mellon Corp. | 8,596 | 449,399 |
| The Charles Schwab Corp. (a) | 3,526 | 140,687 |
| The Goldman Sachs Group, Inc. | 5,734 | 1,282,925 |
| Two Harbors Investment Corp. | 1,322 | 13,524 |
| Voya Financial, Inc. | 2,698 | 103,145 |
| Waddell & Reed Financial, Inc., Class A | 2,908 | 54,118 |
| Western Asset Mortgage Capital Corp. | 845 | 8,881 |
| World Acceptance Corp. * | 592 | 44,293 |
| | | 12,613,581 |
| |
| Energy 11.7% |
| Anadarko Petroleum Corp. | 7,088 | 290,112 |
| Andeavor | 4,291 | 429,744 |
| Antero Resources Corp. * | 768 | 15,122 |
| Apache Corp. | 9,392 | 364,785 |
| Archrock, Inc. | 1,813 | 18,493 |
| Atwood Oceanics, Inc. * | 3,089 | 20,295 |
| Baker Hughes a GE Co. | 8,838 | 299,608 |
| Bill Barrett Corp. * | 3,764 | 11,254 |
| Bristow Group, Inc. | 2,461 | 20,279 |
| Cabot Oil & Gas Corp. | 2,102 | 53,706 |
| California Resources Corp. *(b) | 6,287 | 49,039 |
| CARBO Ceramics, Inc. * | 1,832 | 12,018 |
| Chesapeake Energy Corp. *(b) | 34,886 | 126,985 |
| Chevron Corp. | 54,950 | 5,913,719 |
| Cimarex Energy Co. | 488 | 48,649 |
| Cloud Peak Energy, Inc. * | 4,528 | 14,218 |
| Concho Resources, Inc. * | 424 | 47,051 |
| ConocoPhillips | 49,392 | 2,156,455 |
| CONSOL Energy, Inc. * | 6,083 | 88,508 |
| Continental Resources, Inc. * | 504 | 17,096 |
| CVR Energy, Inc. | 911 | 19,514 |
| Delek US Holdings, Inc. | 5,554 | 137,295 |
| Denbury Resources, Inc. * | 34,638 | 36,716 |
| Devon Energy Corp. | 9,137 | 286,902 |
| Diamond Offshore Drilling, Inc. *(b) | 4,553 | 51,722 |
Schwab Fundamental Index ETFs | Semiannual Report
Schwab Fundamental U.S. Broad Market Index ETF
Portfolio Holdings as of August 31, 2017 (Unaudited) (continued)
| Security | Number
of Shares | Value ($) |
| Dril-Quip, Inc. * | 394 | 14,795 |
| Energen Corp. * | 1,295 | 66,408 |
| Ensco plc, Class A (b) | 14,542 | 61,803 |
| EOG Resources, Inc. | 4,222 | 358,828 |
| EQT Corp. | 1,120 | 69,821 |
| Exxon Mobil Corp. | 115,992 | 8,853,669 |
| Forum Energy Technologies, Inc. * | 530 | 6,148 |
| Golar LNG Ltd. | 1,046 | 22,677 |
| Green Plains, Inc. | 1,650 | 30,607 |
| Halliburton Co. | 13,881 | 540,943 |
| Helix Energy Solutions Group, Inc. * | 3,519 | 22,064 |
| Helmerich & Payne, Inc. (b) | 1,459 | 61,774 |
| Hess Corp. | 12,942 | 503,444 |
| HollyFrontier Corp. | 11,447 | 358,406 |
| Kinder Morgan, Inc. | 20,668 | 399,512 |
| Marathon Oil Corp. | 33,059 | 367,616 |
| Marathon Petroleum Corp. | 20,312 | 1,065,364 |
| Matrix Service Co. * | 1,509 | 17,882 |
| McDermott International, Inc. * | 9,354 | 57,434 |
| Murphy Oil Corp. | 10,521 | 238,406 |
| Nabors Industries Ltd. | 11,859 | 77,676 |
| National Oilwell Varco, Inc. | 12,132 | 372,088 |
| Newfield Exploration Co. * | 2,087 | 54,533 |
| Newpark Resources, Inc. * | 3,581 | 28,827 |
| Noble Corp. plc * | 23,902 | 77,920 |
| Noble Energy, Inc. | 4,428 | 105,254 |
| Nordic American Offshore Ltd. | 103 | 125 |
| Nordic American Tankers Ltd. | 2,516 | 11,926 |
| Oasis Petroleum, Inc. * | 1,438 | 10,497 |
| Occidental Petroleum Corp. | 16,065 | 959,080 |
| Oceaneering International, Inc. | 3,158 | 71,213 |
| Oil States International, Inc. * | 1,024 | 22,272 |
| ONEOK, Inc. | 2,290 | 124,026 |
| Patterson-UTI Energy, Inc. | 4,052 | 64,710 |
| PBF Energy, Inc., Class A (b) | 4,002 | 94,767 |
| PDC Energy, Inc. * | 159 | 6,253 |
| Peabody Energy Corp. * | 654 | 18,966 |
| Phillips 66 | 18,243 | 1,528,946 |
| Pioneer Energy Services Corp. * | 3,357 | 5,707 |
| Pioneer Natural Resources Co. | 487 | 63,140 |
| QEP Resources, Inc. * | 5,822 | 43,956 |
| Range Resources Corp. | 1,200 | 20,832 |
| Renewable Energy Group, Inc. * | 1,299 | 15,718 |
| REX American Resources Corp. * | 150 | 12,993 |
| Rowan Cos. plc, Class A * | 2,242 | 21,859 |
| RPC, Inc. | 831 | 16,130 |
| Schlumberger Ltd. | 17,783 | 1,129,398 |
| SEACOR Holdings, Inc. * | 378 | 14,504 |
| SemGroup Corp., Class A | 701 | 18,016 |
| Ship Finance International Ltd. | 636 | 8,300 |
| SM Energy Co. | 2,121 | 28,337 |
| Southwestern Energy Co. * | 8,017 | 43,693 |
| Superior Energy Services, Inc. * | 4,997 | 41,175 |
| Targa Resources Corp. | 973 | 43,367 |
| Teekay Corp. | 2,865 | 26,415 |
| The Williams Cos., Inc. | 8,047 | 239,237 |
| Transocean Ltd. * | 17,384 | 141,853 |
| Unit Corp. * | 1,553 | 24,724 |
| US Silica Holdings, Inc. | 526 | 14,312 |
| Valero Energy Corp. | 22,100 | 1,505,010 |
| W&T Offshore, Inc. * | 9,919 | 18,945 |
| Weatherford International plc * | 32,512 | 124,521 |
| Whiting Petroleum Corp. * | 8,123 | 36,310 |
| World Fuel Services Corp. | 6,776 | 234,043 |
| WPX Energy, Inc. * | 3,326 | 33,227 |
| | | 31,201,687 |
| |
| Security | Number
of Shares | Value ($) |
| Food & Staples Retailing 3.4% |
| Casey's General Stores, Inc. | 603 | 63,568 |
| Costco Wholesale Corp. | 6,692 | 1,048,904 |
| CVS Health Corp. | 26,412 | 2,042,704 |
| Ingles Markets, Inc., Class A | 556 | 12,204 |
| Performance Food Group Co. * | 895 | 24,881 |
| PriceSmart, Inc. | 159 | 12,919 |
| Rite Aid Corp. * | 10,282 | 24,882 |
| SpartanNash Co. | 815 | 20,082 |
| Sprouts Farmers Market, Inc. * | 559 | 11,147 |
| SUPERVALU, Inc. * | 768 | 15,352 |
| Sysco Corp. | 9,757 | 513,901 |
| The Andersons, Inc. | 747 | 23,792 |
| The Kroger Co. | 23,847 | 521,534 |
| United Natural Foods, Inc. * | 1,828 | 63,523 |
| US Foods Holding Corp. * | 1,006 | 27,615 |
| Wal-Mart Stores, Inc. | 46,095 | 3,598,637 |
| Walgreens Boots Alliance, Inc. | 12,440 | 1,013,860 |
| | | 9,039,505 |
| |
| Food, Beverage & Tobacco 4.4% |
| Altria Group, Inc. | 14,101 | 894,003 |
| Archer-Daniels-Midland Co. | 21,404 | 884,413 |
| B&G Foods, Inc. | 325 | 9,912 |
| Brown-Forman Corp., Class B | 1,946 | 103,216 |
| Bunge Ltd. | 7,211 | 538,157 |
| Cal-Maine Foods, Inc. * | 318 | 11,591 |
| Campbell Soup Co. | 1,673 | 77,293 |
| ConAgra Brands, Inc. | 4,621 | 149,998 |
| Constellation Brands, Inc., Class A | 577 | 115,458 |
| Darling Ingredients, Inc. * | 2,081 | 36,209 |
| Dean Foods Co. | 1,600 | 17,600 |
| Dr. Pepper Snapple Group, Inc. | 2,175 | 198,034 |
| Flowers Foods, Inc. | 2,742 | 47,629 |
| Fresh Del Monte Produce, Inc. | 1,113 | 52,300 |
| General Mills, Inc. | 7,655 | 407,705 |
| Hormel Foods Corp. | 2,451 | 75,344 |
| Ingredion, Inc. | 964 | 119,362 |
| J&J Snack Foods Corp. | 159 | 20,271 |
| Kellogg Co. | 2,744 | 179,622 |
| Lamb Weston Holdings, Inc. | 767 | 34,883 |
| Lancaster Colony Corp. | 318 | 37,037 |
| McCormick & Co., Inc. Non-Voting Shares | 1,113 | 105,880 |
| Molson Coors Brewing Co., Class B | 1,197 | 107,431 |
| Mondelez International, Inc., Class A | 17,127 | 696,384 |
| Monster Beverage Corp. * | 1,201 | 67,040 |
| PepsiCo, Inc. | 15,652 | 1,811,406 |
| Philip Morris International, Inc. | 18,333 | 2,143,678 |
| Pilgrim's Pride Corp. * | 1,458 | 42,938 |
| Pinnacle Foods, Inc. | 586 | 34,756 |
| Sanderson Farms, Inc. | 480 | 70,810 |
| Snyder's-Lance, Inc. | 477 | 16,943 |
| The Boston Beer Co., Inc., Class A * | 100 | 14,900 |
| The Coca-Cola Co. | 39,497 | 1,799,088 |
| The Hain Celestial Group, Inc. * | 551 | 22,161 |
| The Hershey Co. | 1,115 | 116,986 |
| The J.M. Smucker Co. | 1,335 | 139,855 |
| The Kraft Heinz Co. | 1,838 | 148,418 |
| TreeHouse Foods, Inc. * | 406 | 27,198 |
| Tyson Foods, Inc., Class A | 5,448 | 344,858 |
| Universal Corp. | 872 | 49,878 |
| Vector Group Ltd. | 716 | 15,466 |
| | | 11,786,111 |
| |
Schwab Fundamental Index ETFs | Semiannual Report
Schwab Fundamental U.S. Broad Market Index ETF
Portfolio Holdings as of August 31, 2017 (Unaudited) (continued)
| Security | Number
of Shares | Value ($) |
| Health Care Equipment & Services 5.5% |
| Abbott Laboratories | 16,931 | 862,465 |
| Aetna, Inc. | 4,990 | 786,923 |
| Alere, Inc. * | 505 | 24,977 |
| Align Technology, Inc. * | 98 | 17,321 |
| Allscripts Healthcare Solutions, Inc. * | 2,746 | 36,082 |
| Amedisys, Inc. * | 370 | 19,329 |
| AmerisourceBergen Corp. | 2,706 | 217,157 |
| Analogic Corp. | 159 | 11,376 |
| Anthem, Inc. | 7,700 | 1,509,508 |
| Baxter International, Inc. | 4,259 | 264,228 |
| Becton Dickinson & Co. | 1,893 | 377,540 |
| Boston Scientific Corp. * | 4,737 | 130,504 |
| Brookdale Senior Living, Inc. * | 2,855 | 34,631 |
| C.R. Bard, Inc. | 644 | 206,602 |
| Cardinal Health, Inc. | 8,186 | 552,228 |
| Centene Corp. * | 1,126 | 100,045 |
| Cerner Corp. * | 1,058 | 71,711 |
| Chemed Corp. | 318 | 62,738 |
| Cigna Corp. | 1,737 | 316,238 |
| Community Health Systems, Inc. * | 12,403 | 94,759 |
| CONMED Corp. | 318 | 15,773 |
| Danaher Corp. | 3,280 | 273,618 |
| DaVita, Inc. * | 1,708 | 100,020 |
| DENTSPLY SIRONA, Inc. | 1,371 | 77,557 |
| Edwards Lifesciences Corp. * | 702 | 79,789 |
| Envision Healthcare Corp. * | 807 | 42,295 |
| Express Scripts Holding Co. * | 16,777 | 1,053,931 |
| Haemonetics Corp. * | 258 | 11,099 |
| Halyard Health, Inc. * | 1,481 | 67,075 |
| HCA Healthcare, Inc. * | 5,595 | 440,103 |
| HealthSouth Corp. | 477 | 21,823 |
| Henry Schein, Inc. * | 878 | 152,491 |
| Hill-Rom Holdings, Inc. | 725 | 55,796 |
| Hologic, Inc. * | 398 | 15,363 |
| Humana, Inc. | 2,549 | 656,673 |
| IDEXX Laboratories, Inc. * | 342 | 53,157 |
| Intuitive Surgical, Inc. * | 161 | 161,752 |
| Invacare Corp. | 847 | 11,435 |
| Kindred Healthcare, Inc. | 4,179 | 33,850 |
| Laboratory Corp. of America Holdings * | 804 | 126,123 |
| LifePoint Health, Inc. * | 954 | 55,284 |
| LivaNova plc * | 251 | 15,708 |
| Magellan Health, Inc. * | 991 | 80,172 |
| Masimo Corp. * | 318 | 26,833 |
| McKesson Corp. | 4,685 | 699,517 |
| MEDNAX, Inc. * | 636 | 28,525 |
| Medtronic plc | 9,306 | 750,250 |
| Molina Healthcare, Inc. * | 636 | 40,704 |
| Owens & Minor, Inc. | 2,710 | 75,717 |
| Patterson Cos., Inc. | 1,431 | 55,094 |
| PharMerica Corp. * | 497 | 14,612 |
| Quality Systems, Inc. * | 646 | 10,175 |
| Quest Diagnostics, Inc. | 2,501 | 270,983 |
| ResMed, Inc. | 954 | 74,011 |
| Select Medical Holdings Corp. * | 3,528 | 65,621 |
| STERIS plc | 503 | 43,841 |
| Stryker Corp. | 1,887 | 266,765 |
| Teleflex, Inc. | 332 | 70,301 |
| Tenet Healthcare Corp. *(b) | 4,443 | 76,286 |
| The Cooper Cos., Inc. | 159 | 39,882 |
| Triple-S Management Corp., Class B * | 636 | 15,716 |
| UnitedHealth Group, Inc. | 11,403 | 2,268,057 |
| Universal Health Services, Inc., Class B | 915 | 98,939 |
| Varian Medical Systems, Inc. * | 954 | 101,363 |
| VCA, Inc. * | 676 | 62,841 |
| WellCare Health Plans, Inc. * | 661 | 115,463 |
| Security | Number
of Shares | Value ($) |
| West Pharmaceutical Services, Inc. | 453 | 39,429 |
| Zimmer Biomet Holdings, Inc. | 1,645 | 187,974 |
| | | 14,796,148 |
| |
| Household & Personal Products 1.8% |
| Central Garden & Pet Co., Class A * | 1,018 | 34,704 |
| Church & Dwight Co., Inc. | 2,002 | 100,440 |
| Colgate-Palmolive Co. | 8,090 | 579,567 |
| Edgewell Personal Care Co. * | 636 | 48,298 |
| Energizer Holdings, Inc. | 658 | 29,051 |
| Herbalife Ltd. *(b) | 1,637 | 112,969 |
| HRG Group, Inc. * | 754 | 11,906 |
| Kimberly-Clark Corp. | 3,189 | 393,172 |
| Nu Skin Enterprises, Inc., Class A | 1,367 | 83,154 |
| Spectrum Brands Holdings, Inc. | 159 | 17,484 |
| The Clorox Co. | 856 | 118,582 |
| The Estee Lauder Cos., Inc., Class A | 1,476 | 157,917 |
| The Procter & Gamble Co. | 33,715 | 3,110,883 |
| WD-40 Co. | 159 | 17,323 |
| | | 4,815,450 |
| |
| Insurance 3.7% |
| Aflac, Inc. | 5,837 | 481,844 |
| Alleghany Corp. * | 137 | 77,099 |
| Ambac Financial Group, Inc. * | 1,352 | 24,593 |
| American Equity Investment Life Holding Co. | 2,079 | 57,713 |
| American Financial Group, Inc. | 891 | 90,713 |
| American International Group, Inc. | 24,466 | 1,479,704 |
| American National Insurance Co. | 203 | 23,489 |
| AmTrust Financial Services, Inc. | 882 | 10,937 |
| Aon plc | 2,379 | 331,062 |
| Arch Capital Group Ltd. * | 1,004 | 97,729 |
| Argo Group International Holdings Ltd. | 380 | 22,876 |
| Arthur J. Gallagher & Co. | 954 | 55,237 |
| Aspen Insurance Holdings Ltd. | 1,272 | 57,494 |
| Assurant, Inc. | 1,527 | 144,592 |
| Assured Guaranty Ltd. | 2,013 | 85,633 |
| Axis Capital Holdings Ltd. | 2,091 | 125,962 |
| Brighthouse Financial, Inc. * | 941 | 53,703 |
| Brown & Brown, Inc. | 795 | 35,743 |
| Chubb Ltd. | 3,010 | 425,674 |
| Cincinnati Financial Corp. | 1,359 | 104,426 |
| CNA Financial Corp. | 360 | 17,662 |
| CNO Financial Group, Inc. | 3,393 | 75,833 |
| Employers Holdings, Inc. | 684 | 28,831 |
| Erie Indemnity Co., Class A | 340 | 41,069 |
| Everest Re Group Ltd. | 640 | 161,587 |
| First American Financial Corp. | 1,431 | 70,205 |
| FNF Group | 3,065 | 147,856 |
| Genworth Financial, Inc., Class A * | 18,742 | 64,285 |
| Horace Mann Educators Corp. | 477 | 16,766 |
| Infinity Property & Casualty Corp. | 318 | 28,127 |
| James River Group Holdings Ltd. | 352 | 14,038 |
| Kemper Corp. | 1,129 | 54,079 |
| Lincoln National Corp. | 2,728 | 185,122 |
| Loews Corp. | 6,043 | 281,483 |
| Markel Corp. * | 35 | 36,820 |
| Marsh & McLennan Cos., Inc. | 4,190 | 327,155 |
| MBIA, Inc. * | 3,100 | 31,186 |
| Mercury General Corp. | 225 | 12,931 |
| MetLife, Inc. | 10,361 | 485,206 |
| Old Republic International Corp. | 2,902 | 55,399 |
| Primerica, Inc. | 968 | 74,100 |
| Principal Financial Group, Inc. | 2,095 | 130,979 |
| ProAssurance Corp. | 966 | 51,439 |
| Prudential Financial, Inc. | 3,816 | 389,537 |
Schwab Fundamental Index ETFs | Semiannual Report
Schwab Fundamental U.S. Broad Market Index ETF
Portfolio Holdings as of August 31, 2017 (Unaudited) (continued)
| Security | Number
of Shares | Value ($) |
| Reinsurance Group of America, Inc. | 982 | 132,030 |
| RenaissanceRe Holdings Ltd. | 796 | 110,771 |
| RLI Corp. | 636 | 34,039 |
| Safety Insurance Group, Inc. | 159 | 11,353 |
| Selective Insurance Group, Inc. | 677 | 34,121 |
| Stewart Information Services Corp. | 320 | 11,546 |
| The Allstate Corp. | 5,983 | 541,461 |
| The Hanover Insurance Group, Inc. | 646 | 63,424 |
| The Hartford Financial Services Group, Inc. | 6,166 | 333,396 |
| The Progressive Corp. | 8,795 | 408,792 |
| The Travelers Cos., Inc. | 8,586 | 1,040,451 |
| Torchmark Corp. | 1,184 | 91,132 |
| Unum Group | 3,125 | 150,562 |
| Validus Holdings Ltd. | 1,125 | 56,419 |
| W.R. Berkley Corp. | 1,350 | 89,964 |
| White Mountains Insurance Group Ltd. | 70 | 60,975 |
| Willis Towers Watson plc | 466 | 69,187 |
| XL Group Ltd. | 3,685 | 150,938 |
| | | 9,958,479 |
| |
| Materials 4.2% |
| A. Schulman, Inc. | 517 | 15,717 |
| AdvanSix, Inc. * | 503 | 16,061 |
| Air Products & Chemicals, Inc. | 1,767 | 256,869 |
| AK Steel Holding Corp. * | 1,988 | 11,133 |
| Albemarle Corp. | 1,034 | 120,213 |
| Alcoa Corp. * | 2,811 | 123,347 |
| Allegheny Technologies, Inc. * | 4,413 | 91,923 |
| AptarGroup, Inc. | 960 | 80,266 |
| Ashland Global Holdings, Inc. | 1,074 | 66,642 |
| Avery Dennison Corp. | 1,146 | 108,022 |
| Axalta Coating Systems Ltd. * | 539 | 15,911 |
| Ball Corp. | 5,851 | 233,981 |
| Bemis Co., Inc. | 1,590 | 67,750 |
| Berry Global Group, Inc. * | 411 | 23,115 |
| Boise Cascade Co. * | 1,041 | 31,230 |
| Cabot Corp. | 1,279 | 67,378 |
| Calgon Carbon Corp. | 994 | 12,127 |
| Carpenter Technology Corp. | 1,024 | 41,503 |
| Celanese Corp., Series A | 1,431 | 138,836 |
| Century Aluminum Co. * | 1,596 | 31,154 |
| CF Industries Holdings, Inc. | 7,137 | 206,902 |
| Clearwater Paper Corp. * | 537 | 24,970 |
| Cleveland-Cliffs, Inc. * | 7,780 | 65,041 |
| Commercial Metals Co. | 4,452 | 84,098 |
| Compass Minerals International, Inc. | 318 | 21,242 |
| Crown Holdings, Inc. * | 954 | 56,315 |
| Domtar Corp. | 3,022 | 122,210 |
| E.I. du Pont de Nemours & Co. | 8,433 | 707,782 |
| Eagle Materials, Inc. | 110 | 10,697 |
| Eastman Chemical Co. | 2,212 | 190,674 |
| Ecolab, Inc. | 1,547 | 206,215 |
| Ferro Corp. * | 400 | 7,708 |
| FMC Corp. | 1,321 | 113,897 |
| Freeport-McMoRan, Inc. * | 51,579 | 762,338 |
| GCP Applied Technologies, Inc. * | 503 | 14,210 |
| Graphic Packaging Holding Co. | 3,657 | 47,724 |
| Greif, Inc., Class A | 828 | 50,053 |
| H.B. Fuller Co. | 636 | 31,921 |
| Hecla Mining Co. | 875 | 4,620 |
| Huntsman Corp. | 4,151 | 110,292 |
| Innophos Holdings, Inc. | 318 | 14,520 |
| Innospec, Inc. | 349 | 19,369 |
| International Flavors & Fragrances, Inc. | 636 | 87,036 |
| International Paper Co. | 6,728 | 362,437 |
| Kaiser Aluminum Corp. | 318 | 30,630 |
| KapStone Paper & Packaging Corp. | 1,457 | 32,593 |
| Security | Number
of Shares | Value ($) |
| Kraton Corp. * | 477 | 15,660 |
| Louisiana-Pacific Corp. * | 954 | 24,308 |
| LyondellBasell Industries N.V., Class A | 9,715 | 880,082 |
| Martin Marietta Materials, Inc. | 320 | 67,837 |
| Materion Corp. | 318 | 12,148 |
| Minerals Technologies, Inc. | 477 | 30,528 |
| Monsanto Co. | 5,480 | 642,256 |
| Neenah Paper, Inc. | 100 | 7,725 |
| NewMarket Corp. | 73 | 30,551 |
| Newmont Mining Corp. | 7,516 | 288,163 |
| Nucor Corp. | 5,641 | 310,875 |
| Olin Corp. | 1,592 | 51,310 |
| Owens-Illinois, Inc. * | 4,135 | 101,886 |
| P.H. Glatfelter Co. | 795 | 13,769 |
| Packaging Corp. of America | 799 | 89,815 |
| Platform Specialty Products Corp. * | 1,607 | 18,770 |
| PolyOne Corp. | 795 | 28,731 |
| PPG Industries, Inc. | 3,137 | 327,252 |
| Praxair, Inc. | 3,182 | 418,560 |
| Quaker Chemical Corp. | 71 | 9,885 |
| Rayonier Advanced Materials, Inc. | 805 | 11,045 |
| Reliance Steel & Aluminum Co. | 2,067 | 149,692 |
| Royal Gold, Inc. | 205 | 19,122 |
| RPM International, Inc. | 1,431 | 70,076 |
| Schnitzer Steel Industries, Inc., Class A | 2,705 | 72,764 |
| Schweitzer-Mauduit International, Inc. | 318 | 12,062 |
| Sealed Air Corp. | 1,120 | 49,706 |
| Sensient Technologies Corp. | 636 | 45,887 |
| Silgan Holdings, Inc. | 1,272 | 38,274 |
| Sonoco Products Co. | 1,749 | 84,407 |
| Southern Copper Corp. | 1,019 | 41,473 |
| Steel Dynamics, Inc. | 2,895 | 99,733 |
| Stepan Co. | 542 | 41,929 |
| SunCoke Energy, Inc. * | 3,098 | 28,873 |
| The Chemours Co. | 6,104 | 299,523 |
| The Dow Chemical Co. | 14,803 | 986,620 |
| The Mosaic Co. | 14,260 | 284,915 |
| The Scotts Miracle-Gro Co., Class A | 636 | 60,795 |
| The Sherwin-Williams Co. | 369 | 125,191 |
| TimkenSteel Corp. * | 1,825 | 27,065 |
| Trinseo S.A. | 303 | 20,271 |
| Tronox Ltd., Class A | 2,633 | 54,477 |
| United States Steel Corp. | 4,679 | 124,508 |
| Vulcan Materials Co. | 482 | 58,447 |
| W.R. Grace & Co. | 159 | 11,365 |
| Westlake Chemical Corp. | 487 | 37,455 |
| WestRock Co. | 2,228 | 126,795 |
| Worthington Industries, Inc. | 954 | 47,662 |
| | | 11,338,915 |
| |
| Media 3.0% |
| AMC Networks, Inc., Class A * | 159 | 9,664 |
| Cable One, Inc. | 25 | 18,969 |
| CBS Corp., Class B Non-Voting Shares | 7,264 | 465,332 |
| Charter Communications, Inc., Class A * | 452 | 180,140 |
| Cinemark Holdings, Inc. | 1,434 | 47,738 |
| Comcast Corp., Class A | 44,750 | 1,817,297 |
| Discovery Communications, Inc., Class A * | 2,958 | 65,697 |
| Discovery Communications, Inc., Class C * | 6,323 | 132,846 |
| DISH Network Corp., Class A * | 1,497 | 85,763 |
| Gannett Co., Inc. | 6,145 | 52,171 |
| John Wiley & Sons, Inc., Class A | 477 | 25,734 |
| Lions Gate Entertainment Corp., Class A * | 157 | 4,668 |
| Lions Gate Entertainment Corp., Class B * | 424 | 11,902 |
| Live Nation Entertainment, Inc. * | 1,050 | 41,958 |
| Meredith Corp. | 505 | 27,447 |
| News Corp., Class A | 7,382 | 98,697 |
Schwab Fundamental Index ETFs | Semiannual Report
Schwab Fundamental U.S. Broad Market Index ETF
Portfolio Holdings as of August 31, 2017 (Unaudited) (continued)
| Security | Number
of Shares | Value ($) |
| News Corp., Class B | 2,238 | 30,661 |
| Omnicom Group, Inc. | 3,339 | 241,677 |
| Regal Entertainment Group, Class A | 1,590 | 23,484 |
| Scholastic Corp. | 954 | 37,616 |
| Scripps Networks Interactive, Inc., Class A | 1,301 | 111,431 |
| Sinclair Broadcast Group, Inc., Class A | 341 | 10,315 |
| Sirius XM Holdings, Inc. (b) | 10,520 | 60,490 |
| TEGNA, Inc. | 3,500 | 44,170 |
| The Interpublic Group of Cos., Inc. | 3,556 | 71,618 |
| The New York Times Co., Class A | 1,808 | 33,719 |
| The Walt Disney Co. | 15,655 | 1,584,286 |
| Time Warner, Inc. | 13,673 | 1,382,340 |
| Time, Inc. | 4,835 | 63,580 |
| Tribune Media Co., Class A | 1,284 | 51,450 |
| Twenty-First Century Fox, Inc., Class A | 15,332 | 423,010 |
| Twenty-First Century Fox, Inc., Class B | 7,879 | 213,521 |
| Viacom, Inc., Class B | 15,090 | 431,574 |
| | | 7,900,965 |
| |
| Pharmaceuticals, Biotechnology & Life Sciences 5.7% |
| AbbVie, Inc. | 8,802 | 662,791 |
| Agilent Technologies, Inc. | 2,728 | 176,556 |
| Alexion Pharmaceuticals, Inc. * | 387 | 55,113 |
| Allergan plc | 578 | 132,639 |
| Amgen, Inc. | 6,249 | 1,110,885 |
| Bio-Rad Laboratories, Inc., Class A * | 280 | 60,990 |
| Bio-Techne Corp. | 159 | 19,681 |
| Biogen, Inc. * | 908 | 287,437 |
| Bristol-Myers Squibb Co. | 12,311 | 744,569 |
| Bruker Corp. | 510 | 14,836 |
| Catalent, Inc. * | 350 | 14,452 |
| Celgene Corp. * | 2,979 | 413,872 |
| Charles River Laboratories International, Inc. * | 572 | 62,234 |
| Eli Lilly & Co. | 9,002 | 731,773 |
| Endo International plc * | 1,088 | 9,564 |
| Gilead Sciences, Inc. | 10,959 | 917,378 |
| Illumina, Inc. * | 220 | 44,981 |
| Impax Laboratories, Inc. * | 1,054 | 22,819 |
| Johnson & Johnson | 22,411 | 2,966,544 |
| Mallinckrodt plc * | 630 | 25,880 |
| Merck & Co., Inc. | 34,070 | 2,175,710 |
| Mettler-Toledo International, Inc. * | 183 | 110,731 |
| Mylan N.V. * | 4,351 | 136,969 |
| Myriad Genetics, Inc. * | 1,737 | 52,961 |
| PAREXEL International Corp. * | 318 | 27,949 |
| PDL BioPharma, Inc. * | 8,527 | 26,604 |
| PerkinElmer, Inc. | 1,113 | 74,560 |
| Perrigo Co., plc | 993 | 78,407 |
| Pfizer, Inc. | 100,247 | 3,400,378 |
| QIAGEN N.V. * | 913 | 29,371 |
| Quintiles IMS Holdings, Inc. * | 603 | 57,906 |
| Regeneron Pharmaceuticals, Inc. * | 119 | 59,131 |
| Thermo Fisher Scientific, Inc. | 1,797 | 336,291 |
| United Therapeutics Corp. * | 426 | 55,721 |
| Vertex Pharmaceuticals, Inc. * | 100 | 16,054 |
| VWR Corp. * | 646 | 21,331 |
| Waters Corp. * | 496 | 91,006 |
| Zoetis, Inc. | 1,711 | 107,280 |
| | | 15,333,354 |
| |
| Real Estate 2.1% |
| Acadia Realty Trust | 503 | 14,431 |
| Alexandria Real Estate Equities, Inc. | 518 | 62,839 |
| Altisource Portfolio Solutions S.A. * | 393 | 8,953 |
| Altisource Residential Corp. | 1,862 | 22,549 |
| Security | Number
of Shares | Value ($) |
| American Campus Communities, Inc. | 982 | 46,733 |
| American Tower Corp. | 1,184 | 175,291 |
| Apartment Investment & Management Co., Class A | 743 | 33,680 |
| Apple Hospitality REIT, Inc. | 768 | 13,962 |
| Ashford Hospitality Trust, Inc. | 3,113 | 19,332 |
| AvalonBay Communities, Inc. | 477 | 89,547 |
| Boston Properties, Inc. | 807 | 97,324 |
| Brandywine Realty Trust | 1,749 | 30,048 |
| Brixmor Property Group, Inc. | 3,056 | 57,208 |
| Camden Property Trust | 678 | 60,667 |
| CBL & Associates Properties, Inc. | 4,992 | 39,936 |
| CBRE Group, Inc., Class A * | 1,846 | 66,604 |
| Chesapeake Lodging Trust | 503 | 12,872 |
| Columbia Property Trust, Inc. | 1,689 | 35,469 |
| CoreCivic, Inc. | 3,597 | 96,400 |
| Corporate Office Properties Trust | 1,278 | 42,634 |
| Crown Castle International Corp. | 1,229 | 133,273 |
| CubeSmart | 393 | 9,687 |
| DCT Industrial Trust, Inc. | 399 | 23,282 |
| DDR Corp. | 3,349 | 32,418 |
| DiamondRock Hospitality Co. | 1,590 | 17,474 |
| Digital Realty Trust, Inc. | 795 | 94,080 |
| Douglas Emmett, Inc. | 636 | 24,779 |
| Duke Realty Corp. | 2,544 | 75,608 |
| DuPont Fabros Technology, Inc. | 320 | 20,595 |
| EastGroup Properties, Inc. | 159 | 14,129 |
| EPR Properties | 318 | 22,152 |
| Equinix, Inc. | 164 | 76,819 |
| Equity Commonwealth * | 1,590 | 49,195 |
| Equity LifeStyle Properties, Inc. | 250 | 22,288 |
| Equity Residential | 2,358 | 158,340 |
| Essex Property Trust, Inc. | 196 | 52,130 |
| Extra Space Storage, Inc. | 318 | 24,686 |
| Federal Realty Investment Trust | 318 | 40,364 |
| First Industrial Realty Trust, Inc. | 503 | 15,583 |
| Franklin Street Properties Corp. | 1,027 | 10,239 |
| Gaming & Leisure Properties, Inc. | 1,018 | 39,895 |
| GGP, Inc. | 4,422 | 91,756 |
| Government Properties Income Trust | 482 | 8,941 |
| Gramercy Property Trust | 490 | 14,925 |
| HCP, Inc. | 3,867 | 115,275 |
| Healthcare Realty Trust, Inc. | 477 | 15,875 |
| Healthcare Trust of America, Inc., Class A | 494 | 15,349 |
| Hersha Hospitality Trust | 1,218 | 22,582 |
| Highwoods Properties, Inc. | 795 | 41,523 |
| Hospitality Properties Trust | 1,908 | 52,203 |
| Host Hotels & Resorts, Inc. | 9,039 | 163,787 |
| Investors Real Estate Trust | 1,349 | 8,472 |
| Iron Mountain, Inc. | 3,527 | 139,034 |
| JBG SMITH Properties * | 636 | 20,816 |
| Jones Lang LaSalle, Inc. | 533 | 64,978 |
| Kilroy Realty Corp. | 318 | 22,015 |
| Kimco Realty Corp. | 3,021 | 59,272 |
| Lamar Advertising Co., Class A | 377 | 25,093 |
| LaSalle Hotel Properties | 1,312 | 37,235 |
| Lexington Realty Trust | 2,475 | 24,404 |
| Liberty Property Trust | 1,113 | 47,414 |
| Life Storage, Inc. | 159 | 11,701 |
| Mack-Cali Realty Corp. | 1,749 | 40,035 |
| Medical Properties Trust, Inc. | 682 | 8,975 |
| Mid-America Apartment Communities, Inc. | 684 | 72,819 |
| Monogram Residential Trust, Inc. | 1,193 | 14,316 |
| National Retail Properties, Inc. | 481 | 20,120 |
| Omega Healthcare Investors, Inc. | 477 | 15,202 |
| Outfront Media, Inc. | 2,133 | 46,926 |
| Paramount Group, Inc. | 1,094 | 17,263 |
| Park Hotels & Resorts, Inc. | 754 | 20,124 |
Schwab Fundamental Index ETFs | Semiannual Report
Schwab Fundamental U.S. Broad Market Index ETF
Portfolio Holdings as of August 31, 2017 (Unaudited) (continued)
| Security | Number
of Shares | Value ($) |
| Pebblebrook Hotel Trust | 952 | 31,978 |
| Pennsylvania Real Estate Investment Trust | 1,159 | 11,625 |
| Piedmont Office Realty Trust, Inc., Class A | 2,407 | 48,742 |
| Potlatch Corp. | 636 | 30,401 |
| Prologis, Inc. | 2,154 | 136,477 |
| PS Business Parks, Inc. | 159 | 21,482 |
| Public Storage | 519 | 106,571 |
| Quality Care Properties, Inc. * | 1,527 | 20,950 |
| Rayonier, Inc. | 2,087 | 60,544 |
| Realogy Holdings Corp. | 2,534 | 85,903 |
| Realty Income Corp. | 850 | 48,926 |
| Regency Centers Corp. | 569 | 36,598 |
| Retail Properties of America, Inc., Class A | 2,299 | 30,646 |
| RLJ Lodging Trust | 2,339 | 47,201 |
| Ryman Hospitality Properties, Inc. | 318 | 18,896 |
| Sabra Health Care REIT, Inc. | 1,359 | 29,694 |
| SBA Communications Corp. * | 318 | 48,829 |
| Senior Housing Properties Trust | 2,502 | 49,339 |
| Simon Property Group, Inc. | 1,651 | 258,959 |
| SL Green Realty Corp. | 677 | 65,249 |
| Spirit Realty Capital, Inc. | 3,909 | 34,008 |
| Sun Communities, Inc. | 159 | 14,359 |
| Sunstone Hotel Investors, Inc. | 1,148 | 18,138 |
| Tanger Factory Outlet Centers, Inc. | 318 | 7,441 |
| Taubman Centers, Inc. | 318 | 16,612 |
| The GEO Group, Inc. | 2,195 | 60,670 |
| The Macerich Co. | 988 | 52,137 |
| Tier REIT, Inc. | 654 | 12,040 |
| UDR, Inc. | 1,291 | 50,117 |
| Ventas, Inc. | 2,568 | 175,754 |
| VEREIT, Inc. | 2,485 | 20,973 |
| Vornado Realty Trust | 1,273 | 94,826 |
| Washington Prime Group, Inc. | 2,726 | 22,762 |
| Washington Real Estate Investment Trust | 477 | 15,674 |
| Weingarten Realty Investors | 954 | 30,566 |
| Welltower, Inc. | 2,383 | 174,483 |
| Weyerhaeuser Co. | 7,554 | 246,336 |
| WP Carey, Inc. | 318 | 21,894 |
| Xenia Hotels & Resorts, Inc. | 1,012 | 20,200 |
| | | 5,519,925 |
| |
| Retailing 4.4% |
| Aaron's, Inc. | 1,341 | 59,366 |
| Abercrombie & Fitch Co., Class A (b) | 6,858 | 87,371 |
| Advance Auto Parts, Inc. | 529 | 51,789 |
| Amazon.com, Inc. * | 472 | 462,843 |
| American Eagle Outfitters, Inc. | 6,360 | 76,002 |
| Asbury Automotive Group, Inc. * | 720 | 38,772 |
| Ascena Retail Group, Inc. * | 6,000 | 12,240 |
| AutoNation, Inc. *(b) | 1,804 | 81,847 |
| AutoZone, Inc. * | 101 | 53,372 |
| Barnes & Noble Education, Inc. * | 1,661 | 8,604 |
| Bed Bath & Beyond, Inc. | 8,256 | 227,783 |
| Best Buy Co., Inc. | 9,193 | 498,812 |
| Big Lots, Inc. | 2,245 | 106,862 |
| Burlington Stores, Inc. * | 328 | 28,579 |
| Cabela's, Inc. * | 392 | 21,050 |
| Caleres, Inc. | 1,113 | 30,029 |
| CarMax, Inc. * | 2,106 | 141,418 |
| Chico's FAS, Inc. | 5,780 | 44,390 |
| Core-Mark Holding Co., Inc. | 2,197 | 59,451 |
| Dick's Sporting Goods, Inc. | 1,457 | 38,407 |
| Dillard's, Inc., Class A (b) | 1,633 | 99,286 |
| Dollar General Corp. | 4,669 | 338,783 |
| Dollar Tree, Inc. * | 2,422 | 192,888 |
| DSW, Inc., Class A | 2,544 | 47,140 |
| Expedia, Inc. | 547 | 81,153 |
| Security | Number
of Shares | Value ($) |
| Express, Inc. * | 1,988 | 12,664 |
| Five Below, Inc. * | 212 | 10,085 |
| Foot Locker, Inc. | 1,812 | 63,837 |
| GameStop Corp., Class A | 7,077 | 130,925 |
| Genesco, Inc. * | 561 | 11,865 |
| Genuine Parts Co. | 2,386 | 197,632 |
| GNC Holdings, Inc., Class A (b) | 5,755 | 47,767 |
| Group 1 Automotive, Inc. | 636 | 38,173 |
| Guess?, Inc. | 5,100 | 79,458 |
| HSN, Inc. | 1,063 | 39,012 |
| J.C. Penney Co., Inc. *(b) | 10,668 | 41,285 |
| Kohl's Corp. | 11,235 | 446,928 |
| L Brands, Inc. | 3,634 | 131,624 |
| Liberty Interactive Corp. QVC Group, Class A * | 8,862 | 196,027 |
| Liberty TripAdvisor Holdings, Inc., Class A * | 1,207 | 16,113 |
| Lithia Motors, Inc., Class A | 187 | 20,196 |
| LKQ Corp. * | 2,412 | 83,576 |
| Lowe's Cos., Inc. | 14,947 | 1,104,434 |
| Lumber Liquidators Holdings, Inc. * | 957 | 35,916 |
| Macy's, Inc. | 11,480 | 238,440 |
| Monro, Inc. | 159 | 7,584 |
| Murphy USA, Inc. * | 2,196 | 141,554 |
| Netflix, Inc. * | 360 | 62,896 |
| Nordstrom, Inc. (b) | 3,545 | 158,178 |
| O'Reilly Automotive, Inc. * | 652 | 127,877 |
| Office Depot, Inc. | 15,180 | 65,122 |
| Penske Automotive Group, Inc. | 795 | 33,676 |
| Pier 1 Imports, Inc. | 7,804 | 32,699 |
| Pool Corp. | 318 | 31,701 |
| Rent-A-Center, Inc. (b) | 4,993 | 60,415 |
| RH * | 390 | 18,248 |
| Ross Stores, Inc. | 3,253 | 190,138 |
| Sally Beauty Holdings, Inc. * | 1,457 | 27,086 |
| Select Comfort Corp. * | 314 | 9,272 |
| Shoe Carnival, Inc. | 1,006 | 20,221 |
| Shutterfly, Inc. * | 503 | 22,927 |
| Signet Jewelers Ltd. | 1,318 | 83,126 |
| Sonic Automotive, Inc., Class A | 1,113 | 20,145 |
| Staples, Inc. | 45,309 | 462,831 |
| Target Corp. | 18,043 | 983,885 |
| The Children's Place, Inc. | 353 | 37,471 |
| The Finish Line, Inc., Class A | 1,000 | 8,330 |
| The Gap, Inc. | 9,739 | 230,035 |
| The Home Depot, Inc. | 12,858 | 1,927,028 |
| The Michaels Cos., Inc. * | 380 | 8,531 |
| The Priceline Group, Inc. * | 152 | 281,516 |
| The TJX Cos., Inc. | 7,745 | 559,964 |
| Tiffany & Co. | 1,242 | 113,519 |
| Tractor Supply Co. | 1,565 | 93,133 |
| TripAdvisor, Inc. * | 700 | 29,911 |
| Urban Outfitters, Inc. * | 2,254 | 46,072 |
| Williams-Sonoma, Inc. | 1,778 | 81,788 |
| Zumiez, Inc. * | 1,006 | 12,525 |
| | | 11,823,598 |
| |
| Semiconductors & Semiconductor Equipment 2.9% |
| Amkor Technology, Inc. * | 1,698 | 14,908 |
| Analog Devices, Inc. | 2,356 | 197,127 |
| Applied Materials, Inc. | 8,709 | 392,950 |
| Broadcom Ltd. | 499 | 125,783 |
| Brooks Automation, Inc. | 1,272 | 33,161 |
| Cabot Microelectronics Corp. | 415 | 29,722 |
| Cirrus Logic, Inc. * | 507 | 29,396 |
| Cree, Inc. * | 821 | 19,975 |
| Cypress Semiconductor Corp. | 2,272 | 31,104 |
| Diodes, Inc. * | 597 | 16,800 |
| Entegris, Inc. * | 1,590 | 40,465 |
Schwab Fundamental Index ETFs | Semiannual Report
Schwab Fundamental U.S. Broad Market Index ETF
Portfolio Holdings as of August 31, 2017 (Unaudited) (continued)
| Security | Number
of Shares | Value ($) |
| First Solar, Inc. * | 1,538 | 72,224 |
| Integrated Device Technology, Inc. * | 431 | 10,650 |
| Intel Corp. | 83,849 | 2,940,584 |
| KLA-Tencor Corp. | 1,785 | 167,237 |
| Lam Research Corp. | 1,149 | 190,711 |
| Marvell Technology Group Ltd. | 9,367 | 167,763 |
| Maxim Integrated Products, Inc. | 3,180 | 148,379 |
| Microchip Technology, Inc. | 1,393 | 120,912 |
| Micron Technology, Inc. * | 11,396 | 364,330 |
| Microsemi Corp. * | 404 | 20,354 |
| MKS Instruments, Inc. | 636 | 52,375 |
| NVIDIA Corp. | 1,477 | 250,263 |
| NXP Semiconductor N.V. * | 674 | 76,135 |
| ON Semiconductor Corp. * | 4,134 | 70,609 |
| Photronics, Inc. * | 1,272 | 10,049 |
| Power Integrations, Inc. | 251 | 18,285 |
| Qorvo, Inc. * | 915 | 66,996 |
| QUALCOMM, Inc. | 17,666 | 923,402 |
| Silicon Laboratories, Inc. * | 477 | 36,204 |
| Skyworks Solutions, Inc. | 549 | 57,843 |
| Teradyne, Inc. | 1,590 | 56,620 |
| Texas Instruments, Inc. | 8,882 | 735,607 |
| Veeco Instruments, Inc. * | 334 | 6,313 |
| Versum Materials, Inc. | 866 | 31,981 |
| Xilinx, Inc. | 1,950 | 128,817 |
| | | 7,656,034 |
| |
| Software & Services 7.2% |
| Accenture plc, Class A | 5,778 | 755,531 |
| ACI Worldwide, Inc. * | 483 | 10,993 |
| Activision Blizzard, Inc. | 5,375 | 352,385 |
| Acxiom Corp. * | 1,272 | 29,625 |
| Adobe Systems, Inc. * | 1,370 | 212,569 |
| Akamai Technologies, Inc. * | 803 | 37,861 |
| Alliance Data Systems Corp. | 334 | 75,317 |
| Alphabet, Inc., Class A * | 880 | 840,611 |
| Alphabet, Inc., Class C * | 842 | 790,916 |
| Amdocs Ltd. | 2,226 | 144,223 |
| ANSYS, Inc. * | 349 | 44,958 |
| Autodesk, Inc. * | 883 | 101,068 |
| Automatic Data Processing, Inc. | 2,912 | 310,041 |
| Booz Allen Hamilton Holding Corp. | 1,815 | 61,910 |
| Broadridge Financial Solutions, Inc. | 1,113 | 86,959 |
| CA, Inc. | 4,825 | 160,094 |
| CACI International, Inc., Class A * | 642 | 83,332 |
| Cadence Design Systems, Inc. * | 795 | 31,236 |
| Cardtronics plc, Class A * | 382 | 9,924 |
| Cars.com, Inc. * | 1,167 | 30,179 |
| CDK Global, Inc. | 740 | 47,730 |
| Cimpress N.V. * | 318 | 29,396 |
| Citrix Systems, Inc. * | 1,137 | 88,925 |
| Cognizant Technology Solutions Corp., Class A | 3,395 | 240,264 |
| Convergys Corp. | 2,385 | 56,048 |
| CoreLogic, Inc. * | 1,624 | 76,279 |
| CSG Systems International, Inc. | 212 | 8,207 |
| CSRA, Inc. | 2,428 | 76,506 |
| DST Systems, Inc. | 789 | 40,499 |
| eBay, Inc. * | 7,056 | 254,933 |
| Electronic Arts, Inc. * | 836 | 101,574 |
| Euronet Worldwide, Inc. * | 320 | 31,446 |
| Facebook, Inc., Class A * | 1,639 | 281,859 |
| Fair Isaac Corp. | 253 | 35,612 |
| Fidelity National Information Services, Inc. | 3,180 | 295,486 |
| First Data Corp., Class A * | 2,157 | 39,710 |
| Fiserv, Inc. * | 1,669 | 206,472 |
| FleetCor Technologies, Inc. * | 157 | 22,572 |
| Security | Number
of Shares | Value ($) |
| Gartner, Inc. * | 333 | 40,156 |
| Genpact Ltd. | 1,117 | 31,779 |
| Global Payments, Inc. | 863 | 82,408 |
| IAC/InterActiveCorp * | 928 | 105,337 |
| International Business Machines Corp. | 19,940 | 2,852,018 |
| Intuit, Inc. | 1,930 | 272,998 |
| j2 Global, Inc. | 318 | 23,939 |
| Jack Henry & Associates, Inc. | 477 | 49,164 |
| Leidos Holdings, Inc. | 2,178 | 127,021 |
| Manhattan Associates, Inc. * | 157 | 6,602 |
| ManTech International Corp., Class A | 1,280 | 51,482 |
| MasterCard, Inc., Class A | 4,323 | 576,256 |
| MAXIMUS, Inc. | 477 | 28,992 |
| Microsoft Corp. | 62,087 | 4,642,245 |
| Nuance Communications, Inc. * | 1,119 | 17,982 |
| Oracle Corp. | 36,643 | 1,844,242 |
| Paychex, Inc. | 2,013 | 114,801 |
| PayPal Holdings, Inc. * | 2,692 | 166,043 |
| Progress Software Corp. | 477 | 16,018 |
| PTC, Inc. * | 280 | 15,680 |
| Red Hat, Inc. * | 546 | 58,695 |
| salesforce.com, Inc. * | 318 | 30,366 |
| Science Applications International Corp. | 575 | 42,481 |
| SS&C Technologies Holdings, Inc. | 416 | 16,103 |
| Sykes Enterprises, Inc. * | 795 | 21,195 |
| Symantec Corp. | 10,007 | 300,010 |
| Synopsys, Inc. * | 959 | 77,123 |
| Take-Two Interactive Software, Inc. * | 795 | 77,743 |
| Teradata Corp. * | 2,800 | 89,376 |
| The Western Union Co. | 9,244 | 174,896 |
| TiVo Corp. | 1,335 | 24,431 |
| Total System Services, Inc. | 1,075 | 74,304 |
| Travelport Worldwide Ltd. | 1,229 | 18,607 |
| Unisys Corp. * | 2,622 | 20,321 |
| Vantiv, Inc., Class A * | 321 | 22,691 |
| Verint Systems, Inc. * | 257 | 10,203 |
| VeriSign, Inc. * | 551 | 57,166 |
| Visa, Inc., Class A | 8,086 | 837,063 |
| VMware, Inc., Class A * | 233 | 25,187 |
| WebMD Health Corp. * | 354 | 23,520 |
| WEX, Inc. * | 79 | 8,622 |
| Zynga, Inc., Class A * | 3,923 | 14,711 |
| | | 19,193,227 |
| |
| Technology Hardware & Equipment 6.0% |
| ADTRAN, Inc. | 954 | 21,083 |
| Amphenol Corp., Class A | 1,910 | 154,595 |
| Anixter International, Inc. * | 1,118 | 82,508 |
| Apple, Inc. | 47,356 | 7,766,384 |
| ARRIS International plc * | 452 | 12,593 |
| Arrow Electronics, Inc. * | 3,180 | 252,587 |
| Avnet, Inc. | 5,624 | 216,918 |
| AVX Corp. | 1,069 | 18,654 |
| Belden, Inc. | 477 | 36,762 |
| Benchmark Electronics, Inc. * | 1,908 | 62,010 |
| Brocade Communications Systems, Inc. | 5,253 | 65,032 |
| CDW Corp. | 982 | 62,279 |
| Cisco Systems, Inc. | 58,073 | 1,870,531 |
| Cognex Corp. | 318 | 34,653 |
| Coherent, Inc. * | 24 | 5,600 |
| CommScope Holding Co., Inc. * | 1,145 | 37,854 |
| Comtech Telecommunications Corp. | 1,771 | 34,659 |
| Corning, Inc. | 16,288 | 468,443 |
| Diebold Nixdorf, Inc. | 917 | 18,753 |
| Dolby Laboratories, Inc., Class A | 830 | 41,882 |
| EchoStar Corp., Class A * | 477 | 28,763 |
| Electronics For Imaging, Inc. * | 228 | 8,108 |
Schwab Fundamental Index ETFs | Semiannual Report
Schwab Fundamental U.S. Broad Market Index ETF
Portfolio Holdings as of August 31, 2017 (Unaudited) (continued)
| Security | Number
of Shares | Value ($) |
| ePlus, Inc. * | 176 | 14,731 |
| F5 Networks, Inc. * | 547 | 65,301 |
| Fabrinet * | 486 | 18,876 |
| Finisar Corp. * | 636 | 15,359 |
| FLIR Systems, Inc. | 1,622 | 61,636 |
| Harmonic, Inc. * | 2,709 | 8,804 |
| Harris Corp. | 1,581 | 194,305 |
| Hewlett Packard Enterprise Co. | 29,548 | 533,637 |
| HP, Inc. | 45,124 | 860,966 |
| II-VI, Inc. * | 754 | 27,031 |
| Insight Enterprises, Inc. * | 1,431 | 57,355 |
| InterDigital, Inc. | 318 | 22,689 |
| IPG Photonics Corp. * | 163 | 28,654 |
| Itron, Inc. * | 660 | 47,916 |
| Jabil, Inc. | 5,566 | 174,494 |
| Juniper Networks, Inc. | 6,047 | 167,683 |
| Keysight Technologies, Inc. * | 1,769 | 72,281 |
| Knowles Corp. * | 1,839 | 26,978 |
| Littelfuse, Inc. | 159 | 29,599 |
| Lumentum Holdings, Inc. * | 297 | 16,885 |
| Methode Electronics, Inc. | 336 | 13,742 |
| Motorola Solutions, Inc. | 4,092 | 360,587 |
| National Instruments Corp. | 636 | 25,688 |
| NCR Corp. * | 1,782 | 65,097 |
| NetApp, Inc. | 4,361 | 168,596 |
| NETGEAR, Inc. * | 797 | 38,256 |
| NetScout Systems, Inc. * | 402 | 13,166 |
| OSI Systems, Inc. * | 406 | 33,722 |
| Plantronics, Inc. | 318 | 13,556 |
| Plexus Corp. * | 795 | 41,404 |
| Rogers Corp. * | 100 | 11,855 |
| Sanmina Corp. * | 2,087 | 78,158 |
| ScanSource, Inc. * | 636 | 24,963 |
| SYNNEX Corp. | 807 | 96,525 |
| Tech Data Corp. * | 2,397 | 264,365 |
| Trimble, Inc. * | 1,202 | 46,493 |
| TTM Technologies, Inc. * | 1,302 | 18,541 |
| VeriFone Systems, Inc. * | 1,117 | 22,083 |
| ViaSat, Inc. * | 159 | 10,114 |
| Viavi Solutions, Inc. * | 2,544 | 25,542 |
| Vishay Intertechnology, Inc. | 5,009 | 88,659 |
| Western Digital Corp. | 4,488 | 396,156 |
| Xerox Corp. | 8,462 | 273,069 |
| Zebra Technologies Corp., Class A * | 478 | 49,277 |
| | | 15,925,445 |
| |
| Telecommunication Services 3.0% |
| AT&T, Inc. | 110,586 | 4,142,551 |
| ATN International, Inc. | 251 | 15,203 |
| CenturyLink, Inc. (b) | 25,076 | 494,499 |
| Cincinnati Bell, Inc. * | 1,754 | 36,922 |
| Consolidated Communications Holdings, Inc. | 636 | 11,734 |
| Frontier Communications Corp. (b) | 5,314 | 71,580 |
| General Communication, Inc., Class A * | 497 | 21,436 |
| Iridium Communications, Inc. * | 1,193 | 13,242 |
| Level 3 Communications, Inc. * | 1,119 | 60,907 |
| Sprint Corp. * | 2,214 | 18,265 |
| T-Mobile US, Inc. * | 1,347 | 87,164 |
| Telephone & Data Systems, Inc. | 3,831 | 112,287 |
| Verizon Communications, Inc. | 58,699 | 2,815,791 |
| Vonage Holdings Corp. * | 3,736 | 31,009 |
| Windstream Holdings, Inc. | 10,133 | 20,975 |
| Zayo Group Holdings, Inc. * | 523 | 17,871 |
| | | 7,971,436 |
| |
| Security | Number
of Shares | Value ($) |
| Transportation 2.2% |
| Alaska Air Group, Inc. | 957 | 71,450 |
| Allegiant Travel Co. | 66 | 7,788 |
| AMERCO | 26 | 9,703 |
| American Airlines Group, Inc. | 4,210 | 188,355 |
| ArcBest Corp. | 1,254 | 37,244 |
| Atlas Air Worldwide Holdings, Inc. * | 486 | 32,465 |
| Avis Budget Group, Inc. * | 3,605 | 130,609 |
| C.H. Robinson Worldwide, Inc. | 2,450 | 173,043 |
| Copa Holdings S.A., Class A | 641 | 79,529 |
| CSX Corp. | 12,664 | 635,733 |
| Delta Air Lines, Inc. | 1,755 | 82,818 |
| Echo Global Logistics, Inc. * | 654 | 9,941 |
| Expeditors International of Washington, Inc. | 2,788 | 156,407 |
| FedEx Corp. | 4,589 | 983,790 |
| Forward Air Corp. | 318 | 16,526 |
| Genesee & Wyoming, Inc., Class A * | 159 | 10,901 |
| Hawaiian Holdings, Inc. * | 502 | 21,511 |
| Heartland Express, Inc. | 795 | 17,625 |
| Hertz Global Holdings, Inc. * | 7,402 | 160,919 |
| Hub Group, Inc., Class A * | 636 | 24,454 |
| J.B. Hunt Transport Services, Inc. | 795 | 78,617 |
| JetBlue Airways Corp. * | 3,363 | 66,621 |
| Kansas City Southern | 810 | 83,778 |
| Kirby Corp. * | 890 | 55,714 |
| Knight Transportation, Inc. | 795 | 31,045 |
| Landstar System, Inc. | 636 | 59,371 |
| Macquarie Infrastructure Corp. | 493 | 36,719 |
| Marten Transport Ltd. | 825 | 14,149 |
| Matson, Inc. | 850 | 21,930 |
| Norfolk Southern Corp. | 3,745 | 451,347 |
| Old Dominion Freight Line, Inc. | 631 | 63,037 |
| Roadrunner Transportation Systems, Inc. * | 2,944 | 21,992 |
| Ryder System, Inc. | 1,413 | 109,649 |
| Saia, Inc. * | 214 | 12,102 |
| SkyWest, Inc. | 1,677 | 58,192 |
| Southwest Airlines Co. | 1,378 | 71,849 |
| Spirit Airlines, Inc. * | 702 | 23,903 |
| Swift Transportation Co. * | 954 | 26,760 |
| Union Pacific Corp. | 10,062 | 1,059,529 |
| United Continental Holdings, Inc. * | 830 | 51,427 |
| United Parcel Service, Inc., Class B | 5,331 | 609,653 |
| Werner Enterprises, Inc. | 1,113 | 36,840 |
| | | 5,895,035 |
| |
| Utilities 4.1% |
| AES Corp. | 25,627 | 282,922 |
| ALLETE, Inc. | 477 | 36,886 |
| Alliant Energy Corp. | 2,922 | 124,886 |
| Ameren Corp. | 3,828 | 229,642 |
| American Electric Power Co., Inc. | 7,105 | 523,141 |
| American States Water Co. | 318 | 15,677 |
| American Water Works Co., Inc. | 1,530 | 123,777 |
| Aqua America, Inc. | 955 | 31,897 |
| Atmos Energy Corp. | 809 | 71,224 |
| Avangrid, Inc. | 503 | 24,556 |
| Avista Corp. | 954 | 49,036 |
| Black Hills Corp. | 477 | 33,571 |
| California Water Service Group | 477 | 17,864 |
| Calpine Corp. * | 13,630 | 200,361 |
| CenterPoint Energy, Inc. | 7,337 | 217,322 |
| CMS Energy Corp. | 3,034 | 147,270 |
| Consolidated Edison, Inc. | 4,622 | 389,496 |
| Dominion Energy, Inc. | 5,899 | 464,664 |
| DTE Energy Co. | 2,347 | 263,615 |
| Duke Energy Corp. | 9,061 | 791,025 |
Schwab Fundamental Index ETFs | Semiannual Report
Schwab Fundamental U.S. Broad Market Index ETF
Portfolio Holdings as of August 31, 2017 (Unaudited) (continued)
| Security | Number
of Shares | Value ($) |
| Dynegy, Inc. * | 2,565 | 24,162 |
| Edison International | 4,160 | 333,549 |
| El Paso Electric Co. | 477 | 26,497 |
| Entergy Corp. | 4,069 | 322,143 |
| Eversource Energy | 3,285 | 206,955 |
| Exelon Corp. | 19,120 | 724,074 |
| FirstEnergy Corp. | 10,974 | 357,533 |
| Great Plains Energy, Inc. | 2,396 | 73,533 |
| Hawaiian Electric Industries, Inc. | 1,635 | 54,642 |
| IDACORP, Inc. | 477 | 42,443 |
| MDU Resources Group, Inc. | 4,007 | 108,349 |
| MGE Energy, Inc. | 320 | 20,352 |
| National Fuel Gas Co. | 668 | 38,731 |
| New Jersey Resources Corp. | 1,272 | 55,523 |
| NextEra Energy, Inc. | 4,041 | 608,211 |
| NiSource, Inc. | 2,718 | 73,033 |
| Northwest Natural Gas Co. | 477 | 31,625 |
| NorthWestern Corp. | 477 | 28,773 |
| NRG Energy, Inc. | 12,854 | 320,193 |
| OGE Energy Corp. | 3,097 | 110,625 |
| ONE Gas, Inc. | 279 | 20,992 |
| Otter Tail Corp. | 336 | 14,045 |
| PG&E Corp. | 6,437 | 453,036 |
| Pinnacle West Capital Corp. | 1,749 | 157,358 |
| PNM Resources, Inc. | 1,272 | 53,933 |
| Portland General Electric Co. | 1,286 | 61,098 |
| PPL Corp. | 9,240 | 362,578 |
| Public Service Enterprise Group, Inc. | 8,351 | 391,161 |
| SCANA Corp. | 1,361 | 82,177 |
| Sempra Energy | 2,434 | 287,042 |
| South Jersey Industries, Inc. | 360 | 12,917 |
| Spire, Inc. | 477 | 36,491 |
| The Southern Co. | 12,969 | 625,884 |
| UGI Corp. | 1,852 | 91,507 |
| Vectren Corp. | 1,272 | 83,456 |
| WEC Energy Group, Inc. | 2,804 | 182,877 |
| Westar Energy, Inc. | 1,444 | 74,092 |
| WGL Holdings, Inc. | 547 | 46,090 |
| Xcel Energy, Inc. | 6,291 | 311,404 |
| | | 10,947,916 |
| Total Common Stock |
| (Cost $235,599,208) | | 266,109,436 |
|
| Other Investment Companies 0.8% of net assets |
| |
| Money Market Fund 0.2% |
| State Street Institutional U.S. Government Money Market Fund, Premier Class 0.93% (c) | 526,652 | 526,652 |
| |
| Securities Lending Collateral 0.6% |
| Wells Fargo Government Money Market Fund, Select Class 0.92% (c) | 1,646,898 | 1,646,898 |
| Total Other Investment Companies |
| (Cost $2,173,550) | | 2,173,550 |
| | Number of
Contracts | Notional
Amount
($) | Current Value/
Unrealized
Appreciation
($) |
| Futures Contracts | | | |
| Long | |
| S&P 500 Index, e-mini, expires 09/15/17 | 10 | 1,235,050 | 7,219 |
| * | Non-income producing security. |
| (a) | Issuer is affiliated with the fund's investment adviser. |
| (b) | All or a portion of this security is on loan. Securities on loan were valued at $1,592,372. |
| (c) | The rate shown is the 7-day yield. |
| | |
| REIT — | Real Estate Investment Trust |
Schwab Fundamental Index ETFs | Semiannual Report
Schwab Fundamental U.S. Large Company Index ETF
Portfolio Holdings as of August 31, 2017 (Unaudited)
This section shows all the securities in the fund's portfolio and their values as of the report date.
The fund files its complete schedule of portfolio holdings with the SEC for the first and third quarters of each fiscal year on Form N-Q. The fund's Form N-Q is available on the SEC's website at www.sec.gov and may be viewed and copied at the SEC's Public Reference Room in Washington, D.C. Call 1-800-SEC-0330 for information on the operation of the Public Reference Room. The fund also makes available its complete schedule of portfolio holdings on a daily basis on the fund's website at www.schwabfunds.com/schwabetfs_prospectus.
| Security | Number
of Shares | Value ($) |
| Common Stock 99.7% of net assets |
| |
| Automobiles & Components 1.5% |
| Adient plc | 17,983 | 1,271,038 |
| BorgWarner, Inc. | 49,731 | 2,308,016 |
| Cooper Tire & Rubber Co. (b) | 16,614 | 558,230 |
| Dana, Inc. | 43,320 | 1,042,712 |
| Delphi Automotive plc | 38,136 | 3,676,310 |
| Ford Motor Co. | 1,112,491 | 12,270,776 |
| General Motors Co. | 422,688 | 15,445,020 |
| Harley-Davidson, Inc. | 34,322 | 1,613,477 |
| Lear Corp. | 14,648 | 2,190,462 |
| Tenneco, Inc. | 10,169 | 551,160 |
| The Goodyear Tire & Rubber Co. | 58,377 | 1,768,823 |
| Thor Industries, Inc. | 7,700 | 836,528 |
| Visteon Corp. * | 13,268 | 1,531,658 |
| | | 45,064,210 |
| |
| Banks 5.0% |
| Bank of America Corp. | 773,323 | 18,474,687 |
| BB&T Corp. | 83,793 | 3,862,019 |
| CIT Group, Inc. | 33,285 | 1,492,832 |
| Citigroup, Inc. | 380,595 | 25,891,878 |
| Citizens Financial Group, Inc. | 55,849 | 1,850,277 |
| Comerica, Inc. | 13,880 | 947,310 |
| Fifth Third Bancorp | 107,016 | 2,796,328 |
| Huntington Bancshares, Inc. | 110,144 | 1,386,713 |
| JPMorgan Chase & Co. | 425,633 | 38,685,783 |
| KeyCorp | 104,302 | 1,795,037 |
| M&T Bank Corp. | 11,803 | 1,745,192 |
| New York Community Bancorp, Inc. | 84,635 | 1,019,852 |
| People's United Financial, Inc. | 46,271 | 772,726 |
| PHH Corp. * | 56,722 | 805,452 |
| Regions Financial Corp. | 139,069 | 1,962,264 |
| SunTrust Banks, Inc. | 55,311 | 3,047,636 |
| The PNC Financial Services Group, Inc. | 51,566 | 6,466,892 |
| U.S. Bancorp | 181,605 | 9,307,256 |
| Wells Fargo & Co. | 575,195 | 29,375,209 |
| | | 151,685,343 |
| |
| Capital Goods 8.4% |
| 3M Co. | 74,613 | 15,244,928 |
| AECOM * | 34,072 | 1,141,412 |
| AGCO Corp. | 27,433 | 1,877,789 |
| Allison Transmission Holdings, Inc. | 17,678 | 613,957 |
| AMETEK, Inc. | 22,303 | 1,410,665 |
| Arconic, Inc. | 81,738 | 2,081,867 |
| Carlisle Cos., Inc. | 7,122 | 674,382 |
| Caterpillar, Inc. | 127,242 | 14,949,663 |
| Chicago Bridge & Iron Co. N.V. (b) | 33,295 | 410,860 |
| Cummins, Inc. | 32,484 | 5,177,300 |
| Deere & Co. | 85,855 | 9,953,170 |
| Donaldson Co., Inc. | 15,056 | 711,396 |
| Dover Corp. | 30,891 | 2,622,028 |
| Eaton Corp. plc | 69,494 | 4,986,889 |
| EMCOR Group, Inc. | 13,035 | 860,831 |
| Security | Number
of Shares | Value ($) |
| Emerson Electric Co. | 142,875 | 8,435,340 |
| Fastenal Co. | 33,705 | 1,438,192 |
| Flowserve Corp. | 31,079 | 1,220,783 |
| Fluor Corp. | 79,072 | 3,049,807 |
| Fortive Corp. | 21,833 | 1,418,490 |
| Fortune Brands Home & Security, Inc. | 15,362 | 960,586 |
| General Dynamics Corp. | 38,560 | 7,764,056 |
| General Electric Co. | 1,198,752 | 29,429,362 |
| Honeywell International, Inc. | 75,218 | 10,400,393 |
| Hubbell, Inc. | 9,111 | 1,027,630 |
| Huntington Ingalls Industries, Inc. | 4,288 | 917,460 |
| IDEX Corp. | 7,782 | 915,008 |
| Illinois Tool Works, Inc. | 50,501 | 6,944,392 |
| Ingersoll-Rand plc | 36,150 | 3,086,848 |
| Jacobs Engineering Group, Inc. | 35,877 | 1,954,938 |
| Johnson Controls International plc | 151,159 | 5,984,385 |
| KBR, Inc. | 65,054 | 1,058,429 |
| Lincoln Electric Holdings, Inc. | 11,053 | 959,843 |
| Lockheed Martin Corp. | 31,118 | 9,503,126 |
| Masco Corp. | 20,020 | 736,135 |
| MSC Industrial Direct Co., Inc., Class A | 7,430 | 511,778 |
| Nordson Corp. | 4,774 | 521,798 |
| Northrop Grumman Corp. | 30,895 | 8,409,928 |
| Oshkosh Corp. | 22,038 | 1,644,035 |
| Owens Corning | 21,358 | 1,583,269 |
| PACCAR, Inc. | 56,628 | 3,756,135 |
| Parker-Hannifin Corp. | 23,627 | 3,801,348 |
| Pentair plc | 25,937 | 1,609,391 |
| Quanta Services, Inc. * | 48,424 | 1,739,874 |
| Raytheon Co. | 45,091 | 8,207,013 |
| Regal Beloit Corp. | 9,199 | 693,605 |
| Rockwell Automation, Inc. | 14,262 | 2,339,824 |
| Rockwell Collins, Inc. | 19,545 | 2,561,372 |
| Roper Technologies, Inc. | 5,322 | 1,227,573 |
| Snap-on, Inc. | 5,322 | 785,368 |
| Spirit AeroSystems Holdings, Inc., Class A | 12,839 | 956,505 |
| Stanley Black & Decker, Inc. | 19,529 | 2,812,176 |
| Terex Corp. | 26,843 | 1,034,798 |
| Textron, Inc. | 42,739 | 2,098,058 |
| The Boeing Co. | 71,943 | 17,241,859 |
| The Timken Co. | 20,931 | 938,755 |
| TransDigm Group, Inc. | 4,773 | 1,244,130 |
| Trinity Industries, Inc. | 37,456 | 1,080,231 |
| United Rentals, Inc. * | 14,703 | 1,735,836 |
| United Technologies Corp. | 145,045 | 17,364,787 |
| Valmont Industries, Inc. | 5,580 | 801,009 |
| W.W. Grainger, Inc. | 12,053 | 1,959,456 |
| WABCO Holdings, Inc. * | 5,956 | 855,401 |
| Wabtec Corp. | 7,785 | 549,387 |
| Watsco, Inc. | 3,875 | 571,020 |
| WESCO International, Inc. * | 15,259 | 769,817 |
| Xylem, Inc. | 17,725 | 1,100,191 |
| | | 252,428,067 |
| |
| Commercial & Professional Services 0.6% |
| ABM Industries, Inc. | 14,471 | 642,947 |
| Cintas Corp. | 10,174 | 1,373,592 |
| Equifax, Inc. | 7,299 | 1,039,889 |
Schwab Fundamental Index ETFs | Semiannual Report
Schwab Fundamental U.S. Large Company Index ETF
Portfolio Holdings as of August 31, 2017 (Unaudited) (continued)
| Security | Number
of Shares | Value ($) |
| LSC Communications, Inc. | 15,651 | 252,138 |
| ManpowerGroup, Inc. | 28,971 | 3,230,556 |
| Nielsen Holdings plc | 36,366 | 1,412,819 |
| Pitney Bowes, Inc. | 66,637 | 856,285 |
| Republic Services, Inc. | 35,577 | 2,321,043 |
| Robert Half International, Inc. | 25,415 | 1,151,299 |
| The Dun & Bradstreet Corp. | 7,099 | 791,113 |
| Waste Management, Inc. | 60,810 | 4,689,059 |
| | | 17,760,740 |
| |
| Consumer Durables & Apparel 1.2% |
| Carter's, Inc. | 5,456 | 473,090 |
| Coach, Inc. | 75,050 | 3,129,585 |
| D.R. Horton, Inc. | 30,473 | 1,101,599 |
| Fossil Group, Inc. * | 54,968 | 455,685 |
| Garmin Ltd. | 18,704 | 963,256 |
| Hanesbrands, Inc. | 33,949 | 823,603 |
| Hasbro, Inc. | 14,843 | 1,458,325 |
| Leggett & Platt, Inc. | 21,541 | 990,240 |
| Lennar Corp., Class A | 15,155 | 784,423 |
| Mattel, Inc. | 82,529 | 1,338,620 |
| Michael Kors Holdings Ltd. * | 24,181 | 1,020,922 |
| Mohawk Industries, Inc. * | 5,486 | 1,388,616 |
| Newell Brands, Inc. | 21,600 | 1,042,848 |
| NIKE, Inc., Class B | 144,007 | 7,605,010 |
| NVR, Inc. * | 659 | 1,793,040 |
| Polaris Industries, Inc. (b) | 11,427 | 1,065,339 |
| PulteGroup, Inc. | 44,598 | 1,151,520 |
| PVH Corp. | 11,214 | 1,411,730 |
| Ralph Lauren Corp. | 21,599 | 1,898,336 |
| Tupperware Brands Corp. | 12,893 | 746,118 |
| VF Corp. | 51,985 | 3,268,297 |
| Whirlpool Corp. | 14,893 | 2,555,936 |
| | | 36,466,138 |
| |
| Consumer Services 1.9% |
| Adtalem Global Education, Inc. | 23,840 | 815,328 |
| Aramark | 31,848 | 1,295,895 |
| Brinker International, Inc. | 14,235 | 444,417 |
| Carnival Corp. | 61,934 | 4,303,174 |
| Chipotle Mexican Grill, Inc. * | 2,205 | 698,346 |
| Darden Restaurants, Inc. | 17,871 | 1,467,030 |
| H&R Block, Inc. | 50,581 | 1,352,536 |
| International Game Technology plc | 30,530 | 621,896 |
| Las Vegas Sands Corp. | 45,478 | 2,829,186 |
| Marriott International, Inc., Class A | 38,217 | 3,958,517 |
| McDonald's Corp. | 135,480 | 21,672,736 |
| MGM Resorts International | 46,394 | 1,529,146 |
| Royal Caribbean Cruises Ltd. | 17,444 | 2,171,080 |
| Service Corp. International | 23,380 | 826,249 |
| Starbucks Corp. | 74,467 | 4,085,260 |
| The Wendy's Co. | 43,671 | 651,571 |
| Wyndham Worldwide Corp. | 24,942 | 2,486,219 |
| Wynn Resorts Ltd. | 15,231 | 2,116,957 |
| Yum China Holdings, Inc. * | 31,919 | 1,128,656 |
| Yum! Brands, Inc. | 43,336 | 3,329,071 |
| | | 57,783,270 |
| |
| Diversified Financials 4.8% |
| Affiliated Managers Group, Inc. | 4,038 | 713,474 |
| AGNC Investment Corp. | 51,433 | 1,107,867 |
| Ally Financial, Inc. | 193,228 | 4,366,953 |
| American Express Co. | 149,059 | 12,833,980 |
| Ameriprise Financial, Inc. | 30,871 | 4,275,942 |
| Annaly Capital Management, Inc. | 182,734 | 2,284,175 |
| Security | Number
of Shares | Value ($) |
| Berkshire Hathaway, Inc., Class B * | 188,230 | 34,099,747 |
| BlackRock, Inc. | 10,307 | 4,318,736 |
| Capital One Financial Corp. | 98,016 | 7,803,054 |
| CME Group, Inc. | 22,266 | 2,801,063 |
| Discover Financial Services | 76,249 | 4,494,878 |
| Franklin Resources, Inc. | 79,788 | 3,449,235 |
| Intercontinental Exchange, Inc. | 16,118 | 1,042,351 |
| Invesco Ltd. | 59,591 | 1,953,393 |
| Legg Mason, Inc. | 39,122 | 1,494,069 |
| Leucadia National Corp. | 39,176 | 927,688 |
| LPL Financial Holdings, Inc. | 17,080 | 800,027 |
| Moody's Corp. | 13,892 | 1,861,945 |
| Morgan Stanley | 95,559 | 4,347,934 |
| MSCI, Inc. | 5,928 | 679,408 |
| Nasdaq, Inc. | 10,161 | 765,936 |
| Navient Corp. | 149,125 | 1,968,450 |
| Northern Trust Corp. | 16,914 | 1,496,889 |
| Raymond James Financial, Inc. | 8,583 | 672,221 |
| S&P Global, Inc. | 18,481 | 2,852,173 |
| Santander Consumer USA Holdings, Inc. * | 50,656 | 723,368 |
| SEI Investments Co. | 11,926 | 697,194 |
| SLM Corp. * | 136,568 | 1,388,897 |
| State Street Corp. | 46,144 | 4,267,859 |
| Synchrony Financial | 130,776 | 4,026,593 |
| T. Rowe Price Group, Inc. | 37,036 | 3,124,357 |
| TD Ameritrade Holding Corp. | 19,826 | 858,862 |
| The Bank of New York Mellon Corp. | 106,747 | 5,580,733 |
| The Charles Schwab Corp. (a) | 39,188 | 1,563,601 |
| The Goldman Sachs Group, Inc. | 70,774 | 15,834,975 |
| Voya Financial, Inc. | 36,398 | 1,391,495 |
| Waddell & Reed Financial, Inc., Class A | 35,756 | 665,419 |
| | | 143,534,941 |
| |
| Energy 12.3% |
| Anadarko Petroleum Corp. | 87,477 | 3,580,434 |
| Andeavor | 52,036 | 5,211,405 |
| Apache Corp. | 110,807 | 4,303,744 |
| Baker Hughes a GE Co. | 103,242 | 3,499,904 |
| Cabot Oil & Gas Corp. | 31,953 | 816,399 |
| Chesapeake Energy Corp. *(b) | 443,968 | 1,616,043 |
| Chevron Corp. | 678,362 | 73,005,318 |
| Concho Resources, Inc. * | 6,692 | 742,611 |
| ConocoPhillips | 606,301 | 26,471,102 |
| CONSOL Energy, Inc. * | 69,208 | 1,006,976 |
| Delek US Holdings, Inc. | 51,432 | 1,271,399 |
| Devon Energy Corp. | 112,523 | 3,533,222 |
| Diamond Offshore Drilling, Inc. *(b) | 54,699 | 621,381 |
| Ensco plc, Class A (b) | 190,284 | 808,707 |
| EOG Resources, Inc. | 51,968 | 4,416,760 |
| EQT Corp. | 13,323 | 830,556 |
| Exxon Mobil Corp. | 1,429,908 | 109,144,878 |
| Halliburton Co. | 169,250 | 6,595,672 |
| Helmerich & Payne, Inc. (b) | 24,004 | 1,016,329 |
| Hess Corp. | 156,946 | 6,105,199 |
| HollyFrontier Corp. | 148,355 | 4,644,995 |
| Kinder Morgan, Inc. | 249,572 | 4,824,227 |
| Marathon Oil Corp. | 395,107 | 4,393,590 |
| Marathon Petroleum Corp. | 247,457 | 12,979,120 |
| Murphy Oil Corp. | 122,830 | 2,783,328 |
| Nabors Industries Ltd. | 132,241 | 866,179 |
| National Oilwell Varco, Inc. | 151,268 | 4,639,390 |
| Noble Corp. plc * | 261,872 | 853,703 |
| Noble Energy, Inc. | 60,278 | 1,432,808 |
| Occidental Petroleum Corp. | 196,467 | 11,729,080 |
| Oceaneering International, Inc. | 45,134 | 1,017,772 |
| ONEOK, Inc. | 28,789 | 1,559,212 |
| Patterson-UTI Energy, Inc. | 44,764 | 714,881 |
Schwab Fundamental Index ETFs | Semiannual Report
Schwab Fundamental U.S. Large Company Index ETF
Portfolio Holdings as of August 31, 2017 (Unaudited) (continued)
| Security | Number
of Shares | Value ($) |
| PBF Energy, Inc., Class A (b) | 46,900 | 1,110,592 |
| Peabody Energy Corp. * | 10,912 | 316,448 |
| Phillips 66 | 225,298 | 18,882,225 |
| Pioneer Natural Resources Co. | 7,289 | 945,019 |
| QEP Resources, Inc. * | 56,884 | 429,474 |
| Schlumberger Ltd. | 219,094 | 13,914,660 |
| SM Energy Co. | 24,822 | 331,622 |
| Superior Energy Services, Inc. * | 74,885 | 617,052 |
| Targa Resources Corp. | 10,917 | 486,571 |
| The Williams Cos., Inc. | 100,898 | 2,999,698 |
| Transocean Ltd. * | 220,664 | 1,800,618 |
| Valero Energy Corp. | 270,179 | 18,399,190 |
| Weatherford International plc * | 416,553 | 1,595,398 |
| Whiting Petroleum Corp. * | 123,759 | 553,203 |
| World Fuel Services Corp. | 83,843 | 2,895,937 |
| | | 372,314,031 |
| |
| Food & Staples Retailing 3.6% |
| Casey's General Stores, Inc. | 7,453 | 785,695 |
| Costco Wholesale Corp. | 82,128 | 12,872,743 |
| CVS Health Corp. | 326,947 | 25,286,081 |
| Rite Aid Corp. * | 120,759 | 292,237 |
| Sysco Corp. | 114,285 | 6,019,391 |
| The Kroger Co. | 291,585 | 6,376,964 |
| United Natural Foods, Inc. * | 21,596 | 750,461 |
| US Foods Holding Corp. * | 7,581 | 208,098 |
| Wal-Mart Stores, Inc. | 570,659 | 44,551,348 |
| Walgreens Boots Alliance, Inc. | 150,990 | 12,305,685 |
| | | 109,448,703 |
| |
| Food, Beverage & Tobacco 4.6% |
| Altria Group, Inc. | 175,636 | 11,135,322 |
| Archer-Daniels-Midland Co. | 264,568 | 10,931,950 |
| Brown-Forman Corp., Class B | 26,529 | 1,407,098 |
| Bunge Ltd. | 91,190 | 6,805,510 |
| Campbell Soup Co. | 18,397 | 849,941 |
| ConAgra Brands, Inc. | 52,427 | 1,701,780 |
| Constellation Brands, Inc., Class A | 6,853 | 1,371,285 |
| Dr. Pepper Snapple Group, Inc. | 26,862 | 2,445,785 |
| General Mills, Inc. | 92,917 | 4,948,760 |
| Hormel Foods Corp. | 36,444 | 1,120,289 |
| Ingredion, Inc. | 10,937 | 1,354,219 |
| Kellogg Co. | 34,233 | 2,240,892 |
| Lamb Weston Holdings, Inc. | 11,733 | 533,617 |
| McCormick & Co., Inc. Non-Voting Shares | 11,939 | 1,135,757 |
| Molson Coors Brewing Co., Class B | 14,401 | 1,292,490 |
| Mondelez International, Inc., Class A | 214,888 | 8,737,346 |
| Monster Beverage Corp. * | 13,671 | 763,115 |
| PepsiCo, Inc. | 193,814 | 22,430,094 |
| Philip Morris International, Inc. | 223,728 | 26,160,515 |
| The Coca-Cola Co. | 488,740 | 22,262,107 |
| The Hershey Co. | 13,311 | 1,396,590 |
| The J.M. Smucker Co. | 16,285 | 1,706,017 |
| The Kraft Heinz Co. | 21,977 | 1,774,643 |
| Tyson Foods, Inc., Class A | 65,065 | 4,118,615 |
| | | 138,623,737 |
| |
| Health Care Equipment & Services 5.6% |
| Abbott Laboratories | 208,222 | 10,606,829 |
| Aetna, Inc. | 59,389 | 9,365,645 |
| AmerisourceBergen Corp. | 31,867 | 2,557,327 |
| Anthem, Inc. | 93,514 | 18,332,485 |
| Baxter International, Inc. | 55,544 | 3,445,950 |
| Becton Dickinson & Co. | 21,686 | 4,325,056 |
| Boston Scientific Corp. * | 57,076 | 1,572,444 |
| Security | Number
of Shares | Value ($) |
| C.R. Bard, Inc. | 7,118 | 2,283,526 |
| Cardinal Health, Inc. | 102,974 | 6,946,626 |
| Centene Corp. * | 14,976 | 1,330,618 |
| Cerner Corp. * | 16,605 | 1,125,487 |
| Cigna Corp. | 21,648 | 3,941,235 |
| Community Health Systems, Inc. * | 166,003 | 1,268,263 |
| Danaher Corp. | 42,825 | 3,572,461 |
| DaVita, Inc. * | 23,163 | 1,356,425 |
| DENTSPLY SIRONA, Inc. | 14,233 | 805,161 |
| Edwards Lifesciences Corp. * | 7,125 | 809,827 |
| Express Scripts Holding Co. * | 206,018 | 12,942,051 |
| HCA Healthcare, Inc. * | 67,633 | 5,320,012 |
| Henry Schein, Inc. * | 11,502 | 1,997,667 |
| Humana, Inc. | 31,840 | 8,202,621 |
| Intuitive Surgical, Inc. * | 1,910 | 1,918,920 |
| Laboratory Corp. of America Holdings * | 9,373 | 1,470,342 |
| LifePoint Health, Inc. * | 13,277 | 769,402 |
| Magellan Health, Inc. * | 12,486 | 1,010,117 |
| McKesson Corp. | 57,104 | 8,526,198 |
| MEDNAX, Inc. * | 11,736 | 526,360 |
| Medtronic plc | 114,081 | 9,197,210 |
| Owens & Minor, Inc. | 30,335 | 847,560 |
| Patterson Cos., Inc. | 20,766 | 799,491 |
| Quest Diagnostics, Inc. | 27,770 | 3,008,879 |
| ResMed, Inc. | 11,117 | 862,457 |
| Stryker Corp. | 25,420 | 3,593,625 |
| Tenet Healthcare Corp. *(b) | 49,011 | 841,519 |
| UnitedHealth Group, Inc. | 139,966 | 27,839,237 |
| Universal Health Services, Inc., Class B | 11,361 | 1,228,465 |
| Varian Medical Systems, Inc. * | 13,527 | 1,437,244 |
| WellCare Health Plans, Inc. * | 7,707 | 1,346,259 |
| Zimmer Biomet Holdings, Inc. | 19,865 | 2,269,973 |
| | | 169,600,974 |
| |
| Household & Personal Products 1.9% |
| Church & Dwight Co., Inc. | 25,182 | 1,263,381 |
| Colgate-Palmolive Co. | 97,626 | 6,993,927 |
| Herbalife Ltd. *(b) | 18,236 | 1,258,466 |
| Kimberly-Clark Corp. | 39,784 | 4,904,970 |
| Nu Skin Enterprises, Inc., Class A | 13,453 | 818,346 |
| The Clorox Co. | 11,183 | 1,549,181 |
| The Estee Lauder Cos., Inc., Class A | 21,487 | 2,298,894 |
| The Procter & Gamble Co. | 414,353 | 38,232,351 |
| | | 57,319,516 |
| |
| Insurance 3.8% |
| Aflac, Inc. | 72,090 | 5,951,029 |
| Alleghany Corp. * | 1,673 | 941,514 |
| American Financial Group, Inc. | 10,705 | 1,089,876 |
| American International Group, Inc. | 302,470 | 18,293,386 |
| Aon plc | 30,085 | 4,186,629 |
| Arch Capital Group Ltd. * | 11,737 | 1,142,480 |
| Arthur J. Gallagher & Co. | 14,225 | 823,627 |
| Assurant, Inc. | 17,827 | 1,688,039 |
| Assured Guaranty Ltd. | 30,936 | 1,316,017 |
| Axis Capital Holdings Ltd. | 23,451 | 1,412,688 |
| Brighthouse Financial, Inc. * | 11,589 | 661,384 |
| Chubb Ltd. | 37,461 | 5,297,735 |
| Cincinnati Financial Corp. | 14,498 | 1,114,026 |
| CNO Financial Group, Inc. | 50,163 | 1,121,143 |
| Everest Re Group Ltd. | 8,072 | 2,038,019 |
| First American Financial Corp. | 18,203 | 893,039 |
| FNF Group | 39,024 | 1,882,518 |
| Genworth Financial, Inc., Class A * | 253,214 | 868,524 |
| Lincoln National Corp. | 37,998 | 2,578,544 |
| Loews Corp. | 70,801 | 3,297,911 |
Schwab Fundamental Index ETFs | Semiannual Report
Schwab Fundamental U.S. Large Company Index ETF
Portfolio Holdings as of August 31, 2017 (Unaudited) (continued)
| Security | Number
of Shares | Value ($) |
| Markel Corp. * | 780 | 820,552 |
| Marsh & McLennan Cos., Inc. | 50,258 | 3,924,145 |
| MetLife, Inc. | 127,824 | 5,985,998 |
| Old Republic International Corp. | 35,579 | 679,203 |
| Principal Financial Group, Inc. | 29,179 | 1,824,271 |
| Prudential Financial, Inc. | 48,460 | 4,946,797 |
| Reinsurance Group of America, Inc. | 10,847 | 1,458,379 |
| RenaissanceRe Holdings Ltd. | 8,436 | 1,173,954 |
| The Allstate Corp. | 74,711 | 6,761,345 |
| The Hartford Financial Services Group, Inc. | 83,674 | 4,524,253 |
| The Progressive Corp. | 106,879 | 4,967,736 |
| The Travelers Cos., Inc. | 104,164 | 12,622,594 |
| Torchmark Corp. | 15,965 | 1,228,826 |
| Unum Group | 34,644 | 1,669,148 |
| Validus Holdings Ltd. | 12,481 | 625,922 |
| W.R. Berkley Corp. | 17,919 | 1,194,122 |
| White Mountains Insurance Group Ltd. | 936 | 815,322 |
| Willis Towers Watson plc | 6,136 | 911,012 |
| XL Group Ltd. | 44,368 | 1,817,313 |
| | | 114,549,020 |
| |
| Materials 4.0% |
| Air Products & Chemicals, Inc. | 19,838 | 2,883,850 |
| Albemarle Corp. | 10,162 | 1,181,434 |
| Alcoa Corp. * | 41,408 | 1,816,983 |
| Allegheny Technologies, Inc. * | 42,336 | 881,859 |
| Ashland Global Holdings, Inc. | 15,596 | 967,732 |
| Avery Dennison Corp. | 17,072 | 1,609,207 |
| Ball Corp. | 72,715 | 2,907,873 |
| Bemis Co., Inc. | 21,315 | 908,232 |
| Celanese Corp., Series A | 18,321 | 1,777,503 |
| CF Industries Holdings, Inc. | 90,355 | 2,619,391 |
| Cleveland-Cliffs, Inc. * | 86,232 | 720,899 |
| Commercial Metals Co. | 48,177 | 910,063 |
| Crown Holdings, Inc. * | 12,556 | 741,181 |
| Domtar Corp. | 40,004 | 1,617,762 |
| E.I. du Pont de Nemours & Co. | 100,716 | 8,453,094 |
| Eastman Chemical Co. | 27,744 | 2,391,533 |
| Ecolab, Inc. | 19,742 | 2,631,609 |
| FMC Corp. | 18,035 | 1,554,978 |
| Freeport-McMoRan, Inc. * | 645,592 | 9,541,850 |
| Graphic Packaging Holding Co. | 55,753 | 727,577 |
| Huntsman Corp. | 54,376 | 1,444,770 |
| International Flavors & Fragrances, Inc. | 7,128 | 975,467 |
| International Paper Co. | 84,284 | 4,540,379 |
| LyondellBasell Industries N.V., Class A | 118,808 | 10,762,817 |
| Martin Marietta Materials, Inc. | 3,239 | 686,636 |
| Monsanto Co. | 67,587 | 7,921,196 |
| Newmont Mining Corp. | 90,342 | 3,463,712 |
| Nucor Corp. | 73,427 | 4,046,562 |
| Owens-Illinois, Inc. * | 53,188 | 1,310,552 |
| Packaging Corp. of America | 9,392 | 1,055,755 |
| PPG Industries, Inc. | 37,421 | 3,903,759 |
| Praxair, Inc. | 40,997 | 5,392,745 |
| Reliance Steel & Aluminum Co. | 22,132 | 1,602,799 |
| RPM International, Inc. | 14,760 | 722,797 |
| Sealed Air Corp. | 17,812 | 790,497 |
| Sonoco Products Co. | 17,804 | 859,221 |
| Steel Dynamics, Inc. | 41,499 | 1,429,641 |
| The Chemours Co. | 70,779 | 3,473,125 |
| The Dow Chemical Co. | 180,426 | 12,025,393 |
| The Mosaic Co. | 173,411 | 3,464,752 |
| The Sherwin-Williams Co. | 4,284 | 1,453,433 |
| United States Steel Corp. | 59,346 | 1,579,197 |
| Security | Number
of Shares | Value ($) |
| Vulcan Materials Co. | 7,061 | 856,217 |
| WestRock Co. | 28,383 | 1,615,276 |
| | | 122,221,308 |
| |
| Media 3.0% |
| CBS Corp., Class B Non-Voting Shares | 86,427 | 5,536,514 |
| Charter Communications, Inc., Class A * | 4,832 | 1,925,745 |
| Comcast Corp., Class A | 556,650 | 22,605,557 |
| Discovery Communications, Inc., Class A * | 48,391 | 1,074,764 |
| Discovery Communications, Inc., Class C * | 66,376 | 1,394,560 |
| DISH Network Corp., Class A * | 19,580 | 1,121,738 |
| News Corp., Class A | 92,898 | 1,242,046 |
| News Corp., Class B | 27,268 | 373,572 |
| Omnicom Group, Inc. | 40,022 | 2,896,792 |
| Scripps Networks Interactive, Inc., Class A | 16,881 | 1,445,858 |
| TEGNA, Inc. | 44,553 | 562,259 |
| The Interpublic Group of Cos., Inc. | 43,444 | 874,962 |
| The Walt Disney Co. | 195,422 | 19,776,706 |
| Time Warner, Inc. | 166,607 | 16,843,968 |
| Tribune Media Co., Class A | 13,191 | 528,563 |
| Twenty-First Century Fox, Inc., Class A | 201,354 | 5,555,357 |
| Twenty-First Century Fox, Inc., Class B | 85,459 | 2,315,939 |
| Viacom, Inc., Class B | 184,449 | 5,275,241 |
| | | 91,350,141 |
| |
| Pharmaceuticals, Biotechnology & Life Sciences 6.0% |
| AbbVie, Inc. | 107,348 | 8,083,304 |
| Agilent Technologies, Inc. | 28,974 | 1,875,197 |
| Allergan plc | 7,498 | 1,720,641 |
| Amgen, Inc. | 77,660 | 13,805,618 |
| Biogen, Inc. * | 11,962 | 3,786,691 |
| Bristol-Myers Squibb Co. | 148,814 | 9,000,271 |
| Celgene Corp. * | 38,509 | 5,350,055 |
| Eli Lilly & Co. | 110,398 | 8,974,253 |
| Gilead Sciences, Inc. | 133,500 | 11,175,285 |
| Johnson & Johnson | 277,186 | 36,691,111 |
| Merck & Co., Inc. | 419,768 | 26,806,385 |
| Mettler-Toledo International, Inc. * | 2,056 | 1,244,065 |
| Mylan N.V. * | 54,290 | 1,709,049 |
| Perrigo Co., plc | 13,051 | 1,030,507 |
| Pfizer, Inc. | 1,234,277 | 41,866,676 |
| Thermo Fisher Scientific, Inc. | 23,184 | 4,338,654 |
| United Therapeutics Corp. * | 3,937 | 514,960 |
| Waters Corp. * | 6,066 | 1,112,990 |
| Zoetis, Inc. | 18,653 | 1,169,543 |
| | | 180,255,255 |
| |
| Real Estate 1.3% |
| American Tower Corp. | 14,391 | 2,130,588 |
| AvalonBay Communities, Inc. | 6,110 | 1,147,030 |
| Boston Properties, Inc. | 12,075 | 1,456,245 |
| Brixmor Property Group, Inc. | 24,985 | 467,719 |
| CBRE Group, Inc., Class A * | 29,469 | 1,063,241 |
| CoreCivic, Inc. | 37,787 | 1,012,692 |
| Crown Castle International Corp. | 14,748 | 1,599,273 |
| Digital Realty Trust, Inc. | 10,858 | 1,284,936 |
| Duke Realty Corp. | 23,160 | 688,315 |
| Equinix, Inc. | 1,769 | 828,617 |
| Equity Residential | 29,251 | 1,964,205 |
| Essex Property Trust, Inc. | 2,414 | 642,052 |
| GGP, Inc. | 50,780 | 1,053,685 |
| HCP, Inc. | 50,677 | 1,510,681 |
| Hospitality Properties Trust | 29,049 | 794,781 |
| Host Hotels & Resorts, Inc. | 104,686 | 1,896,910 |
| Iron Mountain, Inc. | 47,068 | 1,855,421 |
Schwab Fundamental Index ETFs | Semiannual Report
Schwab Fundamental U.S. Large Company Index ETF
Portfolio Holdings as of August 31, 2017 (Unaudited) (continued)
| Security | Number
of Shares | Value ($) |
| JBG SMITH Properties * | 7,931 | 259,582 |
| Jones Lang LaSalle, Inc. | 7,375 | 899,086 |
| Kimco Realty Corp. | 29,858 | 585,814 |
| Prologis, Inc. | 28,455 | 1,802,909 |
| Public Storage | 6,469 | 1,328,344 |
| Realogy Holdings Corp. | 25,126 | 851,771 |
| Simon Property Group, Inc. | 19,692 | 3,088,690 |
| SL Green Realty Corp. | 7,239 | 697,695 |
| The Macerich Co. | 11,169 | 589,388 |
| Ventas, Inc. | 28,641 | 1,960,190 |
| Vornado Realty Trust | 15,966 | 1,189,307 |
| Welltower, Inc. | 28,494 | 2,086,331 |
| Weyerhaeuser Co. | 90,820 | 2,961,640 |
| | | 39,697,138 |
| |
| Retailing 4.4% |
| Abercrombie & Fitch Co., Class A (b) | 87,829 | 1,118,941 |
| Advance Auto Parts, Inc. | 6,548 | 641,049 |
| Amazon.com, Inc. * | 5,548 | 5,440,369 |
| American Eagle Outfitters, Inc. | 60,960 | 728,472 |
| Ascena Retail Group, Inc. * | 135,904 | 277,244 |
| AutoNation, Inc. *(b) | 24,756 | 1,123,180 |
| AutoZone, Inc. * | 1,801 | 951,720 |
| Bed Bath & Beyond, Inc. | 99,572 | 2,747,192 |
| Best Buy Co., Inc. | 107,931 | 5,856,336 |
| Big Lots, Inc. | 24,848 | 1,182,765 |
| CarMax, Inc. * | 28,238 | 1,896,182 |
| Chico's FAS, Inc. | 55,377 | 425,295 |
| Core-Mark Holding Co., Inc. | 29,629 | 801,761 |
| Dick's Sporting Goods, Inc. | 18,776 | 494,935 |
| Dillard's, Inc., Class A (b) | 17,717 | 1,077,194 |
| Dollar General Corp. | 55,000 | 3,990,800 |
| Dollar Tree, Inc. * | 26,894 | 2,141,838 |
| Expedia, Inc. | 8,036 | 1,192,221 |
| Foot Locker, Inc. | 27,176 | 957,411 |
| GameStop Corp., Class A | 85,316 | 1,578,346 |
| Genuine Parts Co. | 27,647 | 2,290,001 |
| GNC Holdings, Inc., Class A (b) | 80,391 | 667,245 |
| Group 1 Automotive, Inc. | 9,124 | 547,622 |
| Kohl's Corp. | 130,047 | 5,173,270 |
| L Brands, Inc. | 42,732 | 1,547,753 |
| Liberty Interactive Corp. QVC Group, Class A * | 108,700 | 2,404,444 |
| LKQ Corp. * | 25,888 | 897,019 |
| Lowe's Cos., Inc. | 181,150 | 13,385,174 |
| Macy's, Inc. | 138,621 | 2,879,158 |
| Murphy USA, Inc. * | 25,451 | 1,640,571 |
| Nordstrom, Inc. (b) | 45,188 | 2,016,289 |
| O'Reilly Automotive, Inc. * | 9,064 | 1,777,722 |
| Office Depot, Inc. | 183,742 | 788,253 |
| Ross Stores, Inc. | 36,756 | 2,148,388 |
| Sally Beauty Holdings, Inc. * | 27,700 | 514,943 |
| Signet Jewelers Ltd. | 16,214 | 1,022,617 |
| Staples, Inc. | 543,821 | 5,555,132 |
| Target Corp. | 225,249 | 12,282,828 |
| The Gap, Inc. | 124,471 | 2,940,005 |
| The Home Depot, Inc. | 157,730 | 23,638,995 |
| The Priceline Group, Inc. * | 1,871 | 3,465,242 |
| The TJX Cos., Inc. | 92,480 | 6,686,304 |
| Tiffany & Co. | 13,181 | 1,204,743 |
| Tractor Supply Co. | 20,466 | 1,217,932 |
| Urban Outfitters, Inc. * | 34,579 | 706,795 |
| Williams-Sonoma, Inc. | 22,622 | 1,040,612 |
| | | 133,062,308 |
| |
| Security | Number
of Shares | Value ($) |
| Semiconductors & Semiconductor Equipment 2.9% |
| Analog Devices, Inc. | 27,466 | 2,298,080 |
| Applied Materials, Inc. | 100,655 | 4,541,554 |
| Broadcom Ltd. | 5,407 | 1,362,942 |
| First Solar, Inc. * | 19,038 | 894,024 |
| Intel Corp. | 1,034,522 | 36,280,687 |
| KLA-Tencor Corp. | 19,724 | 1,847,942 |
| Lam Research Corp. | 14,163 | 2,350,775 |
| Marvell Technology Group Ltd. | 105,440 | 1,888,430 |
| Maxim Integrated Products, Inc. | 36,430 | 1,699,824 |
| Microchip Technology, Inc. | 13,731 | 1,191,851 |
| Micron Technology, Inc. * | 151,675 | 4,849,050 |
| NVIDIA Corp. | 16,552 | 2,804,571 |
| NXP Semiconductor N.V. * | 9,810 | 1,108,138 |
| ON Semiconductor Corp. * | 47,856 | 817,380 |
| Qorvo, Inc. * | 13,632 | 998,135 |
| QUALCOMM, Inc. | 216,560 | 11,319,591 |
| Skyworks Solutions, Inc. | 9,331 | 983,114 |
| Texas Instruments, Inc. | 113,559 | 9,404,956 |
| Xilinx, Inc. | 26,769 | 1,768,360 |
| | | 88,409,404 |
| |
| Software & Services 7.3% |
| Accenture plc, Class A | 72,624 | 9,496,314 |
| Activision Blizzard, Inc. | 66,450 | 4,356,462 |
| Adobe Systems, Inc. * | 14,671 | 2,276,352 |
| Akamai Technologies, Inc. * | 12,834 | 605,123 |
| Alliance Data Systems Corp. | 4,646 | 1,047,673 |
| Alphabet, Inc., Class A * | 10,478 | 10,009,005 |
| Alphabet, Inc., Class C * | 10,701 | 10,051,770 |
| Amdocs Ltd. | 23,759 | 1,539,346 |
| Autodesk, Inc. * | 9,210 | 1,054,177 |
| Automatic Data Processing, Inc. | 34,041 | 3,624,345 |
| Booz Allen Hamilton Holding Corp. | 21,982 | 749,806 |
| Broadridge Financial Solutions, Inc. | 12,721 | 993,892 |
| CA, Inc. | 62,456 | 2,072,290 |
| CACI International, Inc., Class A * | 5,987 | 777,113 |
| Cars.com, Inc. * | 4,176 | 107,991 |
| Citrix Systems, Inc. * | 16,283 | 1,273,493 |
| Cognizant Technology Solutions Corp., Class A | 44,274 | 3,133,271 |
| eBay, Inc. * | 79,609 | 2,876,273 |
| Electronic Arts, Inc. * | 12,298 | 1,494,207 |
| Facebook, Inc., Class A * | 20,903 | 3,594,689 |
| Fidelity National Information Services, Inc. | 36,490 | 3,390,651 |
| First Data Corp., Class A * | 40,772 | 750,613 |
| Fiserv, Inc. * | 21,329 | 2,638,611 |
| Global Payments, Inc. | 9,564 | 913,266 |
| IAC/InterActiveCorp * | 11,914 | 1,352,358 |
| International Business Machines Corp. | 244,801 | 35,013,887 |
| Intuit, Inc. | 23,015 | 3,255,472 |
| Leidos Holdings, Inc. | 21,855 | 1,274,584 |
| MasterCard, Inc., Class A | 53,705 | 7,158,876 |
| Microsoft Corp. | 761,965 | 56,972,123 |
| Oracle Corp. | 454,149 | 22,857,319 |
| Paychex, Inc. | 26,723 | 1,524,013 |
| PayPal Holdings, Inc. * | 38,062 | 2,347,664 |
| Symantec Corp. | 119,124 | 3,571,338 |
| Teradata Corp. * | 40,028 | 1,277,694 |
| The Western Union Co. | 120,229 | 2,274,733 |
| Total System Services, Inc. | 15,336 | 1,060,024 |
| Visa, Inc., Class A | 98,022 | 10,147,237 |
| | | 218,914,055 |
| |
Schwab Fundamental Index ETFs | Semiannual Report
Schwab Fundamental U.S. Large Company Index ETF
Portfolio Holdings as of August 31, 2017 (Unaudited) (continued)
| Security | Number
of Shares | Value ($) |
| Technology Hardware & Equipment 6.0% |
| Amphenol Corp., Class A | 24,842 | 2,010,711 |
| Anixter International, Inc. * | 10,968 | 809,438 |
| Apple, Inc. | 583,903 | 95,760,092 |
| Arrow Electronics, Inc. * | 37,270 | 2,960,356 |
| Avnet, Inc. | 77,401 | 2,985,357 |
| Brocade Communications Systems, Inc. | 67,434 | 834,833 |
| CDW Corp. | 15,919 | 1,009,583 |
| Cisco Systems, Inc. | 714,369 | 23,009,825 |
| CommScope Holding Co., Inc. * | 15,614 | 516,199 |
| Corning, Inc. | 207,431 | 5,965,716 |
| F5 Networks, Inc. * | 6,802 | 812,023 |
| FLIR Systems, Inc. | 19,568 | 743,584 |
| Harris Corp. | 17,252 | 2,120,271 |
| Hewlett Packard Enterprise Co. | 365,575 | 6,602,284 |
| HP, Inc. | 556,736 | 10,622,523 |
| Jabil, Inc. | 72,708 | 2,279,396 |
| Juniper Networks, Inc. | 86,992 | 2,412,288 |
| Keysight Technologies, Inc. * | 19,781 | 808,252 |
| Motorola Solutions, Inc. | 51,735 | 4,558,888 |
| NCR Corp. * | 17,950 | 655,714 |
| NetApp, Inc. | 54,814 | 2,119,109 |
| Sanmina Corp. * | 22,182 | 830,716 |
| SYNNEX Corp. | 7,735 | 925,183 |
| Tech Data Corp. * | 27,036 | 2,981,800 |
| Western Digital Corp. | 56,581 | 4,994,405 |
| Xerox Corp. | 103,719 | 3,347,012 |
| | | 182,675,558 |
| |
| Telecommunication Services 3.2% |
| AT&T, Inc. | 1,360,526 | 50,965,304 |
| CenturyLink, Inc. (b) | 311,625 | 6,145,245 |
| Frontier Communications Corp. (b) | 67,262 | 906,019 |
| Level 3 Communications, Inc. * | 17,904 | 974,515 |
| Sprint Corp. * | 26,102 | 215,341 |
| T-Mobile US, Inc. * | 16,873 | 1,091,852 |
| Telephone & Data Systems, Inc. | 44,831 | 1,313,996 |
| Verizon Communications, Inc. | 718,401 | 34,461,696 |
| Windstream Holdings, Inc. | 136,911 | 283,406 |
| | | 96,357,374 |
| |
| Transportation 2.2% |
| Alaska Air Group, Inc. | 13,394 | 999,996 |
| American Airlines Group, Inc. | 53,069 | 2,374,307 |
| Avis Budget Group, Inc. * | 46,318 | 1,678,101 |
| C.H. Robinson Worldwide, Inc. | 30,402 | 2,147,293 |
| CSX Corp. | 151,729 | 7,616,796 |
| Delta Air Lines, Inc. | 25,441 | 1,200,561 |
| Expeditors International of Washington, Inc. | 37,269 | 2,090,791 |
| FedEx Corp. | 54,967 | 11,783,826 |
| Hertz Global Holdings, Inc. * | 87,929 | 1,911,576 |
| J.B. Hunt Transport Services, Inc. | 12,897 | 1,275,384 |
| JetBlue Airways Corp. * | 43,684 | 865,380 |
| Kansas City Southern | 10,665 | 1,103,081 |
| Kirby Corp. * | 9,168 | 573,917 |
| Norfolk Southern Corp. | 44,826 | 5,402,430 |
| Old Dominion Freight Line, Inc. | 6,266 | 625,973 |
| Ryder System, Inc. | 18,972 | 1,472,227 |
| Southwest Airlines Co. | 16,126 | 840,810 |
| Union Pacific Corp. | 122,586 | 12,908,306 |
| United Continental Holdings, Inc. * | 10,373 | 642,711 |
| United Parcel Service, Inc., Class B | 67,939 | 7,769,504 |
| | | 65,282,970 |
| |
| Security | Number
of Shares | Value ($) |
| Utilities 4.2% |
| AES Corp. | 301,834 | 3,332,247 |
| Alliant Energy Corp. | 28,804 | 1,231,083 |
| Ameren Corp. | 42,937 | 2,575,791 |
| American Electric Power Co., Inc. | 85,964 | 6,329,529 |
| American Water Works Co., Inc. | 18,145 | 1,467,931 |
| Atmos Energy Corp. | 13,076 | 1,151,211 |
| Calpine Corp. * | 162,982 | 2,395,835 |
| CenterPoint Energy, Inc. | 88,245 | 2,613,817 |
| CMS Energy Corp. | 38,076 | 1,848,209 |
| Consolidated Edison, Inc. | 53,686 | 4,524,119 |
| Dominion Energy, Inc. | 76,711 | 6,042,526 |
| DTE Energy Co. | 30,816 | 3,461,253 |
| Duke Energy Corp. | 109,099 | 9,524,343 |
| Edison International | 46,462 | 3,725,323 |
| Entergy Corp. | 54,021 | 4,276,843 |
| Eversource Energy | 37,901 | 2,387,763 |
| Exelon Corp. | 236,785 | 8,967,048 |
| FirstEnergy Corp. | 140,021 | 4,561,884 |
| Great Plains Energy, Inc. | 32,336 | 992,392 |
| MDU Resources Group, Inc. | 42,657 | 1,153,445 |
| National Fuel Gas Co. | 13,092 | 759,074 |
| NextEra Energy, Inc. | 50,638 | 7,621,525 |
| NiSource, Inc. | 33,844 | 909,388 |
| NRG Energy, Inc. | 161,799 | 4,030,413 |
| OGE Energy Corp. | 33,819 | 1,208,015 |
| PG&E Corp. | 77,956 | 5,486,543 |
| Pinnacle West Capital Corp. | 18,286 | 1,645,191 |
| PPL Corp. | 117,552 | 4,612,741 |
| Public Service Enterprise Group, Inc. | 100,955 | 4,728,732 |
| SCANA Corp. | 21,378 | 1,290,804 |
| Sempra Energy | 31,990 | 3,772,581 |
| The Southern Co. | 157,209 | 7,586,906 |
| UGI Corp. | 28,402 | 1,403,343 |
| Vectren Corp. | 16,006 | 1,050,154 |
| WEC Energy Group, Inc. | 31,388 | 2,047,125 |
| Westar Energy, Inc. | 16,724 | 858,109 |
| Xcel Energy, Inc. | 79,748 | 3,947,526 |
| | | 125,520,762 |
| Total Common Stock |
| (Cost $2,769,717,336) | | 3,010,324,963 |
|
| Other Investment Companies 0.8% of net assets |
| |
| Money Market Fund 0.2% |
| State Street Institutional U.S. Government Money Market Fund, Premier Class 0.93% (c) | 6,604,197 | 6,604,197 |
| |
| Securities Lending Collateral 0.6% |
| Wells Fargo Government Money Market Fund, Select Class 0.92% (c) | 17,801,055 | 17,801,055 |
| Total Other Investment Companies |
| (Cost $24,405,252) | | 24,405,252 |
Schwab Fundamental Index ETFs | Semiannual Report
Schwab Fundamental U.S. Large Company Index ETF
Portfolio Holdings as of August 31, 2017 (Unaudited) (continued)
| | Number of
Contracts | Notional
Amount
($) | Current Value/
Unrealized
Appreciation
($) |
| Futures Contracts | | | |
| Long | |
| S&P 500 Index, e-mini, expires 09/15/17 | 62 | 7,657,310 | 82,252 |
| * | Non-income producing security. |
| (a) | Issuer is affiliated with the fund's adviser. |
| (b) | All or a portion of this security is on loan. Securities on loan were valued at $17,201,227. |
| (c) | The rate shown is the 7-day yield. |
Schwab Fundamental Index ETFs | Semiannual Report
Schwab Fundamental U.S. Small Company Index ETF
Portfolio Holdings as of August 31, 2017 (Unaudited)
This section shows all the securities in the fund's portfolio and their values as of the report date.
The fund files its complete schedule of portfolio holdings with the SEC for the first and third quarters of each fiscal year on Form N-Q. The fund's Form N-Q is available on the SEC's website at www.sec.gov and may be viewed and copied at the SEC's Public Reference Room in Washington, D.C. Call 1-800-SEC-0330 for information on the operation of the Public Reference Room. The fund also makes available its complete schedule of portfolio holdings on a daily basis on the fund's website at www.schwabfunds.com/schwabetfs_prospectus.
| Security | Number
of Shares | Value ($) |
| Common Stock 99.8% of net assets |
| |
| Automobiles & Components 0.8% |
| American Axle & Manufacturing Holdings, Inc. * | 119,274 | 1,742,593 |
| Cooper-Standard Holding, Inc. * | 24,340 | 2,448,117 |
| Dorman Products, Inc. * | 17,878 | 1,187,457 |
| Gentex Corp. | 213,222 | 3,895,566 |
| Gentherm, Inc. * | 7,376 | 229,762 |
| LCI Industries | 21,189 | 2,093,473 |
| Modine Manufacturing Co. * | 35,884 | 579,527 |
| Standard Motor Products, Inc. | 28,916 | 1,275,196 |
| Superior Industries International, Inc. | 66,840 | 979,206 |
| Tower International, Inc. | 39,986 | 897,686 |
| Winnebago Industries, Inc. | 10,268 | 371,188 |
| | | 15,699,771 |
| |
| Banks 5.4% |
| Associated Banc-Corp. | 105,237 | 2,304,690 |
| Astoria Financial Corp. | 62,132 | 1,217,166 |
| BancorpSouth, Inc. | 44,928 | 1,305,158 |
| Bank of Hawaii Corp. | 36,201 | 2,828,384 |
| Bank of the Ozarks, Inc. | 21,220 | 911,611 |
| BankUnited, Inc. | 75,376 | 2,508,513 |
| BOK Financial Corp. | 21,786 | 1,753,337 |
| Capitol Federal Financial, Inc. | 124,293 | 1,705,300 |
| Cathay General Bancorp | 31,164 | 1,099,154 |
| Chemical Financial Corp. | 4,884 | 221,782 |
| Columbia Banking System, Inc. | 27,500 | 1,022,175 |
| Commerce Bancshares, Inc. | 60,648 | 3,335,034 |
| Community Bank System, Inc. | 22,176 | 1,141,177 |
| Cullen/Frost Bankers, Inc. | 34,971 | 2,944,558 |
| CVB Financial Corp. | 58,720 | 1,215,504 |
| East West Bancorp, Inc. | 89,155 | 4,936,512 |
| F.N.B. Corp. | 141,604 | 1,796,955 |
| First Citizens BancShares, Inc., Class A | 5,167 | 1,759,415 |
| First Commonwealth Financial Corp. | 19,736 | 248,871 |
| First Financial Bancorp | 52,325 | 1,253,184 |
| First Financial Bankshares, Inc. | 23,267 | 931,843 |
| First Horizon National Corp. | 192,760 | 3,317,400 |
| First Midwest Bancorp, Inc. | 10,964 | 231,121 |
| First Republic Bank | 46,149 | 4,478,760 |
| Fulton Financial Corp. | 144,076 | 2,514,126 |
| Glacier Bancorp, Inc. | 41,770 | 1,387,182 |
| Great Western Bancorp, Inc. | 28,430 | 1,021,206 |
| Hancock Holding Co. | 56,593 | 2,487,262 |
| Home BancShares, Inc. | 10,168 | 237,016 |
| IBERIABANK Corp. | 15,188 | 1,163,401 |
| International Bancshares Corp. | 47,236 | 1,698,134 |
| Investors Bancorp, Inc. | 102,897 | 1,346,922 |
| MB Financial, Inc. | 32,973 | 1,311,336 |
| National Bank Holdings Corp., Class A | 35,423 | 1,139,912 |
| NBT Bancorp, Inc. | 30,151 | 989,857 |
| Northwest Bancshares, Inc. | 117,097 | 1,806,807 |
| Ocwen Financial Corp. * | 430,246 | 1,260,621 |
| OFG Bancorp | 21,328 | 185,554 |
| Old National Bancorp | 87,567 | 1,431,720 |
| Security | Number
of Shares | Value ($) |
| PacWest Bancorp | 34,245 | 1,546,162 |
| Park National Corp. | 12,078 | 1,166,614 |
| Popular, Inc. | 108,315 | 4,322,852 |
| Prosperity Bancshares, Inc. | 32,343 | 1,932,494 |
| Provident Financial Services, Inc. | 39,364 | 978,195 |
| Radian Group, Inc. | 31,296 | 547,680 |
| Signature Bank * | 13,617 | 1,747,606 |
| SVB Financial Group * | 19,090 | 3,232,701 |
| Synovus Financial Corp. | 71,375 | 3,006,315 |
| TCF Financial Corp. | 152,907 | 2,374,646 |
| Texas Capital Bancshares, Inc. * | 14,722 | 1,093,109 |
| The Bank of NT Butterfield & Son Ltd. | 7,076 | 232,659 |
| Trustmark Corp. | 58,309 | 1,727,113 |
| UMB Financial Corp. | 21,381 | 1,435,093 |
| Umpqua Holdings Corp. | 116,921 | 2,046,118 |
| Union Bankshares Corp. | 7,476 | 234,223 |
| United Bankshares, Inc. | 38,897 | 1,304,994 |
| Valley National Bancorp | 232,513 | 2,601,821 |
| Washington Federal, Inc. | 88,788 | 2,774,625 |
| Webster Financial Corp. | 49,237 | 2,298,383 |
| Westamerica Bancorp | 26,670 | 1,374,839 |
| Western Alliance Bancorp * | 4,984 | 240,378 |
| Wintrust Financial Corp. | 25,587 | 1,862,989 |
| Zions Bancorp | 106,009 | 4,628,353 |
| | | 109,158,622 |
| |
| Capital Goods 12.0% |
| A.O. Smith Corp. | 70,933 | 3,950,259 |
| AAR Corp. | 87,611 | 3,159,253 |
| Actuant Corp., Class A | 125,654 | 3,021,979 |
| Acuity Brands, Inc. | 16,587 | 2,932,416 |
| Aegion Corp. * | 73,884 | 1,601,066 |
| Air Lease Corp. | 53,467 | 2,172,899 |
| Aircastle Ltd. | 72,114 | 1,616,796 |
| Alamo Group, Inc. | 2,792 | 256,194 |
| Albany International Corp., Class A | 28,581 | 1,531,942 |
| Allegion plc | 28,289 | 2,226,627 |
| Altra Industrial Motion Corp. | 30,186 | 1,390,065 |
| American Woodmark Corp. * | 2,492 | 206,338 |
| Apogee Enterprises, Inc. | 25,575 | 1,117,628 |
| Applied Industrial Technologies, Inc. | 68,768 | 3,919,776 |
| Armstrong Flooring, Inc. * | 21,032 | 313,797 |
| Armstrong World Industries, Inc. * | 134,605 | 6,393,737 |
| Astec Industries, Inc. | 24,497 | 1,217,011 |
| Atkore International Group, Inc. * | 10,168 | 169,399 |
| AZZ, Inc. | 21,220 | 1,037,658 |
| Babcock & Wilcox Enterprises, Inc. * | 168,932 | 381,786 |
| Barnes Group, Inc. | 48,807 | 3,051,414 |
| Beacon Roofing Supply, Inc. * | 64,221 | 3,024,809 |
| BMC Stock Holdings, Inc. * | 11,164 | 226,629 |
| Briggs & Stratton Corp. | 118,777 | 2,487,190 |
| BWX Technologies, Inc. | 72,941 | 3,991,332 |
| Chart Industries, Inc. * | 47,635 | 1,607,205 |
| CIRCOR International, Inc. | 22,965 | 1,102,779 |
| Colfax Corp. * | 86,400 | 3,445,632 |
| Comfort Systems USA, Inc. | 43,082 | 1,466,942 |
| Crane Co. | 47,998 | 3,562,892 |
| Cubic Corp. | 44,287 | 1,902,127 |
Schwab Fundamental Index ETFs | Semiannual Report
Schwab Fundamental U.S. Small Company Index ETF
Portfolio Holdings as of August 31, 2017 (Unaudited) (continued)
| Security | Number
of Shares | Value ($) |
| Curtiss-Wright Corp. | 40,140 | 3,886,355 |
| DigitalGlobe, Inc. * | 49,262 | 1,694,613 |
| Dycom Industries, Inc. * | 20,547 | 1,657,732 |
| Encore Wire Corp. | 53,098 | 2,277,904 |
| EnerSys | 57,981 | 3,716,582 |
| EnPro Industries, Inc. | 23,155 | 1,631,733 |
| ESCO Technologies, Inc. | 23,865 | 1,299,449 |
| Esterline Technologies Corp. * | 40,644 | 3,470,998 |
| Federal Signal Corp. | 77,349 | 1,445,653 |
| Franklin Electric Co., Inc. | 39,447 | 1,520,682 |
| GATX Corp. (a) | 80,446 | 4,873,419 |
| Generac Holdings, Inc. * | 95,063 | 3,838,644 |
| General Cable Corp. | 205,612 | 3,485,123 |
| Gibraltar Industries, Inc. * | 7,276 | 212,823 |
| Global Brass & Copper Holdings, Inc. | 8,372 | 249,904 |
| Graco, Inc. | 39,353 | 4,545,665 |
| Granite Construction, Inc. | 52,935 | 2,923,600 |
| Griffon Corp. | 60,812 | 1,128,063 |
| H&E Equipment Services, Inc. | 81,840 | 1,926,514 |
| Harsco Corp. * | 238,225 | 4,073,647 |
| HD Supply Holdings, Inc. * | 78,574 | 2,616,514 |
| HEICO Corp. | 8,822 | 756,663 |
| HEICO Corp., Class A | 8,417 | 611,495 |
| Herc Holdings, Inc. * | 72,768 | 3,072,265 |
| Hexcel Corp. | 77,050 | 4,142,978 |
| Hillenbrand, Inc. | 60,015 | 2,145,536 |
| Hyster-Yale Materials Handling, Inc. | 27,424 | 1,952,040 |
| ITT, Inc. | 20,732 | 836,744 |
| Kaman Corp. | 42,560 | 2,087,142 |
| Kennametal, Inc. | 151,375 | 5,298,125 |
| KLX, Inc. * | 66,809 | 3,202,823 |
| Lennox International, Inc. | 27,337 | 4,530,561 |
| Lindsay Corp. | 15,719 | 1,360,794 |
| Masonite International Corp. * | 25,248 | 1,598,198 |
| MasTec, Inc. * | 85,195 | 3,475,956 |
| Meritor, Inc. * | 70,216 | 1,394,490 |
| Moog, Inc., Class A * | 61,519 | 4,722,198 |
| MRC Global, Inc. * | 269,083 | 4,243,439 |
| Mueller Industries, Inc. | 133,669 | 3,987,346 |
| Mueller Water Products, Inc., Class A | 112,282 | 1,346,261 |
| MYR Group, Inc. * | 36,715 | 947,614 |
| National Presto Industries, Inc. | 12,108 | 1,205,957 |
| NOW, Inc. * | 300,066 | 3,498,770 |
| Orbital ATK, Inc. | 36,774 | 4,103,243 |
| Primoris Services Corp. | 68,517 | 1,960,271 |
| Quanex Building Products Corp. | 70,870 | 1,389,052 |
| Raven Industries, Inc. | 44,397 | 1,243,116 |
| RBC Bearings, Inc. * | 13,192 | 1,454,682 |
| Rexnord Corp. * | 89,968 | 2,148,436 |
| Rush Enterprises, Inc., Class A * | 75,513 | 3,095,278 |
| Sensata Technologies Holding N.V. * | 94,342 | 4,213,314 |
| Simpson Manufacturing Co., Inc. | 39,322 | 1,721,517 |
| SPX Corp. * | 73,919 | 1,781,448 |
| SPX FLOW, Inc. * | 103,262 | 3,456,179 |
| Standex International Corp. | 13,508 | 1,289,339 |
| Teledyne Technologies, Inc. * | 31,540 | 4,732,892 |
| Tennant Co. | 20,790 | 1,267,151 |
| Textainer Group Holdings Ltd. * | 94,816 | 1,682,984 |
| The Greenbrier Cos., Inc. | 44,900 | 1,926,210 |
| The Middleby Corp. * | 18,509 | 2,252,545 |
| The Toro Co. | 72,620 | 4,479,202 |
| Titan International, Inc. | 153,475 | 1,316,816 |
| TriMas Corp. * | 63,547 | 1,537,837 |
| Triton International Ltd. * | 12,260 | 452,639 |
| Triumph Group, Inc. | 209,431 | 5,508,035 |
| Tutor Perini Corp. * | 109,128 | 2,853,697 |
| Univar, Inc. * | 21,528 | 607,305 |
| Universal Forest Products, Inc. | 35,067 | 3,058,193 |
| Security | Number
of Shares | Value ($) |
| USG Corp. * | 37,727 | 1,131,810 |
| Veritiv Corp. * | 13,956 | 390,768 |
| Wabash National Corp. | 95,768 | 2,013,043 |
| Watts Water Technologies, Inc., Class A | 32,595 | 2,011,111 |
| Welbilt, Inc. * | 35,480 | 706,052 |
| Woodward, Inc. | 50,729 | 3,561,683 |
| | | 242,724,437 |
| |
| Commercial & Professional Services 5.2% |
| ACCO Brands Corp. * | 156,479 | 1,713,445 |
| Brady Corp., Class A | 57,332 | 1,912,022 |
| CBIZ, Inc. * | 83,094 | 1,258,874 |
| Clean Harbors, Inc. * | 60,924 | 3,295,379 |
| Copart, Inc. * | 155,937 | 5,097,581 |
| Covanta Holding Corp. | 231,162 | 3,317,175 |
| Deluxe Corp. | 55,790 | 3,869,036 |
| Ennis, Inc. | 67,550 | 1,290,205 |
| Essendant, Inc. | 272,128 | 3,227,438 |
| Exponent, Inc. | 4,088 | 278,393 |
| FTI Consulting, Inc. * | 75,551 | 2,561,934 |
| Healthcare Services Group, Inc. | 48,761 | 2,496,563 |
| Herman Miller, Inc. | 69,463 | 2,337,430 |
| HNI Corp. | 58,237 | 2,134,386 |
| Huron Consulting Group, Inc. * | 26,178 | 791,885 |
| ICF International, Inc. * | 26,270 | 1,262,274 |
| IHS Markit Ltd. * | 134,805 | 6,314,266 |
| Insperity, Inc. | 19,537 | 1,568,821 |
| Interface, Inc. | 72,441 | 1,376,379 |
| KAR Auction Services, Inc. | 99,973 | 4,507,783 |
| Kelly Services, Inc., Class A | 182,896 | 3,956,040 |
| Kforce, Inc. | 79,273 | 1,426,914 |
| Kimball International, Inc., Class B | 14,552 | 246,802 |
| Knoll, Inc. | 45,687 | 824,650 |
| Korn/Ferry International | 55,553 | 1,851,026 |
| Matthews International Corp., Class A | 22,198 | 1,337,430 |
| McGrath RentCorp | 36,720 | 1,482,386 |
| Mobile Mini, Inc. | 34,733 | 1,050,673 |
| MSA Safety, Inc. | 27,538 | 2,006,419 |
| Navigant Consulting, Inc. * | 67,611 | 1,036,477 |
| On Assignment, Inc. * | 39,507 | 1,884,484 |
| Quad/Graphics, Inc. | 118,986 | 2,267,873 |
| R.R. Donnelley & Sons Co. | 278,717 | 2,572,558 |
| Resources Connection, Inc. | 104,174 | 1,328,219 |
| Rollins, Inc. | 43,132 | 1,915,492 |
| Steelcase, Inc., Class A | 172,560 | 2,277,792 |
| Stericycle, Inc. * | 58,411 | 4,199,167 |
| Team, Inc. * | 42,686 | 527,172 |
| Tetra Tech, Inc. | 75,371 | 3,210,805 |
| The Brink's Co. | 64,062 | 5,025,664 |
| TransUnion * | 8,872 | 424,614 |
| TrueBlue, Inc. * | 78,815 | 1,611,767 |
| UniFirst Corp. | 16,354 | 2,348,434 |
| Verisk Analytics, Inc. * | 75,104 | 6,087,179 |
| Viad Corp. | 36,499 | 2,005,620 |
| West Corp. | 77,620 | 1,813,979 |
| | | 105,330,905 |
| |
| Consumer Durables & Apparel 2.9% |
| American Outdoor Brands Corp. *(a) | 58,944 | 961,966 |
| Brunswick Corp. | 84,322 | 4,425,219 |
| CalAtlantic Group, Inc. | 37,031 | 1,286,827 |
| Callaway Golf Co. | 17,640 | 245,902 |
| Columbia Sportswear Co. | 26,932 | 1,542,934 |
| Crocs, Inc. * | 240,411 | 2,146,870 |
| Deckers Outdoor Corp. * | 71,506 | 4,569,233 |
| Ethan Allen Interiors, Inc. | 33,512 | 980,226 |
Schwab Fundamental Index ETFs | Semiannual Report
Schwab Fundamental U.S. Small Company Index ETF
Portfolio Holdings as of August 31, 2017 (Unaudited) (continued)
| Security | Number
of Shares | Value ($) |
| G-III Apparel Group Ltd. * | 97,757 | 2,688,317 |
| GoPro, Inc., Class A *(a) | 41,360 | 380,926 |
| Helen of Troy Ltd. * | 30,909 | 2,791,083 |
| Iconix Brand Group, Inc. * | 286,949 | 1,604,045 |
| iRobot Corp. * | 3,622 | 345,611 |
| KB Home | 70,942 | 1,518,159 |
| La-Z-Boy, Inc. | 86,270 | 2,057,540 |
| Lululemon Athletica, Inc. * | 51,536 | 2,965,897 |
| M.D.C Holdings, Inc. | 58,417 | 1,825,531 |
| M/I Homes, Inc. * | 8,472 | 208,411 |
| Meritage Homes Corp. * | 49,802 | 2,026,941 |
| Movado Group, Inc. | 10,268 | 284,937 |
| Oxford Industries, Inc. | 19,763 | 1,142,499 |
| Skechers U.S.A., Inc., Class A * | 96,805 | 2,558,556 |
| Steven Madden Ltd. * | 80,850 | 3,428,040 |
| Sturm Ruger & Co., Inc. (a) | 29,821 | 1,365,802 |
| Taylor Morrison Home Corp., Class A * | 15,848 | 320,447 |
| Tempur Sealy International, Inc. *(a) | 52,654 | 3,259,283 |
| Toll Brothers, Inc. | 77,918 | 3,035,685 |
| TopBuild Corp. * | 10,168 | 603,471 |
| TRI Pointe Group, Inc. * | 25,616 | 326,348 |
| Under Armour, Inc., Class A *(a) | 60,281 | 973,538 |
| Under Armour, Inc., Class C *(a) | 77,289 | 1,167,064 |
| Unifi, Inc. * | 34,753 | 1,080,123 |
| Universal Electronics, Inc. * | 3,888 | 227,642 |
| Vista Outdoor, Inc. * | 98,052 | 2,010,066 |
| Wolverine World Wide, Inc. | 106,350 | 2,797,005 |
| | | 59,152,144 |
| |
| Consumer Services 5.2% |
| American Public Education, Inc. * | 9,868 | 182,065 |
| Ascent Capital Group, Inc., Class A * | 25,316 | 251,388 |
| BJ's Restaurants, Inc. * | 33,494 | 1,008,169 |
| Bloomin' Brands, Inc. | 149,687 | 2,546,176 |
| Bob Evans Farms, Inc. | 59,362 | 4,082,918 |
| Boyd Gaming Corp. | 59,829 | 1,581,879 |
| Bright Horizons Family Solutions, Inc. * | 22,813 | 1,823,443 |
| Buffalo Wild Wings, Inc. * | 13,686 | 1,406,236 |
| Caesars Entertainment Corp. *(a) | 142,810 | 1,656,596 |
| Capella Education Co. | 21,058 | 1,418,256 |
| Career Education Corp. * | 181,404 | 1,743,292 |
| Choice Hotels International, Inc. | 34,428 | 2,136,257 |
| Churchill Downs, Inc. | 8,559 | 1,672,429 |
| ClubCorp Holdings, Inc. | 18,340 | 311,780 |
| Cracker Barrel Old Country Store, Inc. (a) | 18,256 | 2,713,937 |
| Dave & Buster's Entertainment, Inc. * | 3,888 | 227,292 |
| DineEquity, Inc. | 29,958 | 1,190,830 |
| Domino's Pizza, Inc. | 19,091 | 3,479,526 |
| Dunkin' Brands Group, Inc. | 56,893 | 2,933,403 |
| Extended Stay America, Inc. | 93,467 | 1,831,019 |
| Fiesta Restaurant Group, Inc. * | 10,068 | 175,183 |
| Graham Holdings Co., Class B | 8,584 | 5,040,525 |
| Grand Canyon Education, Inc. * | 21,795 | 1,788,280 |
| Hilton Grand Vacations, Inc. * | 11,564 | 419,195 |
| Hilton Worldwide Holdings, Inc. | 78,323 | 5,038,519 |
| Houghton Mifflin Harcourt Co. * | 148,741 | 1,517,158 |
| Hyatt Hotels Corp., Class A * | 27,087 | 1,611,947 |
| ILG, Inc. | 54,904 | 1,449,466 |
| International Speedway Corp., Class A | 34,931 | 1,245,290 |
| Jack in the Box, Inc. | 35,111 | 3,287,092 |
| K12, Inc. * | 71,137 | 1,274,775 |
| La Quinta Holdings, Inc. * | 100,939 | 1,594,836 |
| Marriott Vacations Worldwide Corp. | 23,669 | 2,754,125 |
| Norwegian Cruise Line Holdings Ltd. * | 78,337 | 4,657,918 |
| Penn National Gaming, Inc. * | 146,710 | 3,255,495 |
| Pinnacle Entertainment, Inc. * | 32,492 | 633,594 |
| Red Robin Gourmet Burgers, Inc. * | 29,838 | 1,700,766 |
| Security | Number
of Shares | Value ($) |
| Red Rock Resorts, Inc., Class A | 13,556 | 306,366 |
| Regis Corp. * | 194,079 | 2,577,369 |
| SeaWorld Entertainment, Inc. (a) | 174,719 | 2,267,853 |
| ServiceMaster Global Holdings, Inc. * | 41,449 | 1,953,077 |
| Six Flags Entertainment Corp. | 55,808 | 3,045,443 |
| Sonic Corp. | 9,968 | 233,351 |
| Sotheby's * | 55,796 | 2,503,566 |
| Strayer Education, Inc. | 28,981 | 2,318,770 |
| Texas Roadhouse, Inc. | 60,566 | 2,873,857 |
| The Cheesecake Factory, Inc. | 64,719 | 2,681,308 |
| Vail Resorts, Inc. | 12,493 | 2,847,779 |
| Weight Watchers International, Inc. * | 214,616 | 10,046,175 |
| | | 105,295,969 |
| |
| Diversified Financials 4.4% |
| BGC Partners, Inc., Class A | 141,697 | 1,840,644 |
| Capstead Mortgage Corp. | 136,070 | 1,315,797 |
| CBOE Holdings, Inc. | 47,580 | 4,800,346 |
| Chimera Investment Corp. | 192,903 | 3,678,660 |
| Credit Acceptance Corp. *(a) | 8,996 | 2,449,611 |
| CYS Investments, Inc. | 176,503 | 1,551,461 |
| Donnelley Financial Solutions, Inc. * | 72,256 | 1,547,001 |
| E*TRADE Financial Corp. * | 134,381 | 5,510,965 |
| Eaton Vance Corp. | 98,507 | 4,686,963 |
| Encore Capital Group, Inc. * | 6,380 | 257,433 |
| Enova International, Inc. * | 17,740 | 211,106 |
| Evercore, Inc., Class A | 28,662 | 2,162,548 |
| EZCORP, Inc., Class A * | 173,669 | 1,571,704 |
| FactSet Research Systems, Inc. | 19,351 | 3,041,590 |
| Federated Investors, Inc., Class B | 139,496 | 3,809,636 |
| FirstCash, Inc. | 57,411 | 3,370,026 |
| FNFV Group * | 503,697 | 8,487,294 |
| Greenhill & Co., Inc. | 67,051 | 1,009,118 |
| Invesco Mortgage Capital, Inc. | 144,650 | 2,456,157 |
| Lazard Ltd., Class A | 89,023 | 3,818,197 |
| MarketAxess Holdings, Inc. | 6,375 | 1,230,056 |
| MFA Financial, Inc. | 389,929 | 3,423,577 |
| Morningstar, Inc. | 17,091 | 1,413,426 |
| Nelnet, Inc., Class A | 34,573 | 1,639,797 |
| New Residential Investment Corp. | 206,351 | 3,400,665 |
| New York Mortgage Trust, Inc. | 45,648 | 285,757 |
| OneMain Holdings, Inc. * | 72,114 | 1,973,760 |
| PennyMac Mortgage Investment Trust | 120,466 | 2,082,857 |
| PRA Group, Inc. * | 51,789 | 1,496,702 |
| Redwood Trust, Inc. | 111,996 | 1,868,093 |
| Resource Capital Corp. | 23,820 | 246,537 |
| Starwood Property Trust, Inc. | 136,904 | 3,040,638 |
| Stifel Financial Corp. | 39,407 | 1,881,684 |
| Two Harbors Investment Corp. | 272,531 | 2,787,992 |
| Western Asset Mortgage Capital Corp. | 106,746 | 1,121,901 |
| World Acceptance Corp. * | 39,870 | 2,983,073 |
| | | 88,452,772 |
| |
| Energy 4.4% |
| Antero Resources Corp. * | 89,912 | 1,770,367 |
| Archrock, Inc. | 188,357 | 1,921,241 |
| Atwood Oceanics, Inc. *(a) | 395,657 | 2,599,467 |
| Basic Energy Services, Inc. * | 8,472 | 120,641 |
| Bill Barrett Corp. * | 327,582 | 979,470 |
| Bristow Group, Inc. | 238,308 | 1,963,658 |
| California Resources Corp. *(a) | 526,412 | 4,106,014 |
| CARBO Ceramics, Inc. *(a) | 183,174 | 1,201,621 |
| Cimarex Energy Co. | 49,732 | 4,957,783 |
| Cloud Peak Energy, Inc. * | 164,940 | 517,912 |
| Continental Resources, Inc. * | 45,408 | 1,540,239 |
| CVR Energy, Inc. (a) | 113,037 | 2,421,253 |
Schwab Fundamental Index ETFs | Semiannual Report
Schwab Fundamental U.S. Small Company Index ETF
Portfolio Holdings as of August 31, 2017 (Unaudited) (continued)
| Security | Number
of Shares | Value ($) |
| Denbury Resources, Inc. * | 2,879,108 | 3,051,854 |
| Dril-Quip, Inc. * | 50,314 | 1,889,291 |
| Energen Corp. * | 93,186 | 4,778,578 |
| Exterran Corp. * | 20,832 | 577,880 |
| Forum Energy Technologies, Inc. * | 99,243 | 1,151,219 |
| Golar LNG Ltd. | 61,751 | 1,338,762 |
| Green Plains, Inc. | 122,410 | 2,270,706 |
| Helix Energy Solutions Group, Inc. * | 263,851 | 1,654,346 |
| Kosmos Energy Ltd. * | 41,560 | 292,582 |
| Matrix Service Co. * | 73,316 | 868,795 |
| McDermott International, Inc. * | 553,420 | 3,397,999 |
| Newfield Exploration Co. * | 137,236 | 3,585,977 |
| Newpark Resources, Inc. * | 254,783 | 2,051,003 |
| Nordic American Offshore Ltd. | 5,898 | 7,137 |
| Nordic American Tankers Ltd. (a) | 147,684 | 700,022 |
| Oasis Petroleum, Inc. * | 198,913 | 1,452,065 |
| Oil States International, Inc. * | 134,347 | 2,922,047 |
| Pacific Ethanol, Inc. * | 40,564 | 202,820 |
| PDC Energy, Inc. * | 18,474 | 726,582 |
| Pioneer Energy Services Corp. * | 417,556 | 709,845 |
| Range Resources Corp. | 154,570 | 2,683,335 |
| Renewable Energy Group, Inc. * | 154,270 | 1,866,667 |
| REX American Resources Corp. * | 10,831 | 938,181 |
| Rowan Cos. plc, Class A * | 262,741 | 2,561,725 |
| RPC, Inc. (a) | 91,990 | 1,785,526 |
| Scorpio Tankers, Inc. | 73,552 | 299,357 |
| SEACOR Holdings, Inc. * | 56,203 | 2,156,509 |
| SEACOR Marine Holdings, Inc. * | 10,730 | 137,451 |
| SemGroup Corp., Class A | 58,610 | 1,506,277 |
| Ship Finance International Ltd. (a) | 103,062 | 1,344,959 |
| Southwestern Energy Co. * | 725,136 | 3,951,991 |
| Stone Energy Corp. * | 12,956 | 313,535 |
| Teekay Corp. (a) | 314,855 | 2,902,963 |
| Tesco Corp. * | 189,393 | 833,329 |
| Unit Corp. * | 165,088 | 2,628,201 |
| US Silica Holdings, Inc. | 27,343 | 744,003 |
| W&T Offshore, Inc. * | 734,168 | 1,402,261 |
| WPX Energy, Inc. * | 282,391 | 2,821,086 |
| | | 88,606,532 |
| |
| Food & Staples Retailing 0.8% |
| Ingles Markets, Inc., Class A | 52,006 | 1,141,532 |
| Performance Food Group Co. * | 92,597 | 2,574,196 |
| PriceSmart, Inc. | 24,631 | 2,001,269 |
| SpartanNash Co. | 106,688 | 2,628,792 |
| Sprouts Farmers Market, Inc. * | 103,649 | 2,066,761 |
| SUPERVALU, Inc. * | 87,028 | 1,739,690 |
| The Andersons, Inc. | 95,042 | 3,027,088 |
| Weis Markets, Inc. | 7,776 | 343,777 |
| | | 15,523,105 |
| |
| Food, Beverage & Tobacco 2.5% |
| B&G Foods, Inc. | 38,294 | 1,167,967 |
| Blue Buffalo Pet Products, Inc. * | 9,272 | 238,847 |
| Cal-Maine Foods, Inc. *(a) | 53,765 | 1,959,734 |
| Calavo Growers, Inc. | 3,392 | 227,773 |
| Darling Ingredients, Inc. * | 239,051 | 4,159,487 |
| Dean Foods Co. | 180,154 | 1,981,694 |
| Flowers Foods, Inc. | 271,536 | 4,716,580 |
| Fresh Del Monte Produce, Inc. | 70,060 | 3,292,119 |
| J&J Snack Foods Corp. | 12,503 | 1,594,008 |
| Lancaster Colony Corp. | 18,141 | 2,112,882 |
| Pilgrim's Pride Corp. * | 123,561 | 3,638,872 |
| Pinnacle Foods, Inc. | 72,520 | 4,301,161 |
| Post Holdings, Inc. * | 4,188 | 356,524 |
| Sanderson Farms, Inc. | 44,754 | 6,602,110 |
| Security | Number
of Shares | Value ($) |
| Snyder's-Lance, Inc. | 72,325 | 2,568,984 |
| The Boston Beer Co., Inc., Class A * | 7,946 | 1,183,954 |
| The Hain Celestial Group, Inc. * | 65,050 | 2,616,311 |
| TreeHouse Foods, Inc. * | 42,034 | 2,815,858 |
| Universal Corp. | 67,524 | 3,862,373 |
| Vector Group Ltd. | 83,355 | 1,800,468 |
| | | 51,197,706 |
| |
| Health Care Equipment & Services 4.7% |
| Acadia Healthcare Co., Inc. * | 6,480 | 304,171 |
| Alere, Inc. * | 54,955 | 2,718,074 |
| Align Technology, Inc. * | 14,472 | 2,557,781 |
| Allscripts Healthcare Solutions, Inc. * | 189,755 | 2,493,381 |
| Amedisys, Inc. * | 24,469 | 1,278,261 |
| AMN Healthcare Services, Inc. * | 7,576 | 282,964 |
| Analogic Corp. | 15,131 | 1,082,623 |
| athenahealth, Inc. * | 2,096 | 295,389 |
| Brookdale Senior Living, Inc. * | 243,901 | 2,958,519 |
| Chemed Corp. | 20,336 | 4,012,090 |
| CONMED Corp. | 32,352 | 1,604,659 |
| Diplomat Pharmacy, Inc. * | 17,144 | 287,162 |
| Envision Healthcare Corp. * | 86,558 | 4,536,505 |
| Globus Medical, Inc., Class A * | 7,976 | 241,115 |
| Haemonetics Corp. * | 40,885 | 1,758,873 |
| Halyard Health, Inc. * | 85,853 | 3,888,282 |
| HealthSouth Corp. | 80,874 | 3,699,986 |
| Hill-Rom Holdings, Inc. | 55,781 | 4,292,906 |
| HMS Holdings Corp. * | 52,696 | 933,773 |
| Hologic, Inc. * | 67,646 | 2,611,136 |
| IDEXX Laboratories, Inc. * | 34,865 | 5,419,067 |
| Integra LifeSciences Holdings Corp. * | 4,588 | 233,942 |
| Invacare Corp. | 141,330 | 1,907,955 |
| Kindred Healthcare, Inc. | 436,177 | 3,533,034 |
| LHC Group, Inc. * | 20,404 | 1,331,361 |
| LivaNova plc * | 22,624 | 1,415,810 |
| Masimo Corp. * | 22,709 | 1,916,185 |
| Meridian Bioscience, Inc. | 15,448 | 214,727 |
| Molina Healthcare, Inc. * | 58,229 | 3,726,656 |
| NuVasive, Inc. * | 3,688 | 230,426 |
| PharMerica Corp. * | 83,249 | 2,447,521 |
| Premier, Inc., Class A * | 6,880 | 230,480 |
| Quality Systems, Inc. * | 91,167 | 1,435,880 |
| Select Medical Holdings Corp. * | 291,489 | 5,421,695 |
| STERIS plc | 50,590 | 4,409,424 |
| Teleflex, Inc. | 19,479 | 4,124,678 |
| The Cooper Cos., Inc. | 20,633 | 5,175,375 |
| The Ensign Group, Inc. | 14,352 | 294,790 |
| Triple-S Management Corp., Class B * | 112,983 | 2,791,810 |
| VCA, Inc. * | 46,720 | 4,343,091 |
| West Pharmaceutical Services, Inc. | 32,400 | 2,820,096 |
| | | 95,261,653 |
| |
| Household & Personal Products 0.7% |
| Central Garden & Pet Co. * | 3,092 | 108,993 |
| Central Garden & Pet Co., Class A * | 58,139 | 1,981,958 |
| Coty, Inc., Class A | 27,108 | 449,451 |
| Edgewell Personal Care Co. * | 64,741 | 4,916,431 |
| Energizer Holdings, Inc. | 68,838 | 3,039,198 |
| HRG Group, Inc. * | 113,087 | 1,785,644 |
| Spectrum Brands Holdings, Inc. | 12,850 | 1,412,986 |
| USANA Health Sciences, Inc. * | 3,788 | 224,250 |
| WD-40 Co. | 10,319 | 1,124,255 |
| | | 15,043,166 |
| |
Schwab Fundamental Index ETFs | Semiannual Report
Schwab Fundamental U.S. Small Company Index ETF
Portfolio Holdings as of August 31, 2017 (Unaudited) (continued)
| Security | Number
of Shares | Value ($) |
| Insurance 3.0% |
| Ambac Financial Group, Inc. * | 105,069 | 1,911,205 |
| American Equity Investment Life Holding Co. | 140,398 | 3,897,448 |
| American National Insurance Co. | 11,464 | 1,326,499 |
| AmTrust Financial Services, Inc. | 80,614 | 999,614 |
| Argo Group International Holdings Ltd. | 34,501 | 2,076,960 |
| Aspen Insurance Holdings Ltd. | 93,616 | 4,231,443 |
| Athene Holding Ltd., Class A * | 5,384 | 288,098 |
| Brown & Brown, Inc. | 80,383 | 3,614,020 |
| CNA Financial Corp. | 33,386 | 1,637,917 |
| Employers Holdings, Inc. | 32,360 | 1,363,974 |
| Erie Indemnity Co., Class A | 37,671 | 4,550,280 |
| Horace Mann Educators Corp. | 34,656 | 1,218,158 |
| Infinity Property & Casualty Corp. | 16,886 | 1,493,567 |
| James River Group Holdings Ltd. | 27,506 | 1,096,939 |
| Kemper Corp. | 83,073 | 3,979,197 |
| Maiden Holdings Ltd. | 86,290 | 625,603 |
| MBIA, Inc. * | 280,657 | 2,823,409 |
| Mercury General Corp. | 44,897 | 2,580,231 |
| Primerica, Inc. | 62,782 | 4,805,962 |
| ProAssurance Corp. | 70,858 | 3,773,189 |
| RLI Corp. | 41,940 | 2,244,629 |
| Safety Insurance Group, Inc. | 19,274 | 1,376,164 |
| Selective Insurance Group, Inc. | 39,593 | 1,995,487 |
| Stewart Information Services Corp. | 44,167 | 1,593,545 |
| The Hanover Insurance Group, Inc. | 48,983 | 4,809,151 |
| Universal Insurance Holdings, Inc. | 9,468 | 203,089 |
| | | 60,515,778 |
| |
| Materials 6.7% |
| A. Schulman, Inc. | 70,658 | 2,148,003 |
| AdvanSix, Inc. * | 29,600 | 945,128 |
| AK Steel Holding Corp. * | 170,993 | 957,561 |
| AptarGroup, Inc. | 76,331 | 6,382,035 |
| Axalta Coating Systems Ltd. * | 99,631 | 2,941,107 |
| Balchem Corp. | 2,692 | 201,792 |
| Berry Global Group, Inc. * | 57,960 | 3,259,670 |
| Boise Cascade Co. * | 122,882 | 3,686,460 |
| Cabot Corp. | 100,734 | 5,306,667 |
| Calgon Carbon Corp. | 86,276 | 1,052,567 |
| Carpenter Technology Corp. | 91,185 | 3,695,728 |
| Century Aluminum Co. * | 132,391 | 2,584,272 |
| Clearwater Paper Corp. * | 45,750 | 2,127,375 |
| Compass Minerals International, Inc. (a) | 41,655 | 2,782,554 |
| Eagle Materials, Inc. | 20,364 | 1,980,399 |
| Ferro Corp. * | 74,737 | 1,440,182 |
| GCP Applied Technologies, Inc. * | 20,732 | 585,679 |
| Greif, Inc., Class A | 70,830 | 4,281,674 |
| H.B. Fuller Co. | 54,448 | 2,732,745 |
| Haynes International, Inc. | 6,080 | 185,744 |
| Hecla Mining Co. | 181,390 | 957,739 |
| Ingevity Corp. * | 6,680 | 420,640 |
| Innophos Holdings, Inc. | 45,601 | 2,082,142 |
| Innospec, Inc. | 25,018 | 1,388,499 |
| Kaiser Aluminum Corp. | 32,073 | 3,089,271 |
| KapStone Paper & Packaging Corp. | 97,691 | 2,185,348 |
| Kraton Corp. * | 51,169 | 1,679,878 |
| Louisiana-Pacific Corp. * | 92,781 | 2,364,060 |
| Materion Corp. | 56,465 | 2,156,963 |
| Minerals Technologies, Inc. | 27,610 | 1,767,040 |
| Neenah Paper, Inc. | 16,533 | 1,277,174 |
| NewMarket Corp. | 8,843 | 3,700,884 |
| Olin Corp. | 152,466 | 4,913,979 |
| Olympic Steel, Inc. | 14,652 | 267,399 |
| P.H. Glatfelter Co. | 110,546 | 1,914,657 |
| Security | Number
of Shares | Value ($) |
| Platform Specialty Products Corp. * | 113,003 | 1,319,875 |
| PolyOne Corp. | 124,763 | 4,508,935 |
| Quaker Chemical Corp. | 9,861 | 1,372,848 |
| Rayonier Advanced Materials, Inc. (a) | 28,404 | 389,703 |
| Royal Gold, Inc. | 18,693 | 1,743,683 |
| Schnitzer Steel Industries, Inc., Class A | 165,021 | 4,439,065 |
| Schweitzer-Mauduit International, Inc. | 44,755 | 1,697,557 |
| Sensient Technologies Corp. | 45,881 | 3,310,314 |
| Silgan Holdings, Inc. | 136,915 | 4,119,772 |
| Southern Copper Corp. | 145,602 | 5,926,001 |
| Stepan Co. | 27,857 | 2,155,018 |
| Summit Materials, Inc., Class A * | 10,468 | 309,225 |
| SunCoke Energy, Inc. * | 187,547 | 1,747,938 |
| The Scotts Miracle-Gro Co., Class A | 43,826 | 4,189,327 |
| TimkenSteel Corp. * | 201,749 | 2,991,938 |
| Trinseo S.A. | 32,125 | 2,149,163 |
| Tronox Ltd., Class A | 178,097 | 3,684,827 |
| W.R. Grace & Co. | 42,388 | 3,029,894 |
| Westlake Chemical Corp. | 46,273 | 3,558,857 |
| Worthington Industries, Inc. | 66,349 | 3,314,796 |
| | | 135,401,751 |
| |
| Media 2.2% |
| AMC Entertainment Holdings, Inc., Class A (a) | 14,452 | 193,657 |
| AMC Networks, Inc., Class A * | 38,898 | 2,364,220 |
| Cable One, Inc. | 3,115 | 2,363,475 |
| Cinemark Holdings, Inc. | 112,744 | 3,753,248 |
| Gannett Co., Inc. | 525,277 | 4,459,602 |
| John Wiley & Sons, Inc., Class A | 57,061 | 3,078,441 |
| Liberty Broadband Corp., Class C * | 2,692 | 273,319 |
| Lions Gate Entertainment Corp., Class A * | 33,706 | 1,002,079 |
| Lions Gate Entertainment Corp., Class B * | 41,402 | 1,162,154 |
| Live Nation Entertainment, Inc. * | 100,114 | 4,000,555 |
| Meredith Corp. | 46,205 | 2,511,242 |
| National CineMedia, Inc. | 135,859 | 734,997 |
| New Media Investment Group, Inc. | 22,624 | 311,985 |
| Nexstar Media Group, Inc., Class A | 4,588 | 276,197 |
| Regal Entertainment Group, Class A | 133,927 | 1,978,102 |
| Scholastic Corp. | 61,976 | 2,443,714 |
| Sinclair Broadcast Group, Inc., Class A | 67,124 | 2,030,501 |
| Sirius XM Holdings, Inc. (a) | 847,949 | 4,875,707 |
| The Madison Square Garden Co., Class A * | 1,596 | 339,166 |
| The New York Times Co., Class A | 130,701 | 2,437,574 |
| Time, Inc. | 387,970 | 5,101,805 |
| | | 45,691,740 |
| |
| Pharmaceuticals, Biotechnology & Life Sciences 3.2% |
| Alexion Pharmaceuticals, Inc. * | 32,712 | 4,658,516 |
| Bio-Rad Laboratories, Inc., Class A * | 16,557 | 3,606,446 |
| Bio-Techne Corp. | 16,931 | 2,095,719 |
| Bruker Corp. | 63,779 | 1,855,331 |
| Catalent, Inc. * | 42,746 | 1,764,982 |
| Charles River Laboratories International, Inc. * | 40,683 | 4,426,310 |
| Endo International plc * | 101,280 | 890,251 |
| Illumina, Inc. * | 22,765 | 4,654,532 |
| Impax Laboratories, Inc. * | 114,206 | 2,472,560 |
| INC Research Holdings, Inc., Class A * | 4,188 | 245,836 |
| Mallinckrodt plc * | 58,904 | 2,419,776 |
| Myriad Genetics, Inc. * | 156,758 | 4,779,551 |
| PAREXEL International Corp. * | 29,220 | 2,568,146 |
| PDL BioPharma, Inc. * | 1,053,473 | 3,286,836 |
| PerkinElmer, Inc. | 76,978 | 5,156,756 |
| PRA Health Sciences, Inc. * | 3,092 | 239,321 |
Schwab Fundamental Index ETFs | Semiannual Report
Schwab Fundamental U.S. Small Company Index ETF
Portfolio Holdings as of August 31, 2017 (Unaudited) (continued)
| Security | Number
of Shares | Value ($) |
| Prestige Brands Holdings, Inc. * | 22,357 | 1,133,724 |
| QIAGEN N.V. * | 106,554 | 3,427,842 |
| Quintiles IMS Holdings, Inc. * | 67,844 | 6,515,059 |
| Regeneron Pharmaceuticals, Inc. * | 7,835 | 3,893,212 |
| Vertex Pharmaceuticals, Inc. * | 10,917 | 1,752,615 |
| VWR Corp. * | 71,050 | 2,346,071 |
| | | 64,189,392 |
| |
| Real Estate 10.7% |
| Acadia Realty Trust | 30,738 | 881,873 |
| Alexandria Real Estate Equities, Inc. | 34,375 | 4,170,031 |
| Altisource Portfolio Solutions S.A. *(a) | 47,849 | 1,090,000 |
| Altisource Residential Corp. | 114,931 | 1,391,814 |
| American Campus Communities, Inc. | 68,264 | 3,248,684 |
| American Homes 4 Rent, Class A | 10,468 | 231,971 |
| Apartment Investment & Management Co., Class A | 90,707 | 4,111,748 |
| Apple Hospitality REIT, Inc. | 177,909 | 3,234,386 |
| Ashford Hospitality Trust, Inc. | 221,243 | 1,373,919 |
| Brandywine Realty Trust | 178,210 | 3,061,648 |
| Camden Property Trust | 56,912 | 5,092,486 |
| CBL & Associates Properties, Inc. | 377,212 | 3,017,696 |
| Chesapeake Lodging Trust | 48,651 | 1,244,979 |
| Columbia Property Trust, Inc. | 175,367 | 3,682,707 |
| Corporate Office Properties Trust | 88,073 | 2,938,115 |
| CubeSmart | 61,867 | 1,525,022 |
| CyrusOne, Inc. | 5,284 | 333,051 |
| DCT Industrial Trust, Inc. | 37,013 | 2,159,709 |
| DDR Corp. | 273,437 | 2,646,870 |
| DiamondRock Hospitality Co. | 223,807 | 2,459,639 |
| Douglas Emmett, Inc. | 73,770 | 2,874,079 |
| DuPont Fabros Technology, Inc. | 30,329 | 1,951,974 |
| EastGroup Properties, Inc. | 18,680 | 1,659,905 |
| Education Realty Trust, Inc. | 7,076 | 273,417 |
| EPR Properties | 30,587 | 2,130,690 |
| Equity Commonwealth * | 111,034 | 3,435,392 |
| Equity LifeStyle Properties, Inc. | 33,395 | 2,977,164 |
| Extra Space Storage, Inc. | 37,887 | 2,941,168 |
| Federal Realty Investment Trust | 29,637 | 3,761,824 |
| First Industrial Realty Trust, Inc. | 47,988 | 1,486,668 |
| Forest City Realty Trust, Inc., Class A | 17,144 | 410,770 |
| Franklin Street Properties Corp. | 105,659 | 1,053,420 |
| Gaming & Leisure Properties, Inc. | 79,388 | 3,111,216 |
| Government Properties Income Trust | 67,374 | 1,249,788 |
| Gramercy Property Trust | 48,314 | 1,471,644 |
| Healthcare Realty Trust, Inc. | 67,450 | 2,244,736 |
| Healthcare Trust of America, Inc., Class A | 68,307 | 2,122,299 |
| Hersha Hospitality Trust | 63,513 | 1,177,531 |
| Highwoods Properties, Inc. | 64,507 | 3,369,201 |
| Hudson Pacific Properties, Inc. | 7,976 | 263,208 |
| Investors Real Estate Trust | 206,540 | 1,297,071 |
| Kilroy Realty Corp. | 36,282 | 2,511,803 |
| Kite Realty Group Trust | 13,856 | 278,783 |
| Lamar Advertising Co., Class A | 48,277 | 3,213,317 |
| LaSalle Hotel Properties | 107,349 | 3,046,565 |
| Lexington Realty Trust | 228,933 | 2,257,279 |
| Liberty Property Trust | 115,495 | 4,920,087 |
| Life Storage, Inc. | 19,598 | 1,442,217 |
| Mack-Cali Realty Corp. | 128,208 | 2,934,681 |
| Medical Properties Trust, Inc. | 111,545 | 1,467,932 |
| Mid-America Apartment Communities, Inc. | 53,463 | 5,691,671 |
| Monogram Residential Trust, Inc. | 127,034 | 1,524,408 |
| National Health Investors, Inc. | 2,992 | 239,899 |
| National Retail Properties, Inc. | 58,053 | 2,428,357 |
| New Senior Investment Group, Inc. | 31,496 | 290,708 |
| Omega Healthcare Investors, Inc. | 82,007 | 2,613,563 |
| Security | Number
of Shares | Value ($) |
| Outfront Media, Inc. | 199,149 | 4,381,278 |
| Paramount Group, Inc. | 106,650 | 1,682,937 |
| Park Hotels & Resorts, Inc. | 38,868 | 1,037,387 |
| Pebblebrook Hotel Trust | 43,056 | 1,446,251 |
| Pennsylvania Real Estate Investment Trust | 103,067 | 1,033,762 |
| Piedmont Office Realty Trust, Inc., Class A | 187,661 | 3,800,135 |
| Potlatch Corp. | 39,925 | 1,908,415 |
| PS Business Parks, Inc. | 11,477 | 1,550,658 |
| Quality Care Properties, Inc. * | 73,352 | 1,006,389 |
| Ramco-Gershenson Properties Trust | 19,736 | 259,528 |
| Rayonier, Inc. | 166,349 | 4,825,785 |
| Realty Income Corp. | 74,344 | 4,279,241 |
| Regency Centers Corp. | 62,957 | 4,049,394 |
| Retail Properties of America, Inc., Class A | 239,626 | 3,194,215 |
| RLJ Lodging Trust | 147,988 | 2,986,398 |
| Ryman Hospitality Properties, Inc. | 39,579 | 2,351,784 |
| Sabra Health Care REIT, Inc. | 116,679 | 2,549,436 |
| SBA Communications Corp. * | 35,054 | 5,382,542 |
| Select Income REIT | 10,664 | 247,511 |
| Senior Housing Properties Trust | 221,467 | 4,367,329 |
| Spirit Realty Capital, Inc. | 252,058 | 2,192,905 |
| STORE Capital Corp. | 12,760 | 323,849 |
| Summit Hotel Properties, Inc. | 13,956 | 207,107 |
| Sun Communities, Inc. | 26,022 | 2,350,047 |
| Sunstone Hotel Investors, Inc. | 168,779 | 2,666,708 |
| Tanger Factory Outlet Centers, Inc. | 59,385 | 1,389,609 |
| Taubman Centers, Inc. | 54,451 | 2,844,520 |
| The GEO Group, Inc. | 142,008 | 3,925,101 |
| Tier REIT, Inc. | 66,525 | 1,224,725 |
| UDR, Inc. | 135,671 | 5,266,748 |
| Urban Edge Properties | 10,268 | 258,240 |
| VEREIT, Inc. | 332,931 | 2,809,938 |
| Washington Prime Group, Inc. | 363,470 | 3,034,975 |
| Washington Real Estate Investment Trust | 59,690 | 1,961,413 |
| Weingarten Realty Investors | 88,306 | 2,829,324 |
| WP Carey, Inc. | 54,580 | 3,757,833 |
| Xenia Hotels & Resorts, Inc. | 149,671 | 2,987,433 |
| | | 216,391,633 |
| |
| Retailing 4.5% |
| Aaron's, Inc. | 119,858 | 5,306,114 |
| Asbury Automotive Group, Inc. * | 59,050 | 3,179,842 |
| Barnes & Noble Education, Inc. * | 222,161 | 1,150,794 |
| Barnes & Noble, Inc. | 254,048 | 1,968,872 |
| Big 5 Sporting Goods Corp. (a) | 19,036 | 145,625 |
| Burlington Stores, Inc. * | 26,274 | 2,289,254 |
| Cabela's, Inc. * | 46,740 | 2,509,938 |
| Caleres, Inc. | 104,555 | 2,820,894 |
| Citi Trends, Inc. | 12,460 | 225,900 |
| DSW, Inc., Class A | 191,821 | 3,554,443 |
| Express, Inc. * | 333,004 | 2,121,235 |
| Five Below, Inc. * | 28,854 | 1,372,585 |
| Fred's, Inc., Class A (a) | 216,470 | 1,281,502 |
| Genesco, Inc. * | 68,680 | 1,452,582 |
| Groupon, Inc. * | 76,640 | 340,282 |
| Guess?, Inc. | 413,063 | 6,435,521 |
| Haverty Furniture Cos., Inc. | 11,564 | 271,176 |
| Hibbett Sports, Inc. * | 66,349 | 816,093 |
| HSN, Inc. | 87,510 | 3,211,617 |
| J.C. Penney Co., Inc. *(a) | 977,415 | 3,782,596 |
| Liberty TripAdvisor Holdings, Inc., Class A * | 68,594 | 915,730 |
| Lithia Motors, Inc., Class A | 28,925 | 3,123,900 |
| Lumber Liquidators Holdings, Inc. * | 85,933 | 3,225,065 |
| Monro, Inc. | 27,182 | 1,296,581 |
| Netflix, Inc. * | 25,923 | 4,529,007 |
| Penske Automotive Group, Inc. | 81,713 | 3,461,363 |
Schwab Fundamental Index ETFs | Semiannual Report
Schwab Fundamental U.S. Small Company Index ETF
Portfolio Holdings as of August 31, 2017 (Unaudited) (continued)
| Security | Number
of Shares | Value ($) |
| Pier 1 Imports, Inc. | 601,547 | 2,520,482 |
| Pool Corp. | 27,307 | 2,722,235 |
| Rent-A-Center, Inc. (a) | 394,588 | 4,774,515 |
| RH *(a) | 36,490 | 1,707,367 |
| Select Comfort Corp. * | 67,860 | 2,003,906 |
| Shoe Carnival, Inc. | 40,470 | 813,447 |
| Shutterfly, Inc. * | 23,769 | 1,083,391 |
| Sonic Automotive, Inc., Class A | 155,690 | 2,817,989 |
| Tailored Brands, Inc. (a) | 28,008 | 331,055 |
| The Buckle, Inc. (a) | 128,258 | 1,814,851 |
| The Cato Corp., Class A | 78,480 | 1,032,797 |
| The Children's Place, Inc. | 27,927 | 2,964,451 |
| The Finish Line, Inc., Class A | 176,216 | 1,467,879 |
| The Michaels Cos., Inc. * | 72,374 | 1,624,796 |
| TripAdvisor, Inc. * | 43,266 | 1,848,756 |
| Vitamin Shoppe, Inc. * | 97,843 | 523,460 |
| Zumiez, Inc. * | 56,528 | 703,774 |
| | | 91,543,662 |
| |
| Semiconductors & Semiconductor Equipment 2.0% |
| Advanced Energy Industries, Inc. * | 18,211 | 1,339,237 |
| Amkor Technology, Inc. * | 202,168 | 1,775,035 |
| Brooks Automation, Inc. | 67,489 | 1,759,438 |
| Cabot Microelectronics Corp. | 29,088 | 2,083,283 |
| Cirrus Logic, Inc. * | 36,158 | 2,096,441 |
| Cree, Inc. * | 140,737 | 3,424,131 |
| Cypress Semiconductor Corp. | 229,097 | 3,136,338 |
| Diodes, Inc. * | 48,303 | 1,359,246 |
| Entegris, Inc. * | 73,618 | 1,873,578 |
| Integrated Device Technology, Inc. * | 81,979 | 2,025,701 |
| Microsemi Corp. * | 36,014 | 1,814,385 |
| MKS Instruments, Inc. | 36,595 | 3,013,598 |
| Photronics, Inc. * | 119,324 | 942,660 |
| Power Integrations, Inc. | 15,968 | 1,163,269 |
| Rambus, Inc. * | 19,336 | 250,788 |
| Semtech Corp. * | 6,880 | 258,688 |
| Silicon Laboratories, Inc. * | 31,858 | 2,418,022 |
| Synaptics, Inc. * | 28,344 | 1,178,260 |
| Teradyne, Inc. | 163,231 | 5,812,656 |
| Veeco Instruments, Inc. * | 62,098 | 1,173,652 |
| Versum Materials, Inc. | 49,932 | 1,843,989 |
| Xperi Corp. | 33,272 | 906,662 |
| | | 41,649,057 |
| |
| Software & Services 6.7% |
| ACI Worldwide, Inc. * | 71,182 | 1,620,102 |
| Acxiom Corp. * | 75,129 | 1,749,754 |
| ANSYS, Inc. * | 34,262 | 4,413,631 |
| Aspen Technology, Inc. * | 6,380 | 403,535 |
| Blackhawk Network Holdings, Inc. * | 7,176 | 321,485 |
| Cadence Design Systems, Inc. * | 84,272 | 3,311,047 |
| Cardtronics plc, Class A * | 28,903 | 750,900 |
| CDK Global, Inc. | 68,285 | 4,404,383 |
| Cimpress N.V. *(a) | 18,446 | 1,705,148 |
| CommVault Systems, Inc. * | 19,047 | 1,162,819 |
| Convergys Corp. | 172,219 | 4,047,147 |
| CoreLogic, Inc. * | 96,725 | 4,543,173 |
| CoStar Group, Inc. * | 900 | 257,958 |
| CSG Systems International, Inc. | 38,348 | 1,484,451 |
| CSRA, Inc. | 214,833 | 6,769,388 |
| DST Systems, Inc. | 77,154 | 3,960,315 |
| EPAM Systems, Inc. * | 15,357 | 1,248,985 |
| Euronet Worldwide, Inc. * | 23,389 | 2,298,437 |
| EVERTEC, Inc. | 15,848 | 291,603 |
| ExlService Holdings, Inc. * | 4,984 | 280,500 |
| Fair Isaac Corp. | 21,214 | 2,986,083 |
| Security | Number
of Shares | Value ($) |
| FleetCor Technologies, Inc. * | 16,090 | 2,313,259 |
| Gartner, Inc. * | 40,655 | 4,902,586 |
| Genpact Ltd. | 147,734 | 4,203,032 |
| j2 Global, Inc. | 21,377 | 1,609,261 |
| Jack Henry & Associates, Inc. | 45,240 | 4,662,887 |
| Manhattan Associates, Inc. * | 32,996 | 1,387,482 |
| ManTech International Corp., Class A | 73,613 | 2,960,715 |
| MAXIMUS, Inc. | 49,228 | 2,992,078 |
| Nuance Communications, Inc. * | 127,354 | 2,046,579 |
| Progress Software Corp. | 85,098 | 2,857,591 |
| PTC, Inc. * | 57,037 | 3,194,072 |
| Red Hat, Inc. * | 55,679 | 5,985,493 |
| Sabre Corp. | 57,153 | 1,053,901 |
| salesforce.com, Inc. * | 46,392 | 4,429,972 |
| Science Applications International Corp. | 48,549 | 3,586,800 |
| SS&C Technologies Holdings, Inc. | 43,040 | 1,666,078 |
| Sykes Enterprises, Inc. * | 71,826 | 1,914,881 |
| Synopsys, Inc. * | 61,933 | 4,980,652 |
| Syntel, Inc. | 14,152 | 255,585 |
| Take-Two Interactive Software, Inc. * | 47,473 | 4,642,385 |
| TiVo Corp. | 182,481 | 3,339,402 |
| Travelport Worldwide Ltd. | 166,122 | 2,515,087 |
| Twitter, Inc. * | 14,152 | 239,310 |
| Unisys Corp. * | 173,912 | 1,347,818 |
| Vantiv, Inc., Class A * | 40,038 | 2,830,286 |
| Verint Systems, Inc. * | 37,046 | 1,470,726 |
| VeriSign, Inc. * | 57,089 | 5,922,984 |
| VMware, Inc., Class A * | 30,336 | 3,279,322 |
| WebMD Health Corp. * | 31,392 | 2,085,684 |
| WEX, Inc. * | 17,895 | 1,953,060 |
| Zynga, Inc., Class A * | 393,592 | 1,475,970 |
| | | 136,115,782 |
| |
| Technology Hardware & Equipment 4.9% |
| ADTRAN, Inc. | 109,168 | 2,412,613 |
| ARRIS International plc * | 32,988 | 919,046 |
| AVX Corp. | 71,098 | 1,240,660 |
| Belden, Inc. | 38,995 | 3,005,345 |
| Benchmark Electronics, Inc. * | 146,310 | 4,755,075 |
| Ciena Corp. * | 10,368 | 224,052 |
| Cognex Corp. | 19,861 | 2,164,253 |
| Coherent, Inc. * | 12,481 | 2,912,067 |
| Comtech Telecommunications Corp. | 169,855 | 3,324,062 |
| Cray, Inc. * | 12,560 | 236,756 |
| Diebold Nixdorf, Inc. | 114,828 | 2,348,233 |
| Dolby Laboratories, Inc., Class A | 50,629 | 2,554,739 |
| EchoStar Corp., Class A * | 55,612 | 3,353,404 |
| Electronics For Imaging, Inc. * | 26,860 | 955,142 |
| ePlus, Inc. * | 20,688 | 1,731,586 |
| Fabrinet * | 29,247 | 1,135,953 |
| Finisar Corp. * | 74,704 | 1,804,102 |
| Harmonic, Inc. * | 270,154 | 878,000 |
| II-VI, Inc. * | 43,490 | 1,559,116 |
| Insight Enterprises, Inc. * | 129,208 | 5,178,657 |
| InterDigital, Inc. | 29,129 | 2,078,354 |
| IPG Photonics Corp. * | 13,438 | 2,362,266 |
| Itron, Inc. * | 32,063 | 2,327,774 |
| Knowles Corp. * | 154,321 | 2,263,889 |
| Littelfuse, Inc. | 12,097 | 2,251,977 |
| Lumentum Holdings, Inc. * | 25,261 | 1,436,088 |
| Methode Electronics, Inc. | 33,218 | 1,358,616 |
| MTS Systems Corp. | 25,355 | 1,227,182 |
| National Instruments Corp. | 83,211 | 3,360,892 |
| NETGEAR, Inc. * | 45,704 | 2,193,792 |
| NetScout Systems, Inc. * | 40,055 | 1,311,801 |
| OSI Systems, Inc. * | 17,552 | 1,457,869 |
| Plantronics, Inc. | 49,430 | 2,107,201 |
Schwab Fundamental Index ETFs | Semiannual Report
Schwab Fundamental U.S. Small Company Index ETF
Portfolio Holdings as of August 31, 2017 (Unaudited) (continued)
| Security | Number
of Shares | Value ($) |
| Plexus Corp. * | 66,907 | 3,484,517 |
| Rogers Corp. * | 13,246 | 1,570,313 |
| ScanSource, Inc. * | 91,939 | 3,608,606 |
| Super Micro Computer, Inc. * | 51,043 | 1,359,020 |
| Trimble, Inc. * | 133,155 | 5,150,435 |
| TTM Technologies, Inc. * | 91,521 | 1,303,259 |
| VeriFone Systems, Inc. * | 121,883 | 2,409,627 |
| ViaSat, Inc. * | 25,695 | 1,634,459 |
| Viavi Solutions, Inc. * | 156,764 | 1,573,911 |
| Vishay Intertechnology, Inc. | 361,468 | 6,397,984 |
| Zebra Technologies Corp., Class A * | 25,328 | 2,611,063 |
| | | 99,533,756 |
| |
| Telecommunication Services 0.6% |
| ATN International, Inc. | 13,839 | 838,228 |
| Cincinnati Bell, Inc. * | 105,372 | 2,218,081 |
| Cogent Communications Holdings, Inc. | 6,280 | 292,648 |
| Consolidated Communications Holdings, Inc. | 73,191 | 1,350,374 |
| General Communication, Inc., Class A * | 49,811 | 2,148,348 |
| Iridium Communications, Inc. *(a) | 107,265 | 1,190,642 |
| United States Cellular Corp. * | 9,072 | 350,905 |
| Vonage Holdings Corp. * | 239,413 | 1,987,128 |
| Zayo Group Holdings, Inc. * | 41,006 | 1,401,175 |
| | | 11,777,529 |
| |
| Transportation 2.8% |
| Air Transport Services Group, Inc. * | 11,364 | 260,917 |
| Allegiant Travel Co. | 13,674 | 1,613,532 |
| AMERCO | 5,119 | 1,910,462 |
| ArcBest Corp. | 111,805 | 3,320,609 |
| Atlas Air Worldwide Holdings, Inc. * | 53,202 | 3,553,894 |
| Copa Holdings S.A., Class A | 44,244 | 5,489,353 |
| Echo Global Logistics, Inc. * | 46,045 | 699,884 |
| Forward Air Corp. | 35,119 | 1,825,134 |
| Genesee & Wyoming, Inc., Class A * | 39,080 | 2,679,325 |
| Hawaiian Holdings, Inc. * | 32,431 | 1,389,668 |
| Heartland Express, Inc. | 64,272 | 1,424,910 |
| Hub Group, Inc., Class A * | 81,552 | 3,135,674 |
| Knight Transportation, Inc. | 69,586 | 2,717,333 |
| Landstar System, Inc. | 56,820 | 5,304,147 |
| Macquarie Infrastructure Corp. | 36,844 | 2,744,141 |
| Marten Transport Ltd. | 67,690 | 1,160,884 |
| Matson, Inc. | 51,970 | 1,340,826 |
| Roadrunner Transportation Systems, Inc. * | 156,844 | 1,171,625 |
| Saia, Inc. * | 39,414 | 2,228,862 |
| SkyWest, Inc. | 121,866 | 4,228,750 |
| Spirit Airlines, Inc. * | 57,708 | 1,964,957 |
| Swift Transportation Co. * | 96,109 | 2,695,858 |
| Werner Enterprises, Inc. | 107,672 | 3,563,943 |
| XPO Logistics, Inc. * | 6,680 | 408,816 |
| YRC Worldwide, Inc. * | 28,304 | 378,991 |
| | | 57,212,495 |
| |
| Utilities 3.5% |
| ALLETE, Inc. | 44,902 | 3,472,272 |
| American States Water Co. | 33,584 | 1,655,691 |
| Aqua America, Inc. | 110,346 | 3,685,556 |
| Avangrid, Inc. | 33,523 | 1,636,593 |
| Avista Corp. | 83,941 | 4,314,567 |
| Black Hills Corp. | 51,760 | 3,642,869 |
| California Water Service Group | 39,169 | 1,466,879 |
| Dynegy, Inc. * | 240,674 | 2,267,149 |
| El Paso Electric Co. | 55,372 | 3,075,914 |
| Hawaiian Electric Industries, Inc. | 148,332 | 4,957,255 |
| Security | Number
of Shares | Value ($) |
| IDACORP, Inc. | 41,718 | 3,712,068 |
| MGE Energy, Inc. | 26,586 | 1,690,870 |
| New Jersey Resources Corp. | 96,471 | 4,210,959 |
| Northwest Natural Gas Co. | 32,709 | 2,168,607 |
| NorthWestern Corp. | 47,371 | 2,857,419 |
| ONE Gas, Inc. | 48,382 | 3,640,262 |
| Ormat Technologies, Inc. | 4,288 | 246,303 |
| Otter Tail Corp. | 47,625 | 1,990,725 |
| PNM Resources, Inc. | 126,025 | 5,343,460 |
| Portland General Electric Co. | 106,255 | 5,048,175 |
| South Jersey Industries, Inc. | 56,708 | 2,034,683 |
| Spire, Inc. | 33,783 | 2,584,399 |
| WGL Holdings, Inc. | 53,244 | 4,486,340 |
| | | 70,189,015 |
| Total Common Stock |
| (Cost $1,864,811,114) | | 2,021,658,372 |
|
| Other Investment Companies 2.5% of net assets |
| |
| Money Market Fund 0.1% |
| State Street Institutional U.S. Government Money Market Fund, Premier Class 0.93% (b) | 1,132,435 | 1,132,435 |
| |
| Securities Lending Collateral 2.4% |
| Wells Fargo Government Money Market Fund, Select Class 0.92% (b) | 49,095,431 | 49,095,431 |
| Total Other Investment Companies |
| (Cost $50,227,866) | | 50,227,866 |
| | Number of
Contracts | Notional
Amount
($) | Current Value/
Unrealized
Appreciation
($) |
| Futures Contracts | | | |
| Long | |
| Russell 2000 Index, e-mini expires 09/15/17 | 45 | 3,161,250 | 50,418 |
| * | Non-income producing security. |
| (a) | All or a portion of this security is on loan. Securities on loan were valued at $47,820,174. |
| (b) | The rate shown is the 7-day yield. |
| | |
| REIT — | Real Estate Investment Trust |
Schwab Fundamental Index ETFs | Semiannual Report
Schwab Fundamental International Large Company Index ETF
Portfolio Holdings as of August 31, 2017 (Unaudited)
This section shows all the securities in the fund's portfolio and their values as of the report date.
The fund files its complete schedule of portfolio holdings with the SEC for the first and third quarters of each fiscal year on Form N-Q. The fund's Form N-Q is available on the SEC's website at www.sec.gov and may be viewed and copied at the SEC's Public Reference Room in Washington, D.C. Call 1-800-SEC-0330 for information on the operation of the Public Reference Room. The fund also makes available its complete schedule of portfolio holdings on a daily basis on the fund's website at www.schwabfunds.com/schwabetfs_prospectus.
| Security | Number
of Shares | Value ($) |
| Common Stock 98.9% of net assets |
| |
| Australia 6.2% |
| A.C.N. 004 410 833 Ltd. *(b) | 11,076,407 | — |
| AGL Energy Ltd. | 110,781 | 2,107,903 |
| Amcor Ltd. | 173,280 | 2,214,110 |
| AMP Ltd. | 766,242 | 3,099,498 |
| APA Group | 102,916 | 723,222 |
| Aurizon Holdings Ltd. | 371,607 | 1,461,910 |
| Australia & New Zealand Banking Group Ltd. | 538,456 | 12,556,041 |
| Bendigo & Adelaide Bank Ltd. | 103,019 | 976,428 |
| BHP Billiton Ltd. | 1,087,235 | 23,610,873 |
| BlueScope Steel Ltd. | 134,243 | 1,157,381 |
| Boral Ltd. | 219,770 | 1,162,651 |
| Brambles Ltd. | 197,396 | 1,457,616 |
| Caltex Australia Ltd. | 121,784 | 3,225,238 |
| CIMIC Group Ltd. | 24,310 | 810,786 |
| Coca-Cola Amatil Ltd. | 132,350 | 845,036 |
| Commonwealth Bank of Australia | 247,674 | 14,890,346 |
| CSL Ltd. | 40,452 | 4,123,499 |
| Downer EDI Ltd. | 233,199 | 1,316,927 |
| Fortescue Metals Group Ltd. | 342,840 | 1,634,260 |
| Goodman Group | 107,527 | 707,013 |
| Iluka Resources Ltd. | 116,726 | 876,744 |
| Incitec Pivot Ltd. | 408,679 | 1,079,398 |
| Insurance Australia Group Ltd. | 426,813 | 2,169,956 |
| LendLease Group | 111,844 | 1,470,796 |
| Macquarie Group Ltd. | 34,860 | 2,399,951 |
| Medibank Pvt Ltd. | 396,441 | 955,889 |
| Metcash Ltd. | 800,433 | 1,726,828 |
| Mirvac Group | 412,286 | 758,651 |
| National Australia Bank Ltd. | 485,092 | 11,619,468 |
| Newcrest Mining Ltd. | 59,981 | 1,087,064 |
| Orica Ltd. | 127,079 | 2,049,115 |
| Origin Energy Ltd. * | 566,213 | 3,435,551 |
| QBE Insurance Group Ltd. | 309,682 | 2,564,317 |
| Rio Tinto Ltd. | 117,830 | 6,340,111 |
| Santos Ltd. * | 400,133 | 1,193,294 |
| Scentre Group | 482,399 | 1,476,892 |
| Sonic Healthcare Ltd. | 60,956 | 1,058,804 |
| Stockland | 415,047 | 1,458,331 |
| Suncorp Group Ltd. | 350,727 | 3,624,673 |
| Tabcorp Holdings Ltd. | 197,186 | 642,796 |
| Tatts Group Ltd. | 312,635 | 1,019,142 |
| Telstra Corp., Ltd. | 1,207,866 | 3,515,928 |
| Transurban Group | 96,843 | 934,022 |
| Wesfarmers Ltd. | 386,171 | 13,054,140 |
| Westfield Corp. | 143,916 | 848,112 |
| Westpac Banking Corp. | 578,762 | 14,354,335 |
| Woodside Petroleum Ltd. | 166,880 | 3,815,963 |
| Woolworths Ltd. | 513,077 | 10,580,619 |
| WorleyParsons Ltd. * | 156,461 | 1,662,900 |
| | | 175,854,528 |
| |
| Security | Number
of Shares | Value ($) |
| Austria 0.4% |
| Erste Group Bank AG * | 78,217 | 3,300,756 |
| OMV AG | 93,478 | 5,366,755 |
| Raiffeisen Bank International AG * | 54,672 | 1,791,387 |
| voestalpine AG | 43,060 | 2,231,547 |
| | | 12,690,445 |
| |
| Belgium 0.8% |
| Ageas | 55,441 | 2,571,296 |
| Anheuser-Busch InBev S.A. | 76,802 | 9,087,157 |
| Colruyt S.A. | 15,584 | 864,785 |
| Groupe Bruxelles Lambert S.A. | 15,973 | 1,623,860 |
| KBC Groep N.V. | 35,160 | 2,885,572 |
| Proximus | 45,383 | 1,597,902 |
| Solvay S.A. | 15,108 | 2,188,657 |
| UCB S.A. | 10,991 | 756,460 |
| Umicore S.A. | 28,026 | 2,090,836 |
| | | 23,666,525 |
| |
| Canada 6.8% |
| Agnico Eagle Mines Ltd. | 13,037 | 665,602 |
| Agrium, Inc. | 34,379 | 3,358,516 |
| Alimentation Couche-Tard, Inc., B Shares | 50,894 | 2,420,586 |
| ARC Resources Ltd. | 64,052 | 837,849 |
| Atco Ltd., Class I | 20,219 | 741,995 |
| Bank of Montreal | 90,734 | 6,485,084 |
| Barrick Gold Corp. | 134,247 | 2,408,148 |
| Baytex Energy Corp. *(a) | 207,936 | 524,090 |
| BCE, Inc. | 80,339 | 3,808,854 |
| BlackBerry Ltd. * | 174,333 | 1,608,800 |
| Brookfield Asset Management, Inc., Class A | 103,670 | 4,083,957 |
| Cameco Corp. | 87,844 | 877,214 |
| Canadian Imperial Bank of Commerce | 72,591 | 6,074,195 |
| Canadian National Railway Co. | 81,701 | 6,596,032 |
| Canadian Natural Resources Ltd. | 206,831 | 6,346,392 |
| Canadian Pacific Railway Ltd. | 14,308 | 2,217,497 |
| Canadian Tire Corp., Ltd., Class A | 14,513 | 1,710,884 |
| Celestica, Inc. * | 54,853 | 626,954 |
| Cenovus Energy, Inc. | 364,857 | 2,843,193 |
| CGI Group, Inc., Class A * | 20,095 | 1,018,254 |
| CI Financial Corp. | 49,568 | 1,080,909 |
| Crescent Point Energy Corp. | 166,874 | 1,140,666 |
| Dollarama, Inc. | 8,288 | 813,563 |
| Emera, Inc. | 21,485 | 821,871 |
| Empire Co., Ltd., A Shares | 100,574 | 1,683,787 |
| Enbridge, Inc. | 144,699 | 5,761,415 |
| Encana Corp. | 220,416 | 2,048,133 |
| Enerplus Corp. | 104,697 | 926,093 |
| Fairfax Financial Holdings Ltd. | 2,660 | 1,377,111 |
| Finning International, Inc. | 52,036 | 1,185,777 |
| First Quantum Minerals Ltd. | 124,157 | 1,490,379 |
| Fortis, Inc. | 50,206 | 1,829,641 |
| George Weston Ltd. | 15,498 | 1,341,574 |
| Gibson Energy, Inc. | 58,945 | 820,881 |
| Gildan Activewear, Inc. | 21,654 | 675,484 |
Schwab Fundamental Index ETFs | Semiannual Report
Schwab Fundamental International Large Company Index ETF
Portfolio Holdings as of August 31, 2017 (Unaudited) (continued)
| Security | Number
of Shares | Value ($) |
| Goldcorp, Inc. | 101,578 | 1,390,292 |
| Great-West Lifeco, Inc. | 42,265 | 1,166,059 |
| Husky Energy, Inc. * | 176,183 | 2,053,068 |
| Imperial Oil Ltd. | 66,642 | 1,959,261 |
| Intact Financial Corp. | 16,078 | 1,320,095 |
| Inter Pipeline Ltd. | 41,185 | 751,267 |
| Keyera Corp. | 24,267 | 701,445 |
| Loblaw Cos. Ltd. | 43,023 | 2,324,186 |
| Magna International, Inc. | 138,474 | 6,636,812 |
| Manulife Financial Corp. | 207,107 | 4,052,111 |
| Methanex Corp. | 17,297 | 880,336 |
| Metro, Inc. | 60,217 | 1,979,776 |
| National Bank of Canada | 53,528 | 2,454,069 |
| Obsidian Energy Ltd. * | 885,578 | 882,929 |
| Onex Corp. | 16,240 | 1,293,371 |
| Parkland Fuel Corp. | 26,998 | 581,843 |
| Pembina Pipeline Corp. | 42,556 | 1,366,205 |
| Potash Corp. of Saskatchewan, Inc. | 275,614 | 4,776,943 |
| Power Corp. of Canada | 109,390 | 2,662,878 |
| Power Financial Corp. | 51,823 | 1,393,383 |
| Rogers Communications, Inc., B Shares | 56,778 | 2,952,230 |
| Royal Bank of Canada | 176,268 | 13,030,124 |
| Saputo, Inc. | 32,894 | 1,106,130 |
| Shaw Communications, Inc., B Shares | 86,947 | 1,932,078 |
| SNC-Lavalin Group, Inc. | 27,871 | 1,212,652 |
| Sun Life Financial, Inc. | 74,054 | 2,832,215 |
| Suncor Energy, Inc. | 418,664 | 13,066,658 |
| Teck Resources Ltd., Class B | 148,234 | 3,674,666 |
| TELUS Corp. | 62,370 | 2,249,051 |
| The Bank of Nova Scotia | 163,588 | 10,136,911 |
| The Toronto-Dominion Bank | 207,843 | 11,117,010 |
| Thomson Reuters Corp. | 48,052 | 2,188,450 |
| TransAlta Corp. | 192,704 | 1,178,895 |
| TransCanada Corp. | 99,584 | 5,036,587 |
| Trisura Group Ltd. * | 43 | 840 |
| Valeant Pharmaceuticals International, Inc. * | 77,280 | 1,034,920 |
| Vermilion Energy, Inc. | 17,071 | 554,169 |
| West Fraser Timber Co., Ltd. | 18,320 | 946,722 |
| WestJet Airlines Ltd. | 26,898 | 571,321 |
| | | 193,699,338 |
| |
| Denmark 1.0% |
| AP Moller - Maersk A/S, A Shares | 2,104 | 4,113,191 |
| AP Moller - Maersk A/S, B Shares | 1,840 | 3,788,266 |
| Carlsberg A/S, B Shares | 19,667 | 2,254,052 |
| Coloplast A/S, B Shares | 8,680 | 709,696 |
| Danske Bank A/S | 61,919 | 2,403,142 |
| DSV A/S | 17,157 | 1,214,932 |
| ISS A/S | 29,985 | 1,165,187 |
| Novo Nordisk A/S, B Shares | 139,242 | 6,632,744 |
| Novozymes A/S, B Shares | 17,052 | 866,235 |
| Pandora A/S | 7,184 | 762,502 |
| TDC A/S | 335,950 | 1,998,747 |
| Vestas Wind Systems A/S | 13,276 | 1,207,497 |
| | | 27,116,191 |
| |
| Finland 0.9% |
| Elisa Oyj | 19,165 | 836,219 |
| Fortum Oyj | 151,334 | 2,713,207 |
| Kesko Oyj, B Shares | 39,258 | 2,112,924 |
| Kone Oyj, B Shares | 36,072 | 1,954,743 |
| Metso Oyj | 25,028 | 828,401 |
| Neste Oyj | 32,957 | 1,451,322 |
| Nokia Oyj | 921,903 | 5,704,940 |
| Nokian Renkaat Oyj | 20,903 | 882,479 |
| Security | Number
of Shares | Value ($) |
| Orion Oyj, Class B | 14,058 | 664,865 |
| Sampo Oyj, A Shares | 52,485 | 2,766,789 |
| Stora Enso Oyj, R Shares | 168,288 | 2,208,856 |
| UPM-Kymmene Oyj | 130,193 | 3,383,630 |
| Wartsila Oyj Abp | 21,981 | 1,514,419 |
| | | 27,022,794 |
| |
| France 10.1% |
| Accor S.A. | 36,063 | 1,667,848 |
| Air France-KLM * | 166,996 | 2,547,287 |
| Air Liquide S.A. | 54,177 | 6,605,349 |
| Airbus SE | 58,126 | 4,879,573 |
| Alstom S.A. | 49,089 | 1,743,561 |
| Arkema S.A. | 17,431 | 1,891,660 |
| Atos SE | 11,196 | 1,725,095 |
| AXA S.A. | 354,665 | 10,277,988 |
| BNP Paribas S.A. | 196,842 | 14,956,560 |
| Bollore S.A. | 178,391 | 827,571 |
| Bouygues S.A. | 84,938 | 3,846,938 |
| Bureau Veritas S.A. | 33,319 | 791,269 |
| Capgemini SE | 22,288 | 2,467,777 |
| Carrefour S.A. | 251,829 | 5,071,825 |
| Casino Guichard Perrachon S.A. | 43,187 | 2,452,494 |
| CGG S.A. *(a) | 92,993 | 562,747 |
| Christian Dior SE | 8,329 | 2,568,173 |
| CNP Assurances | 37,810 | 876,570 |
| Compagnie de Saint-Gobain | 153,125 | 8,387,964 |
| Credit Agricole S.A. | 221,765 | 3,904,750 |
| Danone S.A. | 84,601 | 6,653,505 |
| Eiffage S.A. | 16,067 | 1,658,058 |
| Electricite de France S.A. | 281,583 | 2,979,488 |
| Engie S.A. | 1,052,297 | 17,540,077 |
| Essilor International S.A. | 14,167 | 1,786,215 |
| Eurazeo S.A. | 11,983 | 989,995 |
| Eutelsat Communications S.A. | 36,033 | 1,045,929 |
| Faurecia | 22,078 | 1,282,372 |
| Kering | 8,454 | 3,169,066 |
| Klepierre S.A. | 16,030 | 645,115 |
| L'Oreal S.A. | 22,812 | 4,809,940 |
| Legrand S.A. | 31,270 | 2,188,975 |
| LVMH Moet Hennessy Louis Vuitton SE | 25,773 | 6,748,792 |
| Natixis S.A. | 154,806 | 1,160,980 |
| Orange S.A. | 816,436 | 13,856,176 |
| Pernod-Ricard S.A. | 23,383 | 3,191,444 |
| Peugeot S.A. | 109,470 | 2,308,189 |
| Publicis Groupe S.A. | 23,390 | 1,576,734 |
| Rallye S.A. | 61,944 | 1,133,399 |
| Renault S.A. | 52,745 | 4,662,377 |
| Rexel S.A. | 145,297 | 2,167,931 |
| Safran S.A. | 30,056 | 2,915,501 |
| Sanofi | 205,513 | 19,952,339 |
| Schneider Electric SE * | 105,151 | 8,467,196 |
| SCOR SE | 33,638 | 1,407,725 |
| Societe Generale S.A. | 240,979 | 13,474,086 |
| Sodexo S.A. | 12,955 | 1,509,877 |
| Suez | 114,578 | 2,170,693 |
| Teleperformance | 6,988 | 960,408 |
| Thales S.A. | 10,585 | 1,170,359 |
| Total S.A. | 903,617 | 46,673,389 |
| Unibail-Rodamco SE | 9,018 | 2,289,575 |
| Valeo S.A. | 33,307 | 2,224,654 |
| Vallourec S.A. *(a) | 216,318 | 1,095,588 |
| Veolia Environnement S.A. | 199,926 | 4,684,908 |
| Vinci S.A. | 99,349 | 9,136,271 |
| Vivendi S.A. | 396,269 | 9,080,915 |
Schwab Fundamental Index ETFs | Semiannual Report
Schwab Fundamental International Large Company Index ETF
Portfolio Holdings as of August 31, 2017 (Unaudited) (continued)
| Security | Number
of Shares | Value ($) |
| Wendel S.A. | 6,157 | 974,665 |
| Zodiac Aerospace | 29,166 | 842,787 |
| | | 288,638,692 |
| |
| Germany 9.4% |
| adidas AG | 19,900 | 4,460,923 |
| Allianz SE | 85,642 | 18,302,096 |
| Aurubis AG | 28,958 | 2,584,521 |
| BASF SE | 234,683 | 22,703,410 |
| Bayer AG | 113,584 | 14,516,796 |
| Bayerische Motoren Werke AG | 116,634 | 10,815,956 |
| Beiersdorf AG | 9,068 | 966,835 |
| Bilfinger SE (a) | 22,914 | 927,333 |
| Brenntag AG | 33,327 | 1,763,793 |
| CECONOMY AG | 97,919 | 1,071,259 |
| Commerzbank AG * | 395,121 | 4,904,286 |
| Continental AG | 19,852 | 4,473,765 |
| Covestro AG | 9,062 | 711,179 |
| Daimler AG | 276,626 | 20,137,354 |
| Deutsche Bank AG | 518,420 | 8,302,225 |
| Deutsche Boerse AG | 17,451 | 1,862,917 |
| Deutsche Lufthansa AG | 139,099 | 3,484,446 |
| Deutsche Post AG | 216,705 | 8,977,482 |
| Deutsche Telekom AG | 886,999 | 15,987,018 |
| E.ON SE | 2,026,200 | 22,872,963 |
| Evonik Industries AG | 35,952 | 1,163,900 |
| Freenet AG | 34,248 | 1,142,531 |
| Fresenius Medical Care AG & Co. KGaA | 24,304 | 2,268,259 |
| Fresenius SE & Co. KGaA | 39,030 | 3,298,771 |
| GEA Group AG | 22,142 | 974,011 |
| Hannover Rueck SE | 9,253 | 1,119,890 |
| HeidelbergCement AG | 30,311 | 2,906,362 |
| Henkel AG & Co. KGaA | 11,331 | 1,370,043 |
| HOCHTIEF AG | 4,381 | 771,129 |
| HUGO BOSS AG | 16,414 | 1,387,683 |
| Infineon Technologies AG | 97,072 | 2,235,469 |
| Innogy SE | 10,640 | 468,362 |
| K+S AG (a) | 81,593 | 1,942,058 |
| KION Group AG | 8,670 | 789,780 |
| Kloeckner & Co. SE | 55,203 | 613,123 |
| LANXESS AG | 23,438 | 1,745,769 |
| Leoni AG | 17,312 | 1,037,138 |
| Linde AG | 31,327 | 5,998,252 |
| MAN SE | 7,520 | 843,181 |
| Merck KGaA | 10,363 | 1,136,695 |
| METRO AG * | 104,949 | 2,048,786 |
| MTU Aero Engines AG | 6,395 | 894,114 |
| Muenchener Rueckversicherungs-Gesellschaft AG | 33,056 | 6,814,665 |
| OSRAM Licht AG | 17,196 | 1,410,249 |
| ProSiebenSat.1 Media SE | 36,125 | 1,210,303 |
| Rheinmetall AG | 8,535 | 871,243 |
| RWE AG * | 513,503 | 12,793,100 |
| Salzgitter AG | 24,180 | 1,085,221 |
| SAP SE | 68,879 | 7,214,527 |
| Siemens AG | 134,195 | 17,517,971 |
| Suedzucker AG | 31,909 | 677,548 |
| Symrise AG | 8,907 | 650,197 |
| Telefonica Deutschland Holding AG | 172,880 | 934,371 |
| ThyssenKrupp AG | 78,114 | 2,339,388 |
| Uniper SE | 213,792 | 5,316,116 |
| Volkswagen AG | 13,650 | 2,104,022 |
| Vonovia SE | 23,153 | 977,332 |
| | | 267,898,116 |
| |
| Security | Number
of Shares | Value ($) |
| Hong Kong 1.4% |
| AIA Group Ltd. | 572,064 | 4,389,275 |
| BOC Hong Kong Holdings Ltd. | 378,552 | 1,927,476 |
| Cheung Kong Property Holdings Ltd. | 115,584 | 1,014,588 |
| China Mengniu Dairy Co., Ltd. * | 349,705 | 816,795 |
| CK Hutchison Holdings Ltd. | 105,075 | 1,374,784 |
| CLP Holdings Ltd. | 221,375 | 2,337,796 |
| Esprit Holdings Ltd. * | 1,043,617 | 604,052 |
| Galaxy Entertainment Group Ltd. | 197,564 | 1,239,437 |
| Hang Seng Bank Ltd. | 68,291 | 1,570,620 |
| Hong Kong & China Gas Co., Ltd. | 503,680 | 952,471 |
| Hong Kong Exchanges & Clearing Ltd. | 30,309 | 827,195 |
| Hongkong Land Holdings Ltd. | 97,622 | 723,379 |
| I-CABLE Communications Ltd. * | 119,466 | 4,427 |
| Jardine Matheson Holdings Ltd. | 37,266 | 2,448,749 |
| Jardine Strategic Holdings Ltd. | 33,446 | 1,466,607 |
| Li & Fung Ltd. | 3,332,336 | 1,502,999 |
| Link REIT | 103,750 | 856,359 |
| MTR Corp. Ltd. | 137,190 | 801,953 |
| New World Development Co., Ltd. | 969,783 | 1,325,847 |
| Noble Group Ltd. * | 4,017,593 | 1,183,385 |
| PCCW Ltd. | 860,266 | 479,242 |
| Sands China Ltd. | 277,079 | 1,240,872 |
| SJM Holdings Ltd. | 1,066,342 | 930,577 |
| Sun Hung Kai Properties Ltd. | 182,187 | 3,040,155 |
| Swire Pacific Ltd., Class A | 168,856 | 1,718,452 |
| Swire Pacific Ltd., Class B | 230,171 | 415,260 |
| The Wharf Holdings Ltd. | 146,632 | 1,396,727 |
| Want Want China Holdings Ltd. | 1,159,360 | 767,332 |
| WH Group Ltd. | 524,188 | 547,868 |
| Wheelock & Co., Ltd. | 106,508 | 796,791 |
| Yue Yuen Industrial Holdings Ltd. | 163,706 | 709,087 |
| | | 39,410,557 |
| |
| Ireland 0.6% |
| AerCap Holdings N.V. * | 13,662 | 687,199 |
| Bank of Ireland Group plc * | 119,784 | 996,878 |
| CRH plc | 129,354 | 4,511,397 |
| Experian plc | 94,827 | 1,898,823 |
| Kerry Group plc, A Shares | 11,321 | 1,052,939 |
| Seagate Technology plc | 116,895 | 3,685,699 |
| Shire plc | 40,608 | 2,005,896 |
| Smurfit Kappa Group plc | 55,280 | 1,683,478 |
| | | 16,522,309 |
| |
| Israel 0.3% |
| Bank Hapoalim B.M. | 119,434 | 803,519 |
| Bank Leumi Le-Israel | 249,287 | 1,305,288 |
| Bezeq The Israeli Telecommunication Corp., Ltd. | 639,424 | 941,313 |
| Check Point Software Technologies Ltd. * | 9,511 | 1,063,995 |
| Israel Chemicals Ltd. | 248,908 | 1,072,900 |
| Teva Pharmaceutical Industries Ltd. | 192,580 | 3,118,522 |
| | | 8,305,537 |
| |
| Italy 3.7% |
| Assicurazioni Generali S.p.A. | 280,784 | 5,020,712 |
| Atlantia S.p.A. | 66,008 | 2,118,876 |
| Banca Monte dei Paschi di Siena S.p.A. *(b) | 36,136 | 330,413 |
| BPER Banca | 189,503 | 1,066,120 |
| Enel S.p.A. | 3,344,182 | 20,217,432 |
| Eni S.p.A. | 1,576,558 | 24,685,440 |
| EXOR N.V. | 81,596 | 5,228,809 |
Schwab Fundamental Index ETFs | Semiannual Report
Schwab Fundamental International Large Company Index ETF
Portfolio Holdings as of August 31, 2017 (Unaudited) (continued)
| Security | Number
of Shares | Value ($) |
| GEDI Gruppo Editoriale S.p.A. * | 22,089 | 18,869 |
| Intesa Sanpaolo S.p.A. | 3,025,141 | 10,199,925 |
| Luxottica Group S.p.A. | 17,618 | 1,012,741 |
| Mediaset S.p.A. * | 297,005 | 1,096,051 |
| Mediobanca S.p.A. | 73,609 | 754,368 |
| Poste Italiane S.p.A. | 119,755 | 869,209 |
| Prysmian S.p.A. | 28,063 | 881,479 |
| Saipem S.p.A. * | 329,727 | 1,222,294 |
| Snam S.p.A. | 477,604 | 2,322,397 |
| Telecom Italia S.p.A. * | 6,330,476 | 6,054,908 |
| Telecom Italia S.p.A. - RSP | 3,693,399 | 2,865,180 |
| Terna Rete Elettrica Nazionale S.p.A. | 229,720 | 1,354,645 |
| UniCredit S.p.A. * | 749,050 | 15,219,417 |
| Unione di Banche Italiane S.p.A. | 591,082 | 2,725,214 |
| | | 105,264,499 |
| |
| Japan 21.6% |
| Aeon Co., Ltd. | 234,624 | 3,457,751 |
| Air Water, Inc. | 38,832 | 715,531 |
| Aisin Seiki Co., Ltd. | 55,286 | 2,777,863 |
| Ajinomoto Co., Inc. | 87,576 | 1,727,887 |
| Alfresa Holdings Corp. | 74,995 | 1,409,819 |
| Alps Electric Co., Ltd. | 29,137 | 799,507 |
| ANA Holdings, Inc. | 294,740 | 1,092,086 |
| Arcs Co., Ltd. | 25,150 | 563,053 |
| Asahi Glass Co., Ltd. | 79,278 | 3,090,156 |
| Asahi Group Holdings Ltd. | 64,760 | 2,817,878 |
| Asahi Kasei Corp. | 333,475 | 3,990,429 |
| Astellas Pharma, Inc. | 266,285 | 3,347,313 |
| Bandai Namco Holdings, Inc. | 41,314 | 1,383,264 |
| Bridgestone Corp. | 170,832 | 7,324,698 |
| Brother Industries Ltd. | 55,009 | 1,302,503 |
| Canon, Inc. | 301,849 | 10,569,926 |
| Central Japan Railway Co. | 29,118 | 4,928,842 |
| Chubu Electric Power Co., Inc. | 235,199 | 3,070,879 |
| Chugai Pharmaceutical Co., Ltd. | 18,088 | 734,630 |
| Coca-Cola Bottlers Japan, Inc. | 35,344 | 1,210,675 |
| Dai Nippon Printing Co., Ltd. | 230,047 | 2,713,075 |
| Dai-ichi Life Holdings, Inc. | 139,708 | 2,246,803 |
| Daicel Corp. | 60,077 | 764,745 |
| Daiichi Sankyo Co., Ltd. (b) | 107,557 | 2,539,893 |
| Daikin Industries Ltd. | 24,801 | 2,477,621 |
| Daito Trust Construction Co., Ltd. | 11,214 | 1,985,324 |
| Daiwa House Industry Co., Ltd. | 97,664 | 3,413,714 |
| Daiwa Securities Group, Inc. | 174,230 | 952,677 |
| Denka Co., Ltd. | 148,598 | 943,758 |
| Denso Corp. | 107,840 | 5,228,369 |
| Dentsu, Inc. | 29,922 | 1,250,601 |
| DIC Corp. | 28,280 | 998,254 |
| Don Quijote Holdings Co., Ltd. | 20,168 | 765,050 |
| Dowa Holdings Co., Ltd. | 77,794 | 586,671 |
| East Japan Railway Co. | 60,878 | 5,578,363 |
| Ebara Corp. | 24,135 | 746,681 |
| Eisai Co., Ltd. | 35,358 | 1,829,261 |
| Electric Power Development Co., Ltd. | 53,684 | 1,468,189 |
| FANUC Corp. | 17,436 | 3,380,740 |
| Fast Retailing Co., Ltd. | 5,003 | 1,430,533 |
| Fuji Electric Co., Ltd. | 143,312 | 789,088 |
| Fuji Heavy Industries Ltd. | 79,045 | 2,769,376 |
| FUJIFILM Holdings Corp. | 108,096 | 4,244,875 |
| Fujitsu Ltd. | 683,438 | 5,061,515 |
| Furukawa Electric Co., Ltd. | 26,142 | 1,415,649 |
| Hakuhodo DY Holdings, Inc. | 78,672 | 1,070,071 |
| Hankyu Hanshin Holdings, Inc. | 37,864 | 1,441,488 |
| Hanwa Co., Ltd. | 111,497 | 748,649 |
| Haseko Corp. | 63,408 | 784,678 |
| Hino Motors Ltd. | 85,086 | 976,409 |
| Security | Number
of Shares | Value ($) |
| Hitachi Construction Machinery Co., Ltd. | 31,318 | 883,540 |
| Hitachi Ltd. | 2,111,117 | 14,520,403 |
| Hitachi Metals Ltd. | 46,670 | 622,917 |
| Hokuriku Electric Power Co. | 74,255 | 706,387 |
| Honda Motor Co., Ltd. | 517,423 | 14,484,647 |
| Hoya Corp. | 50,767 | 2,903,673 |
| Ibiden Co., Ltd. | 46,626 | 771,451 |
| Idemitsu Kosan Co., Ltd. | 75,432 | 1,840,908 |
| IHI Corp. * | 369,694 | 1,222,684 |
| Iida Group Holdings Co., Ltd. | 54,881 | 931,970 |
| Inpex Corp. | 402,986 | 3,848,249 |
| Isetan Mitsukoshi Holdings Ltd. | 130,551 | 1,342,756 |
| Isuzu Motors Ltd. | 148,533 | 1,940,673 |
| ITOCHU Corp. | 357,790 | 5,838,550 |
| J Front Retailing Co., Ltd. | 74,777 | 1,042,910 |
| Japan Post Bank Co., Ltd. | 83,404 | 1,060,927 |
| Japan Post Holdings Co., Ltd. | 80,976 | 1,005,026 |
| Japan Tobacco, Inc. | 141,253 | 4,830,786 |
| JFE Holdings, Inc. | 256,511 | 5,062,165 |
| JGC Corp. | 71,458 | 1,147,250 |
| JSR Corp. | 50,015 | 973,398 |
| JTEKT Corp. | 58,054 | 775,917 |
| JXTG Holdings, Inc. | 2,204,547 | 10,664,191 |
| K's Holdings Corp. | 39,139 | 874,102 |
| Kajima Corp. | 140,338 | 1,286,580 |
| Kaneka Corp. | 79,640 | 619,406 |
| Kao Corp. | 59,071 | 3,682,947 |
| Kawasaki Heavy Industries Ltd. | 385,534 | 1,183,995 |
| Kawasaki Kisen Kaisha Ltd. *(a) | 522,864 | 1,415,714 |
| KDDI Corp. | 321,043 | 8,654,685 |
| Keio Corp. | 74,542 | 619,716 |
| Kewpie Corp. | 24,182 | 578,953 |
| Keyence Corp. | 2,542 | 1,322,505 |
| Kikkoman Corp. | 19,406 | 607,429 |
| Kintetsu Group Holdings Co., Ltd. | 254,284 | 958,821 |
| Kirin Holdings Co., Ltd. | 207,539 | 4,707,624 |
| Kobe Steel Ltd. * | 215,981 | 2,598,209 |
| Koito Manufacturing Co., Ltd. | 12,668 | 788,441 |
| Komatsu Ltd. | 183,663 | 4,964,541 |
| Konica Minolta, Inc. | 197,194 | 1,573,109 |
| Kubota Corp. | 145,598 | 2,518,795 |
| Kuraray Co., Ltd. | 76,067 | 1,443,103 |
| Kyocera Corp. | 63,399 | 3,801,866 |
| Kyowa Hakko Kirin Co., Ltd. | 35,843 | 628,865 |
| Kyushu Electric Power Co., Inc. | 88,167 | 1,034,997 |
| Kyushu Railway Co. | 5,270 | 164,717 |
| Lawson, Inc. | 10,037 | 673,936 |
| LIXIL Group Corp. | 62,786 | 1,645,237 |
| Makita Corp. | 26,112 | 1,047,469 |
| Marubeni Corp. | 651,425 | 4,234,322 |
| Matsumotokiyoshi Holdings Co., Ltd. | 11,314 | 768,933 |
| Mazda Motor Corp. | 170,556 | 2,508,906 |
| Medipal Holdings Corp. | 83,730 | 1,475,127 |
| MEIJI Holdings Co., Ltd. | 16,626 | 1,323,312 |
| MINEBEA MITSUMI, Inc. | 68,132 | 1,118,613 |
| Mitsubishi Chemical Holdings Corp. | 460,668 | 4,281,877 |
| Mitsubishi Corp. | 351,267 | 8,117,823 |
| Mitsubishi Electric Corp. | 407,136 | 6,018,629 |
| Mitsubishi Estate Co., Ltd. | 97,024 | 1,669,666 |
| Mitsubishi Gas Chemical Co., Inc. | 33,708 | 835,809 |
| Mitsubishi Heavy Industries Ltd. | 972,697 | 3,719,863 |
| Mitsubishi Materials Corp. | 46,544 | 1,668,327 |
| Mitsubishi Motors Corp. | 373,065 | 2,752,397 |
| Mitsubishi Tanabe Pharma Corp. | 32,159 | 788,927 |
| Mitsubishi UFJ Financial Group, Inc. | 2,088,134 | 12,789,489 |
| Mitsui & Co., Ltd. | 537,526 | 8,031,633 |
| Mitsui Chemicals, Inc. | 276,965 | 1,655,851 |
| Mitsui Fudosan Co., Ltd. | 108,421 | 2,342,587 |
Schwab Fundamental Index ETFs | Semiannual Report
Schwab Fundamental International Large Company Index ETF
Portfolio Holdings as of August 31, 2017 (Unaudited) (continued)
| Security | Number
of Shares | Value ($) |
| Mitsui Mining & Smelting Co., Ltd. | 240,127 | 1,274,161 |
| Mitsui OSK Lines Ltd. | 583,995 | 1,873,071 |
| Mizuho Financial Group, Inc. | 4,350,028 | 7,474,017 |
| MS&AD Insurance Group Holdings, Inc. | 69,391 | 2,288,024 |
| Murata Manufacturing Co., Ltd. | 16,157 | 2,472,141 |
| Nagase & Co., Ltd. | 56,716 | 947,671 |
| Nagoya Railroad Co., Ltd. | 162,900 | 728,210 |
| NEC Corp. | 1,236,941 | 3,270,487 |
| NGK Insulators Ltd. | 27,121 | 505,901 |
| NGK Spark Plug Co., Ltd. | 32,045 | 609,979 |
| NH Foods Ltd. | 53,317 | 1,564,728 |
| NHK Spring Co., Ltd. | 101,782 | 1,016,340 |
| Nidec Corp. | 14,106 | 1,596,954 |
| Nikon Corp. | 104,614 | 1,723,289 |
| Nintendo Co., Ltd. | 6,238 | 2,076,688 |
| Nippon Electric Glass Co., Ltd. | 38,258 | 1,453,011 |
| Nippon Express Co., Ltd. | 303,084 | 2,090,140 |
| Nippon Paper Industries Co., Ltd. | 52,840 | 1,011,094 |
| Nippon Steel & Sumitomo Metal Corp. | 279,440 | 6,663,550 |
| Nippon Telegraph & Telephone Corp. | 302,675 | 15,037,497 |
| Nippon Yusen K.K. * | 1,154,019 | 2,285,809 |
| Nissan Motor Co., Ltd. | 781,823 | 7,764,243 |
| Nisshin Seifun Group, Inc. | 46,231 | 802,721 |
| Nitori Holdings Co., Ltd. | 7,044 | 1,086,745 |
| Nitto Denko Corp. | 25,939 | 2,285,630 |
| NOK Corp. | 25,550 | 574,329 |
| Nomura Holdings, Inc. | 468,804 | 2,608,963 |
| Nomura Real Estate Holdings, Inc. | 33,916 | 699,830 |
| NSK Ltd. | 86,764 | 1,028,775 |
| NTT Data Corp. | 126,608 | 1,366,621 |
| NTT DOCOMO, Inc. | 286,310 | 6,642,673 |
| Obayashi Corp. | 103,480 | 1,219,458 |
| Odakyu Electric Railway Co., Ltd. | 32,940 | 637,490 |
| Oji Holdings Corp. | 308,742 | 1,618,609 |
| Olympus Corp. | 24,423 | 842,134 |
| Omron Corp. | 37,218 | 1,866,649 |
| Oriental Land Co., Ltd. | 14,000 | 1,050,572 |
| ORIX Corp. | 148,604 | 2,375,693 |
| Osaka Gas Co., Ltd. | 622,924 | 2,434,305 |
| Otsuka Holdings Co., Ltd. | 60,999 | 2,454,703 |
| Panasonic Corp. | 712,452 | 9,486,629 |
| Recruit Holdings Co., Ltd. | 113,805 | 2,265,553 |
| Resona Holdings, Inc. | 379,887 | 1,893,567 |
| Ricoh Co., Ltd. | 341,056 | 3,411,800 |
| Rohm Co., Ltd. | 16,144 | 1,255,612 |
| Secom Co., Ltd. | 27,257 | 2,021,367 |
| Sega Sammy Holdings, Inc. | 52,201 | 749,387 |
| Seibu Holdings, Inc. | 33,708 | 579,155 |
| Seiko Epson Corp. | 59,796 | 1,532,660 |
| Seino Holdings Co., Ltd. | 73,712 | 1,001,267 |
| Sekisui Chemical Co., Ltd. | 94,844 | 1,766,584 |
| Sekisui House Ltd. | 160,817 | 2,782,079 |
| Seven & i Holdings Co., Ltd. | 180,236 | 7,148,193 |
| Shimamura Co., Ltd. | 8,199 | 999,733 |
| Shimano, Inc. | 5,056 | 682,647 |
| Shimizu Corp. | 110,874 | 1,144,402 |
| Shin-Etsu Chemical Co., Ltd. | 45,014 | 3,977,068 |
| Shionogi & Co., Ltd. | 18,356 | 966,500 |
| Shiseido Co., Ltd. | 48,522 | 2,009,920 |
| Showa Denko K.K. | 65,648 | 1,742,302 |
| Showa Shell Sekiyu K.K. | 117,912 | 1,290,968 |
| SMC Corp. | 4,652 | 1,593,921 |
| SoftBank Group Corp. | 118,912 | 9,639,586 |
| Sojitz Corp. | 676,325 | 1,812,792 |
| Sompo Holdings, Inc. | 52,192 | 1,960,875 |
| Sony Corp. | 176,859 | 6,969,267 |
| Stanley Electric Co., Ltd. | 23,179 | 768,702 |
| Sumitomo Chemical Co., Ltd. | 446,112 | 2,671,159 |
| Security | Number
of Shares | Value ($) |
| Sumitomo Corp. | 318,739 | 4,507,698 |
| Sumitomo Electric Industries Ltd. | 244,374 | 3,823,478 |
| Sumitomo Forestry Co., Ltd. | 46,163 | 718,911 |
| Sumitomo Heavy Industries Ltd. | 168,781 | 1,257,500 |
| Sumitomo Metal Mining Co., Ltd. | 131,777 | 2,268,921 |
| Sumitomo Mitsui Financial Group, Inc. | 262,988 | 9,830,389 |
| Sumitomo Mitsui Trust Holdings, Inc. | 55,453 | 1,917,628 |
| Sumitomo Realty & Development Co., Ltd. | 55,143 | 1,666,916 |
| Sumitomo Rubber Industries Ltd. | 57,898 | 959,005 |
| Suntory Beverage & Food Ltd. | 17,122 | 790,294 |
| Suzuken Co., Ltd. | 41,093 | 1,495,343 |
| Suzuki Motor Corp. | 80,559 | 4,044,785 |
| T&D Holdings, Inc. | 93,795 | 1,285,569 |
| Taiheiyo Cement Corp. | 335,548 | 1,292,680 |
| Taisei Corp. | 152,686 | 1,530,190 |
| Takashimaya Co., Ltd. | 101,576 | 931,221 |
| Takeda Pharmaceutical Co., Ltd. | 124,682 | 6,884,359 |
| TDK Corp. | 26,063 | 1,745,269 |
| Teijin Ltd. | 57,818 | 1,172,540 |
| Terumo Corp. | 26,068 | 1,006,624 |
| The Chugoku Electric Power Co., Inc. | 117,012 | 1,348,094 |
| The Kansai Electric Power Co., Inc. | 215,748 | 3,018,825 |
| The Yokohama Rubber Co., Ltd. | 38,340 | 708,903 |
| Tobu Railway Co., Ltd. | 178,331 | 985,147 |
| Toho Gas Co., Ltd. | 79,626 | 524,522 |
| Tohoku Electric Power Co., Inc. | 145,452 | 1,987,641 |
| Tokio Marine Holdings, Inc. | 81,653 | 3,256,921 |
| Tokyo Electric Power Co. Holdings, Inc. * | 1,215,493 | 4,914,541 |
| Tokyo Electron Ltd. | 16,367 | 2,299,053 |
| Tokyo Gas Co., Ltd. | 753,624 | 3,993,399 |
| Tokyu Corp. | 76,491 | 1,111,990 |
| Tokyu Fudosan Holdings Corp. | 109,640 | 653,497 |
| Toppan Printing Co., Ltd. | 176,663 | 1,767,272 |
| Toray Industries, Inc. | 275,562 | 2,621,419 |
| Toshiba Corp. * | 1,648,908 | 4,584,462 |
| Tosoh Corp. | 113,978 | 1,335,922 |
| TOTO Ltd. | 18,421 | 700,453 |
| Toyo Seikan Group Holdings Ltd. | 65,394 | 1,077,224 |
| Toyo Suisan Kaisha Ltd. | 19,487 | 719,741 |
| Toyoda Gosei Co., Ltd. | 24,476 | 569,980 |
| Toyota Industries Corp. | 33,990 | 1,809,753 |
| Toyota Motor Corp. | 515,071 | 28,935,889 |
| Toyota Tsusho Corp. | 109,434 | 3,365,747 |
| Ube Industries Ltd. | 457,958 | 1,306,549 |
| Unicharm Corp. | 34,203 | 803,954 |
| West Japan Railway Co. | 37,101 | 2,693,750 |
| Yamada Denki Co., Ltd. | 335,972 | 1,816,312 |
| Yamaha Corp. | 19,206 | 668,353 |
| Yamaha Motor Co., Ltd. | 57,733 | 1,631,380 |
| Yamato Holdings Co., Ltd. | 80,644 | 1,717,514 |
| Yamazaki Baking Co., Ltd. | 33,525 | 634,800 |
| Yokogawa Electric Corp. | 36,064 | 561,309 |
| | | 615,536,277 |
| |
| Luxembourg 0.5% |
| ArcelorMittal * | 350,766 | 9,358,053 |
| Millicom International Cellular S.A. | 25,450 | 1,585,398 |
| RTL Group S.A. | 10,015 | 759,060 |
| SES S.A. | 52,434 | 1,197,216 |
| Tenaris S.A. | 100,014 | 1,335,321 |
| | | 14,235,048 |
| |
| Netherlands 4.8% |
| ABN AMRO Group N.V. | 24,896 | 696,757 |
| Aegon N.V. | 704,534 | 4,017,226 |
| Akzo Nobel N.V. | 43,345 | 3,957,723 |
Schwab Fundamental Index ETFs | Semiannual Report
Schwab Fundamental International Large Company Index ETF
Portfolio Holdings as of August 31, 2017 (Unaudited) (continued)
| Security | Number
of Shares | Value ($) |
| ASML Holding N.V. | 16,990 | 2,636,022 |
| Boskalis Westminster | 24,312 | 793,429 |
| Gemalto N.V. | 10,208 | 550,927 |
| Heineken Holding N.V. | 21,503 | 2,120,353 |
| Heineken N.V. | 26,461 | 2,772,523 |
| ING Groep N.V. | 470,971 | 8,343,064 |
| Koninklijke Ahold Delhaize N.V. | 489,941 | 8,795,608 |
| Koninklijke DSM N.V. | 38,170 | 2,892,086 |
| Koninklijke KPN N.V. | 1,106,860 | 3,909,673 |
| Koninklijke Philips N.V. | 179,631 | 6,787,039 |
| NN Group N.V. | 37,360 | 1,480,650 |
| Randstad Holding N.V. | 31,048 | 1,812,611 |
| RELX N.V. | 68,120 | 1,428,220 |
| Royal Dutch Shell plc, A Shares | 1,006,182 | 27,687,189 |
| Royal Dutch Shell plc, B Shares | 1,544,668 | 43,002,209 |
| Unilever N.V. CVA | 191,404 | 11,380,281 |
| Wolters Kluwer N.V. | 33,448 | 1,459,225 |
| X5 Retail Group N.V. GDR * | 17,896 | 730,157 |
| | | 137,252,972 |
| |
| New Zealand 0.1% |
| Contact Energy Ltd. | 168,972 | 675,279 |
| Fletcher Building Ltd. | 176,356 | 1,030,659 |
| Spark New Zealand Ltd. | 508,212 | 1,424,987 |
| | | 3,130,925 |
| |
| Norway 1.0% |
| DNB A.S.A. | 169,791 | 3,306,405 |
| Marine Harvest A.S.A. * | 66,088 | 1,309,043 |
| Norsk Hydro A.S.A. | 365,744 | 2,632,655 |
| Orkla A.S.A. | 142,610 | 1,460,039 |
| Statoil A.S.A. | 633,750 | 11,974,685 |
| Telenor A.S.A. | 196,015 | 3,958,169 |
| Yara International A.S.A. | 68,663 | 2,800,410 |
| | | 27,441,406 |
| |
| Portugal 0.2% |
| EDP - Energias de Portugal S.A. | 964,241 | 3,697,094 |
| Galp Energia, SGPS, S.A. | 133,752 | 2,211,936 |
| Jeronimo Martins, SGPS, S.A. | 40,158 | 800,186 |
| | | 6,709,216 |
| |
| Singapore 0.8% |
| CapitaLand Ltd. | 313,817 | 873,511 |
| ComfortDelGro Corp., Ltd. | 430,436 | 725,846 |
| DBS Group Holdings Ltd. | 212,564 | 3,227,592 |
| Flex Ltd. * | 117,878 | 1,917,875 |
| Hutchison Port Holdings Trust | 1,317,796 | 599,597 |
| Jardine Cycle & Carriage Ltd. | 29,230 | 859,465 |
| Keppel Corp., Ltd. | 496,949 | 2,309,093 |
| Oversea-Chinese Banking Corp., Ltd. | 386,856 | 3,182,019 |
| Sembcorp Industries Ltd. | 364,671 | 800,235 |
| Singapore Airlines Ltd. | 170,374 | 1,293,488 |
| Singapore Press Holdings Ltd. | 267,738 | 544,151 |
| Singapore Telecommunications Ltd. | 1,266,357 | 3,450,310 |
| United Overseas Bank Ltd. | 153,650 | 2,718,858 |
| Wilmar International Ltd. | 488,755 | 1,194,894 |
| | | 23,696,934 |
| |
| Spain 4.3% |
| Abertis Infraestructuras S.A. | 104,110 | 2,104,197 |
| Acciona S.A. | 9,265 | 790,778 |
| Security | Number
of Shares | Value ($) |
| ACS, Actividades de Construccion y Servicios S.A. | 57,897 | 2,186,159 |
| Aena S.A. | 3,608 | 703,701 |
| Amadeus IT Group S.A. | 24,469 | 1,514,778 |
| Banco Bilbao Vizcaya Argentaria S.A. | 1,117,942 | 9,864,734 |
| Banco de Sabadell S.A. | 862,849 | 1,894,728 |
| Banco Santander S.A. | 6,012,382 | 39,021,575 |
| CaixaBank S.A. | 463,642 | 2,391,209 |
| Distribuidora Internacional de Alimentacion S.A. | 191,149 | 1,208,098 |
| Enagas S.A. | 33,188 | 976,763 |
| Endesa S.A. | 181,020 | 4,361,323 |
| Ferrovial S.A. | 89,025 | 2,026,341 |
| Gas Natural SDG S.A. | 107,803 | 2,617,169 |
| Grifols S.A. | 15,922 | 449,579 |
| Iberdrola S.A. | 1,233,092 | 10,058,380 |
| Industria de Diseno Textil S.A. | 76,928 | 2,918,935 |
| Mapfre S.A. | 301,569 | 1,065,925 |
| Red Electrica Corp. S.A. | 58,635 | 1,315,100 |
| Repsol S.A. | 735,379 | 12,616,029 |
| Telefonica S.A. | 2,170,095 | 23,372,445 |
| | | 123,457,946 |
| |
| Sweden 2.4% |
| Alfa Laval AB | 48,764 | 1,103,071 |
| Assa Abloy AB, B Shares | 72,274 | 1,560,403 |
| Atlas Copco AB, A Shares | 101,297 | 3,964,119 |
| Atlas Copco AB, B Shares | 44,953 | 1,602,125 |
| Autoliv, Inc. (a) | 17,599 | 1,911,603 |
| Boliden AB | 51,884 | 1,812,633 |
| Electrolux AB, Series B | 47,012 | 1,706,820 |
| Essity AB, B Shares * | 18,269 | 506,468 |
| Getinge AB, B Shares | 44,058 | 817,227 |
| Hennes & Mauritz AB, B Shares | 183,066 | 4,624,186 |
| Hexagon AB, B Shares | 18,044 | 884,133 |
| Husqvarna AB, B Shares | 70,654 | 711,659 |
| Nordea Bank AB | 489,439 | 6,575,183 |
| Sandvik AB | 209,723 | 3,460,528 |
| Securitas AB, B Shares | 67,929 | 1,114,885 |
| Skandinaviska Enskilda Banken AB, A Shares | 190,364 | 2,473,642 |
| Skanska AB, B Shares | 79,138 | 1,785,176 |
| SKF AB, B Shares | 91,259 | 1,821,200 |
| SSAB AB, A Shares *(a) | 79,166 | 401,434 |
| SSAB AB, B Shares * | 122,427 | 502,795 |
| Svenska Cellulosa AB SCA, B Shares | 76,339 | 635,571 |
| Svenska Handelsbanken AB, A Shares | 197,805 | 2,953,148 |
| Swedbank AB, A Shares | 141,508 | 3,819,854 |
| Swedish Match AB | 26,045 | 927,262 |
| Tele2 AB, B Shares | 232,325 | 2,700,656 |
| Telefonaktiebolaget LM Ericsson, B Shares | 1,187,291 | 6,948,562 |
| Telia Co. AB | 1,102,413 | 5,250,674 |
| Trelleborg AB, B Shares | 36,820 | 875,923 |
| Volvo AB, A Shares | 47,019 | 801,835 |
| Volvo AB, B Shares | 330,899 | 5,642,958 |
| | | 69,895,733 |
| |
| Switzerland 6.3% |
| ABB Ltd. | 342,813 | 7,919,301 |
| Actelion Ltd. * | 2,573 | 719,556 |
| Adecco Group AG | 51,751 | 3,742,658 |
| Aryzta AG * | 21,215 | 667,136 |
| Baloise Holding AG | 6,061 | 963,075 |
| Chocoladefabriken Lindt & Sprungli AG | 54 | 691,218 |
| Cie Financiere Richemont S.A. | 66,068 | 5,895,246 |
| Clariant AG * | 41,800 | 1,006,506 |
Schwab Fundamental Index ETFs | Semiannual Report
Schwab Fundamental International Large Company Index ETF
Portfolio Holdings as of August 31, 2017 (Unaudited) (continued)
| Security | Number
of Shares | Value ($) |
| Coca-Cola HBC AG CDI * | 34,374 | 1,171,097 |
| Credit Suisse Group AG * | 361,476 | 5,303,654 |
| Ferguson plc | 57,399 | 3,404,448 |
| Geberit AG | 2,185 | 996,096 |
| Georg Fischer AG | 613 | 704,854 |
| Givaudan S.A. | 844 | 1,721,374 |
| Glencore plc * | 4,770,498 | 22,098,559 |
| Idorsia Ltd. * | 2,573 | 46,855 |
| Julius Baer Group Ltd. * | 12,318 | 687,039 |
| Kuehne & Nagel International AG | 8,039 | 1,453,043 |
| LafargeHolcim Ltd. * | 71,312 | 4,181,510 |
| Lonza Group AG * | 4,182 | 1,056,597 |
| Nestle S.A. | 385,403 | 32,624,905 |
| Novartis AG | 291,600 | 24,547,804 |
| Roche Holding AG | 75,007 | 19,005,416 |
| Roche Holding AG, Bearer Shares | 3,342 | 853,410 |
| Schindler Holding AG | 4,331 | 924,443 |
| SGS S.A. | 528 | 1,177,424 |
| Sika AG | 190 | 1,344,433 |
| STMicroelectronics N.V. | 117,706 | 2,040,334 |
| Swiss Life Holding AG * | 3,980 | 1,421,369 |
| Swiss Prime Site AG * | 6,529 | 589,716 |
| Swiss Re AG | 83,084 | 7,508,684 |
| Swisscom AG | 4,789 | 2,409,948 |
| TE Connectivity Ltd. | 44,111 | 3,511,236 |
| The Swatch Group AG | 14,635 | 2,854,904 |
| UBS Group AG * | 250,068 | 4,111,420 |
| Zurich Insurance Group AG | 32,453 | 9,688,622 |
| | | 179,043,890 |
| |
| United Kingdom 15.3% |
| 3i Group plc | 76,700 | 958,174 |
| Admiral Group plc | 26,465 | 658,500 |
| Aggreko plc | 88,128 | 1,023,152 |
| Amec Foster Wheeler plc | 184,541 | 1,004,664 |
| Anglo American plc | 497,900 | 8,998,007 |
| Antofagasta plc | 134,951 | 1,799,773 |
| Ashtead Group plc | 40,161 | 860,594 |
| Associated British Foods plc | 55,933 | 2,394,248 |
| AstraZeneca plc | 258,807 | 15,143,591 |
| Aviva plc | 551,708 | 3,714,471 |
| Babcock International Group plc | 82,257 | 861,187 |
| BAE Systems plc | 560,575 | 4,388,149 |
| Balfour Beatty plc | 236,183 | 818,353 |
| Barclays plc | 4,269,824 | 10,514,098 |
| Barratt Developments plc | 118,859 | 956,458 |
| Bellway plc | 14,690 | 606,290 |
| Berkeley Group Holdings plc | 24,939 | 1,202,176 |
| BHP Billiton plc | 731,653 | 13,920,023 |
| Booker Group plc | 345,806 | 891,177 |
| BP plc | 9,896,855 | 56,768,174 |
| British American Tobacco plc | 246,681 | 15,355,858 |
| BT Group plc | 1,415,739 | 5,336,846 |
| Bunzl plc | 37,130 | 1,105,193 |
| Burberry Group plc | 64,923 | 1,503,308 |
| Capita plc | 130,775 | 1,092,788 |
| Carillion plc (a) | 212,063 | 120,532 |
| Carnival plc | 24,228 | 1,678,021 |
| Centrica plc | 2,225,429 | 5,732,286 |
| CNH Industrial N.V. | 173,751 | 1,968,636 |
| Cobham plc | 437,157 | 773,409 |
| Coca-Cola European Partners plc | 56,426 | 2,426,318 |
| Compass Group plc | 183,044 | 3,896,430 |
| Croda International plc | 13,251 | 656,005 |
| DCC plc | 14,465 | 1,313,109 |
| Debenhams plc | 502,956 | 260,854 |
| Diageo plc | 241,363 | 8,061,336 |
| Security | Number
of Shares | Value ($) |
| Direct Line Insurance Group plc | 361,544 | 1,770,763 |
| Dixons Carphone plc | 124,488 | 278,149 |
| Drax Group plc | 195,288 | 776,053 |
| DS Smith plc | 145,056 | 930,448 |
| easyJet plc | 71,951 | 1,108,841 |
| Fiat Chrysler Automobiles N.V. * | 489,003 | 7,354,399 |
| Firstgroup plc * | 880,533 | 1,332,033 |
| G4S plc | 344,787 | 1,259,521 |
| GKN plc | 335,634 | 1,379,183 |
| GlaxoSmithKline plc | 803,856 | 15,884,128 |
| Greene King plc | 58,271 | 517,712 |
| Hiscox Ltd. | 42,694 | 703,071 |
| HSBC Holdings plc | 3,726,985 | 36,042,067 |
| IMI plc | 54,041 | 790,352 |
| Imperial Brands plc | 145,414 | 5,996,880 |
| Inchcape plc | 133,170 | 1,428,539 |
| Informa plc | 80,747 | 718,441 |
| Inmarsat plc | 79,204 | 747,067 |
| InterContinental Hotels Group plc | 25,744 | 1,279,129 |
| International Consolidated Airlines Group S.A. | 132,131 | 1,041,124 |
| Intertek Group plc | 15,260 | 1,004,793 |
| Investec plc | 93,543 | 711,156 |
| ITV plc | 538,851 | 1,101,218 |
| J Sainsbury plc | 1,459,410 | 4,430,512 |
| John Wood Group plc | 101,540 | 740,551 |
| Johnson Matthey plc | 61,165 | 2,178,424 |
| Kingfisher plc | 833,741 | 3,211,134 |
| Land Securities Group plc | 76,589 | 996,757 |
| Legal & General Group plc | 802,159 | 2,689,485 |
| Liberty Global plc, Class A * | 35,245 | 1,198,330 |
| Liberty Global plc, Series C * | 84,386 | 2,787,270 |
| Lloyds Banking Group plc | 10,695,505 | 8,795,478 |
| Man Group plc | 536,931 | 1,158,178 |
| Marks & Spencer Group plc | 704,455 | 2,901,091 |
| Meggitt plc | 152,715 | 1,019,325 |
| Mondi plc | 58,717 | 1,598,692 |
| National Grid plc | 668,813 | 8,399,956 |
| Next plc | 37,408 | 1,990,264 |
| Old Mutual plc | 908,071 | 2,427,947 |
| Pearson plc | 275,114 | 2,150,032 |
| Pennon Group plc | 75,420 | 789,122 |
| Persimmon plc | 31,494 | 1,079,065 |
| Petrofac Ltd. | 69,264 | 373,423 |
| Phoenix Group Holdings | 86,484 | 872,010 |
| Provident Financial plc (a) | 15,253 | 173,547 |
| Prudential plc | 216,029 | 5,053,702 |
| Reckitt Benckiser Group plc | 57,830 | 5,463,576 |
| RELX plc | 75,080 | 1,635,947 |
| Rio Tinto plc | 337,985 | 16,316,406 |
| Rolls-Royce Holdings plc * | 421,500 | 4,964,152 |
| Royal Bank of Scotland Group plc * | 713,130 | 2,314,719 |
| Royal Mail plc | 388,740 | 1,974,591 |
| RSA Insurance Group plc | 171,684 | 1,474,454 |
| Severn Trent plc | 41,316 | 1,207,964 |
| Sky plc | 206,011 | 2,537,755 |
| Smith & Nephew plc | 97,274 | 1,751,034 |
| Smiths Group plc | 68,769 | 1,369,060 |
| Spectris plc | 18,908 | 563,781 |
| SSE plc | 313,931 | 5,764,351 |
| Standard Chartered plc * | 725,748 | 7,200,753 |
| Standard Life Aberdeen plc | 565,858 | 3,132,370 |
| Subsea 7 S.A. | 80,779 | 1,159,793 |
| Tate & Lyle plc | 114,425 | 1,007,768 |
| Taylor Wimpey plc | 387,171 | 1,000,273 |
| Tesco plc * | 3,915,148 | 9,126,160 |
| The British Land Co. plc | 68,269 | 537,924 |
| The Sage Group plc | 124,721 | 1,112,912 |
Schwab Fundamental Index ETFs | Semiannual Report
Schwab Fundamental International Large Company Index ETF
Portfolio Holdings as of August 31, 2017 (Unaudited) (continued)
| Security | Number
of Shares | Value ($) |
| The Weir Group plc | 38,381 | 887,732 |
| Travis Perkins plc | 74,873 | 1,451,988 |
| Unilever plc | 135,944 | 7,915,962 |
| United Utilities Group plc | 108,993 | 1,278,031 |
| Vodafone Group plc | 8,863,873 | 25,287,301 |
| Whitbread plc | 21,920 | 1,061,448 |
| William Hill plc | 180,372 | 575,468 |
| Wm Morrison Supermarkets plc | 1,368,834 | 4,338,976 |
| WPP plc | 163,208 | 2,986,284 |
| | | 437,330,483 |
| Total Common Stock |
| (Cost $2,540,212,981) | | 2,823,820,361 |
|
| Preferred Stock 0.6% of net assets |
| |
| Germany 0.6% |
| Fuchs Petrolub SE | 11,009 | 611,237 |
| Henkel AG & Co. KGaA | 18,421 | 2,464,926 |
| Volkswagen AG | 88,671 | 13,214,511 |
| | | 16,290,674 |
| |
| Italy 0.0% |
| Intesa Sanpaolo S.p.A. - RSP | 237,871 | 750,564 |
| |
| Spain 0.0% |
| Grifols S.A., B Shares | 19,403 | 397,696 |
| Total Preferred Stock |
| (Cost $17,280,713) | | 17,438,934 |
|
| Other Investment Companies 0.4% of net assets |
| |
| United States 0.4% |
| Money Market Fund 0.2% |
| State Street Institutional U.S. Government Money Market Fund, Premier Class 0.93% (c) | 6,320,727 | 6,320,727 |
| Securities Lending Collateral 0.2% |
| Wells Fargo Government Money Market Fund, Select Class 0.92% (c) | 4,647,234 | 4,647,234 |
| Total Other Investment Companies |
| (Cost $10,967,961) | | 10,967,961 |
| | Number of
Contracts | Notional
Amount
($) | Current Value/
Unrealized
Appreciation
($) |
| Futures Contracts | | | |
| Long | |
| MSCI EAFE Index, e-mini, expires 09/15/17 | 114 | 11,028,360 | 43,962 |
| * | Non-income producing security. |
| (a) | All or a portion of this security is on loan. Securities on loan were valued at $4,429,591. |
| (b) | Fair-valued by management in accordance with procedures approved by the Board of Trustees. |
| (c) | The rate shown is the 7-day yield. |
| | |
| CDI — | CHESS Depositary Interest |
| CVA — | Dutch Certificate |
| GDR — | Global Depositary Receipt |
| REIT — | Real Estate Investment Trust |
| RSP — | Risparmio (Convertible Savings Shares) |
Schwab Fundamental Index ETFs | Semiannual Report
Schwab Fundamental International Small Company Index ETF
Portfolio Holdings as of August 31, 2017 (Unaudited)
This section shows all the securities in the fund's portfolio and their values as of the report date.
The fund files its complete schedule of portfolio holdings with the SEC for the first and third quarters of each fiscal year on Form N-Q. The fund's Form N-Q is available on the SEC's website at www.sec.gov and may be viewed and copied at the SEC's Public Reference Room in Washington, D.C. Call 1-800-SEC-0330 for information on the operation of the Public Reference Room. The fund also makes available its complete schedule of portfolio holdings on a daily basis on the fund's website at www.schwabfunds.com/schwabetfs_prospectus.
| Security | Number
of Shares | Value ($) |
| Common Stock 99.6% of net assets |
| |
| Australia 5.9% |
| Adelaide Brighton Ltd. | 229,652 | 1,047,353 |
| ALS Ltd. | 328,224 | 2,074,836 |
| Ansell Ltd. | 54,787 | 948,173 |
| Ardent Leisure Group | 342,506 | 524,301 |
| Aristocrat Leisure Ltd. | 71,257 | 1,196,475 |
| ASX Ltd. | 42,902 | 1,860,635 |
| AusNet Services | 938,616 | 1,295,366 |
| Austal Ltd. | 59,017 | 80,044 |
| Australian Pharmaceutical Industries Ltd. | 543,242 | 631,228 |
| Automotive Holdings Group Ltd. (a) | 320,511 | 813,482 |
| Bank of Queensland Ltd. | 177,615 | 1,773,620 |
| Beach Energy Ltd. | 1,238,415 | 658,107 |
| Bega Cheese Ltd. | 97,678 | 533,791 |
| carsales.com Ltd. | 45,770 | 493,350 |
| Challenger Ltd. | 139,284 | 1,385,332 |
| Charter Hall Retail REIT | 120,413 | 375,337 |
| Cleanaway Waste Management Ltd. | 1,212,522 | 1,380,056 |
| Cochlear Ltd. | 11,931 | 1,478,226 |
| Computershare Ltd. | 183,155 | 2,041,034 |
| Cromwell Property Group | 511,818 | 385,651 |
| Crown Resorts Ltd. | 202,348 | 1,861,710 |
| CSR Ltd. | 600,777 | 1,925,085 |
| Dexus | 246,620 | 1,875,867 |
| DuluxGroup Ltd. | 164,537 | 866,536 |
| Event Hospitality & Entertainment Ltd. | 54,722 | 532,552 |
| Fairfax Media Ltd. | 2,484,625 | 1,901,706 |
| Flight Centre Travel Group Ltd. (a) | 35,758 | 1,371,276 |
| G.U.D. Holdings Ltd. | 66,953 | 619,190 |
| G8 Education Ltd. | 35,507 | 108,707 |
| Genworth Mortgage Insurance Australia Ltd. | 266,187 | 612,266 |
| GrainCorp Ltd., Class A | 257,762 | 1,764,350 |
| GWA Group Ltd. | 231,123 | 535,280 |
| Harvey Norman Holdings Ltd. (a) | 269,935 | 873,523 |
| Healthscope Ltd. | 227,640 | 314,162 |
| Inghams Group Ltd. (a) | 120,597 | 352,954 |
| Investa Office Fund | 148,040 | 530,729 |
| InvoCare Ltd. | 37,892 | 453,816 |
| IOOF Holdings Ltd. | 139,941 | 1,226,486 |
| IRESS Ltd. | 42,112 | 404,822 |
| JB Hi-Fi Ltd. (a) | 79,134 | 1,451,757 |
| McMillan Shakespeare Ltd. | 47,441 | 573,824 |
| Mineral Resources Ltd. | 109,331 | 1,285,996 |
| Monadelphous Group Ltd. | 159,321 | 1,927,072 |
| Myer Holdings Ltd. (a) | 2,188,732 | 1,267,274 |
| Navitas Ltd. (a) | 187,046 | 669,083 |
| nib Holdings Ltd. | 232,173 | 1,088,314 |
| Nine Entertainment Co. Holdings Ltd. | 637,645 | 690,346 |
| Nufarm Ltd. | 116,140 | 820,757 |
| OceanaGold Corp. | 183,520 | 567,942 |
| Orora Ltd. | 590,941 | 1,452,985 |
| OZ Minerals Ltd. | 317,484 | 2,042,198 |
| Pact Group Holdings Ltd. | 22,398 | 91,490 |
| Perpetual Ltd. | 14,953 | 651,587 |
| Premier Investments Ltd. | 54,640 | 548,655 |
| Security | Number
of Shares | Value ($) |
| Primary Health Care Ltd. | 483,058 | 1,310,330 |
| Programmed Maintenance Services Ltd. | 491,796 | 1,174,104 |
| Qantas Airways Ltd. | 687,940 | 3,121,057 |
| Qube Holdings Ltd. (a) | 239,519 | 478,736 |
| Ramsay Health Care Ltd. | 29,989 | 1,624,806 |
| Regis Resources Ltd. | 36,725 | 120,883 |
| Resolute Mining Ltd. | 341,179 | 327,433 |
| Sandfire Resources NL | 19,267 | 90,467 |
| SEEK Ltd. | 68,077 | 904,420 |
| Seven Group Holdings Ltd. | 78,088 | 789,677 |
| Seven West Media Ltd. | 1,959,209 | 1,079,993 |
| Sigma Healthcare Ltd. | 1,409,435 | 955,798 |
| South32 Ltd. | 241,293 | 558,834 |
| Southern Cross Media Group Ltd. | 585,019 | 600,890 |
| Spotless Group Holdings Ltd. | 1,351,528 | 1,179,160 |
| Super Retail Group Ltd. | 108,015 | 693,944 |
| Sydney Airport | 244,601 | 1,435,639 |
| The GPT Group | 452,601 | 1,794,902 |
| The Star Entertainment Grp Ltd. | 350,894 | 1,447,220 |
| TPG Telecom Ltd. (a) | 79,827 | 347,598 |
| Treasury Wine Estates Ltd. | 164,631 | 1,890,755 |
| Vicinity Centres | 396,037 | 822,986 |
| Village Roadshow Ltd. | 142,342 | 418,853 |
| Washington H Soul Pattinson & Co., Ltd. | 41,719 | 585,683 |
| Western Areas Ltd. *(a) | 227,618 | 487,445 |
| Whitehaven Coal Ltd. * | 404,902 | 1,124,018 |
| | | 79,602,325 |
| |
| Austria 1.1% |
| ams AG * | 12,986 | 933,073 |
| ANDRITZ AG | 28,210 | 1,533,061 |
| Austria Technologie & Systemtechnik AG (a) | 35,769 | 493,937 |
| BUWOG AG * | 20,162 | 619,640 |
| CA Immobilien Anlagen AG | 20,378 | 580,367 |
| IMMOFINANZ AG * | 415,969 | 1,100,363 |
| Lenzing AG | 3,420 | 538,750 |
| Oesterreichische Post AG | 31,065 | 1,390,164 |
| RHI AG | 24,558 | 896,932 |
| S IMMO AG | 6,886 | 112,322 |
| Schoeller-Bleckmann Oilfield Equipment AG * | 6,500 | 452,079 |
| Semperit AG Holding | 3,328 | 99,094 |
| Telekom Austria AG * | 105,179 | 1,010,882 |
| UNIQA Insurance Group AG | 66,955 | 678,614 |
| Verbund AG | 32,701 | 701,752 |
| Vienna Insurance Group AG Wiener Versicherung Gruppe | 44,608 | 1,315,254 |
| Wienerberger AG | 84,298 | 1,817,022 |
| Zumtobel Group AG | 21,136 | 381,326 |
| | | 14,654,632 |
| |
| Belgium 1.3% |
| Ackermans & van Haaren N.V. | 5,240 | 879,652 |
| AGFA-Gevaert N.V. * | 186,592 | 824,354 |
| Barco N.V. | 8,127 | 790,753 |
| Befimmo S.A. | 9,674 | 607,045 |
Schwab Fundamental Index ETFs | Semiannual Report
Schwab Fundamental International Small Company Index ETF
Portfolio Holdings as of August 31, 2017 (Unaudited) (continued)
| Security | Number
of Shares | Value ($) |
| Bekaert N.V. | 31,885 | 1,517,839 |
| bpost S.A. | 62,794 | 1,750,677 |
| Cie d'Entreprises CFE | 2,951 | 413,996 |
| Cofinimmo S.A. | 7,904 | 1,018,642 |
| D'Ieteren S.A. N.V. | 32,754 | 1,503,910 |
| Elia System Operator S.A. N.V. | 19,990 | 1,187,592 |
| Euronav N.V. | 45,811 | 350,371 |
| Gimv N.V. | 13,560 | 809,298 |
| Nyrstar N.V. *(a) | 143,589 | 1,031,789 |
| Ontex Group N.V. | 25,470 | 867,861 |
| Orange Belgium S.A. | 37,425 | 898,568 |
| Sofina S.A. | 734 | 106,594 |
| Telenet Group Holding N.V. * | 25,894 | 1,750,764 |
| Tessenderlo Group S.A. * | 20,025 | 876,600 |
| | | 17,186,305 |
| |
| Canada 8.7% |
| Aecon Group, Inc. | 79,540 | 1,084,218 |
| AGF Management Ltd., Class B | 204,691 | 1,268,554 |
| Aimia, Inc. | 210,945 | 363,423 |
| Air Canada * | 22,535 | 419,515 |
| Algonquin Power & Utilities Corp. | 63,216 | 683,212 |
| Allied Properties Real Estate Investment Trust | 4,240 | 130,912 |
| AltaGas Ltd. | 64,159 | 1,416,999 |
| Artis Real Estate Investment Trust | 58,114 | 612,775 |
| AutoCanada, Inc. | 23,154 | 404,445 |
| Bird Construction, Inc. | 63,413 | 449,139 |
| Boardwalk Real Estate Investment Trust (a) | 15,357 | 494,609 |
| Bombardier, Inc., B Shares * | 1,562,340 | 3,115,334 |
| Bonavista Energy Corp. | 616,345 | 1,351,903 |
| Bonterra Energy Corp. | 25,914 | 336,494 |
| CAE, Inc. | 103,083 | 1,694,549 |
| Canadian Apartment Properties REIT | 20,004 | 546,789 |
| Canadian Real Estate Investment Trust | 12,880 | 472,464 |
| Canadian Solar, Inc. * | 37,520 | 589,439 |
| Canadian Utilities Ltd., Class A | 95,136 | 2,953,295 |
| Canadian Western Bank | 36,638 | 847,459 |
| Canfor Corp. * | 76,814 | 1,339,918 |
| Capital Power Corp. | 76,877 | 1,610,201 |
| Cascades, Inc. | 83,512 | 972,503 |
| CCL Industries, Inc., Class B | 24,262 | 1,121,035 |
| Centerra Gold, Inc. * | 173,764 | 1,039,466 |
| CES Energy Solutions Corp. | 102,247 | 433,862 |
| Chartwell Retirement Residences | 35,377 | 415,071 |
| Chemtrade Logistics Income Fund | 43,834 | 653,795 |
| Cineplex, Inc. | 29,257 | 895,853 |
| Cogeco Communications, Inc. | 14,980 | 1,116,555 |
| Cogeco, Inc. | 3,916 | 257,714 |
| Colliers International Group, Inc. | 8,201 | 424,784 |
| Cominar Real Estate Investment Trust | 53,961 | 582,757 |
| Constellation Software, Inc. | 1,392 | 770,927 |
| Corus Entertainment, Inc., B Shares | 66,147 | 727,023 |
| Cott Corp. | 59,797 | 904,765 |
| Crew Energy, Inc. * | 82,393 | 274,041 |
| Dominion Diamond Corp. | 62,334 | 879,015 |
| Dorel Industries, Inc., Class B | 41,188 | 938,906 |
| Dream Global Real Estate Investment Trust | 57,831 | 519,384 |
| Dream Office Real Estate Investment Trust | 41,922 | 714,889 |
| Eldorado Gold Corp. | 369,722 | 757,875 |
| Enercare, Inc. | 32,718 | 546,714 |
| Enerflex Ltd. | 71,320 | 890,256 |
| Ensign Energy Services, Inc. | 280,598 | 1,412,222 |
| Entertainment One Ltd. | 248,371 | 768,092 |
| Exchange Income Corp. (a) | 15,776 | 418,512 |
| Security | Number
of Shares | Value ($) |
| Extendicare, Inc. | 75,518 | 561,378 |
| First Capital Realty, Inc. | 53,656 | 868,339 |
| FirstService Corp. | 1,896 | 131,552 |
| Franco-Nevada Corp. | 14,639 | 1,192,838 |
| Genworth MI Canada, Inc. (a) | 35,280 | 1,012,181 |
| Gran Tierra Energy, Inc. * | 295,077 | 602,510 |
| Granite Real Estate Investment Trust | 16,738 | 678,865 |
| Great Canadian Gaming Corp. * | 24,970 | 675,360 |
| H&R Real Estate Investment Trust | 64,116 | 1,092,337 |
| Home Capital Group, Inc. | 53,491 | 577,681 |
| Hudbay Minerals, Inc. | 104,819 | 910,452 |
| Hudson's Bay Co. (a) | 131,681 | 1,248,803 |
| Hydro One Ltd. | 26,443 | 488,681 |
| IAMGOLD Corp. * | 337,325 | 2,230,448 |
| IGM Financial, Inc. | 74,488 | 2,429,363 |
| Industrial Alliance Insurance & Financial Services, Inc. | 39,824 | 1,702,228 |
| Innergex Renewable Energy, Inc. | 35,441 | 412,713 |
| Interfor Corp. * | 45,104 | 631,366 |
| Intertape Polymer Group, Inc. | 24,456 | 386,615 |
| Just Energy Group, Inc. | 103,093 | 592,862 |
| Kinross Gold Corp. * | 542,160 | 2,460,531 |
| Laurentian Bank of Canada | 17,131 | 767,496 |
| Linamar Corp. | 36,148 | 2,007,566 |
| Lundin Mining Corp. | 175,348 | 1,320,267 |
| MacDonald, Dettwiler & Associates Ltd. | 18,743 | 1,027,184 |
| Maple Leaf Foods, Inc. | 63,154 | 1,727,763 |
| Martinrea International, Inc. | 119,947 | 1,042,809 |
| Medical Facilities Corp. | 23,459 | 287,215 |
| MEG Energy Corp. * | 185,967 | 743,126 |
| Morneau Shepell, Inc. | 31,159 | 509,231 |
| Mullen Group Ltd. | 102,575 | 1,252,581 |
| Nevsun Resources Ltd. | 211,843 | 449,454 |
| New Flyer Industries, Inc. | 15,375 | 629,593 |
| New Gold, Inc. * | 181,845 | 677,341 |
| Norbord, Inc. | 15,797 | 541,791 |
| Northland Power, Inc. | 41,316 | 789,247 |
| Open Text Corp. | 35,518 | 1,138,276 |
| Pan American Silver Corp. | 42,987 | 798,195 |
| Parex Resources, Inc. * | 38,257 | 392,716 |
| Pason Systems, Inc. | 42,491 | 606,651 |
| Pengrowth Energy Corp. *(a) | 1,730,192 | 1,076,411 |
| Peyto Exploration & Development Corp. | 52,285 | 893,693 |
| PrairieSky Royalty Ltd. | 5,836 | 136,573 |
| Precision Drilling Corp. * | 395,358 | 999,629 |
| Premium Brands Holdings Corp. | 2,120 | 166,742 |
| Quebecor, Inc., Class B | 67,032 | 2,555,102 |
| Restaurant Brands International, Inc. | 13,853 | 842,285 |
| Richelieu Hardware Ltd. | 24,415 | 598,813 |
| RioCan Real Estate Investment Trust | 62,699 | 1,190,218 |
| Ritchie Bros. Auctioneers, Inc. (a) | 21,200 | 627,672 |
| Rogers Sugar, Inc. | 23,659 | 121,904 |
| Russel Metals, Inc. | 93,251 | 1,935,307 |
| Secure Energy Services, Inc. | 88,250 | 525,805 |
| SEMAFO, Inc. * | 156,878 | 440,447 |
| ShawCor Ltd. | 57,203 | 1,158,888 |
| Smart Real Estate Investment Trust | 21,647 | 525,398 |
| Stantec, Inc. | 43,823 | 1,212,888 |
| Stella-Jones, Inc. | 12,046 | 457,051 |
| Student Transportation, Inc. | 69,674 | 415,126 |
| SunOpta, Inc. * | 15,960 | 137,609 |
| Superior Plus Corp. | 151,957 | 1,435,032 |
| TFI International, Inc. | 65,367 | 1,592,270 |
| The Jean Coutu Group PJC, Inc., Class A | 63,732 | 1,132,053 |
| The North West Co., Inc. | 43,403 | 1,089,099 |
| TMX Group Ltd. | 17,261 | 913,611 |
| Toromont Industries Ltd. | 34,571 | 1,482,382 |
| Tourmaline Oil Corp. * | 34,398 | 668,343 |
Schwab Fundamental Index ETFs | Semiannual Report
Schwab Fundamental International Small Company Index ETF
Portfolio Holdings as of August 31, 2017 (Unaudited) (continued)
| Security | Number
of Shares | Value ($) |
| Transcontinental, Inc., Class A | 68,389 | 1,325,506 |
| Trinidad Drilling Ltd. * | 362,560 | 482,931 |
| Uni-Select, Inc. | 26,765 | 586,215 |
| Veresen, Inc. | 71,858 | 1,008,161 |
| Waste Connections, Inc. | 56,239 | 3,737,006 |
| Western Forest Products, Inc. | 403,109 | 852,035 |
| Westshore Terminals Investment Corp. | 28,910 | 582,235 |
| Wheaton Precious Metals Corp. | 71,915 | 1,487,916 |
| Whitecap Resources, Inc. | 89,572 | 641,561 |
| Winpak Ltd. | 2,544 | 107,908 |
| WSP Global, Inc. | 31,178 | 1,287,406 |
| Yamana Gold, Inc. | 756,520 | 2,226,567 |
| Yellow Pages Ltd. *(a) | 107,203 | 641,294 |
| | | 117,514,359 |
| |
| Denmark 1.5% |
| Chr Hansen Holding A/S | 12,925 | 1,110,493 |
| D/S Norden A/S *(a) | 44,489 | 945,114 |
| Dfds A/S | 13,671 | 787,138 |
| DONG Energy A/S | 8,219 | 427,244 |
| FLSmidth & Co. A/S | 38,026 | 2,391,232 |
| GN Store Nord A/S | 52,594 | 1,741,938 |
| H. Lundbeck A/S | 15,545 | 988,716 |
| Jyske Bank A/S | 19,193 | 1,153,246 |
| Matas A/S | 28,191 | 410,070 |
| Nets A/S * | 4,240 | 104,713 |
| NKT A/S * | 18,060 | 1,442,560 |
| Per Aarsleff Holding A/S, Class B | 18,781 | 531,372 |
| Rockwool International A/S, B Shares | 7,784 | 1,954,725 |
| Royal Unibrew A/S | 13,315 | 729,181 |
| Scandinavian Tobacco Group A/S, Class A | 5,704 | 100,751 |
| Schouw & Co. | 7,149 | 748,503 |
| SimCorp A/S | 8,042 | 475,634 |
| Sydbank A/S | 23,518 | 916,142 |
| Topdanmark A/S * | 18,036 | 703,456 |
| Tryg A/S | 48,280 | 1,114,400 |
| William Demant Holding A/S * | 32,006 | 845,689 |
| | | 19,622,317 |
| |
| Finland 1.5% |
| Amer Sports Oyj * | 53,820 | 1,421,142 |
| Cargotec Oyj, B Shares | 25,191 | 1,515,448 |
| Caverion Corp. *(a) | 101,398 | 908,962 |
| Cramo Oyj | 27,173 | 759,190 |
| Finnair Oyj | 15,251 | 173,160 |
| Huhtamaki Oyj | 35,998 | 1,398,639 |
| Kemira Oyj | 85,556 | 1,056,845 |
| Konecranes Oyj | 28,296 | 1,247,075 |
| Metsa Board Oyj | 125,491 | 823,563 |
| Outokumpu Oyj | 145,782 | 1,504,419 |
| Outotec Oyj *(a) | 127,323 | 933,979 |
| PKC Group Oyj *(a) | 14,984 | 426,835 |
| Raisio Oyj, V Shares | 22,717 | 94,799 |
| Ramirent Oyj | 67,022 | 692,440 |
| Sanoma Oyj | 115,683 | 1,085,155 |
| Tieto Oyj | 53,842 | 1,700,818 |
| Tikkurila Oyj | 29,852 | 553,660 |
| Uponor Oyj | 29,428 | 480,021 |
| Valmet Oyj | 68,530 | 1,297,901 |
| YIT Oyj | 173,328 | 1,526,975 |
| | | 19,601,026 |
| |
| France 4.1% |
| Aeroports de Paris | 12,058 | 2,148,212 |
| Alten S.A. | 12,150 | 1,032,827 |
| Security | Number
of Shares | Value ($) |
| Altran Technologies S.A. | 41,858 | 714,625 |
| Amundi S.A. | 9,576 | 736,262 |
| BioMerieux | 3,908 | 955,495 |
| Coface S.A. | 75,947 | 723,250 |
| Dassault Aviation S.A. | 505 | 770,486 |
| Dassault Systemes S.A. | 19,300 | 1,898,762 |
| Derichebourg S.A. | 37,504 | 355,771 |
| Edenred | 75,202 | 2,031,341 |
| Elior Group S.A. | 42,265 | 1,120,549 |
| Elis S.A. (a) | 34,527 | 806,410 |
| Euler Hermes Group | 9,876 | 1,171,339 |
| Europcar Groupe S.A. | 38,223 | 553,954 |
| Fnac Darty S.A. * | 14,371 | 1,281,426 |
| Fonciere Des Regions | 12,537 | 1,238,178 |
| Gecina S.A. | 11,318 | 1,761,386 |
| Groupe Eurotunnel SE | 154,660 | 1,841,510 |
| Havas S.A. | 69,522 | 763,481 |
| ICADE | 20,538 | 1,823,019 |
| Iliad S.A. | 7,337 | 1,892,445 |
| Imerys S.A. | 20,615 | 1,811,227 |
| Ingenico Group S.A. | 12,247 | 1,214,342 |
| Ipsen S.A. | 8,388 | 1,125,395 |
| IPSOS | 25,977 | 810,243 |
| JCDecaux S.A. | 33,081 | 1,081,771 |
| Korian S.A. | 20,091 | 704,642 |
| Mercialys S.A. | 29,733 | 598,114 |
| Mersen S.A. | 2,659 | 97,684 |
| Metropole Television S.A. | 53,310 | 1,170,633 |
| Neopost S.A. | 58,991 | 2,560,606 |
| Nexans S.A. | 29,534 | 1,646,447 |
| Nexity S.A. * | 27,311 | 1,511,805 |
| Orpea | 9,485 | 1,147,969 |
| Plastic Omnium S.A. | 28,615 | 1,083,038 |
| Remy Cointreau S.A. | 7,112 | 811,132 |
| SEB S.A. | 11,067 | 2,007,842 |
| SFR Group S.A. * | 13,803 | 564,517 |
| Societe BIC S.A. | 13,224 | 1,587,137 |
| Sopra Steria Group | 5,596 | 968,023 |
| SPIE S.A. | 22,502 | 636,578 |
| Tarkett S.A. | 10,783 | 445,876 |
| Technicolor S.A. | 222,751 | 813,024 |
| Television Francaise 1 S.A. | 128,595 | 1,725,324 |
| UBISOFT Entertainment S.A. * | 28,837 | 1,918,549 |
| Vicat S.A. | 14,593 | 1,001,072 |
| | | 54,663,718 |
| |
| Germany 2.6% |
| Aareal Bank AG | 24,727 | 1,011,141 |
| Axel Springer SE | 28,802 | 1,780,620 |
| Bechtle AG | 19,682 | 1,356,025 |
| CANCOM SE | 7,432 | 509,036 |
| Deutsche Pfandbriefbank AG | 26,145 | 368,032 |
| Deutsche Wohnen SE | 39,652 | 1,682,035 |
| Drillisch AG | 11,591 | 797,755 |
| Duerr AG | 8,945 | 1,040,500 |
| ElringKlinger AG (a) | 37,206 | 645,598 |
| Fielmann AG | 7,762 | 643,485 |
| Fraport AG Frankfurt Airport Services Worldwide | 21,217 | 2,090,890 |
| Gerresheimer AG | 12,347 | 970,011 |
| Grammer AG | 8,498 | 448,029 |
| Heidelberger Druckmaschinen AG * | 199,769 | 748,854 |
| Hella KGaA Hueck & Co. | 26,056 | 1,437,378 |
| Jenoptik AG | 23,783 | 696,004 |
| Krones AG | 8,487 | 1,048,371 |
| LEG Immobilien AG | 13,569 | 1,369,622 |
| Nordex SE *(a) | 7,247 | 100,548 |
Schwab Fundamental Index ETFs | Semiannual Report
Schwab Fundamental International Small Company Index ETF
Portfolio Holdings as of August 31, 2017 (Unaudited) (continued)
| Security | Number
of Shares | Value ($) |
| Norma Group SE | 12,174 | 740,038 |
| Pfeiffer Vacuum Technology AG | 4,153 | 678,906 |
| Rhoen-Klinikum AG | 41,512 | 1,377,459 |
| SAF-Holland S.A. | 35,304 | 643,235 |
| Scout24 AG | 2,897 | 116,501 |
| Siltronic AG * | 19,798 | 1,930,338 |
| SMA Solar Technology AG (a) | 25,150 | 1,112,012 |
| Software AG | 25,161 | 1,104,122 |
| STADA Arzneimittel AG | 25,047 | 2,339,984 |
| TAG Immobilien AG | 36,929 | 615,546 |
| Talanx AG * | 27,959 | 1,155,604 |
| TLG Immobilien AG | 5,576 | 123,371 |
| United Internet AG | 28,929 | 1,714,525 |
| Wacker Chemie AG | 12,554 | 1,606,724 |
| Wirecard AG | 9,471 | 806,333 |
| Zalando SE * | 2,310 | 109,264 |
| | | 34,917,896 |
| |
| Hong Kong 4.3% |
| AAC Technologies Holdings, Inc. | 96,009 | 1,750,536 |
| ASM Pacific Technology Ltd. | 89,908 | 1,112,010 |
| BOC Aviation Ltd. | 15,960 | 84,628 |
| Brightoil Petroleum Holdings Ltd. * | 1,961,015 | 483,586 |
| Cafe de Coral Holdings Ltd. | 167,488 | 532,866 |
| Cathay Pacific Airways Ltd. | 1,189,602 | 1,766,213 |
| China Travel International Investment Hong Kong Ltd. | 302,264 | 94,621 |
| Chow Sang Sang Holdings International Ltd. | 93,640 | 213,687 |
| Chow Tai Fook Jewellery Group Ltd. | 844,457 | 871,815 |
| CK Infrastructure Holdings Ltd. | 10,624 | 96,243 |
| Dairy Farm International Holdings Ltd. | 141,576 | 1,146,766 |
| Far East Consortium International Ltd. | 144,736 | 75,267 |
| FIH Mobile Ltd. | 3,327,152 | 1,024,530 |
| First Pacific Co., Ltd. | 2,187,683 | 1,758,208 |
| Giordano International Ltd. | 1,266,686 | 750,969 |
| Global Brands Group Holding Ltd. * | 7,301,470 | 653,046 |
| Great Eagle Holdings Ltd. | 105,068 | 574,579 |
| Hang Lung Group Ltd. | 359,324 | 1,354,389 |
| Hang Lung Properties Ltd. | 751,674 | 1,828,655 |
| Henderson Land Development Co., Ltd. | 223,794 | 1,386,837 |
| HK Electric Investments & HK Electric Investments Ltd. | 569,940 | 522,864 |
| HKBN Ltd. | 199,548 | 191,225 |
| Hopewell Holdings Ltd. | 108,635 | 426,825 |
| Huabao International Holdings Ltd. | 1,533,301 | 936,463 |
| Hutchison Telecommunications Hong Kong Holdings Ltd. | 1,284,974 | 469,565 |
| Hysan Development Co., Ltd. | 117,379 | 542,918 |
| Johnson Electric Holdings Ltd. | 53,216 | 195,826 |
| Ju Teng International Holdings Ltd. | 1,513,850 | 599,625 |
| K Wah International Holdings Ltd. | 133,040 | 77,004 |
| Kerry Logistics Network Ltd. | 321,194 | 458,001 |
| Kerry Properties Ltd. | 385,221 | 1,525,832 |
| Luk Fook Holdings International Ltd. | 335,524 | 1,151,074 |
| Man Wah Holdings Ltd. | 106,008 | 98,606 |
| Melco Resorts & Entertainment Ltd. ADR | 48,318 | 1,060,580 |
| MGM China Holdings Ltd. | 429,230 | 859,946 |
| Minth Group Ltd. | 159,288 | 733,708 |
| MMG Ltd. * | 1,623,916 | 792,615 |
| NewOcean Energy Holdings Ltd. * | 351,216 | 93,341 |
| NWS Holdings Ltd. | 586,405 | 1,126,888 |
| Orient Overseas International Ltd. | 308,287 | 2,851,865 |
| Pacific Basin Shipping Ltd. * | 4,268,956 | 970,905 |
| Pacific Textiles Holdings Ltd. | 603,892 | 614,197 |
| Pou Sheng International Holdings Ltd. | 441,688 | 81,831 |
| Power Assets Holdings Ltd. | 209,672 | 1,848,522 |
| Security | Number
of Shares | Value ($) |
| Sa Sa International Holdings Ltd. | 914,874 | 334,320 |
| Seaspan Corp. (a) | 15,512 | 110,756 |
| Semiconductor Manufacturing International Corp. * | 1,040,629 | 978,608 |
| Shangri-La Asia Ltd. | 724,433 | 1,212,564 |
| Shougang Fushan Resources Group Ltd. | 2,970,875 | 671,882 |
| Shui On Land Ltd. | 2,067,007 | 483,313 |
| Sino Land Co., Ltd. | 863,835 | 1,494,461 |
| SITC International Holdings Co., Ltd. | 715,107 | 666,091 |
| SmarTone Telecommunications Holdings Ltd. | 244,583 | 298,758 |
| Stella International Holdings Ltd. | 547,099 | 968,867 |
| Sun Art Retail Group Ltd. | 1,521,623 | 1,401,772 |
| Swire Properties Ltd. | 307,731 | 1,065,555 |
| Techtronic Industries Co., Ltd. | 370,857 | 1,919,096 |
| Television Broadcasts Ltd. | 218,398 | 729,719 |
| Texwinca Holdings Ltd. | 859,597 | 494,245 |
| The Bank of East Asia Ltd. | 357,236 | 1,636,363 |
| The Hongkong & Shanghai Hotels Ltd. | 73,964 | 127,771 |
| Tingyi Cayman Islands Holding Corp. | 1,404,020 | 1,869,288 |
| Truly International Holdings Ltd. (a) | 1,737,160 | 526,046 |
| Uni-President China Holdings Ltd. | 633,480 | 541,495 |
| Vitasoy International Holdings Ltd. | 210,826 | 462,788 |
| VTech Holdings Ltd. | 110,479 | 1,552,772 |
| Wynn Macau Ltd. | 918,191 | 2,015,540 |
| Xinyi Glass Holdings Ltd. * | 788,194 | 785,530 |
| | | 58,137,277 |
| |
| Ireland 0.8% |
| C&C Group plc | 192,078 | 688,966 |
| Glanbia plc | 52,408 | 978,856 |
| ICON plc * | 11,719 | 1,328,817 |
| Irish Continental Group plc | 73,102 | 488,439 |
| James Hardie Industries plc CDI | 75,557 | 1,060,127 |
| Jazz Pharmaceuticals plc * | 5,108 | 762,931 |
| Kingspan Group plc | 36,982 | 1,428,956 |
| Origin Enterprises plc | 85,982 | 656,278 |
| Paddy Power Betfair plc | 9,961 | 873,868 |
| Total Produce plc | 368,733 | 949,107 |
| UDG Healthcare plc | 101,702 | 1,096,873 |
| | | 10,313,218 |
| |
| Israel 0.8% |
| Azrieli Group Ltd. | 8,126 | 468,305 |
| Cellcom Israel Ltd. * | 100,351 | 890,573 |
| Delek Group Ltd. | 4,057 | 777,771 |
| Elbit Systems Ltd. | 7,252 | 997,829 |
| First International Bank of Israel Ltd. | 35,284 | 644,362 |
| Gazit-Globe Ltd. | 42,581 | 414,573 |
| Israel Discount Bank Ltd., A Shares * | 612,229 | 1,525,686 |
| Mizrahi Tefahot Bank Ltd. | 45,114 | 803,503 |
| NICE Ltd. | 15,438 | 1,194,872 |
| Partner Communications Co., Ltd. * | 142,027 | 711,590 |
| Paz Oil Co., Ltd. | 6,857 | 1,090,115 |
| Taro Pharmaceutical Industries Ltd. * | 916 | 96,033 |
| The Israel Corp., Ltd. * | 7,622 | 1,454,420 |
| Tower Semiconductor Ltd. * | 3,783 | 111,803 |
| | | 11,181,435 |
| |
| Italy 3.3% |
| A2A S.p.A. | 1,322,076 | 2,217,832 |
| ACEA S.p.A. | 46,701 | 673,491 |
| Anima Holding S.p.A. | 66,395 | 506,775 |
| Ansaldo STS S.p.A. * | 32,835 | 429,413 |
| Astaldi S.p.A. (a) | 89,447 | 573,191 |
Schwab Fundamental Index ETFs | Semiannual Report
Schwab Fundamental International Small Company Index ETF
Portfolio Holdings as of August 31, 2017 (Unaudited) (continued)
| Security | Number
of Shares | Value ($) |
| ASTM S.p.A. | 55,462 | 1,395,923 |
| Autogrill S.p.A. | 71,640 | 945,418 |
| Azimut Holding S.p.A. | 39,817 | 837,890 |
| Banca Carige S.p.A. *(a) | 3,140,316 | 858,710 |
| Banca Generali S.p.A. | 26,306 | 867,261 |
| Banca Mediolanum S.p.A. | 22,143 | 186,913 |
| Banca Popolare di Sondrio Scarl | 472,402 | 1,957,872 |
| Beni Stabili S.p.A. | 579,559 | 496,796 |
| Brembo S.p.A. | 34,219 | 532,947 |
| Buzzi Unicem S.p.A. | 34,331 | 839,179 |
| Buzzi Unicem S.p.A. - RSP | 5,469 | 73,929 |
| C.I.R. - Compagnie Industriali Riunite S.p.A. | 433,541 | 633,987 |
| Cerved Information Solutions S.p.A. | 49,585 | 557,977 |
| Danieli & C Officine Meccaniche S.p.A. | 8,552 | 221,651 |
| Danieli & C Officine Meccaniche S.p.A. - RSP | 34,556 | 645,013 |
| Davide Campari-Milano S.p.A. | 139,216 | 1,006,324 |
| De'Longhi S.p.A. | 22,493 | 676,036 |
| DiaSorin S.p.A. | 5,653 | 486,589 |
| Enav S.p.A. | 32,731 | 144,682 |
| ERG S.p.A. | 82,681 | 1,295,586 |
| Esprinet S.p.A. | 64,489 | 476,893 |
| Ferrari N.V. | 27,759 | 3,171,556 |
| Hera S.p.A. | 678,376 | 2,167,928 |
| Interpump Group S.p.A. | 22,673 | 658,803 |
| Iren S.p.A. | 579,561 | 1,586,170 |
| Italgas S.p.A. | 220,045 | 1,241,084 |
| Italmobiliare S.p.A. | 51,697 | 1,450,516 |
| Leonardo S.p.A. | 141,987 | 2,398,765 |
| MARR S.p.A. | 19,148 | 479,432 |
| Moncler S.p.A. | 3,815 | 108,266 |
| OVS S.p.A. | 13,066 | 97,399 |
| Parmalat S.p.A. | 210,413 | 770,492 |
| Piaggio & C S.p.A. | 208,189 | 629,680 |
| PRADA S.p.A. | 292,823 | 1,064,444 |
| Recordati S.p.A. | 22,465 | 960,976 |
| Safilo Group S.p.A. *(a) | 60,638 | 393,264 |
| Salini Impregilo S.p.A | 150,502 | 527,849 |
| Saras S.p.A. | 449,624 | 1,106,534 |
| Societa Cattolica di Assicurazioni Scarl | 126,935 | 1,088,837 |
| Societa Iniziative Autostradali e Servizi S.p.A. | 77,707 | 1,159,442 |
| Tod's S.p.A. (a) | 12,277 | 876,497 |
| Trevi Finanziaria Industriale S.p.A. * | 423,085 | 372,979 |
| Unipol Gruppo Finanziario S.p.A. | 432,663 | 1,868,275 |
| UnipolSai Assicurazioni S.p.A. | 514,012 | 1,165,384 |
| | | 44,882,850 |
| |
| Japan 37.9% |
| ABC-Mart, Inc. | 10,649 | 546,673 |
| Acom Co., Ltd. * | 100,125 | 409,379 |
| Activia Properties, Inc. | 77 | 337,916 |
| Adastria Co., Ltd. | 22,847 | 503,813 |
| ADEKA Corp. | 75,065 | 1,276,091 |
| Advance Residence Investment Corp. | 258 | 659,886 |
| Advantest Corp. | 33,180 | 552,598 |
| Aeon Delight Co., Ltd. | 17,170 | 609,983 |
| AEON Financial Service Co., Ltd. | 60,396 | 1,279,148 |
| Aeon Mall Co., Ltd. | 64,034 | 1,149,656 |
| Aica Kogyo Co., Ltd. | 26,726 | 880,263 |
| Aichi Steel Corp. | 16,146 | 631,551 |
| Ain Holdings, Inc. | 9,092 | 668,311 |
| Aisan Industry Co., Ltd. | 53,511 | 478,419 |
| Akebono Brake Industry Co., Ltd. *(a) | 179,295 | 570,173 |
| Alpen Co., Ltd. | 26,787 | 534,231 |
| Alpine Electronics, Inc. | 68,373 | 1,261,105 |
| Security | Number
of Shares | Value ($) |
| Amada Holdings Co., Ltd. | 155,689 | 1,707,402 |
| Amano Corp. | 37,046 | 866,067 |
| Anritsu Corp. | 144,986 | 1,152,669 |
| AOKI Holdings, Inc. | 44,607 | 593,355 |
| Aoyama Trading Co., Ltd. | 41,170 | 1,507,497 |
| Aozora Bank Ltd. | 546,000 | 2,063,747 |
| Arata Corp. | 6,908 | 310,377 |
| Arcland Sakamoto Co., Ltd. | 36,232 | 513,885 |
| Asahi Diamond Industrial Co., Ltd. | 62,553 | 548,461 |
| Asahi Holdings, Inc. | 35,628 | 745,190 |
| Asatsu-DK, Inc. | 58,712 | 1,583,293 |
| Asics Corp. | 69,594 | 1,047,767 |
| ASKUL Corp. | 13,605 | 409,782 |
| Autobacs Seven Co., Ltd. | 105,480 | 1,738,513 |
| Avex Group Holdings, Inc. | 44,283 | 606,346 |
| Axial Retailing, Inc. | 13,326 | 544,252 |
| Azbil Corp. | 42,795 | 1,780,857 |
| Belc Co., Ltd. | 11,447 | 553,317 |
| Benesse Holdings, Inc. | 67,780 | 2,605,028 |
| Bic Camera, Inc. (a) | 88,959 | 1,059,652 |
| BML, Inc. | 16,343 | 349,550 |
| Bunka Shutter Co., Ltd. | 46,634 | 353,801 |
| Calbee, Inc. | 25,213 | 861,356 |
| Canon Electronics, Inc. | 26,767 | 536,021 |
| Canon Marketing Japan, Inc. | 59,631 | 1,366,973 |
| Capcom Co., Ltd. | 27,236 | 675,827 |
| Casio Computer Co., Ltd. | 112,516 | 1,588,678 |
| Cawachi Ltd. | 30,343 | 736,106 |
| Central Glass Co., Ltd. | 245,401 | 1,030,122 |
| Chiyoda Co., Ltd. | 31,057 | 787,007 |
| Chiyoda Corp. (a) | 147,597 | 767,086 |
| Chudenko Corp. | 19,154 | 522,097 |
| Chugoku Marine Paints Ltd. | 66,973 | 556,181 |
| Citizen Watch Co., Ltd. | 273,291 | 1,934,342 |
| CKD Corp. | 31,216 | 528,114 |
| Cocokara fine, Inc. | 31,516 | 1,741,026 |
| COMSYS Holdings Corp. | 91,121 | 1,957,206 |
| Cosmo Energy Holdings Co., Ltd. | 10,524 | 217,537 |
| Cosmos Pharmaceutical Corp. | 3,418 | 774,221 |
| Create SD Holdings Co., Ltd. | 16,980 | 440,622 |
| Credit Saison Co., Ltd. | 92,539 | 1,677,406 |
| CyberAgent, Inc. | 32,705 | 1,068,276 |
| Daido Steel Co., Ltd. | 280,843 | 1,668,829 |
| Daifuku Co., Ltd. | 33,693 | 1,464,846 |
| Daihen Corp. | 61,110 | 530,257 |
| Daiichikosho Co., Ltd. | 22,338 | 1,081,788 |
| Daikyo, Inc. | 306,381 | 598,509 |
| Daikyonishikawa Corp. | 7,432 | 115,808 |
| Dainichiseika Color & Chemicals Manufacturing Co., Ltd. | 12,768 | 125,174 |
| Daio Paper Corp. (a) | 78,704 | 963,956 |
| Daiseki Co., Ltd. | 18,407 | 439,018 |
| Daiwabo Holdings Co., Ltd. | 340,314 | 1,366,698 |
| DCM Holdings Co., Ltd. | 159,547 | 1,435,140 |
| DeNA Co., Ltd. | 66,779 | 1,427,078 |
| Descente Ltd. | 5,836 | 74,713 |
| Dexerials Corp. | 10,000 | 137,561 |
| Disco Corp. | 7,108 | 1,272,930 |
| DMG Mori Co., Ltd. | 66,575 | 1,085,791 |
| Doshisha Co., Ltd. | 25,502 | 524,823 |
| Doutor Nichires Holdings Co., Ltd. | 31,163 | 676,152 |
| DTS Corp. | 16,155 | 454,295 |
| Duskin Co., Ltd. | 47,326 | 1,365,256 |
| DyDo Group Holdings, Inc. | 12,368 | 624,805 |
| Dynam Japan Holdings Co., Ltd. | 451,732 | 698,395 |
| Eagle Industry Co., Ltd. | 28,448 | 505,581 |
| Earth Chemical Co., Ltd. | 8,485 | 406,287 |
| EDION Corp. | 193,674 | 1,860,017 |
Schwab Fundamental Index ETFs | Semiannual Report
Schwab Fundamental International Small Company Index ETF
Portfolio Holdings as of August 31, 2017 (Unaudited) (continued)
| Security | Number
of Shares | Value ($) |
| Eizo Corp. | 13,131 | 547,622 |
| Exedy Corp. | 38,520 | 1,153,220 |
| Ezaki Glico Co., Ltd. | 27,079 | 1,436,865 |
| FamilyMart UNY Holdings Co., Ltd. | 50,928 | 2,757,867 |
| Fancl Corp. | 30,904 | 726,410 |
| FCC Co., Ltd. | 42,519 | 919,455 |
| Foster Electric Co., Ltd. | 40,362 | 847,873 |
| FP Corp. | 12,001 | 620,441 |
| Frontier Real Estate Investment Corp. | 85 | 364,915 |
| Fuji Co., Ltd. | 22,633 | 562,021 |
| Fuji Machine Manufacturing Co., Ltd. | 48,488 | 853,805 |
| Fuji Oil Co., Ltd. | 224,972 | 768,576 |
| Fuji Oil Holdings, Inc. | 51,534 | 1,446,848 |
| Fuji Seal International, Inc. | 29,436 | 890,622 |
| Fuji Soft, Inc. | 23,939 | 715,603 |
| Fujikura Ltd. | 282,475 | 2,294,500 |
| Fujimori Kogyo Co., Ltd. | 19,182 | 678,847 |
| Fujitec Co., Ltd. | 43,790 | 631,824 |
| Fujitsu General Ltd. | 28,928 | 604,528 |
| Fukuda Corp. | 1,896 | 103,879 |
| Fukuoka Financial Group, Inc. | 379,059 | 1,663,506 |
| Fukuoka REIT Corp. | 54 | 80,612 |
| Fukuyama Transporting Co., Ltd. | 150,899 | 924,095 |
| Funai Electric Co., Ltd. (a) | 86,871 | 663,806 |
| Furukawa Co., Ltd. | 221,295 | 380,018 |
| Futaba Corp. | 25,946 | 479,504 |
| Futaba Industrial Co., Ltd. | 124,013 | 1,231,566 |
| Fuyo General Lease Co., Ltd. | 9,454 | 572,085 |
| G-Tekt Corp. | 33,043 | 636,181 |
| Geo Holdings Corp. | 102,443 | 1,449,244 |
| Glory Ltd. | 33,942 | 1,153,399 |
| GLP J-Reit | 84 | 89,602 |
| Godo Steel Ltd. | 21,345 | 406,110 |
| Gree, Inc. | 123,406 | 899,251 |
| GS Yuasa Corp. | 304,462 | 1,510,415 |
| GungHo Online Entertainment, Inc. | 256,469 | 766,657 |
| Gunze Ltd. | 200,642 | 895,105 |
| H2O Retailing Corp. | 107,159 | 1,931,705 |
| Hamakyorex Co., Ltd. | 3,716 | 96,462 |
| Hamamatsu Photonics K.K. | 38,276 | 1,184,170 |
| Hazama Ando Corp. | 88,164 | 620,817 |
| Heiwa Corp. | 35,795 | 712,908 |
| Heiwado Co., Ltd. | 49,738 | 1,160,071 |
| Hikari Tsushin, Inc. | 11,054 | 1,369,949 |
| Hirose Electric Co., Ltd. | 11,622 | 1,607,186 |
| HIS Co., Ltd. | 35,007 | 1,170,505 |
| Hisamitsu Pharmaceutical Co., Inc. | 22,259 | 1,069,872 |
| Hitachi Capital Corp. | 23,053 | 534,957 |
| Hitachi Chemical Co., Ltd. | 72,562 | 1,962,062 |
| Hitachi High-Technologies Corp. | 44,030 | 1,570,214 |
| Hitachi Kokusai Electric, Inc. | 27,000 | 685,671 |
| Hitachi Maxell Ltd. | 51,952 | 1,240,032 |
| Hitachi Transport System, Ltd. | 47,130 | 1,137,783 |
| Hitachi Zosen Corp. | 200,830 | 994,479 |
| Hogy Medical Co., Ltd. | 6,522 | 459,847 |
| Hokkaido Electric Power Co., Inc. | 210,210 | 1,600,545 |
| Hokuetsu Kishu Paper Co., Ltd. | 136,913 | 909,353 |
| Hokuhoku Financial Group, Inc. | 67,029 | 1,028,639 |
| Hokuto Corp. | 18,005 | 322,114 |
| Horiba Ltd. | 17,765 | 1,087,917 |
| Hoshizaki Corp. | 14,810 | 1,287,768 |
| Hosiden Corp. | 97,981 | 1,640,732 |
| House Foods Group, Inc. | 44,741 | 1,359,791 |
| Hulic Co., Ltd. | 41,235 | 408,004 |
| IDOM, Inc. | 92,061 | 599,743 |
| Inaba Denki Sangyo Co., Ltd. | 30,077 | 1,227,019 |
| Inabata & Co., Ltd. | 108,203 | 1,551,375 |
| Internet Initiative Japan, Inc. | 21,732 | 405,969 |
| Security | Number
of Shares | Value ($) |
| Iseki & Co., Ltd. | 22,290 | 459,936 |
| Ishihara Sangyo Kaisha Ltd. * | 43,850 | 591,254 |
| Ito En Ltd. | 36,188 | 1,331,650 |
| Itochu Enex Co., Ltd. | 130,882 | 1,308,106 |
| Itochu Techno-Solutions Corp. | 33,885 | 1,259,219 |
| Iwatani Corp. | 279,583 | 1,694,365 |
| Izumi Co., Ltd. | 22,581 | 1,181,779 |
| J-Oil Mills, Inc. | 3,192 | 115,719 |
| Jafco Co., Ltd. | 2,020 | 92,502 |
| Japan Airport Terminal Co., Ltd. | 17,551 | 636,276 |
| Japan Aviation Electronics Industry Ltd. | 61,478 | 1,016,068 |
| Japan Display, Inc. *(a) | 999,684 | 1,798,450 |
| Japan Excellent, Inc. | 349 | 418,889 |
| Japan Exchange Group, Inc. | 61,862 | 1,052,767 |
| Japan Petroleum Exploration Co., Ltd. | 51,131 | 980,251 |
| Japan Post Insurance Co., Ltd. | 41,888 | 901,243 |
| Japan Prime Realty Investment Corp. | 155 | 556,287 |
| Japan Real Estate Investment Corp. | 241 | 1,248,137 |
| Japan Retail Fund Investment Corp. | 174 | 319,827 |
| Joyful Honda Co., Ltd. | 23,849 | 665,241 |
| JVC Kenwood Corp. | 358,447 | 950,995 |
| Kadokawa Dwango * | 12,868 | 150,123 |
| Kaga Electronics Co., Ltd. | 6,808 | 181,551 |
| Kagome Co., Ltd. | 38,316 | 1,208,037 |
| Kakaku.com, Inc. | 7,232 | 89,956 |
| Kaken Pharmaceutical Co., Ltd. | 11,965 | 631,625 |
| Kamigumi Co., Ltd. | 204,440 | 2,260,617 |
| Kanamoto Co., Ltd. | 19,398 | 690,897 |
| Kandenko Co., Ltd. | 101,281 | 1,084,036 |
| Kanematsu Corp. | 954,197 | 2,245,475 |
| Kansai Paint Co., Ltd. | 71,050 | 1,800,458 |
| Kasai Kogyo Co., Ltd. | 32,205 | 460,573 |
| Kato Sangyo Co., Ltd. | 56,097 | 1,651,411 |
| Keihan Holdings Co., Ltd. | 187,815 | 1,131,395 |
| Keihin Corp. | 70,808 | 1,165,122 |
| Keikyu Corp. | 126,468 | 1,342,128 |
| Keisei Electric Railway Co., Ltd. | 48,065 | 1,307,965 |
| Kenedix Office Investment Corp. | 119 | 680,093 |
| KH Neochem Co., Ltd. | 5,512 | 141,932 |
| Kinden Corp. | 147,212 | 2,402,260 |
| Kintetsu World Express, Inc. | 60,715 | 983,047 |
| Kissei Pharmaceutical Co., Ltd. | 16,703 | 422,963 |
| Kitz Corp. | 87,414 | 702,108 |
| Kobayashi Pharmaceutical Co., Ltd. | 18,803 | 1,166,859 |
| Kohnan Shoji Co., Ltd. | 45,388 | 849,530 |
| Kokuyo Co., Ltd. | 82,382 | 1,308,411 |
| Komeri Co., Ltd. | 38,552 | 1,119,150 |
| Komori Corp. | 37,460 | 461,868 |
| Konami Holdings Corp. | 46,067 | 2,398,364 |
| Konishi Co., Ltd. | 7,432 | 129,314 |
| Konoike Transport Co., Ltd. | 39,142 | 554,802 |
| Kose Corp. | 7,667 | 961,336 |
| Kumagai Gumi Co., Ltd. | 204,377 | 638,794 |
| Kurabo Industries Ltd. | 311,850 | 801,868 |
| Kureha Corp. | 16,206 | 831,945 |
| Kurita Water Industries Ltd. | 74,264 | 2,135,613 |
| Kuroda Electric Co., Ltd. | 47,178 | 829,451 |
| KYB Corp. | 258,527 | 1,432,868 |
| Kyoei Steel Ltd. | 23,849 | 364,691 |
| Kyokuto Kaihatsu Kogyo Co., Ltd. | 4,664 | 71,066 |
| Kyokuyo Co., Ltd. | 2,968 | 90,609 |
| KYORIN Holdings, Inc. | 29,876 | 627,054 |
| Kyoritsu Maintenance Co., Ltd. | 12,120 | 336,973 |
| Kyowa Exeo Corp. | 90,526 | 1,702,606 |
| Kyudenko Corp. | 20,758 | 842,127 |
| Kyushu Financial Group, Inc. | 19,900 | 121,143 |
| Leopalace21 Corp. | 280,996 | 2,057,812 |
| Life Corp. | 14,443 | 364,159 |
Schwab Fundamental Index ETFs | Semiannual Report
Schwab Fundamental International Small Company Index ETF
Portfolio Holdings as of August 31, 2017 (Unaudited) (continued)
| Security | Number
of Shares | Value ($) |
| Lintec Corp. | 48,852 | 1,305,857 |
| Lion Corp. | 70,157 | 1,393,451 |
| Mabuchi Motor Co., Ltd. | 15,420 | 727,147 |
| Macnica Fuji Electronics Holdings, Inc. | 8,280 | 145,423 |
| Maeda Corp. | 82,720 | 1,009,385 |
| Maeda Road Construction Co., Ltd. | 59,855 | 1,201,886 |
| Makino Milling Machine Co., Ltd. | 77,571 | 609,658 |
| Mandom Corp. | 11,957 | 715,942 |
| Marudai Food Co., Ltd. | 109,025 | 518,082 |
| Maruha Nichiro Corp. | 29,324 | 849,932 |
| Marui Group Co., Ltd. | 127,134 | 1,777,751 |
| Maruichi Steel Tube Ltd. | 26,013 | 769,329 |
| McDonald's Holdings Co. Japan, Ltd. | 40,415 | 1,793,815 |
| Mebuki Financial Group, Inc. | 289,324 | 1,025,226 |
| Megmilk Snow Brand Co., Ltd. | 45,722 | 1,341,832 |
| Meidensha Corp. | 155,901 | 566,604 |
| Meitec Corp. | 12,310 | 568,188 |
| Ministop Co., Ltd. | 18,899 | 386,016 |
| Miraca Holdings, Inc. | 37,432 | 1,698,826 |
| Mirait Holdings Corp. | 104,332 | 1,240,874 |
| Misawa Homes Co., Ltd. | 62,676 | 541,567 |
| MISUMI Group, Inc. | 76,087 | 1,950,222 |
| Mitsuba Corp. | 35,340 | 512,472 |
| Mitsubishi Logistics Corp. | 65,869 | 795,982 |
| Mitsubishi Shokuhin Co., Ltd. | 37,039 | 1,110,564 |
| Mitsubishi UFJ Lease & Finance Co., Ltd. | 154,356 | 779,774 |
| Mitsui Engineering & Shipbuilding Co., Ltd. | 1,148,246 | 1,439,741 |
| Mitsui-Soko Holdings Co., Ltd. | 154,362 | 444,601 |
| Miura Co., Ltd. | 33,226 | 748,687 |
| Mixi, Inc. | 2,320 | 123,525 |
| Mizuno Corp. | 139,994 | 859,858 |
| Mochida Pharmaceutical Co., Ltd. | 9,034 | 690,314 |
| Mori Trust Sogo REIT, Inc. | 245 | 399,355 |
| Morinaga & Co., Ltd. | 10,960 | 627,367 |
| Morinaga Milk Industry Co., Ltd. | 212,965 | 1,679,571 |
| MOS Food Services, Inc. | 14,491 | 462,143 |
| Musashi Seimitsu Industry Co., Ltd. | 23,766 | 688,838 |
| Nabtesco Corp. | 54,642 | 1,908,945 |
| Nachi-Fujikoshi Corp. | 130,803 | 692,878 |
| Namura Shipbuilding Co., Ltd. | 87,505 | 522,359 |
| Nankai Electric Railway Co., Ltd. | 232,125 | 1,189,519 |
| NEC Networks & System Integration Corp. | 41,206 | 960,325 |
| NET One Systems Co., Ltd. | 121,139 | 1,234,944 |
| Nexon Co., Ltd. * | 50,122 | 1,249,179 |
| Nichi-iko Pharmaceutical Co., Ltd. (a) | 31,233 | 483,848 |
| Nichias Corp. | 73,360 | 858,511 |
| Nichicon Corp. | 47,924 | 558,663 |
| Nichiha Corp. | 18,280 | 665,195 |
| NichiiGakkan Co., Ltd. | 61,442 | 661,537 |
| Nichirei Corp. | 77,678 | 2,051,699 |
| Nifco, Inc. | 17,554 | 1,006,412 |
| Nihon Kohden Corp. | 42,758 | 990,668 |
| Nihon Parkerizing Co., Ltd. | 47,657 | 694,980 |
| Nihon Unisys Ltd. | 50,933 | 799,212 |
| Nikkiso Co., Ltd. | 44,210 | 403,297 |
| Nippo Corp. | 51,341 | 1,016,931 |
| Nippon Accommodations Fund, Inc. | 107 | 434,086 |
| Nippon Building Fund, Inc. | 308 | 1,637,107 |
| Nippon Densetsu Kogyo Co., Ltd. | 28,997 | 591,743 |
| Nippon Flour Mills Co., Ltd. | 68,069 | 1,079,852 |
| Nippon Gas Co., Ltd. | 15,337 | 514,206 |
| Nippon Holdings Co., Ltd. | 47,173 | 1,108,390 |
| Nippon Kayaku Co., Ltd. | 101,106 | 1,620,489 |
| Nippon Light Metal Holdings Co., Ltd. | 574,973 | 1,692,634 |
| Nippon Paint Holdings Co., Ltd. | 23,375 | 796,441 |
| Nippon Prologis REIT, Inc. | 219 | 475,170 |
| Nippon Seiki Co., Ltd. | 44,646 | 906,631 |
| Security | Number
of Shares | Value ($) |
| Nippon Sheet Glass Co., Ltd. * | 229,194 | 1,734,677 |
| Nippon Shinyaku Co., Ltd. | 7,441 | 517,206 |
| Nippon Shokubai Co., Ltd. | 24,228 | 1,725,854 |
| Nippon Signal Co., Ltd. | 47,347 | 501,605 |
| Nippon Soda Co., Ltd. | 132,681 | 760,692 |
| Nippon Steel & Sumikin Bussan Corp. | 31,844 | 1,715,745 |
| Nippon Suisan Kaisha Ltd. | 253,710 | 1,426,917 |
| Nipro Corp. | 91,537 | 1,209,293 |
| Nishi-Nippon Railroad Co., Ltd. | 247,658 | 1,199,361 |
| Nishimatsu Construction Co., Ltd. | 192,823 | 1,061,700 |
| Nishio Rent All Co., Ltd. | 15,715 | 531,163 |
| Nissan Chemical Industries Ltd. | 40,169 | 1,344,928 |
| Nissan Shatai Co., Ltd. | 153,150 | 1,729,652 |
| Nissha Printing Co., Ltd. (a) | 15,953 | 433,105 |
| Nisshin Steel Co., Ltd. | 116,960 | 1,519,651 |
| Nisshinbo Holdings, Inc. | 162,313 | 1,719,580 |
| Nissin Foods Holdings Co., Ltd. | 32,387 | 1,995,129 |
| Nissin Kogyo Co., Ltd. | 55,705 | 963,171 |
| Nitta Corp. | 15,682 | 557,832 |
| Nittetsu Mining Co., Ltd. | 9,576 | 669,955 |
| Nitto Kogyo Corp. | 29,645 | 533,050 |
| NOF Corp. | 88,537 | 1,253,322 |
| Nojima Corp. | 29,238 | 558,673 |
| Nomura Co., Ltd. | 22,481 | 485,938 |
| Nomura Real Estate Master Fund, Inc. | 73 | 96,374 |
| Nomura Research Institute Ltd. | 53,101 | 2,064,985 |
| Noritz Corp. | 35,204 | 615,734 |
| North Pacific Bank Ltd. | 435,484 | 1,309,697 |
| NS Solutions Corp. | 21,663 | 464,713 |
| NTN Corp. | 395,375 | 1,595,007 |
| NTT Urban Development Corp. | 53,898 | 521,056 |
| Obic Co., Ltd. | 12,836 | 803,562 |
| Ohsho Food Service Corp. | 9,446 | 374,630 |
| Oiles Corp. | 21,857 | 397,382 |
| Okamura Corp. | 52,115 | 528,916 |
| Okasan Securities Group, Inc. | 81,081 | 467,067 |
| Oki Electric Industry Co., Ltd. | 86,625 | 1,188,477 |
| OKUMA Corp. | 76,012 | 698,929 |
| Okumura Corp. | 100,471 | 751,296 |
| Ono Pharmaceutical Co., Ltd. | 79,296 | 1,614,595 |
| Onward Holdings Co., Ltd. | 161,934 | 1,187,359 |
| Oracle Corp. Japan | 9,790 | 723,176 |
| OSG Corp. | 31,103 | 654,503 |
| Otsuka Corp. | 32,908 | 2,176,724 |
| Pacific Industrial Co., Ltd. | 39,108 | 493,558 |
| PALTAC Corp. | 42,588 | 1,685,178 |
| PanaHome Corp. | 46,232 | 501,134 |
| Paramount Bed Holdings Co., Ltd. | 13,342 | 584,303 |
| Park24 Co., Ltd. | 35,662 | 856,393 |
| Penta-Ocean Construction Co., Ltd. | 160,214 | 960,760 |
| Persol Holdings Co., Ltd. | 58,945 | 1,196,467 |
| Pigeon Corp. | 22,917 | 885,988 |
| Pilot Corp. | 2,220 | 97,223 |
| Piolax, Inc. | 17,093 | 455,668 |
| Pioneer Corp. * | 642,658 | 1,197,028 |
| Plenus Co., Ltd. | 26,376 | 589,542 |
| Pola Orbis Holdings, Inc. | 31,588 | 1,014,570 |
| Press Kogyo Co., Ltd. | 167,737 | 879,377 |
| Prima Meat Packers Ltd. | 150,493 | 931,181 |
| Raito Kogyo Co., Ltd. | 7,656 | 76,240 |
| Rakuten, Inc. | 147,114 | 1,745,024 |
| Relia, Inc. | 46,796 | 521,704 |
| Relo Group, Inc. | 30,484 | 692,163 |
| Renesas Electronics Corp. * | 58,587 | 590,341 |
| Rengo Co., Ltd. | 257,153 | 1,483,665 |
| Resorttrust, Inc. | 28,531 | 533,239 |
| Riken Corp. | 2,120 | 100,356 |
| Rinnai Corp. | 16,580 | 1,438,661 |
Schwab Fundamental Index ETFs | Semiannual Report
Schwab Fundamental International Small Company Index ETF
Portfolio Holdings as of August 31, 2017 (Unaudited) (continued)
| Security | Number
of Shares | Value ($) |
| Riso Kagaku Corp. | 22,145 | 419,520 |
| Rohto Pharmaceutical Co., Ltd. | 52,943 | 1,227,608 |
| Round One Corp. | 91,543 | 1,045,517 |
| Royal Holdings Co., Ltd. | 22,985 | 582,039 |
| Ryobi Ltd. | 166,548 | 836,826 |
| Ryohin Keikaku Co., Ltd. | 7,162 | 1,984,745 |
| Ryosan Co., Ltd. | 35,333 | 1,478,361 |
| Ryoyo Electro Corp. | 31,818 | 535,696 |
| Saizeriya Co., Ltd. | 24,892 | 704,512 |
| Sakai Chemical Industry Co., Ltd. | 119,217 | 574,096 |
| Sakata INX Corp. | 37,004 | 655,959 |
| San-A Co., Ltd. | 14,441 | 634,402 |
| Sanden Holdings Corp. * | 195,891 | 614,050 |
| Sangetsu Corp. | 46,847 | 836,402 |
| Sanken Electric Co., Ltd. | 140,144 | 714,345 |
| Sanki Engineering Co., Ltd. | 48,611 | 538,405 |
| Sankyo Co., Ltd. | 36,987 | 1,206,463 |
| Sankyo Tateyama, Inc. | 45,364 | 650,825 |
| Sankyu, Inc. | 248,859 | 1,946,825 |
| Sanrio Co., Ltd. (a) | 30,602 | 558,043 |
| Santen Pharmaceutical Co., Ltd. | 118,455 | 1,836,128 |
| Sanwa Holdings Corp. | 112,702 | 1,255,430 |
| Sanyo Chemical Industries Ltd. | 13,269 | 695,640 |
| Sanyo Shokai Ltd. | 33,508 | 497,779 |
| Sanyo Special Steel Co., Ltd. | 121,162 | 653,918 |
| Sapporo Holdings Ltd. | 57,256 | 1,662,120 |
| Sato Holdings Corp. | 22,145 | 528,373 |
| Sawai Pharmaceutical Co., Ltd. | 16,737 | 913,950 |
| SBI Holdings, Inc. | 78,543 | 1,090,439 |
| SCREEN Holdings Co., Ltd. | 12,815 | 827,863 |
| SCSK Corp. | 16,746 | 724,250 |
| Seiko Holdings Corp. | 172,317 | 781,266 |
| Seiren Co., Ltd. | 31,625 | 560,894 |
| Senko Group Holdings Co., Ltd. | 97,476 | 704,102 |
| Senshu Ikeda Holdings, Inc. | 87,270 | 325,102 |
| Seria Co., Ltd. | 10,284 | 562,508 |
| Seven Bank Ltd. | 221,175 | 837,997 |
| Sharp Corp. *(a) | 1,663,560 | 4,987,959 |
| Shikoku Electric Power Co., Inc. | 194,660 | 2,532,738 |
| Shimachu Co., Ltd. | 52,691 | 1,357,250 |
| Shimadzu Corp. | 93,757 | 1,721,633 |
| Shindengen Electric Manufacturing Co., Ltd. | 97,508 | 638,772 |
| Shinko Electric Industries Co., Ltd. | 99,099 | 691,514 |
| Shinko Plantech Co., Ltd. | 57,630 | 489,064 |
| Shinmaywa Industries Ltd. | 104,243 | 901,684 |
| Shinsei Bank Ltd. | 505,190 | 807,863 |
| Ship Healthcare Holdings, Inc. | 31,990 | 976,616 |
| Shizuoka Gas Co., Ltd. | 97,587 | 774,064 |
| SHO-BOND Holdings Co., Ltd. | 1,596 | 88,312 |
| Showa Corp. * | 126,270 | 1,435,251 |
| Showa Sangyo Co., Ltd. | 27,656 | 153,281 |
| Siix Corp. | 11,663 | 482,691 |
| Sintokogio Ltd. | 51,309 | 545,444 |
| SKY Perfect JSAT Holdings, Inc. | 166,365 | 755,792 |
| Skylark Co., Ltd. | 68,762 | 1,007,751 |
| Sohgo Security Services Co., Ltd. | 28,370 | 1,238,578 |
| Sony Financial Holdings, Inc. | 75,689 | 1,197,985 |
| Sotetsu Holdings, Inc. | 189,678 | 920,298 |
| Square Enix Holdings Co., Ltd. | 27,653 | 971,096 |
| St Marc Holdings Co., Ltd. | 13,740 | 410,727 |
| Starts Corp., Inc. | 4,040 | 100,688 |
| Starzen Co., Ltd. | 3,192 | 149,942 |
| Sugi Holdings Co., Ltd. | 25,955 | 1,370,149 |
| Sumco Corp. | 86,085 | 1,263,977 |
| Sumitomo Bakelite Co., Ltd. | 176,168 | 1,294,929 |
| Sumitomo Dainippon Pharma Co., Ltd. | 66,860 | 907,585 |
| Sumitomo Mitsui Construction Co., Ltd. | 441,535 | 489,435 |
| Security | Number
of Shares | Value ($) |
| Sumitomo Osaka Cement Co., Ltd. | 327,079 | 1,465,109 |
| Sumitomo Riko Co., Ltd. | 61,563 | 590,123 |
| Sundrug Co., Ltd. | 38,124 | 1,577,820 |
| Suruga Bank Ltd. | 33,904 | 724,534 |
| Sysmex Corp. | 26,935 | 1,659,270 |
| T-Gaia Corp. | 29,389 | 576,511 |
| Tachi-S Co., Ltd. | 47,305 | 808,474 |
| Tadano Ltd. | 55,714 | 649,980 |
| Taihei Dengyo Kaisha Ltd. | 37,464 | 500,723 |
| Taikisha Ltd. | 24,641 | 624,645 |
| Taisho Pharmaceutical Holdings Co., Ltd. | 19,609 | 1,528,668 |
| Taiyo Nippon Sanso Corp. | 80,098 | 933,725 |
| Taiyo Yuden Co., Ltd. | 106,127 | 1,603,573 |
| Takara Holdings, Inc. | 89,045 | 862,457 |
| Takara Standard Co., Ltd. | 34,748 | 601,760 |
| Takasago International Corp. | 3,068 | 108,994 |
| Takasago Thermal Engineering Co., Ltd. | 40,468 | 667,358 |
| Takuma Co., Ltd. | 40,265 | 456,576 |
| Tamron Co., Ltd. | 25,485 | 455,933 |
| The 77 Bank Ltd. | 105,563 | 492,039 |
| The Awa Bank Ltd. | 56,150 | 345,900 |
| The Bank of Kyoto Ltd. | 76,745 | 709,156 |
| The Chiba Bank Ltd. | 279,753 | 1,870,781 |
| The Chugoku Bank Ltd. | 53,663 | 722,593 |
| The Daishi Bank Ltd. | 111,860 | 506,145 |
| The Gunma Bank Ltd. | 140,677 | 823,151 |
| The Hachijuni Bank Ltd. | 138,821 | 845,085 |
| The Hiroshima Bank Ltd. | 161,128 | 647,089 |
| The Hokkoku Bank Ltd. | 124,959 | 541,572 |
| The Hyakugo Bank Ltd. | 89,474 | 372,334 |
| The Hyakujushi Bank Ltd. | 23,392 | 81,402 |
| The Iyo Bank Ltd. | 99,122 | 750,215 |
| The Japan Steel Works Ltd. | 59,345 | 1,204,047 |
| The Japan Wool Textile Co., Ltd. | 47,267 | 405,845 |
| The Juroku Bank Ltd. | 156,537 | 480,733 |
| The Keiyo Bank Ltd. | 104,629 | 459,166 |
| The Kiyo Bank Ltd. | 45,721 | 741,107 |
| The Musashino Bank Ltd. | 15,449 | 439,355 |
| The Nippon Road Co., Ltd. | 95,771 | 532,545 |
| The Nisshin Oillio Group Ltd. | 206,119 | 1,475,757 |
| The Ogaki Kyoritsu Bank Ltd. | 129,236 | 348,747 |
| The Okinawa Electric Power Co., Inc. | 42,996 | 958,679 |
| The San-In Godo Bank Ltd. | 50,240 | 417,221 |
| The Shiga Bank Ltd. | 82,231 | 432,598 |
| The Shizuoka Bank Ltd. | 191,793 | 1,674,660 |
| The Sumitomo Warehouse Co., Ltd. | 111,860 | 736,857 |
| THK Co., Ltd. | 65,327 | 2,178,358 |
| TIS, Inc. | 78,004 | 2,299,864 |
| TKC Corp. | 14,151 | 414,013 |
| Toa Corp. | 18,014 | 333,732 |
| Toagosei Co., Ltd. | 106,487 | 1,338,102 |
| Toda Corp. | 142,685 | 1,024,179 |
| Toei Co., Ltd. | 36,543 | 435,289 |
| Toho Co., Ltd. | 43,765 | 1,624,387 |
| Toho Holdings Co., Ltd. | 82,238 | 1,609,492 |
| Toho Zinc Co., Ltd. | 166,443 | 763,708 |
| Tokai Carbon Co., Ltd. | 192,424 | 1,388,194 |
| TOKAI Holdings Corp. | 79,709 | 618,494 |
| Tokai Rika Co., Ltd. | 67,887 | 1,279,898 |
| Tokai Tokyo Financial Holdings, Inc. | 89,439 | 514,400 |
| Token Corp. | 7,250 | 999,955 |
| Tokuyama Corp. * | 307,013 | 1,355,700 |
| Tokyo Broadcasting System Holdings, Inc. | 31,420 | 602,364 |
| Tokyo Century Corp. | 17,111 | 740,813 |
| Tokyo Dome Corp. | 44,643 | 422,660 |
| Tokyo Ohka Kogyo Co., Ltd. | 21,679 | 758,351 |
| Tokyo Seimitsu Co., Ltd. | 18,541 | 635,947 |
| Tokyo Steel Manufacturing Co., Ltd. | 73,954 | 625,579 |
Schwab Fundamental Index ETFs | Semiannual Report
Schwab Fundamental International Small Company Index ETF
Portfolio Holdings as of August 31, 2017 (Unaudited) (continued)
| Security | Number
of Shares | Value ($) |
| Tokyo Tatemono Co., Ltd. | 78,410 | 964,630 |
| Tokyu Construction Co., Ltd. | 11,048 | 89,540 |
| Tomy Co., Ltd. | 54,691 | 729,975 |
| Topcon Corp. | 35,056 | 618,242 |
| Toppan Forms Co., Ltd. | 79,617 | 838,416 |
| Topre Corp. | 19,230 | 555,619 |
| Topy Industries Ltd. | 24,619 | 833,234 |
| Toshiba Machine Co., Ltd. | 125,925 | 606,399 |
| Toshiba Plant Systems & Services Corp. | 26,350 | 452,973 |
| Toshiba TEC Corp. | 177,192 | 998,174 |
| Totetsu Kogyo Co., Ltd. | 15,317 | 500,315 |
| Toyo Ink SC Holdings Co., Ltd. | 214,856 | 1,222,059 |
| Toyo Kohan Co., Ltd. | 120,103 | 587,093 |
| Toyo Tire & Rubber Co., Ltd. | 92,042 | 1,772,933 |
| Toyobo Co., Ltd. | 904,168 | 1,634,830 |
| Toyota Boshoku Corp. | 72,137 | 1,425,568 |
| TPR Co., Ltd. | 15,132 | 458,525 |
| Trancom Co., Ltd. | 7,021 | 352,772 |
| Transcosmos, Inc. | 27,602 | 593,119 |
| Trend Micro, Inc. | 36,669 | 1,695,850 |
| Trusco Nakayama Corp. | 34,040 | 797,957 |
| TS Tech Co., Ltd. | 54,439 | 1,701,528 |
| TSI Holdings Co., Ltd. | 107,716 | 781,005 |
| Tsubakimoto Chain Co. | 91,092 | 715,096 |
| Tsumura & Co. | 34,209 | 1,288,355 |
| Tsuruha Holdings, Inc. | 16,987 | 2,020,351 |
| TV Asahi Holdings Corp. | 24,249 | 488,902 |
| UACJ Corp. | 242,885 | 655,432 |
| UKC Holdings Corp. | 53,698 | 940,666 |
| Ulvac, Inc. | 12,706 | 698,449 |
| Unipres Corp. | 66,971 | 1,713,523 |
| United Arrows Ltd. | 22,577 | 752,840 |
| United Super Markets Holdings, Inc. | 22,544 | 227,570 |
| United Urban Investment Corp. | 563 | 848,643 |
| Ushio, Inc. | 83,478 | 1,132,406 |
| USS Co., Ltd. | 66,540 | 1,306,496 |
| Valor Holdings Co., Ltd. | 55,441 | 1,197,880 |
| Vital KSK Holdings, Inc. | 91,867 | 750,395 |
| VT Holdings Co., Ltd. | 15,960 | 87,587 |
| Wacoal Holdings Corp. | 100,945 | 1,438,141 |
| Wacom Co., Ltd. | 147,119 | 680,389 |
| Wakita & Co., Ltd. | 43,672 | 507,113 |
| Warabeya Nichiyo Holdings Co., Ltd. | 26,765 | 670,219 |
| Welcia Holdings Co., Ltd. | 21,923 | 859,511 |
| Xebio Holdings Co., Ltd. | 56,150 | 1,106,572 |
| Yahoo Japan Corp. | 361,056 | 1,653,391 |
| Yakult Honsha Co., Ltd. | 29,852 | 2,066,802 |
| YAMABIKO Corp. | 6,908 | 79,210 |
| Yamaguchi Financial Group, Inc. | 89,474 | 1,011,318 |
| Yamato Kogyo Co., Ltd. | 32,240 | 911,016 |
| Yamazen Corp. | 80,943 | 820,756 |
| Yaoko Co., Ltd. | 14,446 | 687,780 |
| Yaskawa Electric Corp. | 91,882 | 2,780,002 |
| Yellow Hat Ltd. | 19,646 | 544,433 |
| Yodogawa Steel Works Ltd. | 24,768 | 692,001 |
| Yokohama Reito Co., Ltd. | 57,770 | 556,389 |
| Yorozu Corp. | 40,362 | 796,898 |
| Yoshinoya Holdings Co., Ltd. (a) | 63,611 | 1,082,531 |
| Yuasa Trading Co., Ltd. | 25,568 | 861,869 |
| Yurtec Corp. | 57,881 | 431,767 |
| Yusen Logistics Co., Ltd. | 37,415 | 353,889 |
| Zensho Holdings Co., Ltd. | 47,164 | 894,342 |
| Zeon Corp. | 140,037 | 1,763,504 |
| | | 509,558,544 |
| |
| Security | Number
of Shares | Value ($) |
| Luxembourg 0.6% |
| APERAM S.A. | 37,583 | 1,980,995 |
| Espirito Santo Financial Group S.A. *(b) | 8,470 | — |
| Eurofins Scientific SE | 872 | 497,729 |
| IWG plc | 225,994 | 875,361 |
| L'Occitane International S.A. | 200,991 | 465,340 |
| Samsonite International S.A. | 439,290 | 1,801,737 |
| Ternium S.A. ADR | 65,706 | 1,999,434 |
| | | 7,620,596 |
| |
| Netherlands 2.4% |
| Aalberts Industries N.V. | 52,561 | 2,335,554 |
| Accell Group | 3,449 | 105,752 |
| Altice N.V., A Shares * | 36,483 | 840,166 |
| Altice N.V., B Shares * | 9,135 | 210,967 |
| Arcadis N.V. | 84,745 | 1,838,748 |
| ASM International N.V. | 22,053 | 1,294,684 |
| ASR Nederland N.V. | 8,555 | 331,118 |
| BE Semiconductor Industries N.V. | 10,730 | 694,613 |
| Beter Bed Holding N.V. | 20,060 | 361,556 |
| Brunel International N.V. (a) | 26,309 | 350,322 |
| Corbion N.V. | 52,565 | 1,582,361 |
| Core Laboratories N.V. | 9,178 | 809,316 |
| Eurocommercial Properties N.V. | 17,734 | 759,022 |
| Euronext N.V. | 14,142 | 811,668 |
| ForFarmers N.V. | 10,499 | 130,502 |
| Fugro N.V. CVA * | 123,072 | 1,560,505 |
| GrandVision N.V. | 2,960 | 72,705 |
| HAL Trust | 7,845 | 1,534,278 |
| IMCD Group N.V. | 11,553 | 678,595 |
| InterXion Holding N.V. * | 10,857 | 562,935 |
| Koninklijke BAM Groep N.V. | 281,760 | 1,687,651 |
| Koninklijke Vopak N.V. | 30,109 | 1,272,747 |
| Nostrum Oil & Gas plc * | 80,534 | 393,089 |
| NSI N.V. | 14,453 | 556,735 |
| OCI N.V. * | 37,430 | 709,116 |
| Philips Lighting N.V. | 12,765 | 470,465 |
| PostNL N.V. | 297,730 | 1,183,679 |
| Refresco Group N.V. | 25,609 | 497,344 |
| SBM Offshore N.V. | 84,832 | 1,356,019 |
| Sligro Food Group N.V. | 6,805 | 299,509 |
| TKH Group N.V. | 21,108 | 1,242,719 |
| TomTom N.V. * | 41,925 | 436,838 |
| Vastned Retail N.V. | 11,870 | 548,472 |
| VEON Ltd. ADR | 541,481 | 2,285,050 |
| Wereldhave N.V. | 12,817 | 626,592 |
| Wessanen | 5,208 | 90,741 |
| Yandex N.V., Class A * | 40,022 | 1,201,060 |
| | | 31,723,193 |
| |
| New Zealand 1.0% |
| Air New Zealand Ltd. | 618,934 | 1,582,512 |
| Auckland International Airport Ltd. | 147,020 | 714,958 |
| Chorus Ltd. | 363,864 | 1,042,398 |
| EBOS Group Ltd. | 9,576 | 118,101 |
| Fisher & Paykel Healthcare Corp., Ltd. | 93,695 | 789,818 |
| Fonterra Co-operative Group Ltd. | 123,005 | 547,077 |
| Genesis Energy Ltd. | 350,320 | 615,958 |
| Infratil Ltd. | 626,801 | 1,414,082 |
| Kiwi Property Group Ltd. | 435,877 | 421,436 |
| Mainfreight Ltd. | 42,938 | 760,194 |
| Mercury NZ Ltd. | 349,634 | 861,403 |
| Meridian Energy Ltd. | 489,737 | 1,034,711 |
| SKY Network Television Ltd. | 408,624 | 831,145 |
| SKYCITY Entertainment Group Ltd. | 335,561 | 913,249 |
Schwab Fundamental Index ETFs | Semiannual Report
Schwab Fundamental International Small Company Index ETF
Portfolio Holdings as of August 31, 2017 (Unaudited) (continued)
| Security | Number
of Shares | Value ($) |
| Trade Me Group Ltd. | 26,387 | 87,877 |
| Z Energy Ltd. | 208,604 | 1,153,385 |
| | | 12,888,304 |
| |
| Norway 1.4% |
| Aker A.S.A., A Shares | 16,744 | 602,623 |
| Aker Solutions A.S.A. * | 202,498 | 944,575 |
| Atea A.S.A. * | 102,374 | 1,348,784 |
| Austevoll Seafood A.S.A. | 74,980 | 773,427 |
| Bakkafrost P/F | 10,240 | 476,735 |
| Borregaard A.S.A. | 47,439 | 551,840 |
| BW LPG Ltd. *(a) | 110,793 | 454,146 |
| Fred. Olsen Energy A.S.A. *(a) | 533,755 | 626,385 |
| Gjensidige Forsikring A.S.A. | 107,769 | 1,881,146 |
| Kongsberg Automotive A.S.A. * | 609,264 | 622,589 |
| Kongsberg Gruppen A.S.A. | 10,635 | 172,925 |
| Leroy Seafood Group A.S.A. | 115,781 | 767,920 |
| Petroleum Geo-Services A.S.A. *(a) | 659,732 | 1,243,169 |
| REC Silicon A.S.A. *(a) | 8,091,267 | 1,078,510 |
| Salmar A.S.A. | 16,680 | 482,400 |
| Schibsted A.S.A., B Shares | 29,178 | 667,581 |
| Schibsted A.S.A., Class A | 24,455 | 592,526 |
| SpareBank 1 Nord Norge | 17,418 | 137,690 |
| SpareBank 1 SMN | 81,124 | 849,837 |
| SpareBank 1 SR-Bank A.S.A. | 17,008 | 181,998 |
| Storebrand A.S.A. | 183,218 | 1,511,931 |
| TGS Nopec Geophysical Co. A.S.A. | 80,381 | 1,719,236 |
| Tomra Systems A.S.A. | 42,106 | 633,226 |
| Veidekke A.S.A. | 50,942 | 658,068 |
| XXL A.S.A. | 32,306 | 322,859 |
| | | 19,302,126 |
| |
| Portugal 0.5% |
| Banco Comercial Portugues S.A. * | 6,986,141 | 1,855,520 |
| Banco Espirito Santo S.A. *(b) | 45,383 | — |
| CTT-Correios de Portugal S.A. | 121,402 | 751,551 |
| Mota-Engil, SGPS, S.A. | 207,574 | 598,946 |
| NOS, SGPS S.A. | 110,477 | 706,511 |
| REN - Redes Energeticas Nacionais, SGPS, S.A. | 238,629 | 783,028 |
| Semapa-Sociedade de Investimento e Gestao | 33,100 | 597,176 |
| Sonae, SGPS, S.A. | 1,023,112 | 1,144,611 |
| The Navigator Co. S.A. | 227,998 | 971,774 |
| | | 7,409,117 |
| |
| Singapore 2.0% |
| Ascendas Real Estate Investment Trust | 557,626 | 1,092,257 |
| Ascott Residence Trust | 85,136 | 73,663 |
| Asian Pay Television Trust | 214,460 | 90,016 |
| CapitaLand Commercial Trust | 470,685 | 603,087 |
| CapitaLand Mall Trust | 699,854 | 1,118,323 |
| China Aviation Oil Singapore Corp., Ltd. | 283,636 | 333,137 |
| City Developments Ltd. | 270,542 | 2,332,877 |
| CWT Ltd. | 42,568 | 71,156 |
| Fortune Real Estate Investment Trust (b) | 83,116 | 99,296 |
| Genting Singapore plc | 2,511,682 | 2,191,711 |
| Global Logistic Properties Ltd. | 555,102 | 1,324,397 |
| Kulicke & Soffa Industries, Inc. * | 41,236 | 784,721 |
| M1 Ltd. | 263,784 | 347,698 |
| Mapletree Greater China Commercial Trust | 544,977 | 451,472 |
| Mapletree Industrial Trust | 314,344 | 429,387 |
| Mapletree Logistics Trust | 467,924 | 423,819 |
| SATS Ltd. | 265,696 | 945,001 |
| Security | Number
of Shares | Value ($) |
| Sembcorp Marine Ltd. (a) | 1,083,519 | 1,268,627 |
| Singapore Exchange Ltd. | 199,118 | 1,099,694 |
| Singapore Post Ltd. (a) | 704,997 | 654,121 |
| Singapore Technologies Engineering Ltd. | 734,146 | 1,973,220 |
| StarHub Ltd. | 351,249 | 675,081 |
| Suntec Real Estate Investment Trust | 480,039 | 669,863 |
| United Engineers Ltd. | 307,574 | 613,789 |
| UOL Group Ltd. | 190,362 | 1,146,658 |
| Venture Corp., Ltd. | 212,890 | 2,476,923 |
| Wing Tai Holdings Ltd. | 380,922 | 597,470 |
| Yangzijiang Shipbuilding Holdings Ltd. | 2,023,542 | 2,227,684 |
| Yanlord Land Group Ltd. | 393,275 | 501,006 |
| | | 26,616,154 |
| |
| Spain 1.7% |
| Acerinox S.A. | 130,336 | 1,856,378 |
| Almirall S.A. (a) | 21,292 | 218,207 |
| Applus Services S.A. | 42,849 | 549,422 |
| Bankia S.A. | 331,014 | 1,609,195 |
| Bankinter S.A. | 206,849 | 1,969,841 |
| Bolsas y Mercados Espanoles SHMSF S.A. (a) | 27,329 | 983,516 |
| Cellnex Telecom SAU | 25,701 | 573,382 |
| Cia de Distribucion Integral Logista Holdings S.A. | 4,004 | 99,063 |
| Construcciones y Auxiliar de Ferrocarriles S.A. | 11,328 | 471,375 |
| Ebro Foods S.A. | 46,060 | 1,096,857 |
| EDP Renovaveis S.A. | 57,306 | 468,333 |
| Ence Energia y Celulosa S.A. | 132,355 | 578,286 |
| Fomento de Construcciones y Contratas S.A. * | 66,699 | 701,632 |
| Grupo Catalana Occidente S.A. | 18,709 | 789,631 |
| Indra Sistemas S.A. * | 59,620 | 937,062 |
| Mediaset Espana Comunicacion S.A. | 73,294 | 848,736 |
| Melia Hotels International S.A. | 37,498 | 550,357 |
| NH Hotel Group S.A. | 77,323 | 502,853 |
| Obrascon Huarte Lain S.A. *(a) | 388,488 | 1,652,582 |
| Prosegur Cia de Seguridad S.A. | 146,726 | 997,811 |
| Sacyr S.A. *(a) | 331,310 | 932,348 |
| Siemens Gamesa Renewable Energy S.A. | 49,287 | 735,103 |
| Talgo S.A. | 20,176 | 118,161 |
| Tecnicas Reunidas S.A. | 18,433 | 639,260 |
| Vidrala S.A. | 8,080 | 623,449 |
| Viscofan S.A. | 18,677 | 1,125,797 |
| Zardoya Otis S.A. | 60,591 | 623,837 |
| | | 22,252,474 |
| |
| Sweden 2.3% |
| AAK AB | 9,544 | 699,847 |
| AddTech AB, B Shares | 5,441 | 106,326 |
| AF AB, B Shares | 34,153 | 744,234 |
| Axfood AB | 59,692 | 1,054,710 |
| Bergman & Beving Aktiebolag | 24,666 | 290,604 |
| Betsson AB * | 80,296 | 748,737 |
| Bilia AB, B Shares | 68,016 | 707,311 |
| BillerudKorsnas AB | 75,548 | 1,257,970 |
| Bonava AB, B Shares | 52,675 | 857,909 |
| Capio AB | 124,347 | 698,513 |
| Castellum AB | 67,797 | 1,059,894 |
| Clas Ohlson AB, B Shares | 31,963 | 634,653 |
| Com Hem Holding AB | 43,782 | 651,447 |
| Elekta AB, B Shares | 99,114 | 1,024,478 |
| Eltel AB *(a) | 29,086 | 86,995 |
| Fabege AB | 29,884 | 598,630 |
| Haldex AB * | 5,790 | 78,766 |
Schwab Fundamental Index ETFs | Semiannual Report
Schwab Fundamental International Small Company Index ETF
Portfolio Holdings as of August 31, 2017 (Unaudited) (continued)
| Security | Number
of Shares | Value ($) |
| Hemfosa Fastigheter AB | 8,916 | 109,470 |
| Hexpol AB | 63,554 | 620,976 |
| Holmen AB, B Shares | 18,464 | 806,097 |
| ICA Gruppen AB | 29,264 | 1,165,066 |
| Indutrade AB | 30,415 | 739,988 |
| Intrum Justitia AB (a) | 25,443 | 829,091 |
| Inwido AB | 29,792 | 382,820 |
| JM AB | 47,263 | 1,514,583 |
| Kindred Group plc | 8,220 | 90,336 |
| L E Lundbergfortagen AB, B Shares | 18,941 | 1,465,084 |
| Lindab International AB | 38,553 | 396,317 |
| Loomis AB, B Shares | 33,038 | 1,203,216 |
| Mekonomen AB | 19,732 | 422,792 |
| Modern Times Group MTG AB, B Shares | 31,486 | 1,139,571 |
| Momentum Group AB, Class B * | 21,728 | 234,145 |
| NCC AB, B Shares | 64,729 | 1,686,280 |
| Nibe Industrier AB, B Shares | 79,863 | 734,161 |
| Nobia AB | 67,826 | 657,603 |
| Nolato AB, B Shares | 13,857 | 596,432 |
| Peab AB | 160,569 | 1,841,307 |
| Ratos AB, B Shares | 263,773 | 1,232,787 |
| Saab AB, Class B | 23,717 | 1,080,437 |
| SAS AB *(a) | 171,190 | 421,663 |
| Sweco AB, B Shares | 3,290 | 82,774 |
| Wihlborgs Fastigheter AB | 17,961 | 435,406 |
| | | 31,189,426 |
| |
| Switzerland 3.0% |
| Allreal Holding AG * | 5,620 | 1,007,039 |
| ALSO Holding AG * | 688 | 89,275 |
| Arbonia AG * | 31,399 | 560,346 |
| Autoneum Holding AG | 1,347 | 341,866 |
| Banque Cantonale Vaudoise | 877 | 631,969 |
| Barry Callebaut AG * | 702 | 1,008,075 |
| Belimo Holding AG | 134 | 524,984 |
| Bell Food Group AG | 265 | 121,332 |
| BKW AG | 8,277 | 479,739 |
| Bucher Industries AG | 3,796 | 1,332,155 |
| Burckhardt Compression Holding AG (a) | 1,376 | 402,706 |
| Cembra Money Bank AG * | 8,132 | 706,579 |
| Conzzeta AG | 696 | 713,382 |
| Daetwyler Holding AG | 3,461 | 541,299 |
| DKSH Holding AG | 16,085 | 1,315,589 |
| dormakaba Holding AG * | 868 | 780,839 |
| Dufry AG * | 10,207 | 1,569,817 |
| Emmi AG * | 1,005 | 669,826 |
| EMS-Chemie Holding AG | 1,466 | 999,962 |
| Flughafen Zuerich AG | 4,637 | 1,133,918 |
| Forbo Holding AG | 468 | 710,035 |
| GAM Holding AG * | 141,367 | 2,169,785 |
| Helvetia Holding AG | 2,684 | 1,534,712 |
| Huber & Suhner AG | 1,822 | 107,784 |
| Implenia AG | 8,601 | 585,333 |
| Inficon Holding AG * | 941 | 534,637 |
| Kudelski S.A. | 22,197 | 285,258 |
| Logitech International S.A. | 38,751 | 1,375,035 |
| Metall Zug AG, B Shares | 33 | 135,983 |
| Mobimo Holding AG * | 2,182 | 602,264 |
| OC Oerlikon Corp. AG * | 116,460 | 1,623,896 |
| Oriflame Holding AG | 15,027 | 548,026 |
| Panalpina Welttransport Holding AG | 7,654 | 1,005,135 |
| Partners Group Holding AG | 2,241 | 1,450,470 |
| PSP Swiss Property AG | 4,386 | 401,632 |
| Rieter Holding AG * | 362 | 77,259 |
| Schmolz & Bickenbach AG * | 992,962 | 940,266 |
| Schweiter Technologies AG | 431 | 538,638 |
| SFS Group AG * | 5,643 | 641,223 |
| Security | Number
of Shares | Value ($) |
| Sonova Holding AG | 12,908 | 2,177,302 |
| Straumann Holding AG | 1,021 | 652,866 |
| Sulzer AG | 8,532 | 941,095 |
| Sunrise Communications Group AG * | 16,375 | 1,400,650 |
| Tecan Group AG | 488 | 97,346 |
| Temenos Group AG * | 6,393 | 629,321 |
| Valiant Holding AG | 6,028 | 657,372 |
| Valora Holding AG | 3,079 | 926,744 |
| Vifor Pharma AG | 12,950 | 1,305,780 |
| Wizz Air Holdings plc * | 21,077 | 799,826 |
| Zehnder Group AG | 12,026 | 422,975 |
| | | 40,209,345 |
| |
| United Kingdom 10.9% |
| AA plc | 328,947 | 678,184 |
| Ashmore Group plc | 172,587 | 819,496 |
| ASOS plc * | 2,443 | 178,393 |
| Atlantica Yield plc | 6,157 | 127,819 |
| Auto Trader Group plc | 20,897 | 95,159 |
| AVEVA Group plc | 25,516 | 633,900 |
| Avon Products, Inc. * | 701,969 | 1,747,903 |
| B&M European Value Retail S.A. | 145,725 | 699,270 |
| BBA Aviation plc | 424,655 | 1,651,417 |
| BCA Marketplace plc | 31,991 | 77,497 |
| Beazley plc | 55,610 | 366,164 |
| Berendsen plc | 142,797 | 2,327,614 |
| Bodycote plc | 133,162 | 1,640,361 |
| Bovis Homes Group plc | 69,709 | 946,740 |
| Brewin Dolphin Holdings plc | 87,352 | 401,267 |
| Britvic plc | 105,821 | 1,030,167 |
| BTG plc * | 12,866 | 115,469 |
| Cape plc | 30,463 | 103,726 |
| Card Factory plc | 133,576 | 572,641 |
| Centamin plc | 339,833 | 663,406 |
| Chemring Group plc | 296,764 | 676,840 |
| Cineworld Group plc | 59,181 | 493,769 |
| Close Brothers Group plc | 52,308 | 1,041,353 |
| Coats Group plc | 1,298,392 | 1,321,704 |
| Computacenter plc | 103,255 | 1,361,094 |
| Conviviality plc | 167,386 | 884,310 |
| Costain Group plc | 13,470 | 77,541 |
| Countrywide plc | 190,257 | 340,766 |
| Cranswick plc | 30,697 | 1,182,683 |
| Crest Nicholson Holdings plc | 88,008 | 616,911 |
| Daily Mail & General Trust plc, A Shares | 137,334 | 1,103,357 |
| Dairy Crest Group plc | 123,379 | 946,726 |
| Dart Group plc | 11,755 | 78,234 |
| De La Rue plc | 71,661 | 573,424 |
| Dechra Pharmaceuticals plc | 3,678 | 90,663 |
| Derwent London plc | 19,279 | 691,600 |
| Dialog Semiconductor plc * | 12,744 | 578,554 |
| Diploma plc | 38,773 | 541,077 |
| Domino's Pizza Group plc | 95,983 | 334,428 |
| Dunelm Group plc | 43,041 | 324,167 |
| EI Group plc * | 792,060 | 1,441,610 |
| Electrocomponents plc | 237,130 | 1,932,629 |
| Elementis plc | 257,762 | 895,448 |
| EnQuest plc * | 2,034,173 | 661,836 |
| Essentra plc | 158,428 | 1,090,121 |
| esure Group plc | 131,201 | 460,686 |
| Evraz plc | 513,592 | 2,218,317 |
| Fenner plc | 229,487 | 1,014,270 |
| Ferrexpo plc | 39,000 | 150,409 |
| Fidessa Group plc | 18,288 | 494,394 |
| Galliford Try plc | 55,687 | 998,837 |
| Genus plc | 16,584 | 398,110 |
| Go-Ahead Group plc | 32,526 | 754,824 |
Schwab Fundamental Index ETFs | Semiannual Report
Schwab Fundamental International Small Company Index ETF
Portfolio Holdings as of August 31, 2017 (Unaudited) (continued)
| Security | Number
of Shares | Value ($) |
| Grafton Group plc | 176,666 | 1,789,274 |
| Grainger plc | 114,957 | 378,319 |
| Greencore Group plc | 217,070 | 573,396 |
| Greggs plc | 73,733 | 1,142,954 |
| Halfords Group plc | 254,660 | 1,059,571 |
| Halma plc | 93,759 | 1,320,488 |
| Hammerson plc | 216,047 | 1,561,753 |
| Hargreaves Lansdown plc | 26,791 | 483,302 |
| Hays plc | 879,208 | 2,073,214 |
| Headlam Group plc | 64,863 | 523,624 |
| Hill & Smith Holdings plc | 28,995 | 480,095 |
| HomeServe plc | 97,507 | 918,448 |
| Howden Joinery Group plc | 202,662 | 1,112,457 |
| Hunting plc * | 131,837 | 683,252 |
| IG Group Holdings plc | 184,098 | 1,530,066 |
| Indivior plc * | 273,358 | 1,467,413 |
| Intermediate Capital Group plc | 171,985 | 1,967,908 |
| International Personal Finance plc | 361,473 | 907,099 |
| Interserve plc | 360,439 | 781,427 |
| Intu Properties plc | 382,212 | 1,225,338 |
| J.D. Wetherspoon plc | 52,746 | 742,187 |
| James Fisher & Sons plc | 4,630 | 92,413 |
| Janus Henderson Group plc | 82,599 | 2,854,621 |
| Jardine Lloyd Thompson Group plc | 12,122 | 180,409 |
| JD Sports Fashion plc | 92,587 | 386,661 |
| John Laing Group plc | 31,154 | 119,226 |
| John Menzies plc | 75,888 | 691,343 |
| Jupiter Fund Management plc | 181,768 | 1,256,575 |
| KAZ Minerals plc * | 281,721 | 3,051,113 |
| KCOM Group plc | 350,013 | 451,009 |
| Keller Group plc | 76,143 | 810,913 |
| Kier Group plc | 49,376 | 748,212 |
| Ladbrokes Coral Group plc | 851,239 | 1,299,784 |
| Laird plc | 378,780 | 689,409 |
| Lancashire Holdings Ltd. | 182,526 | 1,616,958 |
| London Stock Exchange Group plc | 39,959 | 2,033,823 |
| Lookers plc | 441,132 | 622,421 |
| Marshalls plc | 73,714 | 416,316 |
| Marston's plc | 502,112 | 747,281 |
| McCarthy & Stone plc | 92,179 | 196,458 |
| Mears Group plc | 19,868 | 111,364 |
| Melrose Industries plc | 641,222 | 1,817,743 |
| Merlin Entertainments plc | 187,315 | 1,113,416 |
| Micro Focus International plc | 29,335 | 859,185 |
| Mitchells & Butlers plc | 244,526 | 781,093 |
| Mitie Group plc | 479,429 | 1,661,797 |
| Moneysupermarket.com Group plc | 164,217 | 676,068 |
| Morgan Advanced Materials plc | 230,547 | 891,511 |
| Morgan Sindall Group plc | 9,925 | 160,756 |
| N Brown Group plc | 217,685 | 917,229 |
| National Express Group plc | 368,780 | 1,705,938 |
| NEX Group plc | 174,814 | 1,493,451 |
| Nomad Foods Ltd. * | 14,575 | 218,917 |
| Northgate plc | 204,206 | 1,060,676 |
| Novae Group plc | 55,383 | 506,326 |
| Ocado Group plc *(a) | 56,816 | 226,805 |
| Pagegroup plc | 226,840 | 1,492,165 |
| PayPoint plc | 23,851 | 282,899 |
| Pendragon plc | 2,787,647 | 1,149,447 |
| Petra Diamonds Ltd. * | 53,036 | 64,342 |
| Pets at Home Group plc | 222,590 | 523,157 |
| Playtech plc | 69,746 | 853,777 |
| Polypipe Group plc | 14,955 | 76,272 |
| Premier Foods plc * | 266,017 | 142,252 |
| Premier Oil plc *(a) | 2,010,226 | 1,437,604 |
| PZ Cussons plc | 112,231 | 496,030 |
| QinetiQ Group plc | 385,189 | 1,141,571 |
| Randgold Resources Ltd. | 19,194 | 1,956,335 |
| Security | Number
of Shares | Value ($) |
| Rathbone Brothers plc | 3,056 | 109,471 |
| Redrow plc | 14,531 | 116,182 |
| Renewi plc | 68,565 | 81,944 |
| Renishaw plc | 2,082 | 122,871 |
| Rentokil Initial plc | 467,667 | 1,834,955 |
| Rightmove plc | 7,630 | 405,260 |
| Rotork plc | 371,508 | 1,097,196 |
| RPC Group plc | 82,201 | 981,880 |
| RPS Group plc | 248,734 | 925,462 |
| Saga plc | 418,666 | 1,094,050 |
| Savills plc | 68,317 | 779,505 |
| Schroders plc | 37,583 | 1,631,041 |
| Schroders plc, Non-Voting Shares | 2,667 | 84,161 |
| Segro plc | 210,194 | 1,457,149 |
| Senior plc | 335,986 | 1,188,839 |
| Serco Group plc * | 762,797 | 1,156,876 |
| Shaftesbury plc | 27,955 | 359,134 |
| SIG plc | 1,276,901 | 2,930,370 |
| Soco International plc | 198,733 | 304,732 |
| Spirax-Sarco Engineering plc | 25,589 | 1,853,066 |
| Spire Healthcare Group plc | 112,549 | 470,751 |
| Spirent Communications plc | 550,714 | 690,108 |
| Sports Direct International plc *(a) | 264,883 | 1,324,302 |
| SSP Group plc | 87,039 | 620,212 |
| ST Modwen Properties plc | 21,515 | 98,001 |
| St. James's Place plc | 94,759 | 1,407,833 |
| Stagecoach Group plc | 401,738 | 865,009 |
| Stolt-Nielsen Ltd. | 9,065 | 135,745 |
| SuperGroup plc | 4,312 | 88,344 |
| Synthomer plc | 116,093 | 707,419 |
| TalkTalk Telecom Group plc (a) | 483,185 | 1,250,820 |
| Telecom Plus plc | 28,197 | 396,032 |
| The Paragon Group of Cos. plc | 102,231 | 539,433 |
| The Restaurant Group plc | 177,188 | 791,114 |
| The Unite Group plc | 14,388 | 128,480 |
| Thomas Cook Group plc | 1,173,223 | 1,898,766 |
| TP ICAP plc | 147,595 | 938,746 |
| Tullow Oil plc * | 850,729 | 1,711,179 |
| Tyman plc | 18,395 | 80,708 |
| UBM plc | 143,530 | 1,227,114 |
| Ultra Electronics Holdings plc | 31,125 | 741,963 |
| Vedanta Resources plc | 175,176 | 1,924,289 |
| Vertu Motors plc | 819,834 | 459,533 |
| Vesuvius plc | 196,536 | 1,463,765 |
| Victrex plc | 38,764 | 1,017,468 |
| WH Smith plc | 63,554 | 1,514,193 |
| Worldpay Group plc | 33,259 | 178,709 |
| | | 146,636,121 |
| Total Common Stock |
| (Cost $1,154,545,466) | | 1,337,682,758 |
|
| Preferred Stock 0.1% of net assets |
| |
| Germany 0.1% |
| Sartorius AG | 881 | 87,397 |
| Schaeffler AG | 42,724 | 601,407 |
| | | 688,804 |
| |
| Sweden 0.0% |
| SAS AB | 7,640 | 520,385 |
| Total Preferred Stock |
| (Cost $1,215,927) | | 1,209,189 |
|
Schwab Fundamental Index ETFs | Semiannual Report
Schwab Fundamental International Small Company Index ETF
Portfolio Holdings as of August 31, 2017 (Unaudited) (continued)
| Security | Number
of Shares | Value ($) |
| Other Investment Companies 3.3% of net assets |
| |
| United States 3.3% |
| Money Market Fund 0.2% |
| State Street Institutional U.S. Government Money Market Fund, Premier Class 0.93% (c) | 2,638,859 | 2,638,859 |
| Securities Lending Collateral 3.1% |
| Wells Fargo Government Money Market Fund, Select Class 0.92% (c) | 41,240,693 | 41,240,693 |
| Total Other Investment Companies |
| (Cost $43,879,552) | | 43,879,552 |
| | Number of
Contracts | Notional
Amount
($) | Current Value/
Unrealized
Appreciation
($) |
| Futures Contracts | | | |
| Long | |
| MSCI EAFE Index, e-mini, expires 09/15/17 | 36 | 3,482,640 | 17,840 |
| * | Non-income producing security. |
| (a) | All or a portion of this security is on loan. Securities on loan were valued at $39,283,192. |
| (b) | Fair-valued by management in accordance with procedures approved by the Board of Trustees. |
| (c) | The rate shown is the 7-day yield. |
| | |
| ADR — | American Depositary Receipt |
| CDI — | CHESS Depositary Interest |
| CVA — | Dutch Certificate |
| REIT — | Real Estate Investment Trust |
| RSP — | Risparmio (Convertible Savings Shares) |
Schwab Fundamental Index ETFs | Semiannual Report
Schwab Fundamental Emerging Markets Large Company Index ETF
Portfolio Holdings as of August 31, 2017 (Unaudited)
This section shows all the securities in the fund's portfolio and their values as of the report date.
The fund files its complete schedule of portfolio holdings with the SEC for the first and third quarters of each fiscal year on Form N-Q. The fund's Form N-Q is available on the SEC's website at www.sec.gov and may be viewed and copied at the SEC's Public Reference Room in Washington, D.C. Call 1-800-SEC-0330 for information on the operation of the Public Reference Room. The fund also makes available its complete schedule of portfolio holdings on a daily basis on the fund's website at www.schwabfunds.com/schwabetfs_prospectus.
| Security | Number
of Shares | Value ($) |
| Common Stock 89.9% of net assets |
| |
| Brazil 5.9% |
| Ambev S.A. | 1,303,666 | 8,228,577 |
| B3 SA - Brasil Bolsa Balcao | 348,873 | 2,452,628 |
| Banco Bradesco S.A. | 397,235 | 4,071,518 |
| Banco do Brasil S.A. | 1,000,807 | 9,764,902 |
| BRF S.A. * | 253,404 | 3,424,411 |
| CCR S.A. | 318,620 | 1,768,058 |
| Centrais Eletricas Brasileiras S.A. * | 186,946 | 1,046,890 |
| Cielo S.A. | 214,476 | 1,528,928 |
| Companhia de Saneamento Basico do Estado de Sao Paulo | 202,363 | 2,067,718 |
| Companhia Siderurgica Nacional S.A. * | 657,503 | 1,815,920 |
| CPFL Energia S.A. | 192,064 | 1,653,614 |
| Embraer S.A. | 399,374 | 2,275,827 |
| Gerdau S.A. | 27,976 | 104,650 |
| Itau Unibanco Holding S.A. | 68,228 | 773,473 |
| JBS S.A. | 715,322 | 1,971,060 |
| Petroleo Brasileiro S.A. * | 3,646,808 | 16,191,552 |
| Tim Participacoes S.A. | 667,859 | 2,394,270 |
| Ultrapar Participacoes S.A. | 208,102 | 4,857,885 |
| Vale S.A. | 2,061,472 | 22,983,501 |
| | | 89,375,382 |
| |
| Chile 0.6% |
| Cencosud S.A. | 753,406 | 2,264,870 |
| Empresas COPEC S.A. | 242,055 | 3,089,934 |
| Enel Americas S.A. | 10,077,106 | 2,173,880 |
| Latam Airlines Group S.A. | 150,611 | 1,888,437 |
| | | 9,417,121 |
| |
| China 17.4% |
| Agricultural Bank of China Ltd., H Shares | 10,938,505 | 5,143,290 |
| Alibaba Group Holding Ltd. ADR * | 18,344 | 3,150,399 |
| Anhui Conch Cement Co., Ltd., H Shares | 490,453 | 1,829,850 |
| Baidu, Inc. ADR * | 14,980 | 3,416,189 |
| Bank of China Ltd., H Shares | 36,962,224 | 19,457,655 |
| Bank of Communications Co., Ltd., H Shares | 3,140,954 | 2,399,927 |
| China CITIC Bank Corp., Ltd., H Shares | 3,241,638 | 2,141,363 |
| China Communications Construction Co., Ltd., H Shares | 1,598,534 | 2,128,261 |
| China Construction Bank Corp., H Shares | 44,439,398 | 38,951,794 |
| China Evergrande Group * | 1,822,941 | 5,508,571 |
| China Life Insurance Co., Ltd., H Shares | 931,810 | 2,988,383 |
| China Merchants Bank Co., Ltd., H Shares | 1,033,268 | 3,894,666 |
| China Minsheng Banking Corp., Ltd., H Shares | 2,022,882 | 2,018,630 |
| China Mobile Ltd. | 2,381,011 | 25,250,773 |
| China National Building Material Co., Ltd., H Shares | 5,376,201 | 3,379,682 |
| China Overseas Land & Investment Ltd. | 942,028 | 3,291,973 |
| Security | Number
of Shares | Value ($) |
| China Pacific Insurance (Group) Co., Ltd., H Shares | 453,502 | 2,135,266 |
| China Petroleum & Chemical Corp., H Shares | 31,545,477 | 24,143,438 |
| China Railway Construction Corp., Ltd., H Shares | 972,757 | 1,275,225 |
| China Railway Group Ltd., H Shares | 1,752,695 | 1,401,896 |
| China Resources Beer Holdings Co., Ltd. | 816,351 | 2,048,583 |
| China Resources Land Ltd. | 634,203 | 1,981,264 |
| China Resources Power Holdings Co., Ltd. | 1,135,181 | 2,082,834 |
| China Shenhua Energy Co., Ltd., H Shares | 2,174,187 | 5,597,668 |
| China Telecom Corp., Ltd., H Shares | 10,120,494 | 5,198,319 |
| China Unicom (Hong Kong) Ltd. * | 4,227,937 | 6,158,409 |
| CITIC Ltd. | 1,230,965 | 1,890,538 |
| CNOOC Ltd. | 12,316,657 | 14,730,038 |
| Dongfeng Motor Group Co., Ltd., H Shares | 1,502,104 | 1,949,974 |
| Haier Electronics Group Co., Ltd. * | 651,440 | 1,731,302 |
| Hengan International Group Co., Ltd. | 142,722 | 1,192,625 |
| Huaneng Power International, Inc., H Shares | 2,678,257 | 1,752,094 |
| Industrial & Commercial Bank of China Ltd., H Shares | 32,906,062 | 24,638,185 |
| JD.com, Inc. ADR * | 41,856 | 1,754,185 |
| Jiangxi Copper Co., Ltd., H Shares | 1,200,186 | 2,082,493 |
| Kingboard Chemical Holdings Ltd. | 412,897 | 2,252,707 |
| Kunlun Energy Co., Ltd. | 1,805,591 | 1,748,734 |
| Lenovo Group Ltd. | 4,117,900 | 2,251,929 |
| PetroChina Co., Ltd., H Shares | 17,232,381 | 11,009,066 |
| PICC Property & Casualty Co., Ltd., H Shares | 1,290,637 | 2,424,134 |
| Ping An Insurance Group Co. of China Ltd., H Shares | 693,642 | 5,508,225 |
| Postal Savings Bank of China Co., Ltd., Class H | 618,308 | 372,891 |
| Shimao Property Holdings Ltd. | 781,512 | 1,613,661 |
| Sinopharm Group Co., Ltd., H Shares | 331,666 | 1,498,047 |
| Tencent Holdings Ltd. | 136,133 | 5,722,615 |
| The People's Insurance Co. Group of China Ltd., H Shares | 2,423,774 | 1,142,756 |
| | | 264,240,507 |
| |
| Colombia 0.5% |
| Bancolombia S.A. | 109,938 | 1,231,989 |
| Ecopetrol S.A. | 9,003,220 | 4,188,547 |
| Grupo Argos S.A. | 190,627 | 1,358,109 |
| | | 6,778,645 |
| |
| Czech Republic 0.2% |
| CEZ A/S | 177,474 | 3,360,669 |
| |
Schwab Fundamental Index ETFs | Semiannual Report
Schwab Fundamental Emerging Markets Large Company Index ETF
Portfolio Holdings as of August 31, 2017 (Unaudited) (continued)
| Security | Number
of Shares | Value ($) |
| Greece 1.0% |
| Alpha Bank AE * | 1,386,060 | 3,509,997 |
| Hellenic Telecommunications Organization S.A. | 154,622 | 1,966,981 |
| HOLDING Co. ADMIE IPTO S.A. * | 76,728 | 189,742 |
| National Bank of Greece S.A. * | 12,310,776 | 4,990,970 |
| Piraeus Bank S.A. * | 570,919 | 3,196,985 |
| Public Power Corp. S.A. * | 477,763 | 1,278,027 |
| | | 15,132,702 |
| |
| Hungary 0.5% |
| MOL Hungarian Oil & Gas plc | 45,448 | 4,212,165 |
| OTP Bank plc | 93,319 | 3,792,515 |
| | | 8,004,680 |
| |
| India 4.7% |
| Bharat Petroleum Corp., Ltd. | 263,278 | 2,178,668 |
| Bharti Airtel Ltd. | 554,738 | 3,711,487 |
| Coal India Ltd. | 537,474 | 1,995,993 |
| HCL Technologies Ltd. | 86,242 | 1,167,364 |
| Hero MotoCorp Ltd. | 23,098 | 1,443,520 |
| Hindalco Industries Ltd. | 598,652 | 2,228,805 |
| Housing Development Finance Corp., Ltd. | 152,463 | 4,237,876 |
| ICICI Bank Ltd. ADR | 393,093 | 3,683,281 |
| Indian Oil Corp., Ltd. | 581,056 | 4,132,984 |
| Infosys Ltd. | 428,949 | 6,139,370 |
| ITC Ltd. | 412,503 | 1,821,301 |
| Mahindra & Mahindra Ltd. GDR | 81,561 | 1,700,547 |
| NTPC Ltd. | 828,006 | 2,185,738 |
| Oil & Natural Gas Corp., Ltd. | 1,586,833 | 3,895,949 |
| Reliance Industries Ltd. GDR | 328,994 | 16,268,753 |
| State Bank of India | 660,621 | 2,870,299 |
| Tata Consultancy Services Ltd. | 79,588 | 3,107,949 |
| Tata Motors Ltd. * | 177,363 | 606,921 |
| Tata Motors Ltd. ADR * | 95,110 | 2,839,985 |
| Tata Steel Ltd. | 219,372 | 2,189,559 |
| Vedanta Ltd. | 597,939 | 2,889,319 |
| | | 71,295,668 |
| |
| Indonesia 1.3% |
| Golden Agri-Resources Ltd. | 6,246,275 | 1,816,847 |
| PT Astra International Tbk | 6,997,116 | 4,129,987 |
| PT Bank Central Asia Tbk | 1,407,792 | 1,999,525 |
| PT Bank Mandiri (Persero) Tbk | 2,108,393 | 2,070,151 |
| PT Bank Rakyat Indonesia (Persero) Tbk | 2,326,541 | 2,637,456 |
| PT Perusahaan Gas Negara (Persero) Tbk | 8,172,102 | 1,298,520 |
| PT Telekomunikasi Indonesia (Persero) Tbk | 13,405,146 | 4,712,197 |
| PT United Tractors Tbk | 800,996 | 1,819,081 |
| | | 20,483,764 |
| |
| Malaysia 2.0% |
| Axiata Group Berhad | 3,001,700 | 3,465,257 |
| CIMB Group Holdings Berhad | 1,538,552 | 2,550,743 |
| DiGi.com Berhad | 1,049,800 | 1,189,798 |
| Genting Berhad | 1,141,500 | 2,595,472 |
| Malayan Banking Berhad | 2,110,100 | 4,674,288 |
| Maxis Berhad | 1,084,000 | 1,467,163 |
| Petronas Chemicals Group Berhad | 983,200 | 1,648,452 |
| Public Bank Berhad | 687,200 | 3,314,909 |
| Sime Darby Berhad | 1,132,540 | 2,386,807 |
| Security | Number
of Shares | Value ($) |
| Telekom Malaysia Berhad | 982,600 | 1,479,480 |
| Tenaga Nasional Berhad | 1,487,100 | 4,972,670 |
| | | 29,745,039 |
| |
| Mexico 3.2% |
| Alfa S.A.B. de C.V., A Shares | 1,686,483 | 2,368,471 |
| America Movil S.A.B. de C.V., Series L | 15,706,204 | 14,646,287 |
| Cemex S.A.B. de C.V., Series CPO * | 5,784,247 | 5,423,112 |
| Coca-Cola Femsa S.A.B. de C.V., Series L | 194,409 | 1,598,336 |
| Fomento Economico Mexicano S.A.B. de C.V. | 508,462 | 5,104,662 |
| Grupo Bimbo S.A.B. de C.V., Series A | 673,188 | 1,637,007 |
| Grupo Financiero Banorte S.A.B. de C.V., O Shares | 458,792 | 3,138,456 |
| Grupo Financiero Santander Mexico S.A.B. de C.V., B Shares | 927,924 | 1,917,518 |
| Grupo Mexico S.A.B. de C.V., Series B | 1,417,276 | 4,686,945 |
| Grupo Televisa S.A.B., Series CPO | 703,852 | 3,650,620 |
| Wal-Mart de Mexico S.A.B. de C.V. | 2,136,715 | 5,213,883 |
| | | 49,385,297 |
| |
| Peru 0.1% |
| Credicorp Ltd. | 9,822 | 1,992,294 |
| |
| Philippines 0.2% |
| PLDT, Inc. | 71,104 | 2,403,946 |
| |
| Poland 2.6% |
| Bank Pekao S.A. | 59,951 | 2,146,619 |
| KGHM Polska Miedz S.A. | 207,610 | 7,326,250 |
| Orange Polska S.A. * | 1,544,424 | 2,588,879 |
| PGE S.A. | 1,127,360 | 4,501,994 |
| Polski Koncern Naftowy Orlen S.A. | 310,504 | 10,244,703 |
| Polskie Gornictwo Naftowe i Gazownictwo S.A. | 1,089,698 | 2,082,789 |
| Powszechna Kasa Oszczednosci Bank Polski S.A. * | 359,432 | 3,689,474 |
| Powszechny Zaklad Ubezpieczen S.A. | 347,973 | 4,722,866 |
| Tauron Polska Energia S.A. * | 2,602,053 | 2,854,438 |
| | | 40,158,012 |
| |
| Republic of Korea 18.1% |
| CJ Corp. | 8,943 | 1,403,788 |
| Daelim Industrial Co., Ltd. | 20,555 | 1,527,589 |
| Dongbu Insurance Co., Ltd. | 21,788 | 1,453,049 |
| E-MART, Inc. | 14,480 | 2,876,481 |
| GS Holdings Corp. | 31,282 | 1,958,593 |
| Hana Financial Group, Inc. | 100,705 | 4,376,148 |
| Hankook Tire Co., Ltd. | 34,864 | 1,824,207 |
| Hyosung Corp. | 11,421 | 1,605,382 |
| Hyundai Engineering & Construction Co., Ltd. | 49,116 | 1,770,633 |
| Hyundai Glovis Co., Ltd. | 10,922 | 1,501,339 |
| Hyundai Heavy Industries Co., Ltd. * | 28,777 | 3,789,805 |
| Hyundai Marine & Fire Insurance Co., Ltd. | 39,800 | 1,630,685 |
| Hyundai Mobis Co., Ltd. | 35,294 | 7,386,825 |
| Hyundai Motor Co. | 104,517 | 13,022,915 |
| Hyundai Steel Co. | 64,000 | 3,274,920 |
| Hyundai Wia Corp. | 17,098 | 1,061,422 |
| Industrial Bank of Korea | 135,386 | 1,794,981 |
| KB Financial Group, Inc. | 123,496 | 6,067,469 |
Schwab Fundamental Index ETFs | Semiannual Report
Schwab Fundamental Emerging Markets Large Company Index ETF
Portfolio Holdings as of August 31, 2017 (Unaudited) (continued)
| Security | Number
of Shares | Value ($) |
| Kia Motors Corp. | 284,183 | 8,934,274 |
| Korea Electric Power Corp. | 166,021 | 6,316,336 |
| Korea Gas Corp. * | 40,000 | 1,606,953 |
| Korea Zinc Co., Ltd. | 3,069 | 1,404,402 |
| Korean Air Lines Co., Ltd. * | 50,482 | 1,486,345 |
| KT&G Corp. | 35,432 | 3,597,875 |
| LG Chem Ltd. | 27,306 | 9,177,877 |
| LG Corp. | 46,156 | 3,438,368 |
| LG Display Co., Ltd. | 266,490 | 7,361,798 |
| LG Electronics, Inc. | 133,775 | 9,668,910 |
| LG Uplus Corp. | 152,725 | 1,869,107 |
| Lotte Chemical Corp. | 8,180 | 2,898,111 |
| Lotte Shopping Co., Ltd. | 8,070 | 1,839,296 |
| NAVER Corp. | 1,692 | 1,132,902 |
| POSCO | 73,675 | 22,443,564 |
| S-Oil Corp. | 35,003 | 3,895,775 |
| Samsung Electro-Mechanics Co., Ltd. | 44,123 | 3,952,131 |
| Samsung Electronics Co., Ltd. | 38,964 | 80,028,932 |
| Samsung Fire & Marine Insurance Co., Ltd. | 9,850 | 2,415,329 |
| Samsung Heavy Industries Co., Ltd. * | 229,733 | 2,179,978 |
| Samsung Life Insurance Co., Ltd. | 21,782 | 2,231,129 |
| Samsung SDI Co., Ltd. | 18,620 | 3,244,794 |
| Samsung SDS Co., Ltd. | 10,119 | 1,503,133 |
| Shinhan Financial Group Co., Ltd. | 169,535 | 7,818,216 |
| SK Hynix, Inc. | 189,392 | 11,522,074 |
| SK Innovation Co., Ltd. | 68,720 | 11,487,868 |
| SK Networks Co., Ltd. | 343,559 | 2,135,818 |
| Woori Bank | 122,719 | 2,024,276 |
| | | 275,941,802 |
| |
| Russia 10.1% |
| Bashneft PJSC | 6,288 | 236,037 |
| Gazprom PJSC | 25,715,131 | 52,236,148 |
| LUKOIL PJSC | 729,810 | 36,952,325 |
| Magnit PJSC | 21,380 | 3,975,962 |
| MMC Norilsk Nickel PJSC | 37,708 | 6,356,630 |
| Mobile TeleSystems PJSC | 1,202,344 | 5,589,891 |
| NOVATEK PJSC | 513,225 | 5,296,182 |
| Rosneft Oil Co. PJSC | 686,441 | 3,593,251 |
| Rostelecom PJSC | 1,826,722 | 2,107,454 |
| Sberbank of Russia PJSC | 2,985,500 | 9,433,819 |
| Severstal PJSC | 84,004 | 1,316,292 |
| Sistema PJSC | 12,229,608 | 2,474,355 |
| Surgutneftegas OJSC | 33,531,917 | 15,589,525 |
| Tatneft PJSC | 1,131,969 | 7,562,703 |
| VTB Bank PJSC | 734,550,000 | 816,820 |
| | | 153,537,394 |
| |
| South Africa 5.9% |
| AngloGold Ashanti Ltd. | 258,506 | 2,618,573 |
| Barclays Africa Group Ltd. | 205,375 | 2,344,569 |
| Barloworld Ltd. | 274,618 | 2,715,015 |
| Bid Corp., Ltd. | 115,357 | 2,622,125 |
| FirstRand Ltd. | 1,048,657 | 4,480,240 |
| Gold Fields Ltd. | 858,670 | 3,831,726 |
| Impala Platinum Holdings Ltd. * | 708,997 | 2,192,859 |
| Imperial Holdings Ltd. | 208,309 | 3,343,522 |
| MMI Holdings Ltd. | 603,861 | 966,828 |
| MTN Group Ltd. | 1,710,761 | 17,009,551 |
| Naspers Ltd., N Shares | 15,263 | 3,453,589 |
| Nedbank Group Ltd. | 100,781 | 1,704,845 |
| Remgro Ltd. | 77,548 | 1,296,792 |
| Sanlam Ltd. | 480,883 | 2,656,465 |
| Sappi Ltd. | 216,491 | 1,455,766 |
| Sasol Ltd. | 525,032 | 15,829,932 |
| Security | Number
of Shares | Value ($) |
| Shoprite Holdings Ltd. | 173,384 | 3,006,657 |
| Standard Bank Group Ltd. | 600,822 | 7,739,614 |
| Steinhoff International Holdings N.V. | 499,843 | 2,417,398 |
| Telkom S.A. SOC Ltd. | 262,720 | 1,268,575 |
| The Bidvest Group Ltd. | 179,399 | 2,366,452 |
| Tiger Brands Ltd. | 57,445 | 1,781,138 |
| Vodacom Group Ltd. | 143,413 | 2,003,644 |
| Woolworths Holdings Ltd. | 291,562 | 1,331,124 |
| | | 90,436,999 |
| |
| Taiwan 12.2% |
| Acer, Inc. * | 4,788,470 | 2,411,768 |
| Advanced Semiconductor Engineering, Inc. | 2,650,910 | 3,197,360 |
| Asustek Computer, Inc. | 583,176 | 4,830,975 |
| AU Optronics Corp. | 11,332,371 | 4,656,264 |
| Catcher Technology Co., Ltd. | 160,000 | 2,035,853 |
| Cathay Financial Holding Co., Ltd. | 1,522,840 | 2,485,167 |
| Cheng Shin Rubber Industry Co., Ltd. | 668,000 | 1,343,570 |
| China Steel Corp. | 5,799,088 | 4,861,557 |
| Chunghwa Telecom Co., Ltd. | 1,471,764 | 5,120,621 |
| Compal Electronics, Inc. | 6,959,000 | 5,003,821 |
| CTBC Financial Holding Co., Ltd. | 3,756,809 | 2,433,666 |
| Delta Electronics, Inc. | 583,696 | 3,200,957 |
| Far Eastern New Century Corp. | 3,032,061 | 2,426,332 |
| Far EasTone Telecommunications Co., Ltd. | 541,588 | 1,313,637 |
| Formosa Chemicals & Fibre Corp. | 1,402,882 | 4,411,462 |
| Formosa Petrochemical Corp. | 593,704 | 2,095,148 |
| Formosa Plastics Corp. | 1,380,704 | 4,295,971 |
| Foxconn Technology Co., Ltd. | 451,858 | 1,434,375 |
| Fubon Financial Holding Co., Ltd. | 1,502,116 | 2,414,017 |
| Hon Hai Precision Industry Co., Ltd. | 9,181,911 | 35,749,181 |
| Hotai Motor Co., Ltd. | 122,200 | 1,439,481 |
| HTC Corp. * | 1,339,822 | 3,049,994 |
| Innolux Corp. | 15,435,000 | 7,518,291 |
| Inventec Corp. | 2,653,646 | 2,105,929 |
| Lite-On Technology Corp. | 1,424,229 | 2,107,155 |
| MediaTek, Inc. | 590,046 | 5,288,692 |
| Mega Financial Holding Co., Ltd. | 2,870,548 | 2,306,597 |
| Nan Ya Plastics Corp. | 1,786,588 | 4,511,018 |
| Pegatron Corp. | 1,421,234 | 4,473,880 |
| Pou Chen Corp. | 1,390,000 | 1,803,191 |
| Quanta Computer, Inc. | 2,023,058 | 4,605,324 |
| Siliconware Precision Industries Co., Ltd. | 763,000 | 1,208,503 |
| Synnex Technology International Corp. | 1,713,178 | 1,913,055 |
| Taiwan Cement Corp. | 1,869,000 | 2,158,277 |
| Taiwan Mobile Co., Ltd. | 475,000 | 1,699,858 |
| Taiwan Semiconductor Manufacturing Co., Ltd. | 3,990,352 | 28,626,237 |
| Uni-President Enterprises Corp. | 1,487,796 | 3,164,999 |
| United Microelectronics Corp. | 9,966,931 | 4,970,420 |
| Walsin Lihwa Corp. | 3,476,000 | 1,675,861 |
| Wistron Corp. | 3,941,000 | 3,721,744 |
| WPG Holdings Ltd. | 1,680,000 | 2,187,746 |
| | | 186,257,954 |
| |
| Thailand 1.6% |
| Advanced Info Service PCL NVDR | 469,900 | 2,653,403 |
| Kasikornbank PCL NVDR | 322,200 | 1,950,375 |
| PTT Exploration & Production PCL NVDR | 973,600 | 2,565,578 |
| PTT Global Chemical PCL NVDR | 1,409,700 | 3,247,765 |
| PTT PCL NVDR | 743,600 | 8,935,293 |
| Thai Oil PCL NVDR | 693,100 | 1,967,314 |
Schwab Fundamental Index ETFs | Semiannual Report
Schwab Fundamental Emerging Markets Large Company Index ETF
Portfolio Holdings as of August 31, 2017 (Unaudited) (continued)
| Security | Number
of Shares | Value ($) |
| The Siam Cement PCL NVDR | 90,300 | 1,359,735 |
| The Siam Commercial Bank PCL NVDR | 431,000 | 1,953,486 |
| | | 24,632,949 |
| |
| Turkey 1.7% |
| Akbank T.A.S. | 969,817 | 2,904,493 |
| Eregli Demir ve Celik Fabrikalari T.A.S. | 814,691 | 1,939,656 |
| Haci Omer Sabanci Holding A/S | 627,018 | 1,925,067 |
| KOC Holding A/S | 494,133 | 2,581,906 |
| Tupras-Turkiye Petrol Rafinerileri A/S | 112,332 | 3,816,467 |
| Turk Hava Yollari Anonim Ortakligi * | 754,047 | 2,131,613 |
| Turkcell Iletisim Hizmetleri A/S | 589,418 | 2,255,206 |
| Turkiye Garanti Bankasi A/S | 1,036,801 | 3,225,223 |
| Turkiye Halk Bankasi A/S | 520,546 | 2,234,433 |
| Turkiye Is Bankasi, C Shares | 1,011,906 | 2,195,240 |
| | | 25,209,304 |
| |
| United Arab Emirates 0.1% |
| Emirates Telecommunications Group Co. PJSC | 364,466 | 1,786,063 |
| Total Common Stock |
| (Cost $1,168,771,966) | | 1,369,576,191 |
|
| Preferred Stock 9.7% of net assets |
| |
| Brazil 7.1% |
| Banco Bradesco S.A. | 1,350,052 | 14,408,221 |
| Centrais Eletricas Brasileiras S.A., B Shares | 182,895 | 1,193,356 |
| Cia Brasileira de Distribuicao * | 162,283 | 3,712,995 |
| Companhia Energetica de Minas Gerais | 1,716,160 | 4,570,681 |
| Companhia Paranaense de Energia - Copel, B Shares | 140,379 | 1,282,236 |
| Gerdau S.A. | 1,440,541 | 5,425,292 |
| Itau Unibanco Holding S.A. | 1,713,782 | 21,977,500 |
| Itausa - Investimentos Itau S.A. | 786,861 | 2,550,805 |
| Metalurgica Gerdau S.A. * | 2,079,934 | 3,741,495 |
| Petroleo Brasileiro S.A. * | 4,503,287 | 19,536,261 |
| Telefonica Brasil S.A. | 252,499 | 3,919,354 |
| Vale S.A. | 2,409,938 | 24,946,108 |
| | | 107,264,304 |
| |
| Colombia 0.1% |
| Bancolombia S.A. | 174,698 | 1,993,298 |
| Grupo Argos S.A. | 19,368 | 122,333 |
| | | 2,115,631 |
| |
| Republic of Korea 1.1% |
| Hyundai Motor Co., Ltd. | 15,722 | 1,344,094 |
| Hyundai Motor Co., Ltd. 2nd | 30,676 | 2,774,878 |
| LG Chem Ltd. | 4,950 | 1,154,532 |
| Samsung Electronics Co., Ltd. | 7,070 | 11,818,863 |
| | | 17,092,367 |
| |
| Security | Number
of Shares | Value ($) |
| Russia 1.4% |
| AK Transneft OAO | 5,524 | 16,954,851 |
| Sberbank of Russia PJSC | 193,017 | 525,060 |
| Surgutneftegas OAO | 8,401,229 | 4,195,187 |
| | | 21,675,098 |
| Total Preferred Stock |
| (Cost $99,347,013) | | 148,147,400 |
|
| Other Investment Company 0.2% of net assets |
| |
| United States 0.2% |
| Money Market Fund 0.2% |
| State Street Institutional U.S. Government Money Market Fund, Premier Class 0.93% (a) | 2,812,293 | 2,812,293 |
| Total Other Investment Company |
| (Cost $2,812,293) | | 2,812,293 |
| | Number of
Contracts | Notional
Amount
($) | Current Value/
Unrealized
Appreciation
($) |
| Futures Contracts | | | |
| Long | |
| MSCI Emerging Markets Index, e-mini, expires 09/15/17 | 89 | 4,833,590 | 66,696 |
| * | Non-income producing security. |
| (a) | The rate shown is the 7-day yield. |
| | |
| ADR — | American Depositary Receipt |
| GDR — | Global Depositary Receipt |
| NVDR — | Non-Voting Depositary Receipt |
Schwab Fundamental Index ETFs | Semiannual Report
Item 7: Disclosure of Proxy Voting Policies and Procedures for Closed-End Management Investment Companies.
Not applicable.
Item 8: Portfolio Managers of Closed-End Management Investment Companies.
Not applicable.
| Item 9: | Purchases of Equity Securities by Closed-End Management Investment Company and Affiliated Purchasers. |
Not applicable.
Item 10: Submission of Matters to a Vote of Security Holders.
Not applicable.
Item 11: Controls and Procedures.
| (a) | Based on their evaluation of Registrant’s disclosure controls and procedures, as of a date within 90 days of the filing date, Registrant’s Chief Executive Officer, Marie Chandoha and Registrant’s Chief Financial Officer, Mark Fischer, have concluded that Registrant’s disclosure controls and procedures are: (i) reasonably designed to ensure that information required to be disclosed in this report is appropriately communicated to Registrant’s officers to allow timely decisions regarding disclosures required in this report; (ii) reasonably designed to ensure that information required to be disclosed in this report is recorded, processed, summarized and reported in a timely manner; and (iii) are effective in achieving the goals described in (i) and (ii) above. |
| (b) | During the second fiscal quarter of the period covered by this report, there have been no changes in Registrant’s internal control over financial reporting that the above officers believe to have materially affected, or to be reasonably likely to materially affect, Registrant’s internal control over financial reporting. |
Item 12: Exhibits.
| (a) | (1) Code of ethics – not applicable to this semi-annual report. |
| | (2) | Separate certifications for Registrant’s principal executive officer and principal financial officer, as required by Rule 30a-2(a) under the 1940 Act, are attached. |
| (b) | A certification for Registrant’s principal executive officer and principal financial officer, as required by Rule 30a-2(b) under the 1940 Act, is attached. This certification is being furnished to the Securities and Exchange Commission solely pursuant to 18 U.S.C. section 1350 and is not being filed as part of the Form N-CSRS with the Commission. |
Pursuant to the requirements of the Securities Exchange Act of 1934 and the Investment Company Act of 1940, the registrant has duly caused this report to be signed on its behalf by the undersigned, thereunto duly authorized.
| | |
| (Registrant) Schwab Strategic Trust |
| |
| By: | | /s/ Marie Chandoha |
| | Marie Chandoha Chief Executive Officer |
| |
| Date: | | October 17, 2017 |
Pursuant to the requirements of the Securities Exchange Act of 1934 and the Investment Company Act of 1940, this report has been signed below by the following persons on behalf of the registrant and in the capacities and on the dates indicated.
| | |
| |
| By: | | /s/ Marie Chandoha |
| | Marie Chandoha Chief Executive Officer |
| |
| Date: | | October 17, 2017 |
| | |
| |
| By: | | /s/ Mark Fischer |
| | Mark Fischer Chief Financial Officer |
| |
| Date: | | October 17, 2017 |