UNITED STATES
SECURITIES AND EXCHANGE COMMISSION
Washington, D.C. 20549
FORM N-CSRS
CERTIFIED SHAREHOLDER REPORT OF REGISTERED
MANAGEMENT INVESTMENT COMPANIES
Investment Company Act file number: 811-22311
Schwab Strategic Trust – Fixed Income ETFs
(Exact name of registrant as specified in charter)
211 Main Street, San Francisco, California 94105
(Address of principal executive offices) (Zip code)
Marie Chandoha
Schwab Strategic Trust – Fixed Income ETFs
211 Main Street, San Francisco, California 94105
(Name and address of agent for service)
Registrant’s telephone number, including area code: (415) 636-7000
Date of fiscal year end: December 31
Date of reporting period: June 30, 2018
Item 1: Report(s) to Shareholders.
Semiannual Report | June 30, 2018
Schwab Fixed-Income ETFs
| Schwab U.S. TIPS ETF™ | SCHP |
| Schwab Short-Term U.S. Treasury ETF™ | SCHO |
| Schwab Intermediate-Term U.S. Treasury ETF™ | SCHR |
| Schwab U.S. Aggregate Bond ETF™ | SCHZ |
Fund investment adviser: Charles Schwab Investment Management, Inc. (CSIM)
Distributor: SEI Investments Distribution Co. (SIDCO)
Schwab Fixed-Income ETFs | Semiannual Report
The performance data quoted represents past performance. Past performance does not guarantee future results. Investment return and principal value of an investment will fluctuate so that an investor’s shares, when sold or redeemed, may be worth more or less than the original cost. Current performance may be lower or higher than the performance quoted. To obtain performance information current to the most recent month end, please visit www.schwabfunds.com/schwabetfs_prospectus.
| Total Returns for the 6 Months Ended June 30, 2018 |
| Schwab U.S. TIPS ETF (Ticker Symbol: SCHP) | |
| Market Price Return1 | -0.11% |
| NAV Return1 | -0.06% |
| Bloomberg Barclays US Treasury Inflation-Linked Bond Index (Series-L) | -0.02% |
| ETF Category: Morningstar Inflation-Protected Bond2 | -0.06% |
| Performance Details | page 7 |
| |
| Schwab Short-Term U.S. Treasury ETF (Ticker Symbol: SCHO) | |
| Market Price Return1 | 0.05% |
| NAV Return1 | 0.01% |
| Bloomberg Barclays US Treasury 1-3 Year Index | 0.05% |
| ETF Category: Morningstar Short Government2 | -0.08% |
| Performance Details | page 8 |
| |
| Schwab Intermediate-Term U.S. Treasury ETF (Ticker Symbol: SCHR) | |
| Market Price Return1 | -1.13% |
| NAV Return1 | -1.22% |
| Bloomberg Barclays US Treasury 3-10 Year Index | -1.18% |
| ETF Category: Morningstar Intermediate Government2 | -1.13% |
| Performance Details | page 9 |
| |
| Schwab U.S. Aggregate Bond ETF (Ticker Symbol: SCHZ) | |
| Market Price Return1 | -1.59% |
| NAV Return1 | -1.69% |
| Bloomberg Barclays US Aggregate Bond Index | -1.62% |
| ETF Category: Morningstar Intermediate-Term Bond2 | -1.55% |
| Performance Details | page 10 |
All total returns on this page assume dividends and distributions were reinvested. Index figures do not include trading and management costs, which would lower performance. Indices are unmanaged and cannot be invested in directly. Performance results less than one year are not annualized.
For index definitions, please see the Glossary.
Performance does not reflect the deduction of taxes that a shareholder would pay on fund distributions or on the redemption or sale of fund shares.
Shares are bought and sold at market price, which may be higher or lower than the net asset value (NAV). Brokerage commissions will reduce returns.
Fixed income securities are subject to increased loss of principal during periods of rising interest rates. An investment in the fund(s) is not insured or guaranteed by the Federal Deposit Insurance Corporation (FDIC) or any other government agency.
TIPS generally have lower yields than conventional fixed rate bonds and will likely decline in price during periods of deflation, which could result in losses.
Index ownership — Bloomberg Index Services Limited and its affiliates (collectively, Bloomberg) and Bloomberg’s licensors, including Barclays Bank PLC (Barclays), own all proprietary rights in the Bloomberg Barclays Indices. The funds are not sponsored, endorsed, sold or promoted by Bloomberg or Barclays. Neither Bloomberg nor Barclays endorses or recommends the funds. Neither Bloomberg nor Barclays guarantees the timeliness, accurateness or completeness of any data or information relating to the Bloomberg Barclays Indices, and neither shall be liable in any way in respect of the use or accuracy of the Bloomberg Barclays Indices.
| 1 | ETF performance must be shown based on both a Market Price and a Net Asset Value (NAV) basis. The fund’s per share net asset value (NAV) is the value of one share of the fund. NAV is calculated by taking the fund’s total assets (including the market value of securities owned), subtracting liabilities, and dividing by the number of shares outstanding. The NAV Return is based on the NAV of the fund, and the Market Price Return is based on the market price per share of the fund. The price used to calculate market return (Market Price) is determined using the Official Closing Price of the primary stock exchange (generally, 4:00 p.m. Eastern time) and may not represent the returns you would receive if shares were traded at other times. Market Price and NAV returns assume that dividends and capital gain distributions have been reinvested in the fund at Market Price and NAV, respectively. |
| 2 | Source for category information: Morningstar, Inc. The Morningstar Category return represents all passively- and actively-managed ETFs within the category as of the report date. |
Schwab Fixed-Income ETFs | Semiannual Report
Marie Chandoha
President and CEO of
Charles Schwab Investment
Management, Inc. and the
funds covered in this report.
Dear Shareholder,
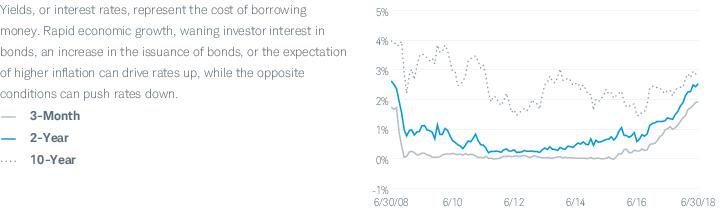
As an investor, sometimes it can be difficult to know what news is important and what isn’t. This year has brought no shortage of domestic and international developments for the markets to digest, causing greater equity volatility than has been seen for years. In fixed income, though, all the headline noise shouldn’t distract from the biggest story: sharply higher U.S. bond yields.
This year through June, the Federal Reserve (Fed) increased its benchmark overnight rate twice, and more hikes are possible by year’s end. This helped push all Treasury yields higher, with 2-year note yields climbing to 2.52% at the end of June, from 1.38% a year earlier. The Fed rate increases put downward pressure on fixed income returns in the six-month reporting period, as higher rates pushed bond prices lower. Total returns for the first half of the year were negative for Schwab Intermediate-Term U.S. Treasury ETF and Schwab U.S. Aggregate Bond ETF and were nearly flat for Schwab U.S. TIPS ETF and Schwab Short-Term U.S. Treasury ETF.
Naturally, many fixed-income investors are wondering how high rates may go in the current rate-hike cycle, which started with the first Fed increase in December 2015. The Fed’s outlook as of mid-year was for its benchmark rate to keep climbing in small, incremental steps through 2019. While this forecast evolves with every policy meeting, what’s significant in that scenario is that it may signal we are closer to the end of this rate-hike cycle than the beginning. Research shows that longer-term bond yields often peak around the same time as the Fed benchmark. So the yield on 10-year Treasuries, which was just under 3% at the end of June, may be hard-pressed to revert back to its long-term average rate, which is above 6%.
At Charles Schwab Investment Management, we emphasize that investors should always have a long-term plan and stick to it. When markets become more turbulent, it certainly makes sense to check in on your investments to ensure that they are continuing to meet your needs. But the rising yields seen in the first half of this year shouldn’t fundamentally change the reasons to have an allocation to fixed income in your portfolio—diversification from stocks, capital preservation and income. We believe bonds and bond ETFs should be a permanent fixture in well-diversified portfolios, and they can even help smooth the ride against stock market volatility in the short run.
Thank you for investing with Charles Schwab Investment Management, and for trusting us to help you achieve your financial goals. For more information about the Schwab Fixed-Income ETFs, please continue reading this report. In addition, you can find further details about these funds by visiting our website at www.schwabfunds.com. We are also happy to hear from you at 1-877-824-5615.
Sincerely,
“ Total returns for the first half of the year were negative for Schwab Intermediate-Term U.S. Treasury ETF and Schwab U.S. Aggregate Bond ETF and were nearly flat for Schwab U.S. TIPS ETF and Schwab Short-Term U.S. Treasury ETF.”
Management views may have changed since the report date.
Schwab Fixed-Income ETFs | Semiannual Report
The Investment Environment
Over the six-month reporting period ended June 30, 2018, fixed-income markets generated negative returns as bond yields rose. (Bond yields and bond prices move in opposite directions.) The yield on the benchmark 10-year U.S. Treasury note rose for a fourth straight quarter, briefly surpassing 3% before investors’ concerns drove them to the relative safety of government debt. Although global growth generally remained strong, uncertainties abounded, from worries about escalating trade tensions and political uncertainty in the eurozone to signs of slowing global economic momentum. After hitting an all-time low last November, volatility spiked in February, then eased, but ended the reporting period elevated from its recent lows. In this environment, the Bloomberg Barclays US Aggregate Bond Index returned –1.62%, while the Bloomberg Barclays US Treasury 1-3 Year Index and the Bloomberg Barclays US Treasury 3-10 Year Index returned 0.05% and –1.18%, respectively. Over the same period, the Bloomberg Barclays US Treasury Inflation-Linked Bond Index (Series-L) returned -0.02%.
Economies around globe continued for the most part to demonstrate economic strength over the reporting period, although in some cases, the pace slowed. In the U.S., the labor market remained strong, reporting a 93rd consecutive month of jobs expansion as of the end of June, along with a pickup in wage gains. Corporate earnings generally remained strong, with many companies exceeding expectations. U.S. consumers generally remained optimistic, although The Conference Board’s Consumer Confidence Index®1 fell slightly in May, suggesting that consumers may sense a cooling ahead. U.S. real gross domestic product (GDP) increased at an annual rate of 2.0% in the first quarter of 2018, following an increase of 2.9% in the fourth quarter of 2017.
During the reporting period, the Federal Reserve (Fed) continued to take steps toward a more normalized monetary policy environment, reaffirming its commitment to gradually raising short-term interest rates. Following three 0.25% rate hikes in 2017, the Fed instituted two more rate hikes thus far in 2018—in March and June—citing continued strength in the labor market and solid economic growth. In its minutes from its June meeting, however, the Fed noted that uncertainty and risks associated with trade policy had intensified, which could eventually have negative effects on business sentiment and investment spending. The federal funds rate ended the reporting period in a range of 1.75% to 2.00%. In addition, the pace of the Fed’s balance sheet reduction plan, whereby it allows securities to mature without reinvesting the proceeds, accelerated over the reporting period. As of the end of the reporting period, the Fed’s balance sheet stood at $4.3 trillion, down from $4.5 trillion when the program was announced.
Yields of U.S. Treasury Securities: Effective Yields of Three-Month, Two-Year and 10-Year Treasuries
Index figures assume dividends and distributions were reinvested. Index figures do not include trading and management costs, which would lower performance. Indices are unmanaged and cannot be invested in directly. Performance results less than one year are not annualized. Past performance is not an indication of future results.
For index definitions, please see the Glossary.
Data source: Bloomberg L.P.
Nothing in this report represents a recommendation of a security by the investment adviser.
Management views may have changed since the report date.
| 1 | The Conference Board is a global, independent business membership and research association working in the public interest. The Consumer Confidence Index® is based on the Consumer Confidence Survey® which reflects prevailing business conditions and likely developments for the months ahead. This monthly report details consumer attitudes and buying intentions, with data available by age, income, and region. |
Schwab Fixed-Income ETFs | Semiannual Report
The Investment Environment (continued)
Outside the U.S., monetary policies mostly remained relatively accommodative amid low inflation, though some central banks did take steps toward tighter policies. At its March meeting, the Governing Council of the European Central Bank left interest rates unchanged, announcing that it expects key interest rates to remain at their present levels for an extended period of time and confirming that its net asset purchases are intended to run until at least the end of September 2018. During the reporting period, the Bank of Japan removed the timeframe for achieving its 2% inflation target and maintained its short-term interest rate target at –0.1%.
During the six-month reporting period, the U.S. bond yield curve flattened and yields remained low relative to historical averages. Short-term yields, which are directly influenced by central bank policy, rose in response to the federal funds rate increases. Longer-term yields, by comparison, are driven by economic growth and inflation expectations. Despite steady economic growth over the reporting period, inflation remained benign and longer-term yields were generally range bound.
Schwab Fixed-Income ETFs | Semiannual Report
 | Matthew Hastings, CFA, Vice President and Head of Taxable Bond Strategies, leads the portfolio management team for Schwab Fixed-Income ETFs and Schwab’s taxable bond funds. He also has overall responsibility for all aspects of the management of the funds. Prior to joining CSIM in 1999, Mr. Hastings was in fixed-income sales and trading at Lehman Brothers. He has worked in the fixed-income securities industry since 1996. |
 | Steven Hung, Senior Portfolio Manager, is responsible for the day-to-day co-management of the Schwab U.S. Aggregate Bond ETF. His primary focus is corporate bonds. Prior to joining CSIM in 1999, Mr. Hung was an associate in Schwab’s management training program for nine months. In that role, he worked as a clerk on the Options Trading Floor of the Pacific Coast Stock Exchange. |
 | Mark McKissick, CFA, Senior Portfolio Manager, is responsible for the day-to-day co-management of the funds. His primary focus is taxable government securities. Prior to joining CSIM in 2016, Mr. McKissick worked for 17 years at Denver Investments, most recently as a director of fixed income and portfolio manager. He has worked in the fixed-income securities industry since 1992. |
 | Alfonso Portillo, Jr., Senior Portfolio Manager, is responsible for the day-to-day co-management of the Schwab U.S. Aggregate Bond ETF. His primary focus is securitized products. Prior to joining CSIM in 2007, Mr. Portillo worked for ten years at Pacific Investment Management Company, most recently as a vice president and member of the mortgage- and asset-backed portfolio management team. He has worked in fixed-income asset management since 1996. |
Schwab Fixed-Income ETFs | Semiannual Report
Schwab U.S. TIPS ETF as of June 30, 2018
The performance data quoted represents past performance. Past performance does not guarantee future results. Investment return and principal value of an investment will fluctuate so that an investor’s shares, when sold or redeemed, may be worth more or less than the original cost. Current performance may be lower or higher than the performance quoted. To obtain performance information current to the most recent month end, please visit www.schwabfunds.com/schwabetfs_prospectus.
Average Annual Total Returns1
| Fund and Inception Date | 6 Months | 1 Year | 5 Years | Since Inception* |
| Fund: Schwab U.S. TIPS ETF (8/5/2010) | | | | |
| Market Price Return2 | -0.11% | 2.07% | 1.63% | 2.68% |
| NAV Return2 | -0.06% | 2.05% | 1.61% | 2.68% |
| Bloomberg Barclays US Treasury Inflation-Linked Bond Index (Series-L) | -0.02% | 2.11% | 1.68% | 2.77% |
| ETF Category: Morningstar Inflation-Protected Bond3 | -0.06% | 1.94% | 1.25% | N/A |
| Fund Expense Ratio4: 0.05% |
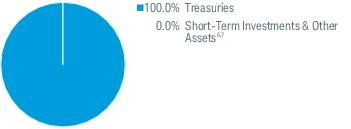
Portfolio Composition % of Investments5
By Security Type
| Weighted Average Maturity8 | 8.4 Yrs |
| Weighted Average Duration8 | 7.7 Yrs |
All total returns on this page assume dividends and distributions were reinvested. Index figures do not include trading and management costs, which would lower performance. Indices are unmanaged and cannot be invested in directly. Performance results less than one year are not annualized.
For index definitions, please see the Glossary.
Shares are bought and sold at market price, which may be higher or lower than the net asset value (NAV). Brokerage commissions will reduce returns.
Index ownership — Bloomberg Index Services Limited and its affiliates (collectively, Bloomberg) and Bloomberg’s licensors, including Barclays Bank PLC (Barclays), own all proprietary rights in the Bloomberg Barclays Indices. The fund is not sponsored, endorsed, sold or promoted by Bloomberg or Barclays. Neither Bloomberg nor Barclays endorses or recommends the fund. Neither Bloomberg nor Barclays guarantees the timeliness, accurateness or completeness of any data or information relating to the Bloomberg Barclays Indices, and neither shall be liable in any way in respect of the use or accuracy of the Bloomberg Barclays Indices.
Portfolio holdings may have changed since the report date.
An index is a statistical composite of a specified financial market or sector. Unlike the fund, an index does not actually hold a portfolio of securities and its return is not inclusive of operational and transaction costs incurred by the fund.
Fixed income securities are subject to increased loss of principal during periods of rising interest rates. An investment in the fund is not insured or guaranteed by the Federal Deposit Insurance Corporation (FDIC) or any other government agency.
TIPS generally have lower yields than conventional fixed rate bonds and will likely decline in price during periods of deflation, which could result in losses.
| * | Inception (8/5/10) represents the date that the shares began trading in the secondary market. |
| 1 | Performance does not reflect the deduction of taxes that a shareholder would pay on fund distributions or on the redemption or sale of fund shares. |
| 2 | ETF performance must be shown based on both a Market Price and a Net Asset Value (NAV) basis. The fund’s per share net asset value (NAV) is the value of one share of the fund. NAV is calculated by taking the fund’s total assets (including the market value of securities owned), subtracting liabilities, and dividing by the number of shares outstanding. The NAV Return is based on the NAV of the fund, and the Market Price Return is based on the market price per share of the fund. The price used to calculate market return (Market Price) is determined using the Official Closing Price of the primary stock exchange (generally, 4:00 p.m. Eastern time) and may not represent the returns you would receive if shares were traded at other times. NAV is used as a proxy for purposes of calculating Market Price Return on inception date. Market Price and NAV returns assume that dividends and capital gain distributions have been reinvested in the fund at Market Price and NAV, respectively. |
| 3 | Source for category information: Morningstar, Inc. The Morningstar Category return represents all passively- and actively-managed ETFs within the category as of the report date. |
| 4 | As stated in the prospectus. |
| 5 | The percentage may differ from the Portfolio Holdings because the above calculation is based on a percentage of total investments, whereas the calculation in the Portfolio Holdings is based on a percentage of net assets. |
| 6 | Less than 0.05%. |
| 7 | Includes the fund’s position in money market mutual funds registered under the Investment Company Act of 1940, as amended. |
| 8 | See Glossary for definitions of maturity and duration. |
Schwab Fixed-Income ETFs | Semiannual Report
Schwab Short-Term U.S. Treasury ETF as of June 30, 2018
The performance data quoted represents past performance. Past performance does not guarantee future results. Investment return and principal value of an investment will fluctuate so that an investor’s shares, when sold or redeemed, may be worth more or less than the original cost. Current performance may be lower or higher than the performance quoted. To obtain performance information current to the most recent month end, please visit www.schwabfunds.com/schwabetfs_prospectus.
Average Annual Total Returns1
| Fund and Inception Date | 6 Months | 1 Year | 5 Years | Since Inception* |
| Fund: Schwab Short-Term U.S. Treasury ETF (8/5/2010) | | | | |
| Market Price Return2 | 0.05% | -0.03% | 0.49% | 0.55% |
| NAV Return2 | 0.01% | -0.05% | 0.49% | 0.55% |
| Bloomberg Barclays US Treasury 1-3 Year Index | 0.05% | 0.01% | 0.58% | 0.65% |
| ETF Category: Morningstar Short Government3 | -0.08% | -0.06% | 0.49% | N/A |
| Fund Expense Ratio4: 0.06% |
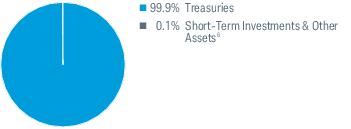
Portfolio Composition % of Investments5
By Security Type
| Weighted Average Maturity7 | 2.0 Yrs |
| Weighted Average Duration7 | 1.9 Yrs |
All total returns on this page assume dividends and distributions were reinvested. Index figures do not include trading and management costs, which would lower performance. Indices are unmanaged and cannot be invested in directly. Performance results less than one year are not annualized.
For index definitions, please see the Glossary.
Shares are bought and sold at market price, which may be higher or lower than the net asset value (NAV). Brokerage commissions will reduce returns.
Index ownership — Bloomberg Index Services Limited and its affiliates (collectively, Bloomberg) and Bloomberg’s licensors, including Barclays Bank PLC (Barclays), own all proprietary rights in the Bloomberg Barclays Indices. The fund is not sponsored, endorsed, sold or promoted by Bloomberg or Barclays. Neither Bloomberg nor Barclays endorses or recommends the fund. Neither Bloomberg nor Barclays guarantees the timeliness, accurateness or completeness of any data or information relating to the Bloomberg Barclays Indices, and neither shall be liable in any way in respect of the use or accuracy of the Bloomberg Barclays Indices.
Portfolio holdings may have changed since the report date.
An index is a statistical composite of a specified financial market or sector. Unlike the fund, an index does not actually hold a portfolio of securities and its return is not inclusive of operational and transaction costs incurred by the fund.
Fixed income securities are subject to increased loss of principal during periods of rising interest rates. An investment in the fund is not insured or guaranteed by the Federal Deposit Insurance Corporation (FDIC) or any other government agency.
| * | Inception (8/5/10) represents the date that the shares began trading in the secondary market. |
| 1 | Performance does not reflect the deduction of taxes that a shareholder would pay on fund distributions or on the redemption or sale of fund shares. |
| 2 | ETF performance must be shown based on both a Market Price and a Net Asset Value (NAV) basis. The fund’s per share net asset value (NAV) is the value of one share of the fund. NAV is calculated by taking the fund’s total assets (including the market value of securities owned), subtracting liabilities, and dividing by the number of shares outstanding. The NAV Return is based on the NAV of the fund, and the Market Price Return is based on the market price per share of the fund. The price used to calculate market return (Market Price) is determined using the Official Closing Price of the primary stock exchange (generally, 4:00 p.m. Eastern time) and may not represent the returns you would receive if shares were traded at other times. NAV is used as a proxy for purposes of calculating Market Price Return on inception date. Market Price and NAV returns assume that dividends and capital gain distributions have been reinvested in the fund at Market Price and NAV, respectively. |
| 3 | Source for category information: Morningstar, Inc. The Morningstar Category return represents all passively- and actively-managed ETFs within the category as of the report date. |
| 4 | As stated in the prospectus. |
| 5 | The percentage may differ from the Portfolio Holdings because the above calculation is based on a percentage of total investments, whereas the calculation in the Portfolio Holdings is based on a percentage of net assets. |
| 6 | Includes the fund’s position in money market mutual funds registered under the Investment Company Act of 1940, as amended. |
| 7 | See Glossary for definitions of maturity and duration. |
Schwab Fixed-Income ETFs | Semiannual Report
Schwab Intermediate-Term U.S. Treasury ETF as of June 30, 2018
The performance data quoted represents past performance. Past performance does not guarantee future results. Investment return and principal value of an investment will fluctuate so that an investor’s shares, when sold or redeemed, may be worth more or less than the original cost. Current performance may be lower or higher than the performance quoted. To obtain performance information current to the most recent month end, please visit www.schwabfunds.com/schwabetfs_prospectus.
Average Annual Total Returns1
| Fund and Inception Date | 6 Months | 1 Year | 5 Years | Since Inception* |
| Fund: Schwab Intermediate-Term U.S. Treasury ETF (8/5/2010) | | | | |
| Market Price Return2 | -1.13% | -1.36% | 1.37% | 2.03% |
| NAV Return2 | -1.22% | -1.34% | 1.36% | 2.02% |
| Bloomberg Barclays US Treasury 3-10 Year Index | -1.18% | -1.28% | 1.45% | 2.13% |
| ETF Category: Morningstar Intermediate Government3 | -1.13% | -0.75% | 1.38% | N/A |
| Fund Expense Ratio4: 0.06% |
Portfolio Composition % of Investments5
By Security Type
| Weighted Average Maturity8 | 5.6 Yrs |
| Weighted Average Duration8 | 5.1 Yrs |
All total returns on this page assume dividends and distributions were reinvested. Index figures do not include trading and management costs, which would lower performance. Indices are unmanaged and cannot be invested in directly. Performance results less than one year are not annualized.
For index definitions, please see the Glossary.
Shares are bought and sold at market price, which may be higher or lower than the net asset value (NAV). Brokerage commissions will reduce returns.
Index ownership — Bloomberg Index Services Limited and its affiliates (collectively, Bloomberg) and Bloomberg’s licensors, including Barclays Bank PLC (Barclays), own all proprietary rights in the Bloomberg Barclays Indices. The fund is not sponsored, endorsed, sold or promoted by Bloomberg or Barclays. Neither Bloomberg nor Barclays endorses or recommends the fund. Neither Bloomberg nor Barclays guarantees the timeliness, accurateness or completeness of any data or information relating to the Bloomberg Barclays Indices, and neither shall be liable in any way in respect of the use or accuracy of the Bloomberg Barclays Indices.
Portfolio holdings may have changed since the report date.
An index is a statistical composite of a specified financial market or sector. Unlike the fund, an index does not actually hold a portfolio of securities and its return is not inclusive of operational and transaction costs incurred by the fund.
Fixed income securities are subject to increased loss of principal during periods of rising interest rates. An investment in the fund is not insured or guaranteed by the Federal Deposit Insurance Corporation (FDIC) or any other government agency.
| * | Inception (8/5/10) represents the date that the shares began trading in the secondary market. |
| 1 | Performance does not reflect the deduction of taxes that a shareholder would pay on fund distributions or on the redemption or sale of fund shares. |
| 2 | ETF performance must be shown based on both a Market Price and a Net Asset Value (NAV) basis. The fund’s per share net asset value (NAV) is the value of one share of the fund. NAV is calculated by taking the fund’s total assets (including the market value of securities owned), subtracting liabilities, and dividing by the number of shares outstanding. The NAV Return is based on the NAV of the fund, and the Market Price Return is based on the market price per share of the fund. The price used to calculate market return (Market Price) is determined using the Official Closing Price of the primary stock exchange (generally, 4:00 p.m. Eastern time) and may not represent the returns you would receive if shares were traded at other times. NAV is used as a proxy for purposes of calculating Market Price Return on inception date. Market Price and NAV returns assume that dividends and capital gain distributions have been reinvested in the fund at Market Price and NAV, respectively. |
| 3 | Source for category information: Morningstar, Inc. The Morningstar Category return represents all passively- and actively-managed ETFs within the category as of the report date. |
| 4 | As stated in the prospectus. |
| 5 | The percentage may differ from the Portfolio Holdings because the above calculation is based on a percentage of total investments, whereas the calculation in the Portfolio Holdings is based on a percentage of net assets. |
| 6 | Less than 0.05%. |
| 7 | Includes the fund’s position in money market mutual funds registered under the Investment Company Act of 1940, as amended. |
| 8 | See Glossary for definitions of maturity and duration. |
Schwab Fixed-Income ETFs | Semiannual Report
Schwab U.S. Aggregate Bond ETF as of June 30, 2018
The performance data quoted represents past performance. Past performance does not guarantee future results. Investment return and principal value of an investment will fluctuate so that an investor’s shares, when sold or redeemed, may be worth more or less than the original cost. Current performance may be lower or higher than the performance quoted. To obtain performance information current to the most recent month end, please visit www.schwabfunds.com/schwabetfs_prospectus.
Average Annual Total Returns1
| Fund and Inception Date | 6 Months | 1 Year | 5 Years | Since Inception* |
| Fund: Schwab U.S. Aggregate Bond ETF (7/14/2011) | | | | |
| Market Price Return2 | -1.59% | -0.60% | 2.27% | 2.30% |
| NAV Return2 | -1.69% | -0.53% | 2.21% | 2.30% |
| Bloomberg Barclays US Aggregate Bond Index | -1.62% | -0.40% | 2.27% | 2.42% |
| ETF Category: Morningstar Intermediate-Term Bond3 | -1.55% | -0.36% | 2.20% | N/A |
| Fund Expense Ratio4: 0.04% |
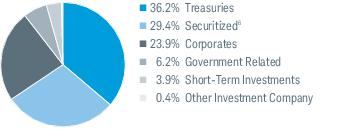
Portfolio Composition % of Investments5
By Security Type
| Weighted Average Maturity7 | 8.4 Yrs |
| Weighted Average Duration7 | 6.0 Yrs |
All total returns on this page assume dividends and distributions were reinvested. Index figures do not include trading and management costs, which would lower performance. Indices are unmanaged and cannot be invested in directly. Performance results less than one year are not annualized.
For index definitions, please see the Glossary.
Shares are bought and sold at market price, which may be higher or lower than the net asset value (NAV). Brokerage commissions will reduce returns.
Index ownership — Bloomberg Index Services Limited and its affiliates (collectively, Bloomberg) and Bloomberg’s licensors, including Barclays Bank PLC (Barclays), own all proprietary rights in the Bloomberg Barclays Indices. The fund is not sponsored, endorsed, sold or promoted by Bloomberg or Barclays. Neither Bloomberg nor Barclays endorses or recommends the fund. Neither Bloomberg nor Barclays guarantees the timeliness, accurateness or completeness of any data or information relating to the Bloomberg Barclays Indices, and neither shall be liable in any way in respect of the use or accuracy of the Bloomberg Barclays Indices.
Portfolio holdings may have changed since the report date.
An index is a statistical composite of a specified financial market or sector. Unlike the fund, an index does not actually hold a portfolio of securities and its return is not inclusive of operational and transaction costs incurred by the fund.
Fixed income securities are subject to increased loss of principal during periods of rising interest rates. An investment in the fund is not insured or guaranteed by the Federal Deposit Insurance Corporation (FDIC) or any other government agency.
| * | Inception (7/14/11) represents the date that the shares began trading in the secondary market. |
| 1 | Performance does not reflect the deduction of taxes that a shareholder would pay on fund distributions or on the redemption or sale of fund shares. |
| 2 | ETF performance must be shown based on both a Market Price and a Net Asset Value (NAV) basis. The fund’s per share net asset value (NAV) is the value of one share of the fund. NAV is calculated by taking the fund’s total assets (including the market value of securities owned), subtracting liabilities, and dividing by the number of shares outstanding. The NAV Return is based on the NAV of the fund, and the Market Price Return is based on the market price per share of the fund. The price used to calculate market return (Market Price) is determined using the Official Closing Price of the primary stock exchange (generally, 4:00 p.m. Eastern time) and may not represent the returns you would receive if shares were traded at other times. NAV is used as a proxy for purposes of calculating Market Price Return on inception date. Market Price and NAV returns assume that dividends and capital gain distributions have been reinvested in the fund at Market Price and NAV, respectively. |
| 3 | Source for category information: Morningstar, Inc. The Morningstar Category return represents all passively- and actively-managed ETFs within the category as of the report date. |
| 4 | As stated in the prospectus. |
| 5 | The percentage may differ from the Portfolio Holdings because the above calculation is based on a percentage of total investments, whereas the calculation in the Portfolio Holdings is based on a percentage of net assets. |
| 6 | The fund may seek to obtain exposure to U.S. agency mortgage pass-through securities, in part or in full, through the use of “to-be-announced” or “TBA” transactions, which are standardized contracts for future delivery of mortgage pass-through securities in which the exact mortgage pools to be delivered are not specified until a few days prior to settlement. These transactions represented approximately 2.3% of total investments on June 30, 2018. |
| 7 | See Glossary for definitions of maturity and duration. |
Schwab Fixed-Income ETFs | Semiannual Report
Fund Expenses (Unaudited)
Examples for a $1,000 Investment
As a fund shareholder, you may incur two types of costs: (1) transaction costs, including brokerage commissions on purchases and sales of fund shares; and, (2) ongoing costs, including management fees.
The expense examples below are intended to help you understand your ongoing cost (in dollars) of investing in a fund and to compare this cost with the ongoing cost of investing in other mutual funds. These examples are based on an investment of $1,000 invested for six months beginning January 1, 2018 and held through June 30, 2018.
Actual Return lines in the table below provide information about actual account values and actual expenses. You may use this information, together with the amount you invested, to estimate the expenses that you paid over the period. To do so, simply divide your account value by $1,000 (for example, an $8,600 account value ÷ $1,000 = 8.6), then multiply the result by the number given for your fund under the heading entitled “Expenses Paid During Period.”
Hypothetical Return lines in the table below provide information about hypothetical account values and hypothetical expenses based on a fund’s actual expense ratio and an assumed return of 5% per year before expenses. Because the return used is not an actual return, it may not be used to estimate the actual ending account value or expenses you paid for the period.
You may use this information to compare the ongoing costs of investing in a fund and other funds. To do so, compare this 5% hypothetical example with the 5% hypothetical examples that appear in the shareholder reports of the other funds.
Please note that the expenses shown in the table are meant to highlight your ongoing costs only, and do not reflect any transactional costs, including any brokerage commissions you may pay when purchasing or selling shares of a fund. Therefore, the hypothetical return lines of the table are useful in comparing ongoing costs only, and will not help you determine the relative total costs of owning different funds. In addition, if these transactional costs were included, your costs would have been higher.
| | Expense Ratio
(Annualized)1 | Beginning
Account Value
at 1/1/18 | Ending
Account Value
(Net of Expenses)
at 6/30/18 | Expenses Paid
During Period
1/1/18-6/30/182 |
| Schwab U.S. TIPS ETF | | | | |
| Actual Return | 0.05% | $1,000.00 | $ 999.40 | $0.25 |
| Hypothetical 5% Return | 0.05% | $1,000.00 | $1,024.55 | $0.25 |
| Schwab Short-Term U.S. Treasury ETF | | | | |
| Actual Return | 0.06% | $1,000.00 | $1,000.10 | $0.30 |
| Hypothetical 5% Return | 0.06% | $1,000.00 | $1,024.50 | $0.30 |
| Schwab Intermediate-Term U.S. Treasury ETF | | | | |
| Actual Return | 0.06% | $1,000.00 | $ 987.80 | $0.30 |
| Hypothetical 5% Return | 0.06% | $1,000.00 | $1,024.50 | $0.30 |
| Schwab U.S. Aggregate Bond ETF | | | | |
| Actual Return | 0.04% | $1,000.00 | $ 983.10 | $0.20 |
| Hypothetical 5% Return | 0.04% | $1,000.00 | $1,024.60 | $0.20 |
| 1 | Based on the most recent six-month expense ratio; may differ from the expense ratio provided in the Financial Highlights. |
| 2 | Expenses for each fund are equal to its annualized expense ratio, multiplied by the average account value over the period, multiplied by the 181 days of the period, and divided by 365 days of the fiscal year. |
Schwab Fixed-Income ETFs | Semiannual Report
Financial Statements
Financial Highlights
| | 1/1/18–
6/30/18* | 1/1/17–
12/31/17 | 1/1/16–
12/31/16 | 1/1/15–
12/31/15 | 1/1/14–
12/31/14 | 1/1/13–
12/31/13 |
| Per-Share Data |
| Net asset value at beginning of period | $55.39 | $54.84 | $53.15 | $54.11 | $52.92 | $58.31 |
| Income (loss) from investment operations: | | | | | | |
| Net investment income (loss) | 0.97 1 | 1.17 1 | 0.99 1 | 0.17 1 | 0.64 | 0.28 |
| Net realized and unrealized gains (losses) | (1.01) | 0.43 | 1.46 | (0.98) | 1.26 | (5.32) |
| Total from investment operations | (0.04) | 1.60 | 2.45 | (0.81) | 1.90 | (5.04) |
| Less distributions: | | | | | | |
| Distributions from net investment income | (0.45) | (1.05) | (0.76) | (0.15) | (0.71) | (0.35) |
| Net asset value at end of period | $54.90 | $55.39 | $54.84 | $53.15 | $54.11 | $52.92 |
| Total return | (0.06%) 2 | 2.95% | 4.60% | (1.50%) | 3.56% | (8.66%) |
| Ratios/Supplemental Data |
| Ratios to average net assets: | | | | | | |
| Total expenses | 0.05% 3 | 0.05% 4 | 0.07% | 0.07% | 0.07% | 0.07% |
| Net investment income (loss) | 3.59% 3 | 2.13% | 1.78% | 0.31% | 1.10% | 0.51% |
| Portfolio turnover rate5 | 9% 2 | 19% | 16% | 19% | 20% | 20% |
| Net assets, end of period (x 1,000) | $5,448,453 | $2,880,386 | $1,614,977 | $815,816 | $549,259 | $399,564 |
| |
1
Calculated based on the average shares outstanding during the period.
2
Not annualized.
3
Annualized.
4
Effective March 1, 2017, the annual operating expense ratio was reduced. The ratio presented for the period ended 12/31/17 is a blended ratio.
5
Portfolio turnover rate excludes securities received or delivered from processing of in-kind creations or redemptions.
Schwab Fixed-Income ETFs | Semiannual Report
Portfolio Holdings as of June 30, 2018 (Unaudited)
This section shows all the securities in the fund’s portfolio and their values as of the report date.
The fund files its complete schedule of portfolio holdings with the SEC for the first and third quarters of each fiscal year on Form N-Q. The fund’s Form N-Q is available on the SEC’s website at www.sec.gov and may be viewed and copied at the SEC’s Public Reference Room in Washington, D.C. Call 1-800-SEC-0330 for information on the operation of the Public Reference Room. The fund also makes available its complete schedule of portfolio holdings on a daily basis on the fund’s website at www.schwabfunds.com/schwabetfs_prospectus.
For fixed rate obligations, the rate shown is the interest rate (the rate established when the obligation was issued). For variable rate obligations, the rate shown is the rate as of the report date based on each security’s rate reset date. The reference rate and spread used is shown parenthetically in the security description if available; if not the reference rate is described in a footnote. The maturity date shown for all the securities is the final legal maturity.
Security
Rate, Maturity Date | Face
Amount ($) | Value ($) |
| Treasuries 99.7% of net assets |
| U.S. Treasury Inflation Protected Securities |
| 1.88%, 07/15/19 | 81,594,427 | 82,928,467 |
| 1.38%, 01/15/20 | 98,952,832 | 100,082,028 |
| 0.13%, 04/15/20 | 253,910,679 | 251,259,861 |
| 1.25%, 07/15/20 | 152,060,706 | 154,558,466 |
| 1.13%, 01/15/21 | 173,933,530 | 176,226,460 |
| 0.13%, 04/15/21 | 220,775,986 | 217,422,066 |
| 0.63%, 07/15/21 | 184,629,853 | 185,371,389 |
| 0.13%, 01/15/22 | 203,785,858 | 200,352,824 |
| 0.13%, 04/15/22 | 215,121,063 | 210,753,406 |
| 0.13%, 07/15/22 | 210,181,817 | 206,735,585 |
| 0.13%, 01/15/23 | 211,159,586 | 206,460,023 |
| 0.63%, 04/15/23 | 76,604,721 | 76,498,753 |
| 0.38%, 07/15/23 | 209,461,945 | 207,630,278 |
| 0.63%, 01/15/24 | 208,868,441 | 208,683,912 |
| 0.13%, 07/15/24 | 205,349,289 | 199,678,519 |
| 0.25%, 01/15/25 | 205,835,635 | 200,289,770 |
| 2.38%, 01/15/25 | 135,167,241 | 149,929,778 |
| 0.38%, 07/15/25 | 205,607,828 | 202,039,253 |
| 0.63%, 01/15/26 | 185,156,829 | 184,260,124 |
| 2.00%, 01/15/26 | 98,459,303 | 107,938,033 |
| 0.13%, 07/15/26 | 173,646,942 | 166,426,930 |
| 0.38%, 01/15/27 | 172,307,541 | 167,482,075 |
| 2.38%, 01/15/27 | 79,214,454 | 90,146,240 |
| 0.38%, 07/15/27 | 170,272,419 | 165,733,927 |
| 0.50%, 01/15/28 | 168,863,935 | 165,265,713 |
| 1.75%, 01/15/28 | 79,306,402 | 86,720,726 |
| 3.63%, 04/15/28 | 66,775,740 | 84,859,334 |
Security
Rate, Maturity Date | Face
Amount ($) | Value ($) |
| 2.50%, 01/15/29 | 76,517,119 | 90,008,881 |
| 3.88%, 04/15/29 | 81,254,560 | 107,229,023 |
| 3.38%, 04/15/32 | 30,867,718 | 41,274,190 |
| 2.13%, 02/15/40 | 41,794,999 | 52,591,510 |
| 2.13%, 02/15/41 | 53,187,186 | 67,404,354 |
| 0.75%, 02/15/42 | 93,446,358 | 91,355,031 |
| 0.63%, 02/15/43 | 69,072,171 | 65,446,437 |
| 1.38%, 02/15/44 | 104,234,200 | 116,433,118 |
| 0.75%, 02/15/45 | 116,154,576 | 112,803,888 |
| 1.00%, 02/15/46 | 85,325,491 | 87,955,020 |
| 0.88%, 02/15/47 | 83,689,339 | 83,747,216 |
| 1.00%, 02/15/48 | 57,863,809 | 59,821,986 |
| Total Treasuries |
| (Cost $5,467,087,221) | | 5,431,804,594 |
| Security | Number
of Shares | Value ($) |
| Other Investment Company 0.0% of net assets |
| |
| Money Market Fund 0.0% |
| State Street Institutional U.S. Government Money Market Fund, Premier Class 1.82% (a) | 1,028,539 | 1,028,539 |
| Total Other Investment Company |
| (Cost $1,028,539) | | 1,028,539 |
| (a) | The rate shown is the 7-day yield. |
The following is a summary of the inputs used to value the fund’s investments as of June 30, 2018 (see financial note 2(a) for additional information):
| Description | Quoted Prices in
Active Markets for
Identical Assets
(Level 1) | Other Significant
Observable Inputs
(Level 2) | Significant
Unobservable Inputs
(Level 3) | Total | |
| Assets | | | | | |
| Treasuries | $— | $5,431,804,594 | $— | $5,431,804,594 | |
| Other Investment Company1 | 1,028,539 | — | — | 1,028,539 | |
| Total | $1,028,539 | $5,431,804,594 | $— | $5,432,833,133 | |
| 1 | As categorized in Portfolio Holdings. |
The fund’s policy is to recognize transfers between Level 1, Level 2 and Level 3 as of the beginning of the fiscal year. There were no transfers between Level 1, Level 2 and Level 3 for the period ended June 30, 2018. Fund investments in underlying mutual funds are classified as Level 1, without consideration to the classification level of the investments held by the underlying mutual funds, which could be Level 1, Level 2 or Level 3.
Schwab Fixed-Income ETFs | Semiannual Report
Statement of Assets and Liabilities
As of June 30, 2018; unaudited
| Assets |
| Investments in unaffiliated issuers, at value (cost $5,468,115,760) | | $5,432,833,133 |
| Receivables: | | |
| Investments sold | | 23,916,664 |
| Interest | | 16,614,224 |
| Fund shares sold | | 10,979,228 |
| Dividends | + | 1,715 |
| Total assets | | 5,484,344,964 |
| Liabilities |
| Payables: | | |
| Investments bought | | 35,675,510 |
| Investment adviser fees | | 214,804 |
| Other liabilities | + | 1,763 |
| Total liabilities | | 35,892,077 |
| Net Assets |
| Total assets | | 5,484,344,964 |
| Total liabilities | – | 35,892,077 |
| Net assets | | $5,448,452,887 |
| Net Assets by Source | | |
| Capital received from investors | | 5,474,804,420 |
| Net investment income not yet distributed | | 32,966,152 |
| Net realized capital losses | | (24,035,058) |
| Net unrealized capital depreciation | | (35,282,627) |
| Net Asset Value (NAV) |
| Net Assets | ÷ | Shares
Outstanding | = | NAV |
| $5,448,452,887 | | 99,250,000 | | $54.90 |
| | | | | |
Schwab Fixed-Income ETFs | Semiannual Report
Statement of Operations
For the period January 1, 2018 through June 30, 2018; unaudited
| Investment Income |
| Dividends | | $15,516 |
| Interest | + | 63,869,020 |
| Total investment income | | 63,884,536 |
| Expenses |
| Investment adviser fees | | 876,768 |
| Total expenses | – | 876,768 |
| Net investment income | | 63,007,768 |
| Realized and Unrealized Gains (Losses) |
| Net realized losses on investments | | (5,240,037) |
| Net realized gains on in-kind redemptions | + | 1,192,011 |
| Net realized losses | | (4,048,026) |
| Net change in unrealized appreciation (depreciation) on investments | + | (44,683,963) |
| Net realized and unrealized losses | | (48,731,989) |
| Increase in net assets resulting from operations | | $14,275,779 |
Schwab Fixed-Income ETFs | Semiannual Report
Statement of Changes in Net Assets
For the current and prior report periods
Figures for the current period are unaudited
| Operations | |
| | 1/1/18-6/30/18 | 1/1/17-12/31/17 |
| Net investment income | | $63,007,768 | $46,731,565 |
| Net realized losses | | (4,048,026) | (3,947,311) |
| Net change in unrealized appreciation (depreciation) | + | (44,683,963) | 23,021,737 |
| Increase in net assets resulting from operations | | 14,275,779 | 65,805,991 |
| Distributions to Shareholders | |
| Distributions from net investment income | | ($30,629,135) | ($46,465,385) |
| Transactions in Fund Shares | | | |
| | | 1/1/18-6/30/18 | 1/1/17-12/31/17 |
| | | SHARES | VALUE | SHARES | VALUE |
| Shares sold | | 49,050,000 | $2,683,123,245 | 24,750,000 | $1,367,959,304 |
| Shares redeemed | + | (1,800,000) | (98,702,504) | (2,200,000) | (121,891,683) |
| Net transactions in fund shares | | 47,250,000 | $2,584,420,741 | 22,550,000 | $1,246,067,621 |
| Shares Outstanding and Net Assets | | | |
| | | 1/1/18-6/30/18 | 1/1/17-12/31/17 |
| | | SHARES | NET ASSETS | SHARES | NET ASSETS |
| Beginning of period | | 52,000,000 | $2,880,385,502 | 29,450,000 | $1,614,977,275 |
| Total increase | + | 47,250,000 | 2,568,067,385 | 22,550,000 | 1,265,408,227 |
| End of period | | 99,250,000 | $5,448,452,887 | 52,000,000 | $2,880,385,502 |
| Net investment income not yet distributed | | | $32,966,152 | | $587,519 |
Schwab Fixed-Income ETFs | Semiannual Report
Schwab Short-Term U.S. Treasury ETF
Financial Statements
Financial Highlights
| | 1/1/18–
6/30/18* | 1/1/17–
12/31/17 | 1/1/16–
12/31/16 | 1/1/15–
12/31/15 | 1/1/14–
12/31/14 | 1/1/13–
12/31/13 |
| Per-Share Data |
| Net asset value at beginning of period | $50.03 | $50.41 | $50.43 | $50.55 | $50.51 | $50.53 |
| Income (loss) from investment operations: | | | | | | |
| Net investment income (loss) | 0.39 1 | 0.57 1 | 0.42 1 | 0.35 1 | 0.24 | 0.15 |
| Net realized and unrealized gains (losses) | (0.39) | (0.39) | (0.03) | (0.13) | 0.04 | (0.02) |
| Total from investment operations | 0.00 2 | 0.18 | 0.39 | 0.22 | 0.28 | 0.13 |
| Less distributions: | | | | | | |
| Distributions from net investment income | (0.31) | (0.56) | (0.41) | (0.34) | (0.24) | (0.15) |
| Net asset value at end of period | $49.72 | $50.03 | $50.41 | $50.43 | $50.55 | $50.51 |
| Total return | 0.01% 3 | 0.35% | 0.78% | 0.44% | 0.55% | 0.25% |
| Ratios/Supplemental Data |
| Ratios to average net assets: | | | | | | |
| Total expenses | 0.06% 4 | 0.06% | 0.08% 5 | 0.08% | 0.08% | 0.08% |
| Net investment income (loss) | 1.60% 4 | 1.13% | 0.83% | 0.69% | 0.49% | 0.31% |
| Portfolio turnover rate6 | 31% 3 | 65% | 66% | 89% | 109% | 101% |
| Net assets, end of period (x 1,000) | $2,618,003 | $2,181,398 | $1,414,092 | $1,071,573 | $702,651 | $444,497 |
| |
1
Calculated based on the average shares outstanding during the period.
2
Per-share amount was less than $0.005.
3
Not annualized.
4
Annualized.
5
Effective December 29, 2016, the annual operating expense ratio was reduced. The ratio presented for the period ended 12/31/16 is a blended ratio.
6
Portfolio turnover rate excludes securities received or delivered from processing of in-kind creations or redemptions.
Schwab Fixed-Income ETFs | Semiannual Report
Schwab Short-Term U.S. Treasury ETF
Portfolio Holdings as of June 30, 2018 (Unaudited)
This section shows all the securities in the fund’s portfolio and their values as of the report date.
The fund files its complete schedule of portfolio holdings with the SEC for the first and third quarters of each fiscal year on Form N-Q. The fund’s Form N-Q is available on the SEC’s website at www.sec.gov and may be viewed and copied at the SEC’s Public Reference Room in Washington, D.C. Call 1-800-SEC-0330 for information on the operation of the Public Reference Room. The fund also makes available its complete schedule of portfolio holdings on a daily basis on the fund’s website at www.schwabfunds.com/schwabetfs_prospectus.
For fixed rate obligations, the rate shown is the interest rate (the rate established when the obligation was issued). For variable rate obligations, the rate shown is the rate as of the report date based on each security’s rate reset date. The reference rate and spread used is shown parenthetically in the security description if available; if not the reference rate is described in a footnote. The maturity date shown for all the securities is the final legal maturity.
Security
Rate, Maturity Date | Face
Amount ($) | Value ($) |
| Treasuries 99.5% of net assets |
| Bonds |
| 8.13%, 08/15/19 | 5,701,000 | 6,057,981 |
| 8.50%, 02/15/20 | 3,286,000 | 3,599,774 |
| 8.75%, 05/15/20 | 2,428,000 | 2,706,366 |
| 8.75%, 08/15/20 | 4,946,000 | 5,575,166 |
| 7.88%, 02/15/21 | 2,120,000 | 2,402,639 |
| Notes |
| 0.75%, 07/15/19 | 24,366,000 | 23,964,818 |
| 0.88%, 07/31/19 | 17,383,000 | 17,104,940 |
| 1.38%, 07/31/19 | 27,755,000 | 27,457,393 |
| 1.63%, 07/31/19 | 35,313,000 | 35,026,772 |
| 0.75%, 08/15/19 | 23,262,000 | 22,839,468 |
| 3.63%, 08/15/19 | 26,881,000 | 27,241,163 |
| 1.00%, 08/31/19 | 22,118,000 | 21,761,606 |
| 1.25%, 08/31/19 | 6,839,000 | 6,748,437 |
| 1.63%, 08/31/19 | 40,735,000 | 40,370,613 |
| 0.88%, 09/15/19 | 26,009,000 | 25,532,518 |
| 1.00%, 09/30/19 | 19,017,000 | 18,686,060 |
| 1.38%, 09/30/19 | 25,226,000 | 24,900,821 |
| 1.75%, 09/30/19 | 37,260,000 | 36,949,985 |
| 1.00%, 10/15/19 | 23,717,000 | 23,287,129 |
| 1.25%, 10/31/19 | 14,096,000 | 13,877,127 |
| 1.50%, 10/31/19 | 63,068,000 | 62,293,199 |
| 1.00%, 11/15/19 | 24,095,000 | 23,624,865 |
| 3.38%, 11/15/19 | 37,429,000 | 37,884,435 |
| 1.00%, 11/30/19 | 22,698,000 | 22,240,937 |
| 1.50%, 11/30/19 | 36,368,000 | 35,882,857 |
| 1.75%, 11/30/19 | 25,243,000 | 24,992,049 |
| 1.38%, 12/15/19 | 24,762,000 | 24,377,512 |
| 1.13%, 12/31/19 | 22,434,000 | 21,991,892 |
| 1.63%, 12/31/19 | 35,910,000 | 35,469,542 |
| 1.88%, 12/31/19 | 24,462,000 | 24,246,524 |
| 1.38%, 01/15/20 | 24,590,000 | 24,179,366 |
| 1.25%, 01/31/20 | 36,524,000 | 35,829,901 |
| 1.38%, 01/31/20 | 20,393,000 | 20,045,283 |
| 2.00%, 01/31/20 | 22,038,000 | 21,874,867 |
| 1.38%, 02/15/20 | 25,088,000 | 24,643,570 |
| 3.63%, 02/15/20 | 44,019,000 | 44,802,229 |
| 1.25%, 02/29/20 | 21,571,000 | 21,131,575 |
| 1.38%, 02/29/20 | 35,462,000 | 34,812,325 |
| 2.25%, 02/29/20 | 25,563,000 | 25,461,147 |
| 1.63%, 03/15/20 | 25,557,000 | 25,181,132 |
| 1.13%, 03/31/20 | 18,458,000 | 18,022,507 |
| 1.38%, 03/31/20 | 33,570,000 | 32,921,548 |
| 2.25%, 03/31/20 | 26,414,000 | 26,297,407 |
| 1.50%, 04/15/20 | 25,679,000 | 25,225,605 |
| 1.13%, 04/30/20 | 25,688,000 | 25,052,322 |
| 1.38%, 04/30/20 | 33,992,000 | 33,301,537 |
| 2.38%, 04/30/20 | 46,534,000 | 46,419,483 |
| 1.50%, 05/15/20 | 24,681,000 | 24,224,016 |
| 3.50%, 05/15/20 | 33,493,000 | 34,086,978 |
Security
Rate, Maturity Date | Face
Amount ($) | Value ($) |
| 1.38%, 05/31/20 | 25,545,000 | 24,996,181 |
| 1.50%, 05/31/20 | 36,655,000 | 35,953,401 |
| 1.50%, 06/15/20 | 24,804,000 | 24,321,000 |
| 1.63%, 06/30/20 | 36,748,000 | 36,102,039 |
| 1.88%, 06/30/20 | 16,900,000 | 16,685,119 |
| 2.50%, 06/30/20 | 22,000,000 | 21,988,398 |
| 1.50%, 07/15/20 | 25,471,000 | 24,947,650 |
| 1.63%, 07/31/20 | 41,655,000 | 40,877,223 |
| 2.00%, 07/31/20 | 24,121,000 | 23,854,821 |
| 1.50%, 08/15/20 | 24,713,000 | 24,180,126 |
| 2.63%, 08/15/20 | 36,478,000 | 36,530,010 |
| 1.38%, 08/31/20 | 36,366,000 | 35,468,214 |
| 2.13%, 08/31/20 | 27,328,000 | 27,083,009 |
| 1.38%, 09/15/20 | 24,301,000 | 23,689,203 |
| 1.38%, 09/30/20 | 37,176,000 | 36,215,378 |
| 2.00%, 09/30/20 | 21,576,000 | 21,311,357 |
| 1.63%, 10/15/20 | 24,503,000 | 23,991,883 |
| 1.38%, 10/31/20 | 35,973,000 | 35,000,605 |
| 1.75%, 10/31/20 | 29,421,000 | 28,876,252 |
| 1.75%, 11/15/20 | 23,474,000 | 23,029,278 |
| 2.63%, 11/15/20 | 55,905,000 | 55,966,146 |
| 1.63%, 11/30/20 | 34,091,000 | 33,331,277 |
| 2.00%, 11/30/20 | 22,309,000 | 22,007,480 |
| 1.88%, 12/15/20 | 24,610,000 | 24,199,513 |
| 1.75%, 12/31/20 | 35,310,000 | 34,599,662 |
| 2.38%, 12/31/20 | 21,659,000 | 21,550,282 |
| 2.00%, 01/15/21 | 24,234,000 | 23,882,796 |
| 1.38%, 01/31/21 | 34,914,000 | 33,853,624 |
| 2.13%, 01/31/21 | 26,017,000 | 25,711,605 |
| 2.25%, 02/15/21 | 27,085,000 | 26,849,064 |
| 3.63%, 02/15/21 | 46,826,000 | 48,031,404 |
| 1.13%, 02/28/21 | 35,934,000 | 34,579,457 |
| 2.00%, 02/28/21 | 27,444,000 | 27,021,084 |
| 2.38%, 03/15/21 | 28,109,000 | 27,942,103 |
| 1.25%, 03/31/21 | 34,676,000 | 33,437,281 |
| 2.25%, 03/31/21 | 25,212,000 | 24,973,668 |
| 2.38%, 04/15/21 | 55,803,000 | 55,452,052 |
| 1.38%, 04/30/21 | 47,263,000 | 45,677,105 |
| 2.63%, 05/15/21 | 31,476,000 | 31,481,533 |
| 3.13%, 05/15/21 | 38,632,000 | 39,173,754 |
| 1.38%, 05/31/21 | 44,729,000 | 43,172,221 |
| 2.63%, 06/15/21 | 28,500,000 | 28,506,123 |
| 1.13%, 06/30/21 | 60,000,000 | 57,417,187 |
| Total Treasuries |
| (Cost $2,634,445,678) | | 2,606,524,954 |
Schwab Fixed-Income ETFs | Semiannual Report
Schwab Short-Term U.S. Treasury ETF
Portfolio Holdings as of June 30, 2018 (Unaudited) (continued)
| Security | Number
of Shares | Value ($) |
| Other Investment Company 0.1% of net assets |
| |
| Money Market Fund 0.1% |
| State Street Institutional U.S. Government Money Market Fund, Premier Class 1.82% (a) | 1,357,014 | 1,357,014 |
| Total Other Investment Company |
| (Cost $1,357,014) | | 1,357,014 |
| (a) | The rate shown is the 7-day yield. |
The following is a summary of the inputs used to value the fund’s investments as of June 30, 2018 (see financial note 2(a) for additional information):
| Description | Quoted Prices in
Active Markets for
Identical Assets
(Level 1) | Other Significant
Observable Inputs
(Level 2) | Significant
Unobservable Inputs
(Level 3) | Total | |
| Assets | | | | | |
| Treasuries | $— | $2,606,524,954 | $— | $2,606,524,954 | |
| Other Investment Company1 | 1,357,014 | — | — | 1,357,014 | |
| Total | $1,357,014 | $2,606,524,954 | $— | $2,607,881,968 | |
| 1 | As categorized in Portfolio Holdings. |
The fund’s policy is to recognize transfers between Level 1, Level 2 and Level 3 as of the beginning of the fiscal year. There were no transfers between Level 1, Level 2 and Level 3 for the period ended June 30, 2018. Fund investments in underlying mutual funds are classified as Level 1, without consideration to the classification level of the investments held by the underlying mutual funds, which could be Level 1, Level 2 or Level 3.
Schwab Fixed-Income ETFs | Semiannual Report
Schwab Short-Term U.S. Treasury ETF
Statement of Assets and Liabilities
As of June 30, 2018; unaudited
| Assets |
| Investments in unaffiliated issuers, at value (cost $2,635,802,692) | | $2,607,881,968 |
| Receivables: | | |
| Investments sold | | 99,854,652 |
| Interest | | 13,375,211 |
| Fund shares sold | | 4,972,472 |
| Dividends | + | 1,622 |
| Total assets | | 2,726,085,925 |
| Liabilities |
| Payables: | | |
| Investments bought | | 107,954,369 |
| Investment adviser fees | + | 129,032 |
| Total liabilities | | 108,083,401 |
| Net Assets |
| Total assets | | 2,726,085,925 |
| Total liabilities | – | 108,083,401 |
| Net assets | | $2,618,002,524 |
| Net Assets by Source | | |
| Capital received from investors | | 2,654,310,099 |
| Net investment income not yet distributed | | 3,735,329 |
| Net realized capital losses | | (12,122,180) |
| Net unrealized capital depreciation | | (27,920,724) |
| Net Asset Value (NAV) |
| Net Assets | ÷ | Shares
Outstanding | = | NAV |
| $2,618,002,524 | | 52,650,000 | | $49.72 |
| | | | | |
Schwab Fixed-Income ETFs | Semiannual Report
Schwab Short-Term U.S. Treasury ETF
Statement of Operations
For the period January 1, 2018 through June 30, 2018; unaudited
| Investment Income |
| Dividends | | $13,189 |
| Interest | + | 19,611,730 |
| Total investment income | | 19,624,919 |
| Expenses |
| Investment adviser fees | | 709,640 |
| Total expenses | – | 709,640 |
| Net investment income | | 18,915,279 |
| Realized and Unrealized Gains (Losses) |
| Net realized losses on investments | | (7,051,108) |
| Net realized gains on in-kind redemptions | + | 38,856 |
| Net realized losses | | (7,012,252) |
| Net change in unrealized appreciation (depreciation) on investments | + | (9,975,530) |
| Net realized and unrealized losses | | (16,987,782) |
| Increase in net assets resulting from operations | | $1,927,497 |
Schwab Fixed-Income ETFs | Semiannual Report
Schwab Short-Term U.S. Treasury ETF
Statement of Changes in Net Assets
For the current and prior report periods
Figures for the current period are unaudited
| Operations | |
| | 1/1/18-6/30/18 | 1/1/17-12/31/17 |
| Net investment income | | $18,915,279 | $20,456,466 |
| Net realized losses | | (7,012,252) | (4,201,781) |
| Net change in unrealized appreciation (depreciation) | + | (9,975,530) | (11,926,446) |
| Increase in net assets resulting from operations | | 1,927,497 | 4,328,239 |
| Distributions to Shareholders | |
| Distributions from net investment income | | ($15,152,875) | ($20,557,590) |
| Transactions in Fund Shares | | | |
| | | 1/1/18-6/30/18 | 1/1/17-12/31/17 |
| | | SHARES | VALUE | SHARES | VALUE |
| Shares sold | | 13,600,000 | $675,924,949 | 23,100,000 | $1,163,271,626 |
| Shares redeemed | + | (4,550,000) | (226,095,514) | (7,550,000) | (379,735,412) |
| Net transactions in fund shares | | 9,050,000 | $449,829,435 | 15,550,000 | $783,536,214 |
| Shares Outstanding and Net Assets | | | |
| | | 1/1/18-6/30/18 | 1/1/17-12/31/17 |
| | | SHARES | NET ASSETS | SHARES | NET ASSETS |
| Beginning of period | | 43,600,000 | $2,181,398,467 | 28,050,000 | $1,414,091,604 |
| Total increase | + | 9,050,000 | 436,604,057 | 15,550,000 | 767,306,863 |
| End of period | | 52,650,000 | $2,618,002,524 | 43,600,000 | $2,181,398,467 |
| Net investment income not yet distributed/Distributions in excess of net investment income | | | $3,735,329 | | ($27,075) |
Schwab Fixed-Income ETFs | Semiannual Report
Schwab Intermediate-Term U.S. Treasury ETF
Financial Statements
Financial Highlights
| | 1/1/18–
6/30/18* | 1/1/17–
12/31/17 | 1/1/16–
12/31/16 | 1/1/15–
12/31/15 | 1/1/14–
12/31/14 | 1/1/13–
12/31/13 |
| Per-Share Data |
| Net asset value at beginning of period | $53.35 | $53.41 | $53.55 | $53.52 | $52.08 | $54.18 |
| Income (loss) from investment operations: | | | | | | |
| Net investment income (loss) | 0.54 1 | 0.89 1 | 0.79 1 | 0.85 1 | 0.77 | 0.56 |
| Net realized and unrealized gains (losses) | (1.19) | (0.07) | (0.15) | 0.02 2 | 1.44 | (2.10) |
| Total from investment operations | (0.65) | 0.82 | 0.64 | 0.87 | 2.21 | (1.54) |
| Less distributions: | | | | | | |
| Distributions from net investment income | (0.39) | (0.88) | (0.78) | (0.84) | (0.77) | (0.56) |
| Net asset value at end of period | $52.31 | $53.35 | $53.41 | $53.55 | $53.52 | $52.08 |
| Total return | (1.22%) 3 | 1.54% | 1.16% | 1.62% | 4.27% | (2.86%) |
| Ratios/Supplemental Data |
| Ratios to average net assets: | | | | | | |
| Total expenses | 0.06% 4 | 0.06% | 0.09% 5 | 0.10% 6 | 0.10% | 0.10% |
| Net investment income (loss) | 2.08% 4 | 1.66% | 1.44% | 1.59% | 1.43% | 1.06% |
| Portfolio turnover rate7 | 17% 3 | 30% | 30% | 32% | 49% | 54% |
| Net assets, end of period (x 1,000) | $2,769,897 | $1,165,708 | $790,506 | $441,747 | $254,226 | $236,969 |
| |
1
Calculated based on the average shares outstanding during the period.
2
The per share amount does not accord with the change in aggregate gains and losses in securities on the Statement of Operations during the period because of the timing of sales and repurchases of fund shares in relation to fluctuating market values.
3
Not annualized.
4
Annualized.
5
Effective December 29, 2016, the annual operating expense ratio was reduced. The ratio presented for the period ended 12/31/16 is a blended ratio.
6
Effective February 24, 2015, the annual operating expense ratio was reduced. The ratio presented for the period ended 12/31/15 is a blended ratio.
7
Portfolio turnover rate excludes securities received or delivered from processing of in-kind creations or redemptions.
Schwab Fixed-Income ETFs | Semiannual Report
Schwab Intermediate-Term U.S. Treasury ETF
Portfolio Holdings as of June 30, 2018 (Unaudited)
This section shows all the securities in the fund’s portfolio and their values as of the report date.
The fund files its complete schedule of portfolio holdings with the SEC for the first and third quarters of each fiscal year on Form N-Q. The fund’s Form N-Q is available on the SEC’s website at www.sec.gov and may be viewed and copied at the SEC’s Public Reference Room in Washington, D.C. Call 1-800-SEC-0330 for information on the operation of the Public Reference Room. The fund also makes available its complete schedule of portfolio holdings on a daily basis on the fund’s website at www.schwabfunds.com/schwabetfs_prospectus.
For fixed rate obligations, the rate shown is the interest rate (the rate established when the obligation was issued). For variable rate obligations, the rate shown is the rate as of the report date based on each security’s rate reset date. The reference rate and spread used is shown parenthetically in the security description if available; if not the reference rate is described in a footnote. The maturity date shown for all the securities is the final legal maturity.
Security
Rate, Maturity Date | Face
Amount ($) | Value ($) |
| Treasuries 99.5% of net assets |
| Bonds |
| 8.13%, 08/15/21 | 3,245,000 | 3,777,129 |
| 8.00%, 11/15/21 | 5,689,000 | 6,665,908 |
| 7.25%, 08/15/22 | 2,425,000 | 2,855,438 |
| 7.63%, 11/15/22 | 1,159,000 | 1,393,041 |
| 7.13%, 02/15/23 | 6,468,000 | 7,698,436 |
| 6.25%, 08/15/23 | 6,367,000 | 7,432,353 |
| 7.50%, 11/15/24 | 5,786,000 | 7,374,664 |
| 7.63%, 02/15/25 | 2,268,000 | 2,926,517 |
| 6.88%, 08/15/25 | 3,352,000 | 4,231,442 |
| 6.00%, 02/15/26 | 5,566,000 | 6,779,866 |
| 6.75%, 08/15/26 | 3,679,000 | 4,729,527 |
| 6.50%, 11/15/26 | 2,823,000 | 3,595,465 |
| 6.63%, 02/15/27 | 3,644,000 | 4,701,756 |
| 6.38%, 08/15/27 | 2,206,000 | 2,832,297 |
| 6.13%, 11/15/27 | 6,548,000 | 8,306,240 |
| Notes |
| 1.13%, 07/31/21 | 40,550,000 | 38,753,762 |
| 2.25%, 07/31/21 | 20,127,000 | 19,902,537 |
| 2.13%, 08/15/21 | 29,194,000 | 28,747,537 |
| 1.13%, 08/31/21 | 24,812,000 | 23,675,106 |
| 2.00%, 08/31/21 | 24,611,000 | 24,134,162 |
| 1.13%, 09/30/21 | 27,718,000 | 26,410,069 |
| 2.13%, 09/30/21 | 19,160,000 | 18,852,018 |
| 1.25%, 10/31/21 | 37,042,000 | 35,395,368 |
| 2.00%, 10/31/21 | 19,438,000 | 19,034,434 |
| 2.00%, 11/15/21 | 26,327,000 | 25,777,835 |
| 1.75%, 11/30/21 | 23,653,000 | 22,958,193 |
| 1.88%, 11/30/21 | 19,131,000 | 18,647,120 |
| 2.00%, 12/31/21 | 24,322,000 | 23,785,681 |
| 2.13%, 12/31/21 | 30,509,000 | 29,964,367 |
| 1.50%, 01/31/22 | 26,616,000 | 25,554,479 |
| 1.88%, 01/31/22 | 22,311,000 | 21,707,906 |
| 2.00%, 02/15/22 | 19,435,000 | 18,988,982 |
| 1.75%, 02/28/22 | 19,284,000 | 18,662,543 |
| 1.88%, 02/28/22 | 21,278,000 | 20,687,868 |
| 1.75%, 03/31/22 | 20,360,000 | 19,688,756 |
| 1.88%, 03/31/22 | 20,434,000 | 19,850,114 |
| 1.75%, 04/30/22 | 21,499,000 | 20,767,530 |
| 1.88%, 04/30/22 | 20,127,000 | 19,533,018 |
| 1.75%, 05/15/22 | 18,240,000 | 17,613,356 |
| 1.75%, 05/31/22 | 25,402,000 | 24,515,907 |
| 1.88%, 05/31/22 | 21,511,000 | 20,864,410 |
| 1.75%, 06/30/22 | 23,447,000 | 22,609,869 |
| 2.13%, 06/30/22 | 20,172,000 | 19,739,405 |
| 1.88%, 07/31/22 | 20,714,000 | 20,056,169 |
| 2.00%, 07/31/22 | 20,696,000 | 20,138,178 |
| 1.63%, 08/15/22 | 22,348,000 | 21,411,305 |
| 1.63%, 08/31/22 | 30,544,000 | 29,256,022 |
| 1.88%, 08/31/22 | 18,329,000 | 17,734,381 |
| 1.75%, 09/30/22 | 27,757,000 | 26,702,559 |
Security
Rate, Maturity Date | Face
Amount ($) | Value ($) |
| 1.88%, 09/30/22 | 20,262,000 | 19,591,217 |
| 1.88%, 10/31/22 | 17,036,000 | 16,458,706 |
| 2.00%, 10/31/22 | 20,268,000 | 19,682,128 |
| 1.63%, 11/15/22 | 26,365,000 | 25,189,904 |
| 2.00%, 11/30/22 | 45,486,000 | 44,151,625 |
| 2.13%, 12/31/22 | 39,095,000 | 38,118,389 |
| 1.75%, 01/31/23 | 17,174,000 | 16,459,870 |
| 2.38%, 01/31/23 | 34,946,000 | 34,429,318 |
| 2.00%, 02/15/23 | 40,267,000 | 39,018,094 |
| 1.50%, 02/28/23 | 18,330,000 | 17,355,503 |
| 2.63%, 02/28/23 | 26,223,000 | 26,120,566 |
| 1.50%, 03/31/23 | 19,302,000 | 18,257,732 |
| 2.50%, 03/31/23 | 25,520,000 | 25,267,791 |
| 1.63%, 04/30/23 | 17,174,000 | 16,319,325 |
| 2.75%, 04/30/23 | 30,074,000 | 30,106,893 |
| 1.75%, 05/15/23 | 33,045,000 | 31,576,692 |
| 1.63%, 05/31/23 | 31,706,000 | 30,106,457 |
| 2.75%, 05/31/23 | 27,617,000 | 27,654,758 |
| 1.38%, 06/30/23 | 21,012,000 | 19,683,155 |
| 2.63%, 06/30/23 | 52,000,000 | 51,751,172 |
| 1.25%, 07/31/23 | 19,275,000 | 17,914,456 |
| 2.50%, 08/15/23 | 30,157,000 | 29,807,721 |
| 1.38%, 08/31/23 | 18,616,000 | 17,387,788 |
| 1.38%, 09/30/23 | 19,157,000 | 17,868,401 |
| 1.63%, 10/31/23 | 18,996,000 | 17,934,895 |
| 2.75%, 11/15/23 | 31,210,000 | 31,203,904 |
| 2.13%, 11/30/23 | 18,457,000 | 17,868,683 |
| 2.25%, 12/31/23 | 25,573,000 | 24,902,708 |
| 2.25%, 01/31/24 | 19,029,000 | 18,517,596 |
| 2.75%, 02/15/24 | 40,060,000 | 40,014,620 |
| 2.13%, 02/29/24 | 21,409,000 | 20,683,101 |
| 2.13%, 03/31/24 | 20,181,000 | 19,483,337 |
| 2.00%, 04/30/24 | 20,724,000 | 19,854,564 |
| 2.50%, 05/15/24 | 45,492,000 | 44,785,630 |
| 2.00%, 05/31/24 | 19,133,000 | 18,315,363 |
| 2.00%, 06/30/24 | 23,398,000 | 22,380,278 |
| 2.13%, 07/31/24 | 20,274,000 | 19,517,685 |
| 2.38%, 08/15/24 | 46,428,000 | 45,331,683 |
| 1.88%, 08/31/24 | 22,167,000 | 21,030,075 |
| 2.13%, 09/30/24 | 20,241,000 | 19,461,010 |
| 2.25%, 10/31/24 | 18,244,000 | 17,662,829 |
| 2.25%, 11/15/24 | 46,620,000 | 45,116,687 |
| 2.13%, 11/30/24 | 20,291,000 | 19,486,494 |
| 2.25%, 12/31/24 | 18,061,000 | 17,469,079 |
| 2.50%, 01/31/25 | 25,703,000 | 25,237,635 |
| 2.00%, 02/15/25 | 47,035,000 | 44,742,044 |
| 2.75%, 02/28/25 | 27,681,000 | 27,586,387 |
| 2.63%, 03/31/25 | 18,378,000 | 18,170,889 |
| 2.88%, 04/30/25 | 26,975,000 | 27,084,059 |
| 2.13%, 05/15/25 | 47,570,000 | 45,529,693 |
| 2.88%, 05/31/25 | 32,509,000 | 32,637,893 |
| 2.75%, 06/30/25 | 17,100,000 | 17,029,195 |
| 2.00%, 08/15/25 | 48,783,000 | 46,219,034 |
| 2.25%, 11/15/25 | 47,763,000 | 45,944,834 |
Schwab Fixed-Income ETFs | Semiannual Report
Schwab Intermediate-Term U.S. Treasury ETF
Portfolio Holdings as of June 30, 2018 (Unaudited) (continued)
Security
Rate, Maturity Date | Face
Amount ($) | Value ($) |
| 1.63%, 02/15/26 | 48,449,000 | 44,456,689 |
| 1.63%, 05/15/26 | 46,534,000 | 42,574,065 |
| 1.50%, 08/15/26 | 46,736,000 | 42,210,296 |
| 2.00%, 11/15/26 | 47,540,000 | 44,560,393 |
| 2.25%, 02/15/27 | 45,573,000 | 43,496,402 |
| 2.38%, 05/15/27 | 44,922,000 | 43,267,256 |
| 2.25%, 08/15/27 | 45,920,000 | 43,712,790 |
| 2.25%, 11/15/27 | 47,023,000 | 44,707,668 |
| 2.75%, 02/15/28 | 51,820,000 | 51,385,805 |
| 2.88%, 05/15/28 | 36,591,000 | 36,668,899 |
| Total Treasuries |
| (Cost $2,799,724,634) | | 2,755,940,833 |
Security
Rate, Maturity Date | Face
Amount ($) | Value ($) |
| Other Investment Company 0.0% of net assets |
| |
| Money Market Fund 0.0% |
| State Street Institutional U.S. Government Money Market Fund, Premier Class 1.82% (a) | 987,828 | 987,828 |
| Total Other Investment Company |
| (Cost $987,828) | | 987,828 |
| (a) | The rate shown is the 7-day yield. |
The following is a summary of the inputs used to value the fund’s investments as of June 30, 2018 and reflects the complete schedule of portfolio holdings (see financial note 2(a) for additional information):
| Description | Quoted Prices in
Active Markets for
Identical Assets
(Level 1) | Other Significant
Observable Inputs
(Level 2) | Significant
Unobservable Inputs
(Level 3) | Total | |
| Assets | | | | | |
| Treasuries | $— | $2,755,940,833 | $— | $2,755,940,833 | |
| Other Investment Company1 | 987,828 | — | — | 987,828 | |
| Total | $987,828 | $2,755,940,833 | $— | $2,756,928,661 | |
| 1 | As categorized in Portfolio Holdings. |
The fund’s policy is to recognize transfers between Level 1, Level 2 and Level 3 as of the beginning of the fiscal year. There were no transfers between Level 1, Level 2 and Level 3 for the period ended June 30, 2018. Fund investments in underlying mutual funds are classified as Level 1, without consideration to the classification level of the investments held by the underlying mutual funds, which could be Level 1, Level 2 or Level 3.
Schwab Fixed-Income ETFs | Semiannual Report
Schwab Intermediate-Term U.S. Treasury ETF
Statement of Assets and Liabilities
As of June 30, 2018; unaudited
| Assets |
| Investments in unaffiliated issuers, at value (cost $2,800,712,462) | | $2,756,928,661 |
| Receivables: | | |
| Investments sold | | 96,231,295 |
| Interest | | 16,758,731 |
| Fund shares sold | | 2,615,563 |
| Dividends | + | 1,018 |
| Total assets | | 2,872,535,268 |
| Liabilities |
| Payables: | | |
| Investments bought | | 102,507,451 |
| Investment adviser fees | + | 130,615 |
| Total liabilities | | 102,638,066 |
| Net Assets |
| Total assets | | 2,872,535,268 |
| Total liabilities | – | 102,638,066 |
| Net assets | | $2,769,897,202 |
| Net Assets by Source | | |
| Capital received from investors | | 2,819,777,493 |
| Net investment income not yet distributed | | 5,038,958 |
| Net realized capital losses | | (11,135,448) |
| Net unrealized capital depreciation | | (43,783,801) |
| Net Asset Value (NAV) |
| Net Assets | ÷ | Shares
Outstanding | = | NAV |
| $2,769,897,202 | | 52,950,000 | | $52.31 |
| | | | | |
Schwab Fixed-Income ETFs | Semiannual Report
Schwab Intermediate-Term U.S. Treasury ETF
Statement of Operations
For the period January 1, 2018 through June 30, 2018; unaudited
| Investment Income |
| Dividends | | $8,293 |
| Interest | + | 16,040,068 |
| Total investment income | | 16,048,361 |
| Expenses |
| Investment adviser fees | | 449,049 |
| Total expenses | – | 449,049 |
| Net investment income | | 15,599,312 |
| Realized and Unrealized Gains (Losses) |
| Net realized losses on investments | | (6,780,411) |
| Net realized gains on in-kind redemptions | + | 5,314 |
| Net realized losses | | (6,775,097) |
| Net change in unrealized appreciation (depreciation) on investments | + | (22,432,700) |
| Net realized and unrealized losses | | (29,207,797) |
| Decrease in net assets resulting from operations | | ($13,608,485) |
Schwab Fixed-Income ETFs | Semiannual Report
Schwab Intermediate-Term U.S. Treasury ETF
Statement of Changes in Net Assets
For the current and prior report periods
Figures for the current period are unaudited
| Operations | |
| | 1/1/18-6/30/18 | 1/1/17-12/31/17 |
| Net investment income | | $15,599,312 | $16,436,695 |
| Net realized losses | | (6,775,097) | (1,961,408) |
| Net change in unrealized appreciation (depreciation) | + | (22,432,700) | (2,252,440) |
| Increase (decrease) in net assets resulting from operations | | (13,608,485) | 12,222,847 |
| Distributions to Shareholders | |
| Distributions from net investment income | | ($10,586,095) | ($16,446,695) |
| Transactions in Fund Shares | | | |
| | | 1/1/18-6/30/18 | 1/1/17-12/31/17 |
| | | SHARES | VALUE | SHARES | VALUE |
| Shares sold | | 31,450,000 | $1,646,704,222 | 8,450,000 | $454,993,243 |
| Shares redeemed | + | (350,000) | (18,320,026) | (1,400,000) | (75,567,594) |
| Net transactions in fund shares | | 31,100,000 | $1,628,384,196 | 7,050,000 | $379,425,649 |
| Shares Outstanding and Net Assets | | | |
| | | 1/1/18-6/30/18 | 1/1/17-12/31/17 |
| | | SHARES | NET ASSETS | SHARES | NET ASSETS |
| Beginning of period | | 21,850,000 | $1,165,707,586 | 14,800,000 | $790,505,785 |
| Total increase | + | 31,100,000 | 1,604,189,616 | 7,050,000 | 375,201,801 |
| End of period | | 52,950,000 | $2,769,897,202 | 21,850,000 | $1,165,707,586 |
| Net investment income not yet distributed | | | $5,038,958 | | $25,741 |
Schwab Fixed-Income ETFs | Semiannual Report
Schwab U.S. Aggregate Bond ETF
Financial Statements
Financial Highlights
| | 1/1/18–
6/30/18* | 1/1/17–
12/31/17 | 1/1/16–
12/31/16 | 1/1/15–
12/31/15 | 1/1/14–
12/31/14 | 1/1/13–
12/31/13 |
| Per-Share Data |
| Net asset value at beginning of period | $52.07 | $51.55 | $51.41 | $52.20 | $50.28 | $52.43 |
| Income (loss) from investment operations: | | | | | | |
| Net investment income (loss) | 0.65 1 | 1.18 1 | 1.06 1 | 1.00 1 | 1.00 | 0.83 |
| Net realized and unrealized gains (losses) | (1.53) | 0.59 | 0.23 2 | (0.71) | 1.98 | (1.97) |
| Total from investment operations | (0.88) | 1.77 | 1.29 | 0.29 | 2.98 | (1.14) |
| Less distributions: | | | | | | |
| Distributions from net investment income | (0.57) | (1.25) | (1.15) | (1.08) | (1.06) | (1.01) |
| Net asset value at end of period | $50.62 | $52.07 | $51.55 | $51.41 | $52.20 | $50.28 |
| Total return | (1.69%) 3 | 3.46% | 2.49% | 0.56% | 5.97% | (2.19%) |
| Ratios/Supplemental Data |
| Ratios to average net assets: | | | | | | |
| Total expenses | 0.04% 4 | 0.04% | 0.05% 5 | 0.05% | 0.05% | 0.06% 6 |
| Net investment income (loss) | 2.58% 4 | 2.26% | 2.01% | 1.92% | 1.96% | 1.59% |
| Portfolio turnover rate7,8 | 43% 3 | 101% | 119% | 104% 9 | 74% | 152% |
| Net assets, end of period (x 1,000) | $5,173,391 | $4,925,693 | $3,309,447 | $2,102,482 | $1,226,778 | $497,801 |
| |
1
Calculated based on the average shares outstanding during the period.
2
The per share amount does not accord with the change in aggregate gains and losses in securities on the Statement of Operations during the period because of the timing of sales and repurchases of fund shares in relation to fluctuating market values.
3
Not annualized.
4
Annualized.
5
Effective October 7, 2016, the annual operating expense ratio was reduced. The ratio presented for the period ended 12/31/16 is a blended ratio.
6
The expense ratio would have been 0.05%, if interest expense related to charges on agency mortgage-backed securities not delivered on a timely basis had not been incurred.
7
Portfolio turnover rate excludes securities received or delivered from processing of in-kind creations or redemptions.
8
Includes to-be-announced (TBA) transactions. (See financial note 2)
9
Revised methodology adopted as of December 31, 2015. For comparison purposes, portfolio turnover rate would have been 146% using previous methodology.
Schwab Fixed-Income ETFs | Semiannual Report
Schwab U.S. Aggregate Bond ETF
Portfolio Holdings as of June 30, 2018 (Unaudited)
This section shows all the securities in the fund’s portfolio and their values as of the report date.
The fund files its complete schedule of portfolio holdings with the SEC for the first and third quarters of each fiscal year on Form N-Q. The fund’s Form N-Q is available on the SEC’s website at www.sec.gov and may be viewed and copied at the SEC’s Public Reference Room in Washington, D.C. Call 1-800-SEC-0330 for information on the operation of the Public Reference Room. The fund also makes available its complete schedule of portfolio holdings on a daily basis on the fund’s website at www.schwabfunds.com/schwabetfs_prospectus.
For fixed rate obligations, the rate shown is the interest rate (the rate established when the obligation was issued). For variable rate obligations, the rate shown is the rate as of the report date based on each security’s rate reset date. The reference rate and spread used is shown parenthetically in the security description if available; if not the reference rate is described in a footnote. The maturity date shown for all the securities is the final legal maturity.
Security
Rate, Maturity Date | Face
Amount ($) | Value ($) |
| Corporates 24.8% of net assets |
| |
| Financial Institutions 7.9% |
| Banking 5.8% |
| American Express Co. |
| 2.65%, 12/02/22 | 500,000 | 480,620 |
| 4.05%, 12/03/42 | 750,000 | 735,708 |
| American Express Credit Corp. |
| 2.20%, 03/03/20 (a) | 500,000 | 493,560 |
| 2.38%, 05/26/20 (a) | 1,000,000 | 985,758 |
| 2.60%, 09/14/20 (a) | 500,000 | 493,910 |
| 2.25%, 05/05/21 (a) | 1,000,000 | 972,128 |
| 3.30%, 05/03/27 (a) | 750,000 | 723,541 |
| Australia & New Zealand Banking Group Ltd. |
| 2.30%, 06/01/21 | 1,000,000 | 972,379 |
| 2.63%, 05/19/22 | 1,000,000 | 967,189 |
| 2.63%, 11/09/22 | 750,000 | 722,328 |
| Banco Bilbao Vizcaya Argentaria S.A. |
| 3.00%, 10/20/20 | 250,000 | 248,193 |
| Bank of America Corp. |
| 5.63%, 07/01/20 | 3,750,000 | 3,925,881 |
| 5.88%, 01/05/21 | 800,000 | 849,264 |
| 2.63%, 04/19/21 | 1,250,000 | 1,228,464 |
| 5.00%, 05/13/21 | 3,250,000 | 3,395,248 |
| 2.33%, 10/01/21 (a)(b) | 2,000,000 | 1,955,848 |
| 2.50%, 10/21/22 (a) | 2,250,000 | 2,156,461 |
| 3.30%, 01/11/23 | 2,900,000 | 2,859,240 |
| 3.12%, 01/20/23 (a)(b) | 3,000,000 | 2,951,922 |
| 3.00%, 12/20/23 (a)(b) | 500,000 | 485,069 |
| 4.20%, 08/26/24 | 500,000 | 503,015 |
| 3.95%, 04/21/25 | 500,000 | 490,100 |
| 3.88%, 08/01/25 | 2,500,000 | 2,489,775 |
| 3.25%, 10/21/27 (a) | 1,000,000 | 933,074 |
| 4.24%, 04/24/38 (a)(b) | 2,250,000 | 2,189,784 |
| 7.75%, 05/14/38 | 400,000 | 543,228 |
| 5.88%, 02/07/42 | 1,000,000 | 1,173,103 |
| 5.00%, 01/21/44 | 1,000,000 | 1,061,526 |
| 4.44%, 01/20/48 (a)(b) | 750,000 | 733,973 |
| Bank of Montreal |
| 1.75%, 09/11/19 | 250,000 | 246,843 |
| 2.35%, 09/11/22 | 1,000,000 | 957,701 |
| 2.55%, 11/06/22 (a) | 250,000 | 241,657 |
| Bank of New York Mellon Corp. |
| 2.30%, 09/11/19 (a) | 2,500,000 | 2,486,903 |
| 2.60%, 08/17/20 (a) | 2,100,000 | 2,079,695 |
| 4.15%, 02/01/21 | 500,000 | 513,567 |
| 2.20%, 08/16/23 (a) | 500,000 | 469,653 |
| 3.44%, 02/07/28 (a)(b) | 500,000 | 488,533 |
| 3.00%, 10/30/28 (a) | 500,000 | 457,372 |
Security
Rate, Maturity Date | Face
Amount ($) | Value ($) |
| Bank of Nova Scotia |
| 1.85%, 04/14/20 | 500,000 | 491,135 |
| 2.15%, 07/14/20 | 1,000,000 | 980,799 |
| 2.50%, 01/08/21 | 500,000 | 491,856 |
| 2.45%, 03/22/21 | 500,000 | 489,264 |
| 1.88%, 04/26/21 | 500,000 | 484,063 |
| 2.70%, 03/07/22 | 500,000 | 488,970 |
| Barclays Bank PLC |
| 5.14%, 10/14/20 | 1,000,000 | 1,024,592 |
| Barclays PLC |
| 2.75%, 11/08/19 | 1,500,000 | 1,489,252 |
| 3.25%, 01/12/21 | 1,500,000 | 1,481,748 |
| 3.65%, 03/16/25 | 1,000,000 | 938,721 |
| 5.25%, 08/17/45 | 1,000,000 | 986,045 |
| BB&T Corp. |
| 2.45%, 01/15/20 (a) | 250,000 | 247,613 |
| 3.20%, 09/03/21 (a) | 750,000 | 747,965 |
| 3.95%, 03/22/22 (a) | 100,000 | 101,599 |
| BNP Paribas S.A. |
| 2.38%, 05/21/20 | 1,000,000 | 986,043 |
| 5.00%, 01/15/21 | 200,000 | 208,052 |
| 3.25%, 03/03/23 | 350,000 | 346,473 |
| 4.25%, 10/15/24 | 300,000 | 296,423 |
| BPCE S.A. |
| 2.50%, 07/15/19 | 1,000,000 | 994,115 |
| 2.65%, 02/03/21 | 1,500,000 | 1,470,780 |
| 4.00%, 04/15/24 | 1,000,000 | 1,002,577 |
| Branch Banking & Trust Co. |
| 3.63%, 09/16/25 (a) | 1,000,000 | 984,792 |
| Capital One Financial Corp. |
| 4.75%, 07/15/21 | 1,050,000 | 1,085,971 |
| 3.05%, 03/09/22 (a) | 500,000 | 490,458 |
| 3.50%, 06/15/23 | 2,000,000 | 1,955,930 |
| 3.20%, 02/05/25 (a) | 500,000 | 470,077 |
| 4.20%, 10/29/25 (a) | 750,000 | 729,507 |
| 3.75%, 07/28/26 (a) | 1,300,000 | 1,210,012 |
| 3.80%, 01/31/28 (a) | 1,250,000 | 1,182,256 |
| Capital One NA |
| 2.40%, 09/05/19 (a) | 750,000 | 744,145 |
| 2.35%, 01/31/20 (a) | 250,000 | 246,497 |
| 2.25%, 09/13/21 (a) | 1,250,000 | 1,198,958 |
| Citigroup, Inc. |
| 2.40%, 02/18/20 | 1,000,000 | 987,641 |
| 2.65%, 10/26/20 | 2,750,000 | 2,714,222 |
| 2.90%, 12/08/21 (a) | 1,000,000 | 980,417 |
| 4.50%, 01/14/22 | 1,850,000 | 1,901,837 |
| 2.75%, 04/25/22 (a) | 2,000,000 | 1,937,627 |
| 3.14%, 01/24/23 (a)(b) | 2,750,000 | 2,696,468 |
| 2.88%, 07/24/23 (a)(b) | 1,500,000 | 1,447,795 |
| 5.50%, 09/13/25 | 1,000,000 | 1,063,280 |
| 3.70%, 01/12/26 | 750,000 | 728,117 |
| 3.20%, 10/21/26 (a) | 1,000,000 | 930,929 |
Schwab Fixed-Income ETFs | Semiannual Report
Schwab U.S. Aggregate Bond ETF
Portfolio Holdings as of June 30, 2018 (Unaudited) (continued)
Security
Rate, Maturity Date | Face
Amount ($) | Value ($) |
| 4.30%, 11/20/26 | 1,000,000 | 977,488 |
| 4.45%, 09/29/27 | 1,000,000 | 984,737 |
| 3.67%, 07/24/28 (a)(b) | 4,000,000 | 3,809,972 |
| 5.30%, 05/06/44 | 1,000,000 | 1,033,185 |
| 4.65%, 07/30/45 | 700,000 | 699,255 |
| 4.75%, 08/15/46 | 250,000 | 238,627 |
| Citizens Bank NA |
| 2.20%, 05/26/20 (a) | 250,000 | 244,853 |
| 2.55%, 05/13/21 (a) | 250,000 | 243,979 |
| Cooperatieve Rabobank UA |
| 1.38%, 08/09/19 | 500,000 | 491,692 |
| 2.50%, 01/19/21 | 750,000 | 735,899 |
| 3.88%, 02/08/22 | 1,000,000 | 1,014,649 |
| 4.63%, 12/01/23 | 450,000 | 453,811 |
| 4.38%, 08/04/25 | 250,000 | 245,477 |
| 5.25%, 05/24/41 | 1,500,000 | 1,683,893 |
| 5.25%, 08/04/45 | 1,000,000 | 1,047,328 |
| Credit Suisse AG |
| 5.30%, 08/13/19 | 250,000 | 256,396 |
| 3.63%, 09/09/24 | 300,000 | 295,229 |
| Credit Suisse Group Funding Guernsey Ltd. |
| 2.75%, 03/26/20 | 1,000,000 | 989,482 |
| 3.13%, 12/10/20 | 750,000 | 745,002 |
| 3.45%, 04/16/21 | 2,250,000 | 2,243,014 |
| 3.80%, 09/15/22 | 500,000 | 498,285 |
| 3.75%, 03/26/25 | 2,500,000 | 2,407,952 |
| Deutsche Bank AG |
| 3.13%, 01/13/21 | 2,000,000 | 1,935,168 |
| 3.30%, 11/16/22 | 500,000 | 468,904 |
| 3.95%, 02/27/23 | 1,500,000 | 1,441,810 |
| Discover Financial Services |
| 3.85%, 11/21/22 | 1,500,000 | 1,495,066 |
| Fifth Third Bancorp |
| 8.25%, 03/01/38 | 600,000 | 821,172 |
| Fifth Third Bank |
| 3.85%, 03/15/26 (a) | 1,000,000 | 985,164 |
| First Tennessee Bank NA |
| 2.95%, 12/01/19 (a) | 250,000 | 248,930 |
| Goldman Sachs Capital I |
| 6.35%, 02/15/34 | 350,000 | 400,268 |
| Goldman Sachs Group, Inc. |
| 1.95%, 07/23/19 | 1,500,000 | 1,485,460 |
| 2.55%, 10/23/19 | 2,100,000 | 2,087,799 |
| 5.38%, 03/15/20 | 1,100,000 | 1,139,589 |
| 2.75%, 09/15/20 (a) | 2,500,000 | 2,471,497 |
| 2.63%, 04/25/21 (a) | 700,000 | 685,008 |
| 5.25%, 07/27/21 | 1,262,000 | 1,326,837 |
| 2.35%, 11/15/21 (a) | 1,500,000 | 1,443,690 |
| 5.75%, 01/24/22 | 1,100,000 | 1,177,750 |
| 3.85%, 07/08/24 (a) | 650,000 | 645,054 |
| 3.50%, 01/23/25 (a) | 1,000,000 | 966,518 |
| 4.25%, 10/21/25 | 1,000,000 | 986,257 |
| 5.95%, 01/15/27 | 265,000 | 287,547 |
| 3.85%, 01/26/27 (a) | 2,000,000 | 1,922,727 |
| 3.69%, 06/05/28 (a)(b) | 500,000 | 474,524 |
| 3.81%, 04/23/29 (a)(b) | 500,000 | 476,144 |
| 6.13%, 02/15/33 | 1,500,000 | 1,717,805 |
| 6.45%, 05/01/36 | 500,000 | 577,785 |
| 6.75%, 10/01/37 | 1,500,000 | 1,783,323 |
| 4.41%, 04/23/39 (a)(b) | 1,000,000 | 960,837 |
| 6.25%, 02/01/41 | 1,000,000 | 1,169,812 |
| 4.80%, 07/08/44 (a) | 500,000 | 497,188 |
| 4.75%, 10/21/45 (a) | 500,000 | 495,955 |
| HSBC Bank USA NA |
| 4.88%, 08/24/20 | 500,000 | 515,485 |
Security
Rate, Maturity Date | Face
Amount ($) | Value ($) |
| HSBC Holdings PLC |
| 3.40%, 03/08/21 | 250,000 | 250,005 |
| 5.10%, 04/05/21 | 850,000 | 888,849 |
| 2.95%, 05/25/21 | 1,000,000 | 984,935 |
| 4.25%, 03/14/24 | 1,000,000 | 996,145 |
| 4.30%, 03/08/26 | 1,850,000 | 1,856,523 |
| 3.90%, 05/25/26 | 2,200,000 | 2,153,395 |
| 4.58%, 06/19/29 (a)(b) | 1,000,000 | 1,011,238 |
| 6.50%, 05/02/36 | 500,000 | 581,437 |
| 6.50%, 09/15/37 | 500,000 | 584,989 |
| 6.80%, 06/01/38 | 750,000 | 905,292 |
| 5.25%, 03/14/44 | 350,000 | 357,064 |
| HSBC USA, Inc. |
| 2.75%, 08/07/20 | 2,500,000 | 2,477,747 |
| 5.00%, 09/27/20 | 400,000 | 411,979 |
| ING Groep N.V. |
| 3.15%, 03/29/22 | 3,000,000 | 2,946,273 |
| JPMorgan Chase & Co. |
| 4.95%, 03/25/20 | 1,000,000 | 1,030,090 |
| 4.25%, 10/15/20 | 500,000 | 511,315 |
| 2.55%, 10/29/20 (a) | 2,750,000 | 2,709,170 |
| 4.63%, 05/10/21 | 7,500,000 | 7,761,053 |
| 2.30%, 08/15/21 (a) | 2,000,000 | 1,933,085 |
| 4.35%, 08/15/21 | 2,250,000 | 2,314,874 |
| 3.20%, 01/25/23 | 1,291,000 | 1,268,698 |
| 3.38%, 05/01/23 | 2,000,000 | 1,954,697 |
| 3.88%, 02/01/24 | 500,000 | 503,675 |
| 3.13%, 01/23/25 (a) | 1,000,000 | 957,148 |
| 3.30%, 04/01/26 (a) | 3,500,000 | 3,352,167 |
| 2.95%, 10/01/26 (a) | 500,000 | 464,949 |
| 4.13%, 12/15/26 | 500,000 | 494,557 |
| 3.78%, 02/01/28 (a)(b) | 1,700,000 | 1,660,415 |
| 3.54%, 05/01/28 (a)(b) | 1,500,000 | 1,437,700 |
| 6.40%, 05/15/38 | 1,150,000 | 1,412,857 |
| 5.50%, 10/15/40 | 500,000 | 557,226 |
| 5.40%, 01/06/42 (d) | 600,000 | 666,722 |
| 4.85%, 02/01/44 | 500,000 | 518,072 |
| 4.26%, 02/22/48 (a)(b) | 500,000 | 471,787 |
| 4.03%, 07/24/48 (a)(b) | 500,000 | 455,632 |
| 3.96%, 11/15/48 (a)(b) | 1,000,000 | 901,374 |
| KeyCorp |
| 2.90%, 09/15/20 | 400,000 | 396,999 |
| 4.10%, 04/30/28 | 1,000,000 | 994,035 |
| Lloyds Bank PLC |
| 6.38%, 01/21/21 | 500,000 | 536,521 |
| Lloyds Banking Group PLC |
| 3.10%, 07/06/21 | 1,250,000 | 1,233,700 |
| 4.50%, 11/04/24 | 1,000,000 | 989,948 |
| 4.65%, 03/24/26 | 1,500,000 | 1,478,247 |
| 4.38%, 03/22/28 | 1,500,000 | 1,482,677 |
| 4.34%, 01/09/48 | 1,000,000 | 861,485 |
| Manufacturers & Traders Trust Co. |
| 2.94%, 12/01/21 |
| (3 mo. USD-LIBOR + .64%) (a)(c) | 250,000 | 249,400 |
| Mitsubishi UFJ Financial Group, Inc. |
| 2.95%, 03/01/21 | 1,150,000 | 1,138,020 |
| 2.19%, 09/13/21 | 2,500,000 | 2,401,619 |
| 3.85%, 03/01/26 | 750,000 | 747,031 |
| 3.29%, 07/25/27 | 1,100,000 | 1,050,246 |
| Mizuho Financial Group, Inc. |
| 2.60%, 09/11/22 | 750,000 | 719,233 |
| 3.66%, 02/28/27 | 600,000 | 586,018 |
| 3.17%, 09/11/27 | 500,000 | 468,858 |
| Morgan Stanley |
| 5.63%, 09/23/19 | 1,500,000 | 1,546,138 |
| 2.65%, 01/27/20 | 3,000,000 | 2,979,348 |
Schwab Fixed-Income ETFs | Semiannual Report
Schwab U.S. Aggregate Bond ETF
Portfolio Holdings as of June 30, 2018 (Unaudited) (continued)
Security
Rate, Maturity Date | Face
Amount ($) | Value ($) |
| 2.80%, 06/16/20 | 500,000 | 496,199 |
| 5.75%, 01/25/21 | 1,000,000 | 1,057,623 |
| 5.50%, 07/28/21 | 1,500,000 | 1,588,397 |
| 2.63%, 11/17/21 | 1,250,000 | 1,214,086 |
| 4.88%, 11/01/22 | 1,000,000 | 1,038,221 |
| 3.13%, 01/23/23 | 2,000,000 | 1,953,518 |
| 4.10%, 05/22/23 | 750,000 | 753,691 |
| 3.88%, 04/29/24 | 1,000,000 | 1,002,547 |
| 4.00%, 07/23/25 | 2,000,000 | 1,995,740 |
| 5.00%, 11/24/25 | 1,000,000 | 1,038,225 |
| 4.35%, 09/08/26 | 2,000,000 | 1,976,065 |
| 3.63%, 01/20/27 | 1,000,000 | 961,270 |
| 3.59%, 07/22/28 (a)(b) | 2,000,000 | 1,903,065 |
| 7.25%, 04/01/32 | 500,000 | 632,269 |
| 6.38%, 07/24/42 | 500,000 | 609,369 |
| 4.30%, 01/27/45 | 850,000 | 806,102 |
| 4.38%, 01/22/47 | 300,000 | 287,175 |
| National Australia Bank Ltd. |
| 2.50%, 05/22/22 | 1,000,000 | 958,720 |
| 3.00%, 01/20/23 | 250,000 | 244,253 |
| 3.38%, 01/14/26 | 1,000,000 | 969,233 |
| PNC Bank NA |
| 2.25%, 07/02/19 (a) | 1,500,000 | 1,492,890 |
| 2.40%, 10/18/19 (a) | 1,250,000 | 1,241,563 |
| 2.15%, 04/29/21 (a) | 500,000 | 484,805 |
| 2.55%, 12/09/21 (a) | 750,000 | 731,733 |
| 2.95%, 01/30/23 (a) | 1,000,000 | 970,381 |
| 3.10%, 10/25/27 (a) | 300,000 | 284,295 |
| Regions Bank |
| 6.45%, 06/26/37 | 250,000 | 296,236 |
| Regions Financial Corp. |
| 3.20%, 02/08/21 (a) | 800,000 | 796,349 |
| 2.75%, 08/14/22 (a) | 1,750,000 | 1,689,218 |
| Royal Bank of Canada |
| 1.50%, 07/29/19 | 1,000,000 | 985,905 |
| 2.20%, 09/23/19 | 500,000 | 496,652 |
| 1.88%, 02/05/20 | 500,000 | 492,240 |
| 2.10%, 10/14/20 | 500,000 | 489,711 |
| 2.50%, 01/19/21 | 500,000 | 491,400 |
| 2.75%, 02/01/22 | 1,500,000 | 1,473,972 |
| Royal Bank of Scotland Group PLC |
| 4.80%, 04/05/26 | 500,000 | 503,621 |
| Santander Holdings USA, Inc. |
| 3.70%, 03/28/22 (a) | 1,500,000 | 1,479,203 |
| 4.50%, 07/17/25 (a) | 1,069,000 | 1,050,152 |
| 4.40%, 07/13/27 (a) | 1,000,000 | 960,756 |
| Santander UK Group Holdings PLC |
| 3.37%, 01/05/24 (a)(b) | 4,000,000 | 3,850,081 |
| State Street Corp. |
| 3.55%, 08/18/25 | 500,000 | 500,222 |
| 2.65%, 05/19/26 | 750,000 | 704,909 |
| Sumitomo Mitsui Banking Corp. |
| 2.45%, 01/16/20 | 585,000 | 578,464 |
| 3.40%, 07/11/24 | 500,000 | 490,114 |
| Sumitomo Mitsui Financial Group, Inc. |
| 2.93%, 03/09/21 | 3,000,000 | 2,966,997 |
| 2.85%, 01/11/22 | 500,000 | 488,597 |
| 3.10%, 01/17/23 | 1,000,000 | 977,704 |
| 2.63%, 07/14/26 | 1,000,000 | 912,117 |
| 3.01%, 10/19/26 | 1,000,000 | 936,971 |
| SunTrust Banks, Inc. |
| 4.00%, 05/01/25 (a) | 500,000 | 502,820 |
| Svenska Handelsbanken AB |
| 2.40%, 10/01/20 | 250,000 | 245,538 |
Security
Rate, Maturity Date | Face
Amount ($) | Value ($) |
| Synchrony Financial |
| 3.00%, 08/15/19 (a) | 1,000,000 | 998,149 |
| 3.95%, 12/01/27 (a) | 2,000,000 | 1,848,565 |
| Synovus Financial Corp. |
| 3.13%, 11/01/22 (a) | 750,000 | 717,187 |
| Toronto-Dominion Bank |
| 2.13%, 07/02/19 | 750,000 | 745,664 |
| 2.50%, 12/14/20 | 1,500,000 | 1,476,350 |
| UBS AG |
| 2.38%, 08/14/19 | 1,000,000 | 993,915 |
| 4.88%, 08/04/20 | 1,000,000 | 1,032,576 |
| US Bancorp |
| 3.00%, 03/15/22 (a) | 600,000 | 593,816 |
| 2.95%, 07/15/22 (a) | 1,500,000 | 1,466,492 |
| 3.60%, 09/11/24 (a) | 1,000,000 | 988,695 |
| 3.15%, 04/27/27 (a) | 500,000 | 478,492 |
| 3.90%, 04/26/28 (a) | 1,500,000 | 1,523,813 |
| US Bank NA |
| 2.80%, 01/27/25 (a) | 500,000 | 474,350 |
| Wachovia Corp. |
| 5.50%, 08/01/35 | 750,000 | 802,045 |
| Wells Fargo & Co. |
| 2.60%, 07/22/20 | 1,250,000 | 1,234,495 |
| 4.60%, 04/01/21 | 1,100,000 | 1,136,239 |
| 2.10%, 07/26/21 | 2,500,000 | 2,403,243 |
| 3.50%, 03/08/22 | 500,000 | 498,625 |
| 2.63%, 07/22/22 | 1,750,000 | 1,686,532 |
| 3.07%, 01/24/23 (a) | 1,000,000 | 973,049 |
| 3.45%, 02/13/23 | 500,000 | 490,533 |
| 3.00%, 04/22/26 | 1,000,000 | 927,998 |
| 4.10%, 06/03/26 | 2,000,000 | 1,961,768 |
| 3.00%, 10/23/26 | 1,000,000 | 924,336 |
| 4.30%, 07/22/27 | 1,000,000 | 987,315 |
| 5.38%, 02/07/35 | 1,700,000 | 1,883,541 |
| 5.38%, 11/02/43 | 400,000 | 418,568 |
| 5.61%, 01/15/44 | 500,000 | 539,050 |
| 4.65%, 11/04/44 | 1,250,000 | 1,193,435 |
| 3.90%, 05/01/45 | 1,500,000 | 1,369,483 |
| 4.40%, 06/14/46 | 500,000 | 458,814 |
| 4.75%, 12/07/46 | 1,000,000 | 969,902 |
| Westpac Banking Corp. |
| 4.88%, 11/19/19 | 2,000,000 | 2,051,027 |
| 2.75%, 01/11/23 | 1,000,000 | 954,282 |
| 2.85%, 05/13/26 | 350,000 | 323,820 |
| 3.35%, 03/08/27 | 250,000 | 238,411 |
| 3.40%, 01/25/28 | 500,000 | 476,888 |
| | | 300,424,016 |
| Brokerage/Asset Managers/Exchanges 0.2% |
| Ameriprise Financial, Inc. |
| 3.70%, 10/15/24 | 475,000 | 474,431 |
| 2.88%, 09/15/26 (a) | 250,000 | 233,553 |
| BlackRock, Inc. |
| 3.50%, 03/18/24 | 1,250,000 | 1,259,226 |
| Brookfield Finance, Inc. |
| 3.90%, 01/25/28 (a) | 500,000 | 473,614 |
| 4.70%, 09/20/47 (a) | 250,000 | 237,489 |
| CME Group, Inc. |
| 3.00%, 03/15/25 (a) | 1,300,000 | 1,255,706 |
| 5.30%, 09/15/43 (a) | 500,000 | 588,421 |
| Intercontinental Exchange, Inc. |
| 2.75%, 12/01/20 (a) | 1,000,000 | 992,531 |
| 4.00%, 10/15/23 | 1,000,000 | 1,022,668 |
Schwab Fixed-Income ETFs | Semiannual Report
Schwab U.S. Aggregate Bond ETF
Portfolio Holdings as of June 30, 2018 (Unaudited) (continued)
Security
Rate, Maturity Date | Face
Amount ($) | Value ($) |
| Invesco Finance PLC |
| 3.75%, 01/15/26 | 650,000 | 639,597 |
| Jefferies Group LLC |
| 5.13%, 01/20/23 | 700,000 | 728,352 |
| 6.25%, 01/15/36 | 150,000 | 154,189 |
| Jefferies Group LLC/Jefferies Group Capital Finance, Inc. |
| 4.85%, 01/15/27 | 700,000 | 680,596 |
| Legg Mason, Inc. |
| 4.75%, 03/15/26 | 250,000 | 254,397 |
| Nasdaq, Inc. |
| 3.85%, 06/30/26 (a) | 300,000 | 291,026 |
| Nomura Holdings, Inc. |
| 6.70%, 03/04/20 (d) | 1,000,000 | 1,054,618 |
| Raymond James Financial, Inc. |
| 3.63%, 09/15/26 | 200,000 | 192,399 |
| 4.95%, 07/15/46 | 250,000 | 255,713 |
| TD Ameritrade Holding Corp. |
| 2.95%, 04/01/22 (a) | 300,000 | 294,912 |
| 3.30%, 04/01/27 (a) | 200,000 | 191,054 |
| | | 11,274,492 |
| Finance Companies 0.2% |
| AerCap Ireland Capital DAC/AerCap Global Aviation Trust |
| 3.95%, 02/01/22 (a) | 750,000 | 746,191 |
| 3.65%, 07/21/27 (a) | 1,700,000 | 1,550,617 |
| Air Lease Corp. |
| 4.25%, 09/15/24 (a) | 1,000,000 | 994,196 |
| 3.63%, 04/01/27 (a) | 2,200,000 | 2,020,777 |
| GATX Corp. |
| 4.55%, 11/07/28 (a) | 200,000 | 198,937 |
| 5.20%, 03/15/44 (a) | 500,000 | 520,963 |
| GE Capital International Funding Co. |
| 2.34%, 11/15/20 | 1,200,000 | 1,173,378 |
| 3.37%, 11/15/25 | 1,000,000 | 960,749 |
| 4.42%, 11/15/35 | 1,250,000 | 1,213,145 |
| International Lease Finance Corp. |
| 4.63%, 04/15/21 | 500,000 | 511,929 |
| | | 9,890,882 |
| Financial Other 0.0% |
| CME Group, Inc. |
| 3.00%, 09/15/22 | 200,000 | 197,989 |
| ORIX Corp. |
| 2.90%, 07/18/22 | 500,000 | 486,716 |
| | | 684,705 |
| Insurance 1.1% |
| Aetna, Inc. |
| 2.75%, 11/15/22 (a) | 250,000 | 240,306 |
| 3.50%, 11/15/24 (a) | 2,000,000 | 1,945,541 |
| 4.75%, 03/15/44 (a) | 500,000 | 500,997 |
| Aflac, Inc. |
| 3.63%, 06/15/23 | 750,000 | 753,232 |
| Allied World Assurance Co. Holdings Ltd. |
| 4.35%, 10/29/25 (a) | 500,000 | 487,190 |
| Allstate Corp. |
| 3.28%, 12/15/26 (a) | 250,000 | 240,601 |
| 4.50%, 06/15/43 | 300,000 | 311,642 |
| American International Group, Inc. |
| 2.30%, 07/16/19 (a) | 2,000,000 | 1,988,405 |
| 3.30%, 03/01/21 (a) | 500,000 | 499,963 |
| 3.88%, 01/15/35 (a) | 250,000 | 223,061 |
Security
Rate, Maturity Date | Face
Amount ($) | Value ($) |
| 4.50%, 07/16/44 (a) | 1,000,000 | 934,692 |
| 4.80%, 07/10/45 (a) | 500,000 | 490,370 |
| 4.38%, 01/15/55 (a) | 750,000 | 650,917 |
| Anthem, Inc. |
| 2.25%, 08/15/19 | 500,000 | 495,946 |
| 3.30%, 01/15/23 | 750,000 | 737,557 |
| 4.63%, 05/15/42 | 750,000 | 729,588 |
| 4.65%, 01/15/43 | 500,000 | 485,313 |
| 4.65%, 08/15/44 (a) | 750,000 | 730,295 |
| 4.38%, 12/01/47 (a) | 250,000 | 231,625 |
| Aon Corp. |
| 8.21%, 01/01/27 | 100,000 | 120,250 |
| Aon PLC |
| 4.00%, 11/27/23 (a) | 500,000 | 506,599 |
| 3.50%, 06/14/24 (a) | 500,000 | 487,011 |
| 3.88%, 12/15/25 (a) | 1,500,000 | 1,483,187 |
| 4.75%, 05/15/45 (a) | 250,000 | 247,793 |
| Assurant, Inc. |
| 6.75%, 02/15/34 | 151,000 | 174,775 |
| AXA Equitable Holdings, Inc. |
| 5.00%, 04/20/48 (a)(e) | 500,000 | 463,019 |
| Berkshire Hathaway Finance Corp. |
| 4.25%, 01/15/21 | 300,000 | 310,143 |
| 5.75%, 01/15/40 | 100,000 | 119,616 |
| Berkshire Hathaway, Inc. |
| 2.75%, 03/15/23 (a) | 750,000 | 734,441 |
| 3.13%, 03/15/26 (a) | 2,000,000 | 1,928,962 |
| Brighthouse Financial, Inc. |
| 4.70%, 06/22/47 (a) | 200,000 | 165,420 |
| Chubb Corp. |
| 6.00%, 05/11/37 | 250,000 | 304,660 |
| Chubb INA Holdings, Inc. |
| 2.88%, 11/03/22 (a) | 1,000,000 | 983,130 |
| 2.70%, 03/13/23 | 750,000 | 726,461 |
| 3.15%, 03/15/25 | 1,000,000 | 969,607 |
| 3.35%, 05/03/26 (a) | 750,000 | 727,921 |
| 4.35%, 11/03/45 (a) | 2,000,000 | 2,051,779 |
| Cigna Corp. |
| 4.00%, 02/15/22 (a) | 400,000 | 405,907 |
| 3.05%, 10/15/27 (a) | 300,000 | 271,121 |
| Hartford Financial Services Group, Inc. |
| 5.13%, 04/15/22 | 1,000,000 | 1,056,223 |
| 5.95%, 10/15/36 | 300,000 | 355,551 |
| 6.10%, 10/01/41 | 350,000 | 423,439 |
| 4.40%, 03/15/48 (a) | 1,000,000 | 966,475 |
| Humana, Inc. |
| 3.85%, 10/01/24 (a) | 1,000,000 | 999,550 |
| 4.95%, 10/01/44 (a) | 750,000 | 785,203 |
| 4.80%, 03/15/47 (a) | 500,000 | 515,654 |
| Lincoln National Corp. |
| 4.00%, 09/01/23 | 500,000 | 504,688 |
| 3.80%, 03/01/28 (a) | 750,000 | 718,073 |
| Loews Corp. |
| 3.75%, 04/01/26 (a) | 250,000 | 245,597 |
| Manulife Financial Corp. |
| 4.15%, 03/04/26 | 350,000 | 349,726 |
| Marsh & McLennan Cos., Inc. |
| 3.50%, 06/03/24 (a) | 500,000 | 495,573 |
| MetLife, Inc. |
| 4.75%, 02/08/21 | 579,000 | 601,541 |
| 3.60%, 04/10/24 | 1,315,000 | 1,305,208 |
| 5.70%, 06/15/35 | 500,000 | 571,308 |
| 6.40%, 12/15/36 (a) | 1,000,000 | 1,062,500 |
Schwab Fixed-Income ETFs | Semiannual Report
Schwab U.S. Aggregate Bond ETF
Portfolio Holdings as of June 30, 2018 (Unaudited) (continued)
Security
Rate, Maturity Date | Face
Amount ($) | Value ($) |
| 5.88%, 02/06/41 | 250,000 | 293,148 |
| 4.60%, 05/13/46 (a) | 250,000 | 253,932 |
| Principal Financial Group, Inc. |
| 4.63%, 09/15/42 | 100,000 | 100,968 |
| 4.35%, 05/15/43 | 250,000 | 239,656 |
| Prudential Financial, Inc. |
| 5.38%, 06/21/20 | 1,000,000 | 1,041,132 |
| 4.50%, 11/16/21 | 250,000 | 259,520 |
| 6.63%, 12/01/37 | 1,750,000 | 2,207,495 |
| 5.88%, 09/15/42 (a)(b) | 1,000,000 | 1,057,500 |
| 5.63%, 06/15/43 (a)(b) | 700,000 | 722,750 |
| 5.38%, 05/15/45 (a)(b) | 1,000,000 | 997,500 |
| The Progressive Corp. |
| 3.70%, 01/26/45 | 300,000 | 273,857 |
| Travelers Cos., Inc. |
| 6.25%, 06/15/37 | 750,000 | 926,283 |
| UnitedHealth Group, Inc. |
| 2.70%, 07/15/20 | 1,000,000 | 994,321 |
| 2.88%, 03/15/22 (a) | 1,000,000 | 986,943 |
| 3.75%, 07/15/25 | 750,000 | 750,815 |
| 6.63%, 11/15/37 | 500,000 | 651,249 |
| 6.88%, 02/15/38 | 750,000 | 994,052 |
| 4.75%, 07/15/45 | 1,000,000 | 1,070,907 |
| 4.20%, 01/15/47 (a) | 1,250,000 | 1,227,618 |
| 4.25%, 04/15/47 (a) | 250,000 | 249,492 |
| Unum Group |
| 5.63%, 09/15/20 | 350,000 | 366,164 |
| Voya Financial, Inc. |
| 3.65%, 06/15/26 | 1,000,000 | 947,528 |
| 5.70%, 07/15/43 | 200,000 | 220,630 |
| XLIT Ltd. |
| 5.75%, 10/01/21 | 850,000 | 907,606 |
| 6.25%, 05/15/27 | 685,000 | 784,393 |
| 5.25%, 12/15/43 | 250,000 | 275,905 |
| 5.50%, 03/31/45 | 750,000 | 781,380 |
| | | 56,398,096 |
| REITs 0.6% |
| Alexandria Real Estate Equities, Inc. |
| 4.30%, 01/15/26 (a) | 250,000 | 250,532 |
| AvalonBay Communities, Inc. |
| 3.50%, 11/15/24 (a) | 700,000 | 690,066 |
| 3.35%, 05/15/27 (a) | 250,000 | 240,047 |
| 3.20%, 01/15/28 (a) | 500,000 | 471,722 |
| Boston Properties LP |
| 3.85%, 02/01/23 (a) | 1,000,000 | 1,006,068 |
| 3.13%, 09/01/23 (a) | 500,000 | 486,843 |
| 3.80%, 02/01/24 (a) | 100,000 | 99,615 |
| Digital Realty Trust LP |
| 5.88%, 02/01/20 (a) | 250,000 | 258,734 |
| 5.25%, 03/15/21 (a) | 1,000,000 | 1,041,673 |
| Duke Realty LP |
| 3.75%, 12/01/24 (a) | 1,000,000 | 986,866 |
| ERP Operating LP |
| 3.38%, 06/01/25 (a) | 250,000 | 244,299 |
| 2.85%, 11/01/26 (a) | 750,000 | 696,828 |
| 4.50%, 06/01/45 (a) | 250,000 | 253,210 |
| Essex Portfolio LP |
| 3.88%, 05/01/24 (a) | 500,000 | 497,006 |
| 3.50%, 04/01/25 (a) | 500,000 | 483,417 |
| Federal Realty Investment Trust |
| 4.50%, 12/01/44 (a) | 850,000 | 864,654 |
| Government Properties Income Trust |
| 4.00%, 07/15/22 (a) | 175,000 | 173,089 |
Security
Rate, Maturity Date | Face
Amount ($) | Value ($) |
| HCP, Inc. |
| 2.63%, 02/01/20 (a) | 300,000 | 296,534 |
| 5.38%, 02/01/21 (a) | 78,000 | 81,128 |
| 4.25%, 11/15/23 (a) | 1,000,000 | 1,007,076 |
| 3.40%, 02/01/25 (a) | 300,000 | 284,064 |
| Healthcare Trust of America Holdings LP |
| 2.95%, 07/01/22 (a) | 450,000 | 435,828 |
| 3.75%, 07/01/27 (a) | 1,000,000 | 950,617 |
| Hospitality Properties Trust |
| 4.38%, 02/15/30 (a) | 1,500,000 | 1,390,976 |
| Host Hotels & Resorts LP |
| 3.75%, 10/15/23 (a) | 250,000 | 245,318 |
| Kilroy Realty LP |
| 3.80%, 01/15/23 (a) | 250,000 | 248,789 |
| 4.38%, 10/01/25 (a) | 1,000,000 | 1,002,932 |
| 4.25%, 08/15/29 (a) | 200,000 | 196,059 |
| Kimco Realty Corp. |
| 3.20%, 05/01/21 (a) | 250,000 | 248,643 |
| 3.40%, 11/01/22 (a) | 600,000 | 591,488 |
| 2.80%, 10/01/26 (a) | 1,000,000 | 889,458 |
| Life Storage LP |
| 3.88%, 12/15/27 (a) | 1,000,000 | 948,220 |
| Mid-America Apartments LP |
| 4.20%, 06/15/28 (a) | 350,000 | 349,415 |
| Omega Healthcare Investors, Inc. |
| 4.95%, 04/01/24 (a) | 1,100,000 | 1,117,208 |
| Prologis LP |
| 4.25%, 08/15/23 (a) | 1,100,000 | 1,134,773 |
| 3.75%, 11/01/25 (a) | 1,000,000 | 1,000,185 |
| Realty Income Corp. |
| 3.88%, 07/15/24 (a) | 1,150,000 | 1,140,722 |
| 3.00%, 01/15/27 (a) | 1,500,000 | 1,375,412 |
| 3.65%, 01/15/28 (a) | 1,000,000 | 959,690 |
| Regency Centers LP |
| 3.60%, 02/01/27 (a) | 250,000 | 237,992 |
| Senior Housing Properties Trust |
| 4.75%, 02/15/28 (a) | 750,000 | 725,966 |
| Simon Property Group LP |
| 4.38%, 03/01/21 (a) | 1,000,000 | 1,030,119 |
| 3.38%, 03/15/22 (a) | 500,000 | 498,552 |
| 3.30%, 01/15/26 (a) | 250,000 | 240,097 |
| 3.38%, 06/15/27 (a) | 750,000 | 718,151 |
| Ventas Realty LP |
| 4.00%, 03/01/28 (a) | 1,000,000 | 967,630 |
| Ventas Realty LP/Ventas Capital Corp. |
| 2.70%, 04/01/20 (a) | 250,000 | 247,499 |
| VEREIT Operating Partnership LP |
| 3.95%, 08/15/27 (a) | 750,000 | 699,980 |
| Vornado Realty LP |
| 5.00%, 01/15/22 (a) | 500,000 | 520,925 |
| Welltower, Inc. |
| 6.13%, 04/15/20 | 500,000 | 523,500 |
| 3.75%, 03/15/23 (a) | 750,000 | 742,406 |
| 4.50%, 01/15/24 (a) | 400,000 | 407,214 |
| WP Carey, Inc. |
| 4.00%, 02/01/25 (a) | 400,000 | 388,655 |
| | | 32,587,890 |
| | | 411,260,081 |
| |
Schwab Fixed-Income ETFs | Semiannual Report
Schwab U.S. Aggregate Bond ETF
Portfolio Holdings as of June 30, 2018 (Unaudited) (continued)
Security
Rate, Maturity Date | Face
Amount ($) | Value ($) |
| Industrial 15.1% |
| Basic Industry 0.7% |
| Air Products & Chemicals, Inc. |
| 4.38%, 08/21/19 | 125,000 | 127,154 |
| Airgas, Inc. |
| 3.65%, 07/15/24 (a) | 800,000 | 798,389 |
| ArcelorMittal |
| 6.25%, 02/25/22 | 1,000,000 | 1,068,740 |
| Barrick North America Finance LLC |
| 5.70%, 05/30/41 | 550,000 | 612,143 |
| Barrick PD Australia Finance Pty Ltd. |
| 5.95%, 10/15/39 | 500,000 | 559,854 |
| BHP Billiton Finance USA Ltd. |
| 4.13%, 02/24/42 | 250,000 | 248,740 |
| 5.00%, 09/30/43 | 1,050,000 | 1,180,751 |
| Dow Chemical Co. |
| 4.13%, 11/15/21 (a) | 1,000,000 | 1,020,135 |
| 3.00%, 11/15/22 (a) | 1,250,000 | 1,218,535 |
| 7.38%, 11/01/29 | 750,000 | 936,964 |
| 4.25%, 10/01/34 (a) | 500,000 | 482,000 |
| 5.25%, 11/15/41 (a) | 200,000 | 211,057 |
| Eastman Chemical Co. |
| 2.70%, 01/15/20 (a) | 850,000 | 845,232 |
| 3.60%, 08/15/22 (a) | 549,000 | 548,441 |
| 4.65%, 10/15/44 (a) | 250,000 | 245,967 |
| Ecolab, Inc. |
| 2.25%, 01/12/20 | 250,000 | 246,965 |
| 4.35%, 12/08/21 | 163,000 | 168,375 |
| 3.25%, 12/01/27 (a) | 1,000,000 | 959,390 |
| EI du Pont de Nemours & Co. |
| 4.63%, 01/15/20 | 1,000,000 | 1,027,130 |
| 3.63%, 01/15/21 | 200,000 | 202,676 |
| 2.80%, 02/15/23 | 500,000 | 485,168 |
| Fibria Overseas Finance Ltd. |
| 5.50%, 01/17/27 | 200,000 | 199,500 |
| Georgia-Pacific LLC |
| 8.00%, 01/15/24 | 250,000 | 302,063 |
| Goldcorp, Inc. |
| 3.70%, 03/15/23 (a) | 800,000 | 788,309 |
| International Paper Co. |
| 4.75%, 02/15/22 (a) | 707,000 | 731,495 |
| 3.65%, 06/15/24 (a) | 200,000 | 197,972 |
| 3.00%, 02/15/27 (a) | 250,000 | 226,724 |
| 4.80%, 06/15/44 (a) | 600,000 | 583,737 |
| 4.35%, 08/15/48 (a) | 1,100,000 | 990,675 |
| LYB International Finance BV |
| 4.00%, 07/15/23 | 150,000 | 150,497 |
| 5.25%, 07/15/43 | 500,000 | 520,825 |
| LyondellBasell Industries NV |
| 6.00%, 11/15/21 (a) | 250,000 | 267,744 |
| 5.75%, 04/15/24 (a) | 250,000 | 270,384 |
| 4.63%, 02/26/55 (a) | 500,000 | 464,193 |
| Monsanto Co. |
| 4.20%, 07/15/34 (a) | 250,000 | 232,530 |
| Mosaic Co. |
| 3.25%, 11/15/22 (a) | 500,000 | 486,188 |
| 4.25%, 11/15/23 (a) | 250,000 | 251,761 |
| 4.05%, 11/15/27 (a) | 500,000 | 478,737 |
| Newmont Mining Corp. |
| 3.50%, 03/15/22 (a) | 500,000 | 497,619 |
| 6.25%, 10/01/39 | 150,000 | 173,932 |
| 4.88%, 03/15/42 (a) | 500,000 | 501,187 |
Security
Rate, Maturity Date | Face
Amount ($) | Value ($) |
| Nucor Corp. |
| 4.13%, 09/15/22 (a) | 500,000 | 513,952 |
| 5.20%, 08/01/43 (a) | 300,000 | 332,713 |
| Nutrien Ltd. |
| 3.63%, 03/15/24 (a) | 350,000 | 340,528 |
| 4.13%, 03/15/35 (a) | 1,500,000 | 1,393,172 |
| 5.88%, 12/01/36 | 100,000 | 114,263 |
| 5.25%, 01/15/45 (a) | 750,000 | 779,040 |
| Packaging Corp. of America |
| 3.90%, 06/15/22 (a) | 1,000,000 | 1,011,112 |
| 3.65%, 09/15/24 (a) | 500,000 | 491,872 |
| Praxair, Inc. |
| 2.65%, 02/05/25 (a) | 500,000 | 474,231 |
| 3.20%, 01/30/26 (a) | 1,000,000 | 979,387 |
| Rio Tinto Alcan, Inc. |
| 7.25%, 03/15/31 | 381,000 | 479,940 |
| Rio Tinto Finance USA Ltd. |
| 5.20%, 11/02/40 | 500,000 | 566,470 |
| Rio Tinto Finance USA PLC |
| 4.75%, 03/22/42 (a) | 500,000 | 538,724 |
| RPM International, Inc. |
| 6.13%, 10/15/19 | 500,000 | 517,280 |
| 4.25%, 01/15/48 (a) | 750,000 | 681,503 |
| Sherwin-Williams Co. |
| 4.20%, 01/15/22 (a) | 100,000 | 101,822 |
| 3.45%, 06/01/27 (a) | 300,000 | 283,966 |
| 4.50%, 06/01/47 (a) | 1,000,000 | 958,186 |
| Southern Copper Corp. |
| 5.38%, 04/16/20 | 1,250,000 | 1,297,932 |
| 3.88%, 04/23/25 | 250,000 | 247,003 |
| 7.50%, 07/27/35 | 250,000 | 306,010 |
| 5.25%, 11/08/42 | 500,000 | 496,556 |
| Vale Overseas Ltd. |
| 4.38%, 01/11/22 | 238,000 | 241,449 |
| 6.25%, 08/10/26 | 1,500,000 | 1,628,250 |
| 6.88%, 11/21/36 | 100,000 | 112,770 |
| 6.88%, 11/10/39 | 750,000 | 853,125 |
| WestRock Co. |
| 3.75%, 03/15/25 (a)(e) | 1,000,000 | 981,813 |
| WestRock RKT Co. |
| 4.90%, 03/01/22 | 200,000 | 208,504 |
| Weyerhaeuser Co. |
| 7.38%, 03/15/32 | 600,000 | 764,420 |
| Yamana Gold, Inc. |
| 4.95%, 07/15/24 (a) | 250,000 | 250,050 |
| | | 39,455,921 |
| Capital Goods 1.3% |
| 3M Co. |
| 2.00%, 08/07/20 | 1,000,000 | 982,743 |
| 2.25%, 03/15/23 (a) | 300,000 | 288,138 |
| 2.88%, 10/15/27 (a) | 300,000 | 284,168 |
| ABB Finance USA, Inc. |
| 2.88%, 05/08/22 | 100,000 | 98,270 |
| 3.80%, 04/03/28 (a) | 250,000 | 252,256 |
| Allegion US Holding Co., Inc. |
| 3.20%, 10/01/24 (a) | 500,000 | 474,050 |
| Bemis Co., Inc. |
| 3.10%, 09/15/26 (a) | 600,000 | 557,499 |
| Boeing Co. |
| 4.88%, 02/15/20 | 1,000,000 | 1,033,002 |
| 1.88%, 06/15/23 (a) | 100,000 | 93,858 |
| 2.60%, 10/30/25 (a) | 500,000 | 471,079 |
Schwab Fixed-Income ETFs | Semiannual Report
Schwab U.S. Aggregate Bond ETF
Portfolio Holdings as of June 30, 2018 (Unaudited) (continued)
Security
Rate, Maturity Date | Face
Amount ($) | Value ($) |
| 5.88%, 02/15/40 | 350,000 | 442,105 |
| 3.65%, 03/01/47 (a) | 500,000 | 474,552 |
| Caterpillar Financial Services Corp. |
| 1.85%, 09/04/20 | 400,000 | 389,647 |
| 2.55%, 11/29/22 | 1,500,000 | 1,449,499 |
| Caterpillar, Inc. |
| 3.90%, 05/27/21 | 1,500,000 | 1,535,546 |
| 2.60%, 06/26/22 (a) | 500,000 | 486,625 |
| 3.40%, 05/15/24 (a) | 1,250,000 | 1,246,650 |
| 6.05%, 08/15/36 | 150,000 | 186,039 |
| 3.80%, 08/15/42 | 250,000 | 239,490 |
| CNH Industrial NV |
| 4.50%, 08/15/23 | 200,000 | 201,580 |
| Deere & Co. |
| 2.60%, 06/08/22 (a) | 750,000 | 731,415 |
| 5.38%, 10/16/29 | 150,000 | 171,224 |
| Dover Corp. |
| 5.38%, 03/01/41 (a) | 350,000 | 399,825 |
| Eagle Materials, Inc. |
| 4.50%, 08/01/26 (a) | 750,000 | 754,476 |
| Eaton Corp. |
| 2.75%, 11/02/22 | 1,000,000 | 971,882 |
| 4.00%, 11/02/32 | 100,000 | 99,812 |
| 4.15%, 11/02/42 | 100,000 | 96,795 |
| Embraer Netherlands Finance BV |
| 5.40%, 02/01/27 | 250,000 | 258,975 |
| Embraer Overseas Ltd. |
| 5.70%, 09/16/23 (e) | 250,000 | 262,190 |
| Emerson Electric Co. |
| 2.63%, 12/01/21 (a) | 500,000 | 491,100 |
| Fortive Corp. |
| 3.15%, 06/15/26 (a) | 1,000,000 | 930,357 |
| 4.30%, 06/15/46 (a) | 500,000 | 472,319 |
| General Dynamics Corp. |
| 3.88%, 07/15/21 (a) | 500,000 | 510,745 |
| 3.38%, 05/15/23 (a) | 1,000,000 | 1,002,679 |
| 3.75%, 05/15/28 (a) | 500,000 | 505,174 |
| General Electric Co. |
| 5.55%, 05/04/20 | 1,000,000 | 1,042,695 |
| 4.38%, 09/16/20 | 2,500,000 | 2,561,386 |
| 4.63%, 01/07/21 | 300,000 | 309,411 |
| 4.65%, 10/17/21 | 350,000 | 364,204 |
| 3.15%, 09/07/22 | 500,000 | 490,171 |
| 2.70%, 10/09/22 | 900,000 | 871,027 |
| 3.38%, 03/11/24 | 600,000 | 587,607 |
| 3.45%, 05/15/24 (a) | 2,000,000 | 1,961,872 |
| 6.75%, 03/15/32 | 200,000 | 244,756 |
| 6.15%, 08/07/37 | 500,000 | 586,212 |
| 5.88%, 01/14/38 | 1,000,000 | 1,136,777 |
| 6.88%, 01/10/39 | 500,000 | 634,319 |
| 4.13%, 10/09/42 | 1,200,000 | 1,116,992 |
| 4.50%, 03/11/44 | 400,000 | 393,051 |
| Harris Corp. |
| 4.40%, 06/15/28 (a) | 250,000 | 252,449 |
| Honeywell International, Inc. |
| 2.50%, 11/01/26 (a) | 1,750,000 | 1,619,474 |
| Huntington Ingalls Industries, Inc. |
| 3.48%, 12/01/27 (a) | 250,000 | 235,575 |
| Illinois Tool Works, Inc. |
| 2.65%, 11/15/26 (a) | 500,000 | 462,632 |
| 3.90%, 09/01/42 (a) | 100,000 | 98,320 |
| Ingersoll-Rand Global Holding Co., Ltd. |
| 3.75%, 08/21/28 (a) | 500,000 | 487,441 |
| 4.30%, 02/21/48 (a) | 500,000 | 481,075 |
Security
Rate, Maturity Date | Face
Amount ($) | Value ($) |
| Ingersoll-Rand Luxembourg Finance S.A. |
| 2.63%, 05/01/20 (a) | 500,000 | 495,997 |
| John Deere Capital Corp. |
| 1.70%, 01/15/20 | 750,000 | 737,498 |
| 2.35%, 01/08/21 | 500,000 | 491,413 |
| 3.90%, 07/12/21 | 500,000 | 509,798 |
| 2.15%, 09/08/22 | 500,000 | 476,124 |
| 2.70%, 01/06/23 | 500,000 | 488,244 |
| 2.65%, 06/24/24 | 500,000 | 476,714 |
| 3.05%, 01/06/28 | 250,000 | 238,118 |
| Johnson Controls International plc |
| 3.63%, 07/02/24 (a) | 500,000 | 493,687 |
| 3.90%, 02/14/26 (a) | 500,000 | 494,329 |
| 6.00%, 01/15/36 | 500,000 | 576,538 |
| 4.63%, 07/02/44 (a) | 200,000 | 198,940 |
| 5.13%, 09/14/45 (a) | 500,000 | 519,897 |
| L-3 Technologies, Inc. |
| 4.95%, 02/15/21 (a) | 500,000 | 512,849 |
| 3.85%, 12/15/26 (a) | 500,000 | 481,989 |
| Lockheed Martin Corp. |
| 4.25%, 11/15/19 (d) | 250,000 | 254,662 |
| 2.50%, 11/23/20 (a) | 1,000,000 | 987,503 |
| 3.35%, 09/15/21 | 500,000 | 503,161 |
| 3.10%, 01/15/23 (a) | 500,000 | 494,043 |
| 3.55%, 01/15/26 (a) | 800,000 | 787,509 |
| 4.70%, 05/15/46 (a) | 250,000 | 266,826 |
| 4.09%, 09/15/52 (a) | 1,000,000 | 945,526 |
| Masco Corp. |
| 3.50%, 04/01/21 (a) | 500,000 | 499,668 |
| 4.50%, 05/15/47 (a) | 500,000 | 439,329 |
| Northrop Grumman Corp. |
| 2.08%, 10/15/20 | 1,000,000 | 977,550 |
| 3.50%, 03/15/21 | 500,000 | 505,506 |
| 3.20%, 02/01/27 (a) | 500,000 | 472,065 |
| 3.25%, 01/15/28 (a) | 250,000 | 235,340 |
| 4.75%, 06/01/43 | 1,000,000 | 1,044,778 |
| 3.85%, 04/15/45 (a) | 750,000 | 683,173 |
| 4.03%, 10/15/47 (a) | 200,000 | 188,297 |
| Owens Corning |
| 4.20%, 12/15/22 (a) | 1,000,000 | 1,003,401 |
| 7.00%, 12/01/36 | 290,000 | 336,857 |
| Parker-Hannifin Corp. |
| 4.45%, 11/21/44 (a) | 250,000 | 261,913 |
| Precision Castparts Corp. |
| 3.90%, 01/15/43 (a) | 250,000 | 243,906 |
| Raytheon Co. |
| 2.50%, 12/15/22 (a) | 2,000,000 | 1,941,931 |
| Republic Services, Inc. |
| 3.55%, 06/01/22 (a) | 750,000 | 755,438 |
| 2.90%, 07/01/26 (a) | 1,000,000 | 930,272 |
| 3.38%, 11/15/27 (a) | 500,000 | 474,823 |
| Rockwell Collins, Inc. |
| 2.80%, 03/15/22 (a) | 1,350,000 | 1,316,636 |
| 3.20%, 03/15/24 (a) | 250,000 | 241,154 |
| Roper Technologies, Inc. |
| 2.80%, 12/15/21 (a) | 1,500,000 | 1,466,117 |
| 3.13%, 11/15/22 (a) | 250,000 | 244,766 |
| 3.85%, 12/15/25 (a) | 500,000 | 492,463 |
| Stanley Black & Decker, Inc. |
| 2.90%, 11/01/22 | 250,000 | 245,341 |
| Textron, Inc. |
| 3.88%, 03/01/25 (a) | 250,000 | 247,392 |
Schwab Fixed-Income ETFs | Semiannual Report
Schwab U.S. Aggregate Bond ETF
Portfolio Holdings as of June 30, 2018 (Unaudited) (continued)
Security
Rate, Maturity Date | Face
Amount ($) | Value ($) |
| United Technologies Corp. |
| 1.95%, 11/01/21 (a) | 500,000 | 479,408 |
| 2.30%, 05/04/22 (a) | 1,000,000 | 958,770 |
| 2.80%, 05/04/24 (a) | 400,000 | 379,424 |
| 3.13%, 05/04/27 (a) | 250,000 | 232,703 |
| 6.13%, 07/15/38 | 400,000 | 468,930 |
| 5.70%, 04/15/40 | 1,000,000 | 1,141,478 |
| 4.50%, 06/01/42 | 500,000 | 495,181 |
| 4.05%, 05/04/47 (a) | 1,000,000 | 917,421 |
| Waste Management, Inc. |
| 2.90%, 09/15/22 (a) | 450,000 | 440,730 |
| 3.15%, 11/15/27 (a) | 200,000 | 188,177 |
| 4.10%, 03/01/45 (a) | 500,000 | 494,454 |
| | | 67,659,367 |
| Communications 2.2% |
| 21st Century Fox America, Inc. |
| 4.00%, 10/01/23 | 1,000,000 | 1,014,263 |
| 3.70%, 10/15/25 (a) | 500,000 | 490,640 |
| 6.20%, 12/15/34 | 1,250,000 | 1,480,501 |
| 6.15%, 03/01/37 | 200,000 | 235,269 |
| 6.65%, 11/15/37 | 500,000 | 622,461 |
| 6.15%, 02/15/41 | 350,000 | 419,610 |
| Activision Blizzard, Inc. |
| 2.30%, 09/15/21 (a) | 500,000 | 484,166 |
| America Movil S.A.B. de C.V. |
| 3.13%, 07/16/22 | 1,200,000 | 1,181,597 |
| 6.13%, 03/30/40 | 1,000,000 | 1,176,892 |
| 4.38%, 07/16/42 | 500,000 | 488,478 |
| American Tower Corp. |
| 5.05%, 09/01/20 | 250,000 | 258,516 |
| 2.25%, 01/15/22 | 250,000 | 239,210 |
| 3.50%, 01/31/23 | 1,500,000 | 1,477,073 |
| 5.00%, 02/15/24 | 200,000 | 207,660 |
| 3.55%, 07/15/27 (a) | 500,000 | 465,913 |
| AT&T, Inc. |
| 2.45%, 06/30/20 (a) | 2,000,000 | 1,970,700 |
| 3.20%, 03/01/22 (a) | 750,000 | 736,612 |
| 3.00%, 06/30/22 (a) | 1,750,000 | 1,700,473 |
| 3.95%, 01/15/25 (a) | 250,000 | 244,855 |
| 3.40%, 05/15/25 (a) | 1,000,000 | 939,152 |
| 4.25%, 03/01/27 (a) | 2,450,000 | 2,402,146 |
| 4.10%, 02/15/28 (a)(e) | 2,283,000 | 2,185,841 |
| 4.50%, 05/15/35 (a) | 1,000,000 | 927,603 |
| 6.35%, 03/15/40 | 300,000 | 326,132 |
| 6.00%, 08/15/40 (a) | 1,000,000 | 1,045,906 |
| 5.35%, 09/01/40 | 525,000 | 514,017 |
| 5.15%, 03/15/42 | 725,000 | 689,021 |
| 4.30%, 12/15/42 (a) | 750,000 | 639,650 |
| 4.35%, 06/15/45 (a) | 1,500,000 | 1,275,400 |
| 4.75%, 05/15/46 (a) | 2,000,000 | 1,793,097 |
| 5.65%, 02/15/47 (a) | 500,000 | 505,272 |
| 5.45%, 03/01/47 (a) | 500,000 | 492,551 |
| 4.55%, 03/09/49 (a) | 259,000 | 224,802 |
| 5.15%, 02/15/50 (a) | 1,000,000 | 935,378 |
| 5.30%, 08/15/58 (a) | 250,000 | 233,679 |
| CBS Corp. |
| 3.38%, 02/15/28 (a) | 300,000 | 270,542 |
| 5.50%, 05/15/33 | 300,000 | 309,329 |
| 4.90%, 08/15/44 (a) | 400,000 | 386,880 |
| 4.60%, 01/15/45 (a) | 250,000 | 231,513 |
| CC Holdings GS V LLC/Crown Castle GS III Corp. |
| 3.85%, 04/15/23 | 750,000 | 744,011 |
Security
Rate, Maturity Date | Face
Amount ($) | Value ($) |
| Charter Communications Operating LLC/Charter Communications Operating Capital |
| 3.58%, 07/23/20 (a) | 500,000 | 499,610 |
| 4.46%, 07/23/22 (a) | 550,000 | 557,251 |
| 4.91%, 07/23/25 (a) | 1,500,000 | 1,517,001 |
| 3.75%, 02/15/28 (a) | 750,000 | 680,584 |
| 6.38%, 10/23/35 (a) | 500,000 | 523,862 |
| 6.48%, 10/23/45 (a) | 1,250,000 | 1,321,834 |
| 5.38%, 05/01/47 (a) | 500,000 | 455,629 |
| Comcast Corp. |
| 2.85%, 01/15/23 | 1,600,000 | 1,548,048 |
| 2.75%, 03/01/23 (a) | 500,000 | 480,958 |
| 3.60%, 03/01/24 | 750,000 | 738,989 |
| 2.35%, 01/15/27 (a) | 500,000 | 438,410 |
| 3.30%, 02/01/27 (a) | 1,030,000 | 970,147 |
| 7.05%, 03/15/33 | 500,000 | 622,233 |
| 4.65%, 07/15/42 | 500,000 | 487,486 |
| 4.75%, 03/01/44 | 2,500,000 | 2,466,780 |
| 4.60%, 08/15/45 (a) | 1,072,000 | 1,035,242 |
| 3.97%, 11/01/47 (a) | 1,448,000 | 1,278,624 |
| Crown Castle International Corp. |
| 4.88%, 04/15/22 | 750,000 | 773,851 |
| 4.45%, 02/15/26 (a) | 500,000 | 495,736 |
| 3.65%, 09/01/27 (a) | 300,000 | 279,580 |
| 3.80%, 02/15/28 (a) | 750,000 | 704,395 |
| 4.75%, 05/15/47 (a) | 750,000 | 709,699 |
| Deutsche Telekom International Finance BV |
| 6.00%, 07/08/19 | 1,075,000 | 1,107,744 |
| 8.75%, 06/15/30 | 400,000 | 531,154 |
| Discovery Communications LLC |
| 2.80%, 06/15/20 (a)(e) | 1,000,000 | 988,391 |
| 3.95%, 03/20/28 (a) | 500,000 | 474,448 |
| 6.35%, 06/01/40 | 1,000,000 | 1,090,476 |
| 4.88%, 04/01/43 | 1,000,000 | 930,357 |
| Electronic Arts, Inc. |
| 3.70%, 03/01/21 (a) | 300,000 | 303,005 |
| 4.80%, 03/01/26 (a) | 500,000 | 525,221 |
| Grupo Televisa S.A.B. |
| 6.63%, 03/18/25 | 1,250,000 | 1,393,700 |
| 6.63%, 01/15/40 | 500,000 | 544,203 |
| 6.13%, 01/31/46 (a) | 250,000 | 259,170 |
| Interpublic Group of Cos., Inc. |
| 3.75%, 02/15/23 | 1,000,000 | 991,680 |
| Koninklijke KPN N.V. |
| 8.38%, 10/01/30 | 250,000 | 328,102 |
| Moody's Corp. |
| 2.75%, 12/15/21 (a) | 750,000 | 733,108 |
| NBCUniversal Media LLC |
| 5.15%, 04/30/20 | 500,000 | 516,814 |
| 4.38%, 04/01/21 (d) | 750,000 | 769,743 |
| 5.95%, 04/01/41 | 1,000,000 | 1,128,448 |
| Omnicom Group, Inc./Omnicom Capital, Inc. |
| 4.45%, 08/15/20 | 1,000,000 | 1,024,629 |
| 3.63%, 05/01/22 | 1,000,000 | 993,586 |
| 3.65%, 11/01/24 (a) | 250,000 | 243,160 |
| 3.60%, 04/15/26 (a) | 500,000 | 479,249 |
| Orange S.A. |
| 9.00%, 03/01/31 | 500,000 | 687,560 |
| 5.38%, 01/13/42 | 250,000 | 272,332 |
| 5.50%, 02/06/44 (a) | 500,000 | 555,576 |
| Rogers Communications, Inc. |
| 3.00%, 03/15/23 (a) | 250,000 | 244,326 |
| 3.63%, 12/15/25 (a) | 500,000 | 489,704 |
| 5.00%, 03/15/44 (a) | 500,000 | 521,170 |
Schwab Fixed-Income ETFs | Semiannual Report
Schwab U.S. Aggregate Bond ETF
Portfolio Holdings as of June 30, 2018 (Unaudited) (continued)
Security
Rate, Maturity Date | Face
Amount ($) | Value ($) |
| TCI Communications, Inc. |
| 7.13%, 02/15/28 | 800,000 | 971,184 |
| Telefonica Emisiones S.A.U. |
| 5.13%, 04/27/20 | 250,000 | 258,018 |
| 5.46%, 02/16/21 | 700,000 | 733,041 |
| 4.57%, 04/27/23 | 150,000 | 155,236 |
| 4.10%, 03/08/27 | 500,000 | 484,414 |
| 7.05%, 06/20/36 | 900,000 | 1,084,786 |
| 5.21%, 03/08/47 | 500,000 | 483,714 |
| Telefonica Europe BV |
| 8.25%, 09/15/30 | 750,000 | 971,869 |
| Telefonos de Mexico S.A.B. de C.V. |
| 5.50%, 11/15/19 | 600,000 | 618,492 |
| TELUS Corp. |
| 3.70%, 09/15/27 (a) | 250,000 | 245,727 |
| Time Warner Cable LLC |
| 5.00%, 02/01/20 | 1,180,000 | 1,205,091 |
| 4.13%, 02/15/21 (a) | 500,000 | 502,826 |
| 6.55%, 05/01/37 | 500,000 | 531,891 |
| 5.88%, 11/15/40 (a) | 1,000,000 | 981,311 |
| 5.50%, 09/01/41 (a) | 250,000 | 233,326 |
| Verizon Communications, Inc. |
| 2.63%, 02/21/20 | 793,000 | 790,703 |
| 4.60%, 04/01/21 | 500,000 | 517,194 |
| 3.00%, 11/01/21 (a) | 1,250,000 | 1,230,577 |
| 3.50%, 11/01/21 | 250,000 | 251,308 |
| 2.45%, 11/01/22 (a) | 750,000 | 715,871 |
| 5.15%, 09/15/23 | 1,250,000 | 1,330,896 |
| 3.50%, 11/01/24 (a) | 1,000,000 | 968,586 |
| 2.63%, 08/15/26 | 500,000 | 444,565 |
| 4.13%, 03/16/27 | 2,000,000 | 1,982,868 |
| 4.50%, 08/10/33 | 3,500,000 | 3,398,492 |
| 4.40%, 11/01/34 (a) | 2,500,000 | 2,338,208 |
| 4.13%, 08/15/46 | 500,000 | 430,602 |
| 4.86%, 08/21/46 | 1,000,000 | 959,151 |
| 4.52%, 09/15/48 | 3,000,000 | 2,745,908 |
| 5.01%, 08/21/54 | 1,000,000 | 944,956 |
| 4.67%, 03/15/55 | 1,000,000 | 891,782 |
| Viacom, Inc. |
| 4.50%, 03/01/21 | 1,000,000 | 1,018,020 |
| 3.88%, 12/15/21 | 100,000 | 99,895 |
| 3.88%, 04/01/24 (a) | 248,000 | 240,245 |
| 6.88%, 04/30/36 | 400,000 | 433,342 |
| 5.85%, 09/01/43 (a) | 500,000 | 501,414 |
| Vodafone Group PLC |
| 2.50%, 09/26/22 | 500,000 | 478,724 |
| 2.95%, 02/19/23 | 1,100,000 | 1,062,536 |
| 4.38%, 05/30/28 | 1,500,000 | 1,485,120 |
| 4.38%, 02/19/43 | 500,000 | 450,934 |
| 5.25%, 05/30/48 | 1,000,000 | 1,000,980 |
| Walt Disney Co. |
| 2.35%, 12/01/22 | 1,500,000 | 1,440,693 |
| 3.00%, 02/13/26 | 800,000 | 762,127 |
| 1.85%, 07/30/26 | 200,000 | 174,826 |
| 4.13%, 12/01/41 | 1,500,000 | 1,434,177 |
| Warner Media LLC |
| 4.88%, 03/15/20 | 200,000 | 205,423 |
| 4.75%, 03/29/21 | 300,000 | 309,764 |
| 4.00%, 01/15/22 | 500,000 | 505,430 |
| 3.55%, 06/01/24 (a) | 400,000 | 386,205 |
| 3.88%, 01/15/26 (a) | 1,000,000 | 962,264 |
| 3.80%, 02/15/27 (a) | 250,000 | 236,520 |
| 4.85%, 07/15/45 (a) | 1,000,000 | 914,202 |
| | | 112,185,250 |
Security
Rate, Maturity Date | Face
Amount ($) | Value ($) |
| Consumer Cyclical 1.7% |
| Alibaba Group Holding Ltd. |
| 3.13%, 11/28/21 (a) | 250,000 | 247,723 |
| 3.40%, 12/06/27 (a) | 2,000,000 | 1,865,691 |
| 4.50%, 11/28/34 (a) | 500,000 | 502,937 |
| 4.00%, 12/06/37 (a) | 1,500,000 | 1,391,512 |
| 4.40%, 12/06/57 (a) | 750,000 | 695,012 |
| Amazon.com, Inc. |
| 2.60%, 12/05/19 (a) | 1,100,000 | 1,100,677 |
| 3.30%, 12/05/21 (a) | 1,500,000 | 1,513,267 |
| 2.40%, 02/22/23 (a) | 1,600,000 | 1,540,393 |
| 2.80%, 08/22/24 (a) | 500,000 | 482,441 |
| 4.80%, 12/05/34 (a) | 500,000 | 549,373 |
| 4.95%, 12/05/44 (a) | 500,000 | 556,953 |
| 4.05%, 08/22/47 (a) | 750,000 | 737,813 |
| 4.25%, 08/22/57 (a) | 1,000,000 | 990,699 |
| American Honda Finance Corp. |
| 2.00%, 02/14/20 | 650,000 | 641,454 |
| 2.45%, 09/24/20 | 200,000 | 197,541 |
| 2.60%, 11/16/22 | 1,000,000 | 974,038 |
| 2.90%, 02/16/24 | 500,000 | 485,432 |
| Aptiv PLC |
| 4.40%, 10/01/46 (a) | 500,000 | 471,594 |
| Automatic Data Processing, Inc. |
| 2.25%, 09/15/20 (a) | 350,000 | 345,319 |
| AutoNation, Inc. |
| 3.80%, 11/15/27 (a) | 500,000 | 465,145 |
| AutoZone, Inc. |
| 3.70%, 04/15/22 (a) | 500,000 | 503,008 |
| 3.25%, 04/15/25 (a) | 1,000,000 | 954,984 |
| Bed Bath & Beyond, Inc. |
| 5.17%, 08/01/44 (a) | 250,000 | 192,119 |
| Booking Holdings, Inc. |
| 2.75%, 03/15/23 (a) | 250,000 | 241,460 |
| Carnival Corp. |
| 3.95%, 10/15/20 | 350,000 | 355,692 |
| Costco Wholesale Corp. |
| 2.75%, 05/18/24 (a) | 500,000 | 484,614 |
| 3.00%, 05/18/27 (a) | 1,750,000 | 1,672,579 |
| Daimler Finance North America LLC |
| 8.50%, 01/18/31 | 500,000 | 704,697 |
| Darden Restaurants, Inc. |
| 3.85%, 05/01/27 (a) | 900,000 | 871,836 |
| Delphi Corp. |
| 4.15%, 03/15/24 (a) | 540,000 | 542,077 |
| Dollar Tree, Inc. |
| 3.70%, 05/15/23 (a) | 500,000 | 496,060 |
| DR Horton, Inc. |
| 4.00%, 02/15/20 | 500,000 | 505,061 |
| 2.55%, 12/01/20 | 250,000 | 245,164 |
| eBay, Inc. |
| 2.15%, 06/05/20 | 400,000 | 393,185 |
| 3.80%, 03/09/22 (a) | 500,000 | 505,233 |
| 3.60%, 06/05/27 (a) | 1,250,000 | 1,184,049 |
| Ford Motor Co. |
| 7.45%, 07/16/31 | 1,000,000 | 1,177,598 |
| 4.75%, 01/15/43 | 600,000 | 520,351 |
| 7.40%, 11/01/46 | 250,000 | 297,025 |
| 5.29%, 12/08/46 (a) | 500,000 | 465,002 |
| Ford Motor Credit Co. LLC |
| 3.16%, 08/04/20 | 300,000 | 298,079 |
| 5.88%, 08/02/21 | 1,750,000 | 1,856,516 |
| 4.14%, 02/15/23 (a) | 1,000,000 | 1,000,708 |
Schwab Fixed-Income ETFs | Semiannual Report
Schwab U.S. Aggregate Bond ETF
Portfolio Holdings as of June 30, 2018 (Unaudited) (continued)
Security
Rate, Maturity Date | Face
Amount ($) | Value ($) |
| 4.13%, 08/04/25 | 2,000,000 | 1,952,738 |
| 3.82%, 11/02/27 (a) | 500,000 | 464,880 |
| General Motors Co. |
| 4.88%, 10/02/23 | 1,100,000 | 1,132,143 |
| 4.00%, 04/01/25 | 400,000 | 388,792 |
| 5.00%, 04/01/35 | 500,000 | 474,839 |
| 6.25%, 10/02/43 | 750,000 | 779,730 |
| General Motors Financial Co., Inc. |
| 3.15%, 01/15/20 (a) | 1,500,000 | 1,497,923 |
| 2.65%, 04/13/20 | 600,000 | 593,032 |
| 3.20%, 07/06/21 (a) | 1,250,000 | 1,234,612 |
| 4.38%, 09/25/21 | 2,250,000 | 2,295,086 |
| 3.45%, 01/14/22 (a) | 750,000 | 739,838 |
| 3.15%, 06/30/22 (a) | 500,000 | 486,385 |
| 3.25%, 01/05/23 (a) | 500,000 | 485,037 |
| 4.35%, 01/17/27 (a) | 1,250,000 | 1,211,647 |
| 3.85%, 01/05/28 (a) | 1,000,000 | 925,831 |
| Harley-Davidson, Inc. |
| 4.63%, 07/28/45 (a) | 500,000 | 486,970 |
| Home Depot, Inc. |
| 2.00%, 04/01/21 (a) | 800,000 | 780,947 |
| 4.40%, 04/01/21 (a) | 500,000 | 518,140 |
| 2.63%, 06/01/22 (a) | 750,000 | 735,997 |
| 3.75%, 02/15/24 (a) | 500,000 | 511,183 |
| 2.13%, 09/15/26 (a) | 250,000 | 223,227 |
| 5.88%, 12/16/36 | 1,700,000 | 2,066,882 |
| 5.95%, 04/01/41 (a) | 500,000 | 618,656 |
| 4.20%, 04/01/43 (a) | 250,000 | 251,391 |
| 4.88%, 02/15/44 (a) | 1,500,000 | 1,647,946 |
| Kohl's Corp. |
| 3.25%, 02/01/23 (a) | 1,000,000 | 972,823 |
| 4.75%, 12/15/23 (a) | 273,000 | 278,529 |
| 4.25%, 07/17/25 (a) | 750,000 | 747,440 |
| Lear Corp. |
| 5.25%, 01/15/25 (a) | 1,000,000 | 1,029,484 |
| Lowe's Cos., Inc. |
| 3.12%, 04/15/22 (a) | 750,000 | 748,435 |
| 3.38%, 09/15/25 (a) | 1,250,000 | 1,225,161 |
| 3.10%, 05/03/27 (a) | 500,000 | 473,091 |
| 6.50%, 03/15/29 | 251,000 | 302,338 |
| 4.05%, 05/03/47 (a) | 500,000 | 474,128 |
| Macy's Retail Holdings, Inc. |
| 2.88%, 02/15/23 (a) | 200,000 | 188,333 |
| Marriott International, Inc. |
| 3.13%, 10/15/21 (a) | 200,000 | 197,919 |
| 3.75%, 03/15/25 (a) | 1,250,000 | 1,234,885 |
| Mastercard, Inc. |
| 2.95%, 11/21/26 (a) | 500,000 | 478,135 |
| 3.80%, 11/21/46 (a) | 500,000 | 488,276 |
| McDonald's Corp. |
| 2.20%, 05/26/20 (a) | 500,000 | 493,183 |
| 2.75%, 12/09/20 (a) | 1,500,000 | 1,490,730 |
| 3.38%, 05/26/25 (a) | 750,000 | 738,113 |
| 4.88%, 12/09/45 (a) | 600,000 | 632,331 |
| 4.45%, 03/01/47 (a) | 250,000 | 247,699 |
| NIKE, Inc. |
| 2.25%, 05/01/23 (a) | 100,000 | 95,733 |
| 3.63%, 05/01/43 (a) | 50,000 | 46,566 |
| Nordstrom, Inc. |
| 4.00%, 10/15/21 (a) | 300,000 | 302,597 |
| 5.00%, 01/15/44 (a) | 500,000 | 462,633 |
| O'Reilly Automotive, Inc. |
| 3.55%, 03/15/26 (a) | 500,000 | 476,433 |
Security
Rate, Maturity Date | Face
Amount ($) | Value ($) |
| QVC, Inc. |
| 5.13%, 07/02/22 | 200,000 | 205,060 |
| 4.38%, 03/15/23 | 250,000 | 247,282 |
| 5.45%, 08/15/34 (a) | 200,000 | 185,217 |
| Royal Caribbean Cruises Ltd. |
| 3.70%, 03/15/28 (a) | 250,000 | 231,352 |
| Starbucks Corp. |
| 2.70%, 06/15/22 (a) | 500,000 | 486,236 |
| 3.85%, 10/01/23 (a) | 300,000 | 303,462 |
| 3.75%, 12/01/47 (a) | 500,000 | 436,416 |
| Target Corp. |
| 3.50%, 07/01/24 | 500,000 | 502,441 |
| 4.00%, 07/01/42 | 500,000 | 477,209 |
| Toyota Motor Credit Corp. |
| 1.55%, 10/18/19 | 350,000 | 345,146 |
| 2.15%, 03/12/20 | 500,000 | 494,102 |
| 3.40%, 09/15/21 | 1,350,000 | 1,361,742 |
| 2.70%, 01/11/23 | 500,000 | 487,109 |
| 3.20%, 01/11/27 | 250,000 | 241,580 |
| Visa, Inc. |
| 2.20%, 12/14/20 (a) | 1,000,000 | 984,106 |
| 2.15%, 09/15/22 (a) | 500,000 | 479,546 |
| 3.15%, 12/14/25 (a) | 250,000 | 242,083 |
| 4.15%, 12/14/35 (a) | 1,500,000 | 1,557,114 |
| 4.30%, 12/14/45 (a) | 750,000 | 781,203 |
| Walgreens Boots Alliance, Inc. |
| 3.30%, 11/18/21 (a) | 1,000,000 | 994,427 |
| 3.80%, 11/18/24 (a) | 1,000,000 | 987,141 |
| 3.45%, 06/01/26 (a) | 500,000 | 466,820 |
| 4.80%, 11/18/44 (a) | 200,000 | 189,001 |
| Walmart, Inc. |
| 2.35%, 12/15/22 (a) | 1,500,000 | 1,450,283 |
| 2.55%, 04/11/23 (a) | 2,450,000 | 2,366,128 |
| 2.65%, 12/15/24 (a) | 1,250,000 | 1,200,302 |
| 3.70%, 06/26/28 (a) | 3,000,000 | 3,028,960 |
| 3.95%, 06/28/38 (a) | 750,000 | 753,394 |
| 4.05%, 06/29/48 (a) | 750,000 | 757,191 |
| Walt Disney Co. |
| 4.38%, 08/16/41 | 500,000 | 502,681 |
| Western Union Co. |
| 4.25%, 06/09/23 (a) | 750,000 | 748,323 |
| | | 91,044,015 |
| Consumer Non-Cyclical 4.1% |
| Abbott Laboratories |
| 2.55%, 03/15/22 | 500,000 | 484,359 |
| 3.40%, 11/30/23 (a) | 2,500,000 | 2,469,582 |
| 3.75%, 11/30/26 (a) | 1,250,000 | 1,230,847 |
| 4.90%, 11/30/46 (a) | 1,000,000 | 1,080,741 |
| AbbVie, Inc. |
| 2.50%, 05/14/20 (a) | 1,000,000 | 988,396 |
| 2.90%, 11/06/22 | 500,000 | 485,675 |
| 3.20%, 11/06/22 (a) | 300,000 | 295,350 |
| 2.85%, 05/14/23 (a) | 1,450,000 | 1,398,056 |
| 4.50%, 05/14/35 (a) | 1,500,000 | 1,464,168 |
| 4.30%, 05/14/36 (a) | 1,500,000 | 1,435,151 |
| 4.40%, 11/06/42 | 500,000 | 476,669 |
| 4.70%, 05/14/45 (a) | 250,000 | 248,229 |
| Allergan Finance LLC |
| 3.25%, 10/01/22 (a) | 1,750,000 | 1,701,879 |
| Allergan Funding SCS |
| 3.45%, 03/15/22 (a) | 1,000,000 | 984,834 |
| 3.85%, 06/15/24 (a) | 500,000 | 491,645 |
| 4.55%, 03/15/35 (a) | 750,000 | 711,647 |
Schwab Fixed-Income ETFs | Semiannual Report
Schwab U.S. Aggregate Bond ETF
Portfolio Holdings as of June 30, 2018 (Unaudited) (continued)
Security
Rate, Maturity Date | Face
Amount ($) | Value ($) |
| 4.85%, 06/15/44 (a) | 250,000 | 242,350 |
| 4.75%, 03/15/45 (a) | 168,000 | 162,321 |
| Allergan, Inc. |
| 2.80%, 03/15/23 (a) | 1,150,000 | 1,087,001 |
| Altria Group, Inc. |
| 9.25%, 08/06/19 | 250,000 | 267,088 |
| 4.75%, 05/05/21 | 500,000 | 519,491 |
| 2.85%, 08/09/22 | 600,000 | 586,167 |
| 2.95%, 05/02/23 | 800,000 | 778,707 |
| 4.25%, 08/09/42 | 200,000 | 187,002 |
| 3.88%, 09/16/46 (a) | 1,000,000 | 880,819 |
| AmerisourceBergen Corp. |
| 3.45%, 12/15/27 (a) | 1,000,000 | 923,076 |
| Amgen, Inc. |
| 3.45%, 10/01/20 | 500,000 | 504,133 |
| 4.10%, 06/15/21 (a) | 1,000,000 | 1,021,733 |
| 1.85%, 08/19/21 (a) | 1,500,000 | 1,437,780 |
| 3.88%, 11/15/21 (a) | 500,000 | 507,538 |
| 3.63%, 05/22/24 (a) | 650,000 | 648,141 |
| 4.95%, 10/01/41 | 500,000 | 514,281 |
| 5.15%, 11/15/41 (a) | 500,000 | 533,459 |
| 4.40%, 05/01/45 (a) | 500,000 | 478,372 |
| 4.66%, 06/15/51 (a) | 750,000 | 744,693 |
| Anheuser-Busch InBev Finance, Inc. |
| 2.65%, 02/01/21 (a) | 3,750,000 | 3,700,599 |
| 3.30%, 02/01/23 (a) | 1,750,000 | 1,737,196 |
| 3.70%, 02/01/24 | 1,950,000 | 1,949,759 |
| 3.65%, 02/01/26 (a) | 1,900,000 | 1,861,821 |
| 4.70%, 02/01/36 (a) | 2,250,000 | 2,287,163 |
| 4.63%, 02/01/44 | 500,000 | 493,136 |
| 4.90%, 02/01/46 (a) | 2,500,000 | 2,580,668 |
| Anheuser-Busch InBev Worldwide, Inc. |
| 6.88%, 11/15/19 | 850,000 | 893,489 |
| 3.50%, 01/12/24 (a) | 500,000 | 497,531 |
| 4.00%, 04/13/28 (a) | 750,000 | 749,761 |
| 4.44%, 10/06/48 (a) | 2,000,000 | 1,932,514 |
| Archer-Daniels-Midland Co. |
| 2.50%, 08/11/26 (a) | 750,000 | 690,606 |
| 4.02%, 04/16/43 | 200,000 | 195,641 |
| Ascension Health |
| 3.95%, 11/15/46 | 500,000 | 493,884 |
| AstraZeneca PLC |
| 2.38%, 11/16/20 | 500,000 | 490,805 |
| 2.38%, 06/12/22 (a) | 500,000 | 481,397 |
| 6.45%, 09/15/37 | 1,650,000 | 2,048,236 |
| BAT Capital Corp. |
| 2.76%, 08/15/22 (a)(e) | 2,000,000 | 1,919,634 |
| 3.22%, 08/15/24 (a)(e) | 1,000,000 | 948,529 |
| Baxalta, Inc. |
| 3.60%, 06/23/22 (a) | 1,000,000 | 990,631 |
| 4.00%, 06/23/25 (a) | 1,750,000 | 1,715,780 |
| 5.25%, 06/23/45 (a) | 1,000,000 | 1,034,055 |
| Baxter International, Inc. |
| 1.70%, 08/15/21 (a) | 500,000 | 475,282 |
| Becton Dickinson & Co. |
| 2.68%, 12/15/19 | 950,000 | 943,207 |
| 3.25%, 11/12/20 | 650,000 | 647,064 |
| 2.89%, 06/06/22 (a) | 750,000 | 726,090 |
| 3.73%, 12/15/24 (a) | 1,000,000 | 977,635 |
| 4.69%, 12/15/44 (a) | 250,000 | 243,223 |
| 4.67%, 06/06/47 (a) | 500,000 | 485,094 |
| Biogen, Inc. |
| 2.90%, 09/15/20 | 1,000,000 | 996,175 |
| 4.05%, 09/15/25 (a) | 1,000,000 | 1,006,679 |
| 5.20%, 09/15/45 (a) | 500,000 | 532,569 |
Security
Rate, Maturity Date | Face
Amount ($) | Value ($) |
| Boston Scientific Corp. |
| 6.00%, 01/15/20 | 650,000 | 677,445 |
| 4.13%, 10/01/23 (a) | 100,000 | 102,051 |
| 3.85%, 05/15/25 | 250,000 | 247,795 |
| Bristol-Myers Squibb Co. |
| 3.25%, 02/27/27 | 250,000 | 241,880 |
| 3.25%, 08/01/42 | 100,000 | 86,759 |
| 4.50%, 03/01/44 (a) | 600,000 | 644,652 |
| Brown-Forman Corp. |
| 4.00%, 04/15/38 (a) | 750,000 | 749,035 |
| Bunge Ltd. Finance Corp. |
| 3.75%, 09/25/27 (a) | 500,000 | 472,761 |
| Campbell Soup Co. |
| 2.50%, 08/02/22 | 350,000 | 331,902 |
| 4.15%, 03/15/28 (a) | 1,000,000 | 954,070 |
| Cardinal Health, Inc. |
| 2.62%, 06/15/22 (a) | 1,100,000 | 1,055,453 |
| 3.08%, 06/15/24 (a) | 1,000,000 | 943,396 |
| 3.75%, 09/15/25 (a) | 250,000 | 241,025 |
| 3.41%, 06/15/27 (a) | 250,000 | 230,163 |
| 4.90%, 09/15/45 (a) | 500,000 | 480,012 |
| Catholic Health Initiatives |
| 4.35%, 11/01/42 | 250,000 | 237,417 |
| Celgene Corp. |
| 2.88%, 08/15/20 | 1,000,000 | 992,848 |
| 3.55%, 08/15/22 | 1,000,000 | 993,335 |
| 3.63%, 05/15/24 (a) | 700,000 | 683,815 |
| 3.45%, 11/15/27 (a) | 500,000 | 460,644 |
| 3.90%, 02/20/28 (a) | 250,000 | 237,026 |
| 4.35%, 11/15/47 (a) | 750,000 | 663,078 |
| Church & Dwight Co., Inc. |
| 3.15%, 08/01/27 (a) | 1,000,000 | 929,673 |
| Clorox Co. |
| 3.90%, 05/15/28 (a) | 550,000 | 546,506 |
| Coca-Cola Co. |
| 1.88%, 10/27/20 | 100,000 | 97,776 |
| 3.30%, 09/01/21 | 750,000 | 756,621 |
| 2.50%, 04/01/23 | 250,000 | 242,232 |
| Coca-Cola Femsa S.A.B. de C.V. |
| 5.25%, 11/26/43 | 750,000 | 840,538 |
| Colgate-Palmolive Co. |
| 2.10%, 05/01/23 | 500,000 | 477,977 |
| 3.25%, 03/15/24 | 400,000 | 401,676 |
| Conagra Brands, Inc. |
| 3.20%, 01/25/23 (a) | 783,000 | 754,707 |
| Constellation Brands, Inc. |
| 2.65%, 11/07/22 (a) | 250,000 | 239,845 |
| 3.20%, 02/15/23 (a) | 1,750,000 | 1,704,606 |
| 4.25%, 05/01/23 | 500,000 | 510,313 |
| CVS Health Corp. |
| 2.25%, 08/12/19 (a) | 1,250,000 | 1,240,081 |
| 3.35%, 03/09/21 | 500,000 | 499,768 |
| 3.70%, 03/09/23 (a) | 3,000,000 | 2,987,969 |
| 3.38%, 08/12/24 (a) | 1,000,000 | 966,641 |
| 4.10%, 03/25/25 (a) | 500,000 | 498,075 |
| 3.88%, 07/20/25 (a) | 750,000 | 727,807 |
| 4.30%, 03/25/28 (a) | 2,000,000 | 1,976,701 |
| 4.88%, 07/20/35 (a) | 250,000 | 251,898 |
| 4.78%, 03/25/38 (a) | 750,000 | 740,010 |
| 5.30%, 12/05/43 (a) | 700,000 | 734,036 |
| 5.13%, 07/20/45 (a) | 1,000,000 | 1,016,964 |
| 5.05%, 03/25/48 (a) | 2,250,000 | 2,298,612 |
| Dartmouth-Hitchcock Health |
| 4.18%, 08/01/48 (a) | 1,500,000 | 1,504,731 |
Schwab Fixed-Income ETFs | Semiannual Report
Schwab U.S. Aggregate Bond ETF
Portfolio Holdings as of June 30, 2018 (Unaudited) (continued)
Security
Rate, Maturity Date | Face
Amount ($) | Value ($) |
| Diageo Capital PLC |
| 3.88%, 05/18/28 (a) | 450,000 | 454,319 |
| 5.88%, 09/30/36 | 1,000,000 | 1,226,664 |
| Dr Pepper Snapple Group, Inc. |
| 3.13%, 12/15/23 (a) | 250,000 | 239,482 |
| 4.42%, 12/15/46 (a) | 250,000 | 229,610 |
| Eli Lilly & Co. |
| 2.35%, 05/15/22 | 600,000 | 584,062 |
| 3.10%, 05/15/27 (a) | 500,000 | 479,152 |
| 3.70%, 03/01/45 (a) | 500,000 | 474,741 |
| Estee Lauder Cos., Inc. |
| 4.15%, 03/15/47 (a) | 600,000 | 613,289 |
| Express Scripts Holding Co. |
| 3.05%, 11/30/22 (a) | 500,000 | 482,479 |
| 3.00%, 07/15/23 (a) | 500,000 | 474,830 |
| 3.40%, 03/01/27 (a) | 500,000 | 457,690 |
| 4.80%, 07/15/46 (a) | 1,000,000 | 954,499 |
| General Mills, Inc. |
| 3.20%, 04/16/21 | 1,000,000 | 995,471 |
| 4.00%, 04/17/25 (a) | 1,000,000 | 986,281 |
| 4.55%, 04/17/38 (a) | 500,000 | 478,654 |
| Genzyme Corp. |
| 5.00%, 06/15/20 | 250,000 | 259,393 |
| Gilead Sciences, Inc. |
| 2.55%, 09/01/20 | 500,000 | 494,147 |
| 4.40%, 12/01/21 (a) | 350,000 | 362,047 |
| 2.50%, 09/01/23 (a) | 750,000 | 715,482 |
| 3.70%, 04/01/24 (a) | 400,000 | 401,061 |
| 3.50%, 02/01/25 (a) | 500,000 | 492,874 |
| 3.65%, 03/01/26 (a) | 400,000 | 395,307 |
| 4.60%, 09/01/35 (a) | 500,000 | 515,497 |
| 5.65%, 12/01/41 (a) | 200,000 | 235,024 |
| 4.80%, 04/01/44 (a) | 500,000 | 522,294 |
| 4.50%, 02/01/45 (a) | 250,000 | 250,464 |
| 4.75%, 03/01/46 (a) | 750,000 | 775,933 |
| 4.15%, 03/01/47 (a) | 750,000 | 718,673 |
| GlaxoSmithKline Capital PLC |
| 2.85%, 05/08/22 | 150,000 | 147,541 |
| GlaxoSmithKline Capital, Inc. |
| 3.63%, 05/15/25 | 1,000,000 | 999,182 |
| 3.88%, 05/15/28 | 1,500,000 | 1,513,671 |
| Hasbro, Inc. |
| 6.35%, 03/15/40 | 450,000 | 494,578 |
| 5.10%, 05/15/44 (a) | 100,000 | 95,067 |
| JM Smucker Co. |
| 3.50%, 10/15/21 | 250,000 | 251,182 |
| 3.50%, 03/15/25 | 750,000 | 718,367 |
| 4.38%, 03/15/45 | 1,000,000 | 931,043 |
| Johnson & Johnson |
| 1.65%, 03/01/21 (a) | 250,000 | 242,949 |
| 2.45%, 12/05/21 | 100,000 | 99,227 |
| 2.05%, 03/01/23 (a) | 100,000 | 95,764 |
| 3.38%, 12/05/23 | 500,000 | 505,390 |
| 2.45%, 03/01/26 (a) | 450,000 | 422,639 |
| 2.95%, 03/03/27 (a) | 2,000,000 | 1,925,983 |
| 2.90%, 01/15/28 (a) | 100,000 | 95,565 |
| 3.40%, 01/15/38 (a) | 1,500,000 | 1,419,718 |
| 3.70%, 03/01/46 (a) | 1,000,000 | 968,971 |
| Kaiser Foundation Hospitals |
| 3.15%, 05/01/27 (a) | 1,250,000 | 1,198,472 |
| Kellogg Co. |
| 2.65%, 12/01/23 | 500,000 | 475,992 |
| 4.30%, 05/15/28 (a) | 1,000,000 | 986,172 |
Security
Rate, Maturity Date | Face
Amount ($) | Value ($) |
| Kimberly-Clark Corp. |
| 6.63%, 08/01/37 | 100,000 | 134,097 |
| 5.30%, 03/01/41 | 1,000,000 | 1,181,248 |
| Koninklijke Ahold Delhaize NV |
| 5.70%, 10/01/40 | 750,000 | 821,409 |
| Koninklijke Philips N.V. |
| 5.00%, 03/15/42 | 100,000 | 110,857 |
| Kraft Heinz Foods Co. |
| 5.38%, 02/10/20 | 1,000,000 | 1,034,573 |
| 3.50%, 06/06/22 | 1,000,000 | 990,996 |
| 3.00%, 06/01/26 (a) | 250,000 | 225,519 |
| 6.88%, 01/26/39 | 250,000 | 295,630 |
| 5.00%, 06/04/42 | 1,500,000 | 1,436,948 |
| 5.20%, 07/15/45 (a) | 500,000 | 488,151 |
| 4.38%, 06/01/46 (a) | 750,000 | 651,280 |
| Kroger Co. |
| 2.80%, 08/01/22 (a) | 750,000 | 728,121 |
| 4.00%, 02/01/24 (a) | 1,000,000 | 1,003,476 |
| Laboratory Corp. of America Holdings |
| 3.25%, 09/01/24 (a) | 1,250,000 | 1,210,166 |
| Maple Escrow Subsidiary, Inc. |
| 3.55%, 05/25/21 (e) | 250,000 | 250,392 |
| 4.42%, 05/25/25 (a)(e) | 1,000,000 | 1,006,439 |
| 4.60%, 05/25/28 (a)(e) | 500,000 | 502,822 |
| 5.09%, 05/25/48 (a)(e) | 250,000 | 253,024 |
| McKesson Corp. |
| 2.70%, 12/15/22 (a) | 750,000 | 720,973 |
| 3.80%, 03/15/24 (a) | 500,000 | 494,166 |
| 3.95%, 02/16/28 (a) | 1,000,000 | 968,580 |
| Mead Johnson Nutrition Co. |
| 3.00%, 11/15/20 | 500,000 | 497,703 |
| Medtronic Global Holdings SCA |
| 3.35%, 04/01/27 (a) | 500,000 | 487,680 |
| Medtronic, Inc. |
| 2.50%, 03/15/20 | 1,850,000 | 1,837,616 |
| 4.13%, 03/15/21 (a) | 100,000 | 102,392 |
| 3.15%, 03/15/22 | 1,300,000 | 1,290,258 |
| 3.63%, 03/15/24 (a) | 200,000 | 200,882 |
| 3.50%, 03/15/25 | 1,350,000 | 1,337,033 |
| 4.38%, 03/15/35 | 1,250,000 | 1,295,053 |
| 4.63%, 03/15/45 | 750,000 | 796,897 |
| Memorial Sloan-Kettering Cancer Center |
| 4.20%, 07/01/55 | 250,000 | 257,367 |
| Merck & Co., Inc. |
| 1.85%, 02/10/20 | 100,000 | 98,536 |
| 3.88%, 01/15/21 (a) | 1,600,000 | 1,631,525 |
| 2.80%, 05/18/23 | 1,250,000 | 1,223,991 |
| 2.75%, 02/10/25 (a) | 2,100,000 | 2,009,384 |
| 3.70%, 02/10/45 (a) | 500,000 | 476,523 |
| Molson Coors Brewing Co. |
| 2.10%, 07/15/21 (a) | 1,000,000 | 959,624 |
| 3.50%, 05/01/22 | 200,000 | 199,444 |
| 3.00%, 07/15/26 (a) | 750,000 | 682,474 |
| 5.00%, 05/01/42 | 750,000 | 763,233 |
| 4.20%, 07/15/46 (a) | 500,000 | 450,669 |
| Mondelez International, Inc. |
| 3.63%, 05/07/23 (a) | 1,000,000 | 997,696 |
| 4.13%, 05/07/28 (a) | 300,000 | 298,033 |
| Mylan N.V. |
| 3.95%, 06/15/26 (a) | 1,000,000 | 956,600 |
| Mylan, Inc. |
| 4.55%, 04/15/28 (a)(e) | 500,000 | 489,581 |
Schwab Fixed-Income ETFs | Semiannual Report
Schwab U.S. Aggregate Bond ETF
Portfolio Holdings as of June 30, 2018 (Unaudited) (continued)
Security
Rate, Maturity Date | Face
Amount ($) | Value ($) |
| Newell Brands, Inc. |
| 2.88%, 12/01/19 (a) | 400,000 | 398,664 |
| 3.85%, 04/01/23 (a) | 500,000 | 493,036 |
| 3.90%, 11/01/25 (a) | 1,250,000 | 1,193,672 |
| Novartis Capital Corp. |
| 4.40%, 04/24/20 (d) | 100,000 | 102,783 |
| 2.40%, 09/21/22 | 100,000 | 97,064 |
| 3.00%, 11/20/25 (a) | 1,000,000 | 965,867 |
| 3.10%, 05/17/27 (a) | 750,000 | 720,888 |
| 4.40%, 05/06/44 | 750,000 | 800,864 |
| PepsiCo, Inc. |
| 1.35%, 10/04/19 | 1,500,000 | 1,475,393 |
| 2.15%, 10/14/20 (a) | 100,000 | 98,443 |
| 1.70%, 10/06/21 (a) | 1,000,000 | 956,749 |
| 2.75%, 03/05/22 | 1,350,000 | 1,333,893 |
| 3.60%, 03/01/24 (a) | 500,000 | 505,983 |
| 4.88%, 11/01/40 | 200,000 | 223,006 |
| 4.60%, 07/17/45 (a) | 1,300,000 | 1,411,632 |
| 3.45%, 10/06/46 (a) | 1,000,000 | 899,144 |
| Perrigo Finance Unlimited Co. |
| 3.90%, 12/15/24 (a) | 500,000 | 487,313 |
| Pfizer, Inc. |
| 1.95%, 06/03/21 | 250,000 | 243,366 |
| 3.00%, 06/15/23 | 500,000 | 494,440 |
| 2.75%, 06/03/26 | 1,000,000 | 945,557 |
| 7.20%, 03/15/39 | 500,000 | 694,338 |
| 4.40%, 05/15/44 | 1,000,000 | 1,041,996 |
| 4.13%, 12/15/46 | 1,500,000 | 1,516,788 |
| Philip Morris International, Inc. |
| 1.88%, 11/01/19 | 100,000 | 98,727 |
| 4.50%, 03/26/20 | 250,000 | 255,943 |
| 4.13%, 05/17/21 | 500,000 | 511,123 |
| 2.90%, 11/15/21 | 500,000 | 492,425 |
| 2.38%, 08/17/22 (a) | 500,000 | 478,786 |
| 2.50%, 08/22/22 | 250,000 | 240,978 |
| 2.63%, 03/06/23 | 150,000 | 143,825 |
| 2.75%, 02/25/26 (a) | 250,000 | 232,459 |
| 3.13%, 03/02/28 (a) | 1,000,000 | 945,295 |
| 6.38%, 05/16/38 | 650,000 | 786,999 |
| 4.38%, 11/15/41 | 250,000 | 240,383 |
| 4.88%, 11/15/43 | 1,000,000 | 1,032,367 |
| 4.25%, 11/10/44 | 200,000 | 189,931 |
| Procter & Gamble Co. |
| 1.85%, 02/02/21 | 1,500,000 | 1,462,832 |
| 2.30%, 02/06/22 | 500,000 | 487,513 |
| 3.50%, 10/25/47 | 750,000 | 689,481 |
| Quest Diagnostics, Inc. |
| 2.50%, 03/30/20 (a) | 500,000 | 493,690 |
| 3.50%, 03/30/25 (a) | 500,000 | 482,001 |
| 4.70%, 03/30/45 (a) | 500,000 | 501,544 |
| Reynolds American, Inc. |
| 4.45%, 06/12/25 (a) | 500,000 | 503,924 |
| 6.15%, 09/15/43 | 500,000 | 569,487 |
| 5.85%, 08/15/45 (a) | 1,500,000 | 1,643,280 |
| Sanofi |
| 4.00%, 03/29/21 | 150,000 | 153,728 |
| Shire Acquisitions Investments Ireland DAC |
| 2.40%, 09/23/21 (a) | 500,000 | 479,048 |
| 2.88%, 09/23/23 (a) | 1,500,000 | 1,412,878 |
| Stryker Corp. |
| 3.50%, 03/15/26 (a) | 2,000,000 | 1,945,009 |
| 4.63%, 03/15/46 (a) | 500,000 | 511,381 |
| Sysco Corp. |
| 3.55%, 03/15/25 (a) | 750,000 | 736,060 |
| 3.75%, 10/01/25 (a) | 750,000 | 741,197 |
Security
Rate, Maturity Date | Face
Amount ($) | Value ($) |
| The Coca-Cola Co. |
| 3.15%, 11/15/20 | 1,000,000 | 1,006,571 |
| 3.20%, 11/01/23 | 750,000 | 748,636 |
| The Kroger Co. |
| 6.15%, 01/15/20 | 300,000 | 313,498 |
| 7.50%, 04/01/31 (d) | 100,000 | 123,990 |
| Thermo Fisher Scientific, Inc. |
| 4.50%, 03/01/21 | 50,000 | 51,649 |
| 3.60%, 08/15/21 (a) | 550,000 | 553,376 |
| 3.30%, 02/15/22 | 750,000 | 746,253 |
| 4.15%, 02/01/24 (a) | 800,000 | 812,957 |
| 5.30%, 02/01/44 (a) | 200,000 | 222,695 |
| Tyson Foods, Inc. |
| 4.88%, 08/15/34 (a) | 750,000 | 757,822 |
| 4.55%, 06/02/47 (a) | 500,000 | 480,712 |
| Unilever Capital Corp. |
| 1.80%, 05/05/20 | 1,500,000 | 1,474,907 |
| 4.25%, 02/10/21 | 800,000 | 823,472 |
| 1.38%, 07/28/21 | 100,000 | 95,016 |
| 2.00%, 07/28/26 | 500,000 | 444,109 |
| Wyeth LLC |
| 5.95%, 04/01/37 | 500,000 | 610,633 |
| Zimmer Biomet Holdings, Inc. |
| 2.70%, 04/01/20 (a) | 500,000 | 495,362 |
| 3.70%, 03/19/23 (a) | 250,000 | 248,481 |
| 4.45%, 08/15/45 (a) | 2,099,000 | 1,998,001 |
| Zoetis, Inc. |
| 3.25%, 02/01/23 (a) | 250,000 | 246,403 |
| 3.00%, 09/12/27 (a) | 500,000 | 463,396 |
| 4.70%, 02/01/43 (a) | 100,000 | 103,499 |
| | | 210,460,122 |
| Energy 2.3% |
| Anadarko Petroleum Corp. |
| 4.85%, 03/15/21 (a) | 750,000 | 772,302 |
| 3.45%, 07/15/24 (a) | 240,000 | 230,924 |
| 6.45%, 09/15/36 | 1,000,000 | 1,158,901 |
| 6.60%, 03/15/46 (a) | 1,000,000 | 1,206,020 |
| Andeavor |
| 4.75%, 12/15/23 (a) | 500,000 | 519,464 |
| 5.13%, 12/15/26 (a) | 1,000,000 | 1,044,269 |
| Apache Corp. |
| 3.25%, 04/15/22 (a) | 1,250,000 | 1,229,871 |
| 6.00%, 01/15/37 | 500,000 | 546,719 |
| Baker Hughes a GE Co. LLC/Baker Hughes Co-Obligor, Inc. |
| 3.34%, 12/15/27 (a) | 750,000 | 698,731 |
| 4.08%, 12/15/47 (a) | 750,000 | 671,885 |
| Boardwalk Pipelines LP |
| 4.95%, 12/15/24 (a) | 500,000 | 509,703 |
| 4.45%, 07/15/27 (a) | 2,000,000 | 1,945,599 |
| BP Capital Markets PLC |
| 2.32%, 02/13/20 | 750,000 | 742,977 |
| 4.50%, 10/01/20 | 800,000 | 824,757 |
| 4.74%, 03/11/21 | 1,500,000 | 1,561,997 |
| 3.56%, 11/01/21 | 500,000 | 505,109 |
| 3.06%, 03/17/22 | 500,000 | 496,101 |
| 3.25%, 05/06/22 | 200,000 | 199,477 |
| 3.28%, 09/19/27 (a) | 750,000 | 721,912 |
| Buckeye Partners LP |
| 4.88%, 02/01/21 (a) | 350,000 | 356,341 |
| 4.35%, 10/15/24 (a) | 300,000 | 296,546 |
| 4.13%, 12/01/27 (a) | 2,500,000 | 2,274,525 |
Schwab Fixed-Income ETFs | Semiannual Report
Schwab U.S. Aggregate Bond ETF
Portfolio Holdings as of June 30, 2018 (Unaudited) (continued)
Security
Rate, Maturity Date | Face
Amount ($) | Value ($) |
| Canadian Natural Resources Ltd. |
| 2.95%, 01/15/23 (a) | 2,600,000 | 2,511,120 |
| 3.80%, 04/15/24 (a) | 150,000 | 148,860 |
| 7.20%, 01/15/32 | 225,000 | 278,123 |
| 6.25%, 03/15/38 | 100,000 | 116,487 |
| Cenovus Energy, Inc. |
| 3.00%, 08/15/22 (a) | 1,000,000 | 958,789 |
| 3.80%, 09/15/23 (a) | 500,000 | 488,042 |
| 4.25%, 04/15/27 (a) | 750,000 | 723,701 |
| Chevron Corp. |
| 1.96%, 03/03/20 (a) | 500,000 | 493,773 |
| 2.42%, 11/17/20 (a) | 100,000 | 98,878 |
| 2.50%, 03/03/22 (a) | 300,000 | 294,429 |
| 2.36%, 12/05/22 (a) | 499,000 | 477,358 |
| 3.19%, 06/24/23 (a) | 1,150,000 | 1,145,035 |
| 2.90%, 03/03/24 (a) | 1,500,000 | 1,460,215 |
| Concho Resources, Inc. |
| 4.30%, 08/15/28 (a) | 1,000,000 | 1,004,326 |
| ConocoPhillips Canada Funding Co. I |
| 5.95%, 10/15/36 | 250,000 | 299,795 |
| ConocoPhillips Co. |
| 4.95%, 03/15/26 (a) | 500,000 | 539,733 |
| 6.50%, 02/01/39 | 1,350,000 | 1,729,478 |
| 4.30%, 11/15/44 (a) | 500,000 | 510,656 |
| ConocoPhillips Holding Co. |
| 6.95%, 04/15/29 | 200,000 | 246,960 |
| Continental Resources, Inc. |
| 5.00%, 09/15/22 (a) | 500,000 | 507,178 |
| 4.90%, 06/01/44 (a) | 500,000 | 491,466 |
| Devon Energy Corp. |
| 3.25%, 05/15/22 (a) | 1,000,000 | 983,903 |
| 5.00%, 06/15/45 (a) | 500,000 | 510,515 |
| Dominion Energy Gas Holdings LLC |
| 4.80%, 11/01/43 (a) | 1,300,000 | 1,338,146 |
| Enable Midstream Partners LP |
| 3.90%, 05/15/24 (a) | 100,000 | 95,849 |
| Enbridge Energy Partners LP |
| 4.38%, 10/15/20 (a) | 1,000,000 | 1,018,741 |
| Enbridge, Inc. |
| 4.25%, 12/01/26 (a) | 1,000,000 | 992,669 |
| 3.70%, 07/15/27 (a) | 500,000 | 474,700 |
| 4.50%, 06/10/44 (a) | 150,000 | 137,983 |
| 5.50%, 12/01/46 (a) | 500,000 | 535,721 |
| Encana Corp. |
| 6.50%, 02/01/38 | 500,000 | 589,015 |
| Energy Transfer Partners LP |
| 4.15%, 10/01/20 (a) | 2,250,000 | 2,276,810 |
| 5.20%, 02/01/22 (a) | 2,000,000 | 2,075,778 |
| 4.20%, 04/15/27 (a) | 250,000 | 236,001 |
| 4.90%, 03/15/35 (a) | 750,000 | 687,972 |
| 6.63%, 10/15/36 | 500,000 | 533,548 |
| 7.50%, 07/01/38 | 500,000 | 572,221 |
| 6.50%, 02/01/42 (a) | 800,000 | 826,727 |
| 6.13%, 12/15/45 (a) | 500,000 | 501,369 |
| 5.30%, 04/15/47 (a) | 250,000 | 229,995 |
| EnLink Midstream Partners LP |
| 4.85%, 07/15/26 (a) | 500,000 | 474,553 |
| Enterprise Products Operating LLC |
| 2.55%, 10/15/19 (a) | 1,000,000 | 993,561 |
| 2.85%, 04/15/21 (a) | 1,500,000 | 1,482,329 |
| 3.35%, 03/15/23 (a) | 500,000 | 493,186 |
| 3.90%, 02/15/24 (a) | 400,000 | 401,014 |
| 3.95%, 02/15/27 (a) | 350,000 | 347,049 |
| 6.65%, 10/15/34 | 250,000 | 303,168 |
Security
Rate, Maturity Date | Face
Amount ($) | Value ($) |
| 6.13%, 10/15/39 | 250,000 | 286,288 |
| 5.10%, 02/15/45 (a) | 500,000 | 516,625 |
| 4.25%, 02/15/48 (a) | 1,000,000 | 934,225 |
| EOG Resources, Inc. |
| 4.15%, 01/15/26 (a) | 250,000 | 256,098 |
| EQT Corp. |
| 3.00%, 10/01/22 (a) | 1,000,000 | 964,200 |
| Exxon Mobil Corp. |
| 2.22%, 03/01/21 (a) | 1,000,000 | 981,972 |
| 2.71%, 03/06/25 (a) | 750,000 | 720,982 |
| 3.57%, 03/06/45 (a) | 500,000 | 464,649 |
| Halliburton Co. |
| 3.80%, 11/15/25 (a) | 500,000 | 497,215 |
| 4.85%, 11/15/35 (a) | 250,000 | 259,263 |
| 5.00%, 11/15/45 (a) | 500,000 | 534,735 |
| Helmerich & Payne International Drilling Co. |
| 4.65%, 03/15/25 (a) | 2,000,000 | 2,067,891 |
| Hess Corp. |
| 7.30%, 08/15/31 | 347,000 | 404,159 |
| 7.13%, 03/15/33 | 600,000 | 695,606 |
| 5.60%, 02/15/41 | 500,000 | 503,960 |
| 5.80%, 04/01/47 (a) | 250,000 | 259,245 |
| Husky Energy, Inc. |
| 7.25%, 12/15/19 | 200,000 | 211,129 |
| 3.95%, 04/15/22 (a) | 500,000 | 504,146 |
| 6.80%, 09/15/37 | 500,000 | 614,588 |
| Kerr-McGee Corp. |
| 6.95%, 07/01/24 | 250,000 | 284,012 |
| Kinder Morgan Energy Partners LP |
| 6.85%, 02/15/20 (d) | 800,000 | 842,699 |
| 3.45%, 02/15/23 (a) | 1,500,000 | 1,449,025 |
| 4.30%, 05/01/24 (a) | 300,000 | 300,054 |
| 5.80%, 03/15/35 | 100,000 | 102,459 |
| 5.00%, 08/15/42 (a) | 1,100,000 | 1,024,590 |
| 4.70%, 11/01/42 (a) | 300,000 | 266,370 |
| 5.40%, 09/01/44 (a) | 400,000 | 388,337 |
| Kinder Morgan, Inc. |
| 4.30%, 06/01/25 (a) | 750,000 | 749,250 |
| 4.30%, 03/01/28 (a) | 1,000,000 | 973,387 |
| 7.80%, 08/01/31 | 500,000 | 606,130 |
| 5.55%, 06/01/45 (a) | 1,200,000 | 1,212,145 |
| Magellan Midstream Partners LP |
| 5.15%, 10/15/43 (a) | 750,000 | 786,808 |
| Marathon Oil Corp. |
| 2.80%, 11/01/22 (a) | 550,000 | 527,890 |
| 6.60%, 10/01/37 | 1,000,000 | 1,187,360 |
| Marathon Petroleum Corp. |
| 5.13%, 03/01/21 (d) | 250,000 | 260,254 |
| 3.63%, 09/15/24 (a) | 500,000 | 488,990 |
| 6.50%, 03/01/41 (a) | 500,000 | 584,113 |
| 4.75%, 09/15/44 (a) | 250,000 | 238,724 |
| MPLX LP |
| 4.00%, 02/15/25 (a) | 250,000 | 244,774 |
| 4.70%, 04/15/48 (a) | 2,000,000 | 1,861,575 |
| Nexen Energy ULC |
| 5.88%, 03/10/35 | 600,000 | 696,770 |
| Noble Energy, Inc. |
| 3.85%, 01/15/28 (a) | 1,000,000 | 957,517 |
| 6.00%, 03/01/41 (a) | 250,000 | 275,840 |
| 5.25%, 11/15/43 (a) | 400,000 | 408,378 |
| Occidental Petroleum Corp. |
| 3.40%, 04/15/26 (a) | 1,000,000 | 978,231 |
| 4.40%, 04/15/46 (a) | 1,500,000 | 1,517,348 |
Schwab Fixed-Income ETFs | Semiannual Report
Schwab U.S. Aggregate Bond ETF
Portfolio Holdings as of June 30, 2018 (Unaudited) (continued)
Security
Rate, Maturity Date | Face
Amount ($) | Value ($) |
| ONEOK, Inc. |
| 5.20%, 07/15/48 (a) | 1,000,000 | 1,013,241 |
| Petro-Canada |
| 5.95%, 05/15/35 | 500,000 | 579,352 |
| 6.80%, 05/15/38 | 750,000 | 958,755 |
| Phillips 66 |
| 3.90%, 03/15/28 (a) | 500,000 | 488,965 |
| 4.88%, 11/15/44 (a) | 1,000,000 | 1,036,828 |
| Phillips 66 Partners LP |
| 3.61%, 02/15/25 (a) | 500,000 | 477,475 |
| Pioneer Natural Resources Co. |
| 7.50%, 01/15/20 | 250,000 | 265,958 |
| Plains All American Pipeline LP |
| 5.75%, 01/15/20 | 100,000 | 103,259 |
| 5.00%, 02/01/21 (a) | 1,000,000 | 1,027,761 |
| 3.65%, 06/01/22 (a) | 200,000 | 196,225 |
| 3.85%, 10/15/23 (a) | 150,000 | 146,366 |
| 4.65%, 10/15/25 (a) | 500,000 | 499,027 |
| 4.50%, 12/15/26 (a) | 1,000,000 | 980,571 |
| 6.65%, 01/15/37 | 100,000 | 107,702 |
| Sabine Pass Liquefaction LLC |
| 5.63%, 04/15/23 (a) | 1,000,000 | 1,062,034 |
| 5.75%, 05/15/24 (a) | 2,175,000 | 2,322,761 |
| 5.63%, 03/01/25 (a) | 1,000,000 | 1,065,099 |
| Schlumberger Investment S.A. |
| 3.65%, 12/01/23 (a) | 1,000,000 | 1,009,044 |
| Shell International Finance BV |
| 4.30%, 09/22/19 | 2,100,000 | 2,139,383 |
| 4.38%, 03/25/20 | 500,000 | 513,132 |
| 1.88%, 05/10/21 | 1,000,000 | 969,880 |
| 3.40%, 08/12/23 | 750,000 | 751,290 |
| 3.25%, 05/11/25 | 1,500,000 | 1,471,069 |
| 2.88%, 05/10/26 | 500,000 | 475,634 |
| 4.13%, 05/11/35 | 500,000 | 508,100 |
| 6.38%, 12/15/38 | 1,500,000 | 1,944,396 |
| 4.55%, 08/12/43 | 750,000 | 787,147 |
| Spectra Energy Partners LP |
| 4.75%, 03/15/24 (a) | 100,000 | 102,178 |
| 5.95%, 09/25/43 (a) | 600,000 | 661,528 |
| Suncor Energy, Inc. |
| 3.60%, 12/01/24 (a) | 750,000 | 741,867 |
| 5.95%, 12/01/34 | 250,000 | 291,489 |
| 6.50%, 06/15/38 | 400,000 | 497,246 |
| 4.00%, 11/15/47 (a) | 750,000 | 703,396 |
| Total Capital International S.A. |
| 2.88%, 02/17/22 | 500,000 | 495,541 |
| 3.70%, 01/15/24 | 1,000,000 | 1,009,045 |
| 3.75%, 04/10/24 | 500,000 | 504,436 |
| TransCanada PipeLines Ltd. |
| 2.50%, 08/01/22 | 395,000 | 379,852 |
| 4.25%, 05/15/28 (a) | 500,000 | 502,555 |
| 4.63%, 03/01/34 (a) | 600,000 | 601,143 |
| 7.63%, 01/15/39 | 500,000 | 655,101 |
| Valero Energy Corp. |
| 6.63%, 06/15/37 | 700,000 | 839,425 |
| 4.90%, 03/15/45 | 500,000 | 507,783 |
| Western Gas Partners LP |
| 3.95%, 06/01/25 (a) | 500,000 | 472,237 |
| Williams Partners LP |
| 5.25%, 03/15/20 | 250,000 | 257,826 |
| 3.60%, 03/15/22 (a) | 1,850,000 | 1,842,539 |
| 3.90%, 01/15/25 (a) | 350,000 | 341,920 |
| 6.30%, 04/15/40 | 500,000 | 560,324 |
Security
Rate, Maturity Date | Face
Amount ($) | Value ($) |
| 5.10%, 09/15/45 (a) | 250,000 | 247,838 |
| 4.85%, 03/01/48 (a) | 500,000 | 478,185 |
| | | 118,634,969 |
| Industrial Other 0.1% |
| Cintas Corp. No 2 |
| 3.70%, 04/01/27 (a) | 1,000,000 | 982,712 |
| Fluor Corp. |
| 3.50%, 12/15/24 (a) | 300,000 | 294,034 |
| Massachusetts Institute of Technology |
| 5.60%, 07/01/11 | 115,000 | 149,293 |
| President & Fellows of Harvard College |
| 3.30%, 07/15/56 (a) | 1,500,000 | 1,370,112 |
| Princeton University |
| 5.70%, 03/01/39 | 1,000,000 | 1,287,369 |
| William Marsh Rice University |
| 3.57%, 05/15/45 | 300,000 | 294,277 |
| | | 4,377,797 |
| Technology 2.1% |
| Adobe Systems, Inc. |
| 3.25%, 02/01/25 (a) | 500,000 | 492,332 |
| Alphabet, Inc. |
| 3.38%, 02/25/24 | 600,000 | 604,805 |
| Analog Devices, Inc. |
| 2.50%, 12/05/21 (a) | 150,000 | 145,454 |
| 3.13%, 12/05/23 (a) | 750,000 | 729,099 |
| 3.90%, 12/15/25 (a) | 300,000 | 297,678 |
| Apple, Inc. |
| 1.80%, 05/11/20 | 1,000,000 | 983,323 |
| 2.25%, 02/23/21 (a) | 2,250,000 | 2,211,702 |
| 2.85%, 05/06/21 | 1,750,000 | 1,746,514 |
| 2.15%, 02/09/22 | 250,000 | 242,364 |
| 2.50%, 02/09/22 (a) | 1,250,000 | 1,226,550 |
| 2.40%, 01/13/23 (a) | 1,000,000 | 965,439 |
| 2.40%, 05/03/23 | 1,750,000 | 1,687,137 |
| 3.45%, 05/06/24 | 1,000,000 | 1,000,688 |
| 3.25%, 02/23/26 (a) | 500,000 | 488,538 |
| 3.35%, 02/09/27 (a) | 1,500,000 | 1,466,371 |
| 3.85%, 05/04/43 | 1,000,000 | 957,062 |
| 4.45%, 05/06/44 | 500,000 | 523,860 |
| 3.45%, 02/09/45 | 500,000 | 447,983 |
| 4.38%, 05/13/45 | 1,100,000 | 1,135,083 |
| 4.25%, 02/09/47 (a) | 3,100,000 | 3,151,913 |
| Applied Materials, Inc. |
| 2.63%, 10/01/20 (a) | 250,000 | 248,096 |
| 4.30%, 06/15/21 | 250,000 | 258,340 |
| 3.90%, 10/01/25 (a) | 1,000,000 | 1,021,224 |
| Baidu, Inc. |
| 3.00%, 06/30/20 | 250,000 | 247,976 |
| 3.88%, 09/29/23 (a) | 750,000 | 745,843 |
| 4.38%, 03/29/28 (a) | 250,000 | 247,153 |
| Broadcom Corp./Broadcom Cayman Finance Ltd. |
| 3.00%, 01/15/22 (a) | 1,500,000 | 1,460,200 |
| 3.63%, 01/15/24 (a) | 2,500,000 | 2,423,016 |
| 3.13%, 01/15/25 (a) | 500,000 | 464,505 |
| Cisco Systems, Inc. |
| 4.45%, 01/15/20 | 1,000,000 | 1,025,563 |
| 2.20%, 02/28/21 | 1,500,000 | 1,472,214 |
| 2.20%, 09/20/23 (a) | 750,000 | 708,224 |
| 3.63%, 03/04/24 | 250,000 | 253,004 |
| 3.50%, 06/15/25 | 250,000 | 252,569 |
| 5.90%, 02/15/39 | 500,000 | 619,798 |
| 5.50%, 01/15/40 | 1,500,000 | 1,787,318 |
Schwab Fixed-Income ETFs | Semiannual Report
Schwab U.S. Aggregate Bond ETF
Portfolio Holdings as of June 30, 2018 (Unaudited) (continued)
Security
Rate, Maturity Date | Face
Amount ($) | Value ($) |
| Corning, Inc. |
| 2.90%, 05/15/22 (a) | 250,000 | 246,378 |
| Dell International LLC/EMC Corp. |
| 4.42%, 06/15/21 (a)(e) | 2,000,000 | 2,030,602 |
| 5.45%, 06/15/23 (a)(e) | 500,000 | 523,868 |
| 6.02%, 06/15/26 (a)(e) | 2,000,000 | 2,104,018 |
| 8.35%, 07/15/46 (a)(e) | 450,000 | 543,575 |
| Fidelity National Information Services, Inc. |
| 2.25%, 08/15/21 (a) | 250,000 | 240,894 |
| 3.50%, 04/15/23 (a) | 909,000 | 899,396 |
| 5.00%, 10/15/25 (a) | 139,000 | 146,363 |
| 3.00%, 08/15/26 (a) | 450,000 | 412,967 |
| 4.25%, 05/15/28 (a) | 1,250,000 | 1,247,359 |
| Fiserv, Inc. |
| 4.63%, 10/01/20 | 750,000 | 771,782 |
| 3.85%, 06/01/25 (a) | 250,000 | 249,364 |
| Flex Ltd. |
| 4.75%, 06/15/25 (a) | 500,000 | 505,522 |
| Harris Corp. |
| 6.15%, 12/15/40 | 150,000 | 180,487 |
| Hewlett Packard Enterprise Co. |
| 3.60%, 10/15/20 (a) | 1,000,000 | 1,005,279 |
| 4.40%, 10/15/22 (a) | 1,000,000 | 1,026,019 |
| 6.35%, 10/15/45 (a) | 1,000,000 | 991,046 |
| HP, Inc. |
| 6.00%, 09/15/41 | 500,000 | 509,467 |
| Intel Corp. |
| 2.45%, 07/29/20 | 750,000 | 745,417 |
| 1.70%, 05/19/21 (a) | 750,000 | 724,506 |
| 2.35%, 05/11/22 (a) | 2,000,000 | 1,945,527 |
| 3.15%, 05/11/27 (a) | 1,000,000 | 969,728 |
| 4.80%, 10/01/41 | 750,000 | 817,761 |
| 4.25%, 12/15/42 (d) | 250,000 | 259,875 |
| 4.10%, 05/19/46 (a) | 650,000 | 654,794 |
| 4.10%, 05/11/47 (a) | 1,000,000 | 999,657 |
| International Business Machines Corp. |
| 2.25%, 02/19/21 | 1,500,000 | 1,468,239 |
| 2.88%, 11/09/22 | 250,000 | 245,647 |
| 3.38%, 08/01/23 | 150,000 | 149,930 |
| 3.63%, 02/12/24 | 1,000,000 | 1,010,272 |
| 3.45%, 02/19/26 | 250,000 | 246,741 |
| 3.30%, 01/27/27 | 1,000,000 | 971,813 |
| 4.00%, 06/20/42 | 500,000 | 488,727 |
| Jabil, Inc. |
| 3.95%, 01/12/28 (a) | 250,000 | 236,467 |
| Keysight Technologies, Inc. |
| 4.60%, 04/06/27 (a) | 1,000,000 | 1,006,178 |
| KLA-Tencor Corp. |
| 4.65%, 11/01/24 (a) | 500,000 | 517,428 |
| Lam Research Corp. |
| 2.80%, 06/15/21 (a) | 1,000,000 | 983,631 |
| 3.80%, 03/15/25 (a) | 500,000 | 499,046 |
| Microsoft Corp. |
| 1.10%, 08/08/19 | 1,000,000 | 984,471 |
| 2.00%, 11/03/20 (a) | 1,000,000 | 984,567 |
| 1.55%, 08/08/21 (a) | 1,750,000 | 1,678,841 |
| 2.38%, 02/12/22 (a) | 1,000,000 | 978,273 |
| 2.00%, 08/08/23 (a) | 500,000 | 472,313 |
| 3.13%, 11/03/25 (a) | 1,000,000 | 983,362 |
| 2.40%, 08/08/26 (a) | 2,000,000 | 1,852,104 |
| 4.20%, 11/03/35 (a) | 350,000 | 368,702 |
| 4.50%, 10/01/40 (d) | 100,000 | 107,966 |
| 5.30%, 02/08/41 | 500,000 | 597,101 |
| 4.45%, 11/03/45 (a) | 2,600,000 | 2,805,931 |
| 3.70%, 08/08/46 (a) | 500,000 | 487,501 |
Security
Rate, Maturity Date | Face
Amount ($) | Value ($) |
| 4.25%, 02/06/47 (a) | 3,250,000 | 3,456,111 |
| 4.50%, 02/06/57 (a) | 750,000 | 816,464 |
| NVIDIA Corp. |
| 2.20%, 09/16/21 (a) | 700,000 | 680,300 |
| 3.20%, 09/16/26 (a) | 500,000 | 482,609 |
| Oracle Corp. |
| 2.25%, 10/08/19 | 500,000 | 497,479 |
| 2.80%, 07/08/21 | 1,000,000 | 993,881 |
| 1.90%, 09/15/21 (a) | 2,750,000 | 2,620,357 |
| 2.50%, 05/15/22 (a) | 1,000,000 | 974,251 |
| 2.50%, 10/15/22 | 1,000,000 | 970,001 |
| 2.40%, 09/15/23 (a) | 250,000 | 235,997 |
| 3.40%, 07/08/24 (a) | 650,000 | 644,503 |
| 2.95%, 05/15/25 (a) | 500,000 | 477,768 |
| 2.65%, 07/15/26 (a) | 500,000 | 461,609 |
| 4.30%, 07/08/34 (a) | 400,000 | 408,438 |
| 3.90%, 05/15/35 (a) | 250,000 | 242,825 |
| 3.80%, 11/15/37 (a) | 3,000,000 | 2,843,448 |
| 6.50%, 04/15/38 | 500,000 | 638,798 |
| 6.13%, 07/08/39 | 750,000 | 921,775 |
| 4.00%, 07/15/46 (a) | 500,000 | 472,953 |
| 4.38%, 05/15/55 (a) | 250,000 | 244,884 |
| QUALCOMM, Inc. |
| 3.00%, 05/20/22 | 1,000,000 | 985,462 |
| 3.45%, 05/20/25 (a) | 1,500,000 | 1,444,811 |
| 3.25%, 05/20/27 (a) | 250,000 | 232,891 |
| 4.80%, 05/20/45 (a) | 1,500,000 | 1,503,418 |
| 4.30%, 05/20/47 (a) | 250,000 | 233,139 |
| Seagate HDD Cayman |
| 4.25%, 03/01/22 (a) | 100,000 | 98,729 |
| 4.75%, 06/01/23 | 750,000 | 744,272 |
| 4.88%, 03/01/24 (a) | 500,000 | 490,878 |
| 4.75%, 01/01/25 | 250,000 | 240,093 |
| 4.88%, 06/01/27 (a) | 500,000 | 465,552 |
| Texas Instruments, Inc. |
| 1.65%, 08/03/19 | 500,000 | 493,957 |
| 1.85%, 05/15/22 (a) | 1,500,000 | 1,434,618 |
| Total System Services, Inc. |
| 3.75%, 06/01/23 (a) | 500,000 | 496,061 |
| 4.45%, 06/01/28 (a) | 250,000 | 249,113 |
| Verisk Analytics, Inc. |
| 4.00%, 06/15/25 (a) | 500,000 | 492,497 |
| VMware, Inc. |
| 2.30%, 08/21/20 | 750,000 | 734,645 |
| 3.90%, 08/21/27 (a) | 1,250,000 | 1,156,395 |
| Xerox Corp. |
| 2.75%, 09/01/20 | 415,000 | 406,634 |
| 4.07%, 03/17/22 | 192,000 | 188,757 |
| 3.63%, 03/15/23 (a) | 1,000,000 | 960,516 |
| | | 106,752,729 |
| Transportation 0.6% |
| American Airlines 2014-1 Class A Pass Through Trust |
| 3.70%, 10/01/26 | 201,001 | 196,730 |
| American Airlines 2015-1 Class A Pass Through Trust |
| 3.38%, 11/01/28 | 640,015 | 615,080 |
| American Airlines 2016-2 Class AA Pass Through Trust |
| 3.20%, 12/15/29 | 1,383,000 | 1,311,513 |
| Burlington Northern Santa Fe LLC |
| 4.70%, 10/01/19 | 140,000 | 143,193 |
| 3.85%, 09/01/23 (a) | 400,000 | 408,169 |
| 3.40%, 09/01/24 (a) | 2,000,000 | 1,983,162 |
| 5.05%, 03/01/41 (a) | 500,000 | 555,110 |
Schwab Fixed-Income ETFs | Semiannual Report
Schwab U.S. Aggregate Bond ETF
Portfolio Holdings as of June 30, 2018 (Unaudited) (continued)
Security
Rate, Maturity Date | Face
Amount ($) | Value ($) |
| 4.55%, 09/01/44 (a) | 1,000,000 | 1,041,824 |
| 4.05%, 06/15/48 (a) | 1,500,000 | 1,454,100 |
| Canadian National Railway Co. |
| 2.95%, 11/21/24 (a) | 150,000 | 146,064 |
| 3.20%, 08/02/46 (a) | 250,000 | 215,385 |
| Canadian Pacific Railway Co. |
| 2.90%, 02/01/25 (a) | 350,000 | 333,705 |
| 7.13%, 10/15/31 | 500,000 | 635,316 |
| Continental Airlines 2007-1 Class A Pass Through Trust |
| 5.98%, 04/19/22 | 350,677 | 371,758 |
| Continental Airlines 2010-1 Class A Pass Through Trust |
| 4.75%, 07/12/22 | 288,475 | 294,389 |
| Continental Airlines 2012-1 Class A Pass Through Trust |
| 4.15%, 10/11/25 | 75,391 | 75,795 |
| CSX Corp. |
| 4.25%, 06/01/21 (a) | 150,000 | 154,006 |
| 2.60%, 11/01/26 (a) | 250,000 | 226,062 |
| 3.25%, 06/01/27 (a) | 1,000,000 | 941,499 |
| 6.15%, 05/01/37 | 500,000 | 601,984 |
| 5.50%, 04/15/41 (a) | 1,000,000 | 1,115,215 |
| 4.10%, 03/15/44 (a) | 850,000 | 797,496 |
| 3.80%, 11/01/46 (a) | 500,000 | 444,869 |
| Delta Air Lines 2007-1 Class A Pass Through Trust |
| 6.82%, 08/10/22 | 349,723 | 381,687 |
| Delta Air Lines, Inc. |
| 2.60%, 12/04/20 | 500,000 | 489,438 |
| FedEx Corp. |
| 2.30%, 02/01/20 | 500,000 | 495,036 |
| 3.25%, 04/01/26 (a) | 750,000 | 719,356 |
| 3.30%, 03/15/27 (a) | 400,000 | 380,031 |
| 3.40%, 02/15/28 (a) | 750,000 | 715,185 |
| 3.90%, 02/01/35 | 300,000 | 281,387 |
| 3.88%, 08/01/42 | 200,000 | 179,675 |
| 4.55%, 04/01/46 (a) | 250,000 | 243,530 |
| 4.40%, 01/15/47 (a) | 1,000,000 | 950,585 |
| Kansas City Southern |
| 4.70%, 05/01/48 (a) | 200,000 | 194,525 |
| Norfolk Southern Corp. |
| 3.00%, 04/01/22 (a) | 750,000 | 742,242 |
| 2.90%, 06/15/26 (a) | 500,000 | 467,336 |
| 4.84%, 10/01/41 | 100,000 | 104,836 |
| 4.65%, 01/15/46 (a) | 500,000 | 513,281 |
| Ryder System, Inc. |
| 3.40%, 03/01/23 (a) | 500,000 | 494,302 |
| Southwest Airlines Co. |
| 3.45%, 11/16/27 (a) | 1,000,000 | 949,334 |
| Union Pacific Corp. |
| 4.16%, 07/15/22 (a) | 250,000 | 258,185 |
| 3.65%, 02/15/24 (a) | 500,000 | 501,439 |
| 3.25%, 08/15/25 (a) | 500,000 | 486,716 |
| 2.75%, 03/01/26 (a) | 1,000,000 | 931,763 |
| 3.38%, 02/01/35 (a) | 750,000 | 672,720 |
| 4.15%, 01/15/45 (a) | 1,000,000 | 965,700 |
| 4.50%, 09/10/48 (a) | 200,000 | 204,145 |
| United Airlines 2016-1 Class AA Pass Through Trust |
| 3.10%, 07/07/28 | 486,808 | 462,489 |
| United Parcel Service, Inc. |
| 2.35%, 05/16/22 (a) | 250,000 | 242,688 |
| 2.45%, 10/01/22 | 500,000 | 484,777 |
| 3.05%, 11/15/27 (a) | 500,000 | 476,477 |
| 6.20%, 01/15/38 | 400,000 | 502,250 |
Security
Rate, Maturity Date | Face
Amount ($) | Value ($) |
| 4.88%, 11/15/40 (a) | 650,000 | 718,439 |
| 3.75%, 11/15/47 (a) | 250,000 | 230,788 |
| | | 29,502,766 |
| | | 780,072,936 |
| |
| Utility 1.8% |
| Electric 1.6% |
| AEP Transmission Co. LLC |
| 3.75%, 12/01/47 (a) | 500,000 | 465,740 |
| Alabama Power Co. |
| 3.55%, 12/01/23 | 350,000 | 352,160 |
| 4.30%, 01/02/46 (a) | 500,000 | 512,894 |
| 3.70%, 12/01/47 (a) | 1,000,000 | 929,267 |
| Ameren Corp. |
| 3.65%, 02/15/26 (a) | 1,000,000 | 970,377 |
| Appalachian Power Co. |
| 3.40%, 06/01/25 (a) | 500,000 | 492,994 |
| 3.30%, 06/01/27 (a) | 750,000 | 721,897 |
| 7.00%, 04/01/38 | 750,000 | 993,489 |
| 4.45%, 06/01/45 (a) | 500,000 | 516,124 |
| Arizona Public Service Co. |
| 4.35%, 11/15/45 (a) | 1,000,000 | 1,029,250 |
| Berkshire Hathaway Energy Co. |
| 2.40%, 02/01/20 (a) | 300,000 | 297,671 |
| 3.25%, 04/15/28 (a) | 1,500,000 | 1,428,341 |
| 6.13%, 04/01/36 | 487,000 | 602,350 |
| 5.95%, 05/15/37 | 250,000 | 307,056 |
| 6.50%, 09/15/37 | 500,000 | 659,259 |
| 5.15%, 11/15/43 (a) | 800,000 | 900,851 |
| 4.50%, 02/01/45 (a) | 850,000 | 872,966 |
| CMS Energy Corp. |
| 6.25%, 02/01/20 | 1,000,000 | 1,045,782 |
| 3.00%, 05/15/26 (a) | 1,500,000 | 1,404,214 |
| 4.88%, 03/01/44 (a) | 500,000 | 529,527 |
| Consolidated Edison Co. of New York, Inc. |
| 6.75%, 04/01/38 | 500,000 | 662,258 |
| 3.95%, 03/01/43 (a) | 1,000,000 | 974,128 |
| 4.45%, 03/15/44 (a) | 1,150,000 | 1,179,387 |
| Consumers Energy Co. |
| 6.70%, 09/15/19 | 300,000 | 313,226 |
| 3.38%, 08/15/23 (a) | 500,000 | 499,471 |
| 3.95%, 05/15/43 (a) | 250,000 | 247,352 |
| Delmarva Power & Light Co. |
| 3.50%, 11/15/23 (a) | 500,000 | 500,092 |
| Dominion Energy, Inc. |
| 2.96%, 07/01/19 | 500,000 | 499,008 |
| 1.60%, 08/15/19 | 1,100,000 | 1,083,325 |
| 2.50%, 12/01/19 (a) | 1,000,000 | 991,650 |
| 2.85%, 08/15/26 (a) | 1,000,000 | 907,136 |
| 5.25%, 08/01/33 | 500,000 | 534,986 |
| DTE Electric Co. |
| 3.70%, 06/01/46 (a) | 500,000 | 477,517 |
| DTE Energy Co. |
| 1.50%, 10/01/19 | 750,000 | 735,633 |
| 3.30%, 06/15/22 (a) | 500,000 | 494,558 |
| Duke Energy Carolinas LLC |
| 6.10%, 06/01/37 | 250,000 | 314,659 |
| 6.05%, 04/15/38 | 1,255,000 | 1,561,349 |
| 5.30%, 02/15/40 | 600,000 | 693,445 |
| 3.75%, 06/01/45 (a) | 750,000 | 705,729 |
| 3.88%, 03/15/46 (a) | 250,000 | 239,663 |
Schwab Fixed-Income ETFs | Semiannual Report
Schwab U.S. Aggregate Bond ETF
Portfolio Holdings as of June 30, 2018 (Unaudited) (continued)
Security
Rate, Maturity Date | Face
Amount ($) | Value ($) |
| Duke Energy Corp. |
| 3.05%, 08/15/22 (a) | 950,000 | 935,630 |
| 3.75%, 04/15/24 (a) | 1,000,000 | 999,153 |
| 2.65%, 09/01/26 (a) | 1,250,000 | 1,127,867 |
| 3.75%, 09/01/46 (a) | 200,000 | 176,891 |
| 3.95%, 08/15/47 (a) | 250,000 | 229,137 |
| Duke Energy Florida LLC |
| 3.20%, 01/15/27 (a) | 1,750,000 | 1,685,473 |
| Duke Energy Progress LLC |
| 4.15%, 12/01/44 (a) | 1,500,000 | 1,483,862 |
| 3.70%, 10/15/46 (a) | 500,000 | 461,337 |
| Edison International |
| 2.95%, 03/15/23 (a) | 500,000 | 480,859 |
| Entergy Corp. |
| 4.00%, 07/15/22 (a) | 500,000 | 507,415 |
| Entergy Louisiana LLC |
| 2.40%, 10/01/26 (a) | 500,000 | 454,017 |
| 4.95%, 01/15/45 (a) | 500,000 | 505,883 |
| Eversource Energy |
| 3.30%, 01/15/28 (a) | 250,000 | 238,128 |
| Exelon Corp. |
| 3.95%, 06/15/25 (a) | 1,000,000 | 995,472 |
| 3.40%, 04/15/26 (a) | 750,000 | 713,529 |
| 4.95%, 06/15/35 (a)(e) | 250,000 | 263,922 |
| 4.45%, 04/15/46 (a) | 500,000 | 487,680 |
| Exelon Generation Co. LLC |
| 5.20%, 10/01/19 | 300,000 | 307,141 |
| 2.95%, 01/15/20 (a) | 1,000,000 | 996,267 |
| 6.25%, 10/01/39 | 1,000,000 | 1,061,788 |
| 5.60%, 06/15/42 (a) | 750,000 | 759,956 |
| FirstEnergy Corp. |
| 3.90%, 07/15/27 (a) | 1,500,000 | 1,457,901 |
| Florida Power & Light Co. |
| 3.13%, 12/01/25 (a) | 1,750,000 | 1,709,166 |
| 5.95%, 02/01/38 | 150,000 | 187,823 |
| 5.96%, 04/01/39 | 500,000 | 628,293 |
| 4.05%, 06/01/42 (a) | 350,000 | 354,625 |
| 3.80%, 12/15/42 (a) | 275,000 | 269,932 |
| 3.70%, 12/01/47 (a) | 500,000 | 471,558 |
| Georgia Power Co. |
| 2.85%, 05/15/22 | 1,000,000 | 980,602 |
| Indiana Michigan Power Co. |
| 3.75%, 07/01/47 (a) | 1,000,000 | 939,364 |
| LG&E & KU Energy LLC |
| 3.75%, 11/15/20 (a) | 1,000,000 | 1,009,388 |
| N.V. Energy, Inc. |
| 6.25%, 11/15/20 | 350,000 | 373,801 |
| National Rural Utilities Cooperative Finance Corp. |
| 1.50%, 11/01/19 | 800,000 | 786,122 |
| 5.25%, 04/20/46 (a)(b) | 800,000 | 823,224 |
| Nevada Power Co. |
| 6.65%, 04/01/36 | 500,000 | 653,033 |
| NextEra Energy Capital Holdings, Inc. |
| 4.80%, 12/01/77 (a)(b) | 1,000,000 | 934,339 |
| Northern States Power Co. |
| 6.25%, 06/01/36 | 750,000 | 934,331 |
| 3.60%, 05/15/46 (a) | 500,000 | 458,723 |
| NSTAR Electric Co. |
| 4.40%, 03/01/44 (a) | 250,000 | 258,985 |
| Oncor Electric Delivery Co. LLC |
| 4.55%, 12/01/41 (a) | 1,200,000 | 1,278,109 |
Security
Rate, Maturity Date | Face
Amount ($) | Value ($) |
| Pacific Gas & Electric Co. |
| 3.50%, 10/01/20 (a) | 250,000 | 248,107 |
| 3.25%, 06/15/23 (a) | 500,000 | 477,952 |
| 3.30%, 03/15/27 (a) | 500,000 | 452,586 |
| 6.05%, 03/01/34 | 1,000,000 | 1,082,651 |
| 5.40%, 01/15/40 | 500,000 | 510,121 |
| 4.30%, 03/15/45 (a) | 1,250,000 | 1,128,266 |
| PPL Capital Funding, Inc. |
| 4.20%, 06/15/22 (a) | 1,100,000 | 1,117,842 |
| 3.40%, 06/01/23 (a) | 1,000,000 | 984,644 |
| PPL Electric Utilities Corp. |
| 6.25%, 05/15/39 | 500,000 | 635,990 |
| PSEG Power LLC |
| 5.13%, 04/15/20 | 400,000 | 412,735 |
| 3.00%, 06/15/21 (a) | 1,500,000 | 1,484,289 |
| Public Service Co. of Colorado |
| 2.25%, 09/15/22 (a) | 1,000,000 | 958,945 |
| Public Service Electric & Gas Co. |
| 3.95%, 05/01/42 (a) | 100,000 | 98,249 |
| 3.60%, 12/01/47 (a) | 500,000 | 461,500 |
| Puget Energy, Inc. |
| 6.50%, 12/15/20 | 500,000 | 535,755 |
| 6.00%, 09/01/21 | 250,000 | 267,564 |
| Puget Sound Energy, Inc. |
| 5.64%, 04/15/41 (a) | 250,000 | 300,724 |
| San Diego Gas & Electric Co. |
| 3.75%, 06/01/47 (a) | 250,000 | 241,097 |
| Sempra Energy |
| 3.55%, 06/15/24 (a) | 400,000 | 392,262 |
| South Carolina Electric & Gas Co. |
| 4.35%, 02/01/42 (a) | 1,000,000 | 951,949 |
| Southern California Edison Co. |
| 2.40%, 02/01/22 (a) | 500,000 | 483,461 |
| 3.50%, 10/01/23 (a) | 250,000 | 249,695 |
| 6.65%, 04/01/29 | 500,000 | 603,436 |
| 5.55%, 01/15/37 | 500,000 | 572,941 |
| 5.95%, 02/01/38 | 500,000 | 606,349 |
| 4.13%, 03/01/48 (a) | 250,000 | 237,124 |
| Southern Co. |
| 2.35%, 07/01/21 (a) | 350,000 | 339,275 |
| 4.25%, 07/01/36 (a) | 250,000 | 246,357 |
| 4.40%, 07/01/46 (a) | 500,000 | 490,074 |
| Southern Power Co. |
| 2.38%, 06/01/20 (a) | 1,500,000 | 1,477,761 |
| 5.15%, 09/15/41 | 1,000,000 | 1,019,850 |
| Southwestern Electric Power Co. |
| 2.75%, 10/01/26 (a) | 500,000 | 459,758 |
| Tampa Electric Co. |
| 4.30%, 06/15/48 (a) | 1,000,000 | 994,004 |
| TransAlta Corp. |
| 6.50%, 03/15/40 | 500,000 | 494,225 |
| Union Electric Co. |
| 3.90%, 09/15/42 (a) | 100,000 | 97,550 |
| Virginia Electric & Power Co. |
| 3.50%, 03/15/27 (a) | 1,200,000 | 1,180,397 |
| 6.00%, 05/15/37 | 800,000 | 978,843 |
| 3.80%, 09/15/47 (a) | 500,000 | 458,019 |
| Westar Energy, Inc. |
| 4.13%, 03/01/42 (a) | 100,000 | 99,954 |
| 4.10%, 04/01/43 (a) | 750,000 | 749,671 |
Schwab Fixed-Income ETFs | Semiannual Report
Schwab U.S. Aggregate Bond ETF
Portfolio Holdings as of June 30, 2018 (Unaudited) (continued)
Security
Rate, Maturity Date | Face
Amount ($) | Value ($) |
| Xcel Energy, Inc. |
| 4.70%, 05/15/20 (a) | 500,000 | 510,920 |
| 2.40%, 03/15/21 (a) | 250,000 | 244,437 |
| | | 83,364,836 |
| Natural Gas 0.1% |
| Atmos Energy Corp. |
| 3.00%, 06/15/27 (a) | 1,250,000 | 1,185,244 |
| CenterPoint Energy Resources Corp. |
| 5.85%, 01/15/41 (a) | 250,000 | 299,307 |
| 4.10%, 09/01/47 (a) | 200,000 | 191,256 |
| NiSource, Inc. |
| 3.49%, 05/15/27 (a) | 250,000 | 239,502 |
| 4.80%, 02/15/44 (a) | 875,000 | 911,826 |
| ONE Gas, Inc. |
| 3.61%, 02/01/24 (a) | 100,000 | 99,468 |
| 4.66%, 02/01/44 (a) | 300,000 | 323,265 |
| Sempra Energy |
| 2.40%, 02/01/20 | 250,000 | 247,073 |
| 3.75%, 11/15/25 (a) | 885,000 | 874,504 |
| 6.00%, 10/15/39 | 350,000 | 416,190 |
| Southern California Gas Co. |
| 2.60%, 06/15/26 (a) | 1,000,000 | 926,948 |
| Southern Co. Gas Capital Corp. |
| 3.95%, 10/01/46 (a) | 750,000 | 692,526 |
| 4.40%, 05/30/47 (a) | 250,000 | 248,330 |
| | | 6,655,439 |
| Utility Other 0.1% |
| American Water Capital Corp. |
| 3.40%, 03/01/25 (a) | 750,000 | 740,448 |
| 2.95%, 09/01/27 (a) | 350,000 | 330,102 |
| 6.59%, 10/15/37 | 450,000 | 591,684 |
| | | 1,662,234 |
| | | 91,682,509 |
| Total Corporates |
| (Cost $1,319,912,685) | | 1,283,015,526 |
|
| Treasuries 37.6% of net assets |
| Bonds |
| 8.13%, 08/15/19 | 1,500,000 | 1,593,926 |
| 8.50%, 02/15/20 | 3,000,000 | 3,286,465 |
| 8.75%, 05/15/20 | 2,750,000 | 3,065,283 |
| 8.75%, 08/15/20 | 1,750,000 | 1,972,612 |
| 7.88%, 02/15/21 | 750,000 | 849,990 |
| 8.13%, 05/15/21 | 750,000 | 863,613 |
| 8.13%, 08/15/21 | 1,000,000 | 1,163,984 |
| 8.00%, 11/15/21 (d) | 2,149,000 | 2,518,024 |
| 7.25%, 08/15/22 | 1,500,000 | 1,766,250 |
| 7.63%, 11/15/22 | 2,200,000 | 2,644,254 |
| 7.13%, 02/15/23 | 1,500,000 | 1,785,352 |
| 6.25%, 08/15/23 | 1,250,000 | 1,459,155 |
| 7.50%, 11/15/24 | 750,000 | 955,928 |
| 7.63%, 02/15/25 | 500,000 | 645,176 |
| 6.88%, 08/15/25 | 500,000 | 631,182 |
| 6.00%, 02/15/26 (d) | 1,891,000 | 2,303,401 |
| 6.75%, 08/15/26 | 1,209,000 | 1,554,226 |
| 6.50%, 11/15/26 | 1,250,000 | 1,592,041 |
| 6.63%, 02/15/27 | 1,000,000 | 1,290,273 |
| 6.38%, 08/15/27 | 500,000 | 641,953 |
| 6.13%, 11/15/27 | 2,438,000 | 3,092,641 |
| 5.50%, 08/15/28 | 750,000 | 923,423 |
| 5.25%, 11/15/28 | 750,000 | 910,181 |
Security
Rate, Maturity Date | Face
Amount ($) | Value ($) |
| 5.25%, 02/15/29 | 2,778,000 | 3,383,354 |
| 6.13%, 08/15/29 | 4,250,000 | 5,564,512 |
| 6.25%, 05/15/30 (d) | 3,135,000 | 4,196,553 |
| 5.38%, 02/15/31 | 7,200,000 | 9,099,844 |
| 4.50%, 02/15/36 | 7,850,000 | 9,601,225 |
| 4.75%, 02/15/37 | 4,386,000 | 5,560,283 |
| 5.00%, 05/15/37 | 4,250,000 | 5,550,566 |
| 4.38%, 02/15/38 (d) | 2,300,000 | 2,804,023 |
| 4.50%, 05/15/38 | 1,000,000 | 1,239,902 |
| 3.50%, 02/15/39 (d) | 1,072,000 | 1,168,271 |
| 4.25%, 05/15/39 | 2,850,000 | 3,438,981 |
| 4.50%, 08/15/39 | 3,450,000 | 4,303,134 |
| 4.38%, 11/15/39 (d) | 3,031,000 | 3,723,749 |
| 4.63%, 02/15/40 | 4,915,000 | 6,240,034 |
| 4.38%, 05/15/40 | 5,000,000 | 6,154,102 |
| 3.88%, 08/15/40 | 3,500,000 | 4,028,965 |
| 4.25%, 11/15/40 (d) | 4,159,000 | 5,044,493 |
| 4.75%, 02/15/41 | 5,500,000 | 7,130,664 |
| 4.38%, 05/15/41 | 3,400,000 | 4,201,391 |
| 3.75%, 08/15/41 | 5,623,000 | 6,368,377 |
| 3.13%, 11/15/41 | 3,100,000 | 3,186,582 |
| 3.13%, 02/15/42 (d) | 4,790,000 | 4,923,315 |
| 3.00%, 05/15/42 | 4,000,000 | 4,025,547 |
| 2.75%, 08/15/42 | 5,399,000 | 5,197,170 |
| 2.75%, 11/15/42 | 6,270,000 | 6,033,405 |
| 3.13%, 02/15/43 | 7,500,000 | 7,701,709 |
| 2.88%, 05/15/43 | 9,999,000 | 9,827,533 |
| 3.63%, 08/15/43 | 7,983,000 | 8,900,421 |
| 3.75%, 11/15/43 | 10,768,000 | 12,244,183 |
| 3.63%, 02/15/44 | 11,295,000 | 12,603,411 |
| 3.38%, 05/15/44 | 13,112,000 | 14,055,193 |
| 3.13%, 08/15/44 (d) | 9,900,000 | 10,167,996 |
| 3.00%, 11/15/44 (d) | 9,500,000 | 9,541,006 |
| 2.50%, 02/15/45 (d) | 10,300,000 | 9,393,721 |
| 3.00%, 05/15/45 (d) | 9,250,000 | 9,288,120 |
| 2.88%, 08/15/45 | 9,350,000 | 9,165,557 |
| 3.00%, 11/15/45 | 9,650,000 | 9,686,376 |
| 2.50%, 02/15/46 (d) | 11,600,000 | 10,549,430 |
| 2.50%, 05/15/46 | 9,700,000 | 8,814,500 |
| 2.25%, 08/15/46 (d) | 17,300,000 | 14,900,308 |
| 2.88%, 11/15/46 | 8,785,000 | 8,603,638 |
| 3.00%, 02/15/47 | 8,650,000 | 8,683,113 |
| 3.00%, 05/15/47 | 9,200,000 | 9,229,109 |
| 2.75%, 08/15/47 | 13,850,000 | 13,219,717 |
| 2.75%, 11/15/47 (d) | 14,150,000 | 13,505,235 |
| 3.00%, 02/15/48 | 4,700,000 | 4,716,799 |
| 3.13%, 05/15/48 | 11,600,000 | 11,924,211 |
| Notes |
| 0.75%, 07/15/19 | 5,000,000 | 4,917,676 |
| 0.88%, 07/31/19 (d) | 4,201,000 | 4,133,800 |
| 1.38%, 07/31/19 | 10,250,000 | 10,140,093 |
| 1.63%, 07/31/19 | 9,350,000 | 9,274,214 |
| 0.75%, 08/15/19 | 6,800,000 | 6,676,484 |
| 3.63%, 08/15/19 | 6,500,000 | 6,587,090 |
| 1.00%, 08/31/19 | 16,700,000 | 16,430,908 |
| 1.25%, 08/31/19 | 5,344,000 | 5,273,234 |
| 1.63%, 08/31/19 (d) | 7,250,000 | 7,185,147 |
| 0.88%, 09/15/19 | 5,550,000 | 5,448,325 |
| 1.00%, 09/30/19 | 4,500,000 | 4,421,689 |
| 1.38%, 09/30/19 | 10,000,000 | 9,871,094 |
| 1.75%, 09/30/19 (d) | 7,425,000 | 7,363,222 |
| 1.00%, 10/15/19 | 5,000,000 | 4,909,375 |
| 1.25%, 10/31/19 | 3,250,000 | 3,199,536 |
| 1.50%, 10/31/19 (d) | 18,208,000 | 17,984,312 |
| 1.00%, 11/15/19 | 6,000,000 | 5,882,930 |
| 3.38%, 11/15/19 (d) | 9,610,700 | 9,727,643 |
| 1.00%, 11/30/19 | 8,801,000 | 8,623,777 |
| 1.50%, 11/30/19 (d) | 8,175,000 | 8,065,947 |
Schwab Fixed-Income ETFs | Semiannual Report
Schwab U.S. Aggregate Bond ETF
Portfolio Holdings as of June 30, 2018 (Unaudited) (continued)
Security
Rate, Maturity Date | Face
Amount ($) | Value ($) |
| 1.75%, 11/30/19 | 7,000,000 | 6,930,410 |
| 1.38%, 12/15/19 | 7,400,000 | 7,285,098 |
| 1.13%, 12/31/19 | 5,900,000 | 5,783,729 |
| 1.63%, 12/31/19 (d) | 11,000,000 | 10,865,078 |
| 1.88%, 12/31/19 | 5,906,000 | 5,853,976 |
| 1.38%, 01/15/20 | 7,000,000 | 6,883,105 |
| 1.25%, 01/31/20 (d) | 8,400,000 | 8,240,367 |
| 1.38%, 01/31/20 (d) | 5,182,000 | 5,093,643 |
| 2.00%, 01/31/20 (d) | 8,000,000 | 7,940,781 |
| 1.38%, 02/15/20 | 7,900,000 | 7,760,053 |
| 3.63%, 02/15/20 | 12,650,000 | 12,875,081 |
| 1.25%, 02/29/20 | 4,450,000 | 4,359,349 |
| 1.38%, 02/29/20 (d) | 7,850,000 | 7,706,186 |
| 1.63%, 03/15/20 | 5,500,000 | 5,419,111 |
| 1.13%, 03/31/20 | 3,384,000 | 3,304,159 |
| 1.38%, 03/31/20 | 6,250,000 | 6,129,272 |
| 2.25%, 03/31/20 | 3,300,000 | 3,285,434 |
| 1.50%, 04/15/20 | 18,000,000 | 17,682,188 |
| 1.13%, 04/30/20 | 4,750,000 | 4,632,456 |
| 1.38%, 04/30/20 (d) | 9,550,000 | 9,356,016 |
| 1.50%, 05/15/20 (d) | 17,500,000 | 17,175,977 |
| 3.50%, 05/15/20 | 5,500,000 | 5,597,539 |
| 1.38%, 05/31/20 | 5,000,000 | 4,892,578 |
| 1.50%, 05/31/20 (d) | 9,000,000 | 8,827,734 |
| 2.50%, 05/31/20 | 4,100,000 | 4,098,479 |
| 1.50%, 06/15/20 | 9,000,000 | 8,824,746 |
| 1.63%, 06/30/20 (d) | 7,000,000 | 6,876,953 |
| 1.88%, 06/30/20 (d) | 5,346,000 | 5,278,026 |
| 2.50%, 06/30/20 | 5,000,000 | 4,997,363 |
| 1.50%, 07/15/20 | 5,000,000 | 4,897,266 |
| 1.63%, 07/31/20 (d) | 16,700,000 | 16,388,180 |
| 2.00%, 07/31/20 | 3,500,000 | 3,461,377 |
| 1.50%, 08/15/20 | 7,000,000 | 6,849,063 |
| 2.63%, 08/15/20 (d) | 8,276,000 | 8,287,800 |
| 1.38%, 08/31/20 | 7,500,000 | 7,314,844 |
| 2.13%, 08/31/20 | 7,000,000 | 6,937,246 |
| 1.38%, 09/15/20 | 5,000,000 | 4,874,121 |
| 1.38%, 09/30/20 (d) | 18,500,000 | 18,021,963 |
| 2.00%, 09/30/20 | 5,000,000 | 4,938,672 |
| 1.63%, 10/15/20 | 5,000,000 | 4,895,703 |
| 1.38%, 10/31/20 | 11,815,000 | 11,495,626 |
| 1.75%, 10/31/20 | 7,984,000 | 7,836,171 |
| 1.75%, 11/15/20 (d) | 18,000,000 | 17,658,984 |
| 2.63%, 11/15/20 (d) | 20,332,000 | 20,354,238 |
| 1.63%, 11/30/20 (d) | 8,600,000 | 8,408,348 |
| 2.00%, 11/30/20 | 5,944,000 | 5,863,663 |
| 1.88%, 12/15/20 | 6,000,000 | 5,899,922 |
| 1.75%, 12/31/20 (d) | 11,000,000 | 10,778,711 |
| 2.38%, 12/31/20 | 6,091,000 | 6,060,426 |
| 2.00%, 01/15/21 (d) | 19,000,000 | 18,724,648 |
| 1.38%, 01/31/21 | 8,000,000 | 7,757,031 |
| 2.13%, 01/31/21 | 3,506,000 | 3,464,846 |
| 2.25%, 02/15/21 | 1,500,000 | 1,486,934 |
| 3.63%, 02/15/21 (d) | 7,073,000 | 7,255,075 |
| 1.13%, 02/28/21 | 8,000,000 | 7,698,438 |
| 2.00%, 02/28/21 | 2,965,000 | 2,919,309 |
| 2.38%, 03/15/21 | 9,050,000 | 8,996,266 |
| 1.25%, 03/31/21 (d) | 9,000,000 | 8,678,496 |
| 2.25%, 03/31/21 | 5,076,000 | 5,028,016 |
| 2.38%, 04/15/21 | 7,100,000 | 7,055,348 |
| 1.38%, 04/30/21 (d) | 16,000,000 | 15,463,125 |
| 2.25%, 04/30/21 | 3,286,000 | 3,253,718 |
| 2.63%, 05/15/21 | 21,200,000 | 21,203,727 |
| 3.13%, 05/15/21 | 2,500,000 | 2,535,059 |
| 1.38%, 05/31/21 | 8,000,000 | 7,721,562 |
| 2.00%, 05/31/21 | 4,234,000 | 4,161,145 |
| 2.63%, 06/15/21 | 8,000,000 | 8,001,719 |
| 1.13%, 06/30/21 | 4,000,000 | 3,827,812 |
Security
Rate, Maturity Date | Face
Amount ($) | Value ($) |
| 2.13%, 06/30/21 | 1,512,000 | 1,490,413 |
| 1.13%, 07/31/21 | 6,500,000 | 6,212,070 |
| 2.25%, 07/31/21 | 3,000,000 | 2,966,543 |
| 2.13%, 08/15/21 | 5,421,900 | 5,338,983 |
| 1.13%, 08/31/21 | 5,100,000 | 4,866,316 |
| 2.00%, 08/31/21 | 3,750,000 | 3,677,344 |
| 1.13%, 09/30/21 | 4,500,000 | 4,287,658 |
| 2.13%, 09/30/21 | 6,750,000 | 6,641,499 |
| 1.25%, 10/31/21 | 3,750,000 | 3,583,301 |
| 2.00%, 10/31/21 | 3,000,000 | 2,937,715 |
| 2.00%, 11/15/21 (d) | 9,300,000 | 9,106,008 |
| 1.75%, 11/30/21 | 8,100,000 | 7,862,063 |
| 1.88%, 11/30/21 (d) | 11,000,000 | 10,721,777 |
| 2.00%, 12/31/21 | 7,500,000 | 7,334,619 |
| 2.13%, 12/31/21 | 5,750,000 | 5,647,354 |
| 1.50%, 01/31/22 (d) | 6,300,000 | 6,048,738 |
| 1.88%, 01/31/22 | 8,500,000 | 8,270,234 |
| 2.00%, 02/15/22 | 8,600,000 | 8,402,637 |
| 1.75%, 02/28/22 | 7,500,000 | 7,258,301 |
| 1.88%, 02/28/22 | 8,600,000 | 8,361,484 |
| 1.75%, 03/31/22 (d) | 6,050,000 | 5,850,539 |
| 1.88%, 03/31/22 (d) | 8,500,000 | 8,257,119 |
| 1.75%, 04/30/22 | 6,000,000 | 5,795,859 |
| 1.88%, 04/30/22 | 9,724,000 | 9,437,028 |
| 1.75%, 05/15/22 | 5,000,000 | 4,828,223 |
| 1.75%, 05/31/22 | 8,000,000 | 7,720,938 |
| 1.88%, 05/31/22 (d) | 6,500,000 | 6,304,619 |
| 1.75%, 06/30/22 | 10,500,000 | 10,125,117 |
| 2.13%, 06/30/22 | 9,000,000 | 8,806,992 |
| 1.88%, 07/31/22 | 6,000,000 | 5,809,453 |
| 2.00%, 07/31/22 | 6,500,000 | 6,324,805 |
| 1.63%, 08/15/22 (d) | 8,911,000 | 8,537,504 |
| 1.63%, 08/31/22 | 8,500,000 | 8,141,572 |
| 1.88%, 08/31/22 | 9,000,000 | 8,708,027 |
| 1.75%, 09/30/22 | 6,250,000 | 6,012,573 |
| 1.88%, 09/30/22 | 8,500,000 | 8,218,604 |
| 1.88%, 10/31/22 | 8,000,000 | 7,728,906 |
| 2.00%, 10/31/22 | 9,000,000 | 8,739,844 |
| 1.63%, 11/15/22 (d) | 7,677,000 | 7,334,834 |
| 2.00%, 11/30/22 (d) | 17,000,000 | 16,501,289 |
| 2.13%, 12/31/22 (d) | 29,000,000 | 28,275,566 |
| 1.75%, 01/31/23 | 9,300,000 | 8,913,287 |
| 2.38%, 01/31/23 | 10,500,000 | 10,344,756 |
| 2.00%, 02/15/23 | 12,894,000 | 12,494,085 |
| 1.50%, 02/28/23 (d) | 7,500,000 | 7,101,270 |
| 2.63%, 02/28/23 | 7,500,000 | 7,470,703 |
| 1.50%, 03/31/23 (d) | 7,000,000 | 6,621,289 |
| 2.50%, 03/31/23 | 8,100,000 | 8,019,949 |
| 1.63%, 04/30/23 | 8,000,000 | 7,601,875 |
| 2.75%, 04/30/23 | 7,700,000 | 7,708,422 |
| 1.75%, 05/15/23 (d) | 10,500,000 | 10,033,447 |
| 1.63%, 05/31/23 (d) | 9,300,000 | 8,830,822 |
| 2.75%, 05/31/23 | 15,500,000 | 15,521,191 |
| 1.38%, 06/30/23 | 3,500,000 | 3,278,652 |
| 2.63%, 06/30/23 | 9,500,000 | 9,454,541 |
| 1.25%, 07/31/23 | 6,250,000 | 5,808,838 |
| 2.50%, 08/15/23 | 5,176,000 | 5,116,051 |
| 1.38%, 08/31/23 | 7,000,000 | 6,538,167 |
| 1.38%, 09/30/23 (d) | 6,750,000 | 6,295,960 |
| 1.63%, 10/31/23 | 4,850,000 | 4,579,082 |
| 2.75%, 11/15/23 (d) | 13,296,000 | 13,293,403 |
| 2.13%, 11/30/23 | 5,250,000 | 5,082,656 |
| 2.25%, 12/31/23 | 4,750,000 | 4,625,498 |
| 2.25%, 01/31/24 | 4,700,000 | 4,573,688 |
| 2.75%, 02/15/24 (d) | 10,119,000 | 10,107,537 |
| 2.13%, 02/29/24 | 6,250,000 | 6,038,086 |
| 2.13%, 03/31/24 | 7,250,000 | 6,999,365 |
| 2.00%, 04/30/24 (d) | 5,500,000 | 5,269,258 |
Schwab Fixed-Income ETFs | Semiannual Report
Schwab U.S. Aggregate Bond ETF
Portfolio Holdings as of June 30, 2018 (Unaudited) (continued)
Security
Rate, Maturity Date | Face
Amount ($) | Value ($) |
| 2.50%, 05/15/24 (d) | 15,730,000 | 15,485,755 |
| 2.00%, 05/31/24 (d) | 6,300,000 | 6,030,773 |
| 2.00%, 06/30/24 | 6,250,000 | 5,978,149 |
| 2.13%, 07/31/24 | 7,000,000 | 6,738,867 |
| 2.38%, 08/15/24 | 14,500,000 | 14,157,607 |
| 1.88%, 08/31/24 | 9,000,000 | 8,538,398 |
| 2.13%, 09/30/24 | 8,500,000 | 8,172,451 |
| 2.25%, 10/31/24 | 8,250,000 | 7,987,192 |
| 2.25%, 11/15/24 (d) | 18,200,000 | 17,613,121 |
| 2.13%, 11/30/24 | 7,000,000 | 6,722,461 |
| 2.25%, 12/31/24 | 9,500,000 | 9,188,652 |
| 2.50%, 01/31/25 | 7,000,000 | 6,873,262 |
| 2.00%, 02/15/25 (d) | 17,600,000 | 16,742,000 |
| 2.75%, 02/28/25 | 9,000,000 | 8,969,238 |
| 2.63%, 03/31/25 | 3,250,000 | 3,213,374 |
| 2.88%, 04/30/25 | 4,000,000 | 4,016,172 |
| 2.13%, 05/15/25 (d) | 15,612,400 | 14,942,775 |
| 2.88%, 05/31/25 | 7,300,000 | 7,328,943 |
| 2.75%, 06/30/25 | 7,200,000 | 7,170,188 |
| 2.00%, 08/15/25 (d) | 14,000,000 | 13,264,180 |
| 2.25%, 11/15/25 (d) | 14,000,000 | 13,467,070 |
| 1.63%, 02/15/26 (d) | 13,000,000 | 11,928,770 |
| 1.63%, 05/15/26 (d) | 12,911,000 | 11,812,304 |
| 1.50%, 08/15/26 (d) | 18,750,000 | 16,934,334 |
| 2.00%, 11/15/26 (d) | 11,000,000 | 10,310,566 |
| 2.25%, 02/15/27 (d) | 13,750,000 | 13,123,462 |
| 2.38%, 05/15/27 | 13,750,000 | 13,243,506 |
| 2.25%, 08/15/27 | 15,300,000 | 14,564,584 |
| 2.25%, 11/15/27 (d) | 21,000,000 | 19,965,996 |
| 2.75%, 02/15/28 | 18,350,000 | 18,196,247 |
| 2.88%, 05/15/28 | 10,800,000 | 10,822,992 |
| Total Treasuries |
| (Cost $1,984,222,175) | | 1,942,624,777 |
|
| Government Related 6.4% of net assets |
| |
| Agency 3.1% |
| Foreign 1.4% |
| Austria 0.0% |
| Oesterreichische Kontrollbank AG |
| 1.38%, 02/10/20 | 1,000,000 | 980,119 |
| 1.88%, 01/20/21 | 1,000,000 | 977,656 |
| | | 1,957,775 |
| Canada 0.1% |
| CNOOC Nexen Finance 2014 ULC |
| 4.25%, 04/30/24 | 500,000 | 506,451 |
| 4.88%, 04/30/44 | 750,000 | 788,246 |
| Export Development Canada |
| 1.63%, 01/17/20 | 1,000,000 | 984,900 |
| 1.75%, 07/21/20 | 1,500,000 | 1,472,640 |
| Nexen Energy ULC |
| 6.40%, 05/15/37 | 1,400,000 | 1,720,275 |
| | | 5,472,512 |
| Colombia 0.1% |
| Ecopetrol S.A. |
| 7.63%, 07/23/19 | 1,400,000 | 1,464,820 |
| 5.88%, 09/18/23 | 300,000 | 318,750 |
| 5.38%, 06/26/26 (a) | 2,500,000 | 2,571,250 |
| 5.88%, 05/28/45 | 250,000 | 238,050 |
| | | 4,592,870 |
Security
Rate, Maturity Date | Face
Amount ($) | Value ($) |
| Germany 0.6% |
| Kreditanstalt fuer Wiederaufbau |
| 1.00%, 07/15/19 (f) | 1,000,000 | 984,687 |
| 1.50%, 09/09/19 (f) | 2,000,000 | 1,975,456 |
| 1.25%, 09/30/19 (f) | 2,300,000 | 2,263,359 |
| 4.00%, 01/27/20 (f) | 1,000,000 | 1,020,659 |
| 1.75%, 03/31/20 (f) | 2,000,000 | 1,969,115 |
| 1.50%, 04/20/20 (f) | 2,200,000 | 2,154,768 |
| 1.63%, 05/29/20 (f) | 1,000,000 | 980,375 |
| 1.88%, 06/30/20 (f) | 1,000,000 | 984,286 |
| 2.75%, 09/08/20 (f) | 1,000,000 | 1,001,174 |
| 2.63%, 04/12/21 (f) | 1,000,000 | 995,577 |
| 1.50%, 06/15/21 (f) | 2,000,000 | 1,926,385 |
| 2.38%, 08/25/21 (f) | 1,500,000 | 1,480,339 |
| 2.63%, 01/25/22 (f) | 500,000 | 496,078 |
| 2.13%, 03/07/22 (f) | 1,000,000 | 974,368 |
| 2.13%, 06/15/22 (f) | 1,500,000 | 1,458,874 |
| 2.00%, 09/29/22 (f) | 3,000,000 | 2,895,745 |
| 2.50%, 11/20/24 (f) | 3,500,000 | 3,402,924 |
| 2.88%, 04/03/28 (f) | 1,000,000 | 989,261 |
| Landwirtschaftliche Rentenbank |
| 2.25%, 10/01/21 (f) | 1,000,000 | 982,557 |
| 2.38%, 06/10/25 (f) | 500,000 | 481,864 |
| 2.50%, 11/15/27 (f) | 300,000 | 286,937 |
| | | 29,704,788 |
| Japan 0.1% |
| Japan Bank for International Cooperation |
| 1.75%, 05/28/20 | 1,000,000 | 978,403 |
| 2.13%, 11/16/20 | 500,000 | 490,362 |
| 2.38%, 07/21/22 | 1,500,000 | 1,457,018 |
| 2.38%, 11/16/22 | 2,050,000 | 1,983,820 |
| 2.25%, 11/04/26 | 1,000,000 | 927,118 |
| 2.75%, 11/16/27 | 1,200,000 | 1,152,082 |
| | | 6,988,803 |
| Mexico 0.3% |
| Petroleos Mexicanos |
| 5.50%, 01/21/21 | 400,000 | 412,296 |
| 4.88%, 01/24/22 | 350,000 | 353,955 |
| 3.50%, 01/30/23 | 1,500,000 | 1,423,755 |
| 4.63%, 09/21/23 | 1,500,000 | 1,482,750 |
| 4.88%, 01/18/24 | 1,750,000 | 1,731,922 |
| 4.50%, 01/23/26 | 500,000 | 470,350 |
| 6.88%, 08/04/26 | 1,500,000 | 1,580,250 |
| 6.50%, 03/13/27 | 500,000 | 513,335 |
| 6.63%, 06/15/35 | 500,000 | 490,625 |
| 6.50%, 06/02/41 | 250,000 | 235,725 |
| 6.38%, 01/23/45 | 1,000,000 | 923,500 |
| 6.75%, 09/21/47 | 2,250,000 | 2,127,150 |
| 6.35%, 02/12/48 (e) | 1,203,000 | 1,091,723 |
| | | 12,837,336 |
| Norway 0.1% |
| Equinor A.S.A. |
| 2.25%, 11/08/19 | 500,000 | 496,514 |
| 3.15%, 01/23/22 | 750,000 | 751,268 |
| 2.45%, 01/17/23 | 1,250,000 | 1,206,190 |
| 3.70%, 03/01/24 | 400,000 | 403,992 |
| 4.25%, 11/23/41 | 1,000,000 | 994,447 |
| | | 3,852,411 |
Schwab Fixed-Income ETFs | Semiannual Report
Schwab U.S. Aggregate Bond ETF
Portfolio Holdings as of June 30, 2018 (Unaudited) (continued)
Security
Rate, Maturity Date | Face
Amount ($) | Value ($) |
| Republic of Korea 0.1% |
| Export-Import Bank of Korea |
| 5.13%, 06/29/20 | 1,000,000 | 1,034,999 |
| 4.38%, 09/15/21 | 1,100,000 | 1,126,052 |
| 2.75%, 01/25/22 | 200,000 | 194,802 |
| 5.00%, 04/11/22 | 500,000 | 524,406 |
| 2.88%, 01/21/25 | 1,250,000 | 1,179,726 |
| 3.25%, 11/10/25 | 2,250,000 | 2,158,169 |
| Korea Development Bank |
| 2.25%, 05/18/20 | 500,000 | 490,230 |
| | | 6,708,384 |
| Sweden 0.0% |
| Svensk Exportkredit AB |
| 1.75%, 03/10/21 | 750,000 | 729,074 |
| 2.38%, 03/09/22 | 900,000 | 882,043 |
| | | 1,611,117 |
| | | 73,725,996 |
| U.S. 1.7% |
| CNOOC Finance 2015 USA LLC |
| 3.50%, 05/05/25 | 200,000 | 193,079 |
| Fannie Mae |
| 1.25%, 07/26/19 (a) | 1,500,000 | 1,481,551 |
| 0.88%, 08/02/19 | 3,250,000 | 3,196,323 |
| 1.75%, 09/12/19 | 2,000,000 | 1,984,044 |
| 1.75%, 11/26/19 | 2,500,000 | 2,475,682 |
| 1.63%, 01/21/20 | 1,300,000 | 1,282,849 |
| 1.50%, 07/30/20 | 1,800,000 | 1,759,648 |
| 1.50%, 11/30/20 | 300,000 | 292,083 |
| 1.88%, 12/28/20 | 250,000 | 245,474 |
| 1.38%, 02/26/21 | 1,500,000 | 1,452,034 |
| 1.38%, 10/07/21 | 1,000,000 | 959,004 |
| 2.00%, 01/05/22 | 250,000 | 243,796 |
| 1.88%, 04/05/22 | 5,000,000 | 4,850,020 |
| 2.38%, 01/19/23 | 3,000,000 | 2,947,659 |
| 2.13%, 04/24/26 | 6,000,000 | 5,623,548 |
| 1.88%, 09/24/26 | 2,000,000 | 1,828,286 |
| 7.13%, 01/15/30 (d) | 527,000 | 726,628 |
| 7.25%, 05/15/30 | 1,000,000 | 1,398,859 |
| 6.63%, 11/15/30 | 1,200,000 | 1,611,773 |
| 5.63%, 07/15/37 | 1,000,000 | 1,335,732 |
| Federal Farm Credit Bank |
| 1.15%, 07/01/19 | 1,000,000 | 988,215 |
| 1.95%, 11/02/21 | 1,250,000 | 1,219,201 |
| 1.92%, 04/19/22 (a) | 1,500,000 | 1,447,899 |
| Federal Home Loan Bank |
| 0.88%, 08/05/19 | 1,000,000 | 983,289 |
| 1.38%, 11/15/19 | 1,000,000 | 985,251 |
| 1.88%, 03/13/20 | 1,000,000 | 988,915 |
| 2.63%, 05/28/20 | 1,800,000 | 1,800,886 |
| 1.75%, 06/12/20 | 1,000,000 | 983,913 |
| 1.75%, 07/13/20 (a) | 250,000 | 245,265 |
| 1.38%, 02/18/21 | 1,000,000 | 968,407 |
| 1.13%, 07/14/21 | 1,000,000 | 957,341 |
| 1.88%, 11/29/21 | 1,750,000 | 1,703,455 |
| 2.38%, 06/10/22 | 400,000 | 393,640 |
| 2.13%, 03/10/23 | 250,000 | 242,892 |
| 2.88%, 06/14/24 | 1,075,000 | 1,072,448 |
| 5.38%, 08/15/24 | 1,750,000 | 1,981,579 |
| 5.50%, 07/15/36 | 400,000 | 522,928 |
| Freddie Mac |
| 0.88%, 07/19/19 | 750,000 | 738,228 |
| 1.25%, 08/01/19 | 1,300,000 | 1,283,851 |
Security
Rate, Maturity Date | Face
Amount ($) | Value ($) |
| 1.25%, 10/02/19 | 1,000,000 | 984,927 |
| 0.00%, 11/29/19 (h) | 700,000 | 673,965 |
| 1.38%, 04/20/20 | 1,000,000 | 979,387 |
| 1.38%, 05/01/20 | 3,750,000 | 3,673,477 |
| 2.38%, 02/16/21 | 8,000,000 | 7,941,712 |
| 1.13%, 08/12/21 | 1,000,000 | 954,744 |
| 2.38%, 01/13/22 (d) | 5,351,000 | 5,283,428 |
| 6.75%, 09/15/29 | 500,000 | 667,816 |
| 6.75%, 03/15/31 (d) | 564,000 | 771,108 |
| 6.25%, 07/15/32 | 700,000 | 938,270 |
| Private Export Funding Corp. |
| 2.30%, 09/15/20 | 2,000,000 | 1,976,438 |
| Tennessee Valley Authority |
| 2.88%, 09/15/24 | 2,000,000 | 1,988,026 |
| 6.75%, 11/01/25 | 488,000 | 605,482 |
| 2.88%, 02/01/27 | 500,000 | 488,118 |
| 5.25%, 09/15/39 | 750,000 | 949,468 |
| 4.63%, 09/15/60 | 100,000 | 120,287 |
| | | 84,392,328 |
| | | 158,118,324 |
| |
| Local Authority 0.9% |
| Foreign 0.3% |
| Canada 0.3% |
| Hydro-Quebec |
| 8.05%, 07/07/24 (d) | 1,160,000 | 1,435,075 |
| Province of Alberta Canada |
| 1.90%, 12/06/19 | 500,000 | 494,397 |
| 3.30%, 03/15/28 | 1,500,000 | 1,499,100 |
| Province of British Columbia |
| 2.00%, 10/23/22 | 450,000 | 432,718 |
| 2.25%, 06/02/26 | 300,000 | 280,495 |
| Province of Manitoba |
| 2.13%, 06/22/26 | 750,000 | 686,895 |
| Province of Ontario |
| 4.00%, 10/07/19 | 750,000 | 762,160 |
| 4.40%, 04/14/20 | 750,000 | 771,006 |
| 2.55%, 02/12/21 | 1,000,000 | 990,406 |
| 2.50%, 09/10/21 | 1,500,000 | 1,476,015 |
| 2.40%, 02/08/22 | 250,000 | 244,416 |
| 2.45%, 06/29/22 | 1,500,000 | 1,463,541 |
| 3.20%, 05/16/24 | 500,000 | 499,357 |
| Province of Quebec |
| 2.75%, 08/25/21 | 500,000 | 496,723 |
| 2.38%, 01/31/22 | 750,000 | 734,085 |
| 2.63%, 02/13/23 | 250,000 | 245,123 |
| 7.13%, 02/09/24 | 1,000,000 | 1,197,364 |
| 2.88%, 10/16/24 | 1,000,000 | 986,291 |
| 7.50%, 09/15/29 | 168,000 | 230,681 |
| | | 14,925,848 |
| | | 14,925,848 |
| U.S. 0.6% |
| American Municipal Power, Inc. |
| RB (Build America Bonds) Series 2010 |
| 6.27%, 02/15/50 | 300,000 | 383,586 |
| RB (Build America Bonds) Series 2010 |
| 8.08%, 02/15/50 | 250,000 | 405,960 |
| Bay Area Toll Authority |
| RB (Build America Bonds) Series 2010S1 |
| 7.04%, 04/01/50 | 500,000 | 733,405 |
Schwab Fixed-Income ETFs | Semiannual Report
Schwab U.S. Aggregate Bond ETF
Portfolio Holdings as of June 30, 2018 (Unaudited) (continued)
Security
Rate, Maturity Date | Face
Amount ($) | Value ($) |
| RB (Build America Bonds) Series 2010S3 |
| 6.91%, 10/01/50 | 1,100,000 | 1,613,436 |
| California |
| GO (Build America Bonds) Series 2009 |
| 6.20%, 10/01/19 | 250,000 | 261,328 |
| GO (Build America Bonds) Series 2009 |
| 7.50%, 04/01/34 | 1,350,000 | 1,899,976 |
| GO (Build America Bonds) Series 2010 |
| 7.95%, 03/01/36 (a) | 350,000 | 377,657 |
| GO (Build America Bonds) Series 2009 |
| 7.55%, 04/01/39 | 1,400,000 | 2,069,578 |
| GO (Build America Bonds) Series 2009 |
| 7.30%, 10/01/39 | 1,350,000 | 1,917,108 |
| GO (Build America Bonds) Series 2009 |
| 7.35%, 11/01/39 | 1,465,000 | 2,090,218 |
| City of Chicago IL |
| GO Bonds Series 2012 |
| 5.43%, 01/01/42 | 350,000 | 326,260 |
| City of New York NY |
| GO Bonds Series 2010 |
| 6.25%, 06/01/35 (a) | 750,000 | 791,895 |
| Commonwealth of Massachusetts |
| Series D |
| 4.50%, 08/01/31 | 400,000 | 427,588 |
| GO (Build America Bonds) Series 2009 |
| 5.46%, 12/01/39 (d) | 100,000 | 120,077 |
| Connecticut |
| GO Bonds Series 2008A |
| 5.85%, 03/15/32 | 700,000 | 809,123 |
| Dallas County Hospital District |
| GO (Build America Bonds) Series C |
| 5.62%, 08/15/44 | 150,000 | 185,814 |
| Dallas Independent School District |
| GO (Build America Bonds) Series 2010C |
| 6.45%, 02/15/35 (a) | 350,000 | 379,190 |
| District of Columbia |
| Series E |
| 5.59%, 12/01/34 | 350,000 | 418,583 |
| Florida State Board of Administration Finance Corp. |
| Series A |
| 2.64%, 07/01/21 | 100,000 | 99,123 |
| Grand Parkway Transportation Corp. |
| RB Series 2013E |
| 5.18%, 10/01/42 | 200,000 | 236,004 |
| Illinois |
| GO Bonds (Pension Funding) Series 2003 |
| 4.95%, 06/01/23 | 550,000 | 559,933 |
| GO Bonds (Pension Funding) Series 2003 |
| 5.10%, 06/01/33 | 1,855,000 | 1,758,429 |
| Los Angeles Department of Water & Power Power System Revenue |
| RB (Build America Bonds) Series 2010 |
| 6.57%, 07/01/45 | 250,000 | 354,135 |
| Los Angeles Unified School District |
| GO (Build America Bonds) Series 2009 |
| 5.76%, 07/01/29 | 300,000 | 351,678 |
| GO (Build America Bonds) Series 2010 |
| 6.76%, 07/01/34 (d) | 450,000 | 596,340 |
| Metropolitan Government Nashville & Davidson County Health & Educational Facs Bd |
| RB (Vanderbilt Univ Medical Center) Series 2016 B |
| 4.05%, 07/01/26 (a) | 800,000 | 824,216 |
| Metropolitan Transportation Authority |
| RB (Build America Bonds) Series E |
| 6.81%, 11/15/40 | 650,000 | 874,386 |
Security
Rate, Maturity Date | Face
Amount ($) | Value ($) |
| New Jersey Transportation Trust Fund Authority |
| RB (Build America Bonds) Series 2010C |
| 5.75%, 12/15/28 | 900,000 | 1,000,881 |
| New Jersey Turnpike Authority |
| RB (Build America Bonds) Series 2010A |
| 7.10%, 01/01/41 | 500,000 | 705,440 |
| New York City Municipal Water Finance Authority |
| Water System RB (Build America Bonds) Series 2009 |
| 5.75%, 06/15/41 (d) | 200,000 | 252,986 |
| Water System RB (Build America Bonds) |
| 6.01%, 06/15/42 | 250,000 | 325,763 |
| Water System RB (Build America Bonds) Series 2011CC |
| 5.88%, 06/15/44 | 250,000 | 326,315 |
| New York City Transitional Finance Authority |
| RB (Build America Bonds) Series 2011A1 |
| 5.51%, 08/01/37 | 200,000 | 237,346 |
| Oregon |
| GO Bonds (Pension Funding) Series 2003 |
| 5.89%, 06/01/27 | 500,000 | 584,040 |
| Oregon School Boards Association |
| Series B |
| 5.55%, 06/30/28 | 250,000 | 282,418 |
| Port Authority of New York & New Jersey |
| Consolidated Bonds 168th Series |
| 4.93%, 10/01/51 | 250,000 | 294,155 |
| Consolidated Bonds 174th Series |
| 4.46%, 10/01/62 | 1,150,000 | 1,226,072 |
| San Diego County Regional Transportation Commission |
| RB (Build America Bonds) Series 2010A |
| 5.91%, 04/01/48 | 300,000 | 401,286 |
| San Diego County Water Authority Financing Corp. |
| RB (Build America Bonds) Series 2010B |
| 6.14%, 05/01/49 | 350,000 | 463,243 |
| San Jose Redevelopment Agency Successor Agency |
| Series A |
| 3.38%, 08/01/34 (a) | 1,500,000 | 1,438,350 |
| Texas |
| GO Mobility Fund Bonds (Build America Bonds) Series 2009A |
| 5.52%, 04/01/39 | 750,000 | 949,792 |
| GO (Build America Bonds) Series 2010A |
| 4.68%, 04/01/40 | 500,000 | 569,840 |
| Texas Transportation Commission |
| RB (Build America Bonds) Series B |
| 5.18%, 04/01/30 | 1,130,000 | 1,291,759 |
| University of California |
| RB Series AD |
| 4.86%, 05/15/12 | 250,000 | 266,195 |
| Utah |
| GO (Build America Bonds) Series D |
| 4.55%, 07/01/24 | 850,000 | 894,514 |
| GO (Build America Bonds) Series B |
| 3.54%, 07/01/25 | 525,000 | 532,980 |
| Wisconsin |
| RB Series A |
| 5.70%, 05/01/26 | 745,000 | 829,118 |
| | | 33,737,519 |
| | | 48,663,367 |
| |
| Sovereign 0.9% |
| Chile 0.1% |
| Chile Government International Bond |
| 2.25%, 10/30/22 | 300,000 | 286,350 |
| 3.13%, 03/27/25 | 1,400,000 | 1,354,500 |
Schwab Fixed-Income ETFs | Semiannual Report
Schwab U.S. Aggregate Bond ETF
Portfolio Holdings as of June 30, 2018 (Unaudited) (continued)
Security
Rate, Maturity Date | Face
Amount ($) | Value ($) |
| 3.24%, 02/06/28 (a) | 3,000,000 | 2,871,000 |
| 3.63%, 10/30/42 | 100,000 | 93,625 |
| | | 4,605,475 |
| Colombia 0.1% |
| Colombia Government International Bond |
| 4.38%, 07/12/21 | 1,000,000 | 1,022,250 |
| 4.50%, 01/28/26 (a) | 1,000,000 | 1,016,875 |
| 7.38%, 09/18/37 | 300,000 | 375,000 |
| 6.13%, 01/18/41 | 750,000 | 841,875 |
| 5.63%, 02/26/44 (a) | 1,500,000 | 1,597,500 |
| 5.00%, 06/15/45 (a) | 350,000 | 345,187 |
| | | 5,198,687 |
| Hungary 0.1% |
| Hungary Government International Bond |
| 6.38%, 03/29/21 | 2,000,000 | 2,140,096 |
| 5.38%, 02/21/23 | 1,000,000 | 1,060,330 |
| 5.75%, 11/22/23 | 1,000,000 | 1,078,061 |
| | | 4,278,487 |
| Israel 0.0% |
| Israel Government International Bond |
| 2.88%, 03/16/26 | 500,000 | 475,844 |
| 3.25%, 01/17/28 | 500,000 | 483,864 |
| 4.50%, 01/30/43 | 500,000 | 506,809 |
| 4.13%, 01/17/48 | 250,000 | 236,961 |
| | | 1,703,478 |
| Italy 0.0% |
| Italy Government International Bond |
| 6.88%, 09/27/23 | 1,000,000 | 1,111,950 |
| 5.38%, 06/15/33 | 500,000 | 548,458 |
| | | 1,660,408 |
| Mexico 0.3% |
| Mexico Government International Bond |
| 3.50%, 01/21/21 | 650,000 | 650,845 |
| 3.63%, 03/15/22 | 3,150,000 | 3,159,734 |
| 8.00%, 09/24/22 | 100,000 | 120,750 |
| 4.00%, 10/02/23 | 600,000 | 602,925 |
| 4.13%, 01/21/26 | 500,000 | 496,625 |
| 4.15%, 03/28/27 | 2,700,000 | 2,664,900 |
| 6.05%, 01/11/40 | 550,000 | 607,750 |
| 4.75%, 03/08/44 | 3,250,000 | 3,023,764 |
| 5.55%, 01/21/45 | 600,000 | 629,250 |
| 4.60%, 01/23/46 | 1,000,000 | 922,500 |
| 4.35%, 01/15/47 | 400,000 | 358,400 |
| | | 13,237,443 |
| Panama 0.1% |
| Panama Government International Bond |
| 5.20%, 01/30/20 | 600,000 | 621,750 |
| 4.00%, 09/22/24 (a) | 500,000 | 505,000 |
| 3.75%, 03/16/25 (a) | 750,000 | 742,500 |
| 6.70%, 01/26/36 | 500,000 | 615,000 |
| 4.50%, 04/16/50 (a) | 500,000 | 481,875 |
| | | 2,966,125 |
Security
Rate, Maturity Date | Face
Amount ($) | Value ($) |
| Peru 0.0% |
| Peruvian Government International Bond |
| 7.35%, 07/21/25 | 1,000,000 | 1,222,500 |
| 4.13%, 08/25/27 | 750,000 | 768,750 |
| 5.63%, 11/18/50 | 500,000 | 581,875 |
| | | 2,573,125 |
| Philippines 0.1% |
| Philippine Government International Bond |
| 4.00%, 01/15/21 | 800,000 | 810,982 |
| 4.20%, 01/21/24 | 1,300,000 | 1,329,194 |
| 9.50%, 10/21/24 | 500,000 | 660,632 |
| 5.50%, 03/30/26 | 600,000 | 661,979 |
| 9.50%, 02/02/30 | 250,000 | 365,311 |
| 6.38%, 01/15/32 | 350,000 | 420,760 |
| 3.95%, 01/20/40 | 1,500,000 | 1,437,490 |
| | | 5,686,348 |
| Poland 0.1% |
| Poland Government International Bond |
| 6.38%, 07/15/19 | 1,000,000 | 1,036,982 |
| 5.13%, 04/21/21 | 850,000 | 893,656 |
| 5.00%, 03/23/22 | 500,000 | 527,979 |
| 3.00%, 03/17/23 | 300,000 | 293,523 |
| 4.00%, 01/22/24 | 250,000 | 254,279 |
| | | 3,006,419 |
| Republic of Korea 0.0% |
| Korea International Bond |
| 3.88%, 09/11/23 | 600,000 | 614,010 |
| | | 614,010 |
| Uruguay 0.0% |
| Uruguay Government International Bond |
| 4.50%, 08/14/24 | 250,000 | 257,538 |
| 4.38%, 10/27/27 | 500,000 | 507,813 |
| 7.63%, 03/21/36 | 550,000 | 713,487 |
| 4.13%, 11/20/45 | 150,000 | 135,000 |
| 5.10%, 06/18/50 | 750,000 | 740,062 |
| | | 2,353,900 |
| | | 47,883,905 |
| |
| Supranational* 1.5% |
| African Development Bank |
| 1.88%, 03/16/20 | 450,000 | 444,143 |
| 2.38%, 09/23/21 | 1,500,000 | 1,477,775 |
| 2.13%, 11/16/22 | 1,000,000 | 967,773 |
| Asian Development Bank |
| 1.75%, 01/10/20 | 1,000,000 | 987,399 |
| 1.50%, 01/22/20 | 500,000 | 491,734 |
| 1.63%, 03/16/21 | 500,000 | 485,295 |
| 2.00%, 02/16/22 | 3,000,000 | 2,914,102 |
| 1.75%, 09/13/22 | 2,775,000 | 2,652,540 |
| 2.00%, 01/22/25 | 1,500,000 | 1,414,961 |
| 2.00%, 04/24/26 | 500,000 | 465,834 |
| 2.63%, 01/12/27 | 1,300,000 | 1,263,014 |
| 2.50%, 11/02/27 | 250,000 | 240,028 |
| 5.82%, 06/16/28 | 1,000,000 | 1,208,950 |
| Corp. Andina de Fomento |
| 2.13%, 09/27/21 | 1,000,000 | 963,590 |
| 4.38%, 06/15/22 | 550,000 | 570,344 |
Schwab Fixed-Income ETFs | Semiannual Report
Schwab U.S. Aggregate Bond ETF
Portfolio Holdings as of June 30, 2018 (Unaudited) (continued)
Security
Rate, Maturity Date | Face
Amount ($) | Value ($) |
| Council of Europe Development Bank |
| 1.75%, 11/14/19 | 500,000 | 494,426 |
| 1.88%, 01/27/20 | 200,000 | 197,669 |
| 1.63%, 03/10/20 | 500,000 | 491,696 |
| 1.63%, 03/16/21 | 500,000 | 484,748 |
| European Bank for Reconstruction & Development |
| 1.50%, 03/16/20 | 850,000 | 834,068 |
| 1.50%, 11/02/21 | 1,100,000 | 1,053,274 |
| European Investment Bank |
| 1.13%, 08/15/19 | 1,000,000 | 984,706 |
| 1.25%, 12/16/19 | 2,750,000 | 2,697,169 |
| 1.63%, 03/16/20 | 2,650,000 | 2,605,324 |
| 1.38%, 06/15/20 | 750,000 | 731,578 |
| 2.88%, 09/15/20 | 1,350,000 | 1,354,636 |
| 2.00%, 03/15/21 | 1,500,000 | 1,469,120 |
| 2.50%, 04/15/21 | 1,000,000 | 991,233 |
| 2.25%, 03/15/22 | 1,500,000 | 1,466,668 |
| 2.38%, 06/15/22 | 1,650,000 | 1,618,839 |
| 2.50%, 03/15/23 | 1,600,000 | 1,570,466 |
| 3.25%, 01/29/24 | 1,100,000 | 1,114,483 |
| 2.50%, 10/15/24 | 500,000 | 485,591 |
| 1.88%, 02/10/25 | 1,000,000 | 932,728 |
| 2.13%, 04/13/26 | 1,100,000 | 1,032,435 |
| 4.88%, 02/15/36 | 1,850,000 | 2,288,989 |
| Inter-American Development Bank |
| 1.25%, 10/15/19 | 500,000 | 491,921 |
| 1.75%, 10/15/19 | 500,000 | 495,079 |
| 3.88%, 02/14/20 | 700,000 | 714,106 |
| 1.63%, 05/12/20 | 1,700,000 | 1,671,661 |
| 2.13%, 11/09/20 | 650,000 | 641,477 |
| 1.88%, 03/15/21 | 4,600,000 | 4,497,788 |
| 2.13%, 01/18/22 | 750,000 | 734,587 |
| 2.50%, 01/18/23 | 350,000 | 344,831 |
| 2.38%, 07/07/27 | 1,100,000 | 1,045,925 |
| 4.38%, 01/24/44 | 2,000,000 | 2,396,804 |
| International Bank for Reconstruction & Development |
| 1.88%, 10/07/19 | 1,800,000 | 1,785,103 |
| 1.63%, 09/04/20 | 1,000,000 | 978,240 |
| 2.13%, 11/01/20 | 1,000,000 | 987,629 |
| 1.38%, 05/24/21 | 1,800,000 | 1,732,347 |
| 2.25%, 06/24/21 | 3,250,000 | 3,202,004 |
| 2.00%, 01/26/22 | 3,450,000 | 3,355,197 |
| 1.88%, 10/07/22 | 2,500,000 | 2,402,630 |
| 2.50%, 11/25/24 | 1,000,000 | 974,435 |
| 2.50%, 07/29/25 | 2,750,000 | 2,669,705 |
| 1.88%, 10/27/26 | 1,000,000 | 917,108 |
| 4.75%, 02/15/35 | 350,000 | 427,963 |
| International Finance Corp. |
| 1.75%, 09/16/19 | 1,100,000 | 1,090,050 |
| 1.63%, 07/16/20 | 1,000,000 | 979,515 |
| 1.13%, 07/20/21 | 1,000,000 | 951,360 |
| Nordic Investment Bank |
| 2.25%, 09/30/21 | 1,450,000 | 1,424,707 |
| | | 78,359,500 |
| Total Government Related |
| (Cost $340,024,494) | | 333,025,096 |
|
| Securitized 30.5% of net assets |
| |
| Asset-Backed Securities 0.6% |
| Automobile 0.2% |
| Ford Credit Auto Owner Trust |
| Series 2016-A Class A4 |
| 1.60%, 06/15/21 (a) | 2,541,000 | 2,507,541 |
Security
Rate, Maturity Date | Face
Amount ($) | Value ($) |
| Honda Auto Receivables Owner Trust |
| Series 2016-2, Class A4, ABS |
| 1.62%, 08/15/22 (a) | 1,455,000 | 1,439,363 |
| Series 2017-2, Class A4 |
| 1.87%, 09/15/23 (a) | 4,740,000 | 4,623,309 |
| Nissan Auto Receivables Owner Trust |
| Series 2017-C, Class A4, ABS |
| 2.28%, 02/15/24 (a) | 900,000 | 881,773 |
| | | 9,451,986 |
| Credit Card 0.4% |
| American Express Credit Account Master Trust |
| Series 2017-3, Class A |
| 1.77%, 11/15/22 (a) | 955,000 | 936,591 |
| Capital One Multi-Asset Execution Trust |
| Series 2017-A4, Class A4, ABS |
| 1.99%, 07/17/23 (a) | 3,350,000 | 3,283,585 |
| Series 2017-A6, Class A6, ABS |
| 2.29%, 07/15/25 (a) | 2,370,000 | 2,299,498 |
| Chase Issuance Trust |
| Series 2012-A4 Class A4 |
| 1.58%, 08/16/21 (a) | 1,080,000 | 1,066,600 |
| Series 2015-A4 Class A4 |
| 1.84%, 04/15/22 (a) | 650,000 | 638,077 |
| Citibank Credit Card Issuance Trust |
| Series 2018-A1, Class A1, ABS |
| 2.49%, 01/20/23 (a) | 700,000 | 691,507 |
| Series 2014-A1 Class A1 |
| 2.88%, 01/23/23 (a) | 325,000 | 324,229 |
| Discover Card Execution Note Trust |
| Series 2014-A4 Class A4 |
| 2.12%, 12/15/21 (a) | 2,650,000 | 2,636,157 |
| Series 2012-A6 Class A6 |
| 1.67%, 01/18/22 (a) | 3,502,000 | 3,464,544 |
| Series 2015-A4 Class A4 |
| 2.19%, 04/17/23 (a) | 3,300,000 | 3,249,120 |
| World Financial Network Credit Card Master Trust |
| Series 2015-B Class A |
| 2.55%, 06/17/24 (a) | 620,000 | 613,278 |
| | | 19,203,186 |
| | | 28,655,172 |
| |
| Commercial Mortgage-Backed Securities 1.9% |
| Bank |
| Series 2017-BNK7, Class A5 |
| 3.44%, 09/15/60 (a) | 1,000,000 | 985,280 |
| CD Mortgage Trust |
| Series 2017-CD3, Class A4 |
| 3.63%, 02/10/50 (a) | 1,715,000 | 1,712,242 |
| CFCRE Commercial Mortgage Trust |
| Series 2016-C3 Class A3 |
| 3.87%, 01/10/48 (a) | 4,725,000 | 4,785,000 |
| Series 2016-C7, Class A3 |
| 3.84%, 12/10/54 (a) | 1,425,000 | 1,431,823 |
| Series 2016-C4 Class A4 |
| 3.28%, 05/10/58 (a) | 1,000,000 | 970,136 |
| Citigroup Commercial Mortgage Trust |
| Series 2013-GC17 Class A4 |
| 4.13%, 11/10/46 (a) | 615,000 | 636,634 |
| Series 2014-GC23 Class A4 |
| 3.62%, 07/10/47 (a) | 1,000,000 | 1,008,285 |
| Series 2016-GC36 Class A5 |
| 3.62%, 02/10/49 (a) | 1,200,000 | 1,200,502 |
Schwab Fixed-Income ETFs | Semiannual Report
Schwab U.S. Aggregate Bond ETF
Portfolio Holdings as of June 30, 2018 (Unaudited) (continued)
Security
Rate, Maturity Date | Face
Amount ($) | Value ($) |
| Series 2017-P7, Class A4 |
| 3.71%, 04/14/50 (a) | 500,000 | 501,544 |
| Series 2017-C4, Class A4 |
| 3.47%, 10/12/50 (a) | 1,300,000 | 1,276,846 |
| COMM Mortgage Trust |
| Series 2012-LC4 Class A4 |
| 3.29%, 12/10/44 (a) | 300,000 | 300,431 |
| Series 2012-CR3 Class A3 |
| 2.82%, 10/15/45 (a) | 257,558 | 252,679 |
| Series 2012-CR4 Class A3 |
| 2.85%, 10/15/45 (a) | 900,000 | 877,263 |
| Series 2013-CR6, Class A4 |
| 3.10%, 03/10/46 (a) | 4,950,000 | 4,904,888 |
| Series 2014-CR14 Class A3 |
| 3.96%, 02/10/47 (a) | 240,000 | 246,120 |
| Series 2014-CR16 Class ASB |
| 3.65%, 04/10/47 (a) | 630,000 | 637,423 |
| Series 2014-CR19 Class ASB |
| 3.50%, 08/10/47 (a) | 400,000 | 402,642 |
| Series 2014-UBS4, Class A5 |
| 3.69%, 08/10/47 (a) | 1,100,000 | 1,109,863 |
| Series 2014-CR20 Class A3 |
| 3.33%, 11/10/47 (a) | 1,550,000 | 1,534,067 |
| Series 2015-CR24 Class A5 |
| 3.70%, 08/10/48 (a) | 400,000 | 401,658 |
| Series 2015-LC23, Class A4 |
| 3.77%, 10/10/48 (a) | 440,000 | 443,760 |
| Series 2016-DC2, Class A5 |
| 3.77%, 02/10/49 (a) | 100,000 | 100,238 |
| Series 2015-PC1, Class ASB |
| 3.61%, 07/10/50 (a) | 1,975,000 | 1,988,704 |
| Series 2015-PC1, Class A5 |
| 3.90%, 07/10/50 (a) | 497,400 | 503,498 |
| Series 2013-CR11 Class A3 |
| 3.98%, 08/10/50 (a) | 450,000 | 462,605 |
| Series 2013-CR11 Class A4 |
| 4.26%, 08/10/50 (a) | 340,000 | 353,720 |
| Commercial Mortgage Pass Through Certificates |
| Series 2016-CR28 Class A4 |
| 3.76%, 02/10/49 (a) | 2,100,000 | 2,108,570 |
| CSAIL Commercial Mortgage Trust |
| Series 2015-C3, Class A4 |
| 3.72%, 08/15/48 (a) | 300,000 | 301,675 |
| Series 2015-C1 Class A4 |
| 3.51%, 04/15/50 (a) | 308,000 | 306,921 |
| CSMC Trust |
| Series 2016-NXSR, Class A4 |
| 3.79%, 12/15/49 (a) | 100,000 | 100,258 |
| Fannie Mae |
| Series 2010-M3 Class A3 |
| 4.33%, 03/25/20 (a)(c)(j) | 146,493 | 148,907 |
| Series 2014-M6 Class A2 |
| 2.68%, 05/25/21 (a) | 603,873 | 598,242 |
| Series 2015-M4 Class AV2 |
| 2.51%, 07/25/22 (a) | 75,000 | 73,672 |
| Series 2016-M3 Class ASQ2 |
| 2.26%, 02/25/23 (a)(c)(j) | 65,000 | 63,051 |
| Series 2014-M9 Class A2 |
| 3.10%, 07/25/24 (a)(c)(j) | 492,000 | 490,270 |
| Series 2015-M3 Class A2 |
| 2.72%, 10/25/24 (a) | 550,000 | 535,181 |
| Series 2015-M13 Class A2 |
| 2.80%, 06/25/25 (a)(c)(j) | 150,000 | 145,223 |
| Series 2016-M6 Class A2 |
| 2.49%, 05/25/26 (a) | 2,600,000 | 2,447,577 |
Security
Rate, Maturity Date | Face
Amount ($) | Value ($) |
| Freddie Mac |
| Series K704 Class A2 |
| 2.41%, 08/25/18 (a) | 25,892 | 25,849 |
| Series K712 Class A2 |
| 1.87%, 11/25/19 (a) | 419,579 | 414,635 |
| Series K008 Class A2 |
| 3.53%, 06/25/20 (a) | 140,600 | 142,204 |
| Series K009 Class A2 |
| 3.81%, 08/25/20 (a) | 500,000 | 508,827 |
| Series K714 Class A2 |
| 3.03%, 10/25/20 (a) | 765,000 | 765,614 |
| Series K010 Class A2 |
| 4.33%, 10/25/20 (a) | 305,000 | 313,584 |
| Series K012 Class A2 |
| 4.19%, 12/25/20 (a)(c)(i) | 1,021,000 | 1,049,564 |
| Series K013 Class A2 |
| 3.97%, 01/25/21 (a)(c)(i) | 492,000 | 503,403 |
| Series K014 Class A2 |
| 3.87%, 04/25/21 (a) | 713,405 | 728,765 |
| Series K015 Class A2 |
| 3.23%, 07/25/21 (a) | 525,000 | 527,279 |
| Series K016 Class A2 |
| 2.97%, 10/25/21 (a) | 500,000 | 498,326 |
| Series K017 Class A2 |
| 2.87%, 12/25/21 (a) | 100,000 | 99,369 |
| Series K021, Class A1 |
| 1.60%, 01/25/22 (a) | 128,049 | 125,156 |
| Series K018, Class A2 |
| 2.79%, 01/25/22 (a) | 150,000 | 149,007 |
| Series K025 Class A1 |
| 1.88%, 04/25/22 (a) | 275,331 | 269,940 |
| Series K020 Class A2 |
| 2.37%, 05/25/22 (a) | 385,000 | 376,265 |
| Series K022 Class A2 |
| 2.36%, 07/25/22 (a) | 1,200,000 | 1,169,528 |
| Series K024 Class A2 |
| 2.57%, 09/25/22 (a) | 800,000 | 785,314 |
| Series K025 Class A2 |
| 2.68%, 10/25/22 (a) | 511,000 | 503,602 |
| Series K029 Class A1 |
| 2.84%, 10/25/22 (a) | 88,521 | 88,365 |
| Series K026 Class A2 |
| 2.51%, 11/25/22 (a) | 550,000 | 538,622 |
| Series K027 Class A2 |
| 2.64%, 01/25/23 (a) | 1,705,000 | 1,681,757 |
| Series K033 Class A1 |
| 2.87%, 02/25/23 (a) | 101,597 | 101,353 |
| Series K028 Class A2 |
| 3.11%, 02/25/23 (a) | 250,000 | 251,343 |
| Series K030 Class A2 |
| 3.25%, 04/25/23 (a)(c)(i) | 250,000 | 252,005 |
| Series K031 Class A2 |
| 3.30%, 04/25/23 (a) | 1,525,000 | 1,540,947 |
| Series K033 Class A2 |
| 3.06%, 07/25/23 (a) | 1,540,000 | 1,538,594 |
| Series K034, Class A2 |
| 3.53%, 07/25/23 (a) | 150,000 | 153,009 |
| Series K035 Class A2 |
| 3.46%, 08/25/23 (a)(c)(i) | 450,000 | 457,579 |
| Series K725, Class A2 |
| 3.00%, 01/25/24 (a) | 650,000 | 646,543 |
| Series K037 Class A2 |
| 3.49%, 01/25/24 (a) | 600,000 | 611,469 |
| Series K728, Class A2 |
| 3.06%, 08/25/24 (a)(c)(i) | 3,700,000 | 3,683,176 |
| Series K040 Class A2 |
| 3.24%, 09/25/24 (a) | 400,000 | 402,476 |
Schwab Fixed-Income ETFs | Semiannual Report
Schwab U.S. Aggregate Bond ETF
Portfolio Holdings as of June 30, 2018 (Unaudited) (continued)
Security
Rate, Maturity Date | Face
Amount ($) | Value ($) |
| Series K045 Class A1 |
| 2.49%, 11/25/24 (a) | 439,056 | 431,044 |
| Series K042, Class A2 |
| 2.67%, 12/25/24 (a) | 100,000 | 97,323 |
| Series K043, Class A2 |
| 3.06%, 12/25/24 (a) | 300,000 | 298,492 |
| Series K052, Class A1 |
| 2.60%, 01/25/25 (a) | 255,834 | 251,898 |
| Series K044, Class A2 |
| 2.81%, 01/25/25 (a) | 1,015,000 | 994,420 |
| Series K045 Class A2 |
| 3.02%, 01/25/25 (a) | 400,000 | 396,556 |
| Series K053, Class A1 |
| 2.55%, 02/25/25 (a) | 573,601 | 562,325 |
| Series K046 Class A2 |
| 3.21%, 03/25/25 (a) | 750,000 | 751,080 |
| Series K048 Class A2 |
| 3.28%, 06/25/25 (a)(c)(i) | 838,000 | 842,706 |
| Series K053, Class A2 |
| 3.00%, 12/25/25 (a) | 950,000 | 936,016 |
| Series K054, Class A2 |
| 2.75%, 01/25/26 (a) | 300,000 | 290,219 |
| Series K055, Class A2 |
| 2.67%, 03/25/26 (a) | 750,000 | 720,362 |
| Series K062, Class A2 |
| 3.41%, 12/25/26 (a) | 3,000,000 | 3,016,529 |
| Series K064, Class A2 |
| 3.22%, 03/25/27 (a) | 107,000 | 106,016 |
| Series K071, Class A2 |
| 3.29%, 11/25/27 (a) | 1,000,000 | 989,087 |
| Series K074, Class A2 |
| 3.60%, 01/25/28 (a) | 1,875,000 | 1,902,908 |
| GS Mortgage Securities Trust |
| Series 2011-GC5 Class A4 |
| 3.71%, 08/10/44 (a) | 233,000 | 235,887 |
| Series 2012-GC6 Class A3 |
| 3.48%, 01/10/45 (a) | 597,743 | 603,159 |
| Series 2012-GCJ7 Class A4 |
| 3.38%, 05/10/45 (a) | 398,425 | 399,787 |
| Series 2013-GC12 Class AAB |
| 2.68%, 06/10/46 (a) | 270,462 | 267,623 |
| Series 2013-GC13 Class A5 |
| 4.18%, 07/10/46 (a)(c)(k) | 649,000 | 672,673 |
| Series 2013-GC14 Class A5 |
| 4.24%, 08/10/46 (a) | 700,000 | 727,683 |
| Series 2016-GS4, Class A4 |
| 3.44%, 11/10/49 (a) | 365,000 | 358,803 |
| JP Morgan Chase Commercial Mortgage Securities Trust |
| Series 2012-C6 Class A3 |
| 3.51%, 05/15/45 (a) | 338,456 | 340,439 |
| Series 2012-CBX Class A4 |
| 3.48%, 06/15/45 (a) | 423,741 | 425,599 |
| Series 2011-C5 Class A3 |
| 4.17%, 08/15/46 (a) | 315,912 | 322,929 |
| Series 2014-C20 Class A4A1 |
| 3.54%, 07/15/47 (a) | 800,000 | 800,492 |
| Series 2014-C26 Class ASB |
| 3.29%, 01/15/48 (a) | 600,000 | 599,764 |
| Series 2015-C29 Class A4 |
| 3.61%, 05/15/48 (a) | 1,000,000 | 1,002,566 |
| Series 2015-C28 Class A4 |
| 3.23%, 10/15/48 (a) | 2,000,000 | 1,961,218 |
| Series 2015-C32 Class A2 |
| 2.82%, 11/15/48 (a) | 600,000 | 596,074 |
| Series 2015-C33 Class A4 |
| 3.77%, 12/15/48 (a) | 450,000 | 454,399 |
Security
Rate, Maturity Date | Face
Amount ($) | Value ($) |
| Series 2015-JP1 Class A4 |
| 3.65%, 01/15/49 (a) | 600,000 | 601,734 |
| JPMDB Commercial Mortgage Securities Trust |
| Series 2017-C5, Class A1 |
| 2.10%, 03/15/50 (a) | 423,213 | 415,261 |
| Morgan Stanley Bank of America Merrill Lynch Trust |
| Series 2012-C5 Class A4 |
| 3.18%, 08/15/45 (a) | 430,000 | 427,138 |
| Series 2013-C10 Class A4 |
| 4.22%, 07/15/46 (a)(c)(k) | 180,000 | 185,399 |
| Series 2014-C16 Class A5 |
| 3.89%, 06/15/47 (a) | 270,000 | 275,106 |
| Series 2015-C24 Class ASB |
| 3.48%, 05/15/48 (a) | 1,000,000 | 1,003,649 |
| Series 2013-C8, Class AS |
| 3.38%, 12/15/48 (a) | 80,000 | 78,379 |
| Morgan Stanley Capital I Trust |
| Series 2012-C4 Class A4 |
| 3.24%, 03/15/45 (a) | 300,000 | 299,204 |
| Series 2011-C3, Class A4 |
| 4.12%, 07/15/49 (a) | 100,000 | 102,360 |
| UBS Commercial Mortgage Trust |
| Series 2017-C3, Class A4 |
| 3.43%, 08/15/50 (a) | 500,000 | 487,848 |
| Series 2017-C6, Class A5 |
| 3.58%, 12/15/50 (a) | 1,000,000 | 986,161 |
| UBS-Barclays Commercial Mortgage Trust |
| Series 2012-C4 Class A5 |
| 2.85%, 12/10/45 (a) | 500,000 | 490,031 |
| Series 2013-C5 Class A4 |
| 3.18%, 03/10/46 (a) | 1,850,000 | 1,836,543 |
| Wells Fargo Commercial Mortgage Trust |
| Series 2013-LC12 Class A4 |
| 4.22%, 07/15/46 (a)(c)(k) | 640,000 | 665,229 |
| Series 2015-C28, Class A3 |
| 3.29%, 05/15/48 (a) | 1,210,000 | 1,192,867 |
| Series 2015-C31 Class A3 |
| 3.43%, 11/15/48 (a) | 500,000 | 493,890 |
| Series 2015-P2, Class A4 |
| 3.81%, 12/15/48 (a) | 1,500,000 | 1,519,487 |
| Series 2014-LC16 Class A4 |
| 3.55%, 08/15/50 (a) | 875,000 | 879,641 |
| Series 2017-C40, Class A4 |
| 3.58%, 10/15/50 (a) | 1,000,000 | 989,668 |
| Series 2017-C41, Class A4 |
| 3.47%, 11/15/50 (a) | 500,000 | 490,061 |
| Series 2015-C30 Class A4 |
| 3.66%, 09/15/58 (a) | 560,000 | 562,630 |
| Series 2016-NXS5, Class A4 |
| 3.37%, 01/15/59 (a) | 575,000 | 568,371 |
| WFRBS Commercial Mortgage Trust |
| Series 2012-C7 Class A1 |
| 2.30%, 06/15/45 (a) | 148,735 | 147,668 |
| Series 2013-C14 Class A5 |
| 3.34%, 06/15/46 (a) | 547,687 | 547,608 |
| Series 2013-C15 Class A4 |
| 4.15%, 08/15/46 (a)(c)(k) | 520,000 | 538,717 |
| Series 2014-C19 Class A4 |
| 3.83%, 03/15/47 (a) | 100,000 | 102,060 |
| Series 2014-C20 Class ASB |
| 3.64%, 05/15/47 (a) | 1,780,000 | 1,801,388 |
| Series 2013-C12 Class A4 |
| 3.20%, 03/15/48 (a) | 881,000 | 876,060 |
| | | 98,171,101 |
| |
Schwab Fixed-Income ETFs | Semiannual Report
Schwab U.S. Aggregate Bond ETF
Portfolio Holdings as of June 30, 2018 (Unaudited) (continued)
Security
Rate, Maturity Date | Face
Amount ($) | Value ($) |
| Mortgage-Backed Securities Pass-Through 28.0% |
| Fannie Mae |
| 3.50%, 10/01/18 to 04/01/48 (a) | 166,105,039 | 166,242,091 |
| 6.00%, 10/01/18 to 07/01/41 (a) | 3,365,984 | 3,712,163 |
| 7.00%, 11/01/18 to 03/01/37 (a) | 19,278 | 21,880 |
| 6.50%, 05/01/19 to 05/01/40 (a) | 1,397,482 | 1,548,435 |
| 4.50%, 06/01/19 to 06/01/48 (a) | 31,094,787 | 32,604,202 |
| 5.00%, 06/01/19 to 09/01/39 (a)(d) | 3,190,406 | 3,421,148 |
| 4.00%, 09/01/20 to 05/01/48 (a) | 112,692,959 | 115,387,543 |
| 5.50%, 08/01/23 to 08/01/41 (a) | 7,777,222 | 8,454,509 |
| 5.00%, 03/01/24 to 06/01/48 (a) | 10,667,285 | 11,430,712 |
| 4.00%, 04/01/24 to 05/01/41 (a)(d) | 7,049,752 | 7,243,384 |
| 8.50%, 05/01/25 (a) | 1,766 | 1,900 |
| 3.00%, 12/01/25 to 04/01/47 (a) | 159,859,056 | 156,758,698 |
| 2.50%, 07/01/27 to 02/01/43 (a) | 38,365,549 | 37,363,042 |
| 2.00%, 02/01/28 to 01/01/32 (a) | 1,583,749 | 1,514,246 |
| 5.50%, 07/01/29 to 09/01/38 (a)(d) | 1,197,360 | 1,299,183 |
| 6.00%, 07/01/35 to 10/01/39 (a)(d) | 1,181,962 | 1,301,000 |
| 4.50%, 04/01/39 to 04/01/41 (a)(d) | 1,267,845 | 1,334,210 |
| 3.50%, 10/01/40 to 06/01/45 (a)(d) | 18,777,343 | 18,762,570 |
| 3.00%, 07/01/43 to 10/01/46 (a)(d) | 11,054,281 | 10,736,618 |
| Fannie Mae TBA |
| 2.00%, 07/01/33 (a)(g) | 3,000,000 | 2,841,218 |
| 2.50%, 07/01/33 to 07/01/48 (a)(g) | 4,500,000 | 4,320,593 |
| 3.00%, 07/01/33 to 07/01/48 (a)(g) | 5,500,000 | 5,379,177 |
| 3.50%, 07/01/33 to 07/01/48 (a)(g) | 11,000,000 | 11,049,058 |
| 4.00%, 07/01/33 to 07/01/48 (a)(g) | 8,500,000 | 8,669,608 |
| 4.50%, 07/01/48 (a)(g) | 11,000,000 | 11,455,563 |
| Freddie Mac |
| 5.50%, 11/01/18 to 06/01/41 (a) | 5,163,212 | 5,591,707 |
| 4.50%, 05/01/19 to 06/01/48 (a) | 20,878,468 | 21,867,951 |
| 5.00%, 03/01/21 to 12/01/44 (a) | 7,541,196 | 8,061,196 |
| 6.00%, 05/01/21 to 05/01/40 (a) | 3,241,946 | 3,588,247 |
| 6.50%, 09/01/22 to 09/01/39 (a) | 420,344 | 467,836 |
| 4.50%, 07/01/23 to 07/01/39 (a)(d) | 467,241 | 489,068 |
| 2.00%, 08/01/23 to 12/01/31 (a) | 1,336,988 | 1,282,926 |
| 5.00%, 01/01/24 to 08/01/39 (a)(d) | 1,185,396 | 1,263,643 |
| 4.00%, 03/01/24 to 06/01/48 (a) | 64,759,872 | 66,364,848 |
| 5.50%, 05/01/24 to 02/01/40 (a)(d) | 637,954 | 688,499 |
| 3.00%, 12/01/25 to 04/01/47 (a) | 100,962,768 | 98,846,512 |
| 3.50%, 12/01/25 to 02/01/48 (a) | 116,923,474 | 116,893,601 |
| 2.50%, 07/01/27 to 11/01/46 (a) | 26,063,901 | 25,365,101 |
| 6.00%, 09/01/32 to 10/01/37 (a)(d) | 291,741 | 321,109 |
| 6.50%, 12/01/33 (a)(d) | 197,042 | 219,527 |
| 3.00%, 01/01/43 to 10/01/46 (a)(d) | 10,815,588 | 10,504,889 |
| 4.00%, 05/01/44 (a)(d) | 1,275,418 | 1,305,827 |
| Freddie Mac TBA |
| 2.00%, 07/01/33 (a)(g) | 1,500,000 | 1,419,672 |
| 2.50%, 07/01/33 (a)(g) | 4,000,000 | 3,883,160 |
| 3.00%, 07/01/33 to 07/01/48 (a)(g) | 8,500,000 | 8,340,328 |
| 3.50%, 07/01/33 to 07/01/48 (a)(g) | 11,500,000 | 11,539,234 |
| 4.00%, 07/01/48 (a)(g) | 8,500,000 | 8,664,466 |
| 4.50%, 07/01/48 (a)(g) | 5,000,000 | 5,203,350 |
| Ginnie Mae |
| 5.00%, 12/15/19 to 02/20/48 (a) | 10,621,334 | 11,343,095 |
| 6.50%, 05/15/24 to 10/20/37 (a) | 185,032 | 210,210 |
| 4.00%, 12/15/24 to 04/20/48 (a) | 71,061,459 | 73,267,088 |
| 5.50%, 04/20/26 to 12/20/45 (a) | 3,540,787 | 3,853,092 |
| 3.50%, 05/20/26 to 03/20/48 (a) | 128,498,188 | 129,447,784 |
| 3.00%, 12/15/26 to 02/20/47 (a) | 77,167,589 | 76,018,702 |
| 2.50%, 03/20/27 to 01/20/47 (a) | 4,566,442 | 4,431,651 |
| 6.00%, 10/20/32 to 01/20/45 (a) | 1,870,967 | 2,051,755 |
| 5.50%, 04/15/33 (a)(d) | 179,038 | 196,094 |
| 5.00%, 05/15/33 to 07/20/39 (a)(d) | 534,882 | 574,500 |
| 4.50%, 09/15/33 to 11/20/47 (a) | 21,928,201 | 23,092,742 |
| 6.00%, 09/20/37 (a)(d) | 227,186 | 248,125 |
Security
Rate, Maturity Date | Face
Amount ($) | Value ($) |
| 4.50%, 03/20/39 (a)(d) | 298,648 | 314,223 |
| 3.00%, 01/20/43 to 12/20/46 (a)(d) | 32,213,214 | 31,651,703 |
| 3.50%, 08/20/44 to 07/20/46 (a)(d) | 30,076,321 | 30,273,269 |
| Ginnie Mae TBA |
| 2.50%, 07/01/48 (a)(g) | 2,000,000 | 1,897,560 |
| 3.00%, 07/01/48 (a)(g) | 7,500,000 | 7,338,202 |
| 3.50%, 07/01/48 (a)(g) | 11,500,000 | 11,543,753 |
| 4.00%, 07/01/48 (a)(g) | 8,000,000 | 8,200,000 |
| 4.50%, 07/01/48 (a)(g) | 9,500,000 | 9,875,629 |
| | | 1,450,854,625 |
| Total Securitized |
| (Cost $1,615,517,228) | | 1,577,680,898 |
|
| Other Investment Company 0.4% of net assets |
| |
| Money Market Fund 0.4% |
| State Street Institutional U.S. Government Money Market Fund, Premier Class 1.82% (l) | 17,839,047 | 17,839,047 |
| Total Other Investment Company |
| (Cost $17,839,047) | | 17,839,047 |
|
| Short-Term Investments 4.0% of net assets |
| |
| Government Related 4.0% |
| Federal Home Loan Bank |
| 1.83%, 07/05/18 (m) | 80,000,000 | 79,987,600 |
| 1.84%, 07/11/18 (m) | 21,000,000 | 20,990,235 |
| 1.89%, 07/24/18 (m) | 60,000,000 | 59,931,780 |
Schwab Fixed-Income ETFs | Semiannual Report
Schwab U.S. Aggregate Bond ETF
Portfolio Holdings as of June 30, 2018 (Unaudited) (continued)
Security
Rate, Maturity Date | Face
Amount ($) | Value ($) |
| 1.88%, 07/27/18 (m) | 18,000,000 | 17,976,744 |
| 1.87%, 08/03/18 (m) | 30,000,000 | 29,949,060 |
| Total Short-Term Investments |
| (Cost $208,824,895) | | 208,835,419 |
| * | Supranational bonds represent the debt of international organizations or institutions such as the World Bank, the International Monetary Fund, regional multilateral development banks and others. |
| (a) | The effective maturity may be shorter than the final maturity shown because of the possibility of interim principal payments and prepayments or as the result of embedded demand features (puts or calls). |
| (b) | Security converts to floating rate after the fixed-rate coupon period. |
| (c) | Variable-rate security. |
| (d) | All or a portion of this security is held as collateral for delayed-delivery securities. |
| (e) | Securities exempt from registration under Rule 144A of the Securities Act of 1933, as amended. These securities may be resold in transactions exempt from registrations, normally to qualified institutional buyers. At the period end, the value of these amounted to $16,809,383 or 0.3% of net assets. |
| (f) | Guaranteed by the Republic of Germany. |
| (g) | Security or a portion of the security purchased on a delayed delivery or when-issued basis. |
| (h) | Zero Coupon Bond. |
| (i) | Variable rate is determined by formula set forth in the security’s offering documents and is affected by the current WAC (Weighted Average Coupon), which is the weighted average gross interest rate of the securitized asset pool and is determined by the different speeds at which the underlying mortgages are paid down. |
| (j) | Variable rate is determined by formula set forth in the security’s offering documents and is affected by the MBS (Mortgage-Backed Securities) pass-through rate, which is the rate earned from a securitized asset pool once management fees and guarantee fees have been paid to the securitizing corporation. |
| (k) | Security is a type of structured mortgage-backed security (MBS) that involves tranching (i.e. dividing) the underlying MBS pools’ cash flows into securities that have varying coupon and principal payback profiles. Tranches pay an investor an interest rate, which is determined by a formula set forth in the security’s offering documents. The floating interest rate may reset once a year and is generally tied to the London Interbank Offered Rate (LIBOR), the Constant Maturity Treasury (CMT), or the Cost of Funds Index (COFI). LIBOR is the interest rate banks charge each other for short-term loans. The CMT is an index published by the Federal Reserve Board to compute an index based on the monthly average yield of a range of Treasury securities maturing at different periods, adjusted to the equivalent of a one-year maturity. The COFI is a regional index of the average interest expenses paid by financial institutions on money market accounts, passbooks, CDs, and other liabilities. A variable interest rate can also be affected by the current WAC (Weighted Average Coupon), which is the weighted average gross interest rate of the securitized asset pool and is determined by the different speeds at which the underlying mortgages are paid down. |
| (l) | The rate shown is the 7-day yield. |
| (m) | The rate shown is the purchase yield. |
| | |
| GO — | General obligation |
| LIBOR — | London Interbank Offered Rate is the interest rate banks charge each other for short-term loans |
| RB — | Revenue bond |
| REIT — | Real Estate Investment Trust |
| TBA — | To-be-announced |
Schwab Fixed-Income ETFs | Semiannual Report
Schwab U.S. Aggregate Bond ETF
Portfolio Holdings as of June 30, 2018 (Unaudited) (continued)
The following is a summary of the inputs used to value the fund’s investments as of June 30, 2018 and reflects the complete schedule of portfolio holdings (see financial note 2(a) for additional information):
| Description | Quoted Prices in
Active Markets for
Identical Assets
(Level 1) | Other Significant
Observable Inputs
(Level 2) | Significant
Unobservable Inputs
(Level 3) | Total | |
| Assets | | | | | |
| Corporates 1 | $— | $1,283,015,526 | $— | $1,283,015,526 | |
| Treasuries | — | 1,942,624,777 | — | 1,942,624,777 | |
| Government Related1 | — | 333,025,096 | — | 333,025,096 | |
| Securitized 1 | — | 1,577,680,898 | — | 1,577,680,898 | |
| Other Investment Company1 | 17,839,047 | — | — | 17,839,047 | |
| Short-Term Investments1 | — | 208,835,419 | — | 208,835,419 | |
| Total | $17,839,047 | $5,345,181,716 | $— | $5,363,020,763 | |
| 1 | As categorized in Portfolio Holdings. |
The fund’s policy is to recognize transfers between Level 1, Level 2 and Level 3 as of the beginning of the fiscal year. There were no transfers between Level 1, Level 2 and Level 3 for the period ended June 30, 2018. Fund investments in underlying mutual funds and ETFs are classified as Level 1, without consideration to the classification level of the investments held by the underlying mutual funds and ETFs, which could be Level 1, Level 2 or Level 3.
Schwab Fixed-Income ETFs | Semiannual Report
Schwab U.S. Aggregate Bond ETF
Statement of Assets and Liabilities
As of June 30, 2018; unaudited
| Assets |
| Investments in unaffiliated issuers, at value (cost $5,486,340,524) | | $5,363,020,763 |
| Cash | | 934,742 |
| Receivables: | | |
| Investments sold | | 163,663,967 |
| Interest | | 32,486,117 |
| Dividends | + | 23,175 |
| Total assets | | 5,560,128,764 |
| Liabilities |
| Payables: | | |
| Investments bought | | 176,486,329 |
| Investments bought — Delayed delivery | | 210,083,232 |
| Investment adviser fees | + | 168,313 |
| Total liabilities | | 386,737,874 |
| Net Assets |
| Total assets | | 5,560,128,764 |
| Total liabilities | – | 386,737,874 |
| Net assets | | $5,173,390,890 |
| Net Assets by Source | | |
| Capital received from investors | | 5,322,082,038 |
| Net investment income not yet distributed | | 8,064,699 |
| Net realized capital losses | | (33,436,086) |
| Net unrealized capital depreciation | | (123,319,761) |
| Net Asset Value (NAV) |
| Net Assets | ÷ | Shares
Outstanding | = | NAV |
| $5,173,390,890 | | 102,200,000 | | $50.62 |
| | | | | |
Schwab Fixed-Income ETFs | Semiannual Report
Schwab U.S. Aggregate Bond ETF
Statement of Operations
For the period January 1, 2018 through June 30, 2018; unaudited
| Investment Income |
| Dividends | | $169,387 |
| Interest | + | 65,109,951 |
| Total investment income | | 65,279,338 |
| Expenses |
| Investment adviser fees | | 997,977 |
| Total expenses | – | 997,977 |
| Net investment income | | 64,281,361 |
| Realized and Unrealized Gains (Losses) |
| Net realized losses on investments | | (14,830,277) |
| Net change in unrealized appreciation (depreciation) on investments | + | (132,445,407) |
| Net realized and unrealized losses | | (147,275,684) |
| Decrease in net assets resulting from operations | | ($82,994,323) |
Schwab Fixed-Income ETFs | Semiannual Report
Schwab U.S. Aggregate Bond ETF
Statement of Changes in Net Assets
For the current and prior report periods
Figures for the current period are unaudited
| Operations | |
| | 1/1/18-6/30/18 | 1/1/17-12/31/17 |
| Net investment income | | $64,281,361 | $88,885,573 |
| Net realized losses | | (14,830,277) | (906,970) |
| Net change in unrealized appreciation (depreciation) | + | (132,445,407) | 39,801,062 |
| Increase (decrease) in net assets resulting from operations | | (82,994,323) | 127,779,665 |
| Distributions to Shareholders | |
| Distributions from net investment income | | ($56,618,000) | ($95,694,640) |
| Transactions in Fund Shares | | | |
| | | 1/1/18-6/30/18 | 1/1/17-12/31/17 |
| | | SHARES | VALUE | SHARES | VALUE |
| Shares sold | | 7,600,000 | $387,309,718 | 30,800,000 | $1,604,905,807 |
| Shares redeemed | + | — | — | (400,000) | (20,744,738) |
| Net transactions in fund shares | | 7,600,000 | $387,309,718 | 30,400,000 | $1,584,161,069 |
| Shares Outstanding and Net Assets | | | |
| | | 1/1/18-6/30/18 | 1/1/17-12/31/17 |
| | | SHARES | NET ASSETS | SHARES | NET ASSETS |
| Beginning of period | | 94,600,000 | $4,925,693,495 | 64,200,000 | $3,309,447,401 |
| Total increase | + | 7,600,000 | 247,697,395 | 30,400,000 | 1,616,246,094 |
| End of period | | 102,200,000 | $5,173,390,890 | 94,600,000 | $4,925,693,495 |
| Net investment income not yet distributed | | | $8,064,699 | | $401,338 |
Schwab Fixed-Income ETFs | Semiannual Report
Financial Notes, unaudited
1. Business Structure of the Funds:
Each of the funds in this report is a series of Schwab Strategic Trust (the trust), a no-load, open-end management investment company. The trust is organized as a Delaware statutory trust and is registered under the Investment Company Act of 1940, as amended (the 1940 Act). The list below shows all the operational funds in the trust as of the end of the period, including the funds discussed in this report, which are highlighted:
| SCHWAB STRATEGIC TRUST (ORGANIZED JANUARY 27, 2009) |
| Schwab U.S. TIPS ETF | Schwab U.S. Dividend Equity ETF™ |
| Schwab Short-Term U.S. Treasury ETF | Schwab International Equity ETF™ |
| Schwab Intermediate-Term U.S. Treasury ETF | Schwab International Small-Cap Equity ETF™ |
| Schwab U.S. Aggregate Bond ETF | Schwab Emerging Markets Equity ETF™ |
| Schwab U.S. Broad Market ETF™ | Schwab U.S. REIT ETF™ |
| Schwab 1000 Index® ETF | Schwab Fundamental U.S. Broad Market Index ETF |
| Schwab U.S. Large-Cap ETF™ | Schwab Fundamental U.S. Large Company Index ETF |
| Schwab U.S. Large-Cap Growth ETF™ | Schwab Fundamental U.S. Small Company Index ETF |
| Schwab U.S. Large-Cap Value ETF™ | Schwab Fundamental International Large Company Index ETF |
| Schwab U.S. Mid-Cap ETF™ | Schwab Fundamental International Small Company Index ETF |
| Schwab U.S. Small-Cap ETF™ | Schwab Fundamental Emerging Markets Large Company Index ETF |
The funds issue and redeem shares at their net asset value per share (NAV) only in large blocks of shares, typically 50,000 shares or more (Creation Units). These transactions are usually in exchange for a basket of securities and/or an amount of cash. As a practical matter, only institutions or large investors purchase or redeem Creation Units. Except when aggregated in Creation Units, shares of the funds are not redeemable securities.
Individual shares of the funds trade on national securities exchanges and elsewhere during the trading day and can only be bought and sold at market prices throughout the trading day through a broker-dealer. Because fund shares trade at market prices rather than NAV, shares may trade at a price greater than NAV (premium) or less than NAV (discount).
Each fund maintains its own account for purposes of holding assets and accounting, and is considered a separate entity for tax purposes. Within its account, each fund may also keep certain assets in segregated accounts, as required by securities law.
2. Significant Accounting Policies:
The following is a summary of the significant accounting policies the funds use in their preparation of financial statements. The funds follow the investment company accounting and reporting guidance of the Financial Accounting Standards Board Accounting Standard Codification Topic 946 Financial Services — Investment Companies. The accounting policies are in conformity with accounting principles generally accepted in the United States of America (GAAP).
The funds may invest in certain other investment companies (underlying funds). For more information about the underlying funds’ operations and policies, please refer to those funds’ semiannual and annual reports, which are filed with the U.S. Securities and Exchange Commission (SEC).
(a) Security Valuation:
Under procedures approved by the funds’ Board of Trustees (the Board), the investment adviser has formed a Pricing Committee to administer the pricing and valuation of portfolio securities and other assets and to ensure that prices used for internal purposes or provided by third parties reasonably reflect fair market value. Among other things, these procedures allow the funds to utilize independent pricing services, quotations from securities and financial instrument dealers and other market sources to determine fair value.
The funds value the securities in their portfolios every business day. The funds use the following policies to value various types of securities:
• Bonds and notes: Fixed income investments are generally valued using an evaluated price at the mid-point of the bid/ask spread provided by an approved, independent pricing service (mid-price). To determine the evaluated mid-price, a pricing service may use a variety of techniques and inputs. Techniques may include, but are not limited to, spread models that calculate an investment-specific price relative to a benchmark or yield curve models that establish a price based on yields of comparable bonds along a range of maturities. Inputs differ by valuation approach and technique, as appropriate, and examples of inputs may include, but are not limited to, interest rates, market conditions, comparable bonds, market trades, projected cash flows, credit reviews and issuer news.
Schwab Fixed-Income ETFs | Semiannual Report
Financial Notes, unaudited (continued)
2. Significant Accounting Policies (continued):
• Securities for which no quoted value is available: The Board has adopted procedures to fair value each fund’s securities when market prices are not “readily available” or are unreliable. For example, a fund may fair value a security when it is de-listed or its trading is halted or suspended; when a security’s primary pricing source is unable or unwilling to provide a price; or when a security’s primary trading market is closed during regular market hours. Each fund makes fair value determinations in good faith in accordance with the fund’s valuation procedures. The Pricing Committee considers a number of factors, including unobservable market inputs when arriving at fair value. The Pricing Committee may employ techniques such as the review of related or comparable assets or liabilities, related market activities, recent transactions, market multiples, book values, transactional back-testing, disposition analysis and other relevant information. The Pricing Committee regularly reviews these inputs and assumptions to calibrate the valuations. Due to the subjective and variable nature of fair value pricing, there can be no assurance that a fund could obtain the fair value assigned to the security upon the sale of such security. The Board convenes on a regular basis to review fair value determinations made by the funds pursuant to the valuation procedures.
• Short-term securities (60 days or less to maturity): Securities with remaining maturities of 60 days or less are generally valued at an evaluated price; however, such securities may be valued at their amortized cost if it approximates the security’s market value.
• Underlying funds: Mutual funds are valued at their respective NAVs.
In accordance with the authoritative guidance on fair value measurements and disclosures under GAAP, the funds disclose the fair value of their investments in a hierarchy that prioritizes the significant inputs to valuation techniques used to measure the fair value. The hierarchy gives the highest priority to valuations based upon unadjusted quoted prices in active markets for identical assets or liabilities (Level 1 measurements) and the lowest priority to valuations based upon unobservable inputs that are significant to the valuation (Level 3 measurements). If inputs used to measure the financial instruments fall within different levels of the hierarchy, the categorization is based on the lowest level input that is significant to the valuation. If the funds determine that either the volume and/or level of activity for an asset or liability has significantly decreased (from normal conditions for that asset or liability) or price quotations or observable inputs are not associated with orderly transactions, increased analysis and management judgment will be required to estimate fair value.
The three levels of the fair value hierarchy are as follows:
• Level 1—quoted prices in active markets for identical securities—Investments whose values are based on quoted market prices in active markets, and whose values are therefore classified as Level 1 prices, include active listed equities. Investments in mutual funds are valued daily at their NAVs, which are classified as Level 1 prices, without consideration to the classification level of the specific investments held by an underlying fund.
• Level 2—other significant observable inputs (including quoted prices for similar securities, interest rates, prepayment speeds, credit risk, etc.)—Investments that trade in markets that are not considered to be active, but whose values are based on quoted market prices, dealer quotations or valuations provided by alternative pricing sources supported by observable inputs are classified as Level 2 prices. These generally include U.S. government and sovereign obligations, most government agency securities, investment-grade corporate bonds, certain mortgage products, less liquid listed equities, and state, municipal and provincial obligations.
• Level 3—significant unobservable inputs (including the funds’ own assumptions in determining the fair value of investments)—Investments whose values are classified as Level 3 prices have significant unobservable inputs, as they may trade infrequently or not at all. When observable prices are not available for these securities, the funds use one or more valuation techniques for which sufficient and reliable data is available. The inputs used by the funds in estimating the value of Level 3 prices may include the original transaction price, quoted prices for similar securities or assets in active markets, completed or pending third-party transactions in the underlying investment or comparable issuers, and changes in financial ratios or cash flows. Level 3 prices may also be adjusted to reflect illiquidity and/or non-transferability, with the amount of such discount estimated by the funds in the absence of market information. Assumptions used by the funds due to the lack of observable inputs may significantly impact the resulting fair value and therefore the funds’ results of operations.
The inputs or methodology used for valuing securities are not necessarily an indication of the risk associated with investing in those securities.
Schwab Fixed-Income ETFs | Semiannual Report
Financial Notes, unaudited (continued)
2. Significant Accounting Policies (continued):
(b) Accounting Policies for certain Portfolio Investments (if held):
Securities Lending: Under the trust’s Securities Lending Program, a fund (lender) may make short-term loans of its securities to another party (borrower) to generate additional revenue for the fund. The borrower pledges collateral in the form of cash, securities issued or fully guaranteed by the U.S. government or foreign governments, or letters of credit issued by a bank. Collateral at the individual loan level is required to be maintained on a daily marked-to-market basis in an amount at least equal to the current value of the securities loaned. The lending agent provides a fund with indemnification against borrower default (the borrower fails to return the security on loan) reducing the risk of loss as a result of default. The cash collateral of securities loaned is currently invested in money market portfolios operating under Rule 2a-7 of the 1940 Act. Each fund bears the risk of loss with respect to the investment of cash collateral. The terms of the securities lending agreements allow the funds or the lending agent to terminate any loan at any given time and the securities must be returned within the earlier of the standard trade settlement period or the specified time period under the relevant securities lending agreement. Securities lending income, as disclosed in each fund’s Statement of Operations, if applicable, represents the income earned from the investment of the cash collateral plus any fees paid by borrowers, less the fees paid to the lending agent and broker rebates which are subject to adjustments pursuant to the securities lending agreement. On loans not collateralized by cash, a fee is received from the borrower, and is allocated between a fund and the lending agent. The aggregate market value of securities loaned will not at any time exceed one-third of the total assets of a fund, including collateral received from the loan. Securities lending fees paid to the unaffiliated lending agents start at 10% of gross lending revenue, with subsequent breakpoints to a low of 7.5%. Any expenses charged by the cash collateral fund are in addition to these fees.
As of June 30, 2018, the funds had no securities on loan.
Inflation-Protected Securities: The Schwab U.S. TIPS ETF invests in inflation-protected securities. Inflation-protected securities are fixed-income securities whose principal value is periodically adjusted to the rate of inflation. The interest rate on these instruments is generally fixed at issuance at a rate lower than typical bonds or notes. Over the life of an inflation-indexed instrument, however, interest will be paid based on a principal value, which is adjusted for any inflation or deflation. Any increase or decrease in the principal amount of an inflation-protected security will be included as an addition or reduction to interest income on the Statement of Operations, even though investors do not receive their principal until maturity.
TBA Commitments: The Schwab U.S. Aggregate Bond ETF may enter into “TBA” (to be announced) commitments to purchase or sell securities for a fixed price at a future date. Payments or proceeds of TBA commitments are not delivered until the contractual settlement date. Unsettled TBA commitments are valued at the current market value generally according to the procedures described above in the Security Valuation section. The fund’s use of TBA commitments may cause the fund to experience higher portfolio turnover and higher transaction costs.
Agency MBS and TBA Transactions: The Treasury Market Practices Group (TMPG) of the Federal Reserve Bank of New York recommended the margining of certain forward-settling Agency MBS transactions, including TBAs, to reduce counterparty credit risk. The TMPG recommended market participants exchange two-way variation margin on a regular basis. The Schwab U.S. Aggregate Bond ETF posts and receives variation margin with certain counterparties in instances where the unrealized gain/loss on such transactions exceeded certain pre-determined thresholds. The variation margin, if any, is disclosed on the Statement of Assets and Liabilities.
Delayed Delivery Transactions and When-Issued Securities: During the period, certain funds transacted in securities on a delayed delivery or when-issued basis. Payment and delivery may take place after the customary settlement period for that security. The price of the underlying securities and the date when the securities will be delivered and paid for are fixed at the time the transaction is negotiated. The securities purchased on a delayed delivery or when-issued basis are identified as such in the funds’ Portfolio Holdings. The funds may receive compensation for interest forgone in the purchase of a delayed delivery or when-issued security. With respect to purchase commitments, the funds identify securities as segregated in their records with a value at least equal to the amount of the commitment. Losses may arise due to changes in the value of the underlying securities or if the counterparty does not perform under the contract’s terms, or if the issuer does not issue the securities due to political, economic, or other factors.
(c) Security Transactions:
Security transactions are recorded as of the date the order to buy or sell the security is executed. Realized gains or losses from security transactions are based on the identified costs of the securities involved. Gains and losses from paydowns on mortgage and asset backed securities are recorded as adjustments to interest income.
Schwab Fixed-Income ETFs | Semiannual Report
Financial Notes, unaudited (continued)
2. Significant Accounting Policies (continued):
(d) Investment Income:
Interest income is recorded as it accrues. If a fund buys a debt security at a discount (less than face value) or a premium (more than face value), it amortizes premiums and accretes discounts from the purchase settlement date up to maturity. The fund then increases (in the case of discounts) or reduces (in the case of premiums) the income it records from the security. Certain securities may be callable (meaning that the issuer has the option to pay it off before its maturity date). The fund amortizes the premium and accretes the discount on each callable security to the security’s maturity date, except when the purchase price is higher than the call price at the security’s call date (in which case the premium is amortized to the call date).
(e) Expenses:
Pursuant to the Amended and Restated Investment Advisory Agreement (Advisory Agreement) between Charles Schwab Investment Management, Inc. (CSIM or the investment adviser) and the trust, the investment adviser will pay the operating expenses of each fund, excluding taxes, any brokerage expenses, and extraordinary or non-routine expenses. Taxes, any brokerage expenses and extraordinary or non-routine expenses that are specific to a fund are charged directly to the fund.
(f) U.S. Treasury, Agency Debt & Agency Mortgage-Backed Securities Charges:
Due to market conditions or other reasons, delivery of U.S. Treasury securities, agency debt and agency mortgage-backed securities may not occur on a timely basis. In these instances, a fund may fail to receive a security purchased causing the fund to be unable to deliver a security sold. The TMPG recommends voluntary fail charges when securities are not delivered as agreed by the parties. These fails charges are included in net realized gains (losses) on each fund’s Statement of Operations, if any.
(g) Distributions to Shareholders:
The funds make distributions from net investment income, if any, monthly and from net realized capital gains, if any, once a year.
(h) Accounting Estimates:
The accounting policies described in this report conform to GAAP. Notwithstanding this, shareholders should understand that in order to follow these principles, fund management has to make estimates and assumptions that affect the information reported in the financial statements. It’s possible that once the results are known, they may turn out to be different from these estimates and these differences may be material.
(i) Federal Income Taxes:
The funds intend to meet federal income and excise tax requirements for regulated investment companies under subchapter M of the Internal Revenue Code, as amended. Accordingly, the funds distribute substantially all of their net investment income and net realized capital gains, if any, to their respective shareholders each year. As long as a fund meets the tax requirements, it is not required to pay federal income tax.
(j) Indemnification:
Under the funds’ organizational documents, the officers and trustees are indemnified against certain liabilities arising out of the performance of their duties to the funds. In addition, in the normal course of business the funds enter into contracts with their vendors and others that provide general indemnifications. The funds’ maximum exposure under these arrangements is unknown as this would involve future claims that may be made against the funds. However, based on experience, the funds expect the risk of loss attributable to these arrangements to be remote.
(k) Recent Accounting Standards:
In March 2017, the Financial Accounting Standards Board issued Accounting Standards Update “Premium Amortization on Purchased Callable Debt Securities” which amends the amortization period for a callable debt security held at a premium from the maturity date to the earliest call date. The guidance is effective for annual periods beginning after December 15, 2018, and interim periods within those annual periods. At this time, management believes these changes will have no impact to the funds.
3. Risk Factors:
Investing in the funds may involve certain risks, as discussed in the funds’ prospectus, including, but not limited to, those described below. Any of these risks could cause an investor to lose money.
Schwab Fixed-Income ETFs | Semiannual Report
Financial Notes, unaudited (continued)
3. Risk Factors (continued):
Market Risk. Financial markets rise and fall in response to a variety of factors, sometimes rapidly and unpredictably. As with any investment whose performance is tied to these markets, the value of an investment in a fund will fluctuate, which means that an investor could lose money over short or long periods.
Investment Style Risk. The funds are index funds. Therefore, the funds follow the securities included in an index during upturns as well as downturns. Because of their indexing strategy, the funds do not take steps to reduce market exposure or to lessen the effects of a declining market. In addition, because of each fund’s expenses, each fund’s performance may be below that of their respective index.
Interest Rate Risk. The funds’ investments in fixed-income securities are subject to the risk that interest rates rise and fall over time. As with any investment whose yield reflects current interest rates, a fund’s yield will change over time. During periods when interest rates are low, a fund’s yield (and total return) also may be low. Changes in interest rates also may affect a fund’s share price: a rise in interest rates could cause a fund’s share price to fall. The longer a fund’s portfolio duration, the more sensitive to interest rate movements its share price is likely to be. A change in a central bank’s monetary policy or improving economic conditions, among other things, may result in an increase in interest rates. The funds are currently subject to heightened levels of interest rate risk because of the continued economic recovery, along with the fact that the Federal Reserve Board ended its quantitative easing program in 2014, and has begun, and may continue, to raise interest rates.
Credit Risk. The funds are subject to the risk that a decline in the credit quality of a portfolio investment could cause the funds to lose money or underperform. The funds could lose money if the issuer or guarantor of a portfolio investment fails to make timely principal or interest payments or otherwise honor its obligations.
Inflation-Protected Security Risk. The value of inflation-protected securities, including TIPS, generally will fluctuate in response to changes in “real” interest rates, generally decreasing when real interest rates rise and increasing when real interest rates fall. Real interest rates represent nominal (or stated) interest rates reduced by the expected impact of inflation. In addition, interest payments on inflation-indexed securities will generally vary up or down along with the rate of inflation.
Sampling Index Tracking Risk. To the extent a fund uses sampling techniques, the fund may not fully replicate the index and may hold securities not included in the index. As a result, a fund will be subject to the risk that the investment adviser’s investment management strategy, the implementation of which is subject to a number of constraints, may not produce the intended results. If a fund uses a sampling approach, it may not track the return of the index as well as it would if a fund purchased all of the securities in its index.
Tracking Error Risk. As index funds, the funds seek to track the performance of an index, although they may not be successful in doing so. The divergence between the performance of a fund and the index, positive or negative, is called “tracking error”. Tracking error can be caused by many factors and it may be significant.
Liquidity Risk. A fund may be unable to sell certain securities, such as illiquid securities, readily at a favorable time or price, or the fund may have to sell them at a loss.
Securities Lending Risk. Securities lending involves the risk of loss of rights in, or delay in recovery of, the loaned securities if the borrower fails to return the security loaned or becomes insolvent.
Market Trading Risk. Although fund shares are listed on national securities exchanges, there can be no assurance that an active trading market for fund shares will develop or be maintained. If an active market is not maintained, investors may find it difficult to buy or sell fund shares.
Mortgage-Backed and Mortgage Pass-Through Securities Risk. With respect to the Schwab U.S. Aggregate Bond ETF, certain of the mortgage-backed securities in which the fund may invest are not backed by the full faith and credit of the U.S. government and there can be no assurance that the U.S. government would provide financial support where it was not obligated to do so. Mortgage-backed securities tend to increase in value less than other debt securities when interest rates decline, but are subject to similar or greater risk of decline in market value during periods of rising interest rates. Transactions in mortgage pass-through securities often occur through TBA transactions, as described in the fund’s prospectus. Default by or bankruptcy of a counterparty to a TBA transaction could expose the fund to possible losses.
Portfolio Turnover Risk. With respect to the Schwab U.S. Aggregate Bond ETF, the fund may engage in frequent trading of its portfolio securities in connection with its tracking of the index, primarily due to the fund rolling over its positions in TBAs as it tracks the portion of the index represented by mortgage-backed securities. A higher portfolio turnover rate may result in increased transaction costs, which may lower the fund’s performance. A higher portfolio turnover rate can also result in an increase in taxable capital gains distributions to the fund’s shareholders.
Schwab Fixed-Income ETFs | Semiannual Report
Financial Notes, unaudited (continued)
3. Risk Factors (continued):
Prepayment and Extension Risk. With respect to the Schwab U.S. Aggregate Bond ETF, certain of the funds’ investments are subject to the risk that the securities may be paid off earlier or later than expected. Either situation could cause a fund to hold securities paying lower-than-market rates of interest, which could hurt a fund’s yield or share price.
Non-U.S. Issuer Risk. The Schwab U.S. Aggregate Bond ETF may invest in U.S.-registered, dollar-denominated bonds of non-U.S. corporations, governments, agencies and supra-national entities to the extent such bonds are included in the fund’s index. The fund’s investments in bonds of non-U.S. issuers may involve certain risks that are greater than those associated with investments in securities of U.S. issuers. These include risks of adverse changes in foreign economic, political, regulatory and other conditions; the imposition of economic sanctions or other government restrictions; differing accounting, auditing, financial reporting and legal standards and practices; differing securities market structures; and higher transaction costs. These risks may be heightened in connection with bonds issued by non-U.S. corporations and entities in emerging markets.
Derivatives Risk. The Schwab U.S. Aggregate Bond ETF may invest in derivatives instruments. The principal types of derivatives used by the fund are futures contracts. A futures contract is an agreement to buy or sell a financial instrument at a specific price on a specific day. The fund’s use of derivative instruments involves risks different from, or possibly greater than, the risks associated with investing directly in securities and other traditional investments. Certain of these risks, such as market risk, credit risk, liquidity risk, and leverage risk are discussed elsewhere in this section. The fund’s use of derivatives is also subject to lack-of-availability risk, valuation risk, correlation risk and tax risk. Lack-of-availability risk is the risk that suitable derivative transactions may not be available in all circumstances for risk management or other purposes. Valuation risk is the risk that a particular derivative may be valued incorrectly. Correlation risk is the risk that changes in the value of the derivative may not correlate perfectly with the underlying asset, rate or index. Tax risk is the risk that the use of derivatives may cause the fund to realize higher amounts of short-term capital gains. A fund’s use of derivatives could reduce the fund’s performance, increase the fund’s volatility, and cause the fund to lose more than the initial amount invested. Furthermore, the use of derivatives subject to regulation by the Commodity Futures Trading Commission (CFTC) could cause the fund to become a commodity pool, which would require the fund to comply with certain CFTC rules.
Leverage Risk. With respect to the Schwab U.S. Aggregate Bond ETF, certain fund transactions, such as TBA transactions or derivatives transactions, may give rise to a form of leverage and may expose the fund to greater risk. Leverage tends to magnify the effect of any decrease or increase in the value of the fund’s portfolio securities. The use of leverage may cause the fund to liquidate portfolio positions when it would not be advantageous to do so in order to satisfy its obligations.
Concentration Risk. With respect to the Schwab U.S. Aggregate Bond ETF, to the extent that the fund’s or an index’s portfolio is concentrated in the securities of issuers in a particular market, industry, group of industries, sector or asset class, the fund may be adversely affected by the performance of those securities, may be subject to increased price volatility and may be more vulnerable to adverse economic, market, political or regulatory occurrences affecting that market, industry, group of industries, sector or asset class.
Operational Risk. The funds are exposed to operational risk arising from a number of factors, including, but not limited to, human error, processing and communication errors, errors of a fund’s service providers, counterparties or other third parties, failed or inadequate processes and technology or system failures. The funds seek to reduce these operational risks through controls and procedures believed to be reasonably designed to address these risks. However, these controls and procedures cannot address every possible risk and may not fully mitigate the risks that they are intended to address.
Shares of the Fund May Trade at Prices Other Than NAV. Fund shares may be bought and sold in the secondary market at market prices. Although it is expected that the market price of the shares of a fund will approximate the fund’s NAV, there may be times when the market price and the NAV vary significantly. An investor may pay more than NAV when buying shares of a fund in the secondary market, and an investor may receive less than NAV when selling those shares in the secondary market. The market price of the fund shares may deviate, sometimes significantly, from NAV during periods of market volatility.
Please refer to the funds’ prospectus for a more complete description of the principal risks of investing in the funds.
4. Affiliates and Affiliated Transactions:
Investment Adviser
CSIM, a wholly owned subsidiary of The Charles Schwab Corporation, serves as each fund’s investment adviser pursuant to the Advisory Agreement between CSIM and the trust.
Schwab Fixed-Income ETFs | Semiannual Report
Financial Notes, unaudited (continued)
4. Affiliates and Affiliated Transactions (continued):
For its advisory services to the funds, CSIM is entitled to receive an annual fee, payable monthly, based on a percentage of each fund’s average daily net assets as follows:
Schwab
U.S. TIPS ETF | Schwab
Short-Term
U.S. Treasury ETF | Schwab
Intermediate-Term
U.S. Treasury ETF | Schwab
U.S. Aggregate
Bond ETF |
| 0.05% | 0.06% | 0.06% | 0.04% |
In addition, advisory fees for each fund will cover interest expense.
Investment from Affiliates
Certain funds in the Fund Complex (for definition refer to Trustees and Officers section) may own shares of other funds in the Fund Complex. The table below reflects the percentages of shares of each fund in this report that are owned by other funds in the Fund Complex as of June 30, 2018, as applicable:
| | Underlying Funds | | |
| | Schwab
U.S. TIPS ETF | Schwab
Short-Term
U.S. Treasury ETF | Schwab
U.S. Aggregate
Bond ETF |
| Schwab Target 2010 Index Fund | 0.0%* | 0.1% | 0.1% |
| Schwab Target 2015 Index Fund | 0.0%* | 0.1% | 0.2% |
| Schwab Target 2020 Index Fund | 0.1% | 0.2% | 0.6% |
| Schwab Target 2025 Index Fund | 0.0%* | 0.1% | 0.6% |
| Schwab Target 2030 Index Fund | -% | 0.1% | 0.7% |
| Schwab Target 2035 Index Fund | -% | 0.0%* | 0.3% |
| Schwab Target 2040 Index Fund | -% | 0.0%* | 0.2% |
| Schwab Target 2045 Index Fund | -% | 0.0%* | 0.1% |
| Schwab Target 2050 Index Fund | -% | 0.0%* | 0.1% |
| Schwab Target 2055 Index Fund | -% | 0.0%* | 0.0%* |
| Schwab Target 2060 Index Fund | -% | 0.0%* | 0.0%* |
| Schwab VIT Balanced Portfolio | 0.0%* | -% | 0.4% |
| Schwab VIT Balanced with Growth Portfolio | 0.1% | -% | 0.8% |
| Schwab VIT Growth Portfolio | 0.0%* | -% | 0.4% |
* Less than 0.05%
Interfund Borrowing and Lending
Pursuant to an exemptive order issued by the SEC, the funds may enter into interfund borrowing and lending transactions with other funds in the Fund Complex (for definition refer to Trustees and Officers section). All loans are for temporary or emergency purposes and the interest rate to be charged will be the average of the overnight repurchase agreement rate and the short-term bank loan rate. All loans are subject to numerous conditions designed to ensure fair and equitable treatment of all participating funds/portfolios. The interfund lending facility is subject to the oversight and periodic review of the Board. The funds had no interfund borrowing or lending activity during the period.
5. Other Service Providers:
SEI Investments Distribution Co. is the principal underwriter and distributor of shares of the funds.
State Street Bank and Trust Company (State Street) serves as the funds’ transfer agent. As part of these services, the transfer agent maintains records pertaining to the sale, redemption and transfer of the funds’ shares.
State Street also serves as custodian and accountant for the funds. The custodian is responsible for the daily safekeeping of securities and cash held by the funds. The funds’ accountant maintains all books and records related to the funds’ transactions.
Schwab Fixed-Income ETFs | Semiannual Report
Financial Notes, unaudited (continued)
6. Board of Trustees:
The Board may include people who are officers and/or directors of CSIM or its affiliates. Federal securities law limits the percentage of such “interested persons” who may serve on a trust’s board, and the trust was in compliance with these limitations throughout the report period. The trust does not pay any interested or non-interested trustees (independent trustees). The independent trustees are paid by CSIM. For information regarding the trustees, please refer to the Trustees and Officers table at the end of this report.
7. Borrowing from Banks:
During the period, the funds were participants with other U.S. registered investment companies managed by CSIM in a joint, syndicated, committed $605 million line of credit (the Syndicated Credit Facility), maturing on October 4, 2018. Under the terms of the Syndicated Credit Facility, in addition to CSIM paying the interest charged on any borrowings by a fund, CSIM paid a commitment fee of 0.15% per annum on its proportionate share of the unused portion of the Syndicated Credit Facility.
During the period, the funds were participants with other U.S. registered investment companies managed by CSIM in a joint, unsecured, uncommitted $500 million line of credit (the Uncommitted Credit Facility), with State Street Bank and Trust Company, which matures on November 30, 2018. Under the terms of the Uncommitted Credit Facility, CSIM pays interest on the amount a fund borrows. There were no borrowings from either line of credit during the period.
The funds also have access to custodian overdraft facilities. A fund may have utilized the overdraft facility and incurred an interest expense, which is disclosed on the fund’s Statement of Operations, if any. Where applicable, CSIM paid any interest expense charged. The interest expense is determined based on a negotiated rate above the current Federal Funds Rate.
8. Purchases and Sales/Maturities of Investment Securities:
For the period ended June 30, 2018, purchases and sales of securities (excluding in-kind transactions and short-term obligations) were as follows:
| | Purchases of Long-Term
U.S. Government Securities* | Purchases of Other
Long-Term Securities | Total Purchases of
Long-Term Securities |
| Schwab U.S. TIPS ETF | $447,234,479 | $— | $447,234,479 |
| Schwab Short-Term U.S. Treasury ETF | 817,058,363 | — | 817,058,363 |
| Schwab Intermediate-Term U.S. Treasury ETF | 380,862,629 | — | 380,862,629 |
| Schwab U.S. Aggregate Bond ETF | 2,151,090,924 | 386,237,951 | 2,537,328,875 |
| | Sales/Maturities of
Long-Term
U.S. Government
Securities | Sales/Maturities of
Other Long-Term Securities | Total Sales/Maturities of
Long-Term Securities |
| Schwab U.S. TIPS ETF | $334,465,581 | $— | $334,465,581 |
| Schwab Short-Term U.S. Treasury ETF | 736,727,845 | — | 736,727,845 |
| Schwab Intermediate-Term U.S. Treasury ETF | 275,836,896 | — | 275,836,896 |
| Schwab U.S. Aggregate Bond ETF | 1,867,660,464 | 273,677,234 | 2,141,337,698 |
*Includes securities guaranteed by U.S. Government Agencies.
9. In-Kind Transactions:
The consideration for the purchase of Creation Units of a fund often consists of the in-kind deposit of a designated portfolio of fixed-income securities, which constitutes an optimized representation of the securities involved in a relevant fund’s underlying index, and an amount of cash. Due to the composition of the portfolio of the Schwab U.S. Aggregate Bond ETF, consideration for the subscription and redemption of Creation Units generally is cash. Investors purchasing and redeeming Creation Units are subject to a standard creation transaction fee and a standard redemption transaction fee paid to the custodian to offset transfer and other transaction costs associated with the issuance and redemption of Creation Units. Purchasers and redeemers of Creation Units for
Schwab Fixed-Income ETFs | Semiannual Report
Financial Notes, unaudited (continued)
9. In-Kind Transactions (continued):
cash are subject to an additional variable charge paid to the fund that will offset the transaction costs to the fund of buying or selling portfolio securities. In addition, purchasers and redeemers of shares in Creation Units are responsible for payment of the costs of transferring securities to or out of the fund. From time to time, CSIM may cover the cost of any transaction fees when believed to be in the best interests of the fund.
The in-kind transactions for the period ended June 30, 2018, were as follows:
| | In-Kind Purchases
of Securities | In-Kind Sales
of Securities |
| Schwab U.S. TIPS ETF | $2,543,457,760 | $97,740,657 |
| Schwab Short-Term U.S. Treasury ETF | 533,860,226 | 160,380,409 |
| Schwab Intermediate-Term U.S. Treasury ETF | 1,539,037,648 | 17,834,196 |
| Schwab U.S. Aggregate Bond ETF | — | — |
For the period ended June 30, 2018, the funds (except for the Schwab U.S. Aggregate Bond ETF) realized net capital gains or losses resulting from in-kind redemptions of Creation Units. Because such gains or losses are not taxable to the funds and are not distributed to existing fund shareholders, the gains or losses are reclassified from accumulated net realized gains or losses to capital received from investors at the end of the funds’ tax year. These reclassifications have no effect on net assets or net asset values per share. The net realized in-kind gains or losses for the period ended June 30, 2018 are disclosed in the funds’ Statements of Operations, if any.
10. Federal Income Taxes
As of June 30, 2018, the tax basis cost of the funds’ investments and gross unrealized appreciation and depreciation were as follows:
| | Schwab
U.S. TIPS ETF | | Schwab
Short-Term
U.S. Treasury ETF | | Schwab
Intermediate-Term
U.S. Treasury ETF | | Schwab
U.S. Aggregate
Bond ETF |
| Tax cost | $5,478,726,200 | | $2,636,556,196 | | $2,800,834,002 | | $5,490,178,869 |
| Gross unrealized appreciation | $— | | $— | | $— | | $3,302,048 |
| Gross unrealized depreciation | (45,893,067) | | (28,674,228) | | (43,905,341) | | (130,460,154) |
| Net unrealized appreciation (depreciation) | ($45,893,067) | | ($28,674,228) | | ($43,905,341) | | ($127,158,106) |
Capital loss carryforwards may be used to offset future realized capital gains for federal income tax purposes. As of December 31, 2017, the funds had capital loss carryforwards available to offset future net capital gains before the expiration dates as follows:
| Expiration Date | Schwab
U.S. TIPS ETF | | Schwab
Short-Term
U.S. Treasury ETF | | Schwab
Intermediate-Term
U.S. Treasury ETF | | Schwab
U.S. Aggregate
Bond ETF |
| December 31, 2018 | $39 | | $366 | | $2,072 | | $— |
| No expiration | 11,922,565 | | 5,054,535 | | 4,271,118 | | 16,118,177 |
| Total | $11,922,604 | | $5,054,901 | | $4,273,190 | | $16,118,177 |
As of December 31, 2017, management has reviewed the tax positions for open periods (for federal purposes, three years from the date of filing and for state purposes, four years from the date of filing) as applicable to the funds, and has determined that no provision for income tax is required in the funds’ financial statements. The funds recognize interest and penalties, if any, related to unrecognized tax benefits as income tax expense in the Statement of Operations. During the period ended December 31, 2017, the funds did not incur any interest or penalties.
11. Subsequent Events:
Management has determined there are no subsequent events or transactions through the date the financial statements were issued that would have materially impacted the financial statements as presented.
Schwab Fixed-Income ETFs | Semiannual Report
Investment Advisory Agreement Approval
The Investment Company Act of 1940 (the 1940 Act) requires that the continuation of a fund’s investment advisory agreement must be specifically approved (1) by the vote of the trustees or by a vote of the shareholders of the fund, and (2) by the vote of a majority of the trustees who are not parties to the investment advisory agreement or “interested persons” of any party (the Independent Trustees), cast in person at a meeting called for the purpose of voting on such approval. In connection with such approvals, the fund’s trustees must request and evaluate, and the investment adviser is required to furnish, such information as may be reasonably necessary to evaluate the terms of the investment advisory agreement.
The Board of Trustees (the Board or the Trustees, as appropriate) calls and holds one or more meetings each year that are dedicated, in whole or in part, to considering whether to renew the investment advisory agreement (the Agreement) between Schwab Strategic Trust (the Trust) and Charles Schwab Investment Management, Inc. (CSIM) with respect to the existing funds in the Trust, including Schwab U.S. TIPS ETF, Schwab Short-Term U.S. Treasury ETF, Schwab Intermediate-Term U.S. Treasury ETF and Schwab U.S. Aggregate Bond ETF (the Funds), and to review certain other agreements pursuant to which CSIM provides investment advisory services to certain other registered investment companies. In preparation for the meeting(s), the Board requests and reviews a wide variety of materials provided by CSIM, including information about affiliates, personnel, business goals and priorities, profitability, third-party oversight, corporate structure and operations. The Board also receives data provided by an independent provider of investment company data. This information is in addition to the detailed information about the Fund that the Board reviews during the course of each year, including information that relates to the Funds’ operations and performance, legal and compliance matters, risk management, portfolio turnover, and sales and marketing activity. The Independent Trustees receive advice from Independent Trustees’ legal counsel, including a memorandum regarding the responsibilities of trustees for the approval of investment advisory agreements. In addition, the Independent Trustees meet in executive session outside the presence of Fund management and participate in question and answer sessions with representatives of CSIM.
The Board, including a majority of the Independent Trustees, considered information specifically relating to its consideration of the continuance of the Agreement with respect to the Funds at meetings held on April 26, 2018 and June 5, 2018, and approved the renewal of the Agreement with respect to the Funds for an additional one-year term at the meeting held on June 5, 2018. The Board’s approval of the Agreement with respect to the Funds was based on consideration and
evaluation of a variety of specific factors discussed at these meetings and at prior meetings, including:
| 1. | the nature, extent and quality of the services provided to the Funds under the Agreement, including the resources of CSIM and its affiliates dedicated to the Funds; |
| 2. | each Fund’s investment performance and how it compared to that of certain other comparable exchange-traded funds; |
| 3. | each Fund’s expenses and how those expenses compared to those of certain other comparable exchange-traded funds; |
| 4. | the profitability of CSIM and its affiliates, including Charles Schwab & Co., Inc. (Schwab), with respect to the Funds, including both direct and indirect benefits accruing to CSIM and its affiliates; and |
| 5. | the extent to which economies of scale would be realized as the Funds grow and whether fee levels in the Agreement reflect those economies of scale for the benefit of Fund investors. |
Nature, Extent and Quality of Services. The Board considered the nature, extent and quality of the services provided by CSIM to the Funds and the resources of CSIM and its affiliates dedicated to the Funds. In this regard, the Trustees evaluated, among other things, CSIM’s experience, track record, compliance program, resources dedicated to hiring and retaining qualified personnel, and information security resources. The Trustees also considered information provided by CSIM relating to the Funds’ portfolio management team, portfolio strategy and risk oversight structure, and internal investment guidelines. The Trustees also considered investments in CSIM’s infrastructure. The Trustees also considered Schwab’s reputation in connection with the OneSource exchange-traded fund offering and its overall financial condition. Following such evaluation, the Board concluded, within the context of its full deliberations, that the nature, extent and quality of services provided by CSIM to the Funds and the resources of CSIM and its affiliates dedicated to the Funds supported renewal of the Agreement with respect to the Funds.
Fund Performance. The Board considered each Fund’s performance in determining whether to renew the Agreement with respect to the Fund. Specifically, the Trustees considered each Fund’s performance relative to a peer category of other exchange-traded funds and applicable indices/benchmarks, in light of total return, yield, if applicable, and market trends. As part of this review, the Trustees considered the composition of the peer category and the selection criteria. In evaluating the performance of the Funds, the Trustees considered the risk profile for such Fund and the appropriateness of the benchmark used to compare the performance of the Fund. The
Schwab Fixed-Income ETFs | Semiannual Report
Trustees further considered the level of Fund performance in the context of their review of Fund expenses and adviser profitability discussed below and also noted that performance is reviewed throughout the year by a designated committee of the Board and by the Board. Following such evaluation the Board concluded, within the context of its full deliberations, that the performance of the Fund supported renewal of the Agreement with respect to the Funds.
Fund Expenses. With respect to the Funds’ expenses, the Trustees considered the rate of compensation called for by the Agreement and each Fund’s operating expense ratio, in each case in comparison to those of other comparable exchange-traded funds, such peer groups and comparisons. The Trustees also considered fees charged by CSIM to mutual funds that it manages. Following such evaluation, the Board concluded, within the context of its full deliberations, that the expenses of each Fund are reasonable and supported renewal of the Agreement with respect to the Funds.
Profitability. The Trustees considered the compensation flowing to CSIM and its affiliates, directly or indirectly and reviewed profitability on a pre-tax basis, without regard to distribution expenses. In this connection, the Trustees reviewed management’s profitability analyses. The Trustees also reviewed profitability of CSIM relating to the Schwab fund complex as a whole, noting the benefit to Fund shareholders of being part of the Schwab fund complex, including the allocations of certain fixed costs across other funds in the complex. The Trustees also considered any other benefits derived by CSIM from its relationship with the Funds, such as
whether, by virtue of its management of the Funds, CSIM obtains investment information or other research resources that aid it in providing advisory services to other clients. The Trustees considered whether the varied levels of compensation and profitability with respect to the Funds under the Agreement and other service agreements were reasonable and justified in light of the quality of all services rendered to the Funds by CSIM and its affiliates. Based on this evaluation, the Board concluded, within the context of its full deliberations, that the profitability of CSIM is reasonable and supported renewal of the Agreement with respect to the Funds.
Economies of Scale. The Trustees considered the existence of any economies of scale and whether those are passed along to the Funds’ shareholders by way of the relatively low advisory fee and unitary fee structure of the Funds. Based on this evaluation, the Board concluded, within the context of its full deliberations, that each Fund obtains reasonable benefit from economies of scale.
In the course of their deliberations, the Trustees did not identify any particular information or factor that was all important or controlling. Based on the Trustees’ deliberation and their evaluation of the information described above, the Board, including all of the Independent Trustees, approved the continuation of the Agreement with respect to the Funds and concluded that the compensation under the Agreement with respect to the Funds is fair and reasonable in light of such services and expenses and such other matters as the Trustees have considered to be relevant in the exercise of their reasonable judgment.
Schwab Fixed-Income ETFs | Semiannual Report
Trustees and Officers
The tables below give information about the trustees and officers for the Schwab Strategic Trust, which includes the funds covered in this report. The “Fund Complex” includes The Charles Schwab Family of Funds, Schwab Capital Trust, Schwab Investments, Schwab Annuity Portfolios, Schwab Strategic Trust and Laudus Trust. The Fund Complex includes 107 funds.
The address for all trustees and officers is 211 Main Street, San Francisco, CA 94105. You can find more information about the trustees and officers in the Statement of Additional Information, which is available free by calling 1-877-824-5615.
| Independent Trustees |
Name, Year of Birth, and
Position(s) with the trust
(Terms of office, and
length of Time Served1) | Principal Occupations
During the Past Five Years | Number of
Portfolios in
Fund Complex
Overseen by
the Trustee | Other Directorships |
Robert W. Burns
1959
Trustee
(Trustee of Schwab Strategic Trust since 2009; The Charles Schwab Family of Funds, Schwab Investments, Schwab Capital Trust, Schwab Annuity Portfolios and Laudus Trust since 2016) | Retired/Private Investor (Jan. 2009 – present). Formerly, Managing Director, Pacific Investment Management Company, LLC (PIMCO) (investment management firm) and President, PIMCO Funds. | 107 | Director, PS Business Parks, Inc. (2005 – 2012) |
John F. Cogan
1947
Trustee
(Trustee of The Charles Schwab Family of Funds, Schwab Investments, Schwab Capital Trust and Schwab Annuity Portfolios since 2008; Laudus Trust since 2010; Schwab Strategic Trust since 2016) | Senior Fellow, The Hoover Institution at Stanford University (public policy think tank) (Oct. 1979 – present); Senior Fellow, Stanford Institute for Economic Policy Research (2000 – present); Professor of Public Policy, Stanford University (1994 – 2015). | 107 | Director, Gilead Sciences, Inc. (2005 – present) |
Nancy F. Heller
1956
Trustee
(Trustee of The Charles Schwab Family of Funds, Schwab Investments, Schwab Capital Trust, Schwab Annuity Portfolios, Schwab Strategic Trust and Laudus Trust since 2018) | President and Chairman, TIAA Charitable (financial services) (2014 – 2016); Senior Managing Director, TIAA (financial services) (2003 – 2016). | 107 | None |
Stephen Timothy Kochis
1946
Trustee
(Trustee of Schwab Strategic Trust since 2012; The Charles Schwab Family of Funds, Schwab Investments, Schwab Capital Trust, Schwab Annuity Portfolios and Laudus Trust since 2016) | CEO and Owner, Kochis Global (wealth management consulting) (May 2012 – present); Chairman and CEO, Aspiriant, LLC (wealth management) (Jan. 2008 – Apr. 2012). | 107 | None |
Schwab Fixed-Income ETFs | Semiannual Report
| Independent Trustees (continued) |
Name, Year of Birth, and
Position(s) with the trust
(Terms of office, and
length of Time Served1) | Principal Occupations
During the Past Five Years | Number of
Portfolios in
Fund Complex
Overseen by
the Trustee | Other Directorships |
David L. Mahoney
1954
Trustee
(Trustee of The Charles Schwab Family of Funds, Schwab Investments, Schwab Capital Trust, Schwab Annuity Portfolios and Laudus Trust since 2011; Schwab Strategic Trust since 2016) | Private Investor. | 107 | Director, Symantec Corporation (2003 – present)
Director, Corcept Therapeutics Incorporated (2004 – present)
Director, Adamas Pharmaceuticals, Inc. (2009 – present) |
Kiran M. Patel
1948
Trustee
(Trustee of The Charles Schwab Family of Funds, Schwab Investments, Schwab Capital Trust, Schwab Annuity Portfolios and Laudus Trust since 2011; Schwab Strategic Trust since 2016) | Retired. Executive Vice President and General Manager of Small Business Group, Intuit, Inc. (financial software and services firm for consumers and small businesses) (Dec. 2008 – Sept. 2013). | 107 | Director, KLA-Tencor Corporation (2008 – present) |
Kimberly S. Patmore
1956
Trustee
(Trustee of The Charles Schwab Family of Funds, Schwab Investments, Schwab Capital Trust, Schwab Annuity Portfolios, Schwab Strategic Trust and Laudus Trust since 2016) | Consultant, Patmore Management Consulting (management consulting) (2008 – present). | 107 | None |
Gerald B. Smith
1950
Trustee
(Trustee of The Charles Schwab Family of Funds, Schwab Investments, Schwab Capital Trust and Schwab Annuity Portfolios since 2000; Laudus Trust since 2010; Schwab Strategic Trust since 2016) | Chairman, Chief Executive Officer and Founder of Smith Graham & Co. (investment advisors) (Mar. 1990 – present). | 107 | Director, Eaton (2012 – present)
Director and Chairman of the Audit Committee, Oneok Partners LP (2003 – 2013)
Director, Oneok, Inc. (2009 – 2013)
Lead Independent Director, Board of Cooper Industries (2002 – 2012) |
Joseph H. Wender
1944
Trustee
(Trustee of The Charles Schwab Family of Funds, Schwab Investments, Schwab Capital Trust and Schwab Annuity Portfolios since 2008; Laudus Trust since 2010; Schwab Strategic Trust since 2016) | Senior Consultant, Goldman Sachs & Co., Inc. (investment banking and securities firm) (Jan. 2008 – present); Co-CEO, Colgin Cellars, LLC (vineyards) (Feb. 1998 – present). | 107 | Board Member and Chairman of the Audit Committee, Ionis Pharmaceuticals (1994 – present)
Lead Independent Director and Chair of Audit Committee, OUTFRONT Media Inc. (2014 – present) |
Schwab Fixed-Income ETFs | Semiannual Report
| Interested Trustees |
Name, Year of Birth, and
Position(s) with the trust
(Terms of office, and
length of Time Served1) | Principal Occupations
During the Past Five Years | Number of
Portfolios in
Fund Complex
Overseen by
the Trustee | Other Directorships |
Walter W. Bettinger II2
1960
Chairman and Trustee
(Trustee of The Charles Schwab Family of Funds, Schwab Investments, Schwab Capital Trust and Schwab Annuity Portfolios since 2008; Schwab Strategic Trust since 2009; Laudus Trust since 2010) | Director, President and Chief Executive Officer, The Charles Schwab Corporation (Oct. 2008 – present); President and Chief Executive Officer (Oct. 2008 – present), Director (May 2008 – present), Charles Schwab & Co., Inc.; Director, Charles Schwab Bank (Apr. 2006 – present); Director (May 2008 – present), President and Chief Executive Officer (Aug. 2017 – present), Schwab Holdings, Inc.; and Director, Charles Schwab Investment Management, Inc. (July 2016 – present). | 107 | Director, The Charles Schwab Corporation (2008 – present) |
Marie A. Chandoha2
1961
Trustee
(Trustee of The Charles Schwab Family of Funds, Schwab Investments, Schwab Capital Trust, Schwab Annuity Portfolios, Schwab Strategic Trust and Laudus Trust since 2016) | Director, President and Chief Executive Officer (Dec. 2010 – present), Chief Investment Officer (Sept. 2010 – Oct. 2011), Charles Schwab Investment Management, Inc.; Trustee (Jan. 2016 – present), President, Chief Executive Officer (Dec. 2010 – present), and Chief Investment Officer (Sept. 2010 – Oct. 2011), Schwab Funds, Laudus Funds and Schwab ETFs; Director, Charles Schwab Worldwide Funds plc and Charles Schwab Asset Management (Ireland) Limited (Jan. 2011 – present); Global Head of Fixed Income Business Division, BlackRock, Inc. (formerly Barclays Global Investors) (investment management firm) (Mar. 2007 – Aug. 2010). | 107 | None |
Joseph R. Martinetto2
1962
Trustee
(Trustee of The Charles Schwab Family of Funds, Schwab Investments, Schwab Capital Trust, Schwab Annuity Portfolios, Schwab Strategic Trust and Laudus Trust since 2016) | Chief Operating Officer (Feb. 2018 – present), Senior Executive Vice President (July 2015 – Feb. 2018), The Charles Schwab Corporation; Senior Executive Vice President, Charles Schwab & Co., Inc. (July 2015 – present); Chief Financial Officer (July 2015 – Aug. 2017), Executive Vice President and Chief Financial Officer (May 2007 – July 2015), The Charles Schwab Corporation and Charles Schwab & Co., Inc.; Director, Charles Schwab & Co., Inc. (May 2007 – present); Director (Apr. 2010 – present) and Chief Executive Officer (July 2013 – Apr. 2015), Charles Schwab Bank; Director (May 2007 – present), Chief Financial Officer (May 2007 – Aug. 2017), Senior Executive Vice President (Feb. 2016 – present), and Executive Vice President (May 2007 – Feb. 2016), Schwab Holdings, Inc. | 107 | None |
| Officers of the Trust |
Name, Year of Birth, and Position(s) with the trust
(Terms of office, and length of Time Served3) | Principal Occupations During the Past Five Years |
Marie A. Chandoha
1961
President and Chief Executive Officer
(Officer of The Charles Schwab Family of Funds, Schwab Investments, Schwab Capital Trust, Schwab Annuity Portfolios, Schwab Strategic Trust and Laudus Trust since 2010) | Director, President and Chief Executive Officer (Dec. 2010 – present), Chief Investment Officer (Sept. 2010 – Oct. 2011), Charles Schwab Investment Management, Inc.; Trustee (Jan. 2016 – present), President, Chief Executive Officer (Dec. 2010 – present), and Chief Investment Officer (Sept. 2010 – Oct. 2011), Schwab Funds, Laudus Funds and Schwab ETFs; Director, Charles Schwab Worldwide Funds plc and Charles Schwab Asset Management (Ireland) Limited (Jan. 2011 – present); Global Head of Fixed Income Business Division, BlackRock, Inc. (formerly Barclays Global Investors) (investment management firm) (Mar. 2007 – Aug. 2010). |
Schwab Fixed-Income ETFs | Semiannual Report
| Officers of the Trust (continued) |
Name, Year of Birth, and Position(s) with the trust
(Terms of office, and length of Time Served3) | Principal Occupations During the Past Five Years |
Mark Fischer
1970
Treasurer and Chief Financial Officer
(Officer of The Charles Schwab Family of Funds, Schwab Investments, Schwab Capital Trust, Schwab Annuity Portfolios, Schwab Strategic Trust and Laudus Trust since 2013) | Treasurer and Chief Financial Officer, Schwab Funds, Laudus Funds and Schwab ETFs (Jan. 2016 – present); Assistant Treasurer, Schwab Funds and Laudus Funds (Dec. 2013 – Dec. 2015), Schwab ETFs (Nov. 2013 – Dec. 2015); Vice President, Charles Schwab Investment Management, Inc. (Oct. 2013 – present); Executive Director, J.P. Morgan Investor Services (Apr. 2011 – Sept. 2013); Assistant Treasurer, Massachusetts Financial Service Investment Management (May 2005 – Mar. 2011). |
George Pereira
1964
Senior Vice President and Chief Operating Officer
(Officer of The Charles Schwab Family of Funds, Schwab Investments, Schwab Capital Trust and Schwab Annuity Portfolios since 2004; Laudus Trust since 2006; Schwab Strategic Trust since 2009) | Senior Vice President and Chief Financial Officer (Nov. 2004 – present), Chief Operating Officer (Jan. 2011 – present), Charles Schwab Investment Management, Inc.; Senior Vice President and Chief Operating Officer (Jan. 2016 – present), Treasurer and Chief Financial Officer, Laudus Funds (June 2006 – Dec. 2015); Treasurer and Principal Financial Officer, Schwab Funds (Nov. 2004 – Dec. 2015) and Schwab ETFs (Oct. 2009 – Dec. 2015); Director, Charles Schwab Worldwide Funds plc and Charles Schwab Asset Management (Ireland) Limited (Apr. 2005 – present). |
Omar Aguilar
1970
Senior Vice President and Chief Investment Officer – Equities and Multi-Asset Strategies
(Officer of The Charles Schwab Family of Funds, Schwab Investments, Schwab Capital Trust, Schwab Annuity Portfolios, Schwab Strategic Trust and Laudus Trust since 2011) | Senior Vice President and Chief Investment Officer – Equities and Multi-Asset Strategies, Charles Schwab Investment Management, Inc. (Apr. 2011 – present); Senior Vice President and Chief Investment Officer – Equities, Schwab Funds, Laudus Funds and Schwab ETFs (June 2011 – present); Head of the Portfolio Management Group and Vice President of Portfolio Management, Financial Engines, Inc. (investment management firm) (May 2009 – Apr. 2011); Head of Quantitative Equity, ING Investment Management (July 2004 – Jan. 2009). |
Brett Wander
1961
Senior Vice President and Chief Investment Officer – Fixed Income
(Officer of The Charles Schwab Family of Funds, Schwab Investments, Schwab Capital Trust, Schwab Annuity Portfolios, Schwab Strategic Trust and Laudus Trust since 2011) | Senior Vice President and Chief Investment Officer – Fixed Income, Charles Schwab Investment Management, Inc. (Apr. 2011 – present); Senior Vice President and Chief Investment Officer – Fixed Income, Schwab Funds, Laudus Funds and Schwab ETFs (June 2011 – present); Senior Managing Director, Global Head of Active Fixed-Income Strategies, State Street Global Advisors (Jan. 2008 – Oct. 2010); Director of Alpha Strategies Loomis, Sayles & Company (investment management firm) (Apr. 2006 – Jan. 2008). |
David Lekich
1964
Chief Legal Officer and Secretary, Schwab Funds and Schwab ETFs
Vice President and Assistant Clerk, Laudus Funds
(Officer of The Charles Schwab Family of Funds, Schwab Investments, Schwab Capital Trust, Schwab Annuity Portfolios, Schwab Strategic Trust and Laudus Trust since 2011) | Senior Vice President (Sept. 2011 – present), Vice President (Mar. 2004 – Sept. 2011), Charles Schwab & Co., Inc.; Senior Vice President and Chief Counsel (Sept. 2011 – present), Vice President (Jan. 2011 – Sept. 2011), Charles Schwab Investment Management, Inc.; Secretary (Apr. 2011 – present) and Chief Legal Officer (Dec. 2011 – present), Schwab Funds; Vice President and Assistant Clerk, Laudus Funds (Apr. 2011 – present); Secretary (May 2011 – present) and Chief Legal Officer (Nov. 2011 – present), Schwab ETFs. |
Catherine MacGregor
1964
Vice President and Assistant Secretary, Schwab Funds and Schwab ETFs
Chief Legal Officer, Vice President and Clerk, Laudus Funds
(Officer of The Charles Schwab Family of Funds, Schwab Investments, Schwab Capital Trust, Schwab Annuity Portfolios and Laudus Trust since 2005; Schwab Strategic Trust since 2009) | Vice President, Charles Schwab & Co., Inc., Charles Schwab Investment Management, Inc. (July 2005 – present); Vice President (Dec. 2005 – present), Chief Legal Officer and Clerk (Mar. 2007 – present), Laudus Funds; Vice President (Nov. 2005 – present) and Assistant Secretary (June 2007 – present), Schwab Funds; Vice President and Assistant Secretary, Schwab ETFs (Oct. 2009 – present). |
| 1 | Each Trustee shall hold office until the election and qualification of his or her successor, or until he or she dies, resigns or is removed. The retirement policy requires that each independent trustee retire by December 31 of the year in which the Trustee turns 74 or the Trustee’s twentieth year of service as an independent trustee on any trust in the Fund Complex, whichever occurs first. |
| 2 | Mr. Bettinger, Ms. Chandoha and Mr. Martinetto are Interested Trustees. Mr. Bettinger is an Interested Trustee because he owns stock of The Charles Schwab Corporation (CSC), the parent company of Charles Schwab Investment Management, Inc. (CSIM), the investment adviser for the trusts in the Fund Complex, is an employee and director of Charles Schwab & Co., Inc. (CS&Co), the principal underwriter for The Charles Schwab Family of Funds, Schwab Investments, Schwab Capital Trust and Schwab Annuity Portfolios, and is a director of CSIM. Ms. Chandoha is an Interested Trustee because she owns stock of CSC and is an employee and director of CSIM. Mr. Martinetto is an Interested Trustee because he owns stock of CSC and is an employee and director of CS&Co. |
| 3 | The President, Treasurer and Secretary/Clerk hold office until their respective successors are chosen and qualified or until he or she sooner dies, resigns, is removed or becomes disqualified. Each of the other officers serves at the pleasure of the Board. |
Schwab Fixed-Income ETFs | Semiannual Report
ask See “offer.”
asset allocation The practice of dividing a portfolio among different asset classes, with each asset class assigned a particular percentage to help offset risks and rewards, based on your goals, time horizon and risk tolerance.
asset-backed securities Bond or other debt securities that represent ownership in a pool of assets such as credit card debt.
asset class A group of securities with similar structure and basic characteristics. Stocks, bonds and cash are the three main examples of asset classes.
authorized participant (AP) A large institutional investor that places orders for creation units with the funds’ distributor.
Bloomberg Barclays US Aggregate Bond Index An index that represents securities that are SEC registered, taxable, and dollar denominated. The index covers the U.S. investment grade fixed rate bond market, with index components for government and corporate securities, mortgage pass-through securities, and asset-backed securities. The index excludes certain types of securities, including state and local government series bonds, structured notes embedded with swaps or other special features, private placements, floating rate securities, inflation-linked bonds and Eurobonds.
Bloomberg Barclays US Treasury 1 – 3 Year Index An index that includes all publicly-issued U.S. Treasury securities that have a remaining maturity of greater than or equal to one year and less than three years, are rated investment grade, and have $250 million or more of outstanding face value.
Bloomberg Barclays US Treasury 3 – 10 Year Index An index that measures the performance of U.S. Treasury securities that have a remaining maturity of greater than or equal to three years but less than 10 years, are rated investment grade and have $250 million or more of outstanding face value.
Bloomberg Barclays US Treasury Inflation-Linked Bond Index (Series-L) An index that tracks inflation-protected securities issued by the U.S. Treasury that have at least one year remaining to maturity, are rated investment grade, and have $250 million or more of outstanding face value.
bid The highest price at which someone is willing to buy a security.
bond A security representing a loan from the investor to the issuer. A bond typically pays interest at a fixed rate (the “coupon rate”) until a specified date (the “maturity date”), at which time the issuer returns the money borrowed (“principal” or “face value”) to the bondholder. Because of their structure, bonds are sometimes called “fixed income securities” or “debt securities.”
call An early repayment of a bond’s principal by the issuer, usually done because the issuer is able to refinance its bond debt at a lower rate.
call protection A term used in reference to a bond that cannot be called by the issuer before maturity, or at least for many years from the present date. A bond that offers call protection can more reliably be expected to provide a given yield over a given number of years than a bond that could be called (assuming both bonds are of the same credit quality).
capital gain, capital loss The difference between the amount paid for an investment and its value at a later time. If the investment has been sold, the capital gain or loss is considered a realized gain or loss. If the investment is still held, the gain or loss is still “on paper” and is considered unrealized.
commencement of operations The date that the first NAV was calculated.
coupon, coupon rate The annual rate of interest paid until maturity by the issuer of a debt security.
creation unit (C.U.) A basket of securities that is delivered by an authorized participant (AP) to the fund equal to the current holdings of the ETF, plus a designated cash component. In return, the APs receive a large block of ETF shares (typically 50,000 shares), which investors can then buy and sell in the secondary market.
credit quality The capacity of an issuer to make its interest and principal payments; an assessment typically rendered by an independent third-party organization.
credit risk The risk that a bond issuer may be unable to pay interest or principal to its bondholders.
duration A measure of an individual bond’s sensitivity to interest rates, expressed in years. Calculations of duration generally take into account the bond’s yield, interest payments, maturity date and call features.
weighted average duration A measure of the duration of all bonds in a fund’s portfolio, also expressed in years, based on the market value weighted average duration of each bond in the portfolio.
exchange A marketplace, or any organization or group that provides or maintains a marketplace for trading securities, options, futures, or commodities.
expense ratio The amount that is taken from the fund’s assets each year to cover the operating expenses. An expense ratio of 0.50% means that a fund’s expenses amount to half of one percent of its average net assets a year.
face value The value of a bond, note, mortgage or other security as given on the certificate or instrument. Face value is also referred to as par value or nominal value.
inception date The date that the shares began trading in the secondary market.
indicative optimized portfolio value (IOPV) A calculation disseminated by the stock exchange that approximates the fund’s NAV every 15 seconds throughout the trading day.
interest Payments to bondholders (usually made twice a year) as compensation for loaning the bond principal to the issuer.
interest rate risk The risk that a bond’s value will fluctuate if market interest rates change or are expected to change. Bond prices tend to move in the opposite direction of interest rates: when interest rates rise, bond prices tend to fall.
liquidity The ability to convert a security or asset quickly into cash.
market price return The return based on the change in market price per share of the fund over a given time period. Market price returns assume that dividends and capital gain distributions have been reinvested in the fund at market price.
Schwab Fixed-Income ETFs | Semiannual Report
maturity The maturity of a bond will generally be determined using a portfolio security’s final maturity date (date on which the final principal payment of a bond is scheduled to be paid); however, for securitized products, such as mortgage-backed securities and certain other asset-backed securities, maturity will be determined on an average life basis (weighted average time to receipt of all principal payments) by the investment adviser. Because pre-payment rates of individual mortgage pools vary widely, the average life of a particular pool cannot be predicted precisely. For securities with embedded demand features, such as puts or calls, either the demand date or the final maturity date will be used depending on interest rates, yields and other market conditions. The weighted average maturity (WAM) of a fund is dollar-weighted based upon the market value of a fund’s securities at the time of the calculation.
mortgage-backed securities Bond or other debt securities that represent ownership in a pool of mortgage loans.
net asset value (NAV) The value of one share of a fund. NAV is calculated by taking the fund’s total assets, subtracting liabilities, and dividing by the number of shares outstanding.
NAV return The return based on the change in NAV of the fund over a given time period. NAV returns assume that dividends and capital gain distributions have been reinvested in the fund.
offer (ask) The lowest price at which an individual is willing to sell a security.
open The price at which a security opened for trading on a given day.
outstanding shares, shares outstanding When speaking of the fund, indicates all shares currently held by investors.
prepayment risk The risk that a mortgage-backed security may be paid off early, typically because interest rates have fallen and the homeowners who hold the underlying mortgages have refinanced those mortgages at lower rates. In this type of situation, the investor who held the mortgage-backed security will usually have to settle for a lower rate when reinvesting the principal.
primary market The market that deals with the issuance of new securities.
replication If a fund uses a full replication method, the fund will invest substantially all of its assets proportionately in the securities included in the underlying index.
sampling If a fund uses a sampling method, the fund will not fully replicate the underlying index and may hold securities not included in the index. A fund that utilizes a sampling approach may not track the return of the index as closely as a fund that uses a full replication method.
secondary market The market in which investors purchase securities from other investors rather than directly from the issuing companies. Organized exchanges facilitate the trading of securities in the secondary market.
spread The gap between bid and ask prices of a security.
total return The percentage that an investor would have earned or lost on an investment in the fund assuming dividends and distributions were reinvested.
tracking error The difference between the performance of the fund and its benchmark index, positive or negative.
Treasury inflation protected security (TIPS) A United States Treasury bond whose principal increases at the same rate as the Consumer Price Index (CPI).The interest payment is then calculated off that inflated (adjusted) principal and repaid at maturity.
weighted average For mutual funds or ETFs, an average that gives the same weight to each security as the security represents in the fund’s portfolio.
yield The income paid out by an investment, expressed as a percentage of the investment’s market value.
yield to maturity The annualized rate of return a bondholder could expect if the bond were held to maturity. In addition to interest payments, yield to maturity also factors in any difference between a bond’s current price and its principal amount, or face value.
Schwab Fixed-Income ETFs | Semiannual Report
Schwab ETFs™
Schwab ETFs are designed to be low-cost, diversified investments which follow broad market indices and provide exposure to specific segments of the market. These ETFs can serve as part of the foundation of a diversified portfolio. The list below shows all currently available Schwab ETFs.
Investors should carefully consider information contained in the prospectus, or if available, the summary prospectus, including investment objectives, risks, charges and expenses before investing. Please call 1-877-824-5615 for a prospectus for any Schwab ETF. Please read the prospectus carefully before you invest. This report must be preceded or accompanied by a current prospectus.
Proxy Voting Policies, Procedures and Results
A description of the proxy voting policies and procedures used to determine how to vote proxies on behalf of the funds is available without charge, upon request, by visiting the Schwab ETFs’ website at www.schwabfunds.com/schwabetfs_prospectus, the SEC’s website at www.sec.gov, or by contacting Schwab ETFs at 1-877-824-5615.
Information regarding how a fund voted proxies relating to portfolio securities during the most recent twelve-month period ended June 30 is available, without charge, by visiting the fund’s website at www.schwabfunds.com/schwabetfs_prospectus or the SEC’s website at www.sec.gov.
U.S. ETFs
Schwab U.S. Broad Market ETF™
Schwab 1000 Index® ETF
Schwab U.S. Large-Cap ETF™
Schwab U.S. Large-Cap Growth ETF™
Schwab U.S. Large-Cap Value ETF™
Schwab U.S. Mid-Cap ETF™
Schwab U.S. Small-Cap ETF™
Schwab U.S. Dividend Equity ETF™
Schwab U.S. REIT ETF™
International ETFs
Schwab International Equity ETF™
Schwab International Small-Cap Equity ETF™
Schwab Emerging Markets Equity ETF™
Fixed Income ETFs
Schwab U.S. TIPS ETF™
Schwab Short-Term U.S. Treasury ETF™
Schwab Intermediate-Term U.S. Treasury ETF™
Schwab U.S. Aggregate Bond ETF™
Fundamental Index* ETFs
Schwab Fundamental U.S. Broad Market Index ETF
Schwab Fundamental U.S. Large Company Index ETF
Schwab Fundamental U.S. Small Company Index ETF
Schwab Fundamental International Large Company Index ETF
Schwab Fundamental International Small Company Index ETF
Schwab Fundamental Emerging Markets Large Company
Index ETF
Investment Adviser
Charles Schwab Investment Management, Inc.
211 Main Street, San Francisco, CA 94105
Schwab ETFs™
1-877-824-5615
© 2018 Charles Schwab Investment Management, Inc. All rights reserved.
Printed on recycled paper.
| * | FUNDAMENTAL INDEX is a registered trademark of Research Affiliates LLC. |
This page is intentionally left blank.
Item 2: Code of Ethics.
Not applicable to this semi-annual report.
Item 3: Audit Committee Financial Expert.
Not applicable to this semi-annual report.
Item 4: Principal Accountant Fees and Services.
Not applicable to this semi-annual report.
Item 5: Audit Committee of Listed Registrants.
Not applicable to this semi-annual report.
Item 6: Schedule of Investments.
The schedules of investments are included as part of the report to shareholders filed under Item 1 of this Form.
Item 7: Disclosure of Proxy Voting Policies and Procedures for Closed-End Management Investment Companies.
Not applicable.
Item 8: Portfolio Managers of Closed-End Management Investment Companies.
Not applicable.
Item 9: Purchases of Equity Securities by Closed-End Management Investment Company and Affiliated Purchasers.
Not applicable.
Item 10: Submission of Matters to a Vote of Security Holders.
Not applicable.
Item 11: Controls and Procedures.
| (a) | Based on their evaluation of Registrant’s disclosure controls and procedures, as of a date within 90 days of the filing date, Registrant’s Chief Executive Officer, Marie Chandoha and Registrant’s Chief Financial Officer, Mark Fischer, have concluded that Registrant’s disclosure controls and procedures are: (i) reasonably designed to ensure that information required to be disclosed in this report is appropriately communicated |
| | to Registrant’s officers to allow timely decisions regarding disclosures required in this report; (ii) reasonably designed to ensure that information required to be disclosed in this report is recorded, processed, summarized and reported in a timely manner; and (iii) are effective in achieving the goals described in (i) and (ii) above. |
| (b) | During the second fiscal quarter of the period covered by this report, there have been no changes in Registrant’s internal control over financial reporting that the above officers believe to have materially affected, or to be reasonably likely to materially affect, Registrant’s internal control over financial reporting. |
Item 12: Exhibits.
| (a) | (1) Code of ethics – not applicable to this semi-annual report. |
| | (2) | Separate certifications for Registrant’s principal executive officer and principal financial officer, as required by Rule 30a-2(a) under the 1940 Act, are attached. |
| (b) | A certification for Registrant’s principal executive officer and principal financial officer, as required by Rule 30a-2(b) under the 1940 Act, is attached. This certification is being furnished to the Securities and Exchange Commission solely pursuant to 18 U.S.C. section 1350 and is not being filed as part of the Form N-CSRS with the Commission. |
Pursuant to the requirements of the Securities Exchange Act of 1934 and the Investment Company Act of 1940, the registrant has duly caused this report to be signed on its behalf by the undersigned, thereunto duly authorized.
(Registrant) Schwab Strategic Trust
| | |
| By: | | /s/ Marie Chandoha |
| | Marie Chandoha Chief Executive Officer |
| |
| Date: | | August 13, 2018 |
Pursuant to the requirements of the Securities Exchange Act of 1934 and the Investment Company Act of 1940, this report has been signed below by the following persons on behalf of the registrant and in the capacities and on the dates indicated.
| | |
| By: | | /s/ Marie Chandoha |
| | Marie Chandoha Chief Executive Officer |
| |
| Date: | | August 13, 2018 |
| | |
| By: | | /s/ Mark Fischer |
| | Mark Fischer Chief Financial Officer |
| |
| Date: | | August 13, 2018 |