UNITED STATES
SECURITIES AND EXCHANGE COMMISSION
Washington, D.C. 20549
FORM N-CSR
CERTIFIED SHAREHOLDER REPORT OF REGISTERED
MANAGEMENT INVESTMENT COMPANIES
Investment Company Act file number: 811-22311
Schwab Strategic Trust – Schwab U.S. REIT ETF and Schwab Fundamental Index ETFs
(Exact name of registrant as specified in charter)
211 Main Street, San Francisco, California 94105
(Address of principal executive offices) (Zip code)
Jonathan de St. Paer
Schwab Strategic Trust – Schwab U.S. REIT ETF and Schwab Fundamental Index ETFs
211 Main Street, San Francisco, California 94105
(Name and address of agent for service)
Registrant’s telephone number, including area code: (415) 636-7000
Date of fiscal year end: February 28
Date of reporting period: February 28, 2022
Item 1: Report(s) to Shareholders.
Annual Report | February 28, 2022
Schwab U.S. REIT ETF
Ticker Symbol SCHH
This page is intentionally left blank.
Fund investment adviser: Charles Schwab Investment Management, Inc., dba Schwab Asset ManagementTM
Distributor: SEI Investments Distribution Co. (SIDCO)
The Sector/Industry classifications in this report use the Global Industry Classification Standard (GICS) which was developed by and is the exclusive property of MSCI Inc. (MSCI) and Standard & Poor’s (S&P). GICS is a service mark of MSCI and S&P and has been licensed for use by Charles Schwab & Co., Inc. The Industry classifications used in the Portfolio Holdings are sub-categories of Sector classifications.
Schwab U.S. REIT ETF | Annual Report
The performance data quoted represents past performance. Past performance does not guarantee future results. Investment return and principal value of an investment will fluctuate so that an investor’s shares, when sold or redeemed, may be worth more or less than the original cost. Current performance may be lower or higher than the performance quoted. To obtain performance information current to the most recent month end, please visit www.schwabassetmanagement.com/schwabetfs_prospectus.
| Total Returns for the 12 Months Ended February 28, 2022 |
| Schwab U.S. REIT ETF (Ticker Symbol: SCHH) | |
| Market Price Return1 | 21.53% |
| NAV Return1 | 21.56% |
| Dow Jones Equity All REIT Capped Index | 21.63% |
| ETF Category: Morningstar Real Estate2 | 20.02% |
| Performance Details | pages 7-9 |
All total returns on this page assume dividends and distributions were reinvested. Index figures do not include trading and management costs, which would lower performance. Indices are unmanaged and cannot be invested in directly. Performance results less than one year are not annualized.
For index definitions, please see the Glossary.
Small-company stocks are subject to greater volatility than many other asset classes.
The fund is subject to risks associated with the direct ownership of real estate securities and an investment in the fund will be closely linked to the performance of the real estate markets.
Performance does not reflect the deduction of taxes that a shareholder would pay on fund distributions or on the redemption or sale of fund shares.
Shares are bought and sold at market price, which may be higher or lower than the net asset value (NAV). Brokerage commissions will reduce returns.
Index ownership — Dow Jones® is a registered trademark of Dow Jones Trademark Holdings LLC (Dow Jones). The Dow Jones Equity All REIT Capped Index (the Index) is a product of S&P Dow Jones Indices LLC, and the trademark and Index have been licensed for use by Charles Schwab Investment Management, Inc. The Schwab U.S. REIT ETF is not sponsored, endorsed, sold or promoted by S&P Dow Jones Indices LLC, Dow Jones, or any of their respective affiliates and neither S&P Dow Jones Indices LLC, Dow Jones, nor any of their respective affiliates make any representation regarding the advisability of investing in such product.
| 1 | ETF performance must be shown based on both a market price and NAV basis. The fund’s per share NAV is the value of one share of the fund. NAV is calculated by taking the fund’s total assets (including the fair value of securities owned), subtracting liabilities, and dividing by the number of shares outstanding. The NAV Return is based on the NAV of the fund, and the Market Price Return is based on the market price per share of the fund. The price used to calculate market return (Market Price) is determined using the Official Closing Price on the primary stock exchange (generally, 4:00 p.m. Eastern time) and may not represent the returns you would receive if shares were traded at other times. Market Price and NAV returns assume that dividends and capital gain distributions have been reinvested in the fund at Market Price and NAV, respectively. |
| 2 | Source for category information: Morningstar, Inc. The Morningstar Category return represents all passively- and actively-managed ETFs within the category as of the report date. |
Schwab U.S. REIT ETF | Annual Report
Jonathan de St. Paer
President of Schwab Asset
Management and the fund
covered in this report.
Dear Shareholder,
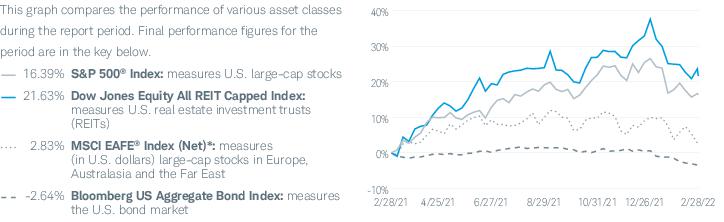
Before Russia’s invasion of Ukraine in late February 2022, financial markets were largely preoccupied with the prospects of continued economic growth in the face of multiple challenges related to the ongoing COVID-19 pandemic. Concerns included rising energy and commodity inflation, global supply-chain disruptions, and the increasing likelihood that the U.S. Federal Reserve (Fed) would raise short-term interest rates. Despite these obstacles, the S&P 500® Index, a bellwether for the overall U.S. stock market, gained more than 20% between March and December 2021, bolstered by strong corporate earnings, robust consumer spending, and improving labor statistics. However, investor sentiment turned dramatically risk averse as tensions between Russia and Ukraine began escalating in 2022. Stock markets dipped sharply in January and February, with the S&P 500® Index losing roughly half of its previous gains. The real estate sector generated positive returns over the reporting period, with U.S. real estate investment trusts (REITs) outperforming the broader U.S. equity market led by strong returns from industrial and residential REITs. For the 12-month reporting period ended February 28, 2022, the S&P 500® Index returned 16.4%, while the Dow Jones Equity All REIT Capped Index, representing U.S. REITs, returned 21.6%.
While the tumultuous events beginning at the end of February have clearly unsettled markets and shaken investor confidence, at Schwab Asset Management we believe that when it comes to their investment plan, investors would do well to avoid getting caught up in dramatic events as they unfold. Although markets may react abruptly in the short term, we believe that wealth creation is most reliably built on a foundation of diversification and a long-term investment plan. Since real estate securities tend to be influenced by a different combination of factors than other stocks and bonds, the Schwab U.S. REIT ETF may add another layer of diversification when combined with more traditional asset classes in a portfolio. The fund offers convenient, low-cost access to U.S. REITs.
Thank you for investing with Schwab Asset Management. For more information about the Schwab U.S. REIT ETF, please continue reading this report. In addition, you can find further details about this fund by visiting our website at www.schwabassetmanagement.com. We are also happy to hear from you at 1-877-824-5615.
Sincerely,
“ The real estate sector generated positive returns over the reporting period, with U.S. real estate investment trusts (REITs) outperforming the broader U.S. equity market led by strong returns from industrial and residential REITs.”
Past performance is no guarantee of future results.
Diversification and asset allocation strategies do not ensure a profit and cannot protect against losses in a declining market.
Management views may have changed since the report date.
Schwab Asset Management is the dba name for Charles Schwab Investment Management, Inc., the investment adviser for Schwab Funds and Schwab ETFs.
Schwab U.S. REIT ETF | Annual Report
The Investment Environment
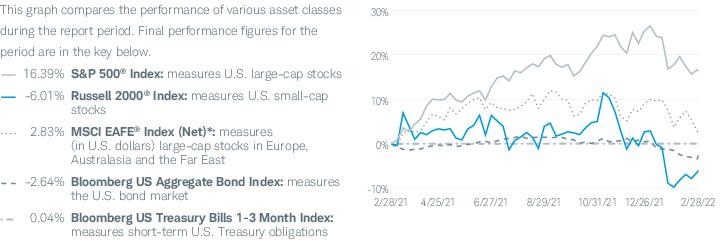
For the 12-month reporting period ended February 28, 2022, U.S. equity markets generated positive returns. Despite persisting COVID-19 pandemic-driven stresses on the global economy and the emergence and rapid spread of the Delta variant during the summer and the Omicron variant late in 2021, market tailwinds included strong corporate earnings, ongoing, albeit fading, fiscal stimulus measures, and optimism related to increased COVID-19 vaccination rates. As a result, for most of the reporting period, through early January 2022, U.S. equity markets posted steady gains, with several key market indices repeatedly exceeding previous record highs. However, beginning in early 2022, equity markets declined in reaction to growing headwinds that included accelerating inflation, an increasing likelihood of rising interest rates, and, in the final week of the reporting period, Russia’s invasion of Ukraine, which drove oil prices above $100 per barrel for the first time since 2014 and roiled stock markets around the world. For the reporting period, the Dow Jones Equity All REIT Capped Index, which represents U.S. real estate investment trusts (REITs), returned 21.63% and the FTSE EPRA Nareit Global Index (Net)*, which represents general trends in eligible real estate securities worldwide, returned 9.78%. During the same period, the S&P 500® Index, a bellwether for the overall U.S. stock market, returned 16.39%.
After falling under severe pressure early in the COVID-19 pandemic as demand fell and funding waned, U.S. REITs continued their strong performance over much of the reporting period. During the reporting period, the Dow Jones Equity All REIT Capped Index exceeded the return of the broader U.S. equity market, hitting a record high in early January 2022 before falling back in the first two months of 2022 on the growing likelihood of rising interest rates and inflation concerns. Among REIT sub-industries in the Dow Jones Equity All REIT Capped Index, all but one posted positive returns and all but two posted double-digit returns for the reporting period. The strongest performers were the industrial and residential REITs sub-industries, both up on strong demand and limited supply. The only sub-industry to post a negative return for the reporting period was the hotels & resort REITs sub-industry, which continued to suffer amid ongoing COVID-19 pandemic-driven constraints in leisure and business travel.
Asset Class Performance Comparison % returns during the 12 months ended February 28, 2022
Index figures assume dividends and distributions were reinvested. Index figures do not include trading and management costs, which would lower performance. Indices are unmanaged and cannot be invested in directly. Performance results less than one year are not annualized. Past performance is not an indication of future results.
For index definitions, please see the Glossary.
Data source: Index provider websites and Schwab Asset Management.
Nothing in this report represents a recommendation of a security by the investment adviser.
Management views may have changed since the report date.
| * | The net version of the index reflects reinvested dividends net of withholding taxes but reflects no deductions for expenses or other taxes. |
Schwab U.S. REIT ETF | Annual Report
The Investment Environment (continued)
The U.S. economy continued its recovery from the dramatic impact of the COVID-19 pandemic, although U.S. gross domestic product (GDP) growth fluctuated over the reporting period. GDP rose at an annualized rate of 6.3% and 6.7% in the first and second quarters of 2021, respectively, before falling back to 2.3% for the third quarter of 2021 amid fading government stimuli, ongoing supply chain disruptions, and persisting inflation. GDP rose at an annualized rate of 6.9% in the fourth quarter of 2021 on increasing inventories, exports, and personal consumption expenditures. The unemployment rate, which has fallen steadily after skyrocketing in April 2020, ended the reporting period at its lowest level since February 2020. Annual inflation, which had remained well below the U.S. Federal Reserve’s (Fed) traditional 2% target until it jumped in March 2021, continued to rise during the spring of 2021, leveled off during the summer of 2021, and rose again through the remainder of the reporting period. At the end of the reporting period, inflation was at its highest rate in 40 years, due to imbalances in the labor market, supply chain bottlenecks, and soaring energy costs.
Monetary policies around the world varied. In the United States, early in the reporting period, the Fed reiterated several times its intention to continue its support of the economy for as long as needed to achieve a full recovery and the Fed maintained the federal funds rate in a range of 0.00% to 0.25% throughout the reporting period. However, as inflation continued to rise and indicators of economic activity and employment continued to strengthen, the Fed began scaling back its bond-buying program in November 2021, citing significant progress on its twin goals of maximum employment and price stability. The Fed subsequently accelerated its wind-down in December 2021, with expectations to end it altogether by March 2022. Fed officials also issued successively strong signals that interest rates could begin to rise sooner in 2022 than previously anticipated.
Schwab U.S. REIT ETF | Annual Report
 | Christopher Bliss, CFA, Managing Director and Head of Passive Equity Strategies for Schwab Asset Management, is responsible for overseeing the investment process, portfolio management and implementation, and development of investment strategies for passive equity Schwab Funds and Schwab ETFs. Before joining Schwab in 2016, Mr. Bliss spent 12 years at BlackRock (formerly Barclays Global Investors) managing and leading institutional index teams, most recently as a managing director and the head of the Americas institutional index team. In this role, Mr. Bliss was responsible for overseeing a team of portfolio managers managing domestic, developed international and emerging markets index strategies. Prior to BlackRock, he worked as an equity analyst and portfolio manager for Harris Bretall and before that, as a research analyst for JP Morgan. |
 | Jeremy Brown, CFA, Portfolio Manager, is responsible for the day-to-day co-management of the fund. Prior to joining Schwab in 2017, Mr. Brown spent six years with ALPS Advisors, Inc. in Denver, most recently as a senior analyst on the ETF portfolio management and research team where he performed portfolio management, trading, and analytics/research functions for ALPS ETFs and passive funds. Additionally, Mr. Brown led a number of investment research, commentary, industry trend analysis, and sales and marketing support initiatives. |
 | Ferian Juwono, CFA, Senior Portfolio Manager, is responsible for the day-to-day co-management of the fund. Prior to joining Schwab in 2010, Mr. Juwono worked at BlackRock (formerly Barclays Global Investors) where he spent more than three years as a portfolio manager, managing equity index funds for institutional clients, and two years as a senior business analyst. Prior to that, Mr. Juwono worked for more than four years as a senior financial analyst with Union Bank of California. |
 | Sabya Sinha, Portfolio Manager, is responsible for the day-to-day co-management of the fund. Prior to joining Schwab in 2015, Mr. Sinha spent a year at F-Squared Investments on the product development and analytics team. Prior to F-Squared, he worked at IndexIQ Advisors as a senior index portfolio manager for three years and for Bank of America’s Columbia Management subsidiary as a portfolio manager for three years. Mr. Sinha also spent time as a software consultant at DPM Mellon, LLC and an equity trader at Jane Street Capital. |
Schwab U.S. REIT ETF | Annual Report
Schwab U.S. REIT ETF as of February 28, 2022
The Schwab U.S. REIT ETF’s (the fund) goal is to track as closely as possible, before fees and expenses, the total return of an index composed of U.S. real estate investment trusts (REITs) classified as equities. To pursue its goal, the fund generally invests in securities that are included in the Dow Jones Equity All REIT Capped Index (the index). The index is a float-adjusted market capitalization weighted index that is subject to capping constraints at each quarterly rebalancing. The index generally includes all publicly traded equity REITs with a minimum float-adjusted market capitalization of $200 million and a three-month median daily value traded of at least $5 million. For more information concerning the fund’s investment objective, strategies, and risks, please see the fund’s prospectus.
Market Highlights. For the 12-month reporting period ended February 28, 2022, U.S. equity markets generated positive returns. Despite persisting COVID-19 pandemic-driven stresses on the global economy and the emergence and rapid spread of the Delta variant during the summer and the Omicron variant late in 2021, market tailwinds included strong corporate earnings, ongoing, albeit fading, fiscal stimulus measures, and optimism related to increased COVID-19 vaccination rates. As a result, for most of the reporting period, through early January 2022, U.S. equity markets posted steady gains, with several key market indices repeatedly exceeding previous record highs. However, beginning in early 2022, equity markets declined in reaction to growing headwinds that included accelerating inflation, an increasing likelihood of rising interest rates, and, in the final week of the reporting period, Russia’s invasion of Ukraine, which drove oil prices above $100 per barrel for the first time since 2014 and roiled stock markets around the world. After falling under severe pressure early in the COVID-19 pandemic as demand fell and funding waned, U.S. REITs continued their strong performance over much of the reporting period. During the reporting period, U.S. REITs exceeded the return of the broader U.S. equity market, hitting a record high in early January 2022 before falling back in the first two months of 2022 on the growing likelihood of rising interest rates and inflation concerns.
Performance. For the 12-month reporting period ended February 28, 2022, the fund’s market price return was 21.53% and its NAV return was 21.56% (for an explanation of the market price and NAV returns, please refer to footnote 3 on the following page.) The index returned 21.63% during the same period. Differences between the return of the fund and the return of the index may be attributable to, among other things, the trading and management costs incurred by the fund and not the index.
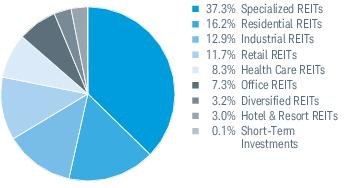
Contributors and Detractors. The hotel & resort REITs sub-industry was the only sub-industry that detracted from the total return of the fund over the reporting period. Hotel & resort REITs represented an average weight of approximately 3% of the fund’s investments and returned approximately -2% for the reporting period. One example from this sub-industry is Park Hotels & Resorts, Inc. which owns and operates hotels. The fund’s holdings of Park Hotels & Resorts, Inc. represented an average weight of less than 1% of the fund’s investments and returned approximately -13% for the reporting period.
While there were no additional sectors that detracted from the total return of the fund, the security & alarm services sub-industry was the smallest contributor to the total return of the fund, representing an average weight of less than 1% of the fund’s investments and returning approximately 28% for the reporting period.
The specialized REITs sub-industry contributed the most to the total return of the fund over the reporting period. Specialized REITs represented an average weight of approximately 39% of the fund’s investments and returned approximately 19% for the reporting period. One example from this sub-industry is Public Storage which acquires, develops, owns, and operates self-storage facilities in the United States. The fund’s holdings of Public Storage represented an average weight of approximately 3% of the fund’s investments and returned approximately 56% for the reporting period.
The residential REITs sub-industry also contributed to the total return of the fund, representing an average weight of approximately 15% of the fund’s investments and returning approximately 37% for the reporting period.
Management views and portfolio holdings may have changed since the report date.
Schwab U.S. REIT ETF | Annual Report
Performance and Fund Facts as of February 28, 2022
The performance data quoted represents past performance. Past performance does not guarantee future results. Investment return and principal value of an investment will fluctuate so that an investor’s shares, when sold or redeemed, may be worth more or less than the original cost. Current performance may be lower or higher than the performance quoted. To obtain performance information current to the most recent month end, please visit www.schwabassetmanagement.com/schwabetfs_prospectus.
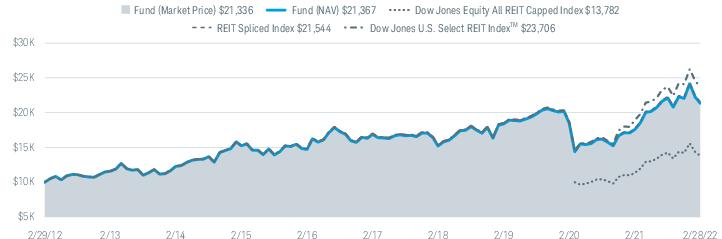
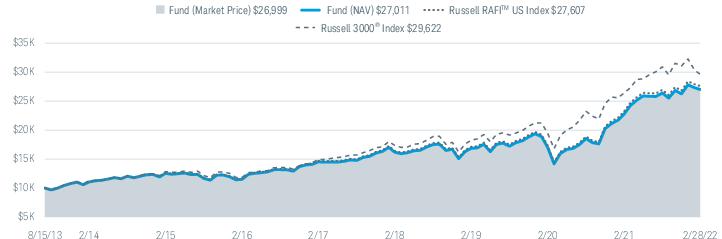
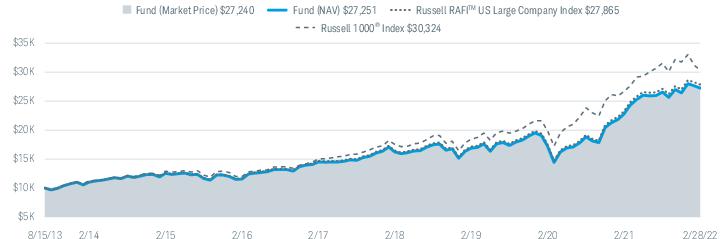
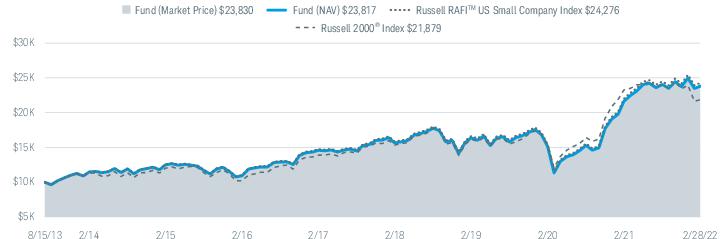
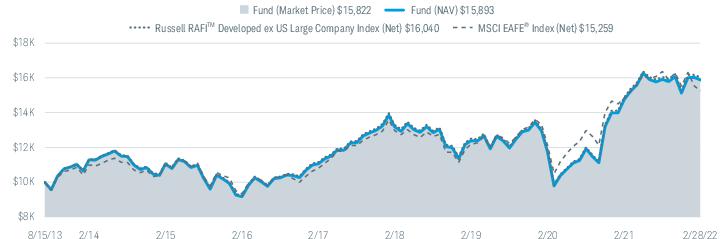
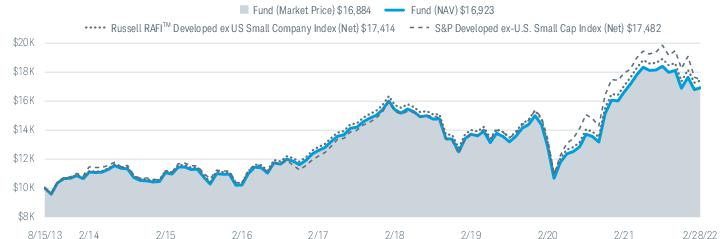
Performance of Hypothetical $10,000 Investment (February 29, 2012 – February 28, 2022)1,2
Average Annual Total Returns1
| Fund and Inception Date | 1 Year | 5 Years | 10 Years |
| Fund: Schwab U.S. REIT ETF (1/13/11) | | | |
| Market Price Return3 | 21.53% | 4.82% | 7.87% |
| NAV Return3 | 21.56% | 4.81% | 7.89% |
| Dow Jones Equity All REIT Capped Index2 | 21.63% | N/A | N/A |
| REIT Spliced Index | 21.63% | 4.85% | 7.98% |
| Dow Jones U.S. Select REIT IndexTM | 25.25% | 6.87% | 9.01% |
| ETF Category: Morningstar Real Estate4 | 20.02% | 7.56% | 9.04% |
| Fund Expense Ratio5: 0.07% |
All total returns on this page assume dividends and distributions were reinvested. Index figures do not include trading and management costs, which would lower performance. Indices are unmanaged and cannot be invested in directly. Performance results less than one year are not annualized.
The first index listed for the fund is the fund’s primary benchmark, as shown in the prospectus. Additional indices shown are provided for comparative purposes.
For index definitions, please see the Glossary.
Small-company stocks may be subject to greater volatility than many other asset classes.
The fund is subject to risks associated with the direct ownership of real estate securities, and an investment in the fund will be closely linked to the performance of the real estate markets.
Shares are bought and sold at market price, which may be higher or lower than the net asset value (NAV). Brokerage commissions will reduce returns.
Index ownership — Dow Jones® is a registered trademark of Dow Jones Trademark Holdings LLC (Dow Jones). The Dow Jones Equity All REIT Capped Index (the Index) is a product of S&P Dow Jones Indices LLC, and the trademark and Index have been licensed for use by Charles Schwab Investment Management, Inc. The Schwab U.S. REIT ETF is not sponsored, endorsed, sold or promoted by S&P Dow Jones Indices LLC, Dow Jones, or any of their respective affiliates and neither S&P Dow Jones Indices LLC, Dow Jones, nor any of their respective affiliates make any representation regarding the advisability of investing in such product.
| 1 | Performance does not reflect the deduction of taxes that a shareholder would pay on fund distributions or on the redemption or sale of fund shares. |
| 2 | The inception date of the Dow Jones Equity All REIT Capped Index is April 13, 2020. The fund began tracking the index on June 22, 2020. |
| 3 | ETF performance must be shown based on both a market price and NAV basis. The fund’s per share NAV is the value of one share of the fund. NAV is calculated by taking the fund’s total assets (including the fair value of securities owned), subtracting liabilities, and dividing by the number of shares outstanding. The NAV Return is based on the NAV of the fund, and the Market Price Return is based on the market price per share of the fund. The price used to calculate market return (Market Price) is determined using the Official Closing Price on the primary stock exchange (generally, 4:00 p.m. Eastern time) and may not represent the returns you would receive if shares were traded at other times. NAV is used as a proxy for purposes of calculating Market Price Return on inception date. Market Price and NAV returns assume that dividends and capital gain distributions have been reinvested in the fund at Market Price and NAV, respectively. |
| 4 | Source for category information: Morningstar, Inc. The Morningstar Category return represents all passively- and actively-managed ETFs within the category as of the report date. |
| 5 | As stated in the prospectus. |
Schwab U.S. REIT ETF | Annual Report
Performance and Fund Facts as of February 28, 2022 (continued)
| Number of Holdings | 138 |
| Weighted Average Market Cap (millions) | $38,535 |
| Price/Earnings Ratio (P/E) | 35.8 |
| Price/Book Ratio (P/B) | 2.9 |
| Portfolio Turnover Rate | 5% 2 |
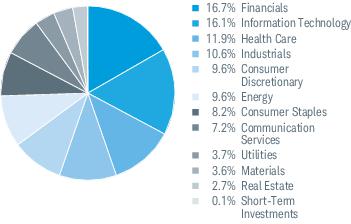
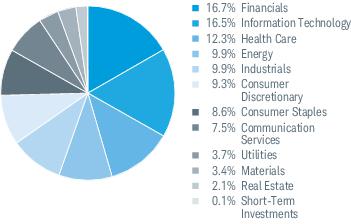
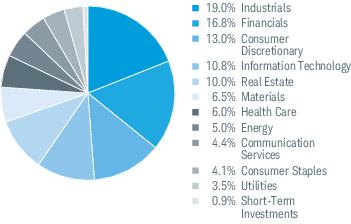
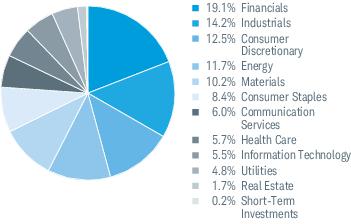
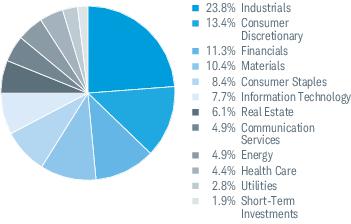
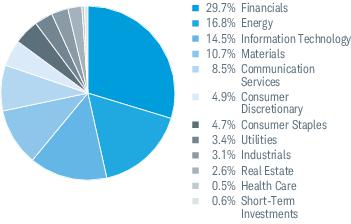
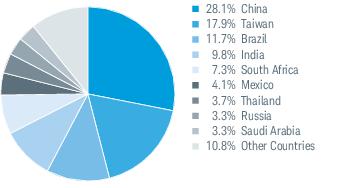
Industry Weightings % of Investments3
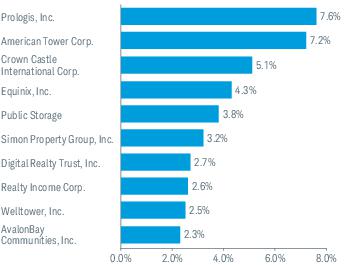
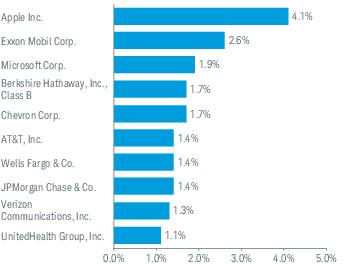
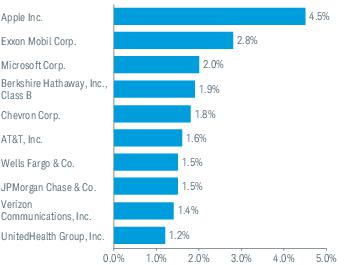
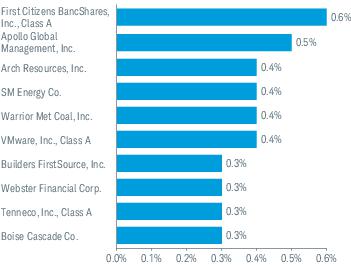
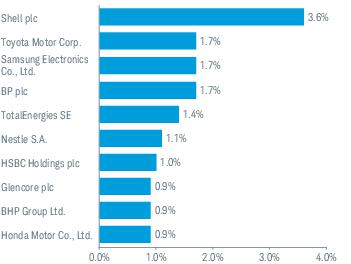
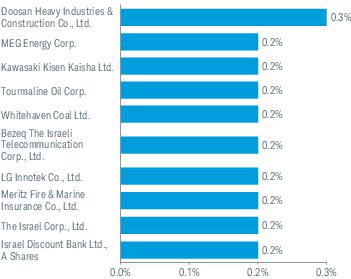
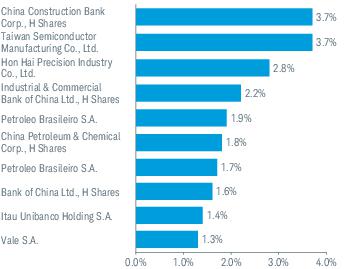
Top Equity Holdings % of Net Assets4
Portfolio holdings may have changed since the report date.
An index is a statistical composite of a specified financial market or sector. Unlike the fund, an index does not actually hold a portfolio of securities and its return is not inclusive of trading and management costs incurred by the fund.
Source of Industry Classification: S&P and MSCI.
| 1 | Excludes derivatives. |
| 2 | Portfolio turnover rate excludes securities received or delivered from processing of in-kind creations or redemptions. |
| 3 | The percentage may differ from the Portfolio Holdings because the above calculation is based on a percentage of total investments, excluding derivatives, whereas the calculation in the Portfolio Holdings is based on a percentage of net assets. |
| 4 | This list is not a recommendation of any security by the investment adviser. |
Schwab U.S. REIT ETF | Annual Report
Fund Expenses (Unaudited)
Examples for a $1,000 Investment
As a fund shareholder, you may incur two types of costs: (1) transaction costs, including brokerage commissions on purchases and sales of fund shares; and, (2) ongoing costs, including management fees.
The expense examples below are intended to help you understand your ongoing cost (in dollars) of investing in the fund and to compare this cost with the ongoing cost of investing in other mutual funds. These examples are based on an investment of $1,000 invested for six months beginning September 1, 2021 and held through February 28, 2022.
Actual Return line in the table below provides information about actual account values and actual expenses. You may use this information, together with the amount you invested, to estimate the expenses that you paid over the period. To do so, simply divide your account value by $1,000 (for example, an $8,600 account value ÷ $1,000 = 8.6), then multiply the result by the number given for the fund under the heading entitled “Expenses Paid During Period.”
Hypothetical Return line in the table below provides information about hypothetical account values and hypothetical expenses based on the fund’s actual expense ratio and an assumed return of 5% per year before expenses. Because the return used is not an actual return, it may not be used to estimate the actual ending account value or expenses you paid for the period.
You may use this information to compare the ongoing costs of investing in the fund and other funds. To do so, compare this 5% hypothetical example with the 5% hypothetical examples that appear in the shareholder reports of the other funds.
Please note that the expenses shown in the table are meant to highlight your ongoing costs only, and do not reflect any transactional costs, including any brokerage commissions you may pay when purchasing or selling shares of a fund. Therefore, the hypothetical return lines of the table are useful in comparing ongoing costs only, and will not help you determine the relative total costs of owning different funds. In addition, if these transactional costs were included, your costs would have been higher.
| | EXPENSE RATIO
(ANNUALIZED) 1 | BEGINNING
ACCOUNT VALUE
AT 9/1/21 | ENDING
ACCOUNT VALUE
(NET OF EXPENSES)
AT 2/28/22 | EXPENSES PAID
DURING PERIOD
9/1/21-2/28/222 |
| Schwab U.S. REIT ETF | | | | |
| Actual Return | 0.07% | $1,000.00 | $ 965.60 | $0.34 |
| Hypothetical 5% Return | 0.07% | $1,000.00 | $1,024.45 | $0.35 |
| 1 | Based on the most recent six-month expense ratio. |
| 2 | Expenses for each fund are equal to its annualized expense ratio, multiplied by the average account value over the period, multiplied by 181 days of the period, and divided by 365 days of the fiscal year. |
Schwab U.S. REIT ETF | Annual Report
Financial Statements
FINANCIAL HIGHLIGHTS
| | 3/1/21–
2/28/22 | 3/1/20–
2/28/21 | 3/1/19–
2/29/20 | 3/1/18–
2/28/19 | 3/1/17–
2/28/18 | |
| Per-Share Data |
| Net asset value at beginning of period | $38.96 | $42.29 | $43.29 | $37.08 | $42.08 | |
| Income (loss) from investment operations: | | | | | | |
| Net investment income (loss)1 | 0.85 | 0.84 | 1.32 | 1.29 | 1.20 | |
| Net realized and unrealized gains (losses) | 7.57 | (3.08) | (1.00) | 6.33 | (5.28) | |
| Total from investment operations | 8.42 | (2.24) | 0.32 | 7.62 | (4.08) | |
| Less distributions: | | | | | | |
| Distributions from net investment income | (0.79) | (1.09) | (1.32) | (1.41) | (0.92) | |
| Net asset value at end of period | $46.59 | $38.96 | $42.29 | $43.29 | $37.08 | |
| Total return | 21.56% | (4.98%) | 0.59% | 20.85% | (9.91%) | |
| Ratios/Supplemental Data |
| Ratios to average net assets: | | | | | | |
| Total expenses | 0.07% | 0.07% | 0.07% | 0.07% | 0.07% | |
| Net investment income (loss) | 1.81% | 2.33% | 2.88% | 3.17% | 2.93% | |
| Portfolio turnover rate2 | 5% | 59% | 6% | 7% | 8% | |
| Net assets, end of period (x 1,000) | $6,648,475 | $4,891,906 | $5,717,395 | $5,127,268 | $3,691,377 | |
| 1 | Calculated based on the average shares outstanding during the period. |
| 2 | Portfolio turnover rate excludes securities received or delivered from processing of in-kind creations or redemptions. |
Schwab U.S. REIT ETF | Annual Report
Portfolio Holdings as of February 28, 2022
This section shows all the securities in the fund’s portfolio and their values as of the report date.
The fund files its complete schedule of portfolio holdings with the U.S. Securities and Exchange Commission (SEC) for the first and third quarters of each fiscal year on Form N-PORT Part F. The fund’s Form N-PORT Part F is available on the SEC’s website at www.sec.gov. You can also obtain this information at no cost on the fund’s website at www.schwabassetmanagement.com/schwabetfs_prospectus, by calling 1-866-414-6349, or by sending an email request to orders@mysummaryprospectus.com.The fund also makes available its complete schedule of portfolio holdings on a daily basis on the fund’s website.
| SECURITY | NUMBER
OF SHARES | VALUE ($) |
| COMMON STOCKS 99.7% OF NET ASSETS |
| |
| Diversified REITs 3.2% |
| Alexander & Baldwin, Inc. | 338,405 | 7,590,424 |
| American Assets Trust, Inc. | 246,024 | 8,994,637 |
| Broadstone Net Lease, Inc. | 754,082 | 16,333,416 |
| DigitalBridge Group, Inc. * | 2,401,017 | 17,407,373 |
| Empire State Realty Trust, Inc., Class A | 659,985 | 6,243,458 |
| Essential Properties Realty Trust, Inc. | 568,727 | 14,377,419 |
| Global Net Lease, Inc. | 484,007 | 6,877,739 |
| iStar, Inc. | 324,292 | 8,146,215 |
| PS Business Parks, Inc. | 93,964 | 14,967,526 |
| STORE Capital Corp. | 1,147,323 | 35,245,763 |
| Washington Real Estate Investment Trust | 395,613 | 9,241,520 |
| WP Carey, Inc. | 870,856 | 67,404,254 |
| | | 212,829,744 |
| |
| Health Care REITs 8.3% |
| CareTrust REIT, Inc. | 454,231 | 7,949,042 |
| Community Healthcare Trust, Inc. | 109,426 | 4,563,064 |
| Diversified Healthcare Trust | 1,117,843 | 3,219,388 |
| Global Medical REIT, Inc. | 282,184 | 4,430,289 |
| Healthcare Realty Trust, Inc. | 689,315 | 17,977,335 |
| Healthcare Trust of America, Inc., Class A | 1,032,470 | 30,344,293 |
| Healthpeak Properties, Inc. | 2,519,873 | 78,267,255 |
| LTC Properties, Inc. | 183,814 | 6,218,428 |
| Medical Properties Trust, Inc. | 2,787,667 | 56,701,147 |
| National Health Investors, Inc. | 214,174 | 11,417,616 |
| Omega Healthcare Investors, Inc. | 1,117,352 | 31,475,806 |
| Physicians Realty Trust | 1,030,420 | 16,754,629 |
| Sabra Health Care REIT, Inc. | 1,069,967 | 14,369,657 |
| Ventas, Inc. | 1,865,972 | 100,762,488 |
| Welltower, Inc. | 2,034,738 | 169,473,328 |
| | | 553,923,765 |
| |
| Hotel & Resort REITs 2.9% |
| Apple Hospitality REIT, Inc. | 993,041 | 17,566,895 |
| Ashford Hospitality Trust, Inc. * | 152,267 | 1,311,019 |
| Braemar Hotels & Resorts, Inc. * | 266,159 | 1,586,308 |
| Chatham Lodging Trust * | 227,979 | 3,134,711 |
| DiamondRock Hospitality Co. * | 984,663 | 9,403,532 |
| Hersha Hospitality Trust * | 154,877 | 1,429,515 |
| Host Hotels & Resorts, Inc. * | 3,337,664 | 60,979,121 |
| Park Hotels & Resorts, Inc. * | 1,104,688 | 20,812,322 |
| Pebblebrook Hotel Trust | 614,635 | 13,835,434 |
| RLJ Lodging Trust | 778,145 | 10,886,248 |
| Ryman Hospitality Properties, Inc. * | 257,582 | 22,695,550 |
| Service Properties Trust | 773,341 | 6,673,933 |
| Summit Hotel Properties, Inc. * | 498,453 | 4,929,700 |
| Sunstone Hotel Investors, Inc. * | 1,024,528 | 10,839,506 |
| SECURITY | NUMBER
OF SHARES | VALUE ($) |
| Xenia Hotels & Resorts, Inc. * | 533,846 | 9,897,505 |
| | | 195,981,299 |
| |
| Industrial REITs 12.9% |
| Americold Realty Trust | 1,247,128 | 33,323,260 |
| Duke Realty Corp. | 1,780,303 | 94,356,059 |
| EastGroup Properties, Inc. | 190,186 | 36,279,881 |
| First Industrial Realty Trust, Inc. | 609,056 | 35,069,444 |
| Industrial Logistics Properties Trust | 305,507 | 6,834,192 |
| Innovative Industrial Properties, Inc. | 111,769 | 21,063,986 |
| LXP Industrial Trust | 1,322,229 | 20,441,660 |
| Prologis, Inc. | 3,446,669 | 502,696,674 |
| Rexford Industrial Realty, Inc. | 708,160 | 49,663,261 |
| STAG Industrial, Inc. | 818,269 | 31,879,760 |
| Terreno Realty Corp. | 349,891 | 24,069,002 |
| | | 855,677,179 |
| |
| Office REITs 7.3% |
| Alexandria Real Estate Equities, Inc. | 659,198 | 124,852,101 |
| Boston Properties, Inc. | 664,487 | 81,273,405 |
| Brandywine Realty Trust | 799,679 | 10,659,721 |
| City Office REIT, Inc. | 202,845 | 3,492,991 |
| Corporate Office Properties Trust | 525,593 | 13,775,792 |
| Cousins Properties, Inc. | 695,203 | 26,855,692 |
| Douglas Emmett, Inc. | 820,508 | 26,010,104 |
| Easterly Government Properties, Inc. | 402,883 | 8,388,024 |
| Equity Commonwealth * | 565,522 | 15,025,920 |
| Highwoods Properties, Inc. | 487,638 | 21,261,017 |
| Hudson Pacific Properties, Inc. | 712,857 | 18,819,425 |
| JBG SMITH Properties | 533,994 | 14,246,960 |
| Kilroy Realty Corp. | 489,999 | 35,093,728 |
| Office Properties Income Trust | 226,026 | 5,661,951 |
| Paramount Group, Inc. | 765,868 | 8,570,063 |
| Piedmont Office Realty Trust, Inc., Class A | 580,149 | 9,885,739 |
| SL Green Realty Corp. | 312,032 | 24,812,785 |
| Veris Residential, Inc. * | 374,882 | 6,335,506 |
| Vornado Realty Trust | 743,266 | 32,168,552 |
| | | 487,189,476 |
| |
| Residential REITs 16.2% |
| American Campus Communities, Inc. | 650,526 | 35,004,804 |
| American Homes 4 Rent, Class A | 1,326,104 | 50,405,213 |
| Apartment Income REIT Corp. | 733,850 | 37,873,999 |
| Apartment Investment & Management Co., Class A * | 709,596 | 5,066,515 |
| AvalonBay Communities, Inc. | 653,226 | 155,853,191 |
| Camden Property Trust | 477,731 | 78,878,165 |
| Centerspace | 66,800 | 6,278,532 |
| Equity LifeStyle Properties, Inc. | 799,121 | 59,630,409 |
| Equity Residential | 1,595,257 | 136,075,422 |
| Essex Property Trust, Inc. | 304,267 | 96,504,364 |
| Independence Realty Trust, Inc. | 488,458 | 12,343,334 |
| Invitation Homes, Inc. | 2,789,702 | 105,450,736 |
Schwab U.S. REIT ETF | Annual Report
Portfolio Holdings as of February 28, 2022 (continued)
| SECURITY | NUMBER
OF SHARES | VALUE ($) |
| Mid-America Apartment Communities, Inc. | 538,225 | 110,126,217 |
| NexPoint Residential Trust, Inc. | 106,376 | 9,038,769 |
| Preferred Apartment Communities, Inc. | 247,748 | 6,258,115 |
| Sun Communities, Inc. | 542,133 | 98,126,073 |
| UDR, Inc. | 1,358,557 | 74,544,023 |
| | | 1,077,457,881 |
| |
| Retail REITs 11.7% |
| Acadia Realty Trust | 413,997 | 8,876,096 |
| Agree Realty Corp. | 326,025 | 20,914,504 |
| Brixmor Property Group, Inc. | 1,388,337 | 34,875,025 |
| Federal Realty Investment Trust | 327,265 | 38,479,819 |
| Getty Realty Corp. | 183,911 | 5,066,748 |
| InvenTrust Properties Corp. | 314,852 | 8,170,409 |
| Kimco Realty Corp. | 2,881,542 | 67,802,683 |
| Kite Realty Group Trust | 1,023,131 | 22,437,263 |
| National Retail Properties, Inc. | 821,035 | 34,984,301 |
| NETSTREIT Corp. | 184,706 | 4,089,391 |
| Phillips Edison & Co., Inc. | 91,687 | 2,963,324 |
| Realty Income Corp. | 2,644,774 | 174,793,114 |
| Regency Centers Corp. | 720,313 | 47,461,423 |
| Retail Opportunity Investments Corp. | 567,426 | 10,304,456 |
| RPT Realty | 392,763 | 5,086,281 |
| Seritage Growth Properties, Class A * | 168,998 | 1,722,090 |
| Simon Property Group, Inc. | 1,536,110 | 211,307,292 |
| SITE Centers Corp. | 840,267 | 13,066,152 |
| Spirit Realty Capital, Inc. | 576,563 | 26,735,226 |
| Tanger Factory Outlet Centers, Inc. | 486,779 | 8,119,474 |
| The Macerich Co. | 996,418 | 15,245,195 |
| The Necessity Retail REIT, Inc. | 575,620 | 4,052,365 |
| Urban Edge Properties | 514,734 | 9,378,453 |
| | | 775,931,084 |
| |
| Specialized REITs 37.2% |
| American Tower Corp. | 2,123,109 | 481,669,739 |
| Crown Castle International Corp. | 2,014,916 | 335,664,856 |
| CubeSmart | 1,013,439 | 48,857,894 |
| CyrusOne, Inc. | 593,282 | 53,603,029 |
| Digital Realty Trust, Inc. | 1,326,610 | 178,986,221 |
| EPR Properties | 349,776 | 17,418,845 |
| Equinix, Inc. | 401,762 | 285,142,544 |
| Extra Space Storage, Inc. | 625,895 | 117,762,144 |
| Four Corners Property Trust, Inc. | 361,615 | 9,539,404 |
| Gaming & Leisure Properties, Inc. | 1,058,559 | 48,069,164 |
| SECURITY | NUMBER
OF SHARES | VALUE ($) |
| Gladstone Land Corp. | 145,046 | 4,335,425 |
| Iron Mountain, Inc. | 1,353,578 | 66,568,966 |
| Lamar Advertising Co., Class A | 405,838 | 44,260,692 |
| Life Storage, Inc. | 383,435 | 48,539,037 |
| National Storage Affiliates Trust | 383,269 | 22,333,085 |
| Outfront Media, Inc. | 680,926 | 18,180,724 |
| PotlatchDeltic Corp. | 313,727 | 17,223,612 |
| Public Storage | 713,151 | 253,182,868 |
| Rayonier, Inc. | 669,424 | 26,576,133 |
| Safehold, Inc. | 65,885 | 4,042,704 |
| SBA Communications Corp. | 508,510 | 154,276,849 |
| The GEO Group, Inc. * | 571,150 | 3,404,054 |
| Uniti Group, Inc. | 1,102,130 | 14,294,626 |
| VICI Properties, Inc. | 2,940,199 | 82,207,964 |
| Weyerhaeuser Co. | 3,501,487 | 136,137,815 |
| | | 2,472,278,394 |
Total Common Stocks
(Cost $5,628,610,161) | 6,631,268,822 |
| | | |
| SHORT-TERM INVESTMENTS 0.1% OF NET ASSETS |
| |
| Money Market Funds 0.1% |
| State Street Institutional U.S. Government Money Market Fund, Premier Class 0.03% (a) | 4,221,708 | 4,221,708 |
Total Short-Term Investments
(Cost $4,221,708) | 4,221,708 |
Total Investments in Securities
(Cost $5,632,831,869) | 6,635,490,530 |
| | NUMBER OF
CONTRACTS | NOTIONAL
AMOUNT
($) | CURRENT VALUE/
UNREALIZED
DEPRECIATION
($) |
| FUTURES CONTRACTS |
| Long | | | |
| Dow Jones U.S. Real Estate Index, expires 03/18/22 | 434 | 17,160,360 | (159,131) |
| * | Non-income producing security. |
| (a) | The rate shown is the 7-day yield. |
| REIT — | Real Estate Investment Trust |
Schwab U.S. REIT ETF | Annual Report
Portfolio Holdings as of February 28, 2022 (continued)
The following is a summary of the inputs used to value the fund’s investments as of February 28, 2022 (see financial note 2(a) for additional information):
| DESCRIPTION | QUOTED PRICES IN
ACTIVE MARKETS FOR
IDENTICAL ASSETS
(LEVEL 1) | OTHER SIGNIFICANT
OBSERVABLE INPUTS
(LEVEL 2) | SIGNIFICANT
UNOBSERVABLE INPUTS
(LEVEL 3) | TOTAL |
| Asset | | | | |
| Common Stocks1 | $6,631,268,822 | $— | $— | $6,631,268,822 |
| Short-Term Investments1 | 4,221,708 | — | — | 4,221,708 |
| Liabilities | | | | |
| Futures Contracts2 | (159,131) | — | — | (159,131) |
| Total | $6,635,331,399 | $— | $— | $6,635,331,399 |
| 1 | As categorized in the Portfolio Holdings. |
| 2 | Futures contracts are reported at cumulative unrealized appreciation or depreciation. |
Fund investments in mutual funds are classified as Level 1, without consideration to the classification level of the underlying securities held by the mutual funds, which could be Level 1, Level 2 or Level 3.
Schwab U.S. REIT ETF | Annual Report
Statement of Assets and Liabilities
As of February 28, 2022
| Assets |
| Investments in securities, at value - unaffiliated (cost $5,632,831,869) | | $6,635,490,530 |
| Cash | | 9,671,970 |
| Deposit with broker for futures contracts | | 871,699 |
| Receivables: | | |
| Investments sold | | 4,637,184 |
| Dividends | + | 3,076,998 |
| Total assets | | 6,653,748,381 |
| Liabilities |
| Payables: | | |
| Fund shares redeemed | | 4,659,057 |
| Management fees | | 358,541 |
| Variation margin on futures contracts | + | 256,190 |
| Total liabilities | | 5,273,788 |
| Net assets | | $6,648,474,593 |
| Net Assets by Source |
| Capital received from investors | | $6,570,249,837 |
| Total distributable earnings | + | 78,224,756 |
| Net assets | | $6,648,474,593 |
| Net Asset Value (NAV) |
| Net Assets | ÷ | Shares
Outstanding | = | NAV |
| $6,648,474,593 | | 142,700,000 | | $46.59 |
| | | | | |
| | | | | |
Schwab U.S. REIT ETF | Annual Report
Statement of Operations
| For the period March 1, 2021 through February 28, 2022 |
| Investment Income |
| Dividends received from securities - unaffiliated | | $116,998,756 |
| Securities on loan, net | + | 8,747 |
| Total investment income | | 117,007,503 |
| Expenses |
| Management fees | | 4,356,629 |
| Total expenses | – | 4,356,629 |
| Net investment income | | 112,650,874 |
| REALIZED AND UNREALIZED GAINS (LOSSES) |
| Net realized gains on sales of securities - unaffiliated | | 51,639,682 |
| Net realized gains on sales of in-kind redemptions - unaffiliated | | 86,840,809 |
| Net realized gains on futures contracts | + | 2,440,689 |
| Net realized gains | | 140,921,180 |
| Net change in unrealized appreciation (depreciation) on securities - unaffiliated | | 808,967,965 |
| Net change in unrealized appreciation (depreciation) on futures contracts | + | (52,683) |
| Net change in unrealized appreciation (depreciation) | + | 808,915,282 |
| Net realized and unrealized gains | | 949,836,462 |
| Increase in net assets resulting from operations | | $1,062,487,336 |
Schwab U.S. REIT ETF | Annual Report
Statement of Changes in Net Assets
For the current and prior report periods
| OPERATIONS |
| | 3/1/21-2/28/22 | 3/1/20-2/28/21 |
| Net investment income | | $112,650,874 | $105,906,627 |
| Net realized gains (losses) | | 140,921,180 | (613,991,983) |
| Net change in unrealized appreciation (depreciation) | + | 808,915,282 | 150,444,259 |
| Increase (decrease) in net assets resulting from operations | | $1,062,487,336 | ($357,641,097) |
| DISTRIBUTIONS TO SHAREHOLDERS |
| Total distributions | | ($105,641,785) | ($134,110,850) |
| TRANSACTIONS IN FUND SHARES |
| | 3/1/21-2/28/22 | 3/1/20-2/28/21 |
| | | SHARES | VALUE | SHARES | VALUE |
| Shares sold | | 23,550,000 | $1,103,067,576 | 40,350,000 | $1,438,051,306 |
| Shares redeemed | + | (6,400,000) | (303,344,302) | (50,000,000) | (1,771,789,053) |
| Net transactions in fund shares | | 17,150,000 | $799,723,274 | (9,650,000) | ($333,737,747) |
| SHARES OUTSTANDING AND NET ASSETS |
| | 3/1/21-2/28/22 | 3/1/20-2/28/21 |
| | | SHARES | NET ASSETS | SHARES | NET ASSETS |
| Beginning of period | | 125,550,000 | $4,891,905,768 | 135,200,000 | $5,717,395,462 |
| Total increase (decrease) | + | 17,150,000 | 1,756,568,825 | (9,650,000) | (825,489,694) |
| End of period | | 142,700,000 | $6,648,474,593 | 125,550,000 | $4,891,905,768 |
Schwab U.S. REIT ETF | Annual Report
1. Business Structure of the Fund:
Schwab U.S. REIT ETF is a series of Schwab Strategic Trust (the trust), a no-load, open-end management investment company. The trust is organized as a Delaware statutory trust and is registered under the Investment Company Act of 1940, as amended (the 1940 Act). The list below shows all the operational funds in the trust as of the end of the period, including the fund discussed in this report, which is highlighted:
| SCHWAB STRATEGIC TRUST (ORGANIZED JANUARY 27, 2009) |
| Schwab U.S. REIT ETF | Schwab U.S. TIPS ETF |
| Schwab U.S. Broad Market ETF | Schwab Short-Term U.S. Treasury ETF |
| Schwab 1000 Index® ETF | Schwab Intermediate-Term U.S. Treasury ETF |
| Schwab U.S. Large-Cap ETF | Schwab Long-Term U.S. Treasury ETF |
| Schwab U.S. Large-Cap Growth ETF | Schwab U.S. Aggregate Bond ETF |
| Schwab U.S. Large-Cap Value ETF | Schwab 1-5 Year Corporate Bond ETF |
| Schwab U.S. Mid-Cap ETF | Schwab 5-10 Year Corporate Bond ETF |
| Schwab U.S. Small-Cap ETF | Schwab Fundamental U.S. Broad Market Index ETF |
| Schwab U.S. Dividend Equity ETF | Schwab Fundamental U.S. Large Company Index ETF |
| Schwab International Dividend Equity ETF | Schwab Fundamental U.S. Small Company Index ETF |
| Schwab International Equity ETF | Schwab Fundamental International Large Company Index ETF |
| Schwab International Small-Cap Equity ETF | Schwab Fundamental International Small Company Index ETF |
| Schwab Emerging Markets Equity ETF | Schwab Fundamental Emerging Markets Large Company Index ETF |
| | Schwab Ariel ESG ETF |
The fund issues and redeems shares at its net asset value per share (NAV) only in large blocks of shares (Creation Units). These transactions are usually in exchange for a basket of securities and/or an amount of cash. As a practical matter, only institutional investors who have entered into an authorized participant agreement purchase or redeem Creation Units. Except when aggregated in Creation Units, shares of the fund are not redeemable securities.
Individual shares of the fund trade on national securities exchanges and elsewhere during the trading day and can only be bought and sold at market prices throughout the trading day through a broker-dealer. Because fund shares trade at market prices rather than NAV, shares may trade at a price greater than NAV (premium) or less than NAV (discount). A chart showing the frequency at which the fund’s daily closing market price was at a discount or premium to the fund’s NAV can be found at www.schwabassetmanagement.com.
The fund maintains its own account for purposes of holding assets and accounting, and is considered a separate entity for tax purposes. Within its account, the fund may also keep certain assets in segregated accounts, as required by securities law.
2. Significant Accounting Policies:
The following is a summary of the significant accounting policies the fund uses in its preparation of financial statements. The fund follows the investment company accounting and reporting guidance of the Financial Accounting Standards Board (FASB) Accounting Standard Codification Topic 946 Financial Services — Investment Companies. The accounting policies are in conformity with accounting principles generally accepted in the United States of America (GAAP).
The fund may invest in certain mutual funds and exchange-traded funds (ETFs), which are referred to as "underlying funds". For more information about the underlying funds’ operations and policies, please refer to those funds’ semiannual and annual reports, which are filed with the U.S. Securities and Exchange Commission (SEC) and are available on the SEC’s website at www.sec.gov.
(a) Security Valuation
Under procedures approved by the fund’s Board of Trustees (the Board), the investment adviser has formed a Pricing Committee to administer the pricing and valuation of portfolio securities and other assets and to ensure that prices used for internal purposes or provided by third parties reasonably reflect fair value. Among other things, these procedures allow the fund to utilize independent pricing services, quotations from securities and financial instrument dealers and other market sources to determine fair value.
Schwab U.S. REIT ETF | Annual Report
Financial Notes (continued)
2. Significant Accounting Policies (continued):
The fund values the securities in its portfolio every business day. The fund uses the following policies to value various types of securities:
• Securities traded on an exchange or over-the-counter: Traded securities are valued at the closing value for the day, or, on days when no closing value has been reported, at the mean of the most recent bid and ask quotes. Securities that are primarily traded on foreign exchanges are valued at the official closing price or the last sales price on the exchange where the securities are principally traded with these values then translated into U.S. dollars at the current exchange rate, unless these securities are fair valued as discussed below.
• Futures contracts: Futures contracts are valued at their settlement prices as of the close of their exchanges.
• Mutual funds: Mutual funds are valued at their respective NAVs.
• Securities for which no quoted value is available: The Board has adopted procedures to fair value the fund’s securities when market prices are not “readily available” or are unreliable. For example, a fund may fair value a security when it is de-listed or its trading is halted or suspended; when a security’s primary pricing source is unable or unwilling to provide a price; or when a security’s primary trading market is closed during regular market hours. The fund makes fair value determinations in good faith in accordance with the fund’s valuation procedures. The Pricing Committee considers a number of factors, including unobservable market inputs when arriving at fair value. The Pricing Committee may employ techniques such as the review of related or comparable assets or liabilities, related market activities, recent transactions, market multiples, book values, transactional back-testing, disposition analysis and other relevant information. The Pricing Committee regularly reviews these inputs and assumptions to calibrate the valuations. Due to the subjective and variable nature of fair value pricing, there can be no assurance that the fund could obtain the fair value assigned to the security upon the sale of such security. The Board convenes on a regular basis to review fair value determinations made by the fund pursuant to the valuation procedures.
In accordance with the authoritative guidance on fair value measurements and disclosures under GAAP, the fund discloses the fair value of its investments in a hierarchy that prioritizes the significant inputs to valuation techniques used to measure the fair value. The hierarchy gives the highest priority to valuations based upon unadjusted quoted prices in active markets for identical assets or liabilities (Level 1 measurements) and the lowest priority to valuations based upon unobservable inputs that are significant to the valuation (Level 3 measurements). If inputs used to measure the financial instruments fall within different levels of the hierarchy, the categorization is based on the lowest level input that is significant to the valuation. If the fund determines that either the volume and/or level of activity for an asset or liability has significantly decreased (from normal conditions for that asset or liability) or price quotations or observable inputs are not associated with orderly transactions, increased analysis and management judgment will be required to estimate fair value.
The three levels of the fair value hierarchy are as follows:
• Level 1 — quoted prices in active markets for identical securities — Investments whose values are based on quoted market prices in active markets, and whose values are therefore classified as Level 1 prices, include active listed equities, mutual funds and futures contracts. Investments in mutual funds are valued daily at their NAVs, which are classified as Level 1 prices, without consideration to the classification level of the underlying securities held by an underlying fund.
• Level 2 — other significant observable inputs (including quoted prices for similar securities, interest rates, prepayment speeds, credit risk, etc.) — Investments that trade in markets that are not considered to be active, but whose values are based on quoted market prices, dealer quotations or valuations provided by alternative pricing sources supported by observable inputs are classified as Level 2 prices. These generally include U.S. government and sovereign obligations, most government agency securities, investment-grade corporate bonds, certain mortgage products, less liquid listed equities, and state, municipal and provincial obligations.
• Level 3 — significant unobservable inputs (including the fund’s own assumptions in determining the fair value of investments) — Investments whose values are classified as Level 3 prices have significant unobservable inputs, as they may trade infrequently or not at all. When observable prices are not available for these securities, the fund uses one or more valuation techniques for which sufficient and reliable data is available. The inputs used by the fund in estimating the value of Level 3 prices may include the original transaction price, quoted prices for similar securities or assets in active markets, completed or pending third-party transactions in the underlying investment or comparable issuers, and changes in financial ratios or cash flows. Level 3 prices may also be adjusted to reflect illiquidity and/or non-transferability, with the amount of such discount estimated by the fund in the absence of market information. Assumptions used by the fund due to the lack of observable inputs may significantly impact the resulting fair value and therefore the fund’s results of operations.
Schwab U.S. REIT ETF | Annual Report
Financial Notes (continued)
2. Significant Accounting Policies (continued):
The inputs or methodology used for valuing securities are not necessarily an indication of the risk associated with investing in those securities.
The levels associated with valuing the fund’s investments as of February 28, 2022 are disclosed in the Portfolio Holdings.
(b) Accounting Policies for certain Portfolio Investments (if held):
Futures Contracts: Futures contracts are instruments that represent an agreement between two parties that obligates one party to buy, and the other party to sell, specific instruments at an agreed upon price on a stipulated future date. The fund must give the broker a deposit of cash and/or securities (initial margin) whenever it enters into a futures contract. The amount of the deposit may vary from one contract to another. Subsequent payments (variation margin) are made or received by the fund depending on the daily fluctuations in the value of the futures contract and are accounted for as unrealized appreciation or depreciation until the contract is closed, at which time the gains or losses are realized. Futures contracts are traded publicly on exchanges, and their value may change daily.
Securities Lending: Under the trust’s Securities Lending Program, the fund (lender) may make short-term loans of its securities to another party (borrower) to generate additional revenue for the fund. The borrower pledges collateral in the form of cash, securities issued or fully guaranteed by the U.S. government or foreign governments, or letters of credit issued by a bank. Collateral at the individual loan level is required to be maintained on a daily marked-to-market basis in an amount at least equal to the current value of the securities loaned. The lending agent provides the fund with indemnification against borrower default (the borrower fails to return the security on loan) reducing the risk of loss as a result of default. The cash collateral of securities loaned is currently invested in money market portfolios operating pursuant to Rule 2a-7 under the 1940 Act. The fund bears the risk of loss with respect to the investment of cash collateral. The terms of the securities lending agreement allow the fund or the lending agent to terminate any loan at any given time and the securities must be returned within the earlier of the standard trade settlement period or the specified time period under the relevant securities lending agreements. Securities lending income, as disclosed in the fund’s Statement of Operations, if applicable, represents the income earned from the investment of the cash collateral plus any fees paid by borrowers, less the fees paid to the lending agent and broker rebates which are subject to adjustments pursuant to the securities lending agreement. On loans not collateralized by cash, a fee is received from the borrower, and is allocated between the fund and the lending agent. The aggregate fair value of securities loaned will not at any time exceed one-third of the total assets of the fund, including collateral received from the loan. Securities lending fees paid to the unaffiliated lending agents start at 10% of gross lending revenue, with subsequent breakpoints to a low of 5%. In this context, the gross lending revenue equals the income received from the investment of cash collateral and fees paid by borrowers less any rebates paid to the borrowers. Any expenses charged by the cash collateral fund are in addition to these fees. All remaining revenue is retained by the fund, as applicable. No portion of lending revenue is paid to or retained by the investment adviser or any of its affiliates.
As of February 28, 2022, the fund had no securities on loan.
(c) Security Transactions:
Security transactions are recorded as of the date the order to buy or sell the security is executed. Realized gains and losses from security transactions are based on the identified costs of the securities involved.
When the fund closes out a futures contract position, it calculates the difference between the value of the position at the beginning and at the end of the contract, and records a realized gain or loss accordingly.
The fund invests in real estate investment trusts (REITs) which report information on the source of their distributions annually. The fund’s policy is to record all REIT distributions initially as dividend income on the ex-dividend date and then re-designate them as return of capital and/or capital gain distributions at the end of the reporting period based on information provided annually by each REIT, and management estimates such re-designations when actual information has not yet been reported.
(d) Investment Income:
Interest income is recorded as it accrues. Dividends and distributions from portfolio securities and underlying funds are recorded on the date they are effective (the ex-dividend date), although the fund records certain foreign security dividends on the date the ex-dividend is confirmed. Any distributions from underlying funds are recorded in accordance with the character of the distributions as designated by the underlying funds.
Schwab U.S. REIT ETF | Annual Report
Financial Notes (continued)
2. Significant Accounting Policies (continued):
(e) Expenses:
Pursuant to the Amended and Restated Advisory Agreement (Advisory Agreement) between the investment adviser and the trust, the investment adviser will pay the operating expenses of the fund, excluding taxes, any brokerage expenses, and extraordinary or non-routine expenses. Taxes, any brokerage expenses and extraordinary or non-routine expenses that are specific to the fund are charged directly to the fund.
(f) Distributions to Shareholders:
The fund makes distributions from net investment income, if any, quarterly and from net realized capital gains, if any, once a year. To receive a distribution, you must be a registered shareholder on the record date. Distributions are paid to shareholders on the payable date.
(g) Accounting Estimates:
The accounting policies described in this report conform to GAAP. Notwithstanding this, shareholders should understand that in order to follow these principles, fund management has to make estimates and assumptions that affect the information reported in the financial statements. It’s possible that once the results are known, they may turn out to be different from these estimates and these differences may be material.
(h) Federal Income Taxes:
The fund intends to meet federal income and excise tax requirements for regulated investment companies under subchapter M of the Internal Revenue Code, as amended. Accordingly, the fund distributes substantially all of its net investment income and net realized capital gains, if any, to its shareholders each year. As long as the fund meets the tax requirements, it is not required to pay federal income tax.
(i) Indemnification:
Under the fund’s organizational documents, the officers and trustees are indemnified against certain liabilities arising out of the performance of their duties to the fund. In addition, in the normal course of business the fund enters into contracts with its vendors and others that provide general indemnifications. The fund’s maximum exposure under these arrangements is unknown as this would involve future claims that may be made against the fund. However, based on experience, the fund expects the risk of loss attributable to these arrangements to be remote.
3. Risk Factors:
Investing in the fund may involve certain risks, as discussed in the fund’s prospectus, including, but not limited to, those described below. Any of these risks could cause an investor to lose money.
Market Risk. Financial markets rise and fall in response to a variety of factors, sometimes rapidly and unpredictable. Markets may be impacted by economic, political, regulatory and other conditions, including economic sanctions and other government actions. In addition, the occurrence of global events, such as war, terrorism, environmental disasters, natural disasters and epidemics, may also negatively affect the financial markets. As with any investment whose performance is tied to these markets, the value of an investment in the fund will fluctuate, which means that an investor could lose money over short or long periods.
Investment Style Risk. The fund is an index fund. Therefore, the fund follows the securities included in the index during upturns as well as downturns. Because of its indexing strategy, the fund does not take steps to reduce market exposure or to lessen the effects of a declining market. In addition, because of the fund’s expenses, the fund’s performance may be below that of the index. Errors relating to the index may occur from time to time and may not be identified by the index provider for a period of time. In addition, market disruptions could cause delays in the index’s rebalancing schedule. Such errors and/or market disruptions may result in losses for the fund.
Equity Risk. The prices of equity securities rise and fall daily. These price movements may result from factors affecting individual companies, industries or the securities market as a whole. In addition, equity markets tend to move in cycles, which may cause stock prices to fall over short or extended periods of time.
Market Capitalization Risk. Securities issued by companies of different market capitalizations tend to go in and out of favor based on market and economic conditions. During a period when securities of a particular market capitalization fall behind other types of investments, the fund’s performance could be impacted.
Schwab U.S. REIT ETF | Annual Report
Financial Notes (continued)
3. Risk Factors (continued):
Large-Cap Company Risk. Large-cap companies are generally more mature and the securities issued by these companies may not be able to reach the same levels of growth as the securities issued by small- or mid-cap companies.
Mid-Cap Company Risk. Mid-cap companies may be more vulnerable to adverse business or economic events than larger, more established companies and the value of securities issued by these companies may move sharply.
Small-Cap Company Risk. Securities issued by small-cap companies may be riskier than those issued by larger companies, and their prices may move sharply, especially during market upturns and downturns.
Real Estate Investment Risk. Due to the composition of the index, the fund concentrates its investments in real estate companies and companies related to the real estate industry. As such, the fund is subject to risks associated with the direct ownership of real estate securities and an investment in the fund will be closely linked to the performance of the real estate markets. These risks include, among others: declines in the value of real estate; risks related to general and local economic conditions; possible lack of availability of mortgage funds or other limits to accessing the credit or capital markets; defaults by borrowers or tenants, particularly during an economic downturn; and changes in interest rates.
REITs Risk. In addition to the risks associated with investing in securities of real estate companies and real estate related companies, REITs are subject to certain additional risks. Equity REITs may be affected by changes in the value of the underlying properties owned by the trusts. Further, REITs are dependent upon specialized management skills and cash flows, and may have their investments in relatively few properties, or in a small geographic area or a single property type. Failure of a company to qualify as a REIT under federal tax law may have adverse consequences to the fund. In addition, REITs have their own expenses, and the fund will bear a proportionate share of those expenses.
Tracking Error Risk. As an index fund, the fund seeks to track the performance of its index, although it may not be successful in doing so. The divergence between the performance of the fund and the index, positive or negative, is called “tracking error.” Tracking error can be caused by many factors and it may be significant.
Derivatives Risk. The principal types of derivatives used by the fund are futures contracts. A future is an agreement to buy or sell a financial instrument at a specific price on a specific day. The fund’s use of derivatives that are subject to regulation by the Commodity Futures Trading Commission (CFTC) could cause the fund to become a commodity pool, which would require the fund to comply with certain CFTC rules.
The fund’s use of derivative instruments involves risks different from, or possibly greater than, the risks associated with investing directly in securities and other traditional investments. Certain of these risks, such as liquidity risk, leverage risk and market risk, are discussed elsewhere in this section. The fund’s use of derivatives is also subject to counterparty risk, lack of availability risk, valuation risk, correlation risk and tax risk. Counterparty risk is the risk that the counterparty to a derivatives transaction may not fulfill its contractual obligations either because the financial condition of the counterparty declines, or because the counterparty is otherwise unable or unwilling to perform under the contract. Lack of availability risk is the risk that suitable derivative transactions may not be available in all circumstances for risk management or other purposes. Valuation risk is the risk that a particular derivative may be valued incorrectly. Correlation risk is the risk that changes in the value of the derivative may not correlate perfectly with the underlying asset, rate or index. Tax risk is the risk that the use of derivatives may cause the fund to realize higher amounts of short-term capital gains. The fund’s use of derivatives could reduce the fund’s performance, increase the fund’s volatility and could cause the fund to lose more than the initial amount invested.
Concentration Risk. To the extent that the fund’s or the index’s portfolio is concentrated in the securities of issuers in a particular market, industry, group of industries, sector or asset class (including the real estate industry, as described above), the fund may be adversely affected by the performance of those securities, may be subject to increased price volatility and may be more vulnerable to adverse economic, market, political or regulatory occurrences affecting that market, industry, group of industries, sector or asset class.
Liquidity Risk. The fund may be unable to sell certain securities, such as illiquid securities, readily at a favorable time or price, or the fund may have to sell them at a loss.
Leverage Risk. Certain fund transactions, such as derivatives transactions, may give rise to a form of leverage and may expose the fund to greater risk. Leverage tends to magnify the effect of any decrease or increase in the value of the fund’s portfolio securities which means even a small amount of leverage can have a disproportionately large impact on the fund. The use of leverage may cause the fund to liquidate portfolio positions when it would not be advantageous to do so in order to satisfy its obligations.
Securities Lending Risk. Securities lending involves the risk of loss of rights in, or delay in recovery of, the loaned securities if the borrower fails to return the security loaned or becomes insolvent.
Schwab U.S. REIT ETF | Annual Report
Financial Notes (continued)
3. Risk Factors (continued):
Market Trading Risk. Although fund shares are listed on national securities exchanges, there can be no assurance that an active trading market for fund shares will develop or be maintained. If an active market is not maintained, investors may find it difficult to buy or sell fund shares.
Shares of the Fund May Trade at Prices Other Than NAV. Fund shares may be bought and sold in the secondary market at market prices. Although it is expected that the market price of the shares of the fund will approximate the fund’s NAV, there may be times when the market price and the NAV vary significantly. An investor may pay more than NAV when buying shares of the fund in the secondary market, and an investor may receive less than NAV when selling those shares in the secondary market. The market price of fund shares may deviate, sometimes significantly, from NAV during periods of market volatility or market disruption.
Please refer to the fund’s prospectus for a more complete description of the principal risks of investing in the fund.
4. Affiliates and Affiliated Transactions:
Investment Adviser
Charles Schwab Investment Management, Inc., dba Schwab Asset Management, a wholly owned subsidiary of The Charles Schwab Corporation, serves as the fund’s investment adviser pursuant to the Advisory Agreement between the investment adviser and the trust.
For its advisory services to the fund, the investment adviser is entitled to receive an annual management fee, payable monthly, equal to 0.07% of the fund’s average daily net assets.
Investment from Affiliates
Certain funds in the Fund Complex (for definition refer to the Trustees and Officers section) may own shares of other funds in the Fund Complex. The table below reflects the percentage of shares of the fund that are owned by other funds in the Fund Complex as of February 28, 2022.
| | UNDERLYING FUND |
| Schwab MarketTrack All Equity Portfolio | 0.6% |
| Schwab MarketTrack Balanced Portfolio | 0.3% |
| Schwab MarketTrack Conservative Portfolio | 0.1% |
| Schwab MarketTrack Growth Portfolio | 0.5% |
| Schwab Target 2010 Index Fund | 0.0%* |
| Schwab Target 2015 Index Fund | 0.0%* |
| Schwab Target 2020 Index Fund | 0.1% |
| Schwab Target 2025 Index Fund | 0.3% |
| Schwab Target 2030 Index Fund | 0.5% |
| Schwab Target 2035 Index Fund | 0.4% |
| Schwab Target 2040 Index Fund | 0.5% |
| Schwab Target 2045 Index Fund | 0.3% |
| Schwab Target 2050 Index Fund | 0.4% |
| Schwab Target 2055 Index Fund | 0.3% |
| Schwab Target 2060 Index Fund | 0.3% |
| Schwab Target 2065 Index Fund | 0.0%* |
| Schwab VIT Balanced Portfolio | 0.1% |
| Schwab VIT Balanced with Growth Portfolio | 0.2% |
| Schwab VIT Growth Portfolio | 0.2% |
Schwab U.S. REIT ETF | Annual Report
Financial Notes (continued)
4. Affiliates and Affiliated Transactions (continued):
Interfund Transactions
The fund may engage in direct transactions with certain other funds in the Fund Complex in accordance with procedures adopted by the Board pursuant to Rule 17a-7 under the 1940 Act. When one fund is seeking to sell a security that another is seeking to buy, an interfund transaction can allow both funds to benefit by reducing transaction costs. This practice is limited to funds that share the same investment adviser, trustees and/or officers. For the period ended February 28, 2022, the fund’s purchases and sales of securities with other funds in the Fund Complex was $14,581,333 and $50,150,922, respectively, and includes realized losses of $3,599,960.
Interfund Borrowing and Lending
Pursuant to an exemptive order issued by the SEC, the fund may enter into interfund borrowing and lending transactions with other funds in the Fund Complex. All loans are for temporary or emergency purposes and the interest rate to be charged will be the average of the overnight repurchase agreement rate and the short-term bank loan rate. All loans are subject to numerous conditions designed to ensure fair and equitable treatment of all participating funds. The interfund lending facility is subject to the oversight and periodic review of the Board. The fund had no interfund borrowing or lending activity during the period.
5. Other Service Providers:
SEI Investments Distribution Co. is the principal underwriter and distributor of shares of the fund.
State Street Bank and Trust Company (State Street) serves as the fund’s transfer agent. As part of these services, the transfer agent maintains records pertaining to the sale, redemption and transfer of the fund’s shares. The transfer agent is also responsible for the order-taking function for the fund’s shares.
State Street also serves as custodian and accountant for the fund. The custodian is responsible for the daily safekeeping of securities and cash held by the fund. The fund’s accountant maintains all books and records related to the fund’s transactions.
6. Board of Trustees:
The Board may include people who are officers and/or directors of the investment adviser or its affiliates. Federal securities law limits the percentage of such “interested persons” who may serve on a trust’s board, and the trust was in compliance with these limitations throughout the report period. The trust does not pay any interested or non-interested trustees (independent trustees). The independent trustees are paid by the investment adviser. For information regarding the trustees, please refer to the Trustees and Officers table at the end of this report.
7. Borrowing from Banks:
During the period, the fund was a participant with other funds in the Fund Complex in a joint, syndicated, committed $850 million line of credit (the Syndicated Credit Facility), which matured on September 30, 2021. On September 30, 2021, the Syndicated Credit Facility was amended to run for a new 364 day period with the line of credit amount remaining unchanged, maturing on September 29, 2022. Under the terms of the Syndicated Credit Facility, in addition to the investment adviser paying the interest charged on any borrowings by the fund, the investment adviser paid a commitment fee of 0.15% per annum on the fund’s proportionate share of the unused portion of the Syndicated Credit Facility.
During the period, the fund was a participant with other funds in the Fund Complex in a joint, unsecured, uncommitted $400 million line of credit (the Uncommitted Credit Facility), with State Street, which matured on September 30, 2021. On September 30, 2021, the Uncommitted Credit Facility was amended to run for a new 364 day period with the line of credit amount remaining unchanged, maturing on September 29, 2022. Under the terms of the Uncommitted Credit Facility, the investment adviser pays interest on the amount it borrows. There were no borrowings from either line of credit during the period.
The fund also has access to custodian overdraft facilities. The fund may have utilized the overdraft facility and incurred an interest expense, which is paid by the investment adviser. The interest expense is determined based on a negotiated rate above the current Federal Funds Rate.
Schwab U.S. REIT ETF | Annual Report
Financial Notes (continued)
The fund entered into equity index futures contracts during the report period. The fund invested in futures contracts to equitize available cash. The value and variation margin for futures contracts held at February 28, 2022 are presented in the Portfolio Holdings and Statement of Assets and Liabilities, respectively. The net realized gains (losses) and net change in unrealized appreciation (depreciation) on futures contracts are presented in the Statement of Operations. Refer to financial note 2(b) for the fund’s accounting policies with respect to futures contracts and financial note 3 for disclosures concerning the risks of investing in futures contracts. During the period ended February 28, 2022, the month-end average notional amounts of futures contracts held by the fund was $12,688,288 and the month-end average number of contracts held was 314.
9. Purchases and Sales of Investment Securities:
For the period ended February 28, 2022, purchases and sales of securities (excluding in-kind transactions and short-term obligations) were as follows:
PURCHASES
OF SECURITIES | SALES
OF SECURITIES |
| $441,372,720 | $297,738,782 |
10. In-Kind Transactions:
The consideration for the purchase of Creation Units of the fund often consists of the in-kind deposit of a designated portfolio of equity securities, which constitutes an optimized representation of the securities involved in a relevant fund’s underlying index, and an amount of cash. Investors purchasing and redeeming Creation Units are subject to a standard creation transaction fee and a standard redemption transaction fee paid to the custodian to offset transfer and other transaction costs associated with the issuance and redemption of Creation Units. Purchasers and redeemers of Creation Units for cash are subject to an additional variable charge paid to the fund that will offset the transaction costs to the fund of buying or selling portfolio securities. In addition, purchasers and redeemers of shares in Creation Units are responsible for payment of the costs of transferring securities to or out of the fund. From time to time, the investment adviser may cover the cost of any transaction fees when believed to be in the best interests of the fund.
The in-kind transactions for the period ended February 28, 2022, were as follows:
IN-KIND PURCHASES
OF SECURITIES | IN-KIND SALES
OF SECURITIES |
| $1,066,319,218 | $270,078,882 |
For the period ended February 28, 2022, the fund realized net capital gains or losses resulting from in-kind redemptions of Creation Units. Because such gains or losses are not taxable to the fund and are not distributed to existing fund shareholders, the gains or losses are reclassified from accumulated net realized gains or losses to capital received from investors at the end of the fund’s tax year. These reclassifications have no effect on net assets or net asset values per share. The net realized in-kind gains or losses for the period ended February 28, 2022 are disclosed in the fund’s Statement of Operations.
11. Federal Income Taxes:
As of February 28, 2022, the tax basis cost of the fund’s investments and gross unrealized appreciation and depreciation were as follows:
| TAX COST | GROSS UNREALIZED
APPRECIATION | GROSS UNREALIZED
DEPRECIATION | NET UNREALIZED
APPRECIATION
(DEPRECIATION) |
| $5,684,924,648 | $1,181,807,831 | ($231,401,080) | $950,406,751 |
As of February 28, 2022, the components of distributable earnings on a tax basis were as follows:
UNDISTRIBUTED
ORDINARY
INCOME | NET UNREALIZED
APPRECIATION
(DEPRECIATION)
ON INVESTMENTS | CAPITAL LOSS
CARRYFORWARDS | TOTAL |
| $5,460,881 | $950,406,751 | ($877,642,876) | $78,224,756 |
Schwab U.S. REIT ETF | Annual Report
Financial Notes (continued)
11. Federal Income Taxes (continued):
The primary difference between book basis and tax basis unrealized appreciation or unrealized depreciation of investments is the tax deferral of losses on wash sales and realization for tax purposes of unrealized appreciation or depreciation on futures contracts. The tax cost of the fund’s investments, disclosed above, have been adjusted from its book amounts to reflect these unrealized appreciation or depreciation differences, as applicable.
Capital loss carryforwards have no expiration and may be used to offset future realized capital gains for federal income tax purposes. As of February 28, 2022, the fund had capital loss carryforwards of $877,642,876.
For the fiscal year ended February 28, 2022, the fund had capital loss carryforwards utilized of $47,993,746.
The tax basis components of distributions paid during the current and prior fiscal years were as follows:
| | CURRENT FISCAL YEAR END DISTRIBUTIONS | PRIOR FISCAL YEAR END DISTRIBUTIONS |
| | ORDINARY
INCOME | ORDINARY
INCOME |
| | $105,641,785 | $134,110,850 |
Distributions paid to shareholders are based on net investment income and net realized gains determined on a tax basis, which may differ from net investment income and net realized gains for financial reporting purposes. These differences reflect the differing character of certain income items and net realized gains and losses for financial statement and tax purposes, and may result in reclassification among certain capital accounts on the financial statements. The fund may also designate a portion of the amount paid to redeeming shareholders as a distribution for tax purposes.
Permanent book and tax basis differences may result in reclassifications between components of net assets as required. The adjustments have no impact on net assets or the results of operations.
As of February 28, 2022, management has reviewed the tax positions for open periods (for federal purposes, three years from the date of filing and for state purposes, four years from the date of filing) as applicable to the fund, and has determined that no provision for income tax is required in the fund’s financial statements. The fund recognizes interest and penalties, if any, related to unrecognized tax benefits as income tax expense in the Statement of Operations. During the period ended February 28, 2022, the fund did not incur any interest or penalties.
12. Subsequent Events:
Effective February 24, 2022, the Board authorized a 2-for-1 share split for the Schwab U.S. REIT ETF which applied to shareholders of record as of the close of markets on March 8, 2022, and paid after the close of the markets on March 10, 2022. Shares began trading at their post-split price on March 11, 2022. The share split increased the number of shares outstanding and decreased the NAV per share. The share split did not change the total value of a shareholder’s investment.
Other than the planned changes for the 2-for-1 share split as discussed above, management has determined there are no subsequent events or transactions through the date the financial statements were issued that would have materially impacted the financial statements as presented.
Schwab U.S. REIT ETF | Annual Report
Report of Independent Registered Public Accounting Firm
To the Board of Trustees of Schwab Strategic Trust and Shareholders of Schwab U.S. REIT ETF:
Opinion on the Financial Statements and Financial Highlights
We have audited the accompanying statement of assets and liabilities, including the portfolio holdings, of Schwab U.S. REIT ETF (the “Fund”), one of the funds constituting Schwab Strategic Trust, as of February 28, 2022, the related statement of operations for the year then ended, the statement of changes in net assets and the financial highlights for each of the two years in the period then ended, and the related notes. In our opinion, the financial statements and financial highlights present fairly, in all material respects, the financial position of the Fund as of February 28, 2022, and the results of its operations for the year then ended, and the changes in its net assets and the financial highlights for each of the two years in the period then ended in conformity with accounting principles generally accepted in the United States of America. The financial highlights for each of the three years in the period ended February 29, 2020 were audited by other auditors, whose report, dated April 16, 2020, expressed an unqualified opinion on such financial highlights.
Basis for Opinion
These financial statements are the responsibility of the Fund’s management. Our responsibility is to express an opinion on the Fund’s financial statements and financial highlights based on our audits. We are a public accounting firm registered with the Public Company Accounting Oversight Board (United States) (PCAOB) and are required to be independent with respect to the Fund in accordance with the U.S. federal securities laws and the applicable rules and regulations of the Securities and Exchange Commission and the PCAOB.
We conducted our audits in accordance with the standards of the PCAOB. Those standards require that we plan and perform the audit to obtain reasonable assurance about whether the financial statements and financial highlights are free of material misstatement, whether due to error or fraud. The Fund is not required to have, nor were we engaged to perform, an audit of its internal control over financial reporting. As part of our audits, we are required to obtain an understanding of internal control over financial reporting but not for the purpose of expressing an opinion on the effectiveness of the Fund’s internal control over financial reporting. Accordingly, we express no such opinion.
Our audits included performing procedures to assess the risks of material misstatement of the financial statements and financial highlights, whether due to error or fraud, and performing procedures that respond to those risks. Such procedures included examining, on a test basis, evidence regarding the amounts and disclosures in the financial statements and financial highlights. Our audits also included evaluating the accounting principles used and significant estimates made by management, as well as evaluating the overall presentation of the financial statements and financial highlights. Our procedures included confirmation of securities owned as of February 28, 2022 by correspondence with the custodian and brokers; when replies were not received from brokers, we performed other auditing procedures. We believe that our audits provide a reasonable basis for our opinion.
Deloitte & Touche LLP
Denver, Colorado
April 18, 2022
We have served as the auditor of one or more investment companies in the Schwab Funds Complex since 2020.
Schwab U.S. REIT ETF | Annual Report
Other Federal Tax Information (unaudited)
For the fiscal year ended February 28, 2022, the fund designates $2,019,963 of the dividend distributions as qualified dividends for the purposes of the maximum rate under section 1(h)(11) of the Internal Revenue Code. Shareholders will be notified in January 2023 via IRS Form 1099 of the amounts for use in preparing their 2022 income tax return.
For the fiscal year ended February 28, 2022, the fund designates $103,621,822 as dividends eligible for the 20% qualified business income deduction under section 199A of the Internal Revenue Code. Shareholders will be notified in January 2023 via IRS Form 1099 of the amounts for use in preparing their 2022 income tax return.
Schwab U.S. REIT ETF | Annual Report
Liquidity Risk Management Program (Unaudited)
The Fund has adopted and implemented a liquidity risk management program (the “program”) as required by Rule 22e-4 under the Investment Company Act of 1940, as amended. The Fund’s Board of Trustees (the “Board”) has designated the Fund’s investment adviser, Charles Schwab Investment Management, Inc., dba Schwab Asset Management, as the administrator of the program. Personnel of the investment adviser or its affiliates conduct the day-to-day operation of the program.
Under the program, the investment adviser manages a Fund’s liquidity risk, which is the risk that the Fund could not meet shareholder redemption requests without significant dilution of remaining shareholders’ interests in the Fund. The program is reasonably designed to assess and manage a Fund’s liquidity risk, taking into consideration the Fund’s investment strategy and the liquidity of its portfolio investments during normal and reasonably foreseeable stressed conditions; its historical redemption history and shareholder concentrations; and its cash holdings and access to other funding sources, including the custodian overdraft facility and lines of credit. The investment adviser’s process of determining the degree of liquidity of each Fund’s investments is supported by third-party liquidity assessment vendors.
The Fund’s Board reviewed a report at its meeting held on September 20, 2021 prepared by the investment adviser regarding the operation and effectiveness of the program for the period June 1, 2020, through May 31, 2021, which included individual Fund liquidity metrics. No significant liquidity events impacting the Fund were noted in the report. In addition, the investment adviser provided its assessment that the program had been operating effectively in managing the Fund’s liquidity risk.
Schwab U.S. REIT ETF | Annual Report
Trustees and Officers
The tables below give information about the trustees and officers of Schwab Strategic Trust, which includes the fund covered in this report. The “Fund Complex” includes The Charles Schwab Family of Funds, Schwab Capital Trust, Schwab Investments, Schwab Annuity Portfolios, Schwab Strategic Trust and Laudus Trust. The Fund Complex includes 103 funds.
The address for all trustees and officers is 211 Main Street, San Francisco, CA 94105. You can find more information about the trustees and officers in the Statement of Additional Information, which is available free by calling 1-877-824-5615.
| Independent Trustees |
Name, Year of Birth, and
Position(s) with the trust
(Terms of office, and
length of Time Served1) | Principal Occupations
During the Past Five Years | Number of
Portfolios in
Fund Complex
Overseen by
the Trustee | Other Directorships |
Robert W. Burns
1959
Trustee
(Trustee of Schwab Strategic Trust since 2009; The Charles Schwab Family of Funds, Schwab Investments, Schwab Capital Trust, Schwab Annuity Portfolios and Laudus Trust since 2016) | Retired/Private Investor. | 103 | None |
Nancy F. Heller
1956
Trustee
(Trustee of The Charles Schwab Family of Funds, Schwab Investments, Schwab Capital Trust, Schwab Annuity Portfolios, Schwab Strategic Trust and Laudus Trust since 2018) | Retired. | 103 | None |
David L. Mahoney
1954
Trustee
(Trustee of The Charles Schwab Family of Funds, Schwab Investments, Schwab Capital Trust, Schwab Annuity Portfolios and Laudus Trust since 2011; Schwab Strategic Trust since 2016) | Private Investor. | 103 | Director (2004 – present), Corcept Therapeutics Incorporated
Director (2009 – 2021), Adamas Pharmaceuticals, Inc.
Director (2003 – 2019), Symantec Corporation |
Jane P. Moncreiff
1961
Trustee
(Trustee of The Charles Schwab Family of Funds, Schwab Investments, Schwab Capital Trust, Schwab Annuity Portfolios, Schwab Strategic Trust and Laudus Trust since 2019) | Consultant (2018 – present), Fulham Advisers LLC (management consulting); Chief Investment Officer (2009 – 2017), CareGroup Healthcare System, Inc. (healthcare). | 103 | None |
Kiran M. Patel
1948
Trustee
(Trustee of The Charles Schwab Family of Funds, Schwab Investments, Schwab Capital Trust, Schwab Annuity Portfolios and Laudus Trust since 2011; Schwab Strategic Trust since 2016) | Retired. | 103 | Director (2008 – present), KLA-Tencor Corporation |
Schwab U.S. REIT ETF | Annual Report
| Independent Trustees (continued) |
Name, Year of Birth, and
Position(s) with the trust
(Terms of office, and
length of Time Served1) | Principal Occupations
During the Past Five Years | Number of
Portfolios in
Fund Complex
Overseen by
the Trustee | Other Directorships |
Kimberly S. Patmore
1956
Trustee
(Trustee of The Charles Schwab Family of Funds, Schwab Investments, Schwab Capital Trust, Schwab Annuity Portfolios, Schwab Strategic Trust and Laudus Trust since 2016) | Consultant (2008 – present), Patmore Management Consulting (management consulting). | 103 | None |
J. Derek Penn
1957
Trustee
(Trustee of The Charles Schwab Family of Funds, Schwab Investments, Schwab Capital Trust, Schwab Annuity Portfolios, Schwab Strategic Trust and Laudus Trust since 2021) | Head of Equity Sales and Trading (2006 – 2018), BNY Mellon (financial services). | 103 | None |
| Interested Trustees |
Name, Year of Birth, and
Position(s) with the trust
(Terms of office, and
length of Time Served1) | Principal Occupations
During the Past Five Years | Number of
Portfolios in
Fund Complex
Overseen by
the Trustee | Other Directorships |
Walter W. Bettinger II2
1960
Chairman and Trustee
(Trustee of The Charles Schwab Family of Funds, Schwab Investments, Schwab Capital Trust and Schwab Annuity Portfolios since 2008; Schwab Strategic Trust since 2009; Laudus Trust since 2010) | Director and Chief Executive Officer (Oct. 2008 – present) and President (Feb. 2007 – Oct. 2021), The Charles Schwab Corporation; President and Chief Executive Officer (Oct. 2008 – Oct. 2021) and Director (May 2008 – Oct. 2021), Charles Schwab & Co., Inc.; Director (Apr. 2006 – present), Charles Schwab Bank, SSB; Director (Nov. 2017 – present), Charles Schwab Premier Bank, SSB; Director (July 2019 – present), Charles Schwab Trust Bank; Director (May 2008 – present) and President and Chief Executive Officer (Aug. 2017 – present), Schwab Holdings, Inc.; Director (Oct. 2020 – present), TD Ameritrade Holding Corporation; Director (July 2016 – Oct. 2021), Charles Schwab Investment Management, Inc. | 103 | Director (2008 – present), The Charles Schwab Corporation |
Joseph R. Martinetto2
1962
Trustee
(Trustee of The Charles Schwab Family of Funds, Schwab Investments, Schwab Capital Trust, Schwab Annuity Portfolios, Schwab Strategic Trust and Laudus Trust since 2016) | Chief Operating Officer (Feb. 2018 – present), The Charles Schwab Corporation; Senior Executive Vice President (July 2015 – present), Charles Schwab & Co., Inc.; Director (May 2007 – present), Charles Schwab & Co., Inc.; Director (Apr. 2010 – Apr. 2020), Charles Schwab Bank, SSB; Director (Nov. 2017 – Apr. 2020), Charles Schwab Premier Bank, SSB; Director (May 2007 – Apr. 2020), and Senior Executive Vice President (Feb. 2016 – present), Schwab Holdings, Inc.; Director (Oct. 2020 – present), TD Ameritrade Holding Corporation. | 103 | None |
Schwab U.S. REIT ETF | Annual Report
| Officers of the Trust |
Name, Year of Birth, and Position(s) with the trust
(Terms of office, and length of Time Served3) | Principal Occupations During the Past Five Years |
Jonathan de St. Paer
1973
President and Chief Executive Officer
(Officer of The Charles Schwab Family of Funds, Schwab Investments, Schwab Capital Trust, Schwab Annuity Portfolios, Schwab Strategic Trust and Laudus Trust since 2018) | Director (Apr. 2019 – present), President (Oct. 2018 – present), Chief Operating Officer (Jan. 2020 – present), and Chief Executive Officer (Apr. 2019 – Nov. 2019), Charles Schwab Investment Management, Inc.; Senior Vice President (June 2020 – Mar. 2022) and Chief Operating Officer (Jan. 2020 – Mar. 2022), Charles Schwab Investment Advisory, Inc.; Chief Executive Officer (Apr. 2019 – present), President (Nov. 2018 – present) and Trustee (Apr. 2019 – Dec. 2020), Schwab Funds, Laudus Trust and Schwab ETFs; Director (Apr. 2019 – Apr. 2022), Charles Schwab Worldwide Funds plc and Charles Schwab Asset Management (Ireland) Limited; Senior Vice President (Apr. 2019 – present), and Senior Vice President – Strategy and Product Development (CSIM) (Jan. 2014 – Mar. 2019), Charles Schwab & Co., Inc. |
Mark Fischer
1970
Treasurer, Chief Financial Officer and Chief Operating Officer
(Officer of The Charles Schwab Family of Funds, Schwab Investments, Schwab Capital Trust, Schwab Annuity Portfolios, Schwab Strategic Trust and Laudus Trust since 2013) | Treasurer and Chief Financial Officer (Jan. 2016 – present) and Chief Operating Officer (Dec. 2020 – present), Schwab Funds, Laudus Trust and Schwab ETFs; Chief Financial Officer (Mar. 2020 – present) and Vice President (Oct. 2013 – present), Charles Schwab Investment Management, Inc.; Director (July 2020 – Apr. 2022), Charles Schwab Worldwide Funds plc and Charles Schwab Asset Management (Ireland) Limited. |
Omar Aguilar
1970
Vice President and Chief Investment Officer
(Officer of The Charles Schwab Family of Funds, Schwab Investments, Schwab Capital Trust, Schwab Annuity Portfolios, Schwab Strategic Trust and Laudus Trust since 2011) | Chief Executive Officer (Jan. 2022 – present) and Chief Investment Officer (Apr. 2011 – present), Senior Vice President (Apr. 2011 – Dec. 2021), Charles Schwab Investment Management, Inc.; Vice President and Chief Investment Officer (June 2011 – present), Schwab Funds, Laudus Trust and Schwab ETFs. |
Brett Wander
1961
Vice President and Chief Investment Officer
(Officer of The Charles Schwab Family of Funds, Schwab Investments, Schwab Capital Trust, Schwab Annuity Portfolios, Schwab Strategic Trust and Laudus Trust since 2011) | Senior Vice President and Chief Investment Officer (Apr. 2011 – present), Charles Schwab Investment Management, Inc.; Vice President and Chief Investment Officer (June 2011 – present), Schwab Funds, Laudus Trust and Schwab ETFs. |
William P. McMahon, Jr.
1972
Vice President and Chief Investment Officer
(Officer of The Charles Schwab Family of Funds, Schwab Investments, Schwab Capital Trust, Schwab Annuity Portfolios, Schwab Strategic Trust and Laudus Trust since 2021) | Senior Vice President and Chief Investment Officer (Jan. 2020 – present), Charles Schwab Investment Management, Inc.; Vice President and Chief Investment Officer (June 2021 – present), Schwab Funds, Laudus Trust and Schwab ETFs; Senior Vice President and Chief Investment Officer – ThomasPartners Strategies (Apr. 2018 – Dec. 2019), Charles Schwab Investment Advisory, Inc.; Senior Vice President and Chief Investment Officer (May 2001 – Apr. 2018), ThomasPartners, Inc. |
Catherine MacGregor
1964
Chief Legal Officer and Secretary, Schwab Funds and Schwab ETFs
Chief Legal Officer, Vice President and Clerk, Laudus Trust
(Officer of The Charles Schwab Family of Funds, Schwab Investments, Schwab Capital Trust, Schwab Annuity Portfolios and Laudus Trust since 2005; Schwab Strategic Trust since 2009) | Chief Legal Officer (Mar. 2022 – present) and Vice President (Sept. 2005 – present), Charles Schwab Investment Management, Inc.; Vice President (July 2005 – present), Charles Schwab & Co., Inc.; Vice President (Dec. 2005 – present) and Chief Legal Officer and Clerk (Mar. 2007 – present), Laudus Trust; Chief Legal Officer and Secretary (Oct. 2021 – present), Vice President (Nov. 2005 – Oct. 2021) and Assistant Secretary (June 2007 – Oct. 2021), Schwab Funds; Chief Legal Officer and Secretary (Oct. 2021 – present), Vice President and Assistant Secretary (Oct. 2009 – Oct. 2021), Schwab ETFs. |
| 1 | Each Trustee shall hold office until the election and qualification of his or her successor, or until he or she dies, resigns or is removed. The retirement policy requires that each independent trustee retire by December 31 of the year in which the Trustee turns 74 or the Trustee’s twentieth year of service as an independent trustee on any trust in the Fund Complex, whichever occurs first. |
| 2 | Mr. Bettinger and Mr. Martinetto are Interested Trustees. Mr. Bettinger is an Interested Trustee because he owns stock of The Charles Schwab Corporation (CSC), the parent company of Charles Schwab Investment Management, Inc., the investment adviser for the trusts in the Fund Complex, and is an employee of Charles Schwab & Co., Inc. (Schwab), the principal underwriter for The Charles Schwab Family of Funds, Schwab Investments, Schwab Capital Trust, Schwab Annuity Portfolios and Laudus Trust. Mr. Martinetto is an Interested Trustee because he owns stock of CSC and is an employee and director of Schwab. |
| 3 | The President, Treasurer and Secretary/Clerk hold office until their respective successors are chosen and qualified or until he or she sooner dies, resigns, is removed or becomes disqualified. Each of the other officers serves at the pleasure of the Board. |
Schwab U.S. REIT ETF | Annual Report
ask See “offer.”
asset allocation The practice of dividing a portfolio among different asset classes, with each asset class assigned a particular percentage to help offset risks and rewards, based on your goals, time horizon and risk tolerance.
asset class A group of securities with similar structure and basic characteristics. Stocks, bonds and cash are the three main examples of asset classes.
authorized participant (AP) A large institutional investor that places orders for creation units with the funds’ distributor.
beta A historical measure of an investment’s volatility relative to a market index (usually the S&P 500®). The index is defined as having a beta of 1.00. Investments with a beta higher than 1.00 have been more volatile than the index; those with a beta of less than 1.00 have been less volatile.
bid The highest price at which someone is willing to buy a security.
Bloomberg US Aggregate Bond Index An index that is a broad-based benchmark measuring the performance of the U.S. investment grade, taxable bond market, including U.S. Treasuries, government-related and corporate bonds, mortgage pass-through securities, commercial mortgage-backed securities, and asset-backed securities that are publicly available for sale in the United States. To be eligible for inclusion in the index, securities must be fixed rate, non-convertible, U.S. dollar-denominated with at least $300 million or more of outstanding face value and have one or more years remaining to maturity. The index excludes certain types of securities, including tax-exempt state and local government series bonds, structured notes embedded with swaps or other special features, private placements, floating rate securities, inflation-linked bonds and Eurobonds. The index is market capitalization weighted and the securities in the index are updated on the last business day of each month.
cap, capitalization See “market cap.”
capital gain, capital loss The difference between the amount paid for an investment and its value at a later time. If the investment has been sold, the capital gain or loss is considered a realized gain or loss. If the investment is still held, the gain or loss is still “on paper” and is considered unrealized.
commencement of operations The date that the first NAV was calculated.
creation unit (C.U.) A basket of securities that is delivered by an authorized participant (AP) to the fund equal to the current holdings of the ETF, plus a designated cash component. In return, the APs receive a large block of ETF shares (typically 50,000 shares), which investors can then buy and sell in the secondary market.
Dow Jones Equity All REIT Capped Index A float-adjusted market cap weighted index that is designed to measure all equity real estate investment trusts (REITs) in the Dow Jones U.S. Total Stock Market Index, as defined by the S&P Dow Jones Indices REIT/RESI Industry Classification Hierarchy, that meet the minimum float market capitalization (FMC) and liquidity thresholds. The aggregate weight of all companies weighing more than 4.5% cannot exceed 22.5%, and no single company’s weight can exceed 10%. The index is reviewed daily based on each company’s capped market capitalization weight. Daily capping is only performed when the sum of companies with weights great than 5% exceeds 25%.
Dow Jones U.S. Select REIT Index An index that is a float-adjusted market-capitalization weighted index comprised of income-producing commercial and/or residential real estate investment trusts (REITs). The index excludes mortgage REITs, net-lease REITs, real estate finance companies, mortgage brokers and bankers, commercial and residential real estate brokers and estate agents, homebuilders, large landowners and sub-dividers of unimproved land, hybrid REITs, timber REITs and companies that have more than 25% of their assets in direct mortgage investments.
exchange A marketplace, or any organization or group that provides or maintains a marketplace for trading securities, options, futures, or commodities.
expense ratio The amount that is taken from the fund’s assets each year to cover the operating expenses. An expense ratio of 0.50% means that a fund’s expenses amount to half of one percent of its average net assets a year.
FTSE EPRA Nareit Global Index (Net) An index that provides a diverse representation of publicly traded equity real estate investment trusts (REITs) and listed property companies worldwide. The index constituents are free-float adjusted, and screened on liquidity, size and revenue. The index is comprised of countries in developed and emerging markets. The Net of Tax Index is calculated based on the maximum withholding tax rates applicable to dividends received by institutional investors who are not resident in the same country as the remitting company and who do not benefit from double taxation treaties.
inception date The date that the shares began trading in the secondary market.
indicative optimized portfolio value (IOPV) A calculation disseminated by the stock exchange that approximates the fund’s NAV every 15 seconds throughout the trading day.
liquidity The ability to convert a security or asset quickly into cash.
market cap, market capitalization The value of a company as determined by the total value of all shares of its stock outstanding.
market price return The return based on the change in market price per share of the fund over a given time period. Market price returns assume that dividends and capital gain distributions have been reinvested in the fund at market price.
median market cap The midpoint of the range of market caps of the stocks held by a fund. There are different ways of calculating median market cap. With a simple median, half of the stocks in the fund’s portfolio would be larger than the median, and half would be smaller. With a weighted median (the type that is calculated for these funds), half of the fund’s assets are invested in stocks that are larger than the median market cap, and half in stocks that are smaller.
MSCI EAFE Index (Net) A free float-adjusted market capitalization index that is designed to measure the equity market performance of developed markets in Europe, Australasia, and the Far East. The Net version of the index reflects reinvested dividends net of withholding taxes, but reflects no deductions for expenses or other taxes; returns are calculated applying dividend withholding rates applicable to non-resident persons who do not benefit from double taxation treaties.
net asset value (NAV) The value of one share of a fund. NAV is calculated by taking the fund’s total assets, subtracting liabilities, and dividing by the number of shares outstanding.
Schwab U.S. REIT ETF | Annual Report
NAV return The return based on the change in NAV of the fund over a given time period. NAV returns assume that dividends and capital gain distributions have been reinvested in the fund.
offer (ask) The lowest price at which an individual is willing to sell a security.
open The price at which a security opened for trading on a given day.
outstanding shares, shares outstanding When speaking of the fund, indicates all shares currently held by investors.
price-to-book ratio (P/B) The market price of a company’s stock compared with its “book value.” A mutual fund’s P/B is the weighted average of the P/B of all stocks in the fund’s portfolio.
price-to-earnings ratio (P/E) The market price of a company’s stock compared with earnings over the past year. A mutual fund’s P/E is the weighted average of the P/E of all stocks in the fund’s portfolio.
primary market The market that deals with the issuance of new securities.
real estate investment trust (REIT) Real estate companies that own and commonly operate income producing commercial and/or residential real estate.
REIT Spliced Index An internally calculated index, compromised of the Dow Jones U.S. Select REIT Index from the inception of the Schwab U.S. REIT ETF until the close of business on June 19, 2020, and the Dow Jones Equity All REIT Capped Index thereafter. The REIT Spliced Index is published with the permission of S&P Dow Jones Indices LLC, but is not calculated, sponsored or endorsed by S&P Dow Jones Indices LLC.
rights and warrants Rights and warrants are types of securities that entitle the holder to purchase a proportionate amount of common stock at a specified price for a specific period of time. Rights allow a
shareholder to buy more shares directly from the company, usually at a price somewhat lower than the current market price of the outstanding shares. Warrants are usually issued with bonds and preferred stock. Rights and warrants can trade on the market separately from the company’s stock. The prices of rights and warrants do not necessarily move parallel to the prices of the underlying common stock. Rights usually expire within a few weeks of issuance, while warrants may not expire for several years. If a right or warrant is not exercised within the specified time period, it will become worthless and a fund will lose the purchase price it paid for the right or warrant and the right to purchase the underlying security.
S&P 500 Index An index that is designed to measure the performance of 500 leading publicly traded companies from a broad range of industries.
sampling If a fund uses a sampling method, the fund will not fully replicate the benchmark index and may hold securities not included in the index. A fund that utilizes a sampling approach may not track the return of the index.
secondary market The market in which investors purchase securities from other investors rather than directly from the issuing companies. Organized exchanges facilitate the trading of securities in the secondary market.
spread The gap between bid and ask prices of a security.
stock A share of ownership, or equity, in the issuing company.
total return The percentage that an investor would have earned or lost on an investment in the fund assuming dividends and distributions were reinvested.
tracking error The difference between the performance of the fund and its benchmark index, positive or negative.
Schwab U.S. REIT ETF | Annual Report
Schwab ETFs
Schwab ETFs are designed to serve as simple low-cost core investment products for a diversified portfolio. These ETFs seek to provide consistent, repeatable performance through a variety of investment strategies that span the equity and fixed income spectrum. The list below shows all currently available Schwab ETFs.
Investors should carefully consider information contained in the prospectus, or if available, the summary prospectus, including investment objectives, risks, charges and expenses before investing. Please call 1-877-824-5615 for a prospectus for any Schwab ETF. Please read the prospectus carefully before you invest. This report must be preceded or accompanied by a current prospectus.
Proxy Voting Policies, Procedures and Results
A description of the proxy voting policies and procedures used to determine how to vote proxies on behalf of the funds is available without charge, upon request, by visiting the Schwab ETFs’ website at www.schwabassetmanagement.com/schwabetfs_prospectus, the SEC’s website at www.sec.gov, or by contacting Schwab ETFs at 1-877-824-5615.
Information regarding how a fund voted proxies relating to portfolio securities during the most recent twelve-month period ended June 30 is available, without charge, by visiting the fund’s website at www.schwabassetmanagement.com/schwabetfs_prospectus or the SEC’s website at www.sec.gov.
U.S. ETFs
Schwab U.S. Broad Market ETF
Schwab 1000 Index® ETF
Schwab U.S. Large-Cap ETF
Schwab U.S. Large-Cap Growth ETF
Schwab U.S. Large-Cap Value ETF
Schwab U.S. Mid-Cap ETF
Schwab U.S. Small-Cap ETF
Schwab U.S. Dividend Equity ETF
Schwab U.S. REIT ETF
International ETFs
Schwab International Dividend Equity ETF
Schwab International Equity ETF
Schwab International Small-Cap Equity ETF
Schwab Emerging Markets Equity ETF
Fixed-Income ETFs
Schwab U.S. TIPS ETF
Schwab Short-Term U.S. Treasury ETF
Schwab Intermediate-Term U.S. Treasury ETF
Schwab Long-Term U.S. Treasury ETF
Schwab U.S. Aggregate Bond ETF
Schwab 1-5 Year Corporate Bond ETF
Schwab 5-10 Year Corporate Bond ETF
Fundamental Index* ETFs
Schwab Fundamental U.S. Broad Market Index ETF
Schwab Fundamental U.S. Large Company Index ETF
Schwab Fundamental U.S. Small Company Index ETF
Schwab Fundamental International Large Company Index ETF
Schwab Fundamental International Small Company Index ETF
Schwab Fundamental Emerging Markets Large Company
Index ETF
Active, Semi-Transparent (Also Known As Non-Transparent) ETF
Schwab Ariel ESG ETF
Investment Adviser
Charles Schwab Investment Management, Inc., dba Schwab Asset Management
211 Main Street, San Francisco, CA 94105
Schwab ETFs
1-877-824-5615
© 2022 Charles Schwab Investment Management, Inc., dba Schwab Asset Management. All rights reserved.
Printed on recycled paper.
| * | FUNDAMENTAL INDEX is a registered trademark of Research Affiliates LLC. |
The Schwab Ariel ESG ETF is different from traditional ETFs. Traditional ETFs tell the public what assets they hold each day. This fund will not. This may create additional risks for your investment. For example:
| • | You may have to pay more money to trade the fund’s shares. This fund will provide less information to traders, who tend to charge more for trades when they have less information. |
| • | The price you pay to buy fund shares on an exchange may not match the value of the fund’s portfolio. The same is true when you sell shares. These price differences may be greater for this fund compared to other ETFs because it provides less information to traders. |
| • | These additional risks may be even greater in bad or uncertain market conditions. |
| • | The ETF will publish on its website each day a “Proxy Portfolio” designed to help trading in shares of the ETF. While the Proxy Portfolio includes some of the ETF’s holdings, it is not the ETF’s actual portfolio. |
The differences between this fund and other ETFs may also have advantages. By keeping certain information about the fund secret, this fund may face less risk that other traders can predict or copy its investment strategy. This may improve the fund’s performance. If other traders are able to copy or predict the fund’s investment strategy, however, this may hurt the fund’s performance.
For additional information regarding the unique attributes and risks of the fund, see Proxy Portfolio Risk, Premium/Discount Risk, Trading Halt Risk, Authorized Participant Concentration Risk, Tracking Error Risk and Shares of the Fund May Trade at Prices Other Than NAV in the Principal Risks and Proxy Portfolio and Proxy Overlap sections of the prospectus and/or the Statement of Additional Information. These risks are discussed on the next page.
Active semi-transparent ETFs operate differently from other exchange-traded funds (ETFs). Unlike other ETFs, an active semi-transparent ETF does not publicly disclose its entire portfolio composition each business day, which may affect the price at which shares of the ETF trade in the secondary market. Active semi-transparent ETFs have limited public trading history. There can be no assurance that an active trading market will develop, be maintained or operate as intended. There is a risk that the market price of an active semi-transparent ETF may vary significantly from the ETF’s net asset value and that its shares may trade at a wider bid/ask spread and, therefore, cost investors more to trade than shares of other ETFs. These risks are heightened during periods of market disruption or volatility.
Proxy Portfolio Risk: Unlike traditional ETFs, this fund does not disclose its portfolio holdings (Actual Portfolio) daily. The fund instead posts a Proxy Portfolio on its website each day. The Proxy Portfolio is designed to reflect the economic exposures and risk characteristics of the fund’s actual holdings on each trading day, but it is not the same as the fund’s Actual Portfolio. Although the Proxy Portfolio is intended to provide investors with enough information to allow for an effective arbitrage mechanism that will keep the market price of the Fund at or close to the underlying NAV per Share of the Fund, there is a risk (which may increase during periods of market disruption or volatility) that market prices will vary significantly from the underlying NAV of the fund. ETF trading on the basis of a published Proxy Portfolio may trade at a wider bid/ask spread than ETFs that publish their portfolios on a daily basis, especially during periods of market disruption or volatility, and therefore may cost investors more to trade. Also, while the Fund seeks to benefit from keeping its portfolio information secret, market participants may attempt to use the Proxy Portfolio to identify a Fund’s trading strategy, which if successful, could result in such market participants engaging in certain predatory trading practices that may have the potential to harm the Fund and its shareholders.
Proxy Portfolio Construction: The Proxy Portfolio is designed to recreate the daily performance of the Actual Portfolio. This is achieved by performing a “Factor Model” analysis of the Actual Portfolio. The Factor Model is comprised of three sets of factors or analytical metrics: market-based factors, fundamental factors, and industry/sector factors. The fund uses a “Model Universe” to generate its Proxy Portfolio. The Model Universe is comprised of securities that the fund can purchase and will be a financial index or stated portfolio of securities from which fund investments will be selected. The results of the Factor Model analysis are then applied to the Model Universe. The Proxy Portfolio is then generated as a result of this Model Universe analysis with the Proxy Portfolio being a small sub-set of the Model Universe. The Factor Model is applied to both the Actual Portfolio and the Model Universe to construct the fund’s Proxy Portfolio that performs in a manner substantially identical to the performance of its Actual Portfolio.
The Proxy Portfolio will only include investments the fund is permitted to hold. The fund’s SAI contains more information on the Proxy Portfolio and its construction. Proxy Portfolio and Proxy Overlap Information regarding the contents of the Proxy Portfolio, and the percentage weight overlap between the holdings of the Proxy Portfolio and a Fund’s Actual Portfolio holdings that formed the basis for its calculation of NAV at the end of the prior Business Day (the Portfolio Overlap), is available by visiting the fund’s website www.schwabassetmanagement.com.
Because environmental, social and governance (ESG) strategies exclude some securities, ESG-focused products may not be able to take advantage of the same opportunities or market trends as products that do not use such strategies. Additionally, the criteria used to select companies for investment may result in investing in securities, industries or sectors that underperform the market as a whole.
This page is intentionally left blank.
Annual Report | February 28, 2022
Schwab Fundamental Index* ETFs
| Schwab Fundamental U.S. Broad Market Index ETF | FNDB |
| Schwab Fundamental U.S. Large Company Index ETF | FNDX |
| Schwab Fundamental U.S. Small Company Index ETF | FNDA |
| Schwab Fundamental International Large Company Index ETF | FNDF |
| Schwab Fundamental International Small Company Index ETF | FNDC |
| Schwab Fundamental Emerging Markets Large Company Index ETF | FNDE |
| * | SCHWAB is a registered trademark of Charles Schwab & Co., Inc.
FUNDAMENTAL INDEX is a registered trademark of Research Affiliates LLC. |
This page is intentionally left blank.
Fund investment adviser: Charles Schwab Investment Management, Inc., dba Schwab Asset ManagementTM
Distributor: SEI Investments Distribution Co. (SIDCO)
The Sector/Industry classifications in this report use the Global Industry Classification Standard (GICS) which was developed by and is the exclusive property of MSCI Inc. (MSCI) and Standard & Poor’s (S&P). GICS is a service mark of MSCI and S&P and has been licensed for use by Charles Schwab & Co., Inc. The Industry classifications used in the Portfolio Holdings are sub-categories of Sector classifications.
Schwab Fundamental Index ETFs | Annual Report
Schwab Fundamental Index ETFs
The performance data quoted represents past performance. Past performance does not guarantee future results. Investment return and principal value of an investment will fluctuate so that an investor’s shares, when sold or redeemed, may be worth more or less than the original cost. Current performance may be lower or higher than the performance quoted. To obtain performance information current to the most recent month end, please visit www.schwabassetmanagement.com/schwabetfs_prospectus.
| Total Returns for the 12 Months Ended February 28, 2022 |
Schwab Fundamental U.S. Broad Market Index ETF
(Ticker Symbol: FNDB) | |
| Market Price Return1 | 18.71% |
| NAV Return1 | 18.80% |
| Russell RAFITM US Index | 19.09% |
| Russell 3000® Index | 12.29% |
| ETF Category: Morningstar Large Value2 | 17.20% |
| Performance Details | pages 8-10 |
| |
Schwab Fundamental U.S. Large Company Index ETF
(Ticker Symbol: FNDX) | |
| Market Price Return1 | 19.62% |
| NAV Return1 | 19.61% |
| Russell RAFITM US Large Company Index | 19.90% |
| Russell 1000® Index | 13.72% |
| ETF Category: Morningstar Large Value2 | 17.20% |
| Performance Details | pages 11-13 |
| |
Schwab Fundamental U.S. Small Company Index ETF
(Ticker Symbol: FNDA) | |
| Market Price Return1 | 10.01% |
| NAV Return1 | 10.06% |
| Russell RAFITM US Small Company Index | 10.32% |
| Russell 2000® Index | -6.01% |
| ETF Category: Morningstar Small Blend2 | 3.98% |
| Performance Details | pages 14-16 |
| Total Returns for the 12 Months Ended February 28, 2022 |
Schwab Fundamental International Large Company Index ETF
(Ticker Symbol: FNDF) | |
| Market Price Return1 | 7.40% |
| NAV Return1 | 7.95% |
| Russell RAFITM Developed ex US Large Company Index (Net)* | 8.00% |
| MSCI EAFE® Index (Net)* | 2.83% |
| ETF Category: Morningstar Foreign Large Value2 | 5.90% |
| Performance Details | pages 17-19 |
| |
Schwab Fundamental International Small Company Index ETF
(Ticker Symbol: FNDC) | |
| Market Price Return1 | 1.61% |
| NAV Return1 | 1.86% |
| Russell RAFITM Developed ex US Small Company Index (Net)* | 2.17% |
| S&P Developed ex-U.S. Small Cap Index (Net)* | -2.47% |
| ETF Category: Morningstar Foreign Small/Mid Value2 | 5.44% |
| Performance Details | pages 20-22 |
| |
Schwab Fundamental Emerging Markets Large Company Index ETF
(Ticker Symbol: FNDE) | |
| Market Price Return1 | 5.31% |
| NAV Return1 | 2.97% |
| Russell RAFITM Emerging Markets Large Company Index (Net)* | 6.51% |
| MSCI Emerging Markets Index (Net)* | -10.69% |
| ETF Category: Morningstar Diversified Emerging Markets2 | -9.68% |
| Performance Details | pages 23-25 |
All total returns on this page assume dividends and distributions were reinvested. Index figures do not include trading and management costs, which would lower performance. Indices are unmanaged and cannot be invested in directly. Performance results less than one year are not annualized.
The first index listed for each fund is the fund’s primary benchmark, as shown in the prospectus. Additional indices shown are provided for comparative purposes.
For index definitions, please see the Glossary.
Performance does not reflect the deduction of taxes that a shareholder would pay on fund distributions or on the redemption or sale of fund shares.
Shares are bought and sold at market price, which may be higher or lower than the net asset value (NAV). Brokerage commissions will reduce returns.
Index ownership — The Schwab Fundamental Index ETFs are not in any way sponsored, endorsed, sold or promoted by Frank Russell Company (Russell), by the London Stock Exchange Group companies (LSEG), or by Research Affiliates LLC (RA) (collectively the Licensor Parties), and none of the Licensor Parties make any warranty or representation whatsoever, expressly or impliedly, either as to the results to be obtained from the use of the Russell RAFI™ Index Series (the Indices) or otherwise. The Indices are compiled and calculated by Russell in conjunction with RA. None of the Licensor Parties shall be liable (whether in negligence or otherwise) to any person for any error in the Indices and none of the Licensor Parties shall be under any obligation to advise any person of any error therein. “Russell®” is a trademark of Russell. The trade names “Research Affiliates®”, “Fundamental Index®” and “RAFI®” are registered trademarks of RA. Charles Schwab Investment Management, Inc. has obtained full license from Russell to use the Indices. For full disclaimer please see the funds’ statement of additional information.
| * | The net version of the index reflects reinvested dividends net of withholding taxes but reflects no deductions for expenses or other taxes. |
| 1 | ETF performance must be shown based on both a market price and NAV basis. The fund’s per share NAV is the value of one share of the fund. NAV is calculated by taking the fund’s total assets (including the fair value of securities owned), subtracting liabilities, and dividing by the number of shares outstanding. The NAV Return is based on the NAV of the fund, and the Market Price Return is based on the market price per share of the fund. The price used to calculate market return (Market Price) is determined using the Official Closing Price on the primary stock exchange (generally, 4:00 p.m. Eastern time) and may not represent the returns you would receive if shares were traded at other times. Market Price and NAV returns assume that dividends and capital gain distributions have been reinvested in the fund at Market Price and NAV, respectively. |
| 2 | Source for category information: Morningstar, Inc. The Morningstar Category return represents all passively- and actively-managed ETFs within the category as of the report date. |
Schwab Fundamental Index ETFs | Annual Report
Schwab Fundamental Index ETFs
Jonathan de St. Paer
President of Schwab Asset
Management and the funds
covered in this report.
Dear Shareholder,
Before Russia’s invasion of Ukraine in late February 2022, financial markets were largely preoccupied with the prospects of continued economic growth in the face of multiple challenges related to the ongoing COVID-19 pandemic. Concerns included rising energy and commodity inflation, global supply chain disruptions, and the increasing likelihood that the U.S. Federal Reserve (Fed) would raise short-term interest rates. Despite these obstacles, the S&P 500® Index, a bellwether for the overall U.S. stock market, gained more than 20% between March and December 2021, bolstered by strong corporate earnings, robust consumer spending, and improving labor statistics. However, investor sentiment turned dramatically risk averse as tensions between Russia and Ukraine began escalating in 2022. Stock markets dipped sharply in January and February, with the S&P 500® Index losing roughly half of its previous gains. International stocks, which had posted milder gains than their U.S. counterparts until then, experienced even steeper losses. For the 12-month reporting period ended February 28, 2022, the S&P 500® Index returned 16.4%, and the MSCI EAFE® Index (Net)*, a broad measure of developed international equity performance, returned 2.8%.
While the tumultuous events beginning at the end of February have clearly unsettled markets and shaken investor confidence, at Schwab Asset Management we believe that when it comes to their investment plan, investors would do well to avoid getting caught up in dramatic events as they unfold. Although markets may react abruptly in the short term, we believe that wealth creation is most reliably built on a foundation of diversification and a long-term investment plan. With their broadly diversified portfolios and cost-effective, passively managed structures, the Schwab Fundamental Index ETFs can serve as part of the core of a diversified portfolio. In addition, by weighting fund holdings based on objective financial measures of company size, Fundamental Index strategies tend to perform differently over time than traditional market-cap index strategies that use market capitalization to weight the same set of stocks. When the two approaches are combined, we believe a portfolio has the potential for better diversification and more attractive risk-adjusted returns.
Thank you for investing with Schwab Asset Management. For more information about the Schwab Fundamental Index ETFs, please continue reading this report. In addition, you can find further details about these funds by visiting our website at www.schwabassetmanagement.com. We are also happy to hear from you at 1-877-824-5615.
Sincerely,
“ While the tumultuous events beginning at the end of February have clearly unsettled markets and shaken investor confidence, at Schwab Asset Management we believe that when it comes to their investment plan, investors would do well to avoid getting caught up in dramatic events as they unfold.”
Past performance is no guarantee of future results.
Diversification and asset allocation strategies do not ensure a profit and cannot protect against losses in a declining market.
Management views may have changed since the report date.
Schwab Asset Management is the dba name for Charles Schwab Investment Management, Inc., the investment adviser for Schwab Funds and Schwab ETFs.
| * | The net version of the index reflects reinvested dividends net of withholding taxes but reflects no deductions for expenses or other taxes. |
Schwab Fundamental Index ETFs | Annual Report
Schwab Fundamental Index ETFs
The Investment Environment
For the 12-month reporting period ended February 28, 2022, U.S. equity markets generated positive returns, while global equity markets were mixed. Despite persisting COVID-19 pandemic-driven stresses on the global economy and the emergence and rapid spread of the Delta variant during the summer and the Omicron variant in late 2021, market tailwinds included strong corporate earnings, ongoing, albeit fading, fiscal stimulus measures, and optimism related to increased COVID-19 vaccination rates. As a result, for most of the reporting period, through early January 2022, U.S. equity markets posted steady gains, with several key market indices repeatedly exceeding previous record highs. Developed international equity markets were less robust, but for the most part still positive, while emerging markets were weaker. However, beginning in early 2022, equity markets declined in reaction to growing headwinds that included accelerating inflation, an increasing likelihood of rising interest rates, and, in the final week of the reporting period, Russia’s invasion of Ukraine, which drove oil prices above $100 per barrel for the first time since 2014 and roiled stock markets around the world. Despite exhibiting some volatility, the U.S. dollar rose over the reporting period against a basket of foreign currencies, generally reducing the returns on overseas investments in U.S. dollar terms. For the reporting period, the S&P 500® Index, a bellwether for the overall U.S. stock market, returned 16.39%. Among U.S. stocks, large-cap stocks outperformed small-cap stocks, with the Russell RAFI™ US Large Company Index returning 19.90% for the reporting period and the Russell 2000® Index and Russell RAFI™ US Small Company Index returning -6.01% and 10.32%, respectively. International equities were weaker. The MSCI EAFE® Index (Net)*, a broad measure of developed international equity performance, and the Russell RAFI™ Developed ex US Large Company Index (Net)* returned 2.83% and 8.00%, respectively, and the MSCI Emerging Markets Index (Net)* and the Russell RAFI™ Emerging Markets Large Company Index (Net)* returned -10.69% and 6.51%, respectively.
Asset Class Performance Comparison % returns during the 12 months ended February 28, 2022
Index figures assume dividends and distributions were reinvested. Index figures do not include trading and management costs, which would lower performance. Indices are unmanaged and cannot be invested in directly. Performance results less than one year are not annualized. Past performance is not an indication of future results.
For index definitions, please see the Glossary.
Data source: Index provider websites and Schwab Asset Management.
Nothing in this report represents a recommendation of a security by the investment adviser.
Management views may have changed since the report date.
| * | The net version of the index reflects reinvested dividends net of withholding taxes but reflects no deductions for expenses or other taxes. |
Schwab Fundamental Index ETFs | Annual Report
Schwab Fundamental Index ETFs
The Investment Environment (continued)
The U.S. economy continued its recovery from the dramatic impact of the COVID-19 pandemic, although U.S. gross domestic product (GDP) growth fluctuated over the reporting period. GDP rose at an annualized rate of 6.3% and 6.7% in the first and second quarters of 2021, respectively, before falling back to 2.3% for the third quarter of 2021 amid fading government stimuli, ongoing supply chain disruptions, and persisting inflation. GDP rose at an annualized rate of 6.9% in the fourth quarter of 2021 on increasing inventories, exports, and personal consumption expenditures. The unemployment rate, which has fallen steadily after skyrocketing in April 2020, ended the reporting period at its lowest level since February 2020. Annual inflation, which had remained well below the U.S. Federal Reserve’s (Fed) traditional 2% target until it jumped in March 2021, continued to rise during the spring of 2021, leveled off during the summer of 2021, and rose again through the remainder of the reporting period. At the end of the reporting period, inflation was at its highest rate in 40 years, due to imbalances in the labor market, supply chain bottlenecks, and soaring energy costs.
Outside the United States, global economies continued to wrestle with the fallout of the COVID-19 pandemic, including the emergence and spread of the Delta and Omicron variants, along with steepening energy costs and rising inflation. In the eurozone and the United Kingdom, after contracting in the first quarter of 2021, GDP growth was positive for the remainder of the reporting period, although it weakened in the final quarter of 2021. Japan’s economy contracted in both the first and third quarters of 2021 but expanded in the second and fourth quarters. Its rising fourth quarter growth was attributed to increases in household consumption and business investment in the face of a decline in COVID-19 cases and easing restrictions. Among emerging markets, China’s GDP growth rate accelerated sharply in the first quarter of 2021 before easing sharply for the subsequent three quarters, albeit remaining positive, in part because of the political landscape and an emphasis on domestic consumption over globalization, as well as multiple headwinds including a property downturn, supply chain issues, and COVID-19 outbreaks. India, after plunging into one of the worst recessions of any major economy in 2020, posted positive gains in GDP for 2021 as COVID-19 cases fell rapidly.
Monetary policies around the world varied. In the United States, early in the reporting period, the Fed reiterated several times its intention to continue its support of the economy for as long as needed to achieve a full recovery and the Fed maintained the federal funds rate in a range of 0.00% to 0.25% throughout the reporting period. However, as inflation continued to rise and indicators of economic activity and employment continued to strengthen, the Fed began scaling back its bond-buying program in November 2021, citing significant progress on its twin goals of maximum employment and price stability. The Fed subsequently accelerated its wind-down in December 2021, with expectations to end it altogether by March 2022. Fed officials also issued successively strong signals that interest rates could begin to rise sooner in 2022 than previously anticipated. In developed international economies, most central banks were similarly accommodative while acknowledging economic improvements and rising inflation and, in some cases, changes in monetary policy. The European Central bank held its interest rate at 0.00%, unchanged since March 2016, but pledged to steadily reduce its asset purchase program. The Bank of Japan upheld its short-term interest rate target of -0.1%, also unchanged since 2016, and stressed that it would maintain its ultra-loose monetary policy despite growing inflation, even as its global counterparts sought to exit from crisis mode policies. The Bank of England raised its key official bank rate twice during the reporting period, from 0.1% to 0.5%, its first back-to-back rate increase since 2004, citing inflationary pressures. Emerging market monetary policies were mixed. China cut its interest rate twice over the reporting period. Indonesia and India maintained low policy rates implemented in 2020 and early 2021. Central banks in Mexico, Brazil, and Pakistan raised their rates multiple times over the reporting period, citing a stronger-than-expected recovery or to counteract the impacts of inflation. Russia, notably, raised its interest rate to 20% in late February amid the broadening fallout of Western sanctions put in place in retaliation against Russia’s invasion of Ukraine.
Schwab Fundamental Index ETFs | Annual Report
Schwab Fundamental Index ETFs
 | Christopher Bliss, CFA, Managing Director and Head of Passive Equity Strategies for Schwab Asset Management, is responsible for overseeing the investment process, portfolio management and implementation, and development of investment strategies for passive equity Schwab Funds and Schwab ETFs. Before joining Schwab in 2016, Mr. Bliss spent 12 years at BlackRock (formerly Barclays Global Investors) managing and leading institutional index teams, most recently as a managing director and the head of the Americas institutional index team. In this role, Mr. Bliss was responsible for overseeing a team of portfolio managers managing domestic, developed international and emerging markets index strategies. Prior to BlackRock, he worked as an equity analyst and portfolio manager for Harris Bretall and before that, as a research analyst for JP Morgan. |
 | Jeremy Brown, CFA, Portfolio Manager, is responsible for the day-to-day co-management of the Schwab Fundamental U.S. Broad Market Index ETF, Schwab Fundamental U.S. Large Company Index ETF, and Schwab Fundamental U.S. Small Company Index ETF. Prior to joining Schwab in 2017, Mr. Brown spent six years with ALPS Advisors, Inc. in Denver, most recently as a senior analyst on the ETF portfolio management and research team where he performed portfolio management, trading, and analytics/research functions for ALPS ETFs and passive funds. Additionally, Mr. Brown led a number of investment research, commentary, industry trend analysis, and sales and marketing support initiatives. |
 | Chuck Craig, CFA, Senior Portfolio Manager, is responsible for the day-to-day co-management of the Schwab Fundamental International Large Company Index ETF, Schwab Fundamental International Small Company Index ETF, and Schwab Fundamental Emerging Markets Large Company Index ETF. Prior to joining Schwab in 2012, Mr. Craig worked at Guggenheim Funds (formerly Claymore Group), where he spent more than five years as a managing director of portfolio management and supervision, and three years as vice president of product research and development. Prior to that, he worked as an equity research analyst at First Trust Portfolios (formerly Niké Securities), and a trader and analyst at PMA Securities, Inc. |
 | Ferian Juwono, CFA, Senior Portfolio Manager, is responsible for the day-to-day co-management of the Schwab Fundamental U.S. Broad Market Index ETF, Schwab Fundamental U.S. Large Company Index ETF, and Schwab Fundamental U.S. Small Company Index ETF. Prior to joining Schwab in 2010, Mr. Juwono worked at BlackRock (formerly Barclays Global Investors) where he spent more than three years as a portfolio manager, managing equity index funds for institutional clients, and two years as a senior business analyst. Prior to that, Mr. Juwono worked for more than four years as a senior financial analyst with Union Bank of California. |
 | Jane Qin, Portfolio Manager, is responsible for the day-to-day co-management of the Schwab Fundamental International Large Company Index ETF, Schwab Fundamental International Small Company Index ETF, and Schwab Fundamental Emerging Markets Large Company Index ETF. Prior to joining Schwab in 2012, Ms. Qin spent more than four years at The Bank of New York Mellon Corporation. During that time, Ms. Qin spent more than two years as an associate equity portfolio manager and nearly two years as a performance analyst. She also worked at Wells Fargo Funds Management as a mutual fund analyst and at CIGNA Reinsurance in the risk management group as a risk analyst. |
 | David Rios, Portfolio Manager, is responsible for the day-to-day co-management of the Schwab Fundamental International Large Company Index ETF, Schwab Fundamental International Small Company Index ETF, and Schwab Fundamental Emerging Markets Large Company Index ETF. Prior to this role, Mr. Rios was an associate portfolio manager on the equity index strategies team for four years. His first role with Schwab Asset Management was as a trade operations specialist. Prior to joining Schwab in 2008, Mr. Rios was a senior fund accountant at Investors Bank & Trust (subsequently acquired by State Street Corporation). |
Schwab Fundamental Index ETFs | Annual Report
Schwab Fundamental Index ETFs
Fund Management (continued)
 | Sabya Sinha, Portfolio Manager, is responsible for the day-to-day co-management of the Schwab Fundamental U.S. Broad Market Index ETF, Schwab Fundamental U.S. Large Company Index ETF, and Schwab Fundamental U.S. Small Company Index ETF. Prior to joining Schwab in 2015, Mr. Sinha spent a year at F-Squared Investments on the product development and analytics team. Prior to F-Squared, he worked at IndexIQ Advisors as a senior index portfolio manager for three years and for Bank of America’s Columbia Management subsidiary as a portfolio manager for three years. Mr. Sinha also spent time as a software consultant at DPM Mellon, LLC and an equity trader at Jane Street Capital. |
Schwab Fundamental Index ETFs | Annual Report
Schwab Fundamental U.S. Broad Market Index ETF as of February 28, 2022
The Schwab Fundamental U.S. Broad Market Index ETF’s (the fund) goal is to track as closely as possible, before fees and expenses, the total return of the Russell RAFITM US Index (the index). The index measures the performance of the constituent companies by fundamental overall company scores, which are created using as the universe the U.S. companies in the FTSE Global Total Cap Index. To pursue its investment objective, the fund invests in a representative sample of the securities included in the index which, when taken together, are expected to perform similarly to the index as a whole. Due to the use of sampling techniques, the fund may not hold all of the securities in the index. For more information concerning the fund’s investment objective, strategies, and risks, please see the fund’s prospectus.
Market Highlights. For the 12-month reporting period ended February 28, 2022, U.S. equity markets generated positive returns, while global equity markets were mixed. Despite persisting COVID-19 pandemic-driven stresses on the global economy and the emergence and rapid spread of the Delta variant during the summer and the Omicron variant in late 2021, market tailwinds included strong corporate earnings, ongoing, albeit fading, fiscal stimulus measures, and optimism related to increased COVID-19 vaccination rates. As a result, for most of the reporting period, through early January 2022, U.S. equity markets posted steady gains, with several key market indices repeatedly exceeding previous record highs. Developed international equity markets were less robust, but for the most part still positive, while emerging markets were weaker. However, beginning in early 2022, equity markets declined in reaction to growing headwinds that included accelerating inflation, an increasing likelihood of rising interest rates, and, in the final week of the reporting period, Russia’s invasion of Ukraine, which drove oil prices above $100 per barrel for the first time since 2014 and roiled stock markets around the world.
Performance. For the 12-month reporting period ended February 28, 2022, the fund generally tracked the index. The fund’s market price return was 18.71% and its NAV return was 18.80% (for an explanation of the market price and NAV returns, please refer to footnote 2 on the following page). The index returned 19.09% during the same period. Differences between the return of the fund and the return of the index may be attributable to, among other things, the trading and management costs incurred by the fund and not the index.
Contributors and Detractors. The communications services sector detracted from the total return of the fund. Stocks in the communications services sector represented an average weight of approximately 7% of the fund’s investments and returned approximately -2% for the reporting period. One example from this sector is entertainment company The Walt Disney Co. The fund’s holdings of The Walt Disney Co. represented an average weight of less than 1% of the fund’s investments and returned approximately -21% for the reporting period.
While there were no additional sectors that detracted from the total return of the fund, the real estate sector was the smallest contributor to the total return of the fund, representing an average weight of approximately 3% of the fund’s investments and returning approximately 19% for the reporting period.
The financials sector contributed the most to the total return of the fund. Stocks in the financials sector represented an average weight of approximately 17% of the fund’s investments and returned approximately 22% for the reporting period. One example from this sector is Wells Fargo & Co., a diversified financial services company. The fund’s holdings of Wells Fargo & Co. represented an average weight of approximately 1% of the fund’s investments and returned approximately 50% for the reporting period.
The energy sector also contributed to the total return of the fund, representing an average weight of approximately 8% of the fund’s investments and returning approximately 49% for the reporting period.
Management views and portfolio holdings may have changed since the report date.
Schwab Fundamental Index ETFs | Annual Report
Schwab Fundamental U.S. Broad Market Index ETF
Performance and Fund Facts as of February 28, 2022
The performance data quoted represents past performance. Past performance does not guarantee future results. Investment return and principal value of an investment will fluctuate so that an investor’s shares, when sold or redeemed, may be worth more or less than the original cost. Current performance may be lower or higher than the performance quoted. To obtain performance information current to the most recent month end, please visit www.schwabassetmanagement.com/schwabetfs_prospectus.
Performance of Hypothetical $10,000 Investment (August 15, 2013 – February 28, 2022)1
Average Annual Total Returns1
| Fund and Inception Date | 1 Year | 5 Years | Since Inception* |
| Fund: Schwab Fundamental U.S. Broad Market Index ETF (8/15/13) | | | |
| Market Price Return2 | 18.71% | 13.20% | 12.33% |
| NAV Return2 | 18.80% | 13.21% | 12.33% |
| Russell RAFITM US Index | 19.09% | 13.46% | 12.62% |
| Russell 3000® Index | 12.29% | 14.68% | 13.56% |
| ETF Category: Morningstar Large Value3 | 17.20% | 10.17% | N/A |
| Fund Expense Ratio4: 0.25% |
All total returns on this page assume dividends and distributions were reinvested. Index figures do not include trading and management costs, which would lower performance. Indices are unmanaged and cannot be invested in directly. Performance results less than one year are not annualized.
The first index listed for the fund is the fund’s primary benchmark, as shown in the prospectus. Additional indices shown are provided for comparative purposes.
For index definitions, please see the Glossary.
Shares are bought and sold at market price, which may be higher or lower than the net asset value (NAV). Brokerage commissions will reduce returns.
Index ownership — The Schwab Fundamental U.S. Broad Market Index ETF is not in any way sponsored, endorsed, sold or promoted by Frank Russell Company (Russell), by the London Stock Exchange Group companies (LSEG), or by Research Affiliates LLC (RA) (collectively the Licensor Parties), and none of the Licensor Parties make any warranty or representation whatsoever, expressly or impliedly, either as to the results to be obtained from the use of the Russell RAFI™ US Index (the Index) or otherwise. The Index is compiled and calculated by Russell in conjunction with RA. None of the Licensor Parties shall be liable (whether in negligence or otherwise) to any person for any error in the Index and none of the Licensor Parties shall be under any obligation to advise any person of any error therein. “Russell®” is a trademark of Russell. The trade names “Research Affiliates®”, “Fundamental Index®” and “RAFI®” are registered trademarks of RA. Charles Schwab Investment Management, Inc. has obtained full license from Russell to use the Index. For full disclaimer please see the fund’s statement of additional information.
| * | Inception (8/15/13) represents the date that the shares began trading in the secondary market. |
| 1 | Performance does not reflect the deduction of taxes that a shareholder would pay on fund distributions or on the redemption or sale of fund shares. |
| 2 | ETF performance must be shown based on both a market price and NAV basis. The fund’s per share NAV is the value of one share of the fund. NAV is calculated by taking the fund’s total assets (including the fair value of securities owned), subtracting liabilities, and dividing by the number of shares outstanding. The NAV Return is based on the NAV of the fund, and the Market Price Return is based on the market price per share of the fund. The price used to calculate market return (Market Price) is determined using the Official Closing Price on the primary stock exchange (generally, 4:00 p.m. Eastern time) and may not represent the returns you would receive if shares were traded at other times. NAV is used as a proxy for purposes of calculating Market Price Return on inception date. Market Price and NAV returns assume that dividends and capital gain distributions have been reinvested in the fund at Market Price and NAV, respectively. |
| 3 | Source for category information: Morningstar, Inc. The Morningstar Category return represents all passively- and actively-managed ETFs within the category as of the report date. |
| 4 | As stated in the prospectus. |
Schwab Fundamental Index ETFs | Annual Report
Schwab Fundamental U.S. Broad Market Index ETF
Performance and Fund Facts as of February 28, 2022 (continued)
| Number of Holdings | 1,625 |
| Weighted Average Market Cap (millions) | $308,061 |
| Price/Earnings Ratio (P/E) | 14.8 |
| Price/Book Ratio (P/B) | 2.4 |
| Portfolio Turnover Rate | 13% 2 |
Sector Weightings % of Investments3
Top Equity Holdings % of Net Assets4
Portfolio holdings may have changed since the report date.
An index is a statistical composite of a specified financial market or sector. Unlike the fund, an index does not actually hold a portfolio of securities and its return is not inclusive of trading and management costs incurred by the fund.
Source of Sector Classification: S& P and MSCI.
| 1 | Excludes derivatives. |
| 2 | Portfolio turnover rate excludes securities received or delivered from processing of in-kind creations or redemptions. |
| 3 | The percentage may differ from the Portfolio Holdings because the above calculation is based on a percentage of total investments, excluding derivatives, whereas the calculation in the Portfolio Holdings is based on a percentage of net assets. |
| 4 | This list is not a recommendation of any security by the investment adviser. |
Schwab Fundamental Index ETFs | Annual Report
Schwab Fundamental U.S. Large Company Index ETF as of February 28, 2022
The Schwab Fundamental U.S. Large Company Index ETF’s (the fund) goal is to track as closely as possible, before fees and expenses, the total return of the Russell RAFITM US Large Company Index (the index). The index measures the performance of the large company size segment by fundamental overall company scores, which are created using as the universe the U.S. companies in the FTSE Global Total Cap Index. To pursue its investment objective, the fund uses a replication investment approach and generally gives the same weight to a given stock as the index does. For more information concerning the fund’s investment objective, strategies, and risks, please see the fund’s prospectus.
Market Highlights. U.S. large-cap stocks outperformed U.S. small-cap stocks over the reporting period. For the 12-month reporting period ended February 28, 2022, U.S. equity markets generated positive returns, while global equity markets were mixed. Despite persisting COVID-19 pandemic-driven stresses on the global economy and the emergence and rapid spread of the Delta variant during the summer and the Omicron variant in late 2021, market tailwinds included strong corporate earnings, ongoing, albeit fading, fiscal stimulus measures, and optimism related to increased COVID-19 vaccination rates. As a result, for most of the reporting period, through early January 2022, U.S. equity markets posted steady gains, with several key market indices repeatedly exceeding previous record highs. Developed international equity markets were less robust, but for the most part still positive, while emerging markets were weaker. However, beginning in early 2022, equity markets declined in reaction to growing headwinds that included accelerating inflation, an increasing likelihood of rising interest rates, and, in the final week of the reporting period, Russia’s invasion of Ukraine, which drove oil prices above $100 per barrel for the first time since 2014 and roiled stock markets around the world.
Performance. For the 12-month reporting period ended February 28, 2022, the fund generally tracked the index. The fund’s market price return was 19.62% and its NAV return was 19.61% (for an explanation of the market price and NAV returns, please refer to footnote 2 on the following page). The index returned 19.90% during the same period. Differences between the return of the fund and the return of the index may be attributable to, among other things, the trading and management costs incurred by the fund and not the index.
Contributors and Detractors. The communications services sector detracted from the total return of the fund. Stocks in the communications services sector represented an average weight of approximately 8% of the fund’s investments and returned approximately -3% for the reporting period. One example from this sector is entertainment company The Walt Disney Co. The fund’s holdings of The Walt Disney Co. represented an average weight of less than 1% of the fund’s investments and returned approximately -21% for the reporting period.
While there were no additional sectors that detracted from the total return of the fund, the real estate sector was the smallest contributor to the total return of the fund, representing an average weight of approximately 2% of the fund’s investments and returning approximately 21% for the reporting period.
The financials sector contributed the most to the total return of the fund. Stocks in the financials sector represented an average weight of approximately 17% of the fund’s investments and returned approximately 23% for the reporting period. One example from this sector is Wells Fargo & Co., a diversified financial services company. The fund’s holdings of Wells Fargo & Co. represented an average weight of approximately 2% of the fund’s investments and returned approximately 50% for the reporting period.
The energy sector also contributed to the total return of the fund, representing an average weight of approximately 9% of the fund’s investments and returning approximately 49% for the reporting period.
Management views and portfolio holdings may have changed since the report date.
Schwab Fundamental Index ETFs | Annual Report
Schwab Fundamental U.S. Large Company Index ETF
Performance and Fund Facts as of February 28, 2022
The performance data quoted represents past performance. Past performance does not guarantee future results. Investment return and principal value of an investment will fluctuate so that an investor’s shares, when sold or redeemed, may be worth more or less than the original cost. Current performance may be lower or higher than the performance quoted. To obtain performance information current to the most recent month end, please visit www.schwabassetmanagement.com/schwabetfs_prospectus.
Performance of Hypothetical $10,000 Investment (August 15, 2013 – February 28, 2022)1
Average Annual Total Returns1
| Fund and Inception Date | 1 Year | 5 Years | Since Inception* |
| Fund: Schwab Fundamental U.S. Large Company Index ETF (8/15/13) | | | |
| Market Price Return2 | 19.62% | 13.43% | 12.45% |
| NAV Return2 | 19.61% | 13.43% | 12.45% |
| Russell RAFITM US Large Company Index | 19.90% | 13.68% | 12.75% |
| Russell 1000® Index | 13.72% | 15.07% | 13.87% |
| ETF Category: Morningstar Large Value3 | 17.20% | 10.17% | N/A |
| Fund Expense Ratio4: 0.25% |
All total returns on this page assume dividends and distributions were reinvested. Index figures do not include trading and management costs, which would lower performance. Indices are unmanaged and cannot be invested in directly. Performance results less than one year are not annualized.
The first index listed for the fund is the fund’s primary benchmark, as shown in the prospectus. Additional indices shown are provided for comparative purposes.
For index definitions, please see the Glossary.
Shares are bought and sold at market price, which may be higher or lower than the net asset value (NAV). Brokerage commissions will reduce returns.
Index ownership — The Schwab Fundamental U.S. Large Company Index ETF is not in any way sponsored, endorsed, sold or promoted by Frank Russell Company (Russell), by the London Stock Exchange Group companies (LSEG), or by Research Affiliates LLC (RA) (collectively the Licensor Parties), and none of the Licensor Parties make any warranty or representation whatsoever, expressly or impliedly, either as to the results to be obtained from the use of the Russell RAFI™ US Large Company Index (the Index) or otherwise. The Index is compiled and calculated by Russell in conjunction with RA. None of the Licensor Parties shall be liable (whether in negligence or otherwise) to any person for any error in the Index and none of the Licensor Parties shall be under any obligation to advise any person of any error therein. “Russell®” is a trademark of Russell. The trade names “Research Affiliates®”, “Fundamental Index®” and “RAFI®” are registered trademarks of RA. Charles Schwab Investment Management, Inc. has obtained full license from Russell to use the Index. For full disclaimer please see the fund’s statement of additional information.
| * | Inception (8/15/13) represents the date that the shares began trading in the secondary market. |
| 1 | Performance does not reflect the deduction of taxes that a shareholder would pay on fund distributions or on the redemption or sale of fund shares. |
| 2 | ETF performance must be shown based on both a market price and NAV basis. The fund’s per share NAV is the value of one share of the fund. NAV is calculated by taking the fund’s total assets (including the fair value of securities owned), subtracting liabilities, and dividing by the number of shares outstanding. The NAV Return is based on the NAV of the fund, and the Market Price Return is based on the market price per share of the fund. The price used to calculate market return (Market Price) is determined using the Official Closing Price on the primary stock exchange (generally, 4:00 p.m. Eastern time) and may not represent the returns you would receive if shares were traded at other times. NAV is used as a proxy for purposes of calculating Market Price Return on inception date. Market Price and NAV returns assume that dividends and capital gain distributions have been reinvested in the fund at Market Price and NAV, respectively. |
| 3 | Source for category information: Morningstar, Inc. The Morningstar Category return represents all passively- and actively-managed ETFs within the category as of the report date. |
| 4 | As stated in the prospectus. |
Schwab Fundamental Index ETFs | Annual Report
Schwab Fundamental U.S. Large Company Index ETF
Performance and Fund Facts as of February 28, 2022 (continued)
| Number of Holdings | 718 |
| Weighted Average Market Cap (millions) | $332,224 |
| Price/Earnings Ratio (P/E) | 14.7 |
| Price/Book Ratio (P/B) | 2.5 |
| Portfolio Turnover Rate | 11% 2 |
Sector Weightings % of Investments3
Top Equity Holdings % of Net Assets4
Portfolio holdings may have changed since the report date.
An index is a statistical composite of a specified financial market or sector. Unlike the fund, an index does not actually hold a portfolio of securities and its return is not inclusive of trading and management costs incurred by the fund.
Source of Sector Classification: S& P and MSCI.
| 1 | Excludes derivatives. |
| 2 | Portfolio turnover rate excludes securities received or delivered from processing of in-kind creations or redemptions. |
| 3 | The percentage may differ from the Portfolio Holdings because the above calculation is based on a percentage of total investments, excluding derivatives, whereas the calculation in the Portfolio Holdings is based on a percentage of net assets. |
| 4 | This list is not a recommendation of any security by the investment adviser. |
Schwab Fundamental Index ETFs | Annual Report
Schwab Fundamental U.S. Small Company Index ETF as of February 28, 2022
The Schwab Fundamental U.S. Small Company Index ETF’s (the fund) goal is to track as closely as possible, before fees and expenses, the total return of the Russell RAFITM US Small Company Index (the index). The index measures the performance of the small company size segment by fundamental overall company scores, which are created using as the universe the U.S. companies in the FTSE Global Total Cap Index. To pursue its investment objective, the fund uses a replication investment approach and generally gives the same weight to a given stock as the index does. For more information concerning the fund’s investment objective, strategies, and risks, please see the fund’s prospectus.
Market Highlights. U.S. small-cap stocks underperformed U.S. large-cap stocks over the reporting period. For the 12-month reporting period ended February 28, 2022, U.S. equity markets generated positive returns, while global equity markets were mixed. Despite persisting COVID-19 pandemic-driven stresses on the global economy and the emergence and rapid spread of the Delta variant during the summer and the Omicron variant in late 2021, market tailwinds included strong corporate earnings, ongoing, albeit fading, fiscal stimulus measures, and optimism related to increased COVID-19 vaccination rates. As a result, for most of the reporting period, through early January 2022, U.S. equity markets posted steady gains, with several key market indices repeatedly exceeding previous record highs. Developed international equity markets were less robust, but for the most part still positive, while emerging markets were weaker. However, beginning in early 2022, equity markets declined in reaction to growing headwinds that included accelerating inflation, an increasing likelihood of rising interest rates, and, in the final week of the reporting period, Russia’s invasion of Ukraine, which drove oil prices above $100 per barrel for the first time since 2014 and roiled stock markets around the world.
Performance. For the 12-month reporting period ended February 28, 2022, the fund generally tracked the index. The fund’s market price return was 10.01% and the fund’s NAV return was 10.06% (for an explanation of the market price and NAV returns, please refer to footnote 2 on the following page). The index returned 10.32% during the same period. Differences between the return of the fund and the return of the index may be attributable to, among other things, the trading and management costs incurred by the fund and not the index.
Contributors and Detractors. The information technology sector detracted from the total return of the fund. Stocks from the information technology sector represented an average weight of approximately 11% of the fund’s investments. The return for the sector was slightly negative, nearly flat, for the reporting period. One example from this sector is CommScope Holding Co., Inc., which designs, builds, and manages wired and wireless networks. The fund’s holdings of CommScope Holding Co., Inc. represented less than 1% of the fund’s investments and returned approximately -40% for the reporting period.
While there were no additional sectors that detracted from the total return of the fund, the health care sector was the smallest contributor to the total return of the fund, representing an average weight of approximately 6% of the fund’s investments and returning approximately 1% for the reporting period.
The financials sector contributed the most to the total return of the fund. Stocks in the financials sector represented an average weight of approximately 15% of the fund’s investments and returned approximately 16% for the reporting period. One example from this sector is Santander Consumer USA Holdings, Inc., which provides auto loans. The fund’s holdings of Santander Consumer USA Holdings, Inc. represented an average weight of less than 1% of the fund’s investments and returned approximately 61% for the reporting period. The fund’s position in Santander Consumer USA Holdings, Inc. was sold prior to the end of the reporting period.
The energy sector also contributed to the total return of the fund, representing an average weight of approximately 5% of the fund’s investments and returning approximately 51% for the reporting period.
Management views and portfolio holdings may have changed since the report date.
Schwab Fundamental Index ETFs | Annual Report
Schwab Fundamental U.S. Small Company Index ETF
Performance and Fund Facts as of February 28, 2022
The performance data quoted represents past performance. Past performance does not guarantee future results. Investment return and principal value of an investment will fluctuate so that an investor’s shares, when sold or redeemed, may be worth more or less than the original cost. Current performance may be lower or higher than the performance quoted. To obtain performance information current to the most recent month end, please visit www.schwabassetmanagement.com/schwabetfs_prospectus.
Performance of Hypothetical $10,000 Investment (August 15, 2013 – February 28, 2022)1
Average Annual Total Returns1
| Fund and Inception Date | 1 Year | 5 Years | Since Inception* |
| Fund: Schwab Fundamental U.S. Small Company Index ETF (8/15/13) | | | |
| Market Price Return2 | 10.01% | 10.30% | 10.70% |
| NAV Return2 | 10.06% | 10.29% | 10.69% |
| Russell RAFITM US Small Company Index | 10.32% | 10.47% | 10.94% |
| Russell 2000® Index | -6.01% | 9.50% | 9.60% |
| ETF Category: Morningstar Small Blend3 | 3.98% | 9.36% | N/A |
| Fund Expense Ratio4: 0.25% |
All total returns on this page assume dividends and distributions were reinvested. Index figures do not include trading and management costs, which would lower performance. Indices are unmanaged and cannot be invested in directly. Performance results less than one year are not annualized.
The first index listed for the fund is the fund’s primary benchmark, as shown in the prospectus. Additional indices shown are provided for comparative purposes.
For index definitions, please see the Glossary.
Shares are bought and sold at market price, which may be higher or lower than the net asset value (NAV). Brokerage commissions will reduce returns.
Small-company stocks may be subject to greater volatility than many other asset classes.
Index ownership — The Schwab Fundamental U.S. Small Company Index ETF is not in any way sponsored, endorsed, sold or promoted by Frank Russell Company (Russell), by the London Stock Exchange Group companies (LSEG), or by Research Affiliates LLC (RA) (collectively the Licensor Parties), and none of the Licensor Parties make any warranty or representation whatsoever, expressly or impliedly, either as to the results to be obtained from the use of the Russell RAFI™ US Small Company Index (the Index) or otherwise. The Index is compiled and calculated by Russell in conjunction with RA. None of the Licensor Parties shall be liable (whether in negligence or otherwise) to any person for any error in the Index and none of the Licensor Parties shall be under any obligation to advise any person of any error therein. “Russell®” is a trademark of Russell. The trade names “Research Affiliates®”, “Fundamental Index®” and “RAFI®” are registered trademarks of RA. Charles Schwab Investment Management, Inc. has obtained full license from Russell to use the Index. For full disclaimer please see the fund’s statement of additional information.
| * | Inception (8/15/13) represents the date that the shares began trading in the secondary market. |
| 1 | Performance does not reflect the deduction of taxes that a shareholder would pay on fund distributions or on the redemption or sale of fund shares. |
| 2 | ETF performance must be shown based on both a market price and NAV basis. The fund’s per share NAV is the value of one share of the fund. NAV is calculated by taking the fund’s total assets (including the fair value of securities owned), subtracting liabilities, and dividing by the number of shares outstanding. The NAV Return is based on the NAV of the fund, and the Market Price Return is based on the market price per share of the fund. The price used to calculate market return (Market Price) is determined using the Official Closing Price on the primary stock exchange (generally, 4:00 p.m. Eastern time) and may not represent the returns you would receive if shares were traded at other times. NAV is used as a proxy for purposes of calculating Market Price Return on inception date. Market Price and NAV returns assume that dividends and capital gain distributions have been reinvested in the fund at Market Price and NAV, respectively. |
| 3 | Source for category information: Morningstar, Inc. The Morningstar Category return represents all passively- and actively-managed ETFs within the category as of the report date. |
| 4 | As stated in the prospectus. |
Schwab Fundamental Index ETFs | Annual Report
Schwab Fundamental U.S. Small Company Index ETF
Performance and Fund Facts as of February 28, 2022 (continued)
| Number of Holdings | 908 |
| Weighted Average Market Cap (millions) | $5,976 |
| Price/Earnings Ratio (P/E) | 15.6 |
| Price/Book Ratio (P/B) | 2.0 |
| Portfolio Turnover Rate | 25% 2 |
Sector Weightings % of Investments3
Top Equity Holdings % of Net Assets4
Portfolio holdings may have changed since the report date.
An index is a statistical composite of a specified financial market or sector. Unlike the fund, an index does not actually hold a portfolio of securities and its return is not inclusive of trading and management costs incurred by the fund.
Source of Sector Classification: S& P and MSCI.
| 1 | Excludes derivatives. |
| 2 | Portfolio turnover rate excludes securities received or delivered from processing of in-kind creations or redemptions. |
| 3 | The percentage may differ from the Portfolio Holdings because the above calculation is based on a percentage of total investments, excluding derivatives, whereas the calculation in the Portfolio Holdings is based on a percentage of net assets. |
| 4 | This list is not a recommendation of any security by the investment adviser. |
Schwab Fundamental Index ETFs | Annual Report
Schwab Fundamental International Large Company Index ETF as of February 28, 2022
The Schwab Fundamental International Large Company Index ETF’s (the fund) goal is to track as closely as possible, before fees and expenses, the total return of the Russell RAFITM Developed ex US Large Company Index (the index). The index measures the performance of the large company size segment by fundamental overall company scores, which are created using as the universe the developed ex U.S. companies in the FTSE Total Global Cap Index. To pursue its investment objective, the fund invests in a representative sample of the securities included in the index which, when taken together, are expected to perform similarly to the index as a whole. Due to the use of sampling techniques, the fund may not hold all of the securities in the index. For more information concerning the fund’s investment objective, strategies, and risks, please see the fund’s prospectus.
Market Highlights. Overall, stocks of large companies in developed international markets generated positive returns for the reporting period. For the 12-month reporting period ended February 28, 2022, U.S. equity markets generated positive returns, while global equity markets were mixed. Despite persisting COVID-19 pandemic-driven stresses on the global economy and the emergence and rapid spread of the Delta variant during the summer and the Omicron variant in late 2021, market tailwinds included strong corporate earnings, ongoing, albeit fading, fiscal stimulus measures, and optimism related to increased COVID-19 vaccination rates. As a result, for most of the reporting period, through early January 2022, U.S. equity markets posted steady gains, with several key market indices repeatedly exceeding previous record highs. Developed international equity markets were less robust, but for the most part still positive, while emerging markets were weaker. However, beginning in early 2022, equity markets declined in reaction to growing headwinds that included accelerating inflation, an increasing likelihood of rising interest rates, and, in the final week of the reporting period, Russia’s invasion of Ukraine, which drove oil prices above $100 per barrel for the first time since 2014 and roiled stock markets around the world. Despite exhibiting some volatility, the U.S. dollar rose over the reporting period against a basket of foreign currencies, generally reducing the returns on overseas investments in U.S. dollar terms.
Performance. For the 12-month reporting period ended February 28, 2022, the fund’s market price return was 7.40% and its NAV return was 7.95% (for an explanation of the market price and NAV returns, please refer to footnote 2 on the following page). The index returned 8.00%1 during the same period. Differences between the return of the fund and the return of the index may be attributable to, among other things, the trading and management costs incurred by the fund and not the index.
Contributors and Detractors. Stocks from South Korea detracted the most from the total return of the fund. South Korean stocks represented an average weight of approximately 6% of the fund’s investments and returned approximately -12% in U.S. dollar terms for the reporting period. One example from this market is Samsung Electronics Co., Ltd, which manufactures a wide range of consumer and industrial electronic equipment and products. The fund’s holdings of Samsung Electronics Co., Ltd. represented an average weight of approximately 2% of the fund’s investments and returned approximately -17% in U.S. dollar terms for the reporting period.
Stocks from Hong Kong also detracted from the total return of the fund, representing an average weight of approximately 2% of the fund’s investments and returning approximately -7% in U.S. dollar terms for the reporting period.
Stocks from the United Kingdom contributed the most to the total return of the fund. Stocks from the United Kingdom represented an average weight of approximately 17% of the fund’s investments and returned approximately 22% in U.S. dollar terms for the reporting period. One example from this market is energy and petroleum company Shell plc. The fund’s holdings of Shell plc represented an average weight of approximately 2% of the fund’s investments and returned approximately 36% in U.S. dollar terms for the reporting period.
Stocks from Canada also contributed to the total return of the fund, representing an average weight of approximately 8% of the fund’s investments and returning approximately 34% in U.S. dollar terms for the reporting period.
Management views and portfolio holdings may have changed since the report date.
| 1 | The total return cited for the index is calculated net of foreign withholding taxes. |
Schwab Fundamental Index ETFs | Annual Report
Schwab Fundamental International Large Company Index ETF
Performance and Fund Facts as of February 28, 2022
The performance data quoted represents past performance. Past performance does not guarantee future results. Investment return and principal value of an investment will fluctuate so that an investor’s shares, when sold or redeemed, may be worth more or less than the original cost. Current performance may be lower or higher than the performance quoted. To obtain performance information current to the most recent month end, please visit www.schwabassetmanagement.com/schwabetfs_prospectus.
Performance of Hypothetical $10,000 Investment (August 15, 2013 – February 28, 2022)1
Average Annual Total Returns1
| Fund and Inception Date | 1 Year | 5 Years | Since Inception* |
| Fund: Schwab Fundamental International Large Company Index ETF (8/15/13) | | | |
| Market Price Return2 | 7.40% | 7.42% | 5.52% |
| NAV Return2 | 7.95% | 7.52% | 5.57% |
| Russell RAFITM Developed ex US Large Company Index (Net)3 | 8.00% | 7.54% | 5.69% |
| MSCI EAFE® Index (Net)3 | 2.83% | 7.16% | 5.07% |
| ETF Category: Morningstar Foreign Large Value4 | 5.90% | 5.47% | N/A |
| Fund Expense Ratio5: 0.25% |
All total returns on this page assume dividends and distributions were reinvested. Index figures do not include trading and management costs, which would lower performance. Indices are unmanaged and cannot be invested in directly. Performance results less than one year are not annualized.
The first index listed for the fund is the fund’s primary benchmark, as shown in the prospectus. Additional indices shown are provided for comparative purposes.
For index definitions, please see the Glossary.
Shares are bought and sold at market price, which may be higher or lower than the net asset value (NAV). Brokerage commissions will reduce returns.
International investing may involve risk of capital loss from unfavorable fluctuations in currency values, from differences in generally accepted accounting principles, or from economic or political instability in other nations.
Index ownership — The Schwab Fundamental International Large Company Index ETF is not in any way sponsored, endorsed, sold or promoted by Frank Russell Company (Russell), by the London Stock Exchange Group companies (LSEG), or by Research Affiliates LLC (RA) (collectively the Licensor Parties), and none of the Licensor Parties make any warranty or representation whatsoever, expressly or impliedly, either as to the results to be obtained from the use of the Russell RAFI™ Developed ex US Large Company Index (the Index) or otherwise. The Index is compiled and calculated by Russell in conjunction with RA. None of the Licensor Parties shall be liable (whether in negligence or otherwise) to any person for any error in the Index and none of the Licensor Parties shall be under any obligation to advise any person of any error therein. “Russell®” is a trademark of Russell. The trade names “Research Affiliates®”, “Fundamental Index®” and “RAFI®” are registered trademarks of RA. Charles Schwab Investment Management, Inc. has obtained full license from Russell to use the Index. For full disclaimer please see the fund’s statement of additional information.
| * | Inception (8/15/13) represents the date that the shares began trading in the secondary market. |
| 1 | Performance does not reflect the deduction of taxes that a shareholder would pay on fund distributions or on the redemption or sale of fund shares. |
| 2 | ETF performance must be shown based on both a market price and NAV basis. The fund’s per share NAV is the value of one share of the fund. NAV is calculated by taking the fund’s total assets (including the fair value of securities owned), subtracting liabilities, and dividing by the number of shares outstanding. The NAV Return is based on the NAV of the fund, and the Market Price Return is based on the market price per share of the fund. The price used to calculate market return (Market Price) is determined using the Official Closing Price on the primary stock exchange (generally, 4:00 p.m. Eastern time) and may not represent the returns you would receive if shares were traded at other times. NAV is used as a proxy for purposes of calculating Market Price Return on inception date. Market Price and NAV returns assume that dividends and capital gain distributions have been reinvested in the fund at Market Price and NAV, respectively. |
| 3 | The net version of the index reflects reinvested dividends net of withholding taxes but reflects no deductions for expenses or other taxes. |
| 4 | Source for category information: Morningstar, Inc. The Morningstar Category return represents all passively- and actively-managed ETFs within the category as of the report date. |
| 5 | As stated in the prospectus. |
Schwab Fundamental Index ETFs | Annual Report
Schwab Fundamental International Large Company Index ETF
Performance and Fund Facts as of February 28, 2022 (continued)
| Number of Holdings | 925 |
| Weighted Average Market Cap (millions) | $70,855 |
| Price/Earnings Ratio (P/E) | 10.3 |
| Price/Book Ratio (P/B) | 1.2 |
| Portfolio Turnover Rate | 15% 2 |
Sector Weightings % of Investments1
Top Equity Holdings % of Net Assets3
Country Weightings % of Investments4
Portfolio holdings may have changed since the report date.
An index is a statistical composite of a specified financial market or sector. Unlike the fund, an index does not actually hold a portfolio of securities and its return is not inclusive of trading and management costs incurred by the fund.
Source of Sector Classification: S&P and MSCI.
| 1 | Excludes derivatives. |
| 2 | Portfolio turnover rate excludes securities received or delivered from processing of in-kind creations or redemptions. |
| 3 | This list is not a recommendation of any security by the investment adviser. |
| 4 | The percentage may differ from the Portfolio Holdings because the above calculation is based on a percentage of total investments, excluding derivatives, whereas the calculation in the Portfolio Holdings is based on a percentage of net assets. |
Schwab Fundamental Index ETFs | Annual Report
Schwab Fundamental International Small Company Index ETF as of February 28, 2022
The Schwab Fundamental International Small Company Index ETF’s (the fund) goal is to track as closely as possible, before fees and expenses, the total return of the Russell RAFITM Developed ex US Small Company Index (the index). The index measures the performance of the small company size segment by fundamental overall company scores, which are created using as the universe the developed ex U.S. companies in the FTSE Global Total Cap Index. To pursue its investment objective, the fund invests in a representative sample of the securities included in the index which, when taken together, are expected to perform similarly to the index as a whole. Due to the use of sampling techniques, the fund may not hold all of the securities in the index. For more information concerning the fund’s investment objective, strategies, and risks, please see the fund’s prospectus.
Market Highlights. Overall, stocks of small companies in developed international markets generated positive returns for the reporting period. For the 12-month reporting period ended February 28, 2022, U.S. equity markets generated positive returns, while global equity markets were mixed. Despite persisting COVID-19 pandemic-driven stresses on the global economy and the emergence and rapid spread of the Delta variant during the summer and the Omicron variant in late 2021, market tailwinds included strong corporate earnings, ongoing fiscal, albeit fading, stimulus measures, and optimism related to increased COVID-19 vaccination rates. As a result, for most of the reporting period, through early January 2022, U.S. equity markets posted steady gains, with several key market indices repeatedly exceeding previous record highs. Developed international equity markets were less robust, but for the most part still positive, while emerging markets were weaker. However, beginning in early 2022, equity markets declined in reaction to growing headwinds that included accelerating inflation, an increasing likelihood of rising interest rates, and, in the final week of the reporting period, Russia’s invasion of Ukraine, which drove oil prices above $100 per barrel for the first time since 2014 and roiled stock markets around the world. Despite exhibiting some volatility, the U.S. dollar rose over the reporting period against a basket of foreign currencies, generally reducing the returns on overseas investments in U.S. dollar terms.
Performance. For the 12-month reporting period ended February 28, 2022, the fund’s market price return was 1.61% and its NAV return was 1.86% (for an explanation of the market price and NAV returns, please refer to footnote 2 on the following page). The index returned 2.17%1 during the same period. Differences between the return of the fund and the return of the index may be attributable to, among other things, the trading and management costs incurred by the fund and not the index.
Contributors and Detractors. Stocks from Japan detracted the most from the total return of the fund. Japanese stocks represented an average weight of approximately 31% of the fund’s investments and returned approximately -4% in U.S. dollar terms for the reporting period. One example from this market is pharmaceutical company Hisamitsu Pharmaceutical Co., Inc. The fund’s holdings of Hisamitsu Pharmaceutical Co., Inc. represented an average weight of less than 1% of the fund’s investments and returned approximately -48% in U.S. dollar terms for the reporting period.
Stocks from Hong Kong also detracted from the total return of the fund, representing an average weight of approximately 4% of the fund’s investments and returning approximately -7% in U.S. dollar terms for the reporting period.
Stocks form Canada contributed the most to the total return of the fund. Canadian stocks represented an average weight of approximately 8% of the fund’s investments and returned approximately 29% in U.S. dollar terms for the reporting period. One example from this market is oil and gas company Baytex Energy Corp. The fund’s holdings of Baytex Energy Corp. represented an average weight of less than 1% of the fund’s investments and returned approximately 370% in U.S. dollar terms for the reporting period.
Stocks from Israel also contributed to the total return of the fund, representing an average weight of approximately 2% of the fund’s investments and returning approximately 63% in U.S. dollar terms for the reporting period.
Management views and portfolio holdings may have changed since the report date.
| 1 | The total return cited for the index is calculated net of foreign withholding taxes. |
Schwab Fundamental Index ETFs | Annual Report
Schwab Fundamental International Small Company Index ETF
Performance and Fund Facts as of February 28, 2022
The performance data quoted represents past performance. Past performance does not guarantee future results. Investment return and principal value of an investment will fluctuate so that an investor’s shares, when sold or redeemed, may be worth more or less than the original cost. Current performance may be lower or higher than the performance quoted. To obtain performance information current to the most recent month end, please visit www.schwabassetmanagement.com/schwabetfs_prospectus.
Performance of Hypothetical $10,000 Investment (August 15, 2013 – February 28, 2022)1
Average Annual Total Returns1
| Fund and Inception Date | 1 Year | 5 Years | Since Inception* |
| Fund: Schwab Fundamental International Small Company Index ETF (8/15/13) | | | |
| Market Price Return2 | 1.61% | 6.07% | 6.32% |
| NAV Return2 | 1.86% | 6.10% | 6.35% |
| Russell RAFITM Developed ex US Small Company Index (Net)3 | 2.17% | 6.30% | 6.71% |
| S&P Developed ex-U.S. Small Cap Index (Net)3 | -2.47% | 7.47% | 6.76% |
| ETF Category: Morningstar Foreign Small/Mid Value4 | 5.44% | 6.12% | N/A |
| Fund Expense Ratio5: 0.39% |
All total returns on this page assume dividends and distributions were reinvested. Index figures do not include trading and management costs, which would lower performance. Indices are unmanaged and cannot be invested in directly. Performance results less than one year are not annualized.
The first index listed for the fund is the fund’s primary benchmark, as shown in the prospectus. Additional indices shown are provided for comparative purposes.
For index definitions, please see the Glossary.
Shares are bought and sold at market price, which may be higher or lower than the net asset value (NAV). Brokerage commissions will reduce returns.
International investing may involve risk of capital loss from unfavorable fluctuations in currency values, from differences in generally accepted accounting principles, or from economic or political instability in other nations.
Small-company stocks may be subject to greater volatility than many other asset classes.
Index ownership — The Schwab Fundamental International Small Company Index ETF is not in any way sponsored, endorsed, sold or promoted by Frank Russell Company (Russell), by the London Stock Exchange Group companies (LSEG), or by Research Affiliates LLC (RA) (collectively the Licensor Parties), and none of the Licensor Parties make any warranty or representation whatsoever, expressly or impliedly, either as to the results to be obtained from the use of the Russell RAFI™ Developed ex US Small Company Index (the Index) or otherwise. The Index is compiled and calculated by Russell in conjunction with RA. None of the Licensor Parties shall be liable (whether in negligence or otherwise) to any person for any error in the Index and none of the Licensor Parties shall be under any obligation to advise any person of any error therein. “Russell®” is a trademark of Russell. The trade names “Research Affiliates®”, “Fundamental Index®” and “RAFI®” are registered trademarks of RA. Charles Schwab Investment Management, Inc. has obtained full license from Russell to use the Index. For full disclaimer please see the fund’s statement of additional information.
| * | Inception (8/15/13) represents the date that the shares began trading in the secondary market. |
| 1 | Performance does not reflect the deduction of taxes that a shareholder would pay on fund distributions or on the redemption or sale of fund shares. |
| 2 | ETF performance must be shown based on both a market price and NAV basis. The fund’s per share NAV is the value of one share of the fund. NAV is calculated by taking the fund’s total assets (including the fair value of securities owned), subtracting liabilities, and dividing by the number of shares outstanding. The NAV Return is based on the NAV of the fund, and the Market Price Return is based on the market price per share of the fund. The price used to calculate market return (Market Price) is determined using the Official Closing Price on the primary stock exchange (generally, 4:00 p.m. Eastern time) and may not represent the returns you would receive if shares were traded at other times. NAV is used as a proxy for purposes of calculating Market Price Return on inception date. Market Price and NAV returns assume that dividends and capital gain distributions have been reinvested in the fund at Market Price and NAV, respectively. |
| 3 | The net version of the index reflects reinvested dividends net of withholding taxes but reflects no deductions for expenses or other taxes. |
| 4 | Source for category information: Morningstar, Inc. The Morningstar Category return represents all passively- and actively-managed ETFs within the category as of the report date. |
| 5 | As stated in the prospectus. |
Schwab Fundamental Index ETFs | Annual Report
Schwab Fundamental International Small Company Index ETF
Performance and Fund Facts as of February 28, 2022 (continued)
| Number of Holdings | 1,632 |
| Weighted Average Market Cap (millions) | $3,859 |
| Price/Earnings Ratio (P/E) | 10.7 |
| Price/Book Ratio (P/B) | 1.1 |
| Portfolio Turnover Rate | 28% 2 |
Sector Weightings % of Investments1
Top Equity Holdings % of Net Assets3
Country Weightings % of Investments4
Portfolio holdings may have changed since the report date.
An index is a statistical composite of a specified financial market or sector. Unlike the fund, an index does not actually hold a portfolio of securities and its return is not inclusive of trading and management costs incurred by the fund.
Source of Sector Classification: S&P and MSCI.
| 1 | Excludes derivatives. |
| 2 | Portfolio turnover rate excludes securities received or delivered from processing of in-kind creations or redemptions. |
| 3 | This list is not a recommendation of any security by the investment adviser. |
| 4 | The percentage may differ from the Portfolio Holdings because the above calculation is based on a percentage of total investments, excluding derivatives, whereas the calculation in the Portfolio Holdings is based on a percentage of net assets. |
Schwab Fundamental Index ETFs | Annual Report
Schwab Fundamental Emerging Markets Large Company Index ETF as of February 28, 2022
The Schwab Fundamental Emerging Markets Large Company Index ETF’s (the fund) goal is to track as closely as possible, before fees and expenses, the total return of the Russell RAFITM Emerging Markets Large Company Index (the index). The index measures the performance of the large company size segment by fundamental overall company scores, which are created using as the universe the emerging markets companies in the FTSE Global Total Cap Index. To pursue its investment objective, the fund invests in a representative sample of the securities included in the index which, when taken together, are expected to perform similarly to the index as a whole. Due to the use of sampling techniques, the fund may not hold all of the securities in the index. For more information concerning the fund’s investment objective, strategies, and risks, please see the fund’s prospectus.
Market Highlights. Overall, stocks in emerging markets generally produced negative returns for the reporting period. For the 12-month reporting period ended February 28, 2022, U.S. equity markets generated positive returns, while global equity markets were mixed. Despite persisting COVID-19 pandemic-driven stresses on the global economy and the emergence and rapid spread of the Delta variant during the summer and the Omicron variant in late 2021, market tailwinds included strong corporate earnings, ongoing, albeit fading, fiscal stimulus measures, and optimism related to increased COVID-19 vaccination rates. As a result, for most of the reporting period, through early January 2022, U.S. equity markets posted steady gains, with several key market indices repeatedly exceeding previous record highs. Developed international equity markets were less robust, but for the most part still positive, while emerging markets were weaker. However, beginning in early 2022, equity markets declined in reaction to growing headwinds that included accelerating inflation, an increasing likelihood of rising interest rates, and, in the final week of the reporting period, Russia’s invasion of Ukraine, which drove oil prices above $100 per barrel for the first time since 2014 and roiled stock markets around the world. Despite exhibiting some volatility, the U.S. dollar rose over the reporting period against a basket of foreign currencies, generally reducing the returns on overseas investments in U.S. dollar terms.
Performance. For the 12-month reporting period ended February 28, 2022, the fund’s market price return was 5.31% and its NAV return was 2.97% (for an explanation of the market price and NAV returns, please refer to footnote 2 on the following page). The index returned 6.51%1 during the same period. Fair valuation2 of the fund’s holdings detracted from the fund’s relative performance. Differences between the return of the fund and the return of the index may also be attributable to, among other things, the trading and management costs incurred by the fund and not the index.
Contributors and Detractors. Stocks from Russia detracted the most from the total return of the fund. Russian stocks also detracted from the fund’s performance relative to the index as a result of the Russian stock exchange closure resulting in fair valuation2 of Russian securities by the fund but not the index. Russian stocks represented an average weight of approximately 12% of the fund’s investments and returned approximately -67% in U.S. dollar terms for the reporting period. The average weight of Russian stocks in the index was also approximately 12% but returned approximately -36% in U.S. dollar terms for the reporting period. One example from this market is LUKOIL PJSC, which explores for, produces, refines, transports, and markets oil and gas mainly from Western Siberia. The fund’s holdings of LUKOIL PJSC represented an average weight of approximately 3% of the fund’s investments and returned approximately -64% in U.S. dollar terms for the reporting period. The average weight of LUKOIL PJSC in the index was also approximately 3% but returned approximately -30% in U.S. dollar terms for the reporting period.
Stocks from China also detracted from the total return of the fund, representing an average weight of approximately 25% of the fund’s investments and returning approximately -8% in U.S. dollar terms for the reporting period.
Stocks from Brazil contributed the most to the total return of the fund. Brazilian stocks represented an average weight of approximately 10% of the fund’s investments and returned approximately 39% in U.S. dollar terms for the reporting period. One example from this market is Petroleo Brasileiro S.A., which refines, markets, and supplies oil products. The fund’s preferred stock holdings of Petroleo Brasileiro S.A. represented an average weight of approximately 1% of the fund’s investments and returned approximately 102% in U.S. dollar terms for the reporting period.
Stocks from South Africa also contributed to the total return of the fund, representing an average weight of 7% of the fund’s investments and returning approximately 52% in U.S. dollar terms for the reporting period.
Management views and portfolio holdings may have changed since the report date.
| 1 | The total return cited for the index is calculated net of foreign withholding taxes. |
| 2 | Fair valued by management using significant unobservable inputs in accordance with procedures approved by the fund’s Board of Trustees (see financial note 2(a) for additional information). |
Schwab Fundamental Index ETFs | Annual Report
Schwab Fundamental Emerging Markets Large Company Index ETF
Performance and Fund Facts as of February 28, 2022
The performance data quoted represents past performance. Past performance does not guarantee future results. Investment return and principal value of an investment will fluctuate so that an investor’s shares, when sold or redeemed, may be worth more or less than the original cost. Current performance may be lower or higher than the performance quoted. To obtain performance information current to the most recent month end, please visit www.schwabassetmanagement.com/schwabetfs_prospectus.
Performance of Hypothetical $10,000 Investment (August 15, 2013 – February 28, 2022)1
Average Annual Total Returns1
| Fund and Inception Date | 1 Year | 5 Years | Since Inception* |
| Fund: Schwab Fundamental Emerging Markets Large Company Index ETF (8/15/13) | | | |
| Market Price Return2 | 5.31% | 6.07% | 4.58% |
| NAV Return2 | 2.97% | 5.55% | 4.34% |
| Russell RAFITM Emerging Markets Large Company Index (Net)3 | 6.51% | 6.76% | 5.30% |
| MSCI Emerging Markets Index (Net)3 | -10.69% | 6.99% | 4.61% |
| ETF Category: Morningstar Diversified Emerging Markets4 | -9.68% | 6.68% | N/A |
| Fund Expense Ratio5: 0.39% |
All total returns on this page assume dividends and distributions were reinvested. Index figures do not include trading and management costs, which would lower performance. Indices are unmanaged and cannot be invested in directly. Performance results less than one year are not annualized.
The first index listed for the fund is the fund’s primary benchmark, as shown in the prospectus. Additional indices shown are provided for comparative purposes.
For index definitions, please see the Glossary.
Shares are bought and sold at market price, which may be higher or lower than the net asset value (NAV). Brokerage commissions will reduce returns.
International investing may involve risk of capital loss from unfavorable fluctuations in currency values, from differences in generally accepted accounting principles, or from economic or political instability in other nations.
Emerging markets involve heightened risks related to the same factors as international investing, as well as increased volatility and lower trading volume.
Index ownership — The Schwab Fundamental Emerging Markets Large Company Index ETF is not in any way sponsored, endorsed, sold or promoted by Frank Russell Company (Russell), by the London Stock Exchange Group companies (LSEG), or by Research Affiliates LLC (RA) (collectively the Licensor Parties), and none of the Licensor Parties make any warranty or representation whatsoever, expressly or impliedly, either as to the results to be obtained from the use of the Russell RAFI™ Emerging Markets Large Company Index (the Index) or otherwise. The Index is compiled and calculated by Russell in conjunction with RA. None of the Licensor Parties shall be liable (whether in negligence or otherwise) to any person for any error in the Index and none of the Licensor Parties shall be under any obligation to advise any person of any error therein. “Russell®” is a trademark of Russell. The trade names “Research Affiliates®”, “Fundamental Index®” and “RAFI®” are registered trademarks of RA. Charles Schwab Investment Management, Inc. has obtained full license from Russell to use the Index. For full disclaimer please see the fund’s statement of additional information.
| * | Inception (8/15/13) represents the date that the shares began trading in the secondary market. |
| 1 | Performance does not reflect the deduction of taxes that a shareholder would pay on fund distributions or on the redemption or sale of fund shares. |
| 2 | ETF performance must be shown based on both a market price and NAV basis. The fund’s per share NAV is the value of one share of the fund. NAV is calculated by taking the fund’s total assets (including the fair value of securities owned), subtracting liabilities, and dividing by the number of shares outstanding. The NAV Return is based on the NAV of the fund, and the Market Price Return is based on the market price per share of the fund. The price used to calculate market return (Market Price) is determined using the Official Closing Price on the primary stock exchange (generally, 4:00 p.m. Eastern time) and may not represent the returns you would receive if shares were traded at other times. NAV is used as a proxy for purposes of calculating Market Price Return on inception date. Market Price and NAV returns assume that dividends and capital gain distributions have been reinvested in the fund at Market Price and NAV, respectively. |
| 3 | The net version of the index reflects reinvested dividends net of withholding taxes but reflects no deductions for expenses or other taxes. |
| 4 | Source for category information: Morningstar, Inc. The Morningstar Category return represents all passively- and actively-managed ETFs within the category as of the report date. |
| 5 | As stated in the prospectus. |
Schwab Fundamental Index ETFs | Annual Report
Schwab Fundamental Emerging Markets Large Company Index ETF
Performance and Fund Facts as of February 28, 2022 (continued)
| Number of Holdings | 328 |
| Weighted Average Market Cap (millions) | $85,115 |
| Price/Earnings Ratio (P/E) | 7.7 |
| Price/Book Ratio (P/B) | 1.2 |
| Portfolio Turnover Rate | 20% 2 |
Sector Weightings % of Investments1
Top Equity Holdings % of Net Assets3
Country Weightings % of Investments4
Portfolio holdings may have changed since the report date.
An index is a statistical composite of a specified financial market or sector. Unlike the fund, an index does not actually hold a portfolio of securities and its return is not inclusive of trading and management costs incurred by the fund.
Source of Sector Classification: S&P and MSCI.
| 1 | Excludes derivatives. |
| 2 | Portfolio turnover rate excludes securities received or delivered from processing of in-kind creations or redemptions. |
| 3 | This list is not a recommendation of any security by the investment adviser. |
| 4 | The percentage may differ from the Portfolio Holdings because the above calculation is based on a percentage of total investments, excluding derivatives, whereas the calculation in the Portfolio Holdings is based on a percentage of net assets. |
Schwab Fundamental Index ETFs | Annual Report
Schwab Fundamental Index ETFs
Fund Expenses (Unaudited)
Examples for a $1,000 Investment
As a fund shareholder, you may incur two types of costs: (1) transaction costs, including brokerage commissions on purchases and sales of fund shares; and, (2) ongoing costs, including management fees.
The expense examples below are intended to help you understand your ongoing cost (in dollars) of investing in a fund and to compare this cost with the ongoing cost of investing in other mutual funds. These examples are based on an investment of $1,000 invested for six months beginning September 1, 2021 and held through February 28, 2022.
Actual Return lines in the table below provide information about actual account values and actual expenses. You may use this information, together with the amount you invested, to estimate the expenses that you paid over the period. To do so, simply divide your account value by $1,000 (for example, an $8,600 account value ÷ $1,000 = 8.6), then multiply the result by the number given for your fund under the heading entitled “Expenses Paid During Period.”
Hypothetical Return lines in the table below provide information about hypothetical account values and hypothetical expenses based on a fund’s actual expense ratio and an assumed return of 5% per year before expenses. Because the return used is not an actual return, it may not be used to estimate the actual ending account value or expenses you paid for the period.
You may use this information to compare the ongoing costs of investing in a fund and other funds. To do so, compare this 5% hypothetical example with the 5% hypothetical examples that appear in the shareholder reports of the other funds.
Please note that the expenses shown in the table are meant to highlight your ongoing costs only, and do not reflect any transactional costs, including any brokerage commissions you may pay when purchasing or selling shares of a fund. Therefore, the hypothetical return lines of the table are useful in comparing ongoing costs only, and will not help you determine the relative total costs of owning different funds. In addition, if these transactional costs were included, your costs would have been higher.
| | EXPENSE RATIO
(ANNUALIZED) 1 | BEGINNING
ACCOUNT VALUE
AT 9/1/21 | ENDING
ACCOUNT VALUE
(NET OF EXPENSES)
AT 2/28/22 | EXPENSES PAID
DURING PERIOD
9/1/21-2/28/222 |
| Schwab Fundamental U.S. Broad Market Index ETF | | | | |
| Actual Return | 0.25% | $1,000.00 | $1,022.90 | $1.25 |
| Hypothetical 5% Return | 0.25% | $1,000.00 | $1,023.55 | $1.25 |
| Schwab Fundamental U.S. Large Company Index ETF | | | | |
| Actual Return | 0.25% | $1,000.00 | $1,025.80 | $1.26 |
| Hypothetical 5% Return | 0.25% | $1,000.00 | $1,023.55 | $1.25 |
| Schwab Fundamental U.S. Small Company Index ETF | | | | |
| Actual Return | 0.25% | $1,000.00 | $ 989.60 | $1.23 |
| Hypothetical 5% Return | 0.25% | $1,000.00 | $1,023.55 | $1.25 |
| Schwab Fundamental International Large Company Index ETF | | | | |
| Actual Return | 0.25% | $1,000.00 | $ 998.30 | $1.24 |
| Hypothetical 5% Return | 0.25% | $1,000.00 | $1,023.55 | $1.25 |
| Schwab Fundamental International Small Company Index ETF | | | | |
| Actual Return | 0.39% | $1,000.00 | $ 919.30 | $1.86 |
| Hypothetical 5% Return | 0.39% | $1,000.00 | $1,022.86 | $1.96 |
| Schwab Fundamental Emerging Markets Large Company Index ETF | | | | |
| Actual Return | 0.39% | $1,000.00 | $ 932.40 | $1.87 |
| Hypothetical 5% Return | 0.39% | $1,000.00 | $1,022.86 | $1.96 |
| 1 | Based on the most recent six-month expense ratio. |
| 2 | Expenses for each fund are equal to its annualized expense ratio, multiplied by the average account value over the period, multiplied by 181 days of the period, and divided by 365 days of the fiscal year. |
Schwab Fundamental Index ETFs | Annual Report
Schwab Fundamental U.S. Broad Market Index ETF
Financial Statements
FINANCIAL HIGHLIGHTS
| | 3/1/21–
2/28/22 | 3/1/20–
2/28/21 | 3/1/19–
2/29/20 | 3/1/18–
2/28/19 | 3/1/17–
2/28/18 | |
| Per-Share Data |
| Net asset value at beginning of period | $48.26 | $37.17 | $37.60 | $36.95 | $33.82 | |
| Income (loss) from investment operations: | | | | | | |
| Net investment income (loss)1 | 0.98 | 0.92 | 0.94 | 0.84 | 0.75 | |
| Net realized and unrealized gains (losses) | 8.04 | 11.13 | (0.43) | 0.62 | 3.09 | |
| Total from investment operations | 9.02 | 12.05 | 0.51 | 1.46 | 3.84 | |
| Less distributions: | | | | | | |
| Distributions from net investment income | (0.94) | (0.96) | (0.94) | (0.81) | (0.71) | |
| Net asset value at end of period | $56.34 | $48.26 | $37.17 | $37.60 | $36.95 | |
| Total return | 18.80% | 33.35% | 1.25% | 3.98% | 11.51% | |
| Ratios/Supplemental Data |
| Ratios to average net assets: | | | | | | |
| Total expenses | 0.25% | 0.25% | 0.25% | 0.25% | 0.25% | |
| Net investment income (loss) | 1.79% | 2.36% | 2.38% | 2.26% | 2.14% | |
| Portfolio turnover rate2 | 13% | 14% | 13% | 11% | 10% | |
| Net assets, end of period (x 1,000) | $425,341 | $284,726 | $262,018 | $276,382 | $260,469 | |
| 1 | Calculated based on the average shares outstanding during the period. |
| 2 | Portfolio turnover rate excludes securities received or delivered from processing of in-kind creations or redemptions. |
Schwab Fundamental Index ETFs | Annual Report
Schwab Fundamental U.S. Broad Market Index ETF
Portfolio Holdings as of February 28, 2022
This section shows all the securities in the fund’s portfolio and their values as of the report date.
The fund files its complete schedule of portfolio holdings with the U.S. Securities and Exchange Commission (SEC) for the first and third quarters of each fiscal year on Form N-PORT Part F. The fund’s Form N-PORT Part F is available on the SEC’s website at www.sec.gov. You can also obtain this information at no cost on the fund’s website at www.schwabassetmanagement.com/schwabetfs_prospectus, by calling 1-866-414-6349, or by sending an email request to orders@mysummaryprospectus.com.The fund also makes available its complete schedule of portfolio holdings on a daily basis on the fund’s website.
| SECURITY | NUMBER
OF SHARES | VALUE ($) |
| COMMON STOCKS 99.7% OF NET ASSETS |
| |
| Automobiles & Components 1.6% |
| Adient plc * | 3,093 | 138,412 |
| American Axle & Manufacturing Holdings, Inc. * | 7,666 | 70,987 |
| Aptiv plc * | 2,290 | 296,418 |
| Autoliv, Inc. | 1,623 | 142,840 |
| BorgWarner, Inc. | 5,959 | 244,379 |
| Cooper-Standard Holding, Inc. * | 2,157 | 27,437 |
| Dana, Inc. | 4,520 | 84,162 |
| Dorman Products, Inc. * | 308 | 28,773 |
| Ford Motor Co. | 139,995 | 2,458,312 |
| Fox Factory Holding Corp. * | 116 | 13,690 |
| General Motors Co. * | 40,775 | 1,905,008 |
| Gentex Corp. | 3,888 | 117,690 |
| Gentherm, Inc. * | 415 | 35,209 |
| Harley-Davidson, Inc. | 3,670 | 151,571 |
| LCI Industries | 357 | 44,454 |
| Lear Corp. | 2,116 | 332,931 |
| Modine Manufacturing Co. * | 1,984 | 20,038 |
| Patrick Industries, Inc. | 343 | 24,470 |
| Standard Motor Products, Inc. | 577 | 25,221 |
| Stoneridge, Inc. * | 621 | 10,253 |
| Tenneco, Inc., Class A * | 5,232 | 100,873 |
| Tesla, Inc. * | 134 | 116,638 |
| The Goodyear Tire & Rubber Co. * | 20,146 | 312,062 |
| Thor Industries, Inc. | 1,159 | 104,889 |
| Veoneer, Inc. * | 590 | 20,915 |
| Visteon Corp. * | 1,222 | 146,848 |
| Winnebago Industries, Inc. | 492 | 31,522 |
| | | 7,006,002 |
| |
| Banks 7.2% |
| Ameris Bancorp | 280 | 13,860 |
| Associated Banc-Corp. | 2,298 | 56,048 |
| Atlantic Union Bankshares Corp. | 584 | 23,728 |
| Axos Financial, Inc. * | 361 | 19,761 |
| Bank of America Corp. | 106,233 | 4,695,499 |
| Bank of Hawaii Corp. | 495 | 42,659 |
| Bank OZK | 1,152 | 54,167 |
| BankUnited, Inc. | 1,388 | 61,350 |
| Banner Corp. | 437 | 26,924 |
| Berkshire Hills Bancorp, Inc. | 579 | 18,007 |
| BOK Financial Corp. | 337 | 34,610 |
| Brookline Bancorp, Inc. | 865 | 14,826 |
| Cadence Bank | 1,887 | 59,667 |
| Capitol Federal Financial, Inc. | 1,969 | 21,502 |
| Cathay General Bancorp | 889 | 41,810 |
| Central Pacific Financial Corp. | 595 | 17,368 |
| Citigroup, Inc. | 64,979 | 3,848,706 |
| Citizens Financial Group, Inc. | 7,359 | 385,759 |
| City Holding Co. | 135 | 10,755 |
| Columbia Banking System, Inc. | 807 | 29,560 |
| Comerica, Inc. | 2,966 | 283,223 |
| SECURITY | NUMBER
OF SHARES | VALUE ($) |
| Commerce Bancshares, Inc. | 747 | 53,620 |
| Community Bank System, Inc. | 338 | 24,654 |
| Credicorp Ltd. | 1,616 | 244,420 |
| Cullen/Frost Bankers, Inc. | 479 | 67,410 |
| CVB Financial Corp. | 1,122 | 26,457 |
| Eagle Bancorp, Inc. | 279 | 16,718 |
| East West Bancorp, Inc. | 1,095 | 95,878 |
| Essent Group Ltd. | 767 | 33,886 |
| F.N.B. Corp. | 4,639 | 62,302 |
| Federal Agricultural Mortgage Corp., Class C | 159 | 19,668 |
| Fifth Third Bancorp | 11,305 | 540,831 |
| First BanCorp | 1,902 | 26,856 |
| First Busey Corp. | 516 | 14,164 |
| First Citizens BancShares, Inc., Class A | 227 | 178,978 |
| First Commonwealth Financial Corp. | 1,115 | 18,007 |
| First Financial Bancorp | 998 | 24,531 |
| First Financial Bankshares, Inc. | 372 | 17,826 |
| First Hawaiian, Inc. | 1,849 | 53,750 |
| First Horizon Corp. | 3,695 | 86,759 |
| First Interstate BancSystem, Inc., Class A | 1,175 | 47,705 |
| First Merchants Corp. | 418 | 18,283 |
| First Republic Bank | 532 | 92,174 |
| Flagstar Bancorp, Inc. | 593 | 27,029 |
| Fulton Financial Corp. | 2,446 | 44,077 |
| Glacier Bancorp, Inc. | 559 | 30,969 |
| Hancock Whitney Corp. | 968 | 53,898 |
| Hanmi Financial Corp. | 551 | 14,392 |
| Heartland Financial USA, Inc. | 286 | 14,191 |
| Hilltop Holdings, Inc. | 738 | 22,819 |
| Home BancShares, Inc. | 1,573 | 36,824 |
| Hope Bancorp, Inc. | 1,918 | 32,529 |
| Huntington Bancshares, Inc. | 16,073 | 249,453 |
| Independent Bank Corp. | 218 | 18,750 |
| Independent Bank Group, Inc. | 179 | 13,810 |
| International Bancshares Corp. | 638 | 27,440 |
| Investors Bancorp, Inc. | 4,042 | 67,663 |
| JPMorgan Chase & Co. | 42,042 | 5,961,556 |
| KeyCorp | 12,185 | 305,478 |
| M&T Bank Corp. | 2,630 | 479,265 |
| MGIC Investment Corp. | 5,110 | 77,570 |
| National Bank Holdings Corp., Class A | 315 | 13,980 |
| NBT Bancorp, Inc. | 543 | 20,835 |
| New York Community Bancorp, Inc. | 7,315 | 84,415 |
| Northwest Bancshares, Inc. | 1,314 | 18,501 |
| OFG Bancorp | 738 | 20,797 |
| Old National Bancorp | 3,476 | 63,541 |
| Pacific Premier Bancorp, Inc. | 312 | 12,078 |
| PacWest Bancorp | 1,989 | 98,296 |
| Park National Corp. | 143 | 19,171 |
| PennyMac Financial Services, Inc. | 267 | 15,419 |
| People's United Financial, Inc. | 4,546 | 95,830 |
| Pinnacle Financial Partners, Inc. | 362 | 36,591 |
| Popular, Inc. | 1,165 | 107,005 |
| Prosperity Bancshares, Inc. | 671 | 49,963 |
| Provident Financial Services, Inc. | 865 | 20,526 |
| Radian Group, Inc. | 3,156 | 75,428 |
Schwab Fundamental Index ETFs | Annual Report
Schwab Fundamental U.S. Broad Market Index ETF
Portfolio Holdings as of February 28, 2022 (continued)
| SECURITY | NUMBER
OF SHARES | VALUE ($) |
| Regions Financial Corp. | 12,140 | 293,667 |
| Renasant Corp. | 506 | 18,474 |
| S&T Bancorp, Inc. | 479 | 14,892 |
| Sandy Spring Bancorp, Inc. | 346 | 16,293 |
| ServisFirst Bancshares, Inc. | 197 | 17,214 |
| Signature Bank | 257 | 88,637 |
| Simmons First National Corp., Class A | 972 | 27,721 |
| Southside Bancshares, Inc. | 275 | 11,465 |
| SouthState Corp. | 379 | 34,110 |
| SVB Financial Group * | 183 | 110,898 |
| Synovus Financial Corp. | 1,595 | 83,977 |
| Texas Capital Bancshares, Inc. * | 489 | 32,567 |
| The Bank of NT Butterfield & Son Ltd. | 567 | 21,773 |
| The PNC Financial Services Group, Inc. | 5,856 | 1,166,808 |
| Tompkins Financial Corp. | 139 | 10,995 |
| Towne Bank | 545 | 16,993 |
| Truist Financial Corp. | 10,296 | 640,617 |
| Trustmark Corp. | 928 | 29,223 |
| U.S. Bancorp | 22,611 | 1,278,426 |
| UMB Financial Corp. | 313 | 31,882 |
| Umpqua Holdings Corp. | 3,461 | 73,892 |
| United Bankshares, Inc. | 1,068 | 39,110 |
| United Community Banks, Inc. | 593 | 22,925 |
| Valley National Bancorp | 3,378 | 47,191 |
| Walker & Dunlop, Inc. | 312 | 43,165 |
| Washington Federal, Inc. | 1,383 | 49,207 |
| Webster Financial Corp. | 1,673 | 100,731 |
| Wells Fargo & Co. | 113,356 | 6,049,810 |
| WesBanco, Inc. | 639 | 23,349 |
| Westamerica BanCorp | 207 | 12,279 |
| Western Alliance Bancorp | 366 | 34,309 |
| Wintrust Financial Corp. | 550 | 54,648 |
| WSFS Financial Corp. | 307 | 15,605 |
| Zions Bancorp NA | 2,731 | 193,601 |
| | | 30,461,209 |
| |
| Capital Goods 7.3% |
| 3M Co. | 7,996 | 1,188,605 |
| A.O. Smith Corp. | 1,459 | 100,058 |
| AAON, Inc. | 225 | 13,176 |
| AAR Corp. * | 939 | 42,199 |
| Acuity Brands, Inc. | 706 | 128,753 |
| Advanced Drainage Systems, Inc. | 145 | 16,924 |
| AECOM | 2,916 | 211,877 |
| AerCap Holdings N.V. * | 4,204 | 228,824 |
| Aerojet Rocketdyne Holdings, Inc. | 582 | 22,553 |
| AGCO Corp. | 1,076 | 129,292 |
| Air Lease Corp. | 1,584 | 66,148 |
| Alamo Group, Inc. | 131 | 18,223 |
| Albany International Corp., Class A | 317 | 27,839 |
| Allegion plc | 608 | 69,628 |
| Allison Transmission Holdings, Inc. | 3,800 | 151,772 |
| Altra Industrial Motion Corp. | 485 | 20,598 |
| American Woodmark Corp. * | 365 | 19,557 |
| AMETEK, Inc. | 1,430 | 185,600 |
| API Group Corp. * | 1,272 | 27,437 |
| Apogee Enterprises, Inc. | 788 | 35,515 |
| Applied Industrial Technologies, Inc. | 619 | 62,581 |
| Arcosa, Inc. | 979 | 51,564 |
| Argan, Inc. | 397 | 15,439 |
| Armstrong World Industries, Inc. | 450 | 39,780 |
| Astec Industries, Inc. | 435 | 21,663 |
| Astronics Corp. * | 1,066 | 15,681 |
| Atkore, Inc. * | 255 | 25,936 |
| AZZ, Inc. | 525 | 25,846 |
| Barnes Group, Inc. | 958 | 44,499 |
| Beacon Roofing Supply, Inc. * | 988 | 58,974 |
| SECURITY | NUMBER
OF SHARES | VALUE ($) |
| Boise Cascade Co. | 1,166 | 93,210 |
| Builders FirstSource, Inc. * | 1,393 | 103,667 |
| BWX Technologies, Inc. | 955 | 51,016 |
| Carlisle Cos., Inc. | 772 | 183,273 |
| Carrier Global Corp. | 12,674 | 568,809 |
| Caterpillar, Inc. | 6,182 | 1,159,620 |
| Chart Industries, Inc. * | 121 | 17,472 |
| CIRCOR International, Inc. * | 421 | 11,342 |
| Colfax Corp. * | 1,265 | 50,866 |
| Columbus McKinnon Corp. | 316 | 14,422 |
| Comfort Systems USA, Inc. | 487 | 41,872 |
| Crane Co. | 642 | 64,893 |
| CSW Industrials, Inc. | 89 | 10,709 |
| Cummins, Inc. | 2,741 | 559,493 |
| Curtiss-Wright Corp. | 652 | 96,183 |
| Deere & Co. | 2,315 | 833,446 |
| Donaldson Co., Inc. | 1,425 | 77,335 |
| Douglas Dynamics, Inc. | 381 | 13,998 |
| Dover Corp. | 1,395 | 218,820 |
| Dycom Industries, Inc. * | 775 | 67,472 |
| Eaton Corp. plc | 5,442 | 839,646 |
| EMCOR Group, Inc. | 1,196 | 138,186 |
| Emerson Electric Co. | 8,264 | 767,891 |
| Encore Wire Corp. | 398 | 46,335 |
| Enerpac Tool Group Corp. | 649 | 11,195 |
| EnerSys | 696 | 50,620 |
| EnPro Industries, Inc. | 307 | 33,905 |
| ESCO Technologies, Inc. | 226 | 15,723 |
| Evoqua Water Technologies Corp. * | 392 | 16,723 |
| Fastenal Co. | 4,347 | 223,697 |
| Federal Signal Corp. | 685 | 24,735 |
| Flowserve Corp. | 2,513 | 76,320 |
| Fluor Corp. * | 9,154 | 198,276 |
| Fortive Corp. | 1,974 | 127,816 |
| Fortune Brands Home & Security, Inc. | 1,683 | 146,253 |
| Franklin Electric Co., Inc. | 429 | 36,276 |
| GATX Corp. | 854 | 91,062 |
| Generac Holdings, Inc. * | 131 | 41,327 |
| General Dynamics Corp. | 4,607 | 1,080,111 |
| General Electric Co. | 22,996 | 2,196,348 |
| Gibraltar Industries, Inc. * | 312 | 15,076 |
| GMS, Inc. * | 771 | 41,827 |
| Graco, Inc. | 1,025 | 73,892 |
| GrafTech International Ltd. | 947 | 9,546 |
| Granite Construction, Inc. | 1,467 | 44,406 |
| Great Lakes Dredge & Dock Corp. * | 815 | 11,500 |
| Griffon Corp. | 952 | 21,944 |
| H&E Equipment Services, Inc. | 916 | 38,252 |
| HEICO Corp. | 151 | 22,274 |
| HEICO Corp., Class A | 253 | 31,099 |
| Helios Technologies, Inc. | 166 | 13,016 |
| Herc Holdings, Inc. | 337 | 53,623 |
| Hexcel Corp. | 1,677 | 97,098 |
| Hillenbrand, Inc. | 948 | 45,229 |
| Honeywell International, Inc. | 6,988 | 1,325,973 |
| Howmet Aerospace, Inc. | 6,315 | 226,835 |
| Hubbell, Inc. | 646 | 115,150 |
| Huntington Ingalls Industries, Inc. | 919 | 187,844 |
| Hyster-Yale Materials Handling, Inc. | 361 | 13,819 |
| IDEX Corp. | 497 | 95,374 |
| Illinois Tool Works, Inc. | 3,172 | 686,230 |
| Ingersoll Rand, Inc. | 821 | 41,477 |
| ITT, Inc. | 912 | 80,137 |
| JELD-WEN Holding, Inc. * | 1,360 | 31,389 |
| John Bean Technologies Corp. | 194 | 21,994 |
| Johnson Controls International plc | 8,688 | 564,372 |
| Kadant, Inc. | 81 | 15,985 |
| Kaman Corp. | 696 | 30,213 |
Schwab Fundamental Index ETFs | Annual Report
Schwab Fundamental U.S. Broad Market Index ETF
Portfolio Holdings as of February 28, 2022 (continued)
| SECURITY | NUMBER
OF SHARES | VALUE ($) |
| Kennametal, Inc. | 1,348 | 42,745 |
| Kratos Defense & Security Solutions, Inc. * | 476 | 9,958 |
| L3Harris Technologies, Inc. | 1,511 | 381,240 |
| Lennox International, Inc. | 260 | 69,402 |
| Lincoln Electric Holdings, Inc. | 755 | 96,232 |
| Lindsay Corp. | 102 | 13,383 |
| Lockheed Martin Corp. | 2,996 | 1,299,665 |
| Masco Corp. | 2,959 | 165,822 |
| Masonite International Corp. * | 413 | 38,958 |
| MasTec, Inc. * | 851 | 67,025 |
| Matrix Service Co. * | 2,236 | 15,518 |
| Maxar Technologies, Inc. | 855 | 27,736 |
| McGrath RentCorp | 324 | 26,335 |
| MDU Resources Group, Inc. | 3,727 | 99,772 |
| Mercury Systems, Inc. * | 255 | 15,356 |
| Meritor, Inc. * | 1,601 | 57,012 |
| Moog, Inc., Class A | 780 | 64,826 |
| MRC Global, Inc. * | 3,796 | 38,340 |
| MSC Industrial Direct Co., Inc., Class A | 1,004 | 77,790 |
| Mueller Industries, Inc. | 1,246 | 71,084 |
| Mueller Water Products, Inc., Class A | 1,931 | 24,504 |
| MYR Group, Inc. * | 287 | 25,758 |
| National Presto Industries, Inc. | 134 | 10,653 |
| Nordson Corp. | 392 | 88,784 |
| Northrop Grumman Corp. | 2,081 | 920,093 |
| NOW, Inc. * | 6,013 | 56,161 |
| nVent Electric plc | 2,440 | 82,789 |
| Oshkosh Corp. | 1,357 | 150,681 |
| Otis Worldwide Corp. | 2,816 | 220,577 |
| Owens Corning | 2,108 | 196,445 |
| PACCAR, Inc. | 6,483 | 595,204 |
| Parker-Hannifin Corp. | 1,372 | 406,647 |
| Parsons Corp. * | 332 | 11,507 |
| Pentair plc | 1,715 | 99,316 |
| PGT Innovations, Inc. * | 608 | 13,078 |
| Primoris Services Corp. | 1,483 | 39,107 |
| Proto Labs, Inc. * | 205 | 11,527 |
| Quanex Building Products Corp. | 817 | 18,677 |
| Quanta Services, Inc. | 2,007 | 218,643 |
| Raytheon Technologies Corp. | 12,760 | 1,310,452 |
| RBC Bearings, Inc. * | 136 | 26,364 |
| Regal Rexnord Corp. | 843 | 135,175 |
| Resideo Technologies, Inc. * | 2,188 | 56,319 |
| Rockwell Automation, Inc. | 976 | 260,182 |
| Roper Technologies, Inc. | 454 | 203,492 |
| Rush Enterprises, Inc., Class A | 1,456 | 75,625 |
| Sensata Technologies Holding plc * | 1,768 | 102,385 |
| Simpson Manufacturing Co., Inc. | 393 | 46,574 |
| SiteOne Landscape Supply, Inc. * | 132 | 22,761 |
| Snap-on, Inc. | 829 | 174,239 |
| Spirit AeroSystems Holdings, Inc., Class A | 4,300 | 215,000 |
| SPX Corp. * | 247 | 12,523 |
| SPX FLOW, Inc. | 361 | 31,006 |
| Standex International Corp. | 189 | 20,021 |
| Stanley Black & Decker, Inc. | 1,656 | 269,431 |
| Tennant Co. | 236 | 18,592 |
| Terex Corp. | 1,263 | 52,137 |
| Textainer Group Holdings Ltd. | 431 | 15,305 |
| Textron, Inc. | 4,261 | 311,607 |
| The Boeing Co. * | 8,916 | 1,830,811 |
| The Greenbrier Cos., Inc. | 1,529 | 67,933 |
| The Manitowoc Co., Inc. * | 859 | 14,199 |
| The Middleby Corp. * | 427 | 75,844 |
| The Timken Co. | 963 | 63,134 |
| The Toro Co. | 778 | 72,984 |
| Trane Technologies plc | 1,759 | 270,763 |
| TransDigm Group, Inc. * | 384 | 255,971 |
| Trex Co., Inc. * | 263 | 24,154 |
| SECURITY | NUMBER
OF SHARES | VALUE ($) |
| Trinity Industries, Inc. | 2,081 | 60,058 |
| Triton International Ltd. | 997 | 65,483 |
| Tutor Perini Corp. * | 3,128 | 30,654 |
| UFP Industries, Inc. | 1,224 | 104,958 |
| United Rentals, Inc. * | 1,080 | 347,350 |
| Univar Solutions, Inc. * | 3,883 | 119,247 |
| Valmont Industries, Inc. | 277 | 59,957 |
| Vectrus, Inc. * | 335 | 15,356 |
| W.W. Grainger, Inc. | 647 | 308,658 |
| Wabash National Corp. | 2,745 | 46,775 |
| Watsco, Inc. | 379 | 103,490 |
| Watts Water Technologies, Inc., Class A | 233 | 33,540 |
| Welbilt, Inc. * | 1,059 | 25,035 |
| WESCO International, Inc. * | 1,333 | 162,266 |
| Westinghouse Air Brake Technologies Corp. | 1,455 | 135,053 |
| Woodward, Inc. | 511 | 63,686 |
| Xylem, Inc. | 1,088 | 96,778 |
| Zurn Water Solutions Corp. | 970 | 31,544 |
| | | 31,135,699 |
| |
| Commercial & Professional Services 1.1% |
| ABM Industries, Inc. | 1,885 | 84,505 |
| ACCO Brands Corp. | 3,789 | 32,585 |
| ADT, Inc. | 3,850 | 28,144 |
| ASGN, Inc. * | 567 | 62,818 |
| Booz Allen Hamilton Holding Corp. | 1,297 | 104,655 |
| Brady Corp., Class A | 718 | 33,085 |
| BrightView Holdings, Inc. * | 1,136 | 15,347 |
| CACI International, Inc., Class A * | 337 | 94,289 |
| CBIZ, Inc. * | 557 | 21,673 |
| Cimpress plc * | 234 | 14,740 |
| Cintas Corp. | 554 | 207,927 |
| Clean Harbors, Inc. * | 647 | 61,743 |
| Copart, Inc. * | 648 | 79,626 |
| CoreCivic, Inc. * | 9,102 | 82,919 |
| CoStar Group, Inc. * | 545 | 33,250 |
| Deluxe Corp. | 1,600 | 49,776 |
| Equifax, Inc. | 524 | 114,410 |
| Exponent, Inc. | 170 | 16,109 |
| FTI Consulting, Inc. * | 429 | 62,634 |
| Harsco Corp. * | 1,751 | 20,854 |
| Healthcare Services Group, Inc. | 1,897 | 30,011 |
| Heidrick & Struggles International, Inc. | 283 | 12,098 |
| HNI Corp. | 1,305 | 53,100 |
| Huron Consulting Group, Inc. * | 354 | 17,463 |
| IAA, Inc. * | 568 | 20,868 |
| ICF International, Inc. | 288 | 25,523 |
| Insperity, Inc. | 293 | 26,355 |
| Interface, Inc. | 1,776 | 23,177 |
| Jacobs Engineering Group, Inc. | 1,724 | 212,052 |
| KAR Auction Services, Inc. * | 3,331 | 61,490 |
| KBR, Inc. | 2,095 | 103,996 |
| Kelly Services, Inc., Class A | 3,604 | 76,477 |
| Kforce, Inc. | 457 | 34,357 |
| Korn Ferry | 670 | 44,394 |
| Leidos Holdings, Inc. | 2,271 | 231,279 |
| ManpowerGroup, Inc. | 2,831 | 300,879 |
| ManTech International Corp., Class A | 457 | 38,100 |
| Matthews International Corp., Class A | 872 | 28,933 |
| MillerKnoll, Inc. | 1,721 | 66,912 |
| MSA Safety, Inc. | 207 | 28,794 |
| Nielsen Holdings plc | 8,992 | 156,641 |
| Pitney Bowes, Inc. | 8,524 | 42,450 |
| Republic Services, Inc. | 2,206 | 265,338 |
| Resources Connection, Inc. | 1,319 | 21,895 |
| Robert Half International, Inc. | 1,857 | 223,379 |
| Rollins, Inc. | 885 | 28,878 |
Schwab Fundamental Index ETFs | Annual Report
Schwab Fundamental U.S. Broad Market Index ETF
Portfolio Holdings as of February 28, 2022 (continued)
| SECURITY | NUMBER
OF SHARES | VALUE ($) |
| Science Applications International Corp. | 1,064 | 93,302 |
| SP Plus Corp. * | 709 | 21,164 |
| Steelcase, Inc., Class A | 3,718 | 45,248 |
| Stericycle, Inc. * | 924 | 53,925 |
| Tetra Tech, Inc. | 406 | 64,461 |
| The Brink's Co. | 467 | 32,718 |
| The GEO Group, Inc. * | 9,641 | 57,460 |
| TransUnion | 682 | 61,898 |
| TriNet Group, Inc. * | 284 | 24,796 |
| TrueBlue, Inc. * | 2,016 | 54,835 |
| UniFirst Corp. | 224 | 40,600 |
| US Ecology, Inc. * | 495 | 23,483 |
| Verisk Analytics, Inc. | 553 | 98,069 |
| Viad Corp. * | 532 | 18,588 |
| Waste Management, Inc. | 4,179 | 603,448 |
| | | 4,689,923 |
| |
| Consumer Durables & Apparel 1.5% |
| Acushnet Holdings Corp. | 389 | 17,038 |
| Beazer Homes USA, Inc. * | 912 | 14,929 |
| Brunswick Corp. | 1,144 | 109,275 |
| Callaway Golf Co. * | 856 | 21,177 |
| Capri Holdings Ltd. * | 3,150 | 213,381 |
| Carter's, Inc. | 1,026 | 99,194 |
| Cavco Industries, Inc. * | 104 | 28,354 |
| Century Communities, Inc. | 329 | 20,964 |
| Columbia Sportswear Co. | 406 | 37,644 |
| Crocs, Inc. * | 184 | 15,406 |
| D.R. Horton, Inc. | 4,221 | 360,473 |
| Deckers Outdoor Corp. * | 195 | 56,285 |
| Ethan Allen Interiors, Inc. | 1,017 | 26,503 |
| Fossil Group, Inc. * | 2,683 | 36,274 |
| Garmin Ltd. | 1,020 | 112,649 |
| G-III Apparel Group Ltd. * | 1,742 | 48,323 |
| Hanesbrands, Inc. | 8,038 | 124,187 |
| Hasbro, Inc. | 1,424 | 138,199 |
| Helen of Troy Ltd. * | 224 | 46,070 |
| Installed Building Products, Inc. | 112 | 10,830 |
| iRobot Corp. * | 323 | 20,078 |
| KB Home | 1,583 | 61,120 |
| Kontoor Brands, Inc. | 984 | 48,747 |
| La-Z-Boy, Inc. | 1,144 | 33,382 |
| Leggett & Platt, Inc. | 2,576 | 95,518 |
| Lennar Corp., Class A | 3,709 | 333,365 |
| LGI Homes, Inc. * | 186 | 23,460 |
| Lululemon Athletica, Inc. * | 332 | 106,220 |
| M.D.C Holdings, Inc. | 964 | 42,744 |
| M/I Homes, Inc. * | 617 | 30,412 |
| Mattel, Inc. * | 3,793 | 94,749 |
| Meritage Homes Corp. * | 710 | 69,992 |
| Mohawk Industries, Inc. * | 1,180 | 166,120 |
| Movado Group, Inc. | 460 | 18,133 |
| Newell Brands, Inc. | 6,078 | 144,353 |
| NIKE, Inc., Class B | 6,500 | 887,575 |
| NVR, Inc. * | 43 | 213,213 |
| Oxford Industries, Inc. | 322 | 28,462 |
| Polaris, Inc. | 971 | 117,986 |
| PulteGroup, Inc. | 5,619 | 279,040 |
| PVH Corp. | 2,133 | 208,799 |
| Ralph Lauren Corp. | 1,123 | 148,281 |
| Skechers U.S.A., Inc., Class A * | 1,982 | 91,132 |
| Skyline Champion Corp. * | 224 | 15,062 |
| Smith & Wesson Brands, Inc. | 842 | 14,844 |
| Steven Madden Ltd. | 1,420 | 60,577 |
| Sturm Ruger & Co., Inc. | 329 | 23,823 |
| Tapestry, Inc. | 4,485 | 183,437 |
| Taylor Morrison Home Corp. * | 2,590 | 76,405 |
| SECURITY | NUMBER
OF SHARES | VALUE ($) |
| Tempur Sealy International, Inc. | 1,293 | 42,682 |
| Toll Brothers, Inc. | 2,168 | 117,636 |
| TopBuild Corp. * | 224 | 48,088 |
| Tri Pointe Homes, Inc. * | 3,523 | 78,810 |
| Tupperware Brands Corp. * | 1,730 | 31,538 |
| Under Armour, Inc., Class A * | 1,789 | 32,005 |
| Under Armour, Inc., Class C * | 1,902 | 29,728 |
| Universal Electronics, Inc. * | 329 | 10,933 |
| VF Corp. | 4,312 | 250,182 |
| Vista Outdoor, Inc. * | 788 | 28,723 |
| Whirlpool Corp. | 1,498 | 301,503 |
| Wolverine World Wide, Inc. | 1,705 | 39,266 |
| | | 6,185,278 |
| |
| Consumer Services 2.3% |
| Adtalem Global Education, Inc. * | 1,544 | 32,084 |
| American Public Education, Inc. * | 507 | 10,120 |
| Aramark | 5,313 | 196,369 |
| Arcos Dorados Holdings, Inc., Class A * | 4,455 | 34,437 |
| Bally's Corp. * | 247 | 8,897 |
| BJ's Restaurants, Inc. * | 643 | 20,621 |
| Bloomin' Brands, Inc. * | 2,486 | 61,181 |
| Booking Holdings, Inc. * | 425 | 923,206 |
| Boyd Gaming Corp. * | 747 | 52,992 |
| Bright Horizons Family Solutions, Inc. * | 349 | 45,593 |
| Brinker International, Inc. * | 1,238 | 52,665 |
| Caesars Entertainment, Inc. * | 289 | 24,331 |
| Carnival Corp. * | 18,123 | 368,441 |
| Chipotle Mexican Grill, Inc. * | 93 | 141,672 |
| Choice Hotels International, Inc. | 181 | 26,127 |
| Churchill Downs, Inc. | 254 | 61,181 |
| Cracker Barrel Old Country Store, Inc. | 590 | 79,219 |
| Darden Restaurants, Inc. | 1,261 | 183,122 |
| Dave & Buster's Entertainment, Inc. * | 974 | 42,213 |
| Denny's Corp. * | 1,163 | 18,399 |
| Dine Brands Global, Inc. | 269 | 22,553 |
| Domino's Pizza, Inc. | 346 | 149,545 |
| Everi Holdings, Inc. * | 572 | 13,385 |
| Expedia Group, Inc. * | 1,416 | 277,692 |
| Frontdoor, Inc. * | 394 | 11,840 |
| Graham Holdings Co., Class B | 100 | 60,113 |
| Grand Canyon Education, Inc. * | 497 | 43,155 |
| H&R Block, Inc. | 3,742 | 92,839 |
| Hilton Grand Vacations, Inc. * | 1,158 | 60,054 |
| Hilton Worldwide Holdings, Inc. * | 1,903 | 283,281 |
| Houghton Mifflin Harcourt Co. * | 2,589 | 54,240 |
| Hyatt Hotels Corp., Class A * | 862 | 83,709 |
| International Game Technology plc | 2,944 | 90,145 |
| Jack in the Box, Inc. | 622 | 53,660 |
| Las Vegas Sands Corp. * | 6,979 | 299,120 |
| Laureate Education, Inc. | 3,106 | 33,669 |
| Marriott International, Inc., Class A * | 2,257 | 384,006 |
| Marriott Vacations Worldwide Corp. | 495 | 79,532 |
| McDonald's Corp. | 7,176 | 1,756,470 |
| MGM Resorts International | 7,129 | 315,743 |
| Norwegian Cruise Line Holdings Ltd. * | 7,719 | 150,443 |
| Papa John's International, Inc. | 203 | 21,684 |
| Penn National Gaming, Inc. * | 975 | 50,066 |
| Perdoceo Education Corp. * | 1,502 | 15,726 |
| Planet Fitness, Inc., Class A * | 361 | 30,551 |
| Red Robin Gourmet Burgers, Inc. * | 919 | 16,128 |
| Red Rock Resorts, Inc., Class A | 623 | 31,324 |
| Regis Corp. * | 4,111 | 7,441 |
| Royal Caribbean Cruises Ltd. * | 3,943 | 318,279 |
| Ruth's Hospitality Group, Inc. | 572 | 14,191 |
| Scientific Games Corp., Class A * | 575 | 36,179 |
| SeaWorld Entertainment, Inc. * | 431 | 29,907 |
Schwab Fundamental Index ETFs | Annual Report
Schwab Fundamental U.S. Broad Market Index ETF
Portfolio Holdings as of February 28, 2022 (continued)
| SECURITY | NUMBER
OF SHARES | VALUE ($) |
| Service Corp. International | 1,497 | 91,092 |
| Six Flags Entertainment Corp. * | 2,044 | 89,241 |
| Starbucks Corp. | 11,210 | 1,028,966 |
| Strategic Education, Inc. | 309 | 18,237 |
| Stride, Inc. * | 966 | 32,438 |
| Terminix Global Holdings, Inc. * | 989 | 42,092 |
| Texas Roadhouse, Inc. | 689 | 65,393 |
| The Cheesecake Factory, Inc. * | 1,042 | 44,587 |
| The Wendy's Co. | 3,515 | 79,931 |
| Travel & Leisure Co. | 1,787 | 100,161 |
| Vail Resorts, Inc. | 270 | 70,349 |
| WW International, Inc. * | 670 | 6,827 |
| Wyndham Hotels & Resorts, Inc. | 738 | 63,771 |
| Wynn Resorts Ltd. * | 1,325 | 114,639 |
| Yum China Holdings, Inc. | 3,511 | 182,642 |
| Yum! Brands, Inc. | 3,214 | 393,972 |
| | | 9,693,878 |
| |
| Diversified Financials 5.8% |
| Affiliated Managers Group, Inc. | 744 | 102,940 |
| AGNC Investment Corp. | 5,992 | 77,357 |
| Ally Financial, Inc. | 9,628 | 480,437 |
| American Express Co. | 8,791 | 1,710,201 |
| Ameriprise Financial, Inc. | 1,865 | 559,108 |
| Annaly Capital Management, Inc. | 14,486 | 100,823 |
| Apollo Commercial Real Estate Finance, Inc. | 2,020 | 26,361 |
| Apollo Global Management, Inc. | 2,287 | 149,250 |
| Arbor Realty Trust, Inc. | 817 | 14,706 |
| Ares Management Corp., Class A | 201 | 16,299 |
| Artisan Partners Asset Management, Inc., Class A | 626 | 23,857 |
| Berkshire Hathaway, Inc., Class B * | 22,602 | 7,265,413 |
| BGC Partners, Inc., Class A | 5,651 | 25,882 |
| BlackRock, Inc. | 966 | 718,598 |
| Blackstone Mortgage Trust, Inc., Class A | 1,440 | 45,763 |
| Blucora, Inc. * | 779 | 15,502 |
| Brightsphere Investment Group, Inc. | 1,072 | 25,589 |
| BrightSpire Capital, Inc. | 1,288 | 11,412 |
| Cannae Holdings, Inc. * | 1,035 | 27,790 |
| Capital One Financial Corp. | 9,730 | 1,491,317 |
| Cboe Global Markets, Inc. | 703 | 82,455 |
| Chimera Investment Corp. | 4,574 | 55,666 |
| CME Group, Inc. | 1,640 | 387,909 |
| Cohen & Steers, Inc. | 204 | 16,577 |
| Compass Diversified Holdings | 1,176 | 27,942 |
| Credit Acceptance Corp. * | 84 | 46,210 |
| Discover Financial Services | 7,072 | 872,968 |
| Donnelley Financial Solutions, Inc. * | 570 | 18,297 |
| Encore Capital Group, Inc. * | 462 | 30,487 |
| Enova International, Inc. * | 613 | 24,992 |
| Equitable Holdings, Inc. | 4,412 | 144,096 |
| Evercore, Inc., Class A | 614 | 77,984 |
| FactSet Research Systems, Inc. | 156 | 63,350 |
| Federated Hermes, Inc. | 1,919 | 62,694 |
| FirstCash Holdings, Inc. | 668 | 48,123 |
| Franklin Resources, Inc. | 9,805 | 291,503 |
| Green Dot Corp., Class A * | 574 | 16,445 |
| Houlihan Lokey, Inc. | 343 | 35,281 |
| Interactive Brokers Group, Inc., Class A | 185 | 12,243 |
| Intercontinental Exchange, Inc. | 2,790 | 357,455 |
| Invesco Ltd. | 8,469 | 179,881 |
| Invesco Mortgage Capital, Inc. | 11,379 | 24,806 |
| Jackson Financial, Inc., Class A | 727 | 29,727 |
| Janus Henderson Group plc | 2,137 | 71,739 |
| Jefferies Financial Group, Inc. | 3,206 | 113,941 |
| KKR & Co., Inc. | 3,424 | 205,851 |
| SECURITY | NUMBER
OF SHARES | VALUE ($) |
| Ladder Capital Corp. | 2,585 | 29,624 |
| Lazard Ltd., Class A | 2,051 | 70,924 |
| LPL Financial Holdings, Inc. | 808 | 146,208 |
| MarketAxess Holdings, Inc. | 74 | 28,226 |
| MFA Financial, Inc. | 9,067 | 36,812 |
| Moelis & Co., Class A | 499 | 24,057 |
| Moody's Corp. | 644 | 207,387 |
| Morgan Stanley | 14,111 | 1,280,432 |
| Morningstar, Inc. | 88 | 24,697 |
| MSCI, Inc. | 188 | 94,318 |
| Nasdaq, Inc. | 592 | 101,321 |
| Navient Corp. | 11,942 | 210,299 |
| Nelnet, Inc., Class A | 289 | 23,279 |
| New Residential Investment Corp. | 13,405 | 139,144 |
| New York Mortgage Trust, Inc. | 6,097 | 21,400 |
| Northern Trust Corp. | 2,216 | 252,402 |
| OneMain Holdings, Inc. | 1,493 | 76,113 |
| PennyMac Mortgage Investment Trust | 1,650 | 25,740 |
| Piper Sandler Cos. | 152 | 22,497 |
| PRA Group, Inc. * | 672 | 29,991 |
| PROG Holdings, Inc. * | 1,584 | 48,534 |
| Raymond James Financial, Inc. | 1,637 | 179,497 |
| Redwood Trust, Inc. | 2,144 | 22,276 |
| S&P Global, Inc. | 1,547 | 581,400 |
| SEI Investments Co. | 1,501 | 87,929 |
| SLM Corp. | 3,898 | 76,791 |
| Starwood Property Trust, Inc. | 3,666 | 87,397 |
| State Street Corp. | 4,945 | 421,957 |
| Stifel Financial Corp. | 701 | 51,523 |
| Synchrony Financial | 20,029 | 856,841 |
| T. Rowe Price Group, Inc. | 2,417 | 349,401 |
| The Bank of New York Mellon Corp. | 16,297 | 866,185 |
| The Carlyle Group, Inc. | 587 | 27,513 |
| The Charles Schwab Corp. (a) | 4,174 | 352,536 |
| The Goldman Sachs Group, Inc. | 4,600 | 1,569,934 |
| TPG RE Finance Trust, Inc. | 1,120 | 13,261 |
| Tradeweb Markets, Inc., Class A | 184 | 15,544 |
| Two Harbors Investment Corp. | 7,918 | 40,065 |
| Virtu Financial, Inc., Class A | 400 | 14,032 |
| Virtus Investment Partners, Inc. | 58 | 13,956 |
| Voya Financial, Inc. | 1,620 | 109,107 |
| WisdomTree Investments, Inc. | 2,469 | 13,900 |
| World Acceptance Corp. * | 130 | 25,541 |
| | | 24,857,218 |
| |
| Energy 9.5% |
| Alto Ingredients, Inc. * | 2,771 | 16,155 |
| Antero Resources Corp. * | 8,048 | 184,541 |
| APA Corp. | 6,179 | 220,158 |
| Arch Resources, Inc. (b) | 992 | 118,415 |
| Archrock, Inc. | 3,527 | 29,450 |
| Baker Hughes Co. | 22,138 | 650,414 |
| Callon Petroleum Co. * | 585 | 32,971 |
| Centennial Resource Development, Inc., Class A * | 5,140 | 45,129 |
| ChampionX Corp. * | 1,289 | 27,597 |
| Cheniere Energy, Inc. | 1,235 | 164,132 |
| Chevron Corp. | 50,402 | 7,257,888 |
| CNX Resources Corp. * | 4,844 | 79,151 |
| ConocoPhillips | 26,482 | 2,512,083 |
| CONSOL Energy, Inc. * | 2,060 | 63,324 |
| Continental Resources, Inc. | 1,105 | 61,250 |
| Core Laboratories N.V. | 941 | 25,934 |
| Coterra Energy, Inc. | 8,350 | 194,806 |
| CVR Energy, Inc. | 2,126 | 36,971 |
| Delek US Holdings, Inc. * | 5,369 | 92,508 |
| Devon Energy Corp. | 4,908 | 292,271 |
Schwab Fundamental Index ETFs | Annual Report
Schwab Fundamental U.S. Broad Market Index ETF
Portfolio Holdings as of February 28, 2022 (continued)
| SECURITY | NUMBER
OF SHARES | VALUE ($) |
| DHT Holdings, Inc. | 2,757 | 17,342 |
| Diamondback Energy, Inc. | 1,771 | 244,575 |
| Dril-Quip, Inc. * | 973 | 28,061 |
| DTE Midstream LLC * | 1,347 | 71,526 |
| EOG Resources, Inc. | 7,435 | 854,430 |
| EQT Corp. | 2,953 | 68,332 |
| Equitrans Midstream Corp. | 7,559 | 48,453 |
| Exxon Mobil Corp. | 138,195 | 10,837,252 |
| Golar LNG Ltd. * | 1,105 | 19,227 |
| Green Plains, Inc. * | 1,483 | 48,553 |
| Halliburton Co. | 17,138 | 574,637 |
| Helix Energy Solutions Group, Inc. * | 4,063 | 16,455 |
| Helmerich & Payne, Inc. | 5,197 | 188,287 |
| Hess Corp. | 1,844 | 186,355 |
| HollyFrontier Corp. * | 10,890 | 331,601 |
| International Seaways, Inc. | 1,603 | 29,319 |
| Kinder Morgan, Inc. | 45,919 | 798,991 |
| Kosmos Energy Ltd. * | 10,779 | 52,386 |
| Liberty Oilfield Services, Inc., Class A * | 1,137 | 14,190 |
| Magnolia Oil & Gas Corp., Class A | 1,423 | 31,804 |
| Marathon Oil Corp. | 22,148 | 499,659 |
| Marathon Petroleum Corp. | 28,700 | 2,234,869 |
| Matador Resources Co. | 746 | 37,002 |
| Murphy Oil Corp. | 5,083 | 176,228 |
| Nabors Industries Ltd. * | 920 | 115,497 |
| NexTier Oilfield Solutions, Inc. * | 5,818 | 46,311 |
| Nordic American Tankers Ltd. | 7,021 | 16,991 |
| NOV, Inc. | 23,031 | 394,982 |
| Occidental Petroleum Corp. | 24,881 | 1,088,046 |
| Oceaneering International, Inc. * | 4,614 | 67,549 |
| Oil States International, Inc. * | 4,463 | 23,341 |
| ONEOK, Inc. | 6,803 | 444,236 |
| Ovintiv, Inc. | 3,859 | 176,935 |
| Par Pacific Holdings, Inc. * | 1,677 | 22,807 |
| Patterson-UTI Energy, Inc. | 10,481 | 151,241 |
| PBF Energy, Inc., Class A * | 17,861 | 296,850 |
| PDC Energy, Inc. | 1,112 | 71,746 |
| Peabody Energy Corp. * | 12,442 | 215,744 |
| Phillips 66 | 24,515 | 2,065,144 |
| Pioneer Natural Resources Co. | 1,666 | 399,174 |
| ProPetro Holding Corp. * | 3,108 | 39,689 |
| Range Resources Corp. * | 1,989 | 45,648 |
| Renewable Energy Group, Inc. * | 867 | 53,321 |
| Schlumberger N.V. | 34,469 | 1,352,564 |
| Scorpio Tankers, Inc. | 1,539 | 26,763 |
| SFL Corp., Ltd. | 3,382 | 33,651 |
| SM Energy Co. | 3,343 | 118,710 |
| Southwestern Energy Co. * | 8,669 | 43,258 |
| Targa Resources Corp. | 5,438 | 355,482 |
| TechnipFMC plc * | 18,831 | 128,992 |
| Teekay Tankers Ltd., Class A * | 1,381 | 19,734 |
| The Williams Cos., Inc. | 18,451 | 577,147 |
| Transocean Ltd. * | 28,847 | 102,118 |
| US Silica Holdings, Inc. * | 1,531 | 22,138 |
| Valero Energy Corp. | 27,351 | 2,284,082 |
| World Fuel Services Corp. | 10,872 | 308,112 |
| | | 40,622,685 |
| |
| Food & Staples Retailing 2.9% |
| BJ's Wholesale Club Holdings, Inc. * | 624 | 39,231 |
| Casey's General Stores, Inc. | 731 | 137,486 |
| Costco Wholesale Corp. | 4,663 | 2,421,263 |
| Grocery Outlet Holding Corp. * | 671 | 18,660 |
| Ingles Markets, Inc., Class A | 648 | 53,278 |
| Performance Food Group Co. * | 5,928 | 332,205 |
| PriceSmart, Inc. | 590 | 42,905 |
| Rite Aid Corp. * | 6,011 | 55,061 |
| SECURITY | NUMBER
OF SHARES | VALUE ($) |
| SpartanNash Co. | 4,312 | 121,340 |
| Sprouts Farmers Market, Inc. * | 3,352 | 95,465 |
| Sysco Corp. | 7,843 | 683,125 |
| The Andersons, Inc. | 1,446 | 65,938 |
| The Chefs' Warehouse, Inc. * | 496 | 16,294 |
| The Kroger Co. | 32,879 | 1,538,737 |
| United Natural Foods, Inc. * | 3,670 | 147,644 |
| US Foods Holding Corp. * | 8,511 | 332,695 |
| Walgreens Boots Alliance, Inc. | 41,337 | 1,905,222 |
| Walmart, Inc. | 30,385 | 4,106,837 |
| Weis Markets, Inc. | 485 | 29,910 |
| | | 12,143,296 |
| |
| Food, Beverage & Tobacco 4.1% |
| Altria Group, Inc. | 34,363 | 1,762,478 |
| Archer-Daniels-Midland Co. | 19,829 | 1,555,585 |
| B&G Foods, Inc. | 1,613 | 47,745 |
| Brown-Forman Corp., Class B | 912 | 59,490 |
| Bunge Ltd. | 5,713 | 597,294 |
| Calavo Growers, Inc. | 474 | 20,235 |
| Cal-Maine Foods, Inc. | 1,008 | 44,624 |
| Campbell Soup Co. | 2,922 | 131,402 |
| Coca-Cola Consolidated, Inc. | 45 | 22,362 |
| Coca-Cola Europacific Partners plc | 4,060 | 207,913 |
| Conagra Brands, Inc. | 6,691 | 233,984 |
| Constellation Brands, Inc., Class A | 1,319 | 284,403 |
| Darling Ingredients, Inc. * | 1,195 | 86,614 |
| Flowers Foods, Inc. | 3,591 | 98,429 |
| Fresh Del Monte Produce, Inc. | 1,986 | 51,398 |
| General Mills, Inc. | 8,714 | 587,585 |
| Hormel Foods Corp. | 3,894 | 185,510 |
| Hostess Brands, Inc. * | 1,179 | 25,396 |
| Ingredion, Inc. | 1,944 | 172,511 |
| J&J Snack Foods Corp. | 202 | 33,071 |
| John B Sanfilippo & Son, Inc. | 215 | 17,097 |
| Kellogg Co. | 3,859 | 246,744 |
| Keurig Dr Pepper, Inc. | 4,042 | 156,304 |
| Lamb Weston Holdings, Inc. | 943 | 62,644 |
| Lancaster Colony Corp. | 210 | 35,324 |
| McCormick & Co., Inc. Non-Voting Shares | 1,544 | 146,942 |
| Molson Coors Beverage Co., Class B | 5,340 | 278,641 |
| Mondelez International, Inc., Class A | 19,031 | 1,246,150 |
| Monster Beverage Corp. * | 2,027 | 171,079 |
| Nomad Foods Ltd. * | 1,194 | 30,065 |
| PepsiCo, Inc. | 14,444 | 2,365,061 |
| Philip Morris International, Inc. | 19,084 | 1,928,820 |
| Pilgrim's Pride Corp. * | 1,739 | 41,006 |
| Post Holdings, Inc. * | 845 | 88,843 |
| Sanderson Farms, Inc. | 566 | 101,082 |
| The Boston Beer Co., Inc., Class A * | 50 | 19,173 |
| The Coca-Cola Co. | 34,133 | 2,124,438 |
| The Hain Celestial Group, Inc. * | 1,065 | 38,723 |
| The Hershey Co. | 1,000 | 202,260 |
| The J.M. Smucker Co. | 2,241 | 301,975 |
| The Kraft Heinz Co. | 13,102 | 513,860 |
| TreeHouse Foods, Inc. * | 1,606 | 63,036 |
| Tyson Foods, Inc., Class A | 9,477 | 878,139 |
| Universal Corp. | 1,247 | 67,475 |
| Vector Group Ltd. | 2,788 | 31,253 |
| | | 17,364,163 |
| |
| Health Care Equipment & Services 6.1% |
| Abbott Laboratories | 8,540 | 1,030,095 |
| ABIOMED, Inc. * | 89 | 27,656 |
| Acadia Healthcare Co., Inc. * | 948 | 53,761 |
| Addus HomeCare Corp. * | 112 | 9,524 |
Schwab Fundamental Index ETFs | Annual Report
Schwab Fundamental U.S. Broad Market Index ETF
Portfolio Holdings as of February 28, 2022 (continued)
| SECURITY | NUMBER
OF SHARES | VALUE ($) |
| Align Technology, Inc. * | 124 | 63,421 |
| Allscripts Healthcare Solutions, Inc. * | 2,022 | 39,348 |
| Amedisys, Inc. * | 157 | 25,158 |
| AmerisourceBergen Corp. | 3,557 | 506,979 |
| AMN Healthcare Services, Inc. * | 427 | 45,322 |
| Anthem, Inc. | 4,960 | 2,241,176 |
| Avanos Medical, Inc. * | 459 | 16,244 |
| Baxter International, Inc. | 5,271 | 447,877 |
| Becton Dickinson & Co. | 1,727 | 468,501 |
| Boston Scientific Corp. * | 5,934 | 262,105 |
| Brookdale Senior Living, Inc. * | 6,515 | 44,823 |
| Cardinal Health, Inc. | 16,151 | 872,315 |
| Centene Corp. * | 8,781 | 725,486 |
| Cerner Corp. | 3,719 | 346,797 |
| Change Healthcare, Inc. * | 1,902 | 40,741 |
| Chemed Corp. | 122 | 58,351 |
| Cigna Corp. | 4,318 | 1,026,734 |
| Community Health Systems, Inc. * | 3,112 | 32,707 |
| CONMED Corp. | 155 | 22,655 |
| Covetrus, Inc. * | 2,075 | 36,769 |
| CVS Health Corp. | 34,579 | 3,584,113 |
| DaVita, Inc. * | 2,283 | 257,454 |
| Dentsply Sirona, Inc. | 2,399 | 129,882 |
| Edwards Lifesciences Corp. * | 1,309 | 147,092 |
| Encompass Health Corp. | 1,300 | 85,826 |
| Envista Holdings Corp. * | 2,214 | 106,272 |
| Globus Medical, Inc., Class A * | 342 | 24,049 |
| Haemonetics Corp. * | 496 | 28,624 |
| HCA Healthcare, Inc. | 3,438 | 860,566 |
| Henry Schein, Inc. * | 2,591 | 223,811 |
| Hologic, Inc. * | 1,558 | 110,883 |
| Humana, Inc. | 2,659 | 1,154,857 |
| ICU Medical, Inc. * | 136 | 32,195 |
| IDEXX Laboratories, Inc. * | 67 | 35,667 |
| Integer Holdings Corp. * | 338 | 28,348 |
| Integra LifeSciences Holdings Corp. * | 359 | 24,075 |
| Intuitive Surgical, Inc. * | 645 | 187,263 |
| Laboratory Corp. of America Holdings * | 979 | 265,563 |
| LHC Group, Inc. * | 189 | 25,736 |
| LivaNova plc * | 219 | 17,262 |
| Masimo Corp. * | 139 | 21,886 |
| McKesson Corp. | 5,047 | 1,387,723 |
| MEDNAX, Inc. * | 2,506 | 58,816 |
| Medtronic plc | 14,058 | 1,475,949 |
| Merit Medical Systems, Inc. * | 280 | 18,208 |
| ModivCare, Inc. * | 153 | 18,054 |
| Molina Healthcare, Inc. * | 685 | 210,206 |
| National HealthCare Corp. | 345 | 22,432 |
| Natus Medical, Inc. * | 434 | 12,074 |
| Neogen Corp. * | 371 | 13,245 |
| NextGen Healthcare, Inc. * | 743 | 14,511 |
| NuVasive, Inc. * | 537 | 29,062 |
| Omnicell, Inc. * | 139 | 17,970 |
| Orthofix Medical, Inc. * | 316 | 10,738 |
| Owens & Minor, Inc. | 1,616 | 71,346 |
| Patterson Cos., Inc. | 2,679 | 80,102 |
| Premier, Inc., Class A | 1,595 | 57,324 |
| Quest Diagnostics, Inc. | 2,107 | 276,586 |
| ResMed, Inc. | 457 | 112,765 |
| Select Medical Holdings Corp. | 1,438 | 33,290 |
| STERIS plc | 639 | 153,360 |
| Stryker Corp. | 1,806 | 475,610 |
| Teleflex, Inc. | 205 | 68,944 |
| Tenet Healthcare Corp. * | 2,287 | 196,659 |
| The Cooper Cos., Inc. | 201 | 82,213 |
| The Ensign Group, Inc. | 315 | 26,473 |
| UnitedHealth Group, Inc. | 9,930 | 4,725,389 |
| Universal Health Services, Inc., Class B | 2,002 | 288,148 |
| SECURITY | NUMBER
OF SHARES | VALUE ($) |
| US Physical Therapy, Inc. | 96 | 8,829 |
| Varex Imaging Corp. * | 608 | 14,373 |
| Veeva Systems, Inc., Class A * | 87 | 19,927 |
| Zimmer Biomet Holdings, Inc. | 1,685 | 214,315 |
| | | 25,990,610 |
| |
| Household & Personal Products 1.3% |
| Central Garden & Pet Co., Class A * | 524 | 23,077 |
| Church & Dwight Co., Inc. | 1,984 | 194,134 |
| Colgate-Palmolive Co. | 7,614 | 585,897 |
| Coty, Inc., Class A * | 6,325 | 58,000 |
| Edgewell Personal Care Co. | 1,360 | 48,525 |
| Energizer Holdings, Inc. | 671 | 22,405 |
| Herbalife Nutrition Ltd. * | 897 | 31,915 |
| Inter Parfums, Inc. | 138 | 12,817 |
| Kimberly-Clark Corp. | 3,306 | 430,276 |
| Medifast, Inc. | 57 | 10,602 |
| Nu Skin Enterprises, Inc., Class A | 1,533 | 71,116 |
| Spectrum Brands Holdings, Inc. | 778 | 72,183 |
| The Clorox Co. | 1,152 | 167,950 |
| The Estee Lauder Cos., Inc., Class A | 906 | 268,475 |
| The Procter & Gamble Co. | 22,776 | 3,550,551 |
| USANA Health Sciences, Inc. * | 252 | 22,178 |
| WD-40 Co. | 77 | 16,316 |
| | | 5,586,417 |
| |
| Insurance 3.6% |
| Aflac, Inc. | 13,039 | 796,553 |
| Alleghany Corp. * | 210 | 139,003 |
| Ambac Financial Group, Inc. * | 1,429 | 18,334 |
| American Equity Investment Life Holding Co. | 2,151 | 81,071 |
| American Financial Group, Inc. | 907 | 122,799 |
| American International Group, Inc. | 33,446 | 2,048,233 |
| American National Group, Inc. | 114 | 21,549 |
| AMERISAFE, Inc. | 334 | 15,731 |
| Aon plc, Class A | 1,857 | 542,504 |
| Arch Capital Group Ltd. * | 3,283 | 154,662 |
| Argo Group International Holdings Ltd. | 479 | 20,199 |
| Arthur J. Gallagher & Co. | 1,100 | 174,009 |
| Assurant, Inc. | 612 | 103,863 |
| Assured Guaranty Ltd. | 2,845 | 176,305 |
| Axis Capital Holdings Ltd. | 1,538 | 84,006 |
| Brighthouse Financial, Inc. * | 292 | 15,260 |
| Brown & Brown, Inc. | 1,413 | 95,533 |
| Chubb Ltd. | 4,851 | 987,858 |
| Cincinnati Financial Corp. | 1,674 | 205,551 |
| CNA Financial Corp. | 626 | 28,608 |
| CNO Financial Group, Inc. | 3,936 | 95,133 |
| Employers Holdings, Inc. | 586 | 22,772 |
| Enstar Group Ltd. * | 82 | 23,372 |
| Everest Re Group Ltd. | 641 | 191,159 |
| Fidelity National Financial, Inc. | 4,647 | 221,383 |
| First American Financial Corp. | 1,989 | 133,343 |
| Genworth Financial, Inc., Class A * | 30,105 | 122,226 |
| Globe Life, Inc. | 1,596 | 161,132 |
| Horace Mann Educators Corp. | 520 | 21,627 |
| James River Group Holdings Ltd. | 667 | 17,742 |
| Kemper Corp. | 873 | 46,653 |
| Lincoln National Corp. | 4,289 | 289,164 |
| Loews Corp. | 5,013 | 307,497 |
| Markel Corp. * | 123 | 152,878 |
| Marsh & McLennan Cos., Inc. | 3,705 | 575,794 |
| MBIA, Inc. * | 2,543 | 38,781 |
| Mercury General Corp. | 543 | 29,865 |
| MetLife, Inc. | 15,602 | 1,053,915 |
Schwab Fundamental Index ETFs | Annual Report
Schwab Fundamental U.S. Broad Market Index ETF
Portfolio Holdings as of February 28, 2022 (continued)
| SECURITY | NUMBER
OF SHARES | VALUE ($) |
| Old Republic International Corp. | 5,933 | 156,335 |
| Primerica, Inc. | 537 | 69,751 |
| Principal Financial Group, Inc. | 4,572 | 322,966 |
| ProAssurance Corp. | 2,144 | 51,670 |
| Prudential Financial, Inc. | 10,184 | 1,137,145 |
| Reinsurance Group of America, Inc. | 1,511 | 167,509 |
| RenaissanceRe Holdings Ltd. | 435 | 65,589 |
| RLI Corp. | 257 | 26,086 |
| Safety Insurance Group, Inc. | 264 | 22,028 |
| Selective Insurance Group, Inc. | 600 | 49,914 |
| SiriusPoint Ltd. * | 1,340 | 9,903 |
| Stewart Information Services Corp. | 610 | 41,407 |
| The Allstate Corp. | 6,978 | 853,828 |
| The Hanover Insurance Group, Inc. | 700 | 97,657 |
| The Hartford Financial Services Group, Inc. | 7,057 | 490,320 |
| The Progressive Corp. | 5,747 | 608,780 |
| The Travelers Cos., Inc. | 7,724 | 1,327,215 |
| United Fire Group, Inc. | 579 | 15,986 |
| Universal Insurance Holdings, Inc. | 1,560 | 18,034 |
| Unum Group | 8,729 | 243,714 |
| W.R. Berkley Corp. | 1,717 | 155,045 |
| White Mountains Insurance Group Ltd. | 49 | 51,460 |
| Willis Towers Watson plc | 880 | 195,624 |
| | | 15,514,033 |
| |
| Materials 3.6% |
| AdvanSix, Inc. | 687 | 27,521 |
| Air Products and Chemicals, Inc. | 1,532 | 362,012 |
| Albemarle Corp. | 715 | 140,061 |
| Alcoa Corp. | 5,868 | 442,095 |
| Allegheny Technologies, Inc. * | 2,739 | 70,502 |
| AptarGroup, Inc. | 580 | 70,690 |
| Arconic Corp. * | 4,563 | 140,084 |
| Ashland Global Holdings, Inc. | 834 | 76,962 |
| Avery Dennison Corp. | 708 | 124,750 |
| Avient Corp. | 1,285 | 67,321 |
| Axalta Coating Systems Ltd. * | 2,529 | 68,384 |
| Balchem Corp. | 172 | 23,794 |
| Ball Corp. | 1,828 | 164,045 |
| Berry Global Group, Inc. * | 1,749 | 106,077 |
| Cabot Corp. | 1,070 | 78,281 |
| Carpenter Technology Corp. | 1,583 | 60,771 |
| Celanese Corp. | 1,669 | 232,458 |
| Century Aluminum Co. * | 1,074 | 25,368 |
| CF Industries Holdings, Inc. | 3,689 | 299,510 |
| Clearwater Paper Corp. * | 770 | 22,199 |
| Cleveland-Cliffs, Inc. * | 1,629 | 36,424 |
| Commercial Metals Co. | 3,065 | 118,156 |
| Compass Minerals International, Inc. | 668 | 39,158 |
| Constellium SE * | 1,510 | 29,339 |
| Corteva, Inc. | 6,393 | 332,628 |
| Crown Holdings, Inc. | 1,137 | 139,476 |
| Dow, Inc. | 11,326 | 667,781 |
| DuPont de Nemours, Inc. | 11,813 | 913,972 |
| Eagle Materials, Inc. | 403 | 55,143 |
| Eastman Chemical Co. | 2,786 | 330,057 |
| Ecolab, Inc. | 1,998 | 352,167 |
| Element Solutions, Inc. | 1,816 | 44,637 |
| Ferro Corp. * | 1,013 | 22,012 |
| FMC Corp. | 765 | 89,696 |
| Freeport-McMoRan, Inc. | 5,304 | 249,023 |
| GCP Applied Technologies, Inc. * | 652 | 20,590 |
| Glatfelter Corp. | 1,349 | 18,535 |
| Graphic Packaging Holding Co. | 6,362 | 130,930 |
| Greif, Inc., Class A | 648 | 37,254 |
| H.B. Fuller Co. | 703 | 48,064 |
| Hawkins, Inc. | 352 | 15,932 |
| SECURITY | NUMBER
OF SHARES | VALUE ($) |
| Hecla Mining Co. | 3,407 | 19,624 |
| Huntsman Corp. | 5,246 | 212,148 |
| Ingevity Corp. * | 340 | 23,198 |
| Innospec, Inc. | 398 | 38,009 |
| International Flavors & Fragrances, Inc. | 948 | 126,084 |
| International Paper Co. | 9,497 | 413,404 |
| Kaiser Aluminum Corp. | 343 | 33,100 |
| Koppers Holdings, Inc. * | 408 | 11,681 |
| Kraton Corp. * | 821 | 37,889 |
| Linde plc * | 3,969 | 1,163,870 |
| Livent Corp. * | 707 | 16,650 |
| Louisiana-Pacific Corp. | 1,238 | 89,074 |
| LyondellBasell Industries N.V., Class A | 7,411 | 720,572 |
| Martin Marietta Materials, Inc. | 482 | 182,871 |
| Materion Corp. | 394 | 32,919 |
| Minerals Technologies, Inc. | 625 | 43,744 |
| Myers Industries, Inc. | 660 | 10,969 |
| Neenah, Inc. | 516 | 20,098 |
| NewMarket Corp. | 131 | 41,627 |
| Newmont Corp. | 5,789 | 383,232 |
| Nucor Corp. | 6,564 | 863,954 |
| O-I Glass, Inc. * | 7,802 | 99,710 |
| Olin Corp. | 2,586 | 133,205 |
| Orion Engineered Carbons S.A. | 1,572 | 24,429 |
| Packaging Corp. of America | 1,501 | 220,932 |
| PPG Industries, Inc. | 3,086 | 411,827 |
| Quaker Chemical Corp. | 58 | 10,765 |
| Reliance Steel & Aluminum Co. | 1,888 | 360,363 |
| Royal Gold, Inc. | 278 | 33,710 |
| RPM International, Inc. | 1,281 | 108,334 |
| Schnitzer Steel Industries, Inc., Class A | 830 | 40,380 |
| Schweitzer-Mauduit International, Inc. | 769 | 24,008 |
| Sealed Air Corp. | 2,744 | 184,205 |
| Sensient Technologies Corp. | 491 | 40,326 |
| Silgan Holdings, Inc. | 1,421 | 59,511 |
| Sonoco Products Co. | 1,925 | 113,036 |
| Southern Copper Corp. | 662 | 45,936 |
| Steel Dynamics, Inc. | 4,570 | 322,551 |
| Stepan Co. | 373 | 38,650 |
| Summit Materials, Inc., Class A * | 1,412 | 44,083 |
| SunCoke Energy, Inc. | 3,967 | 31,458 |
| Sylvamo Corp. * | 898 | 31,340 |
| The Chemours Co. | 3,588 | 99,029 |
| The Mosaic Co. | 7,259 | 380,589 |
| The Scotts Miracle-Gro Co. | 304 | 42,578 |
| The Sherwin-Williams Co. | 1,099 | 289,180 |
| Tredegar Corp. | 1,186 | 13,651 |
| TriMas Corp. | 579 | 18,823 |
| Trinseo plc | 1,183 | 61,469 |
| Tronox Holdings plc, Class A | 1,195 | 24,259 |
| United States Steel Corp. | 7,434 | 202,279 |
| Valvoline, Inc. | 1,212 | 39,184 |
| Verso Corp., Class A | 2,887 | 76,534 |
| Vulcan Materials Co. | 885 | 160,583 |
| Warrior Met Coal, Inc. | 3,613 | 113,810 |
| Westlake Corp. | 635 | 70,047 |
| Westrock Co. | 8,500 | 384,795 |
| Worthington Industries, Inc. | 768 | 43,791 |
| | | 15,177,936 |
| |
| Media & Entertainment 4.1% |
| Activision Blizzard, Inc. | 3,997 | 325,755 |
| Alphabet, Inc., Class A * | 1,077 | 2,909,128 |
| Alphabet, Inc., Class C * | 1,039 | 2,803,035 |
| Altice USA, Inc., Class A * | 6,748 | 78,007 |
| AMC Entertainment Holdings, Inc., Class A * | 992 | 18,709 |
| AMC Networks, Inc., Class A * | 1,282 | 53,139 |
Schwab Fundamental Index ETFs | Annual Report
Schwab Fundamental U.S. Broad Market Index ETF
Portfolio Holdings as of February 28, 2022 (continued)
| SECURITY | NUMBER
OF SHARES | VALUE ($) |
| Cable One, Inc. | 21 | 30,090 |
| Cars.com, Inc. * | 1,683 | 27,231 |
| Charter Communications, Inc., Class A * | 1,528 | 919,520 |
| Cinemark Holdings, Inc. * | 4,262 | 74,755 |
| Comcast Corp., Class A | 60,337 | 2,821,358 |
| Discovery, Inc., Class A * | 2,683 | 75,258 |
| Discovery, Inc., Class C * | 4,846 | 135,543 |
| DISH Network Corp., Class A * | 4,097 | 130,940 |
| Electronic Arts, Inc. | 2,291 | 298,036 |
| Fox Corp., Class A | 5,508 | 230,400 |
| Fox Corp., Class B | 2,635 | 100,815 |
| Gannett Co., Inc. * | 5,507 | 27,315 |
| Gray Television, Inc. | 1,618 | 37,910 |
| iHeartMedia, Inc., Class A * | 2,280 | 48,906 |
| IMAX Corp. * | 679 | 14,042 |
| John Wiley & Sons, Inc., Class A | 733 | 36,877 |
| Liberty Media Corp. - Liberty Formula One, Class C * | 858 | 52,106 |
| Liberty Media Corp. - Liberty SiriusXM, Class A * | 2,314 | 116,533 |
| Liberty Media Corp. - Liberty SiriusXM, Class C * | 4,910 | 247,071 |
| Liberty TripAdvisor Holdings, Inc., Class A * | 3,660 | 7,759 |
| Lions Gate Entertainment Corp., Class A * | 989 | 15,191 |
| Lions Gate Entertainment Corp., Class B * | 1,846 | 26,305 |
| Live Nation Entertainment, Inc. * | 551 | 66,572 |
| Loyalty Ventures, Inc. * | 1,096 | 26,304 |
| Madison Square Garden Entertainment Corp. * | 421 | 32,990 |
| Madison Square Garden Sports Corp. * | 108 | 18,684 |
| Match Group, Inc. * | 546 | 60,873 |
| Meta Platforms, Inc., Class A * | 8,054 | 1,699,636 |
| National CineMedia, Inc. | 4,754 | 14,119 |
| Netflix, Inc. * | 294 | 115,989 |
| News Corp., Class A | 5,847 | 130,505 |
| News Corp., Class B | 1,860 | 41,720 |
| Nexstar Media Group, Inc., Class A | 476 | 88,084 |
| Omnicom Group, Inc. | 3,932 | 329,855 |
| Paramount Global, Class B | 9,889 | 302,702 |
| Scholastic Corp. | 969 | 40,775 |
| Sinclair Broadcast Group, Inc., Class A | 1,780 | 53,400 |
| Sirius XM Holdings, Inc. | 10,816 | 66,627 |
| Spotify Technology S.A. * | 166 | 25,928 |
| Take-Two Interactive Software, Inc. * | 426 | 69,012 |
| TEGNA, Inc. | 3,845 | 88,127 |
| The E.W. Scripps Co., Class A * | 750 | 16,695 |
| The Interpublic Group of Cos., Inc. | 5,168 | 190,182 |
| The Marcus Corp. * | 893 | 16,235 |
| The New York Times Co., Class A | 929 | 40,867 |
| The Walt Disney Co. * | 13,832 | 2,053,499 |
| TripAdvisor, Inc. * | 1,298 | 33,021 |
| Twitter, Inc. * | 1,412 | 50,197 |
| World Wrestling Entertainment, Inc., Class A | 258 | 15,289 |
| Yandex N.V., Class A *(c)(d) | 836 | 8,191 |
| Yelp, Inc. * | 1,045 | 35,415 |
| Ziff Davis, Inc. * | 405 | 40,743 |
| Zynga, Inc., Class A * | 3,070 | 27,876 |
| | | 17,461,846 |
| |
| Pharmaceuticals, Biotechnology & Life Sciences 5.7% |
| AbbVie, Inc. | 17,035 | 2,517,262 |
| Agilent Technologies, Inc. | 1,471 | 191,760 |
| Alkermes plc * | 674 | 16,756 |
| Amgen, Inc. | 8,411 | 1,904,923 |
| Avantor, Inc. * | 815 | 28,272 |
| SECURITY | NUMBER
OF SHARES | VALUE ($) |
| Biogen, Inc. * | 2,238 | 472,240 |
| BioMarin Pharmaceutical, Inc. * | 314 | 24,530 |
| Bio-Rad Laboratories, Inc., Class A * | 66 | 41,313 |
| Bio-Techne Corp. | 77 | 32,295 |
| Bristol-Myers Squibb Co. | 19,040 | 1,307,477 |
| Bruker Corp. | 513 | 36,100 |
| Catalent, Inc. * | 406 | 41,428 |
| Charles River Laboratories International, Inc. * | 147 | 42,801 |
| Danaher Corp. | 1,852 | 508,207 |
| Elanco Animal Health, Inc. * | 2,076 | 58,979 |
| Eli Lilly & Co. | 2,916 | 728,854 |
| Emergent BioSolutions, Inc. * | 316 | 13,076 |
| Exelixis, Inc. * | 1,259 | 25,847 |
| Gilead Sciences, Inc. | 33,589 | 2,028,776 |
| Horizon Therapeutics plc * | 236 | 21,516 |
| ICON plc * | 540 | 128,525 |
| Illumina, Inc. * | 323 | 105,492 |
| Incyte Corp. * | 485 | 33,126 |
| IQVIA Holdings, Inc. * | 1,448 | 333,214 |
| Jazz Pharmaceuticals plc * | 727 | 99,904 |
| Johnson & Johnson | 26,539 | 4,367,523 |
| Ligand Pharmaceuticals, Inc. * | 81 | 8,199 |
| Medpace Holdings, Inc. * | 78 | 11,932 |
| Merck & Co., Inc. | 32,081 | 2,456,763 |
| Mettler-Toledo International, Inc. * | 96 | 135,239 |
| Myriad Genetics, Inc. * | 1,088 | 26,525 |
| Organon & Co. | 3,565 | 133,081 |
| PerkinElmer, Inc. | 476 | 85,494 |
| Perrigo Co., plc | 3,251 | 115,476 |
| Pfizer, Inc. | 89,389 | 4,195,920 |
| Prestige Consumer Healthcare, Inc. * | 564 | 33,575 |
| Regeneron Pharmaceuticals, Inc. * | 463 | 286,301 |
| Royalty Pharma plc, Class A | 266 | 10,443 |
| Syneos Health, Inc. * | 539 | 42,689 |
| Thermo Fisher Scientific, Inc. | 1,543 | 839,392 |
| United Therapeutics Corp. * | 576 | 95,731 |
| Vertex Pharmaceuticals, Inc. * | 404 | 92,928 |
| Viatris, Inc. | 22,220 | 244,642 |
| Waters Corp. * | 483 | 152,981 |
| West Pharmaceutical Services, Inc. | 171 | 66,191 |
| Zoetis, Inc. | 1,356 | 262,589 |
| | | 24,406,287 |
| |
| Real Estate 2.7% |
| Acadia Realty Trust | 1,042 | 22,340 |
| Alexander & Baldwin, Inc. | 1,845 | 41,383 |
| Alexandria Real Estate Equities, Inc. | 499 | 94,511 |
| American Assets Trust, Inc. | 553 | 20,218 |
| American Campus Communities, Inc. | 1,535 | 82,598 |
| American Homes 4 Rent, Class A | 1,303 | 49,527 |
| American Tower Corp. | 1,662 | 377,058 |
| Americold Realty Trust | 897 | 23,968 |
| Apartment Income REIT Corp. | 1,601 | 82,628 |
| Apple Hospitality REIT, Inc. | 5,611 | 99,259 |
| AvalonBay Communities, Inc. | 966 | 230,478 |
| Boston Properties, Inc. | 1,728 | 211,352 |
| Brandywine Realty Trust | 3,331 | 44,402 |
| Brixmor Property Group, Inc. | 4,633 | 116,381 |
| Camden Property Trust | 633 | 104,515 |
| CareTrust REIT, Inc. | 531 | 9,292 |
| CBRE Group, Inc., Class A | 3,378 | 327,159 |
| Centerspace | 188 | 17,670 |
| Chatham Lodging Trust * | 1,600 | 22,000 |
| Corporate Office Properties Trust | 1,540 | 40,363 |
| Cousins Properties, Inc. | 947 | 36,583 |
| Crown Castle International Corp. | 2,088 | 347,840 |
Schwab Fundamental Index ETFs | Annual Report
Schwab Fundamental U.S. Broad Market Index ETF
Portfolio Holdings as of February 28, 2022 (continued)
| SECURITY | NUMBER
OF SHARES | VALUE ($) |
| CubeSmart | 1,101 | 53,079 |
| Cushman & Wakefield plc * | 1,383 | 30,315 |
| CyrusOne, Inc. | 675 | 60,986 |
| DiamondRock Hospitality Co. * | 5,172 | 49,393 |
| Digital Realty Trust, Inc. | 1,320 | 178,094 |
| DigitalBridge Group, Inc. * | 15,523 | 112,542 |
| Diversified Healthcare Trust | 24,942 | 71,833 |
| Douglas Elliman, Inc. * | 1,394 | 10,511 |
| Douglas Emmett, Inc. | 1,632 | 51,734 |
| Duke Realty Corp. | 1,715 | 90,895 |
| Easterly Government Properties, Inc. | 573 | 11,930 |
| EastGroup Properties, Inc. | 154 | 29,377 |
| Empire State Realty Trust, Inc., Class A | 3,192 | 30,196 |
| EPR Properties | 1,032 | 51,394 |
| Equinix, Inc. | 373 | 264,729 |
| Equity Commonwealth * | 1,176 | 31,246 |
| Equity LifeStyle Properties, Inc. | 832 | 62,084 |
| Equity Residential | 3,034 | 258,800 |
| Essex Property Trust, Inc. | 408 | 129,405 |
| Extra Space Storage, Inc. | 587 | 110,444 |
| Federal Realty Investment Trust | 659 | 77,485 |
| First Industrial Realty Trust, Inc. | 628 | 36,160 |
| Gaming & Leisure Properties, Inc. | 1,590 | 72,202 |
| Global Net Lease, Inc. | 1,290 | 18,331 |
| Healthcare Realty Trust, Inc. | 1,310 | 34,165 |
| Healthcare Trust of America, Inc., Class A | 1,808 | 53,137 |
| Healthpeak Properties, Inc. | 5,249 | 163,034 |
| Hersha Hospitality Trust * | 2,053 | 18,949 |
| Highwoods Properties, Inc. | 1,332 | 58,075 |
| Host Hotels & Resorts, Inc. * | 19,452 | 355,388 |
| Hudson Pacific Properties, Inc. | 1,869 | 49,342 |
| Independence Realty Trust, Inc. | 772 | 19,508 |
| Industrial Logistics Properties Trust | 638 | 14,272 |
| Invitation Homes, Inc. | 2,482 | 93,820 |
| Iron Mountain, Inc. | 4,342 | 213,540 |
| iStar, Inc. | 1,259 | 31,626 |
| JBG SMITH Properties | 1,092 | 29,135 |
| Jones Lang LaSalle, Inc. * | 908 | 223,568 |
| Kennedy-Wilson Holdings, Inc. | 1,617 | 35,800 |
| Kilroy Realty Corp. | 939 | 67,251 |
| Kimco Realty Corp. | 6,683 | 157,251 |
| Kite Realty Group Trust | 4,026 | 88,290 |
| Lamar Advertising Co., Class A | 862 | 94,010 |
| Life Storage, Inc. | 426 | 53,927 |
| LTC Properties, Inc. | 386 | 13,058 |
| LXP Industrial Trust | 2,731 | 42,221 |
| Marcus & Millichap, Inc. * | 326 | 16,212 |
| Medical Properties Trust, Inc. | 2,850 | 57,969 |
| Mid-America Apartment Communities, Inc. | 711 | 145,478 |
| National Health Investors, Inc. | 399 | 21,271 |
| National Retail Properties, Inc. | 1,174 | 50,024 |
| Newmark Group, Inc., Class A | 1,237 | 21,870 |
| Office Properties Income Trust | 1,245 | 31,187 |
| Omega Healthcare Investors, Inc. | 2,284 | 64,340 |
| Orion Office REIT, Inc. * | 349 | 5,943 |
| Outfront Media, Inc. | 2,836 | 75,721 |
| Paramount Group, Inc. | 4,630 | 51,810 |
| Park Hotels & Resorts, Inc. * | 7,337 | 138,229 |
| Pebblebrook Hotel Trust | 2,478 | 55,780 |
| Physicians Realty Trust | 1,583 | 25,740 |
| Piedmont Office Realty Trust, Inc., Class A | 2,801 | 47,729 |
| PotlatchDeltic Corp. | 621 | 34,093 |
| Preferred Apartment Communities, Inc. | 1,708 | 43,144 |
| Prologis, Inc. | 2,042 | 297,826 |
| PS Business Parks, Inc. | 144 | 22,938 |
| Public Storage | 719 | 255,259 |
| Rayonier, Inc. | 1,304 | 51,769 |
| Realogy Holdings Corp. * | 6,959 | 126,515 |
| SECURITY | NUMBER
OF SHARES | VALUE ($) |
| Realty Income Corp. | 3,486 | 230,390 |
| Regency Centers Corp. | 1,322 | 87,107 |
| Retail Opportunity Investments Corp. | 1,275 | 23,154 |
| Rexford Industrial Realty, Inc. | 251 | 17,603 |
| RLJ Lodging Trust | 5,903 | 82,583 |
| RPT Realty | 1,689 | 21,872 |
| Ryman Hospitality Properties, Inc. * | 624 | 54,981 |
| Sabra Health Care REIT, Inc. | 2,469 | 33,159 |
| SBA Communications Corp. | 223 | 67,656 |
| Seritage Growth Properties, Class A * | 701 | 7,143 |
| Service Properties Trust | 10,810 | 93,290 |
| Simon Property Group, Inc. | 3,381 | 465,090 |
| SITE Centers Corp. | 3,140 | 48,827 |
| SL Green Realty Corp. | 1,542 | 122,620 |
| Spirit Realty Capital, Inc. | 993 | 46,045 |
| STAG Industrial, Inc. | 711 | 27,701 |
| STORE Capital Corp. | 1,155 | 35,482 |
| Summit Hotel Properties, Inc. * | 2,689 | 26,594 |
| Sun Communities, Inc. | 416 | 75,296 |
| Sunstone Hotel Investors, Inc. * | 5,979 | 63,258 |
| Tanger Factory Outlet Centers, Inc. | 2,182 | 36,396 |
| Terreno Realty Corp. | 188 | 12,932 |
| The Howard Hughes Corp. * | 241 | 23,035 |
| The Macerich Co. | 5,618 | 85,955 |
| The Necessity Retail REIT, Inc. | 1,825 | 12,848 |
| UDR, Inc. | 1,822 | 99,973 |
| Uniti Group, Inc. | 4,809 | 62,373 |
| Urban Edge Properties | 1,628 | 29,662 |
| Ventas, Inc. | 6,477 | 349,758 |
| Veris Residential, Inc. * | 1,623 | 27,429 |
| VICI Properties, Inc. | 2,135 | 59,695 |
| Vornado Realty Trust | 3,259 | 141,049 |
| Washington Real Estate Investment Trust | 1,197 | 27,962 |
| Welltower, Inc. | 4,888 | 407,121 |
| Weyerhaeuser Co. | 10,894 | 423,559 |
| WP Carey, Inc. | 1,169 | 90,481 |
| Xenia Hotels & Resorts, Inc. * | 2,965 | 54,971 |
| Zillow Group, Inc., Class A * | 47 | 2,692 |
| Zillow Group, Inc., Class C * | 114 | 6,557 |
| | | 11,429,203 |
| |
| Retailing 4.2% |
| Abercrombie & Fitch Co., Class A * | 1,830 | 69,686 |
| Advance Auto Parts, Inc. | 935 | 191,189 |
| Amazon.com, Inc. * | 766 | 2,352,585 |
| American Eagle Outfitters, Inc. | 3,524 | 74,286 |
| America's Car-Mart, Inc. * | 85 | 8,175 |
| Asbury Automotive Group, Inc. * | 456 | 88,514 |
| AutoNation, Inc. * | 1,585 | 181,736 |
| AutoZone, Inc. * | 129 | 240,377 |
| Bath & Body Works, Inc. | 3,045 | 162,512 |
| Bed Bath & Beyond, Inc. * | 9,088 | 153,496 |
| Best Buy Co., Inc. | 5,179 | 500,499 |
| Big 5 Sporting Goods Corp. (b) | 572 | 9,472 |
| Big Lots, Inc. | 1,701 | 59,127 |
| Boot Barn Holdings, Inc. * | 155 | 13,488 |
| Burlington Stores, Inc. * | 331 | 74,770 |
| Caleres, Inc. | 1,708 | 35,458 |
| CarMax, Inc. * | 2,204 | 240,963 |
| Chico's FAS, Inc. * | 13,986 | 65,734 |
| Citi Trends, Inc. * | 183 | 6,828 |
| Conn's, Inc. * | 933 | 17,111 |
| Designer Brands, Inc., Class A * | 3,852 | 50,269 |
| Dick's Sporting Goods, Inc. | 1,284 | 134,820 |
| Dillard's, Inc., Class A | 376 | 94,267 |
| Dollar General Corp. | 2,894 | 573,996 |
| Dollar Tree, Inc. * | 3,049 | 433,202 |
Schwab Fundamental Index ETFs | Annual Report
Schwab Fundamental U.S. Broad Market Index ETF
Portfolio Holdings as of February 28, 2022 (continued)
| SECURITY | NUMBER
OF SHARES | VALUE ($) |
| eBay, Inc. | 9,753 | 532,416 |
| Etsy, Inc. * | 57 | 8,829 |
| Express, Inc. * | 9,194 | 43,764 |
| Five Below, Inc. * | 160 | 26,178 |
| Floor & Decor Holdings, Inc., Class A * | 231 | 22,088 |
| Foot Locker, Inc. | 3,463 | 109,500 |
| GameStop Corp., Class A *(b) | 868 | 107,059 |
| Genesco, Inc. * | 786 | 50,422 |
| Genuine Parts Co. | 2,362 | 288,542 |
| Group 1 Automotive, Inc. | 647 | 117,709 |
| Groupon, Inc. * | 1,224 | 26,585 |
| Guess?, Inc. | 1,383 | 30,288 |
| Haverty Furniture Cos., Inc. | 604 | 17,160 |
| Hibbett, Inc. | 340 | 15,327 |
| Kohl's Corp. | 9,156 | 509,257 |
| Lithia Motors, Inc. | 336 | 114,516 |
| LKQ Corp. | 4,193 | 196,861 |
| Lowe's Cos., Inc. | 6,586 | 1,455,901 |
| Macy's, Inc. | 24,248 | 628,508 |
| MarineMax, Inc. * | 400 | 18,304 |
| MercadoLibre, Inc. * | 12 | 13,520 |
| Monro, Inc. | 458 | 21,379 |
| Murphy USA, Inc. | 1,042 | 188,331 |
| National Vision Holdings, Inc. * | 485 | 17,785 |
| Nordstrom, Inc. * | 5,400 | 111,996 |
| Ollie's Bargain Outlet Holdings, Inc. * | 344 | 14,854 |
| O'Reilly Automotive, Inc. * | 651 | 422,655 |
| Overstock.com, Inc. * | 160 | 9,104 |
| Party City Holdco, Inc. * | 3,693 | 15,991 |
| Penske Automotive Group, Inc. | 1,021 | 100,354 |
| PetMed Express, Inc. | 398 | 10,726 |
| Pool Corp. | 147 | 67,411 |
| Qurate Retail, Inc., Class A | 23,186 | 127,755 |
| Rent-A-Center, Inc. | 432 | 12,273 |
| RH * | 28 | 11,252 |
| Ross Stores, Inc. | 3,187 | 291,260 |
| Sally Beauty Holdings, Inc. * | 3,461 | 59,806 |
| Shoe Carnival, Inc. | 526 | 15,338 |
| Signet Jewelers Ltd. | 1,302 | 91,791 |
| Sleep Number Corp. * | 342 | 22,469 |
| Sonic Automotive, Inc., Class A | 1,105 | 59,350 |
| Stitch Fix, Inc., Class A * | 311 | 3,903 |
| Target Corp. | 7,136 | 1,425,559 |
| The Buckle, Inc. | 586 | 21,096 |
| The Children's Place, Inc. * | 352 | 22,162 |
| The Gap, Inc. | 6,817 | 99,187 |
| The Home Depot, Inc. | 8,608 | 2,718,665 |
| The ODP Corp. * | 3,443 | 151,492 |
| The TJX Cos., Inc. | 14,031 | 927,449 |
| Tractor Supply Co. | 1,069 | 217,852 |
| TravelCenters of America, Inc. * | 1,001 | 42,272 |
| Ulta Beauty, Inc. * | 411 | 153,920 |
| Urban Outfitters, Inc. * | 2,316 | 63,713 |
| Victoria's Secret & Co. * | 1,034 | 55,453 |
| Williams-Sonoma, Inc. | 745 | 107,921 |
| Zumiez, Inc. * | 460 | 20,465 |
| | | 17,868,283 |
| |
| Semiconductors & Semiconductor Equipment 3.5% |
| Advanced Micro Devices, Inc. * | 3,227 | 398,018 |
| Ambarella, Inc. * | 98 | 13,692 |
| Amkor Technology, Inc. | 1,915 | 43,413 |
| Analog Devices, Inc. | 2,930 | 469,650 |
| Applied Materials, Inc. | 6,134 | 823,183 |
| Azenta, Inc. | 218 | 19,079 |
| Broadcom, Inc. | 2,296 | 1,348,762 |
| Cirrus Logic, Inc. * | 816 | 70,886 |
| SECURITY | NUMBER
OF SHARES | VALUE ($) |
| CMC Materials, Inc. | 160 | 29,669 |
| Diodes, Inc. * | 328 | 29,386 |
| Entegris, Inc. | 376 | 49,060 |
| First Solar, Inc. * | 766 | 57,672 |
| FormFactor, Inc. * | 369 | 14,941 |
| Intel Corp. | 83,269 | 3,971,931 |
| KLA Corp. | 795 | 277,058 |
| Kulicke & Soffa Industries, Inc. | 551 | 28,784 |
| Lam Research Corp. | 746 | 418,767 |
| Marvell Technology, Inc. | 2,126 | 145,270 |
| Microchip Technology, Inc. | 2,151 | 151,280 |
| Micron Technology, Inc. | 15,186 | 1,349,428 |
| MKS Instruments, Inc. | 389 | 58,583 |
| Monolithic Power Systems, Inc. | 58 | 26,605 |
| NVIDIA Corp. | 2,593 | 632,303 |
| NXP Semiconductor N.V. | 2,075 | 394,499 |
| ON Semiconductor Corp. * | 3,156 | 197,597 |
| Photronics, Inc. * | 1,495 | 27,538 |
| Power Integrations, Inc. | 251 | 22,590 |
| Qorvo, Inc. * | 1,114 | 152,373 |
| QUALCOMM, Inc. | 10,464 | 1,799,703 |
| Semtech Corp. * | 317 | 21,993 |
| Silicon Laboratories, Inc. * | 162 | 24,901 |
| Skyworks Solutions, Inc. | 1,665 | 230,053 |
| SolarEdge Technologies, Inc. * | 65 | 20,762 |
| Synaptics, Inc. * | 295 | 67,387 |
| Teradyne, Inc. | 832 | 98,109 |
| Texas Instruments, Inc. | 6,897 | 1,172,421 |
| Ultra Clean Holdings, Inc. * | 323 | 14,797 |
| Universal Display Corp. | 70 | 10,844 |
| Wolfspeed, Inc. * | 495 | 50,846 |
| | | 14,733,833 |
| |
| Software & Services 5.5% |
| Accenture plc, Class A | 3,831 | 1,210,673 |
| ACI Worldwide, Inc. * | 918 | 30,771 |
| Adobe, Inc. * | 852 | 398,463 |
| Akamai Technologies, Inc. * | 1,333 | 144,311 |
| Alliance Data Systems Corp. | 2,728 | 184,004 |
| Amdocs Ltd. | 2,432 | 191,398 |
| ANSYS, Inc. * | 230 | 74,564 |
| Aspen Technology, Inc. * | 302 | 46,028 |
| Autodesk, Inc. * | 274 | 60,343 |
| Automatic Data Processing, Inc. | 2,680 | 547,899 |
| Avaya Holdings Corp. * | 1,238 | 17,047 |
| Black Knight, Inc. * | 715 | 40,176 |
| Blackbaud, Inc. * | 230 | 14,373 |
| Block, Inc. * | 92 | 11,730 |
| Broadridge Financial Solutions, Inc. | 852 | 124,571 |
| Cadence Design Systems, Inc. * | 722 | 109,332 |
| CDK Global, Inc. | 2,394 | 108,544 |
| Cerence, Inc. * | 236 | 8,522 |
| Check Point Software Technologies Ltd. * | 1,102 | 159,658 |
| Citrix Systems, Inc. | 1,697 | 173,942 |
| Cognizant Technology Solutions Corp., Class A | 9,182 | 790,846 |
| Cognyte Software Ltd. * | 513 | 5,725 |
| CommVault Systems, Inc. * | 287 | 18,055 |
| Concentrix Corp. | 305 | 60,966 |
| Conduent, Inc. * | 8,768 | 42,700 |
| Consensus Cloud Solutions, Inc. * | 127 | 7,069 |
| CSG Systems International, Inc. | 558 | 34,440 |
| Dolby Laboratories, Inc., Class A | 455 | 34,171 |
| Dropbox, Inc., Class A * | 723 | 16,405 |
| DXC Technology Co. * | 8,326 | 283,334 |
| Ebix, Inc. | 575 | 16,968 |
| Envestnet, Inc. * | 186 | 13,917 |
Schwab Fundamental Index ETFs | Annual Report
Schwab Fundamental U.S. Broad Market Index ETF
Portfolio Holdings as of February 28, 2022 (continued)
| SECURITY | NUMBER
OF SHARES | VALUE ($) |
| EPAM Systems, Inc. * | 96 | 19,944 |
| Euronet Worldwide, Inc. * | 427 | 54,754 |
| EVERTEC, Inc. | 466 | 18,808 |
| ExlService Holdings, Inc. * | 235 | 28,386 |
| Fair Isaac Corp. * | 101 | 47,590 |
| Fidelity National Information Services, Inc. | 3,068 | 292,166 |
| Fiserv, Inc. * | 1,888 | 184,401 |
| FleetCor Technologies, Inc. * | 577 | 135,133 |
| Fortinet, Inc. * | 164 | 56,501 |
| Gartner, Inc. * | 273 | 76,555 |
| Genpact Ltd. | 2,027 | 84,810 |
| Global Payments, Inc. | 1,013 | 135,114 |
| Globant S.A. * | 53 | 14,522 |
| GoDaddy, Inc., Class A * | 386 | 32,196 |
| Guidewire Software, Inc. * | 118 | 10,402 |
| InterDigital, Inc. | 544 | 35,044 |
| International Business Machines Corp. | 21,313 | 2,611,056 |
| Intuit, Inc. | 750 | 355,777 |
| Jack Henry & Associates, Inc. | 564 | 99,715 |
| Kyndryl Holdings, Inc. * | 4,541 | 72,020 |
| LiveRamp Holdings, Inc. * | 854 | 36,859 |
| Manhattan Associates, Inc. * | 254 | 33,955 |
| Mastercard, Inc., Class A | 2,774 | 1,000,915 |
| Maximus, Inc. | 1,017 | 80,201 |
| Microsoft Corp. | 26,417 | 7,893,135 |
| MicroStrategy, Inc., Class A * | 21 | 9,303 |
| NCR Corp. * | 2,679 | 108,553 |
| NortonLifeLock, Inc. | 8,010 | 232,130 |
| Nuance Communications, Inc. * | 609 | 33,812 |
| Oracle Corp. | 22,737 | 1,727,330 |
| Pagseguro Digital Ltd., Class A * | 388 | 6,185 |
| Palo Alto Networks, Inc. * | 89 | 52,888 |
| Paychex, Inc. | 2,136 | 254,312 |
| Paycom Software, Inc. * | 47 | 15,943 |
| PayPal Holdings, Inc. * | 2,136 | 239,082 |
| Pegasystems, Inc. | 110 | 9,583 |
| Perficient, Inc. * | 188 | 19,157 |
| Progress Software Corp. | 478 | 21,070 |
| PTC, Inc. * | 212 | 23,591 |
| Sabre Corp. * | 9,915 | 108,371 |
| salesforce.com, Inc. * | 1,090 | 229,478 |
| ServiceNow, Inc. * | 34 | 19,717 |
| Splunk, Inc. * | 184 | 21,730 |
| SS&C Technologies Holdings, Inc. | 1,076 | 80,668 |
| StoneCo Ltd., Class A * | 286 | 3,215 |
| Synopsys, Inc. * | 375 | 117,146 |
| Teradata Corp. * | 1,722 | 86,083 |
| The Western Union Co. | 8,701 | 158,184 |
| Tyler Technologies, Inc. * | 67 | 28,693 |
| Unisys Corp. * | 844 | 18,036 |
| Verint Systems, Inc. * | 420 | 21,097 |
| VeriSign, Inc. * | 368 | 78,649 |
| Visa, Inc., Class A | 5,769 | 1,246,796 |
| VMware, Inc., Class A | 957 | 112,275 |
| Vonage Holdings Corp. * | 1,427 | 28,997 |
| WEX, Inc. * | 240 | 40,442 |
| Workday, Inc., Class A * | 66 | 15,117 |
| Xperi Holding Corp. | 1,061 | 18,377 |
| | | 23,576,914 |
| |
| Technology Hardware & Equipment 7.1% |
| 3D Systems Corp. * | 424 | 7,556 |
| ADTRAN, Inc. | 950 | 19,561 |
| Advanced Energy Industries, Inc. | 266 | 22,836 |
| Amphenol Corp., Class A | 3,500 | 266,035 |
| Apple Inc. | 106,052 | 17,511,306 |
| Arista Networks, Inc. * | 546 | 67,011 |
| SECURITY | NUMBER
OF SHARES | VALUE ($) |
| Arrow Electronics, Inc. * | 2,790 | 340,045 |
| Avnet, Inc. | 9,516 | 400,338 |
| Badger Meter, Inc. | 163 | 16,204 |
| Belden, Inc. | 939 | 52,913 |
| Benchmark Electronics, Inc. | 2,253 | 58,893 |
| CDW Corp. | 1,222 | 210,746 |
| Ciena Corp. * | 1,310 | 89,630 |
| Cisco Systems, Inc. | 69,360 | 3,868,207 |
| Cognex Corp. | 512 | 34,591 |
| Coherent, Inc. * | 194 | 51,278 |
| CommScope Holding Co., Inc. * | 5,055 | 48,225 |
| Comtech Telecommunications Corp. | 549 | 11,298 |
| Corning, Inc. | 18,262 | 737,785 |
| CTS Corp. | 425 | 16,125 |
| Dell Technologies, Inc., Class C * | 1,717 | 87,498 |
| ePlus, Inc. * | 632 | 29,641 |
| F5, Inc. * | 711 | 142,804 |
| Fabrinet * | 347 | 34,745 |
| Flex Ltd. * | 13,238 | 218,295 |
| Hewlett Packard Enterprise Co. | 61,828 | 984,302 |
| HP, Inc. | 21,848 | 750,697 |
| II-VI, Inc. * | 459 | 31,882 |
| Insight Enterprises, Inc. * | 808 | 84,032 |
| IPG Photonics Corp. * | 259 | 33,761 |
| Itron, Inc. * | 364 | 17,352 |
| Jabil, Inc. | 4,093 | 236,616 |
| Juniper Networks, Inc. | 9,082 | 306,881 |
| Keysight Technologies, Inc. * | 510 | 80,259 |
| Knowles Corp. * | 1,294 | 28,183 |
| Littelfuse, Inc. | 167 | 43,121 |
| Lumentum Holdings, Inc. * | 305 | 30,152 |
| Methode Electronics, Inc. | 593 | 27,065 |
| Motorola Solutions, Inc. | 1,280 | 282,150 |
| National Instruments Corp. | 1,437 | 57,696 |
| NetApp, Inc. | 3,799 | 297,766 |
| NETGEAR, Inc. * | 697 | 18,547 |
| NetScout Systems, Inc. * | 1,995 | 62,104 |
| Novanta, Inc. * | 84 | 11,477 |
| OSI Systems, Inc. * | 266 | 21,458 |
| PC Connection, Inc. | 499 | 24,346 |
| Plantronics, Inc. * | 816 | 22,987 |
| Plexus Corp. * | 640 | 52,141 |
| Rogers Corp. * | 130 | 35,490 |
| Sanmina Corp. * | 2,989 | 118,902 |
| ScanSource, Inc. * | 1,913 | 60,413 |
| Seagate Technology Holdings plc | 4,059 | 418,726 |
| Stratasys Ltd. * | 549 | 13,769 |
| Super Micro Computer, Inc. * | 1,184 | 46,519 |
| TD SYNNEX Corp. | 805 | 81,973 |
| TE Connectivity Ltd. | 3,356 | 477,995 |
| Teledyne Technologies, Inc. * | 351 | 150,712 |
| Trimble, Inc. * | 1,079 | 75,260 |
| TTM Technologies, Inc. * | 3,314 | 41,657 |
| ViaSat, Inc. * | 732 | 33,408 |
| Viavi Solutions, Inc. * | 1,128 | 18,499 |
| Vishay Intertechnology, Inc. | 2,945 | 56,515 |
| Western Digital Corp. * | 7,742 | 394,378 |
| Xerox Holdings Corp. | 9,003 | 177,449 |
| Zebra Technologies Corp., Class A * | 156 | 64,481 |
| | | 30,114,687 |
| |
| Telecommunication Services 3.1% |
| AT&T, Inc. | 257,258 | 6,094,442 |
| ATN International, Inc. | 334 | 11,132 |
| Cogent Communications Holdings, Inc. | 323 | 20,478 |
| Consolidated Communications Holdings, Inc. * | 4,891 | 34,824 |
Schwab Fundamental Index ETFs | Annual Report
Schwab Fundamental U.S. Broad Market Index ETF
Portfolio Holdings as of February 28, 2022 (continued)
| SECURITY | NUMBER
OF SHARES | VALUE ($) |
| EchoStar Corp., Class A * | 1,292 | 31,447 |
| Iridium Communications, Inc. * | 522 | 20,666 |
| Liberty Global plc, Class A * | 5,444 | 140,346 |
| Liberty Global plc, Class C * | 11,536 | 298,436 |
| Liberty Latin America Ltd., Class A * | 1,139 | 11,447 |
| Liberty Latin America Ltd., Class C * | 3,933 | 39,684 |
| Lumen Technologies, Inc. | 58,282 | 603,802 |
| Shenandoah Telecommunications Co. | 593 | 13,254 |
| Telephone and Data Systems, Inc. | 6,605 | 114,597 |
| T-Mobile US, Inc. * | 4,097 | 504,792 |
| United States Cellular Corp. * | 587 | 16,148 |
| Verizon Communications, Inc. | 100,539 | 5,395,928 |
| | | 13,351,423 |
| |
| Transportation 2.2% |
| Air Transport Services Group, Inc. * | 1,024 | 32,266 |
| Alaska Air Group, Inc. * | 931 | 52,266 |
| Allegiant Travel Co. * | 83 | 14,449 |
| AMERCO | 96 | 55,451 |
| American Airlines Group, Inc. * | 9,019 | 155,578 |
| ArcBest Corp. | 722 | 66,915 |
| Atlas Air Worldwide Holdings, Inc. * | 570 | 44,665 |
| Atlas Corp. | 1,381 | 19,928 |
| Avis Budget Group, Inc. * | 2,120 | 388,893 |
| C.H. Robinson Worldwide, Inc. | 2,978 | 287,913 |
| Copa Holdings S.A., Class A * | 189 | 16,035 |
| Costamare, Inc. | 974 | 13,149 |
| CSX Corp. | 27,763 | 941,443 |
| Delta Air Lines, Inc. * | 6,015 | 240,119 |
| Expeditors International of Washington, Inc. | 2,127 | 219,847 |
| FedEx Corp. | 4,225 | 939,091 |
| Forward Air Corp. | 429 | 44,264 |
| GXO Logistics, Inc. * | 1,244 | 104,409 |
| Hawaiian Holdings, Inc. * | 822 | 15,766 |
| Heartland Express, Inc. | 1,017 | 14,604 |
| Hub Group, Inc., Class A * | 973 | 82,121 |
| J.B. Hunt Transport Services, Inc. | 1,015 | 205,974 |
| JetBlue Airways Corp. * | 3,408 | 52,040 |
| Kirby Corp. * | 1,277 | 83,197 |
| Knight-Swift Transportation Holdings, Inc. | 1,942 | 105,800 |
| Landstar System, Inc. | 586 | 90,484 |
| Marten Transport Ltd. | 1,309 | 22,580 |
| Mesa Air Group, Inc. * | 1,429 | 6,216 |
| Norfolk Southern Corp. | 2,880 | 738,778 |
| Old Dominion Freight Line, Inc. | 501 | 157,329 |
| Ryder System, Inc. | 2,490 | 196,312 |
| Saia, Inc. * | 160 | 45,957 |
| Schneider National, Inc., Class B | 1,700 | 44,404 |
| SkyWest, Inc. * | 436 | 12,256 |
| Southwest Airlines Co. * | 4,012 | 175,726 |
| Spirit Airlines, Inc. * | 615 | 15,424 |
| Uber Technologies, Inc. * | 1,371 | 49,397 |
| Union Pacific Corp. | 8,176 | 2,010,887 |
| United Airlines Holdings, Inc. * | 3,757 | 166,811 |
| United Parcel Service, Inc., Class B | 5,206 | 1,095,446 |
| Werner Enterprises, Inc. | 1,495 | 64,973 |
| XPO Logistics, Inc. * | 1,362 | 98,990 |
| Yellow Corp. * | 1,718 | 15,479 |
| | | 9,203,632 |
| |
| Utilities 3.7% |
| ALLETE, Inc. | 932 | 58,660 |
| Alliant Energy Corp. | 2,751 | 160,658 |
| Ameren Corp. | 3,392 | 291,542 |
| American Electric Power Co., Inc. | 7,787 | 705,892 |
| SECURITY | NUMBER
OF SHARES | VALUE ($) |
| American States Water Co. | 261 | 21,966 |
| American Water Works Co., Inc. | 1,158 | 174,962 |
| Atlantica Sustainable Infrastructure plc | 810 | 27,338 |
| Atmos Energy Corp. | 1,468 | 161,201 |
| Avangrid, Inc. | 949 | 42,582 |
| Avista Corp. | 1,391 | 62,080 |
| Black Hills Corp. | 983 | 68,800 |
| California Water Service Group | 394 | 22,430 |
| CenterPoint Energy, Inc. | 10,528 | 287,941 |
| Chesapeake Utilities Corp. | 138 | 18,347 |
| Clearway Energy, Inc., Class A | 248 | 7,586 |
| Clearway Energy, Inc., Class C | 576 | 19,238 |
| CMS Energy Corp. | 3,989 | 255,336 |
| Consolidated Edison, Inc. | 7,046 | 604,335 |
| Constellation Energy Corp. | 7,923 | 364,300 |
| Dominion Energy, Inc. | 10,676 | 849,062 |
| DTE Energy Co. | 2,792 | 339,479 |
| Duke Energy Corp. | 12,621 | 1,267,275 |
| Edison International | 6,644 | 421,363 |
| Entergy Corp. | 3,242 | 341,091 |
| Essential Utilities, Inc. | 1,263 | 59,500 |
| Evergy, Inc. | 5,872 | 366,472 |
| Eversource Energy | 4,172 | 341,270 |
| Exelon Corp. | 23,771 | 1,011,694 |
| FirstEnergy Corp. | 11,966 | 500,777 |
| Hawaiian Electric Industries, Inc. | 1,786 | 73,190 |
| IDACORP, Inc. | 635 | 66,008 |
| MGE Energy, Inc. | 344 | 24,775 |
| National Fuel Gas Co. | 1,145 | 71,265 |
| New Jersey Resources Corp. | 1,426 | 62,202 |
| NextEra Energy, Inc. | 12,993 | 1,016,962 |
| NiSource, Inc. | 6,630 | 191,806 |
| Northwest Natural Holding Co. | 535 | 27,825 |
| NorthWestern Corp. | 963 | 58,242 |
| NRG Energy, Inc. | 3,934 | 148,863 |
| OGE Energy Corp. | 3,529 | 132,514 |
| ONE Gas, Inc. | 835 | 69,380 |
| Ormat Technologies, Inc. | 307 | 21,904 |
| Otter Tail Corp. | 568 | 35,137 |
| PG&E Corp. * | 10,285 | 116,940 |
| Pinnacle West Capital Corp. | 2,312 | 163,759 |
| PNM Resources, Inc. | 1,098 | 49,597 |
| Portland General Electric Co. | 1,787 | 90,726 |
| PPL Corp. | 17,307 | 452,924 |
| Public Service Enterprise Group, Inc. | 7,725 | 500,812 |
| Sempra Energy | 3,602 | 519,480 |
| SJW Group | 212 | 13,827 |
| South Jersey Industries, Inc. | 1,548 | 52,524 |
| Southwest Gas Holdings, Inc. | 1,210 | 85,837 |
| Spire, Inc. | 909 | 61,003 |
| The AES Corp. | 13,038 | 276,797 |
| The Southern Co. | 16,096 | 1,042,538 |
| UGI Corp. | 4,069 | 156,412 |
| Unitil Corp. | 313 | 15,803 |
| Vistra Corp. | 15,629 | 356,654 |
| WEC Energy Group, Inc. | 3,629 | 329,804 |
| Xcel Energy, Inc. | 6,970 | 469,290 |
| | | 15,607,977 |
Total Common Stocks
(Cost $309,595,721) | 424,182,432 |
|
Schwab Fundamental Index ETFs | Annual Report
Schwab Fundamental U.S. Broad Market Index ETF
Portfolio Holdings as of February 28, 2022 (continued)
| SECURITY | NUMBER
OF SHARES | VALUE ($) |
| INVESTMENT COMPANIES 0.1% OF NET ASSETS |
| |
| Equity Funds 0.1% |
| iShares Core S&P Total U.S. Stock Market ETF | 2,800 | 274,624 |
Total Investment Companies
(Cost $263,728) | 274,624 |
| | | |
| SHORT-TERM INVESTMENTS 0.1% OF NET ASSETS |
| |
| Money Market Funds 0.1% |
| State Street Institutional U.S. Government Money Market Fund, Premier Class 0.03% (e) | 154,298 | 154,298 |
| State Street Institutional U.S. Government Money Market Fund, Premier Class 0.03% (e)(f) | 186,600 | 186,600 |
| | | 340,898 |
Total Short-Term Investments
(Cost $340,898) | 340,898 |
Total Investments in Securities
(Cost $310,200,347) | 424,797,954 |
| | NUMBER OF
CONTRACTS | NOTIONAL
AMOUNT
($) | CURRENT VALUE/
UNREALIZED
DEPRECIATION
($) |
| FUTURES CONTRACTS |
| Long | | | |
| S&P 500 Index, e-mini, expires 03/18/22 | 4 | 873,600 | (23,474) |
| * | Non-income producing security. |
| (a) | Issuer is affiliated with the fund’s investment adviser. |
| (b) | All or a portion of this security is on loan. Securities on loan were valued at $182,762. |
| (c) | Trading in Russian securities listed on the Moscow Exchange, Russian ADRs, and Russian GDRs had ceased and suspended the fund’s ability to buy or sell these securities as of February 28, 2022. |
| (d) | Fair valued by management using significant unobservable inputs in accordance with procedures approved by the fund’s Board of Trustees. |
| (e) | The rate shown is the 7-day yield. |
| (f) | Security purchased with cash collateral received for securities on loan. |
| ADR — | American Depositary Receipt |
| ETF — | Exchange traded fund |
| GDR — | Global Depositary Receipt |
| REIT — | Real Estate Investment Trust |
Below is a summary of the fund’s transactions with affiliated issuers during the period ended February 28, 2022:
| | VALUE AT
2/28/21 | PURCHASES | SALES | REALIZED
GAINS (LOSSES) | NET CHANGE
IN UNREALIZED
APPRECIATION
(DEPRECIATION) | VALUE AT
2/28/22 | BALANCE
OF SHARES
HELD AT
2/28/22 | DIVIDENDS
RECEIVED |
| COMMON STOCKS 0.1% OF NET ASSETS |
| |
| Diversified Financials 0.1% |
| The Charles Schwab Corp. | $370,567 | $127,014 | ($259,500) | $77,709 | $36,746 | $352,536 | 4,174 | $3,808 |
The following is a summary of the inputs used to value the fund’s investments as of February 28, 2022 (see financial note 2(a) for additional information):
| DESCRIPTION | QUOTED PRICES IN
ACTIVE MARKETS FOR
IDENTICAL ASSETS
(LEVEL 1) | OTHER SIGNIFICANT
OBSERVABLE INPUTS
(LEVEL 2) | SIGNIFICANT
UNOBSERVABLE INPUTS
(LEVEL 3) | TOTAL |
| Assets | | | | |
| Common Stocks1 | $406,720,586 | $— | $— | $406,720,586 |
| Media & Entertainment | 17,453,655 | — | 8,191 2 | 17,461,846 |
| Investment Companies1 | 274,624 | — | — | 274,624 |
| Short-Term Investments1 | 340,898 | — | — | 340,898 |
| Liabilities | | | | |
| Futures Contracts3 | (23,474) | — | — | (23,474) |
| Total | $424,766,289 | $— | $8,191 | $424,774,480 |
| 1 | As categorized in the Portfolio Holdings. |
| 2 | Trading in Russian securities listed on the Moscow Exchange, Russian ADRs, and Russian GDRs had ceased and suspended the fund’s ability to buy or sell these securities as of February 28, 2022. |
| 3 | Futures contracts are reported at cumulative unrealized appreciation or depreciation. |
Schwab Fundamental Index ETFs | Annual Report
Schwab Fundamental U.S. Broad Market Index ETF
Portfolio Holdings as of February 28, 2022 (continued)
Fund investments in mutual funds and ETFs are classified as Level 1, without consideration to the classification level of the underlying securities held by the mutual funds and ETFs, which could be Level 1, Level 2 or Level 3.
Schwab Fundamental Index ETFs | Annual Report
Schwab Fundamental U.S. Broad Market Index ETF
Statement of Assets and Liabilities
As of February 28, 2022
| Assets |
| Investments in securities, at value - affiliated (cost $169,309) | | $352,536 |
| Investments in securities, at value - unaffiliated (cost $310,031,038) including securities on loan of $182,762 | | 424,445,418 |
| Deposit with broker for futures contracts | | 57,500 |
| Receivables: | | |
| Dividends | | 868,799 |
| Income from securities on loan | + | 88 |
| Total assets | | 425,724,341 |
| Liabilities |
| Collateral held for securities on loan | | 186,600 |
| Payables: | | |
| Investments bought | | 112,866 |
| Management fees | | 81,945 |
| Variation margin on futures contracts | + | 2,400 |
| Total liabilities | | 383,811 |
| Net assets | | $425,340,530 |
| Net Assets by Source |
| Capital received from investors | | $327,846,854 |
| Total distributable earnings | + | 97,493,676 |
| Net assets | | $425,340,530 |
| Net Asset Value (NAV) |
| Net Assets | ÷ | Shares
Outstanding | = | NAV |
| $425,340,530 | | 7,550,000 | | $56.34 |
| | | | | |
| | | | | |
Schwab Fundamental Index ETFs | Annual Report
Schwab Fundamental U.S. Broad Market Index ETF
Statement of Operations
| For the period March 1, 2021 through February 28, 2022 |
| Investment Income |
| Dividends received from securities - unaffiliated (net of foreign withholding tax of $1,099) | | $7,732,615 |
| Dividends received from securities - affiliated | | 3,808 |
| Securities on loan, net | + | 4,781 |
| Total investment income | | 7,741,204 |
| Expenses |
| Management fees | | 948,944 |
| Total expenses | – | 948,944 |
| Net investment income | | 6,792,260 |
| REALIZED AND UNREALIZED GAINS (LOSSES) |
| Net realized gains on sales of securities - affiliated | | 27,830 |
| Net realized losses on sales of securities - unaffiliated | | (4,585,873) |
| Net realized gains on sales of in-kind redemptions - affiliated | | 49,879 |
| Net realized gains on sales of in-kind redemptions - unaffiliated | | 11,394,471 |
| Net realized gains on futures contracts | + | 57,109 |
| Net realized gains | | 6,943,416 |
| Net change in unrealized appreciation (depreciation) on securities - affiliated | | 36,746 |
| Net change in unrealized appreciation (depreciation) on securities - unaffiliated | | 44,224,233 |
| Net change in unrealized appreciation (depreciation) on futures contracts | + | (10,590) |
| Net change in unrealized appreciation (depreciation) | + | 44,250,389 |
| Net realized and unrealized gains | | 51,193,805 |
| Increase in net assets resulting from operations | | $57,986,065 |
Schwab Fundamental Index ETFs | Annual Report
Schwab Fundamental U.S. Broad Market Index ETF
Statement of Changes in Net Assets
For the current and prior report periods
| OPERATIONS |
| | 3/1/21-2/28/22 | 3/1/20-2/28/21 |
| Net investment income | | $6,792,260 | $5,688,763 |
| Net realized gains | | 6,943,416 | 14,112,119 |
| Net change in unrealized appreciation (depreciation) | + | 44,250,389 | 48,236,523 |
| Increase in net assets resulting from operations | | $57,986,065 | $68,037,405 |
| DISTRIBUTIONS TO SHAREHOLDERS |
| Total distributions | | ($6,475,295) | ($6,024,890) |
| TRANSACTIONS IN FUND SHARES |
| | 3/1/21-2/28/22 | 3/1/20-2/28/21 |
| | | SHARES | VALUE | SHARES | VALUE |
| Shares sold | | 1,950,000 | $105,060,157 | 500,000 | $20,303,160 |
| Shares redeemed | + | (300,000) | (15,956,138) | (1,650,000) | (59,607,587) |
| Net transactions in fund shares | | 1,650,000 | $89,104,019 | (1,150,000) | ($39,304,427) |
| SHARES OUTSTANDING AND NET ASSETS |
| | 3/1/21-2/28/22 | 3/1/20-2/28/21 |
| | | SHARES | NET ASSETS | SHARES | NET ASSETS |
| Beginning of period | | 5,900,000 | $284,725,741 | 7,050,000 | $262,017,653 |
| Total increase (decrease) | + | 1,650,000 | 140,614,789 | (1,150,000) | 22,708,088 |
| End of period | | 7,550,000 | $425,340,530 | 5,900,000 | $284,725,741 |
Schwab Fundamental Index ETFs | Annual Report
Schwab Fundamental U.S. Large Company Index ETF
Financial Statements
FINANCIAL HIGHLIGHTS
| | 3/1/21–
2/28/22 | 3/1/20–
2/28/21 | 3/1/19–
2/29/20 | 3/1/18–
2/28/19 | 3/1/17–
2/28/18 | |
| Per-Share Data |
| Net asset value at beginning of period | $48.49 | $37.67 | $37.83 | $37.20 | $33.91 | |
| Income (loss) from investment operations: | | | | | | |
| Net investment income (loss)1 | 1.02 | 0.98 | 0.99 | 0.87 | 0.78 | |
| Net realized and unrealized gains (losses) | 8.43 | 10.88 | (0.20) | 0.57 | 3.21 | |
| Total from investment operations | 9.45 | 11.86 | 0.79 | 1.44 | 3.99 | |
| Less distributions: | | | | | | |
| Distributions from net investment income | (0.96) | (1.04) | (0.95) | (0.81) | (0.70) | |
| Net asset value at end of period | $56.98 | $48.49 | $37.67 | $37.83 | $37.20 | |
| Total return | 19.61% | 32.40% | 1.98% | 3.92% | 11.91% | |
| Ratios/Supplemental Data |
| Ratios to average net assets: | | | | | | |
| Total expenses | 0.25% | 0.25% | 0.25% | 0.25% | 0.25% | |
| Net investment income (loss) | 1.84% | 2.49% | 2.47% | 2.33% | 2.22% | |
| Portfolio turnover rate2 | 11% | 13% | 12% | 11% | 9% | |
| Net assets, end of period (x 1,000) | $9,889,450 | $5,862,523 | $5,557,983 | $4,596,260 | $4,016,040 | |
| 1 | Calculated based on the average shares outstanding during the period. |
| 2 | Portfolio turnover rate excludes securities received or delivered from processing of in-kind creations or redemptions. |
Schwab Fundamental Index ETFs | Annual Report
Schwab Fundamental U.S. Large Company Index ETF
Portfolio Holdings as of February 28, 2022
This section shows all the securities in the fund’s portfolio and their values as of the report date.
The fund files its complete schedule of portfolio holdings with the U.S. Securities and Exchange Commission (SEC) for the first and third quarters of each fiscal year on Form N-PORT Part F. The fund’s Form N-PORT Part F is available on the SEC’s website at www.sec.gov. You can also obtain this information at no cost on the fund’s website at www.schwabassetmanagement.com/schwabetfs_prospectus, by calling 1-866-414-6349, or by sending an email request to orders@mysummaryprospectus.com.The fund also makes available its complete schedule of portfolio holdings on a daily basis on the fund’s website.
| SECURITY | NUMBER
OF SHARES | VALUE ($) |
| COMMON STOCKS 99.8% OF NET ASSETS |
| |
| Automobiles & Components 1.7% |
| Adient plc * | 77,655 | 3,475,061 |
| Aptiv plc * | 57,610 | 7,457,038 |
| Autoliv, Inc. | 40,919 | 3,601,281 |
| BorgWarner, Inc. | 149,820 | 6,144,118 |
| Dana, Inc. | 113,691 | 2,116,927 |
| Ford Motor Co. | 3,521,157 | 61,831,517 |
| General Motors Co. * | 1,025,643 | 47,918,041 |
| Gentex Corp. | 97,901 | 2,963,463 |
| Harley-Davidson, Inc. | 92,215 | 3,808,480 |
| Lear Corp. | 53,017 | 8,341,695 |
| Tesla, Inc. * | 3,395 | 2,955,110 |
| The Goodyear Tire & Rubber Co. * | 505,819 | 7,835,136 |
| Thor Industries, Inc. | 29,014 | 2,625,767 |
| Visteon Corp. * | 30,916 | 3,715,176 |
| | | 164,788,810 |
| |
| Banks 6.9% |
| Bank of America Corp. | 2,671,180 | 118,066,156 |
| Citigroup, Inc. | 1,633,808 | 96,770,448 |
| Citizens Financial Group, Inc. | 184,423 | 9,667,454 |
| Comerica, Inc. | 74,750 | 7,137,877 |
| Credicorp Ltd. | 40,346 | 6,102,332 |
| East West Bancorp, Inc. | 27,989 | 2,450,717 |
| Fifth Third Bancorp | 284,182 | 13,595,267 |
| First Republic Bank | 13,468 | 2,333,466 |
| Huntington Bancshares, Inc. | 404,113 | 6,271,834 |
| JPMorgan Chase & Co. | 1,057,172 | 149,906,990 |
| KeyCorp | 306,522 | 7,684,507 |
| M&T Bank Corp. | 66,029 | 12,032,465 |
| New York Community Bancorp, Inc. | 184,112 | 2,124,652 |
| PacWest Bancorp | 49,859 | 2,464,032 |
| People's United Financial, Inc. | 115,585 | 2,436,532 |
| Popular, Inc. | 29,637 | 2,722,158 |
| Regions Financial Corp. | 307,106 | 7,428,894 |
| SVB Financial Group * | 4,537 | 2,749,422 |
| The PNC Financial Services Group, Inc. | 147,229 | 29,335,378 |
| Truist Financial Corp. | 258,944 | 16,111,496 |
| U.S. Bancorp | 568,038 | 32,116,868 |
| Wells Fargo & Co. | 2,849,817 | 152,094,733 |
| Zions Bancorp NA | 68,432 | 4,851,144 |
| | | 686,454,822 |
| |
| Capital Goods 7.0% |
| 3M Co. | 201,017 | 29,881,177 |
| A.O. Smith Corp. | 36,329 | 2,491,443 |
| Acuity Brands, Inc. | 17,541 | 3,198,952 |
| AECOM | 73,316 | 5,327,141 |
| AerCap Holdings N.V. * | 105,536 | 5,744,325 |
| AGCO Corp. | 27,059 | 3,251,409 |
| Allegion plc | 15,508 | 1,775,976 |
| Allison Transmission Holdings, Inc. | 96,262 | 3,844,704 |
| SECURITY | NUMBER
OF SHARES | VALUE ($) |
| AMETEK, Inc. | 35,867 | 4,655,178 |
| Carlisle Cos., Inc. | 19,576 | 4,647,342 |
| Carrier Global Corp. | 317,857 | 14,265,422 |
| Caterpillar, Inc. | 155,539 | 29,176,006 |
| Cummins, Inc. | 68,823 | 14,048,151 |
| Curtiss-Wright Corp. | 16,414 | 2,421,393 |
| Deere & Co. | 58,233 | 20,965,045 |
| Donaldson Co., Inc. | 35,746 | 1,939,935 |
| Dover Corp. | 35,211 | 5,523,197 |
| Eaton Corp. plc | 136,953 | 21,130,478 |
| EMCOR Group, Inc. | 29,972 | 3,462,965 |
| Emerson Electric Co. | 207,805 | 19,309,241 |
| Fastenal Co. | 109,720 | 5,646,191 |
| Flowserve Corp. | 63,093 | 1,916,134 |
| Fluor Corp. * | 230,131 | 4,984,637 |
| Fortive Corp. | 49,448 | 3,201,758 |
| Fortune Brands Home & Security, Inc. | 42,257 | 3,672,133 |
| GATX Corp. | 21,572 | 2,300,222 |
| General Dynamics Corp. | 115,810 | 27,151,655 |
| General Electric Co. | 577,970 | 55,201,915 |
| Graco, Inc. | 25,672 | 1,850,694 |
| Hexcel Corp. | 41,882 | 2,424,968 |
| Honeywell International, Inc. | 175,650 | 33,329,588 |
| Howmet Aerospace, Inc. | 159,352 | 5,723,924 |
| Hubbell, Inc. | 16,276 | 2,901,197 |
| Huntington Ingalls Industries, Inc. | 23,387 | 4,780,303 |
| IDEX Corp. | 12,367 | 2,373,227 |
| Illinois Tool Works, Inc. | 79,748 | 17,252,682 |
| ITT, Inc. | 23,048 | 2,025,228 |
| Johnson Controls International plc | 217,901 | 14,154,849 |
| L3Harris Technologies, Inc. | 37,938 | 9,572,137 |
| Lennox International, Inc. | 6,455 | 1,723,033 |
| Lincoln Electric Holdings, Inc. | 19,137 | 2,439,202 |
| Lockheed Martin Corp. | 75,241 | 32,639,546 |
| Masco Corp. | 74,991 | 4,202,496 |
| MasTec, Inc. * | 21,443 | 1,688,851 |
| MDU Resources Group, Inc. | 93,735 | 2,509,286 |
| MSC Industrial Direct Co., Inc., Class A | 25,226 | 1,954,511 |
| Nordson Corp. | 9,866 | 2,234,550 |
| Northrop Grumman Corp. | 52,339 | 23,141,165 |
| nVent Electric plc | 61,081 | 2,072,478 |
| Oshkosh Corp. | 33,727 | 3,745,046 |
| Otis Worldwide Corp. | 70,493 | 5,521,717 |
| Owens Corning | 52,238 | 4,868,059 |
| PACCAR, Inc. | 163,047 | 14,969,345 |
| Parker-Hannifin Corp. | 34,372 | 10,187,517 |
| Pentair plc | 42,940 | 2,486,655 |
| Quanta Services, Inc. | 50,727 | 5,526,199 |
| Raytheon Technologies Corp. | 320,587 | 32,924,285 |
| Regal Rexnord Corp. | 20,910 | 3,352,919 |
| Rockwell Automation, Inc. | 24,554 | 6,545,605 |
| Roper Technologies, Inc. | 11,516 | 5,161,702 |
| Sensata Technologies Holding plc * | 45,018 | 2,606,992 |
| Snap-on, Inc. | 20,690 | 4,348,624 |
| Spirit AeroSystems Holdings, Inc., Class A | 108,100 | 5,405,000 |
| Stanley Black & Decker, Inc. | 41,577 | 6,764,578 |
Schwab Fundamental Index ETFs | Annual Report
Schwab Fundamental U.S. Large Company Index ETF
Portfolio Holdings as of February 28, 2022 (continued)
| SECURITY | NUMBER
OF SHARES | VALUE ($) |
| Textron, Inc. | 107,301 | 7,846,922 |
| The Boeing Co. * | 223,914 | 45,978,501 |
| The Toro Co. | 19,648 | 1,843,179 |
| Trane Technologies plc | 44,215 | 6,806,015 |
| TransDigm Group, Inc. * | 9,714 | 6,475,255 |
| UFP Industries, Inc. | 30,877 | 2,647,703 |
| United Rentals, Inc. * | 26,975 | 8,675,700 |
| Univar Solutions, Inc. * | 97,600 | 2,997,296 |
| W.W. Grainger, Inc. | 16,304 | 7,777,986 |
| Watsco, Inc. | 9,408 | 2,568,949 |
| WESCO International, Inc. * | 33,268 | 4,049,714 |
| Westinghouse Air Brake Technologies Corp. | 36,879 | 3,423,109 |
| Xylem, Inc. | 27,118 | 2,412,146 |
| | | 690,044,758 |
| |
| Commercial & Professional Services 0.8% |
| ABM Industries, Inc. | 47,126 | 2,112,659 |
| Booz Allen Hamilton Holding Corp. | 32,482 | 2,620,973 |
| CACI International, Inc., Class A * | 8,460 | 2,367,023 |
| Cintas Corp. | 13,889 | 5,212,819 |
| Copart, Inc. * | 16,373 | 2,011,914 |
| CoreCivic, Inc. * | 228,332 | 2,080,105 |
| Equifax, Inc. | 13,011 | 2,840,822 |
| Jacobs Engineering Group, Inc. | 43,510 | 5,351,730 |
| KBR, Inc. | 53,312 | 2,646,408 |
| Kelly Services, Inc., Class A | 90,487 | 1,920,134 |
| Leidos Holdings, Inc. | 57,368 | 5,842,357 |
| ManpowerGroup, Inc. | 71,117 | 7,558,315 |
| Nielsen Holdings plc | 226,025 | 3,937,355 |
| Republic Services, Inc. | 55,628 | 6,690,936 |
| Robert Half International, Inc. | 46,923 | 5,644,368 |
| Science Applications International Corp. | 26,971 | 2,365,087 |
| Verisk Analytics, Inc. | 13,926 | 2,469,637 |
| Waste Management, Inc. | 105,161 | 15,185,248 |
| | | 78,857,890 |
| |
| Consumer Durables & Apparel 1.3% |
| Brunswick Corp. | 28,787 | 2,749,734 |
| Capri Holdings Ltd. * | 79,861 | 5,409,784 |
| Carter's, Inc. | 26,121 | 2,525,378 |
| D.R. Horton, Inc. | 106,101 | 9,061,025 |
| Garmin Ltd. | 25,496 | 2,815,778 |
| Hanesbrands, Inc. | 201,999 | 3,120,885 |
| Hasbro, Inc. | 35,779 | 3,472,352 |
| Leggett & Platt, Inc. | 64,494 | 2,391,438 |
| Lennar Corp., Class A | 93,258 | 8,382,029 |
| Lululemon Athletica, Inc. * | 8,283 | 2,650,063 |
| Mattel, Inc. * | 95,120 | 2,376,098 |
| Mohawk Industries, Inc. * | 29,370 | 4,134,709 |
| Newell Brands, Inc. | 152,846 | 3,630,092 |
| NIKE, Inc., Class B | 163,662 | 22,348,046 |
| NVR, Inc. * | 1,084 | 5,374,949 |
| Polaris, Inc. | 24,383 | 2,962,778 |
| PulteGroup, Inc. | 141,759 | 7,039,752 |
| PVH Corp. | 53,849 | 5,271,279 |
| Ralph Lauren Corp. | 28,251 | 3,730,262 |
| Skechers U.S.A., Inc., Class A * | 48,813 | 2,244,422 |
| Tapestry, Inc. | 112,589 | 4,604,890 |
| Taylor Morrison Home Corp. * | 64,707 | 1,908,856 |
| Toll Brothers, Inc. | 55,028 | 2,985,819 |
| Tri Pointe Homes, Inc. * | 87,791 | 1,963,885 |
| Under Armour, Inc., Class A * | 46,047 | 823,781 |
| Under Armour, Inc., Class C * | 47,950 | 749,459 |
| VF Corp. | 109,046 | 6,326,849 |
| SECURITY | NUMBER
OF SHARES | VALUE ($) |
| Whirlpool Corp. | 37,548 | 7,557,286 |
| | | 128,611,678 |
| |
| Consumer Services 2.1% |
| Aramark | 133,405 | 4,930,649 |
| Booking Holdings, Inc. * | 10,670 | 23,177,907 |
| Carnival Corp. * | 457,861 | 9,308,314 |
| Chipotle Mexican Grill, Inc. * | 2,352 | 3,582,919 |
| Cracker Barrel Old Country Store, Inc. | 14,412 | 1,935,099 |
| Darden Restaurants, Inc. | 31,264 | 4,540,158 |
| Domino's Pizza, Inc. | 8,703 | 3,761,524 |
| Expedia Group, Inc. * | 35,627 | 6,986,811 |
| H&R Block, Inc. | 94,344 | 2,340,675 |
| Hilton Worldwide Holdings, Inc. * | 47,510 | 7,072,339 |
| Las Vegas Sands Corp. * | 176,273 | 7,555,061 |
| Marriott International, Inc., Class A * | 56,615 | 9,632,476 |
| Marriott Vacations Worldwide Corp. | 12,554 | 2,017,051 |
| McDonald's Corp. | 180,367 | 44,148,431 |
| MGM Resorts International | 178,993 | 7,927,600 |
| Norwegian Cruise Line Holdings Ltd. * | 193,572 | 3,772,718 |
| Royal Caribbean Cruises Ltd. * | 99,443 | 8,027,039 |
| Service Corp. International | 38,094 | 2,318,020 |
| Six Flags Entertainment Corp. * | 50,846 | 2,219,936 |
| Starbucks Corp. | 281,929 | 25,878,263 |
| The Wendy's Co. | 88,243 | 2,006,646 |
| Travel & Leisure Co. | 45,172 | 2,531,891 |
| Vail Resorts, Inc. | 6,729 | 1,753,241 |
| Wynn Resorts Ltd. * | 33,699 | 2,915,637 |
| Yum China Holdings, Inc. | 89,060 | 4,632,901 |
| Yum! Brands, Inc. | 80,713 | 9,893,799 |
| | | 204,867,105 |
| |
| Diversified Financials 6.0% |
| Affiliated Managers Group, Inc. | 18,630 | 2,577,647 |
| AGNC Investment Corp. | 150,179 | 1,938,811 |
| Ally Financial, Inc. | 242,109 | 12,081,239 |
| American Express Co. | 220,927 | 42,979,139 |
| Ameriprise Financial, Inc. | 46,907 | 14,062,250 |
| Annaly Capital Management, Inc. | 363,469 | 2,529,744 |
| Berkshire Hathaway, Inc., Class B * | 568,055 | 182,601,280 |
| BlackRock, Inc. | 24,266 | 18,051,235 |
| Capital One Financial Corp. | 244,676 | 37,501,491 |
| Cboe Global Markets, Inc. | 17,404 | 2,041,315 |
| CME Group, Inc. | 41,081 | 9,716,889 |
| Discover Financial Services | 177,677 | 21,932,449 |
| Equitable Holdings, Inc. | 110,461 | 3,607,656 |
| Evercore, Inc., Class A | 15,642 | 1,986,690 |
| Franklin Resources, Inc. | 246,124 | 7,317,267 |
| Intercontinental Exchange, Inc. | 70,264 | 9,002,224 |
| Invesco Ltd. | 212,643 | 4,516,537 |
| Jackson Financial, Inc., Class A | 18,256 | 746,488 |
| Janus Henderson Group plc | 53,529 | 1,796,969 |
| Jefferies Financial Group, Inc. | 80,479 | 2,860,224 |
| KKR & Co., Inc. | 86,461 | 5,198,035 |
| Lazard Ltd., Class A | 52,672 | 1,821,398 |
| LPL Financial Holdings, Inc. | 20,537 | 3,716,170 |
| Moody's Corp. | 16,329 | 5,258,428 |
| Morgan Stanley | 354,527 | 32,169,780 |
| MSCI, Inc. | 4,777 | 2,396,573 |
| Nasdaq, Inc. | 15,042 | 2,574,438 |
| Navient Corp. | 302,643 | 5,329,543 |
| New Residential Investment Corp. | 336,111 | 3,488,832 |
| Northern Trust Corp. | 55,731 | 6,347,761 |
| OneMain Holdings, Inc. | 38,327 | 1,953,910 |
| PROG Holdings, Inc. * | 39,660 | 1,215,182 |
| Raymond James Financial, Inc. | 40,843 | 4,478,435 |
Schwab Fundamental Index ETFs | Annual Report
Schwab Fundamental U.S. Large Company Index ETF
Portfolio Holdings as of February 28, 2022 (continued)
| SECURITY | NUMBER
OF SHARES | VALUE ($) |
| S&P Global, Inc. | 38,942 | 14,630,470 |
| SEI Investments Co. | 37,230 | 2,180,933 |
| Starwood Property Trust, Inc. | 93,158 | 2,220,887 |
| State Street Corp. | 124,237 | 10,601,143 |
| Synchrony Financial | 503,357 | 21,533,612 |
| T. Rowe Price Group, Inc. | 60,593 | 8,759,324 |
| The Bank of New York Mellon Corp. | 409,996 | 21,791,287 |
| The Charles Schwab Corp. (a) | 104,791 | 8,850,648 |
| The Goldman Sachs Group, Inc. | 115,556 | 39,438,107 |
| Voya Financial, Inc. | 41,237 | 2,777,312 |
| | | 588,579,752 |
| |
| Energy 9.9% |
| Antero Resources Corp. * | 202,344 | 4,639,748 |
| APA Corp. | 155,241 | 5,531,237 |
| Baker Hughes Co. | 556,368 | 16,346,092 |
| Cheniere Energy, Inc. | 31,300 | 4,159,770 |
| Chevron Corp. | 1,267,152 | 182,469,888 |
| ConocoPhillips | 665,152 | 63,096,319 |
| Coterra Energy, Inc. | 209,730 | 4,893,001 |
| Delek US Holdings, Inc. * | 136,125 | 2,345,434 |
| Devon Energy Corp. | 122,776 | 7,311,311 |
| Diamondback Energy, Inc. | 44,401 | 6,131,778 |
| DTE Midstream LLC * | 33,250 | 1,765,575 |
| EOG Resources, Inc. | 186,976 | 21,487,282 |
| Exxon Mobil Corp. | 3,474,041 | 272,434,295 |
| Halliburton Co. | 431,684 | 14,474,364 |
| Helmerich & Payne, Inc. | 131,094 | 4,749,536 |
| Hess Corp. | 46,265 | 4,675,541 |
| HollyFrontier Corp. * | 273,942 | 8,341,534 |
| Kinder Morgan, Inc. | 1,153,467 | 20,070,326 |
| Marathon Oil Corp. | 556,293 | 12,549,970 |
| Marathon Petroleum Corp. | 720,853 | 56,132,823 |
| Murphy Oil Corp. | 127,563 | 4,422,609 |
| Nabors Industries Ltd. * | 23,296 | 2,924,580 |
| NOV, Inc. | 579,966 | 9,946,417 |
| Occidental Petroleum Corp. | 625,303 | 27,344,500 |
| ONEOK, Inc. | 171,741 | 11,214,687 |
| Ovintiv, Inc. | 97,837 | 4,485,826 |
| Patterson-UTI Energy, Inc. | 263,186 | 3,797,774 |
| PBF Energy, Inc., Class A * | 451,491 | 7,503,780 |
| Peabody Energy Corp. * | 313,394 | 5,434,252 |
| Phillips 66 | 616,462 | 51,930,759 |
| Pioneer Natural Resources Co. | 42,060 | 10,077,576 |
| Schlumberger N.V. | 866,799 | 34,013,193 |
| Targa Resources Corp. | 136,140 | 8,899,472 |
| TechnipFMC plc * | 472,606 | 3,237,351 |
| The Williams Cos., Inc. | 463,526 | 14,499,093 |
| Transocean Ltd. * | 724,699 | 2,565,434 |
| Valero Energy Corp. | 687,453 | 57,409,200 |
| World Fuel Services Corp. | 274,488 | 7,778,990 |
| | | 981,091,317 |
| |
| Food & Staples Retailing 3.0% |
| Casey's General Stores, Inc. | 18,370 | 3,455,030 |
| Costco Wholesale Corp. | 117,185 | 60,848,311 |
| Performance Food Group Co. * | 149,711 | 8,389,805 |
| Rite Aid Corp. * | 150,974 | 1,382,922 |
| SpartanNash Co. | 108,343 | 3,048,772 |
| Sprouts Farmers Market, Inc. * | 84,294 | 2,400,693 |
| Sysco Corp. | 197,510 | 17,203,121 |
| The Kroger Co. | 826,918 | 38,699,762 |
| United Natural Foods, Inc. * | 92,077 | 3,704,258 |
| US Foods Holding Corp. * | 212,559 | 8,308,931 |
| Walgreens Boots Alliance, Inc. | 1,038,069 | 47,844,600 |
| SECURITY | NUMBER
OF SHARES | VALUE ($) |
| Walmart, Inc. | 763,825 | 103,238,587 |
| | | 298,524,792 |
| |
| Food, Beverage & Tobacco 4.2% |
| Altria Group, Inc. | 864,182 | 44,323,895 |
| Archer-Daniels-Midland Co. | 497,959 | 39,064,884 |
| Bunge Ltd. | 143,518 | 15,004,807 |
| Campbell Soup Co. | 73,456 | 3,303,316 |
| Coca-Cola Europacific Partners plc | 102,789 | 5,263,825 |
| Conagra Brands, Inc. | 169,520 | 5,928,114 |
| Constellation Brands, Inc., Class A | 33,181 | 7,154,487 |
| Darling Ingredients, Inc. * | 30,658 | 2,222,092 |
| Flowers Foods, Inc. | 91,666 | 2,512,565 |
| General Mills, Inc. | 219,134 | 14,776,206 |
| Hormel Foods Corp. | 98,929 | 4,712,978 |
| Ingredion, Inc. | 48,920 | 4,341,161 |
| Kellogg Co. | 97,258 | 6,218,677 |
| Keurig Dr Pepper, Inc. | 101,442 | 3,922,762 |
| McCormick & Co., Inc. Non-Voting Shares | 38,771 | 3,689,836 |
| Molson Coors Beverage Co., Class B | 134,768 | 7,032,194 |
| Mondelez International, Inc., Class A | 477,881 | 31,291,648 |
| Monster Beverage Corp. * | 51,226 | 4,323,474 |
| PepsiCo, Inc. | 363,227 | 59,474,789 |
| Philip Morris International, Inc. | 479,635 | 48,476,709 |
| Post Holdings, Inc. * | 21,246 | 2,233,804 |
| Sanderson Farms, Inc. | 14,140 | 2,525,263 |
| The Coca-Cola Co. | 857,937 | 53,397,999 |
| The Hershey Co. | 25,217 | 5,100,390 |
| The J.M. Smucker Co. | 56,323 | 7,589,524 |
| The Kraft Heinz Co. | 328,647 | 12,889,535 |
| Tyson Foods, Inc., Class A | 238,416 | 22,091,627 |
| | | 418,866,561 |
| |
| Health Care Equipment & Services 6.3% |
| Abbott Laboratories | 214,923 | 25,924,012 |
| Align Technology, Inc. * | 3,192 | 1,632,580 |
| AmerisourceBergen Corp. | 89,450 | 12,749,308 |
| Anthem, Inc. | 124,789 | 56,385,910 |
| Baxter International, Inc. | 132,370 | 11,247,479 |
| Becton Dickinson & Co. | 43,400 | 11,773,552 |
| Boston Scientific Corp. * | 149,724 | 6,613,309 |
| Cardinal Health, Inc. | 406,321 | 21,945,397 |
| Centene Corp. * | 220,638 | 18,229,112 |
| Cerner Corp. | 93,004 | 8,672,623 |
| Cigna Corp. | 108,385 | 25,771,785 |
| CVS Health Corp. | 869,218 | 90,094,446 |
| DaVita, Inc. * | 57,535 | 6,488,222 |
| Dentsply Sirona, Inc. | 60,185 | 3,258,416 |
| Edwards Lifesciences Corp. * | 32,971 | 3,704,951 |
| Encompass Health Corp. | 32,555 | 2,149,281 |
| Envista Holdings Corp. * | 55,556 | 2,666,688 |
| HCA Healthcare, Inc. | 86,425 | 21,633,042 |
| Henry Schein, Inc. * | 65,317 | 5,642,082 |
| Hologic, Inc. * | 39,029 | 2,777,694 |
| Humana, Inc. | 66,791 | 29,008,667 |
| Intuitive Surgical, Inc. * | 16,196 | 4,702,185 |
| Laboratory Corp. of America Holdings * | 24,465 | 6,636,376 |
| McKesson Corp. | 126,809 | 34,867,403 |
| Medtronic plc | 353,290 | 37,091,917 |
| Molina Healthcare, Inc. * | 17,166 | 5,267,730 |
| Patterson Cos., Inc. | 67,655 | 2,022,885 |
| Quest Diagnostics, Inc. | 52,974 | 6,953,897 |
| ResMed, Inc. | 11,547 | 2,849,222 |
| STERIS plc | 16,202 | 3,888,480 |
| Stryker Corp. | 45,454 | 11,970,311 |
Schwab Fundamental Index ETFs | Annual Report
Schwab Fundamental U.S. Large Company Index ETF
Portfolio Holdings as of February 28, 2022 (continued)
| SECURITY | NUMBER
OF SHARES | VALUE ($) |
| Tenet Healthcare Corp. * | 57,849 | 4,974,436 |
| The Cooper Cos., Inc. | 5,054 | 2,067,187 |
| UnitedHealth Group, Inc. | 249,642 | 118,797,139 |
| Universal Health Services, Inc., Class B | 50,432 | 7,258,678 |
| Zimmer Biomet Holdings, Inc. | 42,618 | 5,420,583 |
| | | 623,136,985 |
| |
| Household & Personal Products 1.3% |
| Church & Dwight Co., Inc. | 50,251 | 4,917,060 |
| Colgate-Palmolive Co. | 191,152 | 14,709,146 |
| Kimberly-Clark Corp. | 83,243 | 10,834,077 |
| Nu Skin Enterprises, Inc., Class A | 38,506 | 1,786,293 |
| The Clorox Co. | 29,007 | 4,228,931 |
| The Estee Lauder Cos., Inc., Class A | 22,797 | 6,755,435 |
| The Procter & Gamble Co. | 572,289 | 89,214,132 |
| | | 132,445,074 |
| |
| Insurance 3.8% |
| Aflac, Inc. | 327,383 | 19,999,827 |
| Alleghany Corp. * | 5,260 | 3,481,699 |
| American Financial Group, Inc. | 22,665 | 3,068,614 |
| American International Group, Inc. | 840,799 | 51,490,531 |
| Aon plc, Class A | 46,676 | 13,635,927 |
| Arch Capital Group Ltd. * | 82,287 | 3,876,541 |
| Arthur J. Gallagher & Co. | 27,809 | 4,399,106 |
| Assurant, Inc. | 15,343 | 2,603,860 |
| Assured Guaranty Ltd. | 72,249 | 4,477,270 |
| Axis Capital Holdings Ltd. | 38,584 | 2,107,458 |
| Brown & Brown, Inc. | 35,370 | 2,391,366 |
| Chubb Ltd. | 122,065 | 24,857,317 |
| Cincinnati Financial Corp. | 41,848 | 5,138,516 |
| CNO Financial Group, Inc. | 101,105 | 2,443,708 |
| Everest Re Group Ltd. | 16,203 | 4,832,059 |
| Fidelity National Financial, Inc. | 116,344 | 5,542,628 |
| First American Financial Corp. | 49,799 | 3,338,525 |
| Genworth Financial, Inc., Class A * | 755,553 | 3,067,545 |
| Globe Life, Inc. | 40,399 | 4,078,683 |
| Lincoln National Corp. | 107,750 | 7,264,505 |
| Loews Corp. | 126,237 | 7,743,378 |
| Markel Corp. * | 3,100 | 3,853,021 |
| Marsh & McLennan Cos., Inc. | 93,139 | 14,474,732 |
| MetLife, Inc. | 392,564 | 26,517,698 |
| Old Republic International Corp. | 148,683 | 3,917,797 |
| Primerica, Inc. | 13,485 | 1,751,567 |
| Principal Financial Group, Inc. | 114,835 | 8,111,944 |
| Prudential Financial, Inc. | 256,489 | 28,639,562 |
| Reinsurance Group of America, Inc. | 37,692 | 4,178,535 |
| The Allstate Corp. | 175,519 | 21,476,505 |
| The Hanover Insurance Group, Inc. | 17,685 | 2,467,234 |
| The Hartford Financial Services Group, Inc. | 177,273 | 12,316,928 |
| The Progressive Corp. | 144,711 | 15,329,236 |
| The Travelers Cos., Inc. | 193,963 | 33,328,662 |
| Unum Group | 219,210 | 6,120,343 |
| W.R. Berkley Corp. | 43,042 | 3,886,693 |
| Willis Towers Watson plc | 22,083 | 4,909,051 |
| | | 371,118,571 |
| |
| Materials 3.3% |
| Air Products and Chemicals, Inc. | 38,480 | 9,092,824 |
| Albemarle Corp. | 17,950 | 3,516,225 |
| Alcoa Corp. | 147,458 | 11,109,486 |
| AptarGroup, Inc. | 14,621 | 1,782,007 |
| Arconic Corp. * | 114,662 | 3,520,123 |
| Ashland Global Holdings, Inc. | 21,032 | 1,940,833 |
| SECURITY | NUMBER
OF SHARES | VALUE ($) |
| Avery Dennison Corp. | 17,822 | 3,140,236 |
| Axalta Coating Systems Ltd. * | 63,629 | 1,720,528 |
| Ball Corp. | 45,828 | 4,112,605 |
| Berry Global Group, Inc. * | 44,439 | 2,695,225 |
| Celanese Corp. | 41,805 | 5,822,600 |
| CF Industries Holdings, Inc. | 93,187 | 7,565,852 |
| Commercial Metals Co. | 77,123 | 2,973,092 |
| Corteva, Inc. | 161,553 | 8,405,603 |
| Crown Holdings, Inc. | 28,532 | 3,500,020 |
| Dow, Inc. | 284,890 | 16,797,114 |
| DuPont de Nemours, Inc. | 297,254 | 22,998,542 |
| Eastman Chemical Co. | 70,168 | 8,312,803 |
| Ecolab, Inc. | 50,079 | 8,826,925 |
| FMC Corp. | 19,144 | 2,244,634 |
| Freeport-McMoRan, Inc. | 134,332 | 6,306,887 |
| Graphic Packaging Holding Co. | 159,955 | 3,291,874 |
| Huntsman Corp. | 131,984 | 5,337,433 |
| International Flavors & Fragrances, Inc. | 23,699 | 3,151,967 |
| International Paper Co. | 238,333 | 10,374,635 |
| Linde plc * | 99,665 | 29,225,765 |
| LyondellBasell Industries N.V., Class A | 186,416 | 18,125,228 |
| Martin Marietta Materials, Inc. | 12,078 | 4,582,393 |
| Newmont Corp. | 145,403 | 9,625,679 |
| Nucor Corp. | 165,141 | 21,735,858 |
| O-I Glass, Inc. * | 195,875 | 2,503,282 |
| Olin Corp. | 65,666 | 3,382,456 |
| Packaging Corp. of America | 37,486 | 5,517,564 |
| PPG Industries, Inc. | 77,368 | 10,324,760 |
| Reliance Steel & Aluminum Co. | 47,163 | 9,002,002 |
| RPM International, Inc. | 32,173 | 2,720,871 |
| Sealed Air Corp. | 69,261 | 4,649,491 |
| Sonoco Products Co. | 48,997 | 2,877,104 |
| Steel Dynamics, Inc. | 115,796 | 8,172,882 |
| Sylvamo Corp. * | 21,676 | 756,492 |
| The Chemours Co. | 90,331 | 2,493,136 |
| The Mosaic Co. | 182,327 | 9,559,405 |
| The Sherwin-Williams Co. | 27,512 | 7,239,233 |
| United States Steel Corp. | 188,608 | 5,132,024 |
| Vulcan Materials Co. | 22,275 | 4,041,799 |
| Westrock Co. | 214,427 | 9,707,110 |
| | | 329,914,607 |
| |
| Media & Entertainment 4.1% |
| Activision Blizzard, Inc. | 100,976 | 8,229,544 |
| Alphabet, Inc., Class A * | 27,085 | 73,160,377 |
| Alphabet, Inc., Class C * | 26,109 | 70,437,382 |
| Altice USA, Inc., Class A * | 169,261 | 1,956,657 |
| Charter Communications, Inc., Class A * | 38,441 | 23,133,025 |
| Cinemark Holdings, Inc. * | 106,280 | 1,864,151 |
| Comcast Corp., Class A | 1,518,062 | 70,984,579 |
| Discovery, Inc., Class A *(b) | 67,799 | 1,901,762 |
| Discovery, Inc., Class C * | 120,754 | 3,377,489 |
| DISH Network Corp., Class A * | 102,610 | 3,279,416 |
| Electronic Arts, Inc. | 57,641 | 7,498,518 |
| Fox Corp., Class A | 139,286 | 5,826,333 |
| Fox Corp., Class B | 66,187 | 2,532,315 |
| Liberty Media Corp. - Liberty SiriusXM, Class A * | 57,514 | 2,896,405 |
| Liberty Media Corp. - Liberty SiriusXM, Class C * | 122,787 | 6,178,642 |
| Loyalty Ventures, Inc. * | 26,988 | 647,712 |
| Match Group, Inc. * | 13,989 | 1,559,634 |
| Meta Platforms, Inc., Class A * | 202,577 | 42,749,824 |
| Netflix, Inc. * | 7,422 | 2,928,128 |
| News Corp., Class A | 146,615 | 3,272,447 |
| News Corp., Class B | 45,354 | 1,017,290 |
| Omnicom Group, Inc. | 99,220 | 8,323,566 |
Schwab Fundamental Index ETFs | Annual Report
Schwab Fundamental U.S. Large Company Index ETF
Portfolio Holdings as of February 28, 2022 (continued)
| SECURITY | NUMBER
OF SHARES | VALUE ($) |
| Paramount Global, Class B | 247,515 | 7,576,434 |
| The Interpublic Group of Cos., Inc. | 129,694 | 4,772,739 |
| The Walt Disney Co. * | 347,930 | 51,653,688 |
| Twitter, Inc. * | 35,411 | 1,258,861 |
| | | 409,016,918 |
| |
| Pharmaceuticals, Biotechnology & Life Sciences 6.0% |
| AbbVie, Inc. | 428,011 | 63,247,185 |
| Agilent Technologies, Inc. | 36,951 | 4,816,932 |
| Amgen, Inc. | 211,618 | 47,927,245 |
| Biogen, Inc. * | 56,255 | 11,870,368 |
| Bristol-Myers Squibb Co. | 478,321 | 32,846,303 |
| Danaher Corp. | 46,558 | 12,775,981 |
| Eli Lilly & Co. | 73,251 | 18,309,087 |
| Gilead Sciences, Inc. | 844,542 | 51,010,337 |
| ICON plc * | 13,411 | 3,191,952 |
| Illumina, Inc. * | 8,237 | 2,690,204 |
| IQVIA Holdings, Inc. * | 36,223 | 8,335,637 |
| Jazz Pharmaceuticals plc * | 17,898 | 2,459,543 |
| Johnson & Johnson | 667,091 | 109,783,166 |
| Merck & Co., Inc. | 806,929 | 61,794,623 |
| Mettler-Toledo International, Inc. * | 2,418 | 3,406,333 |
| Organon & Co. | 90,680 | 3,385,084 |
| Perrigo Co., plc | 81,483 | 2,894,276 |
| Pfizer, Inc. | 2,246,885 | 105,468,782 |
| Regeneron Pharmaceuticals, Inc. * | 11,705 | 7,237,904 |
| Thermo Fisher Scientific, Inc. | 38,775 | 21,093,600 |
| United Therapeutics Corp. * | 14,254 | 2,369,015 |
| Vertex Pharmaceuticals, Inc. * | 10,025 | 2,305,951 |
| Viatris, Inc. | 560,930 | 6,175,839 |
| Waters Corp. * | 12,213 | 3,868,223 |
| Zoetis, Inc. | 34,064 | 6,596,494 |
| | | 595,860,064 |
| |
| Real Estate 2.1% |
| Alexandria Real Estate Equities, Inc. | 12,783 | 2,421,100 |
| American Tower Corp. | 41,764 | 9,474,999 |
| Apartment Income REIT Corp. | 40,873 | 2,109,456 |
| Apple Hospitality REIT, Inc. | 140,963 | 2,493,635 |
| AvalonBay Communities, Inc. | 24,377 | 5,816,108 |
| Boston Properties, Inc. | 43,542 | 5,325,622 |
| Brixmor Property Group, Inc. | 116,234 | 2,919,798 |
| Camden Property Trust | 15,957 | 2,634,660 |
| CBRE Group, Inc., Class A | 84,632 | 8,196,609 |
| Crown Castle International Corp. | 52,561 | 8,756,137 |
| Digital Realty Trust, Inc. | 32,837 | 4,430,368 |
| DigitalBridge Group, Inc. * | 390,034 | 2,827,747 |
| Diversified Healthcare Trust | 625,070 | 1,800,202 |
| Duke Realty Corp. | 42,976 | 2,277,728 |
| Equinix, Inc. | 9,374 | 6,653,009 |
| Equity Residential | 76,583 | 6,532,530 |
| Essex Property Trust, Inc. | 10,367 | 3,288,101 |
| Extra Space Storage, Inc. | 14,779 | 2,780,669 |
| Healthpeak Properties, Inc. | 131,979 | 4,099,268 |
| Host Hotels & Resorts, Inc. * | 487,438 | 8,905,492 |
| Invitation Homes, Inc. | 63,258 | 2,391,152 |
| Iron Mountain, Inc. | 110,169 | 5,418,111 |
| Jones Lang LaSalle, Inc. * | 23,018 | 5,667,492 |
| Kimco Realty Corp. | 167,711 | 3,946,240 |
| Lamar Advertising Co., Class A | 21,409 | 2,334,866 |
| Mid-America Apartment Communities, Inc. | 17,773 | 3,636,534 |
| Omega Healthcare Investors, Inc. | 57,219 | 1,611,859 |
| Orion Office REIT, Inc. * | 8,450 | 143,904 |
| Park Hotels & Resorts, Inc. * | 184,225 | 3,470,799 |
| Prologis, Inc. | 51,186 | 7,465,478 |
| SECURITY | NUMBER
OF SHARES | VALUE ($) |
| Public Storage | 18,097 | 6,424,797 |
| Realogy Holdings Corp. * | 174,761 | 3,177,155 |
| Realty Income Corp. | 86,781 | 5,735,356 |
| Regency Centers Corp. | 32,720 | 2,155,921 |
| RLJ Lodging Trust | 147,796 | 2,067,666 |
| Service Properties Trust | 271,216 | 2,340,594 |
| Simon Property Group, Inc. | 84,698 | 11,651,057 |
| SL Green Realty Corp. | 39,181 | 3,115,673 |
| The Macerich Co. | 140,916 | 2,156,015 |
| UDR, Inc. | 45,547 | 2,499,164 |
| Ventas, Inc. | 163,138 | 8,809,452 |
| Vornado Realty Trust | 82,816 | 3,584,276 |
| Welltower, Inc. | 123,399 | 10,277,903 |
| Weyerhaeuser Co. | 274,005 | 10,653,314 |
| WP Carey, Inc. | 29,947 | 2,317,898 |
| | | 206,795,914 |
| |
| Retailing 4.3% |
| Advance Auto Parts, Inc. | 23,578 | 4,821,229 |
| Amazon.com, Inc. * | 19,271 | 59,186,251 |
| American Eagle Outfitters, Inc. | 88,364 | 1,862,713 |
| Asbury Automotive Group, Inc. * | 11,501 | 2,232,459 |
| AutoNation, Inc. * | 40,147 | 4,603,255 |
| AutoZone, Inc. * | 3,233 | 6,024,340 |
| Bath & Body Works, Inc. | 76,509 | 4,083,285 |
| Bed Bath & Beyond, Inc. * | 228,059 | 3,851,916 |
| Best Buy Co., Inc. | 129,581 | 12,522,708 |
| Big Lots, Inc. | 42,321 | 1,471,078 |
| Burlington Stores, Inc. * | 8,345 | 1,885,052 |
| CarMax, Inc. * | 55,088 | 6,022,771 |
| Dick's Sporting Goods, Inc. | 32,629 | 3,426,045 |
| Dollar General Corp. | 72,584 | 14,396,311 |
| Dollar Tree, Inc. * | 76,777 | 10,908,476 |
| eBay, Inc. | 244,635 | 13,354,625 |
| Foot Locker, Inc. | 87,101 | 2,754,134 |
| GameStop Corp., Class A *(b) | 21,967 | 2,709,410 |
| Genuine Parts Co. | 59,167 | 7,227,841 |
| Group 1 Automotive, Inc. | 16,503 | 3,002,391 |
| Kohl's Corp. | 230,579 | 12,824,804 |
| Lithia Motors, Inc. | 8,602 | 2,931,734 |
| LKQ Corp. | 105,790 | 4,966,840 |
| Lowe's Cos., Inc. | 165,691 | 36,627,652 |
| Macy's, Inc. | 608,922 | 15,783,258 |
| Murphy USA, Inc. | 26,003 | 4,699,782 |
| Nordstrom, Inc. * | 135,803 | 2,816,554 |
| O'Reilly Automotive, Inc. * | 16,342 | 10,609,880 |
| Penske Automotive Group, Inc. | 26,061 | 2,561,536 |
| Qurate Retail, Inc., Class A | 582,256 | 3,208,231 |
| Ross Stores, Inc. | 79,515 | 7,266,876 |
| Signet Jewelers Ltd. | 32,628 | 2,300,274 |
| Target Corp. | 179,093 | 35,777,409 |
| The Gap, Inc. | 171,103 | 2,489,549 |
| The Home Depot, Inc. | 216,410 | 68,348,770 |
| The ODP Corp. * | 87,333 | 3,842,652 |
| The TJX Cos., Inc. | 352,911 | 23,327,417 |
| Tractor Supply Co. | 26,948 | 5,491,733 |
| Ulta Beauty, Inc. * | 10,438 | 3,909,031 |
| Urban Outfitters, Inc. * | 57,869 | 1,591,976 |
| Victoria's Secret & Co. * | 25,887 | 1,388,320 |
| Williams-Sonoma, Inc. | 18,792 | 2,722,209 |
| | | 421,832,777 |
| |
| Semiconductors & Semiconductor Equipment 3.6% |
| Advanced Micro Devices, Inc. * | 81,140 | 10,007,876 |
| Analog Devices, Inc. | 73,719 | 11,816,419 |
| Applied Materials, Inc. | 154,436 | 20,725,311 |
Schwab Fundamental Index ETFs | Annual Report
Schwab Fundamental U.S. Large Company Index ETF
Portfolio Holdings as of February 28, 2022 (continued)
| SECURITY | NUMBER
OF SHARES | VALUE ($) |
| Broadcom, Inc. | 57,726 | 33,910,561 |
| Intel Corp. | 2,093,013 | 99,836,720 |
| KLA Corp. | 20,038 | 6,983,243 |
| Lam Research Corp. | 18,657 | 10,473,107 |
| Marvell Technology, Inc. | 53,285 | 3,640,964 |
| Microchip Technology, Inc. | 54,548 | 3,836,361 |
| Micron Technology, Inc. | 381,542 | 33,903,822 |
| NVIDIA Corp. | 65,025 | 15,856,346 |
| NXP Semiconductor N.V. | 52,143 | 9,913,427 |
| ON Semiconductor Corp. * | 79,956 | 5,006,045 |
| Qorvo, Inc. * | 28,025 | 3,833,260 |
| QUALCOMM, Inc. | 263,206 | 45,268,800 |
| Skyworks Solutions, Inc. | 42,171 | 5,826,767 |
| Teradyne, Inc. | 20,974 | 2,473,254 |
| Texas Instruments, Inc. | 173,260 | 29,452,467 |
| | | 352,764,750 |
| |
| Software & Services 5.6% |
| Accenture plc, Class A | 96,377 | 30,457,060 |
| Adobe, Inc. * | 21,516 | 10,062,603 |
| Akamai Technologies, Inc. * | 33,336 | 3,608,955 |
| Alliance Data Systems Corp. | 68,834 | 4,642,853 |
| Amdocs Ltd. | 61,038 | 4,803,691 |
| ANSYS, Inc. * | 5,755 | 1,865,713 |
| Autodesk, Inc. * | 6,801 | 1,497,784 |
| Automatic Data Processing, Inc. | 67,458 | 13,791,114 |
| Broadridge Financial Solutions, Inc. | 21,224 | 3,103,161 |
| Cadence Design Systems, Inc. * | 18,106 | 2,741,792 |
| CDK Global, Inc. | 60,085 | 2,724,254 |
| Check Point Software Technologies Ltd. * | 27,905 | 4,042,876 |
| Citrix Systems, Inc. | 42,987 | 4,406,168 |
| Cognizant Technology Solutions Corp., Class A | 231,067 | 19,901,801 |
| DXC Technology Co. * | 208,584 | 7,098,114 |
| Fidelity National Information Services, Inc. | 77,175 | 7,349,375 |
| Fiserv, Inc. * | 47,264 | 4,616,275 |
| FleetCor Technologies, Inc. * | 14,572 | 3,412,762 |
| Genpact Ltd. | 50,381 | 2,107,941 |
| Global Payments, Inc. | 25,515 | 3,403,191 |
| International Business Machines Corp. | 535,735 | 65,632,895 |
| Intuit, Inc. | 18,901 | 8,966,067 |
| Jack Henry & Associates, Inc. | 13,974 | 2,470,603 |
| Kyndryl Holdings, Inc. * | 113,674 | 1,802,870 |
| Mastercard, Inc., Class A | 69,703 | 25,150,236 |
| Maximus, Inc. | 25,538 | 2,013,927 |
| Microsoft Corp. | 664,118 | 198,431,817 |
| NCR Corp. * | 67,487 | 2,734,573 |
| NortonLifeLock, Inc. | 201,350 | 5,835,123 |
| Oracle Corp. | 571,767 | 43,437,139 |
| Paychex, Inc. | 53,724 | 6,396,379 |
| PayPal Holdings, Inc. * | 53,718 | 6,012,656 |
| Sabre Corp. * | 248,845 | 2,719,876 |
| salesforce.com, Inc. * | 27,404 | 5,769,364 |
| SS&C Technologies Holdings, Inc. | 27,235 | 2,041,808 |
| Synopsys, Inc. * | 9,353 | 2,921,784 |
| Teradata Corp. * | 43,112 | 2,155,169 |
| The Western Union Co. | 218,913 | 3,979,838 |
| VeriSign, Inc. * | 9,213 | 1,969,002 |
| Visa, Inc., Class A | 144,881 | 31,311,682 |
| | | 557,390,291 |
| |
| Technology Hardware & Equipment 7.3% |
| Amphenol Corp., Class A | 87,957 | 6,685,611 |
| Apple Inc. | 2,666,279 | 440,255,988 |
| Arrow Electronics, Inc. * | 70,193 | 8,555,123 |
| SECURITY | NUMBER
OF SHARES | VALUE ($) |
| Avnet, Inc. | 239,640 | 10,081,655 |
| CDW Corp. | 30,906 | 5,330,049 |
| Cisco Systems, Inc. | 1,743,556 | 97,238,118 |
| Corning, Inc. | 458,890 | 18,539,156 |
| Dell Technologies, Inc., Class C * | 42,980 | 2,190,261 |
| F5, Inc. * | 17,716 | 3,558,259 |
| Flex Ltd. * | 332,134 | 5,476,890 |
| Hewlett Packard Enterprise Co. | 1,552,984 | 24,723,505 |
| HP, Inc. | 548,822 | 18,857,524 |
| Insight Enterprises, Inc. * | 20,470 | 2,128,880 |
| Jabil, Inc. | 102,847 | 5,945,585 |
| Juniper Networks, Inc. | 229,590 | 7,757,846 |
| Keysight Technologies, Inc. * | 12,979 | 2,042,505 |
| Motorola Solutions, Inc. | 32,182 | 7,093,878 |
| NetApp, Inc. | 95,168 | 7,459,268 |
| Sanmina Corp. * | 76,435 | 3,040,584 |
| Seagate Technology Holdings plc | 102,019 | 10,524,280 |
| TD SYNNEX Corp. | 20,242 | 2,061,243 |
| TE Connectivity Ltd. | 84,378 | 12,017,958 |
| Teledyne Technologies, Inc. * | 8,741 | 3,753,211 |
| Trimble, Inc. * | 27,237 | 1,899,781 |
| Western Digital Corp. * | 193,695 | 9,866,823 |
| Xerox Holdings Corp. | 226,149 | 4,457,397 |
| Zebra Technologies Corp., Class A * | 3,882 | 1,604,586 |
| | | 723,145,964 |
| |
| Telecommunication Services 3.4% |
| AT&T, Inc. | 6,465,712 | 153,172,717 |
| Liberty Global plc, Class A * | 137,496 | 3,544,647 |
| Liberty Global plc, Class C * | 288,804 | 7,471,359 |
| Lumen Technologies, Inc. | 1,463,971 | 15,166,740 |
| Telephone and Data Systems, Inc. | 165,535 | 2,872,032 |
| T-Mobile US, Inc. * | 102,637 | 12,645,905 |
| Verizon Communications, Inc. | 2,527,879 | 135,671,266 |
| | | 330,544,666 |
| |
| Transportation 2.1% |
| American Airlines Group, Inc. * | 226,652 | 3,909,747 |
| Avis Budget Group, Inc. * | 53,407 | 9,796,980 |
| C.H. Robinson Worldwide, Inc. | 75,054 | 7,256,221 |
| CSX Corp. | 698,060 | 23,671,214 |
| Delta Air Lines, Inc. * | 151,910 | 6,064,247 |
| Expeditors International of Washington, Inc. | 53,634 | 5,543,610 |
| FedEx Corp. | 106,032 | 23,567,733 |
| GXO Logistics, Inc. * | 31,284 | 2,625,666 |
| J.B. Hunt Transport Services, Inc. | 25,389 | 5,152,190 |
| Kirby Corp. * | 31,385 | 2,044,733 |
| Knight-Swift Transportation Holdings, Inc. | 48,978 | 2,668,321 |
| Landstar System, Inc. | 14,720 | 2,272,915 |
| Norfolk Southern Corp. | 72,448 | 18,584,361 |
| Old Dominion Freight Line, Inc. | 12,474 | 3,917,210 |
| Ryder System, Inc. | 62,594 | 4,934,911 |
| Southwest Airlines Co. * | 100,681 | 4,409,828 |
| Union Pacific Corp. | 205,687 | 50,588,718 |
| United Airlines Holdings, Inc. * | 94,197 | 4,182,347 |
| United Parcel Service, Inc., Class B | 130,940 | 27,552,395 |
| XPO Logistics, Inc. * | 33,573 | 2,440,086 |
| | | 211,183,433 |
| |
| Utilities 3.7% |
| Alliant Energy Corp. | 69,211 | 4,041,922 |
| Ameren Corp. | 85,597 | 7,357,062 |
| American Electric Power Co., Inc. | 195,887 | 17,757,157 |
Schwab Fundamental Index ETFs | Annual Report
Schwab Fundamental U.S. Large Company Index ETF
Portfolio Holdings as of February 28, 2022 (continued)
| SECURITY | NUMBER
OF SHARES | VALUE ($) |
| American Water Works Co., Inc. | 28,967 | 4,376,624 |
| Atmos Energy Corp. | 36,489 | 4,006,857 |
| CenterPoint Energy, Inc. | 266,200 | 7,280,570 |
| CMS Energy Corp. | 100,733 | 6,447,919 |
| Consolidated Edison, Inc. | 177,052 | 15,185,750 |
| Constellation Energy Corp. | 198,866 | 9,143,859 |
| Dominion Energy, Inc. | 268,572 | 21,359,531 |
| DTE Energy Co. | 70,023 | 8,514,097 |
| Duke Energy Corp. | 317,448 | 31,874,954 |
| Edison International | 166,681 | 10,570,909 |
| Entergy Corp. | 81,395 | 8,563,568 |
| Evergy, Inc. | 147,363 | 9,196,925 |
| Eversource Energy | 104,755 | 8,568,959 |
| Exelon Corp. | 597,492 | 25,429,259 |
| FirstEnergy Corp. | 300,754 | 12,586,555 |
| NextEra Energy, Inc. | 327,049 | 25,598,125 |
| NiSource, Inc. | 166,697 | 4,822,544 |
| NRG Energy, Inc. | 98,602 | 3,731,100 |
| OGE Energy Corp. | 88,407 | 3,319,683 |
| PG&E Corp. * | 258,484 | 2,938,963 |
| Pinnacle West Capital Corp. | 58,459 | 4,140,651 |
| Portland General Electric Co. | 45,582 | 2,314,198 |
| PPL Corp. | 435,272 | 11,391,068 |
| Public Service Enterprise Group, Inc. | 193,914 | 12,571,445 |
| Sempra Energy | 90,719 | 13,083,494 |
| Southwest Gas Holdings, Inc. | 30,512 | 2,164,521 |
| The AES Corp. | 327,097 | 6,944,269 |
| The Southern Co. | 404,972 | 26,230,036 |
| UGI Corp. | 102,268 | 3,931,182 |
| Vistra Corp. | 391,929 | 8,943,820 |
| WEC Energy Group, Inc. | 91,035 | 8,273,261 |
| Xcel Energy, Inc. | 174,508 | 11,749,624 |
| | | 364,410,461 |
Total Common Stocks
(Cost $8,117,962,984) | 9,870,247,960 |
| | | |
| SHORT-TERM INVESTMENTS 0.1% OF NET ASSETS |
| |
| Money Market Funds 0.1% |
| State Street Institutional U.S. Government Money Market Fund, Premier Class 0.03% (c) | 7,471,770 | 7,471,770 |
| State Street Institutional U.S. Government Money Market Fund, Premier Class 0.03% (c)(d) | 3,896,800 | 3,896,800 |
| | | 11,368,570 |
Total Short-Term Investments
(Cost $11,368,570) | 11,368,570 |
Total Investments in Securities
(Cost $8,129,331,554) | 9,881,616,530 |
| | NUMBER OF
CONTRACTS | NOTIONAL
AMOUNT
($) | CURRENT VALUE/
UNREALIZED
DEPRECIATION
($) |
| FUTURES CONTRACTS |
| Long | | | |
| S&P 500 Index, e-mini, expires 03/18/22 | 85 | 18,564,000 | (245,433) |
| * | Non-income producing security. |
| (a) | Issuer is affiliated with the fund’s investment adviser. |
| (b) | All or a portion of this security is on loan. Securities on loan were valued at $3,885,136. |
| (c) | The rate shown is the 7-day yield. |
| (d) | Security purchased with cash collateral received for securities on loan. |
| REIT — | Real Estate Investment Trust |
Below is a summary of the fund’s transactions with affiliated issuers during the period ended February 28, 2022:
| | VALUE AT
2/28/21 | PURCHASES | SALES | REALIZED
GAINS (LOSSES) | NET CHANGE
IN UNREALIZED
APPRECIATION
(DEPRECIATION) | VALUE AT
2/28/22 | BALANCE
OF SHARES
HELD AT
2/28/22 | DIVIDENDS
RECEIVED |
| COMMON STOCKS 0.1% OF NET ASSETS |
| |
| Diversified Financials 0.1% |
| The Charles Schwab Corp. | $8,403,178 | $4,411,830 | ($6,390,137) | $1,521,579 | $904,198 | $8,850,648 | 104,791 | $83,768 |
Schwab Fundamental Index ETFs | Annual Report
Schwab Fundamental U.S. Large Company Index ETF
Portfolio Holdings as of February 28, 2022 (continued)
The following is a summary of the inputs used to value the fund’s investments as of February 28, 2022 (see financial note 2(a) for additional information):
| DESCRIPTION | QUOTED PRICES IN
ACTIVE MARKETS FOR
IDENTICAL ASSETS
(LEVEL 1) | OTHER SIGNIFICANT
OBSERVABLE INPUTS
(LEVEL 2) | SIGNIFICANT
UNOBSERVABLE INPUTS
(LEVEL 3) | TOTAL |
| Assets | | | | |
| Common Stocks1 | $9,870,247,960 | $— | $— | $9,870,247,960 |
| Short-Term Investments1 | 11,368,570 | — | — | 11,368,570 |
| Liabilities | | | | |
| Futures Contracts2 | (245,433) | — | — | (245,433) |
| Total | $9,881,371,097 | $— | $— | $9,881,371,097 |
| 1 | As categorized in the Portfolio Holdings. |
| 2 | Futures contracts are reported at cumulative unrealized appreciation or depreciation. |
Fund investments in mutual funds are classified as Level 1, without consideration to the classification level of the underlying securities held by the mutual funds, which could be Level 1, Level 2 or Level 3.
Schwab Fundamental Index ETFs | Annual Report
Schwab Fundamental U.S. Large Company Index ETF
Statement of Assets and Liabilities
As of February 28, 2022
| Assets |
| Investments in securities, at value - affiliated (cost $5,247,139) | | $8,850,648 |
| Investments in securities, at value - unaffiliated (cost $8,124,084,415) including securities on loan of $3,885,136 | | 9,872,765,882 |
| Deposit with broker for futures contracts | | 1,414,499 |
| Receivables: | | |
| Investments sold | | 84,000,603 |
| Fund shares sold | | 82,625,768 |
| Dividends | | 21,131,309 |
| Income from securities on loan | + | 1,912 |
| Total assets | | 10,070,790,621 |
| Liabilities |
| Collateral held for securities on loan | | 3,896,800 |
| Payables: | | |
| Investments bought | | 89,646,374 |
| Fund shares redeemed | | 85,844,226 |
| Management fees | | 1,909,197 |
| Variation margin on futures contracts | + | 44,278 |
| Total liabilities | | 181,340,875 |
| Net assets | | $9,889,449,746 |
| Net Assets by Source |
| Capital received from investors | | $8,456,981,798 |
| Total distributable earnings | + | 1,432,467,948 |
| Net assets | | $9,889,449,746 |
| Net Asset Value (NAV) |
| Net Assets | ÷ | Shares
Outstanding | = | NAV |
| $9,889,449,746 | | 173,550,000 | | $56.98 |
| | | | | |
| | | | | |
Schwab Fundamental Index ETFs | Annual Report
Schwab Fundamental U.S. Large Company Index ETF
Statement of Operations
| For the period March 1, 2021 through February 28, 2022 |
| Investment Income |
| Dividends received from securities - unaffiliated (net of foreign withholding tax of $18,965) | | $160,141,226 |
| Dividends received from securities - affiliated | | 83,768 |
| Securities on loan, net | + | 26,860 |
| Total investment income | | 160,251,854 |
| Expenses |
| Management fees | | 19,208,020 |
| Total expenses | – | 19,208,020 |
| Net investment income | | 141,043,834 |
| REALIZED AND UNREALIZED GAINS (LOSSES) |
| Net realized gains on sales of securities - affiliated | | 310,676 |
| Net realized losses on sales of securities - unaffiliated | | (104,766,775) |
| Net realized gains on sales of in-kind redemptions - affiliated | | 1,210,903 |
| Net realized gains on sales of in-kind redemptions - unaffiliated | | 496,763,671 |
| Net realized gains on futures contracts | + | 379,888 |
| Net realized gains | | 393,898,363 |
| Net change in unrealized appreciation (depreciation) on securities - affiliated | | 904,198 |
| Net change in unrealized appreciation (depreciation) on securities - unaffiliated | | 629,162,157 |
| Net change in unrealized appreciation (depreciation) on futures contracts | + | 31,343 |
| Net change in unrealized appreciation (depreciation) | + | 630,097,698 |
| Net realized and unrealized gains | | 1,023,996,061 |
| Increase in net assets resulting from operations | | $1,165,039,895 |
Schwab Fundamental Index ETFs | Annual Report
Schwab Fundamental U.S. Large Company Index ETF
Statement of Changes in Net Assets
For the current and prior report periods
| OPERATIONS |
| | 3/1/21-2/28/22 | 3/1/20-2/28/21 |
| Net investment income | | $141,043,834 | $126,653,300 |
| Net realized gains | | 393,898,363 | 422,934,207 |
| Net change in unrealized appreciation (depreciation) | + | 630,097,698 | 883,468,597 |
| Increase in net assets resulting from operations | | $1,165,039,895 | $1,433,056,104 |
| DISTRIBUTIONS TO SHAREHOLDERS |
| Total distributions | | ($130,197,615) | ($134,608,220) |
| TRANSACTIONS IN FUND SHARES |
| | 3/1/21-2/28/22 | 3/1/20-2/28/21 |
| | | SHARES | VALUE | SHARES | VALUE |
| Shares sold | | 71,200,000 | $4,014,710,303 | 30,500,000 | $1,133,770,691 |
| Shares redeemed | + | (18,550,000) | (1,022,625,679) | (57,150,000) | (2,127,678,557) |
| Net transactions in fund shares | | 52,650,000 | $2,992,084,624 | (26,650,000) | ($993,907,866) |
| SHARES OUTSTANDING AND NET ASSETS |
| | 3/1/21-2/28/22 | 3/1/20-2/28/21 |
| | | SHARES | NET ASSETS | SHARES | NET ASSETS |
| Beginning of period | | 120,900,000 | $5,862,522,842 | 147,550,000 | $5,557,982,824 |
| Total increase (decrease) | + | 52,650,000 | 4,026,926,904 | (26,650,000) | 304,540,018 |
| End of period | | 173,550,000 | $9,889,449,746 | 120,900,000 | $5,862,522,842 |
Schwab Fundamental Index ETFs | Annual Report
Schwab Fundamental U.S. Small Company Index ETF
Financial Statements
FINANCIAL HIGHLIGHTS
| | 3/1/21–
2/28/22 | 3/1/20–
2/28/21 | 3/1/19–
2/29/20 | 3/1/18–
2/28/19 | 3/1/17–
2/28/18 | |
| Per-Share Data |
| Net asset value at beginning of period | $48.75 | $34.73 | $38.08 | $36.90 | $34.89 | |
| Income (loss) from investment operations: | | | | | | |
| Net investment income (loss)1 | 0.65 | 0.49 | 0.55 | 0.59 | 0.52 | |
| Net realized and unrealized gains (losses) | 4.26 | 14.09 | (3.34) | 1.14 | 1.98 | |
| Total from investment operations | 4.91 | 14.58 | (2.79) | 1.73 | 2.50 | |
| Less distributions: | | | | | | |
| Distributions from net investment income | (0.64) | (0.56) | (0.56) | (0.55) | (0.49) | |
| Net asset value at end of period | $53.02 | $48.75 | $34.73 | $38.08 | $36.90 | |
| Total return | 10.06% | 42.73% | (7.46%) | 4.69% | 7.22% | |
| Ratios/Supplemental Data |
| Ratios to average net assets: | | | | | | |
| Total expenses | 0.25% | 0.25% | 0.25% | 0.25% | 0.25% | |
| Net investment income (loss) | 1.21% | 1.40% | 1.43% | 1.53% | 1.45% | |
| Portfolio turnover rate2 | 25% | 24% | 26% | 23% | 21% | |
| Net assets, end of period (x 1,000) | $4,843,112 | $4,085,618 | $3,424,710 | $3,402,783 | $2,782,002 | |
| 1 | Calculated based on the average shares outstanding during the period. |
| 2 | Portfolio turnover rate excludes securities received or delivered from processing of in-kind creations or redemptions. |
Schwab Fundamental Index ETFs | Annual Report
Schwab Fundamental U.S. Small Company Index ETF
Portfolio Holdings as of February 28, 2022
This section shows all the securities in the fund’s portfolio and their values as of the report date.
The fund files its complete schedule of portfolio holdings with the U.S. Securities and Exchange Commission (SEC) for the first and third quarters of each fiscal year on Form N-PORT Part F. The fund’s Form N-PORT Part F is available on the SEC’s website at www.sec.gov. You can also obtain this information at no cost on the fund’s website at www.schwabassetmanagement.com/schwabetfs_prospectus, by calling 1-866-414-6349, or by sending an email request to orders@mysummaryprospectus.com.The fund also makes available its complete schedule of portfolio holdings on a daily basis on the fund’s website.
| SECURITY | NUMBER
OF SHARES | VALUE ($) |
| COMMON STOCKS 99.9% OF NET ASSETS |
| |
| Automobiles & Components 1.4% |
| American Axle & Manufacturing Holdings, Inc. * | 1,159,849 | 10,740,202 |
| Cooper-Standard Holding, Inc. * | 331,099 | 4,211,579 |
| Dorman Products, Inc. * | 47,283 | 4,417,178 |
| Fox Factory Holding Corp. * | 16,493 | 1,946,504 |
| Gentherm, Inc. * | 62,010 | 5,260,928 |
| LCI Industries | 54,236 | 6,753,467 |
| Modine Manufacturing Co. * | 290,026 | 2,929,263 |
| Patrick Industries, Inc. | 50,635 | 3,612,301 |
| Standard Motor Products, Inc. | 90,669 | 3,963,142 |
| Stoneridge, Inc. * | 100,915 | 1,666,107 |
| Tenneco, Inc., Class A * | 785,094 | 15,136,612 |
| Veoneer, Inc. * | 91,925 | 3,258,741 |
| Winnebago Industries, Inc. | 73,021 | 4,678,455 |
| | | 68,574,479 |
| |
| Banks 10.0% |
| Ameris Bancorp | 44,492 | 2,202,354 |
| Associated Banc-Corp. | 358,927 | 8,754,230 |
| Atlantic Union Bankshares Corp. | 87,495 | 3,554,922 |
| Axos Financial, Inc. * | 54,728 | 2,995,811 |
| Bank of Hawaii Corp. | 75,430 | 6,500,557 |
| Bank OZK | 174,839 | 8,220,930 |
| BankUnited, Inc. | 208,940 | 9,235,148 |
| Banner Corp. | 68,260 | 4,205,499 |
| Berkshire Hills Bancorp, Inc. | 86,854 | 2,701,159 |
| BOK Financial Corp. | 50,266 | 5,162,318 |
| Brookline Bancorp, Inc. | 133,251 | 2,283,922 |
| Cadence Bank | 286,922 | 9,072,474 |
| Capitol Federal Financial, Inc. | 287,353 | 3,137,895 |
| Cathay General Bancorp | 134,092 | 6,306,347 |
| Central Pacific Financial Corp. | 86,245 | 2,517,492 |
| City Holding Co. | 22,529 | 1,794,885 |
| Columbia Banking System, Inc. | 119,343 | 4,371,534 |
| Commerce Bancshares, Inc. | 113,000 | 8,111,140 |
| Community Bank System, Inc. | 53,310 | 3,888,431 |
| Cullen/Frost Bankers, Inc. | 74,565 | 10,493,532 |
| CVB Financial Corp. | 166,995 | 3,937,742 |
| Eagle Bancorp, Inc. | 40,989 | 2,456,061 |
| Essent Group Ltd. | 118,244 | 5,224,020 |
| F.N.B. Corp. | 710,249 | 9,538,644 |
| Federal Agricultural Mortgage Corp., Class C | 25,496 | 3,153,855 |
| First BanCorp | 280,948 | 3,966,986 |
| First Busey Corp. | 81,278 | 2,231,081 |
| First Citizens BancShares, Inc., Class A | 34,773 | 27,416,772 |
| First Commonwealth Financial Corp. | 164,311 | 2,653,623 |
| First Financial Bancorp | 151,796 | 3,731,146 |
| First Financial Bankshares, Inc. | 60,643 | 2,906,013 |
| First Hawaiian, Inc. | 279,954 | 8,138,263 |
| First Horizon Corp. | 570,728 | 13,400,693 |
| SECURITY | NUMBER
OF SHARES | VALUE ($) |
| First Interstate BancSystem, Inc., Class A | 177,580 | 7,209,748 |
| First Merchants Corp. | 62,733 | 2,743,941 |
| Flagstar Bancorp, Inc. | 92,380 | 4,210,680 |
| Fulton Financial Corp. | 368,549 | 6,641,253 |
| Glacier Bancorp, Inc. | 85,215 | 4,720,911 |
| Hancock Whitney Corp. | 149,569 | 8,328,002 |
| Hanmi Financial Corp. | 85,937 | 2,244,674 |
| Heartland Financial USA, Inc. | 43,533 | 2,160,107 |
| Hilltop Holdings, Inc. | 109,562 | 3,387,657 |
| Home BancShares, Inc. | 233,882 | 5,475,178 |
| Hope Bancorp, Inc. | 297,660 | 5,048,314 |
| Independent Bank Corp. | 34,919 | 3,003,383 |
| Independent Bank Group, Inc. | 28,059 | 2,164,752 |
| International Bancshares Corp. | 94,500 | 4,064,445 |
| Investors Bancorp, Inc. | 624,048 | 10,446,564 |
| MGIC Investment Corp. | 786,415 | 11,937,780 |
| National Bank Holdings Corp., Class A | 45,980 | 2,040,592 |
| NBT Bancorp, Inc. | 78,697 | 3,019,604 |
| Northwest Bancshares, Inc. | 211,636 | 2,979,835 |
| OFG Bancorp | 110,032 | 3,100,702 |
| Old National Bancorp | 525,674 | 9,609,323 |
| Pacific Premier Bancorp, Inc. | 48,735 | 1,886,532 |
| Park National Corp. | 21,990 | 2,947,979 |
| PennyMac Financial Services, Inc. | 42,053 | 2,428,561 |
| Pinnacle Financial Partners, Inc. | 54,414 | 5,500,167 |
| Prosperity Bancshares, Inc. | 105,185 | 7,832,075 |
| Provident Financial Services, Inc. | 126,847 | 3,010,079 |
| Radian Group, Inc. | 486,677 | 11,631,580 |
| Renasant Corp. | 74,565 | 2,722,368 |
| S&T Bancorp, Inc. | 75,372 | 2,343,316 |
| Sandy Spring Bancorp, Inc. | 52,513 | 2,472,837 |
| ServisFirst Bancshares, Inc. | 31,031 | 2,711,489 |
| Signature Bank | 39,014 | 13,455,539 |
| Simmons First National Corp., Class A | 144,604 | 4,124,106 |
| Southside Bancshares, Inc. | 44,178 | 1,841,781 |
| SouthState Corp. | 57,662 | 5,189,580 |
| Synovus Financial Corp. | 246,251 | 12,965,115 |
| Texas Capital Bancshares, Inc. * | 74,944 | 4,991,270 |
| The Bank of NT Butterfield & Son Ltd. | 89,026 | 3,418,598 |
| Tompkins Financial Corp. | 23,036 | 1,822,148 |
| Towne Bank | 87,786 | 2,737,168 |
| Trustmark Corp. | 138,007 | 4,345,840 |
| UMB Financial Corp. | 49,164 | 5,007,845 |
| Umpqua Holdings Corp. | 529,637 | 11,307,750 |
| United Bankshares, Inc. | 162,814 | 5,962,249 |
| United Community Banks, Inc. | 92,946 | 3,593,292 |
| Valley National Bancorp | 506,238 | 7,072,145 |
| Walker & Dunlop, Inc. | 46,644 | 6,453,197 |
| Washington Federal, Inc. | 213,516 | 7,596,899 |
| Webster Financial Corp. | 256,203 | 15,425,983 |
| WesBanco, Inc. | 92,945 | 3,396,210 |
| Westamerica BanCorp | 33,076 | 1,962,068 |
| Western Alliance Bancorp | 56,774 | 5,321,995 |
| Wintrust Financial Corp. | 86,059 | 8,550,822 |
Schwab Fundamental Index ETFs | Annual Report
Schwab Fundamental U.S. Small Company Index ETF
Portfolio Holdings as of February 28, 2022 (continued)
| SECURITY | NUMBER
OF SHARES | VALUE ($) |
| WSFS Financial Corp. | 46,150 | 2,345,805 |
| | | 483,177,312 |
| |
| Capital Goods 11.7% |
| AAON, Inc. | 33,871 | 1,983,486 |
| AAR Corp. * | 146,839 | 6,598,945 |
| Advanced Drainage Systems, Inc. | 21,044 | 2,456,256 |
| Aerojet Rocketdyne Holdings, Inc. | 90,897 | 3,522,259 |
| Air Lease Corp. | 243,432 | 10,165,720 |
| Alamo Group, Inc. | 19,932 | 2,772,740 |
| Albany International Corp., Class A | 49,313 | 4,330,668 |
| Altra Industrial Motion Corp. | 73,271 | 3,111,819 |
| American Woodmark Corp. * | 56,653 | 3,035,468 |
| API Group Corp. * | 196,189 | 4,231,797 |
| Apogee Enterprises, Inc. | 120,983 | 5,452,704 |
| Applied Industrial Technologies, Inc. | 94,807 | 9,584,988 |
| Arcosa, Inc. | 147,390 | 7,763,031 |
| Argan, Inc. | 56,300 | 2,189,507 |
| Armstrong World Industries, Inc. | 67,891 | 6,001,564 |
| Astec Industries, Inc. | 67,860 | 3,379,428 |
| Astronics Corp. * | 148,335 | 2,182,008 |
| Atkore, Inc. * | 39,824 | 4,050,499 |
| AZZ, Inc. | 79,196 | 3,898,819 |
| Barnes Group, Inc. | 147,629 | 6,857,367 |
| Beacon Roofing Supply, Inc. * | 152,171 | 9,083,087 |
| Boise Cascade Co. | 179,864 | 14,378,328 |
| Builders FirstSource, Inc. * | 213,997 | 15,925,657 |
| BWX Technologies, Inc. | 147,268 | 7,867,057 |
| Chart Industries, Inc. * | 18,536 | 2,676,598 |
| CIRCOR International, Inc. * | 59,448 | 1,601,529 |
| Colfax Corp. * | 194,158 | 7,807,093 |
| Columbus McKinnon Corp. | 49,476 | 2,258,085 |
| Comfort Systems USA, Inc. | 75,085 | 6,455,808 |
| Crane Co. | 98,848 | 9,991,556 |
| CSW Industrials, Inc. | 14,399 | 1,732,632 |
| Douglas Dynamics, Inc. | 55,487 | 2,038,592 |
| Dycom Industries, Inc. * | 119,201 | 10,377,639 |
| Encore Wire Corp. | 61,768 | 7,191,031 |
| Enerpac Tool Group Corp. | 103,219 | 1,780,528 |
| EnerSys | 107,209 | 7,797,311 |
| EnPro Industries, Inc. | 47,089 | 5,200,509 |
| ESCO Technologies, Inc. | 33,548 | 2,333,934 |
| Evoqua Water Technologies Corp. * | 60,645 | 2,587,116 |
| Federal Signal Corp. | 103,003 | 3,719,438 |
| Franklin Electric Co., Inc. | 67,648 | 5,720,315 |
| Generac Holdings, Inc. * | 19,903 | 6,278,799 |
| Gibraltar Industries, Inc. * | 50,023 | 2,417,111 |
| GMS, Inc. * | 118,241 | 6,414,574 |
| GrafTech International Ltd. | 145,961 | 1,471,287 |
| Granite Construction, Inc. | 226,574 | 6,858,395 |
| Great Lakes Dredge & Dock Corp. * | 126,751 | 1,788,457 |
| Griffon Corp. | 149,996 | 3,457,408 |
| H&E Equipment Services, Inc. | 142,712 | 5,959,653 |
| HEICO Corp. | 23,182 | 3,419,577 |
| HEICO Corp., Class A | 39,541 | 4,860,380 |
| Helios Technologies, Inc. | 25,512 | 2,000,396 |
| Herc Holdings, Inc. | 51,843 | 8,249,258 |
| Hillenbrand, Inc. | 143,780 | 6,859,744 |
| Hyster-Yale Materials Handling, Inc. | 51,081 | 1,955,381 |
| Ingersoll Rand, Inc. | 126,124 | 6,371,784 |
| JELD-WEN Holding, Inc. * | 208,597 | 4,814,419 |
| John Bean Technologies Corp. | 30,626 | 3,472,070 |
| Kadant, Inc. | 12,138 | 2,395,434 |
| Kaman Corp. | 107,569 | 4,669,570 |
| Kennametal, Inc. | 203,637 | 6,457,329 |
| Kratos Defense & Security Solutions, Inc. * | 73,112 | 1,529,503 |
| SECURITY | NUMBER
OF SHARES | VALUE ($) |
| Lindsay Corp. | 16,198 | 2,125,340 |
| Masonite International Corp. * | 62,953 | 5,938,356 |
| Matrix Service Co. * | 321,874 | 2,233,806 |
| Maxar Technologies, Inc. | 129,652 | 4,205,911 |
| McGrath RentCorp | 49,875 | 4,053,840 |
| Mercury Systems, Inc. * | 39,931 | 2,404,645 |
| Meritor, Inc. * | 246,384 | 8,773,734 |
| Moog, Inc., Class A | 120,062 | 9,978,353 |
| MRC Global, Inc. * | 582,393 | 5,882,169 |
| Mueller Industries, Inc. | 191,445 | 10,921,937 |
| Mueller Water Products, Inc., Class A | 303,846 | 3,855,806 |
| MYR Group, Inc. * | 45,181 | 4,054,995 |
| National Presto Industries, Inc. | 21,693 | 1,724,593 |
| NOW, Inc. * | 924,952 | 8,639,052 |
| Parsons Corp. * | 51,262 | 1,776,741 |
| PGT Innovations, Inc. * | 92,966 | 1,999,699 |
| Primoris Services Corp. | 226,915 | 5,983,749 |
| Proto Labs, Inc. * | 31,882 | 1,792,725 |
| Quanex Building Products Corp. | 126,575 | 2,893,504 |
| RBC Bearings, Inc. * | 20,595 | 3,992,341 |
| Resideo Technologies, Inc. * | 336,566 | 8,663,209 |
| Rush Enterprises, Inc., Class A | 222,831 | 11,573,842 |
| Simpson Manufacturing Co., Inc. | 61,011 | 7,230,414 |
| SiteOne Landscape Supply, Inc. * | 20,050 | 3,457,221 |
| SPX Corp. * | 38,485 | 1,951,189 |
| SPX FLOW, Inc. | 55,893 | 4,800,650 |
| Standex International Corp. | 29,979 | 3,175,675 |
| Tennant Co. | 36,680 | 2,889,650 |
| Terex Corp. | 193,969 | 8,007,040 |
| Textainer Group Holdings Ltd. | 67,277 | 2,389,006 |
| The Greenbrier Cos., Inc. | 230,026 | 10,220,055 |
| The Manitowoc Co., Inc. * | 134,355 | 2,220,888 |
| The Middleby Corp. * | 65,397 | 11,615,815 |
| The Timken Co. | 148,512 | 9,736,447 |
| Trex Co., Inc. * | 40,296 | 3,700,785 |
| Trinity Industries, Inc. | 319,934 | 9,233,295 |
| Triton International Ltd. | 153,759 | 10,098,891 |
| Tutor Perini Corp. * | 476,719 | 4,671,846 |
| Valmont Industries, Inc. | 42,091 | 9,110,597 |
| Vectrus, Inc. * | 52,733 | 2,417,281 |
| Wabash National Corp. | 421,283 | 7,178,662 |
| Watts Water Technologies, Inc., Class A | 36,344 | 5,231,719 |
| Welbilt, Inc. * | 162,548 | 3,842,635 |
| Woodward, Inc. | 78,294 | 9,757,781 |
| Zurn Water Solutions Corp. | 149,195 | 4,851,821 |
| | | 565,051,155 |
| |
| Commercial & Professional Services 4.9% |
| ACCO Brands Corp. | 567,347 | 4,879,184 |
| ADT, Inc. | 590,953 | 4,319,866 |
| ASGN, Inc. * | 85,962 | 9,523,730 |
| Brady Corp., Class A | 110,016 | 5,069,537 |
| BrightView Holdings, Inc. * | 173,916 | 2,349,605 |
| CBIZ, Inc. * | 88,387 | 3,439,138 |
| Cimpress plc * | 34,087 | 2,147,140 |
| Clean Harbors, Inc. * | 99,664 | 9,510,936 |
| CoStar Group, Inc. * | 84,246 | 5,139,849 |
| Deluxe Corp. | 246,528 | 7,669,486 |
| Exponent, Inc. | 26,371 | 2,498,916 |
| FTI Consulting, Inc. * | 65,146 | 9,511,316 |
| Harsco Corp. * | 269,360 | 3,208,078 |
| Healthcare Services Group, Inc. | 292,590 | 4,628,774 |
| Heidrick & Struggles International, Inc. | 44,208 | 1,889,892 |
| HNI Corp. | 196,547 | 7,997,497 |
| Huron Consulting Group, Inc. * | 51,164 | 2,523,920 |
| IAA, Inc. * | 85,033 | 3,124,112 |
| ICF International, Inc. | 45,308 | 4,015,195 |
Schwab Fundamental Index ETFs | Annual Report
Schwab Fundamental U.S. Small Company Index ETF
Portfolio Holdings as of February 28, 2022 (continued)
| SECURITY | NUMBER
OF SHARES | VALUE ($) |
| Insperity, Inc. | 44,181 | 3,974,081 |
| Interface, Inc. | 273,187 | 3,565,090 |
| KAR Auction Services, Inc. * | 510,821 | 9,429,756 |
| Kforce, Inc. | 71,542 | 5,378,528 |
| Korn Ferry | 103,048 | 6,827,961 |
| ManTech International Corp., Class A | 70,148 | 5,848,239 |
| Matthews International Corp., Class A | 136,185 | 4,518,618 |
| MillerKnoll, Inc. | 260,689 | 10,135,588 |
| MSA Safety, Inc. | 31,195 | 4,339,225 |
| Pitney Bowes, Inc. | 1,307,367 | 6,510,688 |
| Resources Connection, Inc. | 196,215 | 3,257,169 |
| Rollins, Inc. | 137,030 | 4,471,289 |
| SP Plus Corp. * | 106,469 | 3,178,100 |
| Steelcase, Inc., Class A | 571,049 | 6,949,666 |
| Stericycle, Inc. * | 142,281 | 8,303,519 |
| Tetra Tech, Inc. | 60,594 | 9,620,509 |
| The Brink's Co. | 71,715 | 5,024,353 |
| The GEO Group, Inc. * | 1,482,789 | 8,837,422 |
| TransUnion | 105,183 | 9,546,409 |
| TriNet Group, Inc. * | 43,378 | 3,787,333 |
| TrueBlue, Inc. * | 310,338 | 8,441,194 |
| UniFirst Corp. | 35,003 | 6,344,294 |
| US Ecology, Inc. * | 70,345 | 3,337,167 |
| Viad Corp. * | 84,161 | 2,940,585 |
| | | 238,012,954 |
| |
| Consumer Durables & Apparel 3.4% |
| Acushnet Holdings Corp. | 59,387 | 2,601,151 |
| Beazer Homes USA, Inc. * | 144,874 | 2,371,587 |
| Callaway Golf Co. * | 128,355 | 3,175,503 |
| Cavco Industries, Inc. * | 15,677 | 4,274,020 |
| Century Communities, Inc. | 51,564 | 3,285,658 |
| Columbia Sportswear Co. | 61,189 | 5,673,444 |
| Crocs, Inc. * | 28,419 | 2,379,523 |
| Deckers Outdoor Corp. * | 30,268 | 8,736,555 |
| Ethan Allen Interiors, Inc. | 151,901 | 3,958,540 |
| Fossil Group, Inc. * | 412,111 | 5,571,741 |
| G-III Apparel Group Ltd. * | 260,650 | 7,230,431 |
| Helen of Troy Ltd. * | 34,915 | 7,180,968 |
| Installed Building Products, Inc. | 17,977 | 1,738,376 |
| iRobot Corp. * | 47,932 | 2,979,453 |
| KB Home | 243,860 | 9,415,435 |
| Kontoor Brands, Inc. | 151,442 | 7,502,437 |
| La-Z-Boy, Inc. | 176,442 | 5,148,578 |
| LGI Homes, Inc. * | 27,601 | 3,481,314 |
| M.D.C Holdings, Inc. | 148,395 | 6,579,834 |
| M/I Homes, Inc. * | 92,131 | 4,541,137 |
| Meritage Homes Corp. * | 109,788 | 10,822,901 |
| Movado Group, Inc. | 70,720 | 2,787,782 |
| Oxford Industries, Inc. | 49,472 | 4,372,830 |
| Skyline Champion Corp. * | 34,767 | 2,337,733 |
| Smith & Wesson Brands, Inc. | 118,841 | 2,095,167 |
| Steven Madden Ltd. | 218,092 | 9,303,805 |
| Sturm Ruger & Co., Inc. | 50,888 | 3,684,800 |
| Tempur Sealy International, Inc. | 196,824 | 6,497,160 |
| TopBuild Corp. * | 34,003 | 7,299,764 |
| Tupperware Brands Corp. *(a) | 266,560 | 4,859,389 |
| Universal Electronics, Inc. * | 50,176 | 1,667,348 |
| Vista Outdoor, Inc. * | 120,666 | 4,398,276 |
| Wolverine World Wide, Inc. | 261,039 | 6,011,728 |
| | | 163,964,368 |
| |
| Consumer Services 4.9% |
| Adtalem Global Education, Inc. * | 230,516 | 4,790,122 |
| American Public Education, Inc. * | 76,241 | 1,521,770 |
| Arcos Dorados Holdings, Inc., Class A * | 653,684 | 5,052,977 |
| SECURITY | NUMBER
OF SHARES | VALUE ($) |
| Bally's Corp. * | 38,596 | 1,390,228 |
| BJ's Restaurants, Inc. * | 98,292 | 3,152,224 |
| Bloomin' Brands, Inc. * | 378,770 | 9,321,530 |
| Boyd Gaming Corp. * | 115,888 | 8,221,095 |
| Bright Horizons Family Solutions, Inc. * | 54,262 | 7,088,788 |
| Brinker International, Inc. * | 190,975 | 8,124,077 |
| Caesars Entertainment, Inc. * | 45,451 | 3,826,520 |
| Choice Hotels International, Inc. | 27,357 | 3,948,983 |
| Churchill Downs, Inc. | 39,567 | 9,530,503 |
| Dave & Buster's Entertainment, Inc. * | 150,021 | 6,501,910 |
| Denny's Corp. * | 165,866 | 2,624,000 |
| Dine Brands Global, Inc. | 41,414 | 3,472,150 |
| Everi Holdings, Inc. * | 88,748 | 2,076,703 |
| Frontdoor, Inc. * | 56,586 | 1,700,409 |
| Graham Holdings Co., Class B | 15,388 | 9,250,188 |
| Grand Canyon Education, Inc. * | 77,396 | 6,720,295 |
| Hilton Grand Vacations, Inc. * | 178,567 | 9,260,485 |
| Houghton Mifflin Harcourt Co. * | 397,273 | 8,322,869 |
| Hyatt Hotels Corp., Class A * | 133,096 | 12,924,953 |
| International Game Technology plc | 452,543 | 13,856,867 |
| Jack in the Box, Inc. | 94,692 | 8,169,079 |
| Laureate Education, Inc. | 477,713 | 5,178,409 |
| Papa John's International, Inc. | 31,627 | 3,378,396 |
| Penn National Gaming, Inc. * | 150,185 | 7,712,000 |
| Perdoceo Education Corp. * | 214,792 | 2,248,872 |
| Planet Fitness, Inc., Class A * | 56,055 | 4,743,935 |
| Red Robin Gourmet Burgers, Inc. * | 143,666 | 2,521,338 |
| Red Rock Resorts, Inc., Class A | 95,950 | 4,824,366 |
| Regis Corp. *(a) | 632,151 | 1,144,193 |
| Ruth's Hospitality Group, Inc. | 88,631 | 2,198,935 |
| Scientific Games Corp., Class A * | 88,014 | 5,537,841 |
| SeaWorld Entertainment, Inc. * | 67,227 | 4,664,882 |
| Strategic Education, Inc. | 48,051 | 2,835,970 |
| Stride, Inc. * | 146,382 | 4,915,508 |
| Terminix Global Holdings, Inc. * | 153,190 | 6,519,766 |
| Texas Roadhouse, Inc. | 105,914 | 10,052,298 |
| The Cheesecake Factory, Inc. * | 161,130 | 6,894,753 |
| WW International, Inc. * | 100,113 | 1,020,151 |
| Wyndham Hotels & Resorts, Inc. | 111,857 | 9,665,563 |
| | | 236,905,901 |
| |
| Diversified Financials 4.6% |
| Apollo Commercial Real Estate Finance, Inc. | 300,193 | 3,917,519 |
| Apollo Global Management, Inc. | 346,841 | 22,634,844 |
| Arbor Realty Trust, Inc. | 124,428 | 2,239,704 |
| Ares Management Corp., Class A | 30,917 | 2,507,060 |
| Artisan Partners Asset Management, Inc., Class A | 94,591 | 3,604,863 |
| BGC Partners, Inc., Class A | 858,514 | 3,931,994 |
| Blackstone Mortgage Trust, Inc., Class A | 217,201 | 6,902,648 |
| Blucora, Inc. * | 119,402 | 2,376,100 |
| Brightsphere Investment Group, Inc. | 156,188 | 3,728,208 |
| BrightSpire Capital, Inc. | 195,419 | 1,731,412 |
| Cannae Holdings, Inc. * | 159,553 | 4,283,998 |
| Chimera Investment Corp. | 699,151 | 8,508,668 |
| Cohen & Steers, Inc. | 31,882 | 2,590,731 |
| Compass Diversified Holdings | 182,633 | 4,339,360 |
| Credit Acceptance Corp. * | 12,880 | 7,085,546 |
| Donnelley Financial Solutions, Inc. * | 88,011 | 2,825,153 |
| Encore Capital Group, Inc. * | 69,445 | 4,582,676 |
| Enova International, Inc. * | 90,974 | 3,709,010 |
| FactSet Research Systems, Inc. | 23,916 | 9,712,048 |
| Federated Hermes, Inc. | 291,684 | 9,529,316 |
| FirstCash Holdings, Inc. | 103,212 | 7,435,392 |
| Green Dot Corp., Class A * | 89,331 | 2,559,333 |
| Houlihan Lokey, Inc. | 53,125 | 5,464,437 |
Schwab Fundamental Index ETFs | Annual Report
Schwab Fundamental U.S. Small Company Index ETF
Portfolio Holdings as of February 28, 2022 (continued)
| SECURITY | NUMBER
OF SHARES | VALUE ($) |
| Interactive Brokers Group, Inc., Class A | 28,496 | 1,885,865 |
| Invesco Mortgage Capital, Inc. | 1,746,552 | 3,807,483 |
| Ladder Capital Corp. | 395,413 | 4,531,433 |
| MarketAxess Holdings, Inc. | 11,042 | 4,211,750 |
| MFA Financial, Inc. | 1,409,788 | 5,723,739 |
| Moelis & Co., Class A | 73,660 | 3,551,149 |
| Morningstar, Inc. | 13,737 | 3,855,289 |
| Nelnet, Inc., Class A | 44,712 | 3,601,552 |
| New York Mortgage Trust, Inc. | 927,925 | 3,257,017 |
| PennyMac Mortgage Investment Trust | 250,544 | 3,908,486 |
| Piper Sandler Cos. | 24,048 | 3,559,344 |
| PRA Group, Inc. * | 102,437 | 4,571,763 |
| Redwood Trust, Inc. | 332,449 | 3,454,145 |
| SLM Corp. | 589,878 | 11,620,597 |
| Stifel Financial Corp. | 107,028 | 7,866,558 |
| The Carlyle Group, Inc. | 90,864 | 4,258,796 |
| TPG RE Finance Trust, Inc. | 167,724 | 1,985,852 |
| Tradeweb Markets, Inc., Class A | 28,296 | 2,390,446 |
| Two Harbors Investment Corp. | 1,216,767 | 6,156,841 |
| Virtu Financial, Inc., Class A | 62,327 | 2,186,431 |
| Virtus Investment Partners, Inc. | 8,263 | 1,988,243 |
| WisdomTree Investments, Inc. | 347,936 | 1,958,880 |
| World Acceptance Corp. * | 19,140 | 3,760,436 |
| | | 220,292,115 |
| |
| Energy 5.1% |
| Alto Ingredients, Inc. * | 425,861 | 2,482,770 |
| Arch Resources, Inc. (a) | 153,013 | 18,265,162 |
| Archrock, Inc. | 526,269 | 4,394,346 |
| Callon Petroleum Co. * | 90,730 | 5,113,543 |
| Centennial Resource Development, Inc., Class A * | 786,579 | 6,906,164 |
| ChampionX Corp. * | 198,845 | 4,257,271 |
| CNX Resources Corp. * | 743,073 | 12,141,813 |
| CONSOL Energy, Inc. * | 316,865 | 9,740,430 |
| Continental Resources, Inc. | 169,568 | 9,399,154 |
| Core Laboratories N.V. | 140,905 | 3,883,342 |
| CVR Energy, Inc. | 322,986 | 5,616,726 |
| DHT Holdings, Inc. | 422,538 | 2,657,764 |
| Dril-Quip, Inc. * | 144,129 | 4,156,680 |
| EQT Corp. | 455,111 | 10,531,268 |
| Equitrans Midstream Corp. | 1,161,119 | 7,442,773 |
| Golar LNG Ltd. * | 155,804 | 2,710,990 |
| Green Plains, Inc. * | 228,107 | 7,468,223 |
| Helix Energy Solutions Group, Inc. * | 603,391 | 2,443,733 |
| International Seaways, Inc. | 245,841 | 4,496,432 |
| Kosmos Energy Ltd. * | 1,674,293 | 8,137,064 |
| Liberty Oilfield Services, Inc., Class A * | 176,629 | 2,204,330 |
| Magnolia Oil & Gas Corp., Class A | 218,246 | 4,877,798 |
| Matador Resources Co. | 115,258 | 5,716,797 |
| NexTier Oilfield Solutions, Inc. * | 879,681 | 7,002,261 |
| Nordic American Tankers Ltd. | 1,065,335 | 2,578,111 |
| Oceaneering International, Inc. * | 709,629 | 10,388,969 |
| Oil States International, Inc. * | 685,804 | 3,586,755 |
| Par Pacific Holdings, Inc. * | 257,227 | 3,498,287 |
| PDC Energy, Inc. | 169,441 | 10,932,333 |
| ProPetro Holding Corp. * | 461,687 | 5,895,743 |
| Range Resources Corp. * | 305,008 | 6,999,934 |
| Renewable Energy Group, Inc. * | 133,877 | 8,233,435 |
| Scorpio Tankers, Inc. | 242,964 | 4,225,144 |
| SFL Corp., Ltd. | 514,907 | 5,123,325 |
| SM Energy Co. | 512,908 | 18,213,363 |
| Southwestern Energy Co. * | 1,329,936 | 6,636,381 |
| Teekay Tankers Ltd., Class A * | 207,127 | 2,959,845 |
| US Silica Holdings, Inc. * | 235,792 | 3,409,552 |
| | | 244,728,011 |
| |
| SECURITY | NUMBER
OF SHARES | VALUE ($) |
| Food & Staples Retailing 0.8% |
| BJ's Wholesale Club Holdings, Inc. * | 92,615 | 5,822,705 |
| Grocery Outlet Holding Corp. * | 103,432 | 2,876,444 |
| Ingles Markets, Inc., Class A | 99,706 | 8,197,827 |
| PriceSmart, Inc. | 91,733 | 6,670,824 |
| The Andersons, Inc. | 222,080 | 10,126,848 |
| The Chefs' Warehouse, Inc. * | 74,593 | 2,450,380 |
| Weis Markets, Inc. | 76,926 | 4,744,026 |
| | | 40,889,054 |
| |
| Food, Beverage & Tobacco 2.3% |
| B&G Foods, Inc. (a) | 243,057 | 7,194,487 |
| Brown-Forman Corp., Class B | 139,951 | 9,129,004 |
| Calavo Growers, Inc. | 73,101 | 3,120,682 |
| Cal-Maine Foods, Inc. | 155,412 | 6,880,089 |
| Coca-Cola Consolidated, Inc. | 6,869 | 3,413,412 |
| Fresh Del Monte Produce, Inc. | 308,891 | 7,994,099 |
| Hostess Brands, Inc. * | 180,865 | 3,895,832 |
| J&J Snack Foods Corp. | 31,261 | 5,118,051 |
| John B Sanfilippo & Son, Inc. | 33,020 | 2,625,750 |
| Lamb Weston Holdings, Inc. | 145,031 | 9,634,409 |
| Lancaster Colony Corp. | 32,666 | 5,494,748 |
| Nomad Foods Ltd. * | 176,627 | 4,447,468 |
| Pilgrim's Pride Corp. * | 265,180 | 6,252,944 |
| The Boston Beer Co., Inc., Class A * | 7,085 | 2,716,814 |
| The Hain Celestial Group, Inc. * | 165,528 | 6,018,598 |
| TreeHouse Foods, Inc. * | 247,383 | 9,709,783 |
| Universal Corp. | 191,122 | 10,341,612 |
| Vector Group Ltd. | 424,460 | 4,758,197 |
| | | 108,745,979 |
| |
| Health Care Equipment & Services 3.8% |
| ABIOMED, Inc. * | 13,221 | 4,108,293 |
| Acadia Healthcare Co., Inc. * | 146,685 | 8,318,506 |
| Addus HomeCare Corp. * | 17,940 | 1,525,618 |
| Allscripts Healthcare Solutions, Inc. * | 305,785 | 5,950,576 |
| Amedisys, Inc. * | 24,212 | 3,879,731 |
| AMN Healthcare Services, Inc. * | 66,451 | 7,053,109 |
| Avanos Medical, Inc. * | 68,313 | 2,417,597 |
| Brookdale Senior Living, Inc. * | 998,344 | 6,868,607 |
| Change Healthcare, Inc. * | 291,673 | 6,247,636 |
| Chemed Corp. | 18,939 | 9,058,334 |
| Community Health Systems, Inc. * | 478,203 | 5,025,913 |
| CONMED Corp. | 23,941 | 3,499,216 |
| Covetrus, Inc. * | 311,309 | 5,516,395 |
| Globus Medical, Inc., Class A * | 54,582 | 3,838,206 |
| Haemonetics Corp. * | 76,425 | 4,410,487 |
| ICU Medical, Inc. * | 19,768 | 4,679,679 |
| IDEXX Laboratories, Inc. * | 10,300 | 5,483,205 |
| Integer Holdings Corp. * | 50,223 | 4,212,203 |
| Integra LifeSciences Holdings Corp. * | 52,811 | 3,541,506 |
| LHC Group, Inc. * | 29,276 | 3,986,513 |
| LivaNova plc * | 32,152 | 2,534,221 |
| Masimo Corp. * | 21,830 | 3,437,133 |
| MEDNAX, Inc. * | 384,907 | 9,033,767 |
| Merit Medical Systems, Inc. * | 44,459 | 2,891,169 |
| ModivCare, Inc. * | 24,165 | 2,851,470 |
| National HealthCare Corp. | 50,480 | 3,282,210 |
| Natus Medical, Inc. * | 67,084 | 1,866,277 |
| Neogen Corp. * | 55,986 | 1,998,700 |
| NextGen Healthcare, Inc. * | 113,111 | 2,209,058 |
| NuVasive, Inc. * | 79,177 | 4,285,059 |
| Omnicell, Inc. * | 20,624 | 2,666,271 |
| Orthofix Medical, Inc. * | 45,182 | 1,535,284 |
| Owens & Minor, Inc. | 248,825 | 10,985,624 |
Schwab Fundamental Index ETFs | Annual Report
Schwab Fundamental U.S. Small Company Index ETF
Portfolio Holdings as of February 28, 2022 (continued)
| SECURITY | NUMBER
OF SHARES | VALUE ($) |
| Premier, Inc., Class A | 245,619 | 8,827,547 |
| Select Medical Holdings Corp. | 219,919 | 5,091,125 |
| Teleflex, Inc. | 30,610 | 10,294,449 |
| The Ensign Group, Inc. | 46,715 | 3,925,928 |
| US Physical Therapy, Inc. | 15,373 | 1,413,855 |
| Varex Imaging Corp. * | 94,940 | 2,244,382 |
| Veeva Systems, Inc., Class A * | 13,874 | 3,177,840 |
| | | 184,172,699 |
| |
| Household & Personal Products 1.0% |
| Central Garden & Pet Co., Class A * | 82,099 | 3,615,640 |
| Coty, Inc., Class A * | 971,993 | 8,913,176 |
| Edgewell Personal Care Co. | 208,765 | 7,448,735 |
| Energizer Holdings, Inc. | 104,561 | 3,491,292 |
| Herbalife Nutrition Ltd. * | 135,980 | 4,838,168 |
| Inter Parfums, Inc. | 22,113 | 2,053,856 |
| Medifast, Inc. | 9,049 | 1,683,114 |
| Spectrum Brands Holdings, Inc. | 119,600 | 11,096,488 |
| USANA Health Sciences, Inc. * | 37,999 | 3,344,292 |
| WD-40 Co. | 11,453 | 2,426,776 |
| | | 48,911,537 |
| |
| Insurance 2.4% |
| Ambac Financial Group, Inc. * | 222,427 | 2,853,738 |
| American Equity Investment Life Holding Co. | 326,905 | 12,321,049 |
| American National Group, Inc. | 17,357 | 3,280,994 |
| AMERISAFE, Inc. | 54,433 | 2,563,794 |
| Argo Group International Holdings Ltd. | 75,633 | 3,189,444 |
| Brighthouse Financial, Inc. * | 44,981 | 2,350,707 |
| CNA Financial Corp. | 93,827 | 4,287,894 |
| Employers Holdings, Inc. | 89,311 | 3,470,625 |
| Enstar Group Ltd. * | 12,405 | 3,535,797 |
| Horace Mann Educators Corp. | 83,610 | 3,477,340 |
| James River Group Holdings Ltd. | 101,970 | 2,712,402 |
| Kemper Corp. | 134,814 | 7,204,460 |
| MBIA, Inc. * | 390,837 | 5,960,264 |
| Mercury General Corp. | 81,505 | 4,482,775 |
| ProAssurance Corp. | 329,163 | 7,932,828 |
| RenaissanceRe Holdings Ltd. | 65,750 | 9,913,785 |
| RLI Corp. | 38,931 | 3,951,497 |
| Safety Insurance Group, Inc. | 40,268 | 3,359,962 |
| Selective Insurance Group, Inc. | 92,341 | 7,681,848 |
| SiriusPoint Ltd. * | 205,894 | 1,521,557 |
| Stewart Information Services Corp. | 93,520 | 6,348,138 |
| United Fire Group, Inc. | 92,001 | 2,540,148 |
| Universal Insurance Holdings, Inc. | 223,645 | 2,585,336 |
| White Mountains Insurance Group Ltd. | 7,629 | 8,011,976 |
| | | 115,538,358 |
| |
| Materials 6.5% |
| AdvanSix, Inc. | 106,028 | 4,247,482 |
| Allegheny Technologies, Inc. * | 411,991 | 10,604,648 |
| Avient Corp. | 197,968 | 10,371,544 |
| Balchem Corp. | 26,640 | 3,685,378 |
| Cabot Corp. | 164,597 | 12,041,917 |
| Carpenter Technology Corp. | 240,942 | 9,249,763 |
| Century Aluminum Co. * | 173,488 | 4,097,787 |
| Clearwater Paper Corp. * | 116,620 | 3,362,155 |
| Cleveland-Cliffs, Inc. * | 251,475 | 5,622,981 |
| Compass Minerals International, Inc. | 103,337 | 6,057,615 |
| Constellium SE * | 232,949 | 4,526,199 |
| Eagle Materials, Inc. | 62,697 | 8,578,831 |
| Element Solutions, Inc. | 270,566 | 6,650,512 |
| Ferro Corp. * | 148,990 | 3,237,553 |
| SECURITY | NUMBER
OF SHARES | VALUE ($) |
| GCP Applied Technologies, Inc. * | 104,005 | 3,284,478 |
| Glatfelter Corp. | 205,015 | 2,816,906 |
| Greif, Inc., Class A | 98,853 | 5,683,059 |
| H.B. Fuller Co. | 109,462 | 7,483,917 |
| Hawkins, Inc. | 54,349 | 2,459,836 |
| Hecla Mining Co. | 506,195 | 2,915,683 |
| Ingevity Corp. * | 54,136 | 3,693,699 |
| Innospec, Inc. | 60,277 | 5,756,453 |
| Kaiser Aluminum Corp. | 51,565 | 4,976,023 |
| Koppers Holdings, Inc. * | 63,295 | 1,812,136 |
| Kraton Corp. * | 123,471 | 5,698,187 |
| Livent Corp. * | 103,196 | 2,430,266 |
| Louisiana-Pacific Corp. | 191,185 | 13,755,761 |
| Materion Corp. | 60,908 | 5,088,863 |
| Minerals Technologies, Inc. | 96,161 | 6,730,308 |
| Myers Industries, Inc. | 96,372 | 1,601,703 |
| Neenah, Inc. | 77,479 | 3,017,807 |
| NewMarket Corp. | 20,048 | 6,370,452 |
| Orion Engineered Carbons S.A. | 249,150 | 3,871,791 |
| Quaker Chemical Corp. | 9,681 | 1,796,890 |
| Royal Gold, Inc. | 44,047 | 5,341,139 |
| Schnitzer Steel Industries, Inc., Class A | 128,480 | 6,250,552 |
| Schweitzer-Mauduit International, Inc. | 117,784 | 3,677,216 |
| Sensient Technologies Corp. | 74,351 | 6,106,448 |
| Silgan Holdings, Inc. | 214,806 | 8,996,075 |
| Southern Copper Corp. | 100,725 | 6,989,308 |
| Stepan Co. | 57,953 | 6,005,090 |
| Summit Materials, Inc., Class A * | 217,172 | 6,780,110 |
| SunCoke Energy, Inc. | 590,984 | 4,686,503 |
| The Scotts Miracle-Gro Co. | 45,226 | 6,334,354 |
| Tredegar Corp. | 184,781 | 2,126,829 |
| TriMas Corp. | 91,253 | 2,966,635 |
| Trinseo plc | 179,140 | 9,308,114 |
| Tronox Holdings plc, Class A | 184,338 | 3,742,061 |
| Valvoline, Inc. | 186,086 | 6,016,160 |
| Verso Corp., Class A | 445,180 | 11,801,722 |
| Warrior Met Coal, Inc. | 552,614 | 17,407,341 |
| Westlake Corp. | 97,936 | 10,803,320 |
| Worthington Industries, Inc. | 115,362 | 6,577,941 |
| | | 315,495,501 |
| |
| Media & Entertainment 3.8% |
| AMC Entertainment Holdings, Inc., Class A *(a) | 152,678 | 2,879,507 |
| AMC Networks, Inc., Class A * | 197,653 | 8,192,717 |
| Cable One, Inc. | 3,287 | 4,709,778 |
| Cars.com, Inc. * | 263,537 | 4,264,029 |
| Gannett Co., Inc. * | 843,759 | 4,185,045 |
| Gray Television, Inc. | 239,726 | 5,616,780 |
| iHeartMedia, Inc., Class A * | 347,963 | 7,463,806 |
| IMAX Corp. * | 104,864 | 2,168,587 |
| John Wiley & Sons, Inc., Class A | 113,508 | 5,710,587 |
| Liberty Media Corp. - Liberty Formula One, Class A * | 15,044 | 844,871 |
| Liberty Media Corp. - Liberty Formula One, Class C * | 118,148 | 7,175,128 |
| Liberty TripAdvisor Holdings, Inc., Class A * | 599,714 | 1,271,394 |
| Lions Gate Entertainment Corp., Class A * | 150,169 | 2,306,596 |
| Lions Gate Entertainment Corp., Class B * | 285,692 | 4,071,111 |
| Live Nation Entertainment, Inc. * | 83,599 | 10,100,431 |
| Madison Square Garden Entertainment Corp. * | 65,338 | 5,119,886 |
| Madison Square Garden Sports Corp. * | 16,308 | 2,821,284 |
Schwab Fundamental Index ETFs | Annual Report
Schwab Fundamental U.S. Small Company Index ETF
Portfolio Holdings as of February 28, 2022 (continued)
| SECURITY | NUMBER
OF SHARES | VALUE ($) |
| National CineMedia, Inc. | 739,306 | 2,195,739 |
| Nexstar Media Group, Inc., Class A | 73,035 | 13,515,127 |
| Scholastic Corp. | 148,951 | 6,267,858 |
| Sinclair Broadcast Group, Inc., Class A | 270,939 | 8,128,170 |
| Sirius XM Holdings, Inc. (a) | 1,663,475 | 10,247,006 |
| Spotify Technology S.A. * | 25,571 | 3,993,934 |
| Take-Two Interactive Software, Inc. * | 64,166 | 10,394,892 |
| TEGNA, Inc. | 592,552 | 13,581,292 |
| The E.W. Scripps Co., Class A * | 108,927 | 2,424,715 |
| The Marcus Corp. * | 127,003 | 2,308,915 |
| The New York Times Co., Class A | 142,844 | 6,283,708 |
| TripAdvisor, Inc. * | 197,738 | 5,030,455 |
| World Wrestling Entertainment, Inc., Class A | 40,548 | 2,402,874 |
| Yandex N.V., Class A *(b)(c) | 126,894 | 1,243,264 |
| Yelp, Inc. * | 161,186 | 5,462,594 |
| Ziff Davis, Inc. * | 61,109 | 6,147,565 |
| Zynga, Inc., Class A * | 458,108 | 4,159,621 |
| | | 182,689,266 |
| |
| Pharmaceuticals, Biotechnology & Life Sciences 2.2% |
| Alkermes plc * | 108,289 | 2,692,064 |
| Avantor, Inc. * | 125,181 | 4,342,529 |
| BioMarin Pharmaceutical, Inc. * | 47,973 | 3,747,651 |
| Bio-Rad Laboratories, Inc., Class A * | 10,096 | 6,319,692 |
| Bio-Techne Corp. | 11,068 | 4,642,030 |
| Bruker Corp. | 78,590 | 5,530,378 |
| Catalent, Inc. * | 61,674 | 6,293,215 |
| Charles River Laboratories International, Inc. * | 22,416 | 6,526,642 |
| Elanco Animal Health, Inc. * | 320,961 | 9,118,502 |
| Emergent BioSolutions, Inc. * | 48,494 | 2,006,682 |
| Exelixis, Inc. * | 193,812 | 3,978,960 |
| Horizon Therapeutics plc * | 34,590 | 3,153,570 |
| Incyte Corp. * | 74,532 | 5,090,536 |
| Ligand Pharmaceuticals, Inc. * | 13,013 | 1,317,176 |
| Medpace Holdings, Inc. * | 12,509 | 1,913,502 |
| Myriad Genetics, Inc. * | 166,901 | 4,069,046 |
| PerkinElmer, Inc. | 71,965 | 12,925,634 |
| Prestige Consumer Healthcare, Inc. * | 86,475 | 5,147,857 |
| Royalty Pharma plc, Class A | 41,768 | 1,639,812 |
| Syneos Health, Inc. * | 83,151 | 6,585,559 |
| West Pharmaceutical Services, Inc. | 26,436 | 10,232,847 |
| | | 107,273,884 |
| |
| Real Estate 10.1% |
| Acadia Realty Trust | 152,727 | 3,274,467 |
| Alexander & Baldwin, Inc. | 280,700 | 6,296,101 |
| American Assets Trust, Inc. | 81,247 | 2,970,390 |
| American Campus Communities, Inc. | 232,032 | 12,485,642 |
| American Homes 4 Rent, Class A | 195,447 | 7,428,940 |
| Americold Realty Trust | 139,382 | 3,724,287 |
| Brandywine Realty Trust | 519,101 | 6,919,616 |
| CareTrust REIT, Inc. | 83,074 | 1,453,795 |
| Centerspace | 26,792 | 2,518,180 |
| Chatham Lodging Trust * | 239,822 | 3,297,552 |
| Corporate Office Properties Trust | 233,411 | 6,117,702 |
| Cousins Properties, Inc. | 145,188 | 5,608,612 |
| CubeSmart | 169,557 | 8,174,343 |
| Cushman & Wakefield plc * | 206,416 | 4,524,639 |
| CyrusOne, Inc. | 104,240 | 9,418,084 |
| DiamondRock Hospitality Co. * | 797,973 | 7,620,642 |
| Douglas Elliman, Inc. * | 212,506 | 1,602,295 |
| Douglas Emmett, Inc. | 252,239 | 7,995,976 |
| Easterly Government Properties, Inc. | 89,923 | 1,872,197 |
| EastGroup Properties, Inc. | 22,842 | 4,357,340 |
| SECURITY | NUMBER
OF SHARES | VALUE ($) |
| Empire State Realty Trust, Inc., Class A | 482,132 | 4,560,969 |
| EPR Properties | 158,980 | 7,917,204 |
| Equity Commonwealth * | 183,694 | 4,880,750 |
| Equity LifeStyle Properties, Inc. | 128,227 | 9,568,299 |
| Federal Realty Investment Trust | 99,425 | 11,690,391 |
| First Industrial Realty Trust, Inc. | 97,244 | 5,599,310 |
| Gaming & Leisure Properties, Inc. | 245,464 | 11,146,520 |
| Global Net Lease, Inc. | 198,033 | 2,814,049 |
| Healthcare Realty Trust, Inc. | 199,331 | 5,198,552 |
| Healthcare Trust of America, Inc., Class A | 272,069 | 7,996,108 |
| Hersha Hospitality Trust * | 305,768 | 2,822,239 |
| Highwoods Properties, Inc. | 207,016 | 9,025,898 |
| Hudson Pacific Properties, Inc. | 287,728 | 7,596,019 |
| Independence Realty Trust, Inc. | 118,641 | 2,998,058 |
| Industrial Logistics Properties Trust | 98,976 | 2,214,093 |
| iStar, Inc. | 187,610 | 4,712,763 |
| JBG SMITH Properties | 168,298 | 4,490,191 |
| Kennedy-Wilson Holdings, Inc. | 245,721 | 5,440,263 |
| Kilroy Realty Corp. | 144,638 | 10,358,974 |
| Kite Realty Group Trust | 619,239 | 13,579,911 |
| Life Storage, Inc. | 66,301 | 8,393,044 |
| LTC Properties, Inc. | 62,363 | 2,109,740 |
| LXP Industrial Trust | 423,016 | 6,539,827 |
| Marcus & Millichap, Inc. * | 53,243 | 2,647,774 |
| Medical Properties Trust, Inc. | 439,611 | 8,941,688 |
| National Health Investors, Inc. | 59,141 | 3,152,807 |
| National Retail Properties, Inc. | 178,062 | 7,587,222 |
| Newmark Group, Inc., Class A | 190,270 | 3,363,974 |
| Office Properties Income Trust | 191,012 | 4,784,851 |
| Outfront Media, Inc. | 436,297 | 11,649,130 |
| Paramount Group, Inc. | 709,083 | 7,934,639 |
| Pebblebrook Hotel Trust | 380,585 | 8,566,968 |
| Physicians Realty Trust | 245,294 | 3,988,480 |
| Piedmont Office Realty Trust, Inc., Class A | 422,540 | 7,200,082 |
| PotlatchDeltic Corp. | 94,051 | 5,163,400 |
| Preferred Apartment Communities, Inc. | 255,520 | 6,454,435 |
| PS Business Parks, Inc. | 21,882 | 3,485,584 |
| Rayonier, Inc. | 201,279 | 7,990,776 |
| Retail Opportunity Investments Corp. | 197,401 | 3,584,802 |
| Rexford Industrial Realty, Inc. | 39,308 | 2,756,670 |
| RPT Realty | 264,533 | 3,425,702 |
| Ryman Hospitality Properties, Inc. * | 93,707 | 8,256,524 |
| Sabra Health Care REIT, Inc. | 380,062 | 5,104,233 |
| SBA Communications Corp. | 33,547 | 10,177,824 |
| Seritage Growth Properties, Class A * | 118,863 | 1,211,214 |
| SITE Centers Corp. | 482,501 | 7,502,891 |
| Spirit Realty Capital, Inc. | 149,465 | 6,930,692 |
| STAG Industrial, Inc. | 105,829 | 4,123,098 |
| STORE Capital Corp. | 178,555 | 5,485,210 |
| Summit Hotel Properties, Inc. * | 420,477 | 4,158,518 |
| Sun Communities, Inc. | 64,736 | 11,717,216 |
| Sunstone Hotel Investors, Inc. * | 919,124 | 9,724,332 |
| Tanger Factory Outlet Centers, Inc. | 335,440 | 5,595,139 |
| Terreno Realty Corp. | 29,352 | 2,019,124 |
| The Howard Hughes Corp. * | 35,858 | 3,427,308 |
| The Necessity Retail REIT, Inc. | 295,752 | 2,082,094 |
| Uniti Group, Inc. | 739,883 | 9,596,283 |
| Urban Edge Properties | 247,767 | 4,514,315 |
| Veris Residential, Inc. * | 248,520 | 4,199,988 |
| VICI Properties, Inc. | 328,017 | 9,171,355 |
| Washington Real Estate Investment Trust | 177,487 | 4,146,096 |
| Xenia Hotels & Resorts, Inc. * | 444,623 | 8,243,310 |
| Zillow Group, Inc., Class A * | 7,797 | 446,534 |
Schwab Fundamental Index ETFs | Annual Report
Schwab Fundamental U.S. Small Company Index ETF
Portfolio Holdings as of February 28, 2022 (continued)
| SECURITY | NUMBER
OF SHARES | VALUE ($) |
| Zillow Group, Inc., Class C * | 18,237 | 1,048,992 |
| | | 490,875,246 |
| |
| Retailing 3.4% |
| Abercrombie & Fitch Co., Class A * | 280,861 | 10,695,187 |
| America's Car-Mart, Inc. * | 13,600 | 1,308,048 |
| Big 5 Sporting Goods Corp. (a) | 88,415 | 1,464,152 |
| Boot Barn Holdings, Inc. * | 23,488 | 2,043,926 |
| Caleres, Inc. | 261,775 | 5,434,449 |
| Chico's FAS, Inc. * | 2,147,355 | 10,092,569 |
| Citi Trends, Inc. * | 28,275 | 1,054,940 |
| Conn's, Inc. * | 141,231 | 2,590,177 |
| Designer Brands, Inc., Class A * | 590,904 | 7,711,297 |
| Dillard's, Inc., Class A | 57,093 | 14,313,786 |
| Etsy, Inc. * | 9,159 | 1,418,638 |
| Express, Inc. * | 1,410,488 | 6,713,923 |
| Five Below, Inc. * | 24,021 | 3,930,076 |
| Floor & Decor Holdings, Inc., Class A * | 33,508 | 3,204,035 |
| Genesco, Inc. * | 120,555 | 7,733,603 |
| Groupon, Inc. * | 188,120 | 4,085,966 |
| Guess?, Inc. | 212,110 | 4,645,209 |
| Haverty Furniture Cos., Inc. | 86,509 | 2,457,721 |
| Hibbett, Inc. | 52,560 | 2,369,405 |
| MarineMax, Inc. * | 60,933 | 2,788,294 |
| MercadoLibre, Inc. * | 1,854 | 2,088,809 |
| Monro, Inc. | 72,697 | 3,393,496 |
| National Vision Holdings, Inc. * | 75,977 | 2,786,077 |
| Ollie's Bargain Outlet Holdings, Inc. * | 53,369 | 2,304,473 |
| Overstock.com, Inc. * | 24,617 | 1,400,707 |
| Party City Holdco, Inc. * | 537,276 | 2,326,405 |
| PetMed Express, Inc. | 61,997 | 1,670,819 |
| Pool Corp. | 22,523 | 10,328,597 |
| Rent-A-Center, Inc. | 62,505 | 1,775,767 |
| RH * | 4,521 | 1,816,854 |
| Sally Beauty Holdings, Inc. * | 532,367 | 9,199,302 |
| Shoe Carnival, Inc. | 81,089 | 2,364,555 |
| Sleep Number Corp. * | 50,172 | 3,296,300 |
| Sonic Automotive, Inc., Class A | 168,999 | 9,076,936 |
| Stitch Fix, Inc., Class A * | 44,710 | 561,111 |
| The Buckle, Inc. | 90,552 | 3,259,872 |
| The Children's Place, Inc. * | 54,496 | 3,431,068 |
| TravelCenters of America, Inc. * | 153,963 | 6,501,858 |
| Zumiez, Inc. * | 68,035 | 3,026,877 |
| | | 166,665,284 |
| |
| Semiconductors & Semiconductor Equipment 2.2% |
| Ambarella, Inc. * | 15,691 | 2,192,190 |
| Amkor Technology, Inc. | 294,590 | 6,678,355 |
| Azenta, Inc. | 33,825 | 2,960,364 |
| Cirrus Logic, Inc. * | 125,821 | 10,930,070 |
| CMC Materials, Inc. | 24,724 | 4,584,571 |
| Diodes, Inc. * | 49,568 | 4,440,797 |
| Entegris, Inc. | 57,734 | 7,533,132 |
| First Solar, Inc. * | 117,698 | 8,861,482 |
| FormFactor, Inc. * | 57,300 | 2,320,077 |
| Kulicke & Soffa Industries, Inc. | 85,390 | 4,460,774 |
| MKS Instruments, Inc. | 60,336 | 9,086,602 |
| Monolithic Power Systems, Inc. | 8,608 | 3,948,490 |
| Photronics, Inc. * | 232,431 | 4,281,379 |
| Power Integrations, Inc. | 38,666 | 3,479,940 |
| Semtech Corp. * | 49,094 | 3,406,142 |
| Silicon Laboratories, Inc. * | 24,960 | 3,836,602 |
| SolarEdge Technologies, Inc. * | 10,513 | 3,358,062 |
| Synaptics, Inc. * | 44,602 | 10,188,435 |
| Ultra Clean Holdings, Inc. * | 46,309 | 2,121,415 |
| Universal Display Corp. | 11,368 | 1,761,017 |
| SECURITY | NUMBER
OF SHARES | VALUE ($) |
| Wolfspeed, Inc. * | 76,280 | 7,835,482 |
| | | 108,265,378 |
| |
| Software & Services 4.5% |
| ACI Worldwide, Inc. * | 139,049 | 4,660,922 |
| Aspen Technology, Inc. * | 46,325 | 7,060,393 |
| Avaya Holdings Corp. * | 184,133 | 2,535,511 |
| Black Knight, Inc. * | 110,292 | 6,197,307 |
| Blackbaud, Inc. * | 36,461 | 2,278,448 |
| Block, Inc. * | 14,742 | 1,879,605 |
| Cerence, Inc. * | 33,592 | 1,213,007 |
| Cognyte Software Ltd. * | 71,106 | 793,543 |
| CommVault Systems, Inc. * | 42,794 | 2,692,171 |
| Concentrix Corp. | 45,722 | 9,139,371 |
| Conduent, Inc. * | 1,344,621 | 6,548,304 |
| Consensus Cloud Solutions, Inc. * | 20,864 | 1,161,290 |
| CSG Systems International, Inc. | 83,654 | 5,163,125 |
| Dolby Laboratories, Inc., Class A | 69,476 | 5,217,648 |
| Dropbox, Inc., Class A * | 110,977 | 2,518,068 |
| Ebix, Inc. | 92,937 | 2,742,571 |
| Envestnet, Inc. * | 28,554 | 2,136,410 |
| EPAM Systems, Inc. * | 14,581 | 3,029,203 |
| Euronet Worldwide, Inc. * | 66,452 | 8,521,140 |
| EVERTEC, Inc. | 69,304 | 2,797,109 |
| ExlService Holdings, Inc. * | 35,101 | 4,239,850 |
| Fair Isaac Corp. * | 15,458 | 7,283,655 |
| Fortinet, Inc. * | 25,122 | 8,655,031 |
| Gartner, Inc. * | 41,520 | 11,643,038 |
| Globant S.A. * | 8,589 | 2,353,386 |
| GoDaddy, Inc., Class A * | 60,077 | 5,011,023 |
| Guidewire Software, Inc. * | 18,683 | 1,646,906 |
| InterDigital, Inc. | 85,011 | 5,476,409 |
| LiveRamp Holdings, Inc. * | 131,707 | 5,684,474 |
| Manhattan Associates, Inc. * | 39,589 | 5,292,258 |
| MicroStrategy, Inc., Class A *(a) | 3,347 | 1,482,721 |
| Nuance Communications, Inc. * | 93,404 | 5,185,790 |
| Pagseguro Digital Ltd., Class A * | 60,125 | 958,393 |
| Palo Alto Networks, Inc. * | 13,520 | 8,034,260 |
| Paycom Software, Inc. * | 7,278 | 2,468,770 |
| Pegasystems, Inc. | 16,082 | 1,401,064 |
| Perficient, Inc. * | 29,159 | 2,971,302 |
| Progress Software Corp. | 73,204 | 3,226,832 |
| PTC, Inc. * | 33,539 | 3,732,220 |
| ServiceNow, Inc. * | 5,343 | 3,098,513 |
| Splunk, Inc. * | 28,404 | 3,354,512 |
| StoneCo Ltd., Class A * | 44,874 | 504,384 |
| Tyler Technologies, Inc. * | 10,575 | 4,528,849 |
| Unisys Corp. * | 128,099 | 2,737,476 |
| Verint Systems, Inc. * | 61,843 | 3,106,374 |
| VMware, Inc., Class A | 147,105 | 17,258,359 |
| Vonage Holdings Corp. * | 211,139 | 4,290,344 |
| WEX, Inc. * | 37,531 | 6,324,349 |
| Workday, Inc., Class A * | 10,531 | 2,412,126 |
| Xperi Holding Corp. | 162,253 | 2,810,222 |
| | | 215,458,036 |
| |
| Technology Hardware & Equipment 4.3% |
| 3D Systems Corp. * | 65,924 | 1,174,766 |
| ADTRAN, Inc. | 146,628 | 3,019,070 |
| Advanced Energy Industries, Inc. | 40,582 | 3,483,965 |
| Arista Networks, Inc. * | 83,353 | 10,229,914 |
| Badger Meter, Inc. | 24,876 | 2,472,923 |
| Belden, Inc. | 144,497 | 8,142,406 |
| Benchmark Electronics, Inc. | 346,857 | 9,066,842 |
| Ciena Corp. * | 202,113 | 13,828,571 |
| Cognex Corp. | 77,356 | 5,226,171 |
Schwab Fundamental Index ETFs | Annual Report
Schwab Fundamental U.S. Small Company Index ETF
Portfolio Holdings as of February 28, 2022 (continued)
| SECURITY | NUMBER
OF SHARES | VALUE ($) |
| Coherent, Inc. * | 30,097 | 7,955,239 |
| CommScope Holding Co., Inc. * | 760,573 | 7,255,866 |
| Comtech Telecommunications Corp. | 86,001 | 1,769,901 |
| CTS Corp. | 63,368 | 2,404,182 |
| ePlus, Inc. * | 95,103 | 4,460,331 |
| Fabrinet * | 53,105 | 5,317,404 |
| II-VI, Inc. * | 68,756 | 4,775,792 |
| IPG Photonics Corp. * | 38,453 | 5,012,349 |
| Itron, Inc. * | 56,620 | 2,699,075 |
| Knowles Corp. * | 199,170 | 4,337,923 |
| Littelfuse, Inc. | 25,296 | 6,531,680 |
| Lumentum Holdings, Inc. * | 46,864 | 4,632,975 |
| Methode Electronics, Inc. | 93,296 | 4,258,029 |
| National Instruments Corp. | 217,136 | 8,718,010 |
| NETGEAR, Inc. * | 101,652 | 2,704,960 |
| NetScout Systems, Inc. * | 301,455 | 9,384,294 |
| Novanta, Inc. * | 13,718 | 1,874,290 |
| OSI Systems, Inc. * | 40,534 | 3,269,878 |
| PC Connection, Inc. | 79,573 | 3,882,367 |
| Plantronics, Inc. * | 119,655 | 3,370,681 |
| Plexus Corp. * | 97,421 | 7,936,889 |
| Rogers Corp. * | 20,219 | 5,519,787 |
| ScanSource, Inc. * | 286,291 | 9,041,070 |
| Stratasys Ltd. * | 90,122 | 2,260,260 |
| Super Micro Computer, Inc. * | 180,778 | 7,102,768 |
| TTM Technologies, Inc. * | 512,155 | 6,437,788 |
| ViaSat, Inc. * | 113,976 | 5,201,865 |
| Viavi Solutions, Inc. * | 173,716 | 2,848,942 |
| Vishay Intertechnology, Inc. | 454,206 | 8,716,213 |
| | | 206,325,436 |
| |
| Telecommunication Services 0.6% |
| ATN International, Inc. | 48,083 | 1,602,606 |
| Cogent Communications Holdings, Inc. | 47,192 | 2,991,973 |
| Consolidated Communications Holdings, Inc. * | 750,412 | 5,342,933 |
| EchoStar Corp., Class A * | 197,372 | 4,804,035 |
| Iridium Communications, Inc. * | 76,890 | 3,044,075 |
| Liberty Latin America Ltd., Class A * | 180,399 | 1,813,010 |
| Liberty Latin America Ltd., Class C * | 596,730 | 6,021,006 |
| Shenandoah Telecommunications Co. | 92,337 | 2,063,732 |
| United States Cellular Corp. * | 91,720 | 2,523,217 |
| | | 30,206,587 |
| |
| Transportation 2.5% |
| Air Transport Services Group, Inc. * | 153,232 | 4,828,340 |
| Alaska Air Group, Inc. * | 141,260 | 7,930,336 |
| Allegiant Travel Co. * | 10,972 | 1,910,115 |
| AMERCO | 14,778 | 8,535,921 |
| ArcBest Corp. | 111,719 | 10,354,117 |
| Atlas Air Worldwide Holdings, Inc. * | 88,062 | 6,900,538 |
| Atlas Corp. | 216,054 | 3,117,659 |
| Copa Holdings S.A., Class A * | 30,952 | 2,625,968 |
| Costamare, Inc. | 158,836 | 2,144,286 |
| Forward Air Corp. | 64,674 | 6,673,063 |
| Hawaiian Holdings, Inc. * | 119,484 | 2,291,703 |
| Heartland Express, Inc. | 166,095 | 2,385,124 |
| Hub Group, Inc., Class A * | 147,540 | 12,452,376 |
| JetBlue Airways Corp. * | 519,666 | 7,935,300 |
| Marten Transport Ltd. | 195,127 | 3,365,941 |
| Mesa Air Group, Inc. * | 217,340 | 945,429 |
| Saia, Inc. * | 24,524 | 7,044,029 |
| Schneider National, Inc., Class B | 258,274 | 6,746,117 |
| SkyWest, Inc. * | 65,110 | 1,830,242 |
| Spirit Airlines, Inc. * | 99,769 | 2,502,207 |
| Uber Technologies, Inc. * | 210,259 | 7,575,632 |
| SECURITY | NUMBER
OF SHARES | VALUE ($) |
| Werner Enterprises, Inc. | 230,644 | 10,023,788 |
| Yellow Corp. * | 263,224 | 2,371,648 |
| | | 122,489,879 |
| |
| Utilities 3.5% |
| ALLETE, Inc. | 140,867 | 8,866,169 |
| American States Water Co. | 41,753 | 3,513,932 |
| Atlantica Sustainable Infrastructure plc | 128,532 | 4,337,955 |
| Avangrid, Inc. | 145,534 | 6,530,111 |
| Avista Corp. | 213,735 | 9,538,993 |
| Black Hills Corp. | 151,483 | 10,602,295 |
| California Water Service Group | 60,225 | 3,428,609 |
| Chesapeake Utilities Corp. | 22,001 | 2,925,033 |
| Clearway Energy, Inc., Class A | 36,927 | 1,129,597 |
| Clearway Energy, Inc., Class C | 87,811 | 2,932,887 |
| Essential Utilities, Inc. | 193,515 | 9,116,492 |
| Hawaiian Electric Industries, Inc. | 272,278 | 11,157,952 |
| IDACORP, Inc. | 96,422 | 10,023,067 |
| MGE Energy, Inc. | 52,512 | 3,781,914 |
| National Fuel Gas Co. | 176,502 | 10,985,485 |
| New Jersey Resources Corp. | 220,357 | 9,611,972 |
| Northwest Natural Holding Co. | 79,462 | 4,132,819 |
| NorthWestern Corp. | 148,464 | 8,979,103 |
| ONE Gas, Inc. | 129,357 | 10,748,273 |
| Ormat Technologies, Inc. | 48,029 | 3,426,869 |
| Otter Tail Corp. | 87,907 | 5,437,927 |
| PNM Resources, Inc. | 166,019 | 7,499,078 |
| SJW Group | 34,872 | 2,274,352 |
| South Jersey Industries, Inc. | 236,477 | 8,023,665 |
| Spire, Inc. | 140,213 | 9,409,694 |
| Unitil Corp. | 47,291 | 2,387,723 |
| | | 170,801,966 |
Total Common Stocks
(Cost $4,047,947,583) | 4,835,510,385 |
| | | |
| SHORT-TERM INVESTMENTS 0.9% OF NET ASSETS |
| |
| Money Market Funds 0.9% |
| State Street Institutional U.S. Government Money Market Fund, Premier Class 0.03% (d) | 3,953,147 | 3,953,147 |
| State Street Institutional U.S. Government Money Market Fund, Premier Class 0.03% (d)(e) | 40,377,530 | 40,377,530 |
| | | 44,330,677 |
Total Short-Term Investments
(Cost $44,330,677) | 44,330,677 |
Total Investments in Securities
(Cost $4,092,278,260) | 4,879,841,062 |
Schwab Fundamental Index ETFs | Annual Report
Schwab Fundamental U.S. Small Company Index ETF
Portfolio Holdings as of February 28, 2022 (continued)
| | NUMBER OF
CONTRACTS | NOTIONAL
AMOUNT
($) | CURRENT VALUE/
UNREALIZED
APPRECIATION
($) |
| FUTURES CONTRACTS |
| Long | | | |
| Russell 2000 Index, e-mini, expires 03/18/22 | 73 | 7,462,425 | 48,782 |
| * | Non-income producing security. |
| (a) | All or a portion of this security is on loan. Securities on loan were valued at $40,098,369. |
| (b) | Trading in Russian securities listed on the Moscow Exchange, Russian ADRs, and Russian GDRs had ceased and suspended the fund’s ability to buy or sell these securities as of February 28, 2022. |
| (c) | Fair valued by management using significant unobservable inputs in accordance with procedures approved by the fund’s Board of Trustees. |
| (d) | The rate shown is the 7-day yield. |
| (e) | Security purchased with cash collateral received for securities on loan. |
| ADR — | American Depositary Receipt |
| GDR — | Global Depositary Receipt |
| REIT — | Real Estate Investment Trust |
The following is a summary of the inputs used to value the fund’s investments as of February 28, 2022 (see financial note 2(a) for additional information):
| DESCRIPTION | QUOTED PRICES IN
ACTIVE MARKETS FOR
IDENTICAL ASSETS
(LEVEL 1) | OTHER SIGNIFICANT
OBSERVABLE INPUTS
(LEVEL 2) | SIGNIFICANT
UNOBSERVABLE INPUTS
(LEVEL 3) | TOTAL |
| Assets | | | | |
| Common Stocks1 | $4,652,821,119 | $— | $— | $4,652,821,119 |
| Media & Entertainment | 181,446,002 | — | 1,243,264 2 | 182,689,266 |
| Short-Term Investments1 | 44,330,677 | — | — | 44,330,677 |
| Futures Contracts3 | 48,782 | — | — | 48,782 |
| Total | $4,878,646,580 | $— | $1,243,264 | $4,879,889,844 |
| 1 | As categorized in the Portfolio Holdings. |
| 2 | Trading in Russian securities listed on the Moscow Exchange, Russian ADRs, and Russian GDRs had ceased and suspended the fund’s ability to buy or sell these securities as of February 28, 2022. |
| 3 | Futures contracts are reported at cumulative unrealized appreciation or depreciation. |
Fund investments in mutual funds are classified as Level 1, without consideration to the classification level of the underlying securities held by the mutual funds, which could be Level 1, Level 2 or Level 3.
Schwab Fundamental Index ETFs | Annual Report
Schwab Fundamental U.S. Small Company Index ETF
Statement of Assets and Liabilities
As of February 28, 2022
| Assets |
| Investments in securities, at value - unaffiliated (cost $4,092,278,260) including securities on loan of $40,098,369 | | $4,879,841,062 |
| Deposit with broker for futures contracts | | 346,500 |
| Receivables: | | |
| Fund shares sold | | 5,300,051 |
| Dividends | | 4,139,812 |
| Investments sold | | 2,613,185 |
| Income from securities on loan | | 27,132 |
| Variation margin on future contracts | + | 17,484 |
| Total assets | | 4,892,285,226 |
| Liabilities |
| Collateral held for securities on loan | | 40,377,530 |
| Payables: | | |
| Investments bought | | 5,226,370 |
| Fund shares redeemed | | 2,650,026 |
| Management fees | + | 919,299 |
| Total liabilities | | 49,173,225 |
| Net assets | | $4,843,112,001 |
| Net Assets by Source |
| Capital received from investors | | $4,535,235,630 |
| Total distributable earnings | + | 307,876,371 |
| Net assets | | $4,843,112,001 |
| Net Asset Value (NAV) |
| Net Assets | ÷ | Shares
Outstanding | = | NAV |
| $4,843,112,001 | | 91,350,000 | | $53.02 |
| | | | | |
| | | | | |
Schwab Fundamental Index ETFs | Annual Report
Schwab Fundamental U.S. Small Company Index ETF
Statement of Operations
| For the period March 1, 2021 through February 28, 2022 |
| Investment Income |
| Dividends received from securities - unaffiliated (net of foreign withholding tax of $34,600) | | $67,369,414 |
| Securities on loan, net | + | 549,183 |
| Total investment income | | 67,918,597 |
| Expenses |
| Management fees | | 11,635,781 |
| Total expenses | – | 11,635,781 |
| Net investment income | | 56,282,816 |
| REALIZED AND UNREALIZED GAINS (LOSSES) |
| Net realized gains on sales of securities - unaffiliated | | 5,682,212 |
| Net realized gains on sales of in-kind redemptions - unaffiliated | | 441,947,802 |
| Net realized losses on futures contracts | + | (1,431,490) |
| Net realized gains | | 446,198,524 |
| Net change in unrealized appreciation (depreciation) on securities - unaffiliated | | (107,762,044) |
| Net change in unrealized appreciation (depreciation) on futures contracts | + | 123,462 |
| Net change in unrealized appreciation (depreciation) | + | (107,638,582) |
| Net realized and unrealized gains | | 338,559,942 |
| Increase in net assets resulting from operations | | $394,842,758 |
Schwab Fundamental Index ETFs | Annual Report
Schwab Fundamental U.S. Small Company Index ETF
Statement of Changes in Net Assets
For the current and prior report periods
| OPERATIONS |
| | 3/1/21-2/28/22 | 3/1/20-2/28/21 |
| Net investment income | | $56,282,816 | $45,715,884 |
| Net realized gains | | 446,198,524 | 74,363,692 |
| Net change in unrealized appreciation (depreciation) | + | (107,638,582) | 1,138,500,407 |
| Increase in net assets resulting from operations | | $394,842,758 | $1,258,579,983 |
| DISTRIBUTIONS TO SHAREHOLDERS |
| Total distributions | | ($56,395,300) | ($51,561,985) |
| TRANSACTIONS IN FUND SHARES |
| | 3/1/21-2/28/22 | 3/1/20-2/28/21 |
| | | SHARES | VALUE | SHARES | VALUE |
| Shares sold | | 23,050,000 | $1,234,091,769 | 30,900,000 | $953,673,482 |
| Shares redeemed | + | (15,500,000) | (815,045,637) | (45,700,000) | (1,499,782,894) |
| Net transactions in fund shares | | 7,550,000 | $419,046,132 | (14,800,000) | ($546,109,412) |
| SHARES OUTSTANDING AND NET ASSETS |
| | 3/1/21-2/28/22 | 3/1/20-2/28/21 |
| | | SHARES | NET ASSETS | SHARES | NET ASSETS |
| Beginning of period | | 83,800,000 | $4,085,618,411 | 98,600,000 | $3,424,709,825 |
| Total increase (decrease) | + | 7,550,000 | 757,493,590 | (14,800,000) | 660,908,586 |
| End of period | | 91,350,000 | $4,843,112,001 | 83,800,000 | $4,085,618,411 |
Schwab Fundamental Index ETFs | Annual Report
Schwab Fundamental International Large Company Index ETF
Financial Statements
FINANCIAL HIGHLIGHTS
| | 3/1/21–
2/28/22 | 3/1/20–
2/28/21 | 3/1/19–
2/29/20 | 3/1/18–
2/28/19 | 3/1/17–
2/28/18 | |
| Per-Share Data |
| Net asset value at beginning of period | $30.94 | $25.24 | $27.54 | $30.28 | $26.00 | |
| Income (loss) from investment operations: | | | | | | |
| Net investment income (loss)1 | 1.04 | 0.70 | 0.91 | 0.94 | 0.80 | |
| Net realized and unrealized gains (losses) | 1.42 | 5.64 | (2.29) | (2.81) | 4.19 | |
| Total from investment operations | 2.46 | 6.34 | (1.38) | (1.87) | 4.99 | |
| Less distributions: | | | | | | |
| Distributions from net investment income | (1.15) | (0.64) | (0.92) | (0.87) | (0.71) | |
| Net asset value at end of period | $32.25 | $30.94 | $25.24 | $27.54 | $30.28 | |
| Total return | 7.95% | 25.47% | (5.32%) | (6.00%) | 19.19% | |
| Ratios/Supplemental Data |
| Ratios to average net assets: | | | | | | |
| Total expenses | 0.25% | 0.25% | 0.25% | 0.25% | 0.25% | |
| Net investment income (loss) | 3.16% | 2.74% | 3.27% | 3.29% | 2.76% | |
| Portfolio turnover rate2 | 15% | 15% | 20% | 14% | 10% | |
| Net assets, end of period (x 1,000) | $7,381,580 | $5,721,053 | $4,416,696 | $4,083,580 | $3,630,569 | |
| 1 | Calculated based on the average shares outstanding during the period. |
| 2 | Portfolio turnover rate excludes securities received or delivered from processing of in-kind creations or redemptions. |
Schwab Fundamental Index ETFs | Annual Report
Schwab Fundamental International Large Company Index ETF
Portfolio Holdings as of February 28, 2022
This section shows all the securities in the fund’s portfolio and their values as of the report date.
The fund files its complete schedule of portfolio holdings with the U.S. Securities and Exchange Commission (SEC) for the first and third quarters of each fiscal year on Form N-PORT Part F. The fund’s Form N-PORT Part F is available on the SEC’s website at www.sec.gov. You can also obtain this information at no cost on the fund’s website at www.schwabassetmanagement.com/schwabetfs_prospectus, by calling 1-866-414-6349, or by sending an email request to orders@mysummaryprospectus.com.The fund also makes available its complete schedule of portfolio holdings on a daily basis on the fund’s website.
| SECURITY | NUMBER
OF SHARES | VALUE ($) |
| COMMON STOCKS 98.6% OF NET ASSETS |
| |
| Australia 5.5% |
| AGL Energy Ltd. | 1,219,367 | 6,653,948 |
| Amcor plc | 416,645 | 4,795,087 |
| AMP Ltd. * | 4,636,887 | 3,179,695 |
| Ampol Ltd. | 289,146 | 6,183,359 |
| APA Group | 370,374 | 2,701,057 |
| Aristocrat Leisure Ltd. | 72,095 | 1,949,807 |
| Aurizon Holdings Ltd. | 1,283,929 | 3,260,890 |
| Australia & New Zealand Banking Group Ltd. | 1,241,986 | 23,441,435 |
| Bendigo & Adelaide Bank Ltd. | 242,791 | 1,693,102 |
| BHP Group Ltd. | 1,876,601 | 63,539,505 |
| BlueScope Steel Ltd. | 332,552 | 4,884,243 |
| Boral Ltd. (a) | 396,461 | 1,044,322 |
| Brambles Ltd. | 580,084 | 4,167,285 |
| Coles Group Ltd. | 660,822 | 8,334,152 |
| Commonwealth Bank of Australia | 511,645 | 34,699,375 |
| Computershare Ltd. | 145,667 | 2,289,532 |
| Crown Resorts Ltd. * | 266,109 | 2,390,602 |
| CSL Ltd. | 38,327 | 7,230,560 |
| Downer EDI Ltd. | 584,938 | 2,139,280 |
| Endeavour Group Ltd. | 579,219 | 3,009,421 |
| Fortescue Metals Group Ltd. | 381,299 | 5,021,916 |
| Goodman Group | 140,888 | 2,272,692 |
| Incitec Pivot Ltd. | 1,024,664 | 2,297,561 |
| Insurance Australia Group Ltd. | 1,234,562 | 4,120,955 |
| James Hardie Industries plc | 48,324 | 1,565,711 |
| JB Hi-Fi Ltd. | 44,347 | 1,586,815 |
| Lendlease Corp., Ltd. | 545,541 | 4,180,406 |
| Macquarie Group Ltd. | 71,577 | 9,389,685 |
| Medibank Pvt Ltd. | 1,336,811 | 3,084,781 |
| Metcash Ltd. | 889,034 | 2,657,925 |
| Mirvac Group | 1,234,245 | 2,319,681 |
| National Australia Bank Ltd. | 1,254,003 | 26,334,450 |
| Newcrest Mining Ltd. | 215,527 | 4,014,715 |
| Orica Ltd. | 185,473 | 1,963,646 |
| Origin Energy Ltd. | 1,409,023 | 5,828,007 |
| Qantas Airways Ltd. * | 595,898 | 2,192,336 |
| QBE Insurance Group Ltd. | 561,419 | 4,680,953 |
| Ramsay Health Care Ltd. | 46,537 | 2,160,239 |
| Rio Tinto Ltd. | 170,187 | 14,593,544 |
| Santos Ltd. | 814,125 | 4,288,988 |
| Scentre Group | 1,949,747 | 4,343,540 |
| Sims Ltd. | 184,021 | 2,431,669 |
| Sonic Healthcare Ltd. | 111,668 | 2,840,167 |
| South32 Ltd. | 2,440,955 | 8,519,851 |
| Stockland | 900,634 | 2,718,747 |
| Suncorp Group Ltd. | 888,873 | 6,946,764 |
| Tabcorp Holdings Ltd. | 580,872 | 2,103,334 |
| Telstra Corp., Ltd. | 3,142,301 | 9,029,633 |
| Transurban Group | 391,925 | 3,609,040 |
| Treasury Wine Estates Ltd. | 203,187 | 1,713,283 |
| Viva Energy Group Ltd. | 1,411,381 | 2,498,971 |
| Wesfarmers Ltd. | 432,243 | 15,115,135 |
| SECURITY | NUMBER
OF SHARES | VALUE ($) |
| Westpac Banking Corp. | 1,715,480 | 28,394,753 |
| Woodside Petroleum Ltd. | 508,254 | 10,525,965 |
| Woolworths Group Ltd. | 587,516 | 15,130,485 |
| | | 408,063,000 |
| |
| Austria 0.2% |
| Erste Group Bank AG | 133,194 | 4,785,818 |
| OMV AG | 105,309 | 5,012,839 |
| Raiffeisen Bank International AG | 90,146 | 1,485,367 |
| voestalpine AG | 108,055 | 3,573,057 |
| Wienerberger AG | 53,707 | 1,615,470 |
| �� | | 16,472,551 |
| |
| Belgium 0.8% |
| Ageas S.A. N.V. | 90,063 | 4,347,806 |
| Anheuser-Busch InBev S.A. N.V. | 368,089 | 22,796,957 |
| Etablissements Franz Colruyt N.V. | 36,919 | 1,479,558 |
| Groupe Bruxelles Lambert S.A. | 53,839 | 5,620,267 |
| KBC Group N.V. | 96,187 | 6,970,566 |
| Proximus SADP | 130,637 | 2,605,952 |
| Solvay S.A. | 41,655 | 4,665,591 |
| UCB S.A. | 30,590 | 3,356,845 |
| Umicore S.A. | 76,631 | 3,157,981 |
| | | 55,001,523 |
| |
| Canada 8.2% |
| Agnico Eagle Mines Ltd. | 62,695 | 3,165,026 |
| Air Canada * | 122,023 | 2,304,136 |
| Alimentation Couche-Tard, Inc. | 364,986 | 14,316,280 |
| AltaGas Ltd. | 94,220 | 2,074,051 |
| ARC Resources Ltd. | 470,102 | 5,807,938 |
| Atco Ltd., Class I | 62,537 | 2,052,600 |
| Bank of Montreal | 166,452 | 18,993,652 |
| Barrick Gold Corp. | 437,457 | 9,881,455 |
| Bausch Health Cos., Inc. * | 126,262 | 3,035,226 |
| BCE, Inc. | 138,681 | 7,278,743 |
| Brookfield Asset Management Reinsurance Partners Ltd., Class A * | 1,376 | 76,223 |
| Brookfield Asset Management, Inc., Class A | 340,245 | 18,582,230 |
| Canadian Imperial Bank of Commerce | 132,911 | 16,811,536 |
| Canadian National Railway Co. | 163,208 | 20,233,237 |
| Canadian Natural Resources Ltd. | 483,551 | 26,995,897 |
| Canadian Pacific Railway Ltd. | 166,001 | 11,680,994 |
| Canadian Tire Corp., Ltd., Class A | 31,887 | 4,698,012 |
| CCL Industries, Inc., Class B | 33,473 | 1,507,981 |
| Cenovus Energy, Inc. | 518,972 | 8,154,777 |
| CGI, Inc. * | 76,115 | 6,236,347 |
| CI Financial Corp. | 139,702 | 2,285,502 |
| Crescent Point Energy Corp. | 885,092 | 6,329,313 |
| Dollarama, Inc. | 54,975 | 2,839,013 |
| Emera, Inc. | 83,882 | 3,921,790 |
| Empire Co., Ltd., A Shares | 100,052 | 3,096,970 |
| Enbridge, Inc. | 628,437 | 27,132,266 |
Schwab Fundamental Index ETFs | Annual Report
Schwab Fundamental International Large Company Index ETF
Portfolio Holdings as of February 28, 2022 (continued)
| SECURITY | NUMBER
OF SHARES | VALUE ($) |
| Fairfax Financial Holdings Ltd. | 11,550 | 5,595,378 |
| Finning International, Inc. | 81,208 | 2,361,297 |
| First Quantum Minerals Ltd. | 99,203 | 2,907,222 |
| Fortis, Inc. | 151,603 | 6,942,171 |
| George Weston Ltd. | 55,401 | 6,003,322 |
| Gildan Activewear, Inc. | 82,945 | 3,254,104 |
| Great-West Lifeco, Inc. | 97,452 | 2,929,668 |
| H&R Real Estate Investment Trust | 140,777 | 1,435,130 |
| Hydro One Ltd. | 107,042 | 2,641,554 |
| IA Financial Corp., Inc. | 33,500 | 1,989,108 |
| Imperial Oil Ltd. | 163,643 | 7,339,970 |
| Intact Financial Corp. | 25,220 | 3,614,731 |
| Keyera Corp. | 93,036 | 2,177,821 |
| Kinross Gold Corp. | 411,148 | 2,048,690 |
| Linamar Corp. | 35,806 | 1,868,569 |
| Loblaw Cos., Ltd. | 100,231 | 7,813,174 |
| Magna International, Inc. | 220,793 | 16,393,012 |
| Manulife Financial Corp. | 629,921 | 12,753,870 |
| Methanex Corp. | 51,895 | 2,700,005 |
| Metro, Inc. | 110,466 | 5,762,156 |
| National Bank of Canada | 76,688 | 6,144,835 |
| Nutrien Ltd. | 260,460 | 22,385,575 |
| Onex Corp. | 56,040 | 3,760,890 |
| Open Text Corp. | 48,970 | 2,129,684 |
| Parkland Corp. | 78,515 | 2,053,331 |
| Pembina Pipeline Corp. | 170,601 | 5,797,219 |
| Power Corp. of Canada | 206,396 | 6,361,036 |
| Primaris REIT | 35,174 | 396,569 |
| Quebecor, Inc., Class B | 69,388 | 1,516,486 |
| Restaurant Brands International, Inc. | 45,507 | 2,545,608 |
| RioCan Real Estate Investment Trust | 111,368 | 2,205,672 |
| Rogers Communications, Inc., B Shares | 158,895 | 8,204,386 |
| Royal Bank of Canada | 351,207 | 38,824,247 |
| Saputo, Inc. | 107,590 | 2,634,719 |
| Shaw Communications, Inc., B Shares | 174,148 | 5,218,879 |
| SNC-Lavalin Group, Inc. | 91,745 | 2,064,416 |
| Sun Life Financial, Inc. | 160,780 | 8,450,029 |
| Suncor Energy, Inc. | 1,243,993 | 38,015,665 |
| TC Energy Corp. | 283,039 | 15,196,875 |
| Teck Resources Ltd., Class B | 277,745 | 9,994,309 |
| TELUS Corp. | 159,576 | 4,027,301 |
| TFI International, Inc. | 20,324 | 2,117,087 |
| The Bank of Nova Scotia | 421,386 | 30,515,476 |
| The Toronto-Dominion Bank | 450,580 | 36,334,862 |
| Thomson Reuters Corp. | 41,927 | 4,236,500 |
| Vermilion Energy, Inc. * | 244,299 | 4,564,896 |
| Waste Connections, Inc. | 30,004 | 3,702,153 |
| West Fraser Timber Co., Ltd. | 28,392 | 2,832,149 |
| WSP Global, Inc. | 21,337 | 2,616,089 |
| | | 602,869,090 |
| |
| Denmark 0.9% |
| AP Moller - Maersk A/S, A Shares | 1,672 | 5,024,167 |
| AP Moller - Maersk A/S, B Shares | 2,413 | 7,658,872 |
| Carlsberg A/S, B Shares | 24,450 | 3,589,296 |
| Coloplast A/S, B Shares | 12,716 | 1,916,650 |
| Danske Bank A/S | 420,329 | 7,152,997 |
| DSV A/S | 19,696 | 3,649,197 |
| ISS A/S * | 172,241 | 3,165,205 |
| Novo Nordisk A/S, B Shares | 200,744 | 20,675,946 |
| Novozymes A/S, B Shares | 34,516 | 2,268,214 |
| Orsted A/S | 27,955 | 3,635,283 |
| Pandora A/S | 26,129 | 2,705,007 |
| Vestas Wind Systems A/S | 172,318 | 5,659,325 |
| | | 67,100,159 |
| |
| SECURITY | NUMBER
OF SHARES | VALUE ($) |
| Finland 0.9% |
| Elisa Oyj | 36,088 | 2,008,463 |
| Fortum Oyj | 126,045 | 2,667,251 |
| Kesko Oyj, B Shares | 84,553 | 2,501,509 |
| Kone Oyj, B Shares | 71,813 | 4,224,992 |
| Neste Oyj | 93,630 | 3,699,714 |
| Nokia Oyj * | 2,251,622 | 12,234,148 |
| Nokian Renkaat Oyj | 60,473 | 1,154,696 |
| Nordea Bank Abp | 1,305,838 | 14,590,910 |
| Outokumpu Oyj * | 372,829 | 2,213,574 |
| Sampo Oyj, A Shares | 146,527 | 6,971,575 |
| Stora Enso Oyj, R Shares | 282,705 | 5,452,066 |
| UPM-Kymmene Oyj | 268,577 | 9,351,640 |
| Wartsila Oyj Abp | 220,744 | 2,496,753 |
| | | 69,567,291 |
| |
| France 8.3% |
| Accor S.A. * | 59,299 | 2,037,437 |
| Air France-KLM *(a) | 653,271 | 2,899,063 |
| Air Liquide S.A. | 109,383 | 18,269,139 |
| Airbus SE * | 90,456 | 11,673,866 |
| Alstom S.A. | 122,025 | 3,138,641 |
| Arkema S.A. | 37,473 | 5,004,464 |
| Atos SE | 53,653 | 1,924,803 |
| AXA S.A. | 883,171 | 24,080,268 |
| BNP Paribas S.A. | 603,562 | 35,597,639 |
| Bollore S.A. | 419,042 | 2,135,892 |
| Bouygues S.A. | 199,668 | 7,181,036 |
| Bureau Veritas S.A. | 63,534 | 1,831,134 |
| Capgemini SE | 37,186 | 7,864,789 |
| Carrefour S.A. | 669,242 | 13,455,304 |
| Casino Guichard Perrachon S.A. * | 117,456 | 2,098,953 |
| Cie de Saint-Gobain | 285,316 | 17,930,133 |
| Cie Generale des Etablissements Michelin S.C.A. | 102,351 | 14,255,126 |
| CNP Assurances | 92,492 | 2,261,621 |
| Credit Agricole S.A. | 525,288 | 6,764,983 |
| Danone S.A. | 224,066 | 13,668,254 |
| Dassault Systemes SE | 34,229 | 1,672,018 |
| Eiffage S.A. | 52,411 | 5,375,831 |
| Electricite de France S.A. | 555,299 | 5,070,779 |
| Elis S.A. * | 111,330 | 1,799,411 |
| Engie S.A. | 1,215,896 | 19,485,736 |
| EssilorLuxottica S.A. | 38,628 | 6,799,609 |
| Eurazeo SE | 19,262 | 1,498,230 |
| Eutelsat Communications S.A. | 175,146 | 1,939,306 |
| Faurecia SE | 88,566 | 3,387,205 |
| Hermes International | 1,741 | 2,428,721 |
| Kering S.A. | 9,783 | 7,000,627 |
| Klepierre S.A. * | 82,540 | 2,378,912 |
| Lagardere S.A. * | 94,214 | 2,685,742 |
| Legrand S.A. | 50,493 | 4,810,461 |
| L'Oreal S.A. | 30,008 | 11,965,275 |
| LVMH Moet Hennessy Louis Vuitton SE | 27,768 | 20,581,642 |
| Orange S.A. | 2,151,795 | 26,136,326 |
| Pernod-Ricard S.A. | 35,997 | 7,910,491 |
| Publicis Groupe S.A. | 90,526 | 6,064,126 |
| Renault S.A. * | 413,526 | 13,256,048 |
| Rexel S.A. * | 266,005 | 5,914,290 |
| Rubis S.C.A. | 57,746 | 1,814,144 |
| Safran S.A. | 71,162 | 9,167,879 |
| Sanofi | 361,457 | 37,947,762 |
| Schneider Electric SE | 124,811 | 19,595,447 |
| SCOR SE | 105,160 | 3,440,712 |
| SES S.A. | 398,768 | 3,157,670 |
Schwab Fundamental Index ETFs | Annual Report
Schwab Fundamental International Large Company Index ETF
Portfolio Holdings as of February 28, 2022 (continued)
| SECURITY | NUMBER
OF SHARES | VALUE ($) |
| Societe Generale S.A. | 858,683 | 24,729,092 |
| Sodexo S.A. | 50,203 | 4,234,741 |
| STMicroelectronics N.V. | 103,660 | 4,417,391 |
| Technip Energies N.V. * | 83,986 | 951,821 |
| Teleperformance | 6,976 | 2,600,585 |
| Thales S.A. | 33,002 | 3,814,283 |
| TotalEnergies SE | 2,032,929 | 104,099,607 |
| Valeo S.A. | 251,600 | 5,591,186 |
| Veolia Environnement S.A. | 279,091 | 9,783,559 |
| Vinci S.A. | 192,755 | 20,463,817 |
| Vivendi SE | 194,086 | 2,465,552 |
| Wendel SE | 18,032 | 1,844,086 |
| | | 612,352,665 |
| |
| Germany 7.0% |
| adidas AG | 37,914 | 9,030,154 |
| Allianz SE | 173,903 | 39,710,169 |
| Aurubis AG | 47,828 | 5,643,331 |
| BASF SE | 608,697 | 40,508,560 |
| Bayer AG | 585,439 | 33,871,192 |
| Bayerische Motoren Werke AG | 304,030 | 29,559,084 |
| Beiersdorf AG | 21,184 | 2,151,443 |
| Brenntag SE | 62,939 | 5,293,500 |
| Commerzbank AG * | 892,740 | 7,554,538 |
| Continental AG * | 101,331 | 8,740,994 |
| Covestro AG | 138,541 | 7,346,316 |
| Daimler Truck Holding AG * | 279,399 | 8,529,657 |
| Deutsche Bank AG * | 637,606 | 8,063,954 |
| Deutsche Boerse AG | 23,779 | 4,078,401 |
| Deutsche Lufthansa AG * | 935,653 | 7,224,065 |
| Deutsche Post AG | 347,767 | 17,640,041 |
| Deutsche Telekom AG | 2,129,448 | 38,340,507 |
| Deutsche Wohnen SE | 16,846 | 704,067 |
| E.ON SE | 922,363 | 12,554,231 |
| Evonik Industries AG | 115,184 | 3,478,886 |
| Freenet AG | 74,231 | 1,999,364 |
| Fresenius Medical Care AG & Co. KGaA | 111,834 | 7,200,080 |
| Fresenius SE & Co. KGaA | 283,000 | 9,938,072 |
| GEA Group AG | 62,999 | 2,764,613 |
| Hannover Rueck SE | 19,946 | 3,692,073 |
| HeidelbergCement AG | 104,593 | 6,830,224 |
| Henkel AG & Co. KGaA | 46,994 | 3,620,961 |
| HUGO BOSS AG | 40,196 | 2,474,120 |
| Infineon Technologies AG | 174,056 | 6,010,641 |
| K+S AG * | 206,980 | 5,333,092 |
| KION Group AG | 23,128 | 1,874,528 |
| Knorr-Bremse AG | 17,216 | 1,527,625 |
| LANXESS AG | 49,294 | 2,412,896 |
| Mercedes-Benz Group AG | 558,884 | 44,048,430 |
| Merck KGaA | 19,918 | 3,972,132 |
| METRO AG * | 220,210 | 2,067,762 |
| MTU Aero Engines AG | 10,717 | 2,602,473 |
| Muenchener Rueckversicherungs-Gesellschaft AG in Muenchen | 51,391 | 14,266,090 |
| ProSiebenSat.1 Media SE | 111,746 | 1,539,419 |
| Rheinmetall AG | 27,209 | 4,082,971 |
| RWE AG | 248,836 | 11,596,153 |
| Salzgitter AG * | 62,137 | 2,748,421 |
| SAP SE | 179,146 | 20,387,294 |
| Siemens AG | 231,714 | 32,964,694 |
| Siemens Energy AG * | 153,021 | 3,683,244 |
| Siemens Healthineers AG | 39,351 | 2,540,562 |
| Symrise AG | 16,305 | 1,950,418 |
| Telefonica Deutschland Holding AG | 659,825 | 1,812,028 |
| ThyssenKrupp AG * | 329,665 | 3,554,687 |
| SECURITY | NUMBER
OF SHARES | VALUE ($) |
| Uniper SE | 118,899 | 3,806,101 |
| United Internet AG | 59,833 | 2,040,327 |
| Vitesco Technologies Group AG * | 21,950 | 930,698 |
| Volkswagen AG | 22,226 | 5,871,593 |
| Vonovia SE | 93,279 | 4,976,623 |
| | | 517,143,499 |
| |
| Hong Kong 1.7% |
| AAC Technologies Holdings, Inc. | 316,148 | 865,860 |
| AIA Group Ltd. | 1,563,601 | 16,258,953 |
| BOC Hong Kong Holdings Ltd. | 1,508,345 | 5,424,382 |
| CK Asset Holdings Ltd. | 1,213,958 | 7,667,152 |
| CK Hutchison Holdings Ltd. | 2,446,731 | 17,144,058 |
| CLP Holdings Ltd. | 732,056 | 7,452,942 |
| Galaxy Entertainment Group Ltd. * | 476,451 | 2,649,423 |
| Hang Seng Bank Ltd. | 230,173 | 4,247,789 |
| Henderson Land Development Co., Ltd. | 417,483 | 1,736,463 |
| Hong Kong & China Gas Co., Ltd. | 2,017,904 | 3,052,539 |
| Hong Kong Exchanges & Clearing Ltd. | 45,984 | 2,222,194 |
| Hongkong Land Holdings Ltd. | 441,991 | 2,382,331 |
| Jardine Matheson Holdings Ltd. | 103,589 | 6,163,545 |
| Lenovo Group Ltd. | 3,862,802 | 4,296,012 |
| Link REIT | 298,298 | 2,408,923 |
| MTR Corp., Ltd. | 492,629 | 2,550,244 |
| New World Development Co., Ltd. | 1,059,011 | 4,235,393 |
| Noble Group Ltd. *(a)(b) | 54,070,092 | 597,482 |
| PCCW Ltd. | 3,700,570 | 2,064,897 |
| Samsonite International S.A. * | 858,945 | 1,912,749 |
| Sands China Ltd. * | 985,604 | 2,579,521 |
| Sino Land Co., Ltd. | 1,240,413 | 1,560,498 |
| Sun Hung Kai Properties Ltd. | 615,976 | 7,165,903 |
| Swire Pacific Ltd., A Shares | 780,925 | 4,317,540 |
| Techtronic Industries Co., Ltd. | 127,127 | 2,123,203 |
| The Wharf Holdings Ltd. | 905,346 | 3,267,435 |
| WH Group Ltd. | 8,707,367 | 6,073,326 |
| Wharf Real Estate Investment Co., Ltd. | 477,841 | 2,143,457 |
| Yue Yuen Industrial Holdings Ltd. * | 1,139,465 | 1,924,944 |
| | | 126,489,158 |
| |
| Ireland 0.1% |
| Bank of Ireland Group plc * | 418,598 | 2,777,761 |
| Kerry Group plc, A Shares | 27,480 | 3,277,922 |
| Kingspan Group plc | 20,116 | 1,962,089 |
| | | 8,017,772 |
| |
| Israel 0.2% |
| Bank Hapoalim B.M. | 304,893 | 3,223,517 |
| Bank Leumi Le-Israel B.M. | 448,995 | 4,857,710 |
| ICL Group Ltd. | 309,384 | 3,513,260 |
| Teva Pharmaceutical Industries Ltd. * | 535,307 | 4,341,974 |
| | | 15,936,461 |
| |
| Italy 2.9% |
| A2A S.p.A. | 927,345 | 1,663,426 |
| Assicurazioni Generali S.p.A. | 627,436 | 12,494,977 |
| Atlantia S.p.A. * | 278,157 | 5,126,912 |
| Banco BPM S.p.A. | 865,266 | 2,994,323 |
| CNH Industrial N.V. | 405,226 | 5,837,299 |
| Enel S.p.A. | 3,887,202 | 28,811,941 |
| Eni S.p.A. | 2,939,628 | 45,670,382 |
| EXOR N.V. | 182,765 | 13,918,102 |
| Ferrari N.V. | 9,653 | 2,089,845 |
| Intesa Sanpaolo S.p.A. | 7,671,419 | 19,762,038 |
Schwab Fundamental Index ETFs | Annual Report
Schwab Fundamental International Large Company Index ETF
Portfolio Holdings as of February 28, 2022 (continued)
| SECURITY | NUMBER
OF SHARES | VALUE ($) |
| Iveco Group N.V. * | 81,007 | 677,399 |
| Leonardo S.p.A. * | 397,505 | 3,571,823 |
| Mediobanca Banca di Credito Finanziario S.p.A. | 222,858 | 2,334,430 |
| Pirelli & C S.p.A. | 275,138 | 1,527,561 |
| Poste Italiane S.p.A. | 151,291 | 1,746,032 |
| Prysmian S.p.A. | 74,180 | 2,459,577 |
| Saras S.p.A. * | 2,625,014 | 1,616,912 |
| Snam S.p.A. | 645,151 | 3,597,807 |
| Stellantis N.V. | 1,444,051 | 26,551,466 |
| Telecom Italia S.p.A. | 18,483,419 | 7,845,425 |
| Tenaris S.A. | 248,418 | 3,219,928 |
| Terna - Rete Elettrica Nazionale | 344,368 | 2,839,844 |
| UniCredit S.p.A. | 1,416,091 | 18,113,230 |
| Unipol Gruppo S.p.A. | 358,818 | 1,826,910 |
| | | 216,297,589 |
| |
| Japan 24.6% |
| Advantest Corp. | 19,104 | 1,504,435 |
| Aeon Co., Ltd. | 369,012 | 8,322,194 |
| AGC, Inc. | 152,422 | 6,736,080 |
| Air Water, Inc. | 133,439 | 1,937,139 |
| Aisin Corp. | 224,569 | 8,159,942 |
| Ajinomoto Co., Inc. | 173,828 | 5,039,390 |
| Alfresa Holdings Corp. | 285,442 | 4,376,736 |
| Alps Alpine Co., Ltd. | 334,884 | 3,343,752 |
| Amada Co., Ltd. | 212,601 | 1,869,892 |
| ANA Holdings, Inc. * | 130,589 | 2,864,624 |
| Asahi Group Holdings Ltd. | 170,718 | 6,883,563 |
| Asahi Kasei Corp. | 946,160 | 8,851,638 |
| Astellas Pharma, Inc. | 667,574 | 11,119,954 |
| Bandai Namco Holdings, Inc. | 55,162 | 4,008,734 |
| Bic Camera, Inc. | 173,003 | 1,500,586 |
| Bridgestone Corp. | 480,337 | 19,705,599 |
| Brother Industries Ltd. | 181,420 | 3,285,801 |
| Canon, Inc. | 813,528 | 19,060,606 |
| Casio Computer Co., Ltd. | 105,623 | 1,233,453 |
| Central Japan Railway Co. | 107,334 | 14,435,456 |
| Chubu Electric Power Co., Inc. | 936,661 | 9,376,776 |
| Chugai Pharmaceutical Co., Ltd. | 56,288 | 1,857,125 |
| Coca-Cola Bottlers Japan Holdings, Inc. | 167,708 | 2,137,576 |
| COMSYS Holdings Corp. | 67,742 | 1,630,984 |
| Concordia Financial Group Ltd. | 495,446 | 2,026,091 |
| Cosmo Energy Holdings Co., Ltd. | 141,359 | 3,186,177 |
| Dai Nippon Printing Co., Ltd. | 261,745 | 6,788,212 |
| Daicel Corp. | 333,374 | 2,555,843 |
| Daido Steel Co., Ltd. | 41,451 | 1,493,568 |
| Dai-ichi Life Holdings, Inc. | 479,032 | 10,015,273 |
| Daiichi Sankyo Co., Ltd. | 261,965 | 6,353,803 |
| Daikin Industries Ltd. | 55,144 | 10,152,624 |
| Daito Trust Construction Co., Ltd. | 49,090 | 5,421,531 |
| Daiwa House Industry Co., Ltd. | 510,329 | 14,484,615 |
| Daiwa Securities Group, Inc. | 652,755 | 3,864,106 |
| Denka Co., Ltd. | 63,132 | 1,934,933 |
| Denso Corp. | 242,513 | 16,943,800 |
| Dentsu Group, Inc. | 103,351 | 4,105,325 |
| DIC Corp. | 101,302 | 2,303,538 |
| East Japan Railway Co. | 282,695 | 16,715,025 |
| Ebara Corp. | 46,820 | 2,422,811 |
| EDION Corp. | 196,678 | 2,044,051 |
| Eisai Co., Ltd. | 64,224 | 3,188,477 |
| Electric Power Development Co., Ltd. | 259,603 | 4,113,527 |
| ENEOS Holdings, Inc. | 5,318,720 | 20,956,242 |
| FANUC Corp. | 37,237 | 6,839,581 |
| Fast Retailing Co., Ltd. | 6,288 | 3,375,620 |
| Fuji Electric Co., Ltd. | 62,610 | 3,185,540 |
| SECURITY | NUMBER
OF SHARES | VALUE ($) |
| FUJIFILM Holdings Corp. | 146,879 | 9,260,997 |
| Fujikura Ltd. * | 384,629 | 2,060,483 |
| Fujitsu Ltd. | 83,961 | 12,075,658 |
| Furukawa Electric Co., Ltd. | 96,360 | 1,903,356 |
| H2O Retailing Corp. | 250,819 | 1,872,840 |
| Hakuhodo DY Holdings, Inc. | 143,164 | 1,884,407 |
| Hankyu Hanshin Holdings, Inc. | 125,114 | 3,731,423 |
| Hanwa Co., Ltd. | 86,855 | 2,514,968 |
| Haseko Corp. | 286,609 | 3,648,090 |
| Hino Motors Ltd. | 347,014 | 3,244,924 |
| Hitachi Construction Machinery Co., Ltd. | 62,600 | 1,523,489 |
| Hitachi Ltd. | 574,682 | 28,191,476 |
| Hitachi Metals Ltd. * | 113,355 | 2,014,653 |
| Hokkaido Electric Power Co., Inc. | 417,241 | 1,825,826 |
| Honda Motor Co., Ltd. | 2,032,483 | 62,205,362 |
| Hoya Corp. | 39,049 | 5,036,448 |
| Idemitsu Kosan Co., Ltd. | 323,325 | 8,646,329 |
| IHI Corp. | 145,438 | 3,356,407 |
| Iida Group Holdings Co., Ltd. | 117,644 | 2,168,511 |
| Inpex Corp. | 1,010,225 | 10,393,893 |
| Isetan Mitsukoshi Holdings Ltd. | 556,433 | 4,468,856 |
| Isuzu Motors Ltd. | 476,681 | 6,444,040 |
| ITOCHU Corp. | 632,162 | 20,544,236 |
| J Front Retailing Co., Ltd. | 246,107 | 2,055,610 |
| Japan Airlines Co., Ltd. * | 149,560 | 2,982,759 |
| Japan Exchange Group, Inc. | 74,962 | 1,405,843 |
| Japan Post Holdings Co., Ltd. * | 1,023,707 | 8,480,303 |
| Japan Post Insurance Co., Ltd. | 103,947 | 1,781,562 |
| Japan Tobacco, Inc. | 702,438 | 12,929,616 |
| JFE Holdings, Inc. | 845,446 | 12,625,718 |
| JGC Holdings Corp. | 258,085 | 2,581,410 |
| JSR Corp. | 63,253 | 1,971,593 |
| JTEKT Corp. | 369,571 | 3,179,899 |
| Kajima Corp. | 465,267 | 6,237,224 |
| Kaneka Corp. | 62,901 | 2,050,734 |
| Kao Corp. | 152,782 | 7,136,680 |
| Kawasaki Heavy Industries Ltd. | 177,391 | 3,274,437 |
| KDDI Corp. | 986,873 | 32,183,156 |
| Keio Corp. | 34,543 | 1,409,612 |
| Kewpie Corp. | 82,774 | 1,764,360 |
| Keyence Corp. | 9,103 | 4,250,569 |
| Kikkoman Corp. | 37,611 | 2,788,782 |
| Kinden Corp. | 101,060 | 1,430,239 |
| Kintetsu Group Holdings Co., Ltd. * | 89,564 | 2,686,726 |
| Kirin Holdings Co., Ltd. | 428,597 | 7,098,318 |
| Kobe Steel Ltd. | 736,209 | 3,911,959 |
| Koito Manufacturing Co., Ltd. | 56,748 | 2,916,850 |
| Komatsu Ltd. | 497,509 | 11,414,522 |
| Konica Minolta, Inc. | 828,019 | 3,486,774 |
| K's Holdings Corp. | 199,207 | 2,144,707 |
| Kubota Corp. | 381,576 | 6,831,428 |
| Kuraray Co., Ltd. | 379,604 | 3,552,968 |
| Kyocera Corp. | 142,917 | 8,163,672 |
| Kyushu Electric Power Co., Inc. | 769,879 | 5,802,084 |
| Kyushu Railway Co. | 112,890 | 2,489,608 |
| Lixil Corp. | 145,017 | 3,217,004 |
| Makita Corp. | 71,759 | 2,538,901 |
| Marubeni Corp. | 1,428,219 | 14,923,912 |
| MatsukiyoCocokara & Co. | 76,826 | 2,941,634 |
| Mazda Motor Corp. * | 1,269,872 | 9,437,903 |
| Medipal Holdings Corp. | 205,629 | 3,743,903 |
| MEIJI Holdings Co., Ltd. | 89,674 | 5,380,051 |
| MINEBEA MITSUMI, Inc. | 152,197 | 3,298,317 |
| MISUMI Group, Inc. | 55,128 | 1,754,236 |
| Mitsubishi Chemical Holdings Corp. | 1,349,332 | 9,576,245 |
| Mitsubishi Corp. | 920,063 | 30,923,064 |
| Mitsubishi Electric Corp. | 1,460,620 | 17,519,831 |
Schwab Fundamental Index ETFs | Annual Report
Schwab Fundamental International Large Company Index ETF
Portfolio Holdings as of February 28, 2022 (continued)
| SECURITY | NUMBER
OF SHARES | VALUE ($) |
| Mitsubishi Estate Co., Ltd. | 414,514 | 6,323,430 |
| Mitsubishi Gas Chemical Co., Inc. | 140,642 | 2,487,413 |
| Mitsubishi Heavy Industries Ltd. | 381,968 | 11,262,542 |
| Mitsubishi Materials Corp. | 214,489 | 3,860,523 |
| Mitsubishi Motors Corp. * | 1,157,961 | 3,016,178 |
| Mitsubishi UFJ Financial Group, Inc. | 6,086,853 | 37,670,578 |
| Mitsui & Co., Ltd. | 890,620 | 22,158,208 |
| Mitsui Chemicals, Inc. | 152,619 | 3,893,159 |
| Mitsui Fudosan Co., Ltd. | 385,875 | 8,566,810 |
| Mitsui Mining & Smelting Co., Ltd. | 54,489 | 1,591,973 |
| Mitsui OSK Lines Ltd. | 76,217 | 6,180,740 |
| Mizuho Financial Group, Inc. | 1,326,664 | 17,565,987 |
| MS&AD Insurance Group Holdings, Inc. | 285,753 | 9,688,435 |
| Murata Manufacturing Co., Ltd. | 129,815 | 8,776,813 |
| Nagase & Co., Ltd. | 158,519 | 2,526,945 |
| Nagoya Railroad Co., Ltd. * | 138,359 | 2,532,327 |
| NEC Corp. | 147,583 | 6,349,240 |
| NGK Insulators Ltd. | 154,471 | 2,387,310 |
| NGK Spark Plug Co., Ltd. | 172,000 | 3,088,309 |
| NH Foods Ltd. | 120,196 | 4,508,328 |
| NHK Spring Co., Ltd. | 257,657 | 2,044,702 |
| Nichirei Corp. | 71,550 | 1,573,572 |
| Nidec Corp. | 51,477 | 4,417,167 |
| Nikon Corp. | 322,272 | 3,338,142 |
| Nintendo Co., Ltd. | 13,350 | 6,725,131 |
| Nippon Electric Glass Co., Ltd. | 72,465 | 1,737,776 |
| Nippon Express Holdings, Inc. | 66,391 | 4,023,522 |
| Nippon Light Metal Holdings Co., Ltd. | 103,291 | 1,651,939 |
| Nippon Paper Industries Co., Ltd. | 208,097 | 1,983,855 |
| Nippon Shokubai Co., Ltd. | 32,843 | 1,596,881 |
| Nippon Steel Corp. | 990,633 | 18,135,443 |
| Nippon Steel Trading Corp. | 42,090 | 1,988,015 |
| Nippon Telegraph & Telephone Corp. | 986,975 | 28,218,873 |
| Nippon Yusen K.K. | 94,612 | 8,765,010 |
| Nissan Motor Co., Ltd. * | 3,616,298 | 17,121,487 |
| Nisshin Seifun Group, Inc. | 166,184 | 2,351,899 |
| Nissin Foods Holdings Co., Ltd. | 21,603 | 1,719,987 |
| Nitori Holdings Co., Ltd. | 15,409 | 2,307,169 |
| Nitto Denko Corp. | 72,624 | 5,265,122 |
| NOK Corp. | 184,612 | 1,923,459 |
| Nomura Holdings, Inc. | 1,257,191 | 5,744,820 |
| Nomura Real Estate Holdings, Inc. | 71,740 | 1,784,546 |
| NSK Ltd. | 505,400 | 3,264,750 |
| NTN Corp. * | 691,472 | 1,302,795 |
| NTT Data Corp. | 228,278 | 4,306,908 |
| Obayashi Corp. | 748,664 | 6,246,721 |
| Odakyu Electric Railway Co., Ltd. | 86,100 | 1,415,875 |
| Oji Holdings Corp. | 873,603 | 4,452,398 |
| Olympus Corp. | 165,607 | 3,306,388 |
| Omron Corp. | 53,208 | 3,584,928 |
| Ono Pharmaceutical Co., Ltd. | 94,719 | 2,324,491 |
| Oriental Land Co., Ltd. | 16,464 | 3,020,485 |
| ORIX Corp. | 542,581 | 10,755,046 |
| Osaka Gas Co., Ltd. | 353,938 | 6,481,053 |
| Otsuka Corp. | 36,311 | 1,398,214 |
| Otsuka Holdings Co., Ltd. | 172,155 | 5,923,597 |
| PALTAC Corp. | 34,093 | 1,317,246 |
| Pan Pacific International Holdings Corp. | 101,829 | 1,662,153 |
| Panasonic Corp. | 1,811,375 | 18,715,314 |
| Persol Holdings Co., Ltd. | 82,780 | 1,835,642 |
| Rakuten Group, Inc. | 161,584 | 1,366,467 |
| Recruit Holdings Co., Ltd. | 172,547 | 7,219,483 |
| Renesas Electronics Corp. * | 160,509 | 1,867,437 |
| Resona Holdings, Inc. | 1,124,718 | 5,056,470 |
| Ricoh Co., Ltd. | 619,063 | 5,262,103 |
| Rohm Co., Ltd. | 31,240 | 2,449,292 |
| SECURITY | NUMBER
OF SHARES | VALUE ($) |
| Ryohin Keikaku Co., Ltd. | 103,393 | 1,516,221 |
| Sankyu, Inc. | 42,079 | 1,455,913 |
| Santen Pharmaceutical Co., Ltd. | 129,518 | 1,466,390 |
| SBI Holdings, Inc. | 74,647 | 1,944,354 |
| Secom Co., Ltd. | 72,445 | 5,297,433 |
| Seibu Holdings, Inc. * | 144,637 | 1,505,707 |
| Seiko Epson Corp. | 208,104 | 3,185,477 |
| Seino Holdings Co., Ltd. | 157,137 | 1,639,928 |
| Sekisui Chemical Co., Ltd. | 262,041 | 4,279,567 |
| Sekisui House Ltd. | 424,106 | 8,638,617 |
| Seven & i Holdings Co., Ltd. | 484,982 | 23,542,734 |
| SG Holdings Co., Ltd. | 118,186 | 2,495,579 |
| Shikoku Electric Power Co., Inc. | 247,266 | 1,906,422 |
| Shimadzu Corp. | 51,055 | 1,819,672 |
| Shimamura Co., Ltd. | 22,762 | 2,053,373 |
| Shimano, Inc. | 11,061 | 2,552,649 |
| Shimizu Corp. | 602,256 | 3,979,308 |
| Shin-Etsu Chemical Co., Ltd. | 81,984 | 12,577,880 |
| Shionogi & Co., Ltd. | 69,385 | 4,603,176 |
| Shiseido Co., Ltd. | 63,912 | 3,643,553 |
| Showa Denko K.K. | 162,554 | 2,970,924 |
| SMC Corp. | 8,345 | 4,930,560 |
| Softbank Corp. | 1,425,874 | 17,957,284 |
| SoftBank Group Corp. | 451,142 | 20,074,693 |
| Sojitz Corp. | 295,555 | 4,875,663 |
| Sompo Holdings, Inc. | 171,304 | 7,466,430 |
| Sony Group Corp. | 221,529 | 22,715,498 |
| Stanley Electric Co., Ltd. | 90,598 | 2,145,090 |
| Subaru Corp. | 804,309 | 13,223,001 |
| SUMCO Corp. | 77,123 | 1,263,565 |
| Sumitomo Chemical Co., Ltd. | 1,466,286 | 7,002,017 |
| Sumitomo Corp. | 980,310 | 15,950,518 |
| Sumitomo Electric Industries Ltd. | 952,589 | 12,592,288 |
| Sumitomo Forestry Co., Ltd. | 122,214 | 2,347,188 |
| Sumitomo Heavy Industries Ltd. | 126,738 | 3,064,600 |
| Sumitomo Metal Mining Co., Ltd. | 101,928 | 5,085,116 |
| Sumitomo Mitsui Financial Group, Inc. | 711,258 | 25,449,049 |
| Sumitomo Mitsui Trust Holdings, Inc. | 172,047 | 6,139,467 |
| Sumitomo Realty & Development Co., Ltd. | 131,809 | 3,875,019 |
| Sumitomo Rubber Industries Ltd. | 246,348 | 2,376,320 |
| Suntory Beverage & Food Ltd. | 72,222 | 2,884,491 |
| Suzuken Co., Ltd. | 121,944 | 3,928,042 |
| Suzuki Motor Corp. | 331,927 | 13,179,094 |
| Sysmex Corp. | 21,289 | 1,686,484 |
| T&D Holdings, Inc. | 245,529 | 3,589,936 |
| Taiheiyo Cement Corp. | 157,158 | 3,011,484 |
| Taisei Corp. | 181,949 | 6,026,789 |
| Taiyo Yuden Co., Ltd. | 33,150 | 1,467,897 |
| Takashimaya Co., Ltd. | 221,012 | 2,154,951 |
| Takeda Pharmaceutical Co., Ltd. | 492,221 | 14,962,151 |
| TDK Corp. | 155,116 | 6,195,212 |
| Teijin Ltd. | 241,927 | 2,905,014 |
| Terumo Corp. | 97,403 | 3,136,685 |
| The Chugoku Electric Power Co., Inc. | 324,138 | 2,538,506 |
| The Kansai Electric Power Co., Inc. | 1,041,807 | 10,510,786 |
| The Yokohama Rubber Co., Ltd. | 103,389 | 1,442,554 |
| TIS, Inc. | 81,955 | 1,921,237 |
| Tobu Railway Co., Ltd. | 108,417 | 2,659,240 |
| Toho Gas Co., Ltd. | 48,827 | 1,303,608 |
| Toho Holdings Co., Ltd. | 113,613 | 1,866,341 |
| Tohoku Electric Power Co., Inc. | 938,033 | 6,083,878 |
| Tokio Marine Holdings, Inc. | 282,261 | 16,110,995 |
| Tokyo Electric Power Co. Holdings, Inc. * | 5,721,586 | 17,983,192 |
| Tokyo Electron Ltd. | 20,783 | 10,063,537 |
| Tokyo Gas Co., Ltd. | 460,438 | 9,386,659 |
| Tokyu Corp. | 276,455 | 3,677,266 |
Schwab Fundamental Index ETFs | Annual Report
Schwab Fundamental International Large Company Index ETF
Portfolio Holdings as of February 28, 2022 (continued)
| SECURITY | NUMBER
OF SHARES | VALUE ($) |
| Tokyu Fudosan Holdings Corp. | 459,226 | 2,547,822 |
| Toppan, Inc. | 322,465 | 6,319,110 |
| Toray Industries, Inc. | 1,357,778 | 7,777,088 |
| Toshiba Corp. | 222,935 | 8,859,331 |
| Tosoh Corp. | 261,152 | 4,054,176 |
| TOTO Ltd. | 50,492 | 2,119,634 |
| Toyo Seikan Group Holdings Ltd. | 242,437 | 3,226,880 |
| Toyo Suisan Kaisha Ltd. | 48,240 | 2,027,190 |
| Toyoda Gosei Co., Ltd. | 85,280 | 1,614,156 |
| Toyota Industries Corp. | 64,857 | 4,921,643 |
| Toyota Motor Corp. | 6,732,739 | 125,009,441 |
| Toyota Tsusho Corp. | 199,321 | 8,246,274 |
| TS Tech Co., Ltd. | 144,721 | 1,942,597 |
| Tsuruha Holdings, Inc. | 18,050 | 1,440,239 |
| Ube Industries Ltd. | 149,950 | 2,765,303 |
| Unicharm Corp. | 63,285 | 2,373,703 |
| West Japan Railway Co. | 155,274 | 6,676,074 |
| Yakult Honsha Co., Ltd. | 36,752 | 1,987,974 |
| Yamada Holdings Co., Ltd. | 1,017,606 | 3,525,286 |
| Yamaha Corp. | 46,102 | 2,145,489 |
| Yamaha Motor Co., Ltd. | 233,087 | 5,213,216 |
| Yamato Holdings Co., Ltd. | 216,954 | 4,234,535 |
| Yamazaki Baking Co., Ltd. | 137,911 | 1,864,358 |
| Yaskawa Electric Corp. | 48,464 | 1,922,991 |
| Yokogawa Electric Corp. | 120,212 | 1,925,688 |
| Z Holdings Corp. | 570,414 | 2,761,561 |
| | | 1,814,178,795 |
| |
| Netherlands 2.4% |
| Aalberts N.V. | 30,337 | 1,693,845 |
| ABN AMRO Bank N.V. | 401,477 | 5,349,040 |
| Aegon N.V. | 1,375,361 | 6,820,319 |
| Akzo Nobel N.V. | 89,039 | 8,500,735 |
| APERAM S.A. | 35,081 | 1,963,845 |
| ArcelorMittal S.A. | 625,815 | 19,474,280 |
| ASML Holding N.V. | 15,922 | 10,710,487 |
| ASR Nederland N.V. | 83,142 | 3,598,129 |
| Heineken Holding N.V. | 51,570 | 4,213,931 |
| Heineken N.V. | 65,386 | 6,637,651 |
| ING Groep N.V. | 1,935,248 | 22,819,204 |
| Koninklijke Ahold Delhaize N.V. | 890,293 | 27,479,383 |
| Koninklijke DSM N.V. | 36,520 | 6,862,526 |
| Koninklijke KPN N.V. | 1,635,508 | 5,602,860 |
| Koninklijke Philips N.V. | 271,327 | 9,246,255 |
| NN Group N.V. | 175,870 | 8,450,645 |
| Randstad N.V. | 84,147 | 5,736,997 |
| Signify N.V. | 82,958 | 4,247,075 |
| Unibail-Rodamco-Westfield * | 81,019 | 6,177,119 |
| Universal Music Group NV | 197,161 | 4,502,106 |
| Wolters Kluwer N.V. | 40,709 | 4,152,687 |
| | | 174,239,119 |
| |
| New Zealand 0.1% |
| Contact Energy Ltd. | 323,034 | 1,775,139 |
| Fletcher Building Ltd. | 623,221 | 2,830,041 |
| Spark New Zealand Ltd. | 789,284 | 2,406,336 |
| | | 7,011,516 |
| |
| Norway 0.8% |
| DNB Bank A.S.A. | 328,674 | 7,366,867 |
| Equinor A.S.A. | 751,432 | 23,794,015 |
| Mowi A.S.A. | 147,356 | 3,793,806 |
| Norsk Hydro A.S.A. | 845,600 | 8,035,154 |
| Orkla A.S.A. | 301,451 | 2,829,515 |
| Subsea 7 S.A. | 309,637 | 2,116,207 |
| SECURITY | NUMBER
OF SHARES | VALUE ($) |
| Telenor A.S.A. | 389,483 | 5,777,812 |
| Yara International A.S.A. | 100,594 | 5,124,847 |
| | | 58,838,223 |
| |
| Poland 0.3% |
| Bank Polska Kasa Opieki S.A. | 78,402 | 2,166,433 |
| Grupa Lotos S.A. * | 147,742 | 1,915,508 |
| KGHM Polska Miedz S.A. | 49,200 | 1,946,361 |
| PGE Polska Grupa Energetyczna S.A. * | 806,856 | 1,573,403 |
| Polski Koncern Naftowy Orlen S.A. | 538,574 | 9,148,098 |
| Polskie Gornictwo Naftowe i Gazownictwo S.A. | 1,406,053 | 1,871,376 |
| Powszechna Kasa Oszczednosci Bank Polski S.A. * | 260,229 | 2,508,673 |
| Powszechny Zaklad Ubezpieczen S.A. | 325,057 | 2,450,651 |
| | | 23,580,503 |
| |
| Portugal 0.2% |
| EDP - Energias de Portugal S.A. | 1,447,303 | 7,094,168 |
| Galp Energia, SGPS, S.A. | 499,005 | 5,525,238 |
| Jeronimo Martins, SGPS, S.A. | 109,253 | 2,383,701 |
| | | 15,003,107 |
| |
| Republic of Korea 5.2% |
| Amorepacific Corp. | 10,089 | 1,543,956 |
| BNK Financial Group, Inc. | 305,991 | 2,005,414 |
| CJ CheilJedang Corp. | 6,538 | 2,058,164 |
| CJ Corp. | 31,176 | 2,180,648 |
| Coway Co., Ltd. | 27,302 | 1,637,189 |
| DB Insurance Co., Ltd. | 56,680 | 2,913,315 |
| E-MART, Inc. | 27,764 | 3,001,888 |
| GS Engineering & Construction Corp. | 57,696 | 2,056,201 |
| GS Holdings Corp. | 105,839 | 3,521,071 |
| Hana Financial Group, Inc. | 189,192 | 7,663,035 |
| Hankook Tire & Technology Co., Ltd. | 73,832 | 2,161,506 |
| Hanwha Corp. | 97,076 | 2,450,415 |
| Hanwha Solutions Corp. * | 50,417 | 1,419,400 |
| Hyundai Engineering & Construction Co., Ltd. | 83,706 | 3,014,488 |
| Hyundai Glovis Co., Ltd. | 18,699 | 2,737,160 |
| Hyundai Heavy Industries Holdings Co., Ltd. | 91,420 | 3,908,170 |
| Hyundai Marine & Fire Insurance Co., Ltd. | 102,196 | 2,447,910 |
| Hyundai Mobis Co., Ltd. | 56,947 | 10,609,330 |
| Hyundai Motor Co. | 103,443 | 15,055,953 |
| Hyundai Steel Co. | 132,035 | 4,359,620 |
| Industrial Bank of Korea | 232,645 | 2,080,038 |
| KB Financial Group, Inc. | 200,424 | 9,951,606 |
| Kia Corp. | 197,282 | 12,109,129 |
| Korea Electric Power Corp. | 677,340 | 13,069,645 |
| Korea Gas Corp. | 61,787 | 2,109,499 |
| Korea Shipbuilding & Offshore Engineering Co., Ltd. * | 33,202 | 2,435,577 |
| Korea Zinc Co., Ltd. | 6,316 | 2,889,175 |
| Korean Air Lines Co., Ltd. * | 86,417 | 2,105,891 |
| KT&G Corp. | 64,694 | 4,293,742 |
| LG Chem Ltd. | 11,238 | 5,280,883 |
| LG Corp. | 29,477 | 1,843,615 |
| LG Display Co., Ltd. | 378,732 | 5,890,372 |
| LG Electronics, Inc. | 80,554 | 8,274,146 |
| LG Household & Health Care Ltd. | 2,138 | 1,689,275 |
| LG Uplus Corp. | 278,531 | 3,046,270 |
| Lotte Chemical Corp. | 18,407 | 3,368,021 |
Schwab Fundamental Index ETFs | Annual Report
Schwab Fundamental International Large Company Index ETF
Portfolio Holdings as of February 28, 2022 (continued)
| SECURITY | NUMBER
OF SHARES | VALUE ($) |
| Lotte Shopping Co., Ltd. | 28,163 | 1,998,007 |
| LX Holdings Corp. * | 25,752 | 209,040 |
| NAVER Corp. | 7,218 | 1,909,032 |
| POSCO | 92,153 | 21,843,561 |
| Posco International Corp. | 99,631 | 1,711,133 |
| Samsung C&T Corp. | 42,196 | 3,860,407 |
| Samsung Electro-Mechanics Co., Ltd. | 20,348 | 2,809,305 |
| Samsung Electronics Co., Ltd. | 2,035,799 | 122,078,520 |
| Samsung Fire & Marine Insurance Co., Ltd. | 28,224 | 4,471,803 |
| Samsung Life Insurance Co., Ltd. | 41,754 | 2,076,674 |
| Samsung SDI Co., Ltd. | 4,953 | 2,257,449 |
| Samsung SDS Co., Ltd. | 16,536 | 1,925,429 |
| Shinhan Financial Group Co., Ltd. | 319,894 | 10,389,538 |
| SK Hynix, Inc. | 226,626 | 23,278,006 |
| SK Innovation Co., Ltd. * | 51,188 | 8,535,945 |
| SK Square Co., Ltd. * | 34,715 | 1,611,092 |
| SK Telecom Co., Ltd. | 54,282 | 2,465,004 |
| SK, Inc. | 40,603 | 7,682,607 |
| S-Oil Corp. | 33,491 | 2,353,715 |
| Woori Financial Group, Inc. | 433,709 | 5,158,264 |
| | | 385,806,248 |
| |
| Singapore 0.8% |
| Capitaland Investment Ltd. * | 1,624,992 | 4,417,268 |
| ComfortDelGro Corp., Ltd. | 1,932,483 | 2,007,294 |
| DBS Group Holdings Ltd. | 490,771 | 12,227,246 |
| Jardine Cycle & Carriage Ltd. | 109,993 | 1,769,676 |
| Keppel Corp., Ltd. | 783,846 | 3,458,866 |
| Oversea-Chinese Banking Corp., Ltd. | 1,077,786 | 9,265,728 |
| Singapore Airlines Ltd. * | 739,084 | 2,771,327 |
| Singapore Telecommunications Ltd. | 4,354,309 | 8,083,435 |
| United Overseas Bank Ltd. | 413,199 | 9,104,410 |
| Venture Corp., Ltd. | 124,422 | 1,606,776 |
| Wilmar International Ltd. | 1,424,790 | 4,597,282 |
| | | 59,309,308 |
| |
| Spain 3.1% |
| Acciona S.A. | 9,865 | 1,696,405 |
| ACS, Actividades de Construccion y Servicios S.A. | 216,317 | 5,301,548 |
| Aena SME S.A. * | 20,378 | 3,348,599 |
| Amadeus IT Group S.A. * | 82,723 | 5,569,296 |
| Banco Bilbao Vizcaya Argentaria S.A. | 4,707,155 | 27,968,647 |
| Banco de Sabadell S.A. * | 8,839,864 | 7,692,942 |
| Banco Santander S.A. | 15,516,841 | 52,015,428 |
| Bankinter S.A. | 247,393 | 1,416,035 |
| CaixaBank S.A. | 2,150,113 | 7,100,124 |
| Enagas S.A. | 94,601 | 2,010,893 |
| Endesa S.A. | 170,355 | 3,762,757 |
| Ferrovial S.A. | 103,079 | 2,827,308 |
| Grifols S.A. | 90,007 | 1,720,147 |
| Iberdrola S.A. | 2,277,836 | 26,045,189 |
| Industria de Diseno Textil S.A. | 261,960 | 6,943,913 |
| Linea Directa Aseguradora S.A. Cia de Seguros y Reaseguros | 260,442 | 438,500 |
| Mapfre S.A. | 908,040 | 1,796,573 |
| Naturgy Energy Group S.A. | 185,736 | 5,013,109 |
| Red Electrica Corp. S.A. | 149,445 | 2,992,046 |
| Repsol S.A. | 1,748,265 | 22,829,419 |
| Telefonica S.A. | 7,560,336 | 36,310,822 |
| | | 224,799,700 |
| |
| SECURITY | NUMBER
OF SHARES | VALUE ($) |
| Sweden 1.7% |
| Alfa Laval AB | 60,608 | 1,990,685 |
| Assa Abloy AB, B Shares | 176,021 | 4,692,302 |
| Atlas Copco AB, A Shares | 93,248 | 4,884,598 |
| Atlas Copco AB, B Shares | 55,042 | 2,523,434 |
| Boliden AB | 131,114 | 5,883,196 |
| Electrolux AB, B Shares | 105,035 | 1,900,227 |
| Epiroc AB, A Shares | 70,772 | 1,342,600 |
| Epiroc AB, B Shares | 48,362 | 789,619 |
| Essity AB, B Shares | 186,398 | 4,832,658 |
| H & M Hennes & Mauritz AB, B Shares | 450,508 | 7,659,142 |
| Hexagon AB, B Shares | 203,118 | 2,770,808 |
| Husqvarna AB, B Shares | 136,024 | 1,649,461 |
| Industrivarden AB, A Shares | 39,376 | 1,098,066 |
| Industrivarden AB, C Shares | 30,511 | 836,950 |
| Investor AB, A Shares | 111,130 | 2,485,595 |
| Investor AB, B Shares | 364,582 | 7,497,761 |
| Lundin Energy AB | 59,898 | 2,219,314 |
| Sandvik AB | 260,348 | 5,707,232 |
| Securitas AB, B Shares | 214,154 | 2,608,231 |
| Skandinaviska Enskilda Banken AB, A Shares | 397,557 | 4,620,797 |
| Skanska AB, B Shares | 173,416 | 3,959,563 |
| SKF AB, B Shares | 171,762 | 3,199,313 |
| SSAB AB, A Shares * | 170,540 | 1,083,425 |
| SSAB AB, B Shares * | 587,501 | 3,225,647 |
| Svenska Cellulosa AB SCA, B Shares | 119,116 | 1,962,507 |
| Svenska Handelsbanken AB, A Shares | 516,269 | 4,966,755 |
| Swedbank AB, A Shares | 436,322 | 7,097,132 |
| Swedish Match AB | 275,104 | 2,021,117 |
| Tele2 AB, B Shares | 174,537 | 2,325,446 |
| Telefonaktiebolaget LM Ericsson, B Shares | 678,917 | 6,322,901 |
| Telia Co. AB | 1,714,115 | 6,413,720 |
| Trelleborg AB, B Shares | 87,078 | 1,771,416 |
| Volvo AB, A Shares | 87,987 | 1,731,176 |
| Volvo AB, B Shares | 553,124 | 10,770,394 |
| | | 124,843,188 |
| |
| Switzerland 5.0% |
| ABB Ltd. | 402,654 | 13,671,232 |
| Adecco Group AG | 149,045 | 7,073,322 |
| Alcon, Inc. | 71,650 | 5,551,128 |
| Baloise Holding AG | 14,429 | 2,423,575 |
| Barry Callebaut AG | 705 | 1,629,081 |
| Chocoladefabriken Lindt & Spruengli AG | 15 | 1,692,190 |
| Chocoladefabriken Lindt & Spruengli AG, Participation Certificate | 139 | 1,480,980 |
| Cie Financiere Richemont S.A. | 100,469 | 13,699,572 |
| Clariant AG * | 84,938 | 1,535,448 |
| Credit Suisse Group AG | 678,307 | 5,734,317 |
| DKSH Holding AG | 23,563 | 2,017,411 |
| Dufry AG * | 39,517 | 1,865,476 |
| Geberit AG | 5,184 | 3,398,177 |
| Georg Fischer AG | 1,353 | 1,673,830 |
| Givaudan S.A. | 1,025 | 4,302,442 |
| Holcim Ltd. * | 279,663 | 14,049,450 |
| Julius Baer Group Ltd. | 37,611 | 2,205,539 |
| Kuehne & Nagel International AG | 9,935 | 2,722,392 |
| Lonza Group AG | 5,191 | 3,606,456 |
| Nestle S.A. | 632,587 | 82,588,992 |
| Novartis AG | 475,432 | 41,633,012 |
| Partners Group Holding AG | 1,447 | 1,965,977 |
| Roche Holding AG | 148,127 | 56,485,074 |
| Roche Holding AG, Bearer Shares | 5,486 | 2,298,565 |
Schwab Fundamental Index ETFs | Annual Report
Schwab Fundamental International Large Company Index ETF
Portfolio Holdings as of February 28, 2022 (continued)
| SECURITY | NUMBER
OF SHARES | VALUE ($) |
| Schindler Holding AG | 3,988 | 899,794 |
| Schindler Holding AG, Participation Certificate | 8,267 | 1,905,794 |
| SGS S.A. | 1,181 | 3,391,940 |
| Sika AG | 11,259 | 3,755,250 |
| Sonova Holding AG | 5,728 | 2,228,891 |
| Swiss Life Holding AG | 11,458 | 6,998,815 |
| Swiss Prime Site AG | 19,450 | 1,911,186 |
| Swiss Re AG | 132,116 | 12,646,386 |
| Swisscom AG | 11,553 | 6,933,437 |
| The Swatch Group AG | 22,480 | 1,342,748 |
| The Swatch Group AG, Bearer Shares | 15,336 | 4,765,702 |
| UBS Group AG | 1,108,854 | 20,407,651 |
| Zurich Insurance Group AG | 50,316 | 23,121,942 |
| | | 365,613,174 |
| |
| United Kingdom 17.7% |
| 3i Group plc | 190,137 | 3,407,080 |
| abrdn plc | 1,761,663 | 4,885,793 |
| Admiral Group plc | 40,427 | 1,614,813 |
| Anglo American plc | 410,939 | 21,079,167 |
| Antofagasta plc | 89,514 | 1,826,804 |
| Ashtead Group plc | 76,158 | 4,982,543 |
| Associated British Foods plc | 202,177 | 5,208,405 |
| AstraZeneca plc | 255,499 | 31,055,695 |
| Aviva plc | 1,899,669 | 10,700,207 |
| BAE Systems plc | 1,431,373 | 13,820,246 |
| Balfour Beatty plc | 494,440 | 1,590,870 |
| Barclays plc | 7,566,833 | 18,567,445 |
| Barratt Developments plc | 593,762 | 4,867,718 |
| Bellway plc | 77,644 | 3,004,519 |
| Berkeley Group Holdings plc | 53,886 | 2,816,869 |
| BP plc | 25,023,739 | 122,064,153 |
| British American Tobacco plc | 1,084,396 | 47,454,465 |
| BT Group plc | 9,669,433 | 24,164,014 |
| Bunzl plc | 119,286 | 4,751,946 |
| Burberry Group plc | 126,755 | 3,299,428 |
| Carnival plc * | 106,181 | 2,007,095 |
| Centrica plc * | 11,665,835 | 12,096,361 |
| Coca-Cola HBC AG * | 66,295 | 1,693,634 |
| Compass Group plc | 600,392 | 13,646,463 |
| CRH plc | 317,534 | 14,426,101 |
| Croda International plc | 17,651 | 1,772,454 |
| Currys plc | 2,002,053 | 2,522,394 |
| DCC plc | 61,135 | 4,806,836 |
| Diageo plc | 378,608 | 18,922,907 |
| Direct Line Insurance Group plc | 1,010,581 | 4,014,961 |
| Drax Group plc | 302,612 | 2,866,571 |
| DS Smith plc | 602,370 | 2,785,162 |
| easyJet plc * | 237,748 | 1,922,285 |
| Evraz plc | 332,033 | 644,869 |
| Experian plc | 118,044 | 4,645,450 |
| Ferguson plc | 72,108 | 11,044,121 |
| Firstgroup plc * | 1,804,164 | 2,425,580 |
| GlaxoSmithKline plc | 1,888,223 | 39,153,085 |
| Glencore plc * | 11,355,899 | 67,369,441 |
| Hays plc | 1,167,869 | 2,126,404 |
| HSBC Holdings plc | 10,637,671 | 73,449,379 |
| Imperial Brands plc | 762,314 | 16,764,270 |
| Inchcape plc | 309,134 | 3,098,412 |
| Informa plc * | 375,251 | 2,992,764 |
| InterContinental Hotels Group plc * | 36,827 | 2,587,246 |
| International Consolidated Airlines Group S.A. * | 1,260,429 | 2,512,419 |
| Intertek Group plc | 28,861 | 2,084,914 |
| ITV plc * | 2,282,192 | 3,388,249 |
| J Sainsbury plc | 1,959,244 | 7,247,648 |
| SECURITY | NUMBER
OF SHARES | VALUE ($) |
| John Wood Group plc * | 781,303 | 1,891,158 |
| Johnson Matthey plc | 157,624 | 3,982,396 |
| Kingfisher plc | 1,763,894 | 7,246,853 |
| Land Securities Group plc | 218,129 | 2,324,423 |
| Legal & General Group plc | 2,231,054 | 8,298,032 |
| Lloyds Banking Group plc | 41,515,746 | 26,980,124 |
| London Stock Exchange Group plc | 18,089 | 1,595,571 |
| M&G plc | 4,094,247 | 11,305,537 |
| Marks & Spencer Group plc * | 2,553,136 | 5,988,074 |
| Meggitt plc * | 308,753 | 3,127,735 |
| Melrose Industries plc | 975,571 | 1,940,552 |
| Micro Focus International plc | 426,052 | 2,200,874 |
| Mondi plc | 254,841 | 5,373,478 |
| National Grid plc | 1,688,793 | 25,623,238 |
| Natwest Group plc | 1,038,730 | 3,201,367 |
| Next plc | 30,931 | 2,847,846 |
| Pearson plc | 372,493 | 3,238,657 |
| Pennon Group plc | 103,705 | 1,447,121 |
| Persimmon plc | 164,237 | 5,317,410 |
| Polymetal International plc | 85,317 | 402,033 |
| Prudential plc | 534,178 | 8,145,678 |
| Reckitt Benckiser Group plc | 140,957 | 11,954,853 |
| RELX plc | 320,469 | 9,808,060 |
| Rentokil Initial plc | 249,962 | 1,703,093 |
| Rio Tinto plc | 491,584 | 38,196,458 |
| Rolls-Royce Holdings plc * | 2,180,539 | 3,028,140 |
| Royal Mail plc | 904,901 | 4,767,973 |
| Severn Trent plc | 82,203 | 3,172,111 |
| Shell plc | 10,101,007 | 267,265,791 |
| Smith & Nephew plc | 241,173 | 4,326,452 |
| Smiths Group plc | 150,931 | 3,096,405 |
| Smurfit Kappa Group plc | 91,563 | 4,552,995 |
| SSE plc | 561,691 | 12,845,951 |
| Standard Chartered plc | 1,214,296 | 8,680,816 |
| Tate & Lyle plc | 252,830 | 2,555,116 |
| Taylor Wimpey plc | 2,256,677 | 4,549,416 |
| Tesco plc | 6,250,531 | 24,300,329 |
| The Sage Group plc | 231,930 | 2,187,059 |
| Travis Perkins plc | 144,486 | 2,833,325 |
| TUI AG *(a) | 1,234,484 | 3,988,538 |
| Unilever plc | 689,545 | 34,662,521 |
| United Utilities Group plc | 240,145 | 3,462,197 |
| Vodafone Group plc | 29,504,805 | 52,034,584 |
| Whitbread plc * | 77,585 | 3,043,876 |
| Wickes Group plc | 171,009 | 414,389 |
| WPP plc | 776,202 | 11,013,540 |
| | | 1,307,101,800 |
Total Common Stocks
(Cost $6,294,028,200) | 7,275,635,439 |
|
| PREFERRED STOCKS 0.9% OF NET ASSETS |
| |
| Germany 0.6% |
| Bayerische Motoren Werke AG | 51,282 | 4,199,038 |
| Fuchs Petrolub SE | 37,921 | 1,512,048 |
| Henkel AG & Co. KGaA | 71,781 | 5,711,436 |
| Volkswagen AG | 152,918 | 30,579,718 |
| | | 42,002,240 |
| |
| Italy 0.0% |
| Telecom Italia S.p.A. - RSP | 11,302,717 | 4,731,507 |
| |
Schwab Fundamental Index ETFs | Annual Report
Schwab Fundamental International Large Company Index ETF
Portfolio Holdings as of February 28, 2022 (continued)
| SECURITY | NUMBER
OF SHARES | VALUE ($) |
| Republic of Korea 0.3% |
| Amorepacific Corp. | 1,593 | 101,620 |
| Hyundai Motor Co., Ltd. | 20,324 | 1,479,062 |
| Hyundai Motor Co., Ltd. 2nd | 24,928 | 1,828,627 |
| LG Chem Ltd. | 2,559 | 575,714 |
| LG Electronics, Inc. | 14,270 | 707,358 |
| LG Household & Health Care Ltd. | 215 | 93,879 |
| Samsung Electronics Co., Ltd. | 345,327 | 18,984,584 |
| | | 23,770,844 |
Total Preferred Stocks
(Cost $61,278,573) | 70,504,591 |
| | | |
| SHORT-TERM INVESTMENTS 0.2% OF NET ASSETS |
| |
| Money Market Funds 0.2% |
| State Street Institutional U.S. Government Money Market Fund, Premier Class 0.03% (c) | 7,526,114 | 7,526,114 |
| State Street Institutional U.S. Government Money Market Fund, Premier Class 0.03% (c)(d) | 5,468,050 | 5,468,050 |
| | | 12,994,164 |
Total Short-Term Investments
(Cost $12,994,164) | 12,994,164 |
Total Investments in Securities
(Cost $6,368,300,937) | 7,359,134,194 |
| | NUMBER OF
CONTRACTS | NOTIONAL
AMOUNT
($) | CURRENT VALUE/
UNREALIZED
DEPRECIATION
($) |
| FUTURES CONTRACTS |
| Long | | | |
| MSCI EAFE Index, expires 03/18/22 | 316 | 34,124,840 | (1,157,931) |
| * | Non-income producing security. |
| (a) | All or a portion of this security is on loan. Securities on loan were valued at $4,643,277. |
| (b) | Fair valued by management using significant unobservable inputs in accordance with procedures approved by the fund’s Board of Trustees. |
| (c) | The rate shown is the 7-day yield. |
| (d) | Security purchased with cash collateral received for securities on loan. |
| REIT — | Real Estate Investment Trust |
| RSP — | Risparmio (Savings Shares) |
The following is a summary of the inputs used to value the fund’s investments as of February 28, 2022 (see financial note 2(a) for additional information):
| DESCRIPTION | QUOTED PRICES IN
ACTIVE MARKETS FOR
IDENTICAL ASSETS
(LEVEL 1) | OTHER SIGNIFICANT
OBSERVABLE INPUTS
(LEVEL 2) | SIGNIFICANT
UNOBSERVABLE INPUTS
(LEVEL 3) | TOTAL |
| Assets | | | | |
| Common Stocks1 | $7,149,146,281 | $— | $— | $7,149,146,281 |
| Hong Kong | 125,891,676 | — | 597,482 | 126,489,158 |
| Preferred Stocks1 | 70,504,591 | — | — | 70,504,591 |
| Short-Term Investments1 | 12,994,164 | — | — | 12,994,164 |
| Liabilities | | | | |
| Futures Contracts2 | (1,157,931) | — | — | (1,157,931) |
| Total | $7,357,378,781 | $— | $597,482 | $7,357,976,263 |
| 1 | As categorized in the Portfolio Holdings. |
| 2 | Futures contracts are reported at cumulative unrealized appreciation or depreciation. |
Fund investments in mutual funds are classified as Level 1, without consideration to the classification level of the underlying securities held by the mutual funds, which could be Level 1, Level 2 or Level 3.
Schwab Fundamental Index ETFs | Annual Report
Schwab Fundamental International Large Company Index ETF
Statement of Assets and Liabilities
As of February 28, 2022
| Assets |
| Investments in securities, at value - unaffiliated (cost $6,368,300,937) including securities on loan of $4,643,277 | | $7,359,134,194 |
| Foreign currency, at value (cost $2,516,889) | | 2,517,663 |
| Deposit with broker for futures contracts | | 1,497,837 |
| Receivables: | | |
| Dividends | | 21,934,685 |
| Foreign tax reclaims | | 4,105,651 |
| Income from securities on loan | + | 62,130 |
| Total assets | | 7,389,252,160 |
| Liabilities |
| Collateral held for securities on loan | | 5,468,050 |
| Payables: | | |
| Management fees | | 1,425,520 |
| Variation margin on futures contracts | | 660,453 |
| Investments bought | + | 117,799 |
| Total liabilities | | 7,671,822 |
| Net assets | | $7,381,580,338 |
| Net Assets by Source |
| Capital received from investors | | $6,694,507,083 |
| Total distributable earnings | + | 687,073,255 |
| Net assets | | $7,381,580,338 |
| Net Asset Value (NAV) |
| Net Assets | ÷ | Shares
Outstanding | = | NAV |
| $7,381,580,338 | | 228,900,000 | | $32.25 |
| | | | | |
| | | | | |
Schwab Fundamental Index ETFs | Annual Report
Schwab Fundamental International Large Company Index ETF
Statement of Operations
| For the period March 1, 2021 through February 28, 2022 |
| Investment Income |
| Dividends received from securities - unaffiliated (net of foreign withholding tax of $21,748,786) | | $231,546,971 |
| Securities on loan, net | + | 1,840,687 |
| Total investment income | | 233,387,658 |
| Expenses |
| Management fees | | 17,121,985 |
| Professional fees | + | 21,692* |
| Total expenses | | 17,143,677 |
| Expense reduction by investment adviser | – | 21,692* |
| Net expenses | – | 17,121,985 |
| Net investment income | | 216,265,673 |
| REALIZED AND UNREALIZED GAINS (LOSSES) |
| Net realized losses on sales of securities - unaffiliated | | (69,975,919) |
| Net realized gains on sales of in-kind redemptions - unaffiliated | | 40,180,305 |
| Net realized gains on futures contracts | | 1,633,984 |
| Net realized losses on foreign currency transactions | + | (1,224,840) |
| Net realized losses | | (29,386,470) |
| Net change in unrealized appreciation (depreciation) on securities - unaffiliated | | 258,251,589 |
| Net change in unrealized appreciation (depreciation) on futures contracts | | (800,058) |
| Net change in unrealized appreciation (depreciation) on foreign currency translations | + | 73,321 |
| Net change in unrealized appreciation (depreciation) | + | 257,524,852 |
| Net realized and unrealized gains | | 228,138,382 |
| Increase in net assets resulting from operations | | $444,404,055 |
| * | Professional fees associated with the filing of tax claims in the European Union deemed to be non-routine expenses of the fund. See financial notes 2 (d) and 4 for additional information. |
Schwab Fundamental Index ETFs | Annual Report
Schwab Fundamental International Large Company Index ETF
Statement of Changes in Net Assets
For the current and prior report periods
| OPERATIONS |
| | 3/1/21-2/28/22 | 3/1/20-2/28/21 |
| Net investment income | | $216,265,673 | $123,117,127 |
| Net realized gains (losses) | | (29,386,470) | 57,292,597 |
| Net change in unrealized appreciation (depreciation) | + | 257,524,852 | 979,453,687 |
| Increase in net assets resulting from operations | | $444,404,055 | $1,159,863,411 |
| DISTRIBUTIONS TO SHAREHOLDERS |
| Total distributions | | ($245,365,750) | ($114,361,960) |
| TRANSACTIONS IN FUND SHARES |
| | 3/1/21-2/28/22 | 3/1/20-2/28/21 |
| | | SHARES | VALUE | SHARES | VALUE |
| Shares sold | | 46,300,000 | $1,538,419,912 | 40,300,000 | $981,805,769 |
| Shares redeemed | + | (2,300,000) | (76,930,745) | (30,400,000) | (722,949,976) |
| Net transactions in fund shares | | 44,000,000 | $1,461,489,167 | 9,900,000 | $258,855,793 |
| SHARES OUTSTANDING AND NET ASSETS |
| | 3/1/21-2/28/22 | 3/1/20-2/28/21 |
| | | SHARES | NET ASSETS | SHARES | NET ASSETS |
| Beginning of period | | 184,900,000 | $5,721,052,866 | 175,000,000 | $4,416,695,622 |
| Total increase | + | 44,000,000 | 1,660,527,472 | 9,900,000 | 1,304,357,244 |
| End of period | | 228,900,000 | $7,381,580,338 | 184,900,000 | $5,721,052,866 |
Schwab Fundamental Index ETFs | Annual Report
Schwab Fundamental International Small Company Index ETF
Financial Statements
FINANCIAL HIGHLIGHTS
| | 3/1/21–
2/28/22 | 3/1/20–
2/28/21 | 3/1/19–
2/29/20 | 3/1/18–
2/28/19 | 3/1/17–
2/28/18 | |
| Per-Share Data |
| Net asset value at beginning of period | $36.11 | $28.53 | $31.23 | $36.02 | $29.99 | |
| Income (loss) from investment operations: | | | | | | |
| Net investment income (loss)1 | 0.73 | 0.53 | 0.80 | 0.79 | 0.62 | |
| Net realized and unrealized gains (losses) | (0.01) | 7.66 | (2.60) | (4.82) | 6.11 | |
| Total from investment operations | 0.72 | 8.19 | (1.80) | (4.03) | 6.73 | |
| Less distributions: | | | | | | |
| Distributions from net investment income | (0.97) | (0.61) | (0.90) | (0.76) | (0.70) | |
| Net asset value at end of period | $35.86 | $36.11 | $28.53 | $31.23 | $36.02 | |
| Total return | 1.86% | 28.97% | (6.06%) | (11.06%) | 22.47% | |
| Ratios/Supplemental Data |
| Ratios to average net assets: | | | | | | |
| Total expenses | 0.39% | 0.39% | 0.39% | 0.39% | 0.39% | |
| Net investment income (loss) | 1.90% | 1.78% | 2.54% | 2.38% | 1.83% | |
| Portfolio turnover rate2 | 28% | 24% | 31% | 25% | 18% | |
| Net assets, end of period (x 1,000) | $2,685,954 | $2,292,915 | $1,900,303 | $1,842,568 | $1,811,898 | |
| 1 | Calculated based on the average shares outstanding during the period. |
| 2 | Portfolio turnover rate excludes securities received or delivered from processing of in-kind creations or redemptions. |
Schwab Fundamental Index ETFs | Annual Report
Schwab Fundamental International Small Company Index ETF
Portfolio Holdings as of February 28, 2022
This section shows all the securities in the fund’s portfolio and their values as of the report date.
The fund files its complete schedule of portfolio holdings with the U.S. Securities and Exchange Commission (SEC) for the first and third quarters of each fiscal year on Form N-PORT Part F. The fund’s Form N-PORT Part F is available on the SEC’s website at www.sec.gov. You can also obtain this information at no cost on the fund’s website at www.schwabassetmanagement.com/schwabetfs_prospectus, by calling 1-866-414-6349, or by sending an email request to orders@mysummaryprospectus.com.The fund also makes available its complete schedule of portfolio holdings on a daily basis on the fund’s website.
| SECURITY | NUMBER
OF SHARES | VALUE ($) |
| COMMON STOCKS 99.1% OF NET ASSETS |
| |
| Australia 5.2% |
| Adbri Ltd. | 819,768 | 1,963,053 |
| ALS Ltd. | 205,327 | 1,762,617 |
| Ansell Ltd. | 118,850 | 2,216,458 |
| ARB Corp., Ltd. | 19,684 | 592,630 |
| ASX Ltd. | 46,222 | 2,761,430 |
| Austal Ltd. | 590,101 | 820,016 |
| Bank of Queensland Ltd. | 569,950 | 3,308,673 |
| Bapcor Ltd. | 191,188 | 893,457 |
| Beach Energy Ltd. | 1,499,527 | 1,659,401 |
| Bega Cheese Ltd. | 243,473 | 830,378 |
| Blackmores Ltd. | 12,360 | 741,291 |
| Breville Group Ltd. | 43,676 | 853,189 |
| carsales.com Ltd. | 65,400 | 972,879 |
| Challenger Ltd. | 595,008 | 2,914,431 |
| Charter Hall Group | 78,139 | 950,885 |
| Charter Hall Retail REIT | 249,113 | 757,421 |
| CIMIC Group Ltd. | 189,738 | 3,041,425 |
| Cleanaway Waste Management Ltd. | 792,354 | 1,592,671 |
| Cochlear Ltd. | 15,077 | 2,438,665 |
| Collins Foods Ltd. | 76,432 | 606,209 |
| Coronado Global Resources, Inc. * | 1,587,583 | 1,877,808 |
| Costa Group Holdings Ltd. | 287,350 | 569,247 |
| Cromwell Property Group | 988,169 | 634,602 |
| CSR Ltd. | 744,571 | 3,090,504 |
| Dexus | 462,419 | 3,664,253 |
| Domino's Pizza Enterprises Ltd. | 11,367 | 651,216 |
| Eagers Automotive Ltd. | 141,213 | 1,432,547 |
| Eclipx Group Ltd. * | 724,708 | 1,220,052 |
| Elders Ltd. | 116,042 | 974,262 |
| Event Hospitality & Entertainment Ltd. * | 136,851 | 1,430,998 |
| Evolution Mining Ltd. | 976,282 | 3,025,034 |
| Flight Centre Travel Group Ltd. *(a) | 218,535 | 2,784,663 |
| G.U.D. Holdings Ltd. | 79,365 | 669,210 |
| G8 Education Ltd. * | 1,840,458 | 1,682,765 |
| Genworth Mortgage Insurance Australia Ltd. | 465,252 | 1,012,830 |
| GrainCorp Ltd., Class A | 532,298 | 3,244,601 |
| GWA Group Ltd. | 348,175 | 578,576 |
| Harvey Norman Holdings Ltd. | 609,476 | 2,321,898 |
| Healius Ltd. | 518,760 | 1,618,684 |
| Humm Group Ltd. | 850,195 | 542,911 |
| IGO Ltd. | 179,036 | 1,419,998 |
| Iluka Resources Ltd. | 141,463 | 1,097,356 |
| Inghams Group Ltd. | 354,505 | 872,066 |
| InvoCare Ltd. | 82,836 | 777,221 |
| IOOF Holdings Ltd. | 733,985 | 2,034,594 |
| IRESS Ltd. | 115,792 | 870,493 |
| Link Administration Holdings Ltd. | 435,196 | 1,667,424 |
| Magellan Financial Group Ltd. (a) | 42,740 | 570,663 |
| McMillan Shakespeare Ltd. | 88,780 | 771,146 |
| Mineral Resources Ltd. | 53,843 | 1,767,970 |
| Monadelphous Group Ltd. | 209,745 | 1,718,354 |
| Myer Holdings Ltd. * | 5,867,272 | 1,724,322 |
| SECURITY | NUMBER
OF SHARES | VALUE ($) |
| nib Holdings Ltd. | 410,416 | 1,944,754 |
| Nine Entertainment Co. Holdings Ltd. | 853,861 | 1,728,696 |
| Northern Star Resources Ltd. | 291,229 | 2,178,815 |
| NRW Holdings Ltd. | 1,204,415 | 1,887,805 |
| Nufarm Ltd. | 546,332 | 2,172,523 |
| Orora Ltd. | 1,625,893 | 4,400,763 |
| OZ Minerals Ltd. | 154,245 | 2,854,161 |
| Pendal Group Ltd. | 304,852 | 1,022,017 |
| Perenti Global Ltd. | 1,689,194 | 931,580 |
| Perpetual Ltd. | 61,077 | 1,559,639 |
| Platinum Asset Management Ltd. | 266,499 | 460,256 |
| Premier Investments Ltd. | 48,285 | 965,998 |
| Qube Holdings Ltd. | 837,220 | 1,804,360 |
| REA Group Ltd. | 6,876 | 657,026 |
| Reece Ltd. | 96,446 | 1,355,629 |
| Regis Resources Ltd. | 812,595 | 1,152,784 |
| Reliance Worldwide Corp., Ltd. | 316,148 | 1,057,593 |
| Sandfire Resources Ltd. | 307,165 | 1,493,391 |
| SEEK Ltd. | 117,808 | 2,279,948 |
| Seven Group Holdings Ltd. | 69,761 | 1,123,304 |
| Shopping Centres Australasia Property Group | 430,325 | 905,569 |
| Southern Cross Media Group Ltd. | 497,134 | 638,519 |
| St. Barbara Ltd. | 1,200,415 | 1,158,538 |
| Steadfast Group Ltd. | 284,045 | 956,384 |
| Super Retail Group Ltd. | 202,573 | 1,625,788 |
| Tassal Group Ltd. | 315,305 | 819,108 |
| The GPT Group | 825,372 | 2,958,720 |
| The Star Entertainment Grp Ltd. * | 1,337,952 | 3,252,464 |
| TPG Telecom Ltd. | 146,857 | 595,708 |
| Vicinity Centres | 3,400,206 | 4,441,247 |
| Washington H Soul Pattinson & Co., Ltd. | 39,664 | 724,735 |
| Whitehaven Coal Ltd. | 2,435,207 | 5,672,416 |
| Worley Ltd. | 426,228 | 3,689,857 |
| | | 140,465,542 |
| |
| Austria 0.8% |
| ANDRITZ AG | 72,315 | 3,248,970 |
| AT&S Austria Technologie & Systemtechnik AG | 26,679 | 1,465,331 |
| BAWAG Group AG * | 62,172 | 3,354,711 |
| CA Immobilien Anlagen AG | 19,999 | 688,487 |
| EVN AG | 40,409 | 1,127,877 |
| IMMOFINANZ AG *(a) | 46,159 | 1,191,417 |
| Lenzing AG * | 16,912 | 1,882,461 |
| Mayr Melnhof Karton AG | 9,828 | 1,861,144 |
| Oesterreichische Post AG | 42,487 | 1,729,901 |
| S IMMO AG | 32,360 | 832,341 |
| UNIQA Insurance Group AG | 153,879 | 1,244,426 |
| Verbund AG | 17,610 | 2,136,192 |
| Vienna Insurance Group AG Wiener Versicherung Gruppe | 46,670 | 1,226,623 |
| | | 21,989,881 |
| |
Schwab Fundamental Index ETFs | Annual Report
Schwab Fundamental International Small Company Index ETF
Portfolio Holdings as of February 28, 2022 (continued)
| SECURITY | NUMBER
OF SHARES | VALUE ($) |
| Belgium 1.3% |
| Ackermans & van Haaren N.V. | 22,923 | 4,299,770 |
| AGFA-Gevaert N.V. * | 249,898 | 1,018,889 |
| Barco N.V. | 60,203 | 1,376,744 |
| Befimmo S.A. | 21,009 | 1,122,053 |
| Bekaert S.A. | 64,932 | 2,835,583 |
| bpost S.A. * | 267,987 | 1,818,059 |
| Cie d'Entreprises CFE | 12,078 | 1,608,930 |
| Cofinimmo S.A. | 9,815 | 1,290,935 |
| D'ieteren Group | 24,113 | 3,913,600 |
| Elia Group S.A. N.V. | 16,561 | 2,392,130 |
| Euronav N.V. | 268,152 | 3,011,282 |
| KBC Ancora | 18,327 | 826,689 |
| Melexis N.V. | 8,090 | 743,291 |
| Ontex Group N.V. * | 251,554 | 1,802,641 |
| Orange Belgium S.A. | 42,915 | 944,762 |
| Sofina S.A. | 3,820 | 1,489,705 |
| Telenet Group Holding N.V. | 77,773 | 2,716,730 |
| Tessenderlo Group S.A. * | 31,475 | 1,161,337 |
| Warehouses De Pauw CVA | 19,316 | 764,124 |
| | | 35,137,254 |
| |
| Canada 8.7% |
| Aclara Resources, Inc. * | 47,038 | 39,682 |
| Aecon Group, Inc. | 124,742 | 1,731,940 |
| Ag Growth International, Inc. | 27,025 | 799,020 |
| Alamos Gold, Inc., Class A | 129,168 | 951,180 |
| Algonquin Power & Utilities Corp. | 264,965 | 3,831,323 |
| Allied Properties Real Estate Investment Trust | 50,981 | 1,771,784 |
| Altus Group Ltd. | 14,265 | 552,448 |
| Artis Real Estate Investment Trust | 178,341 | 1,827,913 |
| ATS Automation Tooling Systems, Inc. * | 28,753 | 1,114,211 |
| AutoCanada, Inc. * | 37,617 | 972,196 |
| B2Gold Corp. | 523,803 | 2,114,457 |
| Badger Infrastructure Solutions Ltd. | 31,166 | 746,500 |
| Baytex Energy Corp. * | 990,959 | 4,523,714 |
| Birchcliff Energy Ltd. | 346,395 | 1,840,740 |
| BlackBerry Ltd. * | 146,611 | 1,005,650 |
| Boardwalk Real Estate Investment Trust | 31,963 | 1,422,566 |
| Boralex, Inc., Class A | 24,797 | 723,568 |
| Boyd Group Services, Inc. | 7,631 | 995,547 |
| Brookfield Infrastructure Corp., Class A (a) | 71,195 | 5,016,515 |
| BRP, Inc. | 19,437 | 1,392,090 |
| CAE, Inc. * | 131,955 | 3,527,886 |
| Cameco Corp. | 185,183 | 4,550,916 |
| Canadian Apartment Properties REIT | 56,523 | 2,351,207 |
| Canadian Utilities Ltd., Class A | 146,736 | 4,083,873 |
| Canadian Western Bank | 64,041 | 1,873,743 |
| Canfor Corp. * | 98,553 | 2,229,263 |
| Capital Power Corp. | 91,225 | 2,801,446 |
| Cascades, Inc. | 240,275 | 2,487,335 |
| Celestica, Inc. * | 410,656 | 4,879,241 |
| Centerra Gold, Inc. | 227,855 | 2,220,434 |
| Chartwell Retirement Residences | 159,396 | 1,529,427 |
| Chemtrade Logistics Income Fund (a) | 279,091 | 1,628,315 |
| Choice Properties Real Estate Investment Trust | 105,255 | 1,204,953 |
| Chorus Aviation, Inc. * | 452,550 | 1,555,657 |
| Cineplex, Inc. *(a) | 180,113 | 1,965,360 |
| Cogeco Communications, Inc. | 10,522 | 839,537 |
| Cogeco, Inc. | 24,428 | 1,510,728 |
| Colliers International Group, Inc. | 10,236 | 1,404,641 |
| Cominar Real Estate Investment Trust | 321,343 | 2,964,255 |
| Constellation Software, Inc. | 2,544 | 4,284,615 |
| SECURITY | NUMBER
OF SHARES | VALUE ($) |
| Corus Entertainment, Inc., B Shares | 637,923 | 2,555,011 |
| Crombie Real Estate Investment Trust (a) | 60,430 | 828,063 |
| Dorel Industries, Inc., Class B | 120,257 | 1,092,254 |
| Dream Office Real Estate Investment Trust | 78,894 | 1,625,962 |
| ECN Capital Corp. | 90,091 | 405,582 |
| Element Fleet Management Corp. | 170,560 | 1,672,856 |
| Enerflex Ltd. | 303,599 | 1,874,230 |
| Enerplus Corp. | 363,483 | 4,642,587 |
| Exchange Income Corp. (a) | 43,723 | 1,401,301 |
| Extendicare, Inc. (a) | 102,931 | 623,259 |
| First Capital Real Estate Investment Trust | 184,782 | 2,644,218 |
| FirstService Corp. | 5,442 | 774,198 |
| Franco-Nevada Corp. | 25,010 | 3,680,661 |
| Gibson Energy, Inc. | 205,880 | 4,015,825 |
| Granite Real Estate Investment Trust | 13,632 | 1,008,898 |
| Home Capital Group, Inc. * | 52,013 | 1,571,032 |
| Hudbay Minerals, Inc. | 274,320 | 2,234,183 |
| IAMGOLD Corp. * | 590,506 | 1,731,921 |
| IGM Financial, Inc. | 79,584 | 2,825,456 |
| Innergex Renewable Energy, Inc. | 48,235 | 700,888 |
| Interfor Corp. | 86,081 | 2,620,402 |
| Intertape Polymer Group, Inc. | 51,330 | 969,659 |
| Just Energy Group, Inc. * | 54,636 | 54,061 |
| Killam Apartment Real Estate Investment Trust | 45,975 | 773,167 |
| Laurentian Bank of Canada | 49,041 | 1,645,977 |
| LifeWorks, Inc. | 34,429 | 684,590 |
| Lundin Mining Corp. | 409,052 | 3,944,263 |
| Maple Leaf Foods, Inc. | 109,463 | 2,304,303 |
| Martinrea International, Inc. | 310,988 | 2,424,939 |
| MEG Energy Corp. * | 479,089 | 6,251,368 |
| Mullen Group Ltd. | 167,742 | 1,634,636 |
| NFI Group, Inc. | 110,977 | 1,658,946 |
| Northland Power, Inc. | 82,754 | 2,629,390 |
| NorthWest Healthcare Properties Real Estate Investment Trust | 84,685 | 906,040 |
| NuVista Energy Ltd. * | 372,093 | 2,833,933 |
| OceanaGold Corp. * | 1,128,532 | 2,126,536 |
| Pan American Silver Corp. | 70,194 | 1,659,176 |
| Parex Resources, Inc. | 141,654 | 3,121,559 |
| Pason Systems, Inc. | 109,258 | 1,112,953 |
| Peyto Exploration & Development Corp. | 408,026 | 3,519,379 |
| PrairieSky Royalty Ltd. | 109,893 | 1,485,052 |
| Precision Drilling Corp. * | 57,683 | 3,363,155 |
| Premium Brands Holdings Corp. | 15,441 | 1,423,394 |
| Primo Water Corp. | 146,923 | 2,134,892 |
| Richelieu Hardware Ltd. | 39,911 | 1,525,828 |
| Ritchie Bros. Auctioneers, Inc. | 33,357 | 1,747,077 |
| Russel Metals, Inc. | 120,525 | 2,983,786 |
| Secure Energy Services, Inc. | 573,618 | 2,772,325 |
| ShawCor Ltd. * | 409,354 | 1,891,287 |
| Shopify, Inc., Class A * | 757 | 525,170 |
| Sienna Senior Living, Inc. (a) | 66,809 | 813,286 |
| Sleep Country Canada Holdings, Inc. | 28,925 | 681,192 |
| SmartCentres Real Estate Investment Trust | 92,756 | 2,326,305 |
| SSR Mining, Inc. | 63,270 | 1,251,582 |
| Stantec, Inc. | 69,766 | 3,464,785 |
| Stelco Holdings, Inc. | 23,595 | 723,839 |
| Stella-Jones, Inc. | 68,054 | 2,132,808 |
| Superior Plus Corp. | 212,280 | 1,913,005 |
| The Descartes Systems Group, Inc. * | 9,441 | 672,300 |
| The North West Co., Inc. | 54,848 | 1,557,634 |
| TMX Group Ltd. | 17,496 | 1,766,222 |
| Torex Gold Resources, Inc. * | 76,612 | 971,278 |
Schwab Fundamental Index ETFs | Annual Report
Schwab Fundamental International Small Company Index ETF
Portfolio Holdings as of February 28, 2022 (continued)
| SECURITY | NUMBER
OF SHARES | VALUE ($) |
| Toromont Industries Ltd. | 35,645 | 3,019,434 |
| Tourmaline Oil Corp. | 147,512 | 5,815,114 |
| TransAlta Corp. | 420,034 | 4,262,102 |
| Transat AT, Inc. *(a) | 340,126 | 1,305,959 |
| Transcontinental, Inc., Class A | 147,038 | 2,370,739 |
| Tricon Residential, Inc. | 56,469 | 838,787 |
| Turquoise Hill Resources Ltd. * | 76,950 | 1,581,651 |
| Westshore Terminals Investment Corp. | 50,487 | 1,182,614 |
| Wheaton Precious Metals Corp. | 83,546 | 3,658,410 |
| Whitecap Resources, Inc. | 682,603 | 5,204,219 |
| Winpak Ltd. | 34,643 | 1,043,373 |
| Yamana Gold, Inc. | 394,815 | 1,939,289 |
| | | 234,397,431 |
| |
| Denmark 1.3% |
| Chr Hansen Holding A/S | 33,061 | 2,419,213 |
| D/S Norden A/S | 47,123 | 1,230,988 |
| Demant A/S * | 34,994 | 1,479,010 |
| Dfds A/S * | 34,395 | 1,601,712 |
| FLSmidth & Co. A/S | 81,524 | 2,351,222 |
| Genmab A/S * | 3,220 | 1,084,265 |
| GN Store Nord A/S | 33,221 | 1,758,229 |
| H. Lundbeck A/S | 48,524 | 1,179,295 |
| Jyske Bank A/S * | 60,765 | 3,316,014 |
| Matas A/S | 42,103 | 612,865 |
| NKT A/S * | 22,517 | 947,254 |
| Per Aarsleff Holding A/S | 30,236 | 1,191,625 |
| Ringkjoebing Landbobank A/S | 6,969 | 870,263 |
| Rockwool International A/S, B Shares | 4,011 | 1,381,506 |
| Royal Unibrew A/S | 19,833 | 2,115,504 |
| Scandinavian Tobacco Group A/S, Class A | 76,183 | 1,725,536 |
| Schouw & Co. A/S | 16,656 | 1,446,150 |
| SimCorp A/S | 9,654 | 874,940 |
| Sydbank A/S | 87,216 | 2,844,623 |
| The Drilling Co. of 1972 A/S * | 30,543 | 1,200,957 |
| Topdanmark A/S | 21,952 | 1,256,285 |
| Tryg A/S | 102,668 | 2,334,720 |
| | | 35,222,176 |
| |
| Finland 1.0% |
| Aktia Bank Oyj | 51,529 | 590,349 |
| Cargotec Oyj, B Shares | 58,713 | 2,337,143 |
| Finnair Oyj *(a) | 1,500,602 | 758,128 |
| Huhtamaki Oyj | 83,893 | 3,080,335 |
| Kemira Oyj | 142,254 | 1,893,390 |
| Kojamo Oyj | 62,981 | 1,468,568 |
| Konecranes Oyj | 74,008 | 2,598,513 |
| Metsa Board Oyj, Class B | 158,306 | 1,553,165 |
| Neles Oyj | 83,009 | 1,083,866 |
| Orion Oyj, B Shares | 77,907 | 3,674,343 |
| Sanoma Oyj | 65,675 | 960,436 |
| TietoEVRY Oyj | 69,823 | 1,960,631 |
| Tokmanni Group Corp. | 33,890 | 633,025 |
| Uponor Oyj | 46,382 | 1,039,842 |
| Valmet Oyj | 84,183 | 2,940,641 |
| YIT Oyj | 279,565 | 1,219,605 |
| | | 27,791,980 |
| |
| France 3.9% |
| Aeroports de Paris * | 26,956 | 3,845,178 |
| Albioma S.A. | 19,736 | 905,763 |
| Alten S.A. | 20,371 | 3,116,354 |
| Amundi S.A. | 32,977 | 2,311,282 |
| Beneteau S.A. * | 50,994 | 855,711 |
| SECURITY | NUMBER
OF SHARES | VALUE ($) |
| BioMerieux | 13,566 | 1,495,088 |
| CGG S.A. * | 2,439,747 | 2,081,003 |
| Cie Plastic Omnium S.A. | 97,880 | 2,084,441 |
| Coface S.A. | 92,224 | 1,239,925 |
| Covivio | 33,116 | 2,731,667 |
| Dassault Aviation S.A. | 15,523 | 2,341,580 |
| Derichebourg S.A. | 145,639 | 1,527,854 |
| Edenred | 71,743 | 3,294,989 |
| Elior Group S.A. * | 446,089 | 2,072,332 |
| Eramet S.A. * | 14,134 | 1,873,287 |
| Eurofins Scientific SE | 21,923 | 2,229,450 |
| Euronext N.V. | 21,494 | 1,951,886 |
| Fnac Darty S.A. | 40,396 | 2,240,509 |
| Gaztransport Et Technigaz S.A. | 10,240 | 985,685 |
| Gecina S.A. (a) | 20,096 | 2,561,904 |
| Getlink SE | 212,353 | 3,491,860 |
| ICADE (a) | 31,999 | 1,987,554 |
| Imerys S.A. | 69,040 | 2,962,248 |
| Ipsen S.A. | 18,008 | 2,108,622 |
| IPSOS | 55,091 | 2,654,576 |
| JCDecaux S.A. * | 97,072 | 2,749,770 |
| Kaufman & Broad S.A. | 29,316 | 1,071,798 |
| Korian S.A. | 73,677 | 1,500,331 |
| La Francaise des Jeux SAEM | 28,929 | 1,205,168 |
| Maisons du Monde S.A. | 65,274 | 1,445,787 |
| Mercialys S.A. | 98,502 | 1,012,333 |
| Mersen S.A. | 26,192 | 976,706 |
| Metropole Television S.A. | 94,605 | 1,887,184 |
| Nexans S.A. | 31,512 | 3,068,685 |
| Nexity S.A. | 67,962 | 2,694,624 |
| Orpea S.A. | 30,039 | 1,249,723 |
| Quadient S.A. | 94,621 | 1,732,337 |
| Remy Cointreau S.A. | 6,806 | 1,320,206 |
| Sartorius Stedim Biotech | 1,579 | 609,031 |
| SEB S.A. | 23,598 | 3,464,241 |
| Societe BIC S.A. | 53,443 | 2,836,886 |
| Sopra Steria Group S.A. | 15,328 | 2,754,627 |
| SPIE S.A. | 143,883 | 3,400,263 |
| Tarkett S.A. * | 46,541 | 818,625 |
| Technicolor S.A. * | 433,367 | 1,453,459 |
| Television Francaise 1 S.A. | 233,254 | 2,318,620 |
| Trigano S.A. | 5,782 | 996,882 |
| UbiSoft Entertainment S.A. * | 54,618 | 2,966,126 |
| Vallourec S.A. * | 124,820 | 1,228,134 |
| Verallia S.A. | 30,743 | 811,468 |
| Vicat S.A. | 34,492 | 1,270,719 |
| Virbac S.A. | 1,709 | 702,555 |
| Worldline S.A. * | 33,483 | 1,726,401 |
| | | 104,223,437 |
| |
| Germany 3.6% |
| 1&1 AG | 62,194 | 1,496,323 |
| Aareal Bank AG | 120,382 | 3,707,544 |
| ADVA Optical Networking SE * | 47,790 | 805,166 |
| Aroundtown S.A. | 314,127 | 1,951,137 |
| Bechtle AG | 41,402 | 2,141,451 |
| Befesa S.A. | 16,909 | 1,183,214 |
| Bilfinger SE | 58,453 | 2,224,372 |
| Borussia Dortmund GmbH & Co. KGaA * | 100,930 | 458,447 |
| CANCOM SE | 22,992 | 1,318,605 |
| Carl Zeiss Meditec AG, Class B | 6,439 | 1,018,668 |
| CECONOMY AG | 562,100 | 2,251,398 |
| Cewe Stiftung & Co. KGaA | 5,312 | 607,384 |
| CTS Eventim AG & Co., KGaA * | 18,784 | 1,321,591 |
| Deutsche Euroshop AG | 49,927 | 942,672 |
| Deutsche Pfandbriefbank AG | 346,545 | 3,791,971 |
| Deutz AG * | 284,746 | 1,648,707 |
Schwab Fundamental Index ETFs | Annual Report
Schwab Fundamental International Small Company Index ETF
Portfolio Holdings as of February 28, 2022 (continued)
| SECURITY | NUMBER
OF SHARES | VALUE ($) |
| Duerr AG | 64,040 | 2,326,208 |
| DWS Group GmbH & Co. KGaA | 32,643 | 1,198,933 |
| ElringKlinger AG * | 64,125 | 693,603 |
| Fielmann AG | 15,872 | 946,637 |
| Fraport AG Frankfurt Airport Services Worldwide * | 48,660 | 3,325,206 |
| Gerresheimer AG | 24,357 | 1,764,578 |
| Grand City Properties S.A. | 57,258 | 1,256,018 |
| GRENKE AG (a) | 20,035 | 585,311 |
| Hamburger Hafen und Logistik AG | 35,862 | 712,557 |
| Hella GmbH & Co. KGaA | 30,577 | 2,130,021 |
| HelloFresh SE * | 7,826 | 429,663 |
| HOCHTIEF AG | 33,325 | 2,256,320 |
| Hornbach Holding AG & Co. KGaA | 21,289 | 2,812,029 |
| Jenoptik AG | 40,190 | 1,463,485 |
| JOST Werke AG | 15,562 | 727,137 |
| Kloeckner & Co. SE * | 310,103 | 4,252,839 |
| Krones AG | 21,251 | 1,966,817 |
| KWS Saat SE & Co. KGaA | 7,059 | 517,742 |
| LEG Immobilien SE | 20,413 | 2,643,586 |
| Leoni AG *(a) | 207,281 | 2,467,872 |
| Nordex SE *(a) | 56,643 | 1,012,217 |
| Norma Group SE | 38,108 | 1,327,747 |
| Pfeiffer Vacuum Technology AG | 3,858 | 768,729 |
| Puma SE | 29,881 | 2,751,442 |
| QIAGEN N.V. * | 44,955 | 2,262,108 |
| Rational AG | 791 | 584,601 |
| RTL Group S.A. * | 66,269 | 3,717,203 |
| S&T AG (a) | 26,847 | 424,576 |
| SAF-Holland SE * | 85,614 | 1,024,122 |
| Scout24 SE | 20,918 | 1,226,445 |
| Siltronic AG | 12,973 | 1,479,713 |
| Sixt SE * | 13,531 | 2,033,496 |
| Software AG | 38,616 | 1,469,495 |
| Stabilus S.A. | 18,535 | 1,101,300 |
| Stroeer SE & Co. KGaA | 14,764 | 1,120,177 |
| Suedzucker AG | 163,144 | 2,237,402 |
| TAG Immobilien AG | 63,381 | 1,635,936 |
| Takkt AG | 76,180 | 1,314,285 |
| Talanx AG * | 76,973 | 3,385,621 |
| Wacker Chemie AG | 15,521 | 2,418,856 |
| Wacker Neuson SE | 38,124 | 908,659 |
| Zalando SE * | 32,640 | 2,184,278 |
| | | 97,733,620 |
| |
| Hong Kong 3.7% |
| Asia Cement China Holdings Corp. | 1,147,728 | 716,807 |
| ASM Pacific Technology Ltd. | 255,162 | 2,788,799 |
| BOC Aviation Ltd. | 154,993 | 1,343,893 |
| Brightoil Petroleum Holdings Ltd. *(b) | 2,380,161 | 0 |
| Budweiser Brewing Co. APAC Ltd. | 722,262 | 2,241,557 |
| Cafe de Coral Holdings Ltd. | 524,653 | 804,400 |
| Cathay Pacific Airways Ltd. * | 2,532,758 | 2,256,037 |
| Champion REIT | 1,123,750 | 509,115 |
| Chow Sang Sang Holdings International Ltd. | 821,135 | 1,149,675 |
| Chow Tai Fook Jewellery Group Ltd. * | 1,461,302 | 3,037,171 |
| CITIC Telecom International Holdings Ltd. | 2,886,783 | 1,027,075 |
| CK Infrastructure Holdings Ltd. | 164,098 | 1,018,564 |
| Cowell e Holdings, Inc. * | 1,252,103 | 1,413,357 |
| Dairy Farm International Holdings Ltd. | 489,704 | 1,297,716 |
| FIH Mobile Ltd. * | 13,384,000 | 1,969,822 |
| FIT Hon Teng Ltd. * | 2,633,202 | 475,167 |
| Fortune Real Estate Investment Trust | 905,480 | 850,586 |
| Haitong International Securities Group Ltd. | 4,043,580 | 890,098 |
| SECURITY | NUMBER
OF SHARES | VALUE ($) |
| Hang Lung Group Ltd. | 1,262,469 | 2,782,256 |
| Hang Lung Properties Ltd. | 1,290,790 | 2,705,906 |
| HKBN Ltd. | 608,582 | 765,625 |
| Huabao International Holdings Ltd. (a) | 376,370 | 215,311 |
| Hysan Development Co., Ltd. | 444,829 | 1,309,375 |
| IGG, Inc. | 1,197,529 | 715,725 |
| Johnson Electric Holdings Ltd. | 756,215 | 1,256,213 |
| JS Global Lifestyle Co., Ltd. | 247,862 | 284,859 |
| K Wah International Holdings Ltd. | 3,423,018 | 1,296,714 |
| Kerry Logistics Network Ltd. | 371,382 | 901,161 |
| Kerry Properties Ltd. | 1,172,461 | 3,211,112 |
| Lee & Man Paper Manufacturing Ltd. | 2,626,915 | 1,687,691 |
| Luk Fook Holdings International Ltd. | 729,331 | 1,936,806 |
| Man Wah Holdings Ltd. | 554,082 | 648,841 |
| Melco International Development Ltd. * | 1,886,168 | 1,870,791 |
| MGM China Holdings Ltd. * | 711,923 | 457,383 |
| Minth Group Ltd. | 534,758 | 1,923,122 |
| MMG Ltd. * | 3,429,191 | 1,237,611 |
| NagaCorp Ltd. | 1,612,089 | 1,485,473 |
| Nexteer Automotive Group Ltd. | 1,563,908 | 1,561,166 |
| NWS Holdings Ltd. | 3,261,911 | 3,201,922 |
| Pacific Basin Shipping Ltd. | 5,043,268 | 2,672,118 |
| Pacific Textiles Holdings Ltd. | 1,339,535 | 649,735 |
| Power Assets Holdings Ltd. | 113,717 | 716,762 |
| Powerlong Real Estate Holdings Ltd. | 2,713,058 | 1,295,123 |
| PRADA S.p.A. | 260,045 | 1,622,432 |
| Shangri-La Asia Ltd. * | 1,494,034 | 1,217,988 |
| Shui On Land Ltd. | 13,632,179 | 1,988,902 |
| Shun Tak Holdings Ltd. * | 4,750,000 | 1,209,734 |
| SITC International Holdings Co., Ltd. | 453,952 | 1,864,912 |
| SJM Holdings Ltd. * | 2,416,216 | 1,360,604 |
| Stella International Holdings Ltd. | 1,415,000 | 1,437,872 |
| Swire Properties Ltd. | 706,513 | 1,835,521 |
| The Bank of East Asia Ltd. | 1,762,135 | 2,967,825 |
| Tingyi Cayman Islands Holding Corp. | 2,006,654 | 4,437,716 |
| Towngas Smart Energy Co., Ltd. * | 1,412,347 | 1,001,370 |
| Truly International Holdings Ltd. | 4,899,783 | 1,693,105 |
| Uni-President China Holdings Ltd. | 1,427,890 | 1,480,209 |
| Value Partners Group Ltd. | 1,120,412 | 547,753 |
| Vitasoy International Holdings Ltd. | 392,716 | 728,769 |
| VSTECS Holdings Ltd. | 1,534,419 | 1,578,859 |
| VTech Holdings Ltd. | 280,780 | 2,308,780 |
| Want Want China Holdings Ltd. | 4,897,071 | 5,208,117 |
| Wynn Macau Ltd. * | 1,662,614 | 1,417,128 |
| Xinyi Glass Holdings Ltd. | 913,004 | 2,424,566 |
| | | 98,910,802 |
| |
| Ireland 0.3% |
| AIB Group plc * | 1,014,294 | 2,673,833 |
| Dalata Hotel Group plc * | 180,401 | 854,071 |
| Glanbia plc (a) | 208,550 | 2,932,728 |
| Irish Continental Group plc * | 149,616 | 677,236 |
| | | 7,137,868 |
| |
| Israel 2.1% |
| Arad Investment & Industrial Development Ltd. | 6,206 | 868,912 |
| Azrieli Group Ltd. | 9,926 | 848,469 |
| Bezeq The Israeli Telecommunication Corp., Ltd. * | 3,359,624 | 5,523,474 |
| Cellcom Israel Ltd. * | 165,146 | 844,419 |
| Clal Insurance Enterprises Holdings Ltd. * | 31,903 | 746,654 |
| Delek Group Ltd. * | 26,711 | 3,303,994 |
| El Al Israel Airlines * | 595,466 | 660,401 |
| Elbit Systems Ltd. | 14,992 | 3,072,812 |
Schwab Fundamental Index ETFs | Annual Report
Schwab Fundamental International Small Company Index ETF
Portfolio Holdings as of February 28, 2022 (continued)
| SECURITY | NUMBER
OF SHARES | VALUE ($) |
| Equital Ltd. * | 27,806 | 1,112,951 |
| First International Bank of Israel Ltd. | 33,787 | 1,451,425 |
| Gazit-Globe Ltd. | 142,805 | 1,245,196 |
| Harel Insurance Investments & Financial Services Ltd. | 98,399 | 1,193,515 |
| Isracard Ltd. | 214,338 | 1,125,367 |
| Israel Discount Bank Ltd., A Shares | 798,364 | 5,250,281 |
| Mizrahi Tefahot Bank Ltd. | 63,578 | 2,481,276 |
| Nice Ltd. * | 10,904 | 2,468,618 |
| Norstar Holdings, Inc. | 85,209 | 1,128,163 |
| Oil Refineries Ltd. * | 10,395,411 | 3,700,312 |
| Partner Communications Co., Ltd. * | 145,343 | 1,115,425 |
| Paz Oil Co., Ltd. * | 29,520 | 4,284,174 |
| Shikun & Binui Ltd. * | 123,466 | 746,084 |
| Shufersal Ltd. | 126,061 | 1,127,507 |
| Strauss Group Ltd. | 23,894 | 784,925 |
| The Israel Corp., Ltd. * | 10,009 | 5,252,660 |
| The Phoenix Holdings Ltd. | 79,022 | 981,165 |
| Tower Semiconductor Ltd. * | 90,015 | 4,206,663 |
| | | 55,524,842 |
| |
| Italy 2.4% |
| ACEA S.p.A. | 52,336 | 1,000,501 |
| Amplifon S.p.A. | 20,927 | 903,776 |
| Anima Holding S.p.A. | 353,923 | 1,681,537 |
| Autogrill S.p.A. * | 320,762 | 2,445,581 |
| Azimut Holding S.p.A. | 92,213 | 2,216,477 |
| Banca Generali S.p.A. | 30,901 | 1,146,406 |
| Banca IFIS S.p.A. | 66,535 | 1,415,427 |
| Banca Mediolanum S.p.A. | 178,373 | 1,474,967 |
| Banca Monte dei Paschi di Siena S.p.A. *(a) | 1,044,685 | 1,007,239 |
| Banca Popolare di Sondrio Scarl | 640,926 | 2,551,284 |
| BFF Bank S.p.A. | 125,483 | 909,079 |
| BPER Banca | 1,551,750 | 3,128,553 |
| Brembo S.p.A. | 153,518 | 1,827,774 |
| Buzzi Unicem S.p.A. | 105,173 | 2,020,620 |
| Davide Campari-Milano N.V. | 130,467 | 1,428,478 |
| De'Longhi S.p.A. | 41,497 | 1,326,505 |
| DiaSorin S.p.A. | 5,007 | 751,629 |
| Enav S.p.A. * | 321,709 | 1,483,677 |
| ERG S.p.A. | 44,628 | 1,416,566 |
| Esprinet S.p.A. | 72,398 | 906,690 |
| Fincantieri S.p.A. *(a) | 868,679 | 617,131 |
| FinecoBank Banca Fineco S.p.A. | 152,986 | 2,564,622 |
| Hera S.p.A. | 926,485 | 3,605,777 |
| Infrastrutture Wireless Italiane S.p.A. | 60,007 | 614,148 |
| Interpump Group S.p.A. | 33,411 | 1,818,571 |
| Iren S.p.A. | 973,214 | 2,750,276 |
| Italgas S.p.A. | 491,026 | 3,186,686 |
| Maire Tecnimont S.p.A. (a) | 224,655 | 714,606 |
| MARR S.p.A. | 38,339 | 720,864 |
| MFE-MediaForEurope N.V., Class A * | 799,468 | 720,166 |
| MFE-MediaForEurope N.V., Class B | 698,671 | 860,083 |
| Moncler S.p.A. | 45,830 | 2,788,985 |
| Nexi S.p.A. * | 44,879 | 618,508 |
| OVS S.p.A. * | 713,107 | 1,811,776 |
| Piaggio & C S.p.A. | 212,796 | 626,691 |
| Recordati Industria Chimica e Farmaceutica S.p.A. | 36,374 | 1,787,828 |
| Reply S.p.A. | 5,661 | 926,424 |
| Saipem S.p.A. *(a) | 1,635,334 | 1,939,669 |
| Salvatore Ferragamo S.p.A. * | 59,065 | 1,288,690 |
| Societa Cattolica Di Assicurazione S.p.A. * | 71,090 | 437,968 |
| Technogym S.p.A. | 55,153 | 437,662 |
| Tod's S.p.A. * | 13,537 | 692,121 |
| SECURITY | NUMBER
OF SHARES | VALUE ($) |
| UnipolSai Assicurazioni S.p.A. | 601,368 | 1,641,360 |
| Webuild S.p.A. (a) | 371,538 | 703,587 |
| | | 64,916,965 |
| |
| Japan 33.0% |
| ABC-Mart, Inc. | 33,095 | 1,430,980 |
| Achilles Corp. | 62,193 | 698,203 |
| Acom Co., Ltd. | 302,841 | 841,408 |
| Adastria Co., Ltd. | 92,364 | 1,361,702 |
| ADEKA Corp. | 164,237 | 3,788,823 |
| Advance Residence Investment Corp. | 238 | 665,387 |
| Aeon Delight Co., Ltd. | 33,637 | 868,560 |
| AEON Financial Service Co., Ltd. (a) | 201,792 | 2,081,432 |
| Aeon Mall Co., Ltd. | 168,454 | 2,359,160 |
| Aica Kogyo Co., Ltd. | 66,117 | 1,848,463 |
| Aichi Steel Corp. | 61,306 | 1,398,847 |
| Aida Engineering Ltd. | 109,396 | 943,175 |
| Aiful Corp. | 215,749 | 691,221 |
| Ain Holdings, Inc. | 38,887 | 2,160,858 |
| Alpen Co., Ltd. | 34,938 | 640,972 |
| Amano Corp. | 88,276 | 1,722,982 |
| Anritsu Corp. | 85,646 | 1,191,273 |
| AOKI Holdings, Inc. | 194,946 | 1,012,179 |
| Aoyama Trading Co., Ltd. * | 427,766 | 2,521,842 |
| Aozora Bank Ltd. | 150,788 | 3,406,558 |
| Arata Corp. | 70,121 | 2,435,285 |
| Arcland Sakamoto Co., Ltd. | 70,222 | 956,617 |
| Arcs Co., Ltd. | 159,447 | 3,012,430 |
| Ariake Japan Co., Ltd. | 11,704 | 583,295 |
| As One Corp. | 9,759 | 585,498 |
| Asahi Holdings, Inc. | 61,727 | 1,198,364 |
| Asahi Intecc Co., Ltd. | 29,347 | 625,798 |
| Asanuma Corp. | 18,904 | 884,676 |
| Asics Corp. | 184,792 | 3,669,367 |
| ASKUL Corp. | 55,393 | 796,928 |
| Autobacs Seven Co., Ltd. | 152,852 | 1,907,083 |
| Avex, Inc. | 68,378 | 821,070 |
| Axial Retailing, Inc. | 42,336 | 1,222,203 |
| Azbil Corp. | 85,597 | 3,218,016 |
| Belc Co., Ltd. | 18,561 | 884,740 |
| Belluna Co., Ltd. | 99,754 | 635,723 |
| Benesse Holdings, Inc. | 122,135 | 2,479,285 |
| BML, Inc. | 23,077 | 666,212 |
| Bunka Shutter Co., Ltd. | 124,547 | 1,176,533 |
| Calbee, Inc. | 99,514 | 2,230,911 |
| Canon Electronics, Inc. | 47,965 | 667,158 |
| Canon Marketing Japan, Inc. | 118,137 | 2,462,747 |
| Capcom Co., Ltd. | 46,936 | 1,130,865 |
| Cawachi Ltd. | 49,321 | 1,049,155 |
| Central Glass Co., Ltd. | 127,005 | 2,270,487 |
| Chudenko Corp. | 55,003 | 1,043,469 |
| Chugoku Marine Paints Ltd. | 102,056 | 813,435 |
| Citizen Watch Co., Ltd. | 923,053 | 3,999,162 |
| CKD Corp. | 59,683 | 1,027,061 |
| Colowide Co., Ltd. (a) | 42,424 | 637,603 |
| Cosmos Pharmaceutical Corp. | 14,324 | 1,973,709 |
| Create SD Holdings Co., Ltd. | 30,824 | 841,689 |
| Credit Saison Co., Ltd. | 332,269 | 3,735,953 |
| CyberAgent, Inc. | 146,933 | 1,895,745 |
| Daifuku Co., Ltd. | 42,268 | 3,031,332 |
| Daihen Corp. | 27,813 | 1,039,592 |
| Daiho Corp. | 32,047 | 996,121 |
| Daiichikosho Co., Ltd. | 64,339 | 1,955,168 |
| Daikyonishikawa Corp. | 284,224 | 1,391,815 |
| Daio Paper Corp. | 107,898 | 1,592,590 |
| Daiseki Co., Ltd. | 27,403 | 1,111,109 |
| Daishi Hokuetsu Financial Group, Inc. | 49,267 | 1,138,263 |
Schwab Fundamental Index ETFs | Annual Report
Schwab Fundamental International Small Company Index ETF
Portfolio Holdings as of February 28, 2022 (continued)
| SECURITY | NUMBER
OF SHARES | VALUE ($) |
| Daiwa House REIT Investment Corp. | 277 | 749,169 |
| Daiwabo Holdings Co., Ltd. | 217,285 | 3,327,899 |
| DCM Holdings Co., Ltd. | 270,532 | 2,618,999 |
| DeNA Co., Ltd. | 99,773 | 1,528,106 |
| Descente Ltd. * | 38,958 | 1,019,825 |
| Dexerials Corp. | 43,022 | 1,210,256 |
| Disco Corp. | 10,955 | 3,057,983 |
| DMG Mori Co., Ltd. | 131,921 | 1,829,198 |
| Doshisha Co., Ltd. | 59,439 | 799,401 |
| Doutor Nichires Holdings Co., Ltd. | 85,657 | 1,205,557 |
| Dowa Holdings Co., Ltd. | 95,879 | 4,337,136 |
| DTS Corp. | 50,471 | 1,202,452 |
| Duskin Co., Ltd. | 80,775 | 1,964,409 |
| DyDo Group Holdings, Inc. | 20,993 | 938,693 |
| Eagle Industry Co., Ltd. | 94,922 | 853,824 |
| Earth Corp. | 15,601 | 759,901 |
| Eizo Corp. | 29,807 | 953,669 |
| Elecom Co., Ltd. | 43,248 | 590,659 |
| Exedy Corp. | 171,070 | 2,478,974 |
| Exeo Group, Inc. | 165,900 | 3,436,834 |
| Ezaki Glico Co., Ltd. | 84,662 | 2,888,836 |
| Fancl Corp. | 31,486 | 887,103 |
| FCC Co., Ltd. | 125,210 | 1,532,851 |
| Food & Life Cos. Ltd. | 35,394 | 1,167,764 |
| Foster Electric Co., Ltd. | 166,341 | 1,146,731 |
| FP Corp. | 33,112 | 937,227 |
| Fuji Co., Ltd. (a) | 75,519 | 2,065,421 |
| Fuji Corp. | 85,324 | 1,719,444 |
| Fuji Media Holdings, Inc. | 133,210 | 1,441,108 |
| Fuji Oil Holdings, Inc. | 71,018 | 1,376,889 |
| Fuji Seal International, Inc. | 74,013 | 1,165,701 |
| Fuji Soft, Inc. | 24,852 | 1,212,661 |
| Fujibo Holdings, Inc. | 16,745 | 521,941 |
| Fujimori Kogyo Co., Ltd. | 29,057 | 1,005,358 |
| Fujitec Co., Ltd. | 84,701 | 2,018,704 |
| Fujitsu General Ltd. | 61,642 | 1,323,022 |
| Fukuoka Financial Group, Inc. | 174,440 | 3,454,722 |
| Fukuyama Transporting Co., Ltd. | 51,082 | 1,758,542 |
| Furukawa Co., Ltd. | 99,233 | 1,144,184 |
| Furuno Electric Co., Ltd. | 63,176 | 566,075 |
| Futaba Industrial Co., Ltd. | 427,681 | 1,444,479 |
| Fuyo General Lease Co., Ltd. | 14,485 | 945,754 |
| Geo Holdings Corp. | 194,431 | 2,562,590 |
| Glory Ltd. | 143,098 | 2,586,760 |
| GLP J-REIT | 405 | 603,412 |
| GMO Internet, Inc. | 24,151 | 543,306 |
| Godo Steel Ltd. | 43,300 | 498,509 |
| Goldwin, Inc. | 15,428 | 810,414 |
| Gree, Inc. | 97,930 | 801,806 |
| GS Yuasa Corp. | 160,763 | 3,443,476 |
| GungHo Online Entertainment, Inc. | 70,599 | 1,548,979 |
| Gunze Ltd. | 40,735 | 1,391,728 |
| H.U. Group Holdings, Inc. | 98,565 | 2,597,306 |
| Hamakyorex Co., Ltd. | 39,163 | 987,448 |
| Hamamatsu Photonics K.K. | 40,860 | 2,054,086 |
| Hazama Ando Corp. | 466,232 | 3,740,381 |
| Heiwa Corp. | 100,596 | 1,690,065 |
| Heiwa Real Estate Co., Ltd. | 22,072 | 784,761 |
| Heiwado Co., Ltd. | 109,588 | 1,902,982 |
| Hikari Tsushin, Inc. | 13,773 | 1,698,082 |
| Hirata Corp. | 11,704 | 529,436 |
| Hirose Electric Co., Ltd. | 19,910 | 2,964,675 |
| HIS Co., Ltd. * | 70,229 | 1,203,664 |
| Hisamitsu Pharmaceutical Co., Inc. | 60,761 | 1,930,847 |
| Hitachi Transport System Ltd. | 42,339 | 2,235,043 |
| Hitachi Zosen Corp. | 337,571 | 2,315,442 |
| Hogy Medical Co., Ltd. | 23,819 | 692,804 |
| Hokkoku Financial Holdings, Inc. | 40,345 | 1,066,642 |
| SECURITY | NUMBER
OF SHARES | VALUE ($) |
| Hokuetsu Corp. | 408,456 | 2,539,219 |
| Hokuhoku Financial Group, Inc. | 260,681 | 2,129,810 |
| Hokuriku Electric Power Co. | 734,200 | 3,595,301 |
| Horiba Ltd. | 40,967 | 2,344,020 |
| Hoshizaki Corp. | 37,072 | 2,568,566 |
| Hosiden Corp. | 215,677 | 2,209,671 |
| House Foods Group, Inc. | 95,703 | 2,472,864 |
| Hulic Co., Ltd. | 233,878 | 2,126,071 |
| Ibiden Co., Ltd. | 67,753 | 3,247,203 |
| Ichikoh Industries Ltd. | 108,852 | 476,331 |
| IDOM, Inc. | 98,898 | 564,150 |
| Iino Kaiun Kaisha Ltd. | 185,307 | 1,420,674 |
| Inaba Denki Sangyo Co., Ltd. | 123,998 | 2,869,153 |
| Inabata & Co., Ltd. | 206,452 | 4,160,409 |
| Inageya Co., Ltd. | 70,099 | 873,385 |
| INFRONEER Holdings, Inc. | 513,145 | 4,544,458 |
| Internet Initiative Japan, Inc. | 40,612 | 1,290,557 |
| Iriso Electronics Co., Ltd. | 17,602 | 625,068 |
| Ishihara Sangyo Kaisha Ltd. | 107,305 | 987,569 |
| Ito En Ltd. | 44,136 | 2,529,174 |
| Itochu Enex Co., Ltd. | 233,475 | 2,118,354 |
| Itochu Techno-Solutions Corp. | 73,748 | 1,894,685 |
| Itoham Yonekyu Holdings, Inc. | 579,022 | 3,473,881 |
| Iwatani Corp. | 69,065 | 3,262,111 |
| Izumi Co., Ltd. | 101,201 | 2,824,929 |
| Jaccs Co., Ltd. | 54,308 | 1,527,744 |
| JAFCO Group Co., Ltd. | 44,393 | 662,956 |
| Japan Airport Terminal Co., Ltd. * | 30,198 | 1,402,729 |
| Japan Aviation Electronics Industry Ltd. | 116,011 | 1,819,109 |
| Japan Display, Inc. *(a) | 3,195,485 | 1,165,273 |
| Japan Lifeline Co., Ltd. | 56,276 | 534,543 |
| Japan Metropolitan Fund Invest | 1,550 | 1,252,919 |
| Japan Petroleum Exploration Co., Ltd. | 96,940 | 2,300,300 |
| Japan Post Bank Co., Ltd. | 306,312 | 2,696,769 |
| Japan Prime Realty Investment Corp. | 189 | 613,727 |
| Japan Real Estate Investment Corp. | 244 | 1,298,650 |
| Jeol Ltd. | 12,138 | 694,503 |
| J-Oil Mills, Inc. | 65,647 | 988,909 |
| Joshin Denki Co., Ltd. | 83,968 | 1,529,541 |
| Joyful Honda Co., Ltd. | 126,682 | 1,751,055 |
| Juki Corp. | 115,282 | 659,612 |
| Juroku Financial Group, Inc. | 50,377 | 1,068,994 |
| JVC Kenwood Corp. | 976,579 | 1,577,110 |
| Kadokawa Corp. | 51,162 | 1,282,437 |
| Kaga Electronics Co., Ltd. | 52,927 | 1,383,202 |
| Kagome Co., Ltd. | 72,065 | 1,920,899 |
| Kakaku.com, Inc. | 37,750 | 820,716 |
| Kaken Pharmaceutical Co., Ltd. | 47,693 | 1,747,467 |
| Kameda Seika Co., Ltd. | 18,331 | 657,322 |
| Kamigumi Co., Ltd. | 187,751 | 3,635,205 |
| Kanamoto Co., Ltd. | 82,824 | 1,637,423 |
| Kandenko Co., Ltd. | 330,099 | 2,502,074 |
| Kanematsu Corp. | 284,860 | 3,462,592 |
| Kansai Paint Co., Ltd. | 138,994 | 2,774,449 |
| Kanto Denka Kogyo Co., Ltd. | 79,829 | 831,039 |
| Kato Sangyo Co., Ltd. | 94,080 | 2,528,132 |
| Kawasaki Kisen Kaisha Ltd. * | 85,208 | 5,955,497 |
| Keihan Holdings Co., Ltd. | 109,923 | 2,920,463 |
| Keikyu Corp. | 272,542 | 2,849,061 |
| Keisei Electric Railway Co., Ltd. | 99,992 | 2,795,522 |
| Keiyo Co., Ltd. | 95,034 | 735,188 |
| KH Neochem Co., Ltd. | 40,302 | 989,573 |
| Kintetsu World Express, Inc. | 71,592 | 1,867,888 |
| Kissei Pharmaceutical Co., Ltd. | 38,905 | 819,817 |
| Kitz Corp. | 222,522 | 1,267,414 |
| Kobayashi Pharmaceutical Co., Ltd. | 26,670 | 2,273,926 |
| Koei Tecmo Holdings Co., Ltd. | 14,057 | 485,145 |
| Kohnan Shoji Co., Ltd. | 62,127 | 1,968,861 |
Schwab Fundamental Index ETFs | Annual Report
Schwab Fundamental International Small Company Index ETF
Portfolio Holdings as of February 28, 2022 (continued)
| SECURITY | NUMBER
OF SHARES | VALUE ($) |
| Kokuyo Co., Ltd. | 170,634 | 2,382,283 |
| Komeri Co., Ltd. | 76,791 | 1,882,855 |
| Konami Holdings Corp. | 56,273 | 3,166,043 |
| Kose Corp. | 18,285 | 2,084,498 |
| Kumagai Gumi Co., Ltd. | 97,169 | 2,433,971 |
| Kumiai Chemical Industry Co., Ltd. | 99,157 | 699,932 |
| Kura Sushi, Inc. | 20,877 | 671,581 |
| Kurabo Industries Ltd. | 81,003 | 1,342,607 |
| Kureha Corp. | 30,289 | 2,416,808 |
| Kurita Water Industries Ltd. | 86,892 | 3,545,842 |
| Kusuri no Aoki Holdings Co., Ltd. | 13,900 | 813,423 |
| KYB Corp. | 52,575 | 1,403,674 |
| Kyoei Steel Ltd. | 87,211 | 1,200,926 |
| KYORIN Holdings, Inc. | 76,654 | 1,246,563 |
| Kyoritsu Maintenance Co., Ltd. | 27,572 | 1,017,417 |
| Kyowa Kirin Co., Ltd. | 121,164 | 3,107,605 |
| Kyudenko Corp. | 77,826 | 2,084,595 |
| Kyushu Financial Group, Inc. | 400,262 | 1,431,803 |
| Lawson, Inc. (a) | 68,314 | 2,847,034 |
| Leopalace21 Corp. * | 959,593 | 1,699,648 |
| Life Corp. | 41,994 | 1,108,416 |
| Lintec Corp. | 102,824 | 2,284,581 |
| Lion Corp. | 217,356 | 2,840,206 |
| M3, Inc. | 21,946 | 813,436 |
| Mabuchi Motor Co., Ltd. | 68,872 | 2,370,979 |
| Macnica Fuji Electronics Holdings, Inc. | 131,680 | 3,059,481 |
| Makino Milling Machine Co., Ltd. | 51,620 | 1,682,944 |
| Mandom Corp. | 67,211 | 801,805 |
| Maruha Nichiro Corp. | 142,107 | 3,103,096 |
| Marui Group Co., Ltd. | 172,154 | 3,370,586 |
| Maruichi Steel Tube Ltd. | 89,322 | 2,210,269 |
| Max Co., Ltd. | 60,685 | 932,602 |
| Maxell Holdings Ltd. | 119,865 | 1,227,010 |
| MCJ Co., Ltd. | 93,896 | 819,323 |
| Mebuki Financial Group, Inc. | 1,233,152 | 2,901,534 |
| Megmilk Snow Brand Co., Ltd. | 163,411 | 2,884,433 |
| Meidensha Corp. | 76,333 | 1,489,214 |
| Meitec Corp. | 23,369 | 1,367,546 |
| Menicon Co., Ltd. | 19,611 | 507,919 |
| Ministop Co., Ltd. | 50,287 | 627,414 |
| Mirait Holdings Corp. | 179,931 | 3,041,681 |
| Mitsubishi HC Capital, Inc. | 615,613 | 3,201,669 |
| Mitsubishi Logisnext Co., Ltd. | 134,917 | 1,089,410 |
| Mitsubishi Logistics Corp. | 81,454 | 1,939,196 |
| Mitsui E&S Holdings Co., Ltd. * | 303,132 | 900,118 |
| Mitsui-Soko Holdings Co., Ltd. | 53,544 | 1,106,909 |
| Miura Co., Ltd. | 36,369 | 989,944 |
| Mixi, Inc. | 123,900 | 2,394,629 |
| Mizuho Leasing Co., Ltd. | 30,201 | 815,499 |
| Mizuno Corp. | 68,544 | 1,351,538 |
| Modec, Inc. | 44,355 | 452,119 |
| MonotaRO Co., Ltd. | 27,960 | 521,936 |
| Morinaga & Co., Ltd. | 57,434 | 1,865,015 |
| Morinaga Milk Industry Co., Ltd. | 75,796 | 3,790,623 |
| MOS Food Services, Inc. | 26,674 | 705,208 |
| Musashi Seimitsu Industry Co., Ltd. | 85,554 | 1,325,929 |
| Nabtesco Corp. | 95,175 | 2,611,270 |
| Nachi-Fujikoshi Corp. | 47,379 | 1,715,393 |
| Nankai Electric Railway Co., Ltd. | 144,376 | 2,932,021 |
| NEC Networks & System Integration Corp. | 70,998 | 1,082,461 |
| NET One Systems Co., Ltd. | 53,109 | 1,292,507 |
| Nexon Co., Ltd. | 129,363 | 2,794,488 |
| Nichias Corp. | 96,779 | 2,182,202 |
| Nichicon Corp. | 102,292 | 1,081,760 |
| Nichiha Corp. | 50,724 | 1,135,372 |
| Nichi-iko Pharmaceutical Co., Ltd. | 143,622 | 1,054,953 |
| Nichireki Co., Ltd. | 51,262 | 573,707 |
| SECURITY | NUMBER
OF SHARES | VALUE ($) |
| Nifco, Inc. | 101,982 | 2,895,430 |
| Nihon Kohden Corp. | 76,271 | 2,059,499 |
| Nihon M&A Center Holdings, Inc. | 24,738 | 357,189 |
| Nihon Parkerizing Co., Ltd. | 144,913 | 1,240,584 |
| Nihon Unisys Ltd. | 72,571 | 1,969,042 |
| Nikkiso Co., Ltd. | 121,428 | 837,107 |
| Nippn Corp. | 141,608 | 2,098,761 |
| Nippo Corp. (a) | 83,194 | 2,878,473 |
| Nippon Building Fund, Inc. | 261 | 1,491,105 |
| Nippon Chemi-Con Corp. * | 43,400 | 682,040 |
| Nippon Denko Co., Ltd. | 234,604 | 682,373 |
| Nippon Densetsu Kogyo Co., Ltd. | 82,176 | 1,135,873 |
| Nippon Gas Co., Ltd. | 110,169 | 1,653,850 |
| Nippon Holdings Co., Ltd. | 116,901 | 2,222,819 |
| Nippon Kayaku Co., Ltd. | 319,573 | 3,152,029 |
| Nippon Koei Co., Ltd. | 30,290 | 806,068 |
| Nippon Paint Holdings Co., Ltd. | 188,847 | 1,670,806 |
| Nippon Prologis REIT, Inc. | 219 | 641,741 |
| Nippon Sanso Holdings Corp. | 109,405 | 2,129,681 |
| Nippon Sheet Glass Co., Ltd. * | 484,158 | 2,009,356 |
| Nippon Shinyaku Co., Ltd. | 21,920 | 1,417,877 |
| Nippon Signal Company Ltd. | 122,849 | 925,834 |
| Nippon Soda Co., Ltd. | 57,708 | 1,688,526 |
| Nippon Suisan Kaisha Ltd. | 761,001 | 3,594,396 |
| Nippon Television Holdings, Inc. | 65,432 | 748,200 |
| Nippon Thompson Co., Ltd. | 111,229 | 522,465 |
| Nippon Yakin Kogyo Co., Ltd. | 43,646 | 1,070,923 |
| Nipro Corp. | 217,465 | 2,063,723 |
| Nishimatsu Construction Co., Ltd. | 102,957 | 3,419,236 |
| Nishimatsuya Chain Co., Ltd. | 72,595 | 898,810 |
| Nishi-Nippon Financial Holdings, Inc. | 257,879 | 1,847,191 |
| Nishi-Nippon Railroad Co., Ltd. | 117,280 | 2,649,556 |
| Nishio Rent All Co., Ltd. | 46,767 | 1,163,338 |
| Nissan Chemical Corp. | 69,804 | 3,939,449 |
| Nissha Co., Ltd. | 79,281 | 903,807 |
| Nisshinbo Holdings, Inc. | 461,449 | 4,054,581 |
| Nissin Electric Co., Ltd. | 77,466 | 977,279 |
| Nitta Corp. | 33,101 | 796,953 |
| Nittetsu Mining Co., Ltd. | 19,642 | 1,135,800 |
| Nitto Boseki Co., Ltd. | 29,585 | 782,169 |
| Nitto Kogyo Corp. | 63,282 | 885,701 |
| Noevir Holdings Co., Ltd. | 12,764 | 572,953 |
| NOF Corp. | 51,458 | 2,224,969 |
| Nojima Corp. | 83,809 | 1,851,911 |
| Nomura Co., Ltd. | 108,854 | 876,125 |
| Nomura Real Estate Master Fund, Inc. | 904 | 1,191,467 |
| Nomura Research Institute Ltd. | 101,983 | 3,519,708 |
| North Pacific Bank Ltd. | 388,412 | 856,580 |
| NS Solutions Corp. | 39,436 | 1,244,627 |
| NSD Co., Ltd. | 53,867 | 1,005,081 |
| Obic Co., Ltd. | 9,938 | 1,579,898 |
| Ohsho Food Service Corp. | 11,836 | 621,730 |
| Okamoto Industries, Inc. | 26,039 | 906,589 |
| Okamura Corp. | 172,477 | 1,774,563 |
| Okasan Securities Group, Inc. | 247,043 | 840,815 |
| Oki Electric Industry Co., Ltd. | 325,711 | 2,386,803 |
| OKUMA Corp. | 54,290 | 2,198,939 |
| Okumura Corp. | 91,522 | 2,578,588 |
| Okuwa Co., Ltd. (a) | 143,307 | 1,211,904 |
| Onward Holdings Co., Ltd. | 590,630 | 1,420,486 |
| Open House Group Co., Ltd. | 40,699 | 1,837,506 |
| Oracle Corp. Japan | 15,006 | 1,063,156 |
| Orient Corp. | 822,650 | 899,969 |
| Orix JREIT, Inc. | 532 | 743,206 |
| Osaka Soda Co., Ltd. | 43,040 | 1,173,394 |
| OSG Corp. | 116,142 | 1,931,078 |
| Outsourcing, Inc. | 79,723 | 974,604 |
| Pacific Industrial Co., Ltd. | 117,152 | 1,032,423 |
Schwab Fundamental Index ETFs | Annual Report
Schwab Fundamental International Small Company Index ETF
Portfolio Holdings as of February 28, 2022 (continued)
| SECURITY | NUMBER
OF SHARES | VALUE ($) |
| Paramount Bed Holdings Co., Ltd. | 55,602 | 975,177 |
| Park24 Co., Ltd. * | 133,648 | 1,986,589 |
| Pasona Group, Inc. | 29,733 | 647,453 |
| Penta-Ocean Construction Co., Ltd. | 577,576 | 3,023,906 |
| Pigeon Corp. | 71,282 | 1,310,834 |
| Pilot Corp. | 47,264 | 1,932,828 |
| Piolax, Inc. | 60,556 | 908,537 |
| Plenus Co., Ltd. | 54,554 | 945,903 |
| Pola Orbis Holdings, Inc. | 76,131 | 1,187,161 |
| Press Kogyo Co., Ltd. | 578,682 | 1,874,091 |
| Prima Meat Packers Ltd. | 71,031 | 1,493,085 |
| Qol Holdings Co., Ltd. | 55,460 | 617,319 |
| Raito Kogyo Co., Ltd. | 68,835 | 1,167,222 |
| Raiznext Corp. | 106,312 | 1,050,428 |
| Relia, Inc. | 79,776 | 730,053 |
| Relo Group, Inc. | 55,116 | 818,306 |
| Rengo Co., Ltd. | 500,393 | 3,736,384 |
| Resorttrust, Inc. | 72,795 | 1,227,418 |
| Restar Holdings Corp. | 79,514 | 1,366,944 |
| Retail Partners Co., Ltd. (a) | 126,754 | 1,414,186 |
| Rinnai Corp. | 36,594 | 2,992,971 |
| Rohto Pharmaceutical Co., Ltd. | 80,568 | 2,696,676 |
| Round One Corp. | 86,818 | 974,653 |
| Royal Holdings Co., Ltd. * | 49,382 | 844,221 |
| Ryobi Ltd. | 180,037 | 1,710,097 |
| Ryosan Co., Ltd. | 121,000 | 2,447,840 |
| Ryoyo Electro Corp. | 31,703 | 599,790 |
| S Foods, Inc. | 49,759 | 1,427,858 |
| Saibu Gas Holdings Co., Ltd. | 48,759 | 973,275 |
| Saizeriya Co., Ltd. | 48,277 | 1,228,145 |
| Sakata INX Corp. | 118,522 | 986,869 |
| Sakata Seed Corp. | 23,925 | 701,080 |
| SAMTY Co., Ltd. | 35,605 | 672,067 |
| San-A Co., Ltd. | 38,477 | 1,424,827 |
| Sanden Holdings Corp. * | 244,365 | 417,972 |
| Sangetsu Corp. | 120,410 | 1,685,270 |
| Sanken Electric Co., Ltd. | 25,822 | 1,165,829 |
| Sanki Engineering Co., Ltd. | 122,727 | 1,590,896 |
| Sankyo Co., Ltd. | 66,134 | 1,840,325 |
| Sanoh Industrial Co., Ltd. | 65,504 | 399,252 |
| Sanrio Co., Ltd. | 39,926 | 813,946 |
| Sanwa Holdings Corp. | 321,971 | 3,578,232 |
| Sanyo Chemical Industries Ltd. | 22,117 | 983,191 |
| Sanyo Denki Co., Ltd. | 13,114 | 576,139 |
| Sanyo Special Steel Co., Ltd. | 57,185 | 1,055,570 |
| Sapporo Holdings Ltd. | 142,267 | 2,812,607 |
| Sato Holdings Corp. | 41,501 | 731,830 |
| Sawai Group Holdings Co., Ltd. | 58,603 | 2,322,750 |
| SCREEN Holdings Co., Ltd. | 32,294 | 3,117,945 |
| SCSK Corp. | 108,368 | 1,842,280 |
| Sega Sammy Holdings, Inc. | 274,501 | 4,978,794 |
| Seiko Holdings Corp. | 76,859 | 1,601,577 |
| Seiren Co., Ltd. | 62,125 | 1,241,691 |
| Sekisui Jushi Corp. | 38,708 | 643,929 |
| Senko Group Holdings Co., Ltd. | 291,443 | 2,381,141 |
| Senshu Ikeda Holdings, Inc. | 563,756 | 910,429 |
| Seven Bank Ltd. | 803,145 | 1,715,421 |
| Sharp Corp. | 165,027 | 1,551,762 |
| Shibaura Machine Co., Ltd. | 39,946 | 1,061,296 |
| Shibuya Corp. | 27,248 | 583,168 |
| Shima Seiki Manufacturing Ltd. | 45,068 | 699,645 |
| Shindengen Electric Manufacturing Co., Ltd. * | 22,985 | 586,524 |
| Shinko Electric Industries Co., Ltd. | 37,276 | 1,559,977 |
| Shinmaywa Industries Ltd. | 190,132 | 1,536,904 |
| Shinsei Bank Ltd. | 75,598 | 1,421,708 |
| Ship Healthcare Holdings, Inc. | 95,058 | 1,878,463 |
| SHO-BOND Holdings Co., Ltd. | 22,315 | 993,931 |
| SECURITY | NUMBER
OF SHARES | VALUE ($) |
| Shochiku Co., Ltd. * | 6,599 | 683,534 |
| Shoei Foods Corp. | 21,023 | 770,281 |
| Showa Sangyo Co., Ltd. | 65,506 | 1,559,518 |
| Siix Corp. | 95,047 | 920,142 |
| SKY Perfect JSAT Holdings, Inc. | 343,079 | 1,283,847 |
| Skylark Holdings Co., Ltd. * | 282,056 | 3,690,544 |
| Sodick Co., Ltd. | 79,198 | 532,915 |
| Sohgo Security Services Co., Ltd. | 79,527 | 2,858,622 |
| Sotetsu Holdings, Inc. | 116,664 | 2,208,183 |
| Square Enix Holdings Co., Ltd. | 50,202 | 2,423,470 |
| St Marc Holdings Co., Ltd. | 55,118 | 768,565 |
| Star Micronics Co., Ltd. | 49,854 | 633,699 |
| Starts Corp., Inc. | 48,926 | 1,102,773 |
| Sugi Holdings Co., Ltd. | 42,379 | 2,391,695 |
| Sumitomo Bakelite Co., Ltd. | 43,088 | 1,778,888 |
| Sumitomo Dainippon Pharma Co., Ltd. | 169,500 | 1,858,724 |
| Sumitomo Densetsu Co., Ltd. | 32,264 | 646,821 |
| Sumitomo Mitsui Construction Co., Ltd. | 662,274 | 2,535,818 |
| Sumitomo Osaka Cement Co., Ltd. | 117,792 | 3,502,823 |
| Sundrug Co., Ltd. | 125,330 | 3,395,091 |
| Suruga Bank Ltd. | 541,632 | 2,125,615 |
| SWCC Showa Holdings Co., Ltd. | 44,792 | 731,917 |
| Tadano Ltd. | 239,081 | 2,036,366 |
| Taikisha Ltd. | 65,428 | 1,761,031 |
| Taisho Pharmaceutical Holdings Co., Ltd. | 48,180 | 2,388,607 |
| Taiyo Holdings Co., Ltd. | 26,001 | 691,930 |
| Takara Holdings, Inc. | 196,447 | 1,946,134 |
| Takara Leben Co., Ltd. | 236,698 | 645,306 |
| Takara Standard Co., Ltd. | 114,464 | 1,353,592 |
| Takasago Thermal Engineering Co., Ltd. | 140,134 | 2,354,324 |
| Takeuchi Manufacturing Co., Ltd. | 50,323 | 1,120,716 |
| Takuma Co., Ltd. | 80,906 | 1,022,081 |
| Tamura Corp. | 147,278 | 769,797 |
| Tanseisha Co., Ltd. | 80,338 | 511,289 |
| TBS Holdings, Inc. | 64,461 | 1,041,002 |
| TechnoPro Holdings, Inc. | 51,501 | 1,477,845 |
| T-Gaia Corp. | 67,980 | 1,022,872 |
| The 77 Bank Ltd. | 100,192 | 1,356,191 |
| The Awa Bank Ltd. | 42,668 | 860,954 |
| The Bank of Kyoto Ltd. | 35,122 | 1,564,366 |
| The Chiba Bank Ltd. | 506,355 | 3,204,973 |
| The Chugoku Bank Ltd. | 190,947 | 1,503,702 |
| The Gunma Bank Ltd. | 630,243 | 2,095,794 |
| The Hachijuni Bank Ltd. | 605,699 | 2,298,159 |
| The Hyakugo Bank Ltd. | 240,376 | 740,903 |
| The Iyo Bank Ltd. | 292,492 | 1,574,517 |
| The Japan Steel Works Ltd. | 81,650 | 2,644,276 |
| The Japan Wool Textile Co., Ltd. | 134,150 | 1,054,098 |
| The Kiyo Bank Ltd. | 70,107 | 897,832 |
| The Musashino Bank Ltd. | 52,695 | 869,290 |
| The Nanto Bank Ltd. | 44,679 | 826,663 |
| The Nisshin Oillio Group Ltd. | 80,352 | 2,131,325 |
| The Ogaki Kyoritsu Bank Ltd. | 47,411 | 838,105 |
| The Okinawa Electric Power Co., Inc. | 149,223 | 1,878,649 |
| The San-in Godo Bank Ltd. | 215,612 | 1,272,986 |
| The Shiga Bank Ltd. | 54,423 | 1,057,510 |
| The Shizuoka Bank Ltd. | 411,444 | 3,054,349 |
| The Sumitomo Warehouse Co., Ltd. | 95,861 | 1,772,815 |
| THK Co., Ltd. | 138,500 | 3,150,597 |
| TKC Corp. | 20,674 | 561,837 |
| Toa Corp. (a) | 42,857 | 960,771 |
| Toagosei Co., Ltd. | 225,780 | 2,142,631 |
| Tocalo Co., Ltd. | 47,840 | 555,347 |
| Toda Corp. | 443,337 | 2,956,222 |
| Toei Co., Ltd. | 4,623 | 715,276 |
| Toho Co., Ltd. | 80,427 | 3,341,378 |
| Toho Zinc Co., Ltd. | 49,090 | 1,170,403 |
Schwab Fundamental Index ETFs | Annual Report
Schwab Fundamental International Small Company Index ETF
Portfolio Holdings as of February 28, 2022 (continued)
| SECURITY | NUMBER
OF SHARES | VALUE ($) |
| Tokai Carbon Co., Ltd. | 190,437 | 1,820,457 |
| TOKAI Holdings Corp. | 222,406 | 1,763,027 |
| Tokai Rika Co., Ltd. | 221,095 | 2,925,537 |
| Tokai Tokyo Financial Holdings, Inc. | 238,010 | 867,933 |
| Token Corp. | 19,139 | 1,510,515 |
| Tokuyama Corp. | 183,757 | 2,822,367 |
| Tokyo Century Corp. | 41,618 | 1,821,183 |
| Tokyo Ohka Kogyo Co., Ltd. | 25,433 | 1,598,740 |
| Tokyo Seimitsu Co., Ltd. | 35,543 | 1,456,592 |
| Tokyo Steel Manufacturing Co., Ltd. | 149,248 | 1,457,816 |
| Tokyo Tatemono Co., Ltd. | 231,719 | 3,544,944 |
| Tokyu Construction Co., Ltd. | 284,193 | 1,751,917 |
| Tomy Co., Ltd. | 200,349 | 2,184,835 |
| Topcon Corp. | 107,915 | 1,412,944 |
| Toppan Forms Co., Ltd. *(a)(b) | 112,353 | 1,512,022 |
| Topre Corp. | 177,917 | 1,838,257 |
| Toshiba TEC Corp. | 38,268 | 1,619,766 |
| Totetsu Kogyo Co., Ltd. | 64,598 | 1,407,218 |
| Towa Pharmaceutical Co., Ltd. | 34,367 | 886,813 |
| Toyo Construction Co., Ltd. | 207,865 | 1,079,256 |
| Toyo Ink SC Holdings Co., Ltd. | 130,328 | 2,178,263 |
| Toyo Tire Corp. | 191,356 | 2,523,723 |
| Toyobo Co., Ltd. | 272,155 | 2,944,260 |
| Toyota Boshoku Corp. | 211,545 | 3,849,779 |
| TPR Co., Ltd. | 133,198 | 1,606,356 |
| Trancom Co., Ltd. | 12,571 | 794,590 |
| Transcosmos, Inc. | 49,144 | 1,348,340 |
| Trend Micro, Inc. | 64,206 | 3,567,774 |
| Trusco Nakayama Corp. | 61,202 | 1,335,365 |
| TSI Holdings Co., Ltd. | 506,270 | 1,468,150 |
| Tsubaki Nakashima Co., Ltd. | 59,977 | 506,687 |
| Tsubakimoto Chain Co. | 102,260 | 2,916,641 |
| Tsumura & Co. | 60,826 | 1,684,697 |
| TV Asahi Holdings Corp. | 53,999 | 734,677 |
| UACJ Corp. * | 101,520 | 2,073,150 |
| Uchida Yoko Co., Ltd. | 18,334 | 757,715 |
| Ulvac, Inc. | 55,505 | 2,727,661 |
| Unipres Corp. | 365,351 | 2,442,546 |
| United Arrows Ltd. | 94,336 | 1,395,690 |
| United Super Markets Holdings, Inc. (a) | 268,600 | 2,472,030 |
| United Urban Investment Corp. | 778 | 888,274 |
| Unitika Ltd. * | 187,699 | 488,906 |
| Ushio, Inc. | 143,097 | 2,314,649 |
| USS Co., Ltd. | 122,967 | 2,032,812 |
| V Technology Co., Ltd. | 14,546 | 431,297 |
| Valor Holdings Co., Ltd. | 139,289 | 2,690,845 |
| Valqua Ltd. | 30,045 | 706,419 |
| VT Holdings Co., Ltd. | 227,434 | 969,569 |
| Wacoal Holdings Corp. | 125,140 | 2,145,878 |
| Wacom Co., Ltd. | 115,270 | 866,714 |
| Wakita & Co., Ltd. | 99,488 | 859,480 |
| Warabeya Nichiyo Holdings Co., Ltd. | 81,544 | 1,298,474 |
| Welcia Holdings Co., Ltd. | 82,415 | 2,193,201 |
| World Co., Ltd. * | 88,303 | 966,790 |
| Xebio Holdings Co., Ltd. | 133,743 | 1,114,767 |
| YAMABIKO Corp. | 88,317 | 1,019,853 |
| Yamaguchi Financial Group, Inc. | 323,509 | 2,005,517 |
| Yamato Kogyo Co., Ltd. | 48,778 | 1,562,759 |
| Yamazen Corp. | 257,100 | 2,294,758 |
| Yaoko Co., Ltd. | 29,230 | 1,667,385 |
| Yellow Hat Ltd. | 67,779 | 958,057 |
| Yokogawa Bridge Holdings Corp. | 55,591 | 1,014,563 |
| Yokohama Reito Co., Ltd. | 118,972 | 903,846 |
| Yondoshi Holdings, Inc. | 44,547 | 662,548 |
| Yoshinoya Holdings Co., Ltd. (a) | 78,028 | 1,616,452 |
| Yuasa Trading Co., Ltd. | 75,051 | 1,944,451 |
| Zenkoku Hosho Co., Ltd. | 20,601 | 862,139 |
| Zenrin Co., Ltd. | 61,109 | 590,530 |
| SECURITY | NUMBER
OF SHARES | VALUE ($) |
| Zensho Holdings Co., Ltd. | 83,377 | 1,995,112 |
| Zeon Corp. | 221,144 | 2,582,493 |
| ZERIA Pharmaceutical Co., Ltd. | 38,914 | 669,993 |
| Zojirushi Corp. | 53,732 | 676,461 |
| ZOZO, Inc. | 21,898 | 617,916 |
| | | 886,647,955 |
| |
| Luxembourg 0.0% |
| Espirito Santo Financial Group S.A. *(b) | 8,470 | 0 |
| |
| Netherlands 1.6% |
| Accell Group N.V. * | 21,774 | 1,408,698 |
| Adyen N.V. * | 493 | 1,032,389 |
| AMG Advanced Metallurgical Group N.V. | 22,725 | 901,534 |
| Arcadis N.V. | 63,854 | 2,914,735 |
| ASM International N.V. | 8,369 | 2,709,099 |
| BE Semiconductor Industries N.V. | 21,501 | 1,838,776 |
| Boskalis Westminster | 121,675 | 3,520,501 |
| Corbion N.V. | 37,368 | 1,381,710 |
| Eurocommercial Properties N.V. | 53,648 | 1,336,510 |
| Flow Traders | 15,917 | 549,212 |
| Fugro N.V. CVA * | 105,659 | 1,018,242 |
| Heijmans N.V. CVA | 41,482 | 635,523 |
| IMCD N.V. | 15,175 | 2,466,349 |
| Intertrust N.V. * | 82,599 | 1,792,418 |
| JDE Peet's N.V. | 41,210 | 1,355,055 |
| Koninklijke BAM Groep N.V. * | 796,634 | 2,244,107 |
| Koninklijke Vopak N.V. | 62,388 | 2,315,253 |
| OCI N.V. * | 55,219 | 1,569,157 |
| PostNL N.V. | 415,433 | 1,669,547 |
| SBM Offshore N.V. | 216,850 | 3,300,320 |
| Sligro Food Group N.V. * | 81,066 | 2,071,464 |
| TKH Group N.V. | 43,612 | 2,414,961 |
| TomTom N.V. * | 76,175 | 637,848 |
| Van Lanschot Kempen N.V. | 30,452 | 771,293 |
| Wereldhave N.V. | 74,083 | 1,352,996 |
| | | 43,207,697 |
| |
| New Zealand 0.9% |
| Air New Zealand Ltd. * | 2,422,594 | 2,451,037 |
| Auckland International Airport Ltd. * | 366,296 | 1,764,982 |
| Chorus Ltd. | 401,562 | 1,985,185 |
| EBOS Group Ltd. | 103,983 | 2,742,337 |
| Fisher & Paykel Healthcare Corp., Ltd. | 98,155 | 1,827,390 |
| Freightways Ltd. | 92,595 | 763,243 |
| Genesis Energy Ltd. | 648,546 | 1,209,179 |
| Infratil Ltd. | 240,133 | 1,291,954 |
| Mercury NZ Ltd. | 430,551 | 1,666,667 |
| Meridian Energy Ltd. | 841,955 | 2,846,115 |
| Ryman Healthcare Ltd. | 76,163 | 515,433 |
| SKYCITY Entertainment Group Ltd. | 882,518 | 1,767,842 |
| The a2 Milk Co., Ltd. * | 210,558 | 847,846 |
| Z Energy Ltd. | 1,120,380 | 2,759,910 |
| | | 24,439,120 |
| |
| Norway 1.7% |
| Aker A.S.A., A Shares | 22,203 | 1,841,907 |
| Aker BP A.S.A. | 89,987 | 2,798,775 |
| Aker Solutions A.S.A. * | 555,194 | 1,755,175 |
| Austevoll Seafood A.S.A. | 132,930 | 1,883,527 |
| Bakkafrost P/F | 19,002 | 1,294,366 |
| Borregaard A.S.A. | 47,554 | 1,052,351 |
| BW LPG Ltd. | 179,374 | 1,067,842 |
| BW Offshore Ltd. | 236,873 | 749,921 |
Schwab Fundamental Index ETFs | Annual Report
Schwab Fundamental International Small Company Index ETF
Portfolio Holdings as of February 28, 2022 (continued)
| SECURITY | NUMBER
OF SHARES | VALUE ($) |
| DNO A.S.A. | 724,686 | 913,929 |
| Elkem A.S.A. | 404,583 | 1,527,484 |
| Entra A.S.A. | 55,840 | 1,184,282 |
| Europris A.S.A. | 142,450 | 910,394 |
| Fjordkraft Holding A.S.A. | 101,128 | 419,524 |
| Frontline Ltd. * | 127,901 | 1,229,900 |
| Gjensidige Forsikring A.S.A. | 105,763 | 2,620,727 |
| Grieg Seafood A.S.A. * | 78,340 | 988,866 |
| Kongsberg Automotive A.S.A. * | 3,092,734 | 959,088 |
| Kongsberg Gruppen A.S.A. | 42,899 | 1,513,282 |
| Leroy Seafood Group A.S.A. | 227,145 | 1,983,788 |
| PGS A.S.A. * | 3,450,560 | 953,513 |
| Salmar A.S.A. | 26,600 | 1,963,772 |
| Schibsted A.S.A., A Shares | 16,309 | 469,593 |
| Schibsted A.S.A., B Shares | 18,541 | 481,149 |
| SpareBank 1 Nord Norge | 119,274 | 1,464,874 |
| SpareBank 1 SMN | 117,286 | 1,939,284 |
| SpareBank 1 SR-Bank A.S.A. | 118,463 | 1,762,062 |
| Storebrand A.S.A. | 256,511 | 2,542,459 |
| TGS Nopec Geophysical Co. A.S.A. | 194,625 | 2,177,833 |
| Tomra Systems A.S.A. | 25,771 | 1,216,801 |
| Veidekke A.S.A. | 131,571 | 2,037,831 |
| XXL A.S.A. | 400,740 | 543,212 |
| | | 44,247,511 |
| |
| Poland 0.8% |
| Alior Bank S.A. * | 190,768 | 2,136,821 |
| Asseco Poland S.A. | 109,756 | 1,941,423 |
| Bank Millennium S.A. * | 588,199 | 984,901 |
| Cyfrowy Polsat S.A. | 335,271 | 2,181,445 |
| Enea S.A. * | 1,071,374 | 2,248,515 |
| Eurocash S.A. | 330,350 | 748,983 |
| Jastrzebska Spolka Weglowa S.A. * | 166,982 | 1,964,588 |
| LPP S.A. | 355 | 734,439 |
| mBank S.A. * | 10,256 | 1,012,484 |
| Orange Polska S.A. * | 1,389,972 | 2,588,235 |
| Santander Bank Polska S.A. | 26,518 | 1,994,793 |
| Tauron Polska Energia S.A. * | 4,066,471 | 2,414,513 |
| | | 20,951,140 |
| |
| Portugal 0.4% |
| Banco Espirito Santo S.A. *(b) | 45,383 | 0 |
| CTT-Correios de Portugal S.A. | 222,416 | 1,081,711 |
| EDP Renovaveis S.A. | 45,853 | 1,118,626 |
| Mota-Engil, SGPS, S.A. *(a) | 467,273 | 635,058 |
| NOS, SGPS S.A. | 540,293 | 2,083,948 |
| REN - Redes Energeticas Nacionais, SGPS, S.A. | 497,969 | 1,445,840 |
| Sonae, SGPS, S.A. | 2,286,883 | 2,491,569 |
| The Navigator Co. S.A. | 507,862 | 1,818,533 |
| | | 10,675,285 |
| |
| Republic of Korea 7.4% |
| AJ Networks Co., Ltd. | 136,650 | 608,041 |
| AK Holdings, Inc. | 37,858 | 665,943 |
| AMOREPACIFIC Group | 50,486 | 2,049,085 |
| Asiana Airlines, Inc. * | 92,102 | 1,466,922 |
| BGF retail Co., Ltd. | 10,966 | 1,545,920 |
| Binggrae Co., Ltd. * | 13,156 | 584,298 |
| Celltrion, Inc. | 8,498 | 1,127,318 |
| Cheil Worldwide, Inc. | 95,514 | 1,787,387 |
| Chong Kun Dang Pharmaceutical Corp. * | 6,215 | 496,745 |
| CJ CGV Co., Ltd. * | 30,951 | 665,433 |
| CJ ENM Co., Ltd. | 14,418 | 1,558,897 |
| CJ Logistics Corp. * | 12,298 | 1,268,310 |
| SECURITY | NUMBER
OF SHARES | VALUE ($) |
| Com2uSCorp | 8,326 | 761,032 |
| Daehan Flour Mill Co., Ltd. * | 5,027 | 700,314 |
| Daesang Corp. * | 61,391 | 1,136,067 |
| Daewoo Engineering & Construction Co., Ltd. * | 381,334 | 1,988,576 |
| Daewoo Shipbuilding & Marine Engineering Co., Ltd. * | 96,199 | 2,120,242 |
| Daou Technology, Inc. | 38,303 | 684,921 |
| DB HiTek Co., Ltd. | 22,361 | 1,290,684 |
| DGB Financial Group, Inc. | 344,832 | 2,718,848 |
| DL Holdings Co., Ltd. | 39,759 | 1,997,292 |
| Dongkuk Steel Mill Co., Ltd. | 204,203 | 2,802,303 |
| Dongwon Industries Co., Ltd. | 3,436 | 600,125 |
| Doosan Bobcat, Inc. | 38,860 | 1,233,010 |
| Doosan Co., Ltd. * | 28,302 | 2,671,665 |
| Doosan Heavy Industries & Construction Co., Ltd. * | 379,949 | 6,572,911 |
| Easy Holdings Co., Ltd. * | 150,812 | 496,080 |
| Fila Holdings Corp. | 45,361 | 1,327,989 |
| Green Cross Corp. | 2,560 | 387,508 |
| Green Cross Holdings Corp. | 22,662 | 420,312 |
| GS Global Corp. * | 309,363 | 603,365 |
| GS Retail Co., Ltd. | 103,920 | 2,294,736 |
| Halla Holdings Corp. | 18,252 | 614,801 |
| Handsome Co., Ltd. | 24,618 | 734,025 |
| Hanjin Transportation Co., Ltd. * | 37,076 | 878,834 |
| Hanmi Pharm Co., Ltd. * | 2,649 | 583,844 |
| Hanon Systems | 137,556 | 1,321,389 |
| Hansol Chemical Co., Ltd. | 2,519 | 449,391 |
| Hansol Paper Co., Ltd. | 77,036 | 788,076 |
| Hanssem Co., Ltd. | 9,766 | 592,937 |
| Hanwha Aerospace Co., Ltd. | 44,851 | 1,939,745 |
| Hanwha General Insurance Co., Ltd. * | 520,192 | 1,845,235 |
| Hanwha Life Insurance Co., Ltd. * | 1,130,379 | 2,778,118 |
| Harim Holdings Co., Ltd. | 140,492 | 1,215,218 |
| HDC Holdings Co., Ltd. * | 107,676 | 684,197 |
| HDC Hyundai Development Co-Engineering & Construction * | 109,015 | 1,455,226 |
| Hite Jinro Co., Ltd. * | 31,532 | 933,621 |
| HMM Co., Ltd. * | 48,892 | 1,173,148 |
| Hotel Shilla Co., Ltd. | 30,479 | 2,040,637 |
| HS Industries Co., Ltd. * | 108,928 | 480,158 |
| Huchems Fine Chemical Corp. | 36,736 | 675,232 |
| Hyosung Advanced Materials Corp. | 2,250 | 868,300 |
| Hyosung Chemical Corp. * | 3,500 | 800,516 |
| Hyosung Corp. | 14,485 | 1,024,015 |
| Hyosung Heavy Industries Corp. * | 19,615 | 910,315 |
| Hyosung TNC Corp. | 2,959 | 1,186,209 |
| Hyundai Construction Equipment Co., Ltd. | 45,045 | 1,255,048 |
| Hyundai Corp. | 63,658 | 878,881 |
| Hyundai Department Store Co., Ltd. | 32,423 | 2,097,983 |
| Hyundai Doosan Infracore Co., Ltd. * | 258,124 | 1,451,256 |
| Hyundai Elevator Co., Ltd. * | 22,327 | 700,997 |
| Hyundai Greenfood Co., Ltd. | 172,346 | 1,202,631 |
| Hyundai Home Shopping Network Corp. | 13,059 | 633,210 |
| Hyundai Mipo Dockyard Co., Ltd. | 30,275 | 2,009,353 |
| Hyundai Wia Corp. | 52,736 | 2,675,507 |
| Innocean Worldwide, Inc. | 12,984 | 539,943 |
| Interpark Holdings Corp. | 141,658 | 692,768 |
| INTOPS Co., Ltd. | 25,835 | 706,925 |
| IS Dongseo Co., Ltd. * | 20,422 | 898,510 |
| JB Financial Group Co., Ltd. | 287,793 | 1,967,529 |
| Kakao Corp. | 16,192 | 1,267,241 |
| Kangwon Land, Inc. * | 121,144 | 2,670,035 |
| KCC Corp. | 7,959 | 2,194,376 |
Schwab Fundamental Index ETFs | Annual Report
Schwab Fundamental International Small Company Index ETF
Portfolio Holdings as of February 28, 2022 (continued)
| SECURITY | NUMBER
OF SHARES | VALUE ($) |
| KEPCO Plant Service & Engineering Co., Ltd. * | 37,376 | 1,150,174 |
| KIWOOM Securities Co., Ltd. * | 6,190 | 522,548 |
| Kolon Corp. | 33,246 | 804,640 |
| Kolon Industries, Inc. | 47,185 | 2,299,697 |
| Korea Aerospace Industries Ltd. * | 50,800 | 1,567,497 |
| Korea Electric Terminal Co., Ltd. | 12,422 | 601,289 |
| Korea Investment Holdings Co., Ltd. * | 25,777 | 1,697,957 |
| Korea Petrochemical Ind Co., Ltd. * | 8,099 | 1,145,116 |
| Korean Reinsurance Co. | 218,005 | 1,751,510 |
| Kumho Petrochemical Co., Ltd. * | 18,856 | 2,517,061 |
| Kumho Tire Co., Inc. * | 238,238 | 788,612 |
| KUMHOE&C Co., Ltd. * | 65,354 | 584,319 |
| Kwang Dong Pharmaceutical Co., Ltd. | 112,218 | 680,392 |
| LF Corp. | 78,495 | 1,168,595 |
| LG Hausys Ltd. | 23,949 | 1,095,517 |
| LG HelloVision Co., Ltd. | 143,124 | 593,994 |
| LG Innotek Co., Ltd. | 19,978 | 5,433,365 |
| Lotte Chilsung Beverage Co., Ltd. | 6,331 | 866,178 |
| Lotte Corp. | 30,574 | 738,699 |
| LOTTE Fine Chemical Co., Ltd. | 27,617 | 1,821,456 |
| Lotte Food Co., Ltd. | 2,040 | 531,908 |
| LOTTE Himart Co., Ltd. | 83,523 | 1,611,622 |
| LS Corp. | 63,558 | 2,574,354 |
| LS Electric Co., Ltd. | 27,930 | 997,707 |
| LX International Corp. | 121,657 | 2,989,948 |
| Mando Corp. | 57,662 | 2,174,884 |
| Meritz Financial Group, Inc. | 61,428 | 1,882,665 |
| Meritz Fire & Marine Insurance Co., Ltd. | 156,189 | 5,339,018 |
| Meritz Securities Co., Ltd. | 324,257 | 1,580,360 |
| Mirae Asset Daewoo Co., Ltd. | 156,423 | 1,143,559 |
| NCSoft Corp. | 4,200 | 1,549,216 |
| Netmarble Corp. | 6,035 | 514,482 |
| Nexen Tire Corp. * | 130,450 | 682,439 |
| NH Investment & Securities Co., Ltd. * | 117,167 | 1,125,528 |
| NHN Corp. * | 19,193 | 566,683 |
| NICE Holdings Co., Ltd. | 44,792 | 622,137 |
| NongShim Co., Ltd. | 6,380 | 1,629,026 |
| OCI Co., Ltd. | 28,453 | 2,484,771 |
| Orion Corp. | 18,258 | 1,389,451 |
| Ottogi Corp. | 1,974 | 710,893 |
| Pan Ocean Co., Ltd. | 215,904 | 1,179,764 |
| Partron Co., Ltd. | 96,014 | 918,336 |
| Poongsan Corp. | 68,702 | 1,817,045 |
| S-1 Corp. | 25,992 | 1,508,913 |
| Samsung Card Co., Ltd. | 58,933 | 1,575,827 |
| Samsung Engineering Co., Ltd. * | 113,169 | 2,183,658 |
| Samsung Heavy Industries Co., Ltd. * | 686,516 | 3,323,095 |
| Samsung Securities Co., Ltd. | 44,616 | 1,569,640 |
| SAMT Co., Ltd. | 200,850 | 686,567 |
| Samyang Corp. | 12,315 | 528,510 |
| Samyang Holdings Corp. | 16,507 | 1,140,876 |
| Seah Besteel Corp. | 54,466 | 799,538 |
| Sebang Global Battery Co., Ltd. | 11,844 | 626,505 |
| Seohan Co., Ltd. * | 447,279 | 567,306 |
| Seoul Semiconductor Co., Ltd. * | 58,892 | 651,444 |
| Seoyon Co., Ltd. * | 59,633 | 580,285 |
| Seoyon E-Hwa Co., Ltd. * | 103,445 | 593,646 |
| SFA Engineering Corp. | 27,241 | 851,883 |
| Shinsegae, Inc. | 13,392 | 2,912,636 |
| SK Chemicals Co., Ltd. | 5,923 | 615,773 |
| SK Discovery Co., Ltd. | 24,188 | 815,755 |
| SK Gas Ltd. | 13,355 | 1,321,782 |
| SK Networks Co., Ltd. | 813,627 | 2,984,235 |
| SKC Co., Ltd. | 10,697 | 1,223,302 |
| SL Corp. * | 25,309 | 498,876 |
| SNT Motiv Co., Ltd. | 14,760 | 529,094 |
| SSANGYONG C&E Co., Ltd. | 95,999 | 605,208 |
| SECURITY | NUMBER
OF SHARES | VALUE ($) |
| Sungwoo Hitech Co., Ltd. | 279,280 | 1,118,421 |
| Taekwang Industrial Co., Ltd. * | 2,641 | 2,229,480 |
| Tongyang, Inc. * | 494,335 | 575,597 |
| Unid Co., Ltd. | 7,873 | 566,403 |
| WONIK IPS Co., Ltd. | 19,183 | 571,972 |
| Young Poong Corp. * | 1,700 | 927,517 |
| Youngone Corp. * | 50,653 | 1,790,454 |
| Yuhan Corp. | 26,288 | 1,270,290 |
| | | 198,036,559 |
| |
| Singapore 1.6% |
| Ascendas Real Estate Investment Trust | 1,121,667 | 2,288,863 |
| Ascott Residence Trust | 1,309,070 | 993,290 |
| CapitaLand Integrated Commercial Trust | 1,451,730 | 2,256,547 |
| City Developments Ltd. | 580,631 | 3,045,484 |
| First Resources Ltd. | 572,035 | 775,384 |
| Genting Singapore Ltd. | 5,689,696 | 3,227,423 |
| Golden Agri-Resources Ltd. | 23,555,685 | 4,945,575 |
| Keppel Infrastructure Trust | 3,286,340 | 1,307,322 |
| Mapletree Commercial Trust | 670,331 | 893,808 |
| Mapletree Industrial Trust | 475,617 | 896,961 |
| Mapletree Logistics Trust | 704,018 | 907,607 |
| Mapletree North Asia Commercial Trust | 1,202,307 | 956,567 |
| NetLink NBN Trust | 1,210,585 | 851,677 |
| SATS Ltd. * | 588,107 | 1,719,978 |
| Sembcorp Industries Ltd. | 1,313,887 | 2,429,450 |
| Sembcorp Marine Ltd. * | 13,092,217 | 800,511 |
| Singapore Exchange Ltd. | 320,119 | 2,202,594 |
| Singapore Press Holdings Ltd. | 2,429,627 | 4,170,342 |
| Singapore Technologies Engineering Ltd. | 1,188,716 | 3,345,166 |
| StarHub Ltd. | 1,348,413 | 1,241,678 |
| Suntec Real Estate Investment Trust | 897,342 | 1,070,901 |
| UOL Group Ltd. | 362,742 | 1,865,217 |
| | | 42,192,345 |
| |
| Spain 1.4% |
| Abengoa S.A., B Shares *(b) | 192,522,094 | 0 |
| Acerinox S.A. | 291,443 | 3,733,414 |
| Almirall S.A. | 45,089 | 594,560 |
| Applus Services S.A. | 220,459 | 2,016,862 |
| Atresmedia Corp de Medios de Comunicaion S.A. | 161,269 | 701,002 |
| Cellnex Telecom S.A. | 27,478 | 1,254,285 |
| Cia de Distribucion Integral Logista Holdings S.A. | 71,371 | 1,299,458 |
| Cie Automotive S.A. | 47,524 | 1,277,893 |
| Construcciones y Auxiliar de Ferrocarriles S.A. | 20,766 | 730,053 |
| Ebro Foods S.A. | 116,450 | 2,163,377 |
| Ence Energia y Celulosa S.A. * | 254,908 | 815,991 |
| Faes Farma S.A. | 221,378 | 848,896 |
| Gestamp Automocion S.A. | 419,830 | 1,740,975 |
| Grupo Catalana Occidente S.A. | 49,223 | 1,597,803 |
| Indra Sistemas S.A. * | 105,022 | 1,212,637 |
| Inmobiliaria Colonial Socimi S.A. | 99,257 | 841,716 |
| Mediaset Espana Comunicacion S.A. * | 364,068 | 1,874,495 |
| Melia Hotels International S.A. * | 175,880 | 1,332,267 |
| Merlin Properties Socimi S.A. | 162,961 | 1,834,040 |
| Obrascon Huarte Lain S.A. * | 1,322,796 | 1,331,246 |
| Prosegur Cash S.A. | 828,340 | 630,806 |
| Prosegur Cia de Seguridad S.A. | 653,830 | 1,574,515 |
| Sacyr S.A. | 641,403 | 1,508,568 |
| Siemens Gamesa Renewable Energy S.A. * | 89,358 | 2,080,607 |
| Tecnicas Reunidas S.A. *(a) | 79,154 | 651,235 |
| Unicaja Banco S.A. | 2,272,466 | 2,140,217 |
Schwab Fundamental Index ETFs | Annual Report
Schwab Fundamental International Small Company Index ETF
Portfolio Holdings as of February 28, 2022 (continued)
| SECURITY | NUMBER
OF SHARES | VALUE ($) |
| Viscofan S.A. | 30,406 | 1,888,607 |
| Zardoya Otis S.A. | 151,531 | 1,196,504 |
| | | 38,872,029 |
| |
| Sweden 2.9% |
| AAK AB | 105,143 | 1,926,690 |
| AddTech AB, B Shares | 46,533 | 774,054 |
| AFRY AB | 59,598 | 1,145,460 |
| Arjo AB, B Shares | 104,956 | 908,532 |
| Attendo AB * | 180,014 | 616,055 |
| Axfood AB | 95,206 | 2,509,721 |
| Beijer Ref AB | 51,443 | 783,238 |
| Betsson AB, B Shares * | 169,146 | 1,011,664 |
| Bilia AB, A Shares | 100,293 | 1,315,534 |
| BillerudKorsnas AB | 180,307 | 2,551,334 |
| Bonava AB, B Shares | 138,891 | 998,469 |
| Bravida Holding AB | 130,346 | 1,597,872 |
| Castellum AB | 128,965 | 2,891,335 |
| Clas Ohlson AB, B Shares | 70,660 | 797,323 |
| Cloetta AB, B Shares | 293,148 | 740,464 |
| Concentric AB | 27,836 | 632,623 |
| Coor Service Management Holding AB | 107,417 | 830,251 |
| Dometic Group AB | 182,500 | 1,779,714 |
| Dustin Group AB | 59,797 | 516,988 |
| Electrolux Professional AB, B Shares * | 119,810 | 698,813 |
| Elekta AB, B Shares (a) | 146,003 | 1,273,129 |
| Evolution AB | 4,513 | 526,362 |
| Fabege AB | 70,387 | 1,058,989 |
| Fastighets AB Balder, B Shares * | 14,087 | 885,382 |
| Fingerprint Cards AB, B Shares * | 241,055 | 426,396 |
| Getinge AB, B Shares | 90,012 | 3,534,408 |
| Granges AB | 118,489 | 1,279,272 |
| Hexpol AB | 191,655 | 1,990,018 |
| Holmen AB, B Shares | 62,530 | 3,097,945 |
| Indutrade AB | 70,421 | 1,578,060 |
| International Petroleum Corp. * | 192,931 | 1,367,537 |
| Intrum AB | 53,114 | 1,370,310 |
| Inwido AB | 46,852 | 730,713 |
| JM AB | 69,315 | 2,167,241 |
| Kinnevik AB, B Shares * | 74,245 | 1,912,331 |
| L E Lundbergfortagen AB, B Shares | 37,103 | 1,811,475 |
| Lifco AB, B Shares | 42,002 | 964,806 |
| Lindab International AB | 45,535 | 1,099,996 |
| Loomis AB | 109,684 | 3,104,045 |
| Mekonomen AB * | 43,920 | 545,847 |
| Modern Times Group MTG AB, B Shares * | 49,505 | 642,534 |
| Mycronic AB | 25,634 | 493,766 |
| NCC AB, B Shares | 116,537 | 1,645,905 |
| Nibe Industrier AB, B Shares | 180,195 | 1,621,301 |
| Nobia AB | 215,336 | 953,682 |
| Nolato AB, B Shares | 71,319 | 678,567 |
| Nordic Entertainment Group AB, B Shares * | 16,647 | 571,115 |
| Pandox AB * | 59,214 | 871,440 |
| Peab AB, B Shares | 248,901 | 2,428,830 |
| Ratos AB, B Shares | 310,138 | 1,665,995 |
| Resurs Holding AB | 175,598 | 509,406 |
| Saab AB, B Shares | 99,728 | 3,023,053 |
| SAS AB *(a) | 7,491,015 | 759,086 |
| Scandic Hotels Group AB *(a) | 311,509 | 1,395,127 |
| Solid Forsakring AB * | 16,196 | 83,123 |
| Sweco AB, B Shares | 83,415 | 1,177,224 |
| Swedish Orphan Biovitrum AB * | 56,958 | 1,173,474 |
| Tethys Oil AB | 97,753 | 701,180 |
| Thule Group AB | 31,093 | 1,236,710 |
| Wallenstam AB, B Shares | 39,387 | 581,737 |
| SECURITY | NUMBER
OF SHARES | VALUE ($) |
| Wihlborgs Fastigheter AB | 44,515 | 885,753 |
| | | 78,849,404 |
| |
| Switzerland 3.2% |
| Allreal Holding AG | 9,443 | 2,048,239 |
| ALSO Holding AG * | 3,676 | 989,669 |
| ams-OSRAM AG * | 101,718 | 1,589,881 |
| Arbonia AG | 52,634 | 1,167,477 |
| Aryzta AG * | 2,202,587 | 2,511,206 |
| Autoneum Holding AG * | 6,708 | 1,117,939 |
| Banque Cantonale Vaudoise | 14,874 | 1,272,668 |
| Belimo Holding AG | 2,892 | 1,538,281 |
| BKW AG | 13,220 | 1,668,621 |
| Bobst Group S.A. * | 9,309 | 848,256 |
| Bucher Industries AG | 5,287 | 2,350,034 |
| Burckhardt Compression Holding AG | 1,887 | 929,668 |
| Bystronic AG | 1,181 | 1,377,372 |
| Cembra Money Bank AG | 21,287 | 1,471,029 |
| Daetwyler Holding AG | 2,845 | 981,462 |
| dormakaba Holding AG | 2,306 | 1,276,852 |
| Emmi AG | 1,566 | 1,828,095 |
| EMS-Chemie Holding AG | 2,598 | 2,572,656 |
| Flughafen Zuerich AG * | 14,276 | 2,567,486 |
| Forbo Holding AG | 782 | 1,343,323 |
| Galenica AG | 52,139 | 3,682,606 |
| GAM Holding AG * | 902,828 | 1,129,704 |
| Helvetia Holding AG | 33,547 | 4,088,021 |
| Huber & Suhner AG | 16,895 | 1,629,743 |
| Implenia AG * | 54,414 | 1,367,690 |
| Inficon Holding AG | 680 | 801,962 |
| Interroll Holding AG | 156 | 579,824 |
| Komax Holding AG * | 2,682 | 708,613 |
| Landis & Gyr Group AG * | 31,805 | 2,078,271 |
| Logitech International S.A. | 38,697 | 2,906,124 |
| Medmix AG * | 19,544 | 723,434 |
| Mobimo Holding AG * | 3,278 | 1,100,468 |
| OC Oerlikon Corp. AG | 198,207 | 1,771,538 |
| PSP Swiss Property AG | 12,564 | 1,626,904 |
| Rieter Holding AG * | 4,906 | 873,770 |
| Schweiter Technologies AG | 861 | 1,114,903 |
| SFS Group AG | 12,348 | 1,811,587 |
| Siegfried Holding AG * | 1,244 | 939,661 |
| SIG Combibloc Group AG * | 148,983 | 3,358,187 |
| Softwareone Holding AG * | 49,830 | 903,778 |
| St. Galler Kantonalbank AG | 1,513 | 742,111 |
| Stadler Rail AG (a) | 28,224 | 1,089,029 |
| Straumann Holding AG | 1,201 | 1,910,578 |
| Sulzer AG | 17,549 | 1,483,378 |
| Tecan Group AG | 2,298 | 996,397 |
| Temenos AG | 10,189 | 1,028,617 |
| u-blox Holding AG * | 10,528 | 746,467 |
| Valiant Holding AG | 12,187 | 1,268,580 |
| Valora Holding AG * | 7,827 | 1,550,982 |
| VAT Group AG | 4,676 | 1,775,703 |
| Vetropack Holding AG | 14,624 | 745,984 |
| Vifor Pharma AG | 28,976 | 5,089,631 |
| Vontobel Holding AG | 14,985 | 1,187,432 |
| Zehnder Group AG | 8,248 | 712,918 |
| Zur Rose Group AG * | 1,550 | 271,328 |
| | | 85,246,137 |
| |
| United Kingdom 9.9% |
| 4imprint Group plc | 19,331 | 702,903 |
| 888 Holdings plc | 146,312 | 475,473 |
| AG Barr plc | 91,761 | 636,532 |
| Airtel Africa plc | 1,572,632 | 2,998,424 |
Schwab Fundamental Index ETFs | Annual Report
Schwab Fundamental International Small Company Index ETF
Portfolio Holdings as of February 28, 2022 (continued)
| SECURITY | NUMBER
OF SHARES | VALUE ($) |
| Ascential plc * | 168,600 | 741,546 |
| Ashmore Group plc | 254,621 | 860,927 |
| Auto Trader Group plc | 165,388 | 1,471,260 |
| Avast plc | 134,450 | 1,133,984 |
| AVEVA Group plc | 15,774 | 527,003 |
| B&M European Value Retail S.A. | 475,748 | 3,864,481 |
| Babcock International Group plc * | 911,749 | 4,049,255 |
| Bank of Georgia Group plc | 45,369 | 802,318 |
| Beazley plc | 534,653 | 3,232,474 |
| Biffa plc | 250,084 | 1,090,539 |
| Big Yellow Group plc | 40,790 | 774,430 |
| Bodycote plc | 210,998 | 2,110,560 |
| Brewin Dolphin Holdings plc | 229,658 | 910,565 |
| Britvic plc | 208,305 | 2,378,488 |
| C&C Group plc * | 392,430 | 1,109,953 |
| Capita plc * | 3,452,472 | 1,297,060 |
| Card Factory plc * | 2,137,352 | 1,415,256 |
| Centamin plc | 1,816,044 | 2,417,185 |
| Chemring Group plc | 203,654 | 845,718 |
| Cineworld Group plc *(a) | 3,802,044 | 2,046,169 |
| Clarkson plc | 16,409 | 728,756 |
| Close Brothers Group plc | 145,148 | 2,280,551 |
| Coats Group plc | 1,534,932 | 1,262,471 |
| Computacenter plc | 55,528 | 2,032,489 |
| ConvaTec Group plc | 889,158 | 2,150,433 |
| Costain Group plc * | 1,477,002 | 868,014 |
| Countryside Properties plc * | 320,088 | 1,306,473 |
| Cranswick plc | 54,200 | 2,556,936 |
| Crest Nicholson Holdings plc | 526,789 | 2,181,245 |
| De La Rue plc * | 314,430 | 481,795 |
| Dechra Pharmaceuticals plc | 13,222 | 730,559 |
| Derwent London plc | 29,777 | 1,216,179 |
| Diploma plc | 31,777 | 1,140,108 |
| Domino's Pizza Group plc | 182,936 | 895,909 |
| Dunelm Group plc | 61,235 | 985,124 |
| Electrocomponents plc | 193,853 | 2,573,713 |
| Elementis plc * | 770,418 | 1,333,484 |
| Endeavour Mining plc | 42,499 | 1,134,759 |
| Entain plc * | 152,093 | 3,436,553 |
| Essentra plc | 472,018 | 1,934,824 |
| Euromoney Institutional Investor plc | 95,920 | 1,167,315 |
| Ferrexpo plc | 366,682 | 831,473 |
| Flutter Entertainment plc * | 22,052 | 3,194,055 |
| Forterra plc | 229,547 | 737,648 |
| Frasers Group plc * | 211,016 | 1,802,128 |
| Fresnillo plc | 132,913 | 1,281,523 |
| Games Workshop Group plc | 7,208 | 722,932 |
| Genuit Group plc | 122,516 | 840,012 |
| Genus plc | 13,267 | 583,873 |
| Grafton Group plc | 243,001 | 3,534,347 |
| Grainger plc | 270,053 | 1,021,085 |
| Great Portland Estates plc | 127,728 | 1,166,235 |
| Greencore Group plc * | 837,848 | 1,501,909 |
| Greggs plc | 61,688 | 2,131,325 |
| Halfords Group plc | 408,599 | 1,524,101 |
| Halma plc | 86,700 | 2,804,711 |
| Hammerson plc (a) | 1,832,953 | 910,211 |
| Harbour Energy plc * | 494,291 | 2,640,923 |
| Hargreaves Lansdown plc | 103,512 | 1,575,676 |
| Hikma Pharmaceuticals plc | 91,978 | 2,570,662 |
| Hill & Smith Holdings plc | 54,902 | 1,038,674 |
| Hilton Food Group plc | 59,013 | 850,401 |
| Hiscox Ltd. | 236,980 | 2,931,029 |
| Hochschild Mining plc | 339,493 | 528,853 |
| HomeServe plc | 147,497 | 1,332,885 |
| Howden Joinery Group plc | 346,550 | 3,967,241 |
| Hunting plc | 351,879 | 1,104,793 |
| Ibstock plc | 526,527 | 1,261,045 |
| SECURITY | NUMBER
OF SHARES | VALUE ($) |
| IG Group Holdings plc | 314,620 | 3,299,036 |
| IMI plc | 177,460 | 3,483,506 |
| Indivior plc * | 636,050 | 2,396,405 |
| Intermediate Capital Group plc | 84,687 | 1,947,598 |
| Intu Properties plc *(a)(b) | 11,806,310 | 0 |
| Investec plc | 273,669 | 1,499,259 |
| IWG plc * | 699,941 | 2,630,549 |
| J.D. Sports Fashion plc | 842,409 | 1,706,757 |
| J.D. Wetherspoon plc * | 93,277 | 1,096,353 |
| John Menzies plc * | 194,148 | 1,466,605 |
| Jupiter Fund Management plc | 584,146 | 1,645,934 |
| Just Group plc * | 1,826,515 | 2,059,836 |
| Kier Group plc * | 1,780,644 | 2,221,937 |
| Lancashire Holdings Ltd. | 185,452 | 1,173,981 |
| Man Group plc | 1,540,426 | 3,989,054 |
| Marshalls plc | 108,050 | 926,398 |
| Marston's plc * | 1,709,694 | 1,788,160 |
| Mediclinic International plc * | 549,084 | 2,423,854 |
| Mitchells & Butlers plc * | 520,824 | 1,661,784 |
| Moneysupermarket.com Group plc | 499,004 | 1,399,336 |
| Morgan Advanced Materials plc | 349,572 | 1,425,877 |
| Morgan Sindall Group plc | 64,695 | 2,013,866 |
| National Express Group plc * | 982,815 | 3,149,038 |
| NewRiver REIT plc | 637,499 | 758,708 |
| Ocado Group plc * | 40,038 | 737,589 |
| OSB Group plc | 192,784 | 1,294,634 |
| Oxford Instruments plc | 22,769 | 814,166 |
| Pagegroup plc | 357,585 | 2,753,994 |
| Paragon Banking Group plc | 202,913 | 1,376,267 |
| PayPoint plc | 93,500 | 748,958 |
| Petrofac Ltd. * | 1,607,154 | 2,300,879 |
| Petropavlovsk plc * | 2,938,613 | 315,431 |
| Pets at Home Group plc | 356,562 | 1,745,266 |
| Phoenix Group Holdings plc | 295,042 | 2,448,869 |
| Playtech plc * | 427,651 | 3,827,252 |
| Plus500 Ltd. | 117,750 | 2,204,766 |
| Premier Foods plc | 853,777 | 1,257,820 |
| Provident Financial plc * | 670,237 | 2,607,944 |
| PZ Cussons plc | 202,954 | 573,220 |
| QinetiQ Group plc | 553,628 | 2,172,037 |
| Quilter plc | 404,595 | 704,097 |
| Rathbone Brothers plc | 32,127 | 713,842 |
| Reach plc | 287,145 | 876,505 |
| Redde Northgate plc | 471,527 | 2,394,662 |
| Redrow plc | 350,865 | 2,717,304 |
| Renishaw plc | 13,853 | 873,230 |
| Rhi Magnesita N.V. | 28,273 | 1,055,360 |
| Rightmove plc | 137,181 | 1,238,006 |
| Rotork plc | 479,185 | 1,984,134 |
| Sabre Insurance Group plc | 270,879 | 755,980 |
| Safestore Holdings plc | 55,162 | 942,194 |
| Saga plc * | 422,457 | 1,592,798 |
| Savills plc | 117,957 | 2,014,763 |
| Schroders plc | 64,386 | 2,646,988 |
| Segro plc | 152,563 | 2,664,190 |
| Senior plc * | 1,196,871 | 2,253,081 |
| Serco Group plc | 1,127,067 | 2,011,283 |
| SIG plc * | 1,878,818 | 984,666 |
| Softcat plc | 30,923 | 646,429 |
| Spectris plc | 83,154 | 3,130,708 |
| Spirax-Sarco Engineering plc | 16,228 | 2,600,896 |
| Spirent Communications plc | 268,672 | 875,993 |
| SSP Group plc * | 871,930 | 3,265,226 |
| St. James's Place plc | 198,309 | 3,734,450 |
| Stagecoach Group plc * | 1,217,014 | 1,404,319 |
| SThree plc | 197,851 | 1,168,053 |
| Superdry plc * | 184,367 | 485,349 |
| Synthomer plc | 269,258 | 1,036,143 |
Schwab Fundamental Index ETFs | Annual Report
Schwab Fundamental International Small Company Index ETF
Portfolio Holdings as of February 28, 2022 (continued)
| SECURITY | NUMBER
OF SHARES | VALUE ($) |
| TBC Bank Group plc | 42,721 | 688,998 |
| Ted Baker plc * | 347,548 | 482,178 |
| Telecom Plus plc | 74,924 | 1,457,675 |
| The British Land Co., plc | 564,688 | 4,012,623 |
| The Go-Ahead Group plc * | 206,328 | 1,840,991 |
| The Restaurant Group plc * | 793,321 | 1,043,150 |
| The Unite Group plc | 55,302 | 792,472 |
| The Weir Group plc | 142,085 | 3,016,920 |
| TP ICAP Group plc | 736,326 | 1,184,571 |
| Tritax Big Box REIT plc | 252,902 | 798,786 |
| Tullow Oil plc * | 1,466,370 | 1,057,336 |
| Tyman plc | 208,064 | 960,345 |
| Ultra Electronics Holdings plc | 50,630 | 2,180,644 |
| Vesuvius plc | 348,879 | 1,853,710 |
| Victrex plc | 56,065 | 1,465,388 |
| Virgin Money UK plc | 293,329 | 732,835 |
| Vistry Group plc | 205,043 | 2,756,668 |
| WH Smith plc * | 114,554 | 2,498,441 |
| Wizz Air Holdings plc * | 18,244 | 833,262 |
| Workspace Group plc | 64,856 | 673,104 |
| | | 265,123,612 |
Total Common Stocks
(Cost $2,408,386,347) | 2,661,940,592 |
|
| PREFERRED STOCKS 0.3% OF NET ASSETS |
| |
| Germany 0.2% |
| Draegerwerk AG & Co. KGaA | 21,946 | 1,255,905 |
| Jungheinrich AG | 44,491 | 1,628,098 |
| Sartorius AG | 2,281 | 1,009,949 |
| Schaeffler AG | 239,209 | 1,614,765 |
| Sixt SE | 16,095 | 1,314,264 |
| | | 6,822,981 |
| |
| Italy 0.1% |
| Danieli & C Officine Meccaniche S.p.A. - RSP | 102,919 | 1,629,941 |
| |
| Republic of Korea 0.0% |
| Mirae Asset Securities Co., Ltd. | 44,574 | 165,899 |
Total Preferred Stocks
(Cost $8,539,825) | 8,618,821 |
|
| RIGHTS 0.0% OF NET ASSETS |
| |
| Italy 0.0% |
| Banca Popolare di Sondrio Scarl |
| expires 03/07/22, strike EUR 3.75 *(b) | 637,506 | 4 |
Total Rights
(Cost $0) | 4 |
| SECURITY | NUMBER
OF SHARES | VALUE ($) |
| WARRANTS 0.0% OF NET ASSETS |
| |
| Italy 0.0% |
| Webuild S.p.A. |
| expires 08/02/30 *(a)(b) | 37,091 | 70,240 |
Total Warrants
(Cost $0) | 70,240 |
| | | |
| SHORT-TERM INVESTMENTS 2.0% OF NET ASSETS |
| |
| Money Market Funds 2.0% |
| State Street Institutional U.S. Government Money Market Fund, Premier Class 0.03% (c) | 4,427,619 | 4,427,619 |
| State Street Institutional U.S. Government Money Market Fund, Premier Class 0.03% (c)(d) | 47,323,459 | 47,323,459 |
| | | 51,751,078 |
Total Short-Term Investments
(Cost $51,751,078) | 51,751,078 |
Total Investments in Securities
(Cost $2,468,677,250) | 2,722,380,735 |
| | NUMBER OF
CONTRACTS | NOTIONAL
AMOUNT
($) | CURRENT VALUE/
UNREALIZED
DEPRECIATION
($) |
| FUTURES CONTRACTS |
| Long | | | |
| MSCI EAFE Index, expires 03/18/22 | 177 | 19,114,230 | (824,453) |
| * | Non-income producing security. |
| (a) | All or a portion of this security is on loan. Securities on loan were valued at $44,426,343. |
| (b) | Fair valued by management using significant unobservable inputs in accordance with procedures approved by the fund’s Board of Trustees. |
| (c) | The rate shown is the 7-day yield. |
| (d) | Security purchased with cash collateral received for securities on loan. |
| CVA — | Dutch Certificate |
| REIT — | Real Estate Investment Trust |
| RSP — | Risparmio (Savings Shares) |
| EUR — | Euro |
Schwab Fundamental Index ETFs | Annual Report
Schwab Fundamental International Small Company Index ETF
Portfolio Holdings as of February 28, 2022 (continued)
The following is a summary of the inputs used to value the fund’s investments as of February 28, 2022 (see financial note 2(a) for additional information):
| DESCRIPTION | QUOTED PRICES IN
ACTIVE MARKETS FOR
IDENTICAL ASSETS
(LEVEL 1) | OTHER SIGNIFICANT
OBSERVABLE INPUTS
(LEVEL 2) | SIGNIFICANT
UNOBSERVABLE INPUTS
(LEVEL 3) | TOTAL |
| Assets | | | | |
| Common Stocks1 | $1,361,710,909 | $— | $— | $1,361,710,909 |
| Hong Kong | 98,910,802 | — | 0* | 98,910,802 |
| Japan | 885,135,933 | — | 1,512,022 | 886,647,955 |
| Luxembourg | — | — | 0* | 0 |
| Portugal | 10,675,285 | — | 0* | 10,675,285 |
| Spain | 38,872,029 | — | 0* | 38,872,029 |
| United Kingdom | 265,123,612 | — | 0* | 265,123,612 |
| Preferred Stocks1 | 8,618,821 | — | — | 8,618,821 |
| Rights 1 | | | | |
| Italy | — | — | 4 | 4 |
| Warrants 1 | | | | |
| Italy | — | — | 70,240 | 70,240 |
| Short-Term Investments1 | 51,751,078 | — | — | 51,751,078 |
| Liabilities | | | | |
| Futures Contracts2 | (824,453) | — | — | (824,453) |
| Total | $2,719,974,016 | $— | $1,582,266 | $2,721,556,282 |
| * | Level 3 amount shown includes securities determined to have no value at February 28, 2022. |
| 1 | As categorized in the Portfolio Holdings. |
| 2 | Futures contracts are reported at cumulative unrealized appreciation or depreciation. |
Fund investments in mutual funds are classified as Level 1, without consideration to the classification level of the underlying securities held by the mutual funds, which could be Level 1, Level 2 or Level 3.
Schwab Fundamental Index ETFs | Annual Report
Schwab Fundamental International Small Company Index ETF
Statement of Assets and Liabilities
As of February 28, 2022
| Assets |
| Investments in securities, at value - unaffiliated (cost $2,468,677,250) including securities on loan of $44,426,343 | | $2,722,380,735 |
| Foreign currency, at value (cost $709,432) | | 707,545 |
| Deposit with broker for futures contracts | | 833,775 |
| Receivables: | | |
| Dividends | | 6,241,852 |
| Investments sold | | 2,794,108 |
| Foreign tax reclaims | | 1,323,134 |
| Income from securities on loan | + | 149,764 |
| Total assets | | 2,734,430,913 |
| Liabilities |
| Collateral held for securities on loan | | 47,323,459 |
| Payables: | | |
| Management fees | | 803,814 |
| Variation margin on futures contracts | + | 349,951 |
| Total liabilities | | 48,477,224 |
| Net assets | | $2,685,953,689 |
| Net Assets by Source |
| Capital received from investors | | $2,617,476,452 |
| Total distributable earnings | + | 68,477,237 |
| Net assets | | $2,685,953,689 |
| Net Asset Value (NAV) |
| Net Assets | ÷ | Shares
Outstanding | = | NAV |
| $2,685,953,689 | | 74,900,000 | | $35.86 |
| | | | | |
| | | | | |
Schwab Fundamental Index ETFs | Annual Report
Schwab Fundamental International Small Company Index ETF
Statement of Operations
| For the period March 1, 2021 through February 28, 2022 |
| Investment Income |
| Dividends received from securities - unaffiliated (net of foreign withholding tax of $7,234,632) | | $59,231,171 |
| Securities on loan, net | + | 2,038,612 |
| Total investment income | | 61,269,783 |
| Expenses |
| Management fees | | 10,413,381 |
| Professional fees | + | 4,588* |
| Total expenses | | 10,417,969 |
| Expense reduction by investment adviser | – | 4,588* |
| Net expenses | – | 10,413,381 |
| Net investment income | | 50,856,402 |
| REALIZED AND UNREALIZED GAINS (LOSSES) |
| Net realized gains on sales of securities - unaffiliated | | 5,277,972 |
| Net realized gains on sales of in-kind redemptions - unaffiliated | | 55,418,944 |
| Net realized gains on futures contracts | | 490,813 |
| Net realized losses on foreign currency transactions | + | (279,973) |
| Net realized gains | | 60,907,756 |
| Net change in unrealized appreciation (depreciation) on securities - unaffiliated | | (88,560,194) |
| Net change in unrealized appreciation (depreciation) on futures contracts | | (622,338) |
| Net change in unrealized appreciation (depreciation) on foreign currency translations | + | (33,075) |
| Net change in unrealized appreciation (depreciation) | + | (89,215,607) |
| Net realized and unrealized losses | | (28,307,851) |
| Increase in net assets resulting from operations | | $22,548,551 |
| * | Professional fees associated with the filing of tax claims in the European Union deemed to be non-routine expenses of the fund. See financial notes 2 (d) and 4 for additional information. |
Schwab Fundamental Index ETFs | Annual Report
Schwab Fundamental International Small Company Index ETF
Statement of Changes in Net Assets
For the current and prior report periods
| OPERATIONS |
| | 3/1/21-2/28/22 | 3/1/20-2/28/21 |
| Net investment income | | $50,856,402 | $33,663,568 |
| Net realized gains (losses) | | 60,907,756 | (13,565,450) |
| Net change in unrealized appreciation (depreciation) | + | (89,215,607) | 487,117,080 |
| Increase in net assets resulting from operations | | $22,548,551 | $507,215,198 |
| DISTRIBUTIONS TO SHAREHOLDERS |
| Total distributions | | ($68,417,380) | ($38,178,680) |
| TRANSACTIONS IN FUND SHARES |
| | 3/1/21-2/28/22 | 3/1/20-2/28/21 |
| | | SHARES | VALUE | SHARES | VALUE |
| Shares sold | | 13,600,000 | $522,848,782 | 5,400,000 | $162,294,485 |
| Shares redeemed | + | (2,200,000) | (83,941,621) | (8,500,000) | (238,718,494) |
| Net transactions in fund shares | | 11,400,000 | $438,907,161 | (3,100,000) | ($76,424,009) |
| SHARES OUTSTANDING AND NET ASSETS |
| | 3/1/21-2/28/22 | 3/1/20-2/28/21 |
| | | SHARES | NET ASSETS | SHARES | NET ASSETS |
| Beginning of period | | 63,500,000 | $2,292,915,357 | 66,600,000 | $1,900,302,848 |
| Total increase (decrease) | + | 11,400,000 | 393,038,332 | (3,100,000) | 392,612,509 |
| End of period | | 74,900,000 | $2,685,953,689 | 63,500,000 | $2,292,915,357 |
Schwab Fundamental Index ETFs | Annual Report
Schwab Fundamental Emerging Markets Large Company Index ETF
Financial Statements
FINANCIAL HIGHLIGHTS
| | 3/1/21–
2/28/22 | 3/1/20–
2/28/21 | 3/1/19–
2/29/20 | 3/1/18–
2/28/19 | 3/1/17–
2/28/18 | |
| Per-Share Data |
| Net asset value at beginning of period | $29.64 | $25.54 | $28.08 | $31.22 | $26.06 | |
| Income (loss) from investment operations: | | | | | | |
| Net investment income (loss)1 | 1.36 | 0.79 | 1.02 | 0.85 | 0.71 | |
| Net realized and unrealized gains (losses) | (0.41) | 4.02 | (2.53) | (3.20) | 5.06 | |
| Total from investment operations | 0.95 | 4.81 | (1.51) | (2.35) | 5.77 | |
| Less distributions: | | | | | | |
| Distributions from net investment income | (1.34) | (0.71) | (1.03) | (0.79) | (0.61) | |
| Net asset value at end of period | $29.25 | $29.64 | $25.54 | $28.08 | $31.22 | |
| Total return | 2.97% | 19.12% | (5.74%) | (7.36%) | 22.32% | |
| Ratios/Supplemental Data |
| Ratios to average net assets: | | | | | | |
| Total expenses | 0.39% | 0.39% | 0.39% | 0.39% | 0.39% | |
| Net investment income (loss) | 4.29% | 3.11% | 3.61% | 2.99% | 2.48% | |
| Portfolio turnover rate2 | 20% | 25% | 32% | 33% | 14% | |
| Net assets, end of period (x 1,000) | $4,825,566 | $3,805,524 | $2,574,297 | $2,341,576 | $2,200,763 | |
| 1 | Calculated based on the average shares outstanding during the period. |
| 2 | Portfolio turnover rate excludes securities received or delivered from processing of in-kind creations or redemptions. |
Schwab Fundamental Index ETFs | Annual Report
Schwab Fundamental Emerging Markets Large Company Index ETF
Portfolio Holdings as of February 28, 2022
This section shows all the securities in the fund’s portfolio and their values as of the report date.
The fund files its complete schedule of portfolio holdings with the U.S. Securities and Exchange Commission (SEC) for the first and third quarters of each fiscal year on Form N-PORT Part F. The fund’s Form N-PORT Part F is available on the SEC’s website at www.sec.gov. You can also obtain this information at no cost on the fund’s website at www.schwabassetmanagement.com/schwabetfs_prospectus, by calling 1-866-414-6349, or by sending an email request to orders@mysummaryprospectus.com.The fund also makes available its complete schedule of portfolio holdings on a daily basis on the fund’s website.
| SECURITY | NUMBER
OF SHARES | VALUE ($) |
| COMMON STOCKS 94.4% OF NET ASSETS |
| |
| Brazil 7.0% |
| Ambev S.A. | 6,027,825 | 17,784,991 |
| B3 S.A. - Brasil Bolsa Balcao | 2,612,847 | 7,394,706 |
| Banco Bradesco S.A. | 3,175,885 | 10,517,033 |
| Banco do Brasil S.A. | 4,257,244 | 29,096,718 |
| BRF S.A. * | 1,746,461 | 5,664,802 |
| CCR S.A. | 2,763,159 | 6,307,578 |
| Centrais Eletricas Brasileiras S.A. | 828,719 | 5,593,214 |
| Cia Brasileira de Distribuicao | 491,995 | 2,225,185 |
| Cia de Saneamento Basico do Estado de Sao Paulo | 992,589 | 7,978,553 |
| Cia Energetica de Minas Gerais | 578,261 | 1,911,560 |
| Cielo S.A. | 9,784,112 | 4,880,946 |
| Cogna Educacao * | 9,927,819 | 4,355,236 |
| Embraer S.A. * | 1,739,645 | 5,943,233 |
| IRB Brasil Resseguros S.A. * | 6,888,950 | 4,091,889 |
| Itau Unibanco Holding S.A. | 1,265,482 | 5,362,399 |
| JBS S.A. | 3,007,653 | 20,953,213 |
| Petroleo Brasileiro S.A. | 11,654,912 | 82,281,412 |
| Sendas Distribuidora S.A. | 1,154,268 | 3,015,790 |
| Suzano S.A. | 505,741 | 5,406,207 |
| Telefonica Brasil S.A. | 880,383 | 8,573,639 |
| TIM S.A. | 2,396,517 | 6,331,230 |
| Ultrapar Participacoes S.A. | 5,179,175 | 14,888,985 |
| Vale S.A. | 3,558,467 | 63,741,160 |
| Vibra Energia S.A. | 3,225,017 | 14,767,582 |
| | | 339,067,261 |
| |
| Chile 0.8% |
| Banco de Chile | 59,381,619 | 6,334,139 |
| Cencosud S.A. | 5,301,863 | 9,805,912 |
| Empresas CMPC S.A. | 2,405,008 | 3,995,436 |
| Empresas COPEC S.A. | 1,185,484 | 9,247,610 |
| Enel Americas S.A. | 53,470,879 | 6,290,296 |
| Falabella S.A. | 1,494,209 | 4,944,350 |
| | | 40,617,743 |
| |
| China 28.2% |
| Agile Group Holdings Ltd. (a) | 5,991,717 | 2,729,886 |
| Agricultural Bank of China Ltd., A Shares | 22,749,400 | 10,743,774 |
| Agricultural Bank of China Ltd., H Shares | 72,180,068 | 27,343,384 |
| Alibaba Group Holding Ltd. * | 3,218,607 | 42,921,900 |
| Anhui Conch Cement Co., Ltd., A Shares | 416,200 | 2,658,140 |
| Anhui Conch Cement Co., Ltd., H Shares | 1,733,385 | 9,295,063 |
| BAIC Motor Corp., Ltd., H Shares | 21,685,790 | 7,548,965 |
| Baidu, Inc., ADR * | 142,064 | 21,656,236 |
| Bank of China Ltd., A Shares | 14,192,200 | 6,972,396 |
| Bank of China Ltd., H Shares | 191,867,627 | 74,648,065 |
| SECURITY | NUMBER
OF SHARES | VALUE ($) |
| Bank of Communications Co., Ltd., A Shares | 8,211,700 | 6,220,591 |
| Bank of Communications Co., Ltd., H Shares | 20,135,881 | 13,812,704 |
| Beijing Enterprises Holdings Ltd. | 1,552,545 | 5,295,228 |
| BYD Co., Ltd., A Shares | 27,300 | 1,079,886 |
| BYD Co., Ltd., H Shares | 166,182 | 5,049,030 |
| China Cinda Asset Management Co., Ltd., H Shares | 35,504,998 | 6,406,958 |
| China CITIC Bank Corp., Ltd., A Shares | 2,339,900 | 1,705,791 |
| China CITIC Bank Corp., Ltd., H Shares | 28,032,036 | 13,166,307 |
| China Communications Services Corp., Ltd., H Shares | 12,068,189 | 6,625,866 |
| China Construction Bank Corp., A Shares | 1,835,000 | 1,753,574 |
| China Construction Bank Corp., H Shares | 239,837,569 | 179,869,736 |
| China Everbright Bank Co., Ltd., A Shares | 7,816,800 | 4,137,577 |
| China Everbright Bank Co., Ltd., H Shares | 7,774,007 | 2,885,268 |
| China Evergrande Group | 25,451,511 | 5,211,669 |
| China Gas Holdings Ltd. | 2,120,875 | 3,354,879 |
| China Hongqiao Group Ltd. | 5,647,676 | 7,849,516 |
| China Jinmao Holdings Group Ltd. | 16,909,932 | 5,626,761 |
| China Life Insurance Co., Ltd., A Shares | 175,900 | 802,282 |
| China Life Insurance Co., Ltd., H Shares | 4,151,478 | 6,885,746 |
| China Longyuan Power Group Corp., Ltd., H Shares | 3,175,567 | 6,502,562 |
| China Mengniu Dairy Co., Ltd. * | 1,343,828 | 8,728,166 |
| China Merchants Bank Co., Ltd., A Shares | 1,180,600 | 9,317,572 |
| China Merchants Bank Co., Ltd., H Shares | 2,859,741 | 24,082,184 |
| China Minsheng Banking Corp., Ltd., A Shares | 9,677,000 | 5,996,366 |
| China Minsheng Banking Corp., Ltd., H Shares | 25,316,537 | 9,849,658 |
| China National Building Material Co., Ltd., H Shares | 13,347,016 | 17,115,720 |
| China Oriental Group Co., Ltd. | 21,840,618 | 6,345,035 |
| China Overseas Land & Investment Ltd. | 10,290,779 | 31,410,865 |
| China Pacific Insurance Group Co., Ltd., A Shares | 271,600 | 1,138,051 |
| China Pacific Insurance Group Co., Ltd., H Shares | 1,603,568 | 4,463,648 |
| China Petroleum & Chemical Corp., A Shares | 16,028,600 | 10,999,023 |
| China Petroleum & Chemical Corp., H Shares | 179,202,298 | 88,526,674 |
| China Railway Group Ltd., A Shares | 5,037,800 | 4,957,962 |
Schwab Fundamental Index ETFs | Annual Report
Schwab Fundamental Emerging Markets Large Company Index ETF
Portfolio Holdings as of February 28, 2022 (continued)
| SECURITY | NUMBER
OF SHARES | VALUE ($) |
| China Railway Group Ltd., H Shares | 12,739,954 | 7,483,828 |
| China Resources Land Ltd. | 4,425,742 | 21,523,503 |
| China Resources Power Holdings Co., Ltd. | 6,843,677 | 15,204,862 |
| China Shenhua Energy Co., Ltd., A Shares | 1,230,400 | 4,921,600 |
| China Shenhua Energy Co., Ltd., H Shares | 8,627,771 | 23,739,979 |
| China State Construction Engineering Corp., Ltd., A Shares | 10,318,600 | 8,323,562 |
| China Taiping Insurance Holdings Co., Ltd. | 3,485,778 | 4,117,605 |
| China Tower Corp., Ltd., H Shares | 62,739,332 | 7,306,755 |
| China Vanke Co., Ltd., A Shares | 1,261,400 | 3,838,174 |
| China Vanke Co., Ltd., H Shares | 3,584,799 | 8,496,676 |
| CITIC Ltd. | 22,112,256 | 25,780,700 |
| Country Garden Holdings Co., Ltd. | 17,422,573 | 13,512,266 |
| Dongfeng Motor Group Co., Ltd., H Shares | 7,930,294 | 6,810,125 |
| ENN Energy Holdings Ltd. | 415,534 | 6,030,633 |
| Fosun International Ltd. | 5,622,047 | 6,094,262 |
| Geely Automobile Holdings Ltd. | 3,810,553 | 7,032,286 |
| Guangzhou R&F Properties Co., Ltd., H Shares (a) | 13,224,207 | 5,618,896 |
| Hengan International Group Co., Ltd. | 1,089,347 | 5,778,752 |
| Huaneng Power International, Inc., A Shares | 2,123,400 | 2,951,223 |
| Huaneng Power International, Inc., H Shares | 18,443,494 | 10,787,049 |
| Industrial & Commercial Bank of China Ltd., A Shares | 11,720,000 | 8,655,341 |
| Industrial & Commercial Bank of China Ltd., H Shares | 175,112,892 | 104,659,407 |
| Industrial Bank Co., Ltd., A Shares | 2,452,200 | 8,576,871 |
| JD.com, Inc., A Shares * | 579,500 | 20,706,759 |
| Jiangxi Copper Co., Ltd., A Shares | 430,800 | 1,512,920 |
| Jiangxi Copper Co., Ltd., H Shares | 3,631,364 | 6,524,995 |
| Jinmao Property Services Co., Ltd. *(b) | 254,198 | 254,729 |
| Kingboard Holdings Ltd. | 1,741,274 | 8,122,840 |
| Kunlun Energy Co., Ltd. | 8,575,825 | 8,385,183 |
| Legend Holdings Corp., H Shares | 3,450,269 | 4,848,401 |
| Longfor Group Holdings Ltd. | 1,824,946 | 9,762,692 |
| Meituan, B Shares * | 162,558 | 3,582,488 |
| NetEase, Inc. | 651,866 | 12,722,470 |
| PetroChina Co., Ltd., H Shares | 83,395,115 | 44,506,140 |
| PICC Property & Casualty Co., Ltd., H Shares | 19,618,397 | 20,713,846 |
| Ping An Insurance Group Co. of China Ltd., A Shares | 863,100 | 6,943,099 |
| Ping An Insurance Group Co. of China Ltd., H Shares | 6,738,976 | 52,092,370 |
| Postal Savings Bank of China Co., Ltd., H Shares | 11,775,909 | 9,660,414 |
| SAIC Motor Corp., Ltd., A Shares | 2,158,000 | 6,193,563 |
| Shanghai Pudong Development Bank Co., Ltd., A Shares | 5,470,600 | 7,273,904 |
| Shenzhou International Group Holdings Ltd. | 236,115 | 3,967,634 |
| Shimao Group Holdings Ltd. | 4,925,896 | 2,944,051 |
| Sinopec Shanghai Petrochemical Co., Ltd., A Shares | 2,009,500 | 1,292,959 |
| Sinopec Shanghai Petrochemical Co., Ltd., H Shares | 18,690,996 | 4,210,061 |
| Sinopharm Group Co., Ltd., H Shares | 4,705,506 | 11,369,768 |
| Sunac China Holdings Ltd. | 3,807,877 | 3,118,934 |
| Tencent Holdings Ltd. | 1,065,398 | 57,430,620 |
| SECURITY | NUMBER
OF SHARES | VALUE ($) |
| Vipshop Holdings Ltd., ADR * | 444,309 | 3,852,159 |
| Weichai Power Co., Ltd., A Shares | 374,300 | 899,269 |
| Weichai Power Co., Ltd., H Shares | 2,386,832 | 4,032,172 |
| Yankuang Energy Group Co., Ltd., A Shares | 207,700 | 1,043,437 |
| Yankuang Energy Group Co., Ltd., H Shares (a) | 4,338,323 | 10,638,016 |
| | | 1,359,540,912 |
| |
| Colombia 0.3% |
| Bancolombia S.A. | 624,650 | 6,252,899 |
| Ecopetrol S.A. | 11,841,176 | 9,907,104 |
| | | 16,160,003 |
| |
| Czech Republic 0.2% |
| CEZ A/S | 270,724 | 10,317,216 |
| |
| Egypt 0.1% |
| Commercial International Bank Egypt S.A.E., GDR * | 2,005,805 | 5,866,980 |
| |
| Greece 0.5% |
| Alpha Services and Holdings S.A. * | 7,149,716 | 9,733,044 |
| Hellenic Telecommunications Organization S.A. | 362,180 | 7,241,053 |
| Motor Oil Hellas Corinth Refineries S.A. | 360,910 | 5,792,799 |
| | | 22,766,896 |
| |
| Hungary 0.4% |
| MOL Hungarian Oil & Gas plc | 1,630,799 | 12,805,898 |
| OTP Bank Nyrt * | 173,977 | 6,725,303 |
| | | 19,531,201 |
| |
| India 9.8% |
| Axis Bank Ltd. * | 1,124,834 | 11,083,006 |
| Bharat Petroleum Corp., Ltd. | 2,716,366 | 12,610,701 |
| Bharti Airtel Ltd. * | 1,242,174 | 11,317,594 |
| Coal India Ltd. | 4,999,549 | 11,250,188 |
| GAIL India Ltd. | 3,397,585 | 6,531,606 |
| Grasim Industries Ltd. | 373,836 | 7,930,945 |
| HCL Technologies Ltd. | 743,151 | 11,115,087 |
| Hero MotoCorp Ltd. | 183,614 | 6,178,627 |
| Hindalco Industries Ltd. | 2,226,634 | 16,955,191 |
| Hindustan Petroleum Corp., Ltd. | 3,547,829 | 12,866,310 |
| Hindustan Unilever Ltd. | 189,169 | 5,453,319 |
| Housing Development Finance Corp., Ltd. | 537,329 | 16,862,065 |
| ICICI Bank Ltd. | 640,817 | 6,316,530 |
| Indian Oil Corp., Ltd. | 13,495,712 | 20,597,988 |
| Infosys Ltd. | 2,007,071 | 45,699,340 |
| ITC Ltd. | 2,863,047 | 8,201,847 |
| JSW Steel Ltd. | 864,359 | 7,197,877 |
| Larsen & Toubro Ltd. | 363,216 | 8,757,725 |
| Mahindra & Mahindra Ltd. | 782,224 | 8,210,250 |
| Maruti Suzuki India Ltd. | 116,192 | 12,821,098 |
| NTPC Ltd. | 7,368,554 | 13,055,535 |
| Oil & Natural Gas Corp., Ltd. | 14,738,733 | 31,424,765 |
| Power Grid Corp. of India Ltd. | 2,829,287 | 7,853,550 |
| Reliance Industries Ltd. | 1,907,983 | 59,749,577 |
| State Bank of India | 1,962,083 | 12,582,747 |
| Sun Pharmaceutical Industries Ltd. | 640,104 | 7,169,233 |
Schwab Fundamental Index ETFs | Annual Report
Schwab Fundamental Emerging Markets Large Company Index ETF
Portfolio Holdings as of February 28, 2022 (continued)
| SECURITY | NUMBER
OF SHARES | VALUE ($) |
| Tata Consultancy Services Ltd. | 503,391 | 23,745,344 |
| Tata Motors Ltd. * | 3,753,330 | 22,617,864 |
| Tata Motors Ltd., A Shares, DVR * | 839,248 | 2,414,798 |
| Tata Steel Ltd. | 905,589 | 14,671,990 |
| Tech Mahindra Ltd. | 378,798 | 7,088,559 |
| Vedanta Ltd. | 3,455,617 | 17,441,470 |
| Wipro Ltd. | 892,557 | 6,583,937 |
| | | 474,356,663 |
| |
| Indonesia 1.7% |
| PT Astra International Tbk | 38,646,217 | 15,601,591 |
| PT Bank Central Asia Tbk | 16,539,642 | 9,267,357 |
| PT Bank Mandiri (Persero) Tbk | 22,698,181 | 12,165,100 |
| PT Bank Rakyat Indonesia (Persero) Tbk | 46,100,540 | 14,599,948 |
| PT Telkom Indonesia (Persero) Tbk | 81,913,586 | 24,744,551 |
| PT United Tractors Tbk | 3,498,445 | 6,063,290 |
| | | 82,441,837 |
| |
| Kuwait 0.7% |
| Kuwait Finance House KSCP | 2,504,516 | 7,808,002 |
| Mobile Telecommunications Co. KSCP | 3,808,695 | 7,798,517 |
| National Bank of Kuwait SAKP | 5,385,633 | 18,764,342 |
| | | 34,370,861 |
| |
| Malaysia 1.9% |
| Axiata Group Berhad | 8,700,172 | 8,143,784 |
| CIMB Group Holdings Berhad | 11,027,284 | 14,997,211 |
| Genting Berhad | 6,814,500 | 7,531,090 |
| Malayan Banking Berhad | 8,245,030 | 17,202,921 |
| Petronas Chemicals Group Berhad | 3,268,600 | 7,434,829 |
| Public Bank Berhad | 12,973,200 | 13,750,325 |
| Tenaga Nasional Berhad | 10,345,500 | 22,595,745 |
| | | 91,655,905 |
| |
| Mexico 4.1% |
| Alfa S.A.B. de C.V., A Shares | 15,215,853 | 11,423,526 |
| America Movil S.A.B. de C.V., Series L | 64,057,580 | 58,030,383 |
| Cemex SAB de C.V., ADR * | 3,121,876 | 15,921,568 |
| Coca-Cola Femsa S.A.B. de C.V. | 1,072,060 | 5,901,642 |
| Fomento Economico Mexicano S.A.B. de C.V. | 3,008,591 | 24,299,903 |
| Grupo Bimbo S.A.B. de C.V., Series A | 3,798,331 | 11,724,495 |
| Grupo Financiero Banorte S.A.B. de C.V., O Shares | 3,583,164 | 24,295,194 |
| Grupo Mexico S.A.B. de C.V., Series B | 3,344,457 | 17,198,194 |
| Grupo Televisa S.A.B., Series CPO | 3,353,793 | 7,205,751 |
| Wal-Mart de Mexico S.A.B. de C.V. | 5,964,405 | 22,739,613 |
| | | 198,740,269 |
| |
| Philippines 0.1% |
| SM Investments Corp. | 308,257 | 5,363,083 |
| |
| Qatar 0.6% |
| Ooredoo QPSC | 3,272,758 | 6,898,769 |
| Qatar National Bank QPSC | 3,534,476 | 21,162,202 |
| | | 28,060,971 |
| |
| SECURITY | NUMBER
OF SHARES | VALUE ($) |
| Russia 3.0% |
| Alrosa PJSC (b)(c) | 5,101,117 | 2,117,201 |
| Gazprom PJSC (b)(c) | 40,103,722 | 46,063,823 |
| Inter RAO UES PJSC (b)(c) | 163,997,565 | 2,255,696 |
| LUKOIL PJSC (b)(c) | 1,548,485 | 38,513,024 |
| Magnit PJSC (b)(c) | 213,464 | 3,193,631 |
| MMC Norilsk Nickel PJSC (b)(c) | 56,707 | 5,473,498 |
| Mobile TeleSystems PJSC (b)(c) | 2,722,155 | 3,087,301 |
| Novatek PJSC (b)(c) | 910,093 | 5,573,727 |
| Novolipetsk Steel PJSC (b)(c) | 2,244,152 | 2,030,729 |
| Rosneft Oil Co. PJSC (b)(c) | 4,831,508 | 7,181,774 |
| ROSSETI PJSC (b)(c) | 304,960,410 | 1,000,808 |
| Sberbank of Russia PJSC (b)(c) | 16,483,790 | 10,381,639 |
| Severstal PAO (b)(c) | 350,021 | 2,381,834 |
| Sistema PJSC (b)(c) | 13,190,680 | 792,692 |
| Surgutneftegas PJSC (b)(c) | 22,928,546 | 2,467,075 |
| Tatneft PJSC (b)(c) | 4,700,439 | 8,504,567 |
| VTB Bank PJSC (b)(c) | 12,998,250,000 | 1,237,646 |
| | | 142,256,665 |
| |
| Saudi Arabia 3.3% |
| Al Rajhi Bank | 468,400 | 20,025,951 |
| Banque Saudi Fransi | 543,662 | 7,694,766 |
| Riyad Bank | 1,101,294 | 10,420,859 |
| Saudi Arabian Oil Co. | 1,402,539 | 15,533,091 |
| Saudi Basic Industries Corp. | 1,331,813 | 44,231,655 |
| Saudi Electricity Co. | 1,252,852 | 9,216,812 |
| Saudi Telecom Co. | 606,983 | 18,443,922 |
| The Saudi British Bank | 743,420 | 7,668,618 |
| The Saudi National Bank | 1,383,496 | 25,149,779 |
| | | 158,385,453 |
| |
| South Africa 7.3% |
| Absa Group Ltd. | 1,871,874 | 21,397,691 |
| AngloGold Ashanti Ltd. | 506,692 | 11,918,616 |
| Aspen Pharmacare Holdings Ltd. | 466,861 | 6,072,743 |
| Barloworld Ltd. | 1,037,454 | 8,247,936 |
| Bid Corp., Ltd. | 571,478 | 11,553,453 |
| FirstRand Ltd. | 6,777,890 | 29,002,044 |
| Gold Fields Ltd. | 934,411 | 12,990,747 |
| MTN Group Ltd. * | 4,826,006 | 59,839,039 |
| MultiChoice Group | 918,966 | 7,494,457 |
| Naspers Ltd., N Shares | 71,575 | 8,932,504 |
| Nedbank Group Ltd. | 1,082,643 | 15,314,993 |
| Old Mutual Ltd. | 11,076,942 | 9,032,161 |
| Sanlam Ltd. | 2,119,210 | 8,867,699 |
| Sappi Ltd. * | 2,973,901 | 9,799,776 |
| Sasol Ltd. * | 2,178,684 | 49,430,502 |
| Shoprite Holdings Ltd. | 883,299 | 13,090,145 |
| Sibanye Stillwater Ltd. | 1,536,744 | 7,097,714 |
| Standard Bank Group Ltd. | 2,958,171 | 31,135,216 |
| The Bidvest Group Ltd. | 599,876 | 8,169,028 |
| The SPAR Group Ltd. | 418,182 | 4,440,401 |
| Thungela Resources Ltd. * | 220,185 | 1,957,691 |
| Vodacom Group Ltd. | 1,021,523 | 9,784,541 |
| Woolworths Holdings Ltd. | 1,833,867 | 5,993,223 |
| | | 351,562,320 |
| |
| Taiwan 17.9% |
| Acer, Inc. | 6,935,470 | 7,124,720 |
| ASE Technology Holding Co., Ltd. | 4,582,000 | 16,229,449 |
| Asustek Computer, Inc. | 1,602,176 | 21,230,904 |
| AU Optronics Corp. | 25,770,371 | 18,889,999 |
| Catcher Technology Co., Ltd. | 1,892,000 | 9,650,651 |
Schwab Fundamental Index ETFs | Annual Report
Schwab Fundamental Emerging Markets Large Company Index ETF
Portfolio Holdings as of February 28, 2022 (continued)
| SECURITY | NUMBER
OF SHARES | VALUE ($) |
| Cathay Financial Holding Co., Ltd. | 8,088,840 | 17,975,200 |
| Cheng Shin Rubber Industry Co., Ltd. | 3,683,000 | 4,676,825 |
| China Steel Corp. | 16,155,088 | 20,744,896 |
| Chunghwa Telecom Co., Ltd. | 4,379,764 | 19,449,995 |
| Compal Electronics, Inc. | 22,933,000 | 20,777,535 |
| CTBC Financial Holding Co., Ltd. | 17,810,809 | 17,248,563 |
| Delta Electronics, Inc. | 1,351,696 | 11,884,896 |
| E.Sun Financial Holding Co., Ltd. | 6,446,598 | 6,771,975 |
| Far Eastern New Century Corp. | 9,441,061 | 9,951,252 |
| Far EasTone Telecommunications Co., Ltd. | 2,488,588 | 6,151,566 |
| First Financial Holding Co., Ltd. | 8,343,655 | 7,648,722 |
| Formosa Chemicals & Fibre Corp. | 6,292,882 | 17,732,751 |
| Formosa Petrochemical Corp. | 2,610,704 | 9,107,432 |
| Formosa Plastics Corp. | 5,129,704 | 19,212,375 |
| Foxconn Technology Co., Ltd. | 2,674,858 | 6,087,246 |
| Fubon Financial Holding Co., Ltd. | 8,597,970 | 23,032,194 |
| Hon Hai Precision Industry Co., Ltd. | 37,216,928 | 136,734,210 |
| Innolux Corp. | 28,474,000 | 17,012,288 |
| Inventec Corp. | 11,323,646 | 10,360,318 |
| Largan Precision Co., Ltd. | 80,200 | 5,778,634 |
| Lite-On Technology Corp. | 3,869,229 | 9,440,174 |
| MediaTek, Inc. | 534,046 | 20,668,447 |
| Mega Financial Holding Co., Ltd. | 8,956,548 | 12,012,349 |
| Nan Ya Plastics Corp. | 7,084,588 | 22,162,239 |
| Pegatron Corp. | 9,715,234 | 23,945,877 |
| Pou Chen Corp. | 8,588,000 | 9,833,237 |
| President Chain Store Corp. | 559,000 | 5,214,143 |
| Quanta Computer, Inc. | 5,110,058 | 16,933,276 |
| Synnex Technology International Corp. | 3,986,178 | 10,223,157 |
| Taiwan Cement Corp. | 5,748,302 | 9,708,654 |
| Taiwan Mobile Co., Ltd. | 1,778,000 | 6,564,045 |
| Taiwan Semiconductor Manufacturing Co., Ltd. | 8,194,352 | 176,543,200 |
| Uni-President Enterprises Corp. | 6,617,796 | 15,839,276 |
| United Microelectronics Corp. | 8,077,931 | 15,011,957 |
| Walsin Lihwa Corp. | 8,804,000 | 8,761,605 |
| Wistron Corp. | 13,763,934 | 14,434,088 |
| WPG Holdings Ltd. | 6,376,880 | 12,669,599 |
| Yageo Corp. | 394,000 | 6,345,318 |
| Yuanta Financial Holding Co., Ltd. | 7,576,960 | 6,716,157 |
| | | 864,491,394 |
| |
| Thailand 3.7% |
| Advanced Info Service PCL NVDR | 1,376,800 | 9,649,187 |
| Bangkok Bank PCL NVDR | 2,293,700 | 9,827,636 |
| Charoen Pokphand Foods PCL NVDR | 8,820,100 | 6,815,839 |
| CP ALL PCL NVDR | 4,891,700 | 10,180,125 |
| IRPC PCL NVDR | 43,766,300 | 5,089,883 |
| Kasikornbank PCL NVDR | 1,720,500 | 8,609,082 |
| Krung Thai Bank PCL NVDR | 18,667,500 | 7,998,317 |
| PTT Exploration & Production PCL NVDR | 2,354,000 | 9,833,849 |
| PTT Global Chemical PCL NVDR | 6,640,500 | 10,771,125 |
| PTT PCL NVDR | 45,237,400 | 54,686,375 |
| Thai Oil PCL NVDR | 4,527,100 | 7,447,028 |
| The Siam Cement PCL NVDR | 1,643,400 | 19,715,770 |
| The Siam Commercial Bank PCL NVDR | 4,331,200 | 16,635,519 |
| | | 177,259,735 |
| |
| Turkey 1.4% |
| Akbank T.A.S. | 13,225,386 | 6,708,284 |
| BIM Birlesik Magazalar A/S | 702,097 | 3,703,073 |
| SECURITY | NUMBER
OF SHARES | VALUE ($) |
| Eregli Demir ve Celik Fabrikalari T.A.S. | 3,261,577 | 7,314,024 |
| Haci Omer Sabanci Holding A/S | 4,915,544 | 5,511,507 |
| KOC Holding A/S | 3,509,268 | 8,011,259 |
| Turk Hava Yollari AO * | 4,229,339 | 7,818,066 |
| Turkcell Iletisim Hizmetleri A/S | 4,348,506 | 6,438,210 |
| Turkiye Garanti Bankasi A/S | 9,400,378 | 7,515,066 |
| Turkiye Is Bankasi A/S, Class C | 8,598,263 | 4,938,232 |
| Turkiye Petrol Rafinerileri A/S * | 713,689 | 9,933,195 |
| | | 67,890,916 |
| |
| United Arab Emirates 1.4% |
| Abu Dhabi Commercial Bank PJSC | 3,369,421 | 9,870,535 |
| Emaar Properties PJSC | 8,758,214 | 12,113,020 |
| Emirates NBD Bank PJSC | 2,854,270 | 11,112,308 |
| Emirates Telecommunications Group Co. PJSC | 1,765,837 | 16,816,808 |
| First Abu Dhabi Bank PJSC | 2,750,086 | 15,483,530 |
| | | 65,396,201 |
Total Common Stocks
(Cost $4,096,586,055) | 4,556,100,485 |
|
| PREFERRED STOCKS 5.3% OF NET ASSETS |
| |
| Brazil 4.7% |
| Banco Bradesco S.A. | 10,854,160 | 42,875,586 |
| Centrais Eletricas Brasileiras S.A., B Shares | 551,198 | 3,681,643 |
| Cia Energetica de Minas Gerais | 3,111,829 | 7,731,702 |
| Gerdau S.A. | 2,237,228 | 11,056,510 |
| Itau Unibanco Holding S.A. | 13,584,013 | 67,159,348 |
| Petroleo Brasileiro S.A. | 14,172,560 | 93,535,540 |
| | | 226,040,329 |
| |
| Colombia 0.2% |
| Bancolombia S.A. | 1,062,206 | 9,478,134 |
| |
| Russia 0.4% |
| Surgutneftegas PJSC (b)(c) | 26,752,105 | 4,092,753 |
| Tatneft PJSC (b)(c) | 504,714 | 808,690 |
| Transneft PJSC (b)(c) | 23,922 | 17,317,575 |
| | | 22,219,018 |
Total Preferred Stocks
(Cost $275,961,433) | 257,737,481 |
Schwab Fundamental Index ETFs | Annual Report
Schwab Fundamental Emerging Markets Large Company Index ETF
Portfolio Holdings as of February 28, 2022 (continued)
| SECURITY | NUMBEROF SHARES | VALUE ($) |
| SHORT-TERM INVESTMENTS 0.6% OF NET ASSETS |
| |
| Money Market Funds 0.6% |
| State Street Institutional U.S. Government Money Market Fund, Premier Class 0.03% (d) | 20,821,297 | 20,821,297 |
| State Street Institutional U.S. Government Money Market Fund, Premier Class 0.03% (d)(e) | 5,958,427 | 5,958,427 |
| | | 26,779,724 |
Total Short-Term Investments
(Cost $26,779,724) | 26,779,724 |
Total Investments in Securities
(Cost $4,399,327,212) | 4,840,617,690 |
| | NUMBER OF
CONTRACTS | NOTIONAL
AMOUNT
($) | CURRENT VALUE/
UNREALIZED
DEPRECIATION
($) |
| FUTURES CONTRACTS |
| Long | | | |
| MSCI Emerging Markets Index, expires 03/18/22 | 252 | 14,811,300 | (269,950) |
| * | Non-income producing security. |
| (a) | All or a portion of this security is on loan. Securities on loan were valued at $5,600,487. |
| (b) | Fair valued by management using significant unobservable inputs in accordance with procedures approved by the fund’s Board of Trustees. |
| (c) | Trading in Russian securities listed on the Moscow Exchange, Russian ADRs, and Russian GDRs had ceased and suspended the fund’s ability to buy or sell these securities as of February 28, 2022. |
| (d) | The rate shown is the 7-day yield. |
| (e) | Security purchased with cash collateral received for securities on loan. |
| ADR — | American Depositary Receipt |
| DVR — | Differential Voting Rights |
| GDR — | Global Depositary Receipt |
| NVDR — | Non-Voting Depositary Receipt |
The following is a summary of the inputs used to value the fund’s investments as of February 28, 2022 (see financial note 2(a) for additional information):
| DESCRIPTION | QUOTED PRICES IN
ACTIVE MARKETS FOR
IDENTICAL ASSETS
(LEVEL 1) | OTHER SIGNIFICANT
OBSERVABLE INPUTS
(LEVEL 2) | SIGNIFICANT
UNOBSERVABLE INPUTS
(LEVEL 3) | TOTAL |
| Assets | | | | |
| Common Stocks1 | $3,054,302,908 | $— | $— | $3,054,302,908 |
| China | 1,359,286,183 | — | 254,729 | 1,359,540,912 |
| Russia 2 | — | — | 142,256,665 | 142,256,665 |
| Preferred Stocks1 | 235,518,463 | — | — | 235,518,463 |
| Russia 2 | — | — | 22,219,018 | 22,219,018 |
| Short-Term Investments1 | 26,779,724 | — | — | 26,779,724 |
| Liabilities | | | | |
| Futures Contracts3 | (269,950) | — | — | (269,950) |
| Total | $4,675,617,328 | $— | $164,730,412 | $4,840,347,740 |
| 1 | As categorized in the Portfolio Holdings. |
| 2 | Trading in Russian securities listed on the Moscow Exchange, Russian ADRs, and Russian GDRs had ceased and suspended the fund’s ability to buy or sell these securities as of February 28, 2022. |
| 3 | Futures contracts are reported at cumulative unrealized appreciation or depreciation. |
Fund investments in mutual funds are classified as Level 1, without consideration to the classification level of the underlying securities held by the mutual funds, which could be Level 1, Level 2 or Level 3.
Schwab Fundamental Index ETFs | Annual Report
Schwab Fundamental Emerging Markets Large Company Index ETF
Portfolio Holdings as of February 28, 2022 (continued)
The following is a reconciliation of Level 3 investments for which significant unobservable inputs were used to determine fair value:
| INVESTMENT IN SECURITIES | VALUE AT
2/28/21 | GROSS
TRANSFERS
IN | GROSS
TRANSFERS
OUT | PURCHASES | SALES | REALIZED
GAINS
(LOSSES) | NET CHANGE IN
UNREALIZED
APPRECIATION
(DEPRECIATION) | VALUE AT
2/28/22 |
| Common Stocks | | | | | | | | |
| China | $— | $— | $— | $67,934 | $— | $— | $186,795 | $254,729 |
| Philippines | 9,276,866 | — | (4,167,445) | 51,729 | (4,756,870) | 330,089 | (734,369) | — |
| Russia | — | 365,180,824 | — | 218,573,243 | (98,988,827) | 19,924,151 | (362,432,726) | 142,256,665 |
| Preferred Stocks | | | | | | | | |
| Russia | — | 38,096,864 | — | 30,092,831 | (2,183,947) | (918,275) | (42,868,455) | 22,219,018 |
| Total | $9,276,866 | $403,277,688 | ($4,167,445) | $248,785,737 | ($105,929,644) | $19,335,965 | ($405,848,755) | $164,730,412 |
There were security transfers to Level 3 due to securities being fair valued by management using significant unobservable inputs in accordance with procedures approved by the fund’s Board of Trustees. Additionally, there were security transfers from Level 3 as a result of available quoted market prices in active markets for those securities (see financial note 2(a) for additional information).
Schwab Fundamental Index ETFs | Annual Report
Schwab Fundamental Emerging Markets Large Company Index ETF
Statement of Assets and Liabilities
As of February 28, 2022
| Assets |
| Investments in securities, at value - unaffiliated (cost $4,399,327,212) including securities on loan of $5,600,487 | | $4,840,617,690 |
| Foreign currency, at value (cost $8,980,926) | | 8,869,022 |
| Deposit with broker for futures contracts | | 952,389 |
| Receivables: | | |
| Dividends | | 5,430,908 |
| Income from securities on loan | + | 28,798 |
| Total assets | | 4,855,898,807 |
| Liabilities |
| Collateral held for securities on loan | | 5,958,427 |
| Payables: | | |
| Foreign capital gains tax | | 13,648,159 |
| Investments bought | | 9,067,500 |
| Management fees | | 1,554,739 |
| Variation margin on futures contracts | + | 104,427 |
| Total liabilities | | 30,333,252 |
| Net assets | | $4,825,565,555 |
| Net Assets by Source |
| Capital received from investors | | $4,610,183,472 |
| Total distributable earnings | + | 215,382,083 |
| Net assets | | $4,825,565,555 |
| Net Asset Value (NAV) |
| Net Assets | ÷ | Shares
Outstanding | = | NAV |
| $4,825,565,555 | | 165,000,000 | | $29.25 |
| | | | | |
| | | | | |
Schwab Fundamental Index ETFs | Annual Report
Schwab Fundamental Emerging Markets Large Company Index ETF
Statement of Operations
| For the period March 1, 2021 through February 28, 2022 |
| Investment Income |
| Dividends received from securities - unaffiliated (net of foreign withholding tax of $24,753,737) | | $221,768,672 |
| Securities on loan, net | + | 355,445 |
| Total investment income | | 222,124,117 |
| Expenses |
| Management fees | | 18,514,414 |
| Professional fees | + | 78* |
| Total expenses | | 18,514,492 |
| Expense reduction by investment adviser | – | 78* |
| Net expenses | – | 18,514,414 |
| Net investment income | | 203,609,703 |
| REALIZED AND UNREALIZED GAINS (LOSSES) |
| Net realized gains on sales of securities - unaffiliated (net of foreign capital gains tax paid of $6,543,153) | | 7,571,166 |
| Net realized gains on sales of in-kind redemptions - unaffiliated | | 65,015,792 |
| Net realized losses on futures contracts | | (3,186,113) |
| Net realized losses on foreign currency transactions | + | (1,676,167) |
| Net realized gains | | 67,724,678 |
| Net change in unrealized appreciation (depreciation) on securities - unaffiliated (net of change in foreign capital gains tax of $35,987) | | (200,838,467) |
| Net change in unrealized appreciation (depreciation) on futures contracts | | (165,630) |
| Net change in unrealized appreciation (depreciation) on foreign currency translations | + | 38,096 |
| Net change in unrealized appreciation (depreciation) | + | (200,966,001) |
| Net realized and unrealized losses | | (133,241,323) |
| Increase in net assets resulting from operations | | $70,368,380 |
| * | Professional fees associated with the filing of tax claims in the European Union deemed to be non-routine expenses of the fund. See financial notes 2 (d) and 4 for additional information. |
Schwab Fundamental Index ETFs | Annual Report
Schwab Fundamental Emerging Markets Large Company Index ETF
Statement of Changes in Net Assets
For the current and prior report periods
| OPERATIONS |
| | 3/1/21-2/28/22 | 3/1/20-2/28/21 |
| Net investment income | | $203,609,703 | $92,017,907 |
| Net realized gains (losses) | | 67,724,678 | (115,642,262) |
| Net change in unrealized appreciation (depreciation) | + | (200,966,001) | 652,744,376 |
| Increase in net assets resulting from operations | | $70,368,380 | $629,120,021 |
| DISTRIBUTIONS TO SHAREHOLDERS |
| Total distributions | | ($210,038,530) | ($87,400,780) |
| TRANSACTIONS IN FUND SHARES |
| | 3/1/21-2/28/22 | 3/1/20-2/28/21 |
| | | SHARES | VALUE | SHARES | VALUE |
| Shares sold | | 40,800,000 | $1,289,730,550 | 31,300,000 | $765,612,459 |
| Shares redeemed | + | (4,200,000) | (130,019,083) | (3,700,000) | (76,104,258) |
| Net transactions in fund shares | | 36,600,000 | $1,159,711,467 | 27,600,000 | $689,508,201 |
| SHARES OUTSTANDING AND NET ASSETS |
| | 3/1/21-2/28/22 | 3/1/20-2/28/21 |
| | | SHARES | NET ASSETS | SHARES | NET ASSETS |
| Beginning of period | | 128,400,000 | $3,805,524,238 | 100,800,000 | $2,574,296,796 |
| Total increase | + | 36,600,000 | 1,020,041,317 | 27,600,000 | 1,231,227,442 |
| End of period | | 165,000,000 | $4,825,565,555 | 128,400,000 | $3,805,524,238 |
Schwab Fundamental Index ETFs | Annual Report
Schwab Fundamental Index ETFs
1. Business Structure of the Funds:
Each of the funds in this report is a series of Schwab Strategic Trust (the trust), a no-load, open-end management investment company. The trust is organized as a Delaware statutory trust and is registered under the Investment Company Act of 1940, as amended (the 1940 Act). The list below shows all the operational funds in the trust as of the end of the period, including the funds discussed in this report, which are highlighted:
| SCHWAB STRATEGIC TRUST (ORGANIZED JANUARY 27, 2009) |
| Schwab Fundamental U.S. Broad Market Index ETF | Schwab U.S. Dividend Equity ETF |
| Schwab Fundamental U.S. Large Company Index ETF | Schwab U.S. REIT ETF |
| Schwab Fundamental U.S. Small Company Index ETF | Schwab International Dividend Equity ETF |
| Schwab Fundamental International Large Company Index ETF | Schwab International Equity ETF |
| Schwab Fundamental International Small Company Index ETF | Schwab International Small-Cap Equity ETF |
| Schwab Fundamental Emerging Markets Large Company Index ETF | Schwab Emerging Markets Equity ETF |
| Schwab U.S. Broad Market ETF | Schwab U.S. TIPS ETF |
| Schwab 1000 Index® ETF | Schwab Short-Term U.S. Treasury ETF |
| Schwab U.S. Large-Cap ETF | Schwab Intermediate-Term U.S. Treasury ETF |
| Schwab U.S. Large-Cap Growth ETF | Schwab Long-Term U.S. Treasury ETF |
| Schwab U.S. Large-Cap Value ETF | Schwab U.S. Aggregate Bond ETF |
| Schwab U.S. Mid-Cap ETF | Schwab 1-5 Year Corporate Bond ETF |
| Schwab U.S. Small-Cap ETF | Schwab 5-10 Year Corporate Bond ETF |
| | Schwab Ariel ESG ETF |
The funds issue and redeem shares at their net asset value per share (NAV) only in large blocks of shares (Creation Units). These transactions are usually in exchange for a basket of securities and/or an amount of cash. As a practical matter, only institutional investors who have entered into an authorized participant agreement purchase or redeem Creation Units. Except when aggregated in Creation Units, shares of the funds are not redeemable securities.
Individual shares of the funds trade on national securities exchanges and elsewhere during the trading day and can only be bought and sold at market prices throughout the trading day through a broker-dealer. Because fund shares trade at market prices rather than NAV, shares may trade at a price greater than NAV (premium) or less than NAV (discount). A chart showing the frequency at which each fund’s daily closing market price was at a discount or premium to each fund’s NAV can be found at www.schwabassetmanagement.com
Each fund maintains its own account for purposes of holding assets and accounting, and is considered a separate entity for tax purposes. Within its account, each fund may also keep certain assets in segregated accounts, as required by securities law.
2. Significant Accounting Policies:
The following is a summary of the significant accounting policies the funds use in their preparation of financial statements. The funds follow the investment company accounting and reporting guidance of the Financial Accounting Standards Board (FASB) Accounting Standard Codification Topic 946 Financial Services — Investment Companies. The accounting policies are in conformity with accounting principles generally accepted in the United States of America (GAAP).
The funds may invest in certain mutual funds and exchange-traded funds (ETFs) which are referred to as “underlying funds”. For more information about the underlying funds’ operations and policies, please refer to those funds’ semiannual and annual reports, which are filed with the U.S. Securities and Exchange Commission (SEC) and available on the SEC’s website at www.sec.gov
(a) Security Valuation:
Under procedures approved by the funds’ Board of Trustees (the Board), the investment adviser has formed a Pricing Committee to administer the pricing and valuation of portfolio securities and other assets and to ensure that prices used for internal purposes or provided by third parties reasonably reflect fair value. Among other things, these procedures allow the funds to utilize independent pricing services, quotations from securities and financial instrument dealers and other market sources to determine fair value.
Schwab Fundamental Index ETFs | Annual Report
Schwab Fundamental Index ETFs
Financial Notes (continued)
2. Significant Accounting Policies (continued):
The funds value the securities in their portfolios every business day. The funds use the following policies to value various types of securities:
• Securities traded on an exchange or over-the-counter: Traded securities are valued at the closing value for the day, or, on days when no closing value has been reported, at the mean of the most recent bid and ask quotes. Securities that are primarily traded on foreign exchanges are valued at the official closing price or the last sales price on the exchange where the securities are principally traded with these values then translated into U.S. dollars at the current exchange rate, unless these securities are fair valued as discussed below.
• Futures contracts: Futures contracts are valued at their settlement prices as of the close of their exchanges.
• Mutual funds: Mutual funds are valued at their respective NAVs.
• Securities for which no quoted value is available: The Board has adopted procedures to fair value each fund’s securities when market prices are not “readily available” or are unreliable. For example, a fund may fair value a security when it is de-listed or its trading is halted or suspended; when a security’s primary pricing source is unable or unwilling to provide a price; or when a security’s primary trading market is closed during regular market hours. Each fund makes fair value determinations in good faith in accordance with the fund’s valuation procedures. The Pricing Committee considers a number of factors, including unobservable market inputs, when arriving at fair value. The Pricing Committee may employ techniques such as the review of related or comparable assets or liabilities, related market activities, recent transactions, market multiples, book values, transactional back-testing, disposition analysis and other relevant information. The Pricing Committee regularly reviews these inputs and assumptions to calibrate the valuations. Due to the subjective and variable nature of fair value pricing, there can be no assurance that a fund could obtain the fair value assigned to the security upon the sale of such security. The Board convenes on a regular basis to review fair value determinations made by the funds pursuant to the valuation procedures.
In accordance with the authoritative guidance on fair value measurements and disclosures under GAAP, the funds disclose the fair value of their investments in a hierarchy that prioritizes the significant inputs to valuation techniques used to measure the fair value. The hierarchy gives the highest priority to valuations based upon unadjusted quoted prices in active markets for identical assets or liabilities (Level 1 measurements) and the lowest priority to valuations based upon unobservable inputs that are significant to the valuation (Level 3 measurements). If inputs used to measure the financial instruments fall within different levels of the hierarchy, the categorization is based on the lowest level input that is significant to the valuation. If the funds determine that either the volume and/or level of activity for an asset or liability has significantly decreased (from normal conditions for that asset or liability) or price quotations or observable inputs are not associated with orderly transactions, increased analysis and management judgment will be required to estimate fair value.
The three levels of the fair value hierarchy are as follows:
• Level 1 — quoted prices in active markets for identical securities — Investments whose values are based on quoted market prices in active markets, and whose values are therefore classified as Level 1 prices, include active listed equities, mutual funds, ETFs and futures contracts. Investments in mutual funds are valued daily at their NAVs, and investments in ETFs are valued daily at the last reported sale price or the official closing price, which are classified as Level 1 prices, without consideration to the classification level of the underlying securities held by an underlying fund.
• Level 2 — other significant observable inputs (including quoted prices for similar securities, interest rates, prepayment speeds, credit risk, etc.) — Investments that trade in markets that are not considered to be active, but whose values are based on quoted market prices, dealer quotations or valuations provided by alternative pricing sources supported by observable inputs are classified as Level 2 prices. These generally include U.S. government and sovereign obligations, most government agency securities, investment-grade corporate bonds, certain mortgage products, less liquid listed equities, and state, municipal and provincial obligations.
• Level 3 — significant unobservable inputs (including the funds’ own assumptions in determining the fair value of investments) — Investments whose values are classified as Level 3 prices have significant unobservable inputs, as they may trade infrequently or not at all. When observable prices are not available for these securities, the funds use one or more valuation techniques for which sufficient and reliable data is available. The inputs used by the funds in estimating the value of Level 3 prices may include the original transaction price, quoted prices for similar securities or assets in active markets, completed or pending third-party transactions in the underlying investment or comparable issuers, and changes in financial
Schwab Fundamental Index ETFs | Annual Report
Schwab Fundamental Index ETFs
Financial Notes (continued)
2. Significant Accounting Policies (continued):
ratios or cash flows. Level 3 prices may also be adjusted to reflect illiquidity and/or non-transferability, with the amount of such discount estimated by the funds in the absence of market information. Assumptions used by the funds due to the lack of observable inputs may significantly impact the resulting fair value and therefore the funds’ results of operations.
The inputs or methodology used for valuing securities are not necessarily an indication of the risk associated with investing in those securities.
The levels associated with valuing the funds’ investments as of February 28, 2022 are disclosed in the Portfolio Holdings.
(b) Accounting Policies for certain Portfolio Investments (if held):
Futures Contracts: Futures contracts are instruments that represent an agreement between two parties that obligates one party to buy, and the other party to sell, specific instruments at an agreed upon price on a stipulated future date. A fund must give the broker a deposit of cash and/or securities (initial margin) whenever it enters into a futures contract. The amount of the deposit may vary from one contract to another. Subsequent payments (variation margin) are made or received by a fund depending on the daily fluctuations in the value of the futures contract and are accounted for as unrealized appreciation or depreciation until the contract is closed, at which time the gains or losses are realized. Futures contracts are traded publicly on exchanges, and their value may change daily.
Securities Lending: Under the trust’s Securities Lending Program, a fund (lender) may make short-term loans of its securities to another party (borrower) to generate additional revenue for the fund. The borrower pledges collateral in the form of cash, securities issued or fully guaranteed by the U.S. government or foreign governments, or letters of credit issued by a bank. Collateral at the individual loan level is required to be maintained on a daily marked-to-market basis in an amount at least equal to the current value of the securities loaned. The lending agent provides a fund with indemnification against borrower default (the borrower fails to return the security on loan) reducing the risk of loss as a result of default. The cash collateral of securities loaned is currently invested in money market portfolios operating pursuant to Rule 2a-7 under the 1940 Act. Each fund bears the risk of loss with respect to the investment of cash collateral. The terms of the securities lending agreement allow the funds or the lending agent to terminate any loan at any given time and the securities must be returned within the earlier of the standard trade settlement period or the specified time period under the relevant securities lending agreement. Securities lending income, as disclosed in each fund’s Statement of Operations, if applicable, represents the income earned from the investment of the cash collateral plus any fees paid by borrowers, less the fees paid to the lending agent and broker rebates which are subject to adjustments pursuant to the securities lending agreement. On loans not collateralized by cash, a fee is received from the borrower, and is allocated between a fund and the lending agent. The aggregate fair value of securities loaned will not at any time exceed one-third of the total assets of a fund, including collateral received from the loan. Securities lending fees paid to the unaffiliated lending agents start at 10% of gross lending revenue, with subsequent breakpoints to a low of 5%. In this context, the gross lending revenue equals the income received from the investment of cash collateral and fees paid by borrowers less any rebates paid to the borrowers. Any expenses charged by the cash collateral fund are in addition to these fees. All remaining revenue is retained by the fund, as applicable. No portion of lending revenue is paid to or retained by the investment adviser or any of its affiliates.
As of February 28, 2022, Schwab Fundamental U.S. Broad Market Index ETF, Schwab Fundamental U.S. Large Company Index ETF, Schwab Fundamental U.S. Small Company Index ETF, Schwab Fundamental International Large Company Index ETF, Schwab Fundamental International Small Company Index ETF and Schwab Fundamental Emerging Markets Large Company Index ETF had securities on loan, all of which were classified as common stocks and warrants. The value of the securities on loan and the related collateral as of February 28, 2022 are disclosed in each fund’s Portfolio Holdings and Statement of Assets and Liabilities.
Passive Foreign Investment Companies: Certain funds may own shares in certain foreign corporations that meet the Internal Revenue Code definition of a passive foreign investment company (PFIC). The funds may elect for tax purposes to mark-to-market annually the shares of each PFIC lot held and would be required to distribute as ordinary income to shareholders any such marked-to-market gains (as well as any gains realized on sale).
Central Securities Depositories Regulation: Effective February 1, 2022, the Central Securities Depositories Regulation (CSDR) introduced new measures for the authorization and supervision of European Union Central Security Depositories and sets out to create a common set of prudential, organizational, and conduct of business standards at a European level. CSDR is designed to support securities settlement and operational aspects of securities settlement, including the provision of shorter settlement periods; mandatory buy-ins; and cash penalties, to prevent and address settlement fails. CSDR measures are aimed to prevent settlement fails by ensuring that all transaction details are provided to facilitate settlement, as well as further incentivizing timely settlement by imposing cash penalty fines and buy-ins. Schwab Fundamental International Large Company Index ETF, Schwab Fundamental
Schwab Fundamental Index ETFs | Annual Report
Schwab Fundamental Index ETFs
Financial Notes (continued)
2. Significant Accounting Policies (continued):
International Small Company Index ETF and Schwab Fundamental Emerging Markets Large Company Index ETF may be subject to pay cash penalties and may also receive cash penalties with certain counterparties in instances where there are settlement fails. At this time, management believes the adoption of CSDR will not have a material impact to the financial statements.
(c) Security Transactions:
Security transactions are recorded as of the date the order to buy or sell the security is executed. Realized gains and losses from security transactions are based on the identified costs of the securities involved.
Assets and liabilities denominated in foreign currencies are reported in U.S. dollars. For assets and liabilities held on a given date, the dollar value is based on market exchange rates in effect on that date. Transactions involving foreign currencies, including purchases, sales, income receipts and expense payments, are calculated using exchange rates in effect on the transaction date. Realized foreign exchange gains or losses arise from sales of foreign currencies, currency gains or losses realized between the trade and settlement dates on securities transactions and the difference between the recorded amounts of dividends, interest, and foreign withholding taxes and the U.S. dollar equivalent of the amounts actually received or paid. Net unrealized foreign exchange appreciation or depreciation arises from changes in foreign exchange rates on foreign denominated assets and liabilities other than investments in securities held at the end of the reporting period. These realized and unrealized foreign exchange gains or losses are reported in foreign currency transactions or translations on the Statement of Operations. The funds do not isolate the portion of the fluctuations on investments resulting from changes in foreign currency exchange rates from the fluctuations in market prices of investments held. Such fluctuations are included with the net realized and unrealized gain or loss from investments.
Gains realized by the funds on the sale of securities in certain foreign countries may be subject to non-U.S. taxes. In those instances, the funds record a liability based on unrealized gains to provide for potential non-U.S. taxes payable upon the sale of these securities.
When a fund closes out a futures contract position, it calculates the difference between the value of the position at the beginning and at the end of the contract, and records a realized gain or loss accordingly.
(d) Investment Income:
Interest income is recorded as it accrues. Dividends, in the form of cash or non-cash income such as in the form of additional securities, and distributions from portfolio securities and underlying funds are recorded on the date they are effective (the ex-dividend date), although the funds record certain foreign security dividends on the date the ex-dividend is confirmed. Any distributions from underlying funds are recorded in accordance with the character of the distributions as designated by the underlying funds.
Income received from foreign sources may result in withholding tax. Withholding taxes are accrued at the same time as the related income if the tax rate is fixed and known, unless a tax withheld is reclaimable from the local tax authorities in which case it is recorded as receivable. If the tax rate is not known or estimable, such expense or reclaim receivable is recorded when the net proceeds are received.
The Schwab Fundamental International Large Company Index ETF, Schwab Fundamental International Small Company Index ETF and Schwab Fundamental Emerging Markets Large Company Index ETF filed claims to recover taxes previously withheld in certain European Union countries on the basis that those countries had purportedly violated certain provisions in the Treaty on the Functioning of the European Union. These filings are subject to various administrative and judicial proceedings within these countries, and all professional fees associated with these filings have been paid by the investment adviser. For additional details see Affiliates and Affiliated Transactions in financial note 4, Other Affiliated Transactions.
(e) Expenses:
Pursuant to the Amended and Restated Advisory Agreement (Advisory Agreement) between the investment adviser and the trust, the investment adviser will pay the operating expenses of each fund, excluding taxes, any brokerage expenses, and extraordinary or non-routine expenses. Taxes, any brokerage expenses and extraordinary or non-routine expenses that are specific to a fund are charged directly to the fund.
Schwab Fundamental Index ETFs | Annual Report
Schwab Fundamental Index ETFs
Financial Notes (continued)
2. Significant Accounting Policies (continued):
(f) Distributions to Shareholders:
Schwab Fundamental U.S. Broad Market Index ETF, Schwab Fundamental U.S. Large Company Index ETF, and Schwab Fundamental U.S. Small Company Index ETF make distributions from net investment income, if any, quarterly. Schwab Fundamental International Large Company Index ETF, Schwab Fundamental International Small Company Index ETF, and Schwab Fundamental Emerging Markets Large Company Index ETF make distributions from net investment income, if any, semiannually. All funds make distributions from net realized capital gains, if any, once a year. To receive a distribution, you must be a registered shareholder on the record date. Distributions are paid to shareholders on the payable date.
(g) Accounting Estimates:
The accounting policies described in this report conform to GAAP. Notwithstanding this, shareholders should understand that in order to follow these principles, fund management has to make estimates and assumptions that affect the information reported in the financial statements. It’s possible that once the results are known, they may turn out to be different from these estimates and these differences may be material.
(h) Federal Income Taxes:
The funds intend to meet federal income and excise tax requirements for regulated investment companies under subchapter M of the Internal Revenue Code, as amended. Accordingly, the funds distribute substantially all of their net investment income and net realized capital gains, if any, to their respective shareholders each year. As long as a fund meets the tax requirements, it is not required to pay federal income tax.
(i) Foreign Taxes:
The funds may be subject to foreign taxes (a portion of which may be reclaimable) on income, corporate events, foreign currency exchanges and capital gains on investments. All foreign taxes are recorded in accordance with the applicable foreign tax regulations and rates that exist in foreign markets in which the funds invest. These foreign taxes, if any, are paid by the funds and are disclosed in the Statement of Operations. Foreign taxes accrued as of February 28, 2022, if any, are reflected in each fund’s Statement of Assets and Liabilities.
(j) Indemnification:
Under the funds’ organizational documents, the officers and trustees are indemnified against certain liabilities arising out of the performance of their duties to the funds. In addition, in the normal course of business the funds enter into contracts with their vendors and others that provide general indemnifications. The funds’ maximum exposure under these arrangements is unknown as this would involve future claims that may be made against the funds. However, based on experience, the funds expect the risk of loss attributable to these arrangements to be remote.
3. Risk Factors:
Investing in the funds may involve certain risks, as discussed in the funds’ prospectus, including, but not limited to, those described below. Any of these risks could cause an investor to lose money.
Market Risk. Financial markets rise and fall in response to a variety of factors, sometimes rapidly and unpredictably. Markets may be impacted by economic, political, regulatory and other conditions, including economic sanctions and other government actions. In addition, the occurrence of global events, such as war, terrorism, environmental disasters, natural disasters and epidemics may also negatively affect the financial markets. As with any investment whose performance is tied to these markets, the value of an investment in a fund will fluctuate, which means that an investor could lose money over short or long periods.
Investment Style Risk. The funds are index funds. Therefore, each fund follows their respective securities included in the index during upturns as well as downturns. Because of their indexing strategies, the funds do not take steps to reduce market exposure or to lessen the effects of a declining market. In addition, because of the funds’ expenses, the funds’ performance may be below that of their respective index. Errors relating to the index may occur from time to time and may not be identified by the index provider for a period of time. In addition, market disruptions could cause delays in the index’s rebalancing schedule. Such errors and/or market disruptions may result in losses for a fund.
Equity Risk. The prices of equity securities rise and fall daily. These price movements may result from factors affecting individual companies, industries or the securities market as a whole. In addition, equity markets tend to move in cycles, which may cause stock prices to fall over short or extended periods of time.
Schwab Fundamental Index ETFs | Annual Report
Schwab Fundamental Index ETFs
Financial Notes (continued)
3. Risk Factors (continued):
Market Capitalization Risk. Securities issued by companies of different market capitalizations tend to go in and out of favor based on market and economic conditions. During a period when securities of a particular market capitalization fall behind other types of investments, a fund’s performance could be impacted.
Large-Cap Company Risk. Certain funds invest in large-cap company stocks. Large-cap companies are generally more mature and the securities issued by these companies may not be able to reach the same levels of growth as the securities issued by small- or mid-cap companies.
Mid-Cap Company Risk. Certain funds invest in mid-cap company stocks. Mid-cap companies may be more vulnerable to adverse business or economic events than larger, more established companies and the value of securities issued by these companies may move sharply.
Small-Cap Company Risk. Certain funds invest in small-cap company stocks. Securities issued by small-cap companies may be riskier than those issued by larger companies, and their prices may move sharply, especially during market upturns and downturns.
Foreign Investment Risk. A fund’s investments in securities of foreign issuers involve certain risks that may be greater than those associated with investments in securities of U.S. issuers. These include risks of adverse changes in foreign economic, political, regulatory and other conditions; changes in currency exchange rates or exchange control regulations (including limitations on currency movements and exchanges); the imposition of economic sanctions or other government restrictions; differing accounting, auditing, financial reporting and legal standards and practices; differing securities market structures; and higher transaction costs. These risks may negatively impact the value or liquidity of a fund’s investments, and could impair the fund’s ability to meet its investment objective or invest in accordance with its investment strategy. There is a risk that investments in securities denominated in, and/or receiving revenues in, foreign currencies will decline in value relative to the U.S. dollar. Foreign securities also include American Depositary Receipts (ADRs), Global Depositary Receipts (GDRs) and European Depositary Receipts (EDRs), which may be less liquid than the underlying shares in their primary trading market, and GDRs, in particular, many of which are issued by companies in emerging markets, may be more volatile. Foreign securities may also include investments in variable interest entities (VIEs) structures, which are created by China-based operating companies in jurisdictions outside of China to obtain indirect financing due to Chinese regulations that prohibit non-Chinese ownership of those companies. To the extent a fund’s investments in a single country or a limited number of countries represent a large percentage of the fund’s assets, the fund’s performance may be adversely affected by the economic, political, regulatory and social conditions in those countries, and the fund’s price may be more volatile than the price of a fund that is geographically diversified.
Emerging Markets Risk. Certain funds invest in emerging markets. Emerging market countries may be more likely to experience political turmoil or rapid changes in market or economic conditions than more developed countries. Emerging market countries often have less uniformity in accounting, auditing, financial reporting and record keeping requirements and greater risk associated with the custody of securities. In addition, the financial stability of issuers (including governments) in emerging market countries may be more precarious than in developed countries. As a result, there may be an increased risk of illiquidity and price volatility associated with a fund’s investments in emerging market countries, which may be magnified by currency fluctuations relative to the U.S. dollar, and, at times, it may be difficult to value such investments.
Sampling Index Tracking Risk. Certain funds may not fully replicate the index and may hold securities not included in the index. As a result, a fund is subject to the risk that the investment adviser’s investment management strategy, the implementation of which is subject to a number of constraints, may not produce the intended results. Because certain funds utilize a sampling approach they may not track the return of their respective index as well as they would if the funds purchased all of the securities in their respective index.
Tracking Error Risk. As index funds, each fund seeks to track the performance of its respective index, although it may not be successful in doing so. The divergence between the performance of a fund and the index, positive or negative, is called “tracking error.” Tracking error can be caused by many factors and it may be significant.
Derivatives Risk. Each fund may use derivatives to enhance returns or hedge against market declines. Examples of derivatives are options, futures, options on futures and swaps. An option is the right, but not the obligation, to buy or sell an instrument at a specific price on or before a specific date. A future is an agreement to buy or sell a financial instrument at a specific price on a specific day. A swap is an agreement whereby two parties agree to exchange payment streams calculated in relation to a rate, index, instrument or certain securities and a predetermined amount. A fund’s use of derivatives that are subject to regulation by the Commodity Futures Trading Commission (CFTC) could cause the fund to become a commodity pool, which would require the fund to comply with certain CFTC rules.
Schwab Fundamental Index ETFs | Annual Report
Schwab Fundamental Index ETFs
Financial Notes (continued)
3. Risk Factors (continued):
A fund’s use of derivative instruments involves risks different from, or possibly greater than, the risks associated with investing directly in securities and other traditional investments. Certain of these risks, such as liquidity risk, leverage risk and market risk, are discussed elsewhere in this section. A fund’s use of derivatives is also subject to counterparty risk, lack of availability risk, valuation risk, correlation risk and tax risk. Counterparty risk is the risk that the counterparty to a derivatives transaction may not fulfill its contractual obligations either because the financial condition of the counterparty declines, or because the counterparty is otherwise unable or unwilling to perform under the contract. Lack of availability risk is the risk that suitable derivative transactions may not be available in all circumstances for risk management or other purposes. Valuation risk is the risk that a particular derivative may be valued incorrectly. Correlation risk is the risk that changes in the value of the derivative may not correlate perfectly with the underlying asset, rate or index. Tax risk is the risk that the use of derivatives may cause the fund to realize higher amounts of short-term capital gains. A fund’s use of derivatives could reduce the fund’s performance, increase the fund’s volatility, and could cause the fund to lose more than the initial amount invested.
Liquidity Risk. A fund may be unable to sell certain securities, such as illiquid securities, readily at a favorable time or price, or the fund may have to sell them at a loss.
Leverage Risk. Certain fund transactions, such as derivatives transactions, may give rise to a form of leverage and may expose a fund to greater risk. Leverage tends to magnify the effect of any decrease or increase in the value of a fund’s portfolio securities which means even a small amount of leverage can have a disproportionately large impact on the fund. The use of leverage may cause a fund to liquidate portfolio positions when it would not be advantageous to do so in order to satisfy its obligations.
Securities Lending Risk. Securities lending involves the risk of loss of rights in, or delay in recovery of, the loaned securities if the borrower fails to return the security loaned or becomes insolvent.
Concentration Risk. To the extent that a fund’s or an index’s portfolio is concentrated in the securities of issuers in a particular market, industry, group of industries, sector, country or asset class, the fund may be adversely affected by the performance of those securities, may be subject to increased price volatility and may be more vulnerable to adverse economic, market, political or regulatory occurrences affecting that market, industry, group of industries, sector, country or asset class.
Market Trading Risk. Although fund shares are listed on national securities exchanges, there can be no assurance that an active trading market for fund shares will develop or be maintained. If an active market is not maintained, investors may find it difficult to buy or sell fund shares.
Share of the Fund may Trade at Prices Other Than NAV. Fund shares may be bought and sold in the secondary market at market prices. Although it is expected that the market price of the shares of a fund will approximate the fund’s NAV, there may be times when the market price and the NAV vary significantly. An investor may pay more than NAV when buying shares of a fund in the secondary market, and an investor may receive less than NAV when selling those shares in the secondary market. The market price of fund shares may deviate, sometimes significantly, from NAV during periods of market volatility or market disruption, or as a result of other factors impacting foreign securities, including liquidity, irregular trading activity and timing differences between foreign markets where securities trade and the secondary market where fund shares are sold.
4. Affiliates and Affiliated Transactions:
Investment Adviser
Charles Schwab Investment Management, Inc., dba Schwab Asset Management, a wholly owned subsidiary of The Charles Schwab Corporation, serves as each fund’s investment adviser pursuant to the Advisory Agreement between it and the trust.
For its advisory services to the funds, the investment adviser is entitled to receive an annual management fee, payable monthly, based on a percentage of each fund’s average daily net assets as follows:
SCHWAB
FUNDAMENTAL
U.S. BROAD
MARKET
INDEX ETF | SCHWAB
FUNDAMENTAL
U.S. LARGE
COMPANY
INDEX ETF | SCHWAB
FUNDAMENTAL
U.S. SMALL
COMPANY
INDEX ETF | SCHWAB
FUNDAMENTAL
INTERNATIONAL
LARGE
COMPANY
INDEX ETF | SCHWAB
FUNDAMENTAL
INTERNATIONAL
SMALL
COMPANY
INDEX ETF | SCHWAB
FUNDAMENTAL
EMERGING
MARKETS LARGE
COMPANY
INDEX ETF |
| 0.25% | 0.25% | 0.25% | 0.25% | 0.39% | 0.39% |
Schwab Fundamental Index ETFs | Annual Report
Schwab Fundamental Index ETFs
Financial Notes (continued)
4. Affiliates and Affiliated Transactions (continued):
Other Affiliated Transactions
The professional fees related to foreign withholding tax claims discussed in financial note 2 were non-routine expenses. The investment adviser agreed to pay these professional fees, on behalf of the funds, subject to reimbursement by the funds to the extent the funds are able to successfully recover taxes withheld in the future.
For the period ended February 28, 2022, the professional fees incurred by the Schwab Fundamental International Large Company Index ETF, Schwab Fundamental International Small Company Index ETF and Schwab Fundamental Emerging Markets Large Company Index ETF were $21,692, $4,588, and $78, respectively, as shown on the Statement of Operations.
For the period ended February 28, 2022, Schwab Fundamental International Large Company Index ETF and Schwab Fundamental International Small Company Index ETF recovered previously withheld foreign taxes from Finland and Schwab Fundamental Emerging Markets Large Company Index ETF recovered previously withheld foreign taxes from Poland. The payments received by Schwab Fundamental International Large Company Index ETF, Schwab Fundamental International Small Company ETF and Schwab Fundamental Emerging Markets Large Company Index ETF amounted to $428,497, $275,626 and $271,552, respectively, and are recorded as income in each fund’s Statement of Operations. The investment adviser had paid upfront professional fees associated with recovering these foreign taxes in the amounts of $87,043, $9,705 and $11,542 for Schwab Fundamental International Large Company Index ETF, Schwab Fundamental International Small Company Index ETF and Schwab Fundamental Emerging Markets Large Company Index ETF, respectively. Those amounts have been reimbursed to the investment adviser by the Schwab Fundamental International Large Company Index ETF, Schwab Fundamental International Small Company Index ETF and Schwab Fundamental Emerging Markets Large Company Index ETF.
As of February 28, 2022, the balance of professional fees related to foreign withholding tax subject to future reimbursement by the Schwab Fundamental International Large Company Index ETF and Schwab Fundamental International Small Company Index ETF to the investment adviser was $19,528 and $4,588, respectively. Schwab Fundamental Emerging Markets Large Company Index ETF had no balance of professional fees related to foreign withholding tax subject to future reimbursement by the fund to the investment adviser.
No other amounts for additional tax reclaims are reflected in the financial statements due to the uncertainty surrounding the ultimate resolution of proceedings, the likelihood of receipt of these claims, and the potential timing of payment.
Interfund Transactions
The funds may engage in direct transactions with certain other funds in the Fund Complex (for definition refer to the Trustees and Officers section) in accordance with procedures adopted by the Board pursuant to Rule 17a-7 under the 1940 Act. When one fund is seeking to sell a security that another is seeking to buy, an interfund transaction can allow both funds to benefit by reducing transaction costs. This practice is limited to funds that share the same investment adviser, trustees and/or officers. For the period ended February 28, 2022, each fund’s purchases and sales of securities with other funds in the Fund Complex as well as any realized gains (losses) were as follows:
| | PURCHASE COST | SALE PROCEEDS | REALIZED GAINS (LOSSES) |
| Schwab Fundamental U.S. Broad Market Index ETF | $22,697,572 | $10,461,482 | ($2,121,079) |
| Schwab Fundamental U.S. Large Company Index ETF | 412,683,816 | 156,409,489 | (22,694,141) |
| Schwab Fundamental U.S. Small Company Index ETF | 287,637,098 | 81,597,336 | (6,112,775) |
| Schwab Fundamental International Large Company Index ETF | 147,099,598 | 76,387,892 | 2,130,228 |
| Schwab Fundamental International Small Company Index ETF | 56,144,704 | 43,932,531 | 4,819,817 |
| Schwab Fundamental Emerging Markets Large Company Index ETF | 86,947,292 | 19,179,788 | 2,789,552 |
Interfund Borrowing and Lending
Pursuant to an exemptive order issued by the SEC , the funds may enter into interfund borrowing and lending transactions with other funds in the Fund Complex . All loans are for temporary or emergency purposes and the interest rate to be charged will be the average of the overnight repurchase agreement rate and the short-term bank loan rate. All loans are subject to numerous conditions designed to ensure fair and equitable treatment of all participating funds. The interfund lending facility is subject to the oversight and periodic review of the Board. The funds had no interfund borrowing or lending activity during the period.
Schwab Fundamental Index ETFs | Annual Report
Schwab Fundamental Index ETFs
Financial Notes (continued)
| | 5. Other Service Providers: |
SEI Investments Distribution Co. is the principal underwriter and distributor of shares of the funds.
State Street Bank and Trust Company (State Street) serves as the funds’ transfer agent. As part of these services, the transfer agent maintains records pertaining to the sale, redemption and transfer of the funds’ shares. The transfer agent is also responsible for the order-taking function for the funds’ shares.
State Street also serves as custodian and accountant for the funds. The custodian is responsible for the daily safekeeping of securities and cash held by the funds. The funds’ accountant maintains all books and records related to the funds’ transactions.
6. Board of Trustees:
The Board may include people who are officers and/or directors of the investment adviser or its affiliates. Federal securities law limits the percentage of such “interested persons” who may serve on a trust’s board, and the trust was in compliance with these limitations throughout the report period. The trust does not pay any interested or non-interested trustees (independent trustees). The independent trustees are paid by the investment adviser. For information regarding the trustees, please refer to the Trustees and Officers table at the end of this report.
7. Borrowing from Banks:
During the period, the funds were participants with other funds in the Fund Complex in a joint, syndicated, committed $850 million line of credit (the Syndicated Credit Facility), which matured on September 30, 2021. On September 30, 2021, the Syndicated Credit Facility was amended to run for a new 364 day period with the line of credit amount remaining unchanged, maturing on September 29, 2022. Under the terms of the Syndicated Credit Facility, in addition to the investment adviser paying the interest charged on any borrowings by a fund, the investment adviser paid a commitment fee of 0.15% per annum on the funds’ proportionate share of the unused portion of the Syndicated Credit Facility.
During the period, the funds were participants with other funds in the Fund Complex in a joint, unsecured, uncommitted $400 million line of credit (the Uncommitted Credit Facility), with State Street Bank and Trust Company, which matured on September 30, 2021. On September 30, 2021, the Uncommitted Credit Facility was amended to run for a new 364 day period with the line of credit amount remaining unchanged, maturing on September 29, 2022. Under the terms of the Uncommitted Credit Facility, the investment adviser pays interest on the amount a fund borrows.
During the period, Schwab Fundamental International Large Company Index ETF borrowed from the Syndicated Credit Facility. The average daily loan balance and interest rate were $13,839,818 and 1.18%, respectively, during the 1 day borrowings were outstanding during the period. The investment adviser paid interest expense of $454 on behalf of the fund. As of February 28, 2022, Schwab Fundamental International Large Company Index ETF does not have a borrowing balance outstanding from either line of credit. No other funds borrowed from either line of credit during the period.
The funds also have access to custodian overdraft facilities. A fund may have utilized the overdraft facility and incurred an interest expense, which is paid by the investment adviser. The interest expense is determined based on a negotiated rate above the current Federal Funds Rate.
8. Derivatives:
Certain funds entered into equity index futures contracts during the report period. The funds invested in futures contracts to equitize available cash. The value and variation margin for futures contracts held at February 28, 2022 are presented in the Portfolio Holdings and Statement of Assets and Liabilities, respectively. The net realized gains (losses)and net change in unrealized appreciation (depreciation) on futures contracts are presented in the Statement of Operations. Refer to financial note 2(b) for the
Schwab Fundamental Index ETFs | Annual Report
Schwab Fundamental Index ETFs
Financial Notes (continued)
8. Derivatives (continued):
funds’ accounting policies with respect to futures contracts and financial note 3 for disclosures concerning the risks of investing in futures contracts. During the period ended February 28, 2022, the month-end average notional amounts of futures contracts held by the funds and the month-end average number of contracts held were as follows:
| | NOTIONAL AMOUNTS | NUMBER OF CONTRACTS |
| Schwab Fundamental U.S. Broad Market Index ETF | $599,799 | 3 |
| Schwab Fundamental U.S. Large Company Index ETF | 12,029,228 | 55 |
| Schwab Fundamental U.S. Small Company Index ETF | 7,015,407 | 63 |
| Schwab Fundamental International Large Company Index ETF | 29,020,065 | 256 |
| Schwab Fundamental International Small Company Index ETF | 11,829,455 | 105 |
| Schwab Fundamental Emerging Markets Large Company Index ETF | 16,997,858 | 266 |
9. Purchases and Sales of Investment Securities:
For the period ended February 28, 2022, purchases and sales of securities (excluding in-kind transactions and short-term obligations) were as follows:
| | PURCHASES
OF SECURITIES | SALES
OF SECURITIES |
| Schwab Fundamental U.S. Broad Market Index ETF | $53,471,482 | $48,356,828 |
| Schwab Fundamental U.S. Large Company Index ETF | 929,208,610 | 852,834,041 |
| Schwab Fundamental U.S. Small Company Index ETF | 1,314,538,548 | 1,136,025,240 |
| Schwab Fundamental International Large Company Index ETF | 1,075,172,610 | 1,009,411,269 |
| Schwab Fundamental International Small Company Index ETF | 775,443,934 | 729,005,824 |
| Schwab Fundamental Emerging Markets Large Company Index ETF | 1,909,031,745 | 942,843,373 |
10. In-Kind Transactions:
The consideration for the purchase of Creation Units of a fund often consists of the in-kind deposit of a designated portfolio of equity securities, which constitutes an optimized representation of the securities involved in a relevant fund’s underlying index, and an amount of cash. Investors purchasing and redeeming Creation Units are subject to a standard creation transaction fee and a standard redemption transaction fee paid to the custodian to offset transfer and other transaction costs associated with the issuance and redemption of Creation Units. Purchasers and redeemers of Creation Units for cash are subject to an additional variable charge paid to the fund that will offset the transaction costs to the fund of buying or selling portfolio securities. In addition, purchasers and redeemers of shares in Creation Units are responsible for payment of the costs of transferring securities to or out of the fund. From time to time, the investment adviser may cover the cost of any transaction fees when believed to be in the best interests of a fund.
The in-kind transactions for the period ended February 28, 2022, were as follows:
| | IN-KIND PURCHASES
OF SECURITIES | IN-KIND SALES
OF SECURITIES |
| Schwab Fundamental U.S. Broad Market Index ETF | $101,486,601 | $15,483,967 |
| Schwab Fundamental U.S. Large Company Index ETF | 3,881,918,021 | 947,040,367 |
| Schwab Fundamental U.S. Small Company Index ETF | 1,207,767,649 | 789,910,044 |
| Schwab Fundamental International Large Company Index ETF | 1,398,909,984 | 73,031,852 |
| Schwab Fundamental International Small Company Index ETF | 461,268,277 | 80,246,362 |
| Schwab Fundamental Emerging Markets Large Company Index ETF | 266,929,723 | 117,705,349 |
For the period ended February 28, 2022, where applicable, the funds realized net capital gains or losses resulting from in-kind redemptions of Creation Units. Because such gains or losses are not taxable to the funds and are not distributed to existing fund shareholders, the gains or losses are reclassified from accumulated net realized gains or losses to capital received from investors at the end of the funds’ tax year. These reclassifications have no effect on net assets or net asset values per share. The net realized in-kind gains or losses for the period ended February 28, 2022 are disclosed in the funds’ Statements of Operations, if any.
Schwab Fundamental Index ETFs | Annual Report
Schwab Fundamental Index ETFs
Financial Notes (continued)
| | 11. Federal Income Taxes: |
As of February 28, 2022, the tax basis cost of the funds’ investments and gross unrealized appreciation and depreciation were as follows:
| | TAX COST | GROSS UNREALIZED
APPRECIATION | GROSS UNREALIZED
DEPRECIATION | NET UNREALIZED
APPRECIATION
(DEPRECIATION) |
| Schwab Fundamental U.S. Broad Market Index ETF | $312,771,645 | $122,199,430 | ($10,196,595) | $112,002,835 |
| Schwab Fundamental U.S. Large Company Index ETF | 8,178,210,135 | 1,931,042,550 | (227,881,588) | 1,703,160,962 |
| Schwab Fundamental U.S. Small Company Index ETF | 4,134,679,440 | 1,005,044,642 | (259,834,238) | 745,210,404 |
| Schwab Fundamental International Large Company Index ETF | 6,504,155,670 | 1,346,693,603 | (492,873,010) | 853,820,593 |
| Schwab Fundamental International Small Company Index ETF | 2,542,350,274 | 497,133,593 | (317,927,585) | 179,206,008 |
| Schwab Fundamental Emerging Markets Large Company Index ETF | 4,550,552,695 | 1,011,445,869 | (721,650,824) | 289,795,045 |
As of February 28, 2022, the components of distributable earnings on a tax basis were as follows:
| | UNDISTRIBUTED
ORDINARY
INCOME | NET UNREALIZED
APPRECIATION
(DEPRECIATION)
ON INVESTMENTS | NET OTHER UNREALIZED
APPRECIATION
(DEPRECIATION) | CAPITAL LOSS
CARRYFORWARDS
AND OTHER LOSSES | TOTAL |
| Schwab Fundamental U.S. Broad Market Index ETF | $1,194,044 | $112,002,835 | $— | ($15,703,203) | $97,493,676 |
| Schwab Fundamental U.S. Large Company Index ETF | 29,791,110 | 1,703,160,962 | — | (300,484,124) | 1,432,467,948 |
| Schwab Fundamental U.S. Small Company Index ETF | 432,038 | 745,210,404 | — | (437,766,071) | 307,876,371 |
| Schwab Fundamental International Large Company Index ETF | 13,910,542 | 853,820,593 | 11,755 | (180,669,635) | 687,073,255 |
| Schwab Fundamental International Small Company Index ETF | 2,047,845 | 179,206,008 | (8,372) | (112,768,244) | 68,477,237 |
| Schwab Fundamental Emerging Markets Large Company Index ETF | — | 289,795,045 | (13,652,500) | (60,760,462) | 215,382,083 |
The primary difference between book basis and tax basis unrealized appreciation or unrealized depreciation of investments is the tax deferral of losses on wash sales, the realization for tax purposes of unrealized appreciation (depreciation) on futures contracts, the realization for tax purposes of unrealized appreciation on investments in PFICs and partnership investments. The tax cost of the funds’ investments, disclosed above, have been adjusted from their book amounts to reflect these unrealized appreciation or depreciation differences, as applicable.
Capital loss carryforwards have no expiration and may be used to offset future realized capital gains for federal income tax purposes. As of February 28, 2022, the funds had capital loss carryforwards available as follows:
| | |
| Schwab Fundamental U.S. Broad Market Index ETF | $15,703,203 |
| Schwab Fundamental U.S. Large Company Index ETF | 300,484,124 |
| Schwab Fundamental U.S. Small Company Index ETF | 437,766,071 |
| Schwab Fundamental International Large Company Index ETF | 180,669,635 |
| Schwab Fundamental International Small Company Index ETF | 112,768,244 |
| Schwab Fundamental Emerging Markets Large Company Index ETF | 57,024,223 |
Schwab Fundamental Index ETFs | Annual Report
Schwab Fundamental Index ETFs
Financial Notes (continued)
11. Federal Income Taxes (continued):
For the fiscal year ended February 28, 2022, the funds had capital loss carryforwards utilized as follows:
| | |
| Schwab Fundamental U.S. Broad Market Index ETF | $— |
| Schwab Fundamental U.S. Large Company Index ETF | — |
| Schwab Fundamental U.S. Small Company Index ETF | 18,828,022 |
| Schwab Fundamental International Large Company Index ETF | — |
| Schwab Fundamental International Small Company Index ETF | 15,225,915 |
| Schwab Fundamental Emerging Markets Large Company Index ETF | 63,075,905 |
For tax purposes, late-year ordinary losses may be deferred and treated as occurring on the first day of the following fiscal year. For the fiscal year ended February 28, 2022, Schwab Fundamental Emerging Markets Large Company Index ETF had ordinary losses deferred of $3,736,239.
The tax basis components of distributions paid during the current and prior fiscal years were:
| | CURRENT FISCAL YEAR END DISTRIBUTIONS | PRIOR FISCAL YEAR END DISTRIBUTIONS |
| | ORDINARY
INCOME | ORDINARY
INCOME |
| Schwab Fundamental U.S. Broad Market Index ETF | $6,475,295 | $6,024,890 |
| Schwab Fundamental U.S. Large Company Index ETF | 130,197,615 | 134,608,220 |
| Schwab Fundamental U.S. Small Company Index ETF | 56,395,300 | 51,561,985 |
| Schwab Fundamental International Large Company Index ETF | 245,365,750 | 114,361,960 |
| Schwab Fundamental International Small Company Index ETF | 68,417,380 | 38,178,680 |
| Schwab Fundamental Emerging Markets Large Company Index ETF | 210,038,530 | 87,400,780 |
Distributions paid to shareholders are based on net investment income and net realized gains determined on a tax basis, which may differ from net investment income and net realized gains for financial reporting purposes. These differences reflect the differing character of certain income items and net realized gains and losses for financial statement and tax purposes, and may result in reclassification among certain capital accounts on the financial statements. The fund may also designate a portion of the amount paid to redeeming shareholders as a distribution for tax purposes.
Permanent book and tax basis differences may result in reclassifications between components of net assets as required. The adjustments will have no impact on net assets or the results of operations.
As of February 28, 2022, management has reviewed the tax positions for open periods (for federal purposes, three years from the date of filing and for state purposes, four years from the date of filing) as applicable to the funds, and has determined that no provision for income tax is required in the funds’ financial statements. The funds recognize interest and penalties, if any, related to unrecognized tax benefits as income tax expense in the Statement of Operations. During the fiscal year ended February 28, 2022, the funds did not incur any interest or penalties.
12. Subsequent Events:
Management has determined there are no subsequent events or transactions through the date the financial statements were issued that would have materially impacted the financial statements as presented.
Schwab Fundamental Index ETFs | Annual Report
Schwab Fundamental Index ETFs
Report of Independent Registered Public Accounting Firm
To the Board of Trustees of Schwab Strategic Trust and Shareholders of Schwab Fundamental U.S. Broad Market Index ETF, Schwab Fundamental U.S. Large Company Index ETF, Schwab Fundamental U.S. Small Company Index ETF, Schwab Fundamental International Large Company Index ETF, Schwab Fundamental International Small Company Index ETF, and Schwab Fundamental Emerging Markets Large Company Index ETF:
Opinion on the Financial Statements and Financial Highlights
We have audited the accompanying statements of assets and liabilities, including the portfolio holdings, of Schwab Fundamental U.S. Broad Market Index ETF, Schwab Fundamental U.S. Large Company Index ETF, Schwab Fundamental U.S. Small Company Index ETF, Schwab Fundamental International Large Company Index ETF, Schwab Fundamental International Small Company Index ETF, and Schwab Fundamental Emerging Markets Large Company Index ETF (the “Funds”), six of the funds constituting Schwab Strategic Trust, as of February 28, 2022, and the related statements of operations for the year then ended, the statements of changes in net assets and the financial highlights for each of the two years in the period then ended, and the related notes. In our opinion, the financial statements and financial highlights present fairly, in all material respects, the financial position of each of the Funds as of February 28, 2022, and the results of their operations for the year then ended, and the changes in their net assets and the financial highlights for each of the two years in the period then ended in conformity with accounting principles generally accepted in the United States of America. The financial highlights for each of the three years in the period ended February 29, 2020 were audited by other auditors, whose report, dated April 16, 2020, expressed an unqualified opinion on such financial highlights.
Basis for Opinions
These financial statements and financial highlights are the responsibility of the Funds’ management. Our responsibility is to express an opinion on the Funds’ financial statements and financial highlights based on our audits. We are a public accounting firm registered with the Public Company Accounting Oversight Board (United States) (PCAOB) and are required to be independent with respect to the Funds in accordance with the U.S. federal securities laws and the applicable rules and regulations of the Securities and Exchange Commission and the PCAOB.
We conducted our audits in accordance with the standards of the PCAOB. Those standards require that we plan and perform the audit to obtain reasonable assurance about whether the financial statements and financial highlights are free of material misstatement, whether due to error or fraud. The Funds are not required to have, nor were we engaged to perform, an audit of their internal control over financial reporting. As part of our audits, we are required to obtain an understanding of internal control over financial reporting but not for the purpose of expressing an opinion on the effectiveness of the Funds’ internal control over financial reporting. Accordingly, we express no such opinion.
Our audits included performing procedures to assess the risks of material misstatement of the financial statements and financial highlights, whether due to error or fraud, and performing procedures that respond to those risks. Such procedures included examining, on a test basis, evidence regarding the amounts and disclosures in the financial statements and financial highlights. Our audits also included evaluating the accounting principles used and significant estimates made by management, as well as evaluating the overall presentation of the financial statements and financial highlights. Our procedures included confirmation of securities owned as of February 28, 2022, by correspondence with the custodian and brokers; when replies were not received from brokers, we performed other auditing procedures. We believe that our audits provide a reasonable basis for our opinion.
Deloitte & Touche LLP
Denver, Colorado
April 18, 2022
We have served as the auditor of one or more investment companies in the Schwab Funds Complex since 2020.
Schwab Fundamental Index ETFs | Annual Report
Schwab Fundamental Index ETFs
Other Federal Tax Information (unaudited)
The funds may elect to pass through, under section 853(a) of the Internal Revenue Code, the foreign tax credit to shareholders. For the fiscal year ended February 28, 2022, the foreign tax credit and respective foreign source income on the funds were as follows:
| | FOREIGN TAX CREDIT | FOREIGN SOURCE INCOME |
| Schwab Fundamental U.S. Broad Market Index ETF | $— | $— |
| Schwab Fundamental U.S. Large Company Index ETF | — | — |
| Schwab Fundamental U.S. Small Company Index ETF | — | — |
| Schwab Fundamental International Large Company Index ETF | 16,767,239 | 252,999,577 |
| Schwab Fundamental International Small Company Index ETF | 6,431,680 | 66,246,548 |
| Schwab Fundamental Emerging Markets Large Company Index ETF | 24,252,320 | 246,267,875 |
For corporate shareholders, the following percentage of the funds dividend distributions paid during the fiscal year ended February 28, 2022, qualify for the corporate dividends received deduction:
| | |
| Schwab Fundamental U.S. Broad Market Index ETF | 99.52% |
| Schwab Fundamental U.S. Large Company Index ETF | 99.41% |
| Schwab Fundamental U.S. Small Company Index ETF | 96.20% |
| Schwab Fundamental International Large Company Index ETF | —% |
| Schwab Fundamental International Small Company Index ETF | —% |
| Schwab Fundamental Emerging Markets Large Company Index ETF | —% |
For the fiscal year ended February 28, 2022, the funds designate the following amounts of the dividend distributions as qualified dividends for the purposes of the maximum rate under section 1(h)(11) of the Internal Revenue Code. Shareholders will be notified in January 2023 via IRS Form 1099 of the amounts for use in preparing their 2022 income tax return.
| Schwab Fundamental U.S. Broad Market Index ETF | $6,475,295 |
| Schwab Fundamental U.S. Large Company Index ETF | 130,197,615 |
| Schwab Fundamental U.S. Small Company Index ETF | 55,175,302 |
| Schwab Fundamental International Large Company Index ETF | 248,646,356 |
| Schwab Fundamental International Small Company Index ETF | 61,332,264 |
| Schwab Fundamental Emerging Markets Large Company Index ETF | 136,410,603 |
For the fiscal year ended February 28, 2022, the funds designate the following amounts as dividends eligible for the 20% qualified business income deduction under section 199A of the Internal Revenue Code. Shareholders will be notified in January 2023 via IRS Form 1099 of the amounts for use in preparing their 2022 income tax return.
| Schwab Fundamental U.S. Broad Market Index ETF | $— |
| Schwab Fundamental U.S. Large Company Index ETF | — |
| Schwab Fundamental U.S. Small Company Index ETF | 1,219,998 |
| Schwab Fundamental International Large Company Index ETF | — |
| Schwab Fundamental International Small Company Index ETF | — |
| Schwab Fundamental Emerging Markets Large Company Index ETF | — |
Schwab Fundamental Index ETFs | Annual Report
Schwab Fundamental Index ETFs
Liquidity Risk Management Program (Unaudited)
The Funds have adopted and implemented a liquidity risk management program (the “program”) as required by Rule 22e-4 under the Investment Company Act of 1940, as amended. The Funds’ Board of Trustees (the “Board”) has designated the Funds’ investment adviser, Charles Schwab Investment Management, Inc., dba Schwab Asset Management, as the administrator of the program. Personnel of the investment adviser or its affiliates conduct the day-to-day operation of the program.
Under the program, the investment adviser manages a Fund’s liquidity risk, which is the risk that the Fund could not meet shareholder redemption requests without significant dilution of remaining shareholders’ interests in the Fund. The program is reasonably designed to assess and manage a Fund’s liquidity risk, taking into consideration the Fund’s investment strategy and the liquidity of its portfolio investments during normal and reasonably foreseeable stressed conditions; its historical redemption history and shareholder concentrations; and its cash holdings and access to other funding sources, including the custodian overdraft facility and lines of credit. The investment adviser’s process of determining the degree of liquidity of each Fund’s investments is supported by third-party liquidity assessment vendors.
The Funds’ Board reviewed a report at its meeting held on September 20, 2021 prepared by the investment adviser regarding the operation and effectiveness of the program for the period June 1, 2020, through May 31, 2021, which included individual Fund liquidity risk metrics. No significant liquidity events impacting any of the Funds were noted in the report. In addition, the investment adviser provided its assessment that the program had been operating effectively in managing each Fund’s liquidity risk.
Schwab Fundamental Index ETFs | Annual Report
Schwab Fundamental Index ETFs
Trustees and Officers
The tables below give information about the trustees and officers of Schwab Strategic Trust, which includes the funds covered in this report. The “Fund Complex” includes The Charles Schwab Family of Funds, Schwab Capital Trust, Schwab Investments, Schwab Annuity Portfolios, Schwab Strategic Trust and Laudus Trust. The Fund Complex includes 103 funds.
The address for all trustees and officers is 211 Main Street, San Francisco, CA 94105. You can find more information about the trustees and officers in the Statement of Additional Information, which is available free by calling 1-877-824-5615.
| Independent Trustees |
Name, Year of Birth, and
Position(s) with the trust
(Terms of office, and
length of Time Served1) | Principal Occupations
During the Past Five Years | Number of
Portfolios in
Fund Complex
Overseen by
the Trustee | Other Directorships |
Robert W. Burns
1959
Trustee
(Trustee of Schwab Strategic Trust since 2009; The Charles Schwab Family of Funds, Schwab Investments, Schwab Capital Trust, Schwab Annuity Portfolios and Laudus Trust since 2016) | Retired/Private Investor. | 103 | None |
Nancy F. Heller
1956
Trustee
(Trustee of The Charles Schwab Family of Funds, Schwab Investments, Schwab Capital Trust, Schwab Annuity Portfolios, Schwab Strategic Trust and Laudus Trust since 2018) | Retired. | 103 | None |
David L. Mahoney
1954
Trustee
(Trustee of The Charles Schwab Family of Funds, Schwab Investments, Schwab Capital Trust, Schwab Annuity Portfolios and Laudus Trust since 2011; Schwab Strategic Trust since 2016) | Private Investor. | 103 | Director (2004 – present), Corcept Therapeutics Incorporated
Director (2009 – 2021), Adamas Pharmaceuticals, Inc.
Director (2003 – 2019), Symantec Corporation |
Jane P. Moncreiff
1961
Trustee
(Trustee of The Charles Schwab Family of Funds, Schwab Investments, Schwab Capital Trust, Schwab Annuity Portfolios, Schwab Strategic Trust and Laudus Trust since 2019) | Consultant (2018 – present), Fulham Advisers LLC (management consulting); Chief Investment Officer (2009 – 2017), CareGroup Healthcare System, Inc. (healthcare). | 103 | None |
Kiran M. Patel
1948
Trustee
(Trustee of The Charles Schwab Family of Funds, Schwab Investments, Schwab Capital Trust, Schwab Annuity Portfolios and Laudus Trust since 2011; Schwab Strategic Trust since 2016) | Retired. | 103 | Director (2008 – present), KLA-Tencor Corporation |
Schwab Fundamental Index ETFs | Annual Report
Schwab Fundamental Index ETFs
| Independent Trustees (continued) |
Name, Year of Birth, and
Position(s) with the trust
(Terms of office, and
length of Time Served1) | Principal Occupations
During the Past Five Years | Number of
Portfolios in
Fund Complex
Overseen by
the Trustee | Other Directorships |
Kimberly S. Patmore
1956
Trustee
(Trustee of The Charles Schwab Family of Funds, Schwab Investments, Schwab Capital Trust, Schwab Annuity Portfolios, Schwab Strategic Trust and Laudus Trust since 2016) | Consultant (2008 – present), Patmore Management Consulting (management consulting). | 103 | None |
J. Derek Penn
1957
Trustee
(Trustee of The Charles Schwab Family of Funds, Schwab Investments, Schwab Capital Trust, Schwab Annuity Portfolios, Schwab Strategic Trust and Laudus Trust since 2021) | Head of Equity Sales and Trading (2006 – 2018), BNY Mellon (financial services). | 103 | None |
| Interested Trustees |
Name, Year of Birth, and
Position(s) with the trust
(Terms of office, and
length of Time Served1) | Principal Occupations
During the Past Five Years | Number of
Portfolios in
Fund Complex
Overseen by
the Trustee | Other Directorships |
Walter W. Bettinger II2
1960
Chairman and Trustee
(Trustee of The Charles Schwab Family of Funds, Schwab Investments, Schwab Capital Trust and Schwab Annuity Portfolios since 2008; Schwab Strategic Trust since 2009; Laudus Trust since 2010) | Director and Chief Executive Officer (Oct. 2008 – present) and President (Feb. 2007 – Oct. 2021), The Charles Schwab Corporation; President and Chief Executive Officer (Oct. 2008 – Oct. 2021) and Director (May 2008 – Oct. 2021), Charles Schwab & Co., Inc.; Director (Apr. 2006 – present), Charles Schwab Bank, SSB; Director (Nov. 2017 – present), Charles Schwab Premier Bank, SSB; Director (July 2019 – present), Charles Schwab Trust Bank; Director (May 2008 – present) and President and Chief Executive Officer (Aug. 2017 – present), Schwab Holdings, Inc.; Director (Oct. 2020 – present), TD Ameritrade Holding Corporation; Director (July 2016 – Oct. 2021), Charles Schwab Investment Management, Inc. | 103 | Director (2008 – present), The Charles Schwab Corporation |
Joseph R. Martinetto2
1962
Trustee
(Trustee of The Charles Schwab Family of Funds, Schwab Investments, Schwab Capital Trust, Schwab Annuity Portfolios, Schwab Strategic Trust and Laudus Trust since 2016) | Chief Operating Officer (Feb. 2018 – present), The Charles Schwab Corporation; Senior Executive Vice President (July 2015 – present), Charles Schwab & Co., Inc.; Director (May 2007 – present), Charles Schwab & Co., Inc.; Director (Apr. 2010 – Apr. 2020), Charles Schwab Bank, SSB; Director (Nov. 2017 – Apr. 2020), Charles Schwab Premier Bank, SSB; Director (May 2007 – Apr. 2020), and Senior Executive Vice President (Feb. 2016 – present), Schwab Holdings, Inc.; Director (Oct. 2020 – present), TD Ameritrade Holding Corporation. | 103 | None |
Schwab Fundamental Index ETFs | Annual Report
Schwab Fundamental Index ETFs
| Officers of the Trust |
Name, Year of Birth, and Position(s) with the trust
(Terms of office, and length of Time Served3) | Principal Occupations During the Past Five Years |
Jonathan de St. Paer
1973
President and Chief Executive Officer
(Officer of The Charles Schwab Family of Funds, Schwab Investments, Schwab Capital Trust, Schwab Annuity Portfolios, Schwab Strategic Trust and Laudus Trust since 2018) | Director (Apr. 2019 – present), President (Oct. 2018 – present), Chief Operating Officer (Jan. 2020 – present), and Chief Executive Officer (Apr. 2019 – Nov. 2019), Charles Schwab Investment Management, Inc.; Senior Vice President (June 2020 – Mar. 2022) and Chief Operating Officer (Jan. 2020 – Mar. 2022), Charles Schwab Investment Advisory, Inc.; Chief Executive Officer (Apr. 2019 – present), President (Nov. 2018 – present) and Trustee (Apr. 2019 – Dec. 2020), Schwab Funds, Laudus Trust and Schwab ETFs; Director (Apr. 2019 – Apr. 2022), Charles Schwab Worldwide Funds plc and Charles Schwab Asset Management (Ireland) Limited; Senior Vice President (Apr. 2019 – present), and Senior Vice President – Strategy and Product Development (CSIM) (Jan. 2014 – Mar. 2019), Charles Schwab & Co., Inc. |
Mark Fischer
1970
Treasurer, Chief Financial Officer and Chief Operating Officer
(Officer of The Charles Schwab Family of Funds, Schwab Investments, Schwab Capital Trust, Schwab Annuity Portfolios, Schwab Strategic Trust and Laudus Trust since 2013) | Treasurer and Chief Financial Officer (Jan. 2016 – present) and Chief Operating Officer (Dec. 2020 – present), Schwab Funds, Laudus Trust and Schwab ETFs; Chief Financial Officer (Mar. 2020 – present) and Vice President (Oct. 2013 – present), Charles Schwab Investment Management, Inc.; Director (July 2020 – Apr. 2022), Charles Schwab Worldwide Funds plc and Charles Schwab Asset Management (Ireland) Limited. |
Omar Aguilar
1970
Vice President and Chief Investment Officer
(Officer of The Charles Schwab Family of Funds, Schwab Investments, Schwab Capital Trust, Schwab Annuity Portfolios, Schwab Strategic Trust and Laudus Trust since 2011) | Chief Executive Officer (Jan. 2022 – present) and Chief Investment Officer (Apr. 2011 – present), Senior Vice President (Apr. 2011 – Dec. 2021), Charles Schwab Investment Management, Inc.; Vice President and Chief Investment Officer (June 2011 – present), Schwab Funds, Laudus Trust and Schwab ETFs. |
Brett Wander
1961
Vice President and Chief Investment Officer
(Officer of The Charles Schwab Family of Funds, Schwab Investments, Schwab Capital Trust, Schwab Annuity Portfolios, Schwab Strategic Trust and Laudus Trust since 2011) | Senior Vice President and Chief Investment Officer (Apr. 2011 – present), Charles Schwab Investment Management, Inc.; Vice President and Chief Investment Officer (June 2011 – present), Schwab Funds, Laudus Trust and Schwab ETFs. |
William P. McMahon, Jr.
1972
Vice President and Chief Investment Officer
(Officer of The Charles Schwab Family of Funds, Schwab Investments, Schwab Capital Trust, Schwab Annuity Portfolios, Schwab Strategic Trust and Laudus Trust since 2021) | Senior Vice President and Chief Investment Officer (Jan. 2020 – present), Charles Schwab Investment Management, Inc.; Vice President and Chief Investment Officer (June 2021 – present), Schwab Funds, Laudus Trust and Schwab ETFs; Senior Vice President and Chief Investment Officer – ThomasPartners Strategies (Apr. 2018 – Dec. 2019), Charles Schwab Investment Advisory, Inc.; Senior Vice President and Chief Investment Officer (May 2001 – Apr. 2018), ThomasPartners, Inc. |
Catherine MacGregor
1964
Chief Legal Officer and Secretary, Schwab Funds and Schwab ETFs
Chief Legal Officer, Vice President and Clerk, Laudus Trust
(Officer of The Charles Schwab Family of Funds, Schwab Investments, Schwab Capital Trust, Schwab Annuity Portfolios and Laudus Trust since 2005; Schwab Strategic Trust since 2009) | Chief Legal Officer (Mar. 2022 – present) and Vice President (Sept. 2005 – present), Charles Schwab Investment Management, Inc.; Vice President (July 2005 – present), Charles Schwab & Co., Inc.; Vice President (Dec. 2005 – present) and Chief Legal Officer and Clerk (Mar. 2007 – present), Laudus Trust; Chief Legal Officer and Secretary (Oct. 2021 – present), Vice President (Nov. 2005 – Oct. 2021) and Assistant Secretary (June 2007 – Oct. 2021), Schwab Funds; Chief Legal Officer and Secretary (Oct. 2021 – present), Vice President and Assistant Secretary (Oct. 2009 – Oct. 2021), Schwab ETFs. |
| 1 | Each Trustee shall hold office until the election and qualification of his or her successor, or until he or she dies, resigns or is removed. The retirement policy requires that each independent trustee retire by December 31 of the year in which the Trustee turns 74 or the Trustee’s twentieth year of service as an independent trustee on any trust in the Fund Complex, whichever occurs first. |
| 2 | Mr. Bettinger and Mr. Martinetto are Interested Trustees. Mr. Bettinger is an Interested Trustee because he owns stock of The Charles Schwab Corporation (CSC), the parent company of Charles Schwab Investment Management, Inc., the investment adviser for the trusts in the Fund Complex, and is an employee of Charles Schwab & Co., Inc. (Schwab), the principal underwriter for The Charles Schwab Family of Funds, Schwab Investments, Schwab Capital Trust, Schwab Annuity Portfolios and Laudus Trust. Mr. Martinetto is an Interested Trustee because he owns stock of CSC and is an employee and director of Schwab. |
| 3 | The President, Treasurer and Secretary/Clerk hold office until their respective successors are chosen and qualified or until he or she sooner dies, resigns, is removed or becomes disqualified. Each of the other officers serves at the pleasure of the Board. |
Schwab Fundamental Index ETFs | Annual Report
Schwab Fundamental Index ETFs
144A securities These securities may be sold only to qualified institutional buyers under Securities Act Rule 144A.
American Depositary Receipt (ADR) U.S. dollar-denominated receipts issued by U.S. banks or trust companies that represent shares of foreign-based corporations.
ask See “offer.”
asset allocation The practice of dividing a portfolio among different asset classes, with each asset class assigned a particular percentage to help offset risks and rewards, based on your goals, time horizon and risk tolerance.
asset class A group of securities with similar structure and basic characteristics. Stocks, bonds and cash are the three main examples of asset classes.
authorized participant (AP) A large institutional investor that places orders for creation units with the funds’ distributor.
beta A historical measure of an investment’s volatility relative to a market index (usually the S&P 500®). The index is defined as having a beta of 1.00. Investments with a beta higher than 1.00 have been more volatile than the index; those with a beta of less than 1.00 have been less volatile.
bid The highest price at which someone is willing to buy a security.
Bloomberg US Aggregate Bond Index An index that is a broad-based benchmark measuring the performance of the U.S. investment grade, taxable bond market, including U.S. Treasuries, government-related and corporate bonds, mortgage pass-through securities, commercial mortgage-backed securities, and asset-backed securities that are publicly available for sale in the United States. To be eligible for inclusion in the index, securities must be fixed rate, non-convertible, U.S. dollar-denominated with at least $300 million or more of outstanding face value and have one or more years remaining to maturity. The index excludes certain types of securities, including tax-exempt state and local government series bonds, structured notes embedded with swaps or other special features, private placements, floating rate securities, inflation-linked bonds and Eurobonds. The index is market capitalization weighted and the securities in the index are updated on the last business day of each month.
Bloomberg US Treasury Bills 1–3 Month Index An index that includes all publicly issued zero-coupon U.S. Treasury Bills that have a remaining maturity of less than 3 months but more than 1 month, are rated investment grade and have $300 million or more of outstanding face value. It excludes zero-coupon STRIPS.
cap, capitalization See “market cap.”
capital gain, capital loss The difference between the amount paid for an investment and its value at a later time. If the investment has been sold, the capital gain or loss is considered a realized gain or loss. If the investment is still held, the gain or loss is still “on paper” and is considered unrealized.
commencement of operations The date that the first NAV was calculated.
creation unit (C.U.) A basket of securities that is delivered by an authorized participant (AP) to the fund equal to the current holdings of the ETF, plus a designated cash component. In return, the APs receive a large block of ETF shares (typically 50,000 shares), which investors can then buy and sell in the secondary market.
European Depositary Receipt (EDR) A negotiable security (receipt) that is issued by a European bank, and that represents shares of foreign-based corporations.
exchange A marketplace, or any organization or group that provides or maintains a marketplace for trading securities, options, futures, or commodities.
expense ratio The amount that is taken from the fund’s assets each year to cover the operating expenses. An expense ratio of 0.50% means that a fund’s expenses amount to half of one percent of its average net assets a year.
Global Depositary Receipt (GDR) A negotiable security (receipt) that is issued by a foreign bank, and that represents shares of foreign-based corporations.
gross domestic product (GDP) The output of goods and services produced by labor and property located in the United States.
inception date The date that the shares began trading in the secondary market.
indicative optimized portfolio value (IOPV) A calculation disseminated by the stock exchange that approximates the fund’s NAV every 15 seconds throughout the trading day.
liquidity The ability to convert a security or asset quickly into cash.
market cap, market capitalization The value of a company as determined by the total value of all shares of its stock outstanding.
market price return The return based on the change in market price per share of the fund over a given time period. Market price returns assume that dividends and capital gain distributions have been reinvested in the fund at market price.
median market cap The midpoint of the range of market caps of the stocks held by a fund. There are different ways of calculating median market cap. With a simple median, half of the stocks in the fund’s portfolio would be larger than the median, and half would be smaller. With a weighted median (the type that is calculated for these funds), half of the fund’s assets are invested in stocks that are larger than the median market cap, and half in stocks that are smaller.
MSCI EAFE Index (Net) A free float-adjusted market capitalization index that is designed to measure the equity market performance of developed markets in Europe, Australasia, and the Far East. The Net version of the index reflects reinvested dividends net of withholding taxes, but reflects no deductions for expenses or other taxes; returns are calculated applying dividend withholding rates applicable to non-resident persons who do not benefit from double taxation treaties.
MSCI Emerging Markets Index (Net) A free float-adjusted market capitalization weighted index that is designed to measure equity market performance in the global emerging markets. This series approximates the minimum possible dividend reinvestment. The returns are calculated applying dividend withholding rates applicable to non-resident persons who do not benefit from double taxation treaties.
net asset value (NAV) The value of one share of a fund. NAV is calculated by taking the fund’s total assets, subtracting liabilities, and dividing by the number of shares outstanding.
NAV return The return based on the change in NAV of the fund over a given time period. NAV returns assume that dividends and capital gain distributions have been reinvested in the fund.
offer (ask) The lowest price at which an individual is willing to sell a security.
Schwab Fundamental Index ETFs | Annual Report
Schwab Fundamental Index ETFs
open The price at which a security opened for trading on a given day.
outstanding shares, shares outstanding When speaking of the fund, indicates all shares currently held by investors.
price-to-book ratio (P/B) The market price of a company’s stock compared with its “book value.” A mutual fund’s P/B is the weighted average of the P/B of all stocks in the fund’s portfolio.
price-to-earnings ratio (P/E) The market price of a company’s stock compared with earnings over the past year. A mutual fund’s P/E is the weighted average of the P/E of all stocks in the fund’s portfolio.
primary market The market that deals with the issuance of new securities.
rights and warrants Rights and warrants are types of securities that entitle the holder to purchase a proportionate amount of common stock at a specified price for a specific period of time. Rights allow a shareholder to buy more shares directly from the company, usually at a price somewhat lower than the current market price of the outstanding shares. Warrants are usually issued with bonds and preferred stock. Rights and warrants can trade on the market separately from the company’s stock. The prices of rights and warrants do not necessarily move parallel to the prices of the underlying common stock. Rights usually expire within a few weeks of issuance, while warrants may not expire for several years. If a right or warrant is not exercised within the specified time period, it will become worthless and a fund will lose the purchase price it paid for the right or warrant and the right to purchase the underlying security.
Russell 1000 Index An index that measures the performance of the 1,000 largest companies in the Russell 3000 Index, and represents approximately 92% of the total market capitalization of the Russell 3000 Index. The Russell 3000 Index measures the performance of the largest 3,000 U.S. companies representing approximately 98% of the investable U.S. equity market.
Russell 2000 Index An index that measures the performance of the 2,000 smallest companies in the Russell 3000 Index. The Russell 3000 Index measures the performance of the largest 3,000 U.S. companies representing approximately 98% of the investable U.S. equity market.
Russell RAFI Developed ex US Large Company Index (Net) An index that ranks developed ex-U.S. companies in the FTSE Global Total Cap Index by fundamental measures of size and tracks the performance of those companies whose fundamental scores are in the top 87.5%. The index uses a partial quarterly reconstitution methodology in which the index is split into four equal segments at the annual reconstitution and each segment is then rebalanced on a rolling quarterly basis. The Net series reduces index performance by adjusting for local taxes. Selecting the developed ex-U.S. companies in the FTSE Global Total Cap Index measures the performance of the largest investable securities in developed countries globally, excluding companies assigned to the United States.
Russell RAFI Developed ex US Small Company Index (Net) An index that ranks developed ex-U.S. companies in the FTSE Global Total Cap Index by fundamental measures of size and tracks the performance of those companies whose fundamental scores rank below the 87.5% threshold. The index uses a partial quarterly reconstitution methodology in which the index is split into four equal segments at the annual reconstitution and each segment is then rebalanced on a rolling quarterly basis. The Net series reduces index performance by adjusting for local taxes. Selecting the developed ex-U.S. companies in the FTSE Global Total Cap Index measures the performance of the smallest investable securities in developed countries globally, excluding companies assigned to the United States.
Russell RAFI Emerging Markets Large Company Index (Net) An index that ranks emerging market companies in the FTSE Global Total Cap Index by measures of fundamental size and tracks the performance of those companies whose fundamental scores are in the top 87.5%. The index uses a partial quarterly reconstitution methodology in which the index is split into four equal segments at the annual reconstitution and each segment is then rebalanced on a rolling quarterly basis. The Net series reduces index performance by adjusting for local taxes. Selecting the emerging companies in the FTSE Global Total Cap Index measures the performance of the investable securities in emerging countries globally.
Russell RAFI US Index An index that selects, ranks, and weights securities by fundamental measures of company size rather than market capitalization. The index measures the performance of the constituent companies by fundamental overall company scores, which are created using as the universe U.S. companies in the FTSE Global Total Cap Index. Securities are grouped in order of decreasing company score and each company receives a weight based on its percentage of the total scores of the companies. The index uses a partial quarterly reconstitution methodology in which the index is split into four equal segments at the annual reconstitution and each segment is then rebalanced on a rolling quarterly basis.
Russell RAFI US Large Company Index An index that ranks U.S. companies in the FTSE Global Total Cap Index. The Russell RAFI US Large Company Index includes only those securities that are members of the U.S. portion whose fundamental scores are in the top 87.5%. The index uses a partial quarterly reconstitution methodology in which the index is split into four equal segments at the annual reconstitution and each segment is then rebalanced on a rolling quarterly basis.
Russell RAFI US Small Company Index An index that ranks U.S. companies in the FTSE Global Total Cap Index. The Russell RAFI US Small Company Index includes only those securities that are members of the U.S. portion and rank below the 87.5% fundamental score threshold. The index uses a partial quarterly reconstitution methodology in which the index is split into four equal segments at the annual reconstitution and each segment is then rebalanced on a rolling quarterly basis.
S&P 500 Index An index that is designed to measure the performance of 500 leading publicly traded companies from a broad range of industries.
S&P Developed ex-U.S. Small Cap Index (Net) An index composed of the stocks representing the lowest 15% of float-adjusted market cap in each developed market country, excluding the U.S. The returns are calculated applying dividend withholding rates applicable to non-resident persons who do not benefit from double taxation treaties.
sampling If a fund uses a sampling method, the fund will not fully replicate the benchmark index and may hold securities not included in the index. A fund that utilizes a sampling approach may not track the return of the index.
secondary market The market in which investors purchase securities from other investors rather than directly from the issuing companies. Organized exchanges facilitate the trading of securities in the secondary market.
spread The gap between bid and ask prices of a security.
stock A share of ownership, or equity, in the issuing company.
total return The percentage that an investor would have earned or lost on an investment in the fund assuming dividends and distributions were reinvested.
tracking error The difference between the performance of the fund and its benchmark index, positive or negative.
Schwab Fundamental Index ETFs | Annual Report
Schwab Fundamental Index ETFs
Schwab ETFs
Schwab ETFs are designed to serve as simple low-cost core investment products for a diversified portfolio. These ETFs seek to provide consistent, repeatable performance through a variety of investment strategies that span the equity and fixed income spectrum. The list below shows all currently available Schwab ETFs.
Investors should carefully consider information contained in the prospectus, or if available, the summary prospectus, including investment objectives, risks, charges and expenses before investing. Please call 1-877-824-5615 for a prospectus for any Schwab ETF. Please read the prospectus carefully before you invest. This report must be preceded or accompanied by a current prospectus.
Proxy Voting Policies, Procedures and Results
A description of the proxy voting policies and procedures used to determine how to vote proxies on behalf of the funds is available without charge, upon request, by visiting the Schwab ETFs’ website at www.schwabassetmanagement.com/schwabetfs_prospectus, the SEC’s website at www.sec.gov, or by contacting Schwab ETFs at 1-877-824-5615.
Information regarding how a fund voted proxies relating to portfolio securities during the most recent twelve-month period ended June 30 is available, without charge, by visiting the fund’s website at www.schwabassetmanagement.com/schwabetfs_prospectus or the SEC’s website at www.sec.gov.
U.S. ETFs
Schwab U.S. Broad Market ETF
Schwab 1000 Index® ETF
Schwab U.S. Large-Cap ETF
Schwab U.S. Large-Cap Growth ETF
Schwab U.S. Large-Cap Value ETF
Schwab U.S. Mid-Cap ETF
Schwab U.S. Small-Cap ETF
Schwab U.S. Dividend Equity ETF
Schwab U.S. REIT ETF
International ETFs
Schwab International Dividend Equity ETF
Schwab International Equity ETF
Schwab International Small-Cap Equity ETF
Schwab Emerging Markets Equity ETF
Fixed-Income ETFs
Schwab U.S. TIPS ETF
Schwab Short-Term U.S. Treasury ETF
Schwab Intermediate-Term U.S. Treasury ETF
Schwab Long-Term U.S. Treasury ETF
Schwab U.S. Aggregate Bond ETF
Schwab 1-5 Year Corporate Bond ETF
Schwab 5-10 Year Corporate Bond ETF
Fundamental Index* ETFs
Schwab Fundamental U.S. Broad Market Index ETF
Schwab Fundamental U.S. Large Company Index ETF
Schwab Fundamental U.S. Small Company Index ETF
Schwab Fundamental International Large Company Index ETF
Schwab Fundamental International Small Company Index ETF
Schwab Fundamental Emerging Markets Large Company
Index ETF
Active, Semi-Transparent (Also Known As Non-Transparent) ETF
Schwab Ariel ESG ETF
Investment Adviser
Charles Schwab Investment Management, Inc., dba Schwab Asset Management
211 Main Street, San Francisco, CA 94105
Schwab ETFs
1-877-824-5615
© 2022 Charles Schwab Investment Management, Inc., dba Schwab Asset Management. All rights reserved.
Printed on recycled paper.
| * | FUNDAMENTAL INDEX is a registered trademark of Research Affiliates LLC. |
The Schwab Ariel ESG ETF is different from traditional ETFs. Traditional ETFs tell the public what assets they hold each day. This fund will not. This may create additional risks for your investment. For example:
| • | You may have to pay more money to trade the fund’s shares. This fund will provide less information to traders, who tend to charge more for trades when they have less information. |
| • | The price you pay to buy fund shares on an exchange may not match the value of the fund’s portfolio. The same is true when you sell shares. These price differences may be greater for this fund compared to other ETFs because it provides less information to traders. |
| • | These additional risks may be even greater in bad or uncertain market conditions. |
| • | The ETF will publish on its website each day a “Proxy Portfolio” designed to help trading in shares of the ETF. While the Proxy Portfolio includes some of the ETF’s holdings, it is not the ETF’s actual portfolio. |
The differences between this fund and other ETFs may also have advantages. By keeping certain information about the fund secret, this fund may face less risk that other traders can predict or copy its investment strategy. This may improve the fund’s performance. If other traders are able to copy or predict the fund’s investment strategy, however, this may hurt the fund’s performance.
For additional information regarding the unique attributes and risks of the fund, see Proxy Portfolio Risk, Premium/Discount Risk, Trading Halt Risk, Authorized Participant Concentration Risk, Tracking Error Risk and Shares of the Fund May Trade at Prices Other Than NAV in the Principal Risks and Proxy Portfolio and Proxy Overlap sections of the prospectus and/or the Statement of Additional Information. These risks are discussed on the next page.
Schwab Fundamental Index ETFs
Active semi-transparent ETFs operate differently from other exchange-traded funds (ETFs). Unlike other ETFs, an active semi-transparent ETF does not publicly disclose its entire portfolio composition each business day, which may affect the price at which shares of the ETF trade in the secondary market. Active semi-transparent ETFs have limited public trading history. There can be no assurance that an active trading market will develop, be maintained or operate as intended. There is a risk that the market price of an active semi-transparent ETF may vary significantly from the ETF’s net asset value and that its shares may trade at a wider bid/ask spread and, therefore, cost investors more to trade than shares of other ETFs. These risks are heightened during periods of market disruption or volatility.
Proxy Portfolio Risk: Unlike traditional ETFs, this fund does not disclose its portfolio holdings (Actual Portfolio) daily. The fund instead posts a Proxy Portfolio on its website each day. The Proxy Portfolio is designed to reflect the economic exposures and risk characteristics of the fund’s actual holdings on each trading day, but it is not the same as the fund’s Actual Portfolio. Although the Proxy Portfolio is intended to provide investors with enough information to allow for an effective arbitrage mechanism that will keep the market price of the Fund at or close to the underlying NAV per Share of the Fund, there is a risk (which may increase during periods of market disruption or volatility) that market prices will vary significantly from the underlying NAV of the fund. ETF trading on the basis of a published Proxy Portfolio may trade at a wider bid/ask spread than ETFs that publish their portfolios on a daily basis, especially during periods of market disruption or volatility, and therefore may cost investors more to trade. Also, while the Fund seeks to benefit from keeping its portfolio information secret, market participants may attempt to use the Proxy Portfolio to identify a Fund’s trading strategy, which if successful, could result in such market participants engaging in certain predatory trading practices that may have the potential to harm the Fund and its shareholders.
Proxy Portfolio Construction: The Proxy Portfolio is designed to recreate the daily performance of the Actual Portfolio. This is achieved by performing a “Factor Model” analysis of the Actual Portfolio. The Factor Model is comprised of three sets of factors or analytical metrics: market-based factors, fundamental factors, and industry/sector factors. The fund uses a “Model Universe” to generate its Proxy Portfolio. The Model Universe is comprised of securities that the fund can purchase and will be a financial index or stated portfolio of securities from which fund investments will be selected. The results of the Factor Model analysis are then applied to the Model Universe. The Proxy Portfolio is then generated as a result of this Model Universe analysis with the Proxy Portfolio being a small sub-set of the Model Universe. The Factor Model is applied to both the Actual Portfolio and the Model Universe to construct the fund’s Proxy Portfolio that performs in a manner substantially identical to the performance of its Actual Portfolio.
The Proxy Portfolio will only include investments the fund is permitted to hold. The fund’s SAI contains more information on the Proxy Portfolio and its construction. Proxy Portfolio and Proxy Overlap Information regarding the contents of the Proxy Portfolio, and the percentage weight overlap between the holdings of the Proxy Portfolio and a Fund’s Actual Portfolio holdings that formed the basis for its calculation of NAV at the end of the prior Business Day (the Portfolio Overlap), is available by visiting the fund’s website www.schwabassetmanagement.com.
Because environmental, social and governance (ESG) strategies exclude some securities, ESG-focused products may not be able to take advantage of the same opportunities or market trends as products that do not use such strategies. Additionally, the criteria used to select companies for investment may result in investing in securities, industries or sectors that underperform the market as a whole.
This page is intentionally left blank.
Item 2: Code of Ethics.
| (a) | Registrant has adopted a code of ethics that applies to its principal executive officer, principal financial officer, and any other persons who perform a similar function, regardless of whether these individuals are employed by Registrant or a third party. |
| (c) | During the period covered by the report, no amendments were made to the provisions of this code of ethics. |
| (d) | During the period covered by the report, Registrant did not grant any waivers, including implicit waivers, from the provisions of this code of ethics. |
| (f)(1) | Registrant has filed this code of ethics as an exhibit pursuant to Item 13(a)(1) of Form N-CSR. |
Item 3: Audit Committee Financial Expert.
Registrant’s Board of Trustees has determined that Kiran M. Patel, Kimberly S. Patmore and J. Derek Penn, each currently serving on its audit, compliance and valuation committee, are each an “audit committee financial expert,” as such term is defined in Item 3 of Form N-CSR. Each member of Registrant’s audit, compliance and valuation committee is “independent” under the standards set forth in Item 3 of Form N-CSR.
The designation of each of Mr. Patel, Ms. Patmore and Mr. Penn as an “audit committee financial expert” pursuant to Item 3 of Form N-CSR does not (i) impose upon such individual any duties, obligations, or liability that are greater than the duties, obligations and liability imposed upon such individual as a member of Registrant’s audit, compliance and valuation committee or Board of Trustees in the absence of such designation; and (ii) affect the duties, obligations or liability of any other member of Registrant’s audit, compliance and valuation committee or Board of Trustees.
Item 4: Principal Accountant Fees and Services.
Registrant is composed of twenty-seven operational series. Seven series have a fiscal year-end of the last day of February, whose annual financial statements are reported in Item 1, one has a fiscal year-end of March 31, twelve series have a fiscal year-end of August 31, and seven series have a fiscal year-end of December 31. Principal accountant fees disclosed in Items 4(a)-(d) and 4(g) include fees billed for services rendered to each of the twenty-seven operational series during 2021/2022 and the twenty-five operational series during 2020/2021, based on their respective 2021/2022 and 2020/2021 fiscal years, as applicable.
The following table presents fees billed by the principal accountant in each of the last two fiscal years for the services rendered to the Funds:
| | | | | | | | | | | | | | | | | | | | | | | | | | | | |
(a) Audit Fees1 | | | (b) Audit-Related Fees | | | (c) Tax Fees2 | | | (d) All Other Fees | |
Fiscal Year 2021/2022 | | Fiscal
Year
2020/2021 | | | Fiscal
Year
2021/2022 | | | Fiscal
Year
2020/2021 | | | Fiscal
Year
2021/2022 | | | Fiscal
Year
2020/2021 | | | Fiscal
Year
2021/2022 | | | Fiscal
Year
2020/2021 | |
$468,400 | | $ | 450,900 | | | $ | 0 | | | $ | 0 | | | $ | 83,700 | | | $ | 77,500 | | | $ | 0 | | | $ | 0 | |
| 1 | The nature of the services includes audit of the registrant’s annual financial statements and normally provided services in connection with regulatory filings for those fiscal years. |
| 2 | The nature of the services includes tax compliance, tax advice and tax planning. |
(e) (1) Registrant’s audit, compliance and valuation committee does not have pre-approval policies and procedures as described in paragraph (c)(7) of Rule 2-01 of Regulation S-X.
(2) There were no services described in each of paragraphs (b) through (d) above (including services required to be approved by Registrant’s audit, compliance and valuation committee pursuant to paragraph (c)(7)(ii) of Rule 2-01 of Regulation S-X) that were approved by Registrant’s audit, compliance and valuation committee pursuant to paragraph (c)(7)(i)(C) of Rule 2-01 of Regulation S-X.
(f) Not applicable.
(g) Below are the aggregate non-audit fees billed in each of the last two fiscal years by Registrant’s principal accountant for services rendered to Registrant, to Registrant’s investment adviser, and to any entity controlling, controlled by, or under common control with Registrant’s investment adviser that provides ongoing services to Registrant.
2021/2022: $2,523,317 2020/2021: $4,326,956
(h) During the past fiscal year, all non-audit services provided by Registrant’s principal accountant to either Registrant’s investment adviser or to any entity controlling, controlled by, or under common control with Registrant’s investment adviser that provides ongoing services to Registrant were pre-approved. Included in the audit, compliance and valuation committee’s pre-approval was the review and consideration as to whether the provision of these non-audit services is compatible with maintaining the principal accountant’s independence.
Item 5: Audit Committee of Listed Registrants.
The Registrant is a listed issuer as defined in Rule 10A-3 under the Exchange Act and has separately-designated standing audit, compliance and valuation committee established in accordance with Section 3(a)(58)(A) of the Exchange Act. The Registrant’s audit, compliance and valuation committee members are Kiran M. Patel, J. Derek Penn and Kimberly S. Patmore.
Item 6: Schedule of Investments.
The schedules of investments are included as part of the report to shareholders filed under Item 1 of this Form.
Item 7: Disclosure of Proxy Voting Policies and Procedures for Closed-End Management Investment Companies.
Not applicable.
Item 8: Portfolio Managers of Closed-End Management Investment Companies.
Not applicable.
Item 9: Purchases of Equity Securities by Closed-End Management Investment Company and Affiliated Purchasers.
Not applicable.
Item 10: Submission of Matters to a Vote of Security Holders.
Not applicable.
Item 11: Controls and Procedures.
| (a) | Based on their evaluation of Registrant’s disclosure controls and procedures, as of a date within 90 days of the filing date, Registrant’s Chief Executive Officer, Jonathan de St. Paer and Registrant’s Chief Financial Officer, Mark Fischer, have concluded that Registrant’s disclosure controls and procedures are: (i) reasonably designed to ensure that information required to be disclosed in this report is appropriately communicated to Registrant’s officers to allow timely decisions regarding disclosures required in this report; (ii) reasonably designed to ensure that information required to be disclosed in this report is recorded, processed, summarized and reported in a timely manner; and (iii) are effective in achieving the goals described in (i) and (ii) above. |
| (b) | During the period covered by this report, there have been no changes in Registrant’s internal control over financial reporting that the above officers believe to have materially affected, or to be reasonably likely to materially affect, Registrant’s internal control over financial reporting. |
Item 12: Disclosure of Securities Lending Activities for Closed-End Management Investment Companies.
Not applicable.
Item 13: Exhibits.
Pursuant to the requirements of the Securities Exchange Act of 1934 and the Investment Company Act of 1940, the registrant has duly caused this report to be signed on its behalf by the undersigned, thereunto duly authorized.
(Registrant) Schwab Strategic Trust – Schwab U.S. REIT ETF and Schwab Fundamental Index ETFs
| | |
| By: | | /s/ Jonathan de St. Paer |
| | Jonathan de St. Paer Chief Executive Officer |
| |
| Date: | | April 18, 2022 |
Pursuant to the requirements of the Securities Exchange Act of 1934 and the Investment Company Act of 1940, this report has been signed below by the following persons on behalf of the registrant and in the capacities and on the dates indicated.
| | |
| By: | | /s/ Jonathan de St. Paer |
| | Jonathan de St. Paer Chief Executive Officer |
| |
| Date: | | April 18, 2022 |
| | |
| By: | | /s/ Mark Fischer |
| | Mark Fischer Chief Financial Officer |
| |
| Date: | | April 18, 2022 |