UNITED STATES
SECURITIES AND EXCHANGE COMMISSION
Washington, D.C. 20549
FORM N-CSRS
CERTIFIED SHAREHOLDER REPORT OF REGISTERED
MANAGEMENT INVESTMENT COMPANIES
Investment Company Act file number: 811-22311
Schwab Strategic Trust – Schwab U.S. REIT ETF
(Exact name of registrant as specified in charter)
211 Main Street, San Francisco, California 94105
(Address of principal executive offices) (Zip code)
Jonathan de. St. Paer
Schwab Strategic Trust - Schwab U.S. REIT ETF
211 Main Street, San Francisco, California 94105
(Name and address of agent for service)
Registrant’s telephone number, including area code: (415) 636-7000
Date of fiscal year end: February 28
Date of reporting period: August 31, 2022
Item 1: Report(s) to Shareholders.
Semiannual Report | August 31, 2022
Schwab U.S. REIT ETF
Ticker Symbol SCHH
This page is intentionally left blank.
Fund investment adviser: Charles Schwab Investment Management, Inc., dba Schwab Asset ManagementTM
Distributor: SEI Investments Distribution Co. (SIDCO)
The Sector/Industry classifications in this report use the Global Industry Classification Standard (GICS) which was developed by and is the exclusive property of MSCI Inc. (MSCI) and Standard & Poor’s (S&P). GICS is a service mark of MSCI and S&P and has been licensed for use by Charles Schwab & Co., Inc. The Industry classifications used in the Portfolio Holdings are sub-categories of Sector classifications.
Schwab U.S. REIT ETF | Semiannual Report
The performance data quoted represents past performance. Past performance does not guarantee future results. Investment return and principal value of an investment will fluctuate so that an investor’s shares, when sold or redeemed, may be worth more or less than the original cost. Current performance may be lower or higher than the performance quoted. To obtain performance information current to the most recent month end, please visit www.schwabassetmanagement.com/schwabetfs_prospectus.
| Total Returns for the 6 Months Ended August 31, 2022 |
| Schwab U.S. REIT ETF (Ticker Symbol: SCHH) | |
| Market Price Return1 | -6.74% |
| NAV Return1 | -6.81% |
| Dow Jones Equity All REIT Capped Index | -6.78% |
| ETF Category: Morningstar Real Estate2 | -8.83% |
| Performance Details | pages 6-7 |
All total returns on this page assume dividends and distributions were reinvested. Index figures do not include trading and management costs, which would lower performance. Indices are unmanaged and cannot be invested in directly. Performance results less than one year are not annualized.
For index definitions, please see the Glossary.
Small-company stocks are subject to greater volatility than many other asset classes.
The fund is subject to risks associated with the direct ownership of real estate securities and an investment in the fund will be closely linked to the performance of the real estate markets.
Performance does not reflect the deduction of taxes that a shareholder would pay on fund distributions or on the redemption or sale of fund shares.
Shares are bought and sold at market price, which may be higher or lower than the net asset value (NAV). Brokerage commissions will reduce returns.
Index ownership — Dow Jones® is a registered trademark of Dow Jones Trademark Holdings LLC (Dow Jones). The Dow Jones Equity All REIT Capped Index (the Index) is a product of S&P Dow Jones Indices LLC, and the trademark and Index have been licensed for use by Charles Schwab Investment Management, Inc. The Schwab U.S. REIT ETF is not sponsored, endorsed, sold or promoted by S&P Dow Jones Indices LLC, Dow Jones, or any of their respective affiliates and neither S&P Dow Jones Indices LLC, Dow Jones, nor any of their respective affiliates make any representation regarding the advisability of investing in such product.
| 1 | ETF performance must be shown based on both a market price and NAV basis. The fund’s per share NAV is the value of one share of the fund. NAV is calculated by taking the fund’s total assets (including the fair value of securities owned), subtracting liabilities, and dividing by the number of shares outstanding. The NAV Return is based on the NAV of the fund, and the Market Price Return is based on the market price per share of the fund. The price used to calculate market return (Market Price) is determined using the Official Closing Price on the primary stock exchange (generally, 4:00 p.m. Eastern time) and may not represent the returns you would receive if shares were traded at other times. Market Price and NAV returns assume that dividends and capital gain distributions have been reinvested in the fund at Market Price and NAV, respectively. |
| 2 | Source for category information: Morningstar, Inc. The Morningstar Category return represents all passively- and actively-managed ETFs and mutual funds within the category as of the report date. |
Schwab U.S. REIT ETF | Semiannual Report
The Investment Environment
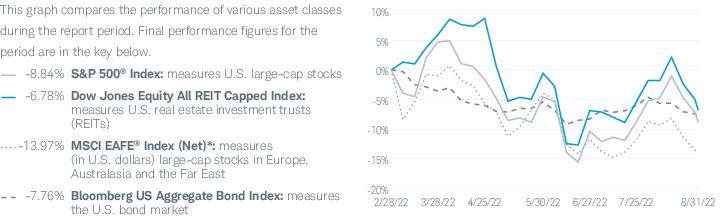
For the six-month reporting period ended August 31, 2022, U.S. equity markets lost ground as a result of accelerating inflation, rising interest rates, and geopolitical tensions, including the war in Ukraine. Albeit decelerating, COVID-19 continued to weigh on economies worldwide, with highly transmissible variants and subvariants keeping infection rates high in many areas. Economic growth around the world slowed and recession fears rose. For the reporting period, the Dow Jones Equity All REIT Capped Index, which represents U.S. real estate investment trusts (REITs), returned -6.78% and the FTSE EPRA Nareit Global Index (Net)*, which represents general trends in eligible real estate securities worldwide, returned -13.17%. During the same period, the S&P 500® Index, a bellwether for the overall U.S. stock market, returned -8.84%.
After recovering strongly from severe pressure early in the COVID-19 pandemic, U.S. REITs began to weaken early in the reporting period as inflation continued to rise and the U.S. Federal Reserve (Fed) began raising interest rates, dampening demand. REITs hit their reporting-period low in mid-June 2022, when they began to rebound, but in the final days of the reporting period slumped again as the Fed reiterated its intentions to further raise interest rates. Among REIT sub-industries in the Dow Jones Equity All REIT Capped Index, all but one—specialized REITs—lost ground for the reporting period. The weakest sub-industry was office REITs, which continued to suffer as remote work environments continued to gain momentum. Residential REITs were also comparatively weak, as rising mortgage rates drove homebuyers to the sidelines and inventories rose.
Amid fading government stimuli, ongoing supply chain disruptions, persisting inflation, a tight labor market, and a widening U.S. trade deficit, U.S. gross domestic product (GDP) decreased at an annualized rate of -1.6% for the first quarter of 2022, followed by a decrease at annualized rate of -0.6% for the second quarter of 2022. The unemployment rate remained near pre-pandemic lows over the reporting period. Inflation remained stubbornly high due to imbalances in the labor market, supply chain bottlenecks, and soaring energy costs.
Monetary policies around the world varied. In the United States, after maintaining the federal funds rate in a range of 0.00% to 0.25% through mid-March 2022, the Fed shifted its stance as inflation continued to rise and indicators of economic activity and employment continued to strengthen. After issuing successively stronger signals that interest rates could begin to rise sooner in 2022 than previously anticipated, the Fed increased the federal funds rate by 0.25% in mid-March, 0.50% in early May, 0.75% in mid-June, and 0.75% in late July in an effort to achieve a return to price
Asset Class Performance Comparison % returns during the 6 months ended August 31, 2022
Index figures assume dividends and distributions were reinvested. Index figures do not include trading and management costs, which would lower performance. Indices are unmanaged and cannot be invested in directly. Performance results less than one year are not annualized. Past performance is not a guarantee of future results.
For index definitions, please see the Glossary.
Data source: Index provider websites and Schwab Asset Management.
Nothing in this report represents a recommendation of a security by the investment adviser.
Management views may have changed since the report date.
| * | The net version of the index reflects reinvested dividends net of withholding taxes but reflects no deductions for expenses or other taxes. |
Schwab U.S. REIT ETF | Semiannual Report
The Investment Environment (continued)
stability. The federal funds rate ended the reporting period in a range of 2.25% to 2.50%. The Fed also set expectations for further rate hikes by the end of 2022. In addition, the Fed ended its bond-buying program in early March 2022. In June, the Fed began to reduce the $9 trillion in assets it holds on its balance sheet, vowing to be even more aggressive than during its last round of quantitative tightening in 2017 through 2019.
Schwab U.S. REIT ETF | Semiannual Report
 | Christopher Bliss, CFA, Managing Director and Head of Passive Equity Strategies for Schwab Asset Management, is responsible for overseeing the investment process and portfolio management of investment strategies for passive equity Schwab Funds and Schwab ETFs. Before joining Schwab in 2016, Mr. Bliss spent 12 years at BlackRock (formerly Barclays Global Investors) managing and leading institutional index teams, most recently as a managing director and the head of the Americas institutional index team. In this role, Mr. Bliss was responsible for overseeing a team of portfolio managers managing domestic, developed international and emerging markets index strategies. Prior to BlackRock, he worked as an equity analyst and portfolio manager for Harris Bretall and before that, as a research analyst for JP Morgan. |
 | Jeremy Brown, CFA, Senior Portfolio Manager, is responsible for the day-to-day co-management of the fund. Prior to joining Schwab in 2017, Mr. Brown spent six years with ALPS Advisors, Inc. in Denver, most recently as a senior analyst on the ETF portfolio management and research team where he performed portfolio management, trading, and analytics/research functions for ALPS ETFs and passive funds. Additionally, Mr. Brown led a number of investment research, commentary, industry trend analysis, and sales and marketing support initiatives. |
 | Ferian Juwono, CFA, Senior Portfolio Manager, is responsible for the day-to-day co-management of the fund. Prior to joining Schwab in 2010, Mr. Juwono worked at BlackRock (formerly Barclays Global Investors) where he spent more than three years as a portfolio manager, managing equity index funds for institutional clients, and two years as a senior business analyst. Prior to that, Mr. Juwono worked for more than four years as a senior financial analyst with Union Bank of California. |
 | Sabya Sinha, Portfolio Manager, is responsible for the day-to-day co-management of the fund. Prior to joining Schwab in 2015, Mr. Sinha spent a year at F-Squared Investments on the product development and analytics team. Prior to F-Squared, he worked at IndexIQ Advisors as a senior index portfolio manager for three years and for Bank of America’s Columbia Management subsidiary as a portfolio manager for three years. Mr. Sinha also spent time as a software consultant at DPM Mellon, LLC and an equity trader at Jane Street Capital. |
Schwab U.S. REIT ETF | Semiannual Report
The performance data quoted represents past performance. Past performance does not guarantee future results. Investment return and principal value of an investment will fluctuate so that an investor’s shares, when sold or redeemed, may be worth more or less than the original cost. Current performance may be lower or higher than the performance quoted. To obtain performance information current to the most recent month end, please visit www.schwabassetmanagement.com/schwabetfs_prospectus.
Average Annual Total Returns1
| Fund and Inception Date | 6 Months | 1 Year | 5 Years | 10 Years |
| Fund: Schwab U.S. REIT ETF (1/13/11) | | | | |
| Market Price Return2 | -6.74% | -9.97% | 3.59% | 6.03% |
| NAV Return2 | -6.81% | -10.01% | 3.59% | 6.03% |
| Dow Jones Equity All REIT Capped Index3 | -6.78% | -9.95% | N/A | N/A |
| REIT Spliced Index | -6.78% | -9.95% | 3.61% | 6.11% |
| ETF Category: Morningstar Real Estate4 | -8.83% | -11.53% | 5.28% | 6.93% |
| Fund Expense Ratio5: 0.07% |
All total returns on this page assume dividends and distributions were reinvested. Index figures do not include trading and management costs, which would lower performance. Indices are unmanaged and cannot be invested in directly. Performance results less than one year are not annualized.
The first index listed for the fund is the fund’s primary benchmark, as shown in the prospectus. Additional indices shown are provided for comparative purposes.
For index definitions, please see the Glossary.
Small-company stocks may be subject to greater volatility than many other asset classes.
The fund is subject to risks associated with the direct ownership of real estate securities, and an investment in the fund will be closely linked to the performance of the real estate markets.
Shares are bought and sold at market price, which may be higher or lower than the net asset value (NAV). Brokerage commissions will reduce returns.
Index ownership — Dow Jones® is a registered trademark of Dow Jones Trademark Holdings LLC (Dow Jones). The Dow Jones Equity All REIT Capped Index (the Index) is a product of S&P Dow Jones Indices LLC, and the trademark and Index have been licensed for use by Charles Schwab Investment Management, Inc. The Schwab U.S. REIT ETF is not sponsored, endorsed, sold or promoted by S&P Dow Jones Indices LLC, Dow Jones, or any of their respective affiliates and neither S&P Dow Jones Indices LLC, Dow Jones, nor any of their respective affiliates make any representation regarding the advisability of investing in such product.
| 1 | Performance does not reflect the deduction of taxes that a shareholder would pay on fund distributions or on the redemption or sale of fund shares. |
| 2 | ETF performance must be shown based on both a market price and NAV basis. The fund’s per share NAV is the value of one share of the fund. NAV is calculated by taking the fund’s total assets (including the fair value of securities owned), subtracting liabilities, and dividing by the number of shares outstanding. The NAV Return is based on the NAV of the fund, and the Market Price Return is based on the market price per share of the fund. The price used to calculate market return (Market Price) is determined using the Official Closing Price on the primary stock exchange (generally, 4:00 p.m. Eastern time) and may not represent the returns you would receive if shares were traded at other times. NAV is used as a proxy for purposes of calculating Market Price Return on inception date. Market Price and NAV returns assume that dividends and capital gain distributions have been reinvested in the fund at Market Price and NAV, respectively. |
| 3 | The inception date of the Dow Jones Equity All REIT Capped Index is April 13, 2020. The fund began tracking the index on June 22, 2020. |
| 4 | Source for category information: Morningstar, Inc. The Morningstar Category return represents all passively- and actively-managed ETFs and mutual funds within the category as of the report date. |
| 5 | As stated in the prospectus. |
Schwab U.S. REIT ETF | Semiannual Report
Performance and Fund Facts as of August 31, 2022
| Number of Holdings | 135 |
| Weighted Average Market Cap (millions) | $39,379 |
| Price/Earnings Ratio (P/E) | 30.5 |
| Price/Book Ratio (P/B) | 2.3 |
| Portfolio Turnover Rate | 3% 2,3 |
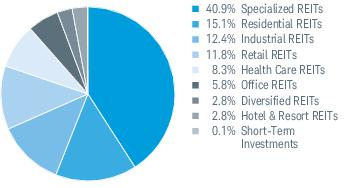
Industry Weightings % of Investments4
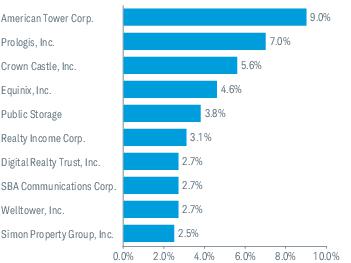
Top Equity Holdings % of Net Assets5
Portfolio holdings may have changed since the report date.
An index is a statistical composite of a specified financial market or sector. Unlike the fund, an index does not actually hold a portfolio of securities and its return is not inclusive of trading and management costs incurred by the fund.
Source of Industry Classification: S&P and MSCI.
| 1 | Excludes derivatives. |
| 2 | Not annualized. |
| 3 | Portfolio turnover rate excludes securities received or delivered from processing of in-kind creations or redemptions. |
| 4 | The percentage may differ from the Portfolio Holdings because the above calculation is based on a percentage of total investments, excluding derivatives, whereas the calculation in the Portfolio Holdings is based on a percentage of net assets. |
| 5 | This list is not a recommendation of any security by the investment adviser. |
Schwab U.S. REIT ETF | Semiannual Report
Fund Expenses (Unaudited)
Examples for a $1,000 Investment
As a fund shareholder, you may incur two types of costs: (1) transaction costs, including brokerage commissions on purchases and sales of fund shares; and, (2) ongoing costs, including management fees.
The expense examples below are intended to help you understand your ongoing cost (in dollars) of investing in the fund and to compare this cost with the ongoing cost of investing in other mutual funds. These examples are based on an investment of $1,000 invested for six months beginning March 1, 2022 and held through August 31, 2022.
Actual Return line in the table below provides information about actual account values and actual expenses. You may use this information, together with the amount you invested, to estimate the expenses that you paid over the period. To do so, simply divide your account value by $1,000 (for example, an $8,600 account value ÷ $1,000 = 8.6), then multiply the result by the number given for the fund under the heading entitled “Expenses Paid During Period.”
Hypothetical Return line in the table below provides information about hypothetical account values and hypothetical expenses based on the fund’s actual expense ratio and an assumed return of 5% per year before expenses. Because the return used is not an actual return, it may not be used to estimate the actual ending account value or expenses you paid for the period.
You may use this information to compare the ongoing costs of investing in the fund and other funds. To do so, compare this 5% hypothetical example with the 5% hypothetical examples that appear in the shareholder reports of the other funds.
Please note that the expenses shown in the table are meant to highlight your ongoing costs only, and do not reflect any transactional costs, including any brokerage commissions you may pay when purchasing or selling shares of a fund. Therefore, the hypothetical return lines of the table are useful in comparing ongoing costs only, and will not help you determine the relative total costs of owning different funds. In addition, if these transactional costs were included, your costs would have been higher.
| | EXPENSE RATIO
(ANNUALIZED) 1 | BEGINNING
ACCOUNT VALUE
AT 3/1/22 | ENDING
ACCOUNT VALUE
(NET OF EXPENSES)
AT 8/31/22 | EXPENSES PAID
DURING PERIOD
3/1/22-8/31/22 2 |
| Schwab U.S. REIT ETF | | | | |
| Actual Return | 0.07% | $1,000.00 | $ 931.90 | $0.34 |
| Hypothetical 5% Return | 0.07% | $1,000.00 | $1,024.85 | $0.36 |
| 1 | Based on the most recent six-month expense ratio. |
| 2 | Expenses for each fund are equal to its annualized expense ratio, multiplied by the average account value over the period, multiplied by 184 days of the period, and divided by 365 days of the fiscal year. |
Schwab U.S. REIT ETF | Semiannual Report
Financial Statements
FINANCIAL HIGHLIGHTS
| | 3/1/22–
8/31/221 | 3/1/21–
2/28/221 | 3/1/20–
2/28/211 | 3/1/19–
2/29/201 | 3/1/18–
2/28/191 | 3/1/17–
2/28/181 |
| Per-Share Data |
| Net asset value at beginning of period | $23.30 | $19.48 | $21.15 | $21.65 | $18.54 | $21.04 |
| Income (loss) from investment operations: | | | | | | |
| Net investment income (loss)2 | 0.28 | 0.43 | 0.42 | 0.66 | 0.65 | 0.60 |
| Net realized and unrealized gains (losses) | (1.87) | 3.79 | (1.54) | (0.50) | 3.17 | (2.64) |
| Total from investment operations | (1.59) | 4.22 | (1.12) | 0.16 | 3.82 | (2.04) |
| Less distributions: | | | | | | |
| Distributions from net investment income | (0.18) | (0.40) | (0.55) | (0.66) | (0.71) | (0.46) |
| Net asset value at end of period | $21.53 | $23.30 | $19.48 | $21.15 | $21.65 | $18.54 |
| Total return | (6.81%) 3 | 21.56% | (4.98%) | 0.59% | 20.85% | (9.91%) |
| Ratios/Supplemental Data |
| Ratios to average net assets: | | | | | | |
| Total expenses | 0.07% 4,5 | 0.07% | 0.07% | 0.07% | 0.07% | 0.07% |
| Net investment income (loss) | 2.45% 4 | 1.81% | 2.33% | 2.88% | 3.17% | 2.93% |
| Portfolio turnover rate6 | 3% 3 | 5% | 59% | 6% | 7% | 8% |
| Net assets, end of period (x 1,000,000) | $5,934 | $6,648 | $4,892 | $5,717 | $5,127 | $3,691 |
| 1 | Per-Share Data has been retroactively adjusted to reflect a 2-for-1 share split effective after market close on March 10, 2022 (see financial note 12 for additional information). |
| 2 | Calculated based on the average shares outstanding during the period. |
| 3 | Not annualized. |
| 4 | Annualized (except for proxy expenses). |
| 5 | Ratio includes less than 0.005% of non-routine proxy expenses. |
| 6 | Portfolio turnover rate excludes securities received or delivered from processing of in-kind creations or redemptions. |
Schwab U.S. REIT ETF | Semiannual Report
Portfolio Holdings as of August 31, 2022
This section shows all the securities in the fund’s portfolio and their values as of the report date.
The fund files its complete schedule of portfolio holdings with the U.S. Securities and Exchange Commission (SEC) for the first and third quarters of each fiscal year on Form N-PORT Part F. The fund’s Form N-PORT Part F is available on the SEC’s website at www.sec.gov. You can also obtain this information at no cost on the fund’s website at www.schwabassetmanagement.com/schwabetfs_prospectus, by calling 1-866-414-6349, or by sending an email request to orders@mysummaryprospectus.com. The fund also makes available its complete schedule of portfolio holdings on a daily basis on the fund’s website.
| SECURITY | NUMBER
OF SHARES | VALUE ($) |
| COMMON STOCKS 99.9% OF NET ASSETS |
| |
| Diversified REITs 2.8% |
| Alexander & Baldwin, Inc. | 327,816 | 6,139,994 |
| American Assets Trust, Inc. | 237,499 | 6,592,972 |
| Armada Hoffler Properties, Inc. | 305,366 | 4,009,456 |
| Broadstone Net Lease, Inc. | 764,576 | 14,633,985 |
| Empire State Realty Trust, Inc., Class A | 616,075 | 4,294,043 |
| Essential Properties Realty Trust, Inc. | 626,643 | 14,187,197 |
| Global Net Lease, Inc. | 467,430 | 6,436,511 |
| iStar, Inc. | 373,691 | 5,145,725 |
| STORE Capital Corp. | 1,139,974 | 30,756,498 |
| WP Carey, Inc. | 870,900 | 73,181,727 |
| | | 165,378,108 |
| |
| Health Care REITs 8.3% |
| CareTrust REIT, Inc. | 438,517 | 9,445,656 |
| Community Healthcare Trust, Inc. | 106,300 | 3,921,407 |
| Diversified Healthcare Trust | 1,074,540 | 1,568,828 |
| Global Medical REIT, Inc. | 277,791 | 3,011,255 |
| Healthcare Realty Trust, Inc., Class A | 1,718,673 | 41,798,127 |
| Healthpeak Properties, Inc. | 2,435,886 | 63,942,008 |
| LTC Properties, Inc. | 177,997 | 7,990,285 |
| Medical Properties Trust, Inc. | 2,709,163 | 39,580,871 |
| National Health Investors, Inc. | 207,095 | 13,566,794 |
| Omega Healthcare Investors, Inc. | 1,061,930 | 34,682,634 |
| Physicians Realty Trust | 1,017,307 | 16,948,335 |
| Sabra Health Care REIT, Inc. | 1,042,960 | 15,613,111 |
| Ventas, Inc. | 1,804,540 | 86,365,284 |
| Welltower, Inc. | 2,049,569 | 157,099,464 |
| | | 495,534,059 |
| |
| Hotel & Resort REITs 2.8% |
| Apple Hospitality REIT, Inc. | 961,271 | 15,293,822 |
| Ashford Hospitality Trust, Inc. * | 155,515 | 1,427,628 |
| Chatham Lodging Trust * | 220,686 | 2,683,542 |
| DiamondRock Hospitality Co. * | 951,107 | 8,303,164 |
| Host Hotels & Resorts, Inc. | 3,226,944 | 57,342,795 |
| Park Hotels & Resorts, Inc. | 1,053,910 | 14,754,740 |
| Pebblebrook Hotel Trust | 593,447 | 10,456,536 |
| RLJ Lodging Trust | 753,996 | 9,093,192 |
| Ryman Hospitality Properties, Inc. * | 248,959 | 20,469,409 |
| Service Properties Trust | 744,655 | 5,093,440 |
| Summit Hotel Properties, Inc. | 482,893 | 3,795,539 |
| Sunstone Hotel Investors, Inc. * | 972,304 | 10,588,390 |
| Xenia Hotels & Resorts, Inc. * | 516,870 | 8,197,558 |
| | | 167,499,755 |
| |
| Industrial REITs 12.4% |
| Americold Realty Trust, Inc. | 1,215,702 | 35,765,953 |
| Duke Realty Corp. | 1,735,719 | 102,147,063 |
| EastGroup Properties, Inc. | 188,166 | 31,053,035 |
| First Industrial Realty Trust, Inc. | 595,958 | 30,203,151 |
| SECURITY | NUMBER
OF SHARES | VALUE ($) |
| Industrial Logistics Properties Trust | 295,019 | 2,209,692 |
| Innovative Industrial Properties, Inc. | 126,353 | 11,589,097 |
| LXP Industrial Trust | 1,294,727 | 13,024,954 |
| Plymouth Industrial REIT, Inc. | 180,943 | 3,667,715 |
| Prologis, Inc. | 3,342,108 | 416,125,867 |
| Rexford Industrial Realty, Inc. | 744,995 | 46,346,139 |
| STAG Industrial, Inc. | 809,039 | 24,918,401 |
| Terreno Realty Corp. | 341,006 | 20,797,956 |
| | | 737,849,023 |
| |
| Office REITs 5.8% |
| Alexandria Real Estate Equities, Inc. | 670,540 | 102,860,836 |
| Boston Properties, Inc. | 643,810 | 51,137,828 |
| Brandywine Realty Trust | 773,064 | 6,207,704 |
| City Office REIT, Inc. | 197,010 | 2,275,466 |
| Corporate Office Properties Trust | 507,756 | 13,120,415 |
| Cousins Properties, Inc. | 671,663 | 18,034,152 |
| Douglas Emmett, Inc. | 793,800 | 15,494,976 |
| Easterly Government Properties, Inc. | 409,474 | 7,350,058 |
| Equity Commonwealth * | 508,888 | 13,388,843 |
| Highwoods Properties, Inc. | 474,888 | 14,441,344 |
| Hudson Pacific Properties, Inc. | 653,683 | 8,635,152 |
| JBG SMITH Properties | 491,196 | 10,791,576 |
| Kilroy Realty Corp. | 474,214 | 23,127,417 |
| Office Properties Income Trust | 218,426 | 3,837,745 |
| Orion Office REIT, Inc. | 255,914 | 2,525,871 |
| Paramount Group, Inc. | 741,075 | 5,135,650 |
| Piedmont Office Realty Trust, Inc., Class A | 556,297 | 6,553,179 |
| SL Green Realty Corp. | 289,637 | 12,793,266 |
| Veris Residential, Inc. * | 361,309 | 4,855,993 |
| Vornado Realty Trust | 718,525 | 18,839,725 |
| | | 341,407,196 |
| |
| Residential REITs 15.1% |
| American Homes 4 Rent, Class A | 1,334,138 | 47,441,947 |
| Apartment Income REIT Corp. | 709,275 | 28,973,884 |
| Apartment Investment & Management Co., Class A * | 688,665 | 6,087,799 |
| AvalonBay Communities, Inc. | 631,239 | 126,822,227 |
| Bluerock Residential Growth REIT, Inc., Class A | 126,608 | 3,374,103 |
| Camden Property Trust | 480,917 | 61,802,644 |
| Centerspace | 69,302 | 5,223,985 |
| Equity LifeStyle Properties, Inc. | 781,006 | 54,748,521 |
| Equity Residential | 1,544,948 | 113,059,295 |
| Essex Property Trust, Inc. | 294,956 | 78,181,037 |
| Independence Realty Trust, Inc. | 997,308 | 19,397,641 |
| Invitation Homes, Inc. | 2,755,429 | 99,966,964 |
| Mid-America Apartment Communities, Inc. | 521,130 | 86,335,607 |
| NexPoint Residential Trust, Inc. | 104,321 | 5,510,235 |
| Sun Communities, Inc. | 549,042 | 84,393,246 |
| UDR, Inc. | 1,351,251 | 60,630,632 |
| UMH Properties, Inc. | 227,545 | 4,104,912 |
Schwab U.S. REIT ETF | Semiannual Report
Portfolio Holdings as of August 31, 2022 (continued)
| SECURITY | NUMBER
OF SHARES | VALUE ($) |
| Washington Real Estate Investment Trust | 395,238 | 7,750,617 |
| | | 893,805,296 |
| |
| Retail REITs 11.8% |
| Acadia Realty Trust | 427,985 | 6,817,801 |
| Agree Realty Corp. | 339,418 | 25,564,964 |
| Brixmor Property Group, Inc. | 1,352,240 | 29,046,115 |
| Federal Realty Investment Trust | 322,678 | 32,677,601 |
| Getty Realty Corp. | 183,383 | 5,516,161 |
| InvenTrust Properties Corp. | 303,968 | 7,982,200 |
| Kimco Realty Corp. | 2,790,061 | 58,814,486 |
| Kite Realty Group Trust | 988,926 | 19,145,607 |
| National Retail Properties, Inc. | 794,234 | 35,661,107 |
| NETSTREIT Corp. | 216,151 | 4,249,529 |
| Phillips Edison & Co., Inc. | 514,318 | 16,802,769 |
| Realty Income Corp. | 2,716,117 | 185,456,469 |
| Regency Centers Corp. | 700,332 | 42,608,199 |
| Retail Opportunity Investments Corp. | 561,263 | 9,401,155 |
| RPT Realty | 383,879 | 3,696,755 |
| Simon Property Group, Inc. | 1,482,354 | 151,170,461 |
| SITE Centers Corp. | 821,143 | 10,642,013 |
| Spirit Realty Capital, Inc. | 606,339 | 24,768,948 |
| Tanger Factory Outlet Centers, Inc. | 470,882 | 7,261,000 |
| The Macerich Co. | 970,013 | 9,283,024 |
| The Necessity Retail REIT, Inc. | 600,095 | 4,476,709 |
| Urban Edge Properties | 497,887 | 7,831,762 |
| Whitestone REIT | 209,559 | 2,062,061 |
| | | 700,936,896 |
| |
| Specialized REITs 40.9% |
| American Tower Corp. | 2,097,995 | 532,995,630 |
| Crown Castle, Inc. | 1,955,036 | 333,978,800 |
| CubeSmart | 1,013,250 | 46,660,163 |
| Digital Realty Trust, Inc. | 1,285,207 | 158,890,141 |
| EPR Properties | 338,549 | 14,723,496 |
| Equinix, Inc. | 410,935 | 270,136,341 |
| Extra Space Storage, Inc. | 606,235 | 120,477,082 |
| Farmland Partners, Inc. | 142,263 | 2,064,236 |
| Four Corners Property Trust, Inc. | 363,137 | 9,764,754 |
| Gaming & Leisure Properties, Inc. | 1,061,756 | 51,250,962 |
| Gladstone Land Corp. | 140,414 | 3,301,133 |
| Iron Mountain, Inc. | 1,311,815 | 69,014,587 |
| SECURITY | NUMBER
OF SHARES | VALUE ($) |
| Lamar Advertising Co., Class A | 393,049 | 36,903,371 |
| Life Storage, Inc. | 380,879 | 48,466,853 |
| National Storage Affiliates Trust | 379,889 | 19,191,992 |
| Outfront Media, Inc. | 659,412 | 11,671,592 |
| PotlatchDeltic Corp. | 313,296 | 14,543,200 |
| Public Storage | 689,454 | 228,092,067 |
| Rayonier, Inc. | 660,485 | 23,460,427 |
| Safehold, Inc. | 69,941 | 2,659,856 |
| SBA Communications Corp. | 486,821 | 158,338,530 |
| Uniti Group, Inc. | 1,071,420 | 10,060,634 |
| VICI Properties, Inc. | 4,347,664 | 143,429,435 |
| Weyerhaeuser Co. | 3,361,216 | 114,819,139 |
| | | 2,424,894,421 |
Total Common Stocks
(Cost $5,614,578,148) | 5,927,304,754 |
| | | |
| SHORT-TERM INVESTMENTS 0.0% OF NET ASSETS |
| |
| Money Market Funds 0.0% |
| State Street Institutional U.S. Government Money Market Fund, Premier Class 2.25% (a) | 3,134,976 | 3,134,976 |
Total Short-Term Investments
(Cost $3,134,976) | 3,134,976 |
Total Investments in Securities
(Cost $5,617,713,124) | 5,930,439,730 |
| | NUMBER OF
CONTRACTS | NOTIONAL
AMOUNT
($) | CURRENT VALUE/
UNREALIZED
DEPRECIATION
($) |
| FUTURES CONTRACTS |
| Long | | | |
| Dow Jones U.S. Real Estate Index, expires 09/16/22 | 160 | 5,835,200 | (366,992) |
| * | Non-income producing security. |
| (a) | The rate shown is the 7-day yield. |
| REIT — | Real Estate Investment Trust |
The following is a summary of the inputs used to value the fund’s investments as of August 31, 2022 (see financial note 2(a) for additional information):
| DESCRIPTION | QUOTED PRICES IN
ACTIVE MARKETS FOR
IDENTICAL ASSETS
(LEVEL 1) | OTHER SIGNIFICANT
OBSERVABLE INPUTS
(LEVEL 2) | SIGNIFICANT
UNOBSERVABLE INPUTS
(LEVEL 3) | TOTAL |
| Asset | | | | |
| Common Stocks1 | $5,927,304,754 | $— | $— | $5,927,304,754 |
| Short-Term Investments1 | 3,134,976 | — | — | 3,134,976 |
| Liabilities | | | | |
| Futures Contracts2 | (366,992) | — | — | (366,992) |
| Total | $5,930,072,738 | $— | $— | $5,930,072,738 |
| 1 | As categorized in the Portfolio Holdings. |
| 2 | Futures contracts are reported at cumulative unrealized appreciation or depreciation. |
Schwab U.S. REIT ETF | Semiannual Report
Portfolio Holdings as of August 31, 2022 (continued)
Fund investments in mutual funds are classified as Level 1, without consideration to the classification level of the underlying securities held by the mutual funds, which could be Level 1, Level 2 or Level 3.
Schwab U.S. REIT ETF | Semiannual Report
Statement of Assets and Liabilities
As of August 31, 2022
| Assets |
| Investments in securities, at value - unaffiliated (cost $5,617,713,124) | | $5,930,439,730 |
| Deposit with broker for futures contracts | | 864,000 |
| Receivables: | | |
| Fund shares sold | | 6,458,492 |
| Dividends | | 3,342,402 |
| Income from securities on loan | + | 291 |
| Total assets | | 5,941,104,915 |
| Liabilities |
| Payables: | | |
| Investments bought | | 6,429,318 |
| Management fees | | 372,528 |
| Variation margin on futures contracts | + | 25,571 |
| Total liabilities | | 6,827,417 |
| Net assets | | $5,934,277,498 |
| Net Assets by Source |
| Capital received from investors | | $6,342,761,610 |
| Total distributable loss | + | (408,484,112) |
| Net assets | | $5,934,277,498 |
| Net Asset Value (NAV) |
| Net Assets | ÷ | Shares
Outstanding | = | NAV |
| $5,934,277,498 | | 275,650,000 | | $21.53 |
| | | | | |
| | | | | |
Schwab U.S. REIT ETF | Semiannual Report
Statement of Operations
| For the period March 1, 2022 through August 31, 2022 |
| Investment Income |
| Dividends received from securities - unaffiliated | | $81,862,867 |
| Securities on loan, net | + | 662 |
| Total investment income | | 81,863,529 |
| Expenses |
| Management fees | | 2,266,035 |
| Proxy fees1 | + | 264,635 |
| Total expenses | – | 2,530,670 |
| Net investment income | | 79,332,859 |
| REALIZED AND UNREALIZED GAINS (LOSSES) |
| Net realized gains on sales of securities - unaffiliated | | 5,742,823 |
| Net realized gains on sales of in-kind redemptions - unaffiliated | | 166,206,797 |
| Net realized gains on futures contracts | + | 2,033,049 |
| Net realized gains | | 173,982,669 |
| Net change in unrealized appreciation (depreciation) on securities - unaffiliated | | (689,932,055) |
| Net change in unrealized appreciation (depreciation) on futures contracts | + | (207,861) |
| Net change in unrealized appreciation (depreciation) | + | (690,139,916) |
| Net realized and unrealized losses | | (516,157,247) |
| Decrease in net assets resulting from operations | | ($436,824,388) |
| 1 | Proxy fees are non-routine expenses (see financial note 2(e) for additional information). |
Schwab U.S. REIT ETF | Semiannual Report
Statement of Changes in Net Assets
For the current and prior report periods
| OPERATIONS |
| | 3/1/22-8/31/22 | 3/1/21-2/28/22 |
| Net investment income | | $79,332,859 | $112,650,874 |
| Net realized gains | | 173,982,669 | 140,921,180 |
| Net change in unrealized appreciation (depreciation) | + | (690,139,916) | 808,915,282 |
| Increase (decrease) in net assets resulting from operations | | ($436,824,388) | $1,062,487,336 |
| DISTRIBUTIONS TO SHAREHOLDERS |
| Total distributions | | ($49,884,480) | ($105,641,785) |
| TRANSACTIONS IN FUND SHARES1 |
| | 3/1/22-8/31/22 | 3/1/21-2/28/22 |
| | | SHARES | VALUE | SHARES | VALUE |
| Shares sold | | 17,050,000 | $394,159,262 | 47,100,000 | $1,103,067,576 |
| Shares redeemed | + | (26,800,000) | (621,647,489) | (12,800,000) | (303,344,302) |
| Net transactions in fund shares | | (9,750,000) | ($227,488,227) | 34,300,000 | $799,723,274 |
| SHARES OUTSTANDING AND NET ASSETS1 |
| | 3/1/22-8/31/22 | 3/1/21-2/28/22 |
| | | SHARES | NET ASSETS | SHARES | NET ASSETS |
| Beginning of period | | 285,400,000 | $6,648,474,593 | 251,100,000 | $4,891,905,768 |
| Total increase (decrease) | + | (9,750,000) | (714,197,095) | 34,300,000 | 1,756,568,825 |
| End of period | | 275,650,000 | $5,934,277,498 | 285,400,000 | $6,648,474,593 |
| 1 | For the period ended August 31, 2022, and the prior report period, transactions in fund shares have been retroactively adjusted to reflect a 2-for-1 share split effective after market close on March 10, 2022. The retroactive adjustment of the share split does not change the transaction in fund share values (see financial note 12 for additional information). |
Schwab U.S. REIT ETF | Semiannual Report
1. Business Structure of the Fund:
Schwab U.S. REIT ETF is a series of Schwab Strategic Trust (the trust), a no-load, open-end management investment company. The trust is organized as a Delaware statutory trust and is registered under the Investment Company Act of 1940, as amended (the 1940 Act). The list below shows all the operational funds in the trust as of the end of the period, including the fund discussed in this report, which is highlighted:
| SCHWAB STRATEGIC TRUST (ORGANIZED JANUARY 27, 2009) |
| Schwab U.S. REIT ETF | Schwab Short-Term U.S. Treasury ETF |
| Schwab U.S. Broad Market ETF | Schwab Intermediate-Term U.S. Treasury ETF |
| Schwab 1000 Index® ETF | Schwab Long-Term U.S. Treasury ETF |
| Schwab U.S. Large-Cap ETF | Schwab U.S. Aggregate Bond ETF |
| Schwab U.S. Large-Cap Growth ETF | Schwab 1-5 Year Corporate Bond ETF |
| Schwab U.S. Large-Cap Value ETF | Schwab 5-10 Year Corporate Bond ETF |
| Schwab U.S. Mid-Cap ETF | Schwab Fundamental U.S. Broad Market Index ETF |
| Schwab U.S. Small-Cap ETF | Schwab Fundamental U.S. Large Company Index ETF |
| Schwab U.S. Dividend Equity ETF | Schwab Fundamental U.S. Small Company Index ETF |
| Schwab International Dividend Equity ETF | Schwab Fundamental International Large Company Index ETF |
| Schwab International Equity ETF | Schwab Fundamental International Small Company Index ETF |
| Schwab International Small-Cap Equity ETF | Schwab Fundamental Emerging Markets Large Company Index ETF |
| Schwab Emerging Markets Equity ETF | Schwab Ariel ESG ETF |
| Schwab U.S. TIPS ETF | Schwab Crypto Thematic ETF |
The fund issues and redeems shares at its net asset value per share (NAV) only in large blocks of shares (Creation Units). These transactions are usually in exchange for a basket of securities and/or an amount of cash. As a practical matter, only institutional investors who have entered into an authorized participant agreement purchase or redeem Creation Units. Except when aggregated in Creation Units, shares of the fund are not redeemable securities.
Individual shares of the fund trade on national securities exchanges and elsewhere during the trading day and can only be bought and sold at market prices throughout the trading day through a broker-dealer. Because fund shares trade at market prices rather than NAV, shares may trade at a price greater than NAV (premium) or less than NAV (discount). A chart showing the frequency at which the fund’s daily closing market price was at a discount or premium to the fund’s NAV can be found at www.schwabassetmanagement.com.
The fund maintains its own account for purposes of holding assets and accounting, and is considered a separate entity for tax purposes. Within its account, the fund may also keep certain assets in segregated accounts, as required by securities law.
2. Significant Accounting Policies:
The following is a summary of the significant accounting policies the fund uses in its preparation of financial statements. The fund follows the investment company accounting and reporting guidance of the Financial Accounting Standards Board (FASB) Accounting Standard Codification Topic 946 Financial Services — Investment Companies. The accounting policies are in conformity with accounting principles generally accepted in the United States of America (GAAP).
The fund may invest in certain mutual funds and exchange-traded funds (ETFs), which are referred to as "underlying funds". For more information about the underlying funds’ operations and policies, please refer to those funds’ semiannual and annual reports, which are filed with the U.S. Securities and Exchange Commission (SEC) and are available on the SEC’s website at www.sec.gov.
(a) Security Valuation
Under procedures approved by the fund’s Board of Trustees (the Board), the investment adviser has formed a Pricing Committee to administer the pricing and valuation of portfolio securities and other assets and to ensure that prices used for internal purposes or provided by third parties reasonably reflect fair value. Among other things, these procedures allow the fund to utilize independent pricing services, quotations from securities and financial instrument dealers and other market sources to determine fair value.
Schwab U.S. REIT ETF | Semiannual Report
Financial Notes (continued)
2. Significant Accounting Policies (continued):
The fund values the securities in its portfolio every business day. The fund uses the following policies to value various types of securities:
• Securities traded on an exchange or over-the-counter: Traded securities are valued at the closing value for the day, or, on days when no closing value has been reported, at the mean of the most recent bid and ask quotes. Securities that are primarily traded on foreign exchanges are valued at the official closing price or the last sales price on the exchange where the securities are principally traded with these values then translated into U.S. dollars at the current exchange rate, unless these securities are fair valued as discussed below.
• Futures contracts: Futures contracts are valued at their settlement prices as of the close of their exchanges.
• Mutual funds: Mutual funds are valued at their respective NAVs.
• Securities for which no quoted value is available: The Board has adopted procedures to fair value the fund’s securities when market prices are not “readily available” or are unreliable. For example, a fund may fair value a security when it is de-listed or its trading is halted or suspended; when a security’s primary pricing source is unable or unwilling to provide a price; or when a security’s primary trading market is closed during regular market hours. The fund makes fair value determinations in good faith in accordance with the fund’s valuation procedures. The Pricing Committee considers a number of factors, including unobservable market inputs when arriving at fair value. The Pricing Committee may employ techniques such as the review of related or comparable assets or liabilities, related market activities, recent transactions, market multiples, book values, transactional back-testing, disposition analysis and other relevant information. The Pricing Committee regularly reviews these inputs and assumptions to calibrate the valuations. Due to the subjective and variable nature of fair value pricing, there can be no assurance that the fund could obtain the fair value assigned to the security upon the sale of such security. The Board convenes on a regular basis to review fair value determinations made by the fund pursuant to the valuation procedures.
In accordance with the authoritative guidance on fair value measurements and disclosures under GAAP, the fund discloses the fair value of its investments in a hierarchy that prioritizes the significant inputs to valuation techniques used to measure the fair value. The hierarchy gives the highest priority to valuations based upon unadjusted quoted prices in active markets for identical assets or liabilities (Level 1 measurements) and the lowest priority to valuations based upon unobservable inputs that are significant to the valuation (Level 3 measurements). If inputs used to measure the financial instruments fall within different levels of the hierarchy, the categorization is based on the lowest level input that is significant to the valuation. If the fund determines that either the volume and/or level of activity for an asset or liability has significantly decreased (from normal conditions for that asset or liability) or price quotations or observable inputs are not associated with orderly transactions, increased analysis and management judgment will be required to estimate fair value.
The three levels of the fair value hierarchy are as follows:
• Level 1 — quoted prices in active markets for identical securities — Investments whose values are based on quoted market prices in active markets, and whose values are therefore classified as Level 1 prices, include active listed equities, mutual funds and futures contracts. Investments in mutual funds are valued daily at their NAVs, which are classified as Level 1 prices, without consideration to the classification level of the underlying securities held by an underlying fund.
• Level 2 — other significant observable inputs (including quoted prices for similar securities, interest rates, prepayment speeds, credit risk, etc.) — Investments that trade in markets that are not considered to be active, but whose values are based on quoted market prices, dealer quotations or valuations provided by alternative pricing sources supported by observable inputs are classified as Level 2 prices. These generally include U.S. government and sovereign obligations, most government agency securities, investment-grade corporate bonds, certain mortgage products, less liquid listed equities, and state, municipal and provincial obligations.
• Level 3 — significant unobservable inputs (including the fund’s own assumptions in determining the fair value of investments) — Investments whose values are classified as Level 3 prices have significant unobservable inputs, as they may trade infrequently or not at all. When observable prices are not available for these securities, the fund uses one or more valuation techniques for which sufficient and reliable data is available. The inputs used by the fund in estimating the value of Level 3 prices may include the original transaction price, quoted prices for similar securities or assets in active markets, completed or pending third-party transactions in the underlying investment or comparable issuers, and changes in financial ratios or cash flows. Level 3 prices may also be adjusted to reflect illiquidity and/or non-transferability, with the amount of such discount estimated by the fund in the absence of market information. Assumptions used by the fund due to the lack of observable inputs may significantly impact the resulting fair value and therefore the fund’s results of operations.
Schwab U.S. REIT ETF | Semiannual Report
Financial Notes (continued)
2. Significant Accounting Policies (continued):
The inputs or methodology used for valuing securities are not necessarily an indication of the risk associated with investing in those securities.
The levels associated with valuing the fund’s investments as of August 31, 2022 are disclosed in the Portfolio Holdings.
(b) Accounting Policies for certain Portfolio Investments (if held):
Futures Contracts: Futures contracts are instruments that represent an agreement between two parties that obligates one party to buy, and the other party to sell, specific instruments at an agreed upon price on a stipulated future date. The fund must give the broker a deposit of cash and/or securities (initial margin) whenever it enters into a futures contract. The amount of the deposit may vary from one contract to another. Subsequent payments (variation margin) are made or received by the fund depending on the daily fluctuations in the value of the futures contract and are accounted for as unrealized appreciation or depreciation until the contract is closed, at which time the gains or losses are realized. Futures contracts are traded publicly on exchanges, and their value may change daily.
Securities Lending: Under the trust’s Securities Lending Program, the fund (lender) may make short-term loans of its securities to another party (borrower) to generate additional revenue for the fund. The borrower pledges collateral in the form of cash, securities issued or fully guaranteed by the U.S. government or foreign governments, or letters of credit issued by a bank. Collateral at the individual loan level is required to be maintained on a daily marked-to-market basis in an amount at least equal to the current value of the securities loaned. The lending agent provides the fund with indemnification against borrower default (the borrower fails to return the security on loan) reducing the risk of loss as a result of default. The cash collateral of securities loaned is currently invested in money market portfolios operating pursuant to Rule 2a-7 under the 1940 Act. The fund bears the risk of loss with respect to the investment of cash collateral. The terms of the securities lending agreement allow the fund or the lending agent to terminate any loan at any given time and the securities must be returned within the earlier of the standard trade settlement period or the specified time period under the relevant securities lending agreements. Securities lending income, as disclosed in the fund’s Statement of Operations, if applicable, represents the income earned from the investment of the cash collateral plus any fees paid by borrowers, less the fees paid to the lending agent and broker rebates which are subject to adjustments pursuant to the securities lending agreement. On loans not collateralized by cash, a fee is received from the borrower, and is allocated between the fund and the lending agent. The aggregate fair value of securities loaned will not at any time exceed one-third of the total assets of the fund, including collateral received from the loan. Securities lending fees paid to the unaffiliated lending agents start at 9% of gross lending revenue, with subsequent breakpoints to a low of 5%. In this context, the gross lending revenue equals the income received from the investment of cash collateral and fees paid by borrowers less any rebates paid to the borrowers. Any expenses charged by the cash collateral fund are in addition to these fees. All remaining revenue is retained by the fund, as applicable. No portion of lending revenue is paid to or retained by the investment adviser or any of its affiliates.
As of August 31, 2022, the fund had no securities on loan.
(c) Security Transactions:
Security transactions are recorded as of the date the order to buy or sell the security is executed. Realized gains and losses from security transactions are based on the identified costs of the securities involved.
When the fund closes out a futures contract position, it calculates the difference between the value of the position at the beginning and at the end of the contract, and records a realized gain or loss accordingly.
The fund invests in real estate investment trusts (REITs) which report information on the source of their distributions annually. The fund’s policy is to record all REIT distributions initially as dividend income on the ex-dividend date and then re-designate them as return of capital and/or capital gain distributions at the end of the reporting period based on information provided annually by each REIT, and management estimates such re-designations when actual information has not yet been reported.
(d) Investment Income:
Interest income is recorded as it accrues. Dividends and distributions from portfolio securities and underlying funds are recorded on the date they are effective (the ex-dividend date), although the fund records certain foreign security dividends on the date the ex-dividend is confirmed. Any distributions from underlying funds are recorded in accordance with the character of the distributions as designated by the underlying funds.
Schwab U.S. REIT ETF | Semiannual Report
Financial Notes (continued)
2. Significant Accounting Policies (continued):
(e) Expenses:
Pursuant to the Amended and Restated Advisory Agreement (Advisory Agreement) between the investment adviser and the trust, the investment adviser will pay the operating expenses of the fund, excluding taxes, any brokerage expenses, and extraordinary or non-routine expenses. Taxes, any brokerage expenses and extraordinary or non-routine expenses that are specific to the fund are charged directly to the fund. The Advisory Agreement excludes paying acquired fund fees and expenses, which are indirect expenses incurred by a fund through its investments in underlying funds.
(f) Distributions to Shareholders:
The fund makes distributions from net investment income, if any, quarterly and from net realized capital gains, if any, once a year. To receive a distribution, you must be a registered shareholder on the record date. Distributions are paid to shareholders on the payable date.
(g) Accounting Estimates:
The accounting policies described in this report conform to GAAP. Notwithstanding this, shareholders should understand that in order to follow these principles, fund management has to make estimates and assumptions that affect the information reported in the financial statements. It’s possible that once the results are known, they may turn out to be different from these estimates and these differences may be material.
(h) Federal Income Taxes:
The fund intends to meet federal income and excise tax requirements for regulated investment companies under subchapter M of the Internal Revenue Code, as amended. Accordingly, the fund distributes substantially all of its net investment income and net realized capital gains, if any, to its shareholders each year. As long as the fund meets the tax requirements, it is not required to pay federal income tax.
(i) Indemnification:
Under the fund’s organizational documents, the officers and trustees are indemnified against certain liabilities arising out of the performance of their duties to the fund. In addition, in the normal course of business the fund enters into contracts with its vendors and others that provide general indemnifications. The fund’s maximum exposure under these arrangements is unknown as this would involve future claims that may be made against the fund. However, based on experience, the fund expects the risk of loss attributable to these arrangements to be remote.
3. Risk Factors:
Investing in the fund may involve certain risks, as discussed in the fund’s prospectus, including, but not limited to, those described below. Any of these risks could cause an investor to lose money.
Market Risk. Financial markets rise and fall in response to a variety of factors, sometimes rapidly and unpredictably. Markets may be impacted by economic, political, regulatory and other conditions, including economic sanctions and other government actions. In addition, the occurrence of global events, such as war, terrorism, environmental disasters, natural disasters and epidemics, may also negatively affect the financial markets. As with any investment whose performance is tied to these markets, the value of an investment in the fund will fluctuate, which means that an investor could lose money over short or long periods.
Investment Style Risk. The fund is an index fund. Therefore, the fund follows the securities included in the index during upturns as well as downturns. Because of its indexing strategy, the fund does not take steps to reduce market exposure or to lessen the effects of a declining market. In addition, because of the fund’s expenses, the fund’s performance may be below that of the index. Errors relating to the index may occur from time to time and may not be identified by the index provider for a period of time. In addition, market disruptions could cause delays in the index’s rebalancing schedule. Such errors and/or market disruptions may result in losses for the fund.
Equity Risk. The prices of equity securities rise and fall daily. These price movements may result from factors affecting individual companies, industries or the securities market as a whole. In addition, equity markets tend to move in cycles, which may cause stock prices to fall over short or extended periods of time.
Schwab U.S. REIT ETF | Semiannual Report
Financial Notes (continued)
3. Risk Factors (continued):
Market Capitalization Risk. Securities issued by companies of different market capitalizations tend to go in and out of favor based on market and economic conditions. During a period when securities of a particular market capitalization fall behind other types of investments, the fund’s performance could be impacted.
Large-Cap Company Risk. Large-cap companies are generally more mature and the securities issued by these companies may not be able to reach the same levels of growth as the securities issued by small- or mid-cap companies.
Mid-Cap Company Risk. Mid-cap companies may be more vulnerable to adverse business or economic events than larger, more established companies and the value of securities issued by these companies may move sharply.
Small-Cap Company Risk. Securities issued by small-cap companies may be riskier than those issued by larger companies, and their prices may move sharply, especially during market upturns and downturns.
Real Estate Investment Risk. Due to the composition of the index, the fund concentrates its investments in real estate companies and companies related to the real estate industry. As such, the fund is subject to risks associated with the direct ownership of real estate securities and an investment in the fund will be closely linked to the performance of the real estate markets. These risks include, among others: declines in the value of real estate; risks related to general and local economic conditions; possible lack of availability of mortgage funds or other limits to accessing the credit or capital markets; defaults by borrowers or tenants, particularly during an economic downturn; and changes in interest rates.
REITs Risk. In addition to the risks associated with investing in securities of real estate companies and real estate related companies, REITs are subject to certain additional risks. Equity REITs may be affected by changes in the value of the underlying properties owned by the trusts. Further, REITs are dependent upon specialized management skills and cash flows, and may have their investments in relatively few properties, or in a small geographic area or a single property type. Failure of a company to qualify as a REIT under federal tax law may have adverse consequences to the fund. In addition, REITs have their own expenses, and the fund will bear a proportionate share of those expenses.
Tracking Error Risk. As an index fund, the fund seeks to track the performance of its index, although it may not be successful in doing so. The divergence between the performance of the fund and the index, positive or negative, is called “tracking error.” Tracking error can be caused by many factors and it may be significant.
Derivatives Risk. The principal types of derivatives used by the fund are futures contracts. A future is an agreement to buy or sell a financial instrument at a specific price on a specific day. The fund’s use of derivatives that are subject to regulation by the Commodity Futures Trading Commission (CFTC) could cause the fund to become a commodity pool, which would require the fund to comply with certain CFTC rules.
The fund’s use of derivative instruments involves risks different from, or possibly greater than, the risks associated with investing directly in securities and other traditional investments. Certain of these risks, such as liquidity risk, leverage risk and market risk, are discussed elsewhere in this section. The fund’s use of derivatives is also subject to counterparty risk, lack of availability risk, valuation risk, correlation risk and tax risk. Counterparty risk is the risk that the counterparty to a derivatives transaction may not fulfill its contractual obligations either because the financial condition of the counterparty declines, or because the counterparty is otherwise unable or unwilling to perform under the contract. Lack of availability risk is the risk that suitable derivative transactions may not be available in all circumstances for risk management or other purposes. Valuation risk is the risk that a particular derivative may be valued incorrectly. Correlation risk is the risk that changes in the value of the derivative may not correlate perfectly with the underlying asset, rate or index. Tax risk is the risk that the use of derivatives may cause the fund to realize higher amounts of short-term capital gains. The fund’s use of derivatives could reduce the fund’s performance, increase the fund’s volatility and could cause the fund to lose more than the initial amount invested.
Concentration Risk. To the extent that the fund’s or the index’s portfolio is concentrated in the securities of issuers in a particular market, industry, group of industries, sector or asset class (including the real estate industry, as described above), the fund may be adversely affected by the performance of those securities, may be subject to increased price volatility and may be more vulnerable to adverse economic, market, political or regulatory occurrences affecting that market, industry, group of industries, sector or asset class.
Liquidity Risk. The fund may be unable to sell certain securities, such as illiquid securities, readily at a favorable time or price, or the fund may have to sell them at a loss.
Schwab U.S. REIT ETF | Semiannual Report
Financial Notes (continued)
3. Risk Factors (continued):
Leverage Risk. Certain fund transactions, such as derivatives transactions, may give rise to a form of leverage and may expose the fund to greater risk. Leverage tends to magnify the effect of any decrease or increase in the value of the fund’s portfolio securities which means even a small amount of leverage can have a disproportionately large impact on the fund. The use of leverage may cause the fund to liquidate portfolio positions when it would not be advantageous to do so in order to satisfy its obligations.
Securities Lending Risk. Securities lending involves the risk of loss of rights in, or delay in recovery of, the loaned securities if the borrower fails to return the security loaned or becomes insolvent.
Market Trading Risk. Although fund shares are listed on national securities exchanges, there can be no assurance that an active trading market for fund shares will develop or be maintained. If an active market is not maintained, investors may find it difficult to buy or sell fund shares.
Shares of the Fund May Trade at Prices Other Than NAV. Fund shares may be bought and sold in the secondary market at market prices. Although it is expected that the market price of the shares of the fund will approximate the fund’s NAV, there may be times when the market price and the NAV vary significantly. An investor may pay more than NAV when buying shares of the fund in the secondary market, and an investor may receive less than NAV when selling those shares in the secondary market. The market price of fund shares may deviate, sometimes significantly, from NAV during periods of market volatility or market disruption.
Please refer to the fund’s prospectus for a more complete description of the principal risks of investing in the fund.
4. Affiliates and Affiliated Transactions:
Investment Adviser
Charles Schwab Investment Management, Inc., dba Schwab Asset Management, a wholly owned subsidiary of The Charles Schwab Corporation, serves as the fund’s investment adviser pursuant to the Advisory Agreement between the investment adviser and the trust.
For its advisory services to the fund, the investment adviser is entitled to receive an annual management fee, payable monthly, equal to 0.07% of the fund’s average daily net assets.
Schwab U.S. REIT ETF | Semiannual Report
Financial Notes (continued)
4. Affiliates and Affiliated Transactions (continued):
Investment from Affiliates
Certain funds in the Fund Complex (for definition refer to the Trustees and Officers section) may own shares of other funds in the Fund Complex. The table below reflects the percentage of shares of the fund that are owned by other funds in the Fund Complex as of August 31, 2022.
| Schwab MarketTrack All Equity Portfolio | 0.6% |
| Schwab MarketTrack Balanced Portfolio | 0.3% |
| Schwab MarketTrack Conservative Portfolio | 0.1% |
| Schwab MarketTrack Growth Portfolio | 0.6% |
| Schwab Target 2010 Index Fund | 0.0%* |
| Schwab Target 2015 Index Fund | 0.0%* |
| Schwab Target 2020 Index Fund | 0.1% |
| Schwab Target 2025 Index Fund | 0.3% |
| Schwab Target 2030 Index Fund | 0.6% |
| Schwab Target 2035 Index Fund | 0.4% |
| Schwab Target 2040 Index Fund | 0.6% |
| Schwab Target 2045 Index Fund | 0.4% |
| Schwab Target 2050 Index Fund | 0.5% |
| Schwab Target 2055 Index Fund | 0.3% |
| Schwab Target 2060 Index Fund | 0.4% |
| Schwab Target 2065 Index Fund | 0.0%* |
| Schwab VIT Balanced Portfolio | 0.1% |
| Schwab VIT Balanced with Growth Portfolio | 0.2% |
| Schwab VIT Growth Portfolio | 0.2% |
Interfund Transactions
The fund may engage in direct transactions with certain other funds in the Fund Complex in accordance with procedures adopted by the Board pursuant to Rule 17a-7 under the 1940 Act. When one fund is seeking to sell a security that another is seeking to buy, an interfund transaction can allow both funds to benefit by reducing transaction costs. This practice is limited to funds that share the same investment adviser, trustees and/or officers. For the period ended August 31, 2022, the fund’s purchases and sales of securities with other funds in the Fund Complex was $8,775,792 and $47,162,591, respectively, and includes realized losses of $11,938,308.
Interfund Borrowing and Lending
Pursuant to an exemptive order issued by the SEC, the fund may enter into interfund borrowing and lending transactions with other funds in the Fund Complex. All loans are for temporary or emergency purposes and the interest rate to be charged will be the average of the overnight repurchase agreement rate and the short-term bank loan rate. All loans are subject to numerous conditions designed to ensure fair and equitable treatment of all participating funds. The interfund lending facility is subject to the oversight and periodic review of the Board. The fund had no interfund borrowing or lending activity during the period.
5. Other Service Providers:
SEI Investments Distribution Co. is the principal underwriter and distributor of shares of the fund.
State Street Bank and Trust Company (State Street) serves as the fund’s transfer agent. As part of these services, the transfer agent maintains records pertaining to the sale, redemption and transfer of the fund’s shares. The transfer agent is also responsible for the order-taking function for the fund’s shares.
State Street also serves as custodian and accountant for the fund. The custodian is responsible for the daily safekeeping of securities and cash held by the fund. The fund’s accountant maintains all books and records related to the fund’s transactions.
Schwab U.S. REIT ETF | Semiannual Report
Financial Notes (continued)
The Board may include people who are officers and/or directors of the investment adviser or its affiliates. Federal securities law limits the percentage of such “interested persons” who may serve on a trust’s board, and the trust was in compliance with these limitations throughout the report period. The trust does not pay any interested or non-interested trustees (independent trustees). The independent trustees are paid by the investment adviser. For information regarding the trustees, please refer to the Trustees and Officers table at the end of this report.
7. Borrowing from Banks:
During the period, the fund was a participant with other funds in the Fund Complex in a joint, syndicated, committed $850 million line of credit (the Syndicated Credit Facility), maturing on September 29, 2022. Under the terms of the Syndicated Credit Facility, in addition to the investment adviser paying the interest charged on any borrowings by the fund, the investment adviser paid a commitment fee of 0.15% per annum on the fund’s proportionate share of the unused portion of the Syndicated Credit Facility.
During the period, the fund was a participant with other funds in the Fund Complex in a joint, unsecured, uncommitted $400 million line of credit (the Uncommitted Credit Facility), with State Street maturing on September 29, 2022. Under the terms of the Uncommitted Credit Facility, the investment adviser pays interest on the amount it borrows. There were no borrowings from either line of credit during the period.
The fund also has access to custodian overdraft facilities. The fund may have utilized the overdraft facility and incurred an interest expense, which is paid by the investment adviser. The interest expense is determined based on a negotiated rate above the current Federal Funds Rate.
8. Derivatives:
The fund entered into equity index futures contracts during the report period. The fund invested in futures contracts to equitize available cash. The value and variation margin for futures contracts held at August 31, 2022 are presented in the Portfolio Holdings and Statement of Assets and Liabilities, respectively. The net realized gains (losses) and net change in unrealized appreciation (depreciation) on futures contracts are presented in the Statement of Operations. Refer to financial note 2(b) for the fund’s accounting policies with respect to futures contracts and financial note 3 for disclosures concerning the risks of investing in futures contracts. During the period ended August 31, 2022, the month-end average notional amounts of futures contracts held by the fund was $11,691,431 and the month-end average number of contracts held was 302.
9. Purchases and Sales of Investment Securities:
For the period ended August 31, 2022, purchases and sales of securities (excluding in-kind transactions and short-term obligations) were as follows:
PURCHASES
OF SECURITIES | SALES
OF SECURITIES |
| $396,374,129 | $210,255,485 |
10. In-Kind Transactions:
The consideration for the purchase of Creation Units of the fund often consists of the in-kind deposit of a designated portfolio of equity securities, which constitutes an optimized representation of the securities involved in a relevant fund’s underlying index, and an amount of cash. Investors purchasing and redeeming Creation Units are subject to a standard creation transaction fee and a standard redemption transaction fee paid to the custodian to offset transfer and other transaction costs associated with the issuance and redemption of Creation Units. Purchasers and redeemers of Creation Units for cash are subject to an additional variable charge paid to the fund that will offset the transaction costs to the fund of buying or selling portfolio securities. In addition, purchasers and redeemers of shares in Creation Units are responsible for payment of the costs of transferring securities to or out of the fund. From time to time, the investment adviser may cover the cost of any transaction fees when believed to be in the best interests of the fund.
Schwab U.S. REIT ETF | Semiannual Report
Financial Notes (continued)
10. In-Kind Transactions (continued):
The in-kind transactions for the period ended August 31, 2022, were as follows:
IN-KIND PURCHASES
OF SECURITIES | IN-KIND SALES
OF SECURITIES |
| $357,957,750 | $583,642,215 |
For the period ended August 31, 2022, the fund realized net capital gains or losses resulting from in-kind redemptions of Creation Units. Because such gains or losses are not taxable to the fund and are not distributed to existing fund shareholders, the gains or losses are reclassified from accumulated net realized gains or losses to capital received from investors at the end of the fund’s tax year. These reclassifications have no effect on net assets or net asset values per share. The net realized gains or losses on sales of in-kind redemptions for the period ended August 31, 2022 are disclosed in the fund’s Statement of Operations.
11. Federal Income Taxes:
As of August 31, 2022, the tax basis cost of the fund’s investments and gross unrealized appreciation and depreciation were as follows:
| TAX COST | GROSS UNREALIZED
APPRECIATION | GROSS UNREALIZED
DEPRECIATION | NET UNREALIZED
APPRECIATION
(DEPRECIATION) |
| $5,682,145,608 | $621,630,055 | ($373,702,925) | $247,927,130 |
Capital loss carryforwards have no expiration and may be used to offset future realized capital gains for federal income tax purposes. As of February 28, 2022, the fund had capital loss carryforwards of $877,642,876.
The tax-basis components of distributions and components of distributable earnings on a tax basis are finalized at fiscal year-end; accordingly, tax basis balances have not been determined as of August 31, 2022. The tax-basis components of distributions paid during the fiscal year ended February 28, 2022 were as follows:
| | PRIOR FISCAL YEAR END DISTRIBUTIONS |
| | ORDINARY
INCOME |
| | $105,641,785 |
Distributions paid to shareholders are based on net investment income and net realized gains determined on a tax basis, which may differ from net investment income and net realized gains for financial reporting purposes. These differences reflect the differing character of certain income items and net realized gains and losses for financial statement and tax purposes, and may result in reclassification among certain capital accounts on the financial statements. The fund may also designate a portion of the amount paid to redeeming shareholders as a distribution for tax purposes.
As of February 28, 2022, management has reviewed the tax positions for open periods (for federal purposes, three years from the date of filing and for state purposes, four years from the date of filing) as applicable to the fund, and has determined that no provision for income tax is required in the fund’s financial statements. The fund recognizes interest and penalties, if any, related to unrecognized tax benefits as income tax expense in the Statement of Operations. During the period ended February 28, 2022, the fund did not incur any interest or penalties.
12. Share Splits:
The Board authorized a 2-for-1 share split for the Schwab U.S. REIT ETF which applied to shareholders of record as of the close of markets on March 8, 2022, and paid after the close of markets on March 10, 2022. Shares began trading at their post-split price on March 11, 2022. The share split increased the number of shares outstanding and decreased the NAV per share. The share split did not change the total value of a shareholder’s investment. The Financial Highlights and Statement of Changes in Net Assets for the fund have been retroactively adjusted to reflect the share split in the current and prior periods presented.
13. Subsequent Events:
Management has determined there are no subsequent events or transactions through the date the financial statements were issued that would have materially impacted the financial statements as presented.
Schwab U.S. REIT ETF | Semiannual Report
Report of Independent Registered Public Accounting Firm
To the Board of Trustees of Schwab Strategic Trust and Shareholders of Schwab U.S. REIT ETF:
Opinion on the Financial Statements and Financial Highlights
We have audited the accompanying statement of assets and liabilities, including the portfolio holdings, of Schwab U.S. REIT ETF (the “Fund”), one of the funds constituting Schwab Strategic Trust, as of August 31, 2022, the related statement of operations for the period from March 1, 2022 through August 31, 2022, the statements of changes in net assets for the period from March 1, 2022 through August 31, 2022 and for the year ended February 28, 2022, and the financial highlights for the period from March 1, 2022 through August 31, 2022 and for the two years in the period ended February 28, 2022, and the related notes. In our opinion, the financial statements and financial highlights present fairly, in all material respects, the financial position of the Fund as of August 31, 2022, and the results of its operations for the period from March 1, 2022 through August 31, 2022, the changes in its net assets for the period from March 1, 2022 through August 31, 2022 and for the year ended February 28, 2022, and the financial highlights for the period from March 1, 2022 through August 31, 2022 and for the two years in the period ended February 28, 2022, in conformity with accounting principles generally accepted in the United States of America. The financial highlights for each of the three years in the period ended February 29, 2020, were audited by other auditors, whose report, dated April 16, 2020, expressed an unqualified opinion on such financial highlights.
Basis for Opinion
These financial statements are the responsibility of the Fund’s management. Our responsibility is to express an opinion on the Fund’s financial statements and financial highlights based on our audits. We are a public accounting firm registered with the Public Company Accounting Oversight Board (United States) (PCAOB) and are required to be independent with respect to the Fund in accordance with the U.S. federal securities laws and the applicable rules and regulations of the Securities and Exchange Commission and the PCAOB.
We conducted our audits in accordance with the standards of the PCAOB. Those standards require that we plan and perform the audit to obtain reasonable assurance about whether the financial statements and financial highlights are free of material misstatement, whether due to error or fraud. The Fund is not required to have, nor were we engaged to perform, an audit of its internal control over financial reporting. As part of our audits, we are required to obtain an understanding of internal control over financial reporting but not for the purpose of expressing an opinion on the effectiveness of the Fund’s internal control over financial reporting. Accordingly, we express no such opinion.
Our audits included performing procedures to assess the risks of material misstatement of the financial statements and financial highlights, whether due to error or fraud, and performing procedures that respond to those risks. Such procedures included examining, on a test basis, evidence regarding the amounts and disclosures in the financial statements and financial highlights. Our audits also included evaluating the accounting principles used and significant estimates made by management, as well as evaluating the overall presentation of the financial statements and financial highlights. Our procedures included confirmation of securities owned as of August 31, 2022 by correspondence with the custodian and brokers; when replies were not received from brokers, we performed other auditing procedures. We believe that our audits provide a reasonable basis for our opinion.
Deloitte & Touche LLP
Denver, Colorado
October 21, 2022
We have served as the auditor of one or more investment companies in the Schwab Funds Complex since 2020.
Schwab U.S. REIT ETF | Semiannual Report
Shareholder Vote Results (unaudited)
A Special Meeting of Shareholders of Schwab Strategic Trust (the “Trust”) was held on June 1, 2022, for the purpose of seeking shareholder approval to elect the following individuals as trustees of the Trust: Walter W. Bettinger II, Richard A. Wurster, Michael J. Beer, Robert W. Burns, Nancy F. Heller, David L. Mahoney, Jane P. Moncreiff, Kiran M. Patel, Kimberly S. Patmore, and J. Derek Penn. The number of votes necessary to conduct the Special Meeting and approve the proposal was obtained. The results of the shareholder vote are listed below:
Proposal – To elect each of the
following individuals as trustees of the Trust: | For | Withheld |
| Walter W. Bettinger II | 1,707,011,744.958 | 53,766,812.577 |
| Richard A. Wurster | 1,741,778,933.018 | 18,999,624.517 |
| Michael J. Beer | 1,741,911,579.511 | 18,866,978.024 |
| Robert W. Burns | 1,742,002,589.714 | 18,775,967.821 |
| Nancy F. Heller | 1,743,265,288.229 | 17,513,269.306 |
| David L. Mahoney | 1,488,067,807.852 | 272,710,749.683 |
| Jane P. Moncreiff | 1,743,396,670.121 | 17,381,887.414 |
| Kiran M. Patel | 1,738,761,227.827 | 22,017,329.708 |
| Kimberly S. Patmore | 1,740,654,694.664 | 20,123,862.871 |
| J. Derek Penn | 1,739,737,491.136 | 21,041,066.399 |
Schwab U.S. REIT ETF | Semiannual Report
Investment Advisory Agreement Approval
The Investment Company Act of 1940, as amended (the 1940 Act), requires that the continuation of a fund’s investment advisory agreement must be specifically approved (1) by the vote of the trustees or by a vote of the shareholders of the fund, and (2) by the vote of a majority of the trustees who are not parties to the investment advisory agreement or “interested persons” of any party (the Independent Trustees), cast in person at a meeting called for the purpose of voting on such approval. In connection with such approvals, the fund’s trustees must request and evaluate, and the investment adviser is required to furnish, such information as may be reasonably necessary to evaluate the terms of the investment advisory agreement.
The Board of Trustees (the Board or the Trustees, as appropriate) calls and holds one or more meetings each year that are dedicated, in whole or in part, to considering whether to renew the investment advisory agreement (the Agreement) between Schwab Strategic Trust (the Trust) and Charles Schwab Investment Management, Inc. (CSIM) (dba Schwab Asset Management) (the investment adviser) with respect to the existing funds in the Trust, including Schwab U.S. REIT ETF (the Fund), and to review certain other agreements pursuant to which the investment adviser provides investment advisory services to certain other registered investment companies. In preparation for the meeting(s), the Board requests and reviews a wide variety of materials provided by the investment adviser, including information about the investment adviser’s affiliates, personnel, business goals and priorities, profitability, third-party oversight, corporate structure and operations. As part of the renewal process, the Independent Trustees’ legal counsel, on behalf of the Independent Trustees, sends an information request letter to the investment adviser seeking certain relevant information. The responses by the investment adviser are provided to the Trustees in the Board materials for their review prior to their meeting, and the Trustees are provided with the opportunity to request any additional materials. The Board also receives data provided by an independent provider of investment company data. This information is in addition to the detailed information about the Fund that the Board reviews during the course of each year, including information that relates to the Fund’s operations and performance, legal and compliance matters, risk management, portfolio turnover, and sales and marketing activity. In considering the renewal, the Independent Trustees receive advice from Independent Trustees’ legal counsel, including a memorandum regarding the responsibilities of trustees for the approval of investment advisory agreements. In addition, the Independent Trustees participate in question and answer sessions with representatives of the investment adviser and meet in executive session outside the presence of Fund management.
The Board, including a majority of the Independent Trustees, considered information specifically relating to the continuance of the Agreement with respect to the Fund at meetings held on May 16, 2022 and June 8, 2022, and approved the renewal of the Agreement with respect to the Fund for an additional one-year term at the meeting on June 8, 2022 called for the purpose of voting on such approval.
The Board’s approval of the continuance of the Agreement with respect to the Fund was based on consideration and evaluation of a variety of specific factors discussed at these meetings and at prior meetings, including:
| 1. | the nature, extent and quality of the services provided to the Fund under the Agreement, including the resources of the investment adviser and its affiliates dedicated to the Fund; |
| 2. | the Fund’s investment performance and how it compared to that of certain other comparable exchange-traded funds and benchmark data; |
| 3. | the Fund’s expenses and how those expenses compared to those of certain other similar exchange-traded funds; |
| 4. | the profitability of the investment adviser and its affiliates, including Charles Schwab & Co., Inc. (Schwab), with respect to the Fund, including both direct and indirect benefits accruing to the investment adviser and its affiliates; and |
| 5. | the extent to which economies of scale would be realized as the Fund grows and whether fee levels in the Agreement reflect those economies of scale for the benefit of Fund investors. |
Nature, Extent and Quality of Services. The Board considered the nature, extent and quality of the services provided by the investment adviser to the Fund and the resources of the investment adviser and its affiliates dedicated to the Fund. In this regard, the Trustees evaluated, among other things, the investment adviser’s experience, track record, compliance program, resources dedicated to hiring and retaining skilled personnel and specialized talent, and information security resources. The Trustees also considered information provided by the investment adviser relating to services and support provided with respect to the Fund’s portfolio management team, portfolio strategy, and internal investment guidelines, as well as trading infrastructure, liquidity management, product design and analysis, shareholder communications, securities valuation, fund accounting and custody, and vendor and risk oversight. The Trustees also considered investments the investment adviser has made in its infrastructure, including modernizing the investment adviser’s technology and use of data, increasing expertise in key areas (including portfolio management and trade operations), and improving business
Schwab U.S. REIT ETF | Semiannual Report
continuity, cybersecurity, due diligence, risk management processes, and information security programs, which are designed to provide enhanced services to the Fund and its shareholders. The Trustees also considered Schwab’s overall financial condition and reputation as a full service brokerage firm, as well as the wide range of products, services and account features that benefit Fund shareholders who are brokerage clients of Schwab. Following such evaluation, the Board concluded, within the context of its full deliberations, that the nature, extent and quality of services provided by the investment adviser to the Fund and the resources of the investment adviser and its affiliates dedicated to the Fund supported renewal of the Agreement with respect to the Fund.
Fund Performance. The Board considered the Fund’s performance in determining whether to renew the Agreement with respect to the Fund. Specifically, the Trustees considered the Fund’s performance relative to a peer category of other exchange-traded funds and applicable indices/benchmarks, in light of total return and market trends, as well as in consideration of the Fund’s investment style and strategy attributes and disclosures. As part of this review, the Trustees considered the composition of the peer category, selection criteria and the reputation of the independent provider of investment company data who prepared the peer category analysis. In evaluating the performance of the Fund, the Trustees considered the risk profile for the Fund and the Fund’s demonstrated performance in tracking its benchmark index. The Trustees further considered the level of Fund performance in the context of their review of Fund expenses and the investment adviser’s profitability discussed below and also noted that the Board and a designated committee of the Board review performance throughout the year. Following such evaluation, the Board concluded, within the context of its full deliberations, that the performance of the Fund supported renewal of the Agreement with respect to the Fund.
Fund Expenses. With respect to the Fund’s expenses, the Trustees considered the rate of compensation called for by the Agreement and the Fund’s operating expense ratio, in each case, in comparison to those of other similar exchange-traded funds, such peer groups and comparisons having been selected and calculated by an independent provider of investment company data. The investment adviser reported to the Board, and the Board took into account, the risk assumed by the investment adviser in the development of the Fund and provision of services as well as the competitive marketplace for financial products. The Trustees also considered fees charged by the investment adviser to mutual funds and other exchange-traded funds that it manages. The Board evaluated the Fund’s unitary fee through review of comparative information with respect to fees paid by other similar exchange-traded funds tracking U.S. REIT indices. Following such evaluation, the Board concluded, within the context of its full deliberations, that the expenses of the Fund are reasonable and supported renewal of the Agreement with respect to the Fund.
Profitability. The Trustees considered the compensation flowing to the investment adviser and its affiliates, directly or indirectly and reviewed profitability on a pre-tax basis, without regard to distribution expenses. In this connection, the Trustees reviewed management’s profitability analyses. The Trustees also reviewed profitability of the investment adviser relating to the Schwab fund complex as a whole, noting the benefits to Fund shareholders of being part of the Schwab fund complex, including the allocations of certain fixed costs across the Fund and other funds in the complex. The Trustees also considered any other benefits derived by the investment adviser from its relationship with the Fund, such as whether, by virtue of its management of the Fund, the investment adviser obtains investment information or other research resources that aid it in providing advisory services to other clients. The Trustees considered whether the compensation and profitability with respect to the Fund under the Agreement and other service agreements were reasonable and justified in light of the quality of all services rendered to the Fund by the investment adviser and its affiliates. The Trustees noted that the investment adviser continues to invest substantial sums in its business in order to provide enhanced research capabilities, services and systems to benefit the Fund. Based on this evaluation, the Board concluded, within the context of its full deliberations, that the profitability of the investment adviser is reasonable and supported renewal of the Agreement with respect to the Fund.
Economies of Scale. Although the Trustees recognized the difficulty of determining economies of scale with precision, the Trustees considered the potential existence of any economies of scale by way of the relatively low advisory fee and unitary fee structure of the Fund and whether those are passed along to the Fund’s shareholders through (i) the enhancement of services provided to the Fund in return for fees paid, including through investments by the investment adviser in its infrastructure, including modernizing the investment adviser’s technology and use of data, increasing expertise and capabilities in key areas (including portfolio and trade operations), and improving business continuity, cybersecurity, due diligence and information security programs, which are designed to provide enhanced services to the Fund and its shareholders; and (ii) pricing a fund to scale and keeping overall expenses down as the fund grows. The Trustees acknowledged that the investment adviser has shared any economies of scale with the Fund by investing in the investment adviser’s infrastructure, as discussed above, over time and that the investment adviser’s internal costs of providing investment management, technology, administrative, legal and compliance services to the Fund continue to increase as a result of regulatory or other developments. Based on this evaluation, the Board concluded, within the context of its full deliberations, that the Fund obtains reasonable benefits from economies of scale.
In the course of their deliberations, the Trustees may have accorded different weights to various factors and did not
Schwab U.S. REIT ETF | Semiannual Report
identify any particular information or factor that was all important or controlling. Based on the Trustees’ deliberation and their evaluation of the information described above, the Board, including all of the Independent Trustees, approved the continuation of the Agreement with respect to the Fund and concluded that the compensation under the Agreement with
respect to the Fund is fair and reasonable in light of the services provided and the related expenses borne by the investment adviser and its affiliates and such other matters as the Trustees considered to be relevant in the exercise of their reasonable judgment.
Schwab U.S. REIT ETF | Semiannual Report
Trustees and Officers
The tables below give information about the trustees and officers of Schwab Strategic Trust, which includes the fund covered in this report. The “Fund Complex” includes The Charles Schwab Family of Funds, Schwab Capital Trust, Schwab Investments, Schwab Annuity Portfolios, Schwab Strategic Trust and Laudus Trust. The Fund Complex includes 105 funds.
The address for all trustees and officers is 211 Main Street, San Francisco, CA 94105. You can find more information about the trustees and officers in the Statement of Additional Information, which is available free by calling 1-877-824-5615.
| Independent Trustees |
Name, Year of Birth, and
Position(s) with the trust
(Terms of office, and
length of Time Served1) | Principal Occupations
During the Past Five Years | Number of
Portfolios in
Fund Complex
Overseen by
the Trustee | Other Directorships |
Michael J. Beer
1961
Trustee
(Trustee of The Charles Schwab Family of Funds, Schwab Investments, Schwab Capital Trust, Schwab Annuity Portfolios, Schwab Strategic Trust and Laudus Trust since 2022) | Retired. Director, President and Chief Executive Officer (Dec. 2016 – Sept. 2019), Principal Funds (investment management). | 105 | Director (2016 – 2019), Principal Funds, Inc. |
Robert W. Burns
1959
Trustee
(Trustee of Schwab Strategic Trust since 2009; The Charles Schwab Family of Funds, Schwab Investments, Schwab Capital Trust, Schwab Annuity Portfolios and Laudus Trust since 2016) | Retired/Private Investor. | 105 | None |
Nancy F. Heller
1956
Trustee
(Trustee of The Charles Schwab Family of Funds, Schwab Investments, Schwab Capital Trust, Schwab Annuity Portfolios, Schwab Strategic Trust and Laudus Trust since 2018) | Retired. | 105 | None |
David L. Mahoney
1954
Trustee
(Trustee of The Charles Schwab Family of Funds, Schwab Investments, Schwab Capital Trust, Schwab Annuity Portfolios and Laudus Trust since 2011; Schwab Strategic Trust since 2016) | Private Investor. | 105 | Director (2004 – present), Corcept Therapeutics Incorporated
Director (2009 – 2021), Adamas Pharmaceuticals, Inc.
Director (2003 – 2019), Symantec Corporation |
Jane P. Moncreiff
1961
Trustee
(Trustee of The Charles Schwab Family of Funds, Schwab Investments, Schwab Capital Trust, Schwab Annuity Portfolios, Schwab Strategic Trust and Laudus Trust since 2019) | Consultant (2018 – present), Fulham Advisers LLC (management consulting); Chief Investment Officer (2009 – 2017), CareGroup Healthcare System, Inc. (healthcare). | 105 | None |
Schwab U.S. REIT ETF | Semiannual Report
| Independent Trustees (continued) |
Name, Year of Birth, and
Position(s) with the trust
(Terms of office, and
length of Time Served1) | Principal Occupations
During the Past Five Years | Number of
Portfolios in
Fund Complex
Overseen by
the Trustee | Other Directorships |
Kiran M. Patel
1948
Trustee
(Trustee of The Charles Schwab Family of Funds, Schwab Investments, Schwab Capital Trust, Schwab Annuity Portfolios and Laudus Trust since 2011; Schwab Strategic Trust since 2016) | Retired. | 105 | Director (2008 – present), KLA-Tencor Corporation |
Kimberly S. Patmore
1956
Trustee
(Trustee of The Charles Schwab Family of Funds, Schwab Investments, Schwab Capital Trust, Schwab Annuity Portfolios, Schwab Strategic Trust and Laudus Trust since 2016) | Consultant (2008 – present), Patmore Management Consulting (management consulting). | 105 | None |
J. Derek Penn
1957
Trustee
(Trustee of The Charles Schwab Family of Funds, Schwab Investments, Schwab Capital Trust, Schwab Annuity Portfolios, Schwab Strategic Trust and Laudus Trust since 2021) | Head of Equity Sales and Trading (2006 – 2018), BNY Mellon (financial services). | 105 | None |
| Interested Trustees |
Name, Year of Birth, and
Position(s) with the trust
(Terms of office, and
length of Time Served1) | Principal Occupations
During the Past Five Years | Number of
Portfolios in
Fund Complex
Overseen by
the Trustee | Other Directorships |
Walter W. Bettinger II2
1960
Chairman and Trustee
(Trustee of The Charles Schwab Family of Funds, Schwab Investments, Schwab Capital Trust and Schwab Annuity Portfolios since 2008; Schwab Strategic Trust since 2009; Laudus Trust since 2010) | Co-Chairman of the Board (July 2022 – present), Director and Chief Executive Officer (Oct. 2008 – present) and President (Feb. 2007 – Oct. 2021), The Charles Schwab Corporation; President and Chief Executive Officer (Oct. 2008 – Oct. 2021) and Director (May 2008 – Oct. 2021), Charles Schwab & Co., Inc.; Director (Apr. 2006 – present), Charles Schwab Bank, SSB; Director (Nov. 2017 – present), Charles Schwab Premier Bank, SSB; Director (July 2019 – present), Charles Schwab Trust Bank; Director (May 2008 – present), Chief Executive Officer (Aug. 2017 – present), and President (Aug. 2017 – Nov. 2021), Schwab Holdings, Inc.; Director (Oct. 2020 – present), TD Ameritrade Holding Corporation; Director (July 2016 – Oct. 2021), Charles Schwab Investment Management, Inc. | 105 | Director (2008 – present), The Charles Schwab Corporation |
Schwab U.S. REIT ETF | Semiannual Report
| Interested Trustees (continued) |
Name, Year of Birth, and
Position(s) with the trust
(Terms of office, and
length of Time Served1) | Principal Occupations
During the Past Five Years | Number of
Portfolios in
Fund Complex
Overseen by
the Trustee | Other Directorships |
Richard A. Wurster2
1973
Trustee
(Trustee of The Charles Schwab Family of Funds, Schwab Investments, Schwab Capital Trust, Schwab Annuity Portfolios, Schwab Strategic Trust and Laudus Trust since 2022) | President (Oct. 2021 – present) and Executive Vice President – Schwab Asset Management Solutions (Apr. 2019 – Oct. 2021), The Charles Schwab Corporation; President, Director (Oct. 2021 – present), Executive Vice President – Schwab Asset Management Solutions (July 2019 – Oct. 2021) and Senior Vice President – Advisory (May 2016 – July 2019), Charles Schwab & Co., Inc.; President (Nov. 2021 – present), Schwab Holdings, Inc.; Director (Oct. 2021 – present) and Chief Executive Officer (Nov. 2019 – Jan. 2022), Charles Schwab Investment Management, Inc.; Director, Chief Executive Officer and President (Mar. 2018 – present), Charles Schwab Investment Advisory, Inc.; Chief Executive Officer (July 2016 – Apr. 2018) and President (Mar. 2017 – Apr. 2018), ThomasPartners, Inc.; Chief Executive Officer (July 2016 – Apr. 2018), Windhaven Investment Management, Inc. | 105 | None |
| Officers of the Trust |
Name, Year of Birth, and Position(s) with the trust
(Terms of office, and length of Time Served3) | Principal Occupations During the Past Five Years |
Jonathan de St. Paer
1973
President and Chief Executive Officer
(Officer of The Charles Schwab Family of Funds, Schwab Investments, Schwab Capital Trust, Schwab Annuity Portfolios, Schwab Strategic Trust and Laudus Trust since 2018) | Director (Apr. 2019 – present), President (Oct. 2018 – present), Chief Operating Officer (Jan. 2021 – present), and Chief Executive Officer (Apr. 2019 – Nov. 2019), Charles Schwab Investment Management, Inc.; Senior Vice President (June 2020 – Mar. 2022) and Chief Operating Officer (Jan. 2021 – Mar. 2022), Charles Schwab Investment Advisory, Inc.; Chief Executive Officer (Apr. 2019 – present), President (Nov. 2018 – present) and Trustee (Apr. 2019 – Dec. 2020), Schwab Funds, Laudus Trust and Schwab ETFs; Director (Mar. 2019 – Apr. 2022), Charles Schwab Worldwide Funds plc and Charles Schwab Asset Management (Ireland) Limited; Managing Director (May 2022 – present), Senior Vice President (Apr. 2019 – May 2022) and Senior Vice President – Strategy and Product Development (CSIM) (Jan. 2014 – Mar. 2019), Charles Schwab & Co., Inc. |
Mark Fischer
1970
Treasurer, Chief Financial Officer and Chief Operating Officer
(Officer of The Charles Schwab Family of Funds, Schwab Investments, Schwab Capital Trust, Schwab Annuity Portfolios, Schwab Strategic Trust and Laudus Trust since 2013) | Treasurer and Chief Financial Officer (Jan. 2016 – present) and Chief Operating Officer (Dec. 2020 – present), Schwab Funds, Laudus Trust and Schwab ETFs; Chief Financial Officer (Mar. 2020 – present) and Vice President (Oct. 2013 – present), Charles Schwab Investment Management, Inc.; Director (July 2020 – Apr. 2022), Charles Schwab Worldwide Funds plc and Charles Schwab Asset Management (Ireland) Limited. |
Omar Aguilar
1970
Vice President and Chief Investment Officer
(Officer of The Charles Schwab Family of Funds, Schwab Investments, Schwab Capital Trust, Schwab Annuity Portfolios, Schwab Strategic Trust and Laudus Trust since 2011) | Chief Executive Officer (Jan. 2022 – present), Chief Investment Officer (Apr. 2011 – present) and Senior Vice President (Apr. 2011 – Dec. 2021), Charles Schwab Investment Management, Inc.; Vice President and Chief Investment Officer (June 2011 – present), Schwab Funds, Laudus Trust and Schwab ETFs. |
Brett Wander
1961
Vice President and Chief Investment Officer
(Officer of The Charles Schwab Family of Funds, Schwab Investments, Schwab Capital Trust, Schwab Annuity Portfolios, Schwab Strategic Trust and Laudus Trust since 2011) | Senior Vice President and Chief Investment Officer (Apr. 2011 – present), Charles Schwab Investment Management, Inc.; Vice President and Chief Investment Officer (June 2011 – present), Schwab Funds, Laudus Trust and Schwab ETFs. |
William P. McMahon, Jr.
1972
Vice President and Chief Investment Officer
(Officer of The Charles Schwab Family of Funds, Schwab Investments, Schwab Capital Trust, Schwab Annuity Portfolios, Schwab Strategic Trust and Laudus Trust since 2021) | Senior Vice President and Chief Investment Officer (Jan. 2020 – present), Charles Schwab Investment Management, Inc.; Vice President and Chief Investment Officer (June 2021 – present), Schwab Funds, Laudus Trust and Schwab ETFs; Senior Vice President and Chief Investment Officer – ThomasPartners Strategies (Apr. 2018 – Dec. 2019), Charles Schwab Investment Advisory, Inc.; Senior Vice President and Chief Investment Officer (May 2001 – Apr. 2018), ThomasPartners, Inc. |
Schwab U.S. REIT ETF | Semiannual Report
| Officers of the Trust (continued) |
Name, Year of Birth, and Position(s) with the trust
(Terms of office, and length of Time Served3) | Principal Occupations During the Past Five Years |
Catherine MacGregor
1964
Chief Legal Officer and Secretary, Schwab Funds and Schwab ETFs
Chief Legal Officer, Vice President and Clerk, Laudus Trust
(Officer of The Charles Schwab Family of Funds, Schwab Investments, Schwab Capital Trust, Schwab Annuity Portfolios and Laudus Trust since 2005; Schwab Strategic Trust since 2009) | Chief Legal Officer (Mar. 2022 – present) and Vice President (Sept. 2005 – present), Charles Schwab Investment Management, Inc.; Managing Director (May 2022 – present) and Vice President (July 2005 – May 2022), Charles Schwab & Co., Inc.; Vice President (Dec. 2005 – present) and Chief Legal Officer and Clerk (Mar. 2007 – present), Laudus Trust; Chief Legal Officer and Secretary (Oct. 2021 – present), Vice President (Nov. 2005 – Oct. 2021) and Assistant Secretary (June 2007 – Oct. 2021), Schwab Funds; Chief Legal Officer and Secretary (Oct. 2021 – present), Vice President and Assistant Secretary (Oct. 2009 – Oct. 2021), Schwab ETFs. |
| 1 | Each Trustee shall hold office until the election and qualification of his or her successor, or until he or she dies, resigns or is removed. The retirement policy requires that each independent trustee retire by December 31 of the year in which the Trustee turns 74 or the Trustee’s twentieth year of service as an independent trustee on any trust in the Fund Complex, whichever occurs first. |
| 2 | Mr. Bettinger and Mr. Wurster are Interested Trustees. Each of Mr. Bettinger and Mr. Wurster is an Interested Trustee because he owns stock of The Charles Schwab Corporation (CSC), the parent company of Charles Schwab Investment Management, Inc., the investment adviser for the trusts in the Fund Complex, and is an employee of Charles Schwab & Co., Inc. (Schwab), the principal underwriter for The Charles Schwab Family of Funds, Schwab Investments, Schwab Capital Trust, Schwab Annuity Portfolios and Laudus Trust. |
| 3 | The President, Treasurer and Secretary/Clerk hold office until their respective successors are chosen and qualified or until he or she sooner dies, resigns, is removed or becomes disqualified. Each of the other officers serves at the pleasure of the Board. |
Schwab U.S. REIT ETF | Semiannual Report
ask See “offer.”
asset allocation The practice of dividing a portfolio among different asset classes, with each asset class assigned a particular percentage to help offset risks and rewards, based on your goals, time horizon and risk tolerance.
asset class A group of securities with similar structure and basic characteristics. Stocks, bonds and cash are the three main examples of asset classes.
authorized participant (AP) A large institutional investor that places orders for creation units with the funds’ distributor.
beta A historical measure of an investment’s volatility relative to a market index (usually the S&P 500®). The index is defined as having a beta of 1.00. Investments with a beta higher than 1.00 have been more volatile than the index; those with a beta of less than 1.00 have been less volatile.
bid The highest price at which someone is willing to buy a security.
Bloomberg US Aggregate Bond Index An index that is a broad-based benchmark measuring the performance of the U.S. investment grade, taxable bond market, including U.S. Treasuries, government-related and corporate bonds, mortgage pass-through securities, commercial mortgage-backed securities, and asset-backed securities that are publicly available for sale in the United States. To be eligible for inclusion in the index, securities must be fixed rate, non-convertible, U.S. dollar-denominated with at least $300 million or more of outstanding face value and have one or more years remaining to maturity. The index excludes certain types of securities, including tax-exempt state and local government series bonds, structured notes embedded with swaps or other special features, private placements, floating rate securities, inflation-linked bonds and Eurobonds. The index is market capitalization weighted and the securities in the index are updated on the last business day of each month.
cap, capitalization See “market cap.”
capital gain, capital loss The difference between the amount paid for an investment and its value at a later time. If the investment has been sold, the capital gain or loss is considered a realized gain or loss. If the investment is still held, the gain or loss is still “on paper” and is considered unrealized.
commencement of operations The date that the first NAV was calculated.
creation unit (C.U.) A basket of securities that is delivered by an authorized participant (AP) to the fund equal to the current holdings of the ETF, plus a designated cash component. In return, the APs receive a large block of ETF shares (typically 50,000 shares), which investors can then buy and sell in the secondary market.
Dow Jones Equity All REIT Capped Index A float-adjusted market cap weighted index that is designed to measure all equity real estate investment trusts (REITs) in the Dow Jones U.S. Total Stock Market Index, as defined by the S&P Dow Jones Indices REIT/RESI Industry Classification Hierarchy, that meet the minimum float market capitalization (FMC) and liquidity thresholds. The aggregate weight of all companies weighing more than 4.5% cannot exceed 22.5%, and no single company’s weight can exceed 10%. The index is reviewed daily based on each company’s capped market capitalization weight. Daily capping is only performed when the sum of companies with weights great than 5% exceeds 25%.
Dow Jones U.S. Select REIT Index An index that is a float-adjusted market-capitalization weighted index comprised of income-producing commercial and/or residential real estate investment trusts (REITs). The index excludes mortgage REITs, net-lease REITs, real estate finance companies, mortgage brokers and bankers, commercial and residential real estate brokers and estate agents, homebuilders, large landowners and sub-dividers of unimproved land, hybrid REITs, timber REITs and companies that have more than 25% of their assets in direct mortgage investments.
exchange A marketplace, or any organization or group that provides or maintains a marketplace for trading securities, options, futures, or commodities.
expense ratio The amount that is taken from the fund’s assets each year to cover the operating expenses. An expense ratio of 0.50% means that a fund’s expenses amount to half of one percent of its average net assets a year.
FTSE EPRA Nareit Global Index (Net) An index that provides a diverse representation of publicly traded equity real estate investment trusts (REITs) and listed property companies worldwide. The index constituents are free-float adjusted, and screened on liquidity, size and revenue. The index is comprised of countries in developed and emerging markets. The Net of Tax Index is calculated based on the maximum withholding tax rates applicable to dividends received by institutional investors who are not resident in the same country as the remitting company and who do not benefit from double taxation treaties.
inception date The date that the shares began trading in the secondary market.
indicative optimized portfolio value (IOPV) A calculation disseminated by the stock exchange that approximates the fund’s NAV every 15 seconds throughout the trading day.
liquidity The ability to convert a security or asset quickly into cash.
market cap, market capitalization The value of a company as determined by the total value of all shares of its stock outstanding.
market price return The return based on the change in market price per share of the fund over a given time period. Market price returns assume that dividends and capital gain distributions have been reinvested in the fund at market price.
median market cap The midpoint of the range of market caps of the stocks held by a fund. There are different ways of calculating median market cap. With a simple median, half of the stocks in the fund’s portfolio would be larger than the median, and half would be smaller. With a weighted median (the type that is calculated for these funds), half of the fund’s assets are invested in stocks that are larger than the median market cap, and half in stocks that are smaller.
MSCI EAFE Index (Net) A free float-adjusted market capitalization index that is designed to measure the equity market performance of developed markets in Europe, Australasia, and the Far East. The Net version of the index reflects reinvested dividends net of withholding taxes, but reflects no deductions for expenses or other taxes; returns are calculated applying dividend withholding rates applicable to non-resident persons who do not benefit from double taxation treaties.
net asset value (NAV) The value of one share of a fund. NAV is calculated by taking the fund’s total assets, subtracting liabilities, and dividing by the number of shares outstanding.
Schwab U.S. REIT ETF | Semiannual Report
NAV return The return based on the change in NAV of the fund over a given time period. NAV returns assume that dividends and capital gain distributions have been reinvested in the fund.
offer (ask) The lowest price at which an individual is willing to sell a security.
open The price at which a security opened for trading on a given day.
outstanding shares, shares outstanding When speaking of the fund, indicates all shares currently held by investors.
price-to-book ratio (P/B) The market price of a company’s stock compared with its “book value.” A mutual fund’s P/B is the weighted average of the P/B of all stocks in the fund’s portfolio.
price-to-earnings ratio (P/E) The market price of a company’s stock compared with earnings over the past year. A mutual fund’s P/E is the weighted average of the P/E of all stocks in the fund’s portfolio.
primary market The market that deals with the issuance of new securities.
real estate investment trust (REIT) Real estate companies that own and commonly operate income producing commercial and/or residential real estate.
REIT Spliced Index An internally calculated index, compromised of the Dow Jones U.S. Select REIT Index from the inception of the Schwab U.S. REIT ETF until the close of business on June 19, 2020, and the Dow Jones Equity All REIT Capped Index thereafter. The REIT Spliced Index is published with the permission of S&P Dow Jones Indices LLC, but is not calculated, sponsored or endorsed by S&P Dow Jones Indices LLC.
rights and warrants Rights and warrants are types of securities that entitle the holder to purchase a proportionate amount of common stock at a specified price for a specific period of time. Rights allow a
shareholder to buy more shares directly from the company, usually at a price somewhat lower than the current market price of the outstanding shares. Warrants are usually issued with bonds and preferred stock. Rights and warrants can trade on the market separately from the company’s stock. The prices of rights and warrants do not necessarily move parallel to the prices of the underlying common stock. Rights usually expire within a few weeks of issuance, while warrants may not expire for several years. If a right or warrant is not exercised within the specified time period, it will become worthless and a fund will lose the purchase price it paid for the right or warrant and the right to purchase the underlying security.
S&P 500 Index An index that is designed to measure the performance of 500 leading publicly traded companies from a broad range of industries.
sampling If a fund uses a sampling method, the fund will not fully replicate the benchmark index and may hold securities not included in the index. A fund that utilizes a sampling approach may not track the return of the index.
secondary market The market in which investors purchase securities from other investors rather than directly from the issuing companies. Organized exchanges facilitate the trading of securities in the secondary market.
spread The gap between bid and ask prices of a security.
stock A share of ownership, or equity, in the issuing company.
total return The percentage that an investor would have earned or lost on an investment in the fund assuming dividends and distributions were reinvested.
tracking error The difference between the performance of the fund and its benchmark index, positive or negative.
Schwab U.S. REIT ETF | Semiannual Report
Schwab ETFs
Schwab ETFs are designed to serve as simple low-cost core investment products for a diversified portfolio. These ETFs seek to provide consistent, repeatable performance through a variety of investment strategies that span the equity and fixed income spectrum. The list below shows all currently available Schwab ETFs.
Investors should carefully consider information contained in the prospectus, or if available, the summary prospectus, including investment objectives, risks, charges and expenses before investing. Please call 1-877-824-5615 for a prospectus for any Schwab ETF. Please read the prospectus carefully before you invest. This report must be preceded or accompanied by a current prospectus.
Proxy Voting Policies, Procedures and Results
A description of the proxy voting policies and procedures used to determine how to vote proxies on behalf of the funds is available without charge, upon request, by visiting the Schwab ETFs’ website at www.schwabassetmanagement.com/schwabetfs_prospectus, the SEC’s website at www.sec.gov, or by contacting Schwab ETFs at 1-877-824-5615.
Information regarding how a fund voted proxies relating to portfolio securities during the most recent twelve-month period ended June 30 is available, without charge, by visiting the fund’s website at www.schwabassetmanagement.com/schwabetfs_prospectus or the SEC’s website at www.sec.gov.
U.S. ETFs
Schwab U.S. Broad Market ETF
Schwab 1000 Index® ETF
Schwab U.S. Large-Cap ETF
Schwab U.S. Large-Cap Growth ETF
Schwab U.S. Large-Cap Value ETF
Schwab U.S. Mid-Cap ETF
Schwab U.S. Small-Cap ETF
Schwab U.S. Dividend Equity ETF
Schwab U.S. REIT ETF
International ETFs
Schwab International Dividend Equity ETF
Schwab International Equity ETF
Schwab International Small-Cap Equity ETF
Schwab Emerging Markets Equity ETF
Fixed-Income ETFs
Schwab U.S. TIPS ETF
Schwab Short-Term U.S. Treasury ETF
Schwab Intermediate-Term U.S. Treasury ETF
Schwab Long-Term U.S. Treasury ETF
Schwab U.S. Aggregate Bond ETF
Schwab 1-5 Year Corporate Bond ETF
Schwab 5-10 Year Corporate Bond ETF
Schwab Municipal Bond ETF
Fundamental Index* ETFs
Schwab Fundamental U.S. Broad Market Index ETF
Schwab Fundamental U.S. Large Company Index ETF
Schwab Fundamental U.S. Small Company Index ETF
Schwab Fundamental International Large Company Index ETF
Schwab Fundamental International Small Company Index ETF
Schwab Fundamental Emerging Markets Large Company
Index ETF
Active, Semi-Transparent (Also Known As Non-Transparent) ETF
Schwab Ariel ESG ETF
Thematic ETFs
Schwab Crypto Thematic ETF
Investment Adviser
Charles Schwab Investment Management, Inc., dba Schwab Asset Management
211 Main Street, San Francisco, CA 94105
Schwab ETFs
1-877-824-5615
© 2022 Charles Schwab Investment Management, Inc., dba Schwab Asset Management. All rights reserved.
Printed on recycled paper.
| * | FUNDAMENTAL INDEX is a registered trademark of Research Affiliates LLC. |
The Schwab Ariel ESG ETF is different from traditional ETFs. Traditional ETFs tell the public what assets they hold each day. This fund will not. This may create additional risks for your investment. For example:
| • | You may have to pay more money to trade the fund’s shares. This fund will provide less information to traders, who tend to charge more for trades when they have less information. |
| • | The price you pay to buy fund shares on an exchange may not match the value of the fund’s portfolio. The same is true when you sell shares. These price differences may be greater for this fund compared to other ETFs because it provides less information to traders. |
| • | These additional risks may be even greater in bad or uncertain market conditions. |
| • | The ETF will publish on its website each day a “Proxy Portfolio” designed to help trading in shares of the ETF. While the Proxy Portfolio includes some of the ETF’s holdings, it is not the ETF’s actual portfolio. |
The differences between this fund and other ETFs may also have advantages. By keeping certain information about the fund secret, this fund may face less risk that other traders can predict or copy its investment strategy. This may improve the fund’s performance. If other traders are able to copy or predict the fund’s investment strategy, however, this may hurt the fund’s performance.
For additional information regarding the unique attributes and risks of the fund, see Proxy Portfolio Risk, Premium/Discount Risk, Trading Halt Risk, Authorized Participant Concentration Risk, Tracking Error Risk and Shares of the Fund May Trade at Prices Other Than NAV in the Principal Risks and Proxy Portfolio and Proxy Overlap sections of the prospectus and/or the Statement of Additional Information. These risks are discussed on the next page.
Active semi-transparent ETFs operate differently from other exchange-traded funds (ETFs). Unlike other ETFs, an active semi-transparent ETF does not publicly disclose its entire portfolio composition each business day, which may affect the price at which shares of the ETF trade in the secondary market. Active semi-transparent ETFs have limited public trading history. There can be no assurance that an active trading market will develop, be maintained or operate as intended. There is a risk that the market price of an active semi-transparent ETF may vary significantly from the ETF’s net asset value and that its shares may trade at a wider bid/ask spread and, therefore, cost investors more to trade than shares of other ETFs. These risks are heightened during periods of market disruption or volatility.
Proxy Portfolio Risk: Unlike traditional ETFs, this fund does not disclose its portfolio holdings (Actual Portfolio) daily. The fund instead posts a Proxy Portfolio on its website each day. The Proxy Portfolio is designed to reflect the economic exposures and risk characteristics of the fund’s actual holdings on each trading day, but it is not the same as the fund’s Actual Portfolio. Although the Proxy Portfolio is intended to provide investors with enough information to allow for an effective arbitrage mechanism that will keep the market price of the Fund at or close to the underlying NAV per Share of the Fund, there is a risk (which may increase during periods of market disruption or volatility) that market prices will vary significantly from the underlying NAV of the fund. ETF trading on the basis of a published Proxy Portfolio may trade at a wider bid/ask spread than ETFs that publish their portfolios on a daily basis, especially during periods of market disruption or volatility, and therefore may cost investors more to trade. Also, while the Fund seeks to benefit from keeping its portfolio information secret, market participants may attempt to use the Proxy Portfolio to identify a Fund’s trading strategy, which if successful, could result in such market participants engaging in certain predatory trading practices that may have the potential to harm the Fund and its shareholders.
Proxy Portfolio Construction: The Proxy Portfolio is designed to recreate the daily performance of the Actual Portfolio. This is achieved by performing a “Factor Model” analysis of the Actual Portfolio. The Factor Model is comprised of three sets of factors or analytical metrics: market-based factors, fundamental factors, and industry/sector factors. The fund uses a “Model Universe” to generate its Proxy Portfolio. The Model Universe is comprised of securities that the fund can purchase and will be a financial index or stated portfolio of securities from which fund investments will be selected. The results of the Factor Model analysis are then applied to the Model Universe. The Proxy Portfolio is then generated as a result of this Model Universe analysis with the Proxy Portfolio being a small sub-set of the Model Universe. The Factor Model is applied to both the Actual Portfolio and the Model Universe to construct the fund’s Proxy Portfolio that performs in a manner substantially identical to the performance of its Actual Portfolio. The Proxy Portfolio will only include investments the fund is permitted to hold. The fund’s SAI contains more information on the Proxy Portfolio and its construction.
Proxy Portfolio and Proxy Overlap Information regarding the contents of the Proxy Portfolio, and the percentage weight overlap between the holdings of the Proxy Portfolio and the fund’s Actual Portfolio holdings that formed the basis for its calculation of NAV at the end of the prior Business Day (the Portfolio Overlap), is available by visiting the fund’s website www.schwabassetmanagement.com.
Because environmental, social and governance (ESG) strategies exclude some securities, ESG-focused products may not be able to take advantage of the same opportunities or market trends as products that do not use such strategies. Additionally, the criteria used to select companies for investment may result in investing in securities, industries or sectors that underperform the market as a whole.
This page is intentionally left blank.
Item 2: Code of Ethics.
Not applicable to this semi-annual report.
Item 3: Audit Committee Financial Expert.
Not applicable to this semi-annual report.
Item 4: Principal Accountant Fees and Services.
Not applicable to this semi-annual report.
Item 5: Audit Committee of Listed Registrants.
Not applicable to this semi-annual report.
Item 6: Schedule of Investments.
The schedules of investments are included as part of the report to shareholders filed under Item 1 of this Form.
Item 7: Disclosure of Proxy Voting Policies and Procedures for Closed-End Management Investment Companies.
Not applicable.
Item 8: Portfolio Managers of Closed-End Management Investment Companies.
Not applicable.
Item 9: Purchases of Equity Securities by Closed-End Management Investment Company and Affiliated Purchasers.
Not applicable.
Item 10: Submission of Matters to a Vote of Security Holders.
Not applicable.
Item 11: Controls and Procedures.
| (a) | Based on their evaluation of Registrant’s disclosure controls and procedures, as of a date within 90 days of the filing date, Registrant’s Chief Executive Officer, Jonathan de St. Paer and Registrant’s Chief Financial Officer, Mark Fischer, have concluded that Registrant’s disclosure controls and procedures are: (i) reasonably designed to ensure that information required to be disclosed in this report is appropriately communicated to Registrant’s officers to allow timely decisions regarding disclosures required in this report; (ii) reasonably designed to ensure that information required to be disclosed in this report is recorded, processed, summarized and reported in a timely manner; and (iii) are effective in achieving the goals described in (i) and (ii) above. |
| (b) | During the period covered by this report, there have been no changes in Registrant’s internal control over financial reporting that the above officers believe to have materially affected, or to be reasonably likely to materially affect, Registrant’s internal control over financial reporting. |
Item 12: Disclosure of Securities Lending Activities for Closed-End Management Investment Companies.
Not applicable.
Item 13: Exhibits.
(a) (1) Code of ethics – not applicable to this semi-annual report.
Pursuant to the requirements of the Securities Exchange Act of 1934 and the Investment Company Act of 1940, the registrant has duly caused this report to be signed on its behalf by the undersigned, thereunto duly authorized.
(Registrant) Schwab Strategic Trust - Schwab U.S. REIT ETF
| | |
| By: | | /s/ Jonathan de St. Paer |
| | Jonathan de St. Paer Chief Executive Officer |
| |
| Date: | | October 21, 2022 |
Pursuant to the requirements of the Securities Exchange Act of 1934 and the Investment Company Act of 1940, this report has been signed below by the following persons on behalf of the registrant and in the capacities and on the dates indicated.
| | |
| By: | | /s/ Jonathan de St. Paer |
| | Jonathan de St. Paer Chief Executive Officer |
| |
| Date: | | October 21, 2022 |
| | |
| By: | | /s/ Mark Fischer |
| | Mark Fischer Chief Financial Officer |
| |
| Date: | | October 21, 2022 |