UNITED STATES
SECURITIES AND EXCHANGE COMMISSION
Washington, D.C. 20549
FORM N-CSRS
CERTIFIED SHAREHOLDER REPORT OF REGISTERED
MANAGEMENT INVESTMENT COMPANIES
Investment Company Act file number: 811-22311
Schwab Strategic Trust – Schwab Fixed-Income ETFs and Schwab Municipal Bond ETF
(Exact name of registrant as specified in charter)
211 Main Street, San Francisco, California 94105
(Address of principal executive offices) (Zip code)
Jonathan de St. Paer
Schwab Strategic Trust – Schwab Fixed-Income ETFs
211 Main Street, San Francisco, California 94105
(Name and address of agent for service)
Registrant’s telephone number, including area code: (415) 636-7000
Date of fiscal year end: December 31
Date of reporting period: June 30, 2023
Item 1: Report(s) to Shareholders.

Schwab U.S. TIPS ETF | SCHP |
Schwab Short-Term U.S. Treasury ETF | SCHO |
Schwab Intermediate-Term U.S. Treasury ETF | SCHR |
Schwab Long-Term U.S. Treasury ETF | SCHQ |
Schwab U.S. Aggregate Bond ETF | SCHZ |
Schwab 1-5 Year Corporate Bond ETF | SCHJ |
Schwab 5-10 Year Corporate Bond ETF | SCHI |
2 | |
3 | |
4 | |
5 | |
6 | |
7 | |
8 | |
9 | |
10 | |
11 | |
12 | |
18 | |
24 | |
30 | |
36 | |
113 | |
143 | |
172 | |
184 | |
187 | |
191 |
Total Returns for the 6 Months Ended June 30, 2023 | |
Schwab U.S. TIPS ETF (Ticker Symbol: SCHP) | |
Market Price Return1 | 2.05% |
NAV Return1 | 2.01% |
Bloomberg US Treasury Inflation-Linked Bond Index (Series-L)SM | 1.87% |
ETF Category: Morningstar Inflation-Protected Bond2 | 1.30% |
Performance Details | page 4 |
Schwab Short-Term U.S. Treasury ETF (Ticker Symbol: SCHO) | |
Market Price Return1 | 1.03% |
NAV Return1 | 0.99% |
Bloomberg US Treasury 1-3 Year Index | 0.98% |
ETF Category: Morningstar Short Government2 | 1.06% |
Performance Details | page 5 |
Schwab Intermediate-Term U.S. Treasury ETF (Ticker Symbol: SCHR) | |
Market Price Return1 | 1.34% |
NAV Return1 | 1.32% |
Bloomberg US Treasury 3-10 Year Index | 1.19% |
ETF Category: Morningstar Intermediate Government2 | 1.68% |
Performance Details | page 6 |
Schwab Long-Term U.S. Treasury ETF (Ticker Symbol: SCHQ) | |
Market Price Return1 | 4.53% |
NAV Return1 | 4.29% |
Bloomberg US Long Treasury Index | 3.72% |
ETF Category: Morningstar Long Government2 | 4.21% |
Performance Details | page 7 |
Total Returns for the 6 Months Ended June 30, 2023 | |
Schwab U.S. Aggregate Bond ETF (Ticker Symbol: SCHZ) | |
Market Price Return1 | 2.41% |
NAV Return1 | 2.21% |
Bloomberg US Aggregate Bond Index | 2.09% |
ETF Category: Morningstar Intermediate Core Bond2 | 2.16% |
Performance Details | page 8 |
Schwab 1-5 Year Corporate Bond ETF (Ticker Symbol: SCHJ) | |
Market Price Return1 | 1.98% |
NAV Return1 | 1.76% |
Bloomberg US 1-5 Year Corporate Bond Index | 1.75% |
ETF Category: Morningstar Short-Term Bond2 | 1.76% |
Performance Details | page 9 |
Schwab 5-10 Year Corporate Bond ETF (Ticker Symbol: SCHI) | |
Market Price Return1 | 3.69% |
NAV Return1 | 3.29% |
Bloomberg US 5-10 Year Corporate Bond Index | 3.14% |
ETF Category: Morningstar Corporate Bond2 | 3.22% |
Performance Details | page 10 |
 | Matthew Hastings, CFA, Managing Director and Head of Taxable Bond Strategies for Schwab Asset Management, leads the portfolio management team for the Schwab Fixed-Income ETFs and Schwab Taxable Bond Funds. He also has overall responsibility for all aspects of the management of the funds. Prior to joining Schwab in 1999, Mr. Hastings was in fixed-income sales and trading at Lehman Brothers. He has worked in the fixed-income securities industry since 1996. |
 | Steven Hung, Senior Portfolio Manager for Schwab Asset Management, is responsible for the day-to-day co-management of the Schwab U.S. Aggregate Bond ETF, Schwab 1-5 Year Corporate Bond ETF and Schwab 5-10 Year Corporate Bond ETF. He is primarily responsible for the management and oversight of corporate bonds within the taxable bond strategies, with additional responsibility for managing municipal bond index strategies. Mr. Hung has been a portfolio manager with Schwab Asset Management since 2005 and prior to that, served in various roles as an associate portfolio manager and trader since 1999. In 1998, he joined Charles Schwab & Co.’s management training program and worked as a clerk on the options trading floor of the Pacific Coast Stock Exchange. |
 | Mark McKissick, CFA, Senior Portfolio Manager for Schwab Asset Management, is responsible for the day-to-day co-management of the Schwab U.S. TIPS ETF, Schwab Short-Term U.S. Treasury ETF, Schwab Intermediate-Term U.S. Treasury ETF, Schwab Long-Term U.S. Treasury ETF and Schwab U.S. Aggregate Bond ETF. Prior to joining Schwab in 2016, Mr. McKissick worked at Denver Investments for 17 years, most recently as a director of fixed income and portfolio manager. In this role he co-managed multiple bond strategies, as well as oversaw the firm’s fixed-income business including the investment process, client service and other administrative functions. He also served as a credit/security analyst from 1999 to 2005. Prior to that, he worked as a senior research analyst with Hotchkis & Wiley, a portfolio manager at Payden & Rygel, and a vice president in fixed income at Salomon Brothers. |
 | Alfonso Portillo, Jr., Senior Portfolio Manager for Schwab Asset Management, is responsible for the day-to-day co-management of the Schwab U.S. Aggregate Bond ETF. His primary focus is securitized products. Prior to joining Schwab in 2007, Mr. Portillo worked for ten years at Pacific Investment Management Company, most recently as a vice president and member of the mortgage- and asset-backed portfolio management team. He has worked in fixed-income asset management since 1996. |
Fund and Inception Date | 6 Months | 1 Year | 5 Years | 10 Years |
Fund: Schwab U.S. TIPS ETF (8/5/10) | ||||
Market Price Return2 | 2.05% | -1.36% | 2.45% | 2.04% |
NAV Return2 | 2.01% | -1.45% | 2.44% | 2.02% |
Bloomberg US Treasury Inflation-Linked Bond Index (Series-L)SM | 1.87% | -1.40% | 2.49% | 2.08% |
ETF Category: Morningstar Inflation-Protected Bond3 | 1.30% | -1.30% | 2.17% | 1.65% |
Fund Expense Ratio4: 0.04% | ||||

Weighted Average Maturity8 | 7.2 Yrs |
Weighted Average Duration8 | 6.7 Yrs |
Fund and Inception Date | 6 Months | 1 Year | 5 Years | 10 Years |
Fund: Schwab Short-Term U.S. Treasury ETF (8/5/10) | ||||
Market Price Return2 | 1.03% | 0.16% | 0.88% | 0.69% |
NAV Return2 | 0.99% | 0.10% | 0.88% | 0.68% |
Bloomberg US Treasury 1-3 Year Index | 0.98% | 0.15% | 0.93% | 0.75% |
ETF Category: Morningstar Short Government3 | 1.06% | -0.44% | 0.51% | 0.51% |
Fund Expense Ratio4: 0.03% | ||||

Weighted Average Maturity7 | 2.0 Yrs |
Weighted Average Duration7 | 1.9 Yrs |
Fund and Inception Date | 6 Months | 1 Year | 5 Years | 10 Years |
Fund: Schwab Intermediate-Term U.S. Treasury ETF (8/5/10) | ||||
Market Price Return2 | 1.34% | -1.91% | 0.70% | 1.04% |
NAV Return2 | 1.32% | -1.89% | 0.70% | 1.03% |
Bloomberg US Treasury 3-10 Year Index | 1.19% | -1.85% | 0.75% | 1.10% |
ETF Category: Morningstar Intermediate Government3 | 1.68% | -1.96% | 0.13% | 0.74% |
Fund Expense Ratio4: 0.03% | ||||

Weighted Average Maturity7 | 5.6 Yrs |
Weighted Average Duration7 | 5.1 Yrs |
Fund and Inception Date | 6 Months | 1 Year | 3 Years | Since Inception* |
Fund: Schwab Long-Term U.S. Treasury ETF (10/10/19) | ||||
Market Price Return2 | 4.53% | -6.87% | -12.05% | -6.34% |
NAV Return2 | 4.29% | -6.83% | -12.10% | -6.37% |
Bloomberg US Long Treasury Index | 3.72% | -6.82% | -12.09% | -6.36% |
ETF Category: Morningstar Long Government3 | 4.21% | -7.69% | -12.20% | N/A |
Fund Expense Ratio4: 0.03% | ||||

Weighted Average Maturity8 | 23.0 Yrs |
Weighted Average Duration8 | 16.0 Yrs |
Fund and Inception Date | 6 Months | 1 Year | 5 Years | 10 Years |
Fund: Schwab U.S. Aggregate Bond ETF (7/14/11) | ||||
Market Price Return2 | 2.41% | -0.82% | 0.72% | 1.49% |
NAV Return2 | 2.21% | -1.01% | 0.71% | 1.46% |
Bloomberg US Aggregate Bond Index | 2.09% | -0.94% | 0.77% | 1.52% |
ETF Category: Morningstar Intermediate Core Bond3 | 2.16% | -0.89% | 0.63% | 1.36% |
Fund Expense Ratio4: 0.03% | ||||
Weighted Average Maturity8 | 8.6 Yrs |
Weighted Average Duration8 | 6.3 Yrs |
Fund and Inception Date | 6 Months | 1 Year | 3 Years | Since Inception* |
Fund: Schwab 1-5 Year Corporate Bond ETF (10/10/19) | ||||
Market Price Return2 | 1.98% | 1.77% | -0.98% | 0.28% |
NAV Return2 | 1.76% | 1.66% | -0.92% | 0.26% |
Bloomberg US 1-5 Year Corporate Bond Index | 1.75% | 1.72% | -0.82% | 0.35% |
ETF Category: Morningstar Short-Term Bond3 | 1.76% | 1.42% | -0.40% | N/A |
Fund Expense Ratio4: 0.03% | ||||

Weighted Average Maturity7 | 3.0 Yrs |
Weighted Average Duration7 | 2.7 Yrs |
Fund and Inception Date | 6 Months | 1 Year | 3 Years | Since Inception* |
Fund: Schwab 5-10 Year Corporate Bond ETF (10/10/19) | ||||
Market Price Return2 | 3.69% | 2.22% | -3.14% | -0.92% |
NAV Return2 | 3.29% | 1.94% | -3.15% | -0.97% |
Bloomberg US 5-10 Year Corporate Bond Index | 3.14% | 2.02% | -3.04% | -0.89% |
ETF Category: Morningstar Corporate Bond3 | 3.22% | 1.58% | -3.04% | N/A |
Fund Expense Ratio4: 0.03% | ||||

Weighted Average Maturity7 | 7.5 Yrs |
Weighted Average Duration7 | 6.2 Yrs |
EXPENSE RATIO (ANNUALIZED) 1 | BEGINNING ACCOUNT VALUE AT 1/1/23 | ENDING ACCOUNT VALUE (NET OF EXPENSES) AT 6/30/23 | EXPENSES PAID DURING PERIOD 1/1/23-6/30/23 2 | |
Schwab U.S. TIPS ETF | ||||
Actual Return | 0.04% | $1,000.00 | $1,020.10 | $0.20 |
Hypothetical 5% Return | 0.04% | $1,000.00 | $1,024.60 | $0.20 |
Schwab Short-Term U.S. Treasury ETF | ||||
Actual Return | 0.03% | $1,000.00 | $1,009.90 | $0.15 |
Hypothetical 5% Return | 0.03% | $1,000.00 | $1,024.65 | $0.15 |
Schwab Intermediate-Term U.S. Treasury ETF | ||||
Actual Return | 0.03% | $1,000.00 | $1,013.20 | $0.15 |
Hypothetical 5% Return | 0.03% | $1,000.00 | $1,024.65 | $0.15 |
Schwab Long-Term U.S. Treasury ETF | ||||
Actual Return | 0.03% | $1,000.00 | $1,042.90 | $0.15 |
Hypothetical 5% Return | 0.03% | $1,000.00 | $1,024.65 | $0.15 |
Schwab U.S. Aggregate Bond ETF | ||||
Actual Return | 0.03% | $1,000.00 | $1,022.10 | $0.15 |
Hypothetical 5% Return | 0.03% | $1,000.00 | $1,024.65 | $0.15 |
Schwab 1-5 Year Corporate Bond ETF | ||||
Actual Return | 0.03% | $1,000.00 | $1,017.60 | $0.15 |
Hypothetical 5% Return | 0.03% | $1,000.00 | $1,024.65 | $0.15 |
Schwab 5-10 Year Corporate Bond ETF | ||||
Actual Return | 0.03% | $1,000.00 | $1,032.90 | $0.15 |
Hypothetical 5% Return | 0.03% | $1,000.00 | $1,024.65 | $0.15 |
1 | Based on the most recent six-month expense ratio. |
2 | Expenses for each fund are equal to its annualized expense ratio, multiplied by the average account value over the period, multiplied by 181 days in the period, and divided by 365 days in the fiscal year. |
1/1/23– 6/30/23* | 1/1/22– 12/31/22 | 1/1/21– 12/31/21 | 1/1/20– 12/31/20 | 1/1/19– 12/31/19 | 1/1/18– 12/31/18 | |
Per-Share Data | ||||||
Net asset value at beginning of period | $51.77 | $62.83 | $62.06 | $56.57 | $53.27 | $55.39 |
Income (loss) from investment operations: | ||||||
Net investment income (loss)1 | 0.77 | 3.62 | 2.93 | 0.81 | 1.21 | 1.51 |
Net realized and unrealized gains (losses) | 0.27 | (10.95 ) | 0.60 | 5.37 | 3.23 | (2.23 ) |
Total from investment operations | 1.04 | (7.33 ) | 3.53 | 6.18 | 4.44 | (0.72 ) |
Less distributions: | ||||||
Distributions from net investment income | (0.42 ) | (3.73 ) | (2.76 ) | (0.69 ) | (1.14 ) | (1.40 ) |
Net asset value at end of period | $52.39 | $51.77 | $62.83 | $62.06 | $56.57 | $53.27 |
Total return | 2.01 %2 | (11.96 %) | 5.80 % | 10.94 % | 8.36 % | (1.31 %) |
Ratios/Supplemental Data | ||||||
Ratios to average net assets: | ||||||
Total expenses | 0.04 %3 | 0.05 %4,5 | 0.05 % | 0.05 % | 0.05 % | 0.05 % |
Net investment income (loss) | 2.92 %3 | 6.34 % | 4.69 % | 1.36 % | 2.18 % | 2.80 % |
Portfolio turnover rate6 | 11 %2 | 18 % | 19 % | 23 % | 20 % | 17 % |
Net assets, end of period (x 1,000,000) | $11,480 | $13,832 | $21,304 | $14,090 | $8,734 | $5,779 |
* | Unaudited. |
1 | Calculated based on the average shares outstanding during the period. |
2 | Not annualized. |
3 | Annualized. |
4 | Effective July 1, 2022, the annual operating expense ratio was reduced to 0.03%. The ratio presented for the period ended December 31, 2022 is a blended ratio. |
5 | Ratio includes less than 0.005% of non-routine proxy expenses. |
6 | Portfolio turnover rate excludes securities received or delivered from processing of in-kind creations or redemptions. |
SECURITY RATE, MATURITY DATE | FACE AMOUNT ($) | VALUE ($) |
TREASURIES 99.7% OF NET ASSETS | ||
U.S. Treasury Inflation Protected Securities | ||
0.13%, 07/15/24 | 387,120,704 | 375,646,377 |
0.13%, 10/15/24 | 345,324,285 | 333,160,620 |
0.25%, 01/15/25 | 354,016,160 | 339,404,752 |
2.38%, 01/15/25 | 241,309,216 | 238,887,716 |
0.13%, 04/15/25 | 282,882,057 | 269,186,883 |
0.38%, 07/15/25 | 388,207,383 | 371,614,980 |
0.13%, 10/15/25 | 344,154,938 | 326,440,086 |
0.63%, 01/15/26 | 326,846,811 | 311,774,368 |
2.00%, 01/15/26 | 155,740,594 | 153,716,203 |
0.13%, 04/15/26 | 265,810,782 | 249,309,020 |
0.13%, 07/15/26 | 325,777,143 | 306,089,146 |
0.13%, 10/15/26 | 367,870,111 | 344,073,543 |
0.38%, 01/15/27 | 303,371,916 | 284,721,954 |
2.38%, 01/15/27 | 150,568,843 | 151,404,255 |
0.13%, 04/15/27 | 375,789,576 | 347,897,696 |
0.38%, 07/15/27 | 334,461,044 | 313,612,766 |
1.63%, 10/15/27 | 376,834,512 | 371,421,296 |
0.50%, 01/15/28 | 341,558,651 | 319,611,226 |
1.75%, 01/15/28 | 141,565,848 | 139,995,896 |
1.25%, 04/15/28 | 372,711,416 | 360,761,632 |
3.63%, 04/15/28 | 144,940,449 | 155,658,279 |
0.75%, 07/15/28 | 297,318,538 | 281,941,768 |
0.88%, 01/15/29 | 255,016,003 | 241,549,118 |
2.50%, 01/15/29 | 130,716,420 | 134,733,271 |
3.88%, 04/15/29 | 168,158,129 | 185,904,187 |
0.25%, 07/15/29 | 301,304,038 | 275,322,459 |
0.13%, 01/15/30 | 340,355,739 | 305,493,179 |
0.13%, 07/15/30 | 376,873,988 | 338,083,219 |
0.13%, 01/15/31 | 390,067,923 | 346,875,549 |
0.13%, 07/15/31 | 398,620,572 | 353,792,201 |
0.13%, 01/15/32 | 435,019,416 | 383,260,906 |
3.38%, 04/15/32 | 60,552,695 | 68,949,690 |
0.63%, 07/15/32 | 451,501,813 | 415,310,127 |
SECURITY RATE, MATURITY DATE | FACE AMOUNT ($) | VALUE ($) |
1.13%, 01/15/33 | 440,540,466 | 422,580,587 |
2.13%, 02/15/40 | 79,241,970 | 85,166,812 |
2.13%, 02/15/41 | 114,249,734 | 122,731,034 |
0.75%, 02/15/42 | 185,209,152 | 157,589,258 |
0.63%, 02/15/43 | 145,435,091 | 119,469,509 |
1.38%, 02/15/44 | 200,041,609 | 188,626,079 |
0.75%, 02/15/45 | 220,178,623 | 182,266,242 |
1.00%, 02/15/46 | 113,367,960 | 98,527,573 |
0.88%, 02/15/47 | 138,945,378 | 116,747,875 |
1.00%, 02/15/48 | 101,003,950 | 87,010,492 |
1.00%, 02/15/49 | 94,610,273 | 81,484,500 |
0.25%, 02/15/50 | 143,013,489 | 100,165,760 |
0.13%, 02/15/51 | 143,946,772 | 96,184,145 |
0.13%, 02/15/52 | 166,871,792 | 110,845,494 |
1.50%, 02/15/53 | 84,538,381 | 82,376,640 |
Total Treasuries (Cost $13,132,653,106) | 11,447,376,368 | |
SECURITY | NUMBER OF SHARES | VALUE ($) |
SHORT-TERM INVESTMENTS 0.0% OF NET ASSETS | ||
Money Market Funds 0.0% | ||
State Street Institutional U.S. Government Money Market Fund, Premier Class 5.03% (a) | 571,009 | 571,009 |
Total Short-Term Investments (Cost $571,009) | 571,009 | |
Total Investments in Securities (Cost $13,133,224,115) | 11,447,947,377 | |
(a) | The rate shown is the annualized 7-day yield. |
DESCRIPTION | QUOTED PRICES IN ACTIVE MARKETS FOR IDENTICAL ASSETS (LEVEL 1) | OTHER SIGNIFICANT OBSERVABLE INPUTS (LEVEL 2) | SIGNIFICANT UNOBSERVABLE INPUTS (LEVEL 3) | TOTAL |
Assets | ||||
Treasuries1 | $— | $11,447,376,368 | $— | $11,447,376,368 |
Short-Term Investments1 | 571,009 | — | — | 571,009 |
Total | $571,009 | $11,447,376,368 | $— | $11,447,947,377 |
1 | As categorized in the Portfolio Holdings. |
Assets | ||
Investments in securities, at value - unaffiliated (cost $13,133,224,115) | $11,447,947,377 | |
Receivables: | ||
Investments sold | 195,508,588 | |
Interest | 31,954,353 | |
Dividends | + | 26,781 |
Total assets | 11,675,437,099 | |
Liabilities | ||
Payables: | ||
Investments bought | 169,327,872 | |
Fund shares redeemed | 26,196,849 | |
Management fees | + | 389,053 |
Total liabilities | 195,913,774 | |
Net assets | $11,479,523,325 | |
Net Assets by Source | ||
Capital received from investors | $13,826,278,075 | |
Total distributable loss | + | (2,346,754,750 ) |
Net assets | $11,479,523,325 | |
Net Asset Value (NAV) | ||||
Net Assets | ÷ | Shares Outstanding | = | NAV |
$11,479,523,325 | 219,100,000 | $52.39 | ||
For the period January 1, 2023 through June 30, 2023; unaudited | ||
Investment Income | ||
Interest received from securities - unaffiliated | $191,183,752 * | |
Dividends received from securities - unaffiliated | + | 144,075 |
Total investment income | 191,327,827 | |
Expenses | ||
Management fees | 2,587,139 | |
Total expenses | – | 2,587,139 |
Net investment income | 188,740,688 | |
REALIZED AND UNREALIZED GAINS (LOSSES) | ||
Net realized losses on sales of securities - unaffiliated | (152,792,856 ) | |
Net realized losses on sales of in-kind redemptions - unaffiliated | + | (222,276,284 ) |
Net realized losses | (375,069,140 ) | |
Net change in unrealized appreciation (depreciation) on securities - unaffiliated | + | 478,325,751 |
Net realized and unrealized gains | 103,256,611 | |
Increase in net assets resulting from operations | $291,997,299 | |
* | See financial note 2(b), Inflation-Protected Securities, for additional information. |
OPERATIONS | |||
1/1/23-6/30/23 | 1/1/22-12/31/22 | ||
Net investment income | $188,740,688 | $1,070,635,987 | |
Net realized losses | (375,069,140 ) | (386,638,993 ) | |
Net change in unrealized appreciation (depreciation) | + | 478,325,751 | (2,910,566,700 ) |
Increase (decrease) in net assets resulting from operations | $291,997,299 | ($2,226,569,706 ) | |
DISTRIBUTIONS TO SHAREHOLDERS | |||
Total distributions | ($97,716,085 ) | ($1,069,955,140 ) | |
TRANSACTIONS IN FUND SHARES | |||||
1/1/23-6/30/23 | 1/1/22-12/31/22 | ||||
SHARES | VALUE | SHARES | VALUE | ||
Shares sold | 49,000,000 | $2,596,495,641 | 120,550,000 | $7,032,380,314 | |
Shares redeemed | + | (97,100,000 ) | (5,143,565,293 ) | (192,400,000 ) | (11,207,272,315 ) |
Net transactions in fund shares | (48,100,000 ) | ($2,547,069,652 ) | (71,850,000 ) | ($4,174,892,001 ) | |
SHARES OUTSTANDING AND NET ASSETS | |||||
1/1/23-6/30/23 | 1/1/22-12/31/22 | ||||
SHARES | NET ASSETS | SHARES | NET ASSETS | ||
Beginning of period | 267,200,000 | $13,832,311,763 | 339,050,000 | $21,303,728,610 | |
Total decrease | + | (48,100,000 ) | (2,352,788,438 ) | (71,850,000 ) | (7,471,416,847 ) |
End of period | 219,100,000 | $11,479,523,325 | 267,200,000 | $13,832,311,763 | |
1/1/23– 6/30/23* | 1/1/22– 12/31/22 | 1/1/21– 12/31/21 | 1/1/20– 12/31/20 | 1/1/19– 12/31/19 | 1/1/18– 12/31/18 | |
Per-Share Data | ||||||
Net asset value at beginning of period | $48.24 | $50.84 | $51.39 | $50.48 | $49.88 | $50.03 |
Income (loss) from investment operations: | ||||||
Net investment income (loss)1 | 0.84 | 0.68 | 0.21 | 0.65 | 1.14 | 0.94 |
Net realized and unrealized gains (losses) | (0.36 ) | (2.64 ) | (0.55 ) | 0.91 | 0.60 | (0.20 )2 |
Total from investment operations | 0.48 | (1.96 ) | (0.34 ) | 1.56 | 1.74 | 0.74 |
Less distributions: | ||||||
Distributions from net investment income | (0.68 ) | (0.64 ) | (0.21 ) | (0.65 ) | (1.14 ) | (0.89 ) |
Net asset value at end of period | $48.04 | $48.24 | $50.84 | $51.39 | $50.48 | $49.88 |
Total return | 0.99 %3 | (3.85 %) | (0.66 %) | 3.11 % | 3.53 % | 1.50 % |
Ratios/Supplemental Data | ||||||
Ratios to average net assets: | ||||||
Total expenses | 0.03 %4 | 0.04 %5,6 | 0.05 %7 | 0.05 % | 0.06 %8 | 0.06 % |
Net investment income (loss) | 3.51 %4 | 1.39 % | 0.41 % | 1.26 % | 2.27 % | 1.89 % |
Portfolio turnover rate9 | 32 %3 | 106 % | 73 % | 74 % | 77 % | 65 % |
Net assets, end of period (x 1,000,000) | $14,400 | $10,256 | $8,956 | $7,508 | $5,263 | $4,255 |
* | Unaudited. |
1 | Calculated based on the average shares outstanding during the period. |
2 | The per share amount does not accord with the change in aggregate gains and losses in securities during the period because of the timing of fund transactions in relation to fluctuating market values. |
3 | Not annualized. |
4 | Annualized. |
5 | Effective July 1, 2022, the annual operating expense ratio was reduced to 0.03%. The ratio presented for the period ended December 31, 2022 is a blended ratio. |
6 | Ratio includes less than 0.005% of non-routine proxy expenses. |
7 | Effective December 20, 2021, the annual operating expense ratio was reduced to 0.04%. The ratio presented for period ended December 31, 2021 is a blended ratio. |
8 | Effective December 13, 2019, the annual operating expense ratio was reduced to 0.05%. The ratio presented for the period ended December 31, 2019 is a blended ratio. |
9 | Portfolio turnover rate excludes securities received or delivered from processing of in-kind creations or redemptions. |
SECURITY RATE, MATURITY DATE | FACE AMOUNT ($) | VALUE ($) |
TREASURIES 99.4% OF NET ASSETS | ||
Bonds | ||
7.50%, 11/15/24 | 14,200,000 | 14,637,648 |
7.63%, 02/15/25 | 13,720,000 | 14,262,637 |
6.88%, 08/15/25 | 13,976,000 | 14,566,158 |
6.00%, 02/15/26 | 26,216,000 | 27,097,718 |
Notes | ||
0.38%, 07/15/24 | 139,694,000 | 132,701,115 |
1.75%, 07/31/24 | 141,085,000 | 135,736,445 |
2.13%, 07/31/24 | 92,665,000 | 89,506,789 |
3.00%, 07/31/24 | 189,003,000 | 184,266,851 |
0.38%, 08/15/24 | 211,860,000 | 200,480,800 |
2.38%, 08/15/24 | 253,390,000 | 245,268,653 |
1.25%, 08/31/24 | 126,821,000 | 120,987,730 |
1.88%, 08/31/24 | 104,758,000 | 100,680,213 |
3.25%, 08/31/24 | 183,693,000 | 179,319,529 |
0.38%, 09/15/24 | 242,291,000 | 228,411,321 |
1.50%, 09/30/24 | 132,198,000 | 126,166,466 |
2.13%, 09/30/24 | 91,065,000 | 87,584,253 |
4.25%, 09/30/24 | 173,770,000 | 171,499,450 |
0.63%, 10/15/24 | 243,520,000 | 229,479,550 |
1.50%, 10/31/24 | 124,465,000 | 118,465,399 |
2.25%, 10/31/24 | 91,435,000 | 87,884,751 |
4.38%, 10/31/24 | 176,795,000 | 174,688,654 |
0.75%, 11/15/24 | 224,626,000 | 211,319,542 |
2.25%, 11/15/24 | 244,126,000 | 234,480,162 |
1.50%, 11/30/24 | 144,925,000 | 137,630,631 |
2.13%, 11/30/24 | 96,625,000 | 92,565,618 |
4.50%, 11/30/24 | 176,699,000 | 174,849,182 |
1.00%, 12/15/24 | 223,937,000 | 210,802,571 |
1.75%, 12/31/24 | 129,696,000 | 123,325,191 |
2.25%, 12/31/24 | 104,819,000 | 100,394,901 |
4.25%, 12/31/24 | 174,339,000 | 171,931,624 |
1.13%, 01/15/25 | 213,023,000 | 200,374,759 |
1.38%, 01/31/25 | 117,369,000 | 110,718,854 |
2.50%, 01/31/25 | 108,520,000 | 104,174,961 |
4.13%, 01/31/25 | 174,976,000 | 172,255,671 |
1.50%, 02/15/25 | 198,250,000 | 187,156,519 |
2.00%, 02/15/25 | 219,945,000 | 209,385,922 |
1.13%, 02/28/25 | 135,455,000 | 126,991,708 |
2.75%, 02/28/25 | 110,490,000 | 106,467,473 |
4.63%, 02/28/25 | 173,871,000 | 172,536,404 |
1.75%, 03/15/25 | 196,009,000 | 185,442,890 |
0.50%, 03/31/25 | 159,631,000 | 147,680,500 |
2.63%, 03/31/25 | 66,660,000 | 63,992,298 |
3.88%, 03/31/25 | 151,528,000 | 148,565,509 |
2.63%, 04/15/25 | 166,518,000 | 159,746,702 |
0.38%, 04/30/25 | 176,337,000 | 162,278,258 |
2.88%, 04/30/25 | 102,846,000 | 99,045,519 |
3.88%, 04/30/25 | 161,232,000 | 158,108,130 |
2.13%, 05/15/25 | 213,165,000 | 202,460,954 |
2.75%, 05/15/25 | 189,267,000 | 181,818,308 |
SECURITY RATE, MATURITY DATE | FACE AMOUNT ($) | VALUE ($) |
0.25%, 05/31/25 | 172,820,000 | 158,177,556 |
2.88%, 05/31/25 | 93,529,000 | 90,032,623 |
4.25%, 05/31/25 | 174,276,000 | 172,094,146 |
2.88%, 06/15/25 | 183,667,000 | 176,704,155 |
0.25%, 06/30/25 | 178,518,000 | 163,068,522 |
2.75%, 06/30/25 | 73,720,000 | 70,738,084 |
4.63%, 06/30/25 | 173,000,000 | 172,216,094 |
3.00%, 07/15/25 | 155,610,000 | 149,999,530 |
0.25%, 07/31/25 | 190,195,000 | 173,077,450 |
2.88%, 07/31/25 | 89,937,000 | 86,458,968 |
2.00%, 08/15/25 | 228,596,000 | 215,674,968 |
3.13%, 08/15/25 | 177,423,000 | 171,379,529 |
0.25%, 08/31/25 | 186,310,000 | 169,098,159 |
2.75%, 08/31/25 | 92,270,000 | 88,406,194 |
3.50%, 09/15/25 | 169,926,000 | 165,345,964 |
0.25%, 09/30/25 | 219,282,000 | 198,647,222 |
3.00%, 09/30/25 | 92,628,000 | 89,158,068 |
4.25%, 10/15/25 | 167,280,000 | 165,437,307 |
0.25%, 10/31/25 | 222,144,000 | 200,537,026 |
3.00%, 10/31/25 | 81,247,000 | 78,158,979 |
2.25%, 11/15/25 | 245,121,000 | 231,639,345 |
4.50%, 11/15/25 | 168,784,000 | 167,946,673 |
0.38%, 11/30/25 | 211,004,000 | 190,513,534 |
2.88%, 11/30/25 | 99,548,000 | 95,437,757 |
4.00%, 12/15/25 | 158,572,000 | 156,112,896 |
0.38%, 12/31/25 | 228,958,000 | 206,402,061 |
2.63%, 12/31/25 | 90,065,000 | 85,800,985 |
3.88%, 01/15/26 | 166,731,000 | 163,656,897 |
0.38%, 01/31/26 | 244,317,000 | 219,389,031 |
2.63%, 01/31/26 | 105,748,000 | 100,663,008 |
1.63%, 02/15/26 | 211,757,000 | 196,263,998 |
4.00%, 02/15/26 | 162,927,000 | 160,457,638 |
0.50%, 02/28/26 | 244,526,000 | 219,710,433 |
2.50%, 02/28/26 | 109,372,000 | 103,694,055 |
4.63%, 03/15/26 | 163,554,000 | 163,758,443 |
0.75%, 03/31/26 | 226,574,000 | 204,828,207 |
2.25%, 03/31/26 | 106,534,000 | 100,275,128 |
3.75%, 04/15/26 | 164,614,000 | 161,141,673 |
0.75%, 04/30/26 | 230,057,000 | 207,222,046 |
2.38%, 04/30/26 | 78,616,000 | 74,156,999 |
1.63%, 05/15/26 | 211,540,000 | 195,277,863 |
3.63%, 05/15/26 | 166,188,000 | 162,163,134 |
0.75%, 05/31/26 | 242,760,000 | 218,095,205 |
2.13%, 05/31/26 | 94,660,000 | 88,555,169 |
4.13%, 06/15/26 | 170,000,000 | 168,273,438 |
0.88%, 06/30/26 | 212,000,000 | 191,040,156 |
1.88%, 06/30/26 | 97,000,000 | 90,039,492 |
Total Treasuries (Cost $14,586,990,116) | 14,317,118,699 | |
SECURITY | NUMBER OF SHARES | VALUE ($) |
SHORT-TERM INVESTMENTS 0.2% OF NET ASSETS | ||
Money Market Funds 0.2% | ||
State Street Institutional U.S. Government Money Market Fund, Premier Class 5.03% (a) | 22,719,575 | 22,719,575 |
Total Short-Term Investments (Cost $22,719,575) | 22,719,575 | |
Total Investments in Securities (Cost $14,609,709,691) | 14,339,838,274 | |
(a) | The rate shown is the annualized 7-day yield. |
DESCRIPTION | QUOTED PRICES IN ACTIVE MARKETS FOR IDENTICAL ASSETS (LEVEL 1) | OTHER SIGNIFICANT OBSERVABLE INPUTS (LEVEL 2) | SIGNIFICANT UNOBSERVABLE INPUTS (LEVEL 3) | TOTAL |
Assets | ||||
Treasuries1 | $— | $14,317,118,699 | $— | $14,317,118,699 |
Short-Term Investments1 | 22,719,575 | — | — | 22,719,575 |
Total | $22,719,575 | $14,317,118,699 | $— | $14,339,838,274 |
1 | As categorized in the Portfolio Holdings. |
Assets | ||
Investments in securities, at value - unaffiliated (cost $14,609,709,691) | $14,339,838,274 | |
Receivables: | ||
Investments sold | 636,394,467 | |
Interest | 71,950,834 | |
Fund shares sold | 4,803,924 | |
Dividends | + | 52,615 |
Total assets | 15,053,040,114 | |
Liabilities | ||
Payables: | ||
Investments bought | 626,538,143 | |
Fund shares redeemed | 26,421,510 | |
Management fees | + | 354,543 |
Total liabilities | 653,314,196 | |
Net assets | $14,399,725,918 | |
Net Assets by Source | ||
Capital received from investors | $15,003,876,926 | |
Total distributable loss | + | (604,151,008 ) |
Net assets | $14,399,725,918 | |
Net Asset Value (NAV) | ||||
Net Assets | ÷ | Shares Outstanding | = | NAV |
$14,399,725,918 | 299,750,000 | $48.04 | ||
For the period January 1, 2023 through June 30, 2023; unaudited | ||
Investment Income | ||
Interest received from securities - unaffiliated | $231,789,217 | |
Dividends received from securities - unaffiliated | + | 234,405 |
Total investment income | 232,023,622 | |
Expenses | ||
Management fees | 1,964,643 | |
Total expenses | – | 1,964,643 |
Net investment income | 230,058,979 | |
REALIZED AND UNREALIZED GAINS (LOSSES) | ||
Net realized losses on sales of securities - unaffiliated | (97,795,170 ) | |
Net realized gains on sales of in-kind redemptions - unaffiliated | + | 3,392,378 |
Net realized losses | (94,402,792 ) | |
Net change in unrealized appreciation (depreciation) on securities - unaffiliated | + | (40,111,251 ) |
Net realized and unrealized losses | (134,514,043 ) | |
Increase in net assets resulting from operations | $95,544,936 | |
OPERATIONS | |||
1/1/23-6/30/23 | 1/1/22-12/31/22 | ||
Net investment income | $230,058,979 | $126,577,182 | |
Net realized losses | (94,402,792 ) | (295,587,090 ) | |
Net change in unrealized appreciation (depreciation) | + | (40,111,251 ) | (170,555,069 ) |
Increase (decrease) in net assets resulting from operations | $95,544,936 | ($339,564,977 ) | |
DISTRIBUTIONS TO SHAREHOLDERS | |||
Total distributions | ($188,277,685 ) | ($125,786,895 ) | |
TRANSACTIONS IN FUND SHARES | |||||
1/1/23-6/30/23 | 1/1/22-12/31/22 | ||||
SHARES | VALUE | SHARES | VALUE | ||
Shares sold | 112,650,000 | $5,470,191,411 | 102,900,000 | $5,050,820,539 | |
Shares redeemed | + | (25,500,000 ) | (1,233,681,680 ) | (66,450,000 ) | (3,285,327,283 ) |
Net transactions in fund shares | 87,150,000 | $4,236,509,731 | 36,450,000 | $1,765,493,256 | |
SHARES OUTSTANDING AND NET ASSETS | |||||
1/1/23-6/30/23 | 1/1/22-12/31/22 | ||||
SHARES | NET ASSETS | SHARES | NET ASSETS | ||
Beginning of period | 212,600,000 | $10,255,948,936 | 176,150,000 | $8,955,807,552 | |
Total increase | + | 87,150,000 | 4,143,776,982 | 36,450,000 | 1,300,141,384 |
End of period | 299,750,000 | $14,399,725,918 | 212,600,000 | $10,255,948,936 | |
1/1/23– 6/30/23* | 1/1/22– 12/31/22 | 1/1/21– 12/31/21 | 1/1/20– 12/31/20 | 1/1/19– 12/31/19 | 1/1/18– 12/31/18 | |
Per-Share Data | ||||||
Net asset value at beginning of period | $49.22 | $56.16 | $58.21 | $54.97 | $52.89 | $53.35 |
Income (loss) from investment operations: | ||||||
Net investment income (loss)1 | 0.73 | 1.12 | 0.55 | 0.94 | 1.28 | 1.21 |
Net realized and unrealized gains (losses) | (0.07 ) | (7.06 ) | (2.04 ) | 3.24 | 2.07 | (0.55 )2 |
Total from investment operations | 0.66 | (5.94 ) | (1.49 ) | 4.18 | 3.35 | 0.66 |
Less distributions: | ||||||
Distributions from net investment income | (0.62 ) | (1.00 ) | (0.56 ) | (0.94 ) | (1.27 ) | (1.12 ) |
Net asset value at end of period | $49.26 | $49.22 | $56.16 | $58.21 | $54.97 | $52.89 |
Total return | 1.32 %3 | (10.63 %) | (2.57 %) | 7.62 % | 6.38 % | 1.28 % |
Ratios/Supplemental Data | ||||||
Ratios to average net assets: | ||||||
Total expenses | 0.03 %4 | 0.04 %5,6 | 0.05 %7 | 0.05 % | 0.06 %8 | 0.06 % |
Net investment income (loss) | 2.96 %4 | 2.18 % | 0.97 % | 1.63 % | 2.35 % | 2.34 % |
Portfolio turnover rate9 | 19 %3 | 88 % | 56 % | 51 % | 38 % | 41 % |
Net assets, end of period (x 1,000,000) | $7,353 | $7,555 | $3,712 | $3,953 | $4,736 | $3,480 |
* | Unaudited. |
1 | Calculated based on the average shares outstanding during the period. |
2 | The per share amount does not accord with the change in aggregate gains and losses in securities during the period because of the timing of fund transactions in relation to fluctuating market values. |
3 | Not annualized. |
4 | Annualized. |
5 | Effective July 1, 2022, the annual operating expense ratio was reduced to 0.03%. The ratio presented for the period ended December 31, 2022 is a blended ratio. |
6 | Ratio includes less than 0.005% of non-routine proxy expenses. |
7 | Effective December 20, 2021, the annual operating expense ratio was reduced to 0.04%. The ratio presented for period ended December 31, 2021 is a blended ratio. |
8 | Effective December 13, 2019, the annual operating expense ratio was reduced to 0.05%. The ratio presented for the period ended December 31, 2019 is a blended ratio. |
9 | Portfolio turnover rate excludes securities received or delivered from processing of in-kind creations or redemptions. |
SECURITY RATE, MATURITY DATE | FACE AMOUNT ($) | VALUE ($) |
TREASURIES 99.4% OF NET ASSETS | ||
Bonds | ||
6.75%, 08/15/26 | 6,136,000 | 6,534,600 |
6.50%, 11/15/26 | 6,435,000 | 6,849,756 |
6.63%, 02/15/27 | 4,468,000 | 4,804,322 |
6.38%, 08/15/27 | 5,622,000 | 6,061,438 |
6.13%, 11/15/27 | 12,264,000 | 13,189,549 |
5.50%, 08/15/28 | 6,886,000 | 7,302,657 |
5.25%, 11/15/28 | 12,213,000 | 12,847,504 |
5.25%, 02/15/29 | 7,052,000 | 7,440,962 |
6.13%, 08/15/29 | 6,376,000 | 7,078,854 |
6.25%, 05/15/30 | 10,052,000 | 11,399,596 |
5.38%, 02/15/31 | 12,334,000 | 13,510,548 |
Notes | ||
1.50%, 08/15/26 | 86,212,000 | 78,823,363 |
0.75%, 08/31/26 | 122,919,000 | 109,652,390 |
1.38%, 08/31/26 | 63,009,000 | 57,350,496 |
0.88%, 09/30/26 | 106,986,000 | 95,744,112 |
1.63%, 09/30/26 | 30,111,000 | 27,588,028 |
1.13%, 10/31/26 | 92,337,000 | 83,052,804 |
1.63%, 10/31/26 | 36,544,000 | 33,424,913 |
2.00%, 11/15/26 | 80,636,000 | 74,613,499 |
1.25%, 11/30/26 | 93,507,000 | 84,265,879 |
1.63%, 11/30/26 | 35,263,000 | 32,199,527 |
1.25%, 12/31/26 | 92,413,000 | 83,193,360 |
1.75%, 12/31/26 | 36,644,000 | 33,566,477 |
1.50%, 01/31/27 | 120,006,000 | 108,736,687 |
2.25%, 02/15/27 | 73,194,000 | 68,081,857 |
1.13%, 02/28/27 | 21,192,000 | 18,913,860 |
1.88%, 02/28/27 | 83,845,000 | 76,878,659 |
0.63%, 03/31/27 | 35,467,000 | 30,975,437 |
2.50%, 03/31/27 | 79,079,000 | 74,124,206 |
0.50%, 04/30/27 | 50,756,000 | 43,995,142 |
2.75%, 04/30/27 | 76,344,000 | 72,133,151 |
2.38%, 05/15/27 | 86,382,000 | 80,449,987 |
0.50%, 05/31/27 | 45,858,000 | 39,645,674 |
2.63%, 05/31/27 | 75,071,000 | 70,552,078 |
0.50%, 06/30/27 | 55,165,000 | 47,566,883 |
3.25%, 06/30/27 | 73,778,000 | 70,970,978 |
0.38%, 07/31/27 | 64,630,000 | 55,299,044 |
2.75%, 07/31/27 | 69,377,000 | 65,420,343 |
2.25%, 08/15/27 | 68,720,000 | 63,541,841 |
0.50%, 08/31/27 | 58,515,000 | 50,208,613 |
3.13%, 08/31/27 | 70,308,000 | 67,253,996 |
0.38%, 09/30/27 | 74,345,000 | 63,286,181 |
4.13%, 09/30/27 | 64,640,000 | 64,289,025 |
0.50%, 10/31/27 | 71,086,000 | 60,692,449 |
4.13%, 10/31/27 | 66,057,000 | 65,718,974 |
2.25%, 11/15/27 | 67,582,000 | 62,257,278 |
0.63%, 11/30/27 | 77,393,000 | 66,294,965 |
3.88%, 11/30/27 | 65,175,000 | 64,263,569 |
0.63%, 12/31/27 | 78,692,000 | 67,260,142 |
SECURITY RATE, MATURITY DATE | FACE AMOUNT ($) | VALUE ($) |
3.88%, 12/31/27 | 67,432,000 | 66,502,176 |
0.75%, 01/31/28 | 94,595,000 | 81,159,554 |
3.50%, 01/31/28 | 67,250,000 | 65,316,563 |
2.75%, 02/15/28 | 92,780,000 | 87,224,073 |
1.13%, 02/29/28 | 88,186,000 | 76,869,945 |
4.00%, 02/29/28 | 64,984,000 | 64,524,543 |
1.25%, 03/31/28 | 86,323,000 | 75,552,857 |
3.63%, 03/31/28 | 47,635,000 | 46,535,301 |
1.25%, 04/30/28 | 87,080,000 | 76,089,551 |
3.50%, 04/30/28 | 49,292,000 | 47,897,961 |
2.88%, 05/15/28 | 98,650,000 | 93,108,645 |
1.25%, 05/31/28 | 87,897,000 | 76,703,866 |
3.63%, 05/31/28 | 71,800,000 | 70,243,398 |
1.25%, 06/30/28 | 90,401,000 | 78,719,496 |
4.00%, 06/30/28 | 65,000,000 | 64,647,070 |
1.00%, 07/31/28 | 93,348,000 | 80,082,375 |
2.88%, 08/15/28 | 100,326,000 | 94,541,579 |
1.13%, 08/31/28 | 97,038,000 | 83,638,417 |
1.25%, 09/30/28 | 92,958,000 | 80,488,556 |
1.38%, 10/31/28 | 87,730,000 | 76,345,662 |
3.13%, 11/15/28 | 91,846,000 | 87,519,193 |
1.50%, 11/30/28 | 88,236,000 | 77,203,053 |
1.38%, 12/31/28 | 83,623,000 | 72,556,019 |
1.75%, 01/31/29 | 83,708,000 | 74,025,993 |
2.63%, 02/15/29 | 94,036,000 | 87,137,578 |
1.88%, 02/28/29 | 73,822,000 | 65,666,976 |
2.38%, 03/31/29 | 72,969,000 | 66,644,070 |
2.88%, 04/30/29 | 69,272,000 | 64,980,383 |
2.38%, 05/15/29 | 73,293,000 | 66,834,054 |
2.75%, 05/31/29 | 66,355,000 | 61,793,094 |
3.25%, 06/30/29 | 61,404,000 | 58,760,750 |
2.63%, 07/31/29 | 56,430,000 | 52,142,643 |
1.63%, 08/15/29 | 70,597,000 | 61,595,883 |
3.13%, 08/31/29 | 57,047,000 | 54,201,335 |
3.88%, 09/30/29 | 57,402,000 | 56,854,887 |
4.00%, 10/31/29 | 52,807,000 | 52,691,485 |
1.75%, 11/15/29 | 51,415,000 | 45,104,612 |
3.88%, 11/30/29 | 53,731,000 | 53,262,952 |
3.88%, 12/31/29 | 54,308,000 | 53,856,141 |
3.50%, 01/31/30 | 51,658,000 | 50,148,618 |
1.50%, 02/15/30 | 87,263,000 | 74,780,301 |
4.00%, 02/28/30 | 53,378,000 | 53,357,149 |
3.63%, 03/31/30 | 43,014,000 | 42,089,871 |
3.50%, 04/30/30 | 46,200,000 | 44,875,360 |
0.63%, 05/15/30 | 125,609,000 | 100,673,651 |
3.75%, 05/31/30 | 53,544,000 | 52,811,953 |
3.75%, 06/30/30 | 55,000,000 | 54,273,828 |
0.63%, 08/15/30 | 163,580,000 | 130,365,593 |
0.88%, 11/15/30 | 169,088,000 | 136,895,231 |
1.13%, 02/15/31 | 155,303,000 | 127,773,117 |
1.63%, 05/15/31 | 161,512,000 | 137,323,055 |
1.25%, 08/15/31 | 165,466,000 | 135,837,244 |
1.38%, 11/15/31 | 168,863,000 | 139,272,399 |
SECURITY RATE, MATURITY DATE | FACE AMOUNT ($) | VALUE ($) |
1.88%, 02/15/32 | 155,802,000 | 133,502,839 |
2.88%, 05/15/32 | 157,924,000 | 146,462,173 |
2.75%, 08/15/32 | 150,943,000 | 138,407,656 |
4.13%, 11/15/32 | 152,035,000 | 155,396,400 |
3.50%, 02/15/33 | 148,881,000 | 145,054,294 |
3.38%, 05/15/33 | 102,076,000 | 98,463,467 |
Total Treasuries (Cost $7,684,488,919) | 7,306,092,541 | |
SECURITY | NUMBER OF SHARES | VALUE ($) |
SHORT-TERM INVESTMENTS 0.1% OF NET ASSETS | ||
Money Market Funds 0.1% | ||
State Street Institutional U.S. Government Money Market Fund, Premier Class 5.03% (a) | 9,643,159 | 9,643,159 |
Total Short-Term Investments (Cost $9,643,159) | 9,643,159 | |
Total Investments in Securities (Cost $7,694,132,078) | 7,315,735,700 | |
(a) | The rate shown is the annualized 7-day yield. |
DESCRIPTION | QUOTED PRICES IN ACTIVE MARKETS FOR IDENTICAL ASSETS (LEVEL 1) | OTHER SIGNIFICANT OBSERVABLE INPUTS (LEVEL 2) | SIGNIFICANT UNOBSERVABLE INPUTS (LEVEL 3) | TOTAL |
Assets | ||||
Treasuries1 | $— | $7,306,092,541 | $— | $7,306,092,541 |
Short-Term Investments1 | 9,643,159 | — | — | 9,643,159 |
Total | $9,643,159 | $7,306,092,541 | $— | $7,315,735,700 |
1 | As categorized in the Portfolio Holdings. |
Assets | ||
Investments in securities, at value - unaffiliated (cost $7,694,132,078) | $7,315,735,700 | |
Receivables: | ||
Investments sold | 227,968,229 | |
Interest | 37,067,197 | |
Fund shares sold | 4,926,372 | |
Dividends | + | 21,403 |
Total assets | 7,585,718,901 | |
Liabilities | ||
Payables: | ||
Investments bought | 232,925,348 | |
Management fees | + | 181,089 |
Total liabilities | 233,106,437 | |
Net assets | $7,352,612,464 | |
Net Assets by Source | ||
Capital received from investors | $8,157,471,423 | |
Total distributable loss | + | (804,858,959 ) |
Net assets | $7,352,612,464 | |
Net Asset Value (NAV) | ||||
Net Assets | ÷ | Shares Outstanding | = | NAV |
$7,352,612,464 | 149,250,000 | $49.26 | ||
For the period January 1, 2023 through June 30, 2023; unaudited | ||
Investment Income | ||
Interest received from securities - unaffiliated | $110,384,820 | |
Dividends received from securities - unaffiliated | + | 139,456 |
Total investment income | 110,524,276 | |
Expenses | ||
Management fees | 1,109,918 | |
Total expenses | – | 1,109,918 |
Net investment income | 109,414,358 | |
REALIZED AND UNREALIZED GAINS (LOSSES) | ||
Net realized losses on sales of securities - unaffiliated | (62,060,417 ) | |
Net realized losses on sales of in-kind redemptions - unaffiliated | + | (9,453,080 ) |
Net realized losses | (71,513,497 ) | |
Net change in unrealized appreciation (depreciation) on securities - unaffiliated | + | 43,165,655 |
Net realized and unrealized losses | (28,347,842 ) | |
Increase in net assets resulting from operations | $81,066,516 | |
OPERATIONS | |||
1/1/23-6/30/23 | 1/1/22-12/31/22 | ||
Net investment income | $109,414,358 | $140,884,355 | |
Net realized losses | (71,513,497 ) | (373,456,484 ) | |
Net change in unrealized appreciation (depreciation) | + | 43,165,655 | (373,736,025 ) |
Increase (decrease) in net assets resulting from operations | $81,066,516 | ($606,308,154 ) | |
DISTRIBUTIONS TO SHAREHOLDERS | |||
Total distributions | ($91,795,350 ) | ($140,863,160 ) | |
TRANSACTIONS IN FUND SHARES | |||||
1/1/23-6/30/23 | 1/1/22-12/31/22 | ||||
SHARES | VALUE | SHARES | VALUE | ||
Shares sold | 74,550,000 | $3,721,892,492 | 139,150,000 | $7,219,464,611 | |
Shares redeemed | + | (78,800,000 ) | (3,913,918,036 ) | (51,750,000 ) | (2,628,923,902 ) |
Net transactions in fund shares | (4,250,000 ) | ($192,025,544 ) | 87,400,000 | $4,590,540,709 | |
SHARES OUTSTANDING AND NET ASSETS | |||||
1/1/23-6/30/23 | 1/1/22-12/31/22 | ||||
SHARES | NET ASSETS | SHARES | NET ASSETS | ||
Beginning of period | 153,500,000 | $7,555,366,842 | 66,100,000 | $3,711,997,447 | |
Total increase (decrease) | + | (4,250,000 ) | (202,754,378 ) | 87,400,000 | 3,843,369,395 |
End of period | 149,250,000 | $7,352,612,464 | 153,500,000 | $7,555,366,842 | |
1/1/23– 6/30/23* | 1/1/22– 12/31/22 | 1/1/21– 12/31/21 | 1/1/20– 12/31/20 | 10/10/191– 12/31/19 | ||
Per-Share Data | ||||||
Net asset value at beginning of period | $35.28 | $51.26 | $54.87 | $47.34 | $50.00 | |
Income (loss) from investment operations: | ||||||
Net investment income (loss)2 | 0.68 | 1.12 | 0.86 | 0.86 | 0.22 | |
Net realized and unrealized gains (losses) | 0.84 | (16.08 ) | (3.60 ) | 7.50 | (2.67 ) | |
Total from investment operations | 1.52 | (14.96 ) | (2.74 ) | 8.36 | (2.45 ) | |
Less distributions: | ||||||
Distributions from net investment income | (0.55 ) | (1.02 ) | (0.87 ) | (0.83 ) | (0.21 ) | |
Net asset value at end of period | $36.25 | $35.28 | $51.26 | $54.87 | $47.34 | |
Total return | 4.29 %3 | (29.42 %) | (4.96 %) | 17.64 % | (4.91 %)3 | |
Ratios/Supplemental Data | ||||||
Ratios to average net assets: | ||||||
Total expenses | 0.03 %4 | 0.04 %5,6 | 0.05 %7 | 0.05 % | 0.06 %4,8 | |
Net investment income (loss) | 3.72 %4 | 2.83 % | 1.70 % | 1.55 % | 2.07 %4 | |
Portfolio turnover rate9 | 10 %3 | 41 % | 68 % | 45 % | 3 %3 | |
Net assets, end of period (x 1,000) | $300,840 | $188,739 | $99,948 | $90,535 | $18,935 | |
* | Unaudited. |
1 | Commencement of operations. |
2 | Calculated based on the average shares outstanding during the period. |
3 | Not annualized. |
4 | Annualized. |
5 | Effective July 1, 2022, the annual operating expense ratio was reduced to 0.03%. The ratio presented for the period ended December 31, 2022 is a blended ratio. |
6 | Ratio includes less than 0.005% of non-routine proxy expenses. |
7 | Effective December 20, 2021, the annual operating expense ratio was reduced to 0.04%. The ratio presented for period ended December 31, 2021 is a blended ratio. |
8 | Effective December 13, 2019, the annual operating expense ratio was reduced to 0.05%. The ratio presented for the period ended December 31, 2019 is a blended ratio. |
9 | Portfolio turnover rate excludes securities received or delivered from processing of in-kind creations or redemptions. |
SECURITY RATE, MATURITY DATE | FACE AMOUNT ($) | VALUE ($) |
TREASURIES 99.2% OF NET ASSETS | ||
Bonds | ||
4.50%, 02/15/36 | 1,193,600 | 1,288,808 |
4.75%, 02/15/37 | 709,600 | 785,605 |
5.00%, 05/15/37 | 915,800 | 1,038,217 |
4.38%, 02/15/38 | 963,600 | 1,026,535 |
4.50%, 05/15/38 | 1,090,700 | 1,175,400 |
3.50%, 02/15/39 | 1,118,000 | 1,073,105 |
4.25%, 05/15/39 | 1,658,600 | 1,736,736 |
4.50%, 08/15/39 | 1,772,100 | 1,908,053 |
4.38%, 11/15/39 | 1,906,300 | 2,020,827 |
4.63%, 02/15/40 | 1,920,700 | 2,095,514 |
1.13%, 05/15/40 | 5,746,400 | 3,730,671 |
4.38%, 05/15/40 | 1,859,600 | 1,966,963 |
1.13%, 08/15/40 | 7,020,100 | 4,520,835 |
3.88%, 08/15/40 | 1,848,400 | 1,835,548 |
1.38%, 11/15/40 | 7,816,600 | 5,237,122 |
4.25%, 11/15/40 | 1,835,000 | 1,909,547 |
1.88%, 02/15/41 | 9,468,000 | 6,883,532 |
4.75%, 02/15/41 | 1,945,500 | 2,149,625 |
2.25%, 05/15/41 | 8,156,400 | 6,288,075 |
4.38%, 05/15/41 | 1,796,400 | 1,892,255 |
1.75%, 08/15/41 | 10,687,600 | 7,518,894 |
3.75%, 08/15/41 | 1,817,400 | 1,756,773 |
2.00%, 11/15/41 | 8,982,900 | 6,582,781 |
3.13%, 11/15/41 | 1,908,600 | 1,682,997 |
2.38%, 02/15/42 | 7,269,500 | 5,664,531 |
3.13%, 02/15/42 | 2,019,600 | 1,776,775 |
3.00%, 05/15/42 | 1,878,400 | 1,616,745 |
3.25%, 05/15/42 | 6,415,000 | 5,728,394 |
2.75%, 08/15/42 | 2,195,300 | 1,811,122 |
3.38%, 08/15/42 | 5,558,400 | 5,048,156 |
2.75%, 11/15/42 | 3,182,800 | 2,621,086 |
4.00%, 11/15/42 | 5,556,600 | 5,525,778 |
3.13%, 02/15/43 | 2,730,500 | 2,383,001 |
3.88%, 02/15/43 | 5,557,600 | 5,422,133 |
2.88%, 05/15/43 | 4,319,300 | 3,615,727 |
3.88%, 05/15/43 | 3,847,800 | 3,755,813 |
3.63%, 08/15/43 | 3,101,000 | 2,913,244 |
3.75%, 11/15/43 | 3,154,600 | 3,017,326 |
3.63%, 02/15/44 | 3,359,700 | 3,149,981 |
3.38%, 05/15/44 | 3,114,800 | 2,810,134 |
3.13%, 08/15/44 | 4,010,500 | 3,472,842 |
3.00%, 11/15/44 | 3,510,300 | 2,973,334 |
2.50%, 02/15/45 | 4,659,700 | 3,609,811 |
3.00%, 05/15/45 | 2,279,600 | 1,926,796 |
2.88%, 08/15/45 | 3,103,400 | 2,562,729 |
3.00%, 11/15/45 | 1,832,500 | 1,546,315 |
2.50%, 02/15/46 | 3,771,400 | 2,904,273 |
SECURITY RATE, MATURITY DATE | FACE AMOUNT ($) | VALUE ($) |
2.50%, 05/15/46 | 3,819,900 | 2,938,936 |
2.25%, 08/15/46 | 4,715,100 | 3,447,180 |
2.88%, 11/15/46 | 2,124,900 | 1,751,880 |
3.00%, 02/15/47 | 4,197,500 | 3,535,738 |
3.00%, 05/15/47 | 3,234,600 | 2,725,656 |
2.75%, 08/15/47 | 4,614,100 | 3,713,269 |
2.75%, 11/15/47 | 4,651,200 | 3,743,853 |
3.00%, 02/15/48 | 5,318,700 | 4,486,407 |
3.13%, 05/15/48 | 5,709,200 | 4,929,537 |
3.00%, 08/15/48 | 6,252,200 | 5,278,713 |
3.38%, 11/15/48 | 6,414,400 | 5,802,025 |
3.00%, 02/15/49 | 6,753,800 | 5,715,931 |
2.88%, 05/15/49 | 6,599,200 | 5,459,291 |
2.25%, 08/15/49 | 6,211,900 | 4,518,672 |
2.38%, 11/15/49 | 5,833,900 | 4,361,296 |
2.00%, 02/15/50 | 7,332,000 | 5,030,439 |
1.25%, 05/15/50 | 8,517,800 | 4,794,590 |
1.38%, 08/15/50 | 9,600,600 | 5,584,849 |
1.63%, 11/15/50 | 9,501,000 | 5,906,950 |
1.88%, 02/15/51 | 10,595,400 | 7,021,936 |
2.38%, 05/15/51 | 10,674,400 | 7,941,587 |
2.00%, 08/15/51 | 10,564,200 | 7,206,765 |
1.88%, 11/15/51 | 9,833,400 | 6,496,190 |
2.25%, 02/15/52 | 8,982,700 | 6,496,317 |
2.88%, 05/15/52 | 8,552,600 | 7,093,313 |
3.00%, 08/15/52 | 8,125,800 | 6,914,548 |
4.00%, 11/15/52 | 8,123,000 | 8,350,825 |
3.63%, 02/15/53 | 8,125,000 | 7,804,443 |
3.63%, 05/15/53 | 5,558,800 | 5,346,002 |
Total Treasuries (Cost $307,960,256) | 298,357,602 | |
SECURITY | NUMBER OF SHARES | VALUE ($) |
SHORT-TERM INVESTMENTS 0.0% OF NET ASSETS | ||
Money Market Funds 0.0% | ||
State Street Institutional U.S. Government Money Market Fund, Premier Class 5.03% (a) | 409 | 409 |
Total Short-Term Investments (Cost $409) | 409 | |
Total Investments in Securities (Cost $307,960,665) | 298,358,011 | |
(a) | The rate shown is the annualized 7-day yield. |
DESCRIPTION | QUOTED PRICES IN ACTIVE MARKETS FOR IDENTICAL ASSETS (LEVEL 1) | OTHER SIGNIFICANT OBSERVABLE INPUTS (LEVEL 2) | SIGNIFICANT UNOBSERVABLE INPUTS (LEVEL 3) | TOTAL |
Assets | ||||
Treasuries1 | $— | $298,357,602 | $— | $298,357,602 |
Short-Term Investments1 | 409 | — | — | 409 |
Total | $409 | $298,357,602 | $— | $298,358,011 |
1 | As categorized in the Portfolio Holdings. |
Assets | ||
Investments in securities, at value - unaffiliated (cost $307,960,665) | $298,358,011 | |
Receivables: | ||
Investments sold | 4,089,173 | |
Interest | 2,487,069 | |
Other assets | 2,209 | |
Dividends | + | 600 |
Total assets | 304,937,062 | |
Liabilities | ||
Payables: | ||
Investments bought | 4,089,451 | |
Management fees | + | 7,174 |
Total liabilities | 4,096,625 | |
Net assets | $300,840,437 | |
Net Assets by Source | ||
Capital received from investors | $328,572,239 | |
Total distributable loss | + | (27,731,802 ) |
Net assets | $300,840,437 | |
Net Asset Value (NAV) | ||||
Net Assets | ÷ | Shares Outstanding | = | NAV |
$300,840,437 | 8,300,000 | $36.25 | ||
For the period January 1, 2023 through June 30, 2023; unaudited | ||
Investment Income | ||
Interest received from securities - unaffiliated | $4,459,508 | |
Dividends received from securities - unaffiliated | + | 5,748 |
Total investment income | 4,465,256 | |
Expenses | ||
Management fees | 35,690 | |
Total expenses | – | 35,690 |
Net investment income | 4,429,566 | |
REALIZED AND UNREALIZED GAINS (LOSSES) | ||
Net realized losses on sales of securities - unaffiliated | (7,771,133 ) | |
Net realized gains on sales of in-kind redemptions - unaffiliated | + | 1,844,341 |
Net realized losses | (5,926,792 ) | |
Net change in unrealized appreciation (depreciation) on securities - unaffiliated | + | 8,399,501 |
Net realized and unrealized gains | 2,472,709 | |
Increase in net assets resulting from operations | $6,902,275 | |
OPERATIONS | |||
1/1/23-6/30/23 | 1/1/22-12/31/22 | ||
Net investment income | $4,429,566 | $2,886,195 | |
Net realized losses | (5,926,792 ) | (14,922,098 ) | |
Net change in unrealized appreciation (depreciation) | + | 8,399,501 | (16,768,720 ) |
Increase (decrease) in net assets resulting from operations | $6,902,275 | ($28,804,623 ) | |
DISTRIBUTIONS TO SHAREHOLDERS | |||
Total distributions | ($3,556,275 ) | ($2,856,565 ) | |
TRANSACTIONS IN FUND SHARES | |||||
1/1/23-6/30/23 | 1/1/22-12/31/22 | ||||
SHARES | VALUE | SHARES | VALUE | ||
Shares sold | 3,700,000 | $136,006,335 | 5,450,000 | $203,105,803 | |
Shares redeemed | + | (750,000 ) | (27,250,828 ) | (2,050,000 ) | (82,653,392 ) |
Net transactions in fund shares | 2,950,000 | $108,755,507 | 3,400,000 | $120,452,411 | |
SHARES OUTSTANDING AND NET ASSETS | |||||
1/1/23-6/30/23 | 1/1/22-12/31/22 | ||||
SHARES | NET ASSETS | SHARES | NET ASSETS | ||
Beginning of period | 5,350,000 | $188,738,930 | 1,950,000 | $99,947,707 | |
Total increase | + | 2,950,000 | 112,101,507 | 3,400,000 | 88,791,223 |
End of period | 8,300,000 | $300,840,437 | 5,350,000 | $188,738,930 | |
1/1/23– 6/30/23* | 1/1/22– 12/31/22 | 1/1/21– 12/31/21 | 1/1/20– 12/31/20 | 1/1/19– 12/31/19 | 1/1/18– 12/31/18 | |
Per-Share Data | ||||||
Net asset value at beginning of period | $45.70 | $53.91 | $56.05 | $53.43 | $50.59 | $52.07 |
Income (loss) from investment operations: | ||||||
Net investment income (loss)1 | 0.70 | 1.11 | 0.96 | 1.19 | 1.43 | 1.35 |
Net realized and unrealized gains (losses) | 0.31 | (8.12 ) | (1.93 ) | 2.79 | 2.90 | (1.42 ) |
Total from investment operations | 1.01 | (7.01 ) | (0.97 ) | 3.98 | 4.33 | (0.07 ) |
Less distributions: | ||||||
Distributions from net investment income | (0.59 ) | (1.20 ) | (1.17 ) | (1.36 ) | (1.49 ) | (1.41 ) |
Net asset value at end of period | $46.12 | $45.70 | $53.91 | $56.05 | $53.43 | $50.59 |
Total return | 2.21 %2 | (13.09 %) | (1.74 %) | 7.50 % | 8.64 % | (0.09 %) |
Ratios/Supplemental Data | ||||||
Ratios to average net assets: | ||||||
Total expenses | 0.03 %3 | 0.04 %4,5 | 0.04 % | 0.04 % | 0.04 % | 0.04 % |
Net investment income (loss) | 3.01 %3 | 2.29 % | 1.76 % | 2.14 % | 2.71 % | 2.67 % |
Portfolio turnover rate6,7 | 27 %2 | 53 % | 48 % | 68 % | 63 % | 71 % |
Net assets, end of period (x 1,000,000) | $7,071 | $6,805 | $9,074 | $8,733 | $7,384 | $5,545 |
* | Unaudited. |
1 | Calculated based on the average shares outstanding during the period. |
2 | Not annualized. |
3 | Annualized. |
4 | Effective July 1, 2022, the annual operating expense ratio was reduced to 0.03%. The ratio presented for the period ended December 31, 2022 is a blended ratio. |
5 | Ratio includes less than 0.005% of non-routine proxy expenses. |
6 | Portfolio turnover rate excludes securities received or delivered from processing of in-kind creations or redemptions. |
7 | Includes to-be-announced (TBA) transactions. (see financial note 2) |
SECURITY RATE, MATURITY DATE | FACE AMOUNT ($) | VALUE ($) |
CORPORATES 24.5% OF NET ASSETS | ||
Financial Institutions 8.0% | ||
Banking 5.6% | ||
Ally Financial, Inc. | ||
5.13%, 09/30/24 | 200,000 | 196,348 |
4.63%, 03/30/25 | 150,000 | 144,527 |
5.80%, 05/01/25 (a) | 250,000 | 245,993 |
2.20%, 11/02/28 (a) | 150,000 | 120,138 |
6.99%, 06/13/29 (a)(b) | 200,000 | 197,716 |
8.00%, 11/01/31 | 1,200,000 | 1,246,527 |
American Express Co. | ||
2.50%, 07/30/24 (a) | 550,000 | 531,855 |
3.00%, 10/30/24 (a) | 600,000 | 581,004 |
2.25%, 03/04/25 (a) | 675,000 | 640,494 |
3.95%, 08/01/25 (a) | 600,000 | 582,444 |
4.20%, 11/06/25 (a) | 400,000 | 390,004 |
4.90%, 02/13/26 (a) | 300,000 | 297,192 |
4.99%, 05/01/26 (a)(b) | 250,000 | 247,378 |
3.13%, 05/20/26 (a) | 75,000 | 71,077 |
1.65%, 11/04/26 (a) | 250,000 | 222,605 |
2.55%, 03/04/27 (a) | 575,000 | 524,216 |
3.30%, 05/03/27 (a) | 600,000 | 561,162 |
5.85%, 11/05/27 (a) | 300,000 | 307,566 |
4.05%, 05/03/29 (a) | 300,000 | 285,774 |
4.99%, 05/26/33 (a)(b) | 250,000 | 239,620 |
4.42%, 08/03/33 (a)(b) | 300,000 | 283,125 |
5.04%, 05/01/34 (a)(b) | 300,000 | 294,018 |
4.05%, 12/03/42 | 200,000 | 174,318 |
American Express Credit Corp. | ||
3.30%, 05/03/27 (a) | 50,000 | 46,940 |
Australia & New Zealand Banking Group Ltd. | ||
3.70%, 11/16/25 | 300,000 | 289,335 |
5.09%, 12/08/25 | 250,000 | 249,110 |
Banco Bilbao Vizcaya Argentaria S.A. | ||
1.13%, 09/18/25 | 400,000 | 360,576 |
5.86%, 09/14/26 (a)(b) | 200,000 | 197,254 |
6.14%, 09/14/28 (a)(b) | 200,000 | 201,178 |
Banco Santander S.A. | ||
3.50%, 03/24/25 | 200,000 | 191,988 |
2.75%, 05/28/25 | 600,000 | 563,844 |
5.15%, 08/18/25 | 400,000 | 393,856 |
5.18%, 11/19/25 | 400,000 | 388,908 |
4.25%, 04/11/27 | 800,000 | 757,672 |
5.29%, 08/18/27 | 600,000 | 588,864 |
1.72%, 09/14/27 (a)(b) | 200,000 | 173,978 |
3.80%, 02/23/28 | 400,000 | 367,900 |
4.18%, 03/24/28 (a)(b) | 400,000 | 375,040 |
4.38%, 04/12/28 | 400,000 | 377,404 |
SECURITY RATE, MATURITY DATE | FACE AMOUNT ($) | VALUE ($) |
3.31%, 06/27/29 | 400,000 | 356,700 |
3.49%, 05/28/30 | 400,000 | 348,564 |
2.75%, 12/03/30 | 400,000 | 312,892 |
2.96%, 03/25/31 | 200,000 | 165,666 |
3.23%, 11/22/32 (a)(b) | 200,000 | 158,700 |
Bank of America Corp. | ||
4.20%, 08/26/24 | 600,000 | 588,966 |
4.00%, 01/22/25 | 725,000 | 705,526 |
3.95%, 04/21/25 | 700,000 | 678,272 |
3.88%, 08/01/25 | 650,000 | 632,931 |
0.98%, 09/25/25 (a)(b) | 600,000 | 564,042 |
3.09%, 10/01/25 (a)(b) | 550,000 | 529,672 |
2.46%, 10/22/25 (a)(b) | 850,000 | 811,639 |
1.53%, 12/06/25 (a)(b) | 250,000 | 234,198 |
3.37%, 01/23/26 (a)(b) | 500,000 | 480,190 |
2.02%, 02/13/26 (a)(b) | 450,000 | 421,627 |
4.45%, 03/03/26 | 550,000 | 535,683 |
3.38%, 04/02/26 (a)(b) | 500,000 | 480,165 |
3.50%, 04/19/26 | 850,000 | 816,731 |
1.32%, 06/19/26 (a)(b) | 500,000 | 458,230 |
4.83%, 07/22/26 (a)(b) | 100,000 | 98,281 |
6.22%, 09/15/26 | 300,000 | 306,471 |
4.25%, 10/22/26 | 500,000 | 482,870 |
1.20%, 10/24/26 (a)(b) | 800,000 | 720,904 |
5.08%, 01/20/27 (a)(b) | 300,000 | 296,607 |
1.66%, 03/11/27 (a)(b) | 800,000 | 721,184 |
3.56%, 04/23/27 (a)(b) | 1,000,000 | 949,330 |
1.73%, 07/22/27 (a)(b) | 1,700,000 | 1,518,032 |
3.25%, 10/21/27 (a) | 800,000 | 746,200 |
4.18%, 11/25/27 (a) | 450,000 | 428,053 |
3.82%, 01/20/28 (a)(b) | 950,000 | 899,992 |
2.55%, 02/04/28 (a)(b) | 300,000 | 270,975 |
3.71%, 04/24/28 (a)(b) | 500,000 | 469,540 |
4.38%, 04/27/28 (a)(b) | 750,000 | 721,770 |
3.59%, 07/21/28 (a)(b) | 850,000 | 792,285 |
4.95%, 07/22/28 (a)(b) | 900,000 | 884,565 |
6.20%, 11/10/28 (a)(b) | 500,000 | 514,690 |
3.42%, 12/20/28 (a)(b) | 2,075,000 | 1,909,726 |
3.97%, 03/05/29 (a)(b) | 825,000 | 773,635 |
5.20%, 04/25/29 (a)(b) | 950,000 | 940,281 |
2.09%, 06/14/29 (a)(b) | 875,000 | 747,994 |
4.27%, 07/23/29 (a)(b) | 850,000 | 807,627 |
3.97%, 02/07/30 (a)(b) | 850,000 | 788,723 |
3.19%, 07/23/30 (a)(b) | 800,000 | 707,400 |
2.88%, 10/22/30 (a)(b) | 600,000 | 517,746 |
2.50%, 02/13/31 (a)(b) | 1,000,000 | 837,560 |
2.59%, 04/29/31 (a)(b) | 800,000 | 673,328 |
1.90%, 07/23/31 (a)(b) | 800,000 | 637,368 |
1.92%, 10/24/31 (a)(b) | 750,000 | 595,140 |
2.65%, 03/11/32 (a)(b) | 600,000 | 497,166 |
2.69%, 04/22/32 (a)(b) | 1,200,000 | 995,064 |
SECURITY RATE, MATURITY DATE | FACE AMOUNT ($) | VALUE ($) |
2.30%, 07/21/32 (a)(b) | 1,350,000 | 1,079,838 |
2.57%, 10/20/32 (a)(b) | 1,000,000 | 814,710 |
2.97%, 02/04/33 (a)(b) | 1,000,000 | 834,200 |
4.57%, 04/27/33 (a)(b) | 1,000,000 | 941,910 |
5.02%, 07/22/33 (a)(b) | 1,400,000 | 1,370,348 |
5.29%, 04/25/34 (a)(b) | 1,000,000 | 991,480 |
2.48%, 09/21/36 (a)(b) | 425,000 | 324,768 |
6.11%, 01/29/37 | 575,000 | 606,694 |
3.85%, 03/08/37 (a)(b) | 700,000 | 599,515 |
4.24%, 04/24/38 (a)(b) | 250,000 | 219,873 |
7.75%, 05/14/38 | 500,000 | 597,800 |
4.08%, 04/23/40 (a)(b) | 400,000 | 344,160 |
2.68%, 06/19/41 (a)(b) | 1,400,000 | 984,620 |
5.88%, 02/07/42 | 450,000 | 480,861 |
3.31%, 04/22/42 (a)(b) | 1,000,000 | 766,010 |
5.00%, 01/21/44 | 625,000 | 603,106 |
4.88%, 04/01/44 | 150,000 | 143,823 |
4.75%, 04/21/45 | 200,000 | 182,864 |
4.44%, 01/20/48 (a)(b) | 600,000 | 531,480 |
3.95%, 01/23/49 (a)(b) | 400,000 | 325,024 |
4.33%, 03/15/50 (a)(b) | 800,000 | 690,896 |
4.08%, 03/20/51 (a)(b) | 1,500,000 | 1,245,360 |
2.83%, 10/24/51 (a)(b) | 350,000 | 230,734 |
3.48%, 03/13/52 (a)(b) | 75,000 | 55,998 |
2.97%, 07/21/52 (a)(b) | 600,000 | 409,800 |
Bank of America NA | ||
6.00%, 10/15/36 | 350,000 | 374,531 |
Bank of Montreal | ||
4.25%, 09/14/24 | 400,000 | 392,552 |
5.20%, 12/12/24 | 400,000 | 396,860 |
1.50%, 01/10/25 | 500,000 | 469,895 |
1.85%, 05/01/25 | 475,000 | 444,239 |
3.70%, 06/07/25 | 400,000 | 386,692 |
1.25%, 09/15/26 | 400,000 | 353,268 |
0.95%, 01/22/27 (a)(b) | 500,000 | 446,155 |
2.65%, 03/08/27 | 300,000 | 274,779 |
4.70%, 09/14/27 (a) | 200,000 | 195,518 |
5.20%, 02/01/28 (a) | 350,000 | 350,074 |
3.80%, 12/15/32 (a)(b) | 304,000 | 268,724 |
3.09%, 01/10/37 (a)(b) | 300,000 | 235,572 |
Bank of New York Mellon Corp. | ||
3.25%, 09/11/24 (a) | 350,000 | 340,295 |
2.10%, 10/24/24 | 445,000 | 425,967 |
0.85%, 10/25/24 (a) | 250,000 | 234,978 |
3.00%, 02/24/25 (a) | 350,000 | 336,910 |
1.60%, 04/24/25 (a) | 550,000 | 515,839 |
3.35%, 04/25/25 (a) | 100,000 | 96,284 |
3.95%, 11/18/25 (a) | 300,000 | 289,929 |
5.22%, 11/21/25 (a)(b) | 100,000 | 99,474 |
0.75%, 01/28/26 (a) | 150,000 | 134,075 |
4.41%, 07/24/26 (a)(b) | 400,000 | 391,720 |
2.45%, 08/17/26 (a) | 300,000 | 277,053 |
1.05%, 10/15/26 (a) | 150,000 | 131,219 |
2.05%, 01/26/27 (a) | 250,000 | 225,380 |
3.25%, 05/16/27 (a) | 325,000 | 304,418 |
3.40%, 01/29/28 (a) | 250,000 | 234,460 |
3.44%, 02/07/28 (a)(b) | 475,000 | 447,364 |
3.85%, 04/28/28 | 100,000 | 95,387 |
3.99%, 06/13/28 (a)(b) | 100,000 | 96,018 |
1.65%, 07/14/28 (a) | 100,000 | 85,773 |
5.80%, 10/25/28 (a)(b) | 400,000 | 407,904 |
3.00%, 10/30/28 (a) | 225,000 | 202,239 |
4.54%, 02/01/29 (a)(b) | 250,000 | 243,625 |
3.85%, 04/26/29 (a) | 100,000 | 95,608 |
3.30%, 08/23/29 (a) | 250,000 | 224,810 |
4.60%, 07/26/30 (a)(b) | 150,000 | 145,037 |
1.80%, 07/28/31 (a) | 200,000 | 157,888 |
SECURITY RATE, MATURITY DATE | FACE AMOUNT ($) | VALUE ($) |
4.29%, 06/13/33 (a)(b) | 250,000 | 237,173 |
5.83%, 10/25/33 (a)(b) | 400,000 | 417,404 |
4.97%, 04/26/34 (a)(b) | 250,000 | 244,628 |
Bank of Nova Scotia | ||
0.65%, 07/31/24 | 275,000 | 260,508 |
1.45%, 01/10/25 | 500,000 | 469,070 |
2.20%, 02/03/25 | 400,000 | 378,612 |
3.45%, 04/11/25 | 500,000 | 481,935 |
1.30%, 06/11/25 | 300,000 | 276,120 |
4.50%, 12/16/25 | 600,000 | 579,426 |
4.75%, 02/02/26 | 300,000 | 295,479 |
1.05%, 03/02/26 | 350,000 | 311,878 |
1.35%, 06/24/26 | 250,000 | 223,010 |
2.70%, 08/03/26 | 500,000 | 463,305 |
1.95%, 02/02/27 | 450,000 | 402,156 |
2.95%, 03/11/27 | 250,000 | 231,938 |
4.85%, 02/01/30 | 200,000 | 193,212 |
2.15%, 08/01/31 | 200,000 | 159,738 |
2.45%, 02/02/32 | 300,000 | 245,037 |
4.59%, 05/04/37 (a)(b) | 600,000 | 515,754 |
Bank OZK | ||
2.75%, 10/01/31 (a)(b) | 125,000 | 98,535 |
BankUnited, Inc. | ||
4.88%, 11/17/25 (a) | 150,000 | 138,920 |
5.13%, 06/11/30 (a) | 100,000 | 77,160 |
Barclays PLC | ||
4.38%, 09/11/24 | 200,000 | 194,458 |
3.65%, 03/16/25 | 600,000 | 575,382 |
4.38%, 01/12/26 | 750,000 | 721,005 |
2.85%, 05/07/26 (a)(b) | 400,000 | 375,100 |
5.20%, 05/12/26 | 650,000 | 627,711 |
5.30%, 08/09/26 (a)(b) | 500,000 | 489,915 |
7.33%, 11/02/26 (a)(b) | 500,000 | 512,205 |
5.83%, 05/09/27 (a)(b) | 100,000 | 98,759 |
2.28%, 11/24/27 (a)(b) | 400,000 | 352,396 |
4.34%, 01/10/28 (a) | 400,000 | 377,128 |
4.84%, 05/09/28 (a) | 600,000 | 553,842 |
5.50%, 08/09/28 (a)(b) | 500,000 | 488,405 |
7.39%, 11/02/28 (a)(b) | 400,000 | 418,116 |
4.97%, 05/16/29 (a)(b) | 650,000 | 616,167 |
5.09%, 06/20/30 (a)(b) | 450,000 | 409,855 |
2.65%, 06/24/31 (a)(b) | 300,000 | 241,302 |
2.67%, 03/10/32 (a)(b) | 250,000 | 197,145 |
2.89%, 11/24/32 (a)(b) | 400,000 | 315,240 |
5.75%, 08/09/33 (a)(b) | 300,000 | 290,466 |
7.44%, 11/02/33 (a)(b) | 600,000 | 649,704 |
6.22%, 05/09/34 (a)(b) | 600,000 | 598,392 |
7.12%, 06/27/34 (a)(b) | 500,000 | 500,095 |
3.56%, 09/23/35 (a)(b) | 300,000 | 237,837 |
3.81%, 03/10/42 (a)(b) | 300,000 | 213,462 |
3.33%, 11/24/42 (a)(b) | 500,000 | 351,930 |
5.25%, 08/17/45 | 400,000 | 373,716 |
4.95%, 01/10/47 | 400,000 | 354,864 |
BNP Paribas S.A. | ||
4.25%, 10/15/24 | 300,000 | 292,479 |
BPCE S.A. | ||
3.38%, 12/02/26 | 250,000 | 233,545 |
Cadence Bank | ||
4.13%, 11/20/29 (a)(b) | 125,000 | 115,493 |
Canadian Imperial Bank of Commerce | ||
2.25%, 01/28/25 | 400,000 | 379,384 |
3.30%, 04/07/25 | 400,000 | 384,808 |
3.95%, 08/04/25 | 450,000 | 435,550 |
0.95%, 10/23/25 | 200,000 | 181,908 |
1.25%, 06/22/26 | 100,000 | 88,829 |
3.45%, 04/07/27 | 300,000 | 281,937 |
SECURITY RATE, MATURITY DATE | FACE AMOUNT ($) | VALUE ($) |
5.00%, 04/28/28 (a) | 500,000 | 492,695 |
3.60%, 04/07/32 (a) | 400,000 | 359,724 |
Capital One Financial Corp. | ||
3.30%, 10/30/24 (a) | 450,000 | 432,445 |
3.20%, 02/05/25 (a) | 300,000 | 286,668 |
4.20%, 10/29/25 (a) | 400,000 | 383,932 |
2.64%, 03/03/26 (a)(b) | 500,000 | 467,155 |
4.99%, 07/24/26 (a)(b) | 400,000 | 387,816 |
3.75%, 07/28/26 (a) | 400,000 | 372,872 |
3.75%, 03/09/27 (a) | 250,000 | 233,123 |
3.65%, 05/11/27 (a) | 250,000 | 232,640 |
1.88%, 11/02/27 (a)(b) | 600,000 | 516,990 |
3.80%, 01/31/28 (a) | 550,000 | 507,232 |
4.93%, 05/10/28 (a)(b) | 300,000 | 284,790 |
6.31%, 06/08/29 (a)(b) | 500,000 | 497,000 |
3.27%, 03/01/30 (a)(b) | 450,000 | 383,895 |
2.36%, 07/29/32 (a)(b) | 375,000 | 265,380 |
2.62%, 11/02/32 (a)(b) | 200,000 | 154,076 |
5.27%, 05/10/33 (a)(b) | 450,000 | 421,564 |
5.82%, 02/01/34 (a)(b) | 350,000 | 334,964 |
6.38%, 06/08/34 (a)(b) | 350,000 | 347,753 |
Capital One NA | ||
2.28%, 01/28/26 (a)(b) | 325,000 | 303,576 |
Citigroup, Inc. | ||
4.00%, 08/05/24 | 250,000 | 245,660 |
3.88%, 03/26/25 | 200,000 | 193,386 |
3.30%, 04/27/25 | 565,000 | 544,151 |
4.40%, 06/10/25 | 650,000 | 632,047 |
5.50%, 09/13/25 | 450,000 | 447,862 |
3.70%, 01/12/26 | 600,000 | 575,556 |
2.01%, 01/25/26 (a)(b) | 500,000 | 470,330 |
4.60%, 03/09/26 | 450,000 | 435,888 |
3.29%, 03/17/26 (a)(b) | 400,000 | 383,024 |
3.11%, 04/08/26 (a)(b) | 1,000,000 | 955,220 |
3.40%, 05/01/26 | 500,000 | 475,710 |
5.61%, 09/29/26 (a)(b) | 700,000 | 700,105 |
3.20%, 10/21/26 (a) | 850,000 | 795,948 |
4.30%, 11/20/26 | 350,000 | 335,640 |
1.12%, 01/28/27 (a)(b) | 600,000 | 535,506 |
1.46%, 06/09/27 (a)(b) | 800,000 | 710,808 |
4.45%, 09/29/27 | 1,050,000 | 1,003,548 |
3.89%, 01/10/28 (a)(b) | 800,000 | 758,592 |
6.63%, 01/15/28 | 150,000 | 158,786 |
3.07%, 02/24/28 (a)(b) | 500,000 | 460,665 |
4.66%, 05/24/28 (a)(b) | 300,000 | 293,136 |
3.67%, 07/24/28 (a)(b) | 700,000 | 655,543 |
4.13%, 07/25/28 | 650,000 | 613,502 |
3.52%, 10/27/28 (a)(b) | 850,000 | 790,559 |
4.08%, 04/23/29 (a)(b) | 550,000 | 518,265 |
3.98%, 03/20/30 (a)(b) | 750,000 | 695,452 |
2.98%, 11/05/30 (a)(b) | 600,000 | 521,280 |
2.67%, 01/29/31 (a)(b) | 750,000 | 635,107 |
4.41%, 03/31/31 (a)(b) | 1,200,000 | 1,130,796 |
2.57%, 06/03/31 (a)(b) | 1,100,000 | 919,160 |
2.56%, 05/01/32 (a)(b) | 750,000 | 613,087 |
6.63%, 06/15/32 | 250,000 | 264,933 |
2.52%, 11/03/32 (a)(b) | 600,000 | 484,758 |
3.06%, 01/25/33 (a)(b) | 900,000 | 751,167 |
5.88%, 02/22/33 | 150,000 | 152,529 |
3.79%, 03/17/33 (a)(b) | 700,000 | 619,675 |
4.91%, 05/24/33 (a)(b) | 700,000 | 678,279 |
6.00%, 10/31/33 | 200,000 | 206,244 |
6.27%, 11/17/33 (a)(b) | 700,000 | 743,533 |
6.17%, 05/25/34 (a)(b) | 750,000 | 755,317 |
6.13%, 08/25/36 | 200,000 | 204,470 |
3.88%, 01/24/39 (a)(b) | 300,000 | 252,072 |
8.13%, 07/15/39 | 550,000 | 704,544 |
SECURITY RATE, MATURITY DATE | FACE AMOUNT ($) | VALUE ($) |
5.32%, 03/26/41 (a)(b) | 450,000 | 441,904 |
5.88%, 01/30/42 | 250,000 | 263,270 |
2.90%, 11/03/42 (a)(b) | 250,000 | 177,788 |
6.68%, 09/13/43 | 300,000 | 324,285 |
5.30%, 05/06/44 | 250,000 | 232,130 |
4.65%, 07/30/45 | 200,000 | 177,890 |
4.75%, 05/18/46 | 600,000 | 514,878 |
4.28%, 04/24/48 (a)(b) | 350,000 | 302,162 |
4.65%, 07/23/48 (a) | 700,000 | 635,747 |
Citizens Bank NA | ||
2.25%, 04/28/25 (a) | 250,000 | 226,578 |
6.06%, 10/24/25 (a)(b) | 250,000 | 238,188 |
3.75%, 02/18/26 (a) | 100,000 | 91,529 |
Citizens Financial Group, Inc. | ||
4.30%, 12/03/25 (a) | 400,000 | 371,184 |
2.85%, 07/27/26 (a) | 250,000 | 222,590 |
2.50%, 02/06/30 (a) | 200,000 | 157,672 |
3.25%, 04/30/30 (a) | 300,000 | 247,656 |
5.64%, 05/21/37 (a)(b) | 100,000 | 86,494 |
Comerica Bank | ||
4.00%, 07/27/25 | 250,000 | 229,590 |
Comerica, Inc. | ||
4.00%, 02/01/29 (a) | 250,000 | 210,478 |
Commonwealth Bank of Australia | ||
5.08%, 01/10/25 | 300,000 | 298,689 |
5.32%, 03/13/26 | 300,000 | 300,873 |
Cooperatieve Rabobank UA | ||
3.88%, 08/22/24 | 250,000 | 245,353 |
1.38%, 01/10/25 | 300,000 | 282,459 |
3.38%, 05/21/25 | 500,000 | 481,845 |
4.38%, 08/04/25 | 500,000 | 483,065 |
3.75%, 07/21/26 | 500,000 | 467,385 |
5.25%, 05/24/41 | 350,000 | 366,166 |
5.75%, 12/01/43 | 300,000 | 301,656 |
5.25%, 08/04/45 | 250,000 | 234,035 |
Credit Suisse AG | ||
4.75%, 08/09/24 | 300,000 | 293,595 |
3.63%, 09/09/24 | 700,000 | 676,382 |
7.95%, 01/09/25 | 350,000 | 357,308 |
3.70%, 02/21/25 | 500,000 | 478,860 |
2.95%, 04/09/25 | 300,000 | 282,504 |
1.25%, 08/07/26 | 500,000 | 431,000 |
5.00%, 07/09/27 | 250,000 | 241,168 |
7.50%, 02/15/28 | 750,000 | 797,805 |
Credit Suisse USA, Inc. | ||
7.13%, 07/15/32 | 300,000 | 332,814 |
Deutsche Bank AG | ||
4.50%, 04/01/25 | 400,000 | 381,124 |
3.96%, 11/26/25 (a)(b) | 700,000 | 668,633 |
4.10%, 01/13/26 | 300,000 | 282,491 |
1.69%, 03/19/26 | 300,000 | 270,750 |
6.12%, 07/14/26 (a)(b) | 200,000 | 198,694 |
2.13%, 11/24/26 (a)(b) | 600,000 | 533,670 |
2.31%, 11/16/27 (a)(b) | 650,000 | 559,838 |
2.55%, 01/07/28 (a)(b) | 400,000 | 347,600 |
6.72%, 01/18/29 (a)(b) | 225,000 | 226,067 |
5.88%, 07/08/31 (a)(b) | 150,000 | 132,080 |
3.55%, 09/18/31 (a)(b) | 450,000 | 374,332 |
3.73%, 01/14/32 (a)(b) | 350,000 | 264,394 |
3.04%, 05/28/32 (a)(b) | 350,000 | 277,081 |
4.88%, 12/01/32 (a)(b) | 250,000 | 211,608 |
3.74%, 01/07/33 (a)(b) | 350,000 | 256,666 |
7.08%, 02/10/34 (a)(b) | 300,000 | 276,516 |
SECURITY RATE, MATURITY DATE | FACE AMOUNT ($) | VALUE ($) |
Discover Bank | ||
2.45%, 09/12/24 (a) | 300,000 | 284,472 |
4.65%, 09/13/28 (a) | 500,000 | 464,965 |
2.70%, 02/06/30 (a) | 550,000 | 443,338 |
Discover Financial Services | ||
3.95%, 11/06/24 (a) | 200,000 | 193,096 |
3.75%, 03/04/25 (a) | 250,000 | 239,675 |
4.50%, 01/30/26 (a) | 50,000 | 47,929 |
4.10%, 02/09/27 (a) | 300,000 | 279,297 |
Fifth Third Bancorp | ||
2.38%, 01/28/25 (a) | 100,000 | 93,938 |
2.55%, 05/05/27 (a) | 300,000 | 266,229 |
1.71%, 11/01/27 (a)(b) | 250,000 | 213,688 |
3.95%, 03/14/28 (a) | 200,000 | 183,942 |
4.34%, 04/25/33 (a)(b) | 75,000 | 66,434 |
8.25%, 03/01/38 | 350,000 | 401,926 |
Fifth Third Bank NA | ||
3.95%, 07/28/25 (a) | 600,000 | 573,606 |
5.85%, 10/27/25 (a)(b) | 300,000 | 292,923 |
3.85%, 03/15/26 (a) | 500,000 | 461,690 |
2.25%, 02/01/27 (a) | 50,000 | 43,958 |
First Citizens BancShares, Inc. | ||
3.38%, 03/15/30 (a)(b) | 25,000 | 22,947 |
First Horizon Bank | ||
5.75%, 05/01/30 (a) | 250,000 | 217,508 |
First-Citizens Bank & Trust Co. | ||
2.97%, 09/27/25 (a)(b) | 250,000 | 235,495 |
6.13%, 03/09/28 | 50,000 | 49,434 |
Goldman Sachs Capital l | ||
6.35%, 02/15/34 | 300,000 | 301,944 |
Goldman Sachs Group, Inc. | ||
3.85%, 07/08/24 (a) | 600,000 | 588,684 |
5.70%, 11/01/24 | 500,000 | 499,700 |
3.50%, 01/23/25 (a) | 750,000 | 724,432 |
3.50%, 04/01/25 (a) | 975,000 | 936,643 |
3.75%, 05/22/25 (a) | 700,000 | 677,033 |
3.27%, 09/29/25 (a)(b) | 800,000 | 773,440 |
4.25%, 10/21/25 | 400,000 | 385,900 |
0.86%, 02/12/26 (a)(b) | 150,000 | 138,350 |
3.75%, 02/25/26 (a) | 475,000 | 456,366 |
3.50%, 11/16/26 (a) | 800,000 | 751,408 |
1.09%, 12/09/26 (a)(b) | 725,000 | 647,932 |
5.95%, 01/15/27 | 265,000 | 268,493 |
3.85%, 01/26/27 (a) | 645,000 | 614,517 |
1.43%, 03/09/27 (a)(b) | 900,000 | 805,500 |
1.54%, 09/10/27 (a)(b) | 800,000 | 703,792 |
1.95%, 10/21/27 (a)(b) | 1,200,000 | 1,067,652 |
2.64%, 02/24/28 (a)(b) | 850,000 | 772,573 |
3.62%, 03/15/28 (a)(b) | 500,000 | 469,380 |
3.69%, 06/05/28 (a)(b) | 800,000 | 752,256 |
4.48%, 08/23/28 (a)(b) | 500,000 | 483,970 |
3.81%, 04/23/29 (a)(b) | 675,000 | 628,236 |
4.22%, 05/01/29 (a)(b) | 1,050,000 | 992,964 |
2.60%, 02/07/30 (a) | 600,000 | 513,882 |
3.80%, 03/15/30 (a) | 700,000 | 647,682 |
1.99%, 01/27/32 (a)(b) | 750,000 | 591,285 |
2.62%, 04/22/32 (a)(b) | 800,000 | 656,288 |
2.38%, 07/21/32 (a)(b) | 1,200,000 | 961,980 |
2.65%, 10/21/32 (a)(b) | 1,025,000 | 836,554 |
6.13%, 02/15/33 | 200,000 | 215,008 |
3.10%, 02/24/33 (a)(b) | 1,200,000 | 1,014,336 |
6.45%, 05/01/36 | 225,000 | 235,206 |
6.75%, 10/01/37 | 1,500,000 | 1,614,030 |
4.02%, 10/31/38 (a)(b) | 800,000 | 678,536 |
4.41%, 04/23/39 (a)(b) | 400,000 | 351,192 |
6.25%, 02/01/41 | 750,000 | 806,257 |
SECURITY RATE, MATURITY DATE | FACE AMOUNT ($) | VALUE ($) |
3.21%, 04/22/42 (a)(b) | 600,000 | 443,844 |
2.91%, 07/21/42 (a)(b) | 450,000 | 319,199 |
3.44%, 02/24/43 (a)(b) | 550,000 | 418,170 |
4.80%, 07/08/44 (a) | 725,000 | 667,377 |
5.15%, 05/22/45 | 650,000 | 606,651 |
4.75%, 10/21/45 (a) | 500,000 | 458,320 |
HSBC Bank USA NA | ||
5.63%, 08/15/35 | 250,000 | 242,588 |
7.00%, 01/15/39 | 200,000 | 216,738 |
HSBC Holdings PLC | ||
4.25%, 08/18/25 | 550,000 | 528,539 |
2.63%, 11/07/25 (a)(b) | 500,000 | 475,780 |
4.18%, 12/09/25 (a)(b) | 400,000 | 388,892 |
4.30%, 03/08/26 | 1,000,000 | 967,790 |
3.00%, 03/10/26 (a)(b) | 400,000 | 380,024 |
1.65%, 04/18/26 (a)(b) | 500,000 | 461,890 |
3.90%, 05/25/26 | 700,000 | 668,052 |
2.10%, 06/04/26 (a)(b) | 650,000 | 602,413 |
4.29%, 09/12/26 (a)(b) | 950,000 | 914,964 |
7.34%, 11/03/26 (a)(b) | 500,000 | 514,980 |
4.38%, 11/23/26 | 400,000 | 378,448 |
1.59%, 05/24/27 (a)(b) | 750,000 | 662,587 |
2.25%, 11/22/27 (a)(b) | 400,000 | 355,168 |
4.04%, 03/13/28 (a)(b) | 800,000 | 751,784 |
4.76%, 06/09/28 (a)(b) | 700,000 | 673,666 |
5.21%, 08/11/28 (a)(b) | 600,000 | 586,956 |
2.01%, 09/22/28 (a)(b) | 650,000 | 557,628 |
7.39%, 11/03/28 (a)(b) | 500,000 | 528,605 |
6.16%, 03/09/29 (a)(b) | 500,000 | 504,880 |
4.58%, 06/19/29 (a)(b) | 1,050,000 | 988,764 |
2.21%, 08/17/29 (a)(b) | 650,000 | 544,752 |
4.95%, 03/31/30 | 700,000 | 689,976 |
3.97%, 05/22/30 (a)(b) | 900,000 | 809,361 |
2.85%, 06/04/31 (a)(b) | 250,000 | 208,460 |
2.36%, 08/18/31 (a)(b) | 500,000 | 400,695 |
2.80%, 05/24/32 (a)(b) | 850,000 | 689,180 |
2.87%, 11/22/32 (a)(b) | 600,000 | 485,124 |
4.76%, 03/29/33 (a)(b) | 400,000 | 361,432 |
5.40%, 08/11/33 (a)(b) | 700,000 | 684,383 |
8.11%, 11/03/33 (a)(b) | 400,000 | 443,768 |
6.25%, 03/09/34 (a)(b) | 600,000 | 615,222 |
6.55%, 06/20/34 (a)(b) | 500,000 | 498,365 |
6.50%, 05/02/36 | 750,000 | 766,494 |
6.50%, 09/15/37 | 550,000 | 558,026 |
6.80%, 06/01/38 | 500,000 | 513,662 |
6.10%, 01/14/42 | 75,000 | 79,779 |
6.33%, 03/09/44 (a)(b) | 700,000 | 727,587 |
5.25%, 03/14/44 | 395,000 | 356,697 |
Huntington Bancshares, Inc. | ||
2.63%, 08/06/24 (a) | 250,000 | 239,563 |
4.00%, 05/15/25 (a) | 150,000 | 144,012 |
2.55%, 02/04/30 (a) | 275,000 | 220,690 |
2.49%, 08/15/36 (a)(b) | 350,000 | 251,339 |
Huntington National Bank | ||
5.70%, 11/18/25 (a)(b) | 300,000 | 291,591 |
4.55%, 05/17/28 (a)(b) | 450,000 | 421,101 |
5.65%, 01/10/30 (a) | 250,000 | 240,848 |
ING Groep N.V. | ||
3.87%, 03/28/26 (a)(b) | 400,000 | 384,428 |
3.95%, 03/29/27 | 500,000 | 475,205 |
1.73%, 04/01/27 (a)(b) | 300,000 | 267,441 |
4.02%, 03/28/28 (a)(b) | 400,000 | 375,764 |
4.55%, 10/02/28 | 250,000 | 240,793 |
4.05%, 04/09/29 | 255,000 | 238,196 |
2.73%, 04/01/32 (a)(b) | 250,000 | 206,468 |
4.25%, 03/28/33 (a)(b) | 400,000 | 366,100 |
SECURITY RATE, MATURITY DATE | FACE AMOUNT ($) | VALUE ($) |
JPMorgan Chase & Co. | ||
3.88%, 09/10/24 | 800,000 | 781,352 |
3.13%, 01/23/25 (a) | 700,000 | 677,257 |
3.90%, 07/15/25 (a) | 750,000 | 731,610 |
7.75%, 07/15/25 | 100,000 | 104,478 |
0.77%, 08/09/25 (a)(b) | 250,000 | 235,438 |
2.30%, 10/15/25 (a)(b) | 550,000 | 524,639 |
1.56%, 12/10/25 (a)(b) | 100,000 | 93,700 |
5.55%, 12/15/25 (a)(b) | 500,000 | 498,195 |
2.60%, 02/24/26 (a)(b) | 500,000 | 474,650 |
2.01%, 03/13/26 (a)(b) | 650,000 | 610,889 |
3.30%, 04/01/26 (a) | 725,000 | 691,084 |
2.08%, 04/22/26 (a)(b) | 1,050,000 | 983,640 |
4.08%, 04/26/26 (a)(b) | 500,000 | 486,185 |
3.20%, 06/15/26 (a) | 349,000 | 332,635 |
2.95%, 10/01/26 (a) | 925,000 | 869,435 |
7.63%, 10/15/26 | 200,000 | 213,978 |
1.05%, 11/19/26 (a)(b) | 800,000 | 717,368 |
4.13%, 12/15/26 | 400,000 | 385,424 |
3.96%, 01/29/27 (a)(b) | 650,000 | 626,340 |
1.04%, 02/04/27 (a)(b) | 650,000 | 579,455 |
1.58%, 04/22/27 (a)(b) | 1,000,000 | 898,740 |
8.00%, 04/29/27 | 350,000 | 385,360 |
1.47%, 09/22/27 (a)(b) | 850,000 | 750,941 |
4.25%, 10/01/27 | 493,000 | 477,880 |
3.63%, 12/01/27 (a) | 300,000 | 281,796 |
3.78%, 02/01/28 (a)(b) | 800,000 | 762,784 |
2.95%, 02/24/28 (a)(b) | 500,000 | 459,690 |
4.32%, 04/26/28 (a)(b) | 500,000 | 483,030 |
3.54%, 05/01/28 (a)(b) | 900,000 | 842,931 |
2.18%, 06/01/28 (a)(b) | 500,000 | 445,325 |
4.85%, 07/25/28 (a)(b) | 1,000,000 | 987,210 |
3.51%, 01/23/29 (a)(b) | 750,000 | 695,377 |
4.01%, 04/23/29 (a)(b) | 750,000 | 707,910 |
2.07%, 06/01/29 (a)(b) | 750,000 | 644,400 |
4.20%, 07/23/29 (a)(b) | 900,000 | 856,962 |
4.45%, 12/05/29 (a)(b) | 750,000 | 720,382 |
3.70%, 05/06/30 (a)(b) | 700,000 | 643,377 |
4.57%, 06/14/30 (a)(b) | 500,000 | 480,945 |
8.75%, 09/01/30 | 200,000 | 241,690 |
2.74%, 10/15/30 (a)(b) | 1,000,000 | 863,160 |
4.49%, 03/24/31 (a)(b) | 1,125,000 | 1,081,260 |
2.52%, 04/22/31 (a)(b) | 800,000 | 678,456 |
2.96%, 05/13/31 (a)(b) | 900,000 | 771,534 |
1.76%, 11/19/31 (a)(b) | 450,000 | 356,647 |
1.95%, 02/04/32 (a)(b) | 900,000 | 717,777 |
2.58%, 04/22/32 (a)(b) | 1,100,000 | 914,012 |
2.55%, 11/08/32 (a)(b) | 750,000 | 615,412 |
2.96%, 01/25/33 (a)(b) | 800,000 | 675,944 |
4.59%, 04/26/33 (a)(b) | 500,000 | 476,930 |
4.91%, 07/25/33 (a)(b) | 1,000,000 | 978,300 |
5.72%, 09/14/33 (a)(b) | 700,000 | 710,507 |
5.35%, 06/01/34 (a)(b) | 250,000 | 252,583 |
6.40%, 05/15/38 | 750,000 | 837,562 |
3.88%, 07/24/38 (a)(b) | 750,000 | 648,247 |
5.50%, 10/15/40 | 350,000 | 362,166 |
3.11%, 04/22/41 (a)(b) | 450,000 | 341,654 |
5.60%, 07/15/41 | 525,000 | 546,556 |
2.53%, 11/19/41 (a)(b) | 400,000 | 275,824 |
5.40%, 01/06/42 | 350,000 | 356,262 |
3.16%, 04/22/42 (a)(b) | 600,000 | 454,464 |
5.63%, 08/16/43 | 400,000 | 410,524 |
4.85%, 02/01/44 | 300,000 | 285,813 |
4.95%, 06/01/45 | 400,000 | 372,900 |
4.26%, 02/22/48 (a)(b) | 575,000 | 499,761 |
4.03%, 07/24/48 (a)(b) | 400,000 | 334,424 |
3.96%, 11/15/48 (a)(b) | 1,000,000 | 821,640 |
3.90%, 01/23/49 (a)(b) | 550,000 | 446,479 |
SECURITY RATE, MATURITY DATE | FACE AMOUNT ($) | VALUE ($) |
3.11%, 04/22/51 (a)(b) | 600,000 | 421,350 |
3.33%, 04/22/52 (a)(b) | 1,000,000 | 730,160 |
KeyBank NA | ||
3.30%, 06/01/25 | 450,000 | 413,869 |
4.15%, 08/08/25 | 250,000 | 230,735 |
3.40%, 05/20/26 | 250,000 | 215,100 |
5.85%, 11/15/27 (a) | 100,000 | 94,260 |
4.39%, 12/14/27 | 250,000 | 220,473 |
6.95%, 02/01/28 | 200,000 | 187,832 |
3.90%, 04/13/29 | 250,000 | 198,645 |
4.90%, 08/08/32 | 250,000 | 197,735 |
KeyCorp | ||
4.15%, 10/29/25 | 100,000 | 93,058 |
2.25%, 04/06/27 | 400,000 | 333,264 |
4.10%, 04/30/28 | 250,000 | 216,915 |
2.55%, 10/01/29 | 250,000 | 189,398 |
4.79%, 06/01/33 (a)(b) | 350,000 | 295,554 |
Lloyds Banking Group PLC | ||
4.50%, 11/04/24 | 300,000 | 291,342 |
4.45%, 05/08/25 | 400,000 | 388,156 |
3.87%, 07/09/25 (a)(b) | 400,000 | 389,712 |
4.58%, 12/10/25 | 200,000 | 191,600 |
2.44%, 02/05/26 (a)(b) | 350,000 | 329,704 |
3.51%, 03/18/26 (a)(b) | 300,000 | 285,585 |
4.65%, 03/24/26 | 450,000 | 429,876 |
4.72%, 08/11/26 (a)(b) | 400,000 | 389,252 |
3.75%, 01/11/27 | 600,000 | 562,746 |
1.63%, 05/11/27 (a)(b) | 300,000 | 265,635 |
3.75%, 03/18/28 (a)(b) | 400,000 | 370,240 |
4.38%, 03/22/28 | 600,000 | 569,916 |
4.55%, 08/16/28 | 200,000 | 189,104 |
3.57%, 11/07/28 (a)(b) | 500,000 | 453,565 |
5.87%, 03/06/29 (a)(b) | 200,000 | 198,704 |
4.98%, 08/11/33 (a)(b) | 400,000 | 374,804 |
7.95%, 11/15/33 (a)(b) | 200,000 | 216,930 |
5.30%, 12/01/45 | 250,000 | 224,323 |
3.37%, 12/14/46 (a)(b) | 250,000 | 164,995 |
4.34%, 01/09/48 | 300,000 | 227,712 |
M&T Bank Corp. | ||
4.55%, 08/16/28 (a)(b) | 175,000 | 163,753 |
5.05%, 01/27/34 (a)(b) | 250,000 | 228,610 |
Manufacturers & Traders Trust Co. | ||
2.90%, 02/06/25 (a) | 250,000 | 236,380 |
4.65%, 01/27/26 (a) | 350,000 | 334,502 |
3.40%, 08/17/27 | 250,000 | 214,830 |
4.70%, 01/27/28 (a) | 350,000 | 330,852 |
Mitsubishi UFJ Financial Group, Inc. | ||
2.80%, 07/18/24 | 300,000 | 290,736 |
2.19%, 02/25/25 | 850,000 | 801,677 |
3.78%, 03/02/25 | 350,000 | 339,147 |
1.41%, 07/17/25 | 600,000 | 550,404 |
4.79%, 07/18/25 (a)(b) | 500,000 | 492,910 |
0.95%, 07/19/25 (a)(b) | 700,000 | 661,500 |
5.06%, 09/12/25 (a)(b) | 600,000 | 592,722 |
0.96%, 10/11/25 (a)(b) | 400,000 | 373,444 |
5.72%, 02/20/26 (a)(b) | 400,000 | 398,140 |
3.85%, 03/01/26 | 750,000 | 719,107 |
2.76%, 09/13/26 | 200,000 | 183,658 |
3.68%, 02/22/27 | 300,000 | 288,708 |
1.54%, 07/20/27 (a)(b) | 500,000 | 441,395 |
3.29%, 07/25/27 | 350,000 | 325,024 |
2.34%, 01/19/28 (a)(b) | 500,000 | 447,685 |
3.96%, 03/02/28 | 350,000 | 333,176 |
5.02%, 07/20/28 (a)(b) | 400,000 | 392,288 |
5.35%, 09/13/28 (a)(b) | 500,000 | 496,690 |
3.74%, 03/07/29 | 550,000 | 509,855 |
SECURITY RATE, MATURITY DATE | FACE AMOUNT ($) | VALUE ($) |
3.20%, 07/18/29 | 750,000 | 663,735 |
2.56%, 02/25/30 | 400,000 | 339,696 |
2.05%, 07/17/30 | 550,000 | 446,440 |
2.31%, 07/20/32 (a)(b) | 900,000 | 717,669 |
2.49%, 10/13/32 (a)(b) | 350,000 | 281,855 |
2.85%, 01/19/33 (a)(b) | 400,000 | 330,444 |
4.32%, 04/19/33 (a)(b) | 200,000 | 185,316 |
5.13%, 07/20/33 (a)(b) | 400,000 | 392,544 |
5.44%, 02/22/34 (a)(b) | 200,000 | 199,562 |
4.29%, 07/26/38 | 150,000 | 135,192 |
4.15%, 03/07/39 | 150,000 | 134,222 |
3.75%, 07/18/39 | 500,000 | 424,200 |
Mizuho Financial Group, Inc. | ||
2.84%, 07/16/25 (a)(b) | 25,000 | 24,087 |
2.56%, 09/13/25 (a)(b) | 250,000 | 238,783 |
2.23%, 05/25/26 (a)(b) | 400,000 | 371,340 |
2.84%, 09/13/26 | 350,000 | 320,877 |
3.66%, 02/28/27 | 300,000 | 282,801 |
1.23%, 05/22/27 (a)(b) | 250,000 | 219,573 |
1.55%, 07/09/27 (a)(b) | 250,000 | 220,550 |
3.17%, 09/11/27 | 500,000 | 457,495 |
4.02%, 03/05/28 | 600,000 | 565,296 |
5.67%, 05/27/29 (a)(b) | 200,000 | 199,708 |
4.25%, 09/11/29 (a)(b) | 550,000 | 515,465 |
3.15%, 07/16/30 (a)(b) | 250,000 | 216,083 |
2.87%, 09/13/30 (a)(b) | 200,000 | 169,688 |
2.59%, 05/25/31 (a)(b) | 250,000 | 207,175 |
2.20%, 07/10/31 (a)(b) | 250,000 | 200,003 |
1.98%, 09/08/31 (a)(b) | 400,000 | 315,660 |
2.56%, 09/13/31 | 225,000 | 177,280 |
2.26%, 07/09/32 (a)(b) | 250,000 | 195,098 |
5.67%, 09/13/33 (a)(b) | 200,000 | 201,732 |
5.75%, 05/27/34 (a)(b) | 200,000 | 201,326 |
Morgan Stanley | ||
3.70%, 10/23/24 | 850,000 | 829,974 |
2.72%, 07/22/25 (a)(b) | 490,000 | 472,644 |
4.00%, 07/23/25 | 800,000 | 776,992 |
0.86%, 10/21/25 (a)(b) | 300,000 | 279,588 |
1.16%, 10/21/25 (a)(b) | 500,000 | 467,535 |
5.00%, 11/24/25 | 600,000 | 590,556 |
3.88%, 01/27/26 | 850,000 | 820,539 |
2.63%, 02/18/26 (a)(b) | 500,000 | 474,745 |
2.19%, 04/28/26 (a)(b) | 750,000 | 704,467 |
4.68%, 07/17/26 (a)(b) | 625,000 | 613,419 |
3.13%, 07/27/26 | 950,000 | 890,967 |
6.25%, 08/09/26 | 200,000 | 204,572 |
4.35%, 09/08/26 | 650,000 | 627,978 |
6.14%, 10/16/26 (a)(b) | 300,000 | 303,606 |
0.99%, 12/10/26 (a)(b) | 700,000 | 625,170 |
3.63%, 01/20/27 | 900,000 | 855,477 |
5.05%, 01/28/27 (a)(b) | 400,000 | 396,752 |
3.95%, 04/23/27 | 650,000 | 616,382 |
1.59%, 05/04/27 (a)(b) | 750,000 | 671,632 |
1.51%, 07/20/27 (a)(b) | 750,000 | 664,860 |
2.48%, 01/21/28 (a)(b) | 750,000 | 678,165 |
4.21%, 04/20/28 (a)(b) | 750,000 | 720,832 |
3.59%, 07/22/28 (a)(b) | 900,000 | 832,050 |
6.30%, 10/18/28 (a)(b) | 500,000 | 515,440 |
3.77%, 01/24/29 (a)(b) | 850,000 | 795,149 |
5.12%, 02/01/29 (a)(b) | 500,000 | 493,660 |
5.16%, 04/20/29 (a)(b) | 800,000 | 791,504 |
4.43%, 01/23/30 (a)(b) | 950,000 | 905,103 |
2.70%, 01/22/31 (a)(b) | 1,000,000 | 852,970 |
3.62%, 04/01/31 (a)(b) | 900,000 | 813,393 |
1.79%, 02/13/32 (a)(b) | 750,000 | 583,042 |
7.25%, 04/01/32 | 300,000 | 341,367 |
1.93%, 04/28/32 (a)(b) | 850,000 | 663,799 |
SECURITY RATE, MATURITY DATE | FACE AMOUNT ($) | VALUE ($) |
2.24%, 07/21/32 (a)(b) | 1,100,000 | 875,501 |
2.51%, 10/20/32 (a)(b) | 750,000 | 605,970 |
2.94%, 01/21/33 (a)(b) | 750,000 | 624,660 |
4.89%, 07/20/33 (a)(b) | 500,000 | 481,900 |
6.34%, 10/18/33 (a)(b) | 800,000 | 852,768 |
5.25%, 04/21/34 (a)(b) | 900,000 | 888,723 |
2.48%, 09/16/36 (a)(b) | 900,000 | 681,453 |
5.30%, 04/20/37 (a)(b) | 400,000 | 378,460 |
5.95%, 01/19/38 (a)(b) | 400,000 | 394,832 |
3.97%, 07/22/38 (a)(b) | 675,000 | 574,398 |
4.46%, 04/22/39 (a)(b) | 325,000 | 290,680 |
3.22%, 04/22/42 (a)(b) | 600,000 | 456,960 |
6.38%, 07/24/42 | 600,000 | 670,356 |
4.30%, 01/27/45 | 550,000 | 482,097 |
4.38%, 01/22/47 | 600,000 | 537,576 |
5.60%, 03/24/51 (a)(b) | 700,000 | 731,997 |
2.80%, 01/25/52 (a)(b) | 600,000 | 394,968 |
National Australia Bank Ltd. | ||
5.13%, 11/22/24 | 250,000 | 248,993 |
3.50%, 06/09/25 | 250,000 | 241,710 |
3.38%, 01/14/26 | 600,000 | 574,872 |
2.50%, 07/12/26 | 450,000 | 416,380 |
3.91%, 06/09/27 | 500,000 | 480,100 |
4.90%, 06/13/28 | 500,000 | 495,390 |
Natwest Group PLC | ||
4.80%, 04/05/26 | 600,000 | 582,990 |
7.47%, 11/10/26 (a)(b) | 200,000 | 204,764 |
5.85%, 03/02/27 (a)(b) | 300,000 | 296,901 |
1.64%, 06/14/27 (a)(b) | 350,000 | 308,305 |
3.07%, 05/22/28 (a)(b) | 300,000 | 270,198 |
5.52%, 09/30/28 (a)(b) | 300,000 | 294,546 |
4.89%, 05/18/29 (a)(b) | 550,000 | 524,056 |
3.75%, 11/01/29 (a)(b) | 200,000 | 187,834 |
5.08%, 01/27/30 (a)(b) | 550,000 | 527,235 |
4.45%, 05/08/30 (a)(b) | 300,000 | 276,246 |
6.02%, 03/02/34 (a)(b) | 200,000 | 201,716 |
3.03%, 11/28/35 (a)(b) | 250,000 | 191,700 |
Northern Trust Corp. | ||
3.95%, 10/30/25 | 350,000 | 337,544 |
4.00%, 05/10/27 (a) | 150,000 | 145,232 |
3.65%, 08/03/28 (a) | 250,000 | 237,218 |
3.15%, 05/03/29 (a) | 150,000 | 136,698 |
1.95%, 05/01/30 (a) | 325,000 | 267,985 |
3.38%, 05/08/32 (a)(b) | 300,000 | 269,430 |
PNC Bank NA | ||
2.50%, 08/27/24 (a) | 250,000 | 239,748 |
3.30%, 10/30/24 (a) | 300,000 | 289,866 |
3.88%, 04/10/25 (a) | 250,000 | 239,415 |
3.25%, 06/01/25 (a) | 500,000 | 477,620 |
3.10%, 10/25/27 (a) | 300,000 | 275,055 |
3.25%, 01/22/28 (a) | 400,000 | 368,668 |
4.05%, 07/26/28 | 550,000 | 507,804 |
2.70%, 10/22/29 | 425,000 | 357,225 |
PNC Financial Services Group, Inc. | ||
2.20%, 11/01/24 (a) | 200,000 | 190,874 |
5.81%, 06/12/26 (a)(b) | 300,000 | 298,464 |
2.60%, 07/23/26 (a) | 300,000 | 277,467 |
1.15%, 08/13/26 (a) | 200,000 | 175,628 |
4.76%, 01/26/27 (a)(b) | 400,000 | 391,388 |
3.15%, 05/19/27 (a) | 200,000 | 186,002 |
3.45%, 04/23/29 (a) | 500,000 | 452,200 |
5.58%, 06/12/29 (a)(b) | 550,000 | 547,811 |
2.55%, 01/22/30 (a) | 600,000 | 507,390 |
2.31%, 04/23/32 (a)(b) | 300,000 | 243,963 |
6.04%, 10/28/33 (a)(b) | 350,000 | 359,821 |
5.07%, 01/24/34 (a)(b) | 400,000 | 383,876 |
SECURITY RATE, MATURITY DATE | FACE AMOUNT ($) | VALUE ($) |
Regions Bank | ||
6.45%, 06/26/37 | 250,000 | 247,810 |
Regions Financial Corp. | ||
2.25%, 05/18/25 (a) | 150,000 | 139,154 |
1.80%, 08/12/28 (a) | 250,000 | 204,393 |
Royal Bank of Canada | ||
2.55%, 07/16/24 | 400,000 | 387,664 |
3.97%, 07/26/24 | 500,000 | 490,895 |
0.75%, 10/07/24 | 200,000 | 187,840 |
2.25%, 11/01/24 | 750,000 | 716,257 |
1.60%, 01/21/25 | 225,000 | 211,961 |
3.38%, 04/14/25 | 400,000 | 385,524 |
4.95%, 04/25/25 | 450,000 | 444,672 |
1.15%, 06/10/25 | 400,000 | 369,184 |
4.88%, 01/12/26 | 400,000 | 395,560 |
0.88%, 01/20/26 | 650,000 | 582,081 |
4.65%, 01/27/26 | 450,000 | 438,403 |
1.20%, 04/27/26 | 350,000 | 312,389 |
1.15%, 07/14/26 | 300,000 | 266,034 |
1.40%, 11/02/26 | 200,000 | 176,494 |
3.63%, 05/04/27 | 400,000 | 378,740 |
4.24%, 08/03/27 | 550,000 | 531,712 |
6.00%, 11/01/27 | 500,000 | 513,475 |
2.30%, 11/03/31 | 300,000 | 243,654 |
3.88%, 05/04/32 | 350,000 | 321,178 |
5.00%, 02/01/33 | 500,000 | 490,355 |
Santander Holdings USA, Inc. | ||
3.45%, 06/02/25 (a) | 250,000 | 235,923 |
4.50%, 07/17/25 (a) | 500,000 | 486,475 |
5.81%, 09/09/26 (a)(b) | 100,000 | 98,705 |
3.24%, 10/05/26 (a)(c) | 350,000 | 315,501 |
4.40%, 07/13/27 (a) | 550,000 | 518,831 |
2.49%, 01/06/28 (a)(b) | 50,000 | 43,292 |
6.57%, 06/12/29 (a)(b) | 100,000 | 98,277 |
Santander UK Group Holdings PLC | ||
1.53%, 08/21/26 (a)(b) | 400,000 | 356,436 |
1.67%, 06/14/27 (a)(b) | 200,000 | 173,308 |
2.47%, 01/11/28 (a)(b) | 500,000 | 437,220 |
3.82%, 11/03/28 (a)(b) | 425,000 | 382,755 |
2.90%, 03/15/32 (a)(b) | 200,000 | 162,282 |
State Street Corp. | ||
3.30%, 12/16/24 | 400,000 | 387,012 |
3.55%, 08/18/25 | 571,000 | 552,705 |
2.35%, 11/01/25 (a)(b) | 450,000 | 429,574 |
2.90%, 03/30/26 (a)(b) | 100,000 | 95,611 |
2.65%, 05/19/26 | 250,000 | 234,653 |
1.68%, 11/18/27 (a)(b) | 250,000 | 223,495 |
2.20%, 02/07/28 (a)(b) | 75,000 | 67,762 |
4.14%, 12/03/29 (a)(b) | 300,000 | 285,462 |
2.40%, 01/24/30 | 250,000 | 216,253 |
2.20%, 03/03/31 | 200,000 | 163,014 |
3.15%, 03/30/31 (a)(b) | 200,000 | 176,512 |
2.62%, 02/07/33 (a)(b) | 150,000 | 125,996 |
4.42%, 05/13/33 (a)(b) | 200,000 | 191,360 |
4.16%, 08/04/33 (a)(b) | 350,000 | 325,941 |
4.82%, 01/26/34 (a)(b) | 200,000 | 194,692 |
3.03%, 11/01/34 (a)(b) | 100,000 | 85,245 |
Sumitomo Mitsui Banking Corp. | ||
3.65%, 07/23/25 | 250,000 | 239,048 |
Sumitomo Mitsui Financial Group, Inc. | ||
2.70%, 07/16/24 | 575,000 | 556,519 |
2.45%, 09/27/24 | 350,000 | 335,500 |
2.35%, 01/15/25 | 250,000 | 237,110 |
1.47%, 07/08/25 | 750,000 | 689,992 |
5.46%, 01/13/26 | 400,000 | 399,232 |
3.78%, 03/09/26 | 550,000 | 525,877 |
SECURITY RATE, MATURITY DATE | FACE AMOUNT ($) | VALUE ($) |
2.63%, 07/14/26 | 700,000 | 644,441 |
1.40%, 09/17/26 | 500,000 | 439,970 |
3.01%, 10/19/26 | 400,000 | 370,500 |
3.45%, 01/11/27 | 300,000 | 281,820 |
2.17%, 01/14/27 | 300,000 | 268,539 |
3.36%, 07/12/27 | 600,000 | 561,348 |
5.52%, 01/13/28 | 500,000 | 502,620 |
3.54%, 01/17/28 | 400,000 | 369,512 |
3.94%, 07/19/28 | 150,000 | 140,517 |
1.90%, 09/17/28 | 700,000 | 589,092 |
4.31%, 10/16/28 | 250,000 | 237,110 |
3.04%, 07/16/29 | 750,000 | 656,092 |
3.20%, 09/17/29 | 50,000 | 43,846 |
2.72%, 09/27/29 | 200,000 | 171,002 |
5.71%, 01/13/30 | 300,000 | 304,248 |
2.75%, 01/15/30 | 450,000 | 388,332 |
2.13%, 07/08/30 | 450,000 | 366,673 |
2.14%, 09/23/30 | 350,000 | 279,353 |
2.22%, 09/17/31 | 350,000 | 279,759 |
5.77%, 01/13/33 | 500,000 | 515,035 |
2.93%, 09/17/41 | 250,000 | 177,650 |
3.05%, 01/14/42 | 50,000 | 37,307 |
Synchrony Bank | ||
5.40%, 08/22/25 (a) | 250,000 | 239,303 |
Synchrony Financial | ||
4.25%, 08/15/24 (a) | 350,000 | 338,282 |
4.50%, 07/23/25 (a) | 300,000 | 283,878 |
3.70%, 08/04/26 (a) | 450,000 | 404,397 |
3.95%, 12/01/27 (a) | 550,000 | 480,804 |
5.15%, 03/19/29 (a) | 225,000 | 204,804 |
2.88%, 10/28/31 (a) | 150,000 | 108,941 |
Synovus Financial Corp. | ||
5.20%, 08/11/25 (a) | 50,000 | 47,805 |
Toronto-Dominion Bank | ||
0.70%, 09/10/24 | 300,000 | 282,879 |
4.29%, 09/13/24 | 300,000 | 294,783 |
1.45%, 01/10/25 | 200,000 | 188,284 |
3.77%, 06/06/25 | 500,000 | 485,150 |
1.15%, 06/12/25 | 300,000 | 276,585 |
0.75%, 09/11/25 | 200,000 | 181,050 |
0.75%, 01/06/26 | 375,000 | 334,961 |
5.10%, 01/09/26 | 200,000 | 199,432 |
1.20%, 06/03/26 | 300,000 | 266,841 |
1.25%, 09/10/26 | 400,000 | 353,980 |
1.95%, 01/12/27 | 250,000 | 225,190 |
2.80%, 03/10/27 | 350,000 | 320,698 |
4.11%, 06/08/27 | 500,000 | 478,830 |
4.69%, 09/15/27 | 500,000 | 489,755 |
5.16%, 01/10/28 | 400,000 | 397,476 |
2.00%, 09/10/31 | 200,000 | 158,936 |
3.63%, 09/15/31 (a)(b) | 500,000 | 461,320 |
3.20%, 03/10/32 | 450,000 | 389,398 |
4.46%, 06/08/32 | 600,000 | 570,276 |
Truist Bank | ||
1.50%, 03/10/25 (a) | 400,000 | 369,544 |
3.63%, 09/16/25 (a) | 250,000 | 234,125 |
4.05%, 11/03/25 (a) | 350,000 | 335,762 |
3.30%, 05/15/26 (a) | 250,000 | 229,400 |
3.80%, 10/30/26 (a) | 250,000 | 228,348 |
2.25%, 03/11/30 (a) | 600,000 | 478,482 |
Truist Financial Corp. | ||
2.50%, 08/01/24 (a) | 160,000 | 154,410 |
2.85%, 10/26/24 (a) | 100,000 | 96,010 |
4.00%, 05/01/25 (a) | 300,000 | 290,637 |
3.70%, 06/05/25 (a) | 230,000 | 220,726 |
1.20%, 08/05/25 (a) | 400,000 | 363,248 |
SECURITY RATE, MATURITY DATE | FACE AMOUNT ($) | VALUE ($) |
4.26%, 07/28/26 (a)(b) | 400,000 | 384,620 |
1.27%, 03/02/27 (a)(b) | 300,000 | 265,086 |
6.05%, 06/08/27 (a)(b) | 500,000 | 500,360 |
1.13%, 08/03/27 (a) | 700,000 | 591,129 |
4.12%, 06/06/28 (a)(b) | 300,000 | 283,407 |
4.87%, 01/26/29 (a)(b) | 400,000 | 384,576 |
3.88%, 03/19/29 (a) | 200,000 | 179,436 |
1.89%, 06/07/29 (a)(b) | 350,000 | 291,400 |
1.95%, 06/05/30 (a) | 200,000 | 159,276 |
4.92%, 07/28/33 (a)(b) | 300,000 | 274,341 |
5.12%, 01/26/34 (a)(b) | 400,000 | 379,444 |
5.87%, 06/08/34 (a)(b) | 500,000 | 500,433 |
UBS Group AG | ||
3.75%, 03/26/25 | 750,000 | 718,305 |
4.55%, 04/17/26 | 525,000 | 505,081 |
4.88%, 05/15/45 | 500,000 | 433,430 |
US Bancorp | ||
2.40%, 07/30/24 (a) | 400,000 | 386,128 |
3.60%, 09/11/24 (a) | 300,000 | 291,519 |
1.45%, 05/12/25 (a) | 500,000 | 467,820 |
3.95%, 11/17/25 (a) | 300,000 | 288,825 |
3.10%, 04/27/26 (a) | 100,000 | 93,423 |
2.38%, 07/22/26 (a) | 400,000 | 366,332 |
5.73%, 10/21/26 (a)(b) | 400,000 | 401,484 |
3.15%, 04/27/27 (a) | 400,000 | 370,940 |
2.22%, 01/27/28 (a)(b) | 275,000 | 244,659 |
3.90%, 04/26/28 (a) | 450,000 | 425,475 |
4.55%, 07/22/28 (a)(b) | 600,000 | 574,950 |
5.78%, 06/12/29 (a)(b) | 500,000 | 500,090 |
3.00%, 07/30/29 (a) | 25,000 | 21,230 |
1.38%, 07/22/30 (a) | 550,000 | 421,646 |
2.68%, 01/27/33 (a)(b) | 250,000 | 200,935 |
4.97%, 07/22/33 (a)(b) | 475,000 | 431,727 |
5.85%, 10/21/33 (a)(b) | 400,000 | 402,396 |
4.84%, 02/01/34 (a)(b) | 500,000 | 468,775 |
5.84%, 06/12/34 (a)(b) | 500,000 | 503,847 |
2.49%, 11/03/36 (a)(b) | 400,000 | 293,312 |
US Bank NA | ||
2.05%, 01/21/25 (a) | 300,000 | 283,050 |
2.80%, 01/27/25 (a) | 250,000 | 238,673 |
Valley National Bancorp | ||
3.00%, 06/15/31 (a)(b) | 150,000 | 119,802 |
Wachovia Corp. | ||
7.57%, 08/01/26 (d) | 200,000 | 209,328 |
5.50%, 08/01/35 | 200,000 | 196,738 |
Webster Financial Corp. | ||
4.10%, 03/25/29 (a) | 150,000 | 129,995 |
Wells Fargo & Co. | ||
3.30%, 09/09/24 | 300,000 | 292,308 |
3.00%, 02/19/25 | 700,000 | 672,616 |
3.55%, 09/29/25 | 750,000 | 719,940 |
2.41%, 10/30/25 (a)(b) | 900,000 | 857,907 |
2.16%, 02/11/26 (a)(b) | 900,000 | 848,070 |
3.00%, 04/22/26 | 1,050,000 | 988,869 |
3.91%, 04/25/26 (a)(b) | 800,000 | 773,536 |
2.19%, 04/30/26 (a)(b) | 850,000 | 797,257 |
4.10%, 06/03/26 | 600,000 | 576,216 |
4.54%, 08/15/26 (a)(b) | 300,000 | 293,358 |
3.00%, 10/23/26 | 1,000,000 | 929,490 |
3.20%, 06/17/27 (a)(b) | 750,000 | 704,767 |
4.30%, 07/22/27 | 800,000 | 768,240 |
3.53%, 03/24/28 (a)(b) | 1,075,000 | 1,005,533 |
3.58%, 05/22/28 (a)(b) | 950,000 | 886,103 |
2.39%, 06/02/28 (a)(b) | 750,000 | 669,817 |
4.81%, 07/25/28 (a)(b) | 875,000 | 856,389 |
4.15%, 01/24/29 (a) | 750,000 | 711,067 |
SECURITY RATE, MATURITY DATE | FACE AMOUNT ($) | VALUE ($) |
7.95%, 11/15/29 | 100,000 | 110,620 |
2.88%, 10/30/30 (a)(b) | 1,025,000 | 887,025 |
2.57%, 02/11/31 (a)(b) | 900,000 | 763,398 |
4.48%, 04/04/31 (a)(b) | 700,000 | 666,631 |
3.35%, 03/02/33 (a)(b) | 1,200,000 | 1,028,940 |
4.90%, 07/25/33 (a)(b) | 1,000,000 | 959,570 |
5.39%, 04/24/34 (a)(b) | 1,000,000 | 994,640 |
5.38%, 02/07/35 | 125,000 | 124,773 |
5.95%, 12/15/36 | 150,000 | 148,347 |
3.07%, 04/30/41 (a)(b) | 1,000,000 | 735,160 |
5.38%, 11/02/43 | 500,000 | 470,910 |
5.61%, 01/15/44 | 700,000 | 673,960 |
4.65%, 11/04/44 | 550,000 | 470,591 |
3.90%, 05/01/45 | 600,000 | 484,542 |
4.90%, 11/17/45 | 400,000 | 352,136 |
4.40%, 06/14/46 | 550,000 | 449,773 |
4.75%, 12/07/46 | 600,000 | 512,004 |
5.01%, 04/04/51 (a)(b) | 1,600,000 | 1,492,000 |
4.61%, 04/25/53 (a)(b) | 900,000 | 790,533 |
Wells Fargo Bank NA | ||
5.95%, 08/26/36 | 275,000 | 278,237 |
5.85%, 02/01/37 | 350,000 | 355,901 |
6.60%, 01/15/38 | 200,000 | 217,708 |
Westpac Banking Corp. | ||
5.35%, 10/18/24 | 350,000 | 349,598 |
1.02%, 11/18/24 | 300,000 | 282,498 |
2.35%, 02/19/25 | 400,000 | 381,288 |
2.85%, 05/13/26 | 500,000 | 470,935 |
1.15%, 06/03/26 | 400,000 | 356,528 |
2.70%, 08/19/26 | 550,000 | 511,197 |
3.35%, 03/08/27 | 400,000 | 377,568 |
5.46%, 11/18/27 | 350,000 | 355,779 |
3.40%, 01/25/28 | 300,000 | 281,952 |
1.95%, 11/20/28 | 150,000 | 128,739 |
2.65%, 01/16/30 | 250,000 | 220,998 |
2.89%, 02/04/30 (a)(b) | 400,000 | 373,956 |
2.15%, 06/03/31 | 375,000 | 315,289 |
4.32%, 11/23/31 (a)(b) | 550,000 | 510,405 |
5.41%, 08/10/33 (a)(b) | 250,000 | 236,723 |
4.11%, 07/24/34 (a)(b) | 400,000 | 349,620 |
2.67%, 11/15/35 (a)(b) | 325,000 | 249,542 |
3.02%, 11/18/36 (a)(b) | 250,000 | 191,695 |
4.42%, 07/24/39 | 300,000 | 248,277 |
2.96%, 11/16/40 | 400,000 | 269,260 |
3.13%, 11/18/41 | 300,000 | 203,862 |
Wintrust Financial Corp. | ||
4.85%, 06/06/29 | 100,000 | 89,822 |
Zions Bancorp NA | ||
3.25%, 10/29/29 (a) | 300,000 | 221,187 |
398,088,592 | ||
Brokerage/Asset Managers/Exchanges 0.3% | ||
Affiliated Managers Group, Inc. | ||
3.30%, 06/15/30 (a) | 275,000 | 232,878 |
Ameriprise Financial, Inc. | ||
3.70%, 10/15/24 | 275,000 | 268,370 |
3.00%, 04/02/25 (a) | 150,000 | 143,046 |
2.88%, 09/15/26 (a) | 150,000 | 140,034 |
BGC Partners, Inc. | ||
3.75%, 10/01/24 (a) | 50,000 | 47,302 |
8.00%, 05/25/28 (a)(c) | 125,000 | 120,976 |
BlackRock, Inc. | ||
3.20%, 03/15/27 | 225,000 | 213,442 |
3.25%, 04/30/29 (a) | 400,000 | 372,176 |
2.40%, 04/30/30 (a) | 300,000 | 260,286 |
1.90%, 01/28/31 (a) | 550,000 | 451,539 |
SECURITY RATE, MATURITY DATE | FACE AMOUNT ($) | VALUE ($) |
Brookfield Corp. | ||
4.00%, 01/15/25 (a) | 150,000 | 145,791 |
Brookfield Finance I UK PLC | ||
2.34%, 01/30/32 (a) | 200,000 | 156,058 |
Brookfield Finance LLC | ||
3.45%, 04/15/50 (a) | 200,000 | 133,428 |
Brookfield Finance, Inc. | ||
3.90%, 01/25/28 (a) | 300,000 | 278,472 |
4.85%, 03/29/29 (a) | 350,000 | 336,626 |
4.35%, 04/15/30 (a) | 250,000 | 231,852 |
2.72%, 04/15/31 (a) | 50,000 | 40,999 |
4.70%, 09/20/47 (a) | 300,000 | 253,413 |
3.50%, 03/30/51 (a) | 200,000 | 133,882 |
3.63%, 02/15/52 (a) | 175,000 | 119,053 |
Cboe Global Markets, Inc. | ||
3.65%, 01/12/27 (a) | 250,000 | 237,717 |
1.63%, 12/15/30 (a) | 100,000 | 79,114 |
3.00%, 03/16/32 (a) | 100,000 | 85,915 |
CI Financial Corp. | ||
3.20%, 12/17/30 (a) | 350,000 | 262,920 |
4.10%, 06/15/51 (a) | 275,000 | 167,910 |
CME Group, Inc. | ||
3.00%, 03/15/25 (a) | 200,000 | 192,872 |
3.75%, 06/15/28 (a) | 200,000 | 191,518 |
2.65%, 03/15/32 (a) | 225,000 | 191,738 |
5.30%, 09/15/43 (a) | 200,000 | 208,168 |
4.15%, 06/15/48 (a) | 250,000 | 227,440 |
E*TRADE Financial Corp. | ||
3.80%, 08/24/27 (a) | 100,000 | 94,713 |
4.50%, 06/20/28 (a) | 150,000 | 144,671 |
Eaton Vance Corp. | ||
3.50%, 04/06/27 (a) | 123,000 | 114,759 |
Franklin Resources, Inc. | ||
2.85%, 03/30/25 | 125,000 | 119,070 |
1.60%, 10/30/30 (a) | 250,000 | 197,095 |
2.95%, 08/12/51 (a) | 100,000 | 64,059 |
Intercontinental Exchange, Inc. | ||
3.65%, 05/23/25 | 200,000 | 196,138 |
3.75%, 12/01/25 (a) | 350,000 | 339,867 |
3.10%, 09/15/27 (a) | 200,000 | 187,252 |
4.00%, 09/15/27 (a) | 450,000 | 438,948 |
3.75%, 09/21/28 (a) | 200,000 | 190,396 |
4.35%, 06/15/29 (a) | 300,000 | 294,018 |
2.10%, 06/15/30 (a) | 450,000 | 376,645 |
1.85%, 09/15/32 (a) | 500,000 | 385,520 |
4.60%, 03/15/33 (a) | 425,000 | 412,161 |
2.65%, 09/15/40 (a) | 350,000 | 249,889 |
4.25%, 09/21/48 (a) | 275,000 | 239,965 |
3.00%, 06/15/50 (a) | 375,000 | 261,176 |
4.95%, 06/15/52 (a) | 400,000 | 382,768 |
3.00%, 09/15/60 (a) | 450,000 | 295,393 |
5.20%, 06/15/62 (a) | 300,000 | 298,824 |
Invesco Finance PLC | ||
3.75%, 01/15/26 | 275,000 | 265,589 |
5.38%, 11/30/43 | 100,000 | 97,879 |
Janus Capital Group, Inc. | ||
4.88%, 08/01/25 (a) | 150,000 | 147,570 |
Jefferies Financial Group, Inc. | ||
4.85%, 01/15/27 | 200,000 | 196,158 |
4.15%, 01/23/30 | 400,000 | 360,972 |
2.63%, 10/15/31 (a) | 300,000 | 233,670 |
2.75%, 10/15/32 (a) | 150,000 | 116,054 |
SECURITY RATE, MATURITY DATE | FACE AMOUNT ($) | VALUE ($) |
Jefferies Group LLC | ||
6.45%, 06/08/27 | 100,000 | 103,536 |
6.25%, 01/15/36 | 150,000 | 153,653 |
6.50%, 01/20/43 | 75,000 | 76,485 |
Lazard Group LLC | ||
3.75%, 02/13/25 | 50,000 | 48,189 |
3.63%, 03/01/27 (a) | 100,000 | 93,213 |
4.50%, 09/19/28 (a) | 200,000 | 189,778 |
4.38%, 03/11/29 (a) | 250,000 | 232,922 |
Legg Mason, Inc. | ||
4.75%, 03/15/26 | 150,000 | 148,005 |
5.63%, 01/15/44 | 176,000 | 173,036 |
Nasdaq, Inc. | ||
5.65%, 06/28/25 | 125,000 | 125,341 |
3.85%, 06/30/26 (a) | 150,000 | 144,515 |
5.35%, 06/28/28 (a) | 250,000 | 250,532 |
1.65%, 01/15/31 (a) | 200,000 | 155,380 |
5.55%, 02/15/34 (a) | 350,000 | 351,596 |
2.50%, 12/21/40 (a) | 250,000 | 167,848 |
3.25%, 04/28/50 (a) | 175,000 | 118,771 |
3.95%, 03/07/52 (a) | 100,000 | 77,023 |
5.95%, 08/15/53 (a) | 200,000 | 204,922 |
6.10%, 06/28/63 (a) | 200,000 | 204,906 |
Nomura Holdings, Inc. | ||
2.65%, 01/16/25 | 500,000 | 473,040 |
1.85%, 07/16/25 | 500,000 | 457,880 |
1.65%, 07/14/26 | 600,000 | 528,150 |
2.33%, 01/22/27 | 400,000 | 354,208 |
2.17%, 07/14/28 | 400,000 | 337,692 |
3.10%, 01/16/30 | 500,000 | 427,435 |
2.68%, 07/16/30 | 350,000 | 286,555 |
2.61%, 07/14/31 | 800,000 | 635,880 |
3.00%, 01/22/32 | 200,000 | 162,208 |
Raymond James Financial, Inc. | ||
4.65%, 04/01/30 (a) | 200,000 | 195,252 |
4.95%, 07/15/46 | 200,000 | 181,054 |
3.75%, 04/01/51 (a) | 200,000 | 152,094 |
Stifel Financial Corp. | ||
4.25%, 07/18/24 | 100,000 | 97,921 |
4.00%, 05/15/30 (a) | 200,000 | 172,208 |
The Charles Schwab Corp. | ||
3.00%, 03/10/25 (a)(e) | 75,000 | 71,687 |
4.20%, 03/24/25 (a)(e) | 150,000 | 146,535 |
3.63%, 04/01/25 (a)(e) | 100,000 | 96,218 |
3.85%, 05/21/25 (a)(e) | 200,000 | 193,088 |
3.45%, 02/13/26 (a)(e) | 75,000 | 71,027 |
0.90%, 03/11/26 (a)(e) | 325,000 | 287,277 |
1.15%, 05/13/26 (a)(e) | 250,000 | 221,357 |
3.20%, 03/02/27 (a)(e) | 175,000 | 162,188 |
2.45%, 03/03/27 (a)(e) | 400,000 | 359,692 |
3.30%, 04/01/27 (a)(e) | 175,000 | 162,374 |
3.20%, 01/25/28 (a)(e) | 175,000 | 160,113 |
2.00%, 03/20/28 (a)(e) | 325,000 | 281,323 |
4.00%, 02/01/29 (a)(e) | 150,000 | 141,092 |
5.64%, 05/19/29 (a)(b)(e) | 300,000 | 302,163 |
3.25%, 05/22/29 (a)(e) | 150,000 | 132,593 |
2.75%, 10/01/29 (a)(e) | 125,000 | 106,593 |
4.63%, 03/22/30 (a)(e) | 125,000 | 122,788 |
1.65%, 03/11/31 (a)(e) | 200,000 | 153,958 |
2.30%, 05/13/31 (a)(e) | 200,000 | 159,534 |
1.95%, 12/01/31 (a)(e) | 225,000 | 171,592 |
2.90%, 03/03/32 (a)(e) | 250,000 | 207,162 |
5.85%, 05/19/34 (a)(b)(e) | 325,000 | 330,145 |
24,147,881 | ||
SECURITY RATE, MATURITY DATE | FACE AMOUNT ($) | VALUE ($) |
Finance Companies 0.3% | ||
AerCap Ireland Capital DAC/AerCap Global Aviation Trust | ||
2.88%, 08/14/24 (a) | 150,000 | 144,197 |
1.65%, 10/29/24 (a) | 850,000 | 798,949 |
1.75%, 10/29/24 (a) | 350,000 | 328,933 |
3.50%, 01/15/25 (a) | 300,000 | 288,909 |
6.50%, 07/15/25 (a) | 300,000 | 301,806 |
4.45%, 10/01/25 (a) | 250,000 | 240,755 |
1.75%, 01/30/26 (a) | 300,000 | 269,598 |
4.45%, 04/03/26 (a) | 250,000 | 239,287 |
2.45%, 10/29/26 (a) | 1,000,000 | 894,430 |
3.65%, 07/21/27 (a) | 250,000 | 229,795 |
4.63%, 10/15/27 (a) | 200,000 | 190,310 |
3.88%, 01/23/28 (a) | 200,000 | 184,350 |
3.00%, 10/29/28 (a) | 1,000,000 | 868,280 |
3.30%, 01/30/32 (a) | 1,150,000 | 940,665 |
3.40%, 10/29/33 (a) | 400,000 | 322,596 |
3.85%, 10/29/41 (a) | 450,000 | 342,774 |
Air Lease Corp. | ||
4.25%, 09/15/24 (a) | 200,000 | 195,522 |
2.30%, 02/01/25 (a) | 250,000 | 235,525 |
3.25%, 03/01/25 (a) | 200,000 | 191,050 |
3.38%, 07/01/25 (a) | 100,000 | 94,724 |
2.88%, 01/15/26 (a) | 325,000 | 301,125 |
3.75%, 06/01/26 (a) | 250,000 | 236,587 |
1.88%, 08/15/26 (a) | 200,000 | 177,932 |
2.20%, 01/15/27 (a) | 250,000 | 221,952 |
3.63%, 04/01/27 (a) | 150,000 | 138,765 |
3.63%, 12/01/27 (a) | 349,000 | 319,251 |
2.10%, 09/01/28 (a) | 200,000 | 166,566 |
4.63%, 10/01/28 (a) | 200,000 | 188,166 |
3.25%, 10/01/29 (a) | 300,000 | 260,727 |
3.00%, 02/01/30 (a) | 400,000 | 335,356 |
3.13%, 12/01/30 (a) | 100,000 | 83,459 |
2.88%, 01/15/32 (a) | 250,000 | 201,205 |
Aircastle Ltd. | ||
4.25%, 06/15/26 (a) | 250,000 | 235,842 |
Ares Capital Corp. | ||
4.25%, 03/01/25 (a) | 100,000 | 95,542 |
3.25%, 07/15/25 (a) | 250,000 | 231,350 |
3.88%, 01/15/26 (a) | 300,000 | 278,565 |
2.15%, 07/15/26 (a) | 300,000 | 260,877 |
2.88%, 06/15/27 (a) | 150,000 | 130,295 |
2.88%, 06/15/28 (a) | 350,000 | 289,775 |
3.20%, 11/15/31 (a) | 350,000 | 268,488 |
Bain Capital Specialty Finance, Inc. | ||
2.95%, 03/10/26 (a) | 200,000 | 177,974 |
BlackRock TCP Capital Corp. | ||
2.85%, 02/09/26 (a) | 200,000 | 179,842 |
Blackstone Private Credit Fund | ||
2.35%, 11/22/24 | 150,000 | 140,462 |
2.70%, 01/15/25 (a) | 200,000 | 187,132 |
4.70%, 03/24/25 | 200,000 | 192,868 |
2.63%, 12/15/26 (a) | 300,000 | 256,644 |
3.25%, 03/15/27 (a) | 400,000 | 345,888 |
4.00%, 01/15/29 (a) | 250,000 | 213,210 |
Blackstone Secured Lending Fund | ||
3.63%, 01/15/26 (a) | 300,000 | 276,036 |
2.75%, 09/16/26 (a) | 200,000 | 174,982 |
2.13%, 02/15/27 (a) | 250,000 | 211,735 |
2.85%, 09/30/28 (a) | 150,000 | 123,206 |
FS KKR Capital Corp. | ||
4.63%, 07/15/24 (a) | 100,000 | 97,124 |
1.65%, 10/12/24 | 100,000 | 93,039 |
4.13%, 02/01/25 (a)(f) | 250,000 | 237,847 |
SECURITY RATE, MATURITY DATE | FACE AMOUNT ($) | VALUE ($) |
3.40%, 01/15/26 (a) | 350,000 | 318,587 |
2.63%, 01/15/27 (a) | 100,000 | 85,563 |
3.25%, 07/15/27 (a) | 125,000 | 107,598 |
3.13%, 10/12/28 (a) | 250,000 | 203,803 |
GATX Corp. | ||
3.85%, 03/30/27 (a) | 300,000 | 282,441 |
3.50%, 03/15/28 (a) | 125,000 | 114,385 |
4.55%, 11/07/28 (a) | 250,000 | 239,162 |
4.70%, 04/01/29 (a) | 255,000 | 244,629 |
4.00%, 06/30/30 (a) | 50,000 | 45,754 |
5.20%, 03/15/44 (a) | 200,000 | 179,096 |
3.10%, 06/01/51 (a) | 150,000 | 95,303 |
Goldman Sachs BDC, Inc. | ||
3.75%, 02/10/25 (a) | 150,000 | 143,435 |
2.88%, 01/15/26 (a) | 100,000 | 92,038 |
Golub Capital BDC, Inc. | ||
2.50%, 08/24/26 (a) | 200,000 | 173,714 |
2.05%, 02/15/27 (a) | 100,000 | 84,212 |
Hercules Capital, Inc. | ||
3.38%, 01/20/27 (a) | 250,000 | 217,025 |
Main Street Capital Corp. | ||
3.00%, 07/14/26 (a) | 150,000 | 132,171 |
Morgan Stanley Direct Lending Fund | ||
4.50%, 02/11/27 (a) | 150,000 | 141,305 |
Oaktree Specialty Lending Corp. | ||
3.50%, 02/25/25 (a) | 100,000 | 94,860 |
2.70%, 01/15/27 (a) | 150,000 | 129,614 |
Owl Rock Capital Corp. | ||
4.00%, 03/30/25 (a) | 250,000 | 235,307 |
4.25%, 01/15/26 (a) | 200,000 | 185,402 |
3.40%, 07/15/26 (a) | 450,000 | 399,690 |
2.63%, 01/15/27 (a) | 150,000 | 127,514 |
Owl Rock Capital Corp. III | ||
3.13%, 04/13/27 (a) | 100,000 | 84,822 |
Owl Rock Core Income Corp. | ||
5.50%, 03/21/25 | 200,000 | 193,120 |
3.13%, 09/23/26 (a) | 150,000 | 130,154 |
4.70%, 02/08/27 (a) | 200,000 | 182,294 |
7.75%, 09/16/27 (a)(c) | 75,000 | 74,387 |
Owl Rock Technology Finance Corp. | ||
2.50%, 01/15/27 (a) | 100,000 | 83,172 |
Prospect Capital Corp. | ||
3.71%, 01/22/26 (a) | 150,000 | 133,118 |
3.36%, 11/15/26 (a) | 150,000 | 126,449 |
Sixth Street Specialty Lending, Inc. | ||
2.50%, 08/01/26 (a) | 200,000 | 175,620 |
19,888,013 | ||
Financial Other 0.0% | ||
Andrew W Mellon Foundation | ||
0.95%, 08/01/27 (a) | 125,000 | 108,004 |
ORIX Corp. | ||
3.25%, 12/04/24 | 250,000 | 240,375 |
3.70%, 07/18/27 | 143,000 | 134,982 |
2.25%, 03/09/31 | 190,000 | 156,693 |
5.20%, 09/13/32 | 200,000 | 202,746 |
842,800 | ||
Insurance 1.1% | ||
ACE Capital Trust II | ||
9.70%, 04/01/30 | 200,000 | 239,334 |
Aegon N.V. | ||
5.50%, 04/11/48 (a)(b) | 250,000 | 238,717 |
SECURITY RATE, MATURITY DATE | FACE AMOUNT ($) | VALUE ($) |
Aetna, Inc. | ||
3.50%, 11/15/24 (a) | 300,000 | 291,453 |
6.63%, 06/15/36 | 200,000 | 220,640 |
6.75%, 12/15/37 | 150,000 | 166,021 |
4.50%, 05/15/42 (a) | 200,000 | 172,244 |
4.13%, 11/15/42 (a) | 150,000 | 124,224 |
4.75%, 03/15/44 (a) | 100,000 | 89,007 |
3.88%, 08/15/47 (a) | 150,000 | 117,264 |
Aflac, Inc. | ||
1.13%, 03/15/26 (a) | 150,000 | 134,528 |
3.60%, 04/01/30 (a) | 250,000 | 230,425 |
4.00%, 10/15/46 (a) | 150,000 | 120,276 |
4.75%, 01/15/49 (a) | 150,000 | 140,763 |
Alleghany Corp. | ||
3.63%, 05/15/30 (a) | 200,000 | 186,014 |
3.25%, 08/15/51 (a) | 200,000 | 144,100 |
Allied World Assurance Co., Holdings Ltd. | ||
4.35%, 10/29/25 (a) | 200,000 | 191,382 |
Allstate Corp. | ||
0.75%, 12/15/25 (a) | 150,000 | 134,550 |
3.28%, 12/15/26 (a) | 150,000 | 141,641 |
1.45%, 12/15/30 (a) | 200,000 | 155,672 |
5.35%, 06/01/33 | 104,000 | 104,413 |
5.55%, 05/09/35 | 200,000 | 203,786 |
5.95%, 04/01/36 | 200,000 | 211,852 |
4.50%, 06/15/43 | 100,000 | 86,463 |
4.20%, 12/15/46 (a) | 276,000 | 226,671 |
3.85%, 08/10/49 (a) | 150,000 | 117,048 |
6.50%, 05/15/57 (a)(b) | 100,000 | 97,649 |
American Equity Investment Life Holding Co. | ||
5.00%, 06/15/27 (a) | 125,000 | 120,840 |
American Financial Group, Inc. | ||
5.25%, 04/02/30 (a) | 100,000 | 97,941 |
4.50%, 06/15/47 (a) | 200,000 | 163,988 |
American International Group, Inc. | ||
2.50%, 06/30/25 (a) | 333,000 | 314,156 |
3.90%, 04/01/26 (a) | 150,000 | 144,237 |
4.20%, 04/01/28 (a) | 200,000 | 192,710 |
3.40%, 06/30/30 (a) | 100,000 | 88,719 |
5.13%, 03/27/33 (a) | 200,000 | 195,500 |
3.88%, 01/15/35 (a) | 75,000 | 64,820 |
6.25%, 05/01/36 | 150,000 | 156,403 |
4.50%, 07/16/44 (a) | 200,000 | 172,872 |
4.80%, 07/10/45 (a) | 275,000 | 246,207 |
4.75%, 04/01/48 (a) | 250,000 | 224,682 |
5.75%, 04/01/48 (a)(b) | 210,000 | 203,822 |
4.38%, 06/30/50 (a) | 350,000 | 296,331 |
Anthem, Inc. | ||
3.50%, 08/15/24 (a) | 250,000 | 243,750 |
3.35%, 12/01/24 (a) | 300,000 | 290,400 |
2.38%, 01/15/25 (a) | 300,000 | 285,420 |
3.65%, 12/01/27 (a) | 500,000 | 472,990 |
4.10%, 03/01/28 (a) | 350,000 | 336,472 |
2.88%, 09/15/29 (a) | 210,000 | 185,422 |
2.25%, 05/15/30 (a) | 350,000 | 293,720 |
2.55%, 03/15/31 (a) | 200,000 | 168,440 |
5.95%, 12/15/34 | 100,000 | 104,586 |
5.85%, 01/15/36 | 100,000 | 102,575 |
6.38%, 06/15/37 | 50,000 | 54,104 |
4.63%, 05/15/42 | 200,000 | 180,656 |
4.65%, 01/15/43 | 300,000 | 274,794 |
5.10%, 01/15/44 | 200,000 | 189,870 |
4.65%, 08/15/44 (a) | 250,000 | 224,882 |
4.38%, 12/01/47 (a) | 400,000 | 349,692 |
4.55%, 03/01/48 (a) | 300,000 | 264,651 |
3.70%, 09/15/49 (a) | 250,000 | 194,387 |
SECURITY RATE, MATURITY DATE | FACE AMOUNT ($) | VALUE ($) |
3.13%, 05/15/50 (a) | 450,000 | 316,183 |
3.60%, 03/15/51 (a) | 250,000 | 191,945 |
4.55%, 05/15/52 (a) | 225,000 | 201,296 |
Aon Corp. | ||
8.21%, 01/01/27 | 150,000 | 152,649 |
4.50%, 12/15/28 (a) | 100,000 | 96,271 |
3.75%, 05/02/29 (a) | 100,000 | 92,602 |
2.80%, 05/15/30 (a) | 250,000 | 216,995 |
2.05%, 08/23/31 (a) | 200,000 | 159,806 |
5.00%, 09/12/32 (a) | 150,000 | 148,260 |
6.25%, 09/30/40 | 150,000 | 158,787 |
2.90%, 08/23/51 (a) | 200,000 | 131,546 |
3.90%, 02/28/52 (a) | 250,000 | 196,810 |
Aon PLC | ||
3.88%, 12/15/25 (a) | 300,000 | 289,473 |
4.60%, 06/14/44 (a) | 200,000 | 175,010 |
4.75%, 05/15/45 (a) | 200,000 | 179,012 |
Arch Capital Finance LLC | ||
4.01%, 12/15/26 (a) | 200,000 | 190,960 |
5.03%, 12/15/46 (a) | 150,000 | 135,245 |
Arch Capital Group Ltd. | ||
3.64%, 06/30/50 (a) | 275,000 | 203,494 |
Arch Capital Group US, Inc. | ||
5.14%, 11/01/43 | 150,000 | 136,989 |
Arthur J Gallagher & Co. | ||
5.50%, 03/02/33 (a) | 100,000 | 100,619 |
3.50%, 05/20/51 (a) | 300,000 | 216,333 |
3.05%, 03/09/52 (a) | 175,000 | 112,313 |
5.75%, 03/02/53 (a) | 150,000 | 151,204 |
Assurant, Inc. | ||
4.20%, 09/27/23 (a) | 16,000 | 15,937 |
4.90%, 03/27/28 (a) | 50,000 | 48,125 |
3.70%, 02/22/30 (a) | 100,000 | 86,475 |
2.65%, 01/15/32 (a) | 100,000 | 75,081 |
Assured Guaranty US Holdings, Inc. | ||
5.00%, 07/01/24 | 132,000 | 129,916 |
3.15%, 06/15/31 (a) | 200,000 | 169,214 |
3.60%, 09/15/51 (a) | 100,000 | 68,968 |
Athene Holding Ltd. | ||
4.13%, 01/12/28 (a) | 300,000 | 273,813 |
6.15%, 04/03/30 (a) | 250,000 | 251,017 |
3.50%, 01/15/31 (a) | 150,000 | 123,953 |
3.95%, 05/25/51 (a) | 300,000 | 204,018 |
AXA S.A. | ||
8.60%, 12/15/30 | 200,000 | 241,284 |
AXIS Specialty Finance LLC | ||
3.90%, 07/15/29 (a) | 100,000 | 91,474 |
4.90%, 01/15/40 (a)(b) | 125,000 | 99,739 |
AXIS Specialty Finance PLC | ||
4.00%, 12/06/27 (a) | 150,000 | 141,042 |
Berkshire Hathaway Finance Corp. | ||
2.30%, 03/15/27 (a) | 250,000 | 233,972 |
1.85%, 03/12/30 (a) | 150,000 | 127,755 |
1.45%, 10/15/30 (a) | 300,000 | 244,446 |
2.88%, 03/15/32 (a) | 200,000 | 176,282 |
5.75%, 01/15/40 | 150,000 | 166,611 |
4.40%, 05/15/42 | 350,000 | 333,875 |
4.30%, 05/15/43 | 100,000 | 91,642 |
4.20%, 08/15/48 (a) | 750,000 | 676,717 |
4.25%, 01/15/49 (a) | 600,000 | 547,722 |
2.85%, 10/15/50 (a) | 375,000 | 261,986 |
2.50%, 01/15/51 (a) | 300,000 | 197,478 |
3.85%, 03/15/52 (a) | 775,000 | 642,072 |
SECURITY RATE, MATURITY DATE | FACE AMOUNT ($) | VALUE ($) |
Berkshire Hathaway, Inc. | ||
3.13%, 03/15/26 (a) | 650,000 | 626,431 |
4.50%, 02/11/43 | 50,000 | 48,324 |
Brighthouse Financial, Inc. | ||
3.70%, 06/22/27 (a) | 200,000 | 183,922 |
5.63%, 05/15/30 (a) | 200,000 | 194,308 |
4.70%, 06/22/47 (a) | 285,000 | 218,051 |
3.85%, 12/22/51 (a) | 125,000 | 80,154 |
Brown & Brown, Inc. | ||
4.20%, 09/15/24 (a) | 145,000 | 141,919 |
4.50%, 03/15/29 (a) | 50,000 | 47,265 |
2.38%, 03/15/31 (a) | 200,000 | 161,764 |
4.20%, 03/17/32 (a) | 175,000 | 157,624 |
4.95%, 03/17/52 (a) | 200,000 | 172,566 |
Centene Corp. | ||
4.25%, 12/15/27 (a) | 650,000 | 609,043 |
2.45%, 07/15/28 (a) | 600,000 | 515,136 |
4.63%, 12/15/29 (a) | 1,000,000 | 923,560 |
3.38%, 02/15/30 (a) | 600,000 | 516,720 |
3.00%, 10/15/30 (a) | 500,000 | 417,775 |
2.50%, 03/01/31 (a) | 600,000 | 478,866 |
2.63%, 08/01/31 (a) | 600,000 | 479,718 |
Chubb Corp. | ||
6.00%, 05/11/37 | 200,000 | 215,436 |
6.50%, 05/15/38 | 260,000 | 292,490 |
Chubb INA Holdings, Inc. | ||
3.15%, 03/15/25 | 200,000 | 193,614 |
3.35%, 05/03/26 (a) | 500,000 | 481,030 |
1.38%, 09/15/30 (a) | 350,000 | 278,096 |
4.35%, 11/03/45 (a) | 400,000 | 363,148 |
2.85%, 12/15/51 (a) | 150,000 | 105,048 |
3.05%, 12/15/61 (a) | 300,000 | 203,076 |
Cincinnati Financial Corp. | ||
6.92%, 05/15/28 | 200,000 | 214,558 |
6.13%, 11/01/34 | 50,000 | 52,810 |
CNA Financial Corp. | ||
4.50%, 03/01/26 (a) | 200,000 | 194,272 |
3.45%, 08/15/27 (a) | 150,000 | 139,742 |
3.90%, 05/01/29 (a) | 25,000 | 23,083 |
2.05%, 08/15/30 (a) | 250,000 | 200,425 |
CNO Financial Group, Inc. | ||
5.25%, 05/30/25 (a) | 50,000 | 49,222 |
5.25%, 05/30/29 (a) | 220,000 | 208,549 |
Corebridge Financial, Inc. | ||
3.50%, 04/04/25 (a) | 250,000 | 238,420 |
3.65%, 04/05/27 (a) | 400,000 | 372,408 |
3.85%, 04/05/29 (a) | 400,000 | 362,476 |
3.90%, 04/05/32 (a) | 650,000 | 567,333 |
4.35%, 04/05/42 (a) | 150,000 | 121,589 |
4.40%, 04/05/52 (a) | 350,000 | 272,083 |
Elevance Health, Inc. | ||
1.50%, 03/15/26 (a) | 350,000 | 316,599 |
5.50%, 10/15/32 (a) | 400,000 | 411,468 |
4.75%, 02/15/33 (a) | 250,000 | 243,435 |
6.10%, 10/15/52 (a) | 200,000 | 219,858 |
5.13%, 02/15/53 (a) | 250,000 | 242,455 |
Enstar Group Ltd. | ||
4.95%, 06/01/29 (a) | 200,000 | 187,012 |
3.10%, 09/01/31 (a) | 175,000 | 137,512 |
Equitable Holdings, Inc. | ||
4.35%, 04/20/28 (a) | 550,000 | 515,454 |
5.00%, 04/20/48 (a) | 450,000 | 389,331 |
SECURITY RATE, MATURITY DATE | FACE AMOUNT ($) | VALUE ($) |
Everest Reinsurance Holdings, Inc. | ||
4.87%, 06/01/44 | 115,000 | 103,469 |
3.50%, 10/15/50 (a) | 300,000 | 214,158 |
3.13%, 10/15/52 (a) | 300,000 | 199,284 |
F&G Annuities & Life, Inc. | ||
7.40%, 01/13/28 (a)(c) | 150,000 | 150,005 |
Fairfax Financial Holdings Ltd. | ||
4.85%, 04/17/28 (a) | 250,000 | 240,835 |
4.63%, 04/29/30 (a) | 300,000 | 281,607 |
Fidelity National Financial, Inc. | ||
4.50%, 08/15/28 (a) | 150,000 | 143,073 |
3.40%, 06/15/30 (a) | 200,000 | 175,274 |
2.45%, 03/15/31 (a) | 200,000 | 157,614 |
3.20%, 09/17/51 (a) | 100,000 | 59,015 |
First American Financial Corp. | ||
4.60%, 11/15/24 | 100,000 | 98,027 |
4.00%, 05/15/30 (a) | 150,000 | 132,273 |
2.40%, 08/15/31 (a) | 200,000 | 152,598 |
Globe Life, Inc. | ||
4.55%, 09/15/28 (a) | 170,000 | 164,512 |
2.15%, 08/15/30 (a) | 200,000 | 157,840 |
4.80%, 06/15/32 (a) | 100,000 | 96,272 |
Hanover Insurance Group, Inc. | ||
4.50%, 04/15/26 (a) | 150,000 | 145,430 |
2.50%, 09/01/30 (a) | 100,000 | 79,312 |
Hartford Financial Services Group, Inc. | ||
2.80%, 08/19/29 (a) | 145,000 | 125,447 |
5.95%, 10/15/36 | 300,000 | 308,127 |
6.10%, 10/01/41 | 150,000 | 149,997 |
4.40%, 03/15/48 (a) | 75,000 | 62,805 |
3.60%, 08/19/49 (a) | 300,000 | 227,931 |
Humana, Inc. | ||
3.85%, 10/01/24 (a) | 200,000 | 195,716 |
4.50%, 04/01/25 (a) | 200,000 | 196,778 |
1.35%, 02/03/27 (a) | 250,000 | 217,842 |
3.95%, 03/15/27 (a) | 150,000 | 143,571 |
3.70%, 03/23/29 (a) | 250,000 | 229,172 |
3.13%, 08/15/29 (a) | 100,000 | 88,394 |
4.88%, 04/01/30 (a) | 350,000 | 343,129 |
2.15%, 02/03/32 (a) | 250,000 | 197,382 |
4.63%, 12/01/42 (a) | 125,000 | 110,731 |
4.95%, 10/01/44 (a) | 250,000 | 229,390 |
4.80%, 03/15/47 (a) | 150,000 | 135,759 |
3.95%, 08/15/49 (a) | 150,000 | 121,148 |
5.50%, 03/15/53 (a) | 200,000 | 199,352 |
Jackson Financial, Inc. | ||
5.17%, 06/08/27 (a) | 100,000 | 95,542 |
3.13%, 11/23/31 (a) | 150,000 | 116,091 |
5.67%, 06/08/32 (a) | 100,000 | 95,358 |
4.00%, 11/23/51 (a) | 150,000 | 102,990 |
Kemper Corp. | ||
4.35%, 02/15/25 (a) | 100,000 | 96,284 |
2.40%, 09/30/30 (a) | 250,000 | 197,380 |
Lincoln National Corp. | ||
3.35%, 03/09/25 | 100,000 | 95,884 |
3.63%, 12/12/26 (a) | 104,000 | 96,870 |
3.80%, 03/01/28 (a) | 150,000 | 135,719 |
3.05%, 01/15/30 (a) | 200,000 | 165,382 |
3.40%, 01/15/31 (a) | 150,000 | 127,056 |
6.30%, 10/09/37 | 150,000 | 149,070 |
7.00%, 06/15/40 | 100,000 | 104,618 |
4.35%, 03/01/48 (a) | 200,000 | 145,578 |
4.38%, 06/15/50 (a) | 50,000 | 35,453 |
SECURITY RATE, MATURITY DATE | FACE AMOUNT ($) | VALUE ($) |
Loews Corp. | ||
3.75%, 04/01/26 (a) | 150,000 | 145,535 |
3.20%, 05/15/30 (a) | 150,000 | 133,692 |
6.00%, 02/01/35 | 100,000 | 104,131 |
4.13%, 05/15/43 (a) | 150,000 | 124,457 |
Manulife Financial Corp. | ||
4.15%, 03/04/26 | 350,000 | 339,360 |
2.48%, 05/19/27 (a) | 100,000 | 91,753 |
4.06%, 02/24/32 (a)(b) | 250,000 | 234,185 |
3.70%, 03/16/32 (a) | 150,000 | 136,716 |
5.38%, 03/04/46 | 150,000 | 148,806 |
Markel Corp. | ||
3.50%, 11/01/27 (a) | 100,000 | 93,269 |
3.35%, 09/17/29 (a) | 100,000 | 89,792 |
5.00%, 04/05/46 | 100,000 | 88,221 |
4.30%, 11/01/47 (a) | 50,000 | 40,988 |
5.00%, 05/20/49 (a) | 200,000 | 180,676 |
4.15%, 09/17/50 (a) | 200,000 | 157,352 |
3.45%, 05/07/52 (a) | 150,000 | 106,188 |
Marsh & McLennan Cos., Inc. | ||
3.75%, 03/14/26 (a) | 250,000 | 242,620 |
4.38%, 03/15/29 (a) | 450,000 | 437,386 |
2.25%, 11/15/30 (a) | 375,000 | 312,349 |
5.75%, 11/01/32 (a) | 150,000 | 157,870 |
4.75%, 03/15/39 (a) | 250,000 | 235,742 |
4.35%, 01/30/47 (a) | 200,000 | 171,838 |
4.20%, 03/01/48 (a) | 100,000 | 85,727 |
4.90%, 03/15/49 (a) | 450,000 | 424,782 |
2.90%, 12/15/51 (a) | 100,000 | 67,323 |
Mercury General Corp. | ||
4.40%, 03/15/27 (a) | 150,000 | 142,194 |
MetLife, Inc. | ||
3.00%, 03/01/25 | 100,000 | 96,731 |
4.55%, 03/23/30 (a) | 400,000 | 392,156 |
6.50%, 12/15/32 | 500,000 | 552,905 |
5.70%, 06/15/35 | 400,000 | 411,564 |
6.40%, 12/15/36 (a) | 400,000 | 400,612 |
10.75%, 08/01/39 (a)(b) | 100,000 | 129,647 |
5.88%, 02/06/41 | 300,000 | 307,566 |
4.13%, 08/13/42 | 350,000 | 294,392 |
4.88%, 11/13/43 | 100,000 | 92,943 |
4.72%, 12/15/44 | 350,000 | 313,208 |
4.05%, 03/01/45 | 150,000 | 126,153 |
4.60%, 05/13/46 (a) | 300,000 | 269,964 |
5.00%, 07/15/52 (a) | 250,000 | 236,670 |
Munich Re America Corp. | ||
7.45%, 12/15/26 | 25,000 | 26,753 |
Nationwide Financial Services, Inc. | ||
6.75%, 05/15/37 (b) | 65,000 | 62,131 |
Old Republic International Corp. | ||
3.88%, 08/26/26 (a) | 250,000 | 236,150 |
3.85%, 06/11/51 (a) | 150,000 | 108,636 |
PartnerRe Finance B LLC | ||
3.70%, 07/02/29 (a) | 160,000 | 146,933 |
4.50%, 10/01/50 (a)(b) | 100,000 | 84,363 |
Principal Financial Group, Inc. | ||
3.10%, 11/15/26 (a) | 150,000 | 138,941 |
3.70%, 05/15/29 (a) | 150,000 | 137,720 |
2.13%, 06/15/30 (a) | 250,000 | 203,482 |
4.63%, 09/15/42 | 150,000 | 128,598 |
4.35%, 05/15/43 | 150,000 | 122,970 |
4.30%, 11/15/46 (a) | 150,000 | 120,902 |
Prudential Financial, Inc. | ||
1.50%, 03/10/26 (a) | 100,000 | 91,527 |
3.88%, 03/27/28 (a) | 92,000 | 87,884 |
SECURITY RATE, MATURITY DATE | FACE AMOUNT ($) | VALUE ($) |
2.10%, 03/10/30 (a) | 250,000 | 211,517 |
5.75%, 07/15/33 | 100,000 | 105,113 |
5.70%, 12/14/36 | 90,000 | 93,659 |
6.63%, 12/01/37 | 100,000 | 111,112 |
3.00%, 03/10/40 (a) | 200,000 | 150,106 |
4.60%, 05/15/44 | 300,000 | 265,557 |
5.38%, 05/15/45 (a)(b) | 400,000 | 390,864 |
4.50%, 09/15/47 (a)(b) | 300,000 | 275,745 |
3.91%, 12/07/47 (a) | 350,000 | 279,646 |
4.42%, 03/27/48 (a) | 150,000 | 128,087 |
5.70%, 09/15/48 (a)(b) | 250,000 | 240,715 |
3.94%, 12/07/49 (a) | 400,000 | 319,424 |
4.35%, 02/25/50 (a) | 250,000 | 213,120 |
3.70%, 10/01/50 (a)(b) | 250,000 | 210,400 |
3.70%, 03/13/51 (a) | 300,000 | 231,645 |
5.13%, 03/01/52 (a)(b) | 250,000 | 225,172 |
6.00%, 09/01/52 (a)(b) | 300,000 | 287,424 |
Prudential Funding Asia PLC | ||
3.13%, 04/14/30 | 325,000 | 288,109 |
3.63%, 03/24/32 (a) | 175,000 | 156,317 |
Radian Group, Inc. | ||
4.50%, 10/01/24 (a) | 100,000 | 97,583 |
6.63%, 03/15/25 (a) | 325,000 | 325,091 |
Reinsurance Group of America, Inc. | ||
3.90%, 05/15/29 (a) | 200,000 | 182,518 |
3.15%, 06/15/30 (a) | 200,000 | 171,890 |
RenaissanceRe Finance, Inc. | ||
3.70%, 04/01/25 (a) | 100,000 | 96,727 |
3.45%, 07/01/27 (a) | 150,000 | 140,010 |
RenaissanceRe Holdings Ltd. | ||
3.60%, 04/15/29 (a) | 75,000 | 66,826 |
Selective Insurance Group, Inc. | ||
5.38%, 03/01/49 (a) | 100,000 | 92,495 |
Stewart Information Services Corp. | ||
3.60%, 11/15/31 (a) | 150,000 | 115,052 |
The Progressive Corp. | ||
4.00%, 03/01/29 (a) | 360,000 | 345,611 |
3.20%, 03/26/30 (a) | 275,000 | 246,845 |
3.00%, 03/15/32 (a) | 150,000 | 131,361 |
6.25%, 12/01/32 | 210,000 | 227,974 |
4.35%, 04/25/44 | 150,000 | 130,398 |
3.70%, 01/26/45 | 150,000 | 118,959 |
4.13%, 04/15/47 (a) | 350,000 | 302,918 |
4.20%, 03/15/48 (a) | 125,000 | 107,511 |
3.95%, 03/26/50 (a) | 150,000 | 124,821 |
Transatlantic Holdings, Inc. | ||
8.00%, 11/30/39 | 121,000 | 151,342 |
Travelers Cos., Inc. | ||
6.75%, 06/20/36 | 50,000 | 56,873 |
6.25%, 06/15/37 | 375,000 | 416,070 |
5.35%, 11/01/40 | 100,000 | 102,806 |
4.60%, 08/01/43 | 200,000 | 182,562 |
4.30%, 08/25/45 (a) | 100,000 | 87,023 |
3.75%, 05/15/46 (a) | 200,000 | 159,436 |
4.00%, 05/30/47 (a) | 150,000 | 126,674 |
4.10%, 03/04/49 (a) | 150,000 | 128,247 |
2.55%, 04/27/50 (a) | 225,000 | 145,667 |
3.05%, 06/08/51 (a) | 275,000 | 196,993 |
Travelers Property Casualty Corp. | ||
6.38%, 03/15/33 | 200,000 | 220,982 |
Trinity Acquisition PLC | ||
4.40%, 03/15/26 (a) | 110,000 | 106,218 |
UnitedHealth Group, Inc. | ||
2.38%, 08/15/24 | 300,000 | 290,088 |
3.75%, 07/15/25 | 750,000 | 730,185 |
SECURITY RATE, MATURITY DATE | FACE AMOUNT ($) | VALUE ($) |
3.70%, 12/15/25 | 100,000 | 96,668 |
1.25%, 01/15/26 | 100,000 | 91,388 |
3.10%, 03/15/26 | 350,000 | 335,034 |
1.15%, 05/15/26 (a) | 300,000 | 271,461 |
3.45%, 01/15/27 | 250,000 | 239,887 |
2.95%, 10/15/27 | 100,000 | 92,881 |
5.25%, 02/15/28 (a) | 300,000 | 306,270 |
3.85%, 06/15/28 | 450,000 | 431,707 |
3.88%, 12/15/28 | 350,000 | 336,241 |
4.00%, 05/15/29 (a) | 250,000 | 239,290 |
2.88%, 08/15/29 | 400,000 | 360,300 |
5.30%, 02/15/30 (a) | 500,000 | 512,475 |
2.00%, 05/15/30 | 400,000 | 337,212 |
2.30%, 05/15/31 (a) | 400,000 | 338,440 |
4.20%, 05/15/32 (a) | 375,000 | 358,151 |
5.35%, 02/15/33 (a) | 500,000 | 519,900 |
4.50%, 04/15/33 (a) | 400,000 | 390,228 |
4.63%, 07/15/35 | 350,000 | 342,993 |
5.80%, 03/15/36 | 200,000 | 214,796 |
6.50%, 06/15/37 | 150,000 | 168,015 |
6.63%, 11/15/37 | 200,000 | 229,152 |
6.88%, 02/15/38 | 300,000 | 358,671 |
3.50%, 08/15/39 (a) | 350,000 | 294,133 |
2.75%, 05/15/40 (a) | 350,000 | 260,946 |
5.70%, 10/15/40 (a) | 100,000 | 105,687 |
5.95%, 02/15/41 (a) | 150,000 | 162,756 |
3.05%, 05/15/41 (a) | 400,000 | 309,584 |
4.63%, 11/15/41 (a) | 173,000 | 162,983 |
4.38%, 03/15/42 (a) | 150,000 | 136,721 |
3.95%, 10/15/42 (a) | 175,000 | 150,314 |
4.75%, 07/15/45 | 700,000 | 670,047 |
4.20%, 01/15/47 (a) | 200,000 | 176,892 |
4.25%, 04/15/47 (a) | 250,000 | 220,015 |
3.75%, 10/15/47 (a) | 225,000 | 185,562 |
4.25%, 06/15/48 (a) | 400,000 | 353,524 |
4.45%, 12/15/48 (a) | 350,000 | 319,795 |
3.70%, 08/15/49 (a) | 350,000 | 282,590 |
2.90%, 05/15/50 (a) | 375,000 | 263,269 |
3.25%, 05/15/51 (a) | 600,000 | 448,770 |
4.75%, 05/15/52 (a) | 550,000 | 523,798 |
5.88%, 02/15/53 (a) | 500,000 | 555,360 |
5.05%, 04/15/53 (a) | 500,000 | 498,110 |
3.88%, 08/15/59 (a) | 350,000 | 286,146 |
3.13%, 05/15/60 (a) | 250,000 | 174,750 |
4.95%, 05/15/62 (a) | 275,000 | 266,029 |
6.05%, 02/15/63 (a) | 400,000 | 453,680 |
5.20%, 04/15/63 (a) | 500,000 | 499,905 |
Unum Group | ||
4.00%, 06/15/29 (a) | 150,000 | 138,291 |
5.75%, 08/15/42 | 150,000 | 142,115 |
4.50%, 12/15/49 (a) | 150,000 | 115,835 |
4.13%, 06/15/51 (a) | 100,000 | 74,099 |
Voya Financial, Inc. | ||
3.65%, 06/15/26 | 150,000 | 141,108 |
5.70%, 07/15/43 | 125,000 | 120,351 |
4.80%, 06/15/46 | 75,000 | 62,076 |
4.70%, 01/23/48 (a)(b) | 100,000 | 81,116 |
Willis North America, Inc. | ||
4.65%, 06/15/27 (a) | 200,000 | 194,500 |
4.50%, 09/15/28 (a) | 200,000 | 191,032 |
2.95%, 09/15/29 (a) | 200,000 | 172,716 |
5.35%, 05/15/33 (a) | 200,000 | 195,250 |
5.05%, 09/15/48 (a) | 175,000 | 151,240 |
3.88%, 09/15/49 (a) | 150,000 | 109,761 |
WR Berkley Corp. | ||
4.75%, 08/01/44 | 100,000 | 88,050 |
4.00%, 05/12/50 (a) | 150,000 | 117,990 |
SECURITY RATE, MATURITY DATE | FACE AMOUNT ($) | VALUE ($) |
3.55%, 03/30/52 (a) | 150,000 | 107,498 |
3.15%, 09/30/61 (a) | 100,000 | 62,408 |
XLIT Ltd. | ||
5.25%, 12/15/43 | 100,000 | 98,721 |
79,258,938 | ||
REITs 0.7% | ||
Agree LP | ||
2.00%, 06/15/28 (a) | 150,000 | 124,991 |
2.90%, 10/01/30 (a) | 250,000 | 208,752 |
Alexandria Real Estate Equities, Inc. | ||
3.45%, 04/30/25 (a) | 25,000 | 23,970 |
4.30%, 01/15/26 (a) | 150,000 | 145,116 |
3.80%, 04/15/26 (a) | 100,000 | 95,822 |
3.95%, 01/15/28 (a) | 150,000 | 140,133 |
4.50%, 07/30/29 (a) | 100,000 | 94,826 |
2.75%, 12/15/29 (a) | 200,000 | 170,388 |
4.70%, 07/01/30 (a) | 150,000 | 142,933 |
4.90%, 12/15/30 (a) | 250,000 | 242,517 |
3.38%, 08/15/31 (a) | 230,000 | 197,598 |
2.00%, 05/18/32 (a) | 200,000 | 151,600 |
1.88%, 02/01/33 (a) | 250,000 | 183,310 |
2.95%, 03/15/34 (a) | 250,000 | 197,892 |
4.85%, 04/15/49 (a) | 100,000 | 84,557 |
4.00%, 02/01/50 (a) | 200,000 | 150,150 |
3.00%, 05/18/51 (a) | 200,000 | 123,656 |
3.55%, 03/15/52 (a) | 250,000 | 171,542 |
5.15%, 04/15/53 (a) | 100,000 | 90,180 |
American Assets Trust LP | ||
3.38%, 02/01/31 (a) | 150,000 | 117,788 |
American Homes 4 Rent LP | ||
4.25%, 02/15/28 (a) | 140,000 | 131,992 |
4.90%, 02/15/29 (a) | 100,000 | 96,079 |
2.38%, 07/15/31 (a) | 100,000 | 79,982 |
3.63%, 04/15/32 (a) | 150,000 | 130,182 |
3.38%, 07/15/51 (a) | 100,000 | 65,806 |
4.30%, 04/15/52 (a) | 100,000 | 78,670 |
AvalonBay Communities, Inc. | ||
3.45%, 06/01/25 (a) | 150,000 | 144,726 |
2.95%, 05/11/26 (a) | 125,000 | 117,734 |
2.90%, 10/15/26 (a) | 100,000 | 92,684 |
3.35%, 05/15/27 (a) | 200,000 | 187,152 |
3.20%, 01/15/28 (a) | 200,000 | 184,660 |
1.90%, 12/01/28 (a) | 150,000 | 127,401 |
3.30%, 06/01/29 (a) | 150,000 | 136,671 |
2.30%, 03/01/30 (a) | 250,000 | 210,040 |
2.45%, 01/15/31 (a) | 200,000 | 168,102 |
2.05%, 01/15/32 (a) | 200,000 | 160,886 |
3.90%, 10/15/46 (a) | 150,000 | 117,273 |
4.35%, 04/15/48 (a) | 100,000 | 84,718 |
Boston Properties LP | ||
3.20%, 01/15/25 (a) | 375,000 | 355,927 |
3.65%, 02/01/26 (a) | 200,000 | 186,178 |
2.75%, 10/01/26 (a) | 225,000 | 199,492 |
6.75%, 12/01/27 (a) | 100,000 | 101,179 |
4.50%, 12/01/28 (a) | 300,000 | 276,924 |
3.40%, 06/21/29 (a) | 350,000 | 295,354 |
2.90%, 03/15/30 (a) | 200,000 | 161,898 |
3.25%, 01/30/31 (a) | 383,000 | 311,831 |
2.55%, 04/01/32 (a) | 200,000 | 150,982 |
2.45%, 10/01/33 (a) | 425,000 | 307,942 |
Brandywine Operating Partnership LP | ||
4.10%, 10/01/24 (a) | 150,000 | 142,803 |
3.95%, 11/15/27 (a) | 125,000 | 99,265 |
7.55%, 03/15/28 (a) | 100,000 | 91,603 |
4.55%, 10/01/29 (a) | 150,000 | 110,447 |
SECURITY RATE, MATURITY DATE | FACE AMOUNT ($) | VALUE ($) |
Brixmor Operating Partnership LP | ||
3.85%, 02/01/25 (a) | 250,000 | 239,985 |
4.13%, 06/15/26 (a) | 50,000 | 46,863 |
3.90%, 03/15/27 (a) | 150,000 | 138,347 |
4.13%, 05/15/29 (a) | 250,000 | 223,732 |
4.05%, 07/01/30 (a) | 225,000 | 203,434 |
2.50%, 08/16/31 (a) | 225,000 | 175,734 |
Broadstone Net Lease LLC | ||
2.60%, 09/15/31 (a) | 150,000 | 108,318 |
Camden Property Trust | ||
4.10%, 10/15/28 (a) | 150,000 | 142,702 |
3.15%, 07/01/29 (a) | 116,000 | 103,324 |
2.80%, 05/15/30 (a) | 250,000 | 217,872 |
3.35%, 11/01/49 (a) | 100,000 | 73,267 |
Corporate Office Properties LP | ||
2.25%, 03/15/26 (a) | 150,000 | 132,896 |
2.00%, 01/15/29 (a) | 150,000 | 114,921 |
2.75%, 04/15/31 (a) | 200,000 | 152,656 |
CubeSmart LP | ||
4.00%, 11/15/25 (a) | 150,000 | 142,468 |
3.13%, 09/01/26 (a) | 100,000 | 92,214 |
4.38%, 02/15/29 (a) | 118,000 | 110,876 |
3.00%, 02/15/30 (a) | 200,000 | 171,780 |
2.00%, 02/15/31 (a) | 250,000 | 195,577 |
Digital Realty Trust LP | ||
3.70%, 08/15/27 (a) | 370,000 | 342,376 |
5.55%, 01/15/28 (a) | 150,000 | 148,488 |
4.45%, 07/15/28 (a) | 200,000 | 188,182 |
3.60%, 07/01/29 (a) | 200,000 | 178,286 |
EPR Properties | ||
4.75%, 12/15/26 (a) | 250,000 | 228,697 |
4.50%, 06/01/27 (a) | 250,000 | 225,210 |
4.95%, 04/15/28 (a) | 200,000 | 179,214 |
3.75%, 08/15/29 (a) | 200,000 | 163,492 |
ERP Operating LP | ||
3.38%, 06/01/25 (a) | 150,000 | 144,343 |
2.85%, 11/01/26 (a) | 150,000 | 139,419 |
3.25%, 08/01/27 (a) | 150,000 | 138,374 |
3.50%, 03/01/28 (a) | 200,000 | 185,696 |
4.15%, 12/01/28 (a) | 50,000 | 47,535 |
3.00%, 07/01/29 (a) | 200,000 | 176,644 |
2.50%, 02/15/30 (a) | 200,000 | 170,626 |
4.50%, 07/01/44 (a) | 150,000 | 131,804 |
4.50%, 06/01/45 (a) | 225,000 | 189,400 |
Essential Properties LP | ||
2.95%, 07/15/31 (a) | 150,000 | 112,590 |
Essex Portfolio LP | ||
3.50%, 04/01/25 (a) | 150,000 | 144,369 |
3.63%, 05/01/27 (a) | 150,000 | 140,331 |
4.00%, 03/01/29 (a) | 250,000 | 231,422 |
3.00%, 01/15/30 (a) | 150,000 | 128,667 |
1.65%, 01/15/31 (a) | 150,000 | 114,015 |
2.65%, 03/15/32 (a) | 200,000 | 161,412 |
4.50%, 03/15/48 (a) | 114,000 | 93,783 |
Extra Space Storage LP | ||
2.55%, 06/01/31 (a) | 150,000 | 121,634 |
2.35%, 03/15/32 (a) | 200,000 | 156,768 |
Federal Realty Investment Trust | ||
1.25%, 02/15/26 (a) | 150,000 | 134,303 |
3.25%, 07/15/27 (a) | 200,000 | 181,508 |
3.20%, 06/15/29 (a) | 100,000 | 86,828 |
4.50%, 12/01/44 (a) | 200,000 | 157,940 |
Healthcare Realty Holdings LP | ||
2.40%, 03/15/30 (a) | 150,000 | 120,303 |
2.05%, 03/15/31 (a) | 200,000 | 149,768 |
SECURITY RATE, MATURITY DATE | FACE AMOUNT ($) | VALUE ($) |
Healthcare Trust of America Holdings LP | ||
3.50%, 08/01/26 (a) | 200,000 | 184,748 |
3.75%, 07/01/27 (a) | 150,000 | 138,617 |
Healthpeak Properties, Inc. | ||
3.40%, 02/01/25 (a) | 150,000 | 144,271 |
4.00%, 06/01/25 (a) | 150,000 | 144,927 |
3.25%, 07/15/26 (a) | 300,000 | 279,927 |
3.50%, 07/15/29 (a) | 250,000 | 224,652 |
3.00%, 01/15/30 (a) | 300,000 | 260,967 |
5.25%, 12/15/32 (a) | 200,000 | 195,640 |
6.75%, 02/01/41 (a) | 100,000 | 106,041 |
Highwoods Realty LP | ||
4.13%, 03/15/28 (a) | 200,000 | 175,728 |
4.20%, 04/15/29 (a) | 200,000 | 170,070 |
2.60%, 02/01/31 (a) | 150,000 | 110,489 |
Host Hotels & Resorts LP | ||
4.00%, 06/15/25 (a) | 100,000 | 96,177 |
4.50%, 02/01/26 (a) | 150,000 | 145,545 |
3.38%, 12/15/29 (a) | 200,000 | 171,582 |
3.50%, 09/15/30 (a) | 275,000 | 233,692 |
Hudson Pacific Properties LP | ||
3.95%, 11/01/27 (a) | 250,000 | 183,622 |
4.65%, 04/01/29 (a) | 150,000 | 106,559 |
3.25%, 01/15/30 (a) | 125,000 | 79,401 |
Invitation Homes Operating Partnership LP | ||
2.30%, 11/15/28 (a) | 150,000 | 127,946 |
2.00%, 08/15/31 (a) | 200,000 | 155,238 |
4.15%, 04/15/32 (a) | 100,000 | 90,314 |
2.70%, 01/15/34 (a) | 150,000 | 114,324 |
Kilroy Realty LP | ||
4.38%, 10/01/25 (a) | 150,000 | 140,603 |
4.75%, 12/15/28 (a) | 150,000 | 133,518 |
4.25%, 08/15/29 (a) | 175,000 | 150,258 |
3.05%, 02/15/30 (a) | 200,000 | 157,320 |
2.50%, 11/15/32 (a) | 250,000 | 175,225 |
Kimco Realty Corp. | ||
2.80%, 10/01/26 (a) | 450,000 | 411,700 |
1.90%, 03/01/28 (a) | 250,000 | 211,027 |
2.70%, 10/01/30 (a) | 300,000 | 248,064 |
4.25%, 04/01/45 (a) | 150,000 | 114,957 |
4.13%, 12/01/46 (a) | 100,000 | 74,750 |
4.45%, 09/01/47 (a) | 200,000 | 162,524 |
3.70%, 10/01/49 (a) | 150,000 | 107,135 |
Kite Realty Group LP | ||
4.00%, 10/01/26 (a) | 100,000 | 90,933 |
Lexington Realty Trust | ||
2.70%, 09/15/30 (a) | 250,000 | 199,792 |
Life Storage LP | ||
3.50%, 07/01/26 (a) | 100,000 | 94,192 |
3.88%, 12/15/27 (a) | 200,000 | 186,242 |
4.00%, 06/15/29 (a) | 150,000 | 136,100 |
2.20%, 10/15/30 (a) | 300,000 | 240,369 |
Mid-America Apartments LP | ||
4.00%, 11/15/25 (a) | 150,000 | 145,312 |
3.60%, 06/01/27 (a) | 60,000 | 56,806 |
4.20%, 06/15/28 (a) | 200,000 | 190,974 |
3.95%, 03/15/29 (a) | 50,000 | 47,228 |
2.75%, 03/15/30 (a) | 100,000 | 87,393 |
1.70%, 02/15/31 (a) | 150,000 | 118,899 |
2.88%, 09/15/51 (a) | 150,000 | 97,925 |
National Health Investors, Inc. | ||
3.00%, 02/01/31 (a) | 150,000 | 115,758 |
National Retail Properties, Inc. | ||
3.60%, 12/15/26 (a) | 150,000 | 139,677 |
3.50%, 10/15/27 (a) | 125,000 | 114,889 |
SECURITY RATE, MATURITY DATE | FACE AMOUNT ($) | VALUE ($) |
4.30%, 10/15/28 (a) | 150,000 | 140,156 |
2.50%, 04/15/30 (a) | 100,000 | 83,339 |
4.80%, 10/15/48 (a) | 85,000 | 70,854 |
3.10%, 04/15/50 (a) | 150,000 | 92,997 |
3.50%, 04/15/51 (a) | 100,000 | 67,777 |
3.00%, 04/15/52 (a) | 125,000 | 75,906 |
Omega Healthcare Investors, Inc. | ||
4.50%, 01/15/25 (a) | 50,000 | 48,124 |
5.25%, 01/15/26 (a) | 100,000 | 96,382 |
4.50%, 04/01/27 (a) | 300,000 | 279,954 |
4.75%, 01/15/28 (a) | 143,000 | 131,065 |
3.63%, 10/01/29 (a) | 150,000 | 123,333 |
3.38%, 02/01/31 (a) | 200,000 | 158,984 |
3.25%, 04/15/33 (a) | 200,000 | 149,172 |
Phillips Edison Grocery Center Operating Partnership I LP | ||
2.63%, 11/15/31 (a) | 100,000 | 74,521 |
Physicians Realty LP | ||
4.30%, 03/15/27 (a) | 300,000 | 283,017 |
2.63%, 11/01/31 (a) | 100,000 | 78,034 |
Piedmont Operating Partnership LP | ||
3.15%, 08/15/30 (a) | 125,000 | 91,481 |
2.75%, 04/01/32 (a) | 100,000 | 68,096 |
Prologis LP | ||
3.25%, 06/30/26 (a) | 50,000 | 47,440 |
3.25%, 10/01/26 (a) | 150,000 | 142,240 |
4.38%, 02/01/29 (a) | 25,000 | 24,052 |
2.88%, 11/15/29 (a) | 150,000 | 131,840 |
2.25%, 04/15/30 (a) | 350,000 | 297,668 |
1.75%, 07/01/30 (a) | 250,000 | 201,900 |
1.25%, 10/15/30 (a) | 350,000 | 272,230 |
1.63%, 03/15/31 (a) | 200,000 | 158,282 |
2.25%, 01/15/32 (a) | 150,000 | 121,299 |
4.63%, 01/15/33 (a) | 100,000 | 97,796 |
4.75%, 06/15/33 (a) | 200,000 | 195,620 |
4.38%, 09/15/48 (a) | 50,000 | 43,159 |
3.05%, 03/01/50 (a) | 200,000 | 138,598 |
3.00%, 04/15/50 (a) | 325,000 | 221,679 |
2.13%, 10/15/50 (a) | 200,000 | 113,170 |
Public Storage | ||
0.88%, 02/15/26 (a) | 200,000 | 179,466 |
1.50%, 11/09/26 (a) | 150,000 | 134,510 |
3.09%, 09/15/27 (a) | 250,000 | 233,422 |
3.39%, 05/01/29 (a) | 300,000 | 277,608 |
2.30%, 05/01/31 (a) | 250,000 | 208,815 |
2.25%, 11/09/31 (a) | 200,000 | 164,238 |
Realty Income Corp. | ||
3.88%, 07/15/24 (a) | 300,000 | 293,520 |
4.63%, 11/01/25 (a) | 250,000 | 246,142 |
0.75%, 03/15/26 (a) | 150,000 | 132,005 |
4.88%, 06/01/26 (a) | 100,000 | 99,083 |
4.13%, 10/15/26 (a) | 250,000 | 239,787 |
3.00%, 01/15/27 (a) | 300,000 | 277,311 |
3.95%, 08/15/27 (a) | 400,000 | 380,728 |
3.40%, 01/15/28 (a) | 150,000 | 138,408 |
3.65%, 01/15/28 (a) | 200,000 | 186,776 |
2.20%, 06/15/28 (a) | 250,000 | 216,330 |
3.10%, 12/15/29 (a) | 100,000 | 87,672 |
3.25%, 01/15/31 (a) | 400,000 | 349,976 |
5.63%, 10/13/32 (a) | 150,000 | 152,287 |
2.85%, 12/15/32 (a) | 200,000 | 163,226 |
4.65%, 03/15/47 (a) | 200,000 | 180,236 |
Regency Centers LP | ||
3.60%, 02/01/27 (a) | 150,000 | 141,528 |
4.13%, 03/15/28 (a) | 200,000 | 187,068 |
2.95%, 09/15/29 (a) | 150,000 | 128,933 |
3.70%, 06/15/30 (a) | 50,000 | 44,865 |
SECURITY RATE, MATURITY DATE | FACE AMOUNT ($) | VALUE ($) |
4.40%, 02/01/47 (a) | 150,000 | 121,524 |
4.65%, 03/15/49 (a) | 50,000 | 42,035 |
Retail Properties of America, Inc. | ||
4.75%, 09/15/30 (a) | 150,000 | 136,193 |
Rexford Industrial Realty LP | ||
2.15%, 09/01/31 (a) | 250,000 | 195,510 |
Sabra Health Care LP | ||
5.13%, 08/15/26 (a) | 150,000 | 141,680 |
3.90%, 10/15/29 (a) | 125,000 | 102,395 |
3.20%, 12/01/31 (a) | 250,000 | 186,840 |
Safehold Operating Partnership LP | ||
2.80%, 06/15/31 (a) | 150,000 | 116,915 |
2.85%, 01/15/32 (a) | 80,000 | 61,652 |
Simon Property Group LP | ||
2.00%, 09/13/24 (a) | 175,000 | 167,062 |
3.38%, 10/01/24 (a) | 100,000 | 97,097 |
3.50%, 09/01/25 (a) | 300,000 | 287,697 |
3.30%, 01/15/26 (a) | 300,000 | 285,702 |
3.25%, 11/30/26 (a) | 200,000 | 187,642 |
1.38%, 01/15/27 (a) | 100,000 | 87,729 |
3.38%, 06/15/27 (a) | 350,000 | 325,524 |
3.38%, 12/01/27 (a) | 100,000 | 92,712 |
1.75%, 02/01/28 (a) | 350,000 | 300,478 |
2.45%, 09/13/29 (a) | 550,000 | 464,629 |
2.65%, 07/15/30 (a) | 100,000 | 85,224 |
2.20%, 02/01/31 (a) | 100,000 | 80,394 |
2.65%, 02/01/32 (a) | 250,000 | 203,847 |
5.50%, 03/08/33 (a) | 150,000 | 149,173 |
6.75%, 02/01/40 (a) | 220,000 | 240,134 |
4.75%, 03/15/42 (a) | 150,000 | 131,639 |
4.25%, 10/01/44 (a) | 100,000 | 80,251 |
4.25%, 11/30/46 (a) | 100,000 | 79,620 |
3.25%, 09/13/49 (a) | 400,000 | 269,744 |
3.80%, 07/15/50 (a) | 275,000 | 204,314 |
5.85%, 03/08/53 (a) | 150,000 | 149,302 |
SITE Centers Corp. | ||
3.63%, 02/01/25 (a) | 150,000 | 141,479 |
4.25%, 02/01/26 (a) | 150,000 | 141,129 |
4.70%, 06/01/27 (a) | 154,000 | 142,270 |
Spirit Realty LP | ||
4.45%, 09/15/26 (a) | 60,000 | 56,750 |
3.20%, 01/15/27 (a) | 200,000 | 180,358 |
3.40%, 01/15/30 (a) | 250,000 | 213,452 |
3.20%, 02/15/31 (a) | 250,000 | 204,927 |
STORE Capital Corp. | ||
4.50%, 03/15/28 (a) | 100,000 | 87,872 |
4.63%, 03/15/29 (a) | 100,000 | 84,455 |
2.75%, 11/18/30 (a) | 125,000 | 90,654 |
2.70%, 12/01/31 (a) | 100,000 | 69,478 |
Sun Communities Operating LP | ||
2.30%, 11/01/28 (a) | 150,000 | 126,479 |
2.70%, 07/15/31 (a) | 300,000 | 237,399 |
Tanger Properties LP | ||
3.13%, 09/01/26 (a) | 200,000 | 177,678 |
3.88%, 07/15/27 (a) | 150,000 | 135,134 |
2.75%, 09/01/31 (a) | 75,000 | 54,548 |
UDR, Inc. | ||
2.95%, 09/01/26 (a) | 100,000 | 91,701 |
3.50%, 01/15/28 (a) | 145,000 | 132,297 |
4.40%, 01/26/29 (a) | 300,000 | 282,465 |
3.00%, 08/15/31 (a) | 350,000 | 297,920 |
2.10%, 08/01/32 (a) | 100,000 | 76,117 |
Ventas Realty LP | ||
2.65%, 01/15/25 (a) | 150,000 | 141,423 |
3.50%, 02/01/25 (a) | 200,000 | 191,684 |
SECURITY RATE, MATURITY DATE | FACE AMOUNT ($) | VALUE ($) |
4.13%, 01/15/26 (a) | 150,000 | 143,586 |
3.25%, 10/15/26 (a) | 200,000 | 183,648 |
3.85%, 04/01/27 (a) | 100,000 | 93,750 |
4.00%, 03/01/28 (a) | 200,000 | 186,222 |
4.40%, 01/15/29 (a) | 250,000 | 233,930 |
4.75%, 11/15/30 (a) | 200,000 | 189,702 |
5.70%, 09/30/43 (a) | 100,000 | 93,930 |
4.38%, 02/01/45 (a) | 100,000 | 80,879 |
4.88%, 04/15/49 (a) | 100,000 | 85,940 |
Vornado Realty LP | ||
3.50%, 01/15/25 (a) | 150,000 | 141,324 |
2.15%, 06/01/26 (a) | 175,000 | 148,363 |
Welltower, Inc. | ||
4.00%, 06/01/25 (a) | 200,000 | 193,350 |
4.25%, 04/01/26 (a) | 400,000 | 386,988 |
2.70%, 02/15/27 (a) | 100,000 | 90,885 |
4.25%, 04/15/28 (a) | 200,000 | 188,874 |
4.13%, 03/15/29 (a) | 400,000 | 372,404 |
3.10%, 01/15/30 (a) | 150,000 | 130,686 |
2.75%, 01/15/31 (a) | 300,000 | 247,698 |
6.50%, 03/15/41 (a) | 250,000 | 258,500 |
4.95%, 09/01/48 (a) | 150,000 | 134,409 |
WP Carey, Inc. | ||
4.00%, 02/01/25 (a) | 300,000 | 291,393 |
3.85%, 07/15/29 (a) | 200,000 | 181,416 |
2.40%, 02/01/31 (a) | 200,000 | 160,954 |
2.25%, 04/01/33 (a) | 150,000 | 113,220 |
45,683,227 | ||
567,909,451 | ||
Industrial 14.4% | ||
Basic Industry 0.7% | ||
Air Products and Chemicals, Inc. | ||
3.35%, 07/31/24 (a) | 20,000 | 19,498 |
1.50%, 10/15/25 (a) | 250,000 | 231,022 |
1.85%, 05/15/27 (a) | 300,000 | 270,045 |
2.05%, 05/15/30 (a) | 125,000 | 106,378 |
2.70%, 05/15/40 (a) | 250,000 | 187,255 |
2.80%, 05/15/50 (a) | 300,000 | 215,244 |
Albemarle Corp. | ||
4.65%, 06/01/27 (a) | 200,000 | 195,070 |
5.05%, 06/01/32 (a) | 200,000 | 194,094 |
5.45%, 12/01/44 (a) | 250,000 | 237,250 |
AngloGold Ashanti Holdings PLC | ||
3.75%, 10/01/30 (a) | 450,000 | 385,470 |
ArcelorMittal S.A. | ||
6.55%, 11/29/27 (a) | 350,000 | 359,845 |
4.25%, 07/16/29 | 250,000 | 236,815 |
6.80%, 11/29/32 (a) | 250,000 | 256,990 |
7.00%, 10/15/39 | 350,000 | 368,004 |
Barrick North America Finance LLC | ||
5.70%, 05/30/41 | 250,000 | 253,327 |
5.75%, 05/01/43 | 200,000 | 206,414 |
Barrick PD Australia Finance Pty Ltd. | ||
5.95%, 10/15/39 | 400,000 | 417,676 |
BHP Billiton Finance USA Ltd. | ||
4.88%, 02/27/26 | 200,000 | 199,046 |
6.42%, 03/01/26 | 100,000 | 102,813 |
4.75%, 02/28/28 (a) | 250,000 | 248,730 |
4.90%, 02/28/33 (a) | 200,000 | 199,486 |
4.13%, 02/24/42 | 275,000 | 248,633 |
5.00%, 09/30/43 | 700,000 | 696,822 |
Cabot Corp. | ||
4.00%, 07/01/29 (a) | 150,000 | 139,656 |
SECURITY RATE, MATURITY DATE | FACE AMOUNT ($) | VALUE ($) |
Celanese US Holdings LLC | ||
5.90%, 07/05/24 | 500,000 | 499,035 |
6.05%, 03/15/25 | 500,000 | 498,185 |
1.40%, 08/05/26 (a) | 400,000 | 346,896 |
6.17%, 07/15/27 (a) | 500,000 | 499,110 |
6.33%, 07/15/29 (a) | 200,000 | 199,204 |
6.38%, 07/15/32 (a) | 300,000 | 302,055 |
Celulosa Arauco y Constitucion S.A. | ||
4.50%, 08/01/24 (a) | 200,000 | 196,904 |
3.88%, 11/02/27 (a) | 250,000 | 230,235 |
CF Industries, Inc. | ||
5.15%, 03/15/34 | 300,000 | 288,156 |
4.95%, 06/01/43 | 100,000 | 86,667 |
5.38%, 03/15/44 | 250,000 | 229,000 |
Dow Chemical Co. | ||
4.80%, 11/30/28 (a) | 50,000 | 49,616 |
7.38%, 11/01/29 | 450,000 | 501,304 |
2.10%, 11/15/30 (a) | 250,000 | 206,885 |
6.30%, 03/15/33 (a) | 175,000 | 188,554 |
4.25%, 10/01/34 (a) | 200,000 | 182,496 |
5.25%, 11/15/41 (a) | 300,000 | 290,019 |
4.38%, 11/15/42 (a) | 450,000 | 382,518 |
4.63%, 10/01/44 (a) | 150,000 | 130,578 |
5.55%, 11/30/48 (a) | 250,000 | 243,767 |
4.80%, 05/15/49 (a) | 200,000 | 176,712 |
3.60%, 11/15/50 (a) | 250,000 | 186,782 |
6.90%, 05/15/53 (a) | 300,000 | 340,923 |
DuPont de Nemours, Inc. | ||
4.49%, 11/15/25 (a) | 400,000 | 392,004 |
4.73%, 11/15/28 (a) | 750,000 | 739,455 |
5.32%, 11/15/38 (a) | 400,000 | 397,184 |
5.42%, 11/15/48 (a) | 605,000 | 600,233 |
Eastman Chemical Co. | ||
3.80%, 03/15/25 (a) | 250,000 | 243,592 |
4.50%, 12/01/28 (a) | 100,000 | 95,577 |
4.80%, 09/01/42 (a) | 150,000 | 130,571 |
4.65%, 10/15/44 (a) | 270,000 | 227,902 |
Ecolab, Inc. | ||
2.70%, 11/01/26 (a) | 300,000 | 282,516 |
3.25%, 12/01/27 (a) | 450,000 | 423,801 |
4.80%, 03/24/30 (a) | 50,000 | 50,244 |
1.30%, 01/30/31 (a) | 300,000 | 236,511 |
2.13%, 02/01/32 (a) | 250,000 | 205,687 |
2.13%, 08/15/50 (a) | 250,000 | 148,470 |
2.70%, 12/15/51 (a) | 250,000 | 166,482 |
2.75%, 08/18/55 (a) | 264,000 | 170,108 |
EI du Pont de Nemours and Co. | ||
1.70%, 07/15/25 (a) | 200,000 | 186,092 |
2.30%, 07/15/30 (a) | 150,000 | 125,693 |
EIDP, Inc. | ||
4.80%, 05/15/33 (a) | 200,000 | 196,132 |
Fibria Overseas Finance Ltd. | ||
4.00%, 01/14/25 (a) | 100,000 | 97,094 |
5.50%, 01/17/27 | 200,000 | 200,470 |
FMC Corp. | ||
5.15%, 05/18/26 (a) | 300,000 | 295,812 |
3.20%, 10/01/26 (a) | 150,000 | 139,544 |
3.45%, 10/01/29 (a) | 200,000 | 175,258 |
4.50%, 10/01/49 (a) | 150,000 | 115,982 |
Freeport-McMoRan, Inc. | ||
5.00%, 09/01/27 (a) | 150,000 | 147,204 |
4.13%, 03/01/28 (a) | 250,000 | 235,117 |
4.38%, 08/01/28 (a) | 150,000 | 141,662 |
5.25%, 09/01/29 (a) | 200,000 | 197,058 |
4.25%, 03/01/30 (a) | 200,000 | 184,932 |
SECURITY RATE, MATURITY DATE | FACE AMOUNT ($) | VALUE ($) |
4.63%, 08/01/30 (a) | 200,000 | 189,468 |
5.40%, 11/14/34 (a) | 250,000 | 241,947 |
5.45%, 03/15/43 (a) | 500,000 | 466,850 |
Georgia-Pacific LLC | ||
7.75%, 11/15/29 | 350,000 | 395,797 |
Huntsman International LLC | ||
4.50%, 05/01/29 (a) | 300,000 | 275,400 |
2.95%, 06/15/31 (a) | 50,000 | 40,071 |
International Flavors & Fragrances, Inc. | ||
4.45%, 09/26/28 (a) | 150,000 | 141,099 |
4.38%, 06/01/47 (a) | 75,000 | 57,803 |
5.00%, 09/26/48 (a) | 350,000 | 297,545 |
International Paper Co. | ||
5.00%, 09/15/35 (a) | 150,000 | 144,311 |
7.30%, 11/15/39 | 100,000 | 113,135 |
6.00%, 11/15/41 (a) | 200,000 | 205,630 |
4.80%, 06/15/44 (a) | 100,000 | 88,719 |
5.15%, 05/15/46 (a) | 100,000 | 92,727 |
4.40%, 08/15/47 (a) | 250,000 | 211,840 |
4.35%, 08/15/48 (a) | 200,000 | 169,058 |
Kinross Gold Corp. | ||
4.50%, 07/15/27 (a) | 150,000 | 143,781 |
Linde, Inc. | ||
2.65%, 02/05/25 (a) | 150,000 | 143,987 |
3.20%, 01/30/26 (a) | 250,000 | 241,560 |
1.10%, 08/10/30 (a) | 200,000 | 159,406 |
3.55%, 11/07/42 (a) | 150,000 | 122,145 |
2.00%, 08/10/50 (a) | 100,000 | 58,060 |
Lubrizol Corp. | ||
6.50%, 10/01/34 | 96,000 | 112,518 |
LYB International Finance BV | ||
5.25%, 07/15/43 | 200,000 | 182,932 |
4.88%, 03/15/44 (a) | 250,000 | 219,852 |
LYB International Finance II BV | ||
3.50%, 03/02/27 (a) | 200,000 | 189,448 |
LYB International Finance III LLC | ||
2.25%, 10/01/30 (a) | 100,000 | 82,238 |
5.63%, 05/15/33 (a) | 200,000 | 200,242 |
3.38%, 10/01/40 (a) | 200,000 | 147,962 |
4.20%, 10/15/49 (a) | 300,000 | 230,121 |
4.20%, 05/01/50 (a) | 300,000 | 229,902 |
3.63%, 04/01/51 (a) | 300,000 | 208,938 |
3.80%, 10/01/60 (a) | 150,000 | 101,757 |
LyondellBasell Industries NV | ||
4.63%, 02/26/55 (a) | 300,000 | 246,075 |
Mosaic Co. | ||
4.05%, 11/15/27 (a) | 250,000 | 238,350 |
5.45%, 11/15/33 (a) | 150,000 | 146,433 |
4.88%, 11/15/41 (a) | 100,000 | 85,819 |
5.63%, 11/15/43 (a) | 150,000 | 141,137 |
NewMarket Corp. | ||
2.70%, 03/18/31 (a) | 150,000 | 123,362 |
Newmont Corp. | ||
2.80%, 10/01/29 (a) | 250,000 | 215,865 |
2.25%, 10/01/30 (a) | 350,000 | 287,836 |
5.88%, 04/01/35 | 250,000 | 256,625 |
6.25%, 10/01/39 | 325,000 | 344,435 |
4.88%, 03/15/42 (a) | 200,000 | 186,094 |
5.45%, 06/09/44 (a) | 100,000 | 98,550 |
Nucor Corp. | ||
2.00%, 06/01/25 (a) | 250,000 | 233,937 |
3.95%, 05/01/28 (a) | 200,000 | 190,284 |
2.70%, 06/01/30 (a) | 250,000 | 217,417 |
3.13%, 04/01/32 (a) | 200,000 | 173,396 |
SECURITY RATE, MATURITY DATE | FACE AMOUNT ($) | VALUE ($) |
6.40%, 12/01/37 | 100,000 | 110,397 |
3.85%, 04/01/52 (a) | 100,000 | 78,969 |
2.98%, 12/15/55 (a) | 400,000 | 257,252 |
Nutrien Ltd. | ||
3.00%, 04/01/25 (a) | 100,000 | 95,197 |
5.95%, 11/07/25 | 150,000 | 151,073 |
4.00%, 12/15/26 (a) | 350,000 | 336,308 |
4.20%, 04/01/29 (a) | 250,000 | 237,020 |
4.13%, 03/15/35 (a) | 250,000 | 220,082 |
5.88%, 12/01/36 | 125,000 | 126,869 |
5.63%, 12/01/40 | 50,000 | 48,656 |
6.13%, 01/15/41 (a) | 500,000 | 516,455 |
4.90%, 06/01/43 (a) | 200,000 | 179,656 |
5.25%, 01/15/45 (a) | 125,000 | 116,671 |
5.00%, 04/01/49 (a) | 50,000 | 45,238 |
3.95%, 05/13/50 (a) | 275,000 | 211,599 |
Packaging Corp. of America | ||
3.65%, 09/15/24 (a) | 100,000 | 97,848 |
3.40%, 12/15/27 (a) | 200,000 | 186,580 |
4.05%, 12/15/49 (a) | 150,000 | 120,195 |
3.05%, 10/01/51 (a) | 200,000 | 133,006 |
PPG Industries, Inc. | ||
2.40%, 08/15/24 (a) | 100,000 | 96,192 |
3.75%, 03/15/28 (a) | 300,000 | 285,576 |
2.80%, 08/15/29 (a) | 150,000 | 132,978 |
2.55%, 06/15/30 (a) | 100,000 | 85,571 |
Rayonier LP | ||
2.75%, 05/17/31 (a) | 225,000 | 181,847 |
Reliance Steel & Aluminum Co. | ||
1.30%, 08/15/25 (a) | 75,000 | 68,651 |
2.15%, 08/15/30 (a) | 200,000 | 163,296 |
Rio Tinto Alcan, Inc. | ||
7.25%, 03/15/31 | 281,000 | 322,934 |
6.13%, 12/15/33 | 375,000 | 406,185 |
5.75%, 06/01/35 | 50,000 | 51,765 |
Rio Tinto Finance USA Ltd. | ||
7.13%, 07/15/28 | 250,000 | 276,000 |
5.20%, 11/02/40 | 350,000 | 354,207 |
2.75%, 11/02/51 (a) | 250,000 | 171,372 |
Rio Tinto Finance USA PLC | ||
4.75%, 03/22/42 (a) | 200,000 | 191,080 |
4.13%, 08/21/42 (a) | 150,000 | 132,251 |
5.13%, 03/09/53 (a) | 300,000 | 302,955 |
RPM International, Inc. | ||
3.75%, 03/15/27 (a) | 250,000 | 234,817 |
4.25%, 01/15/48 (a) | 250,000 | 192,992 |
Sherwin-Williams Co. | ||
3.45%, 08/01/25 (a) | 150,000 | 144,185 |
3.95%, 01/15/26 (a) | 100,000 | 96,988 |
3.45%, 06/01/27 (a) | 450,000 | 424,822 |
2.95%, 08/15/29 (a) | 300,000 | 265,725 |
2.30%, 05/15/30 (a) | 300,000 | 252,558 |
4.55%, 08/01/45 (a) | 150,000 | 129,174 |
4.50%, 06/01/47 (a) | 400,000 | 351,560 |
3.80%, 08/15/49 (a) | 200,000 | 154,902 |
3.30%, 05/15/50 (a) | 200,000 | 142,502 |
Southern Copper Corp. | ||
3.88%, 04/23/25 | 100,000 | 97,358 |
7.50%, 07/27/35 | 350,000 | 407,715 |
6.75%, 04/16/40 | 200,000 | 221,316 |
5.25%, 11/08/42 | 300,000 | 287,562 |
5.88%, 04/23/45 | 495,000 | 508,929 |
Steel Dynamics, Inc. | ||
2.40%, 06/15/25 (a) | 150,000 | 140,445 |
5.00%, 12/15/26 (a) | 100,000 | 98,456 |
SECURITY RATE, MATURITY DATE | FACE AMOUNT ($) | VALUE ($) |
1.65%, 10/15/27 (a) | 100,000 | 85,730 |
3.45%, 04/15/30 (a) | 200,000 | 178,160 |
3.25%, 01/15/31 (a) | 150,000 | 130,463 |
3.25%, 10/15/50 (a) | 150,000 | 99,783 |
Suzano Austria GmbH | ||
6.00%, 01/15/29 (a) | 550,000 | 547,437 |
5.00%, 01/15/30 (a) | 300,000 | 281,706 |
3.75%, 01/15/31 (a) | 325,000 | 277,781 |
3.13%, 01/15/32 (a) | 400,000 | 321,044 |
Teck Resources Ltd. | ||
3.90%, 07/15/30 (a) | 250,000 | 227,597 |
6.13%, 10/01/35 | 150,000 | 151,380 |
6.00%, 08/15/40 (a) | 240,000 | 234,821 |
5.40%, 02/01/43 (a) | 100,000 | 91,050 |
Vale Overseas Ltd. | ||
3.75%, 07/08/30 (a) | 500,000 | 441,195 |
6.13%, 06/12/33 (a) | 400,000 | 401,216 |
6.88%, 11/21/36 | 523,000 | 549,516 |
6.88%, 11/10/39 | 375,000 | 393,630 |
Westlake Chemical Corp. | ||
3.60%, 08/15/26 (a) | 250,000 | 235,542 |
3.38%, 06/15/30 (a) | 200,000 | 174,358 |
2.88%, 08/15/41 (a) | 75,000 | 50,175 |
5.00%, 08/15/46 (a) | 150,000 | 130,313 |
4.38%, 11/15/47 (a) | 130,000 | 103,355 |
3.13%, 08/15/51 (a) | 200,000 | 125,892 |
3.38%, 08/15/61 (a) | 150,000 | 92,001 |
WestRock MWV LLC | ||
8.20%, 01/15/30 | 40,000 | 45,992 |
Weyerhaeuser Co. | ||
6.95%, 10/01/27 | 200,000 | 212,128 |
4.00%, 11/15/29 (a) | 175,000 | 162,094 |
7.38%, 03/15/32 | 300,000 | 335,196 |
3.38%, 03/09/33 (a) | 150,000 | 129,312 |
WRKCo, Inc. | ||
3.00%, 09/15/24 (a) | 100,000 | 96,473 |
3.75%, 03/15/25 (a) | 200,000 | 192,808 |
4.65%, 03/15/26 (a) | 250,000 | 242,867 |
3.90%, 06/01/28 (a) | 250,000 | 233,235 |
4.90%, 03/15/29 (a) | 300,000 | 290,412 |
4.20%, 06/01/32 (a) | 300,000 | 273,537 |
3.00%, 06/15/33 (a) | 250,000 | 203,945 |
Yamana Gold, Inc. | ||
2.63%, 08/15/31 (a)(c) | 150,000 | 117,122 |
46,774,638 | ||
Capital Goods 1.3% | ||
3M Co. | ||
2.00%, 02/14/25 (a) | 200,000 | 188,800 |
2.65%, 04/15/25 (a) | 250,000 | 238,027 |
3.00%, 08/07/25 | 200,000 | 191,188 |
2.25%, 09/19/26 (a) | 175,000 | 160,276 |
2.88%, 10/15/27 (a) | 300,000 | 274,776 |
3.38%, 03/01/29 (a) | 150,000 | 137,781 |
2.38%, 08/26/29 (a) | 350,000 | 300,793 |
3.05%, 04/15/30 (a) | 200,000 | 180,650 |
3.13%, 09/19/46 (a) | 200,000 | 141,098 |
3.63%, 10/15/47 (a) | 250,000 | 193,343 |
4.00%, 09/14/48 (a)(f) | 300,000 | 263,145 |
3.25%, 08/26/49 (a) | 350,000 | 255,370 |
3.70%, 04/15/50 (a) | 250,000 | 198,473 |
ABB Finance USA, Inc. | ||
3.80%, 04/03/28 (a) | 200,000 | 193,850 |
Acuity Brands Lighting, Inc. | ||
2.15%, 12/15/30 (a) | 200,000 | 160,868 |
SECURITY RATE, MATURITY DATE | FACE AMOUNT ($) | VALUE ($) |
Allegion PLC | ||
3.50%, 10/01/29 (a) | 110,000 | 97,768 |
Allegion US Holding Co., Inc. | ||
3.20%, 10/01/24 (a) | 350,000 | 337,606 |
Amcor Finance USA, Inc. | ||
3.63%, 04/28/26 (a) | 80,000 | 75,706 |
4.50%, 05/15/28 (a) | 150,000 | 142,988 |
5.63%, 05/26/33 (a) | 100,000 | 98,908 |
Amcor Flexibles North America, Inc. | ||
4.00%, 05/17/25 (a) | 100,000 | 96,807 |
2.63%, 06/19/30 (a) | 250,000 | 208,162 |
2.69%, 05/25/31 (a) | 250,000 | 205,047 |
Amphenol Corp. | ||
2.05%, 03/01/25 (a) | 100,000 | 94,512 |
4.35%, 06/01/29 (a) | 100,000 | 96,970 |
2.80%, 02/15/30 (a) | 300,000 | 263,670 |
2.20%, 09/15/31 (a) | 250,000 | 204,465 |
Avery Dennison Corp. | ||
4.88%, 12/06/28 (a) | 225,000 | 221,038 |
2.65%, 04/30/30 (a) | 200,000 | 168,374 |
Berry Global, Inc. | ||
1.57%, 01/15/26 (a) | 500,000 | 451,530 |
1.65%, 01/15/27 (a) | 100,000 | 86,510 |
Boeing Co. | ||
2.85%, 10/30/24 (a) | 100,000 | 96,261 |
4.88%, 05/01/25 (a) | 1,000,000 | 986,000 |
2.60%, 10/30/25 (a) | 100,000 | 93,195 |
2.75%, 02/01/26 (a) | 400,000 | 372,884 |
2.20%, 02/04/26 (a) | 1,500,000 | 1,377,945 |
3.10%, 05/01/26 (a) | 200,000 | 188,176 |
2.25%, 06/15/26 (a) | 125,000 | 113,674 |
2.70%, 02/01/27 (a) | 300,000 | 274,377 |
2.80%, 03/01/27 (a) | 150,000 | 137,027 |
5.04%, 05/01/27 (a) | 550,000 | 544,060 |
3.25%, 03/01/28 (a) | 100,000 | 91,256 |
3.45%, 11/01/28 (a) | 150,000 | 136,434 |
3.20%, 03/01/29 (a) | 300,000 | 269,427 |
2.95%, 02/01/30 (a) | 200,000 | 174,244 |
5.15%, 05/01/30 (a) | 1,150,000 | 1,139,535 |
3.63%, 02/01/31 (a) | 400,000 | 361,212 |
6.13%, 02/15/33 | 150,000 | 156,572 |
3.60%, 05/01/34 (a) | 250,000 | 213,177 |
3.25%, 02/01/35 (a) | 250,000 | 202,987 |
6.63%, 02/15/38 | 100,000 | 106,995 |
3.55%, 03/01/38 (a) | 100,000 | 78,349 |
3.50%, 03/01/39 (a) | 150,000 | 114,446 |
6.88%, 03/15/39 | 100,000 | 110,038 |
5.88%, 02/15/40 | 150,000 | 150,486 |
5.71%, 05/01/40 (a) | 850,000 | 848,079 |
3.63%, 03/01/48 (a) | 150,000 | 106,953 |
3.85%, 11/01/48 (a) | 100,000 | 74,176 |
3.90%, 05/01/49 (a) | 225,000 | 172,755 |
3.75%, 02/01/50 (a) | 350,000 | 263,392 |
5.81%, 05/01/50 (a) | 1,500,000 | 1,493,280 |
3.83%, 03/01/59 (a) | 100,000 | 71,649 |
3.95%, 08/01/59 (a) | 300,000 | 222,270 |
5.93%, 05/01/60 (a) | 950,000 | 941,298 |
Carlisle Cos., Inc. | ||
3.50%, 12/01/24 (a) | 300,000 | 289,941 |
2.75%, 03/01/30 (a) | 250,000 | 213,322 |
Carrier Global Corp. | ||
2.24%, 02/15/25 (a) | 450,000 | 425,970 |
2.49%, 02/15/27 (a) | 89,000 | 81,202 |
2.72%, 02/15/30 (a) | 600,000 | 517,440 |
2.70%, 02/15/31 (a)(c) | 250,000 | 211,777 |
SECURITY RATE, MATURITY DATE | FACE AMOUNT ($) | VALUE ($) |
3.38%, 04/05/40 (a) | 400,000 | 307,548 |
3.58%, 04/05/50 (a)(c) | 550,000 | 407,770 |
Caterpillar Financial Services Corp. | ||
0.60%, 09/13/24 | 200,000 | 188,906 |
2.15%, 11/08/24 | 450,000 | 431,397 |
3.25%, 12/01/24 | 100,000 | 97,118 |
4.90%, 01/17/25 | 200,000 | 199,204 |
3.40%, 05/13/25 | 400,000 | 387,812 |
1.45%, 05/15/25 | 300,000 | 280,107 |
0.80%, 11/13/25 | 500,000 | 453,390 |
4.80%, 01/06/26 | 150,000 | 149,724 |
0.90%, 03/02/26 | 300,000 | 270,156 |
1.70%, 01/08/27 | 400,000 | 362,456 |
1.10%, 09/14/27 | 700,000 | 606,655 |
Caterpillar, Inc. | ||
2.60%, 04/09/30 (a) | 250,000 | 222,320 |
6.05%, 08/15/36 | 250,000 | 275,562 |
5.20%, 05/27/41 | 275,000 | 286,973 |
3.80%, 08/15/42 | 350,000 | 307,314 |
4.30%, 05/15/44 (a) | 175,000 | 164,145 |
3.25%, 09/19/49 (a) | 325,000 | 256,188 |
3.25%, 04/09/50 (a) | 450,000 | 355,468 |
4.75%, 05/15/64 (a) | 150,000 | 143,223 |
CNH Industrial Capital LLC | ||
3.95%, 05/23/25 | 150,000 | 145,299 |
1.88%, 01/15/26 (a) | 200,000 | 182,904 |
1.45%, 07/15/26 (a) | 150,000 | 132,992 |
CNH Industrial NV | ||
3.85%, 11/15/27 (a) | 250,000 | 235,235 |
Deere & Co. | ||
2.75%, 04/15/25 (a) | 500,000 | 480,905 |
5.38%, 10/16/29 | 250,000 | 258,275 |
3.10%, 04/15/30 (a) | 350,000 | 320,344 |
7.13%, 03/03/31 | 150,000 | 173,891 |
3.90%, 06/09/42 (a) | 250,000 | 227,200 |
2.88%, 09/07/49 (a) | 200,000 | 150,914 |
3.75%, 04/15/50 (a) | 300,000 | 266,883 |
Dover Corp. | ||
2.95%, 11/04/29 (a) | 150,000 | 132,417 |
5.38%, 10/15/35 | 100,000 | 102,342 |
5.38%, 03/01/41 (a) | 200,000 | 197,500 |
Eagle Materials, Inc. | ||
2.50%, 07/01/31 (a) | 250,000 | 204,577 |
Eaton Corp. | ||
3.10%, 09/15/27 (a) | 200,000 | 187,912 |
4.00%, 11/02/32 | 300,000 | 282,750 |
4.15%, 03/15/33 (a) | 300,000 | 285,357 |
4.15%, 11/02/42 | 300,000 | 267,240 |
3.92%, 09/15/47 (a) | 100,000 | 85,453 |
4.70%, 08/23/52 (a) | 200,000 | 192,082 |
Emerson Electric Co. | ||
0.88%, 10/15/26 (a) | 400,000 | 353,152 |
1.80%, 10/15/27 (a) | 250,000 | 221,970 |
1.95%, 10/15/30 (a) | 250,000 | 207,395 |
2.20%, 12/21/31 (a) | 250,000 | 207,277 |
5.25%, 11/15/39 | 100,000 | 101,814 |
2.75%, 10/15/50 (a) | 150,000 | 100,184 |
2.80%, 12/21/51 (a) | 300,000 | 204,876 |
Flowserve Corp. | ||
3.50%, 10/01/30 (a) | 300,000 | 257,841 |
Fortive Corp. | ||
3.15%, 06/15/26 (a) | 250,000 | 236,822 |
4.30%, 06/15/46 (a) | 200,000 | 159,898 |
SECURITY RATE, MATURITY DATE | FACE AMOUNT ($) | VALUE ($) |
Fortune Brands Home & Security, Inc. | ||
4.00%, 06/15/25 (a) | 150,000 | 145,256 |
3.25%, 09/15/29 (a) | 350,000 | 306,589 |
4.00%, 03/25/32 (a) | 100,000 | 89,241 |
GE Capital Funding LLC | ||
4.55%, 05/15/32 (a) | 200,000 | 194,206 |
GE Capital International Funding Co. | ||
4.42%, 11/15/35 | 250,000 | 237,342 |
General Dynamics Corp. | ||
2.38%, 11/15/24 (a) | 100,000 | 95,944 |
3.25%, 04/01/25 (a) | 250,000 | 242,110 |
3.50%, 05/15/25 (a) | 150,000 | 145,997 |
2.13%, 08/15/26 (a) | 150,000 | 138,386 |
3.50%, 04/01/27 (a) | 250,000 | 239,042 |
2.63%, 11/15/27 (a) | 150,000 | 137,441 |
3.75%, 05/15/28 (a) | 400,000 | 383,696 |
3.63%, 04/01/30 (a) | 300,000 | 282,867 |
2.25%, 06/01/31 (a) | 200,000 | 168,564 |
4.25%, 04/01/40 (a) | 300,000 | 276,711 |
3.60%, 11/15/42 (a) | 150,000 | 125,415 |
4.25%, 04/01/50 (a) | 175,000 | 161,156 |
General Electric Co. | ||
6.75%, 03/15/32 | 500,000 | 564,635 |
5.88%, 01/14/38 | 100,000 | 107,664 |
6.88%, 01/10/39 | 100,000 | 119,855 |
4.35%, 05/01/50 (a) | 225,000 | 195,651 |
Hexcel Corp. | ||
4.95%, 08/15/25 (a) | 100,000 | 98,431 |
4.20%, 02/15/27 (a) | 150,000 | 142,157 |
Honeywell International, Inc. | ||
2.30%, 08/15/24 (a) | 250,000 | 241,807 |
4.85%, 11/01/24 | 50,000 | 49,728 |
1.35%, 06/01/25 (a) | 400,000 | 373,860 |
2.50%, 11/01/26 (a) | 450,000 | 420,457 |
1.10%, 03/01/27 (a) | 250,000 | 220,710 |
4.25%, 01/15/29 (a) | 400,000 | 389,640 |
2.70%, 08/15/29 (a) | 250,000 | 222,952 |
1.95%, 06/01/30 (a) | 300,000 | 252,678 |
1.75%, 09/01/31 (a) | 450,000 | 361,827 |
5.00%, 02/15/33 (a) | 350,000 | 357,059 |
5.70%, 03/15/36 | 200,000 | 212,966 |
5.70%, 03/15/37 | 200,000 | 213,902 |
3.81%, 11/21/47 (a) | 300,000 | 256,662 |
2.80%, 06/01/50 (a) | 250,000 | 186,428 |
Hubbell, Inc. | ||
3.35%, 03/01/26 (a) | 50,000 | 47,637 |
3.15%, 08/15/27 (a) | 100,000 | 92,625 |
3.50%, 02/15/28 (a) | 150,000 | 140,796 |
2.30%, 03/15/31 (a) | 150,000 | 123,857 |
Huntington Ingalls Industries, Inc. | ||
3.84%, 05/01/25 (a) | 100,000 | 96,326 |
3.48%, 12/01/27 (a) | 190,000 | 174,532 |
2.04%, 08/16/28 (a) | 100,000 | 84,284 |
4.20%, 05/01/30 (a) | 250,000 | 232,160 |
IDEX Corp. | ||
3.00%, 05/01/30 (a) | 300,000 | 263,976 |
Illinois Tool Works, Inc. | ||
2.65%, 11/15/26 (a) | 300,000 | 281,061 |
4.88%, 09/15/41 (a) | 150,000 | 149,157 |
3.90%, 09/01/42 (a) | 350,000 | 311,437 |
John Deere Capital Corp. | ||
4.55%, 10/11/24 | 200,000 | 198,256 |
2.05%, 01/09/25 | 250,000 | 238,392 |
1.25%, 01/10/25 | 300,000 | 283,017 |
5.15%, 03/03/25 | 150,000 | 150,288 |
SECURITY RATE, MATURITY DATE | FACE AMOUNT ($) | VALUE ($) |
2.13%, 03/07/25 | 250,000 | 237,940 |
3.45%, 03/13/25 | 75,000 | 72,902 |
3.40%, 06/06/25 | 250,000 | 242,275 |
4.05%, 09/08/25 | 225,000 | 220,360 |
3.40%, 09/11/25 | 200,000 | 192,680 |
4.80%, 01/09/26 | 350,000 | 349,058 |
0.70%, 01/15/26 | 200,000 | 180,044 |
2.65%, 06/10/26 | 200,000 | 188,654 |
1.05%, 06/17/26 | 350,000 | 314,776 |
2.25%, 09/14/26 | 400,000 | 368,848 |
1.75%, 03/09/27 | 150,000 | 135,140 |
2.80%, 09/08/27 | 350,000 | 324,334 |
4.15%, 09/15/27 | 250,000 | 244,380 |
3.05%, 01/06/28 | 50,000 | 46,977 |
4.75%, 01/20/28 | 325,000 | 324,915 |
3.45%, 03/07/29 | 200,000 | 187,220 |
2.80%, 07/18/29 | 400,000 | 359,184 |
2.45%, 01/09/30 | 200,000 | 175,728 |
4.70%, 06/10/30 | 400,000 | 397,636 |
2.00%, 06/17/31 | 200,000 | 165,010 |
Johnson Controls International plc | ||
3.63%, 07/02/24 (a) | 150,000 | 147,020 |
3.90%, 02/14/26 (a) | 183,000 | 176,095 |
1.75%, 09/15/30 (a) | 150,000 | 121,341 |
6.00%, 01/15/36 | 282,000 | 292,936 |
4.63%, 07/02/44 (a) | 200,000 | 179,376 |
5.13%, 09/14/45 (a) | 174,000 | 166,285 |
4.50%, 02/15/47 (a) | 50,000 | 43,830 |
Kennametal, Inc. | ||
4.63%, 06/15/28 (a) | 200,000 | 190,606 |
L3Harris Technologies, Inc. | ||
3.83%, 04/27/25 (a) | 200,000 | 194,086 |
3.85%, 12/15/26 (a) | 150,000 | 143,309 |
4.40%, 06/15/28 (a) | 545,000 | 525,469 |
2.90%, 12/15/29 (a) | 150,000 | 130,133 |
1.80%, 01/15/31 (a) | 200,000 | 158,756 |
4.85%, 04/27/35 (a) | 100,000 | 96,162 |
6.15%, 12/15/40 | 50,000 | 52,482 |
5.05%, 04/27/45 (a) | 100,000 | 92,574 |
Lafarge S.A. | ||
7.13%, 07/15/36 | 150,000 | 163,922 |
Leggett & Platt, Inc. | ||
3.50%, 11/15/27 (a) | 150,000 | 138,702 |
4.40%, 03/15/29 (a) | 226,000 | 215,378 |
3.50%, 11/15/51 (a) | 150,000 | 108,930 |
Legrand France S.A. | ||
8.50%, 02/15/25 | 150,000 | 157,095 |
Lennox International, Inc. | ||
1.35%, 08/01/25 (a) | 100,000 | 91,368 |
1.70%, 08/01/27 (a) | 130,000 | 113,073 |
Lockheed Martin Corp. | ||
3.55%, 01/15/26 (a) | 225,000 | 218,603 |
5.10%, 11/15/27 (a) | 200,000 | 203,808 |
1.85%, 06/15/30 (a) | 150,000 | 125,276 |
3.90%, 06/15/32 (a) | 300,000 | 283,065 |
5.25%, 01/15/33 (a) | 250,000 | 259,705 |
4.75%, 02/15/34 (a) | 500,000 | 499,065 |
3.60%, 03/01/35 (a) | 100,000 | 89,550 |
4.50%, 05/15/36 (a) | 100,000 | 96,630 |
6.15%, 09/01/36 | 200,000 | 221,976 |
5.72%, 06/01/40 | 100,000 | 108,041 |
4.07%, 12/15/42 | 525,000 | 468,620 |
3.80%, 03/01/45 (a) | 300,000 | 253,587 |
4.70%, 05/15/46 (a) | 350,000 | 339,220 |
2.80%, 06/15/50 (a) | 250,000 | 177,533 |
4.09%, 09/15/52 (a) | 400,000 | 352,652 |
SECURITY RATE, MATURITY DATE | FACE AMOUNT ($) | VALUE ($) |
4.15%, 06/15/53 (a) | 250,000 | 220,425 |
5.70%, 11/15/54 (a) | 250,000 | 278,007 |
4.30%, 06/15/62 (a) | 200,000 | 177,840 |
5.90%, 11/15/63 (a) | 200,000 | 228,204 |
Martin Marietta Materials, Inc. | ||
4.25%, 07/02/24 (a) | 100,000 | 99,003 |
3.45%, 06/01/27 (a) | 25,000 | 23,582 |
3.50%, 12/15/27 (a) | 200,000 | 186,850 |
2.50%, 03/15/30 (a) | 200,000 | 169,466 |
2.40%, 07/15/31 (a) | 300,000 | 245,454 |
4.25%, 12/15/47 (a) | 300,000 | 250,305 |
Masco Corp. | ||
2.00%, 10/01/30 (a) | 350,000 | 276,542 |
4.50%, 05/15/47 (a) | 225,000 | 182,430 |
Mohawk Industries, Inc. | ||
3.63%, 05/15/30 (a) | 150,000 | 135,906 |
Northrop Grumman Corp. | ||
2.93%, 01/15/25 (a) | 450,000 | 432,864 |
3.20%, 02/01/27 (a) | 300,000 | 283,446 |
3.25%, 01/15/28 (a) | 450,000 | 421,326 |
4.40%, 05/01/30 (a) | 200,000 | 195,294 |
4.70%, 03/15/33 (a) | 250,000 | 245,627 |
5.15%, 05/01/40 (a) | 100,000 | 98,761 |
5.05%, 11/15/40 | 100,000 | 97,351 |
4.75%, 06/01/43 | 250,000 | 234,152 |
3.85%, 04/15/45 (a) | 200,000 | 163,654 |
4.03%, 10/15/47 (a) | 650,000 | 559,708 |
5.25%, 05/01/50 (a) | 300,000 | 306,549 |
4.95%, 03/15/53 (a) | 250,000 | 244,357 |
nVent Finance Sarl | ||
4.55%, 04/15/28 (a) | 150,000 | 140,879 |
2.75%, 11/15/31 (a) | 100,000 | 80,096 |
5.65%, 05/15/33 (a) | 150,000 | 148,494 |
Oshkosh Corp. | ||
4.60%, 05/15/28 (a) | 125,000 | 120,645 |
3.10%, 03/01/30 (a) | 150,000 | 131,664 |
Otis Worldwide Corp. | ||
2.06%, 04/05/25 (a) | 300,000 | 282,894 |
2.29%, 04/05/27 (a) | 200,000 | 181,892 |
2.57%, 02/15/30 (a) | 450,000 | 388,287 |
3.11%, 02/15/40 (a) | 150,000 | 116,112 |
3.36%, 02/15/50 (a) | 200,000 | 146,864 |
Owens Corning | ||
3.40%, 08/15/26 (a) | 200,000 | 189,346 |
3.95%, 08/15/29 (a) | 150,000 | 139,578 |
3.88%, 06/01/30 (a) | 100,000 | 91,673 |
7.00%, 12/01/36 | 145,000 | 158,961 |
4.30%, 07/15/47 (a) | 100,000 | 82,226 |
4.40%, 01/30/48 (a) | 150,000 | 124,512 |
Parker-Hannifin Corp. | ||
3.25%, 03/01/27 (a) | 100,000 | 94,153 |
4.25%, 09/15/27 (a) | 400,000 | 388,340 |
3.25%, 06/14/29 (a) | 370,000 | 337,000 |
4.20%, 11/21/34 (a) | 150,000 | 137,955 |
6.25%, 05/15/38 | 150,000 | 161,891 |
4.45%, 11/21/44 (a) | 150,000 | 134,247 |
4.10%, 03/01/47 (a) | 150,000 | 128,064 |
4.00%, 06/14/49 (a) | 250,000 | 208,490 |
Pentair Finance Sarl | ||
4.50%, 07/01/29 (a) | 250,000 | 235,762 |
Precision Castparts Corp. | ||
3.90%, 01/15/43 (a) | 350,000 | 300,471 |
4.38%, 06/15/45 (a) | 139,000 | 124,762 |
SECURITY RATE, MATURITY DATE | FACE AMOUNT ($) | VALUE ($) |
Raytheon Technologies Corp. | ||
3.95%, 08/16/25 (a) | 400,000 | 392,044 |
5.00%, 02/27/26 (a) | 250,000 | 249,905 |
2.65%, 11/01/26 (a) | 200,000 | 185,570 |
3.50%, 03/15/27 (a) | 200,000 | 190,282 |
3.13%, 05/04/27 (a) | 350,000 | 327,792 |
7.20%, 08/15/27 | 50,000 | 54,166 |
4.13%, 11/16/28 (a) | 900,000 | 867,636 |
7.50%, 09/15/29 | 150,000 | 169,242 |
2.25%, 07/01/30 (a) | 250,000 | 211,400 |
1.90%, 09/01/31 (a) | 350,000 | 279,842 |
5.15%, 02/27/33 (a) | 350,000 | 355,071 |
5.40%, 05/01/35 | 250,000 | 255,515 |
6.05%, 06/01/36 | 100,000 | 107,533 |
6.13%, 07/15/38 | 200,000 | 215,768 |
4.45%, 11/16/38 (a) | 300,000 | 276,945 |
5.70%, 04/15/40 | 100,000 | 104,039 |
4.88%, 10/15/40 (c) | 350,000 | 334,397 |
4.70%, 12/15/41 | 150,000 | 139,613 |
4.50%, 06/01/42 | 1,000,000 | 922,030 |
4.80%, 12/15/43 (a) | 265,000 | 248,180 |
4.15%, 05/15/45 (a) | 100,000 | 85,493 |
3.75%, 11/01/46 (a) | 375,000 | 303,124 |
4.35%, 04/15/47 (a) | 150,000 | 133,626 |
4.05%, 05/04/47 (a) | 150,000 | 128,076 |
4.63%, 11/16/48 (a) | 350,000 | 327,012 |
3.13%, 07/01/50 (a) | 300,000 | 218,334 |
2.82%, 09/01/51 (a) | 350,000 | 235,518 |
3.03%, 03/15/52 (a) | 200,000 | 140,946 |
5.38%, 02/27/53 (a) | 200,000 | 207,960 |
Regal Rexnord Corp. | ||
6.05%, 02/15/26 (c) | 325,000 | 326,017 |
6.05%, 04/15/28 (a)(c) | 350,000 | 347,956 |
6.30%, 02/15/30 (a)(c) | 300,000 | 299,640 |
6.40%, 04/15/33 (a)(c) | 350,000 | 350,056 |
Republic Services, Inc. | ||
2.50%, 08/15/24 (a) | 350,000 | 337,886 |
0.88%, 11/15/25 (a) | 200,000 | 180,232 |
2.90%, 07/01/26 (a) | 200,000 | 188,746 |
3.38%, 11/15/27 (a) | 300,000 | 282,549 |
3.95%, 05/15/28 (a) | 75,000 | 72,207 |
4.88%, 04/01/29 (a) | 150,000 | 149,955 |
2.30%, 03/01/30 (a) | 300,000 | 256,821 |
1.45%, 02/15/31 (a) | 250,000 | 196,495 |
1.75%, 02/15/32 (a) | 250,000 | 196,460 |
6.20%, 03/01/40 | 100,000 | 109,373 |
5.70%, 05/15/41 (a) | 75,000 | 78,411 |
3.05%, 03/01/50 (a) | 150,000 | 107,420 |
Rockwell Automation, Inc. | ||
2.88%, 03/01/25 (a) | 100,000 | 96,306 |
3.50%, 03/01/29 (a) | 100,000 | 94,237 |
1.75%, 08/15/31 (a) | 150,000 | 121,145 |
4.20%, 03/01/49 (a) | 100,000 | 89,790 |
2.80%, 08/15/61 (a) | 150,000 | 98,400 |
Snap-on, Inc. | ||
4.10%, 03/01/48 (a) | 140,000 | 123,305 |
3.10%, 05/01/50 (a) | 200,000 | 148,646 |
Sonoco Products Co. | ||
1.80%, 02/01/25 (a) | 125,000 | 117,543 |
3.13%, 05/01/30 (a) | 300,000 | 262,026 |
2.85%, 02/01/32 (a) | 100,000 | 83,434 |
5.75%, 11/01/40 (a) | 180,000 | 179,271 |
Stanley Black & Decker, Inc. | ||
2.30%, 02/24/25 (a) | 150,000 | 142,188 |
3.40%, 03/01/26 (a) | 150,000 | 142,434 |
4.25%, 11/15/28 (a) | 150,000 | 142,976 |
SECURITY RATE, MATURITY DATE | FACE AMOUNT ($) | VALUE ($) |
2.30%, 03/15/30 (a) | 250,000 | 207,000 |
5.20%, 09/01/40 | 109,000 | 102,101 |
4.85%, 11/15/48 (a) | 225,000 | 195,134 |
2.75%, 11/15/50 (a) | 250,000 | 149,218 |
4.00%, 03/15/60 (a)(b) | 250,000 | 191,200 |
Teledyne Technologies, Inc. | ||
1.60%, 04/01/26 (a) | 250,000 | 226,312 |
2.25%, 04/01/28 (a) | 200,000 | 174,700 |
2.75%, 04/01/31 (a) | 300,000 | 250,932 |
Textron, Inc. | ||
3.88%, 03/01/25 (a) | 100,000 | 97,207 |
4.00%, 03/15/26 (a) | 100,000 | 96,698 |
3.65%, 03/15/27 (a) | 150,000 | 141,071 |
3.38%, 03/01/28 (a) | 100,000 | 91,429 |
3.90%, 09/17/29 (a) | 150,000 | 138,042 |
2.45%, 03/15/31 (a) | 150,000 | 123,749 |
Timken Co. | ||
3.88%, 09/01/24 (a) | 150,000 | 146,645 |
4.50%, 12/15/28 (a) | 150,000 | 143,186 |
Trane Technologies Financing Ltd. | ||
5.25%, 03/03/33 (a) | 200,000 | 202,746 |
Trane Technologies Global Holding Co., Ltd. | ||
3.75%, 08/21/28 (a) | 300,000 | 284,271 |
5.75%, 06/15/43 | 200,000 | 205,484 |
4.30%, 02/21/48 (a) | 150,000 | 129,722 |
Trane Technologies Luxembourg Finance S.A. | ||
3.80%, 03/21/29 (a) | 200,000 | 188,640 |
4.65%, 11/01/44 (a) | 100,000 | 89,352 |
Valmont Industries, Inc. | ||
5.00%, 10/01/44 (a) | 130,000 | 114,340 |
5.25%, 10/01/54 (a) | 200,000 | 178,608 |
Vontier Corp. | ||
1.80%, 04/01/26 (a) | 150,000 | 133,557 |
2.40%, 04/01/28 (a) | 150,000 | 125,499 |
2.95%, 04/01/31 (a) | 200,000 | 160,126 |
Vulcan Materials Co. | ||
3.90%, 04/01/27 (a) | 150,000 | 144,365 |
3.50%, 06/01/30 (a) | 250,000 | 226,105 |
4.50%, 06/15/47 (a) | 250,000 | 218,370 |
4.70%, 03/01/48 (a) | 150,000 | 134,384 |
Waste Connections, Inc. | ||
4.25%, 12/01/28 (a) | 200,000 | 192,622 |
3.50%, 05/01/29 (a) | 209,000 | 192,652 |
2.60%, 02/01/30 (a) | 250,000 | 216,797 |
2.20%, 01/15/32 (a) | 350,000 | 283,430 |
3.20%, 06/01/32 (a) | 100,000 | 87,274 |
3.05%, 04/01/50 (a) | 225,000 | 156,782 |
2.95%, 01/15/52 (a) | 300,000 | 205,995 |
Waste Management, Inc. | ||
0.75%, 11/15/25 (a) | 300,000 | 270,870 |
3.15%, 11/15/27 (a) | 300,000 | 281,847 |
1.15%, 03/15/28 (a) | 250,000 | 213,337 |
4.63%, 02/15/30 (a) | 250,000 | 246,460 |
1.50%, 03/15/31 (a) | 200,000 | 159,530 |
4.15%, 04/15/32 (a) | 100,000 | 95,343 |
4.10%, 03/01/45 (a) | 250,000 | 218,052 |
4.15%, 07/15/49 (a) | 250,000 | 220,805 |
2.50%, 11/15/50 (a) | 250,000 | 160,630 |
Westinghouse Air Brake Technologies Corp. | ||
3.20%, 06/15/25 (a) | 200,000 | 190,110 |
3.45%, 11/15/26 (a) | 150,000 | 140,564 |
4.95%, 09/15/28 (a)(g) | 300,000 | 290,985 |
SECURITY RATE, MATURITY DATE | FACE AMOUNT ($) | VALUE ($) |
WW Grainger, Inc. | ||
1.85%, 02/15/25 (a) | 300,000 | 284,841 |
4.60%, 06/15/45 (a) | 150,000 | 142,301 |
4.20%, 05/15/47 (a) | 225,000 | 197,384 |
Xylem, Inc. | ||
3.25%, 11/01/26 (a) | 160,000 | 150,696 |
1.95%, 01/30/28 (a) | 100,000 | 87,902 |
2.25%, 01/30/31 (a) | 150,000 | 124,733 |
4.38%, 11/01/46 (a) | 145,000 | 123,056 |
88,885,586 | ||
Communications 2.2% | ||
Activision Blizzard, Inc. | ||
3.40%, 09/15/26 (a) | 250,000 | 238,613 |
3.40%, 06/15/27 (a) | 100,000 | 94,630 |
1.35%, 09/15/30 (a) | 225,000 | 180,257 |
4.50%, 06/15/47 (a) | 78,000 | 72,004 |
2.50%, 09/15/50 (a) | 400,000 | 257,340 |
America Movil S.A.B. de C.V. | ||
3.63%, 04/22/29 (a) | 300,000 | 275,277 |
2.88%, 05/07/30 (a) | 350,000 | 304,815 |
6.38%, 03/01/35 | 350,000 | 383,278 |
6.13%, 11/15/37 | 100,000 | 106,937 |
6.13%, 03/30/40 | 625,000 | 666,456 |
4.38%, 07/16/42 | 300,000 | 264,699 |
4.38%, 04/22/49 (a) | 350,000 | 305,441 |
American Tower Corp. | ||
2.95%, 01/15/25 (a) | 280,000 | 267,879 |
2.40%, 03/15/25 (a) | 350,000 | 330,085 |
4.00%, 06/01/25 (a) | 100,000 | 96,679 |
4.40%, 02/15/26 (a) | 100,000 | 97,302 |
1.60%, 04/15/26 (a) | 350,000 | 314,177 |
3.38%, 10/15/26 (a) | 425,000 | 397,719 |
2.75%, 01/15/27 (a) | 65,000 | 59,257 |
3.13%, 01/15/27 (a) | 150,000 | 138,407 |
3.65%, 03/15/27 (a) | 250,000 | 234,375 |
3.55%, 07/15/27 (a) | 250,000 | 232,173 |
3.60%, 01/15/28 (a) | 300,000 | 277,251 |
1.50%, 01/31/28 (a) | 250,000 | 210,388 |
3.95%, 03/15/29 (a) | 200,000 | 184,866 |
3.80%, 08/15/29 (a) | 325,000 | 297,723 |
2.90%, 01/15/30 (a) | 150,000 | 129,777 |
1.88%, 10/15/30 (a) | 250,000 | 197,808 |
2.30%, 09/15/31 (a) | 200,000 | 159,558 |
4.05%, 03/15/32 (a) | 250,000 | 227,665 |
5.65%, 03/15/33 (a) | 200,000 | 203,882 |
5.55%, 07/15/33 (a) | 500,000 | 504,060 |
3.70%, 10/15/49 (a) | 400,000 | 288,404 |
3.10%, 06/15/50 (a) | 325,000 | 214,052 |
2.95%, 01/15/51 (a) | 275,000 | 174,537 |
AT&T, Inc. | ||
3.88%, 01/15/26 (a) | 100,000 | 96,808 |
5.54%, 02/20/26 (a) | 300,000 | 300,150 |
1.70%, 03/25/26 (a) | 900,000 | 820,314 |
2.95%, 07/15/26 (a) | 200,000 | 188,328 |
3.80%, 02/15/27 (a) | 250,000 | 239,173 |
4.25%, 03/01/27 (a) | 400,000 | 389,196 |
2.30%, 06/01/27 (a) | 700,000 | 630,546 |
1.65%, 02/01/28 (a) | 650,000 | 559,448 |
4.10%, 02/15/28 (a) | 350,000 | 335,723 |
4.35%, 03/01/29 (a) | 950,000 | 912,750 |
4.30%, 02/15/30 (a) | 800,000 | 760,240 |
2.75%, 06/01/31 (a) | 900,000 | 760,221 |
2.25%, 02/01/32 (a) | 700,000 | 556,731 |
2.55%, 12/01/33 (a) | 1,181,000 | 925,739 |
5.40%, 02/15/34 (a) | 750,000 | 752,415 |
SECURITY RATE, MATURITY DATE | FACE AMOUNT ($) | VALUE ($) |
4.50%, 05/15/35 (a) | 800,000 | 736,136 |
5.25%, 03/01/37 (a) | 300,000 | 293,385 |
4.90%, 08/15/37 (a) | 229,000 | 215,384 |
4.85%, 03/01/39 (a) | 300,000 | 276,939 |
5.35%, 09/01/40 | 250,000 | 243,723 |
3.50%, 06/01/41 (a) | 700,000 | 538,594 |
5.55%, 08/15/41 | 175,000 | 173,534 |
4.30%, 12/15/42 (a) | 450,000 | 382,671 |
3.10%, 02/01/43 (a) | 300,000 | 216,393 |
4.65%, 06/01/44 (a) | 200,000 | 174,744 |
4.35%, 06/15/45 (a) | 350,000 | 293,566 |
4.75%, 05/15/46 (a) | 550,000 | 486,260 |
5.15%, 11/15/46 (a) | 275,000 | 257,084 |
5.65%, 02/15/47 (a) | 250,000 | 252,860 |
5.45%, 03/01/47 (a) | 128,000 | 125,126 |
4.50%, 03/09/48 (a) | 500,000 | 423,465 |
4.55%, 03/09/49 (a) | 309,000 | 263,262 |
5.15%, 02/15/50 (a) | 200,000 | 189,026 |
3.65%, 06/01/51 (a) | 875,000 | 643,781 |
3.30%, 02/01/52 (a) | 275,000 | 193,611 |
3.50%, 09/15/53 (a) | 2,000,000 | 1,418,000 |
3.55%, 09/15/55 (a) | 2,100,000 | 1,472,205 |
3.80%, 12/01/57 (a) | 1,675,000 | 1,213,336 |
3.65%, 09/15/59 (a) | 1,800,000 | 1,254,420 |
3.85%, 06/01/60 (a) | 300,000 | 218,466 |
3.50%, 02/01/61 (a) | 100,000 | 69,697 |
Bell Canada | ||
4.46%, 04/01/48 (a) | 500,000 | 434,465 |
4.30%, 07/29/49 (a) | 50,000 | 42,280 |
3.20%, 02/15/52 (a) | 300,000 | 208,026 |
3.65%, 08/15/52 (a) | 250,000 | 189,868 |
Bell Telephone Co. of Canada or Bell Canada | ||
5.10%, 05/11/33 (a) | 300,000 | 296,640 |
British Telecommunications PLC | ||
5.13%, 12/04/28 (a) | 600,000 | 589,572 |
9.63%, 12/15/30 (g) | 350,000 | 430,101 |
Charter Communications Operating LLC/Charter Communications Operating Capital | ||
4.91%, 07/23/25 (a) | 1,200,000 | 1,177,512 |
3.75%, 02/15/28 (a) | 375,000 | 344,917 |
4.20%, 03/15/28 (a) | 275,000 | 258,478 |
2.25%, 01/15/29 (a) | 200,000 | 166,664 |
5.05%, 03/30/29 (a) | 400,000 | 381,664 |
2.80%, 04/01/31 (a) | 550,000 | 443,976 |
2.30%, 02/01/32 (a) | 300,000 | 227,208 |
4.40%, 04/01/33 (a) | 150,000 | 132,011 |
6.38%, 10/23/35 (a) | 600,000 | 586,932 |
5.38%, 04/01/38 (a) | 350,000 | 299,064 |
3.50%, 06/01/41 (a) | 300,000 | 203,295 |
3.50%, 03/01/42 (a) | 400,000 | 267,772 |
6.48%, 10/23/45 (a) | 1,000,000 | 942,630 |
5.38%, 05/01/47 (a) | 700,000 | 579,355 |
5.75%, 04/01/48 (a) | 700,000 | 600,782 |
5.13%, 07/01/49 (a) | 400,000 | 314,956 |
4.80%, 03/01/50 (a) | 800,000 | 603,344 |
3.70%, 04/01/51 (a) | 550,000 | 350,548 |
3.90%, 06/01/52 (a) | 525,000 | 343,518 |
5.25%, 04/01/53 (a) | 400,000 | 323,640 |
6.83%, 10/23/55 (a) | 150,000 | 141,977 |
3.85%, 04/01/61 (a) | 550,000 | 335,681 |
4.40%, 12/01/61 (a) | 425,000 | 286,879 |
3.95%, 06/30/62 (a) | 325,000 | 201,240 |
5.50%, 04/01/63 (a) | 300,000 | 241,620 |
Comcast Corp. | ||
3.38%, 08/15/25 (a) | 400,000 | 386,352 |
3.95%, 10/15/25 (a) | 900,000 | 877,581 |
5.25%, 11/07/25 | 500,000 | 502,945 |
SECURITY RATE, MATURITY DATE | FACE AMOUNT ($) | VALUE ($) |
3.15%, 03/01/26 (a) | 500,000 | 479,355 |
2.35%, 01/15/27 (a) | 450,000 | 413,820 |
3.30%, 02/01/27 (a) | 380,000 | 360,966 |
3.30%, 04/01/27 (a) | 25,000 | 23,653 |
5.35%, 11/15/27 (a) | 200,000 | 204,072 |
3.15%, 02/15/28 (a) | 500,000 | 467,260 |
3.55%, 05/01/28 (a) | 292,000 | 276,781 |
4.15%, 10/15/28 (a) | 1,150,000 | 1,115,569 |
2.65%, 02/01/30 (a) | 675,000 | 591,671 |
3.40%, 04/01/30 (a) | 500,000 | 459,950 |
4.25%, 10/15/30 (a) | 400,000 | 385,792 |
1.95%, 01/15/31 (a) | 500,000 | 409,540 |
1.50%, 02/15/31 (a) | 500,000 | 398,225 |
5.50%, 11/15/32 (a) | 300,000 | 312,003 |
4.25%, 01/15/33 | 500,000 | 476,205 |
7.05%, 03/15/33 | 250,000 | 289,110 |
4.20%, 08/15/34 (a) | 350,000 | 326,497 |
5.65%, 06/15/35 | 300,000 | 315,342 |
4.40%, 08/15/35 (a) | 230,000 | 217,279 |
6.50%, 11/15/35 | 150,000 | 168,972 |
3.20%, 07/15/36 (a) | 375,000 | 309,082 |
3.90%, 03/01/38 (a) | 350,000 | 304,724 |
4.60%, 10/15/38 (a) | 300,000 | 280,254 |
3.25%, 11/01/39 (a) | 400,000 | 318,112 |
3.75%, 04/01/40 (a) | 450,000 | 379,773 |
4.65%, 07/15/42 | 150,000 | 138,738 |
4.75%, 03/01/44 | 200,000 | 185,822 |
4.60%, 08/15/45 (a) | 250,000 | 227,505 |
3.40%, 07/15/46 (a) | 400,000 | 304,068 |
4.00%, 08/15/47 (a) | 266,000 | 222,286 |
3.97%, 11/01/47 (a) | 598,000 | 498,104 |
4.00%, 03/01/48 (a) | 300,000 | 251,193 |
4.70%, 10/15/48 (a) | 550,000 | 518,314 |
4.00%, 11/01/49 (a) | 600,000 | 499,212 |
3.45%, 02/01/50 (a) | 550,000 | 420,552 |
2.80%, 01/15/51 (a) | 550,000 | 364,160 |
2.89%, 11/01/51 (a) | 1,433,000 | 962,890 |
2.45%, 08/15/52 (a) | 500,000 | 306,870 |
4.05%, 11/01/52 (a) | 278,000 | 231,735 |
5.35%, 05/15/53 (a) | 500,000 | 508,730 |
2.94%, 11/01/56 (a) | 1,563,000 | 1,019,607 |
4.95%, 10/15/58 (a) | 300,000 | 288,939 |
2.65%, 08/15/62 (a) | 350,000 | 208,915 |
2.99%, 11/01/63 (a) | 1,000,000 | 634,410 |
5.50%, 05/15/64 (a) | 350,000 | 355,103 |
Crown Castle International Corp. | ||
3.20%, 09/01/24 (a) | 250,000 | 242,295 |
1.35%, 07/15/25 (a) | 200,000 | 183,310 |
4.45%, 02/15/26 (a) | 300,000 | 292,818 |
3.70%, 06/15/26 (a) | 250,000 | 237,820 |
1.05%, 07/15/26 (a) | 100,000 | 87,828 |
4.00%, 03/01/27 (a) | 200,000 | 190,616 |
2.90%, 03/15/27 (a) | 250,000 | 229,030 |
3.65%, 09/01/27 (a) | 300,000 | 280,713 |
3.80%, 02/15/28 (a) | 300,000 | 280,488 |
4.30%, 02/15/29 (a) | 150,000 | 141,443 |
3.10%, 11/15/29 (a) | 300,000 | 262,047 |
3.30%, 07/01/30 (a) | 200,000 | 177,392 |
2.25%, 01/15/31 (a) | 350,000 | 286,041 |
2.10%, 04/01/31 (a) | 200,000 | 160,354 |
2.50%, 07/15/31 (a) | 250,000 | 205,955 |
2.90%, 04/01/41 (a) | 300,000 | 210,918 |
4.75%, 05/15/47 (a) | 125,000 | 107,928 |
5.20%, 02/15/49 (a) | 150,000 | 139,371 |
4.00%, 11/15/49 (a) | 50,000 | 38,509 |
4.15%, 07/01/50 (a) | 150,000 | 119,339 |
3.25%, 01/15/51 (a) | 350,000 | 240,111 |
SECURITY RATE, MATURITY DATE | FACE AMOUNT ($) | VALUE ($) |
Crown Castle, Inc. | ||
5.10%, 05/01/33 (a) | 200,000 | 197,260 |
Deutsche Telekom International Finance BV | ||
8.75%, 06/15/30 (g) | 1,100,000 | 1,318,636 |
9.25%, 06/01/32 | 50,000 | 63,662 |
Discovery Communications LLC | ||
3.90%, 11/15/24 (a) | 350,000 | 339,913 |
3.45%, 03/15/25 (a) | 250,000 | 239,360 |
4.90%, 03/11/26 (a) | 100,000 | 98,208 |
3.95%, 03/20/28 (a) | 450,000 | 419,040 |
4.13%, 05/15/29 (a) | 250,000 | 229,515 |
3.63%, 05/15/30 (a) | 250,000 | 219,683 |
5.00%, 09/20/37 (a) | 200,000 | 171,860 |
6.35%, 06/01/40 | 200,000 | 195,858 |
4.88%, 04/01/43 | 125,000 | 101,725 |
5.20%, 09/20/47 (a) | 350,000 | 289,075 |
5.30%, 05/15/49 (a) | 225,000 | 187,954 |
4.65%, 05/15/50 (a) | 250,000 | 190,053 |
4.00%, 09/15/55 (a) | 514,000 | 342,257 |
Electronic Arts, Inc. | ||
4.80%, 03/01/26 (a) | 75,000 | 74,317 |
1.85%, 02/15/31 (a) | 250,000 | 202,230 |
2.95%, 02/15/51 (a) | 250,000 | 169,913 |
Fox Corp. | ||
3.05%, 04/07/25 (a) | 250,000 | 239,593 |
4.71%, 01/25/29 (a) | 600,000 | 584,022 |
3.50%, 04/08/30 (a) | 200,000 | 180,340 |
5.48%, 01/25/39 (a) | 400,000 | 374,720 |
5.58%, 01/25/49 (a) | 350,000 | 328,275 |
Grupo Televisa S.A.B. | ||
8.50%, 03/11/32 | 150,000 | 177,284 |
6.63%, 01/15/40 | 200,000 | 209,386 |
5.00%, 05/13/45 (a) | 250,000 | 216,255 |
6.13%, 01/31/46 (a) | 250,000 | 248,253 |
5.25%, 05/24/49 (a) | 200,000 | 179,906 |
Interpublic Group of Cos., Inc. | ||
4.75%, 03/30/30 (a) | 300,000 | 291,177 |
2.40%, 03/01/31 (a) | 200,000 | 163,164 |
5.40%, 10/01/48 (a) | 200,000 | 187,778 |
Koninklijke KPN N.V. | ||
8.38%, 10/01/30 | 390,000 | 450,965 |
Meta Platforms, Inc. | ||
3.50%, 08/15/27 (a) | 800,000 | 760,264 |
4.60%, 05/15/28 (a) | 400,000 | 396,004 |
4.80%, 05/15/30 (a) | 500,000 | 500,500 |
3.85%, 08/15/32 (a) | 875,000 | 813,627 |
4.95%, 05/15/33 (a) | 450,000 | 449,743 |
4.45%, 08/15/52 (a) | 700,000 | 610,435 |
5.60%, 05/15/53 (a) | 500,000 | 514,040 |
4.65%, 08/15/62 (a) | 425,000 | 373,715 |
5.75%, 05/15/63 (a) | 500,000 | 517,625 |
NBCUniversal Media LLC | ||
4.45%, 01/15/43 | 200,000 | 179,928 |
Netflix, Inc. | ||
5.88%, 02/15/25 | 250,000 | 251,178 |
4.38%, 11/15/26 | 250,000 | 244,635 |
4.88%, 04/15/28 | 450,000 | 445,527 |
5.88%, 11/15/28 | 500,000 | 518,890 |
6.38%, 05/15/29 | 250,000 | 264,872 |
Omnicom Group, Inc. | ||
2.45%, 04/30/30 (a) | 200,000 | 168,154 |
4.20%, 06/01/30 (a) | 200,000 | 187,686 |
Omnicom Group, Inc./Omnicom Capital, Inc. | ||
3.65%, 11/01/24 (a) | 250,000 | 243,160 |
3.60%, 04/15/26 (a) | 500,000 | 480,700 |
SECURITY RATE, MATURITY DATE | FACE AMOUNT ($) | VALUE ($) |
Orange S.A. | ||
9.00%, 03/01/31 | 800,000 | 984,040 |
5.38%, 01/13/42 | 250,000 | 249,285 |
5.50%, 02/06/44 (a) | 150,000 | 152,561 |
Rogers Communications, Inc. | ||
2.95%, 03/15/25 (a)(c) | 300,000 | 285,324 |
3.63%, 12/15/25 (a) | 270,000 | 255,552 |
2.90%, 11/15/26 (a) | 100,000 | 91,787 |
3.20%, 03/15/27 (a)(c) | 400,000 | 371,940 |
3.80%, 03/15/32 (a)(c) | 500,000 | 437,770 |
7.50%, 08/15/38 | 150,000 | 166,862 |
4.50%, 03/15/42 (a)(c) | 250,000 | 208,078 |
4.50%, 03/15/43 (a) | 200,000 | 166,684 |
5.45%, 10/01/43 (a) | 250,000 | 231,315 |
5.00%, 03/15/44 (a) | 350,000 | 310,856 |
4.30%, 02/15/48 (a) | 150,000 | 117,767 |
4.35%, 05/01/49 (a) | 300,000 | 239,355 |
3.70%, 11/15/49 (a) | 300,000 | 214,080 |
4.55%, 03/15/52 (a)(c) | 450,000 | 364,338 |
Sprint Capital Corp. | ||
6.88%, 11/15/28 | 750,000 | 795,585 |
8.75%, 03/15/32 | 650,000 | 785,947 |
Sprint Corp. | ||
7.63%, 02/15/25 (a) | 400,000 | 408,564 |
7.63%, 03/01/26 (a) | 500,000 | 519,690 |
Take-Two Interactive Software, Inc. | ||
3.55%, 04/14/25 | 100,000 | 96,489 |
5.00%, 03/28/26 | 250,000 | 247,590 |
3.70%, 04/14/27 (a) | 200,000 | 189,628 |
4.00%, 04/14/32 (a) | 150,000 | 137,723 |
TCI Communications, Inc. | ||
7.88%, 02/15/26 | 200,000 | 213,434 |
7.13%, 02/15/28 | 250,000 | 271,705 |
Telefonica Emisiones S.A. | ||
4.10%, 03/08/27 | 350,000 | 336,112 |
7.05%, 06/20/36 | 550,000 | 602,250 |
4.67%, 03/06/38 | 200,000 | 169,828 |
5.21%, 03/08/47 | 700,000 | 609,504 |
4.90%, 03/06/48 | 375,000 | 314,580 |
5.52%, 03/01/49 (a) | 375,000 | 339,015 |
Telefonica Europe BV | ||
8.25%, 09/15/30 | 450,000 | 520,420 |
TELUS Corp. | ||
2.80%, 02/16/27 (a) | 150,000 | 138,807 |
3.70%, 09/15/27 (a) | 200,000 | 188,304 |
3.40%, 05/13/32 (a) | 300,000 | 257,037 |
4.60%, 11/16/48 (a) | 200,000 | 171,964 |
4.30%, 06/15/49 (a) | 175,000 | 142,973 |
Time Warner Cable LLC | ||
6.55%, 05/01/37 | 300,000 | 289,098 |
7.30%, 07/01/38 | 500,000 | 511,130 |
6.75%, 06/15/39 | 375,000 | 360,649 |
5.88%, 11/15/40 (a) | 350,000 | 310,586 |
5.50%, 09/01/41 (a) | 350,000 | 293,419 |
4.50%, 09/15/42 (a) | 375,000 | 280,211 |
Time Warner Entertainment Co. LP | ||
8.38%, 07/15/33 | 300,000 | 330,894 |
T-Mobile USA, Inc. | ||
3.50%, 04/15/25 (a) | 850,000 | 818,082 |
1.50%, 02/15/26 (a) | 350,000 | 316,739 |
2.25%, 02/15/26 (a) | 500,000 | 460,775 |
2.63%, 04/15/26 (a) | 325,000 | 301,590 |
3.75%, 04/15/27 (a) | 1,200,000 | 1,137,216 |
5.38%, 04/15/27 (a) | 200,000 | 199,076 |
4.75%, 02/01/28 (a) | 450,000 | 437,755 |
SECURITY RATE, MATURITY DATE | FACE AMOUNT ($) | VALUE ($) |
2.05%, 02/15/28 (a) | 600,000 | 521,466 |
4.95%, 03/15/28 (a) | 300,000 | 295,794 |
4.80%, 07/15/28 (a) | 250,000 | 245,743 |
2.63%, 02/15/29 (a) | 225,000 | 195,752 |
2.40%, 03/15/29 (a) | 200,000 | 172,044 |
3.38%, 04/15/29 (a) | 800,000 | 720,056 |
3.88%, 04/15/30 (a) | 1,750,000 | 1,614,112 |
2.55%, 02/15/31 (a) | 750,000 | 623,782 |
2.88%, 02/15/31 (a) | 200,000 | 169,736 |
3.50%, 04/15/31 (a) | 800,000 | 705,920 |
2.25%, 11/15/31 (a) | 250,000 | 200,508 |
2.70%, 03/15/32 (a) | 250,000 | 207,315 |
5.20%, 01/15/33 (a) | 250,000 | 248,543 |
5.05%, 07/15/33 (a) | 350,000 | 343,854 |
4.38%, 04/15/40 (a) | 300,000 | 265,944 |
3.00%, 02/15/41 (a) | 600,000 | 438,714 |
4.50%, 04/15/50 (a) | 825,000 | 710,506 |
3.30%, 02/15/51 (a) | 800,000 | 563,352 |
3.40%, 10/15/52 (a) | 800,000 | 572,104 |
5.65%, 01/15/53 (a) | 400,000 | 406,692 |
5.75%, 01/15/54 (a) | 500,000 | 516,565 |
3.60%, 11/15/60 (a) | 500,000 | 351,830 |
5.80%, 09/15/62 (a) | 200,000 | 203,888 |
TWDC Enterprises 18 Corp. | ||
3.15%, 09/17/25 | 200,000 | 192,228 |
3.00%, 02/13/26 | 350,000 | 334,365 |
1.85%, 07/30/26 | 400,000 | 365,408 |
7.00%, 03/01/32 | 200,000 | 229,026 |
4.38%, 08/16/41 | 150,000 | 137,198 |
4.13%, 12/01/41 | 200,000 | 176,376 |
4.13%, 06/01/44 | 350,000 | 307,825 |
3.00%, 07/30/46 | 150,000 | 108,249 |
Verizon Communications, Inc. | ||
3.50%, 11/01/24 (a) | 358,000 | 348,721 |
3.38%, 02/15/25 | 350,000 | 338,306 |
0.85%, 11/20/25 (a) | 400,000 | 361,328 |
1.45%, 03/20/26 (a) | 550,000 | 498,976 |
2.63%, 08/15/26 | 425,000 | 395,505 |
4.13%, 03/16/27 | 700,000 | 680,673 |
3.00%, 03/22/27 (a) | 250,000 | 233,825 |
2.10%, 03/22/28 (a) | 850,000 | 747,107 |
4.33%, 09/21/28 | 1,150,000 | 1,108,910 |
3.88%, 02/08/29 (a) | 325,000 | 305,571 |
4.02%, 12/03/29 (a) | 1,107,000 | 1,034,392 |
3.15%, 03/22/30 (a) | 450,000 | 400,977 |
1.50%, 09/18/30 (a) | 300,000 | 236,973 |
1.68%, 10/30/30 (a) | 418,000 | 331,094 |
7.75%, 12/01/30 | 150,000 | 174,956 |
1.75%, 01/20/31 (a) | 700,000 | 552,321 |
2.55%, 03/21/31 (a) | 1,200,000 | 1,003,716 |
2.36%, 03/15/32 (a) | 1,290,000 | 1,038,760 |
5.05%, 05/09/33 (a) | 300,000 | 296,841 |
4.50%, 08/10/33 | 500,000 | 472,455 |
4.40%, 11/01/34 (a) | 550,000 | 508,101 |
4.27%, 01/15/36 | 700,000 | 633,493 |
5.25%, 03/16/37 | 400,000 | 397,356 |
4.81%, 03/15/39 | 400,000 | 374,684 |
2.65%, 11/20/40 (a) | 900,000 | 627,669 |
3.40%, 03/22/41 (a) | 1,100,000 | 849,783 |
4.75%, 11/01/41 | 50,000 | 46,157 |
3.85%, 11/01/42 (a) | 156,000 | 126,277 |
6.55%, 09/15/43 | 200,000 | 223,410 |
4.13%, 08/15/46 | 350,000 | 289,523 |
4.86%, 08/21/46 | 650,000 | 596,635 |
4.52%, 09/15/48 | 400,000 | 354,880 |
4.00%, 03/22/50 (a) | 350,000 | 284,613 |
2.88%, 11/20/50 (a) | 800,000 | 521,592 |
SECURITY RATE, MATURITY DATE | FACE AMOUNT ($) | VALUE ($) |
3.55%, 03/22/51 (a) | 1,250,000 | 934,375 |
3.88%, 03/01/52 (a) | 250,000 | 196,460 |
5.01%, 08/21/54 | 275,000 | 257,463 |
4.67%, 03/15/55 | 225,000 | 200,810 |
2.99%, 10/30/56 (a) | 1,000,000 | 636,330 |
3.00%, 11/20/60 (a) | 600,000 | 376,248 |
3.70%, 03/22/61 (a) | 1,000,000 | 729,060 |
ViacomCBS, Inc. | ||
4.00%, 01/15/26 (a) | 250,000 | 238,393 |
2.90%, 01/15/27 (a) | 250,000 | 225,155 |
3.38%, 02/15/28 (a) | 150,000 | 133,490 |
3.70%, 06/01/28 (a) | 150,000 | 133,637 |
4.20%, 06/01/29 (a) | 189,000 | 168,764 |
7.88%, 07/30/30 | 225,000 | 237,868 |
4.95%, 01/15/31 (a) | 250,000 | 225,968 |
4.20%, 05/19/32 (a) | 325,000 | 272,577 |
5.50%, 05/15/33 | 200,000 | 184,040 |
6.88%, 04/30/36 | 325,000 | 316,316 |
5.90%, 10/15/40 (a) | 100,000 | 87,396 |
4.85%, 07/01/42 (a) | 325,000 | 242,973 |
4.38%, 03/15/43 | 250,000 | 177,190 |
5.85%, 09/01/43 (a) | 300,000 | 256,404 |
5.25%, 04/01/44 (a) | 200,000 | 152,304 |
4.90%, 08/15/44 (a) | 200,000 | 148,496 |
4.60%, 01/15/45 (a) | 125,000 | 89,168 |
4.95%, 05/19/50 (a) | 300,000 | 225,585 |
Vodafone Group PLC | ||
4.13%, 05/30/25 | 450,000 | 439,362 |
4.38%, 05/30/28 | 300,000 | 293,793 |
7.88%, 02/15/30 | 200,000 | 229,570 |
6.25%, 11/30/32 | 100,000 | 106,592 |
6.15%, 02/27/37 | 430,000 | 450,919 |
5.00%, 05/30/38 | 250,000 | 236,280 |
4.38%, 02/19/43 | 400,000 | 336,316 |
5.25%, 05/30/48 | 450,000 | 424,233 |
4.88%, 06/19/49 | 525,000 | 467,245 |
4.25%, 09/17/50 | 475,000 | 382,009 |
5.13%, 06/19/59 | 175,000 | 156,177 |
5.75%, 02/10/63 (a) | 100,000 | 97,178 |
Walt Disney Co. | ||
1.75%, 08/30/24 (a) | 350,000 | 335,492 |
3.70%, 09/15/24 (a) | 150,000 | 146,985 |
3.35%, 03/24/25 | 500,000 | 484,585 |
3.70%, 10/15/25 (a) | 250,000 | 242,880 |
1.75%, 01/13/26 | 500,000 | 463,225 |
3.38%, 11/15/26 (a) | 200,000 | 190,474 |
3.70%, 03/23/27 | 200,000 | 193,472 |
2.20%, 01/13/28 | 350,000 | 316,816 |
2.00%, 09/01/29 (a) | 375,000 | 319,485 |
3.80%, 03/22/30 | 200,000 | 189,334 |
2.65%, 01/13/31 | 600,000 | 522,768 |
6.55%, 03/15/33 | 100,000 | 111,647 |
6.20%, 12/15/34 | 200,000 | 221,030 |
6.40%, 12/15/35 | 250,000 | 281,497 |
6.15%, 03/01/37 | 100,000 | 108,637 |
6.65%, 11/15/37 | 350,000 | 406,122 |
4.63%, 03/23/40 (a) | 250,000 | 240,820 |
3.50%, 05/13/40 (a) | 550,000 | 454,817 |
6.15%, 02/15/41 | 175,000 | 193,039 |
4.75%, 09/15/44 (a) | 190,000 | 180,513 |
4.95%, 10/15/45 (a) | 135,000 | 130,652 |
7.75%, 12/01/45 | 100,000 | 131,943 |
4.75%, 11/15/46 (a) | 125,000 | 118,055 |
2.75%, 09/01/49 (a) | 500,000 | 339,205 |
4.70%, 03/23/50 (a) | 550,000 | 527,444 |
3.60%, 01/13/51 (a) | 800,000 | 638,576 |
3.80%, 05/13/60 (a) | 475,000 | 382,166 |
SECURITY RATE, MATURITY DATE | FACE AMOUNT ($) | VALUE ($) |
Warnermedia Holdings, Inc. | ||
3.64%, 03/15/25 | 500,000 | 482,395 |
3.76%, 03/15/27 (a) | 1,250,000 | 1,166,850 |
4.05%, 03/15/29 (a) | 450,000 | 411,651 |
4.28%, 03/15/32 (a) | 1,350,000 | 1,198,003 |
5.05%, 03/15/42 (a) | 1,325,000 | 1,112,722 |
5.14%, 03/15/52 (a) | 1,950,000 | 1,591,258 |
5.39%, 03/15/62 (a) | 800,000 | 651,416 |
Weibo Corp. | ||
3.50%, 07/05/24 (a) | 200,000 | 194,276 |
3.38%, 07/08/30 (a) | 300,000 | 240,357 |
WPP Finance 2010 | ||
3.75%, 09/19/24 | 250,000 | 242,748 |
153,224,457 | ||
Consumer Cyclical 1.7% | ||
Advance Auto Parts, Inc. | ||
1.75%, 10/01/27 (a) | 100,000 | 83,175 |
3.90%, 04/15/30 (a) | 150,000 | 129,248 |
3.50%, 03/15/32 (a) | 100,000 | 80,673 |
Alibaba Group Holding Ltd. | ||
3.60%, 11/28/24 (a) | 625,000 | 605,250 |
3.40%, 12/06/27 (a) | 850,000 | 790,015 |
2.13%, 02/09/31 (a) | 450,000 | 366,309 |
4.50%, 11/28/34 (a) | 200,000 | 184,508 |
4.00%, 12/06/37 (a) | 300,000 | 251,325 |
2.70%, 02/09/41 (a) | 250,000 | 168,320 |
4.20%, 12/06/47 (a) | 350,000 | 275,828 |
3.15%, 02/09/51 (a) | 400,000 | 259,232 |
4.40%, 12/06/57 (a) | 300,000 | 236,451 |
3.25%, 02/09/61 (a) | 300,000 | 185,661 |
Amazon.com, Inc. | ||
2.80%, 08/22/24 (a) | 500,000 | 486,370 |
4.70%, 11/29/24 | 250,000 | 248,640 |
3.80%, 12/05/24 (a) | 450,000 | 441,882 |
3.00%, 04/13/25 | 400,000 | 386,292 |
0.80%, 06/03/25 (a) | 250,000 | 231,215 |
4.60%, 12/01/25 | 350,000 | 347,508 |
5.20%, 12/03/25 (a) | 200,000 | 200,732 |
1.00%, 05/12/26 (a) | 825,000 | 742,112 |
3.30%, 04/13/27 (a) | 600,000 | 572,448 |
1.20%, 06/03/27 (a) | 300,000 | 263,442 |
3.15%, 08/22/27 (a) | 750,000 | 706,507 |
4.55%, 12/01/27 (a) | 500,000 | 496,975 |
1.65%, 05/12/28 (a) | 700,000 | 612,003 |
3.45%, 04/13/29 (a) | 350,000 | 329,794 |
4.65%, 12/01/29 (a) | 625,000 | 627,525 |
1.50%, 06/03/30 (a) | 700,000 | 576,317 |
2.10%, 05/12/31 (a) | 700,000 | 589,078 |
3.60%, 04/13/32 (a) | 700,000 | 653,100 |
4.70%, 12/01/32 (a) | 625,000 | 630,181 |
4.80%, 12/05/34 (a) | 300,000 | 306,801 |
3.88%, 08/22/37 (a) | 700,000 | 639,891 |
2.88%, 05/12/41 (a) | 650,000 | 502,684 |
4.95%, 12/05/44 (a) | 400,000 | 405,176 |
4.05%, 08/22/47 (a) | 1,050,000 | 943,131 |
2.50%, 06/03/50 (a) | 600,000 | 399,300 |
3.10%, 05/12/51 (a) | 900,000 | 672,183 |
3.95%, 04/13/52 (a) | 700,000 | 609,469 |
4.25%, 08/22/57 (a) | 525,000 | 475,387 |
2.70%, 06/03/60 (a) | 600,000 | 386,016 |
3.25%, 05/12/61 (a) | 600,000 | 434,988 |
4.10%, 04/13/62 (a) | 325,000 | 281,521 |
American Honda Finance Corp. | ||
0.55%, 07/12/24 | 300,000 | 284,982 |
2.15%, 09/10/24 | 200,000 | 192,252 |
SECURITY RATE, MATURITY DATE | FACE AMOUNT ($) | VALUE ($) |
1.50%, 01/13/25 | 300,000 | 283,554 |
5.00%, 05/23/25 | 500,000 | 498,500 |
1.20%, 07/08/25 | 400,000 | 368,488 |
1.00%, 09/10/25 | 200,000 | 182,618 |
1.30%, 09/09/26 | 300,000 | 267,249 |
2.30%, 09/09/26 | 250,000 | 230,063 |
2.35%, 01/08/27 | 200,000 | 183,626 |
3.50%, 02/15/28 | 200,000 | 188,494 |
2.25%, 01/12/29 | 350,000 | 304,545 |
4.60%, 04/17/30 | 200,000 | 195,652 |
1.80%, 01/13/31 | 250,000 | 203,325 |
Aptiv PLC | ||
2.40%, 02/18/25 (a) | 200,000 | 190,090 |
4.35%, 03/15/29 (a) | 100,000 | 96,273 |
3.25%, 03/01/32 (a) | 250,000 | 213,945 |
4.40%, 10/01/46 (a) | 75,000 | 58,619 |
5.40%, 03/15/49 (a) | 125,000 | 111,094 |
3.10%, 12/01/51 (a) | 350,000 | 220,574 |
4.15%, 05/01/52 (a) | 300,000 | 229,113 |
AutoNation, Inc. | ||
3.50%, 11/15/24 (a) | 100,000 | 96,571 |
3.80%, 11/15/27 (a) | 350,000 | 321,555 |
4.75%, 06/01/30 (a) | 300,000 | 281,598 |
2.40%, 08/01/31 (a) | 150,000 | 114,348 |
AutoZone, Inc. | ||
3.25%, 04/15/25 (a) | 200,000 | 191,714 |
3.63%, 04/15/25 (a) | 100,000 | 96,788 |
3.13%, 04/21/26 (a) | 50,000 | 47,336 |
3.75%, 06/01/27 (a) | 200,000 | 190,638 |
3.75%, 04/18/29 (a) | 200,000 | 185,244 |
4.00%, 04/15/30 (a) | 250,000 | 232,485 |
1.65%, 01/15/31 (a) | 150,000 | 117,146 |
4.75%, 08/01/32 (a) | 225,000 | 217,611 |
Best Buy Co., Inc. | ||
4.45%, 10/01/28 (a) | 200,000 | 194,078 |
1.95%, 10/01/30 (a) | 200,000 | 161,440 |
Block Financial LLC | ||
5.25%, 10/01/25 (a) | 125,000 | 123,316 |
2.50%, 07/15/28 (a) | 150,000 | 127,829 |
3.88%, 08/15/30 (a) | 250,000 | 220,750 |
Booking Holdings, Inc. | ||
3.60%, 06/01/26 (a) | 375,000 | 361,811 |
3.55%, 03/15/28 (a) | 150,000 | 141,236 |
4.63%, 04/13/30 (a) | 500,000 | 487,900 |
BorgWarner, Inc. | ||
2.65%, 07/01/27 (a) | 425,000 | 387,358 |
4.38%, 03/15/45 (a) | 170,000 | 137,144 |
CBRE Services, Inc. | ||
4.88%, 03/01/26 (a) | 150,000 | 145,850 |
2.50%, 04/01/31 (a) | 375,000 | 301,687 |
Choice Hotels International, Inc. | ||
3.70%, 12/01/29 (a) | 100,000 | 86,510 |
3.70%, 01/15/31 (a) | 200,000 | 169,176 |
Costco Wholesale Corp. | ||
3.00%, 05/18/27 (a) | 450,000 | 427,774 |
1.60%, 04/20/30 (a) | 400,000 | 333,664 |
1.75%, 04/20/32 (a) | 600,000 | 485,754 |
Cummins, Inc. | ||
0.75%, 09/01/25 (a) | 150,000 | 136,839 |
1.50%, 09/01/30 (a) | 250,000 | 202,725 |
4.88%, 10/01/43 (a) | 100,000 | 95,009 |
2.60%, 09/01/50 (a) | 200,000 | 129,314 |
Daimler Finance North America LLC | ||
8.50%, 01/18/31 | 450,000 | 560,182 |
SECURITY RATE, MATURITY DATE | FACE AMOUNT ($) | VALUE ($) |
Darden Restaurants, Inc. | ||
3.85%, 05/01/27 (a) | 155,000 | 148,051 |
4.55%, 02/15/48 (a) | 100,000 | 84,091 |
Dick's Sporting Goods, Inc. | ||
3.15%, 01/15/32 (a) | 225,000 | 184,536 |
4.10%, 01/15/52 (a) | 250,000 | 173,930 |
Dollar General Corp. | ||
4.25%, 09/20/24 | 200,000 | 196,350 |
4.15%, 11/01/25 (a) | 89,000 | 86,401 |
3.88%, 04/15/27 (a) | 150,000 | 143,453 |
4.63%, 11/01/27 (a) | 200,000 | 196,024 |
4.13%, 05/01/28 (a) | 150,000 | 142,902 |
3.50%, 04/03/30 (a) | 300,000 | 268,923 |
5.00%, 11/01/32 (a) | 200,000 | 194,566 |
5.45%, 07/05/33 (a) | 300,000 | 297,507 |
4.13%, 04/03/50 (a) | 150,000 | 117,987 |
5.50%, 11/01/52 (a) | 100,000 | 96,124 |
Dollar Tree, Inc. | ||
4.00%, 05/15/25 (a) | 250,000 | 242,365 |
4.20%, 05/15/28 (a) | 325,000 | 308,240 |
2.65%, 12/01/31 (a) | 250,000 | 204,508 |
3.38%, 12/01/51 (a) | 150,000 | 101,351 |
DR Horton, Inc. | ||
2.50%, 10/15/24 (a) | 150,000 | 143,838 |
2.60%, 10/15/25 (a) | 210,000 | 196,730 |
1.40%, 10/15/27 (a) | 225,000 | 193,446 |
eBay, Inc. | ||
3.45%, 08/01/24 (a) | 300,000 | 293,541 |
1.90%, 03/11/25 (a) | 150,000 | 141,143 |
1.40%, 05/10/26 (a) | 200,000 | 180,686 |
3.60%, 06/05/27 (a) | 350,000 | 331,705 |
2.70%, 03/11/30 (a) | 200,000 | 171,924 |
2.60%, 05/10/31 (a) | 250,000 | 209,378 |
6.30%, 11/22/32 (a) | 100,000 | 105,118 |
4.00%, 07/15/42 (a) | 250,000 | 199,928 |
3.65%, 05/10/51 (a) | 250,000 | 183,865 |
Expedia Group, Inc. | ||
5.00%, 02/15/26 (a) | 100,000 | 98,712 |
4.63%, 08/01/27 (a) | 225,000 | 218,518 |
3.80%, 02/15/28 (a) | 300,000 | 281,208 |
3.25%, 02/15/30 (a) | 425,000 | 370,277 |
2.95%, 03/15/31 (a) | 100,000 | 84,829 |
Ford Foundation | ||
2.42%, 06/01/50 (a) | 250,000 | 165,983 |
2.82%, 06/01/70 (a) | 100,000 | 62,784 |
General Motors Co. | ||
4.00%, 04/01/25 | 150,000 | 145,913 |
6.13%, 10/01/25 (a) | 350,000 | 352,579 |
4.20%, 10/01/27 (a) | 250,000 | 237,292 |
6.80%, 10/01/27 (a) | 450,000 | 467,932 |
5.00%, 10/01/28 (a) | 400,000 | 389,380 |
5.40%, 10/15/29 (a) | 400,000 | 390,472 |
5.60%, 10/15/32 (a) | 350,000 | 339,472 |
5.00%, 04/01/35 | 200,000 | 181,926 |
6.60%, 04/01/36 (a) | 350,000 | 360,314 |
5.15%, 04/01/38 (a) | 350,000 | 313,271 |
6.25%, 10/02/43 | 400,000 | 392,640 |
5.20%, 04/01/45 | 400,000 | 341,328 |
6.75%, 04/01/46 (a) | 250,000 | 253,345 |
5.40%, 04/01/48 (a) | 200,000 | 173,266 |
5.95%, 04/01/49 (a) | 100,000 | 93,532 |
General Motors Financial Co., Inc. | ||
1.20%, 10/15/24 | 200,000 | 188,160 |
3.50%, 11/07/24 (a) | 250,000 | 241,902 |
4.00%, 01/15/25 (a) | 250,000 | 242,360 |
2.90%, 02/26/25 (a) | 500,000 | 475,285 |
SECURITY RATE, MATURITY DATE | FACE AMOUNT ($) | VALUE ($) |
3.80%, 04/07/25 | 350,000 | 337,781 |
4.35%, 04/09/25 (a) | 61,000 | 59,440 |
2.75%, 06/20/25 (a) | 250,000 | 235,625 |
6.05%, 10/10/25 | 375,000 | 376,241 |
1.25%, 01/08/26 (a) | 425,000 | 379,861 |
5.25%, 03/01/26 (a) | 400,000 | 393,948 |
5.40%, 04/06/26 | 500,000 | 494,455 |
1.50%, 06/10/26 (a) | 350,000 | 309,585 |
4.00%, 10/06/26 (a) | 300,000 | 284,910 |
4.35%, 01/17/27 (a) | 500,000 | 479,900 |
2.35%, 02/26/27 (a) | 250,000 | 223,260 |
5.00%, 04/09/27 (a) | 400,000 | 389,892 |
2.70%, 08/20/27 (a) | 500,000 | 443,455 |
3.85%, 01/05/28 (a) | 375,000 | 347,272 |
2.40%, 04/10/28 (a) | 300,000 | 259,110 |
2.40%, 10/15/28 (a) | 300,000 | 254,586 |
5.65%, 01/17/29 (a) | 150,000 | 148,268 |
3.60%, 06/21/30 (a) | 500,000 | 433,705 |
2.35%, 01/08/31 (a) | 300,000 | 235,974 |
2.70%, 06/10/31 (a) | 450,000 | 359,536 |
3.10%, 01/12/32 (a) | 600,000 | 486,114 |
6.40%, 01/09/33 (a) | 100,000 | 101,700 |
Genuine Parts Co. | ||
1.88%, 11/01/30 (a) | 125,000 | 97,931 |
2.75%, 02/01/32 (a) | 250,000 | 205,775 |
GLP Capital LP/GLP Financing II, Inc. | ||
3.35%, 09/01/24 (a) | 150,000 | 144,872 |
5.25%, 06/01/25 (a) | 300,000 | 294,381 |
5.38%, 04/15/26 (a) | 350,000 | 342,842 |
5.75%, 06/01/28 (a) | 150,000 | 146,774 |
5.30%, 01/15/29 (a) | 225,000 | 214,949 |
4.00%, 01/15/30 (a) | 225,000 | 195,431 |
4.00%, 01/15/31 (a) | 250,000 | 216,475 |
3.25%, 01/15/32 (a) | 200,000 | 161,906 |
Harley-Davidson, Inc. | ||
3.50%, 07/28/25 (a) | 100,000 | 96,016 |
4.63%, 07/28/45 (a) | 100,000 | 76,070 |
Harman International Industries, Inc. | ||
4.15%, 05/15/25 (a) | 200,000 | 194,148 |
Home Depot, Inc. | ||
3.35%, 09/15/25 (a) | 300,000 | 289,974 |
3.00%, 04/01/26 (a) | 550,000 | 526,680 |
2.13%, 09/15/26 (a) | 300,000 | 277,323 |
2.50%, 04/15/27 (a) | 200,000 | 185,832 |
2.80%, 09/14/27 (a) | 150,000 | 139,812 |
0.90%, 03/15/28 (a) | 275,000 | 232,284 |
1.50%, 09/15/28 (a) | 250,000 | 214,228 |
3.90%, 12/06/28 (a) | 450,000 | 435,942 |
2.95%, 06/15/29 (a) | 650,000 | 592,455 |
2.70%, 04/15/30 (a) | 550,000 | 489,269 |
1.38%, 03/15/31 (a) | 275,000 | 217,451 |
1.88%, 09/15/31 (a) | 450,000 | 366,259 |
3.25%, 04/15/32 (a) | 400,000 | 359,676 |
4.50%, 09/15/32 (a)(f) | 200,000 | 197,704 |
5.88%, 12/16/36 | 850,000 | 926,661 |
3.30%, 04/15/40 (a) | 355,000 | 288,711 |
5.40%, 09/15/40 (a) | 191,000 | 197,737 |
5.95%, 04/01/41 (a) | 200,000 | 220,438 |
4.20%, 04/01/43 (a) | 250,000 | 224,153 |
4.88%, 02/15/44 (a) | 150,000 | 146,373 |
4.40%, 03/15/45 (a) | 325,000 | 297,021 |
4.25%, 04/01/46 (a) | 400,000 | 354,884 |
3.90%, 06/15/47 (a) | 350,000 | 297,979 |
4.50%, 12/06/48 (a) | 350,000 | 325,013 |
3.13%, 12/15/49 (a) | 400,000 | 293,432 |
3.35%, 04/15/50 (a) | 300,000 | 229,371 |
2.38%, 03/15/51 (a) | 400,000 | 248,956 |
SECURITY RATE, MATURITY DATE | FACE AMOUNT ($) | VALUE ($) |
2.75%, 09/15/51 (a) | 250,000 | 169,320 |
3.63%, 04/15/52 (a) | 400,000 | 318,972 |
4.95%, 09/15/52 (a) | 300,000 | 298,407 |
3.50%, 09/15/56 (a) | 297,000 | 229,150 |
Honda Motor Co., Ltd. | ||
2.27%, 03/10/25 (a) | 250,000 | 238,355 |
2.53%, 03/10/27 (a) | 200,000 | 184,222 |
2.97%, 03/10/32 (a) | 225,000 | 199,708 |
Hyatt Hotels Corp. | ||
5.38%, 04/23/25 (a)(d) | 200,000 | 198,266 |
4.85%, 03/15/26 (a) | 300,000 | 294,330 |
4.38%, 09/15/28 (a) | 200,000 | 189,160 |
5.75%, 04/23/30 (a)(d) | 150,000 | 150,947 |
JD.com, Inc. | ||
3.88%, 04/29/26 | 200,000 | 190,894 |
3.38%, 01/14/30 (a) | 200,000 | 179,600 |
4.13%, 01/14/50 (a) | 100,000 | 78,480 |
Lear Corp. | ||
3.80%, 09/15/27 (a) | 150,000 | 140,331 |
4.25%, 05/15/29 (a) | 225,000 | 211,799 |
2.60%, 01/15/32 (a) | 100,000 | 78,227 |
5.25%, 05/15/49 (a) | 250,000 | 220,085 |
Lennar Corp. | ||
5.88%, 11/15/24 (a) | 150,000 | 149,949 |
4.75%, 05/30/25 (a) | 200,000 | 195,668 |
5.25%, 06/01/26 (a) | 100,000 | 99,124 |
5.00%, 06/15/27 (a) | 100,000 | 98,312 |
4.75%, 11/29/27 (a) | 150,000 | 146,034 |
LKQ Corp. | ||
5.75%, 06/15/28 (a)(c) | 225,000 | 224,332 |
6.25%, 06/15/33 (a)(c) | 200,000 | 201,342 |
Lowe's Cos., Inc. | ||
3.13%, 09/15/24 (a) | 200,000 | 194,152 |
4.00%, 04/15/25 (a) | 200,000 | 194,700 |
3.38%, 09/15/25 (a) | 400,000 | 383,856 |
2.50%, 04/15/26 (a) | 450,000 | 421,474 |
3.10%, 05/03/27 (a) | 460,000 | 429,769 |
1.30%, 04/15/28 (a) | 250,000 | 211,668 |
6.50%, 03/15/29 | 451,000 | 484,487 |
3.65%, 04/05/29 (a) | 572,000 | 530,953 |
4.50%, 04/15/30 (a) | 400,000 | 389,336 |
1.70%, 10/15/30 (a) | 400,000 | 320,900 |
2.63%, 04/01/31 (a) | 500,000 | 422,680 |
3.75%, 04/01/32 (a) | 500,000 | 452,985 |
5.00%, 04/15/33 (a) | 325,000 | 321,828 |
5.00%, 04/15/40 (a) | 300,000 | 281,997 |
4.65%, 04/15/42 (a) | 150,000 | 134,501 |
4.38%, 09/15/45 (a) | 250,000 | 210,593 |
3.70%, 04/15/46 (a) | 550,000 | 421,459 |
4.05%, 05/03/47 (a) | 450,000 | 363,285 |
4.55%, 04/05/49 (a) | 200,000 | 171,744 |
5.13%, 04/15/50 (a) | 250,000 | 235,457 |
3.00%, 10/15/50 (a) | 200,000 | 131,782 |
3.50%, 04/01/51 (a) | 175,000 | 125,342 |
4.25%, 04/01/52 (a) | 300,000 | 245,655 |
5.63%, 04/15/53 (a) | 300,000 | 300,294 |
5.75%, 07/01/53 (a) | 150,000 | 153,000 |
4.45%, 04/01/62 (a) | 375,000 | 303,011 |
5.80%, 09/15/62 (a) | 300,000 | 298,551 |
5.85%, 04/01/63 (a) | 150,000 | 149,871 |
Magna International, Inc. | ||
4.15%, 10/01/25 (a) | 250,000 | 242,697 |
2.45%, 06/15/30 (a) | 125,000 | 106,036 |
Marriott International, Inc. | ||
3.75%, 03/15/25 (a) | 150,000 | 145,295 |
5.75%, 05/01/25 (a) | 250,000 | 250,892 |
SECURITY RATE, MATURITY DATE | FACE AMOUNT ($) | VALUE ($) |
3.75%, 10/01/25 (a) | 150,000 | 144,381 |
3.13%, 06/15/26 (a) | 300,000 | 281,910 |
4.65%, 12/01/28 (a) | 150,000 | 145,697 |
4.63%, 06/15/30 (a) | 300,000 | 287,499 |
2.85%, 04/15/31 (a) | 325,000 | 273,585 |
3.50%, 10/15/32 (a) | 475,000 | 410,642 |
McDonald's Corp. | ||
3.38%, 05/26/25 (a) | 200,000 | 193,982 |
3.30%, 07/01/25 (a) | 200,000 | 192,976 |
3.70%, 01/30/26 (a) | 500,000 | 483,785 |
3.50%, 03/01/27 (a) | 250,000 | 238,672 |
3.50%, 07/01/27 (a) | 300,000 | 285,816 |
3.80%, 04/01/28 (a) | 350,000 | 335,919 |
2.63%, 09/01/29 (a) | 300,000 | 266,592 |
2.13%, 03/01/30 (a) | 250,000 | 213,145 |
3.60%, 07/01/30 (a) | 350,000 | 326,018 |
4.60%, 09/09/32 (a) | 200,000 | 198,416 |
4.70%, 12/09/35 (a) | 300,000 | 292,515 |
6.30%, 10/15/37 | 180,000 | 198,180 |
6.30%, 03/01/38 | 250,000 | 276,385 |
5.70%, 02/01/39 | 83,000 | 86,015 |
3.70%, 02/15/42 | 100,000 | 81,636 |
3.63%, 05/01/43 | 200,000 | 160,406 |
4.88%, 12/09/45 (a) | 525,000 | 503,176 |
4.45%, 03/01/47 (a) | 325,000 | 292,900 |
4.45%, 09/01/48 (a) | 250,000 | 224,920 |
3.63%, 09/01/49 (a) | 475,000 | 375,502 |
4.20%, 04/01/50 (a) | 150,000 | 130,086 |
5.15%, 09/09/52 (a) | 250,000 | 249,955 |
MDC Holdings, Inc. | ||
3.85%, 01/15/30 (a) | 200,000 | 176,950 |
2.50%, 01/15/31 (a) | 100,000 | 79,022 |
6.00%, 01/15/43 (a) | 100,000 | 90,463 |
3.97%, 08/06/61 (a) | 100,000 | 60,272 |
NIKE, Inc. | ||
2.40%, 03/27/25 (a) | 300,000 | 286,959 |
2.38%, 11/01/26 (a) | 300,000 | 279,099 |
2.75%, 03/27/27 (a) | 250,000 | 235,207 |
2.85%, 03/27/30 (a) | 450,000 | 407,187 |
3.25%, 03/27/40 (a) | 350,000 | 288,095 |
3.63%, 05/01/43 (a) | 100,000 | 84,303 |
3.88%, 11/01/45 (a) | 325,000 | 285,369 |
3.38%, 11/01/46 (a) | 150,000 | 120,978 |
3.38%, 03/27/50 (a) | 375,000 | 305,426 |
NVR, Inc. | ||
3.00%, 05/15/30 (a) | 250,000 | 216,813 |
O'Reilly Automotive, Inc. | ||
3.55%, 03/15/26 (a) | 200,000 | 191,774 |
3.60%, 09/01/27 (a) | 250,000 | 236,780 |
4.35%, 06/01/28 (a) | 209,000 | 202,615 |
3.90%, 06/01/29 (a) | 250,000 | 235,202 |
1.75%, 03/15/31 (a) | 250,000 | 197,335 |
PACCAR Financial Corp. | ||
0.50%, 08/09/24 | 250,000 | 236,852 |
2.15%, 08/15/24 | 50,000 | 48,188 |
0.90%, 11/08/24 | 150,000 | 141,116 |
1.80%, 02/06/25 | 300,000 | 284,160 |
2.85%, 04/07/25 | 100,000 | 95,890 |
3.55%, 08/11/25 | 175,000 | 169,997 |
4.95%, 10/03/25 | 50,000 | 49,763 |
4.45%, 03/30/26 | 150,000 | 148,952 |
PulteGroup, Inc. | ||
5.50%, 03/01/26 (a) | 150,000 | 149,283 |
5.00%, 01/15/27 (a) | 150,000 | 147,983 |
7.88%, 06/15/32 | 25,000 | 28,410 |
SECURITY RATE, MATURITY DATE | FACE AMOUNT ($) | VALUE ($) |
6.38%, 05/15/33 | 150,000 | 156,108 |
6.00%, 02/15/35 | 100,000 | 101,777 |
PVH Corp. | ||
4.63%, 07/10/25 (a)(c) | 250,000 | 242,010 |
Ralph Lauren Corp. | ||
3.75%, 09/15/25 (a) | 100,000 | 96,598 |
2.95%, 06/15/30 (a) | 200,000 | 176,816 |
Rockefeller Foundation | ||
2.49%, 10/01/50 (a) | 200,000 | 130,196 |
Ross Stores, Inc. | ||
4.60%, 04/15/25 (a) | 200,000 | 196,362 |
0.88%, 04/15/26 (a) | 150,000 | 132,480 |
1.88%, 04/15/31 (a) | 150,000 | 118,518 |
Starbucks Corp. | ||
3.80%, 08/15/25 (a) | 350,000 | 339,230 |
4.75%, 02/15/26 | 250,000 | 247,725 |
2.00%, 03/12/27 (a) | 200,000 | 179,868 |
3.50%, 03/01/28 (a) | 250,000 | 235,080 |
4.00%, 11/15/28 (a) | 250,000 | 240,062 |
3.55%, 08/15/29 (a) | 300,000 | 280,278 |
2.25%, 03/12/30 (a) | 200,000 | 169,418 |
2.55%, 11/15/30 (a) | 375,000 | 320,092 |
3.00%, 02/14/32 (a) | 150,000 | 130,482 |
4.80%, 02/15/33 (a) | 150,000 | 148,475 |
4.30%, 06/15/45 (a) | 50,000 | 43,719 |
3.75%, 12/01/47 (a) | 150,000 | 119,225 |
4.50%, 11/15/48 (a) | 250,000 | 223,683 |
4.45%, 08/15/49 (a) | 325,000 | 288,246 |
3.35%, 03/12/50 (a) | 200,000 | 147,242 |
3.50%, 11/15/50 (a) | 300,000 | 228,441 |
Tapestry, Inc. | ||
4.25%, 04/01/25 (a) | 100,000 | 97,393 |
4.13%, 07/15/27 (a) | 150,000 | 141,140 |
3.05%, 03/15/32 (a) | 100,000 | 79,965 |
Target Corp. | ||
3.50%, 07/01/24 | 250,000 | 245,522 |
2.25%, 04/15/25 (a) | 500,000 | 476,900 |
2.50%, 04/15/26 | 400,000 | 378,860 |
3.38%, 04/15/29 (a) | 325,000 | 304,847 |
2.35%, 02/15/30 (a) | 250,000 | 216,950 |
2.65%, 09/15/30 (a) | 250,000 | 218,623 |
4.50%, 09/15/32 (a) | 300,000 | 293,082 |
6.50%, 10/15/37 | 200,000 | 228,114 |
7.00%, 01/15/38 | 100,000 | 120,868 |
4.00%, 07/01/42 | 450,000 | 404,874 |
3.63%, 04/15/46 | 125,000 | 102,109 |
3.90%, 11/15/47 (a) | 200,000 | 169,652 |
2.95%, 01/15/52 (a) | 250,000 | 175,713 |
4.80%, 01/15/53 (a) | 200,000 | 191,988 |
The California Endowment | ||
2.50%, 04/01/51 (a) | 150,000 | 97,212 |
TJX Cos., Inc. | ||
2.25%, 09/15/26 (a) | 400,000 | 369,200 |
1.15%, 05/15/28 (a) | 100,000 | 85,364 |
3.88%, 04/15/30 (a) | 150,000 | 143,288 |
Toll Brothers Finance Corp. | ||
4.88%, 11/15/25 (a) | 150,000 | 147,354 |
4.88%, 03/15/27 (a) | 200,000 | 193,850 |
3.80%, 11/01/29 (a) | 50,000 | 44,919 |
Toyota Motor Corp. | ||
2.36%, 07/02/24 | 150,000 | 145,338 |
1.34%, 03/25/26 (a) | 300,000 | 272,340 |
3.67%, 07/20/28 | 250,000 | 239,587 |
2.76%, 07/02/29 | 150,000 | 135,543 |
SECURITY RATE, MATURITY DATE | FACE AMOUNT ($) | VALUE ($) |
Toyota Motor Credit Corp. | ||
4.40%, 09/20/24 | 300,000 | 296,436 |
4.80%, 01/10/25 | 350,000 | 347,728 |
1.45%, 01/13/25 | 150,000 | 141,545 |
1.80%, 02/13/25 | 400,000 | 378,804 |
3.00%, 04/01/25 | 550,000 | 530,040 |
3.95%, 06/30/25 | 400,000 | 391,320 |
0.80%, 10/16/25 | 400,000 | 362,632 |
0.80%, 01/09/26 | 300,000 | 270,000 |
4.45%, 05/18/26 | 500,000 | 492,680 |
1.13%, 06/18/26 | 250,000 | 223,610 |
3.20%, 01/11/27 | 450,000 | 425,115 |
3.05%, 03/22/27 | 550,000 | 515,531 |
1.15%, 08/13/27 | 400,000 | 346,076 |
4.55%, 09/20/27 | 300,000 | 296,337 |
5.45%, 11/10/27 | 125,000 | 127,748 |
3.05%, 01/11/28 | 250,000 | 231,808 |
4.63%, 01/12/28 | 300,000 | 297,921 |
3.65%, 01/08/29 | 400,000 | 376,680 |
2.15%, 02/13/30 | 250,000 | 214,748 |
3.38%, 04/01/30 | 600,000 | 553,062 |
1.65%, 01/10/31 | 300,000 | 240,933 |
1.90%, 09/12/31 | 150,000 | 121,142 |
Tractor Supply Co. | ||
1.75%, 11/01/30 (a) | 250,000 | 198,365 |
5.25%, 05/15/33 (a) | 200,000 | 198,484 |
VF Corp. | ||
2.40%, 04/23/25 (a) | 225,000 | 211,041 |
2.80%, 04/23/27 (a) | 150,000 | 135,683 |
2.95%, 04/23/30 (a) | 300,000 | 247,266 |
VICI Properties LP | ||
4.75%, 02/15/28 (a) | 350,000 | 331,782 |
4.95%, 02/15/30 (a) | 400,000 | 375,412 |
5.13%, 05/15/32 (a) | 450,000 | 421,744 |
5.63%, 05/15/52 (a) | 200,000 | 181,244 |
Walgreens Boots Alliance, Inc. | ||
3.80%, 11/18/24 (a) | 400,000 | 390,056 |
3.45%, 06/01/26 (a) | 400,000 | 375,852 |
3.20%, 04/15/30 (a) | 150,000 | 127,749 |
4.50%, 11/18/34 (a) | 100,000 | 88,869 |
4.80%, 11/18/44 (a) | 100,000 | 83,029 |
4.65%, 06/01/46 (a) | 175,000 | 142,938 |
4.10%, 04/15/50 (a) | 125,000 | 89,189 |
Walmart, Inc. | ||
2.85%, 07/08/24 (a) | 300,000 | 292,803 |
2.65%, 12/15/24 (a) | 200,000 | 192,918 |
3.55%, 06/26/25 (a) | 300,000 | 292,539 |
3.90%, 09/09/25 | 500,000 | 489,985 |
3.05%, 07/08/26 (a) | 100,000 | 95,824 |
1.05%, 09/17/26 (a) | 100,000 | 89,358 |
5.88%, 04/05/27 | 300,000 | 314,430 |
3.70%, 06/26/28 (a) | 750,000 | 726,195 |
1.50%, 09/22/28 (a) | 200,000 | 173,764 |
3.25%, 07/08/29 (a) | 350,000 | 328,618 |
2.38%, 09/24/29 (a) | 250,000 | 221,718 |
7.55%, 02/15/30 | 250,000 | 292,462 |
1.80%, 09/22/31 (a) | 600,000 | 499,242 |
4.15%, 09/09/32 (a) | 400,000 | 394,956 |
4.10%, 04/15/33 (a) | 325,000 | 316,004 |
5.25%, 09/01/35 | 600,000 | 641,058 |
6.50%, 08/15/37 | 100,000 | 118,518 |
6.20%, 04/15/38 | 150,000 | 173,706 |
3.95%, 06/28/38 (a) | 350,000 | 323,326 |
5.63%, 04/01/40 | 100,000 | 109,625 |
5.00%, 10/25/40 | 150,000 | 153,518 |
5.63%, 04/15/41 | 150,000 | 165,036 |
2.50%, 09/22/41 (a) | 450,000 | 336,253 |
SECURITY RATE, MATURITY DATE | FACE AMOUNT ($) | VALUE ($) |
4.00%, 04/11/43 (a) | 225,000 | 202,129 |
4.30%, 04/22/44 (a) | 200,000 | 188,388 |
3.63%, 12/15/47 (a) | 150,000 | 127,391 |
4.05%, 06/29/48 (a) | 650,000 | 601,802 |
2.95%, 09/24/49 (a) | 350,000 | 262,279 |
2.65%, 09/22/51 (a) | 250,000 | 178,668 |
4.50%, 04/15/53 (a) | 400,000 | 390,568 |
117,460,020 | ||
Consumer Non-Cyclical 3.8% | ||
Abbott Laboratories | ||
3.88%, 09/15/25 (a) | 100,000 | 97,755 |
3.75%, 11/30/26 (a) | 508,000 | 495,889 |
1.15%, 01/30/28 (a) | 350,000 | 303,282 |
1.40%, 06/30/30 (a) | 100,000 | 82,325 |
4.75%, 11/30/36 (a) | 500,000 | 502,115 |
6.15%, 11/30/37 | 100,000 | 111,995 |
6.00%, 04/01/39 | 160,000 | 179,158 |
5.30%, 05/27/40 | 245,000 | 256,608 |
4.75%, 04/15/43 (a) | 200,000 | 196,822 |
4.90%, 11/30/46 (a) | 850,000 | 858,211 |
AbbVie, Inc. | ||
2.60%, 11/21/24 (a) | 1,050,000 | 1,007,664 |
3.80%, 03/15/25 (a) | 500,000 | 486,420 |
3.60%, 05/14/25 (a) | 1,100,000 | 1,063,700 |
3.20%, 05/14/26 (a) | 550,000 | 521,488 |
2.95%, 11/21/26 (a) | 1,100,000 | 1,028,940 |
4.25%, 11/14/28 (a) | 590,000 | 573,020 |
3.20%, 11/21/29 (a) | 1,500,000 | 1,356,600 |
4.55%, 03/15/35 (a) | 550,000 | 524,062 |
4.50%, 05/14/35 (a) | 625,000 | 593,494 |
4.30%, 05/14/36 (a) | 375,000 | 345,169 |
4.05%, 11/21/39 (a) | 1,050,000 | 914,623 |
4.63%, 10/01/42 (a) | 150,000 | 136,263 |
4.40%, 11/06/42 | 750,000 | 672,195 |
4.85%, 06/15/44 (a) | 200,000 | 186,488 |
4.75%, 03/15/45 (a) | 218,000 | 200,397 |
4.70%, 05/14/45 (a) | 700,000 | 639,891 |
4.45%, 05/14/46 (a) | 500,000 | 441,675 |
4.88%, 11/14/48 (a) | 500,000 | 473,420 |
4.25%, 11/21/49 (a) | 1,550,000 | 1,337,448 |
AdventHealth Obligated Group | ||
2.80%, 11/15/51 (a) | 100,000 | 66,057 |
Adventist Health System | ||
2.95%, 03/01/29 (a) | 200,000 | 174,624 |
3.63%, 03/01/49 (a) | 25,000 | 18,518 |
Advocate Health & Hospitals Corp. | ||
3.83%, 08/15/28 (a) | 100,000 | 95,640 |
2.21%, 06/15/30 (a) | 150,000 | 125,883 |
4.27%, 08/15/48 (a) | 89,000 | 78,740 |
3.39%, 10/15/49 (a) | 200,000 | 151,062 |
3.01%, 06/15/50 (a) | 50,000 | 34,677 |
Agilent Technologies, Inc. | ||
2.75%, 09/15/29 (a) | 350,000 | 305,777 |
2.30%, 03/12/31 (a) | 250,000 | 204,733 |
Ahold Finance USA LLC | ||
6.88%, 05/01/29 | 150,000 | 160,364 |
AHS Hospital Corp. | ||
5.02%, 07/01/45 | 150,000 | 145,397 |
2.78%, 07/01/51 (a) | 125,000 | 82,310 |
Allina Health System | ||
3.89%, 04/15/49 | 125,000 | 100,869 |
2.90%, 11/15/51 (a) | 100,000 | 65,841 |
SECURITY RATE, MATURITY DATE | FACE AMOUNT ($) | VALUE ($) |
Altria Group, Inc. | ||
2.35%, 05/06/25 (a) | 250,000 | 235,367 |
4.40%, 02/14/26 (a) | 250,000 | 244,877 |
2.63%, 09/16/26 (a) | 150,000 | 139,106 |
4.80%, 02/14/29 (a) | 560,000 | 545,199 |
3.40%, 05/06/30 (a) | 200,000 | 176,642 |
2.45%, 02/04/32 (a) | 500,000 | 391,740 |
5.80%, 02/14/39 (a) | 450,000 | 440,829 |
3.40%, 02/04/41 (a) | 300,000 | 210,471 |
4.25%, 08/09/42 | 350,000 | 274,743 |
4.50%, 05/02/43 | 150,000 | 120,093 |
5.38%, 01/31/44 | 500,000 | 471,445 |
3.88%, 09/16/46 (a) | 500,000 | 352,975 |
5.95%, 02/14/49 (a) | 650,000 | 616,642 |
4.45%, 05/06/50 (a) | 200,000 | 147,982 |
3.70%, 02/04/51 (a) | 400,000 | 268,640 |
4.00%, 02/04/61 (a) | 200,000 | 138,508 |
AmerisourceBergen Corp. | ||
3.45%, 12/15/27 (a) | 300,000 | 280,995 |
2.80%, 05/15/30 (a) | 200,000 | 173,710 |
2.70%, 03/15/31 (a) | 350,000 | 298,564 |
4.25%, 03/01/45 (a) | 150,000 | 124,874 |
4.30%, 12/15/47 (a) | 150,000 | 128,238 |
Amgen, Inc. | ||
1.90%, 02/21/25 (a) | 150,000 | 141,489 |
5.25%, 03/02/25 | 600,000 | 597,240 |
3.13%, 05/01/25 (a) | 250,000 | 239,652 |
2.60%, 08/19/26 (a) | 400,000 | 370,772 |
2.20%, 02/21/27 (a) | 450,000 | 409,176 |
3.20%, 11/02/27 (a) | 300,000 | 280,533 |
5.15%, 03/02/28 (a) | 1,000,000 | 999,570 |
1.65%, 08/15/28 (a) | 200,000 | 171,174 |
3.00%, 02/22/29 (a) | 250,000 | 225,875 |
4.05%, 08/18/29 (a) | 400,000 | 379,244 |
2.45%, 02/21/30 (a) | 400,000 | 342,872 |
5.25%, 03/02/30 (a) | 750,000 | 752,317 |
2.30%, 02/25/31 (a) | 425,000 | 353,583 |
2.00%, 01/15/32 (a) | 400,000 | 318,336 |
3.35%, 02/22/32 (a) | 250,000 | 220,527 |
4.20%, 03/01/33 (a) | 225,000 | 210,400 |
5.25%, 03/02/33 (a) | 1,250,000 | 1,251,862 |
6.38%, 06/01/37 | 50,000 | 54,094 |
6.40%, 02/01/39 | 50,000 | 53,789 |
3.15%, 02/21/40 (a) | 500,000 | 383,065 |
5.75%, 03/15/40 | 100,000 | 100,816 |
2.80%, 08/15/41 (a) | 200,000 | 142,258 |
4.95%, 10/01/41 | 225,000 | 209,457 |
5.15%, 11/15/41 (a) | 276,000 | 267,463 |
5.65%, 06/15/42 (a) | 375,000 | 378,356 |
5.60%, 03/02/43 (a) | 750,000 | 753,607 |
4.40%, 05/01/45 (a) | 700,000 | 607,341 |
4.56%, 06/15/48 (a) | 400,000 | 355,116 |
3.38%, 02/21/50 (a) | 700,000 | 513,933 |
4.66%, 06/15/51 (a) | 900,000 | 807,651 |
3.00%, 01/15/52 (a) | 200,000 | 133,962 |
4.20%, 02/22/52 (a) | 250,000 | 207,790 |
4.88%, 03/01/53 (a) | 300,000 | 276,111 |
5.65%, 03/02/53 (a) | 1,000,000 | 1,014,340 |
2.77%, 09/01/53 (a) | 322,000 | 201,479 |
4.40%, 02/22/62 (a) | 350,000 | 288,564 |
5.75%, 03/02/63 (a) | 800,000 | 813,672 |
Anheuser-Busch Cos. LLC/Anheuser-Busch InBev Worldwide, Inc. | ||
3.65%, 02/01/26 (a) | 900,000 | 872,100 |
4.70%, 02/01/36 (a) | 1,525,000 | 1,487,165 |
4.90%, 02/01/46 (a) | 2,700,000 | 2,581,632 |
SECURITY RATE, MATURITY DATE | FACE AMOUNT ($) | VALUE ($) |
Anheuser-Busch InBev Finance, Inc. | ||
4.70%, 02/01/36 (a) | 187,000 | 181,549 |
4.63%, 02/01/44 | 400,000 | 368,916 |
4.90%, 02/01/46 (a) | 475,000 | 453,345 |
Anheuser-Busch InBev Worldwide, Inc. | ||
4.00%, 04/13/28 (a) | 750,000 | 726,420 |
4.75%, 01/23/29 (a) | 1,100,000 | 1,096,579 |
3.50%, 06/01/30 (a) | 500,000 | 466,080 |
4.90%, 01/23/31 (a) | 250,000 | 254,865 |
4.38%, 04/15/38 (a) | 125,000 | 116,220 |
8.20%, 01/15/39 | 350,000 | 457,768 |
5.45%, 01/23/39 (a) | 600,000 | 622,740 |
8.00%, 11/15/39 | 125,000 | 158,728 |
4.35%, 06/01/40 (a) | 400,000 | 368,156 |
4.95%, 01/15/42 | 490,000 | 479,396 |
4.60%, 04/15/48 (a) | 650,000 | 604,487 |
4.44%, 10/06/48 (a) | 350,000 | 316,624 |
5.55%, 01/23/49 (a) | 1,175,000 | 1,239,484 |
4.50%, 06/01/50 (a) | 450,000 | 417,496 |
4.75%, 04/15/58 (a) | 300,000 | 279,102 |
5.80%, 01/23/59 (a) | 600,000 | 655,044 |
Archer-Daniels-Midland Co. | ||
2.50%, 08/11/26 (a) | 500,000 | 469,310 |
3.25%, 03/27/30 (a) | 450,000 | 413,104 |
5.38%, 09/15/35 | 200,000 | 207,946 |
3.75%, 09/15/47 (a) | 175,000 | 145,369 |
4.50%, 03/15/49 (a) | 250,000 | 232,630 |
2.70%, 09/15/51 (a) | 200,000 | 135,062 |
Ascension Health | ||
2.53%, 11/15/29 (a) | 270,000 | 232,783 |
3.11%, 11/15/39 (a) | 200,000 | 156,362 |
3.95%, 11/15/46 | 325,000 | 274,316 |
4.85%, 11/15/53 | 150,000 | 147,825 |
Astrazeneca Finance LLC | ||
1.20%, 05/28/26 (a) | 350,000 | 315,994 |
4.88%, 03/03/28 (a) | 300,000 | 300,003 |
1.75%, 05/28/28 (a) | 350,000 | 303,408 |
4.90%, 03/03/30 (a) | 500,000 | 501,005 |
2.25%, 05/28/31 (a) | 100,000 | 84,414 |
AstraZeneca PLC | ||
3.38%, 11/16/25 | 650,000 | 624,936 |
0.70%, 04/08/26 (a) | 225,000 | 201,094 |
3.13%, 06/12/27 (a) | 50,000 | 47,050 |
4.00%, 01/17/29 (a) | 200,000 | 193,638 |
1.38%, 08/06/30 (a) | 600,000 | 483,300 |
6.45%, 09/15/37 | 700,000 | 805,231 |
4.00%, 09/18/42 | 350,000 | 312,315 |
4.38%, 11/16/45 | 250,000 | 232,420 |
4.38%, 08/17/48 (a) | 250,000 | 234,485 |
2.13%, 08/06/50 (a) | 200,000 | 125,424 |
3.00%, 05/28/51 (a) | 250,000 | 185,918 |
Banner Health | ||
2.34%, 01/01/30 (a) | 100,000 | 85,662 |
1.90%, 01/01/31 (a) | 150,000 | 121,647 |
3.18%, 01/01/50 (a) | 100,000 | 72,085 |
2.91%, 01/01/51 (a) | 100,000 | 68,101 |
Baptist Health South Florida Obligated Group | ||
3.12%, 11/15/71 (a) | 50,000 | 30,237 |
Baptist Healthcare System Obligated Group | ||
Series 20B 3.54%, 08/15/50 (a) | 150,000 | 111,516 |
BAT Capital Corp. | ||
3.22%, 08/15/24 (a) | 750,000 | 727,890 |
2.79%, 09/06/24 (a) | 300,000 | 288,918 |
3.22%, 09/06/26 (a) | 300,000 | 279,459 |
4.70%, 04/02/27 (a) | 250,000 | 242,490 |
SECURITY RATE, MATURITY DATE | FACE AMOUNT ($) | VALUE ($) |
3.56%, 08/15/27 (a) | 1,000,000 | 920,870 |
2.26%, 03/25/28 (a) | 450,000 | 385,924 |
3.46%, 09/06/29 (a) | 200,000 | 173,930 |
4.91%, 04/02/30 (a) | 300,000 | 283,821 |
2.73%, 03/25/31 (a) | 350,000 | 278,953 |
4.74%, 03/16/32 (a) | 125,000 | 114,074 |
7.75%, 10/19/32 (a) | 250,000 | 275,522 |
4.39%, 08/15/37 (a) | 700,000 | 560,504 |
3.73%, 09/25/40 (a) | 250,000 | 178,858 |
4.54%, 08/15/47 (a) | 600,000 | 443,808 |
4.76%, 09/06/49 (a) | 300,000 | 226,821 |
5.28%, 04/02/50 (a) | 100,000 | 83,407 |
3.98%, 09/25/50 (a) | 300,000 | 202,413 |
5.65%, 03/16/52 (a) | 200,000 | 174,300 |
BAT International Finance PLC | ||
1.67%, 03/25/26 (a) | 350,000 | 314,912 |
4.45%, 03/16/28 (a) | 300,000 | 283,401 |
Baxalta, Inc. | ||
4.00%, 06/23/25 (a) | 200,000 | 194,144 |
5.25%, 06/23/45 (a) | 173,000 | 170,602 |
Baxter International, Inc. | ||
1.32%, 11/29/24 | 450,000 | 422,505 |
2.60%, 08/15/26 (a) | 200,000 | 184,000 |
1.92%, 02/01/27 (a) | 500,000 | 444,535 |
3.95%, 04/01/30 (a) | 100,000 | 92,344 |
1.73%, 04/01/31 (a) | 400,000 | 310,516 |
2.54%, 02/01/32 (a) | 450,000 | 364,833 |
3.50%, 08/15/46 (a) | 150,000 | 105,467 |
3.13%, 12/01/51 (a) | 150,000 | 99,672 |
BayCare Health System, Inc. | ||
Series 2020 3.83%, 11/15/50 (a) | 150,000 | 123,929 |
Baylor Scott & White Holdings | ||
1.78%, 11/15/30 (a) | 100,000 | 79,903 |
4.19%, 11/15/45 (a) | 150,000 | 129,563 |
3.97%, 11/15/46 (a) | 50,000 | 41,718 |
2.84%, 11/15/50 (a) | 325,000 | 220,808 |
Becton Dickinson & Co. | ||
3.73%, 12/15/24 (a) | 487,000 | 473,228 |
3.70%, 06/06/27 (a) | 481,000 | 457,686 |
4.69%, 02/13/28 (a) | 200,000 | 197,518 |
2.82%, 05/20/30 (a) | 350,000 | 306,495 |
1.96%, 02/11/31 (a) | 300,000 | 243,630 |
4.69%, 12/15/44 (a) | 300,000 | 273,714 |
4.67%, 06/06/47 (a) | 350,000 | 322,203 |
3.79%, 05/20/50 (a) | 150,000 | 119,435 |
Beth Israel Lahey Health, Inc. | ||
3.08%, 07/01/51 (a) | 150,000 | 97,025 |
Biogen, Inc. | ||
4.05%, 09/15/25 (a) | 500,000 | 484,200 |
2.25%, 05/01/30 (a) | 500,000 | 418,085 |
3.15%, 05/01/50 (a) | 525,000 | 359,704 |
3.25%, 02/15/51 (a) | 335,000 | 234,915 |
Bio-Rad Laboratories, Inc. | ||
3.30%, 03/15/27 (a) | 150,000 | 139,782 |
3.70%, 03/15/32 (a) | 250,000 | 220,687 |
Bon Secours Mercy Health, Inc. | ||
4.30%, 07/01/28 (a) | 100,000 | 95,442 |
3.46%, 06/01/30 (a) | 100,000 | 89,802 |
2.10%, 06/01/31 (a) | 100,000 | 79,931 |
3.21%, 06/01/50 (a) | 125,000 | 87,359 |
Boston Scientific Corp. | ||
1.90%, 06/01/25 (a) | 150,000 | 140,691 |
2.65%, 06/01/30 (a) | 350,000 | 305,207 |
6.50%, 11/15/35 (g) | 125,000 | 139,120 |
SECURITY RATE, MATURITY DATE | FACE AMOUNT ($) | VALUE ($) |
4.55%, 03/01/39 (a) | 100,000 | 93,006 |
7.38%, 01/15/40 | 100,000 | 120,718 |
4.70%, 03/01/49 (a) | 200,000 | 188,474 |
Bristol-Myers Squibb Co. | ||
2.90%, 07/26/24 (a) | 675,000 | 657,342 |
3.88%, 08/15/25 (a) | 114,000 | 109,940 |
0.75%, 11/13/25 (a) | 250,000 | 227,420 |
3.20%, 06/15/26 (a) | 547,000 | 523,780 |
3.25%, 02/27/27 | 150,000 | 143,970 |
1.13%, 11/13/27 (a) | 300,000 | 261,465 |
3.45%, 11/15/27 (a)(f) | 150,000 | 143,927 |
3.90%, 02/20/28 (a) | 350,000 | 339,930 |
3.40%, 07/26/29 (a) | 700,000 | 650,797 |
1.45%, 11/13/30 (a) | 100,000 | 80,458 |
2.95%, 03/15/32 (a) | 600,000 | 530,700 |
4.13%, 06/15/39 (a) | 650,000 | 594,074 |
2.35%, 11/13/40 (a) | 300,000 | 211,152 |
3.55%, 03/15/42 (a) | 200,000 | 166,108 |
3.25%, 08/01/42 | 150,000 | 117,252 |
5.00%, 08/15/45 (a) | 300,000 | 299,859 |
4.35%, 11/15/47 (a) | 425,000 | 386,172 |
4.55%, 02/20/48 (a) | 406,000 | 379,005 |
4.25%, 10/26/49 (a) | 1,000,000 | 890,630 |
2.55%, 11/13/50 (a) | 200,000 | 130,518 |
3.70%, 03/15/52 (a) | 650,000 | 528,749 |
3.90%, 03/15/62 (a) | 325,000 | 261,427 |
Brown-Forman Corp. | ||
3.50%, 04/15/25 (a) | 200,000 | 194,032 |
4.00%, 04/15/38 (a) | 150,000 | 133,100 |
4.50%, 07/15/45 (a) | 150,000 | 139,890 |
Brunswick Corp. | ||
0.85%, 08/18/24 (a) | 125,000 | 118,091 |
2.40%, 08/18/31 (a) | 150,000 | 115,181 |
4.40%, 09/15/32 (a) | 150,000 | 131,337 |
5.10%, 04/01/52 (a) | 100,000 | 75,170 |
Bunge Ltd. Finance Corp. | ||
1.63%, 08/17/25 (a) | 200,000 | 184,252 |
3.75%, 09/25/27 (a) | 350,000 | 331,002 |
2.75%, 05/14/31 (a) | 250,000 | 210,170 |
Campbell Soup Co. | ||
3.95%, 03/15/25 (a) | 250,000 | 243,362 |
4.15%, 03/15/28 (a) | 200,000 | 191,806 |
2.38%, 04/24/30 (a) | 250,000 | 210,920 |
4.80%, 03/15/48 (a) | 325,000 | 294,970 |
3.13%, 04/24/50 (a) | 25,000 | 17,336 |
Cardinal Health, Inc. | ||
3.75%, 09/15/25 (a) | 250,000 | 241,070 |
3.41%, 06/15/27 (a) | 400,000 | 377,296 |
4.60%, 03/15/43 | 150,000 | 125,861 |
4.90%, 09/15/45 (a) | 150,000 | 131,286 |
4.37%, 06/15/47 (a) | 100,000 | 82,860 |
Catholic Health Services of Long Island Obligated Group | ||
3.37%, 07/01/50 (a) | 125,000 | 85,076 |
Cedars-Sinai Health System | ||
2.29%, 08/15/31 (a) | 150,000 | 123,872 |
Children's Health System of Texas | ||
2.51%, 08/15/50 (a) | 175,000 | 108,353 |
Children's Hospital | ||
2.93%, 07/15/50 (a) | 125,000 | 82,290 |
Children's Hospital Corp. | ||
4.12%, 01/01/47 (a) | 100,000 | 86,683 |
2.59%, 02/01/50 (a) | 120,000 | 77,065 |
Children's Hospital Medical Center | ||
4.27%, 05/15/44 | 100,000 | 88,626 |
SECURITY RATE, MATURITY DATE | FACE AMOUNT ($) | VALUE ($) |
Children's Hospital of Philadelphia | ||
2.70%, 07/01/50 (a) | 150,000 | 98,106 |
CHRISTUS Health | ||
4.34%, 07/01/28 (a) | 150,000 | 143,508 |
Church & Dwight Co., Inc. | ||
3.15%, 08/01/27 (a) | 350,000 | 330,445 |
5.60%, 11/15/32 (a) | 100,000 | 105,749 |
5.00%, 06/15/52 (a) | 150,000 | 148,559 |
Cigna Corp. | ||
3.25%, 04/15/25 (a) | 300,000 | 288,024 |
4.13%, 11/15/25 (a) | 650,000 | 633,444 |
4.50%, 02/25/26 (a) | 385,000 | 377,312 |
1.25%, 03/15/26 (a) | 150,000 | 134,814 |
3.40%, 03/01/27 (a) | 435,000 | 410,218 |
3.05%, 10/15/27 (a) | 191,000 | 176,257 |
4.38%, 10/15/28 (a) | 1,200,000 | 1,162,908 |
2.40%, 03/15/30 (a) | 500,000 | 425,210 |
2.38%, 03/15/31 (a) | 450,000 | 378,135 |
4.80%, 08/15/38 (a) | 500,000 | 472,490 |
3.20%, 03/15/40 (a) | 100,000 | 77,028 |
6.13%, 11/15/41 | 145,000 | 155,708 |
4.80%, 07/15/46 (a) | 405,000 | 372,005 |
3.88%, 10/15/47 (a) | 389,000 | 309,488 |
4.90%, 12/15/48 (a) | 850,000 | 793,262 |
3.40%, 03/15/50 (a) | 275,000 | 201,275 |
3.40%, 03/15/51 (a) | 475,000 | 346,978 |
City of Hope | ||
5.62%, 11/15/43 | 195,000 | 193,436 |
Cleveland Clinic Foundation | ||
4.86%, 01/01/14 | 125,000 | 113,223 |
Clorox Co. | ||
3.10%, 10/01/27 (a) | 100,000 | 92,757 |
3.90%, 05/15/28 (a) | 350,000 | 333,889 |
4.40%, 05/01/29 (a)(f) | 150,000 | 145,974 |
1.80%, 05/15/30 (a) | 100,000 | 82,021 |
Coca-Cola Co. | ||
3.38%, 03/25/27 | 350,000 | 337,834 |
1.45%, 06/01/27 | 450,000 | 402,543 |
1.00%, 03/15/28 | 500,000 | 430,030 |
2.13%, 09/06/29 | 450,000 | 395,622 |
3.45%, 03/25/30 | 400,000 | 377,852 |
1.65%, 06/01/30 | 250,000 | 208,658 |
2.00%, 03/05/31 | 200,000 | 168,754 |
1.38%, 03/15/31 | 400,000 | 321,088 |
2.25%, 01/05/32 | 500,000 | 426,765 |
2.50%, 06/01/40 | 450,000 | 339,201 |
4.20%, 03/25/50 | 250,000 | 237,500 |
2.60%, 06/01/50 | 400,000 | 280,952 |
3.00%, 03/05/51 | 450,000 | 344,187 |
2.50%, 03/15/51 | 400,000 | 274,280 |
2.75%, 06/01/60 | 325,000 | 225,306 |
Coca-Cola Consolidated, Inc. | ||
3.80%, 11/25/25 (a) | 150,000 | 145,043 |
Coca-Cola Femsa S.A.B. de C.V. | ||
2.75%, 01/22/30 (a) | 350,000 | 309,764 |
1.85%, 09/01/32 (a) | 250,000 | 196,025 |
5.25%, 11/26/43 | 150,000 | 150,773 |
Colgate-Palmolive Co. | ||
3.10%, 08/15/27 (a) | 300,000 | 285,855 |
3.25%, 08/15/32 (a) | 250,000 | 229,667 |
4.60%, 03/01/33 (a) | 300,000 | 305,820 |
4.00%, 08/15/45 | 200,000 | 182,318 |
3.70%, 08/01/47 (a) | 27,000 | 23,706 |
SECURITY RATE, MATURITY DATE | FACE AMOUNT ($) | VALUE ($) |
CommonSpirit Health | ||
2.76%, 10/01/24 (a) | 300,000 | 288,873 |
6.07%, 11/01/27 (a) | 300,000 | 305,967 |
3.35%, 10/01/29 (a) | 350,000 | 308,276 |
4.35%, 11/01/42 | 200,000 | 171,656 |
3.82%, 10/01/49 (a) | 150,000 | 114,548 |
4.19%, 10/01/49 (a) | 275,000 | 226,240 |
3.91%, 10/01/50 (a) | 225,000 | 174,465 |
Community Health Network, Inc. | ||
3.10%, 05/01/50 (a) | 150,000 | 97,617 |
Conagra Brands, Inc. | ||
4.60%, 11/01/25 (a) | 250,000 | 244,567 |
1.38%, 11/01/27 (a) | 400,000 | 339,520 |
7.00%, 10/01/28 | 100,000 | 106,718 |
4.85%, 11/01/28 (a) | 400,000 | 390,452 |
8.25%, 09/15/30 | 50,000 | 57,971 |
5.30%, 11/01/38 (a) | 300,000 | 289,065 |
5.40%, 11/01/48 (a) | 300,000 | 286,578 |
Constellation Brands, Inc. | ||
4.75%, 11/15/24 | 350,000 | 345,852 |
4.40%, 11/15/25 (a) | 250,000 | 245,082 |
4.75%, 12/01/25 | 200,000 | 197,032 |
3.70%, 12/06/26 (a) | 200,000 | 190,882 |
4.35%, 05/09/27 (a) | 25,000 | 24,451 |
3.60%, 02/15/28 (a) | 100,000 | 94,054 |
4.65%, 11/15/28 (a) | 250,000 | 245,842 |
3.15%, 08/01/29 (a) | 400,000 | 361,640 |
2.88%, 05/01/30 (a) | 200,000 | 174,012 |
2.25%, 08/01/31 (a) | 200,000 | 163,746 |
4.75%, 05/09/32 (a) | 200,000 | 194,340 |
4.50%, 05/09/47 (a) | 175,000 | 151,547 |
4.10%, 02/15/48 (a) | 175,000 | 142,893 |
5.25%, 11/15/48 (a) | 200,000 | 192,616 |
3.75%, 05/01/50 (a) | 100,000 | 78,865 |
Cottage Health Obligated Group | ||
3.30%, 11/01/49 (a) | 150,000 | 111,459 |
CVS Health Corp. | ||
3.38%, 08/12/24 (a) | 150,000 | 146,259 |
2.63%, 08/15/24 (a) | 300,000 | 290,196 |
4.10%, 03/25/25 (a) | 300,000 | 293,880 |
3.88%, 07/20/25 (a) | 750,000 | 729,427 |
5.00%, 02/20/26 (a) | 400,000 | 398,432 |
2.88%, 06/01/26 (a) | 400,000 | 376,420 |
3.00%, 08/15/26 (a) | 250,000 | 234,570 |
3.63%, 04/01/27 (a) | 350,000 | 332,444 |
6.25%, 06/01/27 | 200,000 | 207,746 |
1.30%, 08/21/27 (a) | 350,000 | 301,675 |
4.30%, 03/25/28 (a) | 1,472,000 | 1,421,113 |
5.00%, 01/30/29 (a) | 250,000 | 247,685 |
3.25%, 08/15/29 (a) | 500,000 | 449,525 |
5.13%, 02/21/30 (a) | 400,000 | 397,564 |
3.75%, 04/01/30 (a) | 400,000 | 367,320 |
1.75%, 08/21/30 (a) | 100,000 | 79,944 |
5.25%, 01/30/31 (a) | 200,000 | 199,494 |
1.88%, 02/28/31 (a) | 400,000 | 318,188 |
2.13%, 09/15/31 (a) | 300,000 | 241,200 |
5.25%, 02/21/33 (a) | 400,000 | 398,692 |
5.30%, 06/01/33 (a) | 350,000 | 349,716 |
4.88%, 07/20/35 (a) | 200,000 | 190,434 |
4.78%, 03/25/38 (a) | 1,400,000 | 1,291,780 |
6.13%, 09/15/39 | 150,000 | 156,303 |
4.13%, 04/01/40 (a) | 300,000 | 252,966 |
2.70%, 08/21/40 (a) | 400,000 | 279,372 |
5.30%, 12/05/43 (a) | 200,000 | 191,464 |
5.13%, 07/20/45 (a) | 900,000 | 834,003 |
5.05%, 03/25/48 (a) | 2,200,000 | 2,030,754 |
4.25%, 04/01/50 (a) | 250,000 | 207,680 |
SECURITY RATE, MATURITY DATE | FACE AMOUNT ($) | VALUE ($) |
5.63%, 02/21/53 (a) | 350,000 | 347,931 |
5.88%, 06/01/53 (a) | 350,000 | 359,800 |
6.00%, 06/01/63 (a) | 200,000 | 205,860 |
Danaher Corp. | ||
3.35%, 09/15/25 (a) | 150,000 | 144,459 |
4.38%, 09/15/45 (a) | 75,000 | 68,903 |
2.60%, 10/01/50 (a) | 250,000 | 168,875 |
2.80%, 12/10/51 (a) | 250,000 | 172,953 |
Dartmouth-Hitchcock Health | ||
4.18%, 08/01/48 (a) | 125,000 | 99,305 |
DENTSPLY SIRONA, Inc. | ||
3.25%, 06/01/30 (a) | 250,000 | 217,167 |
DH Europe Finance II Sarl | ||
2.20%, 11/15/24 (a) | 200,000 | 191,584 |
2.60%, 11/15/29 (a) | 250,000 | 220,172 |
3.25%, 11/15/39 (a) | 200,000 | 163,460 |
3.40%, 11/15/49 (a) | 300,000 | 235,224 |
Diageo Capital PLC | ||
2.13%, 10/24/24 (a) | 200,000 | 191,318 |
1.38%, 09/29/25 (a) | 200,000 | 184,222 |
5.30%, 10/24/27 (a) | 300,000 | 305,505 |
3.88%, 05/18/28 (a) | 250,000 | 239,577 |
2.38%, 10/24/29 (a) | 200,000 | 173,756 |
2.00%, 04/29/30 (a) | 350,000 | 295,256 |
2.13%, 04/29/32 (a) | 250,000 | 203,395 |
5.50%, 01/24/33 (a) | 225,000 | 238,639 |
5.88%, 09/30/36 | 200,000 | 214,846 |
3.88%, 04/29/43 (a) | 50,000 | 42,685 |
Diageo Investment Corp. | ||
7.45%, 04/15/35 | 100,000 | 121,294 |
4.25%, 05/11/42 | 100,000 | 91,256 |
Dignity Health | ||
4.50%, 11/01/42 | 100,000 | 87,462 |
5.27%, 11/01/64 | 100,000 | 93,039 |
Duke University Health System, Inc. | ||
3.92%, 06/01/47 (a) | 200,000 | 167,714 |
Edwards Lifesciences Corp. | ||
4.30%, 06/15/28 (a) | 250,000 | 241,885 |
Eli Lilly & Co. | ||
2.75%, 06/01/25 (a) | 50,000 | 48,082 |
5.00%, 02/27/26 (a) | 250,000 | 250,517 |
3.10%, 05/15/27 (a) | 250,000 | 238,202 |
3.38%, 03/15/29 (a) | 350,000 | 329,885 |
4.70%, 02/27/33 (a) | 500,000 | 506,530 |
3.70%, 03/01/45 (a) | 50,000 | 42,686 |
3.95%, 05/15/47 (a) | 150,000 | 135,011 |
3.95%, 03/15/49 (a) | 350,000 | 313,162 |
2.25%, 05/15/50 (a) | 450,000 | 295,015 |
4.15%, 03/15/59 (a) | 175,000 | 155,712 |
2.50%, 09/15/60 (a) | 300,000 | 189,429 |
4.95%, 02/27/63 (a) | 200,000 | 204,274 |
Estee Lauder Cos., Inc. | ||
2.00%, 12/01/24 (a) | 100,000 | 95,488 |
3.15%, 03/15/27 (a) | 250,000 | 237,885 |
4.38%, 05/15/28 (a) | 200,000 | 197,140 |
2.38%, 12/01/29 (a) | 200,000 | 173,168 |
2.60%, 04/15/30 (a) | 250,000 | 219,125 |
4.65%, 05/15/33 (a) | 200,000 | 196,976 |
4.38%, 06/15/45 (a) | 150,000 | 133,550 |
4.15%, 03/15/47 (a) | 150,000 | 131,930 |
3.13%, 12/01/49 (a) | 300,000 | 220,866 |
5.15%, 05/15/53 (a) | 150,000 | 152,837 |
Flowers Foods, Inc. | ||
2.40%, 03/15/31 (a) | 200,000 | 163,728 |
SECURITY RATE, MATURITY DATE | FACE AMOUNT ($) | VALUE ($) |
Fomento Economico Mexicano S.A.B. de C.V. | ||
3.50%, 01/16/50 (a) | 600,000 | 460,938 |
Franciscan Missionaries of Our Lady Health System, Inc. | ||
3.91%, 07/01/49 (a) | 50,000 | 37,609 |
GE HealthCare Technologies, Inc. | ||
5.55%, 11/15/24 | 250,000 | 249,000 |
5.60%, 11/15/25 (a) | 400,000 | 400,712 |
5.65%, 11/15/27 (a) | 450,000 | 455,427 |
5.86%, 03/15/30 (a) | 350,000 | 359,891 |
5.91%, 11/22/32 (a) | 500,000 | 523,215 |
6.38%, 11/22/52 (a) | 300,000 | 334,158 |
General Mills, Inc. | ||
4.00%, 04/17/25 (a) | 200,000 | 195,212 |
3.20%, 02/10/27 (a) | 300,000 | 283,950 |
4.20%, 04/17/28 (a) | 325,000 | 316,062 |
2.88%, 04/15/30 (a) | 350,000 | 311,318 |
2.25%, 10/14/31 (a) | 200,000 | 164,262 |
4.95%, 03/29/33 (a) | 300,000 | 297,885 |
4.70%, 04/17/48 (a) | 50,000 | 47,022 |
3.00%, 02/01/51 (a) | 401,000 | 285,163 |
Gilead Sciences, Inc. | ||
3.50%, 02/01/25 (a) | 600,000 | 581,916 |
3.65%, 03/01/26 (a) | 800,000 | 770,360 |
2.95%, 03/01/27 (a) | 350,000 | 328,800 |
1.20%, 10/01/27 (a) | 300,000 | 259,194 |
4.60%, 09/01/35 (a) | 375,000 | 362,569 |
4.00%, 09/01/36 (a) | 300,000 | 271,110 |
5.65%, 12/01/41 (a) | 200,000 | 210,634 |
4.80%, 04/01/44 (a) | 550,000 | 526,542 |
4.50%, 02/01/45 (a) | 400,000 | 365,576 |
4.75%, 03/01/46 (a) | 650,000 | 613,301 |
4.15%, 03/01/47 (a) | 575,000 | 499,577 |
2.80%, 10/01/50 (a) | 500,000 | 340,120 |
GlaxoSmithKline Capital PLC | ||
3.38%, 06/01/29 (a) | 150,000 | 139,421 |
GlaxoSmithKline Capital, Inc. | ||
3.63%, 05/15/25 | 250,000 | 243,285 |
3.88%, 05/15/28 | 550,000 | 529,589 |
5.38%, 04/15/34 | 130,000 | 137,484 |
6.38%, 05/15/38 | 775,000 | 886,026 |
4.20%, 03/18/43 | 175,000 | 158,200 |
GSK Consumer Healthcare Capital US LLC | ||
3.13%, 03/24/25 | 500,000 | 478,060 |
3.38%, 03/24/27 (a) | 500,000 | 468,385 |
Hackensack Meridian Health, Inc. | ||
2.68%, 09/01/41 (a) | 200,000 | 141,452 |
4.21%, 07/01/48 (a) | 100,000 | 87,289 |
4.50%, 07/01/57 (a) | 150,000 | 133,425 |
Haleon US Capital LLC | ||
3.38%, 03/24/29 (a) | 300,000 | 272,883 |
3.63%, 03/24/32 (a) | 500,000 | 448,645 |
4.00%, 03/24/52 (a) | 300,000 | 249,528 |
Hartford HealthCare Corp. | ||
3.45%, 07/01/54 | 125,000 | 90,050 |
Hasbro, Inc. | ||
3.00%, 11/19/24 (a) | 150,000 | 144,329 |
3.55%, 11/19/26 (a) | 200,000 | 186,024 |
3.50%, 09/15/27 (a) | 200,000 | 186,502 |
3.90%, 11/19/29 (a) | 200,000 | 181,400 |
6.35%, 03/15/40 | 150,000 | 153,750 |
5.10%, 05/15/44 (a) | 100,000 | 88,515 |
HCA, Inc. | ||
5.38%, 02/01/25 | 750,000 | 744,030 |
5.25%, 04/15/25 | 350,000 | 345,698 |
5.88%, 02/15/26 (a) | 500,000 | 500,540 |
SECURITY RATE, MATURITY DATE | FACE AMOUNT ($) | VALUE ($) |
5.25%, 06/15/26 (a) | 250,000 | 247,410 |
5.38%, 09/01/26 (a) | 300,000 | 297,729 |
4.50%, 02/15/27 (a) | 350,000 | 338,383 |
3.13%, 03/15/27 (a)(c) | 350,000 | 321,650 |
5.20%, 06/01/28 (a) | 250,000 | 248,727 |
5.63%, 09/01/28 (a) | 500,000 | 501,345 |
5.88%, 02/01/29 (a) | 250,000 | 251,750 |
3.38%, 03/15/29 (a)(c) | 150,000 | 133,355 |
4.13%, 06/15/29 (a) | 550,000 | 509,624 |
3.50%, 09/01/30 (a) | 750,000 | 657,322 |
2.38%, 07/15/31 (a) | 200,000 | 160,136 |
3.63%, 03/15/32 (a)(c) | 500,000 | 434,350 |
5.50%, 06/01/33 (a) | 300,000 | 299,595 |
5.13%, 06/15/39 (a) | 225,000 | 209,884 |
4.38%, 03/15/42 (a)(c) | 150,000 | 123,752 |
5.50%, 06/15/47 (a) | 400,000 | 376,664 |
5.25%, 06/15/49 (a) | 550,000 | 498,998 |
3.50%, 07/15/51 (a) | 450,000 | 311,188 |
4.63%, 03/15/52 (a)(c) | 600,000 | 494,010 |
5.90%, 06/01/53 (a) | 250,000 | 248,067 |
Hershey Co. | ||
0.90%, 06/01/25 (a) | 200,000 | 184,390 |
2.30%, 08/15/26 (a) | 310,000 | 289,704 |
2.45%, 11/15/29 (a) | 100,000 | 88,027 |
3.13%, 11/15/49 (a) | 150,000 | 111,072 |
2.65%, 06/01/50 (a) | 150,000 | 101,765 |
Hoag Memorial Hospital Presbyterian | ||
3.80%, 07/15/52 (a) | 175,000 | 142,329 |
Hormel Foods Corp. | ||
1.70%, 06/03/28 (a) | 150,000 | 130,380 |
1.80%, 06/11/30 (a) | 250,000 | 209,093 |
3.05%, 06/03/51 (a) | 250,000 | 178,888 |
Hospital Special Surgery | ||
Series 2020 2.67%, 10/01/50 (a) | 125,000 | 78,996 |
IHC Health Services, Inc. | ||
4.13%, 05/15/48 (a) | 150,000 | 141,927 |
Illumina, Inc. | ||
5.75%, 12/13/27 (a) | 250,000 | 251,770 |
2.55%, 03/23/31 (a) | 175,000 | 145,233 |
Indiana University Health, Inc. Obligated Group | ||
3.97%, 11/01/48 (a) | 140,000 | 118,772 |
2.85%, 11/01/51 (a) | 50,000 | 33,654 |
Ingredion, Inc. | ||
3.20%, 10/01/26 (a) | 150,000 | 139,944 |
2.90%, 06/01/30 (a) | 250,000 | 216,515 |
3.90%, 06/01/50 (a) | 100,000 | 74,734 |
Inova Health System Foundation | ||
4.07%, 05/15/52 (a) | 150,000 | 128,541 |
Integris Baptist Medical Center, Inc. | ||
3.88%, 08/15/50 (a) | 150,000 | 114,762 |
Iowa Health System | ||
Series 2020 3.67%, 02/15/50 (a) | 100,000 | 76,836 |
IQVIA, Inc. | ||
5.70%, 05/15/28 (a)(c) | 200,000 | 198,286 |
JBS USA LUX S.A. | ||
2.50%, 01/15/27 (a)(c) | 300,000 | 263,706 |
5.13%, 02/01/28 (a)(c) | 250,000 | 240,517 |
5.50%, 01/15/30 (a)(c) | 400,000 | 383,840 |
3.75%, 12/01/31 (a)(c) | 200,000 | 165,418 |
3.63%, 01/15/32 (a)(c) | 250,000 | 203,095 |
3.00%, 05/15/32 (a)(c) | 425,000 | 329,303 |
5.75%, 04/01/33 (a)(c) | 500,000 | 471,950 |
SECURITY RATE, MATURITY DATE | FACE AMOUNT ($) | VALUE ($) |
4.38%, 02/02/52 (a)(c) | 300,000 | 211,653 |
6.50%, 12/01/52 (a)(c) | 375,000 | 356,220 |
JM Smucker Co. | ||
3.50%, 03/15/25 | 250,000 | 241,752 |
2.38%, 03/15/30 (a) | 200,000 | 170,564 |
2.13%, 03/15/32 (a) | 200,000 | 160,406 |
4.25%, 03/15/35 | 250,000 | 228,097 |
4.38%, 03/15/45 | 200,000 | 173,746 |
3.55%, 03/15/50 (a) | 100,000 | 73,755 |
Johnson & Johnson | ||
2.63%, 01/15/25 (a) | 220,000 | 212,938 |
0.55%, 09/01/25 (a) | 350,000 | 320,120 |
2.45%, 03/01/26 (a) | 500,000 | 472,660 |
2.95%, 03/03/27 (a) | 300,000 | 286,206 |
0.95%, 09/01/27 (a) | 450,000 | 393,777 |
2.90%, 01/15/28 (a) | 350,000 | 329,850 |
6.95%, 09/01/29 | 100,000 | 115,437 |
1.30%, 09/01/30 (a) | 500,000 | 411,160 |
4.95%, 05/15/33 | 100,000 | 105,536 |
4.38%, 12/05/33 (a) | 250,000 | 252,280 |
3.55%, 03/01/36 (a) | 317,000 | 285,934 |
3.63%, 03/03/37 (a) | 550,000 | 496,408 |
3.40%, 01/15/38 (a) | 300,000 | 261,849 |
5.85%, 07/15/38 | 232,000 | 259,808 |
2.10%, 09/01/40 (a) | 400,000 | 282,348 |
4.50%, 09/01/40 | 50,000 | 49,601 |
4.85%, 05/15/41 | 150,000 | 151,247 |
4.50%, 12/05/43 (a) | 200,000 | 198,460 |
3.70%, 03/01/46 (a) | 575,000 | 507,058 |
3.75%, 03/03/47 (a) | 200,000 | 176,600 |
3.50%, 01/15/48 (a) | 75,000 | 64,166 |
2.25%, 09/01/50 (a) | 425,000 | 282,408 |
2.45%, 09/01/60 (a) | 450,000 | 289,993 |
Kaiser Foundation Hospitals | ||
3.15%, 05/01/27 (a) | 250,000 | 235,445 |
2.81%, 06/01/41 (a) | 425,000 | 312,604 |
4.88%, 04/01/42 | 50,000 | 48,612 |
4.15%, 05/01/47 (a) | 275,000 | 241,967 |
3.27%, 11/01/49 (a) | 350,000 | 261,191 |
3.00%, 06/01/51 (a) | 450,000 | 316,228 |
Kellogg Co. | ||
4.30%, 05/15/28 (a) | 350,000 | 339,255 |
2.10%, 06/01/30 (a) | 250,000 | 207,413 |
7.45%, 04/01/31 | 50,000 | 57,030 |
4.50%, 04/01/46 | 231,000 | 205,509 |
Kenvue, Inc. | ||
5.50%, 03/22/25 (c) | 200,000 | 200,578 |
5.35%, 03/22/26 (a)(c) | 200,000 | 201,596 |
5.00%, 03/22/30 (a)(c) | 200,000 | 202,028 |
4.90%, 03/22/33 (a)(c) | 400,000 | 405,012 |
5.10%, 03/22/43 (a)(c) | 200,000 | 203,542 |
5.05%, 03/22/53 (a)(c) | 500,000 | 510,325 |
5.20%, 03/22/63 (a)(c) | 200,000 | 204,976 |
Keurig Dr Pepper, Inc. | ||
4.42%, 05/25/25 (a) | 150,000 | 147,413 |
3.40%, 11/15/25 (a) | 200,000 | 191,800 |
2.55%, 09/15/26 (a) | 250,000 | 230,492 |
3.43%, 06/15/27 (a) | 200,000 | 189,000 |
4.60%, 05/25/28 (a) | 400,000 | 392,296 |
3.20%, 05/01/30 (a) | 300,000 | 269,376 |
2.25%, 03/15/31 (a) | 250,000 | 206,120 |
4.50%, 11/15/45 (a) | 150,000 | 131,969 |
4.42%, 12/15/46 (a) | 200,000 | 171,464 |
5.09%, 05/25/48 (a) | 75,000 | 71,468 |
3.80%, 05/01/50 (a) | 250,000 | 197,805 |
4.50%, 04/15/52 (a) | 400,000 | 353,200 |
SECURITY RATE, MATURITY DATE | FACE AMOUNT ($) | VALUE ($) |
Kimberly-Clark Corp. | ||
2.75%, 02/15/26 | 150,000 | 142,328 |
1.05%, 09/15/27 (a) | 200,000 | 172,892 |
3.95%, 11/01/28 (a) | 200,000 | 194,480 |
3.20%, 04/25/29 (a) | 200,000 | 186,040 |
3.10%, 03/26/30 (a) | 200,000 | 182,786 |
2.00%, 11/02/31 (a) | 150,000 | 124,166 |
6.63%, 08/01/37 | 475,000 | 560,125 |
5.30%, 03/01/41 | 300,000 | 311,967 |
3.20%, 07/30/46 (a) | 100,000 | 75,640 |
Koninklijke Ahold Delhaize N.V. | ||
5.70%, 10/01/40 | 173,000 | 175,355 |
Koninklijke Philips N.V. | ||
6.88%, 03/11/38 | 217,000 | 241,816 |
5.00%, 03/15/42 | 150,000 | 137,711 |
Kraft Heinz Foods Co. | ||
3.00%, 06/01/26 (a) | 500,000 | 471,955 |
3.88%, 05/15/27 (a) | 400,000 | 384,276 |
4.63%, 01/30/29 (a) | 100,000 | 98,637 |
3.75%, 04/01/30 (a) | 250,000 | 232,537 |
6.75%, 03/15/32 | 250,000 | 276,310 |
5.00%, 07/15/35 (a) | 200,000 | 197,216 |
6.88%, 01/26/39 | 175,000 | 197,467 |
4.63%, 10/01/39 (a) | 125,000 | 113,254 |
6.50%, 02/09/40 | 200,000 | 216,250 |
5.00%, 06/04/42 | 450,000 | 422,172 |
5.20%, 07/15/45 (a) | 500,000 | 476,065 |
4.38%, 06/01/46 (a) | 600,000 | 512,754 |
4.88%, 10/01/49 (a) | 300,000 | 273,930 |
5.50%, 06/01/50 (a) | 200,000 | 199,284 |
Kroger Co. | ||
4.50%, 01/15/29 (a) | 200,000 | 195,846 |
2.20%, 05/01/30 (a) | 250,000 | 207,295 |
1.70%, 01/15/31 (a) | 200,000 | 157,000 |
7.50%, 04/01/31 | 100,000 | 114,030 |
6.90%, 04/15/38 | 190,000 | 212,245 |
5.40%, 07/15/40 (a) | 50,000 | 48,303 |
5.00%, 04/15/42 (a) | 100,000 | 91,690 |
5.15%, 08/01/43 (a) | 117,000 | 108,336 |
3.88%, 10/15/46 (a) | 100,000 | 77,425 |
4.45%, 02/01/47 (a) | 400,000 | 349,896 |
4.65%, 01/15/48 (a) | 50,000 | 44,209 |
5.40%, 01/15/49 (a) | 200,000 | 198,332 |
3.95%, 01/15/50 (a) | 120,000 | 96,347 |
Laboratory Corp. of America Holdings | ||
3.25%, 09/01/24 (a) | 200,000 | 193,972 |
2.30%, 12/01/24 (a) | 200,000 | 190,266 |
3.60%, 02/01/25 (a) | 150,000 | 145,277 |
1.55%, 06/01/26 (a) | 96,000 | 85,758 |
3.60%, 09/01/27 (a) | 200,000 | 189,972 |
2.95%, 12/01/29 (a) | 250,000 | 219,767 |
2.70%, 06/01/31 (a) | 150,000 | 127,430 |
4.70%, 02/01/45 (a) | 250,000 | 217,367 |
Mass General Brigham, Inc. | ||
3.77%, 07/01/48 (a) | 100,000 | 80,756 |
3.19%, 07/01/49 (a) | 125,000 | 91,379 |
4.12%, 07/01/55 | 100,000 | 83,644 |
3.34%, 07/01/60 (a) | 175,000 | 122,644 |
Mattel, Inc. | ||
5.45%, 11/01/41 (a) | 150,000 | 125,481 |
Mayo Clinic | ||
3.77%, 11/15/43 | 100,000 | 84,750 |
4.00%, 11/15/47 | 75,000 | 64,275 |
4.13%, 11/15/52 | 100,000 | 87,288 |
3.20%, 11/15/61 (a) | 150,000 | 102,335 |
SECURITY RATE, MATURITY DATE | FACE AMOUNT ($) | VALUE ($) |
McCormick & Co., Inc. | ||
3.15%, 08/15/24 (a) | 150,000 | 145,745 |
0.90%, 02/15/26 (a) | 150,000 | 133,889 |
3.40%, 08/15/27 (a) | 250,000 | 234,287 |
2.50%, 04/15/30 (a) | 200,000 | 169,520 |
4.20%, 08/15/47 (a) | 275,000 | 228,874 |
McKesson Corp. | ||
0.90%, 12/03/25 (a) | 250,000 | 224,322 |
1.30%, 08/15/26 (a) | 400,000 | 355,924 |
3.95%, 02/16/28 (a) | 100,000 | 96,525 |
McLaren Health Care Corp. | ||
Series A 4.39%, 05/15/48 (a) | 150,000 | 132,720 |
Mead Johnson Nutrition Co. | ||
4.13%, 11/15/25 (a) | 200,000 | 195,322 |
5.90%, 11/01/39 | 125,000 | 132,086 |
4.60%, 06/01/44 (a) | 175,000 | 158,293 |
MedStar Health, Inc. | ||
3.63%, 08/15/49 | 100,000 | 74,671 |
Medtronic Global Holdings SCA | ||
4.25%, 03/30/28 (a) | 250,000 | 244,315 |
4.50%, 03/30/33 (a) | 300,000 | 294,702 |
Medtronic, Inc. | ||
4.38%, 03/15/35 | 550,000 | 528,412 |
4.63%, 03/15/45 | 550,000 | 535,887 |
Memorial Health Services | ||
3.45%, 11/01/49 (a) | 100,000 | 74,512 |
Memorial Sloan-Kettering Cancer Center | ||
5.00%, 07/01/42 | 130,000 | 127,033 |
2.96%, 01/01/50 (a) | 150,000 | 104,750 |
4.13%, 07/01/52 | 50,000 | 42,648 |
4.20%, 07/01/55 | 200,000 | 171,520 |
Merck & Co., Inc. | ||
2.75%, 02/10/25 (a) | 700,000 | 675,003 |
0.75%, 02/24/26 (a) | 300,000 | 271,311 |
1.70%, 06/10/27 (a) | 450,000 | 403,245 |
1.90%, 12/10/28 (a) | 300,000 | 262,440 |
3.40%, 03/07/29 (a) | 500,000 | 469,195 |
4.30%, 05/17/30 (a) | 300,000 | 293,742 |
1.45%, 06/24/30 (a) | 350,000 | 285,869 |
2.15%, 12/10/31 (a) | 600,000 | 497,706 |
4.50%, 05/17/33 (a) | 400,000 | 397,500 |
6.50%, 12/01/33 (g) | 275,000 | 316,822 |
3.90%, 03/07/39 (a) | 250,000 | 225,120 |
2.35%, 06/24/40 (a) | 300,000 | 215,454 |
3.60%, 09/15/42 (a) | 175,000 | 146,088 |
4.15%, 05/18/43 | 350,000 | 319,455 |
4.90%, 05/17/44 (a) | 300,000 | 300,957 |
3.70%, 02/10/45 (a) | 500,000 | 425,575 |
4.00%, 03/07/49 (a) | 450,000 | 398,700 |
2.45%, 06/24/50 (a) | 400,000 | 263,052 |
2.75%, 12/10/51 (a) | 575,000 | 397,428 |
5.00%, 05/17/53 (a) | 400,000 | 405,828 |
2.90%, 12/10/61 (a) | 350,000 | 232,995 |
5.15%, 05/17/63 (a) | 250,000 | 255,332 |
Merck Sharp & Dohme Corp. | ||
5.95%, 12/01/28 | 50,000 | 53,324 |
5.75%, 11/15/36 | 100,000 | 107,196 |
Methodist Hospital | ||
2.71%, 12/01/50 (a) | 175,000 | 114,224 |
Molson Coors Beverage Co. | ||
3.00%, 07/15/26 (a) | 540,000 | 505,197 |
5.00%, 05/01/42 | 300,000 | 279,660 |
4.20%, 07/15/46 (a) | 450,000 | 372,879 |
SECURITY RATE, MATURITY DATE | FACE AMOUNT ($) | VALUE ($) |
Mondelez International, Inc. | ||
1.50%, 05/04/25 (a) | 250,000 | 233,402 |
2.63%, 03/17/27 (a) | 250,000 | 231,070 |
2.75%, 04/13/30 (a) | 225,000 | 197,435 |
1.50%, 02/04/31 (a) | 200,000 | 157,414 |
3.00%, 03/17/32 (a) | 250,000 | 216,852 |
1.88%, 10/15/32 (a) | 250,000 | 194,743 |
2.63%, 09/04/50 (a) | 250,000 | 162,513 |
Montefiore Obligated Group | ||
5.25%, 11/01/48 | 125,000 | 95,045 |
4.29%, 09/01/50 | 100,000 | 63,440 |
Mount Nittany Medical Center Obligated Group | ||
3.80%, 11/15/52 | 75,000 | 57,975 |
Mount Sinai Hospitals Group, Inc. | ||
3.98%, 07/01/48 | 100,000 | 79,911 |
3.74%, 07/01/49 (a) | 150,000 | 116,420 |
3.39%, 07/01/50 (a) | 125,000 | 86,015 |
MultiCare Health System | ||
2.80%, 08/15/50 (a) | 125,000 | 76,146 |
Mylan, Inc. | ||
4.55%, 04/15/28 (a) | 200,000 | 188,880 |
5.40%, 11/29/43 (a) | 150,000 | 125,889 |
5.20%, 04/15/48 (a) | 225,000 | 175,543 |
MyMichigan Health | ||
3.41%, 06/01/50 (a) | 100,000 | 70,845 |
New York and Presbyterian Hospital | ||
2.26%, 08/01/40 (a) | 150,000 | 101,810 |
4.02%, 08/01/45 | 100,000 | 84,772 |
4.06%, 08/01/56 | 100,000 | 84,661 |
2.61%, 08/01/60 (a) | 100,000 | 59,079 |
3.95%, 08/01/19 (a) | 175,000 | 127,447 |
Northwell Healthcare, Inc. | ||
3.98%, 11/01/46 (a) | 150,000 | 116,748 |
4.26%, 11/01/47 (a) | 250,000 | 206,140 |
3.81%, 11/01/49 (a) | 125,000 | 94,688 |
Northwestern Memorial Healthcare Obligated Group | ||
2.63%, 07/15/51 (a) | 125,000 | 81,471 |
Novant Health, Inc. | ||
2.64%, 11/01/36 (a) | 150,000 | 113,378 |
3.17%, 11/01/51 (a) | 175,000 | 125,687 |
3.32%, 11/01/61 (a) | 125,000 | 86,764 |
Novartis Capital Corp. | ||
1.75%, 02/14/25 (a) | 350,000 | 331,859 |
3.00%, 11/20/25 (a) | 450,000 | 430,794 |
2.00%, 02/14/27 (a) | 200,000 | 183,430 |
3.10%, 05/17/27 (a) | 250,000 | 238,445 |
2.20%, 08/14/30 (a) | 450,000 | 389,749 |
3.70%, 09/21/42 | 150,000 | 129,002 |
4.40%, 05/06/44 | 525,000 | 504,598 |
4.00%, 11/20/45 (a) | 375,000 | 339,139 |
2.75%, 08/14/50 (a) | 350,000 | 254,943 |
NYU Langone Hospitals | ||
5.75%, 07/01/43 | 125,000 | 130,508 |
4.78%, 07/01/44 | 100,000 | 93,163 |
4.37%, 07/01/47 (a) | 155,000 | 136,578 |
3.38%, 07/01/55 (a) | 150,000 | 106,169 |
OhioHealth Corp. | ||
2.30%, 11/15/31 (a) | 125,000 | 101,993 |
2.83%, 11/15/41 (a) | 50,000 | 36,337 |
3.04%, 11/15/50 (a) | 150,000 | 108,380 |
Orlando Health Obligated Group | ||
4.09%, 10/01/48 (a) | 100,000 | 82,958 |
3.33%, 10/01/50 (a) | 100,000 | 73,310 |
SECURITY RATE, MATURITY DATE | FACE AMOUNT ($) | VALUE ($) |
PeaceHealth Obligated Group | ||
1.38%, 11/15/25 (a) | 150,000 | 135,291 |
4.79%, 11/15/48 (a) | 75,000 | 67,046 |
3.22%, 11/15/50 (a) | 150,000 | 101,385 |
PepsiCo, Inc. | ||
2.25%, 03/19/25 (a) | 550,000 | 524,843 |
2.75%, 04/30/25 (a) | 300,000 | 287,118 |
3.50%, 07/17/25 (a) | 200,000 | 194,866 |
2.85%, 02/24/26 (a) | 300,000 | 286,596 |
2.38%, 10/06/26 (a) | 300,000 | 281,697 |
2.63%, 03/19/27 (a) | 250,000 | 233,782 |
3.00%, 10/15/27 (a) | 500,000 | 470,995 |
3.60%, 02/18/28 (a) | 300,000 | 289,320 |
2.63%, 07/29/29 (a) | 400,000 | 360,560 |
2.75%, 03/19/30 (a) | 500,000 | 450,490 |
1.63%, 05/01/30 (a) | 225,000 | 187,565 |
1.40%, 02/25/31 (a) | 200,000 | 161,180 |
1.95%, 10/21/31 (a) | 400,000 | 331,196 |
3.90%, 07/18/32 (a) | 300,000 | 289,182 |
3.50%, 03/19/40 (a) | 200,000 | 169,288 |
4.00%, 03/05/42 | 250,000 | 226,280 |
3.60%, 08/13/42 | 295,000 | 252,842 |
4.45%, 04/14/46 (a) | 450,000 | 435,730 |
3.45%, 10/06/46 (a) | 450,000 | 373,104 |
4.00%, 05/02/47 (a) | 225,000 | 208,168 |
3.38%, 07/29/49 (a) | 250,000 | 204,968 |
2.88%, 10/15/49 (a) | 250,000 | 189,000 |
3.63%, 03/19/50 (a) | 300,000 | 256,104 |
2.75%, 10/21/51 (a) | 200,000 | 144,310 |
3.88%, 03/19/60 (a) | 250,000 | 217,887 |
PerkinElmer, Inc. | ||
1.90%, 09/15/28 (a) | 250,000 | 211,737 |
3.30%, 09/15/29 (a) | 250,000 | 223,675 |
2.25%, 09/15/31 (a) | 200,000 | 161,072 |
3.63%, 03/15/51 (a) | 125,000 | 91,105 |
Pfizer Investment Enterprises Pte. Ltd. | ||
4.65%, 05/19/25 | 750,000 | 743,482 |
4.45%, 05/19/26 (a) | 900,000 | 889,380 |
4.45%, 05/19/28 (a) | 1,100,000 | 1,082,455 |
4.65%, 05/19/30 (a) | 1,000,000 | 988,950 |
4.75%, 05/19/33 (a) | 1,350,000 | 1,346,341 |
5.11%, 05/19/43 (a) | 800,000 | 801,032 |
5.30%, 05/19/53 (a) | 1,600,000 | 1,667,728 |
5.34%, 05/19/63 (a) | 1,200,000 | 1,215,852 |
Pfizer, Inc. | ||
0.80%, 05/28/25 (a) | 150,000 | 138,770 |
2.75%, 06/03/26 | 400,000 | 378,324 |
3.00%, 12/15/26 | 550,000 | 520,195 |
3.60%, 09/15/28 (a) | 300,000 | 288,030 |
3.45%, 03/15/29 (a) | 500,000 | 470,860 |
2.63%, 04/01/30 (a) | 300,000 | 267,027 |
1.70%, 05/28/30 (a) | 250,000 | 207,885 |
1.75%, 08/18/31 (a) | 300,000 | 244,398 |
4.00%, 12/15/36 | 250,000 | 233,782 |
4.10%, 09/15/38 (a) | 200,000 | 182,286 |
3.90%, 03/15/39 (a) | 300,000 | 268,911 |
7.20%, 03/15/39 | 650,000 | 809,965 |
2.55%, 05/28/40 (a) | 300,000 | 221,211 |
5.60%, 09/15/40 | 200,000 | 216,098 |
4.30%, 06/15/43 | 150,000 | 138,845 |
4.40%, 05/15/44 | 350,000 | 332,794 |
4.13%, 12/15/46 | 200,000 | 180,460 |
4.20%, 09/15/48 (a) | 300,000 | 276,735 |
4.00%, 03/15/49 (a) | 375,000 | 335,985 |
2.70%, 05/28/50 (a) | 250,000 | 177,100 |
Pharmacia LLC | ||
6.60%, 12/01/28 | 200,000 | 215,774 |
SECURITY RATE, MATURITY DATE | FACE AMOUNT ($) | VALUE ($) |
Philip Morris International, Inc. | ||
3.25%, 11/10/24 | 200,000 | 194,430 |
5.13%, 11/15/24 | 300,000 | 298,833 |
1.50%, 05/01/25 (a) | 200,000 | 187,146 |
3.38%, 08/11/25 (a) | 150,000 | 144,563 |
5.00%, 11/17/25 | 200,000 | 199,214 |
4.88%, 02/13/26 | 700,000 | 695,205 |
2.75%, 02/25/26 (a) | 230,000 | 216,398 |
0.88%, 05/01/26 (a) | 250,000 | 223,207 |
3.13%, 08/17/27 (a) | 50,000 | 46,818 |
5.13%, 11/17/27 (a) | 500,000 | 501,935 |
4.88%, 02/15/28 (a) | 300,000 | 295,998 |
3.13%, 03/02/28 (a) | 150,000 | 138,305 |
3.38%, 08/15/29 (a) | 200,000 | 180,890 |
5.63%, 11/17/29 (a) | 400,000 | 408,152 |
5.13%, 02/15/30 (a) | 300,000 | 296,895 |
2.10%, 05/01/30 (a) | 250,000 | 207,175 |
1.75%, 11/01/30 (a) | 250,000 | 198,153 |
5.75%, 11/17/32 (a) | 400,000 | 410,584 |
5.38%, 02/15/33 (a) | 450,000 | 449,415 |
6.38%, 05/16/38 | 400,000 | 438,676 |
4.38%, 11/15/41 | 250,000 | 214,125 |
4.50%, 03/20/42 | 450,000 | 388,813 |
3.88%, 08/21/42 | 200,000 | 159,046 |
4.13%, 03/04/43 | 250,000 | 204,365 |
4.88%, 11/15/43 | 175,000 | 157,595 |
4.25%, 11/10/44 | 350,000 | 291,879 |
Piedmont Healthcare, Inc. | ||
2.04%, 01/01/32 (a) | 150,000 | 118,136 |
Pilgrim's Pride Corp. | ||
4.25%, 04/15/31 (a) | 300,000 | 257,589 |
3.50%, 03/01/32 (a) | 300,000 | 239,295 |
6.25%, 07/01/33 (a) | 250,000 | 243,522 |
Presbyterian Healthcare Services | ||
4.88%, 08/01/52 (a) | 100,000 | 98,569 |
Procter & Gamble Co. | ||
0.55%, 10/29/25 | 400,000 | 363,540 |
4.10%, 01/26/26 | 200,000 | 197,826 |
1.00%, 04/23/26 | 250,000 | 226,595 |
2.45%, 11/03/26 | 350,000 | 328,034 |
2.80%, 03/25/27 | 200,000 | 188,644 |
2.85%, 08/11/27 | 200,000 | 187,790 |
3.95%, 01/26/28 | 275,000 | 270,572 |
3.00%, 03/25/30 | 500,000 | 463,155 |
1.20%, 10/29/30 | 250,000 | 202,350 |
1.95%, 04/23/31 | 400,000 | 340,336 |
2.30%, 02/01/32 | 175,000 | 152,737 |
4.05%, 01/26/33 | 250,000 | 247,290 |
5.80%, 08/15/34 | 125,000 | 141,189 |
3.55%, 03/25/40 | 250,000 | 221,607 |
3.50%, 10/25/47 | 200,000 | 170,180 |
3.60%, 03/25/50 | 150,000 | 127,739 |
Providence St Joseph Health Obligated Group | ||
2.53%, 10/01/29 (a) | 300,000 | 252,978 |
3.74%, 10/01/47 | 112,000 | 85,693 |
3.93%, 10/01/48 (a) | 300,000 | 237,099 |
2.70%, 10/01/51 (a) | 150,000 | 90,665 |
Queen's Health Systems | ||
4.81%, 07/01/52 (a) | 100,000 | 95,654 |
Quest Diagnostics, Inc. | ||
3.50%, 03/30/25 (a) | 300,000 | 289,860 |
3.45%, 06/01/26 (a) | 100,000 | 95,567 |
4.20%, 06/30/29 (a) | 100,000 | 96,735 |
2.95%, 06/30/30 (a) | 200,000 | 176,058 |
2.80%, 06/30/31 (a) | 150,000 | 129,414 |
4.70%, 03/30/45 (a) | 100,000 | 88,622 |
SECURITY RATE, MATURITY DATE | FACE AMOUNT ($) | VALUE ($) |
Rady Children's Hospital-San Diego | ||
3.15%, 08/15/51 (a) | 75,000 | 53,525 |
Regeneron Pharmaceuticals, Inc. | ||
1.75%, 09/15/30 (a) | 375,000 | 299,085 |
2.80%, 09/15/50 (a) | 250,000 | 161,625 |
Reynolds American, Inc. | ||
4.45%, 06/12/25 (a) | 750,000 | 729,577 |
5.70%, 08/15/35 (a) | 200,000 | 188,500 |
7.25%, 06/15/37 | 125,000 | 131,593 |
6.15%, 09/15/43 | 175,000 | 168,914 |
5.85%, 08/15/45 (a) | 500,000 | 446,985 |
Royalty Pharma PLC | ||
1.20%, 09/02/25 (a) | 325,000 | 293,767 |
1.75%, 09/02/27 (a) | 300,000 | 258,633 |
2.20%, 09/02/30 (a) | 300,000 | 241,830 |
2.15%, 09/02/31 (a) | 175,000 | 137,471 |
3.30%, 09/02/40 (a) | 300,000 | 213,762 |
3.55%, 09/02/50 (a) | 150,000 | 101,586 |
3.35%, 09/02/51 (a) | 250,000 | 161,975 |
Rush Obligated Group | ||
3.92%, 11/15/29 (a) | 150,000 | 138,354 |
RWJ Barnabas Health, Inc. | ||
3.95%, 07/01/46 (a) | 175,000 | 144,541 |
3.48%, 07/01/49 (a) | 50,000 | 38,316 |
Sanofi | ||
3.63%, 06/19/28 (a) | 275,000 | 265,276 |
Seattle Children's Hospital | ||
2.72%, 10/01/50 (a) | 75,000 | 50,161 |
Sentara Healthcare | ||
2.93%, 11/01/51 (a) | 100,000 | 68,650 |
Sharp HealthCare | ||
2.68%, 08/01/50 (a) | 100,000 | 65,163 |
Shire Acquisitions Investments Ireland DAC | ||
3.20%, 09/23/26 (a) | 800,000 | 751,560 |
Smith & Nephew PLC | ||
2.03%, 10/14/30 (a) | 250,000 | 202,840 |
Spectrum Health System Obligated Group | ||
3.49%, 07/15/49 (a) | 125,000 | 92,823 |
Stanford Health Care | ||
3.31%, 08/15/30 (a) | 50,000 | 45,184 |
3.80%, 11/15/48 (a) | 150,000 | 124,439 |
3.03%, 08/15/51 (a) | 150,000 | 105,365 |
STERIS Irish FinCo Unlimited Co. | ||
2.70%, 03/15/31 (a) | 200,000 | 167,598 |
3.75%, 03/15/51 (a) | 175,000 | 132,367 |
Stryker Corp. | ||
1.15%, 06/15/25 (a) | 200,000 | 184,552 |
3.38%, 11/01/25 (a) | 200,000 | 191,560 |
3.50%, 03/15/26 (a) | 240,000 | 230,400 |
3.65%, 03/07/28 (a) | 150,000 | 142,850 |
1.95%, 06/15/30 (a) | 300,000 | 251,343 |
4.10%, 04/01/43 (a) | 100,000 | 85,552 |
4.38%, 05/15/44 (a) | 250,000 | 220,122 |
4.63%, 03/15/46 (a) | 300,000 | 279,639 |
2.90%, 06/15/50 (a) | 200,000 | 139,460 |
Summa Health | ||
3.51%, 11/15/51 (a) | 100,000 | 71,083 |
Sutter Health | ||
1.32%, 08/15/25 (a) | 200,000 | 182,274 |
2.29%, 08/15/30 (a) | 200,000 | 165,606 |
3.16%, 08/15/40 (a) | 100,000 | 76,053 |
4.09%, 08/15/48 (a) | 125,000 | 103,259 |
3.36%, 08/15/50 (a) | 200,000 | 144,262 |
SECURITY RATE, MATURITY DATE | FACE AMOUNT ($) | VALUE ($) |
Sysco Corp. | ||
3.75%, 10/01/25 (a) | 300,000 | 290,175 |
3.30%, 07/15/26 (a) | 250,000 | 236,472 |
3.25%, 07/15/27 (a) | 200,000 | 187,084 |
2.40%, 02/15/30 (a) | 200,000 | 170,936 |
5.95%, 04/01/30 (a) | 200,000 | 209,526 |
2.45%, 12/14/31 (a) | 150,000 | 122,784 |
5.38%, 09/21/35 | 200,000 | 198,314 |
6.60%, 04/01/40 (a) | 100,000 | 108,872 |
4.85%, 10/01/45 (a) | 175,000 | 156,594 |
4.50%, 04/01/46 (a) | 150,000 | 128,028 |
4.45%, 03/15/48 (a) | 175,000 | 149,965 |
3.30%, 02/15/50 (a) | 150,000 | 107,927 |
6.60%, 04/01/50 (a) | 331,000 | 378,455 |
Takeda Pharmaceutical Co., Ltd. | ||
5.00%, 11/26/28 (a) | 500,000 | 497,750 |
2.05%, 03/31/30 (a) | 750,000 | 623,977 |
3.03%, 07/09/40 (a) | 450,000 | 340,731 |
3.18%, 07/09/50 (a) | 400,000 | 282,636 |
3.38%, 07/09/60 (a) | 300,000 | 205,731 |
Texas Health Resources | ||
2.33%, 11/15/50 (a) | 100,000 | 59,655 |
4.33%, 11/15/55 | 100,000 | 87,708 |
The Kroger Co. | ||
2.65%, 10/15/26 (a) | 200,000 | 185,684 |
3.70%, 08/01/27 (a) | 150,000 | 143,402 |
Thermo Fisher Scientific, Inc. | ||
1.22%, 10/18/24 (a) | 550,000 | 520,239 |
1.75%, 10/15/28 (a) | 200,000 | 172,480 |
2.60%, 10/01/29 (a) | 260,000 | 230,074 |
2.00%, 10/15/31 (a) | 375,000 | 306,221 |
4.95%, 11/21/32 (a) | 200,000 | 203,794 |
2.80%, 10/15/41 (a) | 350,000 | 261,355 |
5.30%, 02/01/44 (a) | 98,000 | 99,978 |
4.10%, 08/15/47 (a) | 185,000 | 165,914 |
Toledo Hospital | ||
5.75%, 11/15/38 (a) | 175,000 | 170,812 |
Trinity Health Corp. | ||
4.13%, 12/01/45 | 225,000 | 194,245 |
3.43%, 12/01/48 | 100,000 | 76,974 |
Tyson Foods, Inc. | ||
3.95%, 08/15/24 (a) | 250,000 | 245,495 |
4.00%, 03/01/26 (a) | 400,000 | 387,092 |
3.55%, 06/02/27 (a) | 350,000 | 329,448 |
4.35%, 03/01/29 (a) | 360,000 | 343,418 |
4.88%, 08/15/34 (a) | 250,000 | 241,800 |
5.15%, 08/15/44 (a) | 175,000 | 159,502 |
4.55%, 06/02/47 (a) | 250,000 | 209,955 |
5.10%, 09/28/48 (a) | 210,000 | 191,669 |
Unilever Capital Corp. | ||
0.63%, 08/12/24 (a) | 100,000 | 94,735 |
3.10%, 07/30/25 | 200,000 | 192,336 |
2.00%, 07/28/26 | 350,000 | 323,211 |
2.90%, 05/05/27 (a) | 200,000 | 187,182 |
3.50%, 03/22/28 (a) | 350,000 | 335,748 |
2.13%, 09/06/29 (a) | 200,000 | 173,230 |
1.38%, 09/14/30 (a) | 150,000 | 120,453 |
1.75%, 08/12/31 (a) | 400,000 | 323,944 |
5.90%, 11/15/32 | 200,000 | 219,158 |
2.63%, 08/12/51 (a) | 200,000 | 137,278 |
Universal Health Services, Inc. | ||
1.65%, 09/01/26 (a) | 200,000 | 175,646 |
2.65%, 10/15/30 (a) | 250,000 | 204,170 |
2.65%, 01/15/32 (a) | 150,000 | 119,216 |
UPMC | ||
3.60%, 04/03/25 | 200,000 | 192,916 |
SECURITY RATE, MATURITY DATE | FACE AMOUNT ($) | VALUE ($) |
Utah Acquisition Sub, Inc. | ||
3.95%, 06/15/26 (a) | 550,000 | 522,549 |
5.25%, 06/15/46 (a) | 250,000 | 197,738 |
Viatris, Inc. | ||
1.65%, 06/22/25 (a) | 250,000 | 230,290 |
2.30%, 06/22/27 (a) | 225,000 | 196,911 |
2.70%, 06/22/30 (a) | 400,000 | 324,512 |
3.85%, 06/22/40 (a) | 450,000 | 312,714 |
4.00%, 06/22/50 (a) | 600,000 | 398,274 |
West Virginia United Health System Obligated Group | ||
3.13%, 06/01/50 (a) | 100,000 | 66,257 |
Whirlpool Corp. | ||
3.70%, 05/01/25 | 100,000 | 96,837 |
4.75%, 02/26/29 (a) | 250,000 | 244,240 |
2.40%, 05/15/31 (a) | 100,000 | 81,317 |
4.50%, 06/01/46 (a) | 200,000 | 162,974 |
4.60%, 05/15/50 (a) | 150,000 | 125,078 |
Willis-Knighton Medical Center | ||
4.81%, 09/01/48 (a) | 100,000 | 90,024 |
3.07%, 03/01/51 (a) | 125,000 | 79,956 |
Wyeth LLC | ||
6.50%, 02/01/34 | 200,000 | 225,238 |
6.00%, 02/15/36 | 100,000 | 109,074 |
5.95%, 04/01/37 | 550,000 | 602,173 |
Yale-New Haven Health Services Corp. | ||
2.50%, 07/01/50 (a) | 150,000 | 91,067 |
Zimmer Biomet Holdings, Inc. | ||
1.45%, 11/22/24 (a) | 200,000 | 188,558 |
3.55%, 04/01/25 (a) | 350,000 | 337,914 |
3.05%, 01/15/26 (a) | 150,000 | 141,684 |
2.60%, 11/24/31 (a) | 350,000 | 290,913 |
4.45%, 08/15/45 (a) | 149,000 | 126,891 |
Zoetis, Inc. | ||
4.50%, 11/13/25 (a) | 100,000 | 98,423 |
3.00%, 09/12/27 (a) | 300,000 | 279,732 |
3.90%, 08/20/28 (a) | 320,000 | 307,258 |
2.00%, 05/15/30 (a) | 500,000 | 418,135 |
4.70%, 02/01/43 (a) | 350,000 | 326,280 |
4.45%, 08/20/48 (a) | 150,000 | 133,826 |
3.00%, 05/15/50 (a) | 200,000 | 140,740 |
270,501,035 | ||
Energy 1.7% | ||
Apache Corp. | ||
4.38%, 10/15/28 (a) | 75,000 | 68,396 |
4.25%, 01/15/30 (a) | 125,000 | 111,424 |
6.00%, 01/15/37 | 100,000 | 90,070 |
5.10%, 09/01/40 (a) | 350,000 | 285,502 |
5.25%, 02/01/42 (a) | 100,000 | 78,887 |
4.75%, 04/15/43 (a) | 100,000 | 73,797 |
5.35%, 07/01/49 (a) | 75,000 | 58,418 |
Baker Hughes a GE Co., LLC/Baker Hughes Co-Obligor, Inc. | ||
3.34%, 12/15/27 (a) | 400,000 | 370,772 |
3.14%, 11/07/29 (a) | 150,000 | 134,151 |
4.49%, 05/01/30 (a) | 200,000 | 193,912 |
4.08%, 12/15/47 (a) | 300,000 | 243,828 |
Baker Hughes Holdings LLC | ||
2.06%, 12/15/26 (a) | 175,000 | 157,882 |
5.13%, 09/15/40 | 300,000 | 291,681 |
Boardwalk Pipelines LP | ||
4.95%, 12/15/24 (a) | 180,000 | 177,097 |
5.95%, 06/01/26 (a) | 150,000 | 151,382 |
4.45%, 07/15/27 (a) | 250,000 | 238,890 |
3.40%, 02/15/31 (a) | 350,000 | 301,577 |
SECURITY RATE, MATURITY DATE | FACE AMOUNT ($) | VALUE ($) |
BP Capital Markets America, Inc. | ||
3.80%, 09/21/25 (a) | 200,000 | 195,028 |
3.41%, 02/11/26 (a) | 250,000 | 240,505 |
3.12%, 05/04/26 (a) | 300,000 | 285,765 |
3.02%, 01/16/27 (a) | 325,000 | 306,124 |
3.54%, 04/06/27 (a) | 150,000 | 143,447 |
3.59%, 04/14/27 (a) | 250,000 | 239,400 |
3.94%, 09/21/28 (a) | 350,000 | 335,541 |
4.23%, 11/06/28 (a) | 600,000 | 583,854 |
3.63%, 04/06/30 (a) | 200,000 | 186,638 |
1.75%, 08/10/30 (a) | 200,000 | 163,868 |
2.72%, 01/12/32 (a) | 550,000 | 468,055 |
4.81%, 02/13/33 (a) | 500,000 | 493,480 |
4.89%, 09/11/33 (a) | 400,000 | 396,116 |
3.06%, 06/17/41 (a) | 400,000 | 304,116 |
3.00%, 02/24/50 (a) | 575,000 | 401,798 |
2.77%, 11/10/50 (a) | 525,000 | 349,550 |
2.94%, 06/04/51 (a) | 750,000 | 514,410 |
3.00%, 03/17/52 (a) | 400,000 | 277,100 |
3.38%, 02/08/61 (a) | 400,000 | 285,384 |
BP Capital Markets PLC | ||
3.28%, 09/19/27 (a) | 450,000 | 424,530 |
3.72%, 11/28/28 (a) | 250,000 | 236,800 |
Burlington Resources LLC | ||
7.20%, 08/15/31 | 100,000 | 114,479 |
7.40%, 12/01/31 | 25,000 | 28,961 |
Canadian Natural Resources Ltd. | ||
3.90%, 02/01/25 (a) | 100,000 | 96,829 |
2.05%, 07/15/25 (a) | 150,000 | 139,929 |
3.85%, 06/01/27 (a) | 200,000 | 189,084 |
2.95%, 07/15/30 (a) | 200,000 | 172,212 |
7.20%, 01/15/32 | 75,000 | 81,963 |
6.45%, 06/30/33 | 100,000 | 103,385 |
5.85%, 02/01/35 | 100,000 | 97,580 |
6.50%, 02/15/37 | 325,000 | 331,480 |
6.25%, 03/15/38 | 300,000 | 306,441 |
6.75%, 02/01/39 | 100,000 | 104,658 |
4.95%, 06/01/47 (a) | 250,000 | 224,150 |
Cenovus Energy, Inc. | ||
4.25%, 04/15/27 (a) | 100,000 | 95,896 |
2.65%, 01/15/32 (a) | 100,000 | 80,890 |
5.25%, 06/15/37 (a) | 250,000 | 231,097 |
6.80%, 09/15/37 | 150,000 | 157,089 |
6.75%, 11/15/39 | 250,000 | 263,630 |
5.40%, 06/15/47 (a) | 325,000 | 295,399 |
Cheniere Corpus Christi Holdings LLC | ||
5.88%, 03/31/25 (a) | 375,000 | 373,886 |
5.13%, 06/30/27 (a) | 400,000 | 393,896 |
3.70%, 11/15/29 (a) | 300,000 | 272,493 |
Cheniere Energy Partners LP | ||
4.50%, 10/01/29 (a) | 350,000 | 321,779 |
4.00%, 03/01/31 (a) | 350,000 | 308,854 |
3.25%, 01/31/32 (a) | 525,000 | 433,813 |
5.95%, 06/30/33 (a)(c) | 400,000 | 401,664 |
Cheniere Energy, Inc. | ||
4.63%, 10/15/28 (a) | 250,000 | 234,360 |
Chevron Corp. | ||
1.55%, 05/11/25 (a) | 950,000 | 891,423 |
3.33%, 11/17/25 (a) | 50,000 | 48,362 |
2.95%, 05/16/26 (a) | 400,000 | 380,956 |
2.00%, 05/11/27 (a) | 100,000 | 90,929 |
2.24%, 05/11/30 (a) | 500,000 | 436,090 |
3.08%, 05/11/50 (a) | 300,000 | 223,728 |
Chevron USA, Inc. | ||
3.90%, 11/15/24 (a) | 170,000 | 167,192 |
0.69%, 08/12/25 (a) | 250,000 | 228,705 |
SECURITY RATE, MATURITY DATE | FACE AMOUNT ($) | VALUE ($) |
1.02%, 08/12/27 (a) | 250,000 | 217,725 |
3.85%, 01/15/28 (a) | 150,000 | 146,550 |
3.25%, 10/15/29 (a) | 50,000 | 46,313 |
6.00%, 03/01/41 (a) | 150,000 | 166,113 |
5.25%, 11/15/43 (a) | 100,000 | 102,201 |
2.34%, 08/12/50 (a) | 200,000 | 128,084 |
Columbia Pipeline Group, Inc. | ||
4.50%, 06/01/25 (a) | 383,000 | 374,999 |
5.80%, 06/01/45 (a) | 100,000 | 99,123 |
ConocoPhillips Co. | ||
2.40%, 03/07/25 (a) | 400,000 | 381,568 |
6.95%, 04/15/29 | 625,000 | 689,037 |
5.90%, 10/15/32 | 100,000 | 107,850 |
6.50%, 02/01/39 | 500,000 | 577,800 |
3.76%, 03/15/42 (a) | 400,000 | 337,928 |
4.30%, 11/15/44 (a) | 200,000 | 176,832 |
4.88%, 10/01/47 (a) | 150,000 | 142,908 |
3.80%, 03/15/52 (a) | 300,000 | 243,798 |
5.30%, 05/15/53 (a) | 250,000 | 254,635 |
4.03%, 03/15/62 (a) | 500,000 | 408,900 |
Continental Resources, Inc. | ||
4.38%, 01/15/28 (a) | 300,000 | 281,799 |
4.90%, 06/01/44 (a) | 225,000 | 175,140 |
Coterra Energy, Inc. | ||
3.90%, 05/15/27 (a) | 200,000 | 189,118 |
4.38%, 03/15/29 (a) | 150,000 | 140,202 |
DCP Midstream Operating LP | ||
5.38%, 07/15/25 (a) | 250,000 | 247,817 |
5.63%, 07/15/27 (a) | 200,000 | 200,166 |
5.13%, 05/15/29 (a) | 200,000 | 195,920 |
3.25%, 02/15/32 (a) | 200,000 | 169,564 |
Devon Energy Corp. | ||
5.25%, 09/15/24 (a)(c) | 125,000 | 124,024 |
5.85%, 12/15/25 (a) | 150,000 | 151,349 |
5.25%, 10/15/27 (a) | 150,000 | 147,830 |
5.88%, 06/15/28 (a)(c) | 100,000 | 99,727 |
4.50%, 01/15/30 (a) | 195,000 | 183,832 |
7.88%, 09/30/31 | 150,000 | 170,243 |
7.95%, 04/15/32 | 100,000 | 115,237 |
5.60%, 07/15/41 (a) | 250,000 | 235,782 |
4.75%, 05/15/42 (a) | 200,000 | 169,414 |
5.00%, 06/15/45 (a) | 250,000 | 217,113 |
Diamondback Energy, Inc. | ||
3.25%, 12/01/26 (a) | 250,000 | 235,360 |
3.50%, 12/01/29 (a) | 300,000 | 270,741 |
3.13%, 03/24/31 (a) | 50,000 | 42,834 |
6.25%, 03/15/33 (a) | 400,000 | 414,656 |
4.40%, 03/24/51 (a) | 200,000 | 159,074 |
4.25%, 03/15/52 (a) | 150,000 | 115,901 |
6.25%, 03/15/53 (a) | 200,000 | 203,472 |
Eastern Energy Gas Holdings LLC | ||
2.50%, 11/15/24 (a) | 150,000 | 143,531 |
Eastern Gas Transmission & Storage, Inc. | ||
3.00%, 11/15/29 (a) | 150,000 | 131,223 |
4.80%, 11/01/43 (a)(c) | 125,000 | 110,140 |
4.60%, 12/15/44 (a) | 150,000 | 126,792 |
Enable Midstream Partners LP | ||
4.95%, 05/15/28 (a) | 250,000 | 242,575 |
4.15%, 09/15/29 (a) | 200,000 | 184,356 |
5.00%, 05/15/44 (a) | 75,000 | 63,311 |
Enbridge Energy Partners LP | ||
5.88%, 10/15/25 (a) | 150,000 | 150,657 |
7.50%, 04/15/38 | 100,000 | 112,947 |
5.50%, 09/15/40 (a) | 200,000 | 189,888 |
7.38%, 10/15/45 (a) | 150,000 | 173,004 |
SECURITY RATE, MATURITY DATE | FACE AMOUNT ($) | VALUE ($) |
Enbridge, Inc. | ||
2.50%, 02/14/25 | 150,000 | 142,802 |
5.97%, 03/08/26 (a) | 200,000 | 200,338 |
1.60%, 10/04/26 (a) | 150,000 | 133,826 |
4.25%, 12/01/26 (a) | 300,000 | 289,746 |
3.70%, 07/15/27 (a) | 325,000 | 307,463 |
3.13%, 11/15/29 (a) | 350,000 | 309,781 |
5.70%, 03/08/33 (a) | 700,000 | 709,863 |
2.50%, 08/01/33 (a) | 425,000 | 333,574 |
4.50%, 06/10/44 (a) | 150,000 | 125,403 |
5.50%, 12/01/46 (a) | 150,000 | 143,724 |
4.00%, 11/15/49 (a) | 300,000 | 233,448 |
Energy Transfer LP | ||
4.40%, 03/15/27 (a) | 200,000 | 191,588 |
4.00%, 10/01/27 (a) | 200,000 | 187,864 |
5.55%, 02/15/28 (a) | 250,000 | 249,742 |
4.95%, 06/15/28 (a) | 350,000 | 340,564 |
5.25%, 04/15/29 (a) | 500,000 | 488,320 |
3.75%, 05/15/30 (a) | 550,000 | 497,469 |
5.75%, 02/15/33 (a) | 425,000 | 428,158 |
4.90%, 03/15/35 (a) | 150,000 | 138,230 |
Energy Transfer Operating LP | ||
4.05%, 03/15/25 (a) | 200,000 | 194,604 |
2.90%, 05/15/25 (a) | 300,000 | 284,961 |
4.75%, 01/15/26 (a) | 350,000 | 342,489 |
4.20%, 04/15/27 (a) | 250,000 | 238,830 |
5.50%, 06/01/27 (a) | 350,000 | 348,631 |
6.63%, 10/15/36 | 125,000 | 128,540 |
7.50%, 07/01/38 | 100,000 | 109,797 |
6.05%, 06/01/41 (a) | 200,000 | 193,402 |
6.50%, 02/01/42 (a) | 250,000 | 253,340 |
5.15%, 02/01/43 (a) | 150,000 | 128,282 |
5.95%, 10/01/43 (a) | 148,000 | 138,660 |
5.15%, 03/15/45 (a) | 300,000 | 259,512 |
6.13%, 12/15/45 (a) | 300,000 | 286,293 |
5.30%, 04/15/47 (a) | 250,000 | 218,302 |
6.00%, 06/15/48 (a) | 300,000 | 285,153 |
6.25%, 04/15/49 (a) | 500,000 | 489,005 |
5.00%, 05/15/50 (a) | 550,000 | 465,393 |
Eni USA, Inc. | ||
7.30%, 11/15/27 | 200,000 | 214,724 |
Enterprise Products Operating LLC | ||
3.75%, 02/15/25 (a) | 400,000 | 389,476 |
5.05%, 01/10/26 | 200,000 | 199,966 |
3.70%, 02/15/26 (a) | 150,000 | 144,834 |
3.95%, 02/15/27 (a) | 25,000 | 24,156 |
4.15%, 10/16/28 (a) | 300,000 | 287,436 |
3.13%, 07/31/29 (a) | 450,000 | 404,275 |
2.80%, 01/31/30 (a) | 400,000 | 351,028 |
6.88%, 03/01/33 | 150,000 | 169,317 |
6.65%, 10/15/34 | 100,000 | 108,867 |
7.55%, 04/15/38 | 150,000 | 173,522 |
6.13%, 10/15/39 | 225,000 | 239,242 |
6.45%, 09/01/40 | 245,000 | 267,224 |
5.95%, 02/01/41 | 200,000 | 209,298 |
5.70%, 02/15/42 | 150,000 | 152,871 |
4.85%, 08/15/42 (a) | 200,000 | 184,660 |
4.45%, 02/15/43 (a) | 300,000 | 265,029 |
4.85%, 03/15/44 (a) | 400,000 | 369,996 |
5.10%, 02/15/45 (a) | 350,000 | 334,344 |
4.90%, 05/15/46 (a) | 250,000 | 231,020 |
4.25%, 02/15/48 (a) | 350,000 | 297,080 |
4.80%, 02/01/49 (a) | 350,000 | 321,037 |
4.20%, 01/31/50 (a) | 400,000 | 336,428 |
3.70%, 01/31/51 (a) | 325,000 | 249,954 |
3.20%, 02/15/52 (a) | 350,000 | 247,415 |
4.95%, 10/15/54 (a) | 125,000 | 114,121 |
SECURITY RATE, MATURITY DATE | FACE AMOUNT ($) | VALUE ($) |
3.95%, 01/31/60 (a) | 325,000 | 251,056 |
5.25%, 08/16/77 (a)(b) | 300,000 | 262,929 |
5.38%, 02/15/78 (a)(b) | 210,000 | 174,300 |
EOG Resources, Inc. | ||
3.15%, 04/01/25 (a) | 150,000 | 144,728 |
4.15%, 01/15/26 (a) | 250,000 | 244,937 |
4.38%, 04/15/30 (a) | 200,000 | 196,224 |
3.90%, 04/01/35 (a) | 165,000 | 148,211 |
4.95%, 04/15/50 (a) | 100,000 | 98,914 |
EQT Corp. | ||
6.63%, 02/01/25 (a)(g) | 300,000 | 298,620 |
3.90%, 10/01/27 (a) | 400,000 | 371,680 |
5.70%, 04/01/28 (a) | 200,000 | 198,770 |
7.50%, 02/01/30 (a)(g) | 200,000 | 209,728 |
Exxon Mobil Corp. | ||
2.02%, 08/16/24 (a) | 200,000 | 192,850 |
2.71%, 03/06/25 (a) | 500,000 | 480,455 |
2.99%, 03/19/25 (a) | 800,000 | 771,240 |
3.04%, 03/01/26 (a) | 750,000 | 717,705 |
2.28%, 08/16/26 (a) | 300,000 | 278,655 |
3.29%, 03/19/27 (a) | 300,000 | 288,222 |
2.44%, 08/16/29 (a) | 250,000 | 222,722 |
3.48%, 03/19/30 (a) | 550,000 | 516,543 |
2.61%, 10/15/30 (a) | 600,000 | 527,280 |
3.00%, 08/16/39 (a) | 300,000 | 238,461 |
4.23%, 03/19/40 (a) | 550,000 | 507,573 |
3.57%, 03/06/45 (a) | 300,000 | 244,968 |
4.11%, 03/01/46 (a) | 700,000 | 617,008 |
3.10%, 08/16/49 (a) | 450,000 | 331,636 |
4.33%, 03/19/50 (a) | 675,000 | 614,216 |
3.45%, 04/15/51 (a) | 650,000 | 508,111 |
Halliburton Co. | ||
2.92%, 03/01/30 (a) | 300,000 | 264,429 |
4.85%, 11/15/35 (a) | 300,000 | 282,795 |
6.70%, 09/15/38 | 350,000 | 384,748 |
7.45%, 09/15/39 | 300,000 | 349,056 |
4.75%, 08/01/43 (a) | 200,000 | 175,574 |
5.00%, 11/15/45 (a) | 600,000 | 543,618 |
Helmerich and Payne, Inc. | ||
2.90%, 09/29/31 (a) | 200,000 | 161,578 |
Hess Corp. | ||
3.50%, 07/15/24 (a) | 100,000 | 97,578 |
4.30%, 04/01/27 (a) | 200,000 | 192,436 |
7.88%, 10/01/29 | 200,000 | 221,668 |
7.30%, 08/15/31 | 163,000 | 179,259 |
7.13%, 03/15/33 | 150,000 | 164,301 |
6.00%, 01/15/40 | 200,000 | 199,874 |
5.60%, 02/15/41 | 375,000 | 359,141 |
5.80%, 04/01/47 (a) | 150,000 | 146,081 |
HF Sinclair Corp. | ||
5.88%, 04/01/26 (a) | 260,000 | 261,331 |
4.50%, 10/01/30 (a) | 125,000 | 111,343 |
Kinder Morgan Energy Partners LP | ||
7.40%, 03/15/31 | 300,000 | 330,621 |
7.75%, 03/15/32 | 100,000 | 112,227 |
5.80%, 03/15/35 | 300,000 | 296,502 |
6.50%, 02/01/37 | 200,000 | 206,180 |
6.95%, 01/15/38 | 350,000 | 377,307 |
6.50%, 09/01/39 | 200,000 | 205,210 |
6.55%, 09/15/40 | 200,000 | 203,532 |
7.50%, 11/15/40 | 150,000 | 167,577 |
6.38%, 03/01/41 | 150,000 | 150,846 |
5.63%, 09/01/41 | 250,000 | 230,235 |
5.00%, 08/15/42 (a) | 300,000 | 254,862 |
4.70%, 11/01/42 (a) | 100,000 | 83,301 |
5.00%, 03/01/43 (a) | 300,000 | 259,503 |
SECURITY RATE, MATURITY DATE | FACE AMOUNT ($) | VALUE ($) |
5.50%, 03/01/44 (a) | 100,000 | 91,466 |
5.40%, 09/01/44 (a) | 300,000 | 268,077 |
Kinder Morgan, Inc. | ||
4.30%, 06/01/25 (a) | 500,000 | 488,285 |
4.30%, 03/01/28 (a) | 390,000 | 373,561 |
2.00%, 02/15/31 (a) | 350,000 | 278,649 |
7.80%, 08/01/31 | 200,000 | 226,350 |
7.75%, 01/15/32 | 250,000 | 282,450 |
4.80%, 02/01/33 (a) | 250,000 | 236,730 |
5.55%, 06/01/45 (a) | 500,000 | 462,610 |
5.05%, 02/15/46 (a) | 150,000 | 128,871 |
5.20%, 03/01/48 (a) | 246,000 | 215,944 |
3.25%, 08/01/50 (a) | 275,000 | 177,848 |
5.45%, 08/01/52 (a) | 225,000 | 205,607 |
Magellan Midstream Partners LP | ||
3.25%, 06/01/30 (a) | 250,000 | 220,565 |
5.15%, 10/15/43 (a) | 200,000 | 170,878 |
4.25%, 09/15/46 (a) | 150,000 | 111,461 |
4.20%, 10/03/47 (a) | 200,000 | 149,250 |
4.85%, 02/01/49 (a) | 99,000 | 81,277 |
3.95%, 03/01/50 (a) | 250,000 | 179,480 |
Marathon Oil Corp. | ||
4.40%, 07/15/27 (a) | 300,000 | 286,653 |
6.80%, 03/15/32 | 88,000 | 91,274 |
6.60%, 10/01/37 | 250,000 | 250,135 |
5.20%, 06/01/45 (a) | 150,000 | 126,998 |
Marathon Petroleum Corp. | ||
3.63%, 09/15/24 (a) | 200,000 | 194,832 |
4.70%, 05/01/25 (a) | 300,000 | 294,537 |
5.13%, 12/15/26 (a) | 200,000 | 198,498 |
3.80%, 04/01/28 (a) | 150,000 | 139,898 |
6.50%, 03/01/41 (a) | 350,000 | 360,885 |
4.75%, 09/15/44 (a) | 250,000 | 209,173 |
4.50%, 04/01/48 (a) | 100,000 | 79,360 |
5.00%, 09/15/54 (a) | 125,000 | 103,755 |
MPLX LP | ||
4.88%, 12/01/24 (a) | 300,000 | 296,028 |
4.00%, 02/15/25 (a) | 150,000 | 145,650 |
4.88%, 06/01/25 (a) | 350,000 | 344,445 |
1.75%, 03/01/26 (a) | 450,000 | 409,027 |
4.13%, 03/01/27 (a) | 400,000 | 383,620 |
4.25%, 12/01/27 (a) | 246,000 | 234,381 |
4.00%, 03/15/28 (a) | 275,000 | 259,427 |
4.80%, 02/15/29 (a) | 250,000 | 241,687 |
2.65%, 08/15/30 (a) | 500,000 | 419,140 |
5.00%, 03/01/33 (a) | 300,000 | 287,985 |
4.50%, 04/15/38 (a) | 500,000 | 431,615 |
5.20%, 03/01/47 (a) | 300,000 | 264,507 |
5.20%, 12/01/47 (a) | 350,000 | 307,723 |
4.70%, 04/15/48 (a) | 400,000 | 330,028 |
5.50%, 02/15/49 (a) | 425,000 | 388,127 |
4.95%, 03/14/52 (a) | 400,000 | 340,380 |
4.90%, 04/15/58 (a) | 200,000 | 161,798 |
National Fuel Gas Co. | ||
5.20%, 07/15/25 (a) | 150,000 | 147,161 |
5.50%, 01/15/26 (a) | 150,000 | 147,924 |
3.95%, 09/15/27 (a) | 150,000 | 138,209 |
4.75%, 09/01/28 (a) | 100,000 | 94,828 |
2.95%, 03/01/31 (a) | 50,000 | 40,194 |
Northwest Pipeline LLC | ||
4.00%, 04/01/27 (a) | 250,000 | 238,672 |
NOV, Inc. | ||
3.60%, 12/01/29 (a) | 150,000 | 134,117 |
3.95%, 12/01/42 (a) | 300,000 | 221,607 |
SECURITY RATE, MATURITY DATE | FACE AMOUNT ($) | VALUE ($) |
Occidental Petroleum Corp. | ||
5.88%, 09/01/25 (a) | 200,000 | 199,526 |
5.55%, 03/15/26 (a) | 250,000 | 247,002 |
8.50%, 07/15/27 (a)(f) | 300,000 | 324,189 |
8.88%, 07/15/30 (a) | 350,000 | 402,545 |
6.63%, 09/01/30 (a) | 500,000 | 519,785 |
6.13%, 01/01/31 (a) | 300,000 | 304,872 |
7.50%, 05/01/31 | 250,000 | 273,225 |
6.45%, 09/15/36 | 300,000 | 309,534 |
7.95%, 06/15/39 | 300,000 | 341,067 |
6.20%, 03/15/40 | 200,000 | 198,594 |
6.60%, 03/15/46 (a) | 200,000 | 206,976 |
4.40%, 04/15/46 (a) | 300,000 | 235,731 |
4.20%, 03/15/48 (a) | 100,000 | 75,007 |
ONEOK Partners LP | ||
4.90%, 03/15/25 (a) | 175,000 | 172,284 |
6.65%, 10/01/36 | 175,000 | 180,338 |
6.85%, 10/15/37 | 225,000 | 232,315 |
6.13%, 02/01/41 (a) | 150,000 | 145,524 |
6.20%, 09/15/43 (a) | 150,000 | 145,365 |
ONEOK, Inc. | ||
2.75%, 09/01/24 (a) | 150,000 | 145,064 |
2.20%, 09/15/25 (a) | 150,000 | 139,016 |
5.85%, 01/15/26 (a) | 200,000 | 200,808 |
4.00%, 07/13/27 (a) | 150,000 | 140,693 |
4.55%, 07/15/28 (a) | 225,000 | 213,635 |
4.35%, 03/15/29 (a) | 200,000 | 186,190 |
3.40%, 09/01/29 (a) | 250,000 | 218,787 |
3.10%, 03/15/30 (a) | 250,000 | 215,005 |
6.35%, 01/15/31 (a) | 200,000 | 206,132 |
6.00%, 06/15/35 | 100,000 | 100,432 |
4.95%, 07/13/47 (a) | 225,000 | 186,374 |
5.20%, 07/15/48 (a) | 300,000 | 257,607 |
4.45%, 09/01/49 (a) | 200,000 | 152,792 |
4.50%, 03/15/50 (a) | 75,000 | 57,380 |
7.15%, 01/15/51 (a) | 100,000 | 105,489 |
Ovintiv Exploration, Inc. | ||
5.38%, 01/01/26 (a) | 150,000 | 149,243 |
Ovintiv, Inc. | ||
5.65%, 05/15/28 (a) | 200,000 | 196,356 |
7.20%, 11/01/31 | 200,000 | 211,428 |
7.38%, 11/01/31 | 200,000 | 214,586 |
6.25%, 07/15/33 (a) | 200,000 | 197,486 |
6.50%, 08/15/34 | 100,000 | 100,646 |
6.63%, 08/15/37 | 100,000 | 99,040 |
6.50%, 02/01/38 | 200,000 | 197,358 |
Phillips 66 | ||
3.85%, 04/09/25 (a) | 200,000 | 194,710 |
1.30%, 02/15/26 (a) | 200,000 | 181,048 |
3.90%, 03/15/28 (a) | 200,000 | 190,094 |
2.15%, 12/15/30 (a) | 250,000 | 204,210 |
4.65%, 11/15/34 (a) | 100,000 | 94,711 |
5.88%, 05/01/42 | 400,000 | 416,104 |
4.88%, 11/15/44 (a) | 425,000 | 392,768 |
3.30%, 03/15/52 (a) | 300,000 | 207,012 |
Phillips 66 Co. | ||
3.61%, 02/15/25 (a) | 200,000 | 192,972 |
4.95%, 12/01/27 (a) | 200,000 | 198,380 |
3.75%, 03/01/28 (a) | 175,000 | 164,322 |
3.15%, 12/15/29 (a) | 350,000 | 305,767 |
4.68%, 02/15/45 (a) | 200,000 | 171,712 |
4.90%, 10/01/46 (a) | 175,000 | 155,223 |
Pioneer Natural Resources Co. | ||
1.13%, 01/15/26 (a) | 300,000 | 270,732 |
5.10%, 03/29/26 | 300,000 | 298,587 |
SECURITY RATE, MATURITY DATE | FACE AMOUNT ($) | VALUE ($) |
1.90%, 08/15/30 (a) | 300,000 | 243,597 |
2.15%, 01/15/31 (a) | 250,000 | 204,858 |
Plains All American Pipeline LP | ||
6.65%, 01/15/37 | 250,000 | 253,852 |
4.30%, 01/31/43 (a) | 125,000 | 93,580 |
4.90%, 02/15/45 (a) | 200,000 | 162,264 |
Plains All American Pipeline LP/PAA Finance Corp. | ||
4.65%, 10/15/25 (a) | 400,000 | 390,340 |
4.50%, 12/15/26 (a) | 410,000 | 397,044 |
3.55%, 12/15/29 (a) | 150,000 | 132,260 |
3.80%, 09/15/30 (a) | 200,000 | 177,770 |
5.15%, 06/01/42 (a) | 150,000 | 124,976 |
4.70%, 06/15/44 (a) | 100,000 | 78,473 |
Sabine Pass Liquefaction LLC | ||
5.63%, 03/01/25 (a) | 750,000 | 747,855 |
5.88%, 06/30/26 (a) | 500,000 | 504,285 |
5.00%, 03/15/27 (a) | 400,000 | 393,980 |
4.20%, 03/15/28 (a) | 450,000 | 426,987 |
4.50%, 05/15/30 (a) | 525,000 | 499,537 |
5.90%, 09/15/37 (a)(c) | 150,000 | 151,554 |
Schlumberger Finance Canada Ltd. | ||
1.40%, 09/17/25 (a) | 200,000 | 184,134 |
Schlumberger Investment S.A. | ||
4.50%, 05/15/28 (a) | 200,000 | 197,046 |
2.65%, 06/26/30 (a) | 225,000 | 197,145 |
Shell International Finance BV | ||
2.00%, 11/07/24 (a) | 300,000 | 287,481 |
3.25%, 05/11/25 | 800,000 | 773,704 |
2.88%, 05/10/26 | 500,000 | 476,655 |
2.50%, 09/12/26 | 200,000 | 186,546 |
3.88%, 11/13/28 (a) | 500,000 | 484,290 |
2.38%, 11/07/29 (a) | 475,000 | 416,675 |
2.75%, 04/06/30 (a) | 500,000 | 447,905 |
4.13%, 05/11/35 | 500,000 | 465,630 |
6.38%, 12/15/38 | 800,000 | 898,152 |
2.88%, 11/26/41 (a) | 125,000 | 93,649 |
3.63%, 08/21/42 | 150,000 | 124,610 |
4.55%, 08/12/43 | 375,000 | 347,801 |
4.38%, 05/11/45 | 625,000 | 563,950 |
4.00%, 05/10/46 | 725,000 | 618,367 |
3.75%, 09/12/46 | 400,000 | 327,540 |
3.13%, 11/07/49 (a) | 500,000 | 365,595 |
3.25%, 04/06/50 (a) | 600,000 | 448,968 |
3.00%, 11/26/51 (a) | 200,000 | 142,028 |
Spectra Energy Partners LP | ||
3.50%, 03/15/25 (a) | 200,000 | 192,724 |
5.95%, 09/25/43 (a) | 200,000 | 197,776 |
4.50%, 03/15/45 (a) | 100,000 | 82,684 |
Suncor Energy, Inc. | ||
5.95%, 12/01/34 | 150,000 | 150,864 |
5.95%, 05/15/35 | 250,000 | 242,955 |
6.80%, 05/15/38 | 200,000 | 213,656 |
6.50%, 06/15/38 | 375,000 | 390,829 |
6.85%, 06/01/39 | 150,000 | 161,780 |
4.00%, 11/15/47 (a) | 150,000 | 116,325 |
3.75%, 03/04/51 (a) | 200,000 | 147,324 |
Sunoco Logistics Partners Operations LP | ||
5.95%, 12/01/25 (a) | 125,000 | 125,428 |
6.10%, 02/15/42 | 100,000 | 95,182 |
4.95%, 01/15/43 (a) | 100,000 | 82,999 |
5.30%, 04/01/44 (a) | 250,000 | 216,325 |
5.35%, 05/15/45 (a) | 100,000 | 87,536 |
5.40%, 10/01/47 (a) | 400,000 | 354,172 |
Targa Resources Corp. | ||
5.20%, 07/01/27 (a) | 225,000 | 221,384 |
4.20%, 02/01/33 (a) | 200,000 | 177,474 |
SECURITY RATE, MATURITY DATE | FACE AMOUNT ($) | VALUE ($) |
6.13%, 03/15/33 (a) | 250,000 | 255,685 |
4.95%, 04/15/52 (a) | 200,000 | 165,482 |
6.50%, 02/15/53 (a) | 250,000 | 256,867 |
Targa Resources Partners LP/Targa Resources Partners Finance Corp. | ||
6.50%, 07/15/27 (a) | 450,000 | 450,099 |
5.50%, 03/01/30 (a) | 200,000 | 192,598 |
4.88%, 02/01/31 (a) | 450,000 | 415,984 |
4.00%, 01/15/32 (a) | 400,000 | 347,112 |
TC PipeLines LP | ||
4.38%, 03/13/25 (a) | 200,000 | 194,656 |
3.90%, 05/25/27 (a) | 100,000 | 95,355 |
Tennessee Gas Pipeline Co. LLC | ||
7.00%, 03/15/27 | 100,000 | 104,682 |
Tosco Corp. | ||
8.13%, 02/15/30 | 200,000 | 233,086 |
TotalEnergies Capital International S.A. | ||
2.43%, 01/10/25 (a) | 300,000 | 287,727 |
3.46%, 02/19/29 (a) | 356,000 | 332,942 |
2.83%, 01/10/30 (a) | 200,000 | 179,202 |
2.99%, 06/29/41 (a) | 225,000 | 171,513 |
3.46%, 07/12/49 (a) | 300,000 | 233,988 |
3.13%, 05/29/50 (a) | 700,000 | 508,998 |
3.39%, 06/29/60 (a) | 250,000 | 183,860 |
TotalEnergies Capital S.A. | ||
3.88%, 10/11/28 | 275,000 | 264,462 |
TransCanada PipeLines Ltd. | ||
1.00%, 10/12/24 (a) | 150,000 | 141,189 |
4.88%, 01/15/26 (a) | 350,000 | 346,360 |
4.25%, 05/15/28 (a) | 575,000 | 549,131 |
4.10%, 04/15/30 (a) | 150,000 | 139,670 |
2.50%, 10/12/31 (a) | 150,000 | 121,572 |
4.63%, 03/01/34 (a) | 400,000 | 367,648 |
6.20%, 10/15/37 | 350,000 | 365,200 |
4.75%, 05/15/38 (a) | 200,000 | 179,466 |
7.25%, 08/15/38 | 200,000 | 224,054 |
7.63%, 01/15/39 | 400,000 | 465,116 |
6.10%, 06/01/40 | 250,000 | 256,105 |
5.00%, 10/16/43 (a) | 200,000 | 179,174 |
4.88%, 05/15/48 (a) | 300,000 | 269,508 |
5.10%, 03/15/49 (a) | 300,000 | 279,627 |
Transcontinental Gas Pipe Line Co. LLC | ||
7.85%, 02/01/26 (a) | 250,000 | 262,187 |
4.00%, 03/15/28 (a) | 150,000 | 141,345 |
3.25%, 05/15/30 (a) | 200,000 | 178,032 |
5.40%, 08/15/41 (a) | 125,000 | 120,644 |
4.45%, 08/01/42 (a) | 125,000 | 107,364 |
4.60%, 03/15/48 (a) | 200,000 | 170,710 |
Valero Energy Corp. | ||
2.15%, 09/15/27 (a) | 200,000 | 177,512 |
4.35%, 06/01/28 (a) | 150,000 | 143,457 |
4.00%, 04/01/29 (a) | 150,000 | 141,687 |
2.80%, 12/01/31 (a) | 175,000 | 144,170 |
7.50%, 04/15/32 | 175,000 | 198,210 |
6.63%, 06/15/37 | 400,000 | 430,976 |
4.90%, 03/15/45 (f) | 250,000 | 222,380 |
3.65%, 12/01/51 (a) | 200,000 | 140,394 |
4.00%, 06/01/52 (a) | 175,000 | 132,195 |
Valero Energy Partners LP | ||
4.50%, 03/15/28 (a) | 200,000 | 192,912 |
Western Midstream Operating LP | ||
3.35%, 02/01/25 (a)(d) | 200,000 | 191,458 |
3.95%, 06/01/25 (a) | 100,000 | 96,147 |
4.65%, 07/01/26 (a) | 250,000 | 240,830 |
4.50%, 03/01/28 (a) | 150,000 | 141,735 |
4.75%, 08/15/28 (a) | 200,000 | 190,162 |
SECURITY RATE, MATURITY DATE | FACE AMOUNT ($) | VALUE ($) |
4.30%, 02/01/30 (a) | 400,000 | 360,488 |
5.45%, 04/01/44 (a) | 175,000 | 149,116 |
5.30%, 03/01/48 (a) | 125,000 | 104,900 |
5.50%, 08/15/48 (a) | 300,000 | 252,108 |
5.50%, 02/01/50 (a) | 200,000 | 166,774 |
Williams Cos., Inc. | ||
3.90%, 01/15/25 (a) | 237,000 | 230,471 |
4.00%, 09/15/25 (a) | 250,000 | 241,802 |
3.75%, 06/15/27 (a) | 500,000 | 472,560 |
3.50%, 11/15/30 (a) | 350,000 | 314,226 |
7.50%, 01/15/31 | 100,000 | 110,178 |
2.60%, 03/15/31 (a) | 350,000 | 290,598 |
8.75%, 03/15/32 | 150,000 | 178,368 |
6.30%, 04/15/40 | 400,000 | 420,724 |
5.80%, 11/15/43 (a) | 150,000 | 146,282 |
5.40%, 03/04/44 (a) | 175,000 | 162,120 |
5.75%, 06/24/44 (a) | 200,000 | 196,070 |
4.90%, 01/15/45 (a) | 125,000 | 109,470 |
5.10%, 09/15/45 (a) | 350,000 | 316,200 |
4.85%, 03/01/48 (a) | 200,000 | 174,680 |
3.50%, 10/15/51 (a) | 250,000 | 173,380 |
5.30%, 08/15/52 (a) | 225,000 | 208,310 |
120,531,797 | ||
Industrial Other 0.1% | ||
Boston University | ||
4.06%, 10/01/48 (a) | 130,000 | 113,464 |
California Institute of Technology | ||
4.32%, 08/01/45 | 100,000 | 91,837 |
4.70%, 11/01/11 | 125,000 | 109,573 |
3.65%, 09/01/19 (a) | 150,000 | 102,921 |
Case Western Reserve University | ||
5.41%, 06/01/22 (a) | 150,000 | 146,724 |
Cintas Corp. No. 2 | ||
3.70%, 04/01/27 (a) | 300,000 | 289,419 |
4.00%, 05/01/32 (a) | 200,000 | 190,380 |
Duke University | ||
2.68%, 10/01/44 | 150,000 | 111,741 |
2.76%, 10/01/50 | 100,000 | 70,890 |
2.83%, 10/01/55 | 200,000 | 139,982 |
Emory University | ||
2.14%, 09/01/30 (a) | 200,000 | 168,184 |
2.97%, 09/01/50 (a) | 50,000 | 35,984 |
George Washington University | ||
4.30%, 09/15/44 | 125,000 | 112,573 |
4.87%, 09/15/45 | 100,000 | 95,350 |
4.13%, 09/15/48 (a) | 225,000 | 194,735 |
Georgetown University | ||
4.32%, 04/01/49 (a) | 101,000 | 89,107 |
2.94%, 04/01/50 | 125,000 | 86,005 |
5.22%, 10/01/18 (a) | 150,000 | 138,283 |
Howard University | ||
5.21%, 10/01/52 (a) | 50,000 | 41,494 |
Johns Hopkins University | ||
4.08%, 07/01/53 | 200,000 | 178,864 |
2.81%, 01/01/60 (a) | 150,000 | 99,314 |
Leland Stanford Junior University | ||
3.65%, 05/01/48 (a) | 200,000 | 171,470 |
2.41%, 06/01/50 (a) | 250,000 | 165,565 |
Massachusetts Institute of Technology | ||
3.96%, 07/01/38 | 50,000 | 46,200 |
2.99%, 07/01/50 (a) | 200,000 | 149,900 |
2.29%, 07/01/51 (a) | 175,000 | 111,703 |
3.07%, 04/01/52 (a) | 100,000 | 75,540 |
SECURITY RATE, MATURITY DATE | FACE AMOUNT ($) | VALUE ($) |
5.60%, 07/01/11 | 240,000 | 271,716 |
4.68%, 07/01/14 | 150,000 | 140,977 |
3.89%, 07/01/16 | 150,000 | 115,684 |
Northeastern University | ||
2.89%, 10/01/50 | 100,000 | 69,191 |
Northwestern University | ||
4.64%, 12/01/44 | 200,000 | 195,728 |
2.64%, 12/01/50 (a) | 100,000 | 69,250 |
3.66%, 12/01/57 (a) | 100,000 | 82,832 |
President and Fellows of Harvard College | ||
4.88%, 10/15/40 | 50,000 | 50,812 |
3.15%, 07/15/46 (a) | 207,000 | 160,340 |
2.52%, 10/15/50 (a) | 200,000 | 135,286 |
3.75%, 11/15/52 (a) | 150,000 | 128,950 |
3.30%, 07/15/56 (a) | 150,000 | 114,929 |
Quanta Services, Inc. | ||
2.90%, 10/01/30 (a) | 200,000 | 170,244 |
2.35%, 01/15/32 (a) | 200,000 | 157,726 |
3.05%, 10/01/41 (a) | 200,000 | 139,948 |
The American University | ||
3.67%, 04/01/49 | 200,000 | 160,466 |
Thomas Jefferson University | ||
3.85%, 11/01/57 (a) | 225,000 | 164,234 |
Trustees of Boston College | ||
3.13%, 07/01/52 | 150,000 | 111,386 |
Trustees of Princeton University | ||
5.70%, 03/01/39 | 225,000 | 249,799 |
2.52%, 07/01/50 (a) | 200,000 | 137,504 |
Trustees of the University of Pennsylvania | ||
2.40%, 10/01/50 (a) | 100,000 | 65,153 |
4.67%, 09/01/12 | 100,000 | 89,986 |
3.61%, 02/15/19 (a) | 100,000 | 70,381 |
University of Chicago | ||
2.76%, 04/01/45 (a) | 150,000 | 114,912 |
2.55%, 04/01/50 (a) | 200,000 | 137,544 |
4.00%, 10/01/53 (a) | 125,000 | 110,483 |
University of Notre Dame du Lac | ||
3.44%, 02/15/45 | 150,000 | 123,196 |
3.39%, 02/15/48 (a) | 149,000 | 121,702 |
University of Southern California | ||
3.03%, 10/01/39 | 300,000 | 242,196 |
3.84%, 10/01/47 (a) | 200,000 | 173,278 |
2.81%, 10/01/50 (a) | 100,000 | 69,790 |
2.95%, 10/01/51 (a) | 125,000 | 89,435 |
5.25%, 10/01/11 | 100,000 | 101,052 |
3.23%, 10/01/20 (a) | 50,000 | 31,399 |
William Marsh Rice University | ||
3.57%, 05/15/45 | 150,000 | 127,000 |
3.77%, 05/15/55 | 125,000 | 105,536 |
Yale University | ||
1.48%, 04/15/30 (a) | 300,000 | 248,232 |
2.40%, 04/15/50 (a) | 200,000 | 132,384 |
8,307,863 | ||
Technology 2.4% | ||
Adobe, Inc. | ||
1.90%, 02/01/25 (a) | 150,000 | 142,548 |
3.25%, 02/01/25 (a) | 230,000 | 223,365 |
2.15%, 02/01/27 (a) | 275,000 | 252,895 |
2.30%, 02/01/30 (a) | 300,000 | 263,409 |
Advanced Micro Devices, Inc. | ||
3.92%, 06/01/32 (a) | 150,000 | 142,536 |
4.39%, 06/01/52 (a) | 150,000 | 136,743 |
SECURITY RATE, MATURITY DATE | FACE AMOUNT ($) | VALUE ($) |
Alphabet, Inc. | ||
0.45%, 08/15/25 (a) | 225,000 | 206,172 |
2.00%, 08/15/26 (a) | 500,000 | 463,200 |
0.80%, 08/15/27 (a) | 300,000 | 259,863 |
1.10%, 08/15/30 (a) | 600,000 | 485,964 |
1.90%, 08/15/40 (a) | 500,000 | 344,525 |
2.05%, 08/15/50 (a) | 750,000 | 470,242 |
2.25%, 08/15/60 (a) | 475,000 | 289,541 |
Amdocs Ltd. | ||
2.54%, 06/15/30 (a) | 250,000 | 209,548 |
Analog Devices, Inc. | ||
2.95%, 04/01/25 (a) | 150,000 | 144,273 |
3.50%, 12/05/26 (a) | 225,000 | 216,882 |
3.45%, 06/15/27 (a)(c) | 150,000 | 142,322 |
1.70%, 10/01/28 (a) | 200,000 | 172,148 |
2.10%, 10/01/31 (a) | 350,000 | 290,129 |
2.80%, 10/01/41 (a) | 250,000 | 186,578 |
2.95%, 10/01/51 (a) | 325,000 | 231,052 |
Apple Inc. | ||
1.80%, 09/11/24 (a) | 250,000 | 240,732 |
2.75%, 01/13/25 (a) | 400,000 | 385,956 |
2.50%, 02/09/25 | 300,000 | 288,072 |
1.13%, 05/11/25 (a) | 500,000 | 466,090 |
3.20%, 05/13/25 | 600,000 | 580,956 |
0.55%, 08/20/25 (a) | 400,000 | 365,540 |
0.70%, 02/08/26 (a) | 750,000 | 676,402 |
3.25%, 02/23/26 (a) | 950,000 | 915,334 |
4.42%, 05/08/26 (a) | 300,000 | 298,761 |
2.45%, 08/04/26 (a) | 600,000 | 562,524 |
2.05%, 09/11/26 (a) | 550,000 | 507,100 |
3.35%, 02/09/27 (a) | 600,000 | 576,210 |
3.20%, 05/11/27 (a) | 500,000 | 477,650 |
3.00%, 06/20/27 (a) | 250,000 | 237,103 |
2.90%, 09/12/27 (a) | 550,000 | 517,154 |
3.00%, 11/13/27 (a) | 450,000 | 424,503 |
1.20%, 02/08/28 (a) | 750,000 | 649,957 |
4.00%, 05/10/28 (a) | 500,000 | 491,980 |
1.40%, 08/05/28 (a) | 650,000 | 561,385 |
3.25%, 08/08/29 (a) | 300,000 | 281,349 |
2.20%, 09/11/29 (a) | 550,000 | 483,010 |
1.65%, 05/11/30 (a) | 550,000 | 463,716 |
1.25%, 08/20/30 (a) | 400,000 | 325,012 |
1.65%, 02/08/31 (a) | 800,000 | 663,696 |
1.70%, 08/05/31 (a) | 350,000 | 288,883 |
3.35%, 08/08/32 (a) | 450,000 | 420,430 |
4.50%, 02/23/36 (a) | 300,000 | 305,985 |
2.38%, 02/08/41 (a) | 450,000 | 332,572 |
3.85%, 05/04/43 | 800,000 | 713,800 |
4.45%, 05/06/44 | 230,000 | 224,664 |
3.45%, 02/09/45 | 600,000 | 506,580 |
4.38%, 05/13/45 | 600,000 | 570,420 |
4.65%, 02/23/46 (a) | 850,000 | 839,120 |
3.85%, 08/04/46 (a) | 588,000 | 517,716 |
4.25%, 02/09/47 (a) | 300,000 | 286,827 |
3.75%, 09/12/47 (a) | 350,000 | 303,282 |
3.75%, 11/13/47 (a) | 419,000 | 363,847 |
2.95%, 09/11/49 (a) | 500,000 | 372,870 |
2.65%, 05/11/50 (a) | 750,000 | 523,057 |
2.40%, 08/20/50 (a) | 450,000 | 301,630 |
2.65%, 02/08/51 (a) | 350,000 | 242,620 |
2.70%, 08/05/51 (a) | 525,000 | 367,201 |
3.95%, 08/08/52 (a) | 500,000 | 441,670 |
4.85%, 05/10/53 (a) | 500,000 | 513,000 |
2.55%, 08/20/60 (a) | 550,000 | 363,918 |
2.80%, 02/08/61 (a) | 550,000 | 373,175 |
2.85%, 08/05/61 (a) | 450,000 | 306,873 |
4.10%, 08/08/62 (a) | 200,000 | 175,416 |
SECURITY RATE, MATURITY DATE | FACE AMOUNT ($) | VALUE ($) |
Applied Materials, Inc. | ||
3.90%, 10/01/25 (a) | 250,000 | 244,647 |
3.30%, 04/01/27 (a) | 400,000 | 382,164 |
1.75%, 06/01/30 (a) | 250,000 | 209,223 |
5.10%, 10/01/35 (a) | 100,000 | 101,891 |
5.85%, 06/15/41 | 150,000 | 165,323 |
4.35%, 04/01/47 (a) | 125,000 | 117,344 |
2.75%, 06/01/50 (a) | 325,000 | 230,565 |
Arrow Electronics, Inc. | ||
3.25%, 09/08/24 (a) | 200,000 | 193,334 |
4.00%, 04/01/25 (a) | 50,000 | 48,397 |
3.88%, 01/12/28 (a) | 325,000 | 301,424 |
2.95%, 02/15/32 (a) | 50,000 | 41,339 |
Autodesk, Inc. | ||
4.38%, 06/15/25 (a) | 200,000 | 195,820 |
3.50%, 06/15/27 (a) | 75,000 | 71,098 |
2.85%, 01/15/30 (a) | 50,000 | 43,836 |
2.40%, 12/15/31 (a) | 375,000 | 308,040 |
Automatic Data Processing, Inc. | ||
3.38%, 09/15/25 (a) | 250,000 | 241,735 |
1.70%, 05/15/28 (a) | 250,000 | 219,845 |
1.25%, 09/01/30 (a) | 350,000 | 283,990 |
Avnet, Inc. | ||
4.63%, 04/15/26 (a) | 250,000 | 242,625 |
3.00%, 05/15/31 (a) | 25,000 | 20,055 |
5.50%, 06/01/32 (a) | 150,000 | 143,304 |
Baidu, Inc. | ||
3.08%, 04/07/25 (a) | 300,000 | 286,287 |
1.72%, 04/09/26 (a) | 200,000 | 180,894 |
3.63%, 07/06/27 | 200,000 | 188,062 |
4.38%, 03/29/28 (a) | 200,000 | 191,976 |
4.88%, 11/14/28 (a) | 200,000 | 195,692 |
3.43%, 04/07/30 (a) | 200,000 | 179,596 |
2.38%, 10/09/30 (a) | 150,000 | 124,340 |
2.38%, 08/23/31 (a) | 200,000 | 162,840 |
Broadcom Corp./Broadcom Cayman Finance Ltd. | ||
3.13%, 01/15/25 (a) | 100,000 | 96,182 |
3.88%, 01/15/27 (a) | 800,000 | 763,592 |
3.50%, 01/15/28 (a) | 250,000 | 231,128 |
Broadcom, Inc. | ||
3.63%, 10/15/24 (a) | 200,000 | 194,600 |
3.15%, 11/15/25 (a) | 250,000 | 237,693 |
3.46%, 09/15/26 (a) | 204,000 | 193,068 |
1.95%, 02/15/28 (a)(c) | 300,000 | 260,013 |
4.11%, 09/15/28 (a) | 400,000 | 378,552 |
4.00%, 04/15/29 (a)(c) | 200,000 | 185,078 |
4.75%, 04/15/29 (a) | 150,000 | 145,295 |
5.00%, 04/15/30 (a) | 200,000 | 196,520 |
4.15%, 11/15/30 (a) | 543,000 | 499,332 |
2.45%, 02/15/31 (a)(c) | 800,000 | 650,928 |
4.15%, 04/15/32 (a)(c) | 350,000 | 317,100 |
4.30%, 11/15/32 (a) | 575,000 | 527,200 |
2.60%, 02/15/33 (a)(c) | 500,000 | 390,115 |
3.42%, 04/15/33 (a)(c) | 600,000 | 502,950 |
3.47%, 04/15/34 (a)(c) | 850,000 | 697,671 |
3.14%, 11/15/35 (a)(c) | 881,000 | 676,828 |
3.19%, 11/15/36 (a)(c) | 707,000 | 534,754 |
4.93%, 05/15/37 (a)(c) | 655,000 | 592,526 |
3.50%, 02/15/41 (a)(c) | 900,000 | 675,162 |
3.75%, 02/15/51 (a)(c) | 500,000 | 370,050 |
Broadridge Financial Solutions, Inc. | ||
3.40%, 06/27/26 (a) | 200,000 | 188,648 |
2.90%, 12/01/29 (a) | 250,000 | 214,225 |
2.60%, 05/01/31 (a) | 250,000 | 205,285 |
Cadence Design Systems, Inc. | ||
4.38%, 10/15/24 (a) | 100,000 | 98,428 |
SECURITY RATE, MATURITY DATE | FACE AMOUNT ($) | VALUE ($) |
CDW LLC/CDW Finance Corp. | ||
5.50%, 12/01/24 (a) | 175,000 | 174,001 |
4.13%, 05/01/25 (a) | 175,000 | 169,657 |
2.67%, 12/01/26 (a) | 275,000 | 247,596 |
4.25%, 04/01/28 (a) | 250,000 | 230,203 |
3.28%, 12/01/28 (a) | 150,000 | 130,568 |
3.25%, 02/15/29 (a) | 200,000 | 173,476 |
3.57%, 12/01/31 (a) | 300,000 | 253,623 |
CGI, Inc. | ||
1.45%, 09/14/26 (a) | 200,000 | 176,950 |
2.30%, 09/14/31 (a) | 150,000 | 117,399 |
Cisco Systems, Inc. | ||
3.50%, 06/15/25 | 50,000 | 48,585 |
2.95%, 02/28/26 | 150,000 | 144,095 |
2.50%, 09/20/26 (a) | 450,000 | 422,001 |
5.90%, 02/15/39 | 500,000 | 553,760 |
5.50%, 01/15/40 | 650,000 | 691,892 |
Corning, Inc. | ||
4.70%, 03/15/37 | 50,000 | 46,457 |
5.75%, 08/15/40 | 150,000 | 152,655 |
4.75%, 03/15/42 | 50,000 | 46,167 |
5.35%, 11/15/48 (a) | 150,000 | 146,151 |
3.90%, 11/15/49 (a) | 200,000 | 151,376 |
4.38%, 11/15/57 (a) | 250,000 | 204,080 |
5.85%, 11/15/68 (a) | 100,000 | 96,316 |
5.45%, 11/15/79 (a) | 300,000 | 273,990 |
Dell International LLC/EMC Corp. | ||
4.00%, 07/15/24 (a) | 250,000 | 245,930 |
5.85%, 07/15/25 (a) | 200,000 | 200,890 |
6.02%, 06/15/26 (a) | 1,200,000 | 1,218,276 |
4.90%, 10/01/26 (a) | 500,000 | 497,695 |
6.10%, 07/15/27 (a) | 200,000 | 206,658 |
5.25%, 02/01/28 (a) | 250,000 | 249,662 |
5.30%, 10/01/29 (a) | 550,000 | 546,535 |
6.20%, 07/15/30 (a) | 300,000 | 312,540 |
5.75%, 02/01/33 (a) | 250,000 | 252,680 |
8.10%, 07/15/36 (a) | 200,000 | 232,954 |
3.38%, 12/15/41 (a)(c) | 250,000 | 176,710 |
8.35%, 07/15/46 (a) | 256,000 | 314,171 |
3.45%, 12/15/51 (a)(c) | 400,000 | 268,380 |
Dell, Inc. | ||
7.10%, 04/15/28 | 50,000 | 53,810 |
6.50%, 04/15/38 | 100,000 | 103,751 |
DXC Technology Co. | ||
1.80%, 09/15/26 (a) | 250,000 | 217,540 |
2.38%, 09/15/28 (a) | 200,000 | 167,272 |
Equifax, Inc. | ||
2.60%, 12/01/24 (a) | 200,000 | 190,882 |
2.60%, 12/15/25 (a) | 150,000 | 139,742 |
3.10%, 05/15/30 (a) | 200,000 | 173,190 |
2.35%, 09/15/31 (a) | 400,000 | 319,960 |
Equinix, Inc. | ||
2.63%, 11/18/24 (a) | 200,000 | 191,308 |
1.00%, 09/15/25 (a) | 250,000 | 225,995 |
1.45%, 05/15/26 (a) | 200,000 | 178,930 |
2.90%, 11/18/26 (a) | 250,000 | 229,540 |
1.80%, 07/15/27 (a) | 150,000 | 130,040 |
1.55%, 03/15/28 (a) | 250,000 | 210,103 |
3.20%, 11/18/29 (a) | 400,000 | 352,312 |
2.15%, 07/15/30 (a) | 300,000 | 243,408 |
2.50%, 05/15/31 (a) | 300,000 | 244,749 |
3.90%, 04/15/32 (a) | 350,000 | 315,052 |
3.00%, 07/15/50 (a) | 175,000 | 114,146 |
2.95%, 09/15/51 (a) | 150,000 | 95,763 |
3.40%, 02/15/52 (a) | 100,000 | 70,514 |
SECURITY RATE, MATURITY DATE | FACE AMOUNT ($) | VALUE ($) |
FactSet Research Systems, Inc. | ||
2.90%, 03/01/27 (a) | 200,000 | 184,030 |
3.45%, 03/01/32 (a) | 150,000 | 128,417 |
Fidelity National Information Services, Inc. | ||
4.50%, 07/15/25 | 250,000 | 244,680 |
1.15%, 03/01/26 (a) | 350,000 | 312,606 |
1.65%, 03/01/28 (a) | 250,000 | 211,625 |
3.75%, 05/21/29 (a) | 50,000 | 45,753 |
2.25%, 03/01/31 (a) | 500,000 | 400,505 |
5.10%, 07/15/32 (a) | 225,000 | 218,599 |
3.10%, 03/01/41 (a) | 250,000 | 172,440 |
4.50%, 08/15/46 (a) | 100,000 | 80,568 |
5.63%, 07/15/52 (a) | 100,000 | 94,663 |
Fiserv, Inc. | ||
2.75%, 07/01/24 (a) | 600,000 | 582,324 |
3.85%, 06/01/25 (a) | 250,000 | 242,707 |
3.20%, 07/01/26 (a) | 800,000 | 751,176 |
2.25%, 06/01/27 (a) | 200,000 | 179,926 |
4.20%, 10/01/28 (a) | 300,000 | 287,589 |
3.50%, 07/01/29 (a) | 750,000 | 687,307 |
2.65%, 06/01/30 (a) | 200,000 | 170,692 |
5.60%, 03/02/33 (a) | 250,000 | 255,120 |
4.40%, 07/01/49 (a) | 525,000 | 443,793 |
Flex Ltd. | ||
4.75%, 06/15/25 (a) | 150,000 | 146,714 |
3.75%, 02/01/26 (a) | 200,000 | 190,748 |
4.88%, 06/15/29 (a) | 250,000 | 239,930 |
4.88%, 05/12/30 (a) | 300,000 | 291,270 |
Fortinet, Inc. | ||
1.00%, 03/15/26 (a) | 200,000 | 178,606 |
Genpact Luxembourg Sarl | ||
3.38%, 12/01/24 (a) | 200,000 | 192,562 |
1.75%, 04/10/26 (a) | 100,000 | 90,080 |
Global Payments, Inc. | ||
1.50%, 11/15/24 (a) | 200,000 | 188,082 |
2.65%, 02/15/25 (a) | 200,000 | 189,806 |
1.20%, 03/01/26 (a) | 400,000 | 355,652 |
2.15%, 01/15/27 (a) | 350,000 | 311,332 |
4.45%, 06/01/28 (a) | 150,000 | 140,990 |
3.20%, 08/15/29 (a) | 400,000 | 347,840 |
5.30%, 08/15/29 (a) | 150,000 | 146,658 |
2.90%, 05/15/30 (a) | 275,000 | 233,233 |
2.90%, 11/15/31 (a) | 250,000 | 204,085 |
5.40%, 08/15/32 (a) | 225,000 | 219,409 |
4.15%, 08/15/49 (a) | 200,000 | 149,952 |
5.95%, 08/15/52 (a) | 200,000 | 192,238 |
Hewlett Packard Enterprise Co. | ||
5.90%, 10/01/24 | 300,000 | 299,922 |
4.90%, 10/15/25 (a) | 600,000 | 592,140 |
1.75%, 04/01/26 (a) | 350,000 | 319,088 |
6.20%, 10/15/35 (a) | 250,000 | 262,292 |
6.35%, 10/15/45 (a) | 425,000 | 444,002 |
HP, Inc. | ||
2.20%, 06/17/25 (a) | 500,000 | 470,285 |
1.45%, 06/17/26 (a) | 200,000 | 179,724 |
3.00%, 06/17/27 (a) | 300,000 | 277,074 |
4.00%, 04/15/29 (a) | 300,000 | 280,413 |
3.40%, 06/17/30 (a) | 300,000 | 263,961 |
2.65%, 06/17/31 (a) | 250,000 | 201,618 |
4.20%, 04/15/32 (a) | 300,000 | 269,355 |
5.50%, 01/15/33 (a) | 350,000 | 344,078 |
6.00%, 09/15/41 | 350,000 | 354,294 |
Intel Corp. | ||
3.40%, 03/25/25 (a) | 600,000 | 582,018 |
3.70%, 07/29/25 (a) | 700,000 | 680,526 |
4.88%, 02/10/26 | 500,000 | 498,740 |
SECURITY RATE, MATURITY DATE | FACE AMOUNT ($) | VALUE ($) |
2.60%, 05/19/26 (a) | 350,000 | 329,427 |
3.75%, 03/25/27 (a) | 250,000 | 240,797 |
3.15%, 05/11/27 (a) | 300,000 | 281,448 |
3.75%, 08/05/27 (a) | 200,000 | 191,522 |
4.88%, 02/10/28 (a) | 500,000 | 498,425 |
1.60%, 08/12/28 (a) | 300,000 | 258,882 |
4.00%, 08/05/29 (a) | 250,000 | 238,198 |
2.45%, 11/15/29 (a) | 700,000 | 607,873 |
3.90%, 03/25/30 (a) | 450,000 | 424,701 |
2.00%, 08/12/31 (a) | 600,000 | 490,302 |
4.15%, 08/05/32 (a) | 375,000 | 357,855 |
4.00%, 12/15/32 | 100,000 | 93,975 |
5.20%, 02/10/33 (a) | 800,000 | 808,384 |
4.60%, 03/25/40 (a) | 250,000 | 234,093 |
2.80%, 08/12/41 (a) | 250,000 | 178,753 |
4.80%, 10/01/41 | 200,000 | 186,548 |
4.25%, 12/15/42 | 350,000 | 305,035 |
4.90%, 07/29/45 (a) | 200,000 | 197,632 |
4.10%, 05/19/46 (a) | 250,000 | 211,055 |
4.10%, 05/11/47 (a) | 275,000 | 232,645 |
3.73%, 12/08/47 (a) | 500,000 | 390,065 |
3.25%, 11/15/49 (a) | 600,000 | 423,882 |
4.75%, 03/25/50 (a) | 650,000 | 589,615 |
3.05%, 08/12/51 (a) | 350,000 | 234,962 |
4.90%, 08/05/52 (a) | 475,000 | 439,798 |
5.70%, 02/10/53 (a) | 500,000 | 509,605 |
3.10%, 02/15/60 (a) | 375,000 | 241,264 |
4.95%, 03/25/60 (a)(f) | 300,000 | 277,746 |
3.20%, 08/12/61 (a) | 250,000 | 163,148 |
5.05%, 08/05/62 (a) | 250,000 | 230,623 |
5.90%, 02/10/63 (a) | 400,000 | 413,100 |
International Business Machines Corp. | ||
4.00%, 07/27/25 | 300,000 | 293,298 |
7.00%, 10/30/25 | 150,000 | 156,183 |
4.50%, 02/06/26 | 300,000 | 295,896 |
3.45%, 02/19/26 | 500,000 | 479,230 |
3.30%, 05/15/26 | 900,000 | 858,051 |
3.30%, 01/27/27 | 350,000 | 331,114 |
2.20%, 02/09/27 (a) | 200,000 | 182,192 |
1.70%, 05/15/27 (a) | 100,000 | 88,734 |
4.15%, 07/27/27 (a) | 300,000 | 291,753 |
3.50%, 05/15/29 | 1,000,000 | 924,750 |
1.95%, 05/15/30 (a) | 500,000 | 415,180 |
2.72%, 02/09/32 (a) | 150,000 | 128,454 |
4.40%, 07/27/32 (a) | 300,000 | 288,291 |
5.88%, 11/29/32 | 300,000 | 321,027 |
4.15%, 05/15/39 | 650,000 | 571,311 |
2.85%, 05/15/40 (a) | 300,000 | 220,173 |
4.00%, 06/20/42 | 375,000 | 317,377 |
4.70%, 02/19/46 | 250,000 | 226,940 |
4.25%, 05/15/49 | 950,000 | 812,696 |
2.95%, 05/15/50 (a) | 300,000 | 201,510 |
3.43%, 02/09/52 (a) | 250,000 | 182,168 |
7.13%, 12/01/96 | 100,000 | 127,706 |
Intuit, Inc. | ||
0.95%, 07/15/25 (a) | 150,000 | 137,258 |
1.35%, 07/15/27 (a) | 200,000 | 175,556 |
1.65%, 07/15/30 (a) | 150,000 | 121,898 |
Jabil, Inc. | ||
3.95%, 01/12/28 (a) | 350,000 | 328,286 |
3.60%, 01/15/30 (a) | 150,000 | 134,640 |
3.00%, 01/15/31 (a) | 200,000 | 170,290 |
Juniper Networks, Inc. | ||
1.20%, 12/10/25 (a) | 150,000 | 134,538 |
3.75%, 08/15/29 (a) | 200,000 | 180,798 |
2.00%, 12/10/30 (a) | 150,000 | 116,681 |
SECURITY RATE, MATURITY DATE | FACE AMOUNT ($) | VALUE ($) |
Keysight Technologies, Inc. | ||
4.55%, 10/30/24 (a) | 100,000 | 98,474 |
4.60%, 04/06/27 (a) | 250,000 | 246,795 |
3.00%, 10/30/29 (a) | 200,000 | 175,868 |
KLA Corp. | ||
4.65%, 11/01/24 (a) | 250,000 | 246,780 |
4.10%, 03/15/29 (a) | 274,000 | 264,026 |
4.65%, 07/15/32 (a) | 300,000 | 299,124 |
5.00%, 03/15/49 (a) | 150,000 | 145,845 |
3.30%, 03/01/50 (a) | 250,000 | 188,825 |
5.25%, 07/15/62 (a) | 350,000 | 356,265 |
Kyndryl Holdings, Inc. | ||
2.05%, 10/15/26 (a) | 200,000 | 174,138 |
2.70%, 10/15/28 (a) | 150,000 | 122,169 |
3.15%, 10/15/31 (a) | 200,000 | 150,214 |
4.10%, 10/15/41 (a) | 200,000 | 134,626 |
Lam Research Corp. | ||
3.80%, 03/15/25 (a) | 150,000 | 146,736 |
3.75%, 03/15/26 (a) | 150,000 | 145,605 |
4.00%, 03/15/29 (a) | 300,000 | 290,037 |
1.90%, 06/15/30 (a) | 250,000 | 208,435 |
4.88%, 03/15/49 (a) | 220,000 | 213,477 |
2.88%, 06/15/50 (a) | 250,000 | 174,798 |
3.13%, 06/15/60 (a) | 225,000 | 153,443 |
Leidos, Inc. | ||
3.63%, 05/15/25 (a) | 150,000 | 143,984 |
4.38%, 05/15/30 (a) | 300,000 | 277,194 |
2.30%, 02/15/31 (a) | 250,000 | 197,353 |
Marvell Technology, Inc. | ||
1.65%, 04/15/26 (a) | 150,000 | 135,386 |
2.45%, 04/15/28 (a) | 250,000 | 218,740 |
4.88%, 06/22/28 (a) | 189,000 | 183,602 |
2.95%, 04/15/31 (a) | 150,000 | 125,850 |
Mastercard, Inc. | ||
2.00%, 03/03/25 (a) | 200,000 | 190,272 |
2.95%, 11/21/26 (a) | 300,000 | 283,848 |
3.30%, 03/26/27 (a) | 300,000 | 286,866 |
4.88%, 03/09/28 (a) | 200,000 | 202,436 |
2.95%, 06/01/29 (a) | 350,000 | 319,091 |
3.35%, 03/26/30 (a) | 400,000 | 373,500 |
2.00%, 11/18/31 (a) | 250,000 | 207,098 |
3.80%, 11/21/46 (a) | 125,000 | 106,563 |
3.95%, 02/26/48 (a) | 100,000 | 89,002 |
3.65%, 06/01/49 (a) | 300,000 | 251,619 |
3.85%, 03/26/50 (a) | 450,000 | 389,466 |
2.95%, 03/15/51 (a) | 250,000 | 183,288 |
Microchip Technology, Inc. | ||
0.98%, 09/01/24 | 300,000 | 283,359 |
4.25%, 09/01/25 (a) | 300,000 | 290,940 |
Micron Technology, Inc. | ||
4.98%, 02/06/26 (a) | 50,000 | 49,275 |
4.19%, 02/15/27 (a) | 250,000 | 239,820 |
5.38%, 04/15/28 (a) | 150,000 | 148,698 |
5.33%, 02/06/29 (a) | 200,000 | 197,280 |
6.75%, 11/01/29 (a) | 200,000 | 208,060 |
4.66%, 02/15/30 (a) | 250,000 | 235,905 |
2.70%, 04/15/32 (a) | 350,000 | 276,678 |
5.88%, 02/09/33 (a) | 200,000 | 199,480 |
5.88%, 09/15/33 (a) | 250,000 | 247,947 |
3.37%, 11/01/41 (a) | 200,000 | 140,334 |
3.48%, 11/01/51 (a) | 125,000 | 83,536 |
Microsoft Corp. | ||
2.70%, 02/12/25 (a) | 550,000 | 530,805 |
3.13%, 11/03/25 (a) | 900,000 | 866,574 |
2.40%, 08/08/26 (a) | 1,150,000 | 1,079,574 |
3.30%, 02/06/27 (a) | 1,225,000 | 1,179,026 |
SECURITY RATE, MATURITY DATE | FACE AMOUNT ($) | VALUE ($) |
3.50%, 02/12/35 (a) | 525,000 | 492,271 |
4.20%, 11/03/35 (a) | 150,000 | 148,758 |
3.45%, 08/08/36 (a) | 450,000 | 411,043 |
4.10%, 02/06/37 (a) | 475,000 | 461,861 |
3.50%, 11/15/42 | 50,000 | 43,377 |
3.75%, 02/12/45 (a) | 75,000 | 67,937 |
4.45%, 11/03/45 (a) | 200,000 | 197,336 |
3.70%, 08/08/46 (a) | 450,000 | 395,019 |
4.25%, 02/06/47 (a) | 300,000 | 291,960 |
2.53%, 06/01/50 (a) | 1,825,000 | 1,264,287 |
2.92%, 03/17/52 (a) | 1,794,000 | 1,337,248 |
4.00%, 02/12/55 (a) | 250,000 | 231,245 |
3.95%, 08/08/56 (a) | 200,000 | 180,568 |
4.50%, 02/06/57 (a) | 250,000 | 252,085 |
2.68%, 06/01/60 (a) | 960,000 | 644,592 |
3.04%, 03/17/62 (a) | 491,000 | 359,186 |
Moody's Corp. | ||
3.75%, 03/24/25 (a) | 100,000 | 97,343 |
3.25%, 01/15/28 (a) | 100,000 | 93,370 |
4.25%, 02/01/29 (a) | 100,000 | 96,435 |
2.00%, 08/19/31 (a) | 200,000 | 161,464 |
2.75%, 08/19/41 (a) | 175,000 | 122,862 |
5.25%, 07/15/44 | 100,000 | 98,468 |
4.88%, 12/17/48 (a) | 50,000 | 47,059 |
3.25%, 05/20/50 (a) | 100,000 | 71,220 |
3.75%, 02/25/52 (a) | 150,000 | 119,076 |
2.55%, 08/18/60 (a) | 200,000 | 112,486 |
3.10%, 11/29/61 (a) | 175,000 | 115,381 |
Motorola Solutions, Inc. | ||
4.60%, 02/23/28 (a) | 200,000 | 194,052 |
4.60%, 05/23/29 (a) | 250,000 | 242,497 |
2.30%, 11/15/30 (a) | 300,000 | 243,039 |
2.75%, 05/24/31 (a) | 250,000 | 205,368 |
5.60%, 06/01/32 (a) | 200,000 | 198,864 |
5.50%, 09/01/44 | 100,000 | 95,175 |
NetApp, Inc. | ||
3.30%, 09/29/24 (a) | 50,000 | 48,438 |
1.88%, 06/22/25 (a) | 250,000 | 232,400 |
2.38%, 06/22/27 (a) | 175,000 | 158,967 |
2.70%, 06/22/30 (a) | 250,000 | 210,745 |
Nokia Oyj | ||
4.38%, 06/12/27 | 350,000 | 330,242 |
NVIDIA Corp. | ||
3.20%, 09/16/26 (a) | 400,000 | 385,588 |
1.55%, 06/15/28 (a) | 225,000 | 196,583 |
2.85%, 04/01/30 (a) | 400,000 | 362,964 |
2.00%, 06/15/31 (a) | 400,000 | 335,924 |
3.50%, 04/01/40 (a) | 300,000 | 257,454 |
3.50%, 04/01/50 (a) | 550,000 | 448,156 |
3.70%, 04/01/60 (a) | 175,000 | 144,757 |
NXP BV/NXP Funding LLC | ||
5.35%, 03/01/26 (a) | 200,000 | 198,864 |
5.55%, 12/01/28 (a) | 250,000 | 252,067 |
NXP BV/NXP Funding LLC/NXP USA, Inc. | ||
2.70%, 05/01/25 (a) | 200,000 | 189,648 |
3.88%, 06/18/26 (a) | 250,000 | 240,398 |
3.15%, 05/01/27 (a) | 200,000 | 184,448 |
4.30%, 06/18/29 (a) | 350,000 | 330,312 |
3.40%, 05/01/30 (a) | 200,000 | 177,328 |
2.50%, 05/11/31 (a) | 300,000 | 245,169 |
2.65%, 02/15/32 (a) | 350,000 | 283,300 |
3.25%, 05/11/41 (a) | 350,000 | 255,045 |
3.25%, 11/30/51 (a) | 250,000 | 168,128 |
Oracle Corp. | ||
3.40%, 07/08/24 (a) | 400,000 | 391,536 |
2.95%, 11/15/24 (a) | 570,000 | 550,552 |
SECURITY RATE, MATURITY DATE | FACE AMOUNT ($) | VALUE ($) |
2.50%, 04/01/25 (a) | 1,000,000 | 949,550 |
2.95%, 05/15/25 (a) | 500,000 | 477,310 |
5.80%, 11/10/25 | 300,000 | 303,588 |
1.65%, 03/25/26 (a) | 800,000 | 727,024 |
2.65%, 07/15/26 (a) | 756,000 | 700,464 |
2.80%, 04/01/27 (a) | 650,000 | 598,214 |
3.25%, 11/15/27 (a) | 850,000 | 789,225 |
2.30%, 03/25/28 (a) | 650,000 | 574,067 |
4.50%, 05/06/28 (a) | 300,000 | 292,128 |
6.15%, 11/09/29 (a) | 350,000 | 364,885 |
2.95%, 04/01/30 (a) | 950,000 | 829,796 |
3.25%, 05/15/30 (a) | 150,000 | 133,953 |
2.88%, 03/25/31 (a) | 1,000,000 | 853,310 |
6.25%, 11/09/32 (a) | 650,000 | 690,807 |
4.90%, 02/06/33 (a) | 300,000 | 291,357 |
4.30%, 07/08/34 (a) | 400,000 | 363,676 |
3.90%, 05/15/35 (a) | 350,000 | 302,025 |
3.85%, 07/15/36 (a) | 350,000 | 293,016 |
3.80%, 11/15/37 (a) | 525,000 | 430,206 |
6.50%, 04/15/38 | 400,000 | 428,092 |
6.13%, 07/08/39 | 350,000 | 361,378 |
3.60%, 04/01/40 (a) | 850,000 | 658,418 |
5.38%, 07/15/40 | 600,000 | 573,456 |
3.65%, 03/25/41 (a) | 600,000 | 463,392 |
4.50%, 07/08/44 (a) | 275,000 | 230,607 |
4.13%, 05/15/45 (a) | 550,000 | 432,602 |
4.00%, 07/15/46 (a) | 800,000 | 615,744 |
4.00%, 11/15/47 (a) | 675,000 | 521,532 |
3.60%, 04/01/50 (a) | 1,300,000 | 929,617 |
3.95%, 03/25/51 (a) | 840,000 | 636,174 |
6.90%, 11/09/52 (a) | 700,000 | 786,954 |
5.55%, 02/06/53 (a) | 500,000 | 484,905 |
4.38%, 05/15/55 (a) | 375,000 | 302,332 |
3.85%, 04/01/60 (a) | 1,000,000 | 703,640 |
4.10%, 03/25/61 (a) | 450,000 | 333,004 |
PayPal Holdings, Inc. | ||
2.40%, 10/01/24 (a) | 300,000 | 288,555 |
1.65%, 06/01/25 (a) | 300,000 | 280,860 |
2.65%, 10/01/26 (a) | 350,000 | 325,615 |
3.90%, 06/01/27 (a) | 150,000 | 145,280 |
2.85%, 10/01/29 (a) | 425,000 | 378,105 |
2.30%, 06/01/30 (a) | 300,000 | 254,454 |
4.40%, 06/01/32 (a) | 300,000 | 289,143 |
3.25%, 06/01/50 (a) | 275,000 | 199,958 |
5.05%, 06/01/52 (a) | 300,000 | 294,321 |
5.25%, 06/01/62 (a) | 150,000 | 146,364 |
Qorvo, Inc. | ||
1.75%, 12/15/24 (a)(c) | 200,000 | 186,166 |
4.38%, 10/15/29 (a) | 350,000 | 317,299 |
QUALCOMM, Inc. | ||
3.45%, 05/20/25 (a) | 450,000 | 436,743 |
3.25%, 05/20/27 (a) | 550,000 | 522,038 |
1.30%, 05/20/28 (a) | 384,000 | 327,590 |
2.15%, 05/20/30 (a) | 400,000 | 344,420 |
1.65%, 05/20/32 (a) | 450,000 | 355,486 |
4.25%, 05/20/32 (a) | 150,000 | 146,403 |
4.65%, 05/20/35 (a) | 275,000 | 275,258 |
4.80%, 05/20/45 (a) | 450,000 | 436,072 |
4.30%, 05/20/47 (a) | 400,000 | 363,352 |
3.25%, 05/20/50 (a) | 175,000 | 132,253 |
4.50%, 05/20/52 (a) | 300,000 | 273,369 |
6.00%, 05/20/53 (a) | 350,000 | 391,958 |
RELX Capital, Inc. | ||
4.00%, 03/18/29 (a) | 250,000 | 239,618 |
3.00%, 05/22/30 (a) | 200,000 | 178,814 |
4.75%, 05/20/32 (a) | 150,000 | 147,582 |
SECURITY RATE, MATURITY DATE | FACE AMOUNT ($) | VALUE ($) |
Roper Technologies, Inc. | ||
2.35%, 09/15/24 (a) | 150,000 | 144,053 |
1.00%, 09/15/25 (a) | 250,000 | 227,553 |
3.85%, 12/15/25 (a) | 100,000 | 96,053 |
3.80%, 12/15/26 (a) | 200,000 | 191,620 |
1.40%, 09/15/27 (a) | 200,000 | 172,506 |
4.20%, 09/15/28 (a) | 50,000 | 48,147 |
2.95%, 09/15/29 (a) | 200,000 | 177,316 |
2.00%, 06/30/30 (a) | 250,000 | 205,015 |
1.75%, 02/15/31 (a) | 350,000 | 277,952 |
S&P Global, Inc. | ||
2.95%, 01/22/27 (a) | 150,000 | 141,068 |
2.45%, 03/01/27 (a) | 400,000 | 369,496 |
4.75%, 08/01/28 (a) | 150,000 | 149,417 |
2.70%, 03/01/29 (a) | 350,000 | 316,578 |
4.25%, 05/01/29 (a) | 200,000 | 195,364 |
2.50%, 12/01/29 (a) | 150,000 | 131,055 |
1.25%, 08/15/30 (a) | 100,000 | 78,967 |
2.90%, 03/01/32 (a) | 400,000 | 347,656 |
3.25%, 12/01/49 (a) | 200,000 | 150,776 |
3.70%, 03/01/52 (a) | 275,000 | 225,789 |
2.30%, 08/15/60 (a) | 250,000 | 145,160 |
3.90%, 03/01/62 (a) | 150,000 | 124,215 |
Salesforce, Inc. | ||
0.63%, 07/15/24 (a) | 200,000 | 190,514 |
3.70%, 04/11/28 (a) | 425,000 | 410,473 |
1.50%, 07/15/28 (a) | 300,000 | 258,636 |
1.95%, 07/15/31 (a) | 500,000 | 413,180 |
2.70%, 07/15/41 (a) | 350,000 | 256,627 |
2.90%, 07/15/51 (a) | 550,000 | 387,827 |
3.05%, 07/15/61 (a) | 350,000 | 238,868 |
ServiceNow, Inc. | ||
1.40%, 09/01/30 (a) | 450,000 | 356,958 |
Skyworks Solutions, Inc. | ||
1.80%, 06/01/26 (a) | 200,000 | 179,196 |
3.00%, 06/01/31 (a) | 175,000 | 142,193 |
TD SYNNEX Corp. | ||
1.25%, 08/09/24 (a) | 250,000 | 236,215 |
1.75%, 08/09/26 (a) | 300,000 | 262,281 |
2.38%, 08/09/28 (a) | 100,000 | 82,475 |
2.65%, 08/09/31 (a) | 250,000 | 192,615 |
Teledyne FLIR LLC | ||
2.50%, 08/01/30 (a) | 200,000 | 165,876 |
Tencent Music Entertainment Group | ||
2.00%, 09/03/30 (a) | 275,000 | 217,267 |
Texas Instruments, Inc. | ||
1.38%, 03/12/25 (a) | 300,000 | 282,003 |
1.13%, 09/15/26 (a) | 200,000 | 178,644 |
2.90%, 11/03/27 (a) | 400,000 | 374,200 |
2.25%, 09/04/29 (a) | 350,000 | 305,669 |
1.75%, 05/04/30 (a) | 250,000 | 210,198 |
1.90%, 09/15/31 (a) | 150,000 | 123,384 |
3.88%, 03/15/39 (a) | 50,000 | 44,946 |
4.15%, 05/15/48 (a) | 550,000 | 501,352 |
2.70%, 09/15/51 (a) | 300,000 | 208,875 |
5.00%, 03/14/53 (a) | 200,000 | 203,702 |
5.05%, 05/18/63 (a) | 300,000 | 300,969 |
Thomson Reuters Corp. | ||
5.85%, 04/15/40 | 175,000 | 174,473 |
5.65%, 11/23/43 (a) | 100,000 | 94,954 |
Trimble, Inc. | ||
4.75%, 12/01/24 (a) | 100,000 | 98,322 |
4.90%, 06/15/28 (a) | 175,000 | 171,206 |
6.10%, 03/15/33 (a) | 225,000 | 228,618 |
SECURITY RATE, MATURITY DATE | FACE AMOUNT ($) | VALUE ($) |
TSMC Arizona Corp. | ||
1.75%, 10/25/26 (a) | 300,000 | 267,540 |
3.88%, 04/22/27 (a) | 300,000 | 288,654 |
4.13%, 04/22/29 (a) | 200,000 | 191,634 |
2.50%, 10/25/31 (a) | 350,000 | 293,499 |
4.25%, 04/22/32 (a) | 300,000 | 289,965 |
3.13%, 10/25/41 (a) | 200,000 | 160,050 |
3.25%, 10/25/51 (a) | 350,000 | 269,272 |
4.50%, 04/22/52 (a) | 300,000 | 290,439 |
Tyco Electronics Group S.A. | ||
3.45%, 08/01/24 (a) | 165,000 | 161,119 |
3.70%, 02/15/26 (a) | 250,000 | 241,570 |
3.13%, 08/15/27 (a) | 150,000 | 140,660 |
7.13%, 10/01/37 | 100,000 | 116,275 |
VeriSign, Inc. | ||
5.25%, 04/01/25 (a) | 150,000 | 148,481 |
4.75%, 07/15/27 (a) | 100,000 | 98,354 |
2.70%, 06/15/31 (a) | 250,000 | 208,278 |
Verisk Analytics, Inc. | ||
4.00%, 06/15/25 (a) | 300,000 | 291,345 |
4.13%, 03/15/29 (a) | 175,000 | 167,461 |
5.50%, 06/15/45 (a) | 150,000 | 144,026 |
3.63%, 05/15/50 (a) | 100,000 | 73,730 |
Visa, Inc. | ||
3.15%, 12/14/25 (a) | 1,000,000 | 958,970 |
1.90%, 04/15/27 (a) | 400,000 | 364,908 |
0.75%, 08/15/27 (a) | 150,000 | 130,134 |
2.75%, 09/15/27 (a) | 150,000 | 139,434 |
2.05%, 04/15/30 (a) | 450,000 | 386,464 |
1.10%, 02/15/31 (a) | 350,000 | 276,857 |
4.15%, 12/14/35 (a) | 500,000 | 476,760 |
2.70%, 04/15/40 (a) | 250,000 | 192,360 |
4.30%, 12/14/45 (a) | 875,000 | 814,117 |
3.65%, 09/15/47 (a) | 200,000 | 169,792 |
2.00%, 08/15/50 (a) | 550,000 | 338,877 |
VMware, Inc. | ||
4.50%, 05/15/25 (a) | 350,000 | 343,010 |
1.40%, 08/15/26 (a) | 600,000 | 530,196 |
3.90%, 08/21/27 (a) | 600,000 | 569,760 |
4.70%, 05/15/30 (a) | 200,000 | 191,304 |
2.20%, 08/15/31 (a) | 500,000 | 393,360 |
Western Digital Corp. | ||
4.75%, 02/15/26 (a) | 650,000 | 619,944 |
2.85%, 02/01/29 (a) | 300,000 | 240,090 |
3.10%, 02/01/32 (a) | 200,000 | 148,254 |
Western Union Co. | ||
2.85%, 01/10/25 (a) | 150,000 | 142,947 |
1.35%, 03/15/26 (a) | 200,000 | 177,246 |
2.75%, 03/15/31 (a) | 100,000 | 79,378 |
6.20%, 11/17/36 | 150,000 | 151,652 |
Workday, Inc. | ||
3.50%, 04/01/27 (a) | 300,000 | 284,655 |
3.70%, 04/01/29 (a) | 200,000 | 185,812 |
3.80%, 04/01/32 (a) | 400,000 | 360,304 |
Xilinx, Inc. | ||
2.38%, 06/01/30 (a) | 300,000 | 259,395 |
170,879,354 | ||
Transportation 0.5% | ||
American Airlines 2015-2 Class AA Pass-Through Trust | ||
3.60%, 09/22/27 | 133,680 | 124,260 |
American Airlines 2016-1 Class AA Pass-Through Trust | ||
3.58%, 01/15/28 | 172,659 | 159,649 |
American Airlines 2016-2 Class AA Pass-Through Trust | ||
3.20%, 06/15/28 | 348,500 | 313,622 |
SECURITY RATE, MATURITY DATE | FACE AMOUNT ($) | VALUE ($) |
American Airlines 2017-2 Class AA Pass-Through Trust | ||
3.35%, 10/15/29 | 36,469 | 32,623 |
American Airlines 2019-1 Class AA Pass-Through Trust | ||
3.15%, 02/15/32 | 293,050 | 254,628 |
BNSF Funding Trust I | ||
6.61%, 12/15/55 (a)(b) | 100,000 | 97,028 |
Burlington Northern Santa Fe LLC | ||
3.40%, 09/01/24 (a) | 300,000 | 293,079 |
3.00%, 04/01/25 (a) | 240,000 | 231,394 |
7.00%, 12/15/25 | 150,000 | 156,163 |
3.25%, 06/15/27 (a) | 200,000 | 190,916 |
6.20%, 08/15/36 | 100,000 | 110,237 |
6.15%, 05/01/37 | 50,000 | 55,426 |
5.75%, 05/01/40 (a) | 50,000 | 52,985 |
5.05%, 03/01/41 (a) | 200,000 | 197,522 |
5.40%, 06/01/41 (a) | 250,000 | 255,917 |
4.40%, 03/15/42 (a) | 250,000 | 227,135 |
4.38%, 09/01/42 (a) | 350,000 | 317,345 |
4.45%, 03/15/43 (a) | 200,000 | 182,022 |
5.15%, 09/01/43 (a) | 200,000 | 198,712 |
4.90%, 04/01/44 (a) | 150,000 | 145,593 |
4.55%, 09/01/44 (a) | 425,000 | 392,339 |
4.70%, 09/01/45 (a) | 200,000 | 186,350 |
3.90%, 08/01/46 (a) | 100,000 | 82,900 |
4.13%, 06/15/47 (a) | 225,000 | 195,642 |
4.05%, 06/15/48 (a) | 400,000 | 343,528 |
4.15%, 12/15/48 (a) | 300,000 | 262,056 |
3.05%, 02/15/51 (a) | 225,000 | 160,416 |
3.30%, 09/15/51 (a) | 450,000 | 337,261 |
2.88%, 06/15/52 (a) | 150,000 | 103,230 |
4.45%, 01/15/53 (a) | 250,000 | 230,045 |
5.20%, 04/15/54 (a) | 450,000 | 459,819 |
Canadian National Railway Co. | ||
2.95%, 11/21/24 (a) | 150,000 | 144,962 |
6.90%, 07/15/28 | 150,000 | 164,148 |
3.85%, 08/05/32 (a) | 250,000 | 233,187 |
6.38%, 11/15/37 | 150,000 | 167,587 |
3.20%, 08/02/46 (a) | 250,000 | 186,245 |
3.65%, 02/03/48 (a) | 200,000 | 162,752 |
4.45%, 01/20/49 (a) | 200,000 | 183,796 |
2.45%, 05/01/50 (a) | 200,000 | 128,046 |
4.40%, 08/05/52 (a) | 250,000 | 229,695 |
Canadian Pacific Railway Co. | ||
1.35%, 12/02/24 (a) | 450,000 | 423,117 |
2.90%, 02/01/25 (a) | 171,000 | 164,218 |
4.00%, 06/01/28 (a) | 200,000 | 191,506 |
2.88%, 11/15/29 (a) | 150,000 | 133,076 |
2.05%, 03/05/30 (a) | 200,000 | 168,106 |
7.13%, 10/15/31 | 125,000 | 141,535 |
2.45%, 12/02/31 (a) | 450,000 | 395,905 |
4.80%, 09/15/35 (a) | 145,000 | 142,045 |
5.95%, 05/15/37 | 100,000 | 105,325 |
3.00%, 12/02/41 (a) | 300,000 | 246,912 |
4.30%, 05/15/43 (a) | 125,000 | 110,284 |
4.80%, 08/01/45 (a) | 150,000 | 140,403 |
4.95%, 08/15/45 (a) | 100,000 | 93,881 |
4.70%, 05/01/48 (a) | 150,000 | 137,123 |
3.50%, 05/01/50 (a) | 150,000 | 116,151 |
3.10%, 12/02/51 (a) | 500,000 | 355,460 |
4.20%, 11/15/69 (a) | 150,000 | 118,500 |
6.13%, 09/15/15 (a) | 239,000 | 248,591 |
CH Robinson Worldwide, Inc. | ||
4.20%, 04/15/28 (a) | 200,000 | 192,184 |
CSX Corp. | ||
3.40%, 08/01/24 (a) | 150,000 | 146,552 |
3.35%, 11/01/25 (a) | 150,000 | 143,652 |
SECURITY RATE, MATURITY DATE | FACE AMOUNT ($) | VALUE ($) |
2.60%, 11/01/26 (a) | 250,000 | 231,637 |
3.25%, 06/01/27 (a) | 378,000 | 356,783 |
3.80%, 03/01/28 (a) | 300,000 | 286,788 |
2.40%, 02/15/30 (a) | 275,000 | 237,468 |
6.00%, 10/01/36 | 200,000 | 211,240 |
6.15%, 05/01/37 | 250,000 | 269,565 |
6.22%, 04/30/40 | 175,000 | 189,749 |
5.50%, 04/15/41 (a) | 150,000 | 152,401 |
4.75%, 05/30/42 (a) | 50,000 | 46,150 |
4.40%, 03/01/43 (a) | 150,000 | 131,996 |
4.10%, 03/15/44 (a) | 250,000 | 215,120 |
3.80%, 11/01/46 (a) | 250,000 | 202,797 |
4.30%, 03/01/48 (a) | 50,000 | 43,643 |
4.75%, 11/15/48 (a) | 200,000 | 185,636 |
4.50%, 03/15/49 (a) | 150,000 | 134,403 |
3.35%, 09/15/49 (a) | 350,000 | 259,115 |
3.80%, 04/15/50 (a) | 150,000 | 119,757 |
3.95%, 05/01/50 (a) | 150,000 | 122,408 |
2.50%, 05/15/51 (a) | 150,000 | 95,363 |
4.50%, 08/01/54 (a) | 150,000 | 133,632 |
4.25%, 11/01/66 (a) | 250,000 | 208,172 |
4.65%, 03/01/68 (a) | 125,000 | 112,316 |
Delta Air Lines 2020-1 Class AA Pass-Through Trust | ||
2.00%, 06/10/28 | 143,608 | 127,563 |
FedEx Corp 2020-1 Class AA Pass-Through Trust | ||
1.88%, 02/20/34 | 216,580 | 177,208 |
FedEx Corp. | ||
3.25%, 04/01/26 (a) | 300,000 | 287,031 |
3.40%, 02/15/28 (a) | 150,000 | 139,776 |
4.20%, 10/17/28 (a) | 150,000 | 144,693 |
3.10%, 08/05/29 (a) | 400,000 | 360,864 |
4.25%, 05/15/30 (a) | 300,000 | 287,442 |
4.90%, 01/15/34 | 112,000 | 109,486 |
3.90%, 02/01/35 | 150,000 | 132,702 |
3.25%, 05/15/41 (a) | 250,000 | 187,072 |
3.88%, 08/01/42 | 200,000 | 161,662 |
5.10%, 01/15/44 | 200,000 | 186,776 |
4.10%, 02/01/45 | 227,000 | 184,351 |
4.75%, 11/15/45 (a) | 265,000 | 237,398 |
4.55%, 04/01/46 (a) | 400,000 | 345,060 |
4.40%, 01/15/47 (a) | 175,000 | 148,698 |
4.05%, 02/15/48 (a) | 300,000 | 240,732 |
4.95%, 10/17/48 (a) | 250,000 | 230,140 |
5.25%, 05/15/50 (a) | 275,000 | 264,814 |
GXO Logistics, Inc. | ||
1.65%, 07/15/26 (a) | 225,000 | 196,315 |
2.65%, 07/15/31 (a) | 125,000 | 97,530 |
JB Hunt Transport Services, Inc. | ||
3.88%, 03/01/26 (a) | 225,000 | 217,602 |
JetBlue 2019-1 Class AA Pass-Through Trust | ||
2.75%, 05/15/32 | 126,224 | 106,926 |
JetBlue 2020-1 Class A Pass-Through Trust | ||
Series 1A 4.00%, 11/15/32 (f) | 209,102 | 190,624 |
Kirby Corp. | ||
4.20%, 03/01/28 (a) | 250,000 | 234,245 |
Norfolk Southern Corp. | ||
2.90%, 06/15/26 (a) | 300,000 | 282,780 |
7.80%, 05/15/27 | 50,000 | 55,085 |
3.15%, 06/01/27 (a) | 100,000 | 93,860 |
2.55%, 11/01/29 (a) | 200,000 | 173,024 |
2.30%, 05/15/31 (a) | 200,000 | 166,604 |
3.00%, 03/15/32 (a) | 150,000 | 129,212 |
4.84%, 10/01/41 | 200,000 | 185,208 |
3.95%, 10/01/42 (a) | 100,000 | 82,227 |
4.45%, 06/15/45 (a) | 250,000 | 218,275 |
SECURITY RATE, MATURITY DATE | FACE AMOUNT ($) | VALUE ($) |
4.65%, 01/15/46 (a) | 150,000 | 134,601 |
3.94%, 11/01/47 (a) | 250,000 | 202,765 |
4.15%, 02/28/48 (a) | 275,000 | 232,210 |
4.10%, 05/15/49 (a) | 200,000 | 167,970 |
3.40%, 11/01/49 (a) | 250,000 | 184,330 |
3.05%, 05/15/50 (a) | 350,000 | 243,502 |
2.90%, 08/25/51 (a) | 75,000 | 49,781 |
4.05%, 08/15/52 (a) | 250,000 | 206,972 |
3.70%, 03/15/53 (a) | 100,000 | 77,536 |
4.55%, 06/01/53 (a) | 200,000 | 180,952 |
3.16%, 05/15/55 (a) | 300,000 | 205,776 |
Ryder System, Inc. | ||
2.50%, 09/01/24 (a) | 200,000 | 192,292 |
3.35%, 09/01/25 (a) | 135,000 | 128,436 |
1.75%, 09/01/26 (a) | 150,000 | 133,850 |
2.90%, 12/01/26 (a) | 200,000 | 183,372 |
4.30%, 06/15/27 (a) | 50,000 | 48,136 |
5.25%, 06/01/28 (a) | 200,000 | 197,854 |
Southwest Airlines Co. | ||
5.25%, 05/04/25 (a) | 375,000 | 371,629 |
3.00%, 11/15/26 (a) | 100,000 | 91,951 |
5.13%, 06/15/27 (a) | 475,000 | 471,912 |
3.45%, 11/16/27 (a) | 100,000 | 92,477 |
2.63%, 02/10/30 (a) | 150,000 | 128,010 |
Spirit Airlines Pass-Through Trust 2015-1A | ||
4.10%, 04/01/28 | 29,369 | 26,954 |
Triton Container International Ltd./TAL International Container Corp. | ||
3.25%, 03/15/32 (a) | 250,000 | 196,580 |
Union Pacific Corp. | ||
3.25%, 08/15/25 (a) | 200,000 | 192,514 |
2.75%, 03/01/26 (a) | 200,000 | 189,366 |
2.15%, 02/05/27 (a) | 175,000 | 160,120 |
3.00%, 04/15/27 (a) | 75,000 | 70,615 |
3.95%, 09/10/28 (a) | 300,000 | 290,961 |
6.63%, 02/01/29 | 200,000 | 218,402 |
3.70%, 03/01/29 (a) | 300,000 | 287,055 |
2.40%, 02/05/30 (a) | 250,000 | 217,867 |
2.38%, 05/20/31 (a) | 300,000 | 254,172 |
2.80%, 02/14/32 (a) | 400,000 | 345,764 |
3.38%, 02/01/35 (a) | 300,000 | 257,262 |
2.89%, 04/06/36 (a) | 250,000 | 199,845 |
3.60%, 09/15/37 (a) | 200,000 | 171,250 |
3.55%, 08/15/39 (a) | 300,000 | 252,219 |
3.20%, 05/20/41 (a) | 350,000 | 275,348 |
3.38%, 02/14/42 (a) | 100,000 | 80,146 |
4.05%, 11/15/45 (a) | 120,000 | 101,239 |
4.05%, 03/01/46 (a) | 250,000 | 209,717 |
4.00%, 04/15/47 (a) | 200,000 | 169,388 |
4.50%, 09/10/48 (a) | 125,000 | 112,939 |
4.30%, 03/01/49 (a) | 250,000 | 220,165 |
3.25%, 02/05/50 (a) | 550,000 | 412,351 |
3.80%, 10/01/51 (a) | 250,000 | 205,622 |
3.50%, 02/14/53 (a) | 425,000 | 329,447 |
3.88%, 02/01/55 (a) | 150,000 | 122,366 |
3.95%, 08/15/59 (a) | 250,000 | 204,125 |
3.84%, 03/20/60 (a) | 500,000 | 398,735 |
3.55%, 05/20/61 (a) | 200,000 | 148,388 |
2.97%, 09/16/62 (a) | 500,000 | 327,280 |
4.10%, 09/15/67 (a) | 225,000 | 186,869 |
3.75%, 02/05/70 (a) | 250,000 | 189,992 |
3.80%, 04/06/71 (a) | 300,000 | 230,886 |
United Airlines 2013-1 Class A Pass-Through Trust | ||
4.30%, 08/15/25 | 231,272 | 223,326 |
United Airlines 2014-1 Class A Pass-Through Trust | ||
4.00%, 04/11/26 | 81,462 | 76,949 |
SECURITY RATE, MATURITY DATE | FACE AMOUNT ($) | VALUE ($) |
United Airlines 2014-2 Class A Pass-Through Trust | ||
3.75%, 09/03/26 | 193,337 | 181,514 |
United Airlines 2016-1 Class AA Pass-Through Trust | ||
3.10%, 07/07/28 | 319,404 | 288,432 |
United Airlines 2016-2 Class AA Pass-Through Trust | ||
2.88%, 10/07/28 | 120,574 | 106,610 |
United Airlines 2018-1 Class AA Pass-Through Trust | ||
3.50%, 03/01/30 | 352,949 | 318,932 |
United Airlines 2019-1 Class AA Pass-Through Trust | ||
4.15%, 08/25/31 | 187,521 | 172,307 |
United Airlines 2019-2 Class AA Pass-Through Trust | ||
2.70%, 05/01/32 | 171,799 | 145,487 |
United Airlines 2020-1 Class A Pass-Through Trust | ||
5.88%, 10/15/27 | 53,901 | 53,558 |
United Airlines 2020-1 Class B Pass-Through Trust | ||
4.88%, 01/15/26 | 256,875 | 246,929 |
United Parcel Service, Inc. | ||
2.20%, 09/01/24 (a) | 150,000 | 144,783 |
2.80%, 11/15/24 (a) | 50,000 | 48,368 |
3.90%, 04/01/25 (a) | 350,000 | 342,790 |
3.05%, 11/15/27 (a) | 250,000 | 235,712 |
3.40%, 03/15/29 (a) | 125,000 | 118,300 |
2.50%, 09/01/29 (a) | 150,000 | 133,125 |
4.45%, 04/01/30 (a) | 325,000 | 323,918 |
4.88%, 03/03/33 (a) | 250,000 | 252,967 |
6.20%, 01/15/38 | 400,000 | 448,352 |
5.20%, 04/01/40 (a) | 150,000 | 153,784 |
4.88%, 11/15/40 (a) | 200,000 | 197,464 |
3.63%, 10/01/42 | 100,000 | 83,348 |
3.40%, 11/15/46 (a) | 150,000 | 116,841 |
3.75%, 11/15/47 (a) | 300,000 | 252,546 |
4.25%, 03/15/49 (a) | 210,000 | 189,701 |
3.40%, 09/01/49 (a) | 200,000 | 159,294 |
5.30%, 04/01/50 (a) | 350,000 | 368,749 |
5.05%, 03/03/53 (a) | 300,000 | 305,688 |
39,065,947 | ||
1,015,630,697 | ||
Utility 2.1% | ||
Electric 1.9% | ||
AEP Texas, Inc. | ||
3.95%, 06/01/28 (a) | 95,000 | 89,453 |
2.10%, 07/01/30 (a) | 300,000 | 246,033 |
3.80%, 10/01/47 (a) | 150,000 | 113,786 |
4.15%, 05/01/49 (a) | 100,000 | 80,391 |
3.45%, 01/15/50 (a) | 200,000 | 144,556 |
3.45%, 05/15/51 (a) | 200,000 | 143,200 |
5.25%, 05/15/52 (a) | 175,000 | 167,081 |
AEP Transmission Co. LLC | ||
3.75%, 12/01/47 (a) | 250,000 | 200,065 |
4.25%, 09/15/48 (a) | 210,000 | 181,463 |
3.80%, 06/15/49 (a) | 100,000 | 79,863 |
3.65%, 04/01/50 (a) | 200,000 | 155,474 |
5.40%, 03/15/53 (a) | 200,000 | 205,948 |
AES Corp. | ||
1.38%, 01/15/26 (a) | 350,000 | 312,774 |
2.45%, 01/15/31 (a) | 225,000 | 182,218 |
Alabama Power Co. | ||
1.45%, 09/15/30 (a) | 250,000 | 198,237 |
3.05%, 03/15/32 (a) | 200,000 | 174,476 |
3.94%, 09/01/32 (a) | 200,000 | 185,548 |
6.00%, 03/01/39 | 150,000 | 156,991 |
3.85%, 12/01/42 | 150,000 | 124,224 |
SECURITY RATE, MATURITY DATE | FACE AMOUNT ($) | VALUE ($) |
3.75%, 03/01/45 (a) | 175,000 | 138,299 |
4.30%, 01/02/46 (a) | 150,000 | 126,779 |
3.70%, 12/01/47 (a) | 200,000 | 155,990 |
4.30%, 07/15/48 (a) | 150,000 | 128,129 |
3.45%, 10/01/49 (a) | 200,000 | 147,584 |
3.13%, 07/15/51 (a) | 200,000 | 139,048 |
3.00%, 03/15/52 (a) | 150,000 | 102,014 |
Ameren Corp. | ||
2.50%, 09/15/24 (a) | 150,000 | 144,053 |
3.65%, 02/15/26 (a) | 175,000 | 167,039 |
3.50%, 01/15/31 (a) | 300,000 | 268,671 |
Ameren Illinois Co. | ||
3.85%, 09/01/32 (a) | 200,000 | 184,536 |
4.15%, 03/15/46 (a) | 175,000 | 147,810 |
3.70%, 12/01/47 (a) | 175,000 | 140,980 |
4.50%, 03/15/49 (a) | 150,000 | 136,881 |
3.25%, 03/15/50 (a) | 100,000 | 73,405 |
5.90%, 12/01/52 (a) | 100,000 | 109,548 |
American Electric Power Co., Inc. | ||
5.75%, 11/01/27 (a) | 500,000 | 511,710 |
3.20%, 11/13/27 (a) | 50,000 | 46,335 |
4.30%, 12/01/28 (a) | 400,000 | 382,664 |
2.30%, 03/01/30 (a) | 200,000 | 166,340 |
5.95%, 11/01/32 (a) | 200,000 | 209,150 |
5.63%, 03/01/33 (a) | 200,000 | 203,926 |
3.25%, 03/01/50 (a) | 150,000 | 102,930 |
3.88%, 02/15/62 (a)(b) | 250,000 | 200,775 |
Appalachian Power Co. | ||
3.40%, 06/01/25 (a) | 200,000 | 191,862 |
3.30%, 06/01/27 (a) | 300,000 | 280,680 |
7.00%, 04/01/38 | 160,000 | 180,867 |
4.40%, 05/15/44 (a) | 150,000 | 124,859 |
4.45%, 06/01/45 (a) | 150,000 | 124,665 |
4.50%, 03/01/49 (a) | 150,000 | 126,660 |
3.70%, 05/01/50 (a) | 200,000 | 151,412 |
Arizona Public Service Co. | ||
3.15%, 05/15/25 (a) | 250,000 | 239,540 |
2.20%, 12/15/31 (a) | 150,000 | 117,713 |
5.05%, 09/01/41 (a) | 100,000 | 91,763 |
4.35%, 11/15/45 (a) | 175,000 | 141,379 |
3.75%, 05/15/46 (a) | 100,000 | 74,279 |
4.20%, 08/15/48 (a) | 125,000 | 98,414 |
4.25%, 03/01/49 (a) | 150,000 | 120,009 |
3.35%, 05/15/50 (a) | 175,000 | 121,151 |
2.65%, 09/15/50 (a) | 250,000 | 152,782 |
Atlantic City Electric Co. | ||
4.00%, 10/15/28 (a) | 100,000 | 95,357 |
Avangrid, Inc. | ||
3.15%, 12/01/24 (a) | 300,000 | 288,225 |
3.20%, 04/15/25 (a) | 175,000 | 166,647 |
3.80%, 06/01/29 (a) | 195,000 | 178,608 |
Avista Corp. | ||
4.35%, 06/01/48 (a) | 150,000 | 130,568 |
4.00%, 04/01/52 (a) | 100,000 | 80,046 |
Baltimore Gas and Electric Co. | ||
2.25%, 06/15/31 (a) | 150,000 | 125,040 |
6.35%, 10/01/36 | 125,000 | 136,059 |
3.50%, 08/15/46 (a) | 100,000 | 75,822 |
3.75%, 08/15/47 (a) | 100,000 | 78,572 |
4.25%, 09/15/48 (a) | 100,000 | 85,118 |
3.20%, 09/15/49 (a) | 100,000 | 72,561 |
2.90%, 06/15/50 (a) | 150,000 | 100,928 |
4.55%, 06/01/52 (a) | 175,000 | 155,913 |
5.40%, 06/01/53 (a) | 150,000 | 153,166 |
SECURITY RATE, MATURITY DATE | FACE AMOUNT ($) | VALUE ($) |
Berkshire Hathaway Energy Co. | ||
3.50%, 02/01/25 (a) | 150,000 | 145,121 |
4.05%, 04/15/25 (a) | 350,000 | 341,845 |
3.25%, 04/15/28 (a) | 200,000 | 184,336 |
3.70%, 07/15/30 (a) | 200,000 | 183,846 |
6.13%, 04/01/36 | 500,000 | 523,170 |
5.95%, 05/15/37 | 150,000 | 155,007 |
5.15%, 11/15/43 (a) | 260,000 | 243,578 |
4.50%, 02/01/45 (a) | 250,000 | 213,657 |
3.80%, 07/15/48 (a) | 250,000 | 193,795 |
4.45%, 01/15/49 (a) | 300,000 | 254,028 |
4.25%, 10/15/50 (a) | 200,000 | 162,308 |
2.85%, 05/15/51 (a) | 400,000 | 259,632 |
4.60%, 05/01/53 (a) | 300,000 | 257,910 |
Black Hills Corp. | ||
1.04%, 08/23/24 (a) | 200,000 | 189,070 |
3.05%, 10/15/29 (a) | 150,000 | 129,014 |
2.50%, 06/15/30 (a) | 200,000 | 165,386 |
4.35%, 05/01/33 (a) | 150,000 | 134,165 |
4.20%, 09/15/46 (a) | 100,000 | 79,117 |
3.88%, 10/15/49 (a) | 100,000 | 74,191 |
CenterPoint Energy Houston Electric LLC | ||
2.40%, 09/01/26 (a) | 100,000 | 92,165 |
3.00%, 03/01/32 (a) | 250,000 | 216,495 |
4.45%, 10/01/32 (a) | 200,000 | 193,174 |
6.95%, 03/15/33 | 125,000 | 143,536 |
3.55%, 08/01/42 (a) | 128,000 | 101,738 |
3.95%, 03/01/48 (a) | 200,000 | 166,158 |
4.25%, 02/01/49 (a) | 250,000 | 218,292 |
2.90%, 07/01/50 (a) | 175,000 | 119,688 |
3.60%, 03/01/52 (a) | 250,000 | 194,637 |
CenterPoint Energy, Inc. | ||
2.50%, 09/01/24 (a) | 200,000 | 192,262 |
4.25%, 11/01/28 (a) | 120,000 | 112,702 |
2.95%, 03/01/30 (a) | 300,000 | 261,558 |
3.70%, 09/01/49 (a) | 175,000 | 132,554 |
Cleco Corporate Holdings LLC | ||
3.74%, 05/01/26 (a) | 170,000 | 159,785 |
4.97%, 05/01/46 (a) | 150,000 | 126,635 |
CMS Energy Corp. | ||
3.00%, 05/15/26 (a) | 350,000 | 328,020 |
3.45%, 08/15/27 (a) | 200,000 | 187,432 |
4.88%, 03/01/44 (a) | 100,000 | 91,378 |
4.75%, 06/01/50 (a)(b) | 200,000 | 172,746 |
Commonwealth Edison Co. | ||
2.55%, 06/15/26 (a) | 323,000 | 302,344 |
3.70%, 08/15/28 (a) | 300,000 | 283,422 |
6.45%, 01/15/38 | 300,000 | 333,273 |
3.80%, 10/01/42 (a) | 200,000 | 165,994 |
4.60%, 08/15/43 (a) | 150,000 | 138,194 |
4.70%, 01/15/44 (a) | 150,000 | 138,399 |
3.70%, 03/01/45 (a) | 100,000 | 79,538 |
4.35%, 11/15/45 (a) | 150,000 | 131,510 |
3.65%, 06/15/46 (a) | 250,000 | 196,207 |
3.75%, 08/15/47 (a) | 200,000 | 158,750 |
4.00%, 03/01/48 (a) | 150,000 | 126,044 |
4.00%, 03/01/49 (a) | 150,000 | 125,115 |
3.20%, 11/15/49 (a) | 100,000 | 71,700 |
3.00%, 03/01/50 (a) | 300,000 | 208,044 |
3.13%, 03/15/51 (a) | 250,000 | 176,305 |
3.85%, 03/15/52 (a) | 100,000 | 80,125 |
Connecticut Light and Power Co. | ||
0.75%, 12/01/25 (a) | 50,000 | 44,938 |
3.20%, 03/15/27 (a) | 200,000 | 188,590 |
2.05%, 07/01/31 (a) | 350,000 | 285,463 |
SECURITY RATE, MATURITY DATE | FACE AMOUNT ($) | VALUE ($) |
4.30%, 04/15/44 (a) | 150,000 | 130,910 |
4.00%, 04/01/48 (a) | 250,000 | 211,600 |
Consolidated Edison Co. of New York, Inc. | ||
4.00%, 12/01/28 (a) | 200,000 | 191,714 |
3.35%, 04/01/30 (a) | 400,000 | 364,620 |
5.30%, 03/01/35 | 150,000 | 149,783 |
5.85%, 03/15/36 | 250,000 | 257,272 |
6.75%, 04/01/38 | 200,000 | 224,418 |
5.50%, 12/01/39 | 250,000 | 247,007 |
5.70%, 06/15/40 | 150,000 | 151,590 |
4.20%, 03/15/42 | 100,000 | 86,008 |
3.95%, 03/01/43 (a) | 250,000 | 204,362 |
4.45%, 03/15/44 (a) | 275,000 | 241,015 |
4.50%, 12/01/45 (a) | 200,000 | 174,656 |
3.88%, 06/15/47 (a) | 150,000 | 117,894 |
4.13%, 05/15/49 (a) | 200,000 | 164,294 |
3.95%, 04/01/50 (a) | 350,000 | 286,482 |
6.15%, 11/15/52 (a) | 250,000 | 276,232 |
4.63%, 12/01/54 (a) | 275,000 | 237,861 |
4.30%, 12/01/56 (a) | 200,000 | 163,210 |
4.00%, 11/15/57 (a) | 150,000 | 118,685 |
4.50%, 05/15/58 (a) | 190,000 | 160,026 |
3.70%, 11/15/59 (a) | 225,000 | 164,776 |
3.00%, 12/01/60 (a) | 200,000 | 127,148 |
3.60%, 06/15/61 (a) | 300,000 | 218,013 |
Constellation Energy Generation LLC | ||
3.25%, 06/01/25 (a) | 250,000 | 238,250 |
5.60%, 03/01/28 (a) | 200,000 | 202,062 |
5.80%, 03/01/33 (a) | 200,000 | 206,018 |
Consumers Energy Co. | ||
3.95%, 05/15/43 (a) | 250,000 | 209,770 |
3.25%, 08/15/46 (a) | 100,000 | 73,832 |
4.05%, 05/15/48 (a) | 200,000 | 169,286 |
4.35%, 04/15/49 (a) | 200,000 | 177,188 |
3.75%, 02/15/50 (a) | 150,000 | 120,782 |
3.10%, 08/15/50 (a) | 300,000 | 212,745 |
3.50%, 08/01/51 (a) | 125,000 | 95,749 |
2.50%, 05/01/60 (a) | 350,000 | 201,638 |
Dayton Power & Light Co. | ||
3.95%, 06/15/49 (a) | 150,000 | 117,395 |
Delmarva Power & Light Co. | ||
4.15%, 05/15/45 (a) | 200,000 | 165,958 |
Dominion Energy South Carolina, Inc. | ||
2.30%, 12/01/31 (a) | 150,000 | 122,472 |
5.30%, 05/15/33 | 100,000 | 101,190 |
6.05%, 01/15/38 | 250,000 | 269,080 |
5.45%, 02/01/41 (a) | 100,000 | 99,780 |
5.10%, 06/01/65 (a) | 200,000 | 192,700 |
Dominion Energy, Inc. | ||
3.07%, 08/15/24 | 225,000 | 217,417 |
3.30%, 03/15/25 (a) | 100,000 | 96,056 |
3.90%, 10/01/25 (a) | 200,000 | 193,352 |
1.45%, 04/15/26 (a) | 150,000 | 135,123 |
2.85%, 08/15/26 (a) | 200,000 | 185,702 |
3.60%, 03/15/27 (a) | 200,000 | 188,882 |
4.25%, 06/01/28 (a) | 350,000 | 335,919 |
3.38%, 04/01/30 (a) | 400,000 | 358,200 |
5.38%, 11/15/32 (a) | 250,000 | 251,615 |
6.30%, 03/15/33 | 45,000 | 47,975 |
5.25%, 08/01/33 | 300,000 | 296,256 |
5.95%, 06/15/35 | 150,000 | 154,524 |
7.00%, 06/15/38 | 100,000 | 110,269 |
4.90%, 08/01/41 (a) | 200,000 | 179,744 |
4.05%, 09/15/42 (a) | 200,000 | 159,828 |
4.70%, 12/01/44 (a) | 150,000 | 130,643 |
SECURITY RATE, MATURITY DATE | FACE AMOUNT ($) | VALUE ($) |
4.60%, 03/15/49 (a) | 150,000 | 129,389 |
5.75%, 10/01/54 (a)(b) | 125,000 | 119,699 |
DTE Electric Co. | ||
3.38%, 03/01/25 (a) | 150,000 | 145,527 |
2.25%, 03/01/30 (a) | 200,000 | 170,882 |
2.63%, 03/01/31 (a) | 300,000 | 256,923 |
4.00%, 04/01/43 (a) | 125,000 | 105,128 |
4.30%, 07/01/44 (a) | 150,000 | 130,601 |
3.70%, 03/15/45 (a) | 150,000 | 121,544 |
3.70%, 06/01/46 (a) | 125,000 | 99,538 |
3.75%, 08/15/47 (a) | 150,000 | 118,353 |
4.05%, 05/15/48 (a) | 175,000 | 146,512 |
3.95%, 03/01/49 (a) | 239,000 | 198,420 |
2.95%, 03/01/50 (a) | 50,000 | 34,493 |
3.25%, 04/01/51 (a) | 150,000 | 108,591 |
5.40%, 04/01/53 (a) | 200,000 | 208,076 |
DTE Energy Co. | ||
2.53%, 10/01/24 | 170,000 | 162,834 |
4.22%, 11/01/24 | 400,000 | 391,620 |
2.85%, 10/01/26 (a) | 320,000 | 295,203 |
3.40%, 06/15/29 (a) | 250,000 | 224,035 |
2.95%, 03/01/30 (a) | 150,000 | 130,392 |
Duke Energy Carolinas LLC | ||
3.95%, 11/15/28 (a) | 236,000 | 225,987 |
2.45%, 02/01/30 (a) | 250,000 | 215,262 |
2.55%, 04/15/31 (a) | 175,000 | 148,986 |
6.45%, 10/15/32 | 100,000 | 108,473 |
4.95%, 01/15/33 (a) | 250,000 | 248,795 |
6.10%, 06/01/37 | 150,000 | 157,474 |
6.00%, 01/15/38 | 200,000 | 210,286 |
6.05%, 04/15/38 | 150,000 | 158,745 |
5.30%, 02/15/40 | 250,000 | 251,497 |
4.25%, 12/15/41 (a) | 250,000 | 216,862 |
4.00%, 09/30/42 (a) | 200,000 | 166,232 |
3.75%, 06/01/45 (a) | 200,000 | 157,642 |
3.88%, 03/15/46 (a) | 150,000 | 119,823 |
3.70%, 12/01/47 (a) | 200,000 | 157,090 |
3.95%, 03/15/48 (a) | 300,000 | 245,430 |
3.20%, 08/15/49 (a) | 300,000 | 216,717 |
3.45%, 04/15/51 (a) | 150,000 | 110,409 |
5.35%, 01/15/53 (a) | 200,000 | 202,982 |
Duke Energy Corp. | ||
0.90%, 09/15/25 (a) | 200,000 | 182,114 |
2.65%, 09/01/26 (a) | 500,000 | 462,645 |
3.15%, 08/15/27 (a) | 400,000 | 370,232 |
4.30%, 03/15/28 (a) | 200,000 | 192,506 |
3.40%, 06/15/29 (a) | 200,000 | 181,088 |
2.45%, 06/01/30 (a) | 300,000 | 252,267 |
2.55%, 06/15/31 (a) | 500,000 | 415,435 |
4.50%, 08/15/32 (a) | 250,000 | 236,347 |
3.30%, 06/15/41 (a) | 150,000 | 111,027 |
4.80%, 12/15/45 (a) | 100,000 | 89,887 |
3.75%, 09/01/46 (a) | 400,000 | 304,536 |
3.95%, 08/15/47 (a) | 175,000 | 136,126 |
4.20%, 06/15/49 (a) | 200,000 | 162,696 |
3.50%, 06/15/51 (a) | 250,000 | 181,955 |
5.00%, 08/15/52 (a) | 250,000 | 229,635 |
3.25%, 01/15/82 (a)(b) | 100,000 | 74,654 |
Duke Energy Florida LLC | ||
3.80%, 07/15/28 (a) | 250,000 | 238,577 |
2.50%, 12/01/29 (a) | 150,000 | 129,890 |
1.75%, 06/15/30 (a) | 275,000 | 224,216 |
6.35%, 09/15/37 | 150,000 | 162,868 |
6.40%, 06/15/38 | 300,000 | 330,108 |
5.65%, 04/01/40 | 125,000 | 130,738 |
3.85%, 11/15/42 (a) | 150,000 | 122,282 |
SECURITY RATE, MATURITY DATE | FACE AMOUNT ($) | VALUE ($) |
3.40%, 10/01/46 (a) | 300,000 | 225,114 |
4.20%, 07/15/48 (a) | 200,000 | 170,890 |
Duke Energy Indiana LLC | ||
6.12%, 10/15/35 | 100,000 | 104,696 |
6.35%, 08/15/38 | 200,000 | 218,326 |
6.45%, 04/01/39 | 200,000 | 218,046 |
4.90%, 07/15/43 (a) | 75,000 | 72,073 |
3.75%, 05/15/46 (a) | 150,000 | 116,561 |
3.25%, 10/01/49 (a) | 200,000 | 143,560 |
Duke Energy Ohio, Inc. | ||
3.65%, 02/01/29 (a) | 150,000 | 139,662 |
2.13%, 06/01/30 (a) | 200,000 | 166,358 |
3.70%, 06/15/46 (a) | 125,000 | 95,679 |
4.30%, 02/01/49 (a) | 150,000 | 126,111 |
Duke Energy Progress LLC | ||
3.25%, 08/15/25 (a) | 350,000 | 336,556 |
2.00%, 08/15/31 (a) | 200,000 | 161,258 |
6.30%, 04/01/38 | 300,000 | 323,871 |
4.10%, 05/15/42 (a) | 200,000 | 169,300 |
4.10%, 03/15/43 (a) | 100,000 | 83,923 |
4.38%, 03/30/44 (a) | 200,000 | 173,932 |
4.15%, 12/01/44 (a) | 200,000 | 167,026 |
4.20%, 08/15/45 (a) | 75,000 | 62,680 |
3.70%, 10/15/46 (a) | 200,000 | 156,318 |
3.60%, 09/15/47 (a) | 250,000 | 192,770 |
2.50%, 08/15/50 (a) | 400,000 | 251,064 |
2.90%, 08/15/51 (a) | 150,000 | 100,277 |
Edison International | ||
3.55%, 11/15/24 (a) | 150,000 | 145,205 |
5.75%, 06/15/27 (a) | 300,000 | 300,846 |
4.13%, 03/15/28 (a) | 200,000 | 187,224 |
5.25%, 11/15/28 (a) | 200,000 | 195,154 |
6.95%, 11/15/29 (a) | 150,000 | 158,169 |
El Paso Electric Co. | ||
6.00%, 05/15/35 | 169,000 | 171,118 |
5.00%, 12/01/44 (a) | 50,000 | 44,579 |
Emera US Finance LP | ||
3.55%, 06/15/26 (a) | 287,000 | 271,889 |
2.64%, 06/15/31 (a) | 100,000 | 80,426 |
4.75%, 06/15/46 (a) | 400,000 | 325,100 |
Enel Americas S.A. | ||
4.00%, 10/25/26 (a) | 275,000 | 266,227 |
Enel Chile S.A. | ||
4.88%, 06/12/28 (a) | 300,000 | 288,780 |
Entergy Arkansas LLC | ||
3.50%, 04/01/26 (a) | 250,000 | 239,950 |
4.20%, 04/01/49 (a) | 175,000 | 147,705 |
2.65%, 06/15/51 (a) | 250,000 | 156,695 |
Entergy Corp. | ||
0.90%, 09/15/25 (a) | 350,000 | 314,902 |
2.95%, 09/01/26 (a) | 350,000 | 323,316 |
2.80%, 06/15/30 (a) | 350,000 | 297,402 |
2.40%, 06/15/31 (a) | 300,000 | 243,333 |
3.75%, 06/15/50 (a) | 200,000 | 147,860 |
Entergy Louisiana LLC | ||
0.95%, 10/01/24 (a) | 200,000 | 188,752 |
5.40%, 11/01/24 | 150,000 | 149,622 |
2.40%, 10/01/26 (a) | 350,000 | 321,254 |
3.12%, 09/01/27 (a) | 200,000 | 185,210 |
3.25%, 04/01/28 (a) | 200,000 | 184,212 |
1.60%, 12/15/30 (a) | 175,000 | 137,200 |
4.00%, 03/15/33 (a) | 211,000 | 192,289 |
4.95%, 01/15/45 (a) | 125,000 | 115,500 |
4.20%, 09/01/48 (a) | 350,000 | 294,784 |
SECURITY RATE, MATURITY DATE | FACE AMOUNT ($) | VALUE ($) |
4.20%, 04/01/50 (a) | 200,000 | 167,024 |
2.90%, 03/15/51 (a) | 200,000 | 132,398 |
Entergy Mississippi LLC | ||
3.85%, 06/01/49 (a) | 225,000 | 175,005 |
Entergy Texas, Inc. | ||
4.00%, 03/30/29 (a) | 197,000 | 185,940 |
1.75%, 03/15/31 (a) | 250,000 | 198,340 |
3.55%, 09/30/49 (a) | 200,000 | 148,800 |
Evergy Kansas Central, Inc. | ||
3.10%, 04/01/27 (a) | 300,000 | 281,331 |
4.13%, 03/01/42 (a) | 150,000 | 126,594 |
4.10%, 04/01/43 (a) | 300,000 | 250,473 |
4.25%, 12/01/45 (a) | 100,000 | 82,924 |
3.25%, 09/01/49 (a) | 175,000 | 124,593 |
3.45%, 04/15/50 (a) | 100,000 | 73,041 |
Evergy Metro, Inc. | ||
5.30%, 10/01/41 (a) | 50,000 | 48,802 |
4.20%, 06/15/47 (a) | 95,000 | 79,219 |
4.20%, 03/15/48 (a) | 50,000 | 41,679 |
4.13%, 04/01/49 (a) | 100,000 | 81,949 |
Evergy, Inc. | ||
2.45%, 09/15/24 (a) | 350,000 | 336,287 |
2.90%, 09/15/29 (a) | 250,000 | 218,320 |
Eversource Energy | ||
4.75%, 05/15/26 | 200,000 | 196,374 |
2.90%, 03/01/27 (a) | 200,000 | 184,706 |
3.30%, 01/15/28 (a) | 250,000 | 230,417 |
5.45%, 03/01/28 (a) | 250,000 | 251,825 |
1.65%, 08/15/30 (a) | 400,000 | 319,048 |
2.55%, 03/15/31 (a) | 250,000 | 208,332 |
3.38%, 03/01/32 (a) | 200,000 | 175,066 |
5.13%, 05/15/33 (a) | 200,000 | 197,668 |
3.45%, 01/15/50 (a) | 200,000 | 148,008 |
Exelon Corp. | ||
3.95%, 06/15/25 (a) | 150,000 | 145,376 |
3.40%, 04/15/26 (a) | 100,000 | 95,351 |
2.75%, 03/15/27 (a) | 200,000 | 183,364 |
5.15%, 03/15/28 (a) | 300,000 | 299,256 |
4.05%, 04/15/30 (a) | 450,000 | 422,302 |
3.35%, 03/15/32 (a) | 325,000 | 283,146 |
5.30%, 03/15/33 (a) | 250,000 | 250,467 |
4.95%, 06/15/35 (a)(c) | 275,000 | 264,154 |
5.63%, 06/15/35 | 250,000 | 253,437 |
5.10%, 06/15/45 (a) | 200,000 | 188,276 |
4.45%, 04/15/46 (a) | 100,000 | 85,399 |
4.70%, 04/15/50 (a) | 250,000 | 221,907 |
5.60%, 03/15/53 (a) | 200,000 | 201,964 |
Exelon Generation Co. LLC | ||
6.25%, 10/01/39 | 250,000 | 259,907 |
5.75%, 10/01/41 (a) | 100,000 | 98,077 |
5.60%, 06/15/42 (a) | 225,000 | 218,761 |
Florida Power & Light Co. | ||
2.85%, 04/01/25 (a) | 400,000 | 384,980 |
3.13%, 12/01/25 (a) | 350,000 | 335,219 |
5.05%, 04/01/28 (a) | 300,000 | 302,499 |
2.45%, 02/03/32 (a) | 400,000 | 337,224 |
5.10%, 04/01/33 (a) | 200,000 | 203,650 |
4.95%, 06/01/35 | 150,000 | 149,712 |
5.95%, 02/01/38 | 150,000 | 161,749 |
5.96%, 04/01/39 | 250,000 | 270,877 |
5.69%, 03/01/40 | 100,000 | 105,411 |
5.25%, 02/01/41 (a) | 100,000 | 100,489 |
4.13%, 02/01/42 (a) | 200,000 | 175,698 |
4.05%, 06/01/42 (a) | 200,000 | 173,146 |
3.80%, 12/15/42 (a) | 275,000 | 232,499 |
4.05%, 10/01/44 (a) | 100,000 | 85,816 |
SECURITY RATE, MATURITY DATE | FACE AMOUNT ($) | VALUE ($) |
3.70%, 12/01/47 (a) | 55,000 | 44,793 |
3.95%, 03/01/48 (a) | 250,000 | 210,880 |
4.13%, 06/01/48 (a) | 250,000 | 216,220 |
3.99%, 03/01/49 (a) | 250,000 | 211,265 |
3.15%, 10/01/49 (a) | 250,000 | 183,030 |
2.88%, 12/04/51 (a) | 400,000 | 276,736 |
5.30%, 04/01/53 (a) | 200,000 | 207,726 |
Fortis, Inc. | ||
3.06%, 10/04/26 (a) | 310,000 | 286,390 |
Georgia Power Co. | ||
2.20%, 09/15/24 (a) | 150,000 | 143,591 |
3.25%, 04/01/26 (a) | 150,000 | 142,731 |
3.25%, 03/30/27 (a) | 100,000 | 93,318 |
4.65%, 05/16/28 (a) | 200,000 | 196,284 |
2.65%, 09/15/29 (a) | 100,000 | 86,615 |
4.70%, 05/15/32 (a) | 250,000 | 241,917 |
4.95%, 05/17/33 (a) | 250,000 | 247,105 |
4.75%, 09/01/40 | 100,000 | 91,820 |
4.30%, 03/15/42 | 275,000 | 237,784 |
4.30%, 03/15/43 | 150,000 | 126,873 |
3.70%, 01/30/50 (a) | 175,000 | 135,301 |
3.25%, 03/15/51 (a) | 200,000 | 141,162 |
5.13%, 05/15/52 (a) | 250,000 | 243,967 |
Iberdrola International BV | ||
5.81%, 03/15/25 | 100,000 | 100,572 |
6.75%, 07/15/36 | 125,000 | 141,420 |
Idaho Power Co. | ||
4.20%, 03/01/48 (a) | 200,000 | 171,076 |
Indiana Michigan Power Co. | ||
3.85%, 05/15/28 (a) | 50,000 | 47,648 |
4.55%, 03/15/46 (a) | 100,000 | 89,436 |
3.75%, 07/01/47 (a) | 300,000 | 235,356 |
4.25%, 08/15/48 (a) | 200,000 | 168,950 |
Interstate Power and Light Co. | ||
3.25%, 12/01/24 (a) | 200,000 | 193,284 |
4.10%, 09/26/28 (a) | 250,000 | 236,630 |
2.30%, 06/01/30 (a) | 300,000 | 249,981 |
3.70%, 09/15/46 (a) | 50,000 | 37,804 |
3.50%, 09/30/49 (a) | 150,000 | 110,748 |
3.10%, 11/30/51 (a) | 75,000 | 49,859 |
IPALCO Enterprises, Inc. | ||
4.25%, 05/01/30 (a) | 200,000 | 181,206 |
ITC Holdings Corp. | ||
3.25%, 06/30/26 (a) | 220,000 | 208,479 |
3.35%, 11/15/27 (a) | 175,000 | 163,574 |
5.30%, 07/01/43 (a) | 100,000 | 94,582 |
Kentucky Utilities Co. | ||
5.13%, 11/01/40 (a) | 200,000 | 192,268 |
4.38%, 10/01/45 (a) | 150,000 | 126,542 |
3.30%, 06/01/50 (a) | 150,000 | 106,895 |
Louisville Gas & Electric Co. | ||
5.45%, 04/15/33 (a) | 150,000 | 153,138 |
Louisville Gas and Electric Co. | ||
4.25%, 04/01/49 (a) | 150,000 | 125,661 |
MidAmerican Energy Co. | ||
3.50%, 10/15/24 (a) | 250,000 | 243,435 |
3.10%, 05/01/27 (a) | 50,000 | 46,777 |
3.65%, 04/15/29 (a) | 200,000 | 186,172 |
6.75%, 12/30/31 | 200,000 | 223,054 |
5.80%, 10/15/36 | 200,000 | 209,074 |
4.80%, 09/15/43 (a) | 200,000 | 186,144 |
4.40%, 10/15/44 (a) | 125,000 | 109,193 |
4.25%, 05/01/46 (a) | 150,000 | 126,411 |
3.95%, 08/01/47 (a) | 250,000 | 203,562 |
3.65%, 08/01/48 (a) | 250,000 | 193,287 |
SECURITY RATE, MATURITY DATE | FACE AMOUNT ($) | VALUE ($) |
4.25%, 07/15/49 (a) | 300,000 | 255,495 |
3.15%, 04/15/50 (a) | 200,000 | 140,610 |
Mississippi Power Co. | ||
3.95%, 03/30/28 (a) | 250,000 | 235,920 |
4.25%, 03/15/42 | 100,000 | 83,325 |
3.10%, 07/30/51 (a) | 100,000 | 67,352 |
National Grid PLC | ||
5.81%, 06/12/33 (a) | 250,000 | 254,595 |
National Rural Utilities Cooperative Finance Corp. | ||
5.45%, 10/30/25 | 200,000 | 200,792 |
3.25%, 11/01/25 (a) | 400,000 | 380,908 |
4.45%, 03/13/26 (a) | 200,000 | 197,102 |
3.40%, 02/07/28 (a) | 350,000 | 326,529 |
3.90%, 11/01/28 (a) | 250,000 | 236,235 |
3.70%, 03/15/29 (a) | 200,000 | 185,884 |
2.40%, 03/15/30 (a) | 200,000 | 169,716 |
1.35%, 03/15/31 (a) | 250,000 | 190,982 |
1.65%, 06/15/31 (a) | 150,000 | 116,733 |
8.00%, 03/01/32 | 200,000 | 235,002 |
4.15%, 12/15/32 (a) | 200,000 | 187,380 |
5.80%, 01/15/33 (a) | 200,000 | 209,800 |
5.25%, 04/20/46 (a)(b) | 150,000 | 141,267 |
4.40%, 11/01/48 (a) | 150,000 | 128,715 |
4.30%, 03/15/49 (a) | 100,000 | 84,784 |
Nevada Power Co. | ||
3.70%, 05/01/29 (a) | 250,000 | 232,652 |
6.75%, 07/01/37 | 75,000 | 82,693 |
3.13%, 08/01/50 (a) | 250,000 | 167,525 |
NextEra Energy Capital Holdings, Inc. | ||
4.26%, 09/01/24 | 500,000 | 491,730 |
6.05%, 03/01/25 | 700,000 | 704,277 |
4.45%, 06/20/25 | 300,000 | 294,615 |
1.88%, 01/15/27 (a) | 350,000 | 312,056 |
3.55%, 05/01/27 (a) | 450,000 | 424,930 |
4.63%, 07/15/27 (a) | 300,000 | 293,652 |
4.90%, 02/28/28 (a) | 300,000 | 297,339 |
1.90%, 06/15/28 (a) | 550,000 | 471,746 |
3.50%, 04/01/29 (a) | 150,000 | 137,463 |
2.75%, 11/01/29 (a) | 350,000 | 304,440 |
2.25%, 06/01/30 (a) | 700,000 | 582,498 |
2.44%, 01/15/32 (a) | 550,000 | 447,166 |
5.00%, 07/15/32 (a) | 300,000 | 296,394 |
3.00%, 01/15/52 (a) | 200,000 | 132,114 |
5.25%, 02/28/53 (a) | 300,000 | 289,800 |
4.80%, 12/01/77 (a)(b) | 250,000 | 220,705 |
3.80%, 03/15/82 (a)(b) | 150,000 | 126,824 |
Northern States Power Co. | ||
2.25%, 04/01/31 (a) | 200,000 | 166,988 |
6.25%, 06/01/36 | 270,000 | 293,922 |
6.20%, 07/01/37 | 150,000 | 162,456 |
5.35%, 11/01/39 | 200,000 | 204,256 |
3.40%, 08/15/42 (a) | 145,000 | 113,716 |
4.00%, 08/15/45 (a) | 100,000 | 82,072 |
3.60%, 05/15/46 (a) | 200,000 | 155,362 |
3.60%, 09/15/47 (a) | 250,000 | 197,010 |
2.90%, 03/01/50 (a) | 120,000 | 83,082 |
2.60%, 06/01/51 (a) | 175,000 | 112,669 |
4.50%, 06/01/52 (a) | 150,000 | 135,657 |
NorthWestern Corp. | ||
4.18%, 11/15/44 (a) | 160,000 | 133,294 |
NSTAR Electric Co. | ||
3.20%, 05/15/27 (a) | 350,000 | 328,982 |
3.25%, 05/15/29 (a) | 250,000 | 229,517 |
3.95%, 04/01/30 (a) | 150,000 | 142,244 |
1.95%, 08/15/31 (a) | 150,000 | 120,684 |
5.50%, 03/15/40 | 100,000 | 103,060 |
SECURITY RATE, MATURITY DATE | FACE AMOUNT ($) | VALUE ($) |
4.40%, 03/01/44 (a) | 175,000 | 156,084 |
3.10%, 06/01/51 (a) | 125,000 | 87,940 |
Oglethorpe Power Corp. | ||
5.95%, 11/01/39 | 150,000 | 151,125 |
5.38%, 11/01/40 | 200,000 | 187,394 |
5.05%, 10/01/48 (a) | 200,000 | 177,842 |
3.75%, 08/01/50 (a) | 150,000 | 112,380 |
5.25%, 09/01/50 | 50,000 | 46,754 |
Ohio Edison Co. | ||
6.88%, 07/15/36 | 100,000 | 110,701 |
Ohio Power Co. | ||
2.60%, 04/01/30 (a) | 200,000 | 172,030 |
1.63%, 01/15/31 (a) | 200,000 | 158,202 |
4.15%, 04/01/48 (a) | 200,000 | 165,852 |
4.00%, 06/01/49 (a) | 150,000 | 121,974 |
Oklahoma Gas and Electric Co. | ||
3.30%, 03/15/30 (a) | 125,000 | 112,571 |
3.25%, 04/01/30 (a) | 450,000 | 402,084 |
5.40%, 01/15/33 (a) | 150,000 | 152,724 |
4.15%, 04/01/47 (a) | 140,000 | 116,374 |
3.85%, 08/15/47 (a) | 100,000 | 78,284 |
Oncor Electric Delivery Co. LLC | ||
3.70%, 11/15/28 (a) | 265,000 | 250,523 |
5.75%, 03/15/29 (a) | 73,000 | 76,035 |
2.75%, 05/15/30 (a) | 200,000 | 175,532 |
7.00%, 05/01/32 | 250,000 | 284,075 |
4.15%, 06/01/32 (a) | 150,000 | 143,382 |
4.55%, 09/15/32 (a) | 200,000 | 194,924 |
7.50%, 09/01/38 | 100,000 | 121,778 |
5.25%, 09/30/40 | 200,000 | 201,452 |
4.55%, 12/01/41 (a) | 150,000 | 138,446 |
3.75%, 04/01/45 (a) | 250,000 | 204,487 |
3.80%, 09/30/47 (a) | 200,000 | 162,124 |
4.10%, 11/15/48 (a) | 150,000 | 128,328 |
3.80%, 06/01/49 (a) | 150,000 | 121,595 |
3.10%, 09/15/49 (a) | 250,000 | 178,000 |
3.70%, 05/15/50 (a) | 150,000 | 119,178 |
4.60%, 06/01/52 (a) | 250,000 | 230,680 |
5.35%, 10/01/52 (a) | 100,000 | 101,888 |
Pacific Gas and Electric Co. | ||
4.95%, 06/08/25 | 100,000 | 97,127 |
3.50%, 06/15/25 (a) | 150,000 | 142,265 |
3.45%, 07/01/25 | 300,000 | 284,226 |
3.15%, 01/01/26 | 550,000 | 510,752 |
2.95%, 03/01/26 (a) | 225,000 | 206,858 |
3.30%, 03/15/27 (a) | 100,000 | 91,228 |
2.10%, 08/01/27 (a) | 350,000 | 300,678 |
3.30%, 12/01/27 (a) | 350,000 | 308,819 |
3.00%, 06/15/28 (a) | 350,000 | 303,285 |
3.75%, 07/01/28 | 275,000 | 247,607 |
4.65%, 08/01/28 (a) | 100,000 | 92,856 |
4.55%, 07/01/30 (a) | 900,000 | 815,022 |
2.50%, 02/01/31 (a) | 600,000 | 471,114 |
3.25%, 06/01/31 (a) | 350,000 | 285,075 |
4.40%, 03/01/32 (a) | 200,000 | 173,892 |
5.90%, 06/15/32 (a) | 200,000 | 192,720 |
6.15%, 01/15/33 (a) | 400,000 | 393,516 |
4.50%, 07/01/40 (a) | 350,000 | 272,464 |
3.30%, 08/01/40 (a) | 350,000 | 236,740 |
4.20%, 06/01/41 (a) | 100,000 | 74,686 |
4.45%, 04/15/42 (a) | 750,000 | 566,550 |
3.75%, 08/15/42 (a) | 100,000 | 69,362 |
4.60%, 06/15/43 (a) | 150,000 | 113,066 |
4.75%, 02/15/44 (a) | 200,000 | 155,378 |
4.30%, 03/15/45 (a) | 250,000 | 179,120 |
4.25%, 03/15/46 (a) | 175,000 | 125,092 |
SECURITY RATE, MATURITY DATE | FACE AMOUNT ($) | VALUE ($) |
4.00%, 12/01/46 (a) | 200,000 | 135,288 |
4.95%, 07/01/50 (a) | 900,000 | 708,867 |
3.50%, 08/01/50 (a) | 200,000 | 128,362 |
5.25%, 03/01/52 (a) | 200,000 | 162,450 |
6.75%, 01/15/53 (a) | 200,000 | 197,632 |
PacifiCorp | ||
3.50%, 06/15/29 (a) | 100,000 | 89,831 |
2.70%, 09/15/30 (a) | 150,000 | 125,196 |
7.70%, 11/15/31 | 375,000 | 418,144 |
5.75%, 04/01/37 | 100,000 | 97,263 |
6.25%, 10/15/37 | 200,000 | 201,316 |
6.35%, 07/15/38 | 250,000 | 251,475 |
6.00%, 01/15/39 | 100,000 | 99,265 |
4.10%, 02/01/42 (a) | 50,000 | 40,012 |
4.15%, 02/15/50 (a) | 200,000 | 154,878 |
3.30%, 03/15/51 (a) | 200,000 | 137,132 |
2.90%, 06/15/52 (a) | 200,000 | 125,244 |
5.35%, 12/01/53 (a) | 300,000 | 274,419 |
5.50%, 05/15/54 (a) | 300,000 | 281,895 |
PECO Energy Co. | ||
4.90%, 06/15/33 (a) | 150,000 | 149,715 |
3.70%, 09/15/47 (a) | 300,000 | 238,755 |
3.90%, 03/01/48 (a) | 200,000 | 165,430 |
3.00%, 09/15/49 (a) | 100,000 | 69,860 |
2.80%, 06/15/50 (a) | 200,000 | 133,048 |
3.05%, 03/15/51 (a) | 50,000 | 34,703 |
2.85%, 09/15/51 (a) | 150,000 | 99,971 |
4.38%, 08/15/52 (a) | 100,000 | 88,600 |
Pinnacle West Capital Corp. | ||
1.30%, 06/15/25 (a) | 250,000 | 227,730 |
Potomac Electric Power Co. | ||
4.15%, 03/15/43 (a) | 200,000 | 173,182 |
PPL Capital Funding, Inc. | ||
3.10%, 05/15/26 (a) | 200,000 | 189,056 |
4.13%, 04/15/30 (a) | 150,000 | 139,644 |
PPL Electric Utilities Corp. | ||
5.00%, 05/15/33 (a) | 150,000 | 150,670 |
6.25%, 05/15/39 | 300,000 | 329,703 |
4.75%, 07/15/43 (a) | 100,000 | 93,114 |
4.15%, 06/15/48 (a) | 150,000 | 129,620 |
3.00%, 10/01/49 (a) | 100,000 | 71,068 |
5.25%, 05/15/53 (a) | 200,000 | 204,120 |
Progress Energy, Inc. | ||
7.75%, 03/01/31 | 350,000 | 397,890 |
7.00%, 10/30/31 | 210,000 | 230,534 |
6.00%, 12/01/39 | 85,000 | 86,131 |
Public Service Co. of Colorado | ||
3.70%, 06/15/28 (a) | 150,000 | 142,385 |
1.90%, 01/15/31 (a) | 255,000 | 206,685 |
1.88%, 06/15/31 (a) | 225,000 | 179,680 |
4.10%, 06/01/32 (a) | 150,000 | 139,778 |
6.25%, 09/01/37 | 200,000 | 215,150 |
3.60%, 09/15/42 (a) | 100,000 | 79,269 |
3.80%, 06/15/47 (a) | 50,000 | 39,326 |
4.05%, 09/15/49 (a) | 250,000 | 204,227 |
3.20%, 03/01/50 (a) | 250,000 | 177,142 |
2.70%, 01/15/51 (a) | 150,000 | 95,637 |
5.25%, 04/01/53 (a) | 200,000 | 192,204 |
Public Service Co. of New Hampshire | ||
3.60%, 07/01/49 (a) | 100,000 | 78,506 |
Public Service Co. of Oklahoma | ||
2.20%, 08/15/31 (a) | 150,000 | 121,929 |
3.15%, 08/15/51 (a) | 150,000 | 101,256 |
SECURITY RATE, MATURITY DATE | FACE AMOUNT ($) | VALUE ($) |
Public Service Electric and Gas Co. | ||
3.00%, 05/15/27 (a) | 150,000 | 140,480 |
3.70%, 05/01/28 (a) | 125,000 | 118,984 |
3.20%, 05/15/29 (a) | 225,000 | 203,753 |
2.45%, 01/15/30 (a) | 250,000 | 216,162 |
1.90%, 08/15/31 (a) | 200,000 | 160,958 |
4.90%, 12/15/32 (a) | 200,000 | 200,486 |
3.95%, 05/01/42 (a) | 100,000 | 84,774 |
3.65%, 09/01/42 (a) | 100,000 | 81,669 |
3.80%, 01/01/43 (a) | 125,000 | 104,440 |
3.80%, 03/01/46 (a) | 150,000 | 121,859 |
3.60%, 12/01/47 (a) | 275,000 | 218,353 |
4.05%, 05/01/48 (a) | 150,000 | 128,358 |
3.85%, 05/01/49 (a) | 150,000 | 123,614 |
3.20%, 08/01/49 (a) | 150,000 | 111,513 |
3.15%, 01/01/50 (a) | 25,000 | 18,201 |
2.70%, 05/01/50 (a) | 150,000 | 100,977 |
2.05%, 08/01/50 (a) | 200,000 | 119,028 |
5.13%, 03/15/53 (a) | 150,000 | 151,771 |
Public Service Enterprise Group, Inc. | ||
0.80%, 08/15/25 (a) | 225,000 | 203,679 |
0.95%, 03/15/26 (a) | 150,000 | 135,561 |
1.60%, 08/15/30 (a) | 350,000 | 274,561 |
Puget Energy, Inc. | ||
3.65%, 05/15/25 (a) | 150,000 | 143,738 |
4.10%, 06/15/30 (a) | 300,000 | 273,696 |
4.22%, 03/15/32 (a) | 150,000 | 135,101 |
Puget Sound Energy, Inc. | ||
6.27%, 03/15/37 | 100,000 | 106,551 |
5.80%, 03/15/40 | 375,000 | 383,636 |
5.64%, 04/15/41 (a) | 150,000 | 152,019 |
4.30%, 05/20/45 (a) | 150,000 | 125,909 |
4.22%, 06/15/48 (a) | 200,000 | 169,788 |
3.25%, 09/15/49 (a) | 150,000 | 107,436 |
San Diego Gas & Electric Co. | ||
2.50%, 05/15/26 (a) | 200,000 | 186,820 |
1.70%, 10/01/30 (a) | 300,000 | 240,930 |
3.75%, 06/01/47 (a) | 125,000 | 98,178 |
4.15%, 05/15/48 (a) | 269,000 | 225,188 |
4.10%, 06/15/49 (a) | 140,000 | 114,745 |
3.32%, 04/15/50 (a) | 200,000 | 143,430 |
3.70%, 03/15/52 (a) | 200,000 | 155,354 |
5.35%, 04/01/53 (a) | 200,000 | 198,838 |
Sierra Pacific Power Co. | ||
2.60%, 05/01/26 (a) | 200,000 | 186,660 |
Southern California Edison Co. | ||
0.98%, 08/01/24 | 200,000 | 190,112 |
3.70%, 08/01/25 (a) | 250,000 | 241,005 |
1.20%, 02/01/26 (a) | 200,000 | 179,158 |
5.85%, 11/01/27 (a) | 250,000 | 256,122 |
3.65%, 03/01/28 (a) | 100,000 | 93,507 |
5.30%, 03/01/28 (a) | 200,000 | 200,372 |
4.20%, 03/01/29 (a) | 150,000 | 142,875 |
6.65%, 04/01/29 | 150,000 | 156,736 |
2.85%, 08/01/29 (a) | 200,000 | 175,814 |
2.25%, 06/01/30 (a) | 250,000 | 209,365 |
2.75%, 02/01/32 (a) | 200,000 | 167,370 |
5.95%, 11/01/32 (a) | 200,000 | 209,964 |
6.00%, 01/15/34 | 200,000 | 207,778 |
5.75%, 04/01/35 | 200,000 | 204,404 |
5.35%, 07/15/35 | 200,000 | 196,082 |
5.55%, 01/15/37 | 200,000 | 196,784 |
5.95%, 02/01/38 | 250,000 | 257,780 |
6.05%, 03/15/39 | 150,000 | 157,317 |
5.50%, 03/15/40 | 150,000 | 147,782 |
4.05%, 03/15/42 (a) | 105,000 | 85,242 |
SECURITY RATE, MATURITY DATE | FACE AMOUNT ($) | VALUE ($) |
3.90%, 03/15/43 (a) | 150,000 | 119,589 |
4.65%, 10/01/43 (a) | 250,000 | 219,537 |
3.60%, 02/01/45 (a) | 150,000 | 111,054 |
4.00%, 04/01/47 (a) | 600,000 | 479,340 |
4.13%, 03/01/48 (a) | 625,000 | 509,325 |
4.88%, 03/01/49 (a) | 200,000 | 179,834 |
3.65%, 02/01/50 (a) | 400,000 | 299,696 |
3.45%, 02/01/52 (a) | 200,000 | 143,620 |
Southern Power Co. | ||
0.90%, 01/15/26 (a) | 50,000 | 44,872 |
5.15%, 09/15/41 | 200,000 | 188,424 |
5.25%, 07/15/43 | 75,000 | 69,272 |
4.95%, 12/15/46 (a) | 100,000 | 87,846 |
Southwestern Electric Power Co. | ||
2.75%, 10/01/26 (a) | 350,000 | 322,703 |
4.10%, 09/15/28 (a) | 200,000 | 190,262 |
3.90%, 04/01/45 (a) | 100,000 | 76,674 |
3.85%, 02/01/48 (a) | 200,000 | 150,956 |
3.25%, 11/01/51 (a) | 200,000 | 134,820 |
Southwestern Public Service Co. | ||
4.50%, 08/15/41 (a) | 200,000 | 174,858 |
3.40%, 08/15/46 (a) | 100,000 | 72,769 |
3.70%, 08/15/47 (a) | 150,000 | 114,956 |
4.40%, 11/15/48 (a) | 100,000 | 85,655 |
3.75%, 06/15/49 (a) | 100,000 | 77,148 |
3.15%, 05/01/50 (a) | 150,000 | 104,988 |
Tampa Electric Co. | ||
4.10%, 06/15/42 (a) | 200,000 | 172,678 |
4.35%, 05/15/44 (a) | 225,000 | 191,007 |
4.30%, 06/15/48 (a) | 150,000 | 125,891 |
3.63%, 06/15/50 (a) | 200,000 | 148,928 |
5.00%, 07/15/52 (a) | 100,000 | 93,720 |
The Cleveland Electric Illuminating Co. | ||
5.95%, 12/15/36 | 150,000 | 148,764 |
The Southern Co. | ||
4.48%, 08/01/24 (d) | 250,000 | 245,780 |
3.25%, 07/01/26 (a) | 500,000 | 471,295 |
5.11%, 08/01/27 (d) | 250,000 | 248,092 |
4.85%, 06/15/28 (a) | 250,000 | 245,700 |
3.70%, 04/30/30 (a) | 375,000 | 344,734 |
5.20%, 06/15/33 (a) | 200,000 | 198,716 |
4.25%, 07/01/36 (a) | 250,000 | 223,305 |
4.40%, 07/01/46 (a) | 600,000 | 514,998 |
4.00%, 01/15/51 (a)(b) | 250,000 | 232,352 |
3.75%, 09/15/51 (a)(b) | 275,000 | 234,586 |
Toledo Edison Co. | ||
6.15%, 05/15/37 | 100,000 | 104,361 |
Tucson Electric Power Co. | ||
1.50%, 08/01/30 (a) | 175,000 | 138,658 |
4.85%, 12/01/48 (a) | 225,000 | 200,977 |
4.00%, 06/15/50 (a) | 100,000 | 78,876 |
3.25%, 05/01/51 (a) | 200,000 | 138,644 |
Union Electric Co. | ||
2.95%, 06/15/27 (a) | 44,000 | 41,045 |
3.50%, 03/15/29 (a) | 550,000 | 507,952 |
2.95%, 03/15/30 (a) | 150,000 | 133,358 |
2.15%, 03/15/32 (a) | 200,000 | 160,558 |
3.90%, 09/15/42 (a) | 115,000 | 94,115 |
3.65%, 04/15/45 (a) | 100,000 | 77,965 |
4.00%, 04/01/48 (a) | 250,000 | 205,412 |
3.25%, 10/01/49 (a) | 150,000 | 106,671 |
2.63%, 03/15/51 (a) | 250,000 | 160,705 |
3.90%, 04/01/52 (a) | 150,000 | 122,718 |
Virginia Electric and Power Co. | ||
3.10%, 05/15/25 (a) | 200,000 | 191,172 |
3.15%, 01/15/26 (a) | 250,000 | 238,557 |
SECURITY RATE, MATURITY DATE | FACE AMOUNT ($) | VALUE ($) |
2.95%, 11/15/26 (a) | 200,000 | 185,476 |
3.50%, 03/15/27 (a) | 350,000 | 331,933 |
2.88%, 07/15/29 (a) | 150,000 | 133,464 |
2.40%, 03/30/32 (a) | 175,000 | 144,550 |
6.00%, 01/15/36 | 250,000 | 261,567 |
6.00%, 05/15/37 | 275,000 | 286,685 |
8.88%, 11/15/38 | 200,000 | 266,688 |
4.00%, 01/15/43 (a) | 250,000 | 207,150 |
4.45%, 02/15/44 (a) | 250,000 | 215,540 |
4.20%, 05/15/45 (a) | 50,000 | 41,148 |
3.80%, 09/15/47 (a) | 300,000 | 235,338 |
4.60%, 12/01/48 (a) | 250,000 | 222,937 |
3.30%, 12/01/49 (a) | 300,000 | 217,191 |
2.45%, 12/15/50 (a) | 450,000 | 271,107 |
4.63%, 05/15/52 (a) | 225,000 | 199,478 |
5.45%, 04/01/53 (a) | 200,000 | 201,146 |
WEC Energy Group, Inc. | ||
4.75%, 01/09/26 (a) | 200,000 | 197,232 |
5.15%, 10/01/27 (a) | 150,000 | 150,035 |
1.38%, 10/15/27 (a) | 250,000 | 213,950 |
4.75%, 01/15/28 (a) | 200,000 | 195,732 |
2.20%, 12/15/28 (a) | 150,000 | 129,396 |
1.80%, 10/15/30 (a) | 250,000 | 199,572 |
Wisconsin Electric Power Co. | ||
2.05%, 12/15/24 (a) | 100,000 | 95,136 |
1.70%, 06/15/28 (a) | 150,000 | 128,882 |
4.30%, 10/15/48 (a) | 125,000 | 108,326 |
Wisconsin Power and Light Co. | ||
3.05%, 10/15/27 (a) | 100,000 | 93,102 |
3.00%, 07/01/29 (a) | 275,000 | 247,360 |
3.65%, 04/01/50 (a) | 200,000 | 151,414 |
Wisconsin Public Service Corp. | ||
3.67%, 12/01/42 | 200,000 | 156,548 |
4.75%, 11/01/44 (a) | 150,000 | 135,915 |
3.30%, 09/01/49 (a) | 200,000 | 144,584 |
Xcel Energy, Inc. | ||
3.30%, 06/01/25 (a) | 200,000 | 191,788 |
4.00%, 06/15/28 (a) | 250,000 | 238,780 |
3.40%, 06/01/30 (a) | 300,000 | 267,666 |
4.60%, 06/01/32 (a) | 250,000 | 236,837 |
6.50%, 07/01/36 | 90,000 | 96,624 |
3.50%, 12/01/49 (a) | 200,000 | 145,708 |
135,429,724 | ||
Natural Gas 0.2% | ||
Atmos Energy Corp. | ||
3.00%, 06/15/27 (a) | 200,000 | 187,692 |
1.50%, 01/15/31 (a) | 350,000 | 276,360 |
5.50%, 06/15/41 (a) | 150,000 | 150,582 |
4.15%, 01/15/43 (a) | 200,000 | 176,020 |
4.13%, 10/15/44 (a) | 100,000 | 84,584 |
4.30%, 10/01/48 (a) | 225,000 | 195,885 |
4.13%, 03/15/49 (a) | 150,000 | 126,971 |
3.38%, 09/15/49 (a) | 300,000 | 222,846 |
5.75%, 10/15/52 (a) | 150,000 | 160,384 |
CenterPoint Energy Resources Corp. | ||
5.25%, 03/01/28 (a) | 200,000 | 200,328 |
4.00%, 04/01/28 (a) | 50,000 | 47,841 |
1.75%, 10/01/30 (a) | 200,000 | 160,586 |
5.40%, 03/01/33 (a) | 200,000 | 203,744 |
5.85%, 01/15/41 (a) | 225,000 | 232,342 |
4.10%, 09/01/47 (a) | 100,000 | 82,147 |
National Grid USA | ||
5.80%, 04/01/35 | 150,000 | 152,694 |
SECURITY RATE, MATURITY DATE | FACE AMOUNT ($) | VALUE ($) |
NiSource, Inc. | ||
0.95%, 08/15/25 (a) | 350,000 | 319,686 |
3.49%, 05/15/27 (a) | 225,000 | 212,292 |
5.25%, 03/30/28 (a) | 200,000 | 200,250 |
2.95%, 09/01/29 (a) | 350,000 | 307,104 |
3.60%, 05/01/30 (a) | 450,000 | 406,539 |
1.70%, 02/15/31 (a) | 200,000 | 157,000 |
5.25%, 02/15/43 (a) | 300,000 | 288,891 |
4.80%, 02/15/44 (a) | 100,000 | 91,278 |
5.65%, 02/01/45 (a) | 275,000 | 274,950 |
4.38%, 05/15/47 (a) | 350,000 | 300,293 |
3.95%, 03/30/48 (a) | 100,000 | 80,677 |
5.00%, 06/15/52 (a) | 100,000 | 92,809 |
ONE Gas, Inc. | ||
4.66%, 02/01/44 (a) | 200,000 | 181,144 |
4.50%, 11/01/48 (a) | 150,000 | 129,476 |
Piedmont Natural Gas Co., Inc. | ||
3.50%, 06/01/29 (a) | 270,000 | 245,244 |
3.64%, 11/01/46 (a) | 150,000 | 108,782 |
3.35%, 06/01/50 (a) | 150,000 | 103,203 |
5.05%, 05/15/52 (a) | 150,000 | 135,724 |
Sempra Energy | ||
3.30%, 04/01/25 (a) | 250,000 | 240,202 |
3.25%, 06/15/27 (a) | 300,000 | 277,830 |
3.40%, 02/01/28 (a) | 300,000 | 276,873 |
3.70%, 04/01/29 (a) | 200,000 | 183,478 |
3.80%, 02/01/38 (a) | 250,000 | 207,585 |
6.00%, 10/15/39 | 325,000 | 332,507 |
4.00%, 02/01/48 (a) | 225,000 | 175,581 |
4.13%, 04/01/52 (a)(b) | 300,000 | 243,186 |
Southern California Gas Co. | ||
3.20%, 06/15/25 (a) | 50,000 | 47,908 |
2.60%, 06/15/26 (a) | 300,000 | 280,380 |
2.95%, 04/15/27 (a) | 200,000 | 186,846 |
2.55%, 02/01/30 (a) | 250,000 | 215,542 |
5.13%, 11/15/40 | 75,000 | 72,709 |
3.75%, 09/15/42 (a) | 150,000 | 118,002 |
4.13%, 06/01/48 (a) | 125,000 | 100,985 |
4.30%, 01/15/49 (a) | 175,000 | 147,577 |
3.95%, 02/15/50 (a) | 125,000 | 98,298 |
5.75%, 06/01/53 (a) | 150,000 | 152,436 |
Southern Co. Gas Capital Corp. | ||
3.25%, 06/15/26 (a) | 100,000 | 94,310 |
1.75%, 01/15/31 (a) | 250,000 | 196,687 |
5.88%, 03/15/41 (a) | 200,000 | 201,964 |
4.40%, 06/01/43 (a) | 100,000 | 83,015 |
3.95%, 10/01/46 (a) | 225,000 | 174,247 |
4.40%, 05/30/47 (a) | 250,000 | 209,035 |
Southwest Gas Corp. | ||
2.20%, 06/15/30 (a) | 230,000 | 187,075 |
4.05%, 03/15/32 (a) | 100,000 | 90,248 |
3.80%, 09/29/46 (a) | 100,000 | 73,838 |
4.15%, 06/01/49 (a) | 250,000 | 195,670 |
3.18%, 08/15/51 (a) | 50,000 | 32,301 |
Spire Missouri, Inc. | ||
3.30%, 06/01/51 (a) | 125,000 | 88,689 |
Washington Gas Light Co. | ||
3.80%, 09/15/46 (a) | 155,000 | 120,007 |
3.65%, 09/15/49 (a) | 150,000 | 112,605 |
11,513,964 | ||
Utility Other 0.0% | ||
American Water Capital Corp. | ||
3.40%, 03/01/25 (a) | 150,000 | 145,201 |
2.95%, 09/01/27 (a) | 100,000 | 92,541 |
SECURITY RATE, MATURITY DATE | FACE AMOUNT ($) | VALUE ($) |
3.75%, 09/01/28 (a) | 250,000 | 236,707 |
3.45%, 06/01/29 (a) | 150,000 | 139,377 |
2.80%, 05/01/30 (a) | 200,000 | 175,226 |
2.30%, 06/01/31 (a) | 200,000 | 166,436 |
4.45%, 06/01/32 (a) | 325,000 | 315,172 |
6.59%, 10/15/37 | 200,000 | 226,006 |
4.30%, 12/01/42 (a) | 200,000 | 177,534 |
4.30%, 09/01/45 (a) | 45,000 | 38,767 |
4.00%, 12/01/46 (a) | 115,000 | 92,988 |
3.75%, 09/01/47 (a) | 250,000 | 198,390 |
4.20%, 09/01/48 (a) | 250,000 | 211,570 |
4.15%, 06/01/49 (a) | 100,000 | 84,517 |
3.45%, 05/01/50 (a) | 125,000 | 93,894 |
Essential Utilities, Inc. | ||
3.57%, 05/01/29 (a) | 150,000 | 136,776 |
2.70%, 04/15/30 (a) | 200,000 | 169,714 |
2.40%, 05/01/31 (a) | 50,000 | 40,688 |
4.28%, 05/01/49 (a) | 250,000 | 203,460 |
3.35%, 04/15/50 (a) | 200,000 | 140,114 |
5.30%, 05/01/52 (a) | 200,000 | 190,270 |
3,275,348 | ||
150,219,036 | ||
Total Corporates (Cost $1,968,876,728) | 1,733,759,184 | |
TREASURIES 40.9% OF NET ASSETS | ||
Bonds | ||
7.50%, 11/15/24 | 1,248,000 | 1,286,464 |
7.63%, 02/15/25 | 1,000,000 | 1,039,551 |
6.88%, 08/15/25 | 1,000,000 | 1,042,227 |
6.00%, 02/15/26 | 1,889,000 | 1,952,532 |
6.75%, 08/15/26 | 1,209,000 | 1,287,538 |
6.50%, 11/15/26 | 1,748,000 | 1,860,664 |
6.63%, 02/15/27 | 1,000,000 | 1,075,273 |
6.38%, 08/15/27 | 1,200,000 | 1,293,797 |
6.13%, 11/15/27 | 2,434,000 | 2,617,691 |
5.50%, 08/15/28 | 1,748,000 | 1,853,768 |
5.25%, 11/15/28 | 2,248,000 | 2,364,791 |
5.25%, 02/15/29 | 1,174,000 | 1,238,753 |
6.13%, 08/15/29 | 1,044,000 | 1,159,085 |
6.25%, 05/15/30 | 2,131,000 | 2,416,687 |
5.38%, 02/15/31 | 2,594,000 | 2,841,443 |
4.50%, 02/15/36 | 2,844,000 | 3,070,853 |
4.75%, 02/15/37 | 1,182,000 | 1,308,603 |
5.00%, 05/15/37 | 2,648,000 | 3,001,963 |
4.38%, 02/15/38 | 1,596,000 | 1,700,239 |
4.50%, 05/15/38 | 1,596,000 | 1,719,939 |
3.50%, 02/15/39 | 1,972,000 | 1,892,812 |
4.25%, 05/15/39 | 2,946,000 | 3,084,784 |
4.50%, 08/15/39 | 2,946,000 | 3,172,013 |
4.38%, 11/15/39 | 3,625,000 | 3,842,783 |
4.63%, 02/15/40 | 3,955,000 | 4,314,967 |
1.13%, 05/15/40 | 11,200,000 | 7,271,250 |
4.38%, 05/15/40 | 3,194,000 | 3,378,404 |
1.13%, 08/15/40 | 13,000,000 | 8,371,797 |
3.88%, 08/15/40 | 4,494,000 | 4,462,753 |
1.38%, 11/15/40 | 15,000,000 | 10,050,000 |
4.25%, 11/15/40 | 4,253,000 | 4,425,778 |
1.88%, 02/15/41 | 18,400,000 | 13,377,375 |
4.75%, 02/15/41 | 4,292,000 | 4,742,325 |
2.25%, 05/15/41 | 16,000,000 | 12,335,000 |
4.38%, 05/15/41 | 3,944,000 | 4,154,449 |
1.75%, 08/15/41 | 20,600,000 | 14,492,422 |
3.75%, 08/15/41 | 3,817,000 | 3,689,667 |
2.00%, 11/15/41 | 16,800,000 | 12,311,250 |
3.13%, 11/15/41 | 4,344,000 | 3,830,526 |
SECURITY RATE, MATURITY DATE | FACE AMOUNT ($) | VALUE ($) |
2.38%, 02/15/42 | 14,000,000 | 10,909,062 |
3.13%, 02/15/42 | 4,082,000 | 3,591,203 |
3.00%, 05/15/42 | 3,998,000 | 3,441,091 |
3.25%, 05/15/42 | 12,500,000 | 11,162,109 |
2.75%, 08/15/42 | 4,191,000 | 3,457,575 |
3.38%, 08/15/42 | 11,000,000 | 9,990,234 |
2.75%, 11/15/42 | 6,158,000 | 5,071,209 |
4.00%, 11/15/42 | 12,200,000 | 12,132,328 |
3.13%, 02/15/43 | 5,286,000 | 4,613,274 |
3.88%, 02/15/43 | 11,650,000 | 11,366,031 |
2.88%, 05/15/43 | 8,231,000 | 6,890,247 |
3.88%, 05/15/43 | 8,100,000 | 7,906,359 |
3.63%, 08/15/43 | 5,817,000 | 5,464,799 |
3.75%, 11/15/43 | 6,150,000 | 5,882,379 |
3.63%, 02/15/44 | 6,427,000 | 6,025,815 |
3.38%, 05/15/44 | 6,294,000 | 5,678,368 |
3.13%, 08/15/44 | 7,882,000 | 6,825,319 |
3.00%, 11/15/44 | 7,136,000 | 6,044,415 |
2.50%, 02/15/45 | 8,132,000 | 6,299,759 |
3.00%, 05/15/45 | 2,534,000 | 2,141,824 |
2.88%, 08/15/45 | 5,332,000 | 4,403,066 |
3.00%, 11/15/45 | 3,782,000 | 3,191,358 |
2.50%, 02/15/46 | 6,586,000 | 5,071,735 |
2.50%, 05/15/46 | 6,732,000 | 5,179,433 |
2.25%, 08/15/46 | 8,278,000 | 6,051,994 |
2.88%, 11/15/46 | 2,719,000 | 2,241,688 |
3.00%, 02/15/47 | 6,584,000 | 5,545,991 |
3.00%, 05/15/47 | 5,738,000 | 4,835,162 |
2.75%, 08/15/47 | 8,080,000 | 6,502,506 |
2.75%, 11/15/47 | 8,378,000 | 6,743,636 |
3.00%, 02/15/48 | 9,434,000 | 7,957,726 |
3.13%, 05/15/48 | 10,120,000 | 8,737,988 |
3.00%, 08/15/48 | 11,428,000 | 9,648,625 |
3.38%, 11/15/48 | 11,400,000 | 10,311,656 |
3.00%, 02/15/49 | 13,176,000 | 11,151,219 |
2.88%, 05/15/49 | 12,800,000 | 10,589,000 |
2.25%, 08/15/49 | 12,000,000 | 8,729,063 |
2.38%, 11/15/49 | 11,278,000 | 8,431,186 |
2.00%, 02/15/50 | 14,398,000 | 9,878,378 |
1.25%, 05/15/50 | 16,850,000 | 9,484,707 |
1.38%, 08/15/50 | 20,600,000 | 11,983,406 |
1.63%, 11/15/50 | 18,600,000 | 11,563,969 |
1.88%, 02/15/51 | 21,000,000 | 13,917,422 |
2.38%, 05/15/51 | 21,100,000 | 15,698,070 |
2.00%, 08/15/51 | 21,200,000 | 14,462,375 |
1.88%, 11/15/51 | 20,100,000 | 13,278,562 |
2.25%, 02/15/52 | 17,800,000 | 12,873,016 |
2.88%, 05/15/52 | 17,300,000 | 14,348,187 |
3.00%, 08/15/52 | 16,500,000 | 14,040,469 |
4.00%, 11/15/52 | 15,750,000 | 16,191,738 |
3.63%, 02/15/53 | 17,200,000 | 16,521,406 |
3.63%, 05/15/53 | 11,500,000 | 11,059,766 |
Notes | ||
1.75%, 07/31/24 | 14,078,000 | 13,544,301 |
2.13%, 07/31/24 | 6,488,000 | 6,266,876 |
3.00%, 07/31/24 | 12,000,000 | 11,699,297 |
0.38%, 08/15/24 | 15,000,000 | 14,194,336 |
2.38%, 08/15/24 | 17,768,000 | 17,198,522 |
1.25%, 08/31/24 | 9,886,000 | 9,431,283 |
1.88%, 08/31/24 | 6,490,000 | 6,237,372 |
3.25%, 08/31/24 | 14,000,000 | 13,666,680 |
0.38%, 09/15/24 | 17,500,000 | 16,497,510 |
1.50%, 09/30/24 | 8,982,000 | 8,572,196 |
2.13%, 09/30/24 | 7,784,000 | 7,486,475 |
4.25%, 09/30/24 | 16,000,000 | 15,790,937 |
0.63%, 10/15/24 | 16,500,000 | 15,548,672 |
1.50%, 10/31/24 | 8,480,000 | 8,071,238 |
2.25%, 10/31/24 | 8,038,000 | 7,725,900 |
SECURITY RATE, MATURITY DATE | FACE AMOUNT ($) | VALUE ($) |
4.38%, 10/31/24 | 17,000,000 | 16,797,461 |
0.75%, 11/15/24 | 14,800,000 | 13,923,273 |
2.25%, 11/15/24 | 16,870,000 | 16,203,437 |
1.50%, 11/30/24 | 9,480,000 | 9,002,852 |
2.13%, 11/30/24 | 6,988,000 | 6,694,422 |
4.50%, 11/30/24 | 14,000,000 | 13,853,437 |
1.00%, 12/15/24 | 15,000,000 | 14,120,215 |
1.75%, 12/31/24 | 9,982,000 | 9,491,673 |
2.25%, 12/31/24 | 7,988,000 | 7,650,850 |
4.25%, 12/31/24 | 17,000,000 | 16,765,254 |
1.13%, 01/15/25 | 14,000,000 | 13,168,750 |
1.38%, 01/31/25 | 7,696,000 | 7,259,943 |
2.50%, 01/31/25 | 7,488,000 | 7,188,188 |
4.13%, 01/31/25 | 12,000,000 | 11,813,438 |
1.50%, 02/15/25 | 14,000,000 | 13,216,602 |
2.00%, 02/15/25 | 14,486,000 | 13,790,559 |
1.13%, 02/28/25 | 7,998,000 | 7,498,281 |
2.75%, 02/28/25 | 7,890,000 | 7,602,755 |
4.63%, 02/28/25 | 12,000,000 | 11,907,891 |
1.75%, 03/15/25 | 14,000,000 | 13,245,312 |
0.50%, 03/31/25 | 12,200,000 | 11,286,668 |
2.63%, 03/31/25 | 4,724,000 | 4,534,948 |
3.88%, 03/31/25 | 13,500,000 | 13,236,064 |
2.63%, 04/15/25 | 12,000,000 | 11,512,031 |
0.38%, 04/30/25 | 12,900,000 | 11,871,527 |
2.88%, 04/30/25 | 6,986,000 | 6,727,846 |
3.88%, 04/30/25 | 11,000,000 | 10,786,875 |
2.13%, 05/15/25 | 13,880,400 | 13,183,398 |
2.75%, 05/15/25 | 12,500,000 | 12,008,057 |
0.25%, 05/31/25 | 10,700,000 | 9,793,426 |
2.88%, 05/31/25 | 5,788,000 | 5,571,628 |
4.25%, 05/31/25 | 15,000,000 | 14,812,207 |
2.88%, 06/15/25 | 12,000,000 | 11,545,078 |
0.25%, 06/30/25 | 11,500,000 | 10,504,756 |
2.75%, 06/30/25 | 3,988,000 | 3,826,689 |
4.63%, 06/30/25 | 12,000,000 | 11,945,625 |
3.00%, 07/15/25 | 11,000,000 | 10,603,398 |
0.25%, 07/31/25 | 11,100,000 | 10,101,000 |
2.88%, 07/31/25 | 6,386,000 | 6,139,041 |
2.00%, 08/15/25 | 14,168,000 | 13,367,176 |
3.13%, 08/15/25 | 11,000,000 | 10,625,312 |
0.25%, 08/31/25 | 9,400,000 | 8,531,602 |
2.75%, 08/31/25 | 6,236,000 | 5,974,868 |
3.50%, 09/15/25 | 9,500,000 | 9,243,945 |
0.25%, 09/30/25 | 16,100,000 | 14,584,965 |
3.00%, 09/30/25 | 4,682,000 | 4,506,608 |
4.25%, 10/15/25 | 13,000,000 | 12,856,797 |
0.25%, 10/31/25 | 14,800,000 | 13,360,469 |
3.00%, 10/31/25 | 5,688,000 | 5,471,812 |
2.25%, 11/15/25 | 15,072,000 | 14,243,040 |
4.50%, 11/15/25 | 10,000,000 | 9,950,391 |
0.38%, 11/30/25 | 13,600,000 | 12,279,313 |
2.88%, 11/30/25 | 5,682,000 | 5,447,396 |
4.00%, 12/15/25 | 12,100,000 | 11,912,355 |
0.38%, 12/31/25 | 15,300,000 | 13,792,711 |
2.63%, 12/31/25 | 6,486,000 | 6,178,928 |
3.88%, 01/15/26 | 9,200,000 | 9,030,375 |
0.38%, 01/31/26 | 16,100,000 | 14,457,297 |
2.63%, 01/31/26 | 6,938,000 | 6,604,380 |
1.63%, 02/15/26 | 12,672,000 | 11,744,865 |
4.00%, 02/15/26 | 10,000,000 | 9,848,438 |
0.50%, 02/28/26 | 14,500,000 | 13,028,477 |
2.50%, 02/28/26 | 5,476,000 | 5,191,719 |
4.63%, 03/15/26 | 11,500,000 | 11,514,375 |
0.75%, 03/31/26 | 13,000,000 | 11,752,305 |
2.25%, 03/31/26 | 5,786,000 | 5,446,073 |
3.75%, 04/15/26 | 13,000,000 | 12,725,781 |
0.75%, 04/30/26 | 13,800,000 | 12,430,242 |
SECURITY RATE, MATURITY DATE | FACE AMOUNT ($) | VALUE ($) |
2.38%, 04/30/26 | 6,084,000 | 5,738,923 |
1.63%, 05/15/26 | 14,685,000 | 13,556,091 |
3.63%, 05/15/26 | 11,000,000 | 10,733,594 |
0.75%, 05/31/26 | 18,000,000 | 16,171,172 |
2.13%, 05/31/26 | 6,388,000 | 5,976,024 |
4.13%, 06/15/26 | 12,000,000 | 11,878,125 |
0.88%, 06/30/26 | 14,000,000 | 12,615,859 |
1.88%, 06/30/26 | 7,984,000 | 7,411,086 |
0.63%, 07/31/26 | 15,500,000 | 13,811,953 |
1.88%, 07/31/26 | 7,284,000 | 6,745,382 |
1.50%, 08/15/26 | 14,724,000 | 13,462,107 |
0.75%, 08/31/26 | 17,000,000 | 15,165,195 |
1.38%, 08/31/26 | 6,986,000 | 6,358,624 |
0.88%, 09/30/26 | 16,200,000 | 14,497,734 |
1.63%, 09/30/26 | 4,990,000 | 4,571,893 |
1.13%, 10/31/26 | 15,500,000 | 13,941,524 |
1.63%, 10/31/26 | 6,584,000 | 6,022,045 |
2.00%, 11/15/26 | 15,032,000 | 13,909,297 |
1.25%, 11/30/26 | 17,000,000 | 15,319,922 |
1.63%, 11/30/26 | 6,286,000 | 5,739,904 |
1.25%, 12/31/26 | 16,500,000 | 14,853,867 |
1.75%, 12/31/26 | 6,990,000 | 6,402,949 |
1.50%, 01/31/27 | 21,190,000 | 19,200,127 |
2.25%, 02/15/27 | 13,626,000 | 12,674,309 |
1.13%, 02/28/27 | 3,300,000 | 2,945,250 |
1.88%, 02/28/27 | 15,000,000 | 13,753,711 |
0.63%, 03/31/27 | 5,600,000 | 4,890,813 |
2.50%, 03/31/27 | 15,000,000 | 14,060,156 |
0.50%, 04/30/27 | 7,350,000 | 6,370,957 |
2.75%, 04/30/27 | 13,000,000 | 12,282,969 |
2.38%, 05/15/27 | 15,420,000 | 14,361,080 |
0.50%, 05/31/27 | 8,700,000 | 7,521,422 |
2.63%, 05/31/27 | 13,250,000 | 12,452,412 |
0.50%, 06/30/27 | 9,400,000 | 8,105,297 |
3.25%, 06/30/27 | 13,500,000 | 12,986,367 |
0.38%, 07/31/27 | 11,600,000 | 9,925,250 |
2.75%, 07/31/27 | 13,000,000 | 12,258,594 |
2.25%, 08/15/27 | 10,272,000 | 9,497,989 |
0.50%, 08/31/27 | 10,500,000 | 9,009,492 |
3.13%, 08/31/27 | 12,500,000 | 11,957,031 |
0.38%, 09/30/27 | 13,000,000 | 11,066,250 |
4.13%, 09/30/27 | 12,500,000 | 12,432,129 |
0.50%, 10/31/27 | 11,200,000 | 9,562,437 |
4.13%, 10/31/27 | 12,000,000 | 11,938,594 |
2.25%, 11/15/27 | 12,474,000 | 11,491,185 |
0.63%, 11/30/27 | 12,200,000 | 10,450,539 |
3.88%, 11/30/27 | 12,000,000 | 11,832,188 |
0.63%, 12/31/27 | 12,900,000 | 11,025,973 |
3.88%, 12/31/27 | 12,000,000 | 11,834,531 |
0.75%, 01/31/28 | 14,200,000 | 12,183,156 |
3.50%, 01/31/28 | 8,500,000 | 8,255,625 |
2.75%, 02/15/28 | 16,322,000 | 15,344,593 |
1.13%, 02/29/28 | 14,800,000 | 12,900,859 |
4.00%, 02/29/28 | 12,000,000 | 11,915,156 |
1.25%, 03/31/28 | 15,000,000 | 13,128,516 |
3.63%, 03/31/28 | 11,500,000 | 11,234,512 |
1.25%, 04/30/28 | 17,600,000 | 15,378,687 |
3.50%, 04/30/28 | 15,000,000 | 14,575,781 |
2.88%, 05/15/28 | 16,770,000 | 15,827,998 |
1.25%, 05/31/28 | 16,500,000 | 14,398,828 |
3.63%, 05/31/28 | 13,000,000 | 12,718,164 |
1.25%, 06/30/28 | 17,500,000 | 15,238,672 |
4.00%, 06/30/28 | 13,000,000 | 12,929,414 |
1.00%, 07/31/28 | 17,000,000 | 14,584,141 |
2.88%, 08/15/28 | 18,368,000 | 17,308,970 |
1.13%, 08/31/28 | 16,000,000 | 13,790,625 |
1.25%, 09/30/28 | 17,200,000 | 14,892,781 |
1.38%, 10/31/28 | 15,500,000 | 13,488,633 |
SECURITY RATE, MATURITY DATE | FACE AMOUNT ($) | VALUE ($) |
3.13%, 11/15/28 | 16,714,000 | 15,926,614 |
1.50%, 11/30/28 | 15,000,000 | 13,124,414 |
1.38%, 12/31/28 | 13,000,000 | 11,279,531 |
1.75%, 01/31/29 | 14,300,000 | 12,646,004 |
2.63%, 02/15/29 | 15,666,000 | 14,516,752 |
1.88%, 02/28/29 | 12,500,000 | 11,119,141 |
2.38%, 03/31/29 | 11,400,000 | 10,411,852 |
2.88%, 04/30/29 | 10,500,000 | 9,849,492 |
2.38%, 05/15/29 | 12,358,000 | 11,268,951 |
2.75%, 05/31/29 | 10,000,000 | 9,312,500 |
3.25%, 06/30/29 | 11,000,000 | 10,526,484 |
2.63%, 07/31/29 | 11,500,000 | 10,626,270 |
1.63%, 08/15/29 | 8,166,000 | 7,124,835 |
3.13%, 08/31/29 | 8,500,000 | 8,075,996 |
3.88%, 09/30/29 | 9,000,000 | 8,914,219 |
4.00%, 10/31/29 | 20,000,000 | 19,956,250 |
1.75%, 11/15/29 | 7,266,000 | 6,374,212 |
3.88%, 11/30/29 | 8,000,000 | 7,930,312 |
3.88%, 12/31/29 | 10,000,000 | 9,916,797 |
3.50%, 01/31/30 | 9,500,000 | 9,222,422 |
1.50%, 02/15/30 | 10,398,000 | 8,910,599 |
4.00%, 02/28/30 | 7,000,000 | 6,997,266 |
3.63%, 03/31/30 | 8,500,000 | 8,317,383 |
3.50%, 04/30/30 | 10,200,000 | 9,907,547 |
0.63%, 05/15/30 | 14,200,000 | 11,381,078 |
3.75%, 05/31/30 | 8,500,000 | 8,383,789 |
3.75%, 06/30/30 | 10,000,000 | 9,867,969 |
0.63%, 08/15/30 | 22,000,000 | 17,532,969 |
0.88%, 11/15/30 | 25,000,000 | 20,240,234 |
1.13%, 02/15/31 | 29,500,000 | 24,270,664 |
1.63%, 05/15/31 | 29,000,000 | 24,656,797 |
1.25%, 08/15/31 | 31,900,000 | 26,187,906 |
1.38%, 11/15/31 | 33,600,000 | 27,712,125 |
1.88%, 02/15/32 | 33,000,000 | 28,276,875 |
2.88%, 05/15/32 | 28,250,000 | 26,199,668 |
2.75%, 08/15/32 | 41,500,000 | 38,053,555 |
4.13%, 11/15/32 | 29,800,000 | 30,458,860 |
3.50%, 02/15/33 | 39,000,000 | 37,997,578 |
3.38%, 05/15/33 | 24,000,000 | 23,150,625 |
Total Treasuries (Cost $3,054,410,192) | 2,891,560,552 | |
GOVERNMENT RELATED 4.9% OF NET ASSETS | ||
Agency 1.8% | ||
Foreign 0.7% | ||
Austria 0.0% | ||
Oesterreichische Kontrollbank AG | ||
0.50%, 09/16/24 | 100,000 | 94,295 |
1.50%, 02/12/25 | 700,000 | 660,121 |
0.38%, 09/17/25 | 500,000 | 454,035 |
4.63%, 11/03/25 | 375,000 | 373,406 |
0.50%, 02/02/26 | 925,000 | 830,447 |
3.63%, 09/09/27 | 100,000 | 97,192 |
4.25%, 03/01/28 | 500,000 | 498,810 |
3,008,306 | ||
Canada 0.0% | ||
Export Development Canada | ||
3.00%, 05/25/27 | 1,000,000 | 948,240 |
China 0.0% | ||
Industrial & Commercial Bank of China Ltd. | ||
3.54%, 11/08/27 | 300,000 | 285,594 |
SECURITY RATE, MATURITY DATE | FACE AMOUNT ($) | VALUE ($) |
Germany 0.3% | ||
Kreditanstalt Fuer Wiederaufbau | ||
1.38%, 08/05/24(h) | 1,400,000 | 1,339,660 |
0.50%, 09/20/24(h) | 2,000,000 | 1,885,700 |
2.50%, 11/20/24(h) | 2,200,000 | 2,118,336 |
1.25%, 01/31/25(h) | 1,750,000 | 1,646,592 |
0.38%, 07/18/25(h) | 1,650,000 | 1,506,747 |
0.63%, 01/22/26(h) | 1,750,000 | 1,581,107 |
1.00%, 10/01/26(h) | 1,300,000 | 1,163,279 |
3.00%, 05/20/27(h) | 1,750,000 | 1,660,820 |
3.75%, 02/15/28(h) | 50,000 | 48,917 |
2.88%, 04/03/28(h) | 1,100,000 | 1,034,792 |
3.88%, 06/15/28(h) | 1,000,000 | 983,030 |
1.75%, 09/14/29(h) | 700,000 | 612,206 |
0.75%, 09/30/30(h) | 700,000 | 556,535 |
0.00%, 04/18/36(h)(i) | 250,000 | 148,690 |
0.00%, 06/29/37(h)(i) | 850,000 | 480,148 |
Landwirtschaftliche Rentenbank | ||
2.00%, 01/13/25(h) | 900,000 | 857,736 |
2.38%, 06/10/25(h) | 600,000 | 570,300 |
0.88%, 03/30/26(h) | 500,000 | 451,660 |
1.75%, 07/27/26(h) | 500,000 | 459,180 |
2.50%, 11/15/27(h) | 500,000 | 463,920 |
0.88%, 09/03/30(h) | 850,000 | 678,836 |
20,248,191 | ||
Japan 0.2% | ||
Japan Bank for International Cooperation | ||
1.75%, 10/17/24 | 500,000 | 476,395 |
2.13%, 02/10/25 | 100,000 | 94,985 |
2.50%, 05/28/25 | 200,000 | 189,832 |
0.63%, 07/15/25 | 700,000 | 639,849 |
1.88%, 07/21/26 | 350,000 | 319,480 |
2.25%, 11/04/26 | 1,450,000 | 1,331,433 |
2.88%, 06/01/27 | 1,000,000 | 930,450 |
2.88%, 07/21/27 | 750,000 | 699,780 |
4.38%, 10/05/27 | 550,000 | 544,060 |
2.75%, 11/16/27 | 700,000 | 647,689 |
3.25%, 07/20/28 | 400,000 | 374,788 |
3.50%, 10/31/28 | 450,000 | 425,633 |
2.13%, 02/16/29 | 500,000 | 437,120 |
2.00%, 10/17/29 | 700,000 | 602,588 |
1.25%, 01/21/31 | 550,000 | 435,716 |
1.88%, 04/15/31 | 1,250,000 | 1,034,237 |
Japan International Cooperation Agency | ||
2.13%, 10/20/26 | 200,000 | 182,894 |
2.75%, 04/27/27 | 400,000 | 370,628 |
3.38%, 06/12/28 | 350,000 | 329,735 |
1.00%, 07/22/30 | 370,000 | 291,201 |
1.75%, 04/28/31 | 350,000 | 286,087 |
10,644,580 | ||
Norway 0.1% | ||
Equinor A.S.A. | ||
3.25%, 11/10/24 | 150,000 | 145,739 |
2.88%, 04/06/25(a) | 450,000 | 431,734 |
1.75%, 01/22/26(a) | 250,000 | 230,830 |
3.00%, 04/06/27(a) | 150,000 | 140,462 |
7.25%, 09/23/27 | 50,000 | 54,745 |
3.63%, 09/10/28(a) | 600,000 | 573,282 |
3.13%, 04/06/30(a) | 450,000 | 412,753 |
2.38%, 05/22/30(a) | 500,000 | 435,615 |
3.63%, 04/06/40(a) | 200,000 | 168,208 |
4.25%, 11/23/41 | 500,000 | 450,065 |
3.95%, 05/15/43 | 300,000 | 258,519 |
SECURITY RATE, MATURITY DATE | FACE AMOUNT ($) | VALUE ($) |
4.80%, 11/08/43 | 260,000 | 249,441 |
3.25%, 11/18/49(a) | 350,000 | 263,151 |
3.70%, 04/06/50(a) | 550,000 | 450,081 |
4,264,625 | ||
Republic of Korea 0.1% | ||
Export-Import Bank of Korea | ||
1.25%, 01/18/25 | 300,000 | 281,673 |
2.88%, 01/21/25 | 800,000 | 769,776 |
1.88%, 02/12/25 | 200,000 | 189,192 |
3.25%, 11/10/25 | 750,000 | 714,292 |
2.63%, 05/26/26 | 375,000 | 347,167 |
3.25%, 08/12/26 | 200,000 | 187,850 |
1.13%, 12/29/26 | 550,000 | 476,410 |
1.63%, 01/18/27 | 300,000 | 268,950 |
2.38%, 04/21/27 | 250,000 | 228,840 |
5.00%, 01/11/28 | 500,000 | 503,095 |
1.25%, 09/21/30 | 700,000 | 556,360 |
2.13%, 01/18/32 | 350,000 | 288,222 |
5.13%, 01/11/33 | 300,000 | 310,092 |
Korea Development Bank | ||
2.13%, 10/01/24 | 350,000 | 335,622 |
3.38%, 09/16/25 | 500,000 | 479,240 |
3.00%, 01/13/26 | 200,000 | 188,774 |
0.80%, 07/19/26 | 550,000 | 479,787 |
1.00%, 09/09/26 | 250,000 | 218,018 |
2.00%, 09/12/26(f) | 350,000 | 315,287 |
4.38%, 02/15/28 | 400,000 | 392,300 |
1.63%, 01/19/31 | 450,000 | 363,420 |
2.00%, 10/25/31 | 250,000 | 204,185 |
4.25%, 09/08/32 | 200,000 | 193,406 |
8,291,958 | ||
Sweden 0.0% | ||
Svensk Exportkredit AB | ||
0.38%, 03/11/24 | 200,000 | 193,054 |
0.38%, 07/30/24 | 1,050,000 | 993,636 |
0.63%, 10/07/24 | 250,000 | 235,350 |
0.63%, 05/14/25 | 650,000 | 597,590 |
0.50%, 08/26/25 | 550,000 | 500,269 |
2.25%, 03/22/27 | 350,000 | 321,230 |
2,841,129 | ||
50,532,623 | ||
U.S. 1.1% | ||
Fannie Mae | ||
1.63%, 01/07/25 | 1,000,000 | 948,420 |
0.63%, 04/22/25 | 2,000,000 | 1,850,240 |
0.50%, 06/17/25 | 3,000,000 | 2,753,760 |
0.38%, 08/25/25 | 3,500,000 | 3,183,705 |
0.50%, 11/07/25 | 4,000,000 | 3,625,920 |
2.13%, 04/24/26 | 6,000,000 | 5,622,780 |
1.88%, 09/24/26 | 2,500,000 | 2,308,475 |
0.75%, 10/08/27 | 5,000,000 | 4,340,550 |
7.13%, 01/15/30 | 527,000 | 616,848 |
7.25%, 05/15/30 | 1,000,000 | 1,185,550 |
0.88%, 08/05/30 | 1,000,000 | 804,220 |
6.63%, 11/15/30 | 2,700,000 | 3,130,056 |
5.63%, 07/15/37 | 1,500,000 | 1,721,430 |
Federal Farm Credit Banks Funding Corp. | ||
4.50%, 11/18/24 | 1,500,000 | 1,483,890 |
1.75%, 02/14/25 | 2,000,000 | 1,892,880 |
3.88%, 02/02/26 | 500,000 | 489,350 |
SECURITY RATE, MATURITY DATE | FACE AMOUNT ($) | VALUE ($) |
Federal Home Loan Banks | ||
1.50%, 08/15/24 | 2,000,000 | 1,915,540 |
5.38%, 08/15/24 | 1,750,000 | 1,748,758 |
4.50%, 10/03/24 | 1,500,000 | 1,484,970 |
5.00%, 02/28/25 | 1,000,000 | 997,940 |
0.50%, 04/14/25 | 2,000,000 | 1,849,600 |
0.50%, 06/13/25 | 2,000,000 | 1,833,020 |
0.38%, 09/04/25 | 1,000,000 | 909,800 |
4.50%, 12/12/25 | 500,000 | 496,675 |
1.25%, 12/21/26 | 500,000 | 448,940 |
4.25%, 12/10/27 | 2,000,000 | 1,993,660 |
3.25%, 11/16/28 | 5,000,000 | 4,789,850 |
5.50%, 07/15/36 | 400,000 | 453,432 |
Freddie Mac | ||
1.50%, 02/12/25 | 5,000,000 | 4,725,750 |
0.38%, 07/21/25 | 4,000,000 | 3,650,400 |
0.38%, 09/23/25 | 6,000,000 | 5,438,940 |
6.75%, 09/15/29 | 500,000 | 571,045 |
6.75%, 03/15/31 | 1,564,000 | 1,838,951 |
6.25%, 07/15/32 | 700,000 | 818,524 |
Tennessee Valley Authority | ||
2.88%, 09/15/24 | 2,000,000 | 1,938,200 |
6.75%, 11/01/25 | 488,000 | 507,432 |
2.88%, 02/01/27 | 500,000 | 471,665 |
5.25%, 09/15/39 | 750,000 | 795,450 |
4.63%, 09/15/60 | 100,000 | 98,108 |
75,734,724 | ||
126,267,347 | ||
Local Authority 0.8% | ||
Foreign 0.2% | ||
Canada 0.2% | ||
Hydro-Quebec | ||
8.05%, 07/07/24 | 810,000 | 827,601 |
Province of Alberta | ||
1.88%, 11/13/24 | 700,000 | 667,513 |
1.00%, 05/20/25 | 200,000 | 185,168 |
3.30%, 03/15/28 | 600,000 | 569,754 |
1.30%, 07/22/30 | 700,000 | 569,240 |
Province of British Columbia | ||
1.75%, 09/27/24 | 100,000 | 95,658 |
6.50%, 01/15/26 | 100,000 | 103,609 |
2.25%, 06/02/26 | 500,000 | 466,670 |
0.90%, 07/20/26 | 600,000 | 535,890 |
1.30%, 01/29/31 | 600,000 | 486,174 |
7.25%, 09/01/36 | 200,000 | 258,092 |
Province of Manitoba | ||
2.13%, 06/22/26 | 300,000 | 278,154 |
1.50%, 10/25/28 | 100,000 | 86,257 |
Province of New Brunswick | ||
3.63%, 02/24/28 | 100,000 | 95,915 |
Province of Ontario | ||
0.63%, 01/21/26 | 750,000 | 675,037 |
1.05%, 04/14/26 | 750,000 | 678,307 |
2.50%, 04/27/26 | 600,000 | 564,348 |
2.30%, 06/15/26 | 550,000 | 513,167 |
3.10%, 05/19/27 | 350,000 | 331,093 |
1.05%, 05/21/27 | 400,000 | 349,868 |
2.00%, 10/02/29 | 400,000 | 349,192 |
1.13%, 10/07/30 | 575,000 | 461,288 |
1.60%, 02/25/31 | 500,000 | 411,785 |
1.80%, 10/14/31 | 500,000 | 416,375 |
2.13%, 01/21/32 | 250,000 | 212,993 |
SECURITY RATE, MATURITY DATE | FACE AMOUNT ($) | VALUE ($) |
Province of Quebec | ||
2.88%, 10/16/24 | 450,000 | 435,798 |
1.50%, 02/11/25 | 700,000 | 659,750 |
0.60%, 07/23/25 | 950,000 | 870,504 |
2.50%, 04/20/26 | 300,000 | 282,639 |
2.75%, 04/12/27 | 400,000 | 373,852 |
3.63%, 04/13/28 | 1,000,000 | 964,430 |
7.50%, 09/15/29 | 468,000 | 545,225 |
1.35%, 05/28/30 | 400,000 | 330,152 |
1.90%, 04/21/31 | 300,000 | 252,990 |
14,904,488 | ||
U.S. 0.6% | ||
Alameda County Joint Powers Authority | ||
RB (Build America Bonds) Series 2010 | ||
7.05%, 12/01/44 | 105,000 | 128,761 |
American Municipal Power, Inc. | ||
RB (Build America Bonds) Series 2010 | ||
5.94%, 02/15/47 | 200,000 | 214,610 |
RB (Build America Bonds) Series 2010 | ||
6.27%, 02/15/50 | 465,000 | 503,530 |
RB (Build America Bonds) Series 2010 | ||
8.08%, 02/15/50 | 250,000 | 339,135 |
Bay Area Toll Authority | ||
RB (Build America Bonds) Series 2009F2 | ||
6.26%, 04/01/49 | 500,000 | 592,593 |
RB (Build America Bonds) Series 2010S1 | ||
7.04%, 04/01/50 | 300,000 | 385,898 |
RB (Build America Bonds) Series 2010S3 | ||
6.91%, 10/01/50 | 350,000 | 448,051 |
California | ||
GO (Build America Bonds) Series 2009 | ||
7.50%, 04/01/34 | 1,050,000 | 1,269,185 |
GO (Build America Bonds) Series 2009 | ||
7.55%, 04/01/39 | 1,000,000 | 1,256,459 |
GO (Build America Bonds) Series 2009 | ||
7.30%, 10/01/39 | 800,000 | 966,838 |
GO (Build America Bonds) Series 2009 | ||
7.35%, 11/01/39 | 615,000 | 744,537 |
California State University | ||
RB Series 2017B | ||
3.90%, 11/01/47(a) | 100,000 | 86,799 |
Series B | ||
2.72%, 11/01/52 | 400,000 | 274,958 |
Chicago O'Hare International Airport | ||
RB (Build America Bonds) Series 2010B | ||
6.40%, 01/01/40 | 150,000 | 171,313 |
Series C | ||
4.47%, 01/01/49 | 150,000 | 140,038 |
Series C | ||
4.57%, 01/01/54 | 50,000 | 47,198 |
Chicago Transit Authority Sales & Transfer Tax Receipts Revenue | ||
RB (Pension Funding) Series 2008A | ||
6.90%, 12/01/40 | 435,000 | 491,796 |
RB (Pension Funding) Series 2008B | ||
6.90%, 12/01/40 | 195,000 | 223,181 |
City of Atlanta GA Water & Wastewater Revenue | ||
2.26%, 11/01/35 (a) | 125,000 | 100,095 |
SECURITY RATE, MATURITY DATE | FACE AMOUNT ($) | VALUE ($) |
City of Houston TX | ||
GO Bonds (Pension Funding) Series 2017 | ||
3.96%, 03/01/47 | 255,000 | 226,166 |
City of San Antonio TX Electric & Gas Systems Revenue | ||
RB (Build America Bonds) Series 2009 | ||
5.99%, 02/01/39 | 150,000 | 163,756 |
RB Series 2012 | ||
4.43%, 02/01/42 | 200,000 | 188,409 |
City of San Francisco CA Public Utilities Commission Water Revenue | ||
RB (Build America Bonds) Series 2010 | ||
6.95%, 11/01/50 | 150,000 | 187,089 |
Series A | ||
3.30%, 11/01/39(a) | 250,000 | 214,072 |
City of Tucson AZ | ||
Series A, (AGM) | ||
2.86%, 07/01/47 | 650,000 | 474,265 |
Commonwealth Financing Authority | ||
Series A | ||
4.14%, 06/01/38 | 215,000 | 193,761 |
Commonwealth of Massachusetts | ||
GO (Build America Bonds) Series 2009 | ||
5.46%, 12/01/39 | 100,000 | 105,490 |
GO (Build America Bonds) Series 2010D | ||
4.50%, 08/01/31 | 400,000 | 393,183 |
Series D | ||
2.66%, 09/01/39 | 143,092 | 114,579 |
Series D | ||
2.81%, 09/01/43 | 150,000 | 111,712 |
Series H | ||
2.90%, 09/01/49 | 300,000 | 215,316 |
Commonwealth of Massachusetts Transportation Fund Revenue | ||
RB (Build America Bonds) Series 2010 | ||
5.73%, 06/01/40 | 200,000 | 211,796 |
Connecticut | ||
GO Bonds Series 2008A | ||
5.85%, 03/15/32 | 400,000 | 427,155 |
County of Clark Department of Aviation | ||
RB (Build America Bonds) Series 2010C | ||
6.82%, 07/01/45 | 350,000 | 426,725 |
County of Cook IL | ||
GO (Build America Bonds) Series D | ||
6.23%, 11/15/34 | 50,000 | 54,430 |
County of Miami-Dade FL Water & Sewer System Revenue | ||
Series C | ||
3.49%, 10/01/42 (a) | 150,000 | 122,165 |
Dallas Area Rapid Transit | ||
RB (Build America Bonds) Series 2010 | ||
5.02%, 12/01/48 | 250,000 | 257,610 |
Series B | ||
6.00%, 12/01/44 | 300,000 | 342,148 |
Dallas County Hospital District | ||
GO (Build America Bonds) Series C | ||
5.62%, 08/15/44 | 150,000 | 160,725 |
Dallas Fort Worth International Airport | ||
RB Series 2020C | ||
2.92%, 11/01/50 | 150,000 | 107,871 |
Series A | ||
2.99%, 11/01/38 | 150,000 | 124,636 |
Series A | ||
3.14%, 11/01/45 | 20,000 | 15,320 |
Series C | ||
3.09%, 11/01/40(a) | 160,000 | 126,744 |
SECURITY RATE, MATURITY DATE | FACE AMOUNT ($) | VALUE ($) |
Dallas Independent School District | ||
GO (Build America Bonds) Series 2010C | ||
6.45%, 02/15/35 (a) | 350,000 | 352,635 |
District of Columbia | ||
Series E | ||
5.59%, 12/01/34 | 350,000 | 363,707 |
District of Columbia Water & Sewer Authority | ||
RB Series 2014A | ||
4.81%, 10/01/14 | 185,000 | 172,759 |
East Bay Municipal Utility District Water System Revenue | ||
Water System RB (Build America Bonds) Series 2010 | ||
5.87%, 06/01/40 | 50,000 | 54,884 |
Foothill-Eastern Transportation Corridor Agency | ||
Series A | ||
4.09%, 01/15/49(a) | 100,000 | 82,984 |
Series A | ||
3.92%, 01/15/53(a) | 100,000 | 79,835 |
Golden State Tobacco Securitization Corp. | ||
3.00%, 06/01/46 | 155,000 | 142,764 |
Grand Parkway Transportation Corp. | ||
RB Series 2013E | ||
5.18%, 10/01/42 | 200,000 | 205,330 |
Series B | ||
3.24%, 10/01/52(a) | 300,000 | 219,946 |
Illinois | ||
GO (Build America Bonds) Series 2010 | ||
6.63%, 02/01/35 | 138,461 | 144,543 |
GO (Build America Bonds) Series 2010 | ||
6.73%, 04/01/35 | 115,385 | 120,986 |
GO Bonds (Pension Funding) Series 2003 | ||
5.10%, 06/01/33 | 2,445,000 | 2,399,210 |
JobsOhio Beverage System | ||
RB (Build America Bonds) Series B | ||
3.99%, 01/01/29 | 100,000 | 97,865 |
Series B | ||
4.53%, 01/01/35 | 200,000 | 196,218 |
Los Angeles Community College District | ||
GO (Build America Bonds) Series 2010 | ||
6.75%, 08/01/49 | 85,000 | 106,646 |
GO Bonds Series 2020 | ||
1.61%, 08/01/28 | 125,000 | 109,179 |
GO Bonds Series 2020 | ||
1.81%, 08/01/30 | 200,000 | 167,580 |
GO Bonds Series 2020 | ||
2.11%, 08/01/32(a) | 350,000 | 285,924 |
Los Angeles Department of Water & Power System Revenue | ||
RB (Build America Bonds) Series 2010 | ||
6.57%, 07/01/45 | 250,000 | 299,362 |
Los Angeles Unified School District | ||
GO (Build America Bonds) Series 2009 | ||
5.76%, 07/01/29 | 300,000 | 307,497 |
GO (Build America Bonds) Series 2009 | ||
5.75%, 07/01/34 | 225,000 | 238,726 |
GO (Build America Bonds) Series 2010 | ||
6.76%, 07/01/34 | 450,000 | 508,690 |
Maryland Health & Higher Educational Facilities Authority | ||
RB Series D | ||
3.05%, 07/01/40(a) | 100,000 | 75,302 |
RB Series D | ||
3.20%, 07/01/50 | 100,000 | 70,483 |
SECURITY RATE, MATURITY DATE | FACE AMOUNT ($) | VALUE ($) |
Massachusetts School Building Authority | ||
RB Series B | ||
1.75%, 08/15/30 | 500,000 | 421,063 |
RB Series B | ||
3.40%, 10/15/40(a) | 100,000 | 82,969 |
Metropolitan Government Nashville & Davidson County Health & Educational Facs Bd | ||
RB (Vanderbilt Univ Medical Center) Series 2016 B | ||
4.05%, 07/01/26 (a) | 200,000 | 191,019 |
Metropolitan Transportation Authority | ||
RB (Build America Bonds) Series C | ||
7.34%, 11/15/39 | 350,000 | 435,512 |
RB (Build America Bonds) Series E | ||
6.81%, 11/15/40 | 650,000 | 703,827 |
Metropolitan Water Reclamation District of Greater Chicago | ||
5.72%, 12/01/38 | 250,000 | 266,936 |
Michigan Finance Authority | ||
RB Series 2019 | ||
3.38%, 12/01/40 | 350,000 | 284,971 |
Michigan State Building Authority | ||
RB Series 2020 | ||
2.71%, 10/15/40 (a) | 250,000 | 189,432 |
Missouri Health & Educational Facilities Authority | ||
RB Series 2017A | ||
3.65%, 08/15/57 (a) | 75,000 | 60,644 |
Municipal Electric Authority of Georgia | ||
RB (Build America Bonds) Series 2010 | ||
6.66%, 04/01/57 | 145,000 | 165,168 |
RB (Build America Bonds) Series A | ||
6.64%, 04/01/57 | 237,000 | 270,974 |
New Jersey Economic Development Authority | ||
Series A | ||
7.43%, 02/15/29 | 516,000 | 554,877 |
New Jersey Transportation Trust Fund Authority | ||
RB (Build America Bonds) Series 2010C | ||
5.75%, 12/15/28 | 400,000 | 401,867 |
RB (Build America Bonds) Series B | ||
6.56%, 12/15/40 | 50,000 | 57,641 |
New Jersey Turnpike Authority | ||
RB (Build America Bonds) Series 2009F | ||
7.41%, 01/01/40 | 500,000 | 627,343 |
RB (Build America Bonds) Series 2010A | ||
7.10%, 01/01/41 | 650,000 | 793,480 |
New York City Transitional Finance Authority | ||
RB (Build America Bonds) Series 2011A1 | ||
5.51%, 08/01/37 | 450,000 | 467,708 |
New York City Water & Sewer System | ||
Water System RB (Build America Bonds) | ||
6.01%, 06/15/42 | 250,000 | 282,914 |
Water System RB (Build America Bonds) Series 2009 | ||
5.75%, 06/15/41 | 300,000 | 327,682 |
Water System RB (Build America Bonds) Series 2011CC | ||
5.88%, 06/15/44 | 250,000 | 281,225 |
New York State Dormitory Authority | ||
RB (Build America Bonds) Series 2010 | ||
5.60%, 03/15/40 | 200,000 | 212,415 |
SECURITY RATE, MATURITY DATE | FACE AMOUNT ($) | VALUE ($) |
RB Series 2009F | ||
5.63%, 03/15/39 | 200,000 | 209,809 |
Series B | ||
3.14%, 07/01/43 | 200,000 | 161,311 |
Series F | ||
3.11%, 02/15/39 | 200,000 | 163,949 |
New York State Thruway Authority | ||
Series M | ||
2.90%, 01/01/35 | 150,000 | 125,757 |
New York State Urban Development Corp. | ||
RB (Build America Bonds) Series 2009 | ||
5.77%, 03/15/39 | 185,000 | 193,031 |
North Texas Tollway Authority | ||
RB (Build America Bonds) Series 2009B | ||
6.72%, 01/01/49 | 350,000 | 435,084 |
Ohio State University | ||
RB (Build America Bonds) Series 2010C | ||
4.91%, 06/01/40 | 650,000 | 646,021 |
Series A | ||
3.80%, 12/01/46 | 75,000 | 62,237 |
Ohio Turnpike & Infrastructure Commission | ||
RB Series A | ||
3.22%, 02/15/48 (a) | 100,000 | 73,654 |
Oregon | ||
GO Bonds (Pension Funding) Series 2003 | ||
5.89%, 06/01/27 | 300,000 | 306,046 |
Oregon School Boards Association | ||
Series B | ||
5.55%, 06/30/28 | 500,000 | 503,971 |
Port Authority of New York & New Jersey | ||
Consolidated Bonds 164th Series | ||
5.65%, 11/01/40 | 240,000 | 257,479 |
Consolidated Bonds 165th Series | ||
5.65%, 11/01/40 | 200,000 | 215,273 |
Consolidated Bonds 168th Series | ||
4.93%, 10/01/51 | 650,000 | 651,257 |
Consolidated Bonds 174th Series | ||
4.46%, 10/01/62 | 950,000 | 872,763 |
Consolidated Bonds 181st Series | ||
4.96%, 08/01/46 | 200,000 | 196,137 |
Regents of the University of California Medical Center Pooled Revenue | ||
6.55%, 05/15/48 | 100,000 | 116,266 |
6.58%, 05/15/49 | 200,000 | 234,273 |
Series N | ||
3.01%, 05/15/50(a) | 200,000 | 140,664 |
Regional Transportation District Sales Tax Revenue | ||
Series B | ||
5.84%, 11/01/50 | 200,000 | 228,150 |
Rutgers The State University of New Jersey | ||
Series P | ||
3.92%, 05/01/19(a) | 150,000 | 107,373 |
Series R | ||
3.27%, 05/01/43 | 100,000 | 78,627 |
Sales Tax Securitization Corp. | ||
RB Series 2017B | ||
3.59%, 01/01/43 | 200,000 | 167,068 |
RB Series B | ||
3.82%, 01/01/48 | 250,000 | 201,592 |
Salt River Project Agricultural Improvement & Power District | ||
RB (Build America Bonds) Series 2010 | ||
4.84%, 01/01/41 | 75,000 | 73,979 |
SECURITY RATE, MATURITY DATE | FACE AMOUNT ($) | VALUE ($) |
San Diego County Regional Transportation Commission | ||
RB (Build America Bonds) Series 2010A | ||
5.91%, 04/01/48 | 300,000 | 340,736 |
San Diego County Water Authority | ||
RB (Build America Bonds) Series 2010B | ||
6.14%, 05/01/49 | 350,000 | 396,039 |
San Jose Redevelopment Agency Successor Agency | ||
Series A | ||
3.38%, 08/01/34 (a) | 500,000 | 443,712 |
Santa Clara Valley Transportation Authority | ||
RB (Build America Bonds) Series 2010 | ||
5.88%, 04/01/32 | 140,000 | 145,514 |
State Board of Administration Finance Corp. | ||
Series A | ||
1.26%, 07/01/25 | 350,000 | 323,268 |
Series A | ||
1.71%, 07/01/27 | 350,000 | 309,043 |
Series A | ||
2.15%, 07/01/30 | 350,000 | 292,446 |
State of California | ||
2.38%, 10/01/26 | 175,000 | 161,948 |
7.63%, 03/01/40 | 100,000 | 125,416 |
GO Bonds | ||
7.60%, 11/01/40 | 300,000 | 383,592 |
State of Illinois | ||
GO (Build America Bonds) Series 2010 | ||
7.35%, 07/01/35 | 139,286 | 149,601 |
State of Oregon Department of Transportation | ||
RB (Build America Bonds) Series 2010A | ||
5.83%, 11/15/34 | 125,000 | 136,935 |
Texas | ||
GO (Build America Bonds) Series 2010A | ||
4.68%, 04/01/40 | 500,000 | 497,069 |
GO Mobility Fund Bonds (Build America Bonds) Series 2009A | ||
5.52%, 04/01/39 | 500,000 | 538,215 |
Texas Private Activity Bond Surface Transportation Corp. | ||
RB Series B | ||
3.92%, 12/31/49 | 350,000 | 283,108 |
Texas Transportation Commission | ||
GO Bonds Series 2020 | ||
2.47%, 10/01/44(a) | 350,000 | 248,697 |
RB (Build America Bonds) Series B | ||
5.18%, 04/01/30 | 130,000 | 131,790 |
University of California | ||
RB (Build America Bonds) Series 2009 | ||
5.77%, 05/15/43 | 300,000 | 320,722 |
RB Series 2015AQ | ||
4.77%, 05/15/15 | 300,000 | 264,552 |
RB Series AD | ||
4.86%, 05/15/12 | 400,000 | 358,381 |
RB Series AS | ||
5.95%, 05/15/45 | 250,000 | 272,006 |
RB Series BG | ||
1.61%, 05/15/30(a) | 250,000 | 205,350 |
RB Series BJ | ||
3.07%, 05/15/51(a) | 250,000 | 175,962 |
University of Michigan | ||
Series B | ||
2.44%, 04/01/40 (a) | 250,000 | 187,357 |
SECURITY RATE, MATURITY DATE | FACE AMOUNT ($) | VALUE ($) |
University of Pittsburgh-of the Commonwealth System of Higher Education | ||
RB Series 2019A | ||
3.56%, 09/15/19 (a) | 250,000 | 170,443 |
University of Texas System | ||
RB (Build America Bonds) Series C | ||
4.79%, 08/15/46 | 50,000 | 50,031 |
University of Virginia | ||
General Revenue Pledge and Refunding Bonds, Series 2020 | ||
2.26%, 09/01/50(a) | 400,000 | 247,882 |
Series B | ||
2.58%, 11/01/51(a) | 250,000 | 165,424 |
Series C | ||
4.18%, 09/01/17(a) | 150,000 | 121,228 |
Utah | ||
GO (Build America Bonds) Series B | ||
3.54%, 07/01/25 | 165,165 | 160,253 |
GO (Build America Bonds) Series D | ||
4.55%, 07/01/24 | 130,000 | 128,345 |
Westchester County Local Development Corp. | ||
RB Series 2020 | ||
3.85%, 11/01/50 (a) | 250,000 | 179,295 |
Wisconsin | ||
RB Series A | ||
5.70%, 05/01/26 | 280,000 | 282,232 |
41,851,183 | ||
56,755,671 | ||
Sovereign 1.0% | ||
Canada 0.0% | ||
Canada Government International Bond | ||
1.63%, 01/22/25 | 1,150,000 | 1,090,453 |
2.88%, 04/28/25 | 750,000 | 722,400 |
0.75%, 05/19/26 | 850,000 | 762,918 |
3.75%, 04/26/28 | 1,000,000 | 979,580 |
3,555,351 | ||
Chile 0.1% | ||
Chile Government International Bond | ||
3.13%, 03/27/25 | 200,000 | 194,018 |
3.13%, 01/21/26 | 200,000 | 191,820 |
2.75%, 01/31/27(a) | 500,000 | 464,695 |
3.24%, 02/06/28(a) | 550,000 | 517,654 |
2.45%, 01/31/31(a) | 750,000 | 648,532 |
2.55%, 01/27/32(a) | 600,000 | 514,242 |
2.55%, 07/27/33(a) | 500,000 | 409,670 |
3.50%, 01/31/34(a) | 500,000 | 441,665 |
3.10%, 05/07/41(a) | 400,000 | 302,076 |
4.34%, 03/07/42(a) | 250,000 | 222,815 |
3.63%, 10/30/42 | 100,000 | 81,208 |
3.86%, 06/21/47 | 450,000 | 370,238 |
3.50%, 01/25/50(a) | 750,000 | 565,912 |
4.00%, 01/31/52(a) | 350,000 | 286,780 |
3.10%, 01/22/61(a) | 650,000 | 426,862 |
3.25%, 09/21/71(a) | 350,000 | 228,396 |
5,866,583 | ||
Hungary 0.0% | ||
Hungary Government International Bond | ||
7.63%, 03/29/41 | 400,000 | 453,384 |
SECURITY RATE, MATURITY DATE | FACE AMOUNT ($) | VALUE ($) |
Indonesia 0.1% | ||
Indonesia Government International Bond | ||
3.50%, 01/11/28 | 600,000 | 566,934 |
4.10%, 04/24/28 | 250,000 | 241,858 |
4.75%, 02/11/29 | 400,000 | 398,964 |
3.40%, 09/18/29 | 200,000 | 185,102 |
2.85%, 02/14/30 | 600,000 | 534,696 |
3.85%, 10/15/30 | 550,000 | 517,858 |
1.85%, 03/12/31 | 425,000 | 344,267 |
3.55%, 03/31/32(a) | 350,000 | 317,961 |
4.35%, 01/11/48 | 700,000 | 623,917 |
5.35%, 02/11/49 | 300,000 | 304,107 |
3.70%, 10/30/49 | 200,000 | 160,040 |
3.50%, 02/14/50(f) | 500,000 | 383,610 |
4.20%, 10/15/50 | 1,000,000 | 857,710 |
3.05%, 03/12/51 | 350,000 | 257,348 |
4.45%, 04/15/70 | 450,000 | 384,489 |
3.35%, 03/12/71 | 550,000 | 381,865 |
6,460,726 | ||
Israel 0.1% | ||
Israel Government International Bond | ||
2.88%, 03/16/26 | 600,000 | 569,070 |
3.25%, 01/17/28 | 300,000 | 280,890 |
2.50%, 01/15/30 | 400,000 | 350,476 |
2.75%, 07/03/30 | 1,050,000 | 929,177 |
4.50%, 01/30/43 | 400,000 | 368,492 |
4.13%, 01/17/48 | 250,000 | 214,890 |
3.38%, 01/15/50 | 600,000 | 453,114 |
3.88%, 07/03/50 | 650,000 | 536,575 |
4.50%, 04/03/20 | 300,000 | 243,714 |
3,946,398 | ||
Italy 0.1% | ||
Italy Government International Bond | ||
2.38%, 10/17/24 | 1,200,000 | 1,147,608 |
1.25%, 02/17/26 | 800,000 | 715,416 |
2.88%, 10/17/29 | 700,000 | 611,996 |
5.38%, 06/15/33 | 604,000 | 605,703 |
4.00%, 10/17/49 | 735,000 | 559,776 |
3.88%, 05/06/51 | 450,000 | 327,609 |
3,968,108 | ||
Mexico 0.2% | ||
Mexico Government International Bond | ||
3.90%, 04/27/25(a)(f) | 200,000 | 196,964 |
4.13%, 01/21/26 | 700,000 | 687,918 |
4.15%, 03/28/27 | 800,000 | 784,952 |
3.75%, 01/11/28 | 650,000 | 619,404 |
4.50%, 04/22/29 | 1,350,000 | 1,312,902 |
3.25%, 04/16/30(a) | 800,000 | 713,880 |
2.66%, 05/24/31(a) | 1,050,000 | 875,122 |
8.30%, 08/15/31 | 450,000 | 532,665 |
4.75%, 04/27/32(a) | 850,000 | 812,974 |
7.50%, 04/08/33 | 250,000 | 284,668 |
3.50%, 02/12/34(a) | 675,000 | 566,845 |
6.75%, 09/27/34 | 650,000 | 709,072 |
6.05%, 01/11/40 | 850,000 | 865,181 |
4.28%, 08/14/41(a) | 750,000 | 621,210 |
4.75%, 03/08/44 | 1,475,000 | 1,269,813 |
5.55%, 01/21/45 | 850,000 | 814,070 |
4.60%, 01/23/46 | 800,000 | 667,648 |
4.35%, 01/15/47 | 450,000 | 361,832 |
4.60%, 02/10/48 | 700,000 | 578,074 |
4.50%, 01/31/50(a) | 725,000 | 593,253 |
SECURITY RATE, MATURITY DATE | FACE AMOUNT ($) | VALUE ($) |
5.00%, 04/27/51(a) | 1,000,000 | 870,590 |
3.77%, 05/24/61(a) | 1,075,000 | 733,892 |
5.75%, 10/12/10 | 1,050,000 | 940,842 |
16,413,771 | ||
Panama 0.1% | ||
Panama Government International Bond | ||
3.75%, 03/16/25(a) | 500,000 | 484,960 |
7.13%, 01/29/26 | 350,000 | 365,498 |
8.88%, 09/30/27 | 625,000 | 717,525 |
3.88%, 03/17/28(a) | 400,000 | 379,192 |
9.38%, 04/01/29 | 300,000 | 361,809 |
3.16%, 01/23/30(a) | 625,000 | 548,625 |
2.25%, 09/29/32(a) | 1,150,000 | 881,003 |
6.70%, 01/26/36 | 650,000 | 696,807 |
4.50%, 05/15/47 | 400,000 | 319,480 |
4.50%, 04/16/50(a) | 800,000 | 621,816 |
4.30%, 04/29/53 | 600,000 | 448,074 |
4.50%, 04/01/56(a) | 1,050,000 | 788,308 |
3.87%, 07/23/60(a) | 725,000 | 481,654 |
4.50%, 01/19/63(a) | 275,000 | 201,902 |
7,296,653 | ||
Peru 0.1% | ||
Peruvian Government International Bond | ||
7.35%, 07/21/25 | 100,000 | 103,797 |
4.13%, 08/25/27 | 325,000 | 317,219 |
2.84%, 06/20/30 | 250,000 | 219,248 |
2.78%, 01/23/31(a) | 1,200,000 | 1,030,476 |
1.86%, 12/01/32(a) | 425,000 | 328,108 |
8.75%, 11/21/33 | 450,000 | 570,933 |
3.00%, 01/15/34(a) | 500,000 | 415,870 |
6.55%, 03/14/37 | 350,000 | 393,169 |
3.30%, 03/11/41(a) | 250,000 | 192,823 |
5.63%, 11/18/50 | 700,000 | 719,572 |
3.55%, 03/10/51(a) | 400,000 | 299,472 |
2.78%, 12/01/60(a) | 650,000 | 397,130 |
3.60%, 01/15/72(a) | 350,000 | 237,731 |
3.23%, 07/28/21(a) | 350,000 | 211,428 |
5,436,976 | ||
Philippines 0.1% | ||
Philippine Government International Bond | ||
10.63%, 03/16/25 | 500,000 | 548,415 |
5.50%, 03/30/26 | 400,000 | 408,444 |
3.00%, 02/01/28 | 650,000 | 605,163 |
4.63%, 07/17/28 | 200,000 | 200,790 |
3.75%, 01/14/29 | 400,000 | 382,892 |
9.50%, 02/02/30 | 975,000 | 1,230,674 |
2.46%, 05/05/30 | 350,000 | 303,132 |
7.75%, 01/14/31 | 750,000 | 888,285 |
1.65%, 06/10/31 | 400,000 | 317,976 |
6.38%, 01/15/32 | 350,000 | 390,274 |
5.00%, 07/17/33 | 200,000 | 203,612 |
6.38%, 10/23/34 | 700,000 | 784,112 |
5.00%, 01/13/37 | 500,000 | 500,435 |
3.95%, 01/20/40 | 725,000 | 630,163 |
3.70%, 03/01/41 | 500,000 | 416,455 |
3.70%, 02/02/42 | 850,000 | 707,973 |
2.95%, 05/05/45 | 700,000 | 504,490 |
2.65%, 12/10/45 | 800,000 | 542,992 |
4.20%, 03/29/47 | 100,000 | 86,328 |
5.95%, 10/13/47 | 250,000 | 274,368 |
9,926,973 | ||
SECURITY RATE, MATURITY DATE | FACE AMOUNT ($) | VALUE ($) |
Poland 0.0% | ||
Republic of Poland Government International Bond | ||
3.25%, 04/06/26 | 1,144,000 | 1,102,816 |
5.75%, 11/16/32(a) | 475,000 | 499,144 |
4.88%, 10/04/33(a) | 700,000 | 688,793 |
5.50%, 04/04/53(a) | 750,000 | 758,415 |
3,049,168 | ||
Republic of Korea 0.0% | ||
Korea International Bond | ||
2.75%, 01/19/27 | 250,000 | 235,927 |
3.50%, 09/20/28 | 200,000 | 191,308 |
2.50%, 06/19/29 | 475,000 | 428,493 |
1.00%, 09/16/30 | 200,000 | 161,536 |
1.75%, 10/15/31 | 200,000 | 166,932 |
3.88%, 09/20/48 | 200,000 | 179,924 |
1,364,120 | ||
Uruguay 0.1% | ||
Uruguay Government International Bond | ||
4.50%, 08/14/24 | 133,334 | 133,163 |
4.38%, 10/27/27 | 650,000 | 646,353 |
4.38%, 01/23/31(a) | 800,000 | 790,376 |
5.75%, 10/28/34(a) | 50,000 | 54,263 |
7.63%, 03/21/36 | 425,000 | 525,445 |
4.13%, 11/20/45 | 250,000 | 227,725 |
5.10%, 06/18/50 | 1,000,000 | 1,000,480 |
4.98%, 04/20/55 | 850,000 | 830,594 |
4,208,399 | ||
71,946,610 | ||
Supranational* 1.3% | ||
African Development Bank | ||
3.38%, 07/07/25 | 300,000 | 291,342 |
0.88%, 03/23/26 | 100,000 | 90,382 |
0.88%, 07/22/26 | 900,000 | 804,321 |
4.38%, 11/03/27 | 500,000 | 500,585 |
4.38%, 03/14/28 | 575,000 | 576,691 |
Arab Petroleum Investments Corp. | ||
1.48%, 10/06/26 (c) | 125,000 | 111,998 |
Asian Development Bank | ||
0.63%, 10/08/24 | 650,000 | 612,742 |
1.50%, 10/18/24 | 1,700,000 | 1,619,403 |
2.00%, 01/22/25 | 1,650,000 | 1,572,235 |
0.63%, 04/29/25 | 1,200,000 | 1,108,500 |
0.38%, 09/03/25 | 950,000 | 863,958 |
4.25%, 01/09/26 | 1,000,000 | 989,530 |
0.50%, 02/04/26 | 1,150,000 | 1,034,425 |
1.00%, 04/14/26 | 770,000 | 697,866 |
2.00%, 04/24/26 | 500,000 | 465,890 |
2.63%, 01/12/27 | 1,000,000 | 939,810 |
1.50%, 01/20/27 | 1,250,000 | 1,128,550 |
3.13%, 08/20/27 | 500,000 | 477,680 |
2.50%, 11/02/27 | 1,238,000 | 1,150,436 |
2.75%, 01/19/28 | 525,000 | 492,340 |
3.75%, 04/25/28 | 250,000 | 244,495 |
1.25%, 06/09/28 | 300,000 | 260,142 |
5.82%, 06/16/28 | 395,000 | 420,549 |
1.88%, 03/15/29 | 550,000 | 484,842 |
1.75%, 09/19/29 | 1,150,000 | 1,000,017 |
1.88%, 01/24/30 | 1,000,000 | 870,500 |
0.75%, 10/08/30 | 1,150,000 | 909,776 |
1.50%, 03/04/31 | 500,000 | 416,060 |
3.13%, 04/27/32 | 200,000 | 187,274 |
SECURITY RATE, MATURITY DATE | FACE AMOUNT ($) | VALUE ($) |
3.88%, 09/28/32 | 500,000 | 495,185 |
4.00%, 01/12/33 | 300,000 | 299,949 |
Asian Infrastructure Investment Bank | ||
0.50%, 10/30/24 | 1,050,000 | 984,385 |
0.50%, 05/28/25 | 950,000 | 869,886 |
0.50%, 01/27/26 | 1,225,000 | 1,096,693 |
Corp. Andina de Fomento | ||
1.25%, 10/26/24 | 100,000 | 94,090 |
1.63%, 09/23/25 | 1,000,000 | 921,440 |
5.25%, 11/21/25 | 100,000 | 99,497 |
2.25%, 02/08/27 | 200,000 | 179,894 |
Council of Europe Development Bank | ||
1.38%, 02/27/25 | 350,000 | 329,438 |
3.00%, 06/16/25 | 525,000 | 504,950 |
0.88%, 09/22/26 | 525,000 | 466,783 |
European Bank for Reconstruction & Development | ||
1.63%, 09/27/24 | 300,000 | 286,776 |
0.50%, 05/19/25 | 900,000 | 827,649 |
0.50%, 11/25/25 | 700,000 | 633,647 |
0.50%, 01/28/26 | 850,000 | 765,714 |
4.38%, 03/09/28 | 750,000 | 753,645 |
European Investment Bank | ||
3.13%, 12/14/23 | 250,000 | 247,485 |
2.50%, 10/15/24 | 500,000 | 482,680 |
1.88%, 02/10/25 | 1,200,000 | 1,140,408 |
1.63%, 03/14/25 | 1,550,000 | 1,463,773 |
0.63%, 07/25/25 | 1,075,000 | 987,108 |
0.38%, 03/26/26 | 1,525,000 | 1,361,184 |
2.13%, 04/13/26 | 800,000 | 748,640 |
0.75%, 10/26/26 | 625,000 | 553,444 |
1.38%, 03/15/27 | 1,425,000 | 1,277,698 |
2.38%, 05/24/27 | 667,000 | 618,589 |
0.63%, 10/21/27 | 225,000 | 193,124 |
3.25%, 11/15/27 | 1,000,000 | 960,070 |
3.88%, 03/15/28 | 300,000 | 295,245 |
1.75%, 03/15/29 | 1,050,000 | 920,010 |
1.63%, 10/09/29 | 230,000 | 199,364 |
0.88%, 05/17/30 | 255,000 | 207,006 |
3.63%, 07/15/30 | 1,100,000 | 1,069,112 |
0.75%, 09/23/30 | 300,000 | 239,412 |
1.25%, 02/14/31(f) | 1,900,000 | 1,561,819 |
1.63%, 05/13/31 | 500,000 | 420,975 |
3.75%, 02/14/33 | 1,500,000 | 1,477,950 |
4.88%, 02/15/36 | 450,000 | 485,847 |
Inter-American Development Bank | ||
3.00%, 02/21/24 | 250,000 | 245,945 |
3.25%, 07/01/24 | 575,000 | 562,551 |
0.50%, 09/23/24 | 250,000 | 235,668 |
2.13%, 01/15/25 | 1,400,000 | 1,337,420 |
1.75%, 03/14/25 | 1,350,000 | 1,276,695 |
0.88%, 04/03/25 | 650,000 | 604,617 |
0.63%, 07/15/25 | 750,000 | 688,725 |
0.88%, 04/20/26 | 1,325,000 | 1,195,706 |
2.00%, 06/02/26 | 550,000 | 511,022 |
2.00%, 07/23/26 | 700,000 | 648,564 |
2.38%, 07/07/27 | 1,200,000 | 1,114,548 |
0.63%, 09/16/27 | 750,000 | 644,858 |
1.13%, 07/20/28 | 750,000 | 643,463 |
3.13%, 09/18/28 | 1,700,000 | 1,607,758 |
2.25%, 06/18/29 | 1,400,000 | 1,253,518 |
1.13%, 01/13/31 | 550,000 | 445,055 |
3.50%, 04/12/33 | 750,000 | 720,292 |
3.88%, 10/28/41 | 150,000 | 141,611 |
3.20%, 08/07/42 | 200,000 | 170,480 |
4.38%, 01/24/44 | 350,000 | 352,090 |
SECURITY RATE, MATURITY DATE | FACE AMOUNT ($) | VALUE ($) |
Inter-American Investment Corp. | ||
2.63%, 04/22/25 | 500,000 | 477,800 |
4.13%, 02/15/28 | 500,000 | 492,665 |
International Bank for Reconstruction & Development | ||
1.50%, 08/28/24 | 1,375,000 | 1,315,627 |
2.50%, 11/25/24 | 1,400,000 | 1,348,508 |
1.63%, 01/15/25 | 1,550,000 | 1,469,865 |
0.75%, 03/11/25 | 1,650,000 | 1,535,275 |
0.63%, 04/22/25 | 2,825,000 | 2,611,995 |
0.38%, 07/28/25 | 200,000 | 182,606 |
2.50%, 07/29/25 | 2,075,000 | 1,979,965 |
0.50%, 10/28/25 | 2,150,000 | 1,952,157 |
3.13%, 11/20/25 | 450,000 | 433,949 |
0.88%, 07/15/26 | 750,000 | 671,962 |
1.88%, 10/27/26 | 250,000 | 229,673 |
3.13%, 06/15/27 | 500,000 | 476,670 |
2.50%, 11/22/27 | 500,000 | 464,450 |
0.75%, 11/24/27 | 1,850,000 | 1,590,149 |
1.38%, 04/20/28 | 1,525,000 | 1,335,946 |
3.50%, 07/12/28 | 1,000,000 | 965,880 |
1.13%, 09/13/28 | 1,000,000 | 855,050 |
3.63%, 09/21/29 | 25,000 | 24,292 |
1.75%, 10/23/29 | 1,050,000 | 911,263 |
3.88%, 02/14/30 | 250,000 | 246,290 |
0.88%, 05/14/30 | 2,000,000 | 1,614,300 |
0.75%, 08/26/30 | 1,200,000 | 951,936 |
1.25%, 02/10/31 | 1,225,000 | 1,000,629 |
1.63%, 11/03/31 | 1,200,000 | 1,004,820 |
2.50%, 03/29/32 | 1,000,000 | 894,590 |
4.75%, 02/15/35 | 450,000 | 472,824 |
International Finance Corp. | ||
1.38%, 10/16/24 | 750,000 | 713,475 |
0.38%, 07/16/25 | 650,000 | 594,737 |
3.63%, 09/15/25 | 400,000 | 390,668 |
2.13%, 04/07/26 | 50,000 | 46,770 |
0.75%, 10/08/26 | 100,000 | 88,595 |
0.75%, 08/27/30 | 1,050,000 | 833,479 |
Nordic Investment Bank | ||
2.63%, 04/04/25 | 500,000 | 479,475 |
0.38%, 09/11/25 | 550,000 | 500,038 |
0.50%, 01/21/26 | 250,000 | 225,208 |
3.38%, 09/08/27 | 150,000 | 144,752 |
92,771,822 | ||
Total Government Related (Cost $386,353,747) | 347,741,450 | |
SECURITIZED 29.0% OF NET ASSETS | ||
Asset-Backed Securities 0.1% | ||
Auto Backed 0.0% | ||
Ally Auto Receivables Trust 2019-4 | ||
Series 2019-4, Class A4 | ||
1.92%, 01/15/25 (a) | 957,531 | 956,577 |
Credit Card 0.1% | ||
Capital One Multi-Asset Execution Trust | ||
Series 2019-A3, Class A3 | ||
2.06%, 08/15/28 (a) | 2,000,000 | 1,826,636 |
Electric 0.0% | ||
PG&E Wildfire Recovery Funding LLC | ||
3.59%, 06/01/30 | 132,193 | 125,356 |
4.26%, 06/01/36 | 150,000 | 143,377 |
SECURITY RATE, MATURITY DATE | FACE AMOUNT ($) | VALUE ($) |
4.45%, 12/01/47 | 400,000 | 359,948 |
4.67%, 12/01/51 | 275,000 | 257,689 |
886,370 | ||
Utilities 0.0% | ||
Duke Energy Florida Project Finance LLC | ||
2.54%, 09/01/29 | 414,309 | 376,702 |
Duke Energy Progress NC Storm Funding LLC | ||
2.39%, 07/01/37 | 125,000 | 99,586 |
PG&E Energy Recovery Funding LLC | ||
2.82%, 07/15/46 | 100,000 | 71,093 |
PG&E Wildfire Recovery Funding LLC | ||
4.38%, 06/01/39 | 125,000 | 115,875 |
5.10%, 06/01/52 | 300,000 | 304,308 |
967,564 | ||
4,637,147 | ||
Commercial Mortgage-Backed Security 2.1% | ||
BANK | ||
Series 2017-BNK7, Class A5 | ||
3.44%, 09/15/60(a) | 1,000,000 | 916,531 |
Series 2017-BNK8, Class A4 | ||
3.49%, 11/15/50(a) | 600,000 | 546,120 |
Series 2017-BNK9, Class A4 | ||
3.54%, 11/15/54(a) | 1,000,000 | 917,862 |
Series 2019-BN19, Class A3 | ||
3.18%, 08/15/61(a) | 800,000 | 689,381 |
Series 2020-BN26, Class A4 | ||
2.40%, 03/15/63(a) | 700,000 | 582,102 |
BBCMS Mortgage Trust | ||
Series 2018-C2, Class A4 | ||
4.05%, 12/15/51(a) | 1,150,000 | 1,064,221 |
Series 2022-C15, Class A5 | ||
3.66%, 04/15/55(a) | 3,145,000 | 2,792,521 |
Benchmark Mortgage Trust | ||
Series 2019-B12, Class A5 | ||
3.12%, 08/15/52(a) | 1,875,000 | 1,639,102 |
Series 2019-B13, Class A4 | ||
2.95%, 08/15/57(a) | 2,600,000 | 2,244,163 |
Series 2019-B9, Class A5 | ||
4.02%, 03/15/52(a) | 2,600,000 | 2,360,071 |
Series 2020-B16, Class A5 | ||
2.73%, 02/15/53(a) | 1,073,000 | 909,416 |
Series 2020-B18, Class A5 | ||
1.93%, 07/15/53(a) | 1,845,000 | 1,444,654 |
CCUBS Commercial Mortgage Trust | ||
Series 2017-C1, Class A4 | ||
3.54%, 11/15/50 (a) | 1,747,000 | 1,591,475 |
CD Mortgage Trust | ||
Series 2017-CD3, Class A4 | ||
3.63%, 02/10/50 (a) | 1,715,000 | 1,562,544 |
CFCRE Commercial Mortgage Trust | ||
Series 2016-C3, Class A3 | ||
3.87%, 01/10/48(a) | 5,325,000 | 5,028,271 |
Series 2016-C4, Class A4 | ||
3.28%, 05/10/58(a) | 1,000,000 | 926,419 |
Series 2016-C7, Class A3 | ||
3.84%, 12/10/54(a) | 3,625,000 | 3,381,416 |
Citigroup Commercial Mortgage Trust | ||
Series 2013-GC17, Class A4 | ||
4.13%, 11/10/46(a) | 615,000 | 609,953 |
Series 2014-GC23, Class A4 | ||
3.62%, 07/10/47(a) | 1,000,000 | 969,638 |
SECURITY RATE, MATURITY DATE | FACE AMOUNT ($) | VALUE ($) |
Series 2014-GC25, Class A4 | ||
3.64%, 10/10/47(a) | 210,000 | 201,942 |
Series 2016-GC36, Class A5 | ||
3.62%, 02/10/49(a) | 3,350,000 | 3,129,865 |
Series 2016-GC37, Class A4 | ||
3.31%, 04/10/49(a) | 600,000 | 558,649 |
Series 2017-C4, Class A4 | ||
3.47%, 10/12/50(a) | 5,600,000 | 5,124,136 |
Series 2017-P7, Class A4 | ||
3.71%, 04/14/50(a) | 500,000 | 459,804 |
COMM Mortgage Trust | ||
Series 2014-CR14, Class A3 | ||
3.96%, 02/10/47(a) | 240,000 | 238,816 |
Series 2014-CR16, Class ASB | ||
3.65%, 04/10/47(a) | 56,164 | 55,782 |
Series 2014-CR19, Class ASB | ||
3.50%, 08/10/47(a) | 100,295 | 98,732 |
Series 2014-CR21, Class A3 | ||
3.53%, 12/10/47(a) | 160,399 | 154,400 |
Series 2014-LC15, Class A4 | ||
4.01%, 04/10/47(a) | 400,000 | 394,432 |
Series 2015-CR22, Class A5 | ||
3.31%, 03/10/48(a) | 750,000 | 713,623 |
Series 2015-CR24, Class A5 | ||
3.70%, 08/10/48(a) | 400,000 | 379,874 |
Series 2015-LC23, Class A4 | ||
3.77%, 10/10/48(a) | 440,000 | 416,579 |
Series 2015-PC1, Class A5 | ||
3.90%, 07/10/50(a) | 497,400 | 475,175 |
Series 2016-CR28, Class A4 | ||
3.76%, 02/10/49(a) | 2,700,000 | 2,553,514 |
Series 2016-DC2, Class A5 | ||
3.77%, 02/10/49(a) | 100,000 | 94,324 |
CSAIL Commercial Mortgage Trust | ||
Series 2015-C1, Class A4 | ||
3.51%, 04/15/50(a) | 1,308,000 | 1,247,564 |
Series 2015-C3, Class A4 | ||
3.72%, 08/15/48(a) | 300,000 | 284,303 |
Series 2019-C17, Class A5 | ||
3.02%, 09/15/52(a) | 2,238,000 | 1,932,165 |
CSMC Trust | ||
Series 2016-NXSR, Class A4 | ||
3.79%, 12/15/49 (a)(j) | 100,000 | 93,507 |
Fannie Mae | ||
Series 2015-M13, Class A2 | ||
2.79%, 06/25/25(a)(j) | 101,201 | 96,720 |
Series 2015-M3, Class A2 | ||
2.72%, 10/25/24(a) | 364,829 | 351,949 |
Series 2016-M6, Class A2 | ||
2.49%, 05/25/26(a) | 2,254,079 | 2,114,125 |
Freddie Mac | ||
Series K042, Class A2 | ||
2.67%, 12/25/24(a) | 100,000 | 96,122 |
Series K046, Class A2 | ||
3.21%, 03/25/25(a) | 920,000 | 887,589 |
Series K048, Class A2 | ||
3.28%, 06/25/25(a)(j) | 838,000 | 808,630 |
Series K053, Class A2 | ||
3.00%, 12/25/25(a) | 950,000 | 905,553 |
Series K054, Class A2 | ||
2.75%, 01/25/26(a) | 300,000 | 283,964 |
Series K055, Class A2 | ||
2.67%, 03/25/26(a) | 750,000 | 706,817 |
Series K058, Class A2 | ||
2.65%, 08/25/26(a) | 750,000 | 702,599 |
Series K061, Class A2 | ||
3.35%, 11/25/26(a)(j) | 520,000 | 496,687 |
SECURITY RATE, MATURITY DATE | FACE AMOUNT ($) | VALUE ($) |
Series K062, Class A2 | ||
3.41%, 12/25/26(a) | 257,767 | 246,400 |
Series K064, Class A2 | ||
3.22%, 03/25/27(a) | 107,000 | 101,521 |
Series K070, Class A2 | ||
3.30%, 11/25/27(a)(j) | 308,000 | 291,823 |
Series K071, Class A2 | ||
3.29%, 11/25/27(a) | 4,768,000 | 4,513,118 |
Series K072, Class A2 | ||
3.44%, 12/25/27(a) | 1,500,000 | 1,428,786 |
Series K074, Class A2 | ||
3.60%, 01/25/28(a) | 8,175,000 | 7,836,245 |
Series K078, Class A2 | ||
3.85%, 06/25/28(a) | 1,183,000 | 1,146,254 |
Series K083, Class A2 | ||
4.05%, 09/25/28(a)(j) | 2,100,000 | 2,050,150 |
Series K084, Class A2 | ||
3.78%, 10/25/28(a)(j) | 2,000,000 | 1,920,557 |
Series K085, Class A2 | ||
4.06%, 10/25/28(a)(j) | 900,000 | 875,789 |
Series K087, Class A2 | ||
3.77%, 12/25/28(a) | 2,560,000 | 2,463,310 |
Series K088, Class A2 | ||
3.69%, 01/25/29(a) | 2,600,000 | 2,490,021 |
Series K089, Class A2 | ||
3.56%, 01/25/29(a) | 2,990,000 | 2,844,955 |
Series K091, Class A2 | ||
3.51%, 03/25/29(a) | 800,000 | 758,658 |
Series K098, Class A2 | ||
2.43%, 08/25/29(a) | 500,000 | 443,976 |
Series K100, Class A2 | ||
2.67%, 09/25/29(a) | 800,000 | 718,791 |
Series K103, Class A2 | ||
2.65%, 11/25/29(a) | 2,200,000 | 1,970,241 |
Series K112, Class A2 | ||
1.31%, 05/25/30(a) | 2,000,000 | 1,622,573 |
Series K131, Class A2 | ||
1.85%, 07/25/31(a) | 1,000,000 | 822,542 |
Series K132, Class A2 | ||
2.02%, 08/25/31(a) | 1,000,000 | 830,190 |
Series K-1511, Class A2 | ||
3.47%, 03/25/31(a) | 500,000 | 465,869 |
Series K-1512, Class A2 | ||
2.99%, 05/25/31(a) | 1,425,000 | 1,286,180 |
Series K154, Class A2 | ||
3.42%, 04/25/32(a) | 1,760,000 | 1,659,076 |
Series K155, Class A3 | ||
3.75%, 04/25/33(a) | 835,000 | 788,149 |
Series K157, Class A2 | ||
3.99%, 05/25/33(a) | 1,700,000 | 1,639,290 |
Series K733, Class A2 | ||
3.75%, 08/25/25(a)(j) | 1,494,815 | 1,450,743 |
Series K735, Class A2 | ||
2.86%, 05/25/26(a) | 98,708 | 93,388 |
Series K742, Class A2 | ||
1.76%, 03/25/28(a) | 700,000 | 617,752 |
Series KS03, Class A4 | ||
3.16%, 05/25/25(a)(j) | 250,000 | 241,496 |
Freddie Mac Multifamily Structured Pass Through Certificates | ||
1.72%, 06/25/31 (a) | 3,500,000 | 2,852,924 |
GS Mortgage Securities Trust | ||
Series 2013-GC13, Class A5 | ||
4.09%, 07/10/46(a)(j) | 319,803 | 317,520 |
Series 2013-GC14, Class A5 | ||
4.24%, 08/10/46(a) | 470,193 | 468,505 |
Series 2016-GS4, Class A4 | ||
3.44%, 11/10/49(a) | 365,000 | 336,854 |
SECURITY RATE, MATURITY DATE | FACE AMOUNT ($) | VALUE ($) |
Series 2020-GC45, Class A5 | ||
2.91%, 02/13/53(a) | 3,500,000 | 2,987,851 |
JP Morgan Chase Commercial Mortgage Securities Trust | ||
Series 2014-C20, Class A4A1 | ||
3.54%, 07/15/47(a) | 137,684 | 134,755 |
Series 2015-JP1, Class A4 | ||
3.65%, 01/15/49(a) | 600,000 | 566,645 |
JPMBB Commercial Mortgage Securities Trust | ||
Series 2015-C28, Class A4 | ||
3.23%, 10/15/48(a) | 2,000,000 | 1,887,062 |
Series 2015-C29, Class A4 | ||
3.61%, 05/15/48(a) | 1,000,000 | 945,798 |
Series 2015-C33, Class A4 | ||
3.77%, 12/15/48(a) | 1,150,000 | 1,087,471 |
Morgan Stanley Bank of America Merrill Lynch Trust | ||
Series 2013-C11, Class A4 | ||
4.28%, 08/15/46(a)(j) | 1,000,000 | 995,740 |
Series 2014-C16, Class A5 | ||
3.89%, 06/15/47(a) | 270,000 | 264,250 |
Series 2015-C24, Class A4 | ||
3.73%, 05/15/48(a) | 93,000 | 88,318 |
Series 2015-C24, Class ASB | ||
3.48%, 05/15/48(a) | 408,660 | 396,517 |
Morgan Stanley Capital I Trust | ||
Series 2015-UBS8, Class A4 | ||
3.81%, 12/15/48(a) | 400,000 | 375,804 |
Series 2017-H1, Class A4 | ||
3.26%, 06/15/50(a) | 250,000 | 229,374 |
Series 2017-HR2, Class A4 | ||
3.59%, 12/15/50(a) | 1,300,000 | 1,184,743 |
Series 2020-HR8, Class A4 | ||
2.04%, 07/15/53(a) | 3,000,000 | 2,403,916 |
UBS Commercial Mortgage Trust | ||
Series 2017-C3, Class A4 | ||
3.43%, 08/15/50(a) | 1,550,000 | 1,421,519 |
Series 2017-C6, Class A5 | ||
3.58%, 12/15/50(a) | 1,000,000 | 897,251 |
Series 2019-C18, Class A4 | ||
3.04%, 12/15/52(a) | 500,000 | 430,115 |
Wells Fargo Commercial Mortgage Trust | ||
Series 2013-LC12, Class A4 | ||
4.22%, 07/15/46(a)(j) | 59,474 | 59,229 |
Series 2014-LC16 Class A4 | ||
3.55%, 08/15/50(a) | 361,111 | 353,975 |
Series 2015-C28, Class A3 | ||
3.29%, 05/15/48(a) | 971,679 | 922,028 |
Series 2015-C30, Class A4 | ||
3.66%, 09/15/58(a) | 723,000 | 684,668 |
Series 2015-C31, Class A3 | ||
3.43%, 11/15/48(a) | 1,188,128 | 1,135,562 |
Series 2015-NXS4, Class A4 | ||
3.72%, 12/15/48(a) | 2,000,000 | 1,891,349 |
Series 2015-P2, Class A4 | ||
3.81%, 12/15/48(a) | 1,500,000 | 1,416,386 |
Series 2016-C32, Class A4 | ||
3.56%, 01/15/59(a) | 500,000 | 470,493 |
Series 2016-NXS5, Class A4 | ||
3.37%, 01/15/59(a) | 1,166,113 | 1,096,503 |
Series 2016-NXS5, Class A6 | ||
3.64%, 01/15/59(a) | 2,000,000 | 1,877,043 |
Series 2016-NXS6, Class A4 | ||
2.92%, 11/15/49(a) | 150,000 | 137,348 |
Series 2017-C40, Class A4 | ||
3.58%, 10/15/50(a) | 1,551,000 | 1,423,627 |
Series 2017-C41, Class A4 | ||
3.47%, 11/15/50(a) | 2,000,000 | 1,823,347 |
SECURITY RATE, MATURITY DATE | FACE AMOUNT ($) | VALUE ($) |
Series 2017-C42, Class A4 | ||
3.59%, 12/15/50(a) | 2,400,000 | 2,172,309 |
Series 2018-C44, Class A5 | ||
4.21%, 05/15/51(a) | 1,500,000 | 1,404,927 |
Series 2018-C47, Class A3 | ||
4.18%, 09/15/61(a) | 1,275,000 | 1,196,403 |
Series 2019-C50, Class A5 | ||
3.73%, 05/15/52(a) | 1,000,000 | 904,858 |
Series 2019-C53, Class A4 | ||
3.04%, 10/15/52(a) | 4,000,000 | 3,463,842 |
Series 2019-C54, Class A4 | ||
3.15%, 12/15/52(a) | 800,000 | 697,099 |
Series 2020-C55, Class A5 | ||
2.73%, 02/15/53(a) | 750,000 | 631,573 |
Series 2020-C58, Class A4 | ||
2.09%, 07/15/53(a) | 3,000,000 | 2,381,789 |
WFRBS Commercial Mortgage Trust | ||
Series 2013-C15, Class A4 | ||
4.15%, 08/15/46(a)(j) | 177,810 | 177,069 |
Series 2014-C19, Class A4 | ||
3.83%, 03/15/47(a) | 46,382 | 45,930 |
146,491,933 | ||
Mortgage-Backed Securities Pass-Through 26.8% | ||
Fannie Mae | ||
1.00%, 03/01/36 to 07/01/36 (a) | 1,368,461 | 1,159,680 |
1.50%, 09/01/35 to 11/01/51 (a) | 52,883,904 | 43,631,010 |
2.00%, 04/01/28 to 05/01/52 (a) | 244,313,563 | 203,868,020 |
2.50%, 07/01/27 to 05/01/52 (a) | 198,468,247 | 171,019,576 |
3.00%, 12/01/25 to 05/01/52 (a) | 122,553,394 | 110,514,517 |
3.50%, 10/01/25 to 08/01/51 (a) | 79,227,239 | 73,796,091 |
4.00%, 02/01/26 to 07/01/52 (a) | 56,470,298 | 54,035,917 |
4.50%, 12/01/24 to 09/01/52 (a) | 28,176,755 | 27,662,493 |
5.00%, 09/01/33 to 08/01/52 (a) | 13,026,733 | 12,992,513 |
5.50%, 06/01/24 to 02/01/53 (a) | 9,465,849 | 9,560,242 |
6.00%, 04/01/35 to 07/01/53 (a) | 14,827,195 | 15,121,754 |
6.50%, 08/01/34 to 02/01/53 (a) | 4,518,732 | 4,661,695 |
Freddie Mac | ||
1.00%, 10/01/36(a) | 511,022 | 430,793 |
1.50%, 08/01/35 to 08/01/51 (a) | 64,275,114 | 52,244,088 |
2.00%, 08/01/23 to 04/01/52 (a) | 290,424,888 | 240,512,324 |
2.50%, 04/01/27 to 05/01/52 (a) | 168,758,296 | 144,820,540 |
3.00%, 08/01/26 to 05/01/52 (a) | 82,805,866 | 74,606,079 |
3.50%, 01/01/26 to 02/01/53 (a) | 54,080,133 | 50,182,207 |
4.00%, 04/01/26 to 10/01/52 (a) | 30,817,966 | 29,453,426 |
4.50%, 05/01/34 to 09/01/52 (a) | 15,886,179 | 15,529,783 |
5.00%, 11/01/33 to 06/01/53 (a) | 13,120,497 | 13,003,615 |
5.50%, 05/01/24 to 07/01/53 (a) | 8,127,462 | 8,232,162 |
6.00%, 07/01/33 to 02/01/53 (a) | 4,718,723 | 4,893,811 |
6.50%, 12/01/33 to 01/01/53 (a) | 2,584,871 | 2,692,173 |
Ginnie Mae | ||
1.50%, 03/20/51 to 10/20/51 (a) | 1,452,782 | 1,173,299 |
2.00%, 04/20/36 to 04/20/52 (a) | 91,109,661 | 76,834,313 |
2.50%, 03/20/27 to 04/20/52 (a) | 94,863,791 | 82,498,778 |
3.00%, 01/20/27 to 06/20/52 (a) | 76,861,377 | 69,635,169 |
3.50%, 09/20/32 to 06/20/51 (a) | 55,261,933 | 51,886,705 |
4.00%, 06/15/39 to 09/20/52 (a) | 34,990,192 | 33,511,418 |
4.50%, 01/20/39 to 10/20/52 (a) | 24,268,517 | 23,672,103 |
5.00%, 03/20/33 to 06/20/53 (a) | 16,914,248 | 16,726,868 |
5.50%, 10/20/33 to 06/20/53 (a) | 13,936,282 | 13,889,811 |
6.00%, 10/15/36 to 03/20/53 (a) | 7,702,501 | 7,768,230 |
6.50%, 04/20/53 to 06/20/53 (a) | 3,285,883 | 3,346,454 |
7.00%, 01/20/53(a) | 393,436 | 405,245 |
Ginnie Mae II | ||
2.00%, 12/20/51 to 03/20/52 (a) | 12,396,777 | 10,420,068 |
2.50%, 12/20/51 to 03/20/52 (a) | 12,894,858 | 11,170,099 |
SECURITY RATE, MATURITY DATE | FACE AMOUNT ($) | VALUE ($) |
Ginnie Mae, TBA | ||
3.00%, 07/20/53(a)(k) | 1,500,000 | 1,340,019 |
3.50%, 07/20/53(a)(k) | 4,500,000 | 4,154,540 |
4.00%, 07/20/53(a)(k) | 3,500,000 | 3,309,152 |
4.50%, 07/20/53(a)(k) | 5,000,000 | 4,825,536 |
5.00%, 07/20/53(a)(k) | 5,000,000 | 4,911,756 |
UMBS TBA | ||
3.00%, 07/14/52(a)(k) | 12,000,000 | 10,560,193 |
3.50%, 07/18/38 to 07/14/52 (a)(k) | 10,000,000 | 9,150,801 |
4.00%, 07/18/38 to 07/13/53 (a)(k) | 22,000,000 | 20,671,274 |
4.50%, 07/13/53(a)(k) | 26,500,000 | 25,476,329 |
5.00%, 07/13/53(a)(k) | 28,000,000 | 27,430,252 |
5.50%, 07/13/53(a)(k) | 20,000,000 | 19,904,024 |
1,899,296,945 | ||
Total Securitized (Cost $2,344,116,940) | 2,050,426,025 | |
SECURITY | NUMBER OF SHARES | VALUE ($) |
SHORT-TERM INVESTMENTS 2.5% OF NET ASSETS | ||
Money Market Funds 2.5% | ||
State Street Institutional U.S. Government Money Market Fund, Premier Class 5.03% (l) | 171,105,227 | 171,105,227 |
State Street Institutional U.S. Government Money Market Fund, Premier Class 5.03% (l)(m) | 3,341,931 | 3,341,931 |
174,447,158 | ||
Total Short-Term Investments (Cost $174,447,158) | 174,447,158 | |
Total Investments in Securities (Cost $7,928,204,765) | 7,197,934,369 | |
* | Supranational bonds represent the debt of international organizations or institutions such as the World Bank, the International Monetary Fund, regional multilateral development banks and others. |
(a) | The effective maturity may be shorter than the final maturity shown because of the possibility of interim principal payments and prepayments or as the result of embedded demand features (puts or calls). |
(b) | Security is in a fixed rate coupon period. Based on index eligibility requirements and the fund’s investment objective this security will be removed from the index prior to converting to a floating rate security. |
(c) | Securities exempt from registration under Rule 144A of the Securities Act of 1933, as amended. These securities may be resold in transactions exempt from registrations, normally to qualified institutional buyers. At the period end, the value of these amounted to $19,539,914 or 0.3% of net assets. |
(d) | Step up security that pays an initial coupon rate for a set period and increased coupon rates at one or more preset intervals. Rate shown is as of period end. |
(e) | Issuer is affiliated with the fund’s investment adviser. |
(f) | All or a portion of this security is on loan. Securities on loan were valued at $3,281,008. |
(g) | Interest rate is subject to adjustments from time to time if a nationally recognized statistical rating organization downgrades (or subsequently upgrades) the debt rating assigned to the bond. |
(h) | Guaranteed by the Republic of Germany. |
(i) | Zero coupon security. |
(j) | Fixed rate is determined by a formula set forth in the security’s offering documents and is affected by the current WAC of the underlying loans. |
(k) | Security or a portion of the security purchased on a delayed-delivery or when-issued basis. |
(l) | The rate shown is the annualized 7-day yield. |
(m) | Security purchased with cash collateral received for securities on loan. |
GO — | General obligation |
RB — | Revenue bond |
REIT — | Real Estate Investment Trust |
TBA — | To-be-announced |
UMBS — | Uniform Mortgage-Backed Securities are single-class securities backed by mortgage loans purchased by either Freddie Mac or Fannie Mae. |
WAC — | Weighted Average Coupon, which is the weighted average gross interest rate of the securitized asset pool and is determined by the different speeds at which the underlying mortgages are paid down. |
SECURITY RATE, MATURITY DATE | VALUE AT 12/31/22 | PURCHASES | SALES | REALIZED GAINS (LOSSES) | NET CHANGE IN UNREALIZED APPRECIATION (DEPRECIATION) | ACCRETION OF DISCOUNTS (AMORTIZATION OF PREMIUMS) | VALUE AT 6/30/23 | FACE AMOUNT AT 6/30/23 | INTEREST INCOME EARNED |
CORPORATES 0.1% OF NET ASSETS | |||||||||
Financial Institutions 0.1% | |||||||||
Brokerage/Asset Managers/Exchanges 0.1% | |||||||||
The Charles Schwab Corp. | |||||||||
3.55%, 02/01/24 | $123,351 | $— | ($123,057) | ($3,858) | $3,943 | ($379) | $— | $— | $752 |
0.75%, 03/18/24 | 380,421 | — | (382,416) | (18,492) | 20,711 | (224) | — | — | 692 |
3.75%, 04/01/24 | 78,848 | — | (78,613) | (4,646) | 5,713 | (1,302) | — | — | 1,008 |
3.00%, 03/10/25 | 72,189 | — | — | — | (543) | 41 | 71,687 | 75,000 | 1,125 |
4.20%, 03/24/25 | 148,416 | — | — | — | 161 | (2,042) | 146,535 | 150,000 | 3,150 |
3.63%, 04/01/25 | 97,517 | — | — | — | (33) | (1,266) | 96,218 | 100,000 | 1,812 |
3.85%, 05/21/25 | 195,396 | — | — | — | (469) | (1,839) | 193,088 | 200,000 | 3,850 |
3.45%, 02/13/26 | 72,709 | — | — | — | (971) | (711) | 71,027 | 75,000 | 1,294 |
0.90%, 03/11/26 | 288,169 | — | — | — | (675) | (217) | 287,277 | 325,000 | 1,462 |
1.15%, 05/13/26 | 222,469 | — | — | — | (1,085) | (27) | 221,357 | 250,000 | 1,437 |
3.20%, 03/02/27 | 164,842 | — | — | — | (1,206) | (1,448) | 162,188 | 175,000 | 2,800 |
2.45%, 03/03/27 | 366,072 | — | — | — | (7,475) | 1,095 | 359,692 | 400,000 | 4,900 |
3.30%, 04/01/27 | 166,021 | — | — | — | (2,215) | (1,432) | 162,374 | 175,000 | 2,887 |
3.20%, 01/25/28 | 163,390 | — | — | — | (2,646) | (631) | 160,113 | 175,000 | 2,800 |
2.00%, 03/20/28 | 285,768 | — | — | — | (4,181) | (264) | 281,323 | 325,000 | 3,250 |
4.00%, 02/01/29 | 142,884 | — | — | — | (485) | (1,307) | 141,092 | 150,000 | 3,000 |
5.64%, 05/19/29 | — | 299,630 | — | — | 2,530 | 3 | 302,163 | 300,000 | 1,082 |
3.25%, 05/22/29 | 136,225 | — | — | — | (3,157) | (475) | 132,593 | 150,000 | 2,438 |
2.75%, 10/01/29 | 109,189 | — | — | — | (2,217) | (379) | 106,593 | 125,000 | 1,719 |
4.63%, 03/22/30 | 122,891 | — | — | — | 1,004 | (1,107) | 122,788 | 125,000 | 2,891 |
1.65%, 03/11/31 | 155,971 | — | — | — | (2,497) | 484 | 153,958 | 200,000 | 1,650 |
2.30%, 05/13/31 | 163,819 | — | — | — | (4,059) | (226) | 159,534 | 200,000 | 2,300 |
1.95%, 12/01/31 | 176,691 | — | — | — | (5,268) | 169 | 171,592 | 225,000 | 2,194 |
2.90%, 03/03/32 | 212,768 | — | — | — | (6,007) | 401 | 207,162 | 250,000 | 3,625 |
5.85%, 05/19/34 | — | 329,441 | — | — | 725 | ( 21) | 330,145 | 325,000 | 1,215 |
Total | $4,046,016 | $629,071 | ($584,086 ) | ($26,996 ) | ($10,402 ) | ($13,104 ) | $4,040,499 | $55,333 | |
DESCRIPTION | QUOTED PRICES IN ACTIVE MARKETS FOR IDENTICAL ASSETS (LEVEL 1) | OTHER SIGNIFICANT OBSERVABLE INPUTS (LEVEL 2) | SIGNIFICANT UNOBSERVABLE INPUTS (LEVEL 3) | TOTAL |
Assets | ||||
Corporates1 | $— | $1,733,759,184 | $— | $1,733,759,184 |
Treasuries1 | — | 2,891,560,552 | — | 2,891,560,552 |
Government Related1 | — | 347,741,450 | — | 347,741,450 |
Securitized1 | — | 2,050,426,025 | — | 2,050,426,025 |
Short-Term Investments1 | 174,447,158 | — | — | 174,447,158 |
Total | $174,447,158 | $7,023,487,211 | $— | $7,197,934,369 |
1 | As categorized in the Portfolio Holdings. |
Assets | ||
Investments in securities, at value - affiliated (cost $4,547,132) | $4,040,499 | |
Investments in securities, at value - unaffiliated (cost $7,923,657,633) including securities on loan of $3,281,008 | 7,193,893,870 | |
Cash | 515,327 | |
Deposits with brokers for TBA margin | 180,000 | |
Receivables: | ||
Investments sold | 80,077,071 | |
Interest | 43,982,610 | |
Dividends | 467,621 | |
Foreign tax reclaims | 18,761 | |
Income from securities on loan | + | 5,939 |
Total assets | 7,323,181,698 | |
Liabilities | ||
Collateral held for securities on loan | 3,341,931 | |
Payables: | ||
Investments bought - delayed-delivery | 143,757,009 | |
Investments bought | 104,982,597 | |
Management fees | + | 173,496 |
Total liabilities | 252,255,033 | |
Net assets | $7,070,926,665 | |
Net Assets by Source | ||
Capital received from investors | $8,131,962,828 | |
Total distributable loss | + | (1,061,036,163 ) |
Net assets | $7,070,926,665 | |
Net Asset Value (NAV) | ||||
Net Assets | ÷ | Shares Outstanding | = | NAV |
$7,070,926,665 | 153,300,000 | $46.12 | ||
For the period January 1, 2023 through June 30, 2023; unaudited | ||
Investment Income | ||
Interest received from securities - unaffiliated (net of foreign withholding tax of $1,202) | $103,318,681 | |
Dividends received from securities - unaffiliated | 3,013,541 | |
Interest received from securities - affiliated | 42,229 | |
Securities on loan, net | + | 33,193 |
Total investment income | 106,407,644 | |
Expenses | ||
Management fees | 1,048,522 | |
Total expenses | – | 1,048,522 |
Net investment income | 105,359,122 | |
REALIZED AND UNREALIZED GAINS (LOSSES) | ||
Net realized losses on sales of securities - affiliated | (8,504 ) | |
Net realized losses on sales of securities - unaffiliated | (43,893,302 ) | |
Net realized losses on sales of in-kind redemptions - affiliated | (18,492 ) | |
Net realized losses on sales of in-kind redemptions - unaffiliated | + | (7,681,681 ) |
Net realized losses | (51,601,979 ) | |
Net change in unrealized appreciation (depreciation) on securities - affiliated | (10,402 ) | |
Net change in unrealized appreciation (depreciation) on securities - unaffiliated | + | 94,232,246 |
Net change in unrealized appreciation (depreciation) | + | 94,221,844 |
Net realized and unrealized gains | 42,619,865 | |
Increase in net assets resulting from operations | $147,978,987 | |
OPERATIONS | |||
1/1/23-6/30/23 | 1/1/22-12/31/22 | ||
Net investment income | $105,359,122 | $173,767,705 | |
Net realized losses | (51,601,979 ) | (288,649,413 ) | |
Net change in unrealized appreciation (depreciation) | + | 94,221,844 | (1,020,183,841 ) |
Increase (decrease) in net assets resulting from operations | $147,978,987 | ($1,135,065,549 ) | |
DISTRIBUTIONS TO SHAREHOLDERS | |||
Total distributions | ($90,173,650 ) | ($185,912,810 ) | |
TRANSACTIONS IN FUND SHARES | |||||
1/1/23-6/30/23 | 1/1/22-12/31/22 | ||||
SHARES | VALUE | SHARES | VALUE | ||
Shares sold | 13,500,000 | $632,917,703 | 12,800,000 | $619,764,211 | |
Shares redeemed | + | (9,100,000 ) | (424,906,342 ) | (32,200,000 ) | (1,567,471,655 ) |
Net transactions in fund shares | 4,400,000 | $208,011,361 | (19,400,000 ) | ($947,707,444 ) | |
SHARES OUTSTANDING AND NET ASSETS | |||||
1/1/23-6/30/23 | 1/1/22-12/31/22 | ||||
SHARES | NET ASSETS | SHARES | NET ASSETS | ||
Beginning of period | 148,900,000 | $6,805,109,967 | 168,300,000 | $9,073,795,770 | |
Total increase (decrease) | + | 4,400,000 | 265,816,698 | (19,400,000 ) | (2,268,685,803 ) |
End of period | 153,300,000 | $7,070,926,665 | 148,900,000 | $6,805,109,967 | |
1/1/23– 6/30/23* | 1/1/22– 12/31/22 | 1/1/21– 12/31/21 | 1/1/20– 12/31/20 | 10/10/191– 12/31/19 | ||
Per-Share Data | ||||||
Net asset value at beginning of period | $46.95 | $50.57 | $51.37 | $50.04 | $50.00 | |
Income (loss) from investment operations: | ||||||
Net investment income (loss)2 | 0.65 | 0.75 | 0.50 | 0.89 | 0.23 | |
Net realized and unrealized gains (losses) | 0.18 | (3.60 ) | (0.82 ) | 1.74 | 0.02 | |
Total from investment operations | 0.83 | (2.85 ) | (0.32 ) | 2.63 | 0.25 | |
Less distributions: | ||||||
Distributions from net investment income | (0.55 ) | (0.77 ) | (0.48 ) | (0.89 ) | (0.21 ) | |
Distributions from net realized gains | — | — | — | (0.41 ) | — | |
Total distributions | (0.55 ) | (0.77 ) | (0.48 ) | (1.30 ) | (0.21 ) | |
Net asset value at end of period | $47.23 | $46.95 | $50.57 | $51.37 | $50.04 | |
Total return | 1.76 %3 | (5.65 %) | (0.64 %) | 5.31 % | 0.50 %3 | |
Ratios/Supplemental Data | ||||||
Ratios to average net assets: | ||||||
Total expenses | 0.03 %4 | 0.04 %5,6 | 0.05 %7 | 0.05 % | 0.06 %4,8 | |
Net investment income (loss) | 2.76 %4 | 1.56 % | 0.99 % | 1.74 % | 2.01 %4 | |
Portfolio turnover rate9 | 15 %3 | 14 % | 13 % | 80 % | 12 %3 | |
Net assets, end of period (x 1,000) | $363,670 | $370,872 | $609,404 | $118,146 | $35,029 | |
* | Unaudited. |
1 | Commencement of operations. |
2 | Calculated based on the average shares outstanding during the period. |
3 | Not annualized. |
4 | Annualized. |
5 | Effective July 1, 2022, the annual operating expense ratio was reduced to 0.03%. The ratio presented for the period ended December 31, 2022 is a blended ratio. |
6 | Ratio includes less than 0.005% of non-routine proxy expenses. |
7 | Effective December 20, 2021, the annual operating expense ratio was reduced to 0.04%. The ratio presented for period ended December 31, 2021 is a blended ratio. |
8 | Effective December 13, 2019, the annual operating expense ratio was reduced to 0.05%. The ratio presented for the period ended December 31, 2019 is a blended ratio. |
9 | Portfolio turnover rate excludes securities received or delivered from processing of in-kind creations or redemptions. |
SECURITY RATE, MATURITY DATE | FACE AMOUNT ($) | VALUE ($) |
CORPORATES 98.8% OF NET ASSETS | ||
Financial Institutions 44.6% | ||
Banking 35.4% | ||
Ally Financial, Inc. | ||
5.13%, 09/30/24 | 120,000 | 117,809 |
4.63%, 03/30/25 | 100,000 | 96,351 |
5.80%, 05/01/25 (a) | 150,000 | 147,596 |
4.75%, 06/09/27 (a) | 150,000 | 139,568 |
7.10%, 11/15/27 (a) | 50,000 | 50,477 |
6.99%, 06/13/29 (a)(b) | 150,000 | 148,287 |
American Express Co. | ||
2.50%, 07/30/24 (a) | 235,000 | 227,247 |
3.00%, 10/30/24 (a) | 315,000 | 305,027 |
2.25%, 03/04/25 (a) | 250,000 | 237,220 |
3.95%, 08/01/25 (a) | 300,000 | 291,222 |
4.20%, 11/06/25 (a) | 125,000 | 121,876 |
3.13%, 05/20/26 (a) | 225,000 | 213,230 |
1.65%, 11/04/26 (a) | 175,000 | 155,824 |
2.55%, 03/04/27 (a) | 300,000 | 273,504 |
3.30%, 05/03/27 (a) | 300,000 | 280,581 |
5.85%, 11/05/27 (a) | 200,000 | 205,044 |
American Express Credit Corp. | ||
3.30%, 05/03/27 (a) | 75,000 | 70,410 |
Australia & New Zealand Banking Group Ltd. | ||
5.09%, 12/08/25 | 250,000 | 249,110 |
Banco Bilbao Vizcaya Argentaria S.A. | ||
1.13%, 09/18/25 | 200,000 | 180,288 |
6.14%, 09/14/28 (a)(b) | 200,000 | 201,178 |
Banco Santander S.A. | ||
3.50%, 03/24/25 | 200,000 | 191,988 |
2.75%, 05/28/25 | 200,000 | 187,948 |
5.15%, 08/18/25 | 200,000 | 196,928 |
5.18%, 11/19/25 | 200,000 | 194,454 |
1.85%, 03/25/26 | 200,000 | 179,104 |
4.25%, 04/11/27 | 200,000 | 189,418 |
5.29%, 08/18/27 | 400,000 | 392,576 |
1.72%, 09/14/27 (a)(b) | 200,000 | 173,978 |
4.18%, 03/24/28 (a)(b) | 200,000 | 187,520 |
4.38%, 04/12/28 | 200,000 | 188,702 |
Bank of America Corp. | ||
4.20%, 08/26/24 | 450,000 | 441,724 |
4.00%, 01/22/25 | 400,000 | 389,256 |
3.95%, 04/21/25 | 400,000 | 387,584 |
3.88%, 08/01/25 | 275,000 | 267,778 |
0.98%, 09/25/25 (a)(b) | 325,000 | 305,523 |
3.09%, 10/01/25 (a)(b) | 375,000 | 361,140 |
2.46%, 10/22/25 (a)(b) | 175,000 | 167,102 |
1.53%, 12/06/25 (a)(b) | 100,000 | 93,679 |
SECURITY RATE, MATURITY DATE | FACE AMOUNT ($) | VALUE ($) |
3.37%, 01/23/26 (a)(b) | 320,000 | 307,322 |
2.02%, 02/13/26 (a)(b) | 300,000 | 281,085 |
4.45%, 03/03/26 | 325,000 | 316,540 |
3.38%, 04/02/26 (a)(b) | 550,000 | 528,181 |
3.50%, 04/19/26 | 425,000 | 408,365 |
1.32%, 06/19/26 (a)(b) | 475,000 | 435,318 |
4.83%, 07/22/26 (a)(b) | 300,000 | 294,843 |
6.22%, 09/15/26 | 75,000 | 76,618 |
4.25%, 10/22/26 | 300,000 | 289,722 |
1.20%, 10/24/26 (a)(b) | 350,000 | 315,395 |
1.66%, 03/11/27 (a)(b) | 450,000 | 405,666 |
3.56%, 04/23/27 (a)(b) | 500,000 | 474,665 |
1.73%, 07/22/27 (a)(b) | 900,000 | 803,664 |
3.25%, 10/21/27 (a) | 400,000 | 373,100 |
4.18%, 11/25/27 (a) | 350,000 | 332,930 |
3.82%, 01/20/28 (a)(b) | 400,000 | 378,944 |
2.55%, 02/04/28 (a)(b) | 350,000 | 316,137 |
3.71%, 04/24/28 (a)(b) | 250,000 | 234,770 |
4.38%, 04/27/28 (a)(b) | 350,000 | 336,826 |
3.59%, 07/21/28 (a)(b) | 300,000 | 279,630 |
4.95%, 07/22/28 (a)(b) | 500,000 | 491,425 |
6.20%, 11/10/28 (a)(b) | 350,000 | 360,283 |
3.42%, 12/20/28 (a)(b) | 950,000 | 874,332 |
3.97%, 03/05/29 (a)(b) | 250,000 | 234,435 |
5.20%, 04/25/29 (a)(b) | 600,000 | 593,862 |
2.09%, 06/14/29 (a)(b) | 400,000 | 341,940 |
Bank of Montreal | ||
4.25%, 09/14/24 | 100,000 | 98,138 |
1.50%, 01/10/25 | 225,000 | 211,453 |
1.85%, 05/01/25 | 250,000 | 233,810 |
3.70%, 06/07/25 | 300,000 | 290,019 |
1.25%, 09/15/26 | 250,000 | 220,793 |
0.95%, 01/22/27 (a)(b) | 150,000 | 133,847 |
2.65%, 03/08/27 | 200,000 | 183,186 |
4.70%, 09/14/27 (a) | 300,000 | 293,277 |
5.20%, 02/01/28 (a) | 150,000 | 150,032 |
3.80%, 12/15/32 (a)(b) | 200,000 | 176,792 |
Bank of New York Mellon Corp. | ||
3.25%, 09/11/24 (a) | 100,000 | 97,227 |
2.10%, 10/24/24 | 275,000 | 263,238 |
3.00%, 02/24/25 (a) | 145,000 | 139,577 |
1.60%, 04/24/25 (a) | 250,000 | 234,472 |
3.35%, 04/25/25 (a) | 100,000 | 96,284 |
3.95%, 11/18/25 (a) | 75,000 | 72,482 |
5.22%, 11/21/25 (a)(b) | 250,000 | 248,685 |
0.75%, 01/28/26 (a) | 100,000 | 89,383 |
2.80%, 05/04/26 (a) | 100,000 | 94,113 |
4.41%, 07/24/26 (a)(b) | 100,000 | 97,930 |
2.45%, 08/17/26 (a) | 150,000 | 138,527 |
1.05%, 10/15/26 (a) | 150,000 | 131,219 |
3.25%, 05/16/27 (a) | 150,000 | 140,501 |
SECURITY RATE, MATURITY DATE | FACE AMOUNT ($) | VALUE ($) |
3.44%, 02/07/28 (a)(b) | 150,000 | 141,273 |
3.85%, 04/28/28 | 200,000 | 190,774 |
3.99%, 06/13/28 (a)(b) | 150,000 | 144,027 |
5.80%, 10/25/28 (a)(b) | 200,000 | 203,952 |
4.54%, 02/01/29 (a)(b) | 150,000 | 146,175 |
Bank of Nova Scotia | ||
0.65%, 07/31/24 | 200,000 | 189,460 |
2.20%, 02/03/25 | 230,000 | 217,702 |
3.45%, 04/11/25 | 250,000 | 240,967 |
1.30%, 06/11/25 | 150,000 | 138,060 |
4.50%, 12/16/25 | 225,000 | 217,285 |
4.75%, 02/02/26 | 200,000 | 196,986 |
1.05%, 03/02/26 | 175,000 | 155,939 |
1.35%, 06/24/26 | 150,000 | 133,806 |
2.70%, 08/03/26 | 200,000 | 185,322 |
1.30%, 09/15/26 | 125,000 | 110,050 |
1.95%, 02/02/27 | 150,000 | 134,052 |
2.95%, 03/11/27 | 125,000 | 115,969 |
5.25%, 06/12/28 | 150,000 | 149,072 |
BankUnited, Inc. | ||
4.88%, 11/17/25 (a) | 75,000 | 69,460 |
Barclays PLC | ||
4.38%, 09/11/24 | 200,000 | 194,458 |
3.65%, 03/16/25 | 375,000 | 359,614 |
4.38%, 01/12/26 | 400,000 | 384,536 |
2.85%, 05/07/26 (a)(b) | 250,000 | 234,438 |
5.20%, 05/12/26 | 300,000 | 289,713 |
5.30%, 08/09/26 (a)(b) | 250,000 | 244,957 |
7.33%, 11/02/26 (a)(b) | 200,000 | 204,882 |
5.83%, 05/09/27 (a)(b) | 300,000 | 296,277 |
2.28%, 11/24/27 (a)(b) | 300,000 | 264,297 |
4.84%, 05/09/28 (a) | 300,000 | 276,921 |
5.50%, 08/09/28 (a)(b) | 275,000 | 268,623 |
7.39%, 11/02/28 (a)(b) | 250,000 | 261,322 |
4.97%, 05/16/29 (a)(b) | 300,000 | 284,385 |
BNP Paribas S.A. | ||
4.25%, 10/15/24 | 200,000 | 194,986 |
BPCE S.A. | ||
3.38%, 12/02/26 | 250,000 | 233,545 |
Cadence Bank | ||
4.13%, 11/20/29 (a)(b) | 25,000 | 23,099 |
Canadian Imperial Bank of Commerce | ||
2.25%, 01/28/25 | 225,000 | 213,404 |
3.30%, 04/07/25 | 250,000 | 240,505 |
0.95%, 10/23/25 | 200,000 | 181,908 |
1.25%, 06/22/26 | 175,000 | 155,451 |
3.45%, 04/07/27 | 150,000 | 140,969 |
5.00%, 04/28/28 (a) | 200,000 | 197,078 |
Capital One Financial Corp. | ||
3.30%, 10/30/24 (a) | 200,000 | 192,198 |
3.20%, 02/05/25 (a) | 195,000 | 186,334 |
4.25%, 04/30/25 (a) | 100,000 | 96,870 |
4.20%, 10/29/25 (a) | 250,000 | 239,957 |
2.64%, 03/03/26 (a)(b) | 200,000 | 186,862 |
4.99%, 07/24/26 (a)(b) | 250,000 | 242,385 |
3.75%, 07/28/26 (a) | 225,000 | 209,741 |
3.75%, 03/09/27 (a) | 200,000 | 186,498 |
3.65%, 05/11/27 (a) | 150,000 | 139,584 |
1.88%, 11/02/27 (a)(b) | 225,000 | 193,871 |
4.93%, 05/10/28 (a)(b) | 300,000 | 284,790 |
5.47%, 02/01/29 (a)(b) | 250,000 | 240,320 |
6.31%, 06/08/29 (a)(b) | 250,000 | 248,500 |
Citigroup, Inc. | ||
4.00%, 08/05/24 | 95,000 | 93,351 |
3.88%, 03/26/25 | 225,000 | 217,559 |
3.30%, 04/27/25 | 200,000 | 192,620 |
SECURITY RATE, MATURITY DATE | FACE AMOUNT ($) | VALUE ($) |
4.40%, 06/10/25 | 400,000 | 388,952 |
5.50%, 09/13/25 | 200,000 | 199,050 |
1.28%, 11/03/25 (a)(b) | 200,000 | 187,496 |
3.70%, 01/12/26 | 300,000 | 287,778 |
2.01%, 01/25/26 (a)(b) | 300,000 | 282,198 |
4.60%, 03/09/26 | 275,000 | 266,376 |
3.29%, 03/17/26 (a)(b) | 300,000 | 287,268 |
3.11%, 04/08/26 (a)(b) | 550,000 | 525,371 |
3.40%, 05/01/26 | 300,000 | 285,426 |
5.61%, 09/29/26 (a)(b) | 425,000 | 425,064 |
3.20%, 10/21/26 (a) | 475,000 | 444,795 |
4.30%, 11/20/26 | 150,000 | 143,846 |
1.12%, 01/28/27 (a)(b) | 450,000 | 401,629 |
1.46%, 06/09/27 (a)(b) | 475,000 | 422,042 |
4.45%, 09/29/27 | 500,000 | 477,880 |
3.89%, 01/10/28 (a)(b) | 450,000 | 426,708 |
3.07%, 02/24/28 (a)(b) | 450,000 | 414,598 |
4.66%, 05/24/28 (a)(b) | 200,000 | 195,424 |
3.67%, 07/24/28 (a)(b) | 200,000 | 187,298 |
3.52%, 10/27/28 (a)(b) | 350,000 | 325,524 |
4.08%, 04/23/29 (a)(b) | 250,000 | 235,575 |
Citizens Bank NA | ||
2.25%, 04/28/25 (a) | 250,000 | 226,578 |
3.75%, 02/18/26 (a) | 250,000 | 228,823 |
Citizens Financial Group, Inc. | ||
4.30%, 12/03/25 (a) | 100,000 | 92,796 |
2.85%, 07/27/26 (a) | 100,000 | 89,036 |
Comerica Bank | ||
2.50%, 07/23/24 | 250,000 | 234,972 |
Commonwealth Bank of Australia | ||
5.08%, 01/10/25 | 250,000 | 248,907 |
Cooperatieve Rabobank UA | ||
5.00%, 01/13/25 | 250,000 | 248,537 |
3.38%, 05/21/25 | 250,000 | 240,922 |
4.38%, 08/04/25 | 250,000 | 241,532 |
3.75%, 07/21/26 | 250,000 | 233,693 |
Credit Suisse AG | ||
3.63%, 09/09/24 | 400,000 | 386,504 |
7.95%, 01/09/25 | 250,000 | 255,220 |
3.70%, 02/21/25 | 250,000 | 239,430 |
2.95%, 04/09/25 | 250,000 | 235,420 |
1.25%, 08/07/26 | 250,000 | 215,500 |
5.00%, 07/09/27 | 250,000 | 241,167 |
7.50%, 02/15/28 | 400,000 | 425,496 |
Deutsche Bank AG | ||
4.50%, 04/01/25 | 200,000 | 190,562 |
3.96%, 11/26/25 (a)(b) | 325,000 | 310,437 |
4.10%, 01/13/26 | 150,000 | 141,246 |
1.69%, 03/19/26 | 250,000 | 225,625 |
6.12%, 07/14/26 (a)(b) | 200,000 | 198,694 |
2.13%, 11/24/26 (a)(b) | 350,000 | 311,307 |
2.31%, 11/16/27 (a)(b) | 150,000 | 129,194 |
2.55%, 01/07/28 (a)(b) | 200,000 | 173,800 |
6.72%, 01/18/29 (a)(b) | 200,000 | 200,948 |
4.88%, 12/01/32 (a)(b) | 200,000 | 169,286 |
Discover Bank | ||
2.45%, 09/12/24 (a) | 250,000 | 237,060 |
3.45%, 07/27/26 (a) | 250,000 | 230,220 |
Discover Financial Services | ||
3.95%, 11/06/24 (a) | 50,000 | 48,274 |
4.50%, 01/30/26 (a) | 50,000 | 47,929 |
4.10%, 02/09/27 (a) | 175,000 | 162,923 |
Fifth Third Bancorp | ||
2.38%, 01/28/25 (a) | 170,000 | 159,695 |
2.55%, 05/05/27 (a) | 200,000 | 177,486 |
SECURITY RATE, MATURITY DATE | FACE AMOUNT ($) | VALUE ($) |
1.71%, 11/01/27 (a)(b) | 125,000 | 106,844 |
6.36%, 10/27/28 (a)(b) | 100,000 | 99,676 |
Fifth Third Bank NA | ||
3.95%, 07/28/25 (a) | 250,000 | 239,002 |
5.85%, 10/27/25 (a)(b) | 100,000 | 97,641 |
2.25%, 02/01/27 (a) | 100,000 | 87,916 |
First Citizens BancShares, Inc. | ||
3.38%, 03/15/30 (a)(b) | 75,000 | 68,842 |
First Horizon Corp. | ||
4.00%, 05/26/25 (a) | 75,000 | 70,189 |
First-Citizens Bank & Trust Co. | ||
6.13%, 03/09/28 | 100,000 | 98,868 |
FNB Corp. | ||
5.15%, 08/25/25 (a) | 75,000 | 72,167 |
Goldman Sachs Group, Inc. | ||
3.85%, 07/08/24 (a) | 375,000 | 367,927 |
5.70%, 11/01/24 | 100,000 | 99,940 |
3.50%, 01/23/25 (a) | 375,000 | 362,216 |
3.50%, 04/01/25 (a) | 550,000 | 528,363 |
3.75%, 05/22/25 (a) | 400,000 | 386,876 |
3.27%, 09/29/25 (a)(b) | 500,000 | 483,400 |
4.25%, 10/21/25 | 325,000 | 313,544 |
0.86%, 02/12/26 (a)(b) | 150,000 | 138,350 |
3.75%, 02/25/26 (a) | 300,000 | 288,231 |
3.50%, 11/16/26 (a) | 425,000 | 399,185 |
1.09%, 12/09/26 (a)(b) | 325,000 | 290,452 |
5.95%, 01/15/27 | 125,000 | 126,648 |
3.85%, 01/26/27 (a) | 500,000 | 476,370 |
1.43%, 03/09/27 (a)(b) | 500,000 | 447,500 |
4.39%, 06/15/27 (a)(b) | 100,000 | 97,251 |
1.54%, 09/10/27 (a)(b) | 450,000 | 395,883 |
1.95%, 10/21/27 (a)(b) | 675,000 | 600,554 |
2.64%, 02/24/28 (a)(b) | 600,000 | 545,346 |
3.62%, 03/15/28 (a)(b) | 500,000 | 469,380 |
3.69%, 06/05/28 (a)(b) | 350,000 | 329,112 |
4.48%, 08/23/28 (a)(b) | 400,000 | 387,176 |
3.81%, 04/23/29 (a)(b) | 250,000 | 232,680 |
4.22%, 05/01/29 (a)(b) | 400,000 | 378,272 |
HSBC Holdings PLC | ||
4.25%, 08/18/25 | 250,000 | 240,245 |
2.63%, 11/07/25 (a)(b) | 350,000 | 333,046 |
4.18%, 12/09/25 (a)(b) | 200,000 | 194,446 |
4.30%, 03/08/26 | 500,000 | 483,895 |
3.00%, 03/10/26 (a)(b) | 250,000 | 237,515 |
1.65%, 04/18/26 (a)(b) | 300,000 | 277,134 |
3.90%, 05/25/26 | 250,000 | 238,590 |
2.10%, 06/04/26 (a)(b) | 400,000 | 370,716 |
4.29%, 09/12/26 (a)(b) | 400,000 | 385,248 |
7.34%, 11/03/26 (a)(b) | 300,000 | 308,988 |
4.38%, 11/23/26 | 200,000 | 189,224 |
1.59%, 05/24/27 (a)(b) | 300,000 | 265,035 |
2.25%, 11/22/27 (a)(b) | 400,000 | 355,168 |
4.04%, 03/13/28 (a)(b) | 400,000 | 375,892 |
4.76%, 06/09/28 (a)(b) | 350,000 | 336,833 |
5.21%, 08/11/28 (a)(b) | 350,000 | 342,391 |
2.01%, 09/22/28 (a)(b) | 250,000 | 214,473 |
7.39%, 11/03/28 (a)(b) | 350,000 | 370,023 |
6.16%, 03/09/29 (a)(b) | 300,000 | 302,928 |
4.58%, 06/19/29 (a)(b) | 400,000 | 376,672 |
Huntington Bancshares, Inc. | ||
2.63%, 08/06/24 (a) | 100,000 | 95,825 |
4.00%, 05/15/25 (a) | 50,000 | 48,004 |
Huntington National Bank | ||
5.70%, 11/18/25 (a)(b) | 250,000 | 242,992 |
4.55%, 05/17/28 (a)(b) | 250,000 | 233,945 |
SECURITY RATE, MATURITY DATE | FACE AMOUNT ($) | VALUE ($) |
ING Groep N.V. | ||
3.87%, 03/28/26 (a)(b) | 200,000 | 192,214 |
3.95%, 03/29/27 | 200,000 | 190,082 |
1.73%, 04/01/27 (a)(b) | 200,000 | 178,294 |
4.02%, 03/28/28 (a)(b) | 200,000 | 187,882 |
JPMorgan Chase & Co. | ||
3.88%, 09/10/24 | 475,000 | 463,928 |
3.13%, 01/23/25 (a) | 400,000 | 387,004 |
3.90%, 07/15/25 (a) | 375,000 | 365,805 |
7.75%, 07/15/25 | 50,000 | 52,239 |
0.77%, 08/09/25 (a)(b) | 100,000 | 94,175 |
2.30%, 10/15/25 (a)(b) | 305,000 | 290,936 |
1.56%, 12/10/25 (a)(b) | 350,000 | 327,950 |
5.55%, 12/15/25 (a)(b) | 300,000 | 298,917 |
2.60%, 02/24/26 (a)(b) | 250,000 | 237,325 |
2.01%, 03/13/26 (a)(b) | 400,000 | 375,932 |
3.30%, 04/01/26 (a) | 400,000 | 381,288 |
2.08%, 04/22/26 (a)(b) | 550,000 | 515,240 |
4.08%, 04/26/26 (a)(b) | 500,000 | 486,185 |
3.20%, 06/15/26 (a) | 300,000 | 285,933 |
2.95%, 10/01/26 (a) | 500,000 | 469,965 |
7.63%, 10/15/26 | 100,000 | 106,989 |
1.05%, 11/19/26 (a)(b) | 450,000 | 403,519 |
4.13%, 12/15/26 | 300,000 | 289,068 |
3.96%, 01/29/27 (a)(b) | 300,000 | 289,080 |
1.04%, 02/04/27 (a)(b) | 325,000 | 289,728 |
1.58%, 04/22/27 (a)(b) | 500,000 | 449,370 |
8.00%, 04/29/27 | 75,000 | 82,577 |
1.47%, 09/22/27 (a)(b) | 425,000 | 375,470 |
4.25%, 10/01/27 | 250,000 | 242,332 |
3.63%, 12/01/27 (a) | 100,000 | 93,932 |
3.78%, 02/01/28 (a)(b) | 400,000 | 381,392 |
2.95%, 02/24/28 (a)(b) | 300,000 | 275,814 |
4.32%, 04/26/28 (a)(b) | 500,000 | 483,030 |
3.54%, 05/01/28 (a)(b) | 450,000 | 421,465 |
2.18%, 06/01/28 (a)(b) | 250,000 | 222,663 |
4.85%, 07/25/28 (a)(b) | 500,000 | 493,605 |
3.51%, 01/23/29 (a)(b) | 200,000 | 185,434 |
4.01%, 04/23/29 (a)(b) | 300,000 | 283,164 |
2.07%, 06/01/29 (a)(b) | 250,000 | 214,800 |
KeyBank NA | ||
4.15%, 08/08/25 | 250,000 | 230,735 |
5.85%, 11/15/27 (a) | 250,000 | 235,650 |
KeyCorp | ||
4.15%, 10/29/25 | 75,000 | 69,794 |
2.25%, 04/06/27 | 200,000 | 166,632 |
4.10%, 04/30/28 | 200,000 | 173,532 |
Lloyds Banking Group PLC | ||
4.50%, 11/04/24 | 200,000 | 194,228 |
4.45%, 05/08/25 | 350,000 | 339,636 |
3.87%, 07/09/25 (a)(b) | 200,000 | 194,856 |
4.58%, 12/10/25 | 200,000 | 191,600 |
3.51%, 03/18/26 (a)(b) | 200,000 | 190,390 |
4.65%, 03/24/26 | 200,000 | 191,056 |
4.72%, 08/11/26 (a)(b) | 200,000 | 194,626 |
3.75%, 01/11/27 | 200,000 | 187,582 |
1.63%, 05/11/27 (a)(b) | 200,000 | 177,090 |
3.75%, 03/18/28 (a)(b) | 200,000 | 185,120 |
4.38%, 03/22/28 | 200,000 | 189,972 |
3.57%, 11/07/28 (a)(b) | 200,000 | 181,426 |
5.87%, 03/06/29 (a)(b) | 200,000 | 198,704 |
Manufacturers & Traders Trust Co. | ||
2.90%, 02/06/25 (a) | 250,000 | 236,380 |
4.65%, 01/27/26 (a) | 250,000 | 238,930 |
3.40%, 08/17/27 | 75,000 | 64,449 |
4.70%, 01/27/28 (a) | 250,000 | 236,322 |
SECURITY RATE, MATURITY DATE | FACE AMOUNT ($) | VALUE ($) |
Mitsubishi UFJ Financial Group, Inc. | ||
2.80%, 07/18/24 | 200,000 | 193,824 |
2.19%, 02/25/25 | 400,000 | 377,260 |
3.78%, 03/02/25 | 250,000 | 242,247 |
1.41%, 07/17/25 | 200,000 | 183,468 |
4.79%, 07/18/25 (a)(b) | 225,000 | 221,810 |
0.95%, 07/19/25 (a)(b) | 350,000 | 330,750 |
5.06%, 09/12/25 (a)(b) | 300,000 | 296,361 |
3.85%, 03/01/26 | 400,000 | 383,524 |
2.76%, 09/13/26 | 250,000 | 229,573 |
3.68%, 02/22/27 | 50,000 | 48,118 |
1.54%, 07/20/27 (a)(b) | 300,000 | 264,837 |
3.29%, 07/25/27 | 200,000 | 185,728 |
1.64%, 10/13/27 (a)(b) | 250,000 | 219,995 |
2.34%, 01/19/28 (a)(b) | 200,000 | 179,074 |
3.96%, 03/02/28 | 200,000 | 190,386 |
4.08%, 04/19/28 (a)(b) | 200,000 | 189,814 |
5.02%, 07/20/28 (a)(b) | 200,000 | 196,144 |
5.35%, 09/13/28 (a)(b) | 200,000 | 198,676 |
5.42%, 02/22/29 (a)(b) | 200,000 | 198,708 |
Mizuho Financial Group, Inc. | ||
2.23%, 05/25/26 (a)(b) | 200,000 | 185,670 |
2.84%, 09/13/26 | 200,000 | 183,358 |
3.66%, 02/28/27 | 200,000 | 188,534 |
1.23%, 05/22/27 (a)(b) | 200,000 | 175,658 |
1.55%, 07/09/27 (a)(b) | 200,000 | 176,440 |
3.17%, 09/11/27 | 200,000 | 182,998 |
4.02%, 03/05/28 | 200,000 | 188,432 |
5.41%, 09/13/28 (a)(b) | 200,000 | 198,544 |
Morgan Stanley | ||
3.70%, 10/23/24 | 500,000 | 488,220 |
2.72%, 07/22/25 (a)(b) | 335,000 | 323,134 |
4.00%, 07/23/25 | 525,000 | 509,901 |
0.86%, 10/21/25 (a)(b) | 250,000 | 232,990 |
1.16%, 10/21/25 (a)(b) | 300,000 | 280,521 |
5.00%, 11/24/25 | 300,000 | 295,278 |
3.88%, 01/27/26 | 525,000 | 506,803 |
2.63%, 02/18/26 (a)(b) | 250,000 | 237,372 |
2.19%, 04/28/26 (a)(b) | 500,000 | 469,645 |
4.68%, 07/17/26 (a)(b) | 300,000 | 294,441 |
3.13%, 07/27/26 | 200,000 | 187,572 |
6.25%, 08/09/26 | 200,000 | 204,572 |
4.35%, 09/08/26 | 350,000 | 338,142 |
6.14%, 10/16/26 (a)(b) | 200,000 | 202,404 |
0.99%, 12/10/26 (a)(b) | 400,000 | 357,240 |
3.63%, 01/20/27 | 525,000 | 499,028 |
3.95%, 04/23/27 | 325,000 | 308,191 |
1.59%, 05/04/27 (a)(b) | 600,000 | 537,306 |
1.51%, 07/20/27 (a)(b) | 550,000 | 487,564 |
2.48%, 01/21/28 (a)(b) | 300,000 | 271,266 |
4.21%, 04/20/28 (a)(b) | 400,000 | 384,444 |
3.59%, 07/22/28 (a)(b) | 475,000 | 439,137 |
6.30%, 10/18/28 (a)(b) | 400,000 | 412,352 |
3.77%, 01/24/29 (a)(b) | 400,000 | 374,188 |
5.12%, 02/01/29 (a)(b) | 400,000 | 394,928 |
5.16%, 04/20/29 (a)(b) | 375,000 | 371,017 |
National Australia Bank Ltd. | ||
5.13%, 11/22/24 | 250,000 | 248,992 |
2.50%, 07/12/26 | 300,000 | 277,587 |
3.91%, 06/09/27 | 350,000 | 336,070 |
4.94%, 01/12/28 | 250,000 | 249,575 |
National Bank of Canada | ||
5.25%, 01/17/25 | 250,000 | 247,802 |
Natwest Group PLC | ||
4.80%, 04/05/26 | 300,000 | 291,495 |
7.47%, 11/10/26 (a)(b) | 200,000 | 204,764 |
1.64%, 06/14/27 (a)(b) | 300,000 | 264,261 |
SECURITY RATE, MATURITY DATE | FACE AMOUNT ($) | VALUE ($) |
3.07%, 05/22/28 (a)(b) | 200,000 | 180,132 |
5.52%, 09/30/28 (a)(b) | 200,000 | 196,364 |
4.89%, 05/18/29 (a)(b) | 200,000 | 190,566 |
3.75%, 11/01/29 (a)(b) | 200,000 | 187,834 |
Northern Trust Corp. | ||
3.95%, 10/30/25 | 175,000 | 168,772 |
4.00%, 05/10/27 (a) | 150,000 | 145,232 |
3.38%, 05/08/32 (a)(b) | 50,000 | 44,905 |
PNC Bank NA | ||
3.30%, 10/30/24 (a) | 100,000 | 96,622 |
2.95%, 02/23/25 (a) | 250,000 | 238,297 |
3.88%, 04/10/25 (a) | 250,000 | 239,415 |
3.10%, 10/25/27 (a) | 250,000 | 229,213 |
PNC Financial Services Group, Inc. | ||
2.20%, 11/01/24 (a) | 150,000 | 143,156 |
5.67%, 10/28/25 (a)(b) | 100,000 | 99,225 |
2.60%, 07/23/26 (a) | 250,000 | 231,223 |
1.15%, 08/13/26 (a) | 150,000 | 131,721 |
3.15%, 05/19/27 (a) | 100,000 | 93,001 |
5.35%, 12/02/28 (a)(b) | 150,000 | 148,392 |
5.58%, 06/12/29 (a)(b) | 400,000 | 398,408 |
Regions Financial Corp. | ||
2.25%, 05/18/25 (a) | 100,000 | 92,769 |
Royal Bank of Canada | ||
2.55%, 07/16/24 | 300,000 | 290,748 |
3.97%, 07/26/24 | 250,000 | 245,447 |
0.65%, 07/29/24 | 150,000 | 142,148 |
0.75%, 10/07/24 | 100,000 | 93,920 |
5.66%, 10/25/24 | 350,000 | 350,031 |
2.25%, 11/01/24 | 175,000 | 167,127 |
1.15%, 06/10/25 | 350,000 | 323,036 |
4.88%, 01/12/26 | 150,000 | 148,335 |
0.88%, 01/20/26 | 150,000 | 134,327 |
4.65%, 01/27/26 | 275,000 | 267,913 |
1.20%, 04/27/26 | 325,000 | 290,075 |
1.15%, 07/14/26 | 150,000 | 133,017 |
1.40%, 11/02/26 | 200,000 | 176,494 |
2.05%, 01/21/27 | 175,000 | 157,281 |
3.63%, 05/04/27 | 250,000 | 236,712 |
4.24%, 08/03/27 | 200,000 | 193,350 |
6.00%, 11/01/27 | 150,000 | 154,043 |
Santander Holdings USA, Inc. | ||
3.45%, 06/02/25 (a) | 150,000 | 141,554 |
4.50%, 07/17/25 (a) | 150,000 | 145,943 |
5.81%, 09/09/26 (a)(b) | 100,000 | 98,705 |
3.24%, 10/05/26 (a)(c) | 150,000 | 135,215 |
4.40%, 07/13/27 (a) | 150,000 | 141,500 |
2.49%, 01/06/28 (a)(b) | 175,000 | 151,522 |
6.50%, 03/09/29 (a)(b) | 150,000 | 148,598 |
6.57%, 06/12/29 (a)(b) | 100,000 | 98,277 |
Santander UK Group Holdings PLC | ||
1.53%, 08/21/26 (a)(b) | 200,000 | 178,218 |
1.67%, 06/14/27 (a)(b) | 200,000 | 173,308 |
2.47%, 01/11/28 (a)(b) | 200,000 | 174,888 |
3.82%, 11/03/28 (a)(b) | 200,000 | 180,120 |
6.53%, 01/10/29 (a)(b) | 200,000 | 201,818 |
State Street Corp. | ||
3.30%, 12/16/24 | 100,000 | 96,753 |
3.55%, 08/18/25 | 200,000 | 193,592 |
2.35%, 11/01/25 (a)(b) | 250,000 | 238,652 |
2.90%, 03/30/26 (a)(b) | 100,000 | 95,611 |
2.65%, 05/19/26 | 150,000 | 140,792 |
5.75%, 11/04/26 (a)(b) | 50,000 | 50,302 |
1.68%, 11/18/27 (a)(b) | 150,000 | 134,097 |
2.20%, 02/07/28 (a)(b) | 125,000 | 112,936 |
SECURITY RATE, MATURITY DATE | FACE AMOUNT ($) | VALUE ($) |
Sumitomo Mitsui Banking Corp. | ||
3.40%, 07/11/24 | 200,000 | 195,350 |
Sumitomo Mitsui Financial Group, Inc. | ||
2.45%, 09/27/24 | 200,000 | 191,714 |
2.35%, 01/15/25 | 250,000 | 237,110 |
1.47%, 07/08/25 | 400,000 | 367,996 |
0.95%, 01/12/26 | 100,000 | 89,286 |
5.46%, 01/13/26 | 250,000 | 249,520 |
3.78%, 03/09/26 | 300,000 | 286,842 |
2.63%, 07/14/26 | 350,000 | 322,220 |
1.40%, 09/17/26 | 300,000 | 263,982 |
3.01%, 10/19/26 | 250,000 | 231,563 |
3.45%, 01/11/27 | 250,000 | 234,850 |
3.36%, 07/12/27 | 300,000 | 280,674 |
3.35%, 10/18/27 | 250,000 | 230,830 |
5.52%, 01/13/28 | 250,000 | 251,310 |
Synchrony Financial | ||
4.25%, 08/15/24 (a) | 250,000 | 241,630 |
4.88%, 06/13/25 (a) | 100,000 | 95,291 |
4.50%, 07/23/25 (a) | 200,000 | 189,252 |
3.70%, 08/04/26 (a) | 150,000 | 134,799 |
3.95%, 12/01/27 (a) | 225,000 | 196,693 |
Synovus Financial Corp. | ||
5.20%, 08/11/25 (a) | 125,000 | 119,513 |
Toronto-Dominion Bank | ||
0.70%, 09/10/24 | 200,000 | 188,586 |
4.29%, 09/13/24 | 250,000 | 245,652 |
1.45%, 01/10/25 | 100,000 | 94,142 |
3.77%, 06/06/25 | 225,000 | 218,318 |
1.15%, 06/12/25 | 150,000 | 138,293 |
0.75%, 09/11/25 | 75,000 | 67,894 |
0.75%, 01/06/26 | 250,000 | 223,308 |
1.20%, 06/03/26 | 250,000 | 222,368 |
1.25%, 09/10/26 | 250,000 | 221,238 |
1.95%, 01/12/27 | 150,000 | 135,114 |
2.80%, 03/10/27 | 100,000 | 91,628 |
4.11%, 06/08/27 | 250,000 | 239,415 |
4.69%, 09/15/27 | 275,000 | 269,365 |
5.16%, 01/10/28 | 150,000 | 149,054 |
3.63%, 09/15/31 (a)(b) | 275,000 | 253,726 |
Truist Bank | ||
2.15%, 12/06/24 (a) | 250,000 | 235,955 |
1.50%, 03/10/25 (a) | 250,000 | 230,965 |
3.63%, 09/16/25 (a) | 250,000 | 234,125 |
4.05%, 11/03/25 (a) | 200,000 | 191,864 |
3.30%, 05/15/26 (a) | 200,000 | 183,520 |
Truist Financial Corp. | ||
2.50%, 08/01/24 (a) | 175,000 | 168,886 |
2.85%, 10/26/24 (a) | 175,000 | 168,018 |
4.00%, 05/01/25 (a) | 100,000 | 96,879 |
3.70%, 06/05/25 (a) | 150,000 | 143,952 |
1.20%, 08/05/25 (a) | 150,000 | 136,218 |
4.26%, 07/28/26 (a)(b) | 225,000 | 216,349 |
1.27%, 03/02/27 (a)(b) | 200,000 | 176,724 |
1.13%, 08/03/27 (a) | 100,000 | 84,447 |
4.12%, 06/06/28 (a)(b) | 200,000 | 188,938 |
4.87%, 01/26/29 (a)(b) | 250,000 | 240,360 |
1.89%, 06/07/29 (a)(b) | 200,000 | 166,514 |
UBS Group AG | ||
3.75%, 03/26/25 | 350,000 | 335,209 |
4.55%, 04/17/26 | 325,000 | 312,669 |
US Bancorp | ||
2.40%, 07/30/24 (a) | 200,000 | 193,064 |
3.60%, 09/11/24 (a) | 200,000 | 194,346 |
1.45%, 05/12/25 (a) | 300,000 | 280,692 |
3.95%, 11/17/25 (a) | 150,000 | 144,413 |
SECURITY RATE, MATURITY DATE | FACE AMOUNT ($) | VALUE ($) |
3.10%, 04/27/26 (a) | 150,000 | 140,135 |
2.38%, 07/22/26 (a) | 250,000 | 228,958 |
5.73%, 10/21/26 (a)(b) | 225,000 | 225,835 |
3.15%, 04/27/27 (a) | 200,000 | 185,470 |
2.22%, 01/27/28 (a)(b) | 200,000 | 177,934 |
3.90%, 04/26/28 (a) | 100,000 | 94,550 |
4.55%, 07/22/28 (a)(b) | 325,000 | 311,431 |
4.65%, 02/01/29 (a)(b) | 200,000 | 191,266 |
5.78%, 06/12/29 (a)(b) | 150,000 | 150,027 |
US Bank NA | ||
2.05%, 01/21/25 (a) | 100,000 | 94,350 |
2.80%, 01/27/25 (a) | 200,000 | 190,938 |
Valley National Bancorp | ||
3.00%, 06/15/31 (a)(b) | 50,000 | 39,934 |
Wachovia Corp. | ||
7.57%, 08/01/26 (d) | 50,000 | 52,332 |
Wells Fargo & Co. | ||
3.30%, 09/09/24 | 350,000 | 341,026 |
3.00%, 02/19/25 | 350,000 | 336,308 |
3.55%, 09/29/25 | 350,000 | 335,972 |
2.41%, 10/30/25 (a)(b) | 450,000 | 428,953 |
2.16%, 02/11/26 (a)(b) | 400,000 | 376,920 |
3.00%, 04/22/26 | 550,000 | 517,979 |
3.91%, 04/25/26 (a)(b) | 400,000 | 386,768 |
2.19%, 04/30/26 (a)(b) | 450,000 | 422,077 |
4.10%, 06/03/26 | 375,000 | 360,135 |
4.54%, 08/15/26 (a)(b) | 325,000 | 317,804 |
3.00%, 10/23/26 | 525,000 | 487,982 |
3.20%, 06/17/27 (a)(b) | 400,000 | 375,876 |
4.30%, 07/22/27 | 400,000 | 384,120 |
3.53%, 03/24/28 (a)(b) | 575,000 | 537,843 |
3.58%, 05/22/28 (a)(b) | 450,000 | 419,733 |
2.39%, 06/02/28 (a)(b) | 500,000 | 446,545 |
4.81%, 07/25/28 (a)(b) | 450,000 | 440,428 |
Westpac Banking Corp. | ||
2.35%, 02/19/25 | 175,000 | 166,814 |
3.74%, 08/26/25 | 150,000 | 144,851 |
2.85%, 05/13/26 | 250,000 | 235,467 |
1.15%, 06/03/26 | 250,000 | 222,830 |
2.70%, 08/19/26 | 200,000 | 185,890 |
3.35%, 03/08/27 | 150,000 | 141,588 |
4.04%, 08/26/27 | 200,000 | 194,472 |
5.46%, 11/18/27 | 200,000 | 203,302 |
3.40%, 01/25/28 | 100,000 | 93,984 |
2.89%, 02/04/30 (a)(b) | 225,000 | 210,350 |
4.32%, 11/23/31 (a)(b) | 275,000 | 255,203 |
128,731,153 | ||
Brokerage/Asset Managers/Exchanges 1.4% | ||
Affiliated Managers Group, Inc. | ||
3.50%, 08/01/25 | 75,000 | 71,197 |
Ameriprise Financial, Inc. | ||
3.70%, 10/15/24 | 100,000 | 97,589 |
3.00%, 04/02/25 (a) | 100,000 | 95,364 |
2.88%, 09/15/26 (a) | 100,000 | 93,356 |
BGC Partners, Inc. | ||
3.75%, 10/01/24 (a) | 75,000 | 70,953 |
BlackRock, Inc. | ||
3.20%, 03/15/27 | 125,000 | 118,579 |
Brookfield Corp. | ||
4.00%, 01/15/25 (a) | 100,000 | 97,194 |
Brookfield Finance, Inc. | ||
4.25%, 06/02/26 (a) | 100,000 | 96,388 |
3.90%, 01/25/28 (a) | 175,000 | 162,442 |
SECURITY RATE, MATURITY DATE | FACE AMOUNT ($) | VALUE ($) |
Cboe Global Markets, Inc. | ||
3.65%, 01/12/27 (a) | 100,000 | 95,087 |
CME Group, Inc. | ||
3.00%, 03/15/25 (a) | 150,000 | 144,654 |
E*TRADE Financial Corp. | ||
3.80%, 08/24/27 (a) | 75,000 | 71,035 |
Eaton Vance Corp. | ||
3.50%, 04/06/27 (a) | 50,000 | 46,650 |
Franklin Resources, Inc. | ||
2.85%, 03/30/25 | 100,000 | 95,256 |
Intercontinental Exchange, Inc. | ||
3.65%, 05/23/25 (a) | 100,000 | 98,069 |
3.75%, 12/01/25 (a) | 250,000 | 242,762 |
3.10%, 09/15/27 (a) | 75,000 | 70,219 |
4.00%, 09/15/27 (a) | 250,000 | 243,860 |
Invesco Finance PLC | ||
3.75%, 01/15/26 | 100,000 | 96,578 |
Janus Capital Group, Inc. | ||
4.88%, 08/01/25 (a) | 75,000 | 73,785 |
Jefferies Financial Group, Inc. | ||
4.85%, 01/15/27 | 200,000 | 196,158 |
Lazard Group LLC | ||
3.75%, 02/13/25 | 100,000 | 96,378 |
3.63%, 03/01/27 (a) | 50,000 | 46,606 |
Legg Mason, Inc. | ||
4.75%, 03/15/26 | 125,000 | 123,337 |
Nasdaq, Inc. | ||
3.85%, 06/30/26 (a) | 100,000 | 96,343 |
Nomura Holdings, Inc. | ||
2.65%, 01/16/25 | 200,000 | 189,216 |
5.10%, 07/03/25 | 200,000 | 196,694 |
1.85%, 07/16/25 | 200,000 | 183,152 |
1.65%, 07/14/26 | 200,000 | 176,050 |
2.33%, 01/22/27 | 200,000 | 177,104 |
5.39%, 07/06/27 | 200,000 | 196,762 |
The Charles Schwab Corp. | ||
3.00%, 03/10/25 (a)(e) | 25,000 | 23,896 |
4.20%, 03/24/25 (a)(e) | 75,000 | 73,267 |
3.63%, 04/01/25 (a)(e) | 50,000 | 48,109 |
3.85%, 05/21/25 (a)(e) | 95,000 | 91,717 |
3.45%, 02/13/26 (a)(e) | 30,000 | 28,411 |
0.90%, 03/11/26 (a)(e) | 175,000 | 154,688 |
1.15%, 05/13/26 (a)(e) | 125,000 | 110,679 |
3.20%, 03/02/27 (a)(e) | 75,000 | 69,509 |
2.45%, 03/03/27 (a)(e) | 200,000 | 179,846 |
3.30%, 04/01/27 (a)(e) | 50,000 | 46,393 |
3.20%, 01/25/28 (a)(e) | 50,000 | 45,747 |
2.00%, 03/20/28 (a)(e) | 160,000 | 138,498 |
5.64%, 05/19/29 (a)(b)(e) | 150,000 | 151,081 |
5,020,658 | ||
Finance Companies 2.2% | ||
AerCap Ireland Capital DAC/AerCap Global Aviation Trust | ||
2.88%, 08/14/24 (a) | 175,000 | 168,229 |
1.65%, 10/29/24 (a) | 350,000 | 328,979 |
3.50%, 01/15/25 (a) | 150,000 | 144,454 |
6.50%, 07/15/25 (a) | 150,000 | 150,903 |
4.45%, 10/01/25 (a) | 150,000 | 144,453 |
1.75%, 01/30/26 (a) | 150,000 | 134,799 |
4.45%, 04/03/26 (a) | 150,000 | 143,572 |
2.45%, 10/29/26 (a) | 600,000 | 536,658 |
3.65%, 07/21/27 (a) | 200,000 | 183,836 |
3.88%, 01/23/28 (a) | 100,000 | 92,175 |
5.75%, 06/06/28 (a) | 150,000 | 149,140 |
SECURITY RATE, MATURITY DATE | FACE AMOUNT ($) | VALUE ($) |
Air Lease Corp. | ||
0.80%, 08/18/24 (a) | 100,000 | 94,255 |
2.30%, 02/01/25 (a) | 100,000 | 94,210 |
3.25%, 03/01/25 (a) | 125,000 | 119,406 |
3.38%, 07/01/25 (a) | 125,000 | 118,405 |
2.88%, 01/15/26 (a) | 225,000 | 208,471 |
3.75%, 06/01/26 (a) | 125,000 | 118,294 |
1.88%, 08/15/26 (a) | 200,000 | 177,932 |
2.20%, 01/15/27 (a) | 100,000 | 88,781 |
3.63%, 04/01/27 (a) | 100,000 | 92,510 |
3.63%, 12/01/27 (a) | 250,000 | 228,690 |
Aircastle Ltd. | ||
4.25%, 06/15/26 (a) | 125,000 | 117,921 |
Ares Capital Corp. | ||
4.25%, 03/01/25 (a) | 95,000 | 90,765 |
3.25%, 07/15/25 (a) | 225,000 | 208,215 |
3.88%, 01/15/26 (a) | 200,000 | 185,710 |
2.15%, 07/15/26 (a) | 175,000 | 152,178 |
2.88%, 06/15/28 (a) | 150,000 | 124,189 |
Bain Capital Specialty Finance, Inc. | ||
2.95%, 03/10/26 (a) | 100,000 | 88,987 |
Barings BDC, Inc. | ||
3.30%, 11/23/26 (a) | 50,000 | 43,817 |
BlackRock TCP Capital Corp. | ||
2.85%, 02/09/26 (a) | 75,000 | 67,441 |
Blackstone Private Credit Fund | ||
1.75%, 09/15/24 | 75,000 | 70,393 |
2.35%, 11/22/24 | 75,000 | 70,231 |
2.70%, 01/15/25 (a) | 75,000 | 70,174 |
4.70%, 03/24/25 | 150,000 | 144,651 |
2.63%, 12/15/26 (a) | 225,000 | 192,483 |
3.25%, 03/15/27 (a) | 175,000 | 151,326 |
Blackstone Secured Lending Fund | ||
3.63%, 01/15/26 (a) | 125,000 | 115,015 |
2.75%, 09/16/26 (a) | 100,000 | 87,491 |
2.13%, 02/15/27 (a) | 100,000 | 84,694 |
FS KKR Capital Corp. | ||
4.63%, 07/15/24 (a) | 25,000 | 24,281 |
4.13%, 02/01/25 (a) | 160,000 | 152,222 |
3.40%, 01/15/26 (a) | 200,000 | 182,050 |
3.25%, 07/15/27 (a) | 100,000 | 86,078 |
GATX Corp. | ||
3.25%, 03/30/25 (a) | 50,000 | 47,671 |
3.25%, 09/15/26 (a) | 100,000 | 92,438 |
Goldman Sachs BDC, Inc. | ||
3.75%, 02/10/25 (a) | 60,000 | 57,374 |
2.88%, 01/15/26 (a) | 100,000 | 92,038 |
Golub Capital BDC, Inc. | ||
2.50%, 08/24/26 (a) | 100,000 | 86,857 |
2.05%, 02/15/27 (a) | 75,000 | 63,159 |
Hercules Capital, Inc. | ||
2.63%, 09/16/26 (a) | 75,000 | 64,253 |
3.38%, 01/20/27 (a) | 25,000 | 21,703 |
Main Street Capital Corp. | ||
3.00%, 07/14/26 (a) | 100,000 | 88,114 |
Morgan Stanley Direct Lending Fund | ||
4.50%, 02/11/27 (a) | 75,000 | 70,652 |
Oaktree Specialty Lending Corp. | ||
3.50%, 02/25/25 (a) | 60,000 | 56,916 |
2.70%, 01/15/27 (a) | 50,000 | 43,205 |
Owl Rock Capital Corp. | ||
4.00%, 03/30/25 (a) | 105,000 | 98,829 |
3.75%, 07/22/25 (a) | 100,000 | 92,713 |
4.25%, 01/15/26 (a) | 100,000 | 92,701 |
SECURITY RATE, MATURITY DATE | FACE AMOUNT ($) | VALUE ($) |
3.40%, 07/15/26 (a) | 150,000 | 133,230 |
2.88%, 06/11/28 (a) | 100,000 | 81,695 |
Owl Rock Capital Corp. III | ||
3.13%, 04/13/27 (a) | 50,000 | 42,411 |
Owl Rock Core Income Corp. | ||
3.13%, 09/23/26 (a) | 75,000 | 65,077 |
4.70%, 02/08/27 (a) | 100,000 | 91,147 |
7.75%, 09/16/27 (a)(c) | 100,000 | 99,183 |
7.95%, 06/13/28 (a)(c) | 100,000 | 100,364 |
Owl Rock Technology Finance Corp. | ||
2.50%, 01/15/27 (a) | 50,000 | 41,586 |
Prospect Capital Corp. | ||
3.71%, 01/22/26 (a) | 75,000 | 66,559 |
3.36%, 11/15/26 (a) | 50,000 | 42,150 |
Sixth Street Specialty Lending, Inc. | ||
3.88%, 11/01/24 (a) | 95,000 | 91,906 |
7,952,395 | ||
Financial Other 0.1% | ||
Andrew W Mellon Foundation | ||
0.95%, 08/01/27 (a) | 50,000 | 43,202 |
ORIX Corp. | ||
3.25%, 12/04/24 | 125,000 | 120,187 |
3.70%, 07/18/27 | 50,000 | 47,197 |
5.00%, 09/13/27 | 100,000 | 98,965 |
309,551 | ||
Insurance 2.8% | ||
Aegon N.V. | ||
5.50%, 04/11/48 (a)(b) | 200,000 | 190,974 |
Aetna, Inc. | ||
3.50%, 11/15/24 (a) | 150,000 | 145,726 |
Aflac, Inc. | ||
1.13%, 03/15/26 (a) | 75,000 | 67,264 |
2.88%, 10/15/26 (a) | 75,000 | 69,590 |
Allied World Assurance Co., Holdings Ltd. | ||
4.35%, 10/29/25 (a) | 100,000 | 95,691 |
Allstate Corp. | ||
0.75%, 12/15/25 (a) | 150,000 | 134,550 |
American Equity Investment Life Holding Co. | ||
5.00%, 06/15/27 (a) | 100,000 | 96,672 |
American International Group, Inc. | ||
2.50%, 06/30/25 (a) | 167,000 | 157,549 |
3.90%, 04/01/26 (a) | 150,000 | 144,237 |
5.75%, 04/01/48 (a)(b) | 100,000 | 97,058 |
Anthem, Inc. | ||
3.50%, 08/15/24 (a) | 175,000 | 170,625 |
3.35%, 12/01/24 (a) | 125,000 | 121,000 |
2.38%, 01/15/25 (a) | 200,000 | 190,280 |
3.65%, 12/01/27 (a) | 300,000 | 283,794 |
4.10%, 03/01/28 (a) | 150,000 | 144,203 |
Aon Corp. | ||
8.21%, 01/01/27 | 100,000 | 101,766 |
Aon Corp./Aon Global Holdings PLC | ||
2.85%, 05/28/27 (a) | 100,000 | 91,643 |
Aon PLC | ||
3.88%, 12/15/25 (a) | 125,000 | 120,614 |
Arch Capital Finance LLC | ||
4.01%, 12/15/26 (a) | 100,000 | 95,480 |
Assured Guaranty US Holdings, Inc. | ||
5.00%, 07/01/24 | 91,000 | 89,563 |
SECURITY RATE, MATURITY DATE | FACE AMOUNT ($) | VALUE ($) |
Athene Holding Ltd. | ||
4.13%, 01/12/28 (a) | 175,000 | 159,724 |
Berkshire Hathaway, Inc. | ||
3.13%, 03/15/26 (a) | 475,000 | 457,776 |
Brighthouse Financial, Inc. | ||
3.70%, 06/22/27 (a) | 100,000 | 91,961 |
Brown & Brown, Inc. | ||
4.20%, 09/15/24 (a) | 70,000 | 68,513 |
Centene Corp. | ||
4.25%, 12/15/27 (a) | 350,000 | 327,946 |
Chubb INA Holdings, Inc. | ||
3.15%, 03/15/25 | 150,000 | 145,210 |
3.35%, 05/03/26 (a) | 250,000 | 240,515 |
CNA Financial Corp. | ||
4.50%, 03/01/26 (a) | 75,000 | 72,852 |
3.45%, 08/15/27 (a) | 100,000 | 93,161 |
CNO Financial Group, Inc. | ||
5.25%, 05/30/25 (a) | 125,000 | 123,054 |
Corebridge Financial, Inc. | ||
3.50%, 04/04/25 (a) | 150,000 | 143,052 |
3.65%, 04/05/27 (a) | 200,000 | 186,204 |
6.88%, 12/15/52 (a)(b) | 150,000 | 143,894 |
Elevance Health, Inc. | ||
1.50%, 03/15/26 (a) | 125,000 | 113,071 |
Equitable Holdings, Inc. | ||
4.35%, 04/20/28 (a) | 200,000 | 187,438 |
F&G Annuities & Life, Inc. | ||
7.40%, 01/13/28 (a)(c) | 100,000 | 100,003 |
Fairfax Financial Holdings Ltd. | ||
4.85%, 04/17/28 (a) | 100,000 | 96,334 |
First American Financial Corp. | ||
4.60%, 11/15/24 | 75,000 | 73,520 |
Hanover Insurance Group, Inc. | ||
4.50%, 04/15/26 (a) | 75,000 | 72,715 |
Humana, Inc. | ||
3.85%, 10/01/24 (a) | 175,000 | 171,251 |
4.50%, 04/01/25 (a) | 100,000 | 98,389 |
1.35%, 02/03/27 (a) | 125,000 | 108,921 |
3.95%, 03/15/27 (a) | 100,000 | 95,714 |
5.75%, 03/01/28 (a) | 75,000 | 76,501 |
Jackson Financial, Inc. | ||
5.17%, 06/08/27 (a) | 75,000 | 71,657 |
Kemper Corp. | ||
4.35%, 02/15/25 (a) | 70,000 | 67,399 |
Lincoln National Corp. | ||
3.63%, 12/12/26 (a) | 100,000 | 93,144 |
3.80%, 03/01/28 (a) | 100,000 | 90,479 |
Loews Corp. | ||
3.75%, 04/01/26 (a) | 100,000 | 97,023 |
Manulife Financial Corp. | ||
4.15%, 03/04/26 | 250,000 | 242,400 |
4.06%, 02/24/32 (a)(b) | 125,000 | 117,093 |
Markel Corp. | ||
3.50%, 11/01/27 (a) | 50,000 | 46,635 |
Marsh & McLennan Cos., Inc. | ||
3.50%, 03/10/25 (a) | 100,000 | 97,071 |
3.75%, 03/14/26 (a) | 100,000 | 97,048 |
Mercury General Corp. | ||
4.40%, 03/15/27 (a) | 75,000 | 71,097 |
MetLife, Inc. | ||
3.00%, 03/01/25 | 100,000 | 96,731 |
3.60%, 11/13/25 (a) | 75,000 | 72,242 |
SECURITY RATE, MATURITY DATE | FACE AMOUNT ($) | VALUE ($) |
Old Republic International Corp. | ||
4.88%, 10/01/24 (a) | 75,000 | 73,923 |
3.88%, 08/26/26 (a) | 75,000 | 70,845 |
Principal Financial Group, Inc. | ||
3.40%, 05/15/25 (a) | 100,000 | 95,964 |
Prudential Financial, Inc. | ||
1.50%, 03/10/26 (a) | 100,000 | 91,527 |
5.38%, 05/15/45 (a)(b) | 175,000 | 171,003 |
4.50%, 09/15/47 (a)(b) | 125,000 | 114,894 |
Radian Group, Inc. | ||
4.50%, 10/01/24 (a) | 75,000 | 73,187 |
6.63%, 03/15/25 (a) | 100,000 | 100,028 |
4.88%, 03/15/27 (a) | 75,000 | 71,027 |
Reinsurance Group of America, Inc. | ||
3.95%, 09/15/26 (a) | 75,000 | 70,988 |
RenaissanceRe Finance, Inc. | ||
3.70%, 04/01/25 (a) | 45,000 | 43,527 |
The Progressive Corp. | ||
2.45%, 01/15/27 | 100,000 | 91,982 |
2.50%, 03/15/27 (a) | 75,000 | 69,003 |
Trinity Acquisition PLC | ||
4.40%, 03/15/26 (a) | 100,000 | 96,562 |
UnitedHealth Group, Inc. | ||
2.38%, 08/15/24 | 100,000 | 96,696 |
3.75%, 07/15/25 | 300,000 | 292,074 |
5.15%, 10/15/25 | 100,000 | 100,296 |
3.70%, 12/15/25 | 100,000 | 96,668 |
1.25%, 01/15/26 | 100,000 | 91,388 |
3.10%, 03/15/26 | 200,000 | 191,448 |
1.15%, 05/15/26 (a) | 200,000 | 180,974 |
3.45%, 01/15/27 | 125,000 | 119,944 |
3.70%, 05/15/27 (a) | 150,000 | 144,760 |
2.95%, 10/15/27 | 225,000 | 208,982 |
5.25%, 02/15/28 (a) | 100,000 | 102,090 |
Voya Financial, Inc. | ||
3.65%, 06/15/26 | 100,000 | 94,072 |
Willis North America, Inc. | ||
4.65%, 06/15/27 (a) | 100,000 | 97,250 |
10,367,119 | ||
REITs 2.7% | ||
Alexandria Real Estate Equities, Inc. | ||
3.45%, 04/30/25 (a) | 100,000 | 95,880 |
4.30%, 01/15/26 (a) | 50,000 | 48,372 |
3.95%, 01/15/27 (a) | 125,000 | 118,699 |
3.95%, 01/15/28 (a) | 75,000 | 70,066 |
AvalonBay Communities, Inc. | ||
3.50%, 11/15/24 (a) | 100,000 | 97,114 |
3.45%, 06/01/25 (a) | 75,000 | 72,363 |
3.50%, 11/15/25 (a) | 100,000 | 95,641 |
2.95%, 05/11/26 (a) | 125,000 | 117,734 |
3.35%, 05/15/27 (a) | 50,000 | 46,788 |
Boston Properties LP | ||
3.20%, 01/15/25 (a) | 170,000 | 161,354 |
3.65%, 02/01/26 (a) | 200,000 | 186,178 |
6.75%, 12/01/27 (a) | 125,000 | 126,474 |
Brandywine Operating Partnership LP | ||
4.10%, 10/01/24 (a) | 50,000 | 47,601 |
3.95%, 11/15/27 (a) | 75,000 | 59,559 |
7.55%, 03/15/28 (a) | 50,000 | 45,802 |
Brixmor Operating Partnership LP | ||
3.85%, 02/01/25 (a) | 20,000 | 19,199 |
4.13%, 06/15/26 (a) | 150,000 | 140,589 |
2.25%, 04/01/28 (a) | 50,000 | 42,231 |
SECURITY RATE, MATURITY DATE | FACE AMOUNT ($) | VALUE ($) |
Corporate Office Properties LP | ||
2.25%, 03/15/26 (a) | 75,000 | 66,448 |
CubeSmart LP | ||
4.00%, 11/15/25 (a) | 100,000 | 94,979 |
Digital Realty Trust LP | ||
3.70%, 08/15/27 (a) | 150,000 | 138,801 |
5.55%, 01/15/28 (a) | 150,000 | 148,488 |
EPR Properties | ||
4.75%, 12/15/26 (a) | 25,000 | 22,870 |
4.50%, 06/01/27 (a) | 100,000 | 90,084 |
4.95%, 04/15/28 (a) | 75,000 | 67,205 |
ERP Operating LP | ||
3.25%, 08/01/27 (a) | 175,000 | 161,436 |
3.50%, 03/01/28 (a) | 100,000 | 92,848 |
Essex Portfolio LP | ||
3.50%, 04/01/25 (a) | 15,000 | 14,437 |
3.63%, 05/01/27 (a) | 100,000 | 93,554 |
1.70%, 03/01/28 (a) | 100,000 | 84,594 |
Extra Space Storage LP | ||
5.70%, 04/01/28 (a) | 75,000 | 75,016 |
Federal Realty Investment Trust | ||
1.25%, 02/15/26 (a) | 100,000 | 89,535 |
Federal Realty OP LP | ||
5.38%, 05/01/28 (a) | 100,000 | 98,611 |
Healthcare Trust of America Holdings LP | ||
3.50%, 08/01/26 (a) | 125,000 | 115,467 |
Healthpeak Properties, Inc. | ||
3.40%, 02/01/25 (a) | 25,000 | 24,045 |
4.00%, 06/01/25 (a) | 150,000 | 144,927 |
1.35%, 02/01/27 (a) | 150,000 | 130,161 |
Highwoods Realty LP | ||
3.88%, 03/01/27 (a) | 50,000 | 45,269 |
4.13%, 03/15/28 (a) | 50,000 | 43,932 |
Host Hotels & Resorts LP | ||
4.50%, 02/01/26 (a) | 100,000 | 97,030 |
Hudson Pacific Properties LP | ||
3.95%, 11/01/27 (a) | 50,000 | 36,725 |
5.95%, 02/15/28 (a) | 75,000 | 60,445 |
Kilroy Realty LP | ||
3.45%, 12/15/24 (a) | 100,000 | 95,019 |
4.38%, 10/01/25 (a) | 50,000 | 46,867 |
Kimco Realty Corp. | ||
3.30%, 02/01/25 (a) | 125,000 | 119,736 |
2.80%, 10/01/26 (a) | 150,000 | 137,233 |
Kite Realty Group LP | ||
4.00%, 10/01/26 (a) | 100,000 | 90,933 |
Life Storage LP | ||
3.50%, 07/01/26 (a) | 100,000 | 94,192 |
3.88%, 12/15/27 (a) | 100,000 | 93,121 |
Mid-America Apartments LP | ||
4.00%, 11/15/25 (a) | 100,000 | 96,875 |
1.10%, 09/15/26 (a) | 125,000 | 109,260 |
National Retail Properties, Inc. | ||
4.00%, 11/15/25 (a) | 100,000 | 95,315 |
3.50%, 10/15/27 (a) | 100,000 | 91,911 |
Omega Healthcare Investors, Inc. | ||
4.50%, 01/15/25 (a) | 50,000 | 48,124 |
5.25%, 01/15/26 (a) | 100,000 | 96,382 |
4.50%, 04/01/27 (a) | 125,000 | 116,647 |
4.75%, 01/15/28 (a) | 100,000 | 91,654 |
Physicians Realty LP | ||
4.30%, 03/15/27 (a) | 75,000 | 70,754 |
SECURITY RATE, MATURITY DATE | FACE AMOUNT ($) | VALUE ($) |
Prologis LP | ||
3.25%, 06/30/26 (a) | 75,000 | 71,159 |
3.25%, 10/01/26 (a) | 75,000 | 71,120 |
3.38%, 12/15/27 (a) | 100,000 | 93,324 |
Public Storage | ||
0.88%, 02/15/26 (a) | 100,000 | 89,733 |
1.50%, 11/09/26 (a) | 175,000 | 156,928 |
3.09%, 09/15/27 (a) | 100,000 | 93,369 |
Realty Income Corp. | ||
3.88%, 07/15/24 (a) | 75,000 | 73,380 |
4.63%, 11/01/25 (a) | 150,000 | 147,685 |
0.75%, 03/15/26 (a) | 75,000 | 66,002 |
4.88%, 06/01/26 (a) | 75,000 | 74,312 |
4.13%, 10/15/26 (a) | 100,000 | 95,915 |
3.00%, 01/15/27 (a) | 150,000 | 138,655 |
3.95%, 08/15/27 (a) | 100,000 | 95,182 |
3.40%, 01/15/28 (a) | 100,000 | 92,272 |
Regency Centers LP | ||
3.60%, 02/01/27 (a) | 100,000 | 94,352 |
Rexford Industrial Realty LP | ||
5.00%, 06/15/28 (a) | 100,000 | 97,477 |
Sabra Health Care LP | ||
5.13%, 08/15/26 (a) | 100,000 | 94,453 |
Simon Property Group LP | ||
2.00%, 09/13/24 (a) | 150,000 | 143,196 |
3.38%, 10/01/24 (a) | 100,000 | 97,097 |
3.50%, 09/01/25 (a) | 225,000 | 215,773 |
3.30%, 01/15/26 (a) | 150,000 | 142,851 |
3.25%, 11/30/26 (a) | 175,000 | 164,187 |
1.38%, 01/15/27 (a) | 75,000 | 65,797 |
3.38%, 06/15/27 (a) | 150,000 | 139,510 |
3.38%, 12/01/27 (a) | 125,000 | 115,890 |
SITE Centers Corp. | ||
3.63%, 02/01/25 (a) | 75,000 | 70,739 |
4.25%, 02/01/26 (a) | 100,000 | 94,086 |
4.70%, 06/01/27 (a) | 50,000 | 46,192 |
Spirit Realty LP | ||
3.20%, 01/15/27 (a) | 100,000 | 90,179 |
2.10%, 03/15/28 (a) | 100,000 | 84,183 |
STORE Capital Corp. | ||
4.50%, 03/15/28 (a) | 50,000 | 43,936 |
Tanger Properties LP | ||
3.13%, 09/01/26 (a) | 50,000 | 44,420 |
3.88%, 07/15/27 (a) | 50,000 | 45,045 |
UDR, Inc. | ||
2.95%, 09/01/26 (a) | 100,000 | 91,701 |
3.50%, 07/01/27 (a) | 100,000 | 93,660 |
Ventas Realty LP | ||
2.65%, 01/15/25 (a) | 110,000 | 103,710 |
4.13%, 01/15/26 (a) | 130,000 | 124,441 |
3.25%, 10/15/26 (a) | 100,000 | 91,824 |
4.00%, 03/01/28 (a) | 100,000 | 93,111 |
Vornado Realty LP | ||
3.50%, 01/15/25 (a) | 75,000 | 70,662 |
2.15%, 06/01/26 (a) | 50,000 | 42,390 |
Welltower, Inc. | ||
4.00%, 06/01/25 (a) | 200,000 | 193,350 |
4.25%, 04/01/26 (a) | 125,000 | 120,934 |
2.70%, 02/15/27 (a) | 100,000 | 90,885 |
4.25%, 04/15/28 (a) | 100,000 | 94,437 |
SECURITY RATE, MATURITY DATE | FACE AMOUNT ($) | VALUE ($) |
WP Carey, Inc. | ||
4.00%, 02/01/25 (a) | 75,000 | 72,848 |
4.25%, 10/01/26 (a) | 50,000 | 48,032 |
9,702,958 | ||
162,083,834 | ||
Industrial 48.5% | ||
Basic Industry 1.8% | ||
Air Products and Chemicals, Inc. | ||
3.35%, 07/31/24 (a) | 75,000 | 73,116 |
1.50%, 10/15/25 (a) | 100,000 | 92,409 |
1.85%, 05/15/27 (a) | 100,000 | 90,015 |
Albemarle Corp. | ||
4.65%, 06/01/27 (a) | 100,000 | 97,535 |
ArcelorMittal S.A. | ||
4.55%, 03/11/26 | 75,000 | 73,322 |
6.55%, 11/29/27 (a) | 150,000 | 154,219 |
BHP Billiton Finance USA Ltd. | ||
4.88%, 02/27/26 | 150,000 | 149,284 |
4.75%, 02/28/28 (a) | 175,000 | 174,111 |
Celanese US Holdings LLC | ||
5.90%, 07/05/24 | 325,000 | 324,373 |
6.05%, 03/15/25 | 275,000 | 274,002 |
1.40%, 08/05/26 (a) | 50,000 | 43,362 |
6.17%, 07/15/27 (a) | 325,000 | 324,421 |
Celulosa Arauco y Constitucion S.A. | ||
3.88%, 11/02/27 (a) | 200,000 | 184,188 |
DuPont de Nemours, Inc. | ||
4.49%, 11/15/25 (a) | 325,000 | 318,503 |
Eastman Chemical Co. | ||
3.80%, 03/15/25 (a) | 150,000 | 146,155 |
Ecolab, Inc. | ||
2.70%, 11/01/26 (a) | 100,000 | 94,172 |
1.65%, 02/01/27 (a) | 100,000 | 90,012 |
3.25%, 12/01/27 (a) | 100,000 | 94,178 |
5.25%, 01/15/28 (a) | 100,000 | 101,693 |
EI du Pont de Nemours and Co. | ||
1.70%, 07/15/25 (a) | 100,000 | 93,046 |
Fibria Overseas Finance Ltd. | ||
4.00%, 01/14/25 (a) | 50,000 | 48,547 |
5.50%, 01/17/27 | 100,000 | 100,235 |
FMC Corp. | ||
3.20%, 10/01/26 (a) | 100,000 | 93,029 |
Freeport-McMoRan, Inc. | ||
4.55%, 11/14/24 (a) | 200,000 | 197,304 |
4.13%, 03/01/28 (a) | 100,000 | 94,047 |
Kinross Gold Corp. | ||
4.50%, 07/15/27 (a) | 100,000 | 95,854 |
Linde, Inc. | ||
2.65%, 02/05/25 (a) | 15,000 | 14,399 |
4.70%, 12/05/25 (a) | 175,000 | 173,822 |
3.20%, 01/30/26 (a) | 125,000 | 120,780 |
LYB International Finance II BV | ||
3.50%, 03/02/27 (a) | 100,000 | 94,724 |
LYB International Finance III LLC | ||
1.25%, 10/01/25 (a) | 75,000 | 67,921 |
Mosaic Co. | ||
4.05%, 11/15/27 (a) | 125,000 | 119,175 |
Nucor Corp. | ||
2.00%, 06/01/25 (a) | 100,000 | 93,575 |
4.30%, 05/23/27 (a) | 150,000 | 146,007 |
SECURITY RATE, MATURITY DATE | FACE AMOUNT ($) | VALUE ($) |
Nutrien Ltd. | ||
5.90%, 11/07/24 | 100,000 | 100,167 |
3.00%, 04/01/25 (a) | 50,000 | 47,599 |
4.00%, 12/15/26 (a) | 75,000 | 72,066 |
4.90%, 03/27/28 (a) | 150,000 | 147,675 |
Packaging Corp. of America | ||
3.65%, 09/15/24 (a) | 100,000 | 97,848 |
PPG Industries, Inc. | ||
2.40%, 08/15/24 (a) | 50,000 | 48,096 |
1.20%, 03/15/26 (a) | 150,000 | 134,562 |
Reliance Steel & Aluminum Co. | ||
1.30%, 08/15/25 (a) | 75,000 | 68,651 |
RPM International, Inc. | ||
3.75%, 03/15/27 (a) | 75,000 | 70,445 |
Sherwin-Williams Co. | ||
3.45%, 08/01/25 (a) | 75,000 | 72,092 |
4.25%, 08/08/25 | 25,000 | 24,498 |
3.95%, 01/15/26 (a) | 75,000 | 72,741 |
3.45%, 06/01/27 (a) | 250,000 | 236,012 |
Southern Copper Corp. | ||
3.88%, 04/23/25 | 100,000 | 97,358 |
Steel Dynamics, Inc. | ||
2.80%, 12/15/24 (a) | 75,000 | 71,714 |
2.40%, 06/15/25 (a) | 75,000 | 70,223 |
5.00%, 12/15/26 (a) | 75,000 | 73,842 |
1.65%, 10/15/27 (a) | 50,000 | 42,865 |
Westlake Chemical Corp. | ||
3.60%, 08/15/26 (a) | 125,000 | 117,771 |
Westlake Corp. | ||
0.88%, 08/15/24 (a) | 50,000 | 47,273 |
Weyerhaeuser Co. | ||
6.95%, 10/01/27 | 50,000 | 53,032 |
WRKCo, Inc. | ||
3.00%, 09/15/24 (a) | 100,000 | 96,473 |
3.75%, 03/15/25 (a) | 100,000 | 96,404 |
4.65%, 03/15/26 (a) | 150,000 | 145,721 |
4.00%, 03/15/28 (a) | 100,000 | 93,187 |
6,649,850 | ||
Capital Goods 5.1% | ||
3M Co. | ||
2.00%, 02/14/25 (a) | 120,000 | 113,280 |
2.65%, 04/15/25 (a) | 200,000 | 190,422 |
3.00%, 08/07/25 | 100,000 | 95,594 |
2.88%, 10/15/27 (a) | 150,000 | 137,388 |
Allegion US Holding Co., Inc. | ||
3.20%, 10/01/24 (a) | 100,000 | 96,459 |
3.55%, 10/01/27 (a) | 50,000 | 46,325 |
Amcor Finance USA, Inc. | ||
3.63%, 04/28/26 (a) | 125,000 | 118,291 |
4.50%, 05/15/28 (a) | 100,000 | 95,325 |
Amphenol Corp. | ||
2.05%, 03/01/25 (a) | 100,000 | 94,512 |
Berry Global, Inc. | ||
1.57%, 01/15/26 (a) | 250,000 | 225,765 |
1.65%, 01/15/27 (a) | 100,000 | 86,510 |
Boeing Co. | ||
2.85%, 10/30/24 (a) | 50,000 | 48,131 |
4.88%, 05/01/25 (a) | 500,000 | 493,000 |
2.60%, 10/30/25 (a) | 50,000 | 46,598 |
2.75%, 02/01/26 (a) | 250,000 | 233,052 |
2.20%, 02/04/26 (a) | 850,000 | 780,835 |
3.10%, 05/01/26 (a) | 100,000 | 94,088 |
2.25%, 06/15/26 (a) | 75,000 | 68,204 |
SECURITY RATE, MATURITY DATE | FACE AMOUNT ($) | VALUE ($) |
2.70%, 02/01/27 (a) | 150,000 | 137,189 |
2.80%, 03/01/27 (a) | 100,000 | 91,351 |
5.04%, 05/01/27 (a) | 300,000 | 296,760 |
3.25%, 02/01/28 (a) | 150,000 | 137,930 |
Carlisle Cos., Inc. | ||
3.50%, 12/01/24 (a) | 104,000 | 100,513 |
3.75%, 12/01/27 (a) | 100,000 | 95,020 |
Carrier Global Corp. | ||
2.24%, 02/15/25 (a) | 205,000 | 194,053 |
2.49%, 02/15/27 (a) | 150,000 | 136,857 |
Caterpillar Financial Services Corp. | ||
2.15%, 11/08/24 | 125,000 | 119,833 |
4.90%, 01/17/25 | 175,000 | 174,303 |
3.40%, 05/13/25 | 225,000 | 218,144 |
3.65%, 08/12/25 | 175,000 | 169,934 |
0.80%, 11/13/25 | 175,000 | 158,686 |
0.90%, 03/02/26 | 125,000 | 112,565 |
1.15%, 09/14/26 | 100,000 | 89,039 |
1.70%, 01/08/27 | 100,000 | 90,614 |
3.60%, 08/12/27 | 100,000 | 96,271 |
1.10%, 09/14/27 | 250,000 | 216,662 |
CNH Industrial Capital LLC | ||
3.95%, 05/23/25 | 100,000 | 96,866 |
5.45%, 10/14/25 | 75,000 | 74,629 |
1.88%, 01/15/26 (a) | 100,000 | 91,452 |
1.45%, 07/15/26 (a) | 125,000 | 110,826 |
4.55%, 04/10/28 (a) | 100,000 | 96,904 |
CNH Industrial NV | ||
3.85%, 11/15/27 (a) | 50,000 | 47,047 |
Deere & Co. | ||
2.75%, 04/15/25 (a) | 50,000 | 48,091 |
Dover Corp. | ||
3.15%, 11/15/25 (a) | 75,000 | 71,111 |
Eaton Corp. | ||
3.10%, 09/15/27 (a) | 100,000 | 93,956 |
Emerson Electric Co. | ||
3.15%, 06/01/25 (a) | 100,000 | 96,101 |
0.88%, 10/15/26 (a) | 150,000 | 132,432 |
Fortive Corp. | ||
3.15%, 06/15/26 (a) | 150,000 | 142,093 |
Fortune Brands Home & Security, Inc. | ||
4.00%, 06/15/25 (a) | 100,000 | 96,837 |
GE Capital International Funding Co. | ||
3.37%, 11/15/25 | 50,000 | 47,574 |
General Dynamics Corp. | ||
2.38%, 11/15/24 (a) | 100,000 | 95,944 |
3.25%, 04/01/25 (a) | 100,000 | 96,844 |
3.50%, 05/15/25 (a) | 100,000 | 97,331 |
1.15%, 06/01/26 (a) | 75,000 | 67,849 |
2.13%, 08/15/26 (a) | 100,000 | 92,257 |
3.50%, 04/01/27 (a) | 125,000 | 119,521 |
2.63%, 11/15/27 (a) | 50,000 | 45,814 |
3.75%, 05/15/28 (a) | 150,000 | 143,886 |
Hexcel Corp. | ||
4.95%, 08/15/25 (a) | 75,000 | 73,823 |
4.20%, 02/15/27 (a) | 75,000 | 71,078 |
Honeywell International, Inc. | ||
2.30%, 08/15/24 (a) | 125,000 | 120,904 |
1.35%, 06/01/25 (a) | 175,000 | 163,564 |
2.50%, 11/01/26 (a) | 325,000 | 303,664 |
1.10%, 03/01/27 (a) | 150,000 | 132,426 |
Hubbell, Inc. | ||
3.35%, 03/01/26 (a) | 50,000 | 47,637 |
3.15%, 08/15/27 (a) | 100,000 | 92,625 |
SECURITY RATE, MATURITY DATE | FACE AMOUNT ($) | VALUE ($) |
Huntington Ingalls Industries, Inc. | ||
3.84%, 05/01/25 (a) | 125,000 | 120,408 |
3.48%, 12/01/27 (a) | 50,000 | 45,930 |
Illinois Tool Works, Inc. | ||
2.65%, 11/15/26 (a) | 175,000 | 163,952 |
John Deere Capital Corp. | ||
0.63%, 09/10/24 | 150,000 | 141,916 |
4.55%, 10/11/24 | 125,000 | 123,910 |
2.05%, 01/09/25 | 20,000 | 19,071 |
2.13%, 03/07/25 | 50,000 | 47,588 |
3.45%, 03/13/25 | 100,000 | 97,202 |
4.05%, 09/08/25 | 200,000 | 195,876 |
3.40%, 09/11/25 | 125,000 | 120,425 |
4.80%, 01/09/26 | 200,000 | 199,462 |
0.70%, 01/15/26 | 50,000 | 45,011 |
2.65%, 06/10/26 | 100,000 | 94,327 |
1.05%, 06/17/26 | 200,000 | 179,872 |
1.30%, 10/13/26 | 75,000 | 66,771 |
1.70%, 01/11/27 | 100,000 | 90,535 |
2.35%, 03/08/27 | 100,000 | 91,677 |
1.75%, 03/09/27 | 100,000 | 90,093 |
2.80%, 09/08/27 | 100,000 | 92,667 |
4.15%, 09/15/27 | 150,000 | 146,628 |
4.75%, 01/20/28 | 250,000 | 249,935 |
4.90%, 03/03/28 | 100,000 | 100,768 |
1.50%, 03/06/28 | 200,000 | 172,736 |
Johnson Controls International plc | ||
3.90%, 02/14/26 (a) | 150,000 | 144,340 |
Kennametal, Inc. | ||
4.63%, 06/15/28 (a) | 100,000 | 95,303 |
L3Harris Technologies, Inc. | ||
3.83%, 04/27/25 (a) | 150,000 | 145,564 |
3.85%, 12/15/26 (a) | 50,000 | 47,770 |
4.40%, 06/15/28 (a) | 200,000 | 192,508 |
Leggett & Platt, Inc. | ||
3.80%, 11/15/24 (a) | 75,000 | 72,712 |
Legrand France S.A. | ||
8.50%, 02/15/25 | 70,000 | 73,311 |
Lennox International, Inc. | ||
1.35%, 08/01/25 (a) | 175,000 | 159,894 |
Lockheed Martin Corp. | ||
3.55%, 01/15/26 (a) | 125,000 | 121,446 |
5.10%, 11/15/27 (a) | 200,000 | 203,808 |
Martin Marietta Materials, Inc. | ||
4.25%, 07/02/24 (a) | 75,000 | 74,252 |
3.50%, 12/15/27 (a) | 100,000 | 93,425 |
Masco Corp. | ||
3.50%, 11/15/27 (a) | 50,000 | 46,861 |
1.50%, 02/15/28 (a) | 100,000 | 85,230 |
Northrop Grumman Corp. | ||
2.93%, 01/15/25 (a) | 275,000 | 264,528 |
3.20%, 02/01/27 (a) | 150,000 | 141,723 |
3.25%, 01/15/28 (a) | 250,000 | 234,070 |
nVent Finance Sarl | ||
4.55%, 04/15/28 (a) | 100,000 | 93,919 |
Oshkosh Corp. | ||
4.60%, 05/15/28 (a) | 100,000 | 96,516 |
Otis Worldwide Corp. | ||
2.06%, 04/05/25 (a) | 200,000 | 188,596 |
2.29%, 04/05/27 (a) | 100,000 | 90,946 |
Owens Corning | ||
4.20%, 12/01/24 (a) | 50,000 | 49,004 |
3.40%, 08/15/26 (a) | 75,000 | 71,005 |
SECURITY RATE, MATURITY DATE | FACE AMOUNT ($) | VALUE ($) |
Parker-Hannifin Corp. | ||
3.25%, 03/01/27 (a) | 150,000 | 141,229 |
4.25%, 09/15/27 (a) | 150,000 | 145,627 |
Precision Castparts Corp. | ||
3.25%, 06/15/25 (a) | 150,000 | 144,903 |
Raytheon Technologies Corp. | ||
3.95%, 08/16/25 (a) | 225,000 | 220,525 |
2.65%, 11/01/26 (a) | 150,000 | 139,177 |
3.50%, 03/15/27 (a) | 200,000 | 190,282 |
3.13%, 05/04/27 (a) | 150,000 | 140,482 |
Regal Rexnord Corp. | ||
6.05%, 02/15/26 (c) | 200,000 | 200,626 |
6.05%, 04/15/28 (a)(c) | 150,000 | 149,124 |
Republic Services, Inc. | ||
2.50%, 08/15/24 (a) | 170,000 | 164,116 |
3.20%, 03/15/25 (a) | 80,000 | 77,032 |
0.88%, 11/15/25 (a) | 100,000 | 90,116 |
3.38%, 11/15/27 (a) | 150,000 | 141,274 |
3.95%, 05/15/28 (a) | 125,000 | 120,345 |
Rockwell Automation, Inc. | ||
2.88%, 03/01/25 (a) | 50,000 | 48,153 |
Snap-on, Inc. | ||
3.25%, 03/01/27 (a) | 50,000 | 47,263 |
Sonoco Products Co. | ||
1.80%, 02/01/25 (a) | 75,000 | 70,526 |
2.25%, 02/01/27 (a) | 100,000 | 89,333 |
Stanley Black & Decker, Inc. | ||
3.40%, 03/01/26 (a) | 150,000 | 142,434 |
6.00%, 03/06/28 (a) | 100,000 | 102,838 |
4.00%, 03/15/60 (a)(b) | 100,000 | 76,480 |
Teledyne Technologies, Inc. | ||
1.60%, 04/01/26 (a) | 50,000 | 45,263 |
2.25%, 04/01/28 (a) | 100,000 | 87,350 |
Textron, Inc. | ||
3.88%, 03/01/25 (a) | 75,000 | 72,905 |
4.00%, 03/15/26 (a) | 75,000 | 72,524 |
3.65%, 03/15/27 (a) | 75,000 | 70,535 |
Timken Co. | ||
3.88%, 09/01/24 (a) | 75,000 | 73,322 |
Trane Technologies Luxembourg Finance S.A. | ||
3.55%, 11/01/24 (a) | 100,000 | 97,115 |
3.50%, 03/21/26 (a) | 100,000 | 95,604 |
Vontier Corp. | ||
1.80%, 04/01/26 (a) | 100,000 | 89,038 |
2.40%, 04/01/28 (a) | 75,000 | 62,750 |
Vulcan Materials Co. | ||
4.50%, 04/01/25 (a) | 50,000 | 49,063 |
3.90%, 04/01/27 (a) | 100,000 | 96,243 |
Waste Management, Inc. | ||
3.13%, 03/01/25 (a) | 75,000 | 72,392 |
0.75%, 11/15/25 (a) | 75,000 | 67,718 |
3.15%, 11/15/27 (a) | 100,000 | 93,949 |
1.15%, 03/15/28 (a) | 100,000 | 85,335 |
Westinghouse Air Brake Technologies Corp. | ||
3.20%, 06/15/25 (a) | 75,000 | 71,291 |
3.45%, 11/15/26 (a) | 125,000 | 117,136 |
WW Grainger, Inc. | ||
1.85%, 02/15/25 (a) | 90,000 | 85,452 |
Xylem, Inc. | ||
3.25%, 11/01/26 (a) | 100,000 | 94,185 |
1.95%, 01/30/28 (a) | 100,000 | 87,902 |
18,523,037 | ||
SECURITY RATE, MATURITY DATE | FACE AMOUNT ($) | VALUE ($) |
Communications 5.4% | ||
Activision Blizzard, Inc. | ||
3.40%, 09/15/26 (a) | 150,000 | 143,168 |
3.40%, 06/15/27 (a) | 50,000 | 47,315 |
American Tower Corp. | ||
2.95%, 01/15/25 (a) | 150,000 | 143,506 |
2.40%, 03/15/25 (a) | 175,000 | 165,042 |
4.00%, 06/01/25 (a) | 50,000 | 48,340 |
1.30%, 09/15/25 (a) | 100,000 | 90,679 |
1.60%, 04/15/26 (a) | 200,000 | 179,530 |
1.45%, 09/15/26 (a) | 100,000 | 88,166 |
3.38%, 10/15/26 (a) | 150,000 | 140,372 |
2.75%, 01/15/27 (a) | 200,000 | 182,328 |
3.13%, 01/15/27 (a) | 75,000 | 69,203 |
3.55%, 07/15/27 (a) | 100,000 | 92,869 |
3.60%, 01/15/28 (a) | 200,000 | 184,834 |
1.50%, 01/31/28 (a) | 100,000 | 84,155 |
AT&T, Inc. | ||
1.70%, 03/25/26 (a) | 500,000 | 455,730 |
2.95%, 07/15/26 (a) | 100,000 | 94,164 |
3.80%, 02/15/27 (a) | 150,000 | 143,503 |
4.25%, 03/01/27 (a) | 250,000 | 243,247 |
2.30%, 06/01/27 (a) | 450,000 | 405,351 |
1.65%, 02/01/28 (a) | 150,000 | 129,104 |
4.10%, 02/15/28 (a) | 350,000 | 335,723 |
Charter Communications Operating LLC/Charter Communications Operating Capital | ||
4.91%, 07/23/25 (a) | 650,000 | 637,819 |
3.75%, 02/15/28 (a) | 200,000 | 183,956 |
4.20%, 03/15/28 (a) | 150,000 | 140,988 |
Comcast Corp. | ||
3.38%, 08/15/25 (a) | 250,000 | 241,470 |
3.95%, 10/15/25 (a) | 550,000 | 536,299 |
3.15%, 03/01/26 (a) | 400,000 | 383,484 |
2.35%, 01/15/27 (a) | 275,000 | 252,890 |
3.30%, 02/01/27 (a) | 225,000 | 213,730 |
3.30%, 04/01/27 (a) | 150,000 | 141,917 |
5.35%, 11/15/27 (a) | 175,000 | 178,563 |
3.15%, 02/15/28 (a) | 225,000 | 210,267 |
3.55%, 05/01/28 (a) | 50,000 | 47,394 |
Crown Castle International Corp. | ||
1.35%, 07/15/25 (a) | 100,000 | 91,655 |
4.45%, 02/15/26 (a) | 200,000 | 195,212 |
3.70%, 06/15/26 (a) | 50,000 | 47,564 |
1.05%, 07/15/26 (a) | 150,000 | 131,742 |
4.00%, 03/01/27 (a) | 100,000 | 95,308 |
2.90%, 03/15/27 (a) | 125,000 | 114,515 |
3.65%, 09/01/27 (a) | 150,000 | 140,357 |
Crown Castle, Inc. | ||
5.00%, 01/11/28 (a) | 250,000 | 246,497 |
Discovery Communications LLC | ||
3.90%, 11/15/24 (a) | 75,000 | 72,839 |
3.95%, 06/15/25 (a) | 125,000 | 120,289 |
4.90%, 03/11/26 (a) | 225,000 | 220,968 |
3.95%, 03/20/28 (a) | 250,000 | 232,800 |
Electronic Arts, Inc. | ||
4.80%, 03/01/26 (a) | 75,000 | 74,317 |
Fox Corp. | ||
3.05%, 04/07/25 (a) | 95,000 | 91,045 |
Meta Platforms, Inc. | ||
3.50%, 08/15/27 (a) | 400,000 | 380,132 |
4.60%, 05/15/28 (a) | 225,000 | 222,752 |
SECURITY RATE, MATURITY DATE | FACE AMOUNT ($) | VALUE ($) |
Netflix, Inc. | ||
5.88%, 02/15/25 | 125,000 | 125,589 |
4.38%, 11/15/26 | 150,000 | 146,781 |
4.88%, 04/15/28 | 225,000 | 222,763 |
Omnicom Group, Inc./Omnicom Capital, Inc. | ||
3.65%, 11/01/24 (a) | 125,000 | 121,580 |
3.60%, 04/15/26 (a) | 225,000 | 216,315 |
Rogers Communications, Inc. | ||
2.95%, 03/15/25 (a)(c) | 200,000 | 190,216 |
3.63%, 12/15/25 (a) | 100,000 | 94,649 |
2.90%, 11/15/26 (a) | 75,000 | 68,840 |
3.20%, 03/15/27 (a)(c) | 225,000 | 209,216 |
Sprint Corp. | ||
7.63%, 02/15/25 (a) | 300,000 | 306,423 |
7.63%, 03/01/26 (a) | 250,000 | 259,845 |
Take-Two Interactive Software, Inc. | ||
3.55%, 04/14/25 | 150,000 | 144,733 |
3.70%, 04/14/27 (a) | 150,000 | 142,221 |
4.95%, 03/28/28 (a) | 75,000 | 74,228 |
TCI Communications, Inc. | ||
7.88%, 02/15/26 | 75,000 | 80,038 |
Telefonica Emisiones S.A. | ||
4.10%, 03/08/27 | 250,000 | 240,080 |
TELUS Corp. | ||
3.70%, 09/15/27 (a) | 125,000 | 117,690 |
T-Mobile USA, Inc. | ||
3.50%, 04/15/25 (a) | 350,000 | 336,857 |
1.50%, 02/15/26 (a) | 175,000 | 158,370 |
2.25%, 02/15/26 (a) | 275,000 | 253,426 |
2.63%, 04/15/26 (a) | 200,000 | 185,594 |
3.75%, 04/15/27 (a) | 650,000 | 615,992 |
5.38%, 04/15/27 (a) | 150,000 | 149,307 |
4.75%, 02/01/28 (a) | 100,000 | 97,279 |
2.05%, 02/15/28 (a) | 200,000 | 173,822 |
4.95%, 03/15/28 (a) | 200,000 | 197,196 |
TWDC Enterprises 18 Corp. | ||
3.15%, 09/17/25 | 200,000 | 192,228 |
3.00%, 02/13/26 | 150,000 | 143,300 |
1.85%, 07/30/26 | 200,000 | 182,704 |
2.95%, 06/15/27 | 100,000 | 93,590 |
Verizon Communications, Inc. | ||
3.50%, 11/01/24 (a) | 175,000 | 170,464 |
3.38%, 02/15/25 | 100,000 | 96,659 |
0.85%, 11/20/25 (a) | 150,000 | 135,498 |
1.45%, 03/20/26 (a) | 300,000 | 272,169 |
2.63%, 08/15/26 | 325,000 | 302,445 |
4.13%, 03/16/27 | 500,000 | 486,195 |
3.00%, 03/22/27 (a) | 150,000 | 140,295 |
2.10%, 03/22/28 (a) | 400,000 | 351,580 |
ViacomCBS, Inc. | ||
4.75%, 05/15/25 (a) | 158,000 | 154,461 |
4.00%, 01/15/26 (a) | 225,000 | 214,553 |
3.38%, 02/15/28 (a) | 75,000 | 66,745 |
Vodafone Group PLC | ||
4.13%, 05/30/25 | 250,000 | 244,090 |
4.38%, 05/30/28 | 125,000 | 122,414 |
Walt Disney Co. | ||
1.75%, 08/30/24 (a) | 150,000 | 143,782 |
3.70%, 09/15/24 (a) | 100,000 | 97,990 |
3.35%, 03/24/25 | 275,000 | 266,522 |
3.70%, 10/15/25 (a) | 100,000 | 97,152 |
1.75%, 01/13/26 | 250,000 | 231,612 |
3.38%, 11/15/26 (a) | 75,000 | 71,428 |
3.70%, 03/23/27 | 100,000 | 96,736 |
2.20%, 01/13/28 | 100,000 | 90,519 |
SECURITY RATE, MATURITY DATE | FACE AMOUNT ($) | VALUE ($) |
Warnermedia Holdings, Inc. | ||
3.64%, 03/15/25 | 275,000 | 265,317 |
6.41%, 03/15/26 (a) | 100,000 | 100,085 |
3.76%, 03/15/27 (a) | 600,000 | 560,088 |
Weibo Corp. | ||
3.50%, 07/05/24 (a) | 200,000 | 194,276 |
WPP Finance 2010 | ||
3.75%, 09/19/24 | 120,000 | 116,519 |
19,743,564 | ||
Consumer Cyclical 7.7% | ||
Advance Auto Parts, Inc. | ||
1.75%, 10/01/27 (a) | 100,000 | 83,175 |
Alibaba Group Holding Ltd. | ||
3.60%, 11/28/24 (a) | 300,000 | 290,520 |
3.40%, 12/06/27 (a) | 375,000 | 348,536 |
Amazon.com, Inc. | ||
4.70%, 11/29/24 | 200,000 | 198,912 |
3.80%, 12/05/24 (a) | 175,000 | 171,843 |
3.00%, 04/13/25 | 275,000 | 265,576 |
0.80%, 06/03/25 (a) | 250,000 | 231,215 |
4.60%, 12/01/25 | 200,000 | 198,576 |
5.20%, 12/03/25 (a) | 125,000 | 125,458 |
1.00%, 05/12/26 (a) | 450,000 | 404,788 |
3.30%, 04/13/27 (a) | 300,000 | 286,224 |
1.20%, 06/03/27 (a) | 175,000 | 153,674 |
3.15%, 08/22/27 (a) | 550,000 | 518,105 |
4.55%, 12/01/27 (a) | 300,000 | 298,185 |
1.65%, 05/12/28 (a) | 300,000 | 262,287 |
American Honda Finance Corp. | ||
0.55%, 07/12/24 | 200,000 | 189,988 |
0.75%, 08/09/24 | 250,000 | 237,377 |
2.15%, 09/10/24 | 130,000 | 124,964 |
1.20%, 07/08/25 | 25,000 | 23,031 |
1.00%, 09/10/25 | 150,000 | 136,964 |
1.30%, 09/09/26 | 150,000 | 133,625 |
2.30%, 09/09/26 | 125,000 | 115,031 |
2.35%, 01/08/27 | 75,000 | 68,860 |
4.70%, 01/12/28 | 100,000 | 99,283 |
3.50%, 02/15/28 | 250,000 | 235,617 |
Aptiv PLC | ||
2.40%, 02/18/25 (a) | 125,000 | 118,806 |
AutoNation, Inc. | ||
3.50%, 11/15/24 (a) | 165,000 | 159,342 |
3.80%, 11/15/27 (a) | 50,000 | 45,937 |
AutoZone, Inc. | ||
3.25%, 04/15/25 (a) | 15,000 | 14,379 |
3.63%, 04/15/25 (a) | 90,000 | 87,109 |
3.13%, 04/21/26 (a) | 75,000 | 71,003 |
3.75%, 06/01/27 (a) | 125,000 | 119,149 |
Block Financial LLC | ||
5.25%, 10/01/25 (a) | 50,000 | 49,327 |
Booking Holdings, Inc. | ||
3.65%, 03/15/25 (a) | 125,000 | 121,531 |
3.60%, 06/01/26 (a) | 100,000 | 96,483 |
BorgWarner, Inc. | ||
3.38%, 03/15/25 (a) | 85,000 | 81,469 |
2.65%, 07/01/27 (a) | 200,000 | 182,286 |
CBRE Services, Inc. | ||
4.88%, 03/01/26 (a) | 100,000 | 97,233 |
Costco Wholesale Corp. | ||
3.00%, 05/18/27 (a) | 100,000 | 95,061 |
1.38%, 06/20/27 (a) | 250,000 | 221,132 |
SECURITY RATE, MATURITY DATE | FACE AMOUNT ($) | VALUE ($) |
Cummins, Inc. | ||
0.75%, 09/01/25 (a) | 100,000 | 91,226 |
Darden Restaurants, Inc. | ||
3.85%, 05/01/27 (a) | 100,000 | 95,517 |
Dollar General Corp. | ||
4.25%, 09/20/24 | 175,000 | 171,806 |
4.15%, 11/01/25 (a) | 75,000 | 72,810 |
3.88%, 04/15/27 (a) | 100,000 | 95,635 |
4.13%, 05/01/28 (a) | 100,000 | 95,268 |
Dollar Tree, Inc. | ||
4.00%, 05/15/25 (a) | 175,000 | 169,655 |
4.20%, 05/15/28 (a) | 200,000 | 189,686 |
DR Horton, Inc. | ||
2.50%, 10/15/24 (a) | 75,000 | 71,919 |
2.60%, 10/15/25 (a) | 90,000 | 84,313 |
1.30%, 10/15/26 (a) | 100,000 | 87,727 |
1.40%, 10/15/27 (a) | 100,000 | 85,976 |
eBay, Inc. | ||
3.45%, 08/01/24 (a) | 120,000 | 117,416 |
1.90%, 03/11/25 (a) | 125,000 | 117,619 |
1.40%, 05/10/26 (a) | 125,000 | 112,929 |
3.60%, 06/05/27 (a) | 125,000 | 118,466 |
5.95%, 11/22/27 (a) | 75,000 | 76,846 |
Expedia Group, Inc. | ||
5.00%, 02/15/26 (a) | 125,000 | 123,390 |
4.63%, 08/01/27 (a) | 250,000 | 242,797 |
General Motors Co. | ||
4.00%, 04/01/25 | 105,000 | 102,139 |
6.13%, 10/01/25 (a) | 325,000 | 327,395 |
4.20%, 10/01/27 (a) | 100,000 | 94,917 |
6.80%, 10/01/27 (a) | 150,000 | 155,977 |
General Motors Financial Co., Inc. | ||
1.20%, 10/15/24 | 150,000 | 141,120 |
3.50%, 11/07/24 (a) | 150,000 | 145,141 |
4.00%, 01/15/25 (a) | 150,000 | 145,416 |
2.90%, 02/26/25 (a) | 225,000 | 213,878 |
3.80%, 04/07/25 | 200,000 | 193,018 |
4.35%, 04/09/25 (a) | 150,000 | 146,164 |
2.75%, 06/20/25 (a) | 200,000 | 188,500 |
4.30%, 07/13/25 (a) | 125,000 | 121,326 |
6.05%, 10/10/25 | 100,000 | 100,331 |
1.25%, 01/08/26 (a) | 225,000 | 201,103 |
5.25%, 03/01/26 (a) | 225,000 | 221,596 |
1.50%, 06/10/26 (a) | 250,000 | 221,132 |
4.00%, 10/06/26 (a) | 125,000 | 118,713 |
4.35%, 01/17/27 (a) | 200,000 | 191,960 |
2.35%, 02/26/27 (a) | 150,000 | 133,956 |
5.00%, 04/09/27 (a) | 200,000 | 194,946 |
2.70%, 08/20/27 (a) | 200,000 | 177,382 |
6.00%, 01/09/28 (a) | 150,000 | 151,458 |
2.40%, 04/10/28 (a) | 150,000 | 129,555 |
5.80%, 06/23/28 (a) | 200,000 | 199,338 |
Genuine Parts Co. | ||
1.75%, 02/01/25 (a) | 100,000 | 93,749 |
GLP Capital LP/GLP Financing II, Inc. | ||
3.35%, 09/01/24 (a) | 65,000 | 62,778 |
5.25%, 06/01/25 (a) | 150,000 | 147,190 |
5.38%, 04/15/26 (a) | 150,000 | 146,932 |
Harley-Davidson, Inc. | ||
3.50%, 07/28/25 (a) | 100,000 | 96,016 |
Harman International Industries, Inc. | ||
4.15%, 05/15/25 (a) | 75,000 | 72,806 |
Home Depot, Inc. | ||
3.35%, 09/15/25 (a) | 225,000 | 217,480 |
3.00%, 04/01/26 (a) | 200,000 | 191,520 |
SECURITY RATE, MATURITY DATE | FACE AMOUNT ($) | VALUE ($) |
2.13%, 09/15/26 (a) | 200,000 | 184,882 |
2.50%, 04/15/27 (a) | 200,000 | 185,832 |
2.88%, 04/15/27 (a) | 50,000 | 47,058 |
2.80%, 09/14/27 (a) | 225,000 | 209,718 |
Honda Motor Co., Ltd. | ||
2.27%, 03/10/25 (a) | 100,000 | 95,342 |
2.53%, 03/10/27 (a) | 225,000 | 207,250 |
Hyatt Hotels Corp. | ||
1.80%, 10/01/24 (a) | 125,000 | 119,274 |
5.38%, 04/23/25 (a)(d) | 90,000 | 89,220 |
4.85%, 03/15/26 (a) | 50,000 | 49,055 |
JD.com, Inc. | ||
3.88%, 04/29/26 | 200,000 | 190,894 |
Lear Corp. | ||
3.80%, 09/15/27 (a) | 100,000 | 93,554 |
Lennar Corp. | ||
5.88%, 11/15/24 (a) | 75,000 | 74,975 |
4.75%, 05/30/25 (a) | 75,000 | 73,376 |
5.25%, 06/01/26 (a) | 50,000 | 49,562 |
5.00%, 06/15/27 (a) | 50,000 | 49,156 |
4.75%, 11/29/27 (a) | 175,000 | 170,373 |
LKQ Corp. | ||
5.75%, 06/15/28 (a)(c) | 100,000 | 99,703 |
Lowe's Cos., Inc. | ||
3.13%, 09/15/24 (a) | 75,000 | 72,807 |
4.00%, 04/15/25 (a) | 75,000 | 73,013 |
4.40%, 09/08/25 | 200,000 | 196,116 |
3.38%, 09/15/25 (a) | 100,000 | 95,964 |
2.50%, 04/15/26 (a) | 225,000 | 210,737 |
3.35%, 04/01/27 (a) | 125,000 | 118,134 |
3.10%, 05/03/27 (a) | 300,000 | 280,284 |
1.30%, 04/15/28 (a) | 150,000 | 127,001 |
Magna International, Inc. | ||
4.15%, 10/01/25 (a) | 150,000 | 145,618 |
Marriott International, Inc. | ||
3.75%, 03/15/25 (a) | 50,000 | 48,432 |
5.75%, 05/01/25 (a) | 100,000 | 100,357 |
3.75%, 10/01/25 (a) | 50,000 | 48,127 |
3.13%, 06/15/26 (a) | 100,000 | 93,970 |
5.00%, 10/15/27 (a) | 175,000 | 173,847 |
McDonald's Corp. | ||
3.38%, 05/26/25 (a) | 50,000 | 48,496 |
3.30%, 07/01/25 (a) | 150,000 | 144,732 |
1.45%, 09/01/25 (a) | 50,000 | 46,190 |
3.70%, 01/30/26 (a) | 275,000 | 266,082 |
3.50%, 03/01/27 (a) | 150,000 | 143,203 |
3.50%, 07/01/27 (a) | 150,000 | 142,908 |
3.80%, 04/01/28 (a) | 150,000 | 143,965 |
NIKE, Inc. | ||
2.40%, 03/27/25 (a) | 80,000 | 76,522 |
2.38%, 11/01/26 (a) | 225,000 | 209,324 |
2.75%, 03/27/27 (a) | 150,000 | 141,124 |
O'Reilly Automotive, Inc. | ||
3.55%, 03/15/26 (a) | 100,000 | 95,887 |
3.60%, 09/01/27 (a) | 100,000 | 94,712 |
PACCAR Financial Corp. | ||
2.15%, 08/15/24 | 175,000 | 168,656 |
1.80%, 02/06/25 | 10,000 | 9,472 |
3.55%, 08/11/25 | 150,000 | 145,711 |
4.95%, 10/03/25 | 50,000 | 49,763 |
1.10%, 05/11/26 | 50,000 | 45,051 |
2.00%, 02/04/27 | 100,000 | 90,630 |
PulteGroup, Inc. | ||
5.50%, 03/01/26 (a) | 125,000 | 124,403 |
5.00%, 01/15/27 (a) | 25,000 | 24,664 |
SECURITY RATE, MATURITY DATE | FACE AMOUNT ($) | VALUE ($) |
PVH Corp. | ||
4.63%, 07/10/25 (a)(c) | 100,000 | 96,804 |
Ralph Lauren Corp. | ||
3.75%, 09/15/25 (a) | 100,000 | 96,598 |
Ross Stores, Inc. | ||
4.60%, 04/15/25 (a) | 145,000 | 142,362 |
0.88%, 04/15/26 (a) | 75,000 | 66,240 |
Starbucks Corp. | ||
3.80%, 08/15/25 (a) | 300,000 | 290,769 |
4.75%, 02/15/26 | 150,000 | 148,635 |
2.00%, 03/12/27 (a) | 75,000 | 67,451 |
3.50%, 03/01/28 (a) | 100,000 | 94,032 |
Tapestry, Inc. | ||
4.25%, 04/01/25 (a) | 25,000 | 24,348 |
4.13%, 07/15/27 (a) | 75,000 | 70,570 |
Target Corp. | ||
3.50%, 07/01/24 | 140,000 | 137,493 |
2.25%, 04/15/25 (a) | 300,000 | 286,140 |
2.50%, 04/15/26 | 275,000 | 260,466 |
TJX Cos., Inc. | ||
2.25%, 09/15/26 (a) | 175,000 | 161,525 |
Toll Brothers Finance Corp. | ||
4.88%, 11/15/25 (a) | 75,000 | 73,677 |
4.88%, 03/15/27 (a) | 75,000 | 72,694 |
4.35%, 02/15/28 (a) | 100,000 | 94,172 |
Toyota Motor Corp. | ||
2.36%, 07/02/24 | 100,000 | 96,892 |
1.34%, 03/25/26 (a) | 200,000 | 181,560 |
Toyota Motor Credit Corp. | ||
0.63%, 09/13/24 | 250,000 | 236,267 |
4.40%, 09/20/24 | 350,000 | 345,842 |
2.00%, 10/07/24 | 75,000 | 71,915 |
1.45%, 01/13/25 | 100,000 | 94,363 |
1.80%, 02/13/25 | 225,000 | 213,077 |
3.00%, 04/01/25 | 250,000 | 240,927 |
3.40%, 04/14/25 | 100,000 | 96,879 |
3.65%, 08/18/25 | 200,000 | 193,786 |
0.80%, 10/16/25 | 225,000 | 203,980 |
0.80%, 01/09/26 | 150,000 | 135,000 |
1.13%, 06/18/26 | 250,000 | 223,610 |
1.90%, 01/13/27 | 150,000 | 135,566 |
3.05%, 03/22/27 | 250,000 | 234,332 |
1.15%, 08/13/27 | 150,000 | 129,779 |
4.55%, 09/20/27 | 200,000 | 197,558 |
4.63%, 01/12/28 | 250,000 | 248,267 |
1.90%, 04/06/28 | 100,000 | 87,986 |
VF Corp. | ||
2.40%, 04/23/25 (a) | 150,000 | 140,694 |
2.80%, 04/23/27 (a) | 100,000 | 90,455 |
VICI Properties LP | ||
4.38%, 05/15/25 | 100,000 | 96,790 |
4.75%, 02/15/28 (a) | 200,000 | 189,590 |
Walgreens Boots Alliance, Inc. | ||
3.80%, 11/18/24 (a) | 190,000 | 185,277 |
3.45%, 06/01/26 (a) | 225,000 | 211,417 |
Walmart, Inc. | ||
2.65%, 12/15/24 (a) | 115,000 | 110,928 |
3.55%, 06/26/25 (a) | 175,000 | 170,648 |
3.90%, 09/09/25 | 325,000 | 318,490 |
3.05%, 07/08/26 (a) | 125,000 | 119,780 |
1.05%, 09/17/26 (a) | 250,000 | 223,395 |
3.95%, 09/09/27 (a) | 150,000 | 147,387 |
3.90%, 04/15/28 (a) | 150,000 | 146,566 |
3.70%, 06/26/28 (a) | 150,000 | 145,239 |
27,861,338 | ||
SECURITY RATE, MATURITY DATE | FACE AMOUNT ($) | VALUE ($) |
Consumer Non-Cyclical 12.1% | ||
Abbott Laboratories | ||
3.88%, 09/15/25 (a) | 25,000 | 24,439 |
3.75%, 11/30/26 (a) | 275,000 | 268,444 |
1.15%, 01/30/28 (a) | 75,000 | 64,989 |
AbbVie, Inc. | ||
2.60%, 11/21/24 (a) | 575,000 | 551,816 |
3.80%, 03/15/25 (a) | 400,000 | 389,136 |
3.60%, 05/14/25 (a) | 575,000 | 556,025 |
3.20%, 05/14/26 (a) | 300,000 | 284,448 |
2.95%, 11/21/26 (a) | 625,000 | 584,625 |
Agilent Technologies, Inc. | ||
3.05%, 09/22/26 (a) | 100,000 | 92,780 |
Altria Group, Inc. | ||
2.35%, 05/06/25 (a) | 180,000 | 169,465 |
4.40%, 02/14/26 (a) | 100,000 | 97,951 |
2.63%, 09/16/26 (a) | 125,000 | 115,921 |
AmerisourceBergen Corp. | ||
3.25%, 03/01/25 (a) | 20,000 | 19,229 |
3.45%, 12/15/27 (a) | 100,000 | 93,665 |
Amgen, Inc. | ||
1.90%, 02/21/25 (a) | 120,000 | 113,191 |
5.25%, 03/02/25 | 100,000 | 99,540 |
3.13%, 05/01/25 (a) | 150,000 | 143,791 |
5.51%, 03/02/26 (a) | 250,000 | 249,637 |
2.60%, 08/19/26 (a) | 200,000 | 185,386 |
2.20%, 02/21/27 (a) | 250,000 | 227,320 |
3.20%, 11/02/27 (a) | 200,000 | 187,022 |
5.15%, 03/02/28 (a) | 600,000 | 599,742 |
Anheuser-Busch Cos. LLC/Anheuser-Busch InBev Worldwide, Inc. | ||
3.65%, 02/01/26 (a) | 550,000 | 532,950 |
Anheuser-Busch InBev Worldwide, Inc. | ||
4.00%, 04/13/28 (a) | 350,000 | 338,996 |
Archer-Daniels-Midland Co. | ||
2.50%, 08/11/26 (a) | 175,000 | 164,258 |
Astrazeneca Finance LLC | ||
1.20%, 05/28/26 (a) | 175,000 | 157,997 |
4.88%, 03/03/28 (a) | 100,000 | 100,001 |
1.75%, 05/28/28 (a) | 150,000 | 130,032 |
AstraZeneca PLC | ||
3.38%, 11/16/25 | 325,000 | 312,468 |
0.70%, 04/08/26 (a) | 200,000 | 178,750 |
3.13%, 06/12/27 (a) | 150,000 | 141,149 |
BAT Capital Corp. | ||
3.22%, 08/15/24 (a) | 425,000 | 412,471 |
2.79%, 09/06/24 (a) | 150,000 | 144,459 |
3.22%, 09/06/26 (a) | 200,000 | 186,306 |
4.70%, 04/02/27 (a) | 150,000 | 145,494 |
3.56%, 08/15/27 (a) | 550,000 | 506,478 |
2.26%, 03/25/28 (a) | 200,000 | 171,522 |
BAT International Finance PLC | ||
1.67%, 03/25/26 (a) | 250,000 | 224,937 |
4.45%, 03/16/28 (a) | 150,000 | 141,701 |
Baxalta, Inc. | ||
4.00%, 06/23/25 (a) | 150,000 | 145,608 |
Baxter International, Inc. | ||
1.32%, 11/29/24 | 250,000 | 234,725 |
2.60%, 08/15/26 (a) | 75,000 | 69,000 |
1.92%, 02/01/27 (a) | 250,000 | 222,267 |
Becton Dickinson & Co. | ||
3.73%, 12/15/24 (a) | 145,000 | 140,899 |
3.70%, 06/06/27 (a) | 275,000 | 261,671 |
4.69%, 02/13/28 (a) | 125,000 | 123,449 |
SECURITY RATE, MATURITY DATE | FACE AMOUNT ($) | VALUE ($) |
Bestfoods | ||
7.25%, 12/15/26 | 150,000 | 160,542 |
Biogen, Inc. | ||
4.05%, 09/15/25 (a) | 300,000 | 290,520 |
Bio-Rad Laboratories, Inc. | ||
3.30%, 03/15/27 (a) | 100,000 | 93,188 |
Boston Scientific Corp. | ||
1.90%, 06/01/25 (a) | 100,000 | 93,794 |
Bristol-Myers Squibb Co. | ||
2.90%, 07/26/24 (a) | 225,000 | 219,114 |
0.75%, 11/13/25 (a) | 175,000 | 159,194 |
3.20%, 06/15/26 (a) | 300,000 | 287,265 |
3.25%, 02/27/27 | 75,000 | 71,985 |
1.13%, 11/13/27 (a) | 200,000 | 174,310 |
3.45%, 11/15/27 (a) | 100,000 | 95,951 |
3.90%, 02/20/28 (a) | 100,000 | 97,123 |
Brown-Forman Corp. | ||
3.50%, 04/15/25 (a) | 75,000 | 72,762 |
Brunswick Corp. | ||
0.85%, 08/18/24 (a) | 100,000 | 94,473 |
Bunge Ltd. Finance Corp. | ||
1.63%, 08/17/25 (a) | 100,000 | 92,126 |
3.25%, 08/15/26 (a) | 200,000 | 188,730 |
Campbell Soup Co. | ||
3.95%, 03/15/25 (a) | 150,000 | 146,017 |
3.30%, 03/19/25 (a) | 50,000 | 48,092 |
4.15%, 03/15/28 (a) | 150,000 | 143,854 |
Cardinal Health, Inc. | ||
3.50%, 11/15/24 (a) | 70,000 | 67,780 |
3.75%, 09/15/25 (a) | 100,000 | 96,428 |
3.41%, 06/15/27 (a) | 150,000 | 141,486 |
Cigna Corp. | ||
3.25%, 04/15/25 (a) | 25,000 | 24,002 |
4.13%, 11/15/25 (a) | 350,000 | 341,085 |
4.50%, 02/25/26 (a) | 200,000 | 196,006 |
1.25%, 03/15/26 (a) | 100,000 | 89,876 |
3.40%, 03/01/27 (a) | 225,000 | 212,182 |
3.05%, 10/15/27 (a) | 100,000 | 92,281 |
Cigna Group | ||
5.69%, 03/15/26 (a) | 100,000 | 100,166 |
Clorox Co. | ||
3.10%, 10/01/27 (a) | 50,000 | 46,379 |
3.90%, 05/15/28 (a) | 100,000 | 95,397 |
Coca-Cola Co. | ||
3.38%, 03/25/27 | 200,000 | 193,048 |
2.90%, 05/25/27 | 75,000 | 71,075 |
1.45%, 06/01/27 | 250,000 | 223,635 |
1.50%, 03/05/28 | 100,000 | 88,036 |
1.00%, 03/15/28 | 200,000 | 172,012 |
Colgate-Palmolive Co. | ||
3.10%, 08/15/27 (a) | 150,000 | 142,928 |
CommonSpirit Health | ||
2.76%, 10/01/24 (a) | 100,000 | 96,291 |
1.55%, 10/01/25 (a) | 200,000 | 182,020 |
6.07%, 11/01/27 (a) | 50,000 | 50,995 |
Conagra Brands, Inc. | ||
4.60%, 11/01/25 (a) | 175,000 | 171,197 |
1.38%, 11/01/27 (a) | 150,000 | 127,320 |
Constellation Brands, Inc. | ||
4.75%, 11/15/24 | 75,000 | 74,111 |
4.40%, 11/15/25 (a) | 100,000 | 98,033 |
4.75%, 12/01/25 | 150,000 | 147,774 |
3.70%, 12/06/26 (a) | 100,000 | 95,441 |
SECURITY RATE, MATURITY DATE | FACE AMOUNT ($) | VALUE ($) |
3.50%, 05/09/27 (a) | 100,000 | 94,915 |
4.35%, 05/09/27 (a) | 100,000 | 97,803 |
CVS Health Corp. | ||
3.38%, 08/12/24 (a) | 100,000 | 97,506 |
2.63%, 08/15/24 (a) | 165,000 | 159,608 |
4.10%, 03/25/25 (a) | 175,000 | 171,430 |
3.88%, 07/20/25 (a) | 450,000 | 437,656 |
5.00%, 02/20/26 (a) | 250,000 | 249,020 |
2.88%, 06/01/26 (a) | 300,000 | 282,315 |
3.00%, 08/15/26 (a) | 50,000 | 46,914 |
3.63%, 04/01/27 (a) | 150,000 | 142,476 |
1.30%, 08/21/27 (a) | 350,000 | 301,675 |
4.30%, 03/25/28 (a) | 750,000 | 724,072 |
Danaher Corp. | ||
3.35%, 09/15/25 (a) | 50,000 | 48,153 |
DH Europe Finance II Sarl | ||
2.20%, 11/15/24 (a) | 105,000 | 100,582 |
Diageo Capital PLC | ||
1.38%, 09/29/25 (a) | 200,000 | 184,222 |
5.30%, 10/24/27 (a) | 200,000 | 203,670 |
Eli Lilly & Co. | ||
5.50%, 03/15/27 | 75,000 | 77,950 |
3.10%, 05/15/27 (a) | 75,000 | 71,461 |
Estee Lauder Cos., Inc. | ||
2.00%, 12/01/24 (a) | 75,000 | 71,616 |
3.15%, 03/15/27 (a) | 100,000 | 95,154 |
4.38%, 05/15/28 (a) | 100,000 | 98,570 |
Flowers Foods, Inc. | ||
3.50%, 10/01/26 (a) | 75,000 | 70,478 |
GE HealthCare Technologies, Inc. | ||
5.60%, 11/15/25 (a) | 300,000 | 300,534 |
5.65%, 11/15/27 (a) | 300,000 | 303,618 |
General Mills, Inc. | ||
4.00%, 04/17/25 (a) | 100,000 | 97,606 |
5.24%, 11/18/25 (a) | 100,000 | 100,017 |
3.20%, 02/10/27 (a) | 150,000 | 141,975 |
4.20%, 04/17/28 (a) | 200,000 | 194,500 |
Gilead Sciences, Inc. | ||
3.50%, 02/01/25 (a) | 300,000 | 290,958 |
3.65%, 03/01/26 (a) | 425,000 | 409,254 |
2.95%, 03/01/27 (a) | 175,000 | 164,400 |
1.20%, 10/01/27 (a) | 125,000 | 107,998 |
GlaxoSmithKline Capital, Inc. | ||
3.63%, 05/15/25 | 275,000 | 267,613 |
3.88%, 05/15/28 | 250,000 | 240,722 |
GSK Consumer Healthcare Capital US LLC | ||
3.13%, 03/24/25 | 250,000 | 239,030 |
3.38%, 03/24/27 (a) | 275,000 | 257,612 |
Hasbro, Inc. | ||
3.00%, 11/19/24 (a) | 75,000 | 72,164 |
3.55%, 11/19/26 (a) | 75,000 | 69,759 |
3.50%, 09/15/27 (a) | 100,000 | 93,251 |
HCA, Inc. | ||
5.38%, 02/01/25 | 400,000 | 396,816 |
5.25%, 04/15/25 | 200,000 | 197,542 |
5.88%, 02/15/26 (a) | 200,000 | 200,216 |
5.25%, 06/15/26 (a) | 250,000 | 247,410 |
5.38%, 09/01/26 (a) | 175,000 | 173,675 |
4.50%, 02/15/27 (a) | 200,000 | 193,362 |
3.13%, 03/15/27 (a)(c) | 150,000 | 137,850 |
5.20%, 06/01/28 (a) | 100,000 | 99,491 |
Hershey Co. | ||
2.30%, 08/15/26 (a) | 125,000 | 116,816 |
SECURITY RATE, MATURITY DATE | FACE AMOUNT ($) | VALUE ($) |
Illumina, Inc. | ||
5.75%, 12/13/27 (a) | 100,000 | 100,708 |
Ingredion, Inc. | ||
3.20%, 10/01/26 (a) | 100,000 | 93,296 |
IQVIA, Inc. | ||
5.70%, 05/15/28 (a)(c) | 200,000 | 198,286 |
JBS USA LUX S.A. | ||
2.50%, 01/15/27 (a)(c) | 200,000 | 175,804 |
5.13%, 02/01/28 (a)(c) | 150,000 | 144,310 |
JM Smucker Co. | ||
3.50%, 03/15/25 | 150,000 | 145,051 |
3.38%, 12/15/27 (a) | 100,000 | 93,793 |
Johnson & Johnson | ||
0.55%, 09/01/25 (a) | 175,000 | 160,060 |
2.45%, 03/01/26 (a) | 325,000 | 307,229 |
2.95%, 03/03/27 (a) | 175,000 | 166,953 |
0.95%, 09/01/27 (a) | 275,000 | 240,641 |
2.90%, 01/15/28 (a) | 150,000 | 141,365 |
Kaiser Foundation Hospitals | ||
3.15%, 05/01/27 (a) | 100,000 | 94,178 |
Kellogg Co. | ||
3.25%, 04/01/26 | 150,000 | 143,006 |
3.40%, 11/15/27 (a) | 100,000 | 93,801 |
Kenvue, Inc. | ||
5.50%, 03/22/25 (c) | 150,000 | 150,433 |
5.35%, 03/22/26 (a)(c) | 100,000 | 100,798 |
5.05%, 03/22/28 (a)(c) | 150,000 | 151,381 |
Keurig Dr Pepper, Inc. | ||
4.42%, 05/25/25 (a) | 100,000 | 98,275 |
3.40%, 11/15/25 (a) | 100,000 | 95,900 |
2.55%, 09/15/26 (a) | 75,000 | 69,148 |
4.60%, 05/25/28 (a) | 175,000 | 171,629 |
Kimberly-Clark Corp. | ||
3.05%, 08/15/25 | 50,000 | 48,145 |
2.75%, 02/15/26 | 75,000 | 71,164 |
1.05%, 09/15/27 (a) | 125,000 | 108,058 |
Kraft Heinz Foods Co. | ||
3.00%, 06/01/26 (a) | 300,000 | 283,173 |
3.88%, 05/15/27 (a) | 225,000 | 216,155 |
Laboratory Corp. of America Holdings | ||
3.25%, 09/01/24 (a) | 100,000 | 96,986 |
2.30%, 12/01/24 (a) | 50,000 | 47,567 |
3.60%, 02/01/25 (a) | 200,000 | 193,702 |
1.55%, 06/01/26 (a) | 50,000 | 44,666 |
3.60%, 09/01/27 (a) | 100,000 | 94,986 |
McCormick & Co., Inc. | ||
3.15%, 08/15/24 (a) | 125,000 | 121,454 |
0.90%, 02/15/26 (a) | 100,000 | 89,259 |
3.40%, 08/15/27 (a) | 125,000 | 117,144 |
McKesson Corp. | ||
0.90%, 12/03/25 (a) | 50,000 | 44,865 |
1.30%, 08/15/26 (a) | 100,000 | 88,981 |
Mead Johnson Nutrition Co. | ||
4.13%, 11/15/25 (a) | 125,000 | 122,076 |
Medtronic Global Holdings SCA | ||
4.25%, 03/30/28 (a) | 150,000 | 146,589 |
Merck & Co., Inc. | ||
2.75%, 02/10/25 (a) | 420,000 | 405,002 |
0.75%, 02/24/26 (a) | 175,000 | 158,265 |
1.70%, 06/10/27 (a) | 200,000 | 179,220 |
Molson Coors Beverage Co. | ||
3.00%, 07/15/26 (a) | 300,000 | 280,665 |
SECURITY RATE, MATURITY DATE | FACE AMOUNT ($) | VALUE ($) |
Mondelez International, Inc. | ||
1.50%, 05/04/25 (a) | 150,000 | 140,042 |
2.63%, 03/17/27 (a) | 100,000 | 92,428 |
4.13%, 05/07/28 (a) | 100,000 | 97,262 |
Mylan, Inc. | ||
4.55%, 04/15/28 (a) | 100,000 | 94,440 |
Novartis Capital Corp. | ||
1.75%, 02/14/25 (a) | 135,000 | 128,003 |
3.00%, 11/20/25 (a) | 275,000 | 263,263 |
2.00%, 02/14/27 (a) | 375,000 | 343,931 |
PeaceHealth Obligated Group | ||
1.38%, 11/15/25 (a) | 75,000 | 67,646 |
PepsiCo, Inc. | ||
2.25%, 03/19/25 (a) | 250,000 | 238,565 |
2.75%, 04/30/25 (a) | 200,000 | 191,412 |
3.50%, 07/17/25 (a) | 100,000 | 97,433 |
2.85%, 02/24/26 (a) | 125,000 | 119,415 |
2.38%, 10/06/26 (a) | 125,000 | 117,374 |
2.63%, 03/19/27 (a) | 100,000 | 93,513 |
3.00%, 10/15/27 (a) | 250,000 | 235,497 |
4.45%, 05/15/28 (a) | 150,000 | 150,096 |
Pfizer Investment Enterprises Pte. Ltd. | ||
4.65%, 05/19/25 | 400,000 | 396,524 |
4.45%, 05/19/26 (a) | 450,000 | 444,690 |
4.45%, 05/19/28 (a) | 600,000 | 590,430 |
Pfizer, Inc. | ||
0.80%, 05/28/25 (a) | 150,000 | 138,770 |
2.75%, 06/03/26 | 200,000 | 189,162 |
3.00%, 12/15/26 | 250,000 | 236,452 |
Philip Morris International, Inc. | ||
3.25%, 11/10/24 | 180,000 | 174,987 |
1.50%, 05/01/25 (a) | 175,000 | 163,753 |
3.38%, 08/11/25 (a) | 175,000 | 168,656 |
4.88%, 02/13/26 | 200,000 | 198,630 |
2.75%, 02/25/26 (a) | 150,000 | 141,129 |
0.88%, 05/01/26 (a) | 150,000 | 133,925 |
3.13%, 08/17/27 (a) | 100,000 | 93,635 |
5.13%, 11/17/27 (a) | 250,000 | 250,967 |
4.88%, 02/15/28 (a) | 200,000 | 197,332 |
Procter & Gamble Co. | ||
0.55%, 10/29/25 | 175,000 | 159,049 |
2.70%, 02/02/26 | 100,000 | 95,804 |
1.00%, 04/23/26 | 150,000 | 135,957 |
2.45%, 11/03/26 | 175,000 | 164,017 |
1.90%, 02/01/27 | 175,000 | 160,344 |
2.80%, 03/25/27 | 175,000 | 165,063 |
2.85%, 08/11/27 | 150,000 | 140,843 |
Providence St Joseph Health Obligated Group | ||
2.75%, 10/01/26 (a) | 50,000 | 45,691 |
Quest Diagnostics, Inc. | ||
3.50%, 03/30/25 (a) | 50,000 | 48,310 |
3.45%, 06/01/26 (a) | 100,000 | 95,567 |
Revvity, Inc. | ||
0.85%, 09/15/24 (a) | 150,000 | 141,410 |
Reynolds American, Inc. | ||
4.45%, 06/12/25 (a) | 375,000 | 364,789 |
Royalty Pharma PLC | ||
1.20%, 09/02/25 (a) | 175,000 | 158,182 |
1.75%, 09/02/27 (a) | 150,000 | 129,317 |
Shire Acquisitions Investments Ireland DAC | ||
3.20%, 09/23/26 (a) | 475,000 | 446,239 |
SSM Health Care Corp. | ||
3.82%, 06/01/27 (a) | 100,000 | 93,482 |
SECURITY RATE, MATURITY DATE | FACE AMOUNT ($) | VALUE ($) |
Stryker Corp. | ||
1.15%, 06/15/25 (a) | 100,000 | 92,276 |
3.38%, 11/01/25 (a) | 125,000 | 119,725 |
3.50%, 03/15/26 (a) | 175,000 | 168,000 |
3.65%, 03/07/28 (a) | 100,000 | 95,233 |
Sutter Health | ||
1.32%, 08/15/25 (a) | 75,000 | 68,353 |
Sysco Corp. | ||
3.75%, 10/01/25 (a) | 125,000 | 120,906 |
3.30%, 07/15/26 (a) | 200,000 | 189,178 |
3.25%, 07/15/27 (a) | 100,000 | 93,542 |
The Hershey Co. | ||
2.05%, 11/15/24 (a) | 100,000 | 96,007 |
The Kroger Co. | ||
3.50%, 02/01/26 (a) | 50,000 | 48,062 |
2.65%, 10/15/26 (a) | 150,000 | 139,263 |
3.70%, 08/01/27 (a) | 100,000 | 95,601 |
Thermo Fisher Scientific, Inc. | ||
1.22%, 10/18/24 (a) | 400,000 | 378,356 |
4.80%, 11/21/27 (a) | 100,000 | 100,566 |
Tyson Foods, Inc. | ||
4.00%, 03/01/26 (a) | 275,000 | 266,126 |
3.55%, 06/02/27 (a) | 200,000 | 188,256 |
Unilever Capital Corp. | ||
0.63%, 08/12/24 (a) | 100,000 | 94,735 |
3.38%, 03/22/25 (a) | 150,000 | 145,488 |
2.00%, 07/28/26 | 150,000 | 138,519 |
2.90%, 05/05/27 (a) | 175,000 | 163,784 |
Universal Health Services, Inc. | ||
1.65%, 09/01/26 (a) | 125,000 | 109,779 |
UPMC | ||
3.60%, 04/03/25 | 135,000 | 130,218 |
Utah Acquisition Sub, Inc. | ||
3.95%, 06/15/26 (a) | 350,000 | 332,531 |
Viatris, Inc. | ||
1.65%, 06/22/25 (a) | 125,000 | 115,145 |
2.30%, 06/22/27 (a) | 150,000 | 131,274 |
Whirlpool Corp. | ||
3.70%, 05/01/25 | 100,000 | 96,837 |
Zimmer Biomet Holdings, Inc. | ||
1.45%, 11/22/24 (a) | 150,000 | 141,419 |
3.55%, 04/01/25 (a) | 175,000 | 168,957 |
Zoetis, Inc. | ||
4.50%, 11/13/25 (a) | 100,000 | 98,423 |
5.40%, 11/14/25 (a) | 125,000 | 125,435 |
3.00%, 09/12/27 (a) | 100,000 | 93,244 |
44,186,440 | ||
Energy 5.4% | ||
Baker Hughes a GE Co., LLC/Baker Hughes Co-Obligor, Inc. | ||
3.34%, 12/15/27 (a) | 200,000 | 185,386 |
Baker Hughes Holdings LLC | ||
2.06%, 12/15/26 (a) | 100,000 | 90,218 |
Boardwalk Pipelines LP | ||
4.95%, 12/15/24 (a) | 75,000 | 73,790 |
5.95%, 06/01/26 (a) | 100,000 | 100,921 |
4.45%, 07/15/27 (a) | 100,000 | 95,556 |
BP Capital Markets America, Inc. | ||
3.80%, 09/21/25 (a) | 150,000 | 146,271 |
3.41%, 02/11/26 (a) | 100,000 | 96,202 |
3.12%, 05/04/26 (a) | 150,000 | 142,883 |
3.02%, 01/16/27 (a) | 100,000 | 94,192 |
SECURITY RATE, MATURITY DATE | FACE AMOUNT ($) | VALUE ($) |
3.54%, 04/06/27 (a) | 100,000 | 95,631 |
3.59%, 04/14/27 (a) | 125,000 | 119,700 |
BP Capital Markets PLC | ||
3.28%, 09/19/27 (a) | 250,000 | 235,850 |
Canadian Natural Resources Ltd. | ||
3.90%, 02/01/25 (a) | 100,000 | 96,829 |
2.05%, 07/15/25 (a) | 125,000 | 116,608 |
3.85%, 06/01/27 (a) | 200,000 | 189,084 |
Cheniere Corpus Christi Holdings LLC | ||
5.88%, 03/31/25 (a) | 225,000 | 224,332 |
5.13%, 06/30/27 (a) | 200,000 | 196,948 |
Chevron Corp. | ||
1.55%, 05/11/25 (a) | 400,000 | 375,336 |
3.33%, 11/17/25 (a) | 150,000 | 145,084 |
2.95%, 05/16/26 (a) | 300,000 | 285,717 |
2.00%, 05/11/27 (a) | 175,000 | 159,126 |
Chevron USA, Inc. | ||
3.90%, 11/15/24 (a) | 120,000 | 118,018 |
0.69%, 08/12/25 (a) | 100,000 | 91,482 |
1.02%, 08/12/27 (a) | 100,000 | 87,090 |
Columbia Pipeline Group, Inc. | ||
4.50%, 06/01/25 (a) | 175,000 | 171,344 |
ConocoPhillips Co. | ||
2.40%, 03/07/25 (a) | 125,000 | 119,240 |
Continental Resources, Inc. | ||
4.38%, 01/15/28 (a) | 150,000 | 140,900 |
Coterra Energy, Inc. | ||
3.90%, 05/15/27 (a) | 125,000 | 118,199 |
DCP Midstream Operating LP | ||
5.63%, 07/15/27 (a) | 125,000 | 125,104 |
Devon Energy Corp. | ||
5.25%, 09/15/24 (a)(c) | 75,000 | 74,414 |
5.85%, 12/15/25 (a) | 100,000 | 100,899 |
5.25%, 10/15/27 (a) | 50,000 | 49,277 |
Diamondback Energy, Inc. | ||
3.25%, 12/01/26 (a) | 150,000 | 141,216 |
Eastern Energy Gas Holdings LLC | ||
2.50%, 11/15/24 (a) | 100,000 | 95,687 |
3.60%, 12/15/24 (a) | 61,000 | 59,010 |
Enable Midstream Partners LP | ||
4.95%, 05/15/28 (a) | 125,000 | 121,288 |
Enbridge, Inc. | ||
1.60%, 10/04/26 (a) | 100,000 | 89,217 |
4.25%, 12/01/26 (a) | 200,000 | 193,164 |
3.70%, 07/15/27 (a) | 100,000 | 94,604 |
Energy Transfer LP | ||
3.90%, 07/15/26 (a) | 100,000 | 95,231 |
4.40%, 03/15/27 (a) | 100,000 | 95,794 |
4.00%, 10/01/27 (a) | 100,000 | 93,932 |
5.55%, 02/15/28 (a) | 150,000 | 149,845 |
4.95%, 06/15/28 (a) | 100,000 | 97,304 |
Energy Transfer Operating LP | ||
4.05%, 03/15/25 (a) | 175,000 | 170,278 |
2.90%, 05/15/25 (a) | 150,000 | 142,481 |
4.75%, 01/15/26 (a) | 150,000 | 146,781 |
4.20%, 04/15/27 (a) | 100,000 | 95,532 |
5.50%, 06/01/27 (a) | 150,000 | 149,413 |
Enterprise Products Operating LLC | ||
3.75%, 02/15/25 (a) | 185,000 | 180,133 |
3.70%, 02/15/26 (a) | 200,000 | 193,112 |
3.95%, 02/15/27 (a) | 100,000 | 96,624 |
5.25%, 08/16/77 (a)(b) | 250,000 | 219,107 |
5.38%, 02/15/78 (a)(b) | 25,000 | 20,750 |
SECURITY RATE, MATURITY DATE | FACE AMOUNT ($) | VALUE ($) |
EOG Resources, Inc. | ||
3.15%, 04/01/25 (a) | 100,000 | 96,485 |
4.15%, 01/15/26 (a) | 100,000 | 97,975 |
EQT Corp. | ||
6.63%, 02/01/25 (a)(f) | 175,000 | 174,195 |
3.90%, 10/01/27 (a) | 200,000 | 185,840 |
5.70%, 04/01/28 (a) | 100,000 | 99,385 |
Exxon Mobil Corp. | ||
2.02%, 08/16/24 (a) | 200,000 | 192,850 |
2.71%, 03/06/25 (a) | 250,000 | 240,227 |
2.99%, 03/19/25 (a) | 430,000 | 414,541 |
3.04%, 03/01/26 (a) | 400,000 | 382,776 |
2.28%, 08/16/26 (a) | 150,000 | 139,328 |
3.29%, 03/19/27 (a) | 150,000 | 144,111 |
Halliburton Co. | ||
3.80%, 11/15/25 (a) | 95,000 | 91,847 |
Hess Corp. | ||
3.50%, 07/15/24 (a) | 50,000 | 48,789 |
4.30%, 04/01/27 (a) | 150,000 | 144,327 |
HF Sinclair Corp. | ||
2.63%, 10/01/23 | 25,000 | 24,790 |
5.88%, 04/01/26 (a) | 125,000 | 125,640 |
Kinder Morgan Energy Partners LP | ||
4.25%, 09/01/24 (a) | 50,000 | 49,023 |
Kinder Morgan, Inc. | ||
4.30%, 06/01/25 (a) | 225,000 | 219,728 |
1.75%, 11/15/26 (a) | 75,000 | 66,535 |
4.30%, 03/01/28 (a) | 200,000 | 191,570 |
Magellan Midstream Partners LP | ||
5.00%, 03/01/26 (a) | 100,000 | 99,197 |
Marathon Oil Corp. | ||
4.40%, 07/15/27 (a) | 150,000 | 143,327 |
Marathon Petroleum Corp. | ||
3.63%, 09/15/24 (a) | 75,000 | 73,062 |
4.70%, 05/01/25 (a) | 225,000 | 220,903 |
5.13%, 12/15/26 (a) | 125,000 | 124,061 |
MPLX LP | ||
4.88%, 12/01/24 (a) | 175,000 | 172,683 |
4.00%, 02/15/25 (a) | 70,000 | 67,970 |
4.88%, 06/01/25 (a) | 200,000 | 196,826 |
1.75%, 03/01/26 (a) | 250,000 | 227,237 |
4.13%, 03/01/27 (a) | 200,000 | 191,810 |
4.25%, 12/01/27 (a) | 100,000 | 95,277 |
4.00%, 03/15/28 (a) | 200,000 | 188,674 |
National Fuel Gas Co. | ||
5.20%, 07/15/25 (a) | 75,000 | 73,580 |
5.50%, 01/15/26 (a) | 200,000 | 197,232 |
Northwest Pipeline LLC | ||
4.00%, 04/01/27 (a) | 125,000 | 119,336 |
Occidental Petroleum Corp. | ||
5.88%, 09/01/25 (a) | 100,000 | 99,763 |
5.50%, 12/01/25 (a) | 100,000 | 99,249 |
5.55%, 03/15/26 (a) | 150,000 | 148,201 |
8.50%, 07/15/27 (a) | 100,000 | 108,063 |
ONEOK Partners LP | ||
4.90%, 03/15/25 (a) | 75,000 | 73,836 |
ONEOK, Inc. | ||
2.75%, 09/01/24 (a) | 95,000 | 91,874 |
2.20%, 09/15/25 (a) | 75,000 | 69,508 |
5.85%, 01/15/26 (a) | 70,000 | 70,283 |
4.00%, 07/13/27 (a) | 100,000 | 93,795 |
Ovintiv Exploration, Inc. | ||
5.38%, 01/01/26 (a) | 125,000 | 124,369 |
SECURITY RATE, MATURITY DATE | FACE AMOUNT ($) | VALUE ($) |
Ovintiv, Inc. | ||
5.65%, 05/15/28 (a) | 100,000 | 98,178 |
Phillips 66 | ||
3.85%, 04/09/25 (a) | 175,000 | 170,371 |
1.30%, 02/15/26 (a) | 50,000 | 45,262 |
3.90%, 03/15/28 (a) | 100,000 | 95,047 |
Phillips 66 Co. | ||
3.61%, 02/15/25 (a) | 70,000 | 67,540 |
3.55%, 10/01/26 (a) | 100,000 | 93,961 |
4.95%, 12/01/27 (a) | 100,000 | 99,190 |
3.75%, 03/01/28 (a) | 100,000 | 93,898 |
Pioneer Natural Resources Co. | ||
1.13%, 01/15/26 (a) | 150,000 | 135,366 |
Plains All American Pipeline LP/PAA Finance Corp. | ||
3.60%, 11/01/24 (a) | 105,000 | 101,730 |
4.65%, 10/15/25 (a) | 175,000 | 170,774 |
4.50%, 12/15/26 (a) | 125,000 | 121,050 |
Sabine Pass Liquefaction LLC | ||
5.63%, 03/01/25 (a) | 300,000 | 299,142 |
5.88%, 06/30/26 (a) | 250,000 | 252,142 |
5.00%, 03/15/27 (a) | 250,000 | 246,237 |
4.20%, 03/15/28 (a) | 200,000 | 189,772 |
Schlumberger Finance Canada Ltd. | ||
1.40%, 09/17/25 (a) | 75,000 | 69,050 |
Shell International Finance BV | ||
2.00%, 11/07/24 (a) | 225,000 | 215,611 |
3.25%, 05/11/25 | 425,000 | 411,030 |
2.88%, 05/10/26 | 275,000 | 262,160 |
2.50%, 09/12/26 | 175,000 | 163,228 |
Spectra Energy Partners LP | ||
3.50%, 03/15/25 (a) | 125,000 | 120,453 |
3.38%, 10/15/26 (a) | 100,000 | 94,048 |
Sunoco Logistics Partners Operations LP | ||
5.95%, 12/01/25 (a) | 50,000 | 50,171 |
Targa Resources Corp. | ||
5.20%, 07/01/27 (a) | 125,000 | 122,991 |
Targa Resources Partners LP/Targa Resources Partners Finance Corp. | ||
6.50%, 07/15/27 (a) | 125,000 | 125,028 |
5.00%, 01/15/28 (a) | 100,000 | 95,819 |
TC PipeLines LP | ||
4.38%, 03/13/25 (a) | 50,000 | 48,664 |
3.90%, 05/25/27 (a) | 100,000 | 95,355 |
Tennessee Gas Pipeline Co. LLC | ||
7.00%, 03/15/27 | 75,000 | 78,512 |
TotalEnergies Capital International S.A. | ||
2.43%, 01/10/25 (a) | 100,000 | 95,909 |
TransCanada PipeLines Ltd. | ||
1.00%, 10/12/24 (a) | 225,000 | 211,783 |
4.88%, 01/15/26 (a) | 200,000 | 197,920 |
4.25%, 05/15/28 (a) | 200,000 | 191,002 |
Transcontinental Gas Pipe Line Co. LLC | ||
7.85%, 02/01/26 (a) | 75,000 | 78,656 |
4.00%, 03/15/28 (a) | 100,000 | 94,230 |
Valero Energy Corp. | ||
2.15%, 09/15/27 (a) | 100,000 | 88,756 |
Valero Energy Partners LP | ||
4.50%, 03/15/28 (a) | 100,000 | 96,456 |
Western Midstream Operating LP | ||
3.35%, 02/01/25 (a)(d) | 100,000 | 95,729 |
4.65%, 07/01/26 (a) | 100,000 | 96,332 |
4.50%, 03/01/28 (a) | 50,000 | 47,245 |
SECURITY RATE, MATURITY DATE | FACE AMOUNT ($) | VALUE ($) |
Williams Cos., Inc. | ||
3.90%, 01/15/25 (a) | 125,000 | 121,556 |
4.00%, 09/15/25 (a) | 150,000 | 145,082 |
3.75%, 06/15/27 (a) | 200,000 | 189,024 |
19,483,672 | ||
Industrial Other 0.1% | ||
Cintas Corp. No. 2 | ||
3.70%, 04/01/27 (a) | 200,000 | 192,946 |
The Leland Stanford Junior University | ||
1.29%, 06/01/27 (a) | 75,000 | 66,045 |
Yale University | ||
0.87%, 04/15/25 (a) | 100,000 | 92,802 |
351,793 | ||
Technology 9.5% | ||
Adobe, Inc. | ||
1.90%, 02/01/25 (a) | 95,000 | 90,280 |
3.25%, 02/01/25 (a) | 150,000 | 145,672 |
2.15%, 02/01/27 (a) | 150,000 | 137,943 |
Alphabet, Inc. | ||
2.00%, 08/15/26 (a) | 325,000 | 301,080 |
0.80%, 08/15/27 (a) | 175,000 | 151,587 |
Analog Devices, Inc. | ||
2.95%, 04/01/25 (a) | 125,000 | 120,228 |
3.50%, 12/05/26 (a) | 175,000 | 168,686 |
Apple Inc. | ||
1.80%, 09/11/24 (a) | 120,000 | 115,552 |
2.75%, 01/13/25 (a) | 210,000 | 202,627 |
2.50%, 02/09/25 | 250,000 | 240,060 |
1.13%, 05/11/25 (a) | 400,000 | 372,872 |
3.20%, 05/13/25 | 300,000 | 290,478 |
0.55%, 08/20/25 (a) | 250,000 | 228,462 |
0.70%, 02/08/26 (a) | 300,000 | 270,561 |
3.25%, 02/23/26 (a) | 525,000 | 505,843 |
2.45%, 08/04/26 (a) | 400,000 | 375,016 |
2.05%, 09/11/26 (a) | 300,000 | 276,600 |
3.35%, 02/09/27 (a) | 350,000 | 336,122 |
3.20%, 05/11/27 (a) | 375,000 | 358,237 |
3.00%, 06/20/27 (a) | 125,000 | 118,551 |
2.90%, 09/12/27 (a) | 350,000 | 329,098 |
3.00%, 11/13/27 (a) | 300,000 | 283,002 |
1.20%, 02/08/28 (a) | 200,000 | 173,322 |
4.00%, 05/10/28 (a) | 225,000 | 221,391 |
Applied Materials, Inc. | ||
3.90%, 10/01/25 (a) | 125,000 | 122,324 |
3.30%, 04/01/27 (a) | 200,000 | 191,082 |
Arrow Electronics, Inc. | ||
3.25%, 09/08/24 (a) | 75,000 | 72,500 |
4.00%, 04/01/25 (a) | 75,000 | 72,596 |
3.88%, 01/12/28 (a) | 75,000 | 69,560 |
Autodesk, Inc. | ||
4.38%, 06/15/25 (a) | 50,000 | 48,955 |
3.50%, 06/15/27 (a) | 100,000 | 94,797 |
Automatic Data Processing, Inc. | ||
3.38%, 09/15/25 (a) | 175,000 | 169,214 |
Avnet, Inc. | ||
4.63%, 04/15/26 (a) | 100,000 | 97,050 |
6.25%, 03/15/28 (a) | 75,000 | 75,860 |
Baidu, Inc. | ||
4.13%, 06/30/25 | 200,000 | 193,722 |
1.63%, 02/23/27 (a) | 200,000 | 176,002 |
SECURITY RATE, MATURITY DATE | FACE AMOUNT ($) | VALUE ($) |
Broadcom Corp./Broadcom Cayman Finance Ltd. | ||
3.13%, 01/15/25 (a) | 90,000 | 86,564 |
3.88%, 01/15/27 (a) | 450,000 | 429,520 |
3.50%, 01/15/28 (a) | 150,000 | 138,677 |
Broadcom, Inc. | ||
3.63%, 10/15/24 (a) | 100,000 | 97,300 |
3.15%, 11/15/25 (a) | 155,000 | 147,369 |
3.46%, 09/15/26 (a) | 150,000 | 141,962 |
Broadridge Financial Solutions, Inc. | ||
3.40%, 06/27/26 (a) | 100,000 | 94,324 |
Cadence Design Systems, Inc. | ||
4.38%, 10/15/24 (a) | 50,000 | 49,214 |
CDW LLC/CDW Finance Corp. | ||
5.50%, 12/01/24 (a) | 50,000 | 49,715 |
4.13%, 05/01/25 (a) | 150,000 | 145,421 |
2.67%, 12/01/26 (a) | 150,000 | 135,053 |
4.25%, 04/01/28 (a) | 100,000 | 92,081 |
CGI, Inc. | ||
1.45%, 09/14/26 (a) | 125,000 | 110,594 |
Cisco Systems, Inc. | ||
3.50%, 06/15/25 | 100,000 | 97,170 |
2.95%, 02/28/26 | 125,000 | 120,079 |
2.50%, 09/20/26 (a) | 225,000 | 211,000 |
Dell International LLC/EMC Corp. | ||
4.00%, 07/15/24 (a) | 100,000 | 98,372 |
5.85%, 07/15/25 (a) | 175,000 | 175,779 |
6.02%, 06/15/26 (a) | 700,000 | 710,661 |
4.90%, 10/01/26 (a) | 275,000 | 273,732 |
6.10%, 07/15/27 (a) | 100,000 | 103,329 |
5.25%, 02/01/28 (a) | 150,000 | 149,797 |
DXC Technology Co. | ||
1.80%, 09/15/26 (a) | 125,000 | 108,770 |
Equifax, Inc. | ||
2.60%, 12/01/24 (a) | 125,000 | 119,301 |
2.60%, 12/15/25 (a) | 75,000 | 69,871 |
5.10%, 12/15/27 (a) | 100,000 | 99,141 |
5.10%, 06/01/28 (a) | 100,000 | 98,709 |
Equinix, Inc. | ||
2.63%, 11/18/24 (a) | 170,000 | 162,612 |
1.25%, 07/15/25 (a) | 100,000 | 91,379 |
1.00%, 09/15/25 (a) | 125,000 | 112,998 |
1.45%, 05/15/26 (a) | 125,000 | 111,831 |
2.90%, 11/18/26 (a) | 100,000 | 91,816 |
1.55%, 03/15/28 (a) | 100,000 | 84,041 |
2.00%, 05/15/28 (a) | 50,000 | 42,647 |
FactSet Research Systems, Inc. | ||
2.90%, 03/01/27 (a) | 100,000 | 92,015 |
Fidelity National Information Services, Inc. | ||
4.50%, 07/15/25 | 100,000 | 97,872 |
1.15%, 03/01/26 (a) | 200,000 | 178,632 |
4.70%, 07/15/27 (a) | 100,000 | 97,510 |
1.65%, 03/01/28 (a) | 100,000 | 84,650 |
Fiserv, Inc. | ||
3.85%, 06/01/25 (a) | 150,000 | 145,624 |
3.20%, 07/01/26 (a) | 300,000 | 281,691 |
2.25%, 06/01/27 (a) | 150,000 | 134,945 |
5.45%, 03/02/28 (a) | 100,000 | 100,603 |
Flex Ltd. | ||
4.75%, 06/15/25 (a) | 100,000 | 97,809 |
3.75%, 02/01/26 (a) | 100,000 | 95,374 |
6.00%, 01/15/28 (a) | 75,000 | 76,400 |
Fortinet, Inc. | ||
1.00%, 03/15/26 (a) | 100,000 | 89,303 |
SECURITY RATE, MATURITY DATE | FACE AMOUNT ($) | VALUE ($) |
Genpact Luxembourg Sarl | ||
3.38%, 12/01/24 (a) | 50,000 | 48,141 |
1.75%, 04/10/26 (a) | 100,000 | 90,080 |
Global Payments, Inc. | ||
1.50%, 11/15/24 (a) | 100,000 | 94,041 |
2.65%, 02/15/25 (a) | 150,000 | 142,355 |
1.20%, 03/01/26 (a) | 175,000 | 155,598 |
4.80%, 04/01/26 (a) | 125,000 | 122,318 |
2.15%, 01/15/27 (a) | 100,000 | 88,952 |
4.95%, 08/15/27 (a) | 75,000 | 73,182 |
Hewlett Packard Enterprise Co. | ||
5.90%, 10/01/24 | 100,000 | 99,974 |
4.90%, 10/15/25 (a) | 400,000 | 394,760 |
1.75%, 04/01/26 (a) | 100,000 | 91,168 |
HP, Inc. | ||
2.20%, 06/17/25 (a) | 150,000 | 141,086 |
1.45%, 06/17/26 (a) | 175,000 | 157,258 |
3.00%, 06/17/27 (a) | 150,000 | 138,537 |
4.75%, 01/15/28 (a) | 125,000 | 122,121 |
Intel Corp. | ||
3.40%, 03/25/25 (a) | 150,000 | 145,505 |
3.70%, 07/29/25 (a) | 375,000 | 364,567 |
4.88%, 02/10/26 | 250,000 | 249,370 |
2.60%, 05/19/26 (a) | 200,000 | 188,244 |
3.75%, 03/25/27 (a) | 100,000 | 96,319 |
3.15%, 05/11/27 (a) | 150,000 | 140,724 |
3.75%, 08/05/27 (a) | 200,000 | 191,522 |
4.88%, 02/10/28 (a) | 250,000 | 249,212 |
International Business Machines Corp. | ||
7.00%, 10/30/25 | 175,000 | 182,213 |
3.45%, 02/19/26 | 275,000 | 263,576 |
3.30%, 05/15/26 | 500,000 | 476,695 |
2.20%, 02/09/27 (a) | 100,000 | 91,096 |
1.70%, 05/15/27 (a) | 200,000 | 177,468 |
4.15%, 07/27/27 (a) | 100,000 | 97,251 |
6.22%, 08/01/27 | 75,000 | 78,694 |
6.50%, 01/15/28 | 50,000 | 53,136 |
4.50%, 02/06/28 (a) | 200,000 | 196,274 |
Intuit, Inc. | ||
0.95%, 07/15/25 (a) | 100,000 | 91,505 |
1.35%, 07/15/27 (a) | 75,000 | 65,834 |
Jabil, Inc. | ||
1.70%, 04/15/26 (a) | 75,000 | 67,149 |
4.25%, 05/15/27 (a) | 75,000 | 71,657 |
3.95%, 01/12/28 (a) | 100,000 | 93,796 |
Juniper Networks, Inc. | ||
1.20%, 12/10/25 (a) | 75,000 | 67,269 |
Keysight Technologies, Inc. | ||
4.55%, 10/30/24 (a) | 125,000 | 123,093 |
4.60%, 04/06/27 (a) | 100,000 | 98,718 |
Kyndryl Holdings, Inc. | ||
2.05%, 10/15/26 (a) | 100,000 | 87,069 |
Lam Research Corp. | ||
3.80%, 03/15/25 (a) | 65,000 | 63,586 |
3.75%, 03/15/26 (a) | 150,000 | 145,605 |
Leidos, Inc. | ||
3.63%, 05/15/25 (a) | 60,000 | 57,593 |
Marvell Technology, Inc. | ||
1.65%, 04/15/26 (a) | 100,000 | 90,257 |
2.45%, 04/15/28 (a) | 100,000 | 87,496 |
4.88%, 06/22/28 (a) | 100,000 | 97,144 |
Mastercard, Inc. | ||
2.00%, 03/03/25 (a) | 150,000 | 142,704 |
2.95%, 11/21/26 (a) | 100,000 | 94,616 |
3.30%, 03/26/27 (a) | 125,000 | 119,528 |
SECURITY RATE, MATURITY DATE | FACE AMOUNT ($) | VALUE ($) |
3.50%, 02/26/28 (a) | 100,000 | 95,698 |
4.88%, 03/09/28 (a) | 100,000 | 101,218 |
Microchip Technology, Inc. | ||
4.25%, 09/01/25 (a) | 325,000 | 315,185 |
Micron Technology, Inc. | ||
4.98%, 02/06/26 (a) | 75,000 | 73,912 |
4.19%, 02/15/27 (a) | 175,000 | 167,874 |
5.38%, 04/15/28 (a) | 75,000 | 74,349 |
Microsoft Corp. | ||
2.70%, 02/12/25 (a) | 315,000 | 304,006 |
3.13%, 11/03/25 (a) | 500,000 | 481,430 |
2.40%, 08/08/26 (a) | 600,000 | 563,256 |
3.30%, 02/06/27 (a) | 600,000 | 577,482 |
Moody's Corp. | ||
3.75%, 03/24/25 (a) | 100,000 | 97,343 |
Motorola Solutions, Inc. | ||
4.00%, 09/01/24 | 75,000 | 73,306 |
4.60%, 02/23/28 (a) | 100,000 | 97,026 |
NetApp, Inc. | ||
3.30%, 09/29/24 (a) | 65,000 | 62,969 |
1.88%, 06/22/25 (a) | 150,000 | 139,440 |
2.38%, 06/22/27 (a) | 50,000 | 45,419 |
Nokia Oyj | ||
4.38%, 06/12/27 | 75,000 | 70,766 |
NVIDIA Corp. | ||
3.20%, 09/16/26 (a) | 175,000 | 168,695 |
1.55%, 06/15/28 (a) | 100,000 | 87,370 |
NXP BV/NXP Funding LLC | ||
5.35%, 03/01/26 (a) | 25,000 | 24,858 |
NXP BV/NXP Funding LLC/NXP USA, Inc. | ||
2.70%, 05/01/25 (a) | 100,000 | 94,824 |
3.88%, 06/18/26 (a) | 75,000 | 72,119 |
3.15%, 05/01/27 (a) | 100,000 | 92,224 |
4.40%, 06/01/27 (a) | 100,000 | 96,813 |
Oracle Corp. | ||
3.40%, 07/08/24 (a) | 200,000 | 195,768 |
2.95%, 11/15/24 (a) | 300,000 | 289,764 |
2.50%, 04/01/25 (a) | 535,000 | 508,009 |
2.95%, 05/15/25 (a) | 400,000 | 381,848 |
5.80%, 11/10/25 | 200,000 | 202,392 |
1.65%, 03/25/26 (a) | 425,000 | 386,231 |
2.65%, 07/15/26 (a) | 475,000 | 440,106 |
2.80%, 04/01/27 (a) | 350,000 | 322,115 |
3.25%, 11/15/27 (a) | 425,000 | 394,612 |
2.30%, 03/25/28 (a) | 250,000 | 220,795 |
4.50%, 05/06/28 (a) | 100,000 | 97,376 |
PayPal Holdings, Inc. | ||
2.40%, 10/01/24 (a) | 200,000 | 192,370 |
1.65%, 06/01/25 (a) | 175,000 | 163,835 |
2.65%, 10/01/26 (a) | 175,000 | 162,808 |
3.90%, 06/01/27 (a) | 100,000 | 96,853 |
Qorvo, Inc. | ||
1.75%, 12/15/24 (a)(c) | 100,000 | 93,083 |
QUALCOMM, Inc. | ||
3.45%, 05/20/25 (a) | 225,000 | 218,371 |
3.25%, 05/20/27 (a) | 325,000 | 308,477 |
1.30%, 05/20/28 (a) | 125,000 | 106,638 |
Roper Technologies, Inc. | ||
2.35%, 09/15/24 (a) | 75,000 | 72,026 |
1.00%, 09/15/25 (a) | 125,000 | 113,776 |
3.85%, 12/15/25 (a) | 25,000 | 24,013 |
3.80%, 12/15/26 (a) | 100,000 | 95,810 |
1.40%, 09/15/27 (a) | 150,000 | 129,380 |
SECURITY RATE, MATURITY DATE | FACE AMOUNT ($) | VALUE ($) |
S&P Global, Inc. | ||
2.95%, 01/22/27 (a) | 75,000 | 70,534 |
2.45%, 03/01/27 (a) | 200,000 | 184,748 |
Salesforce, Inc. | ||
3.70%, 04/11/28 (a) | 250,000 | 241,455 |
Skyworks Solutions, Inc. | ||
1.80%, 06/01/26 (a) | 100,000 | 89,598 |
TD SYNNEX Corp. | ||
1.25%, 08/09/24 (a) | 125,000 | 118,108 |
1.75%, 08/09/26 (a) | 100,000 | 87,427 |
Texas Instruments, Inc. | ||
4.70%, 11/18/24 | 50,000 | 49,902 |
1.38%, 03/12/25 (a) | 125,000 | 117,501 |
1.13%, 09/15/26 (a) | 100,000 | 89,322 |
2.90%, 11/03/27 (a) | 100,000 | 93,550 |
Thomson Reuters Corp. | ||
3.35%, 05/15/26 (a) | 100,000 | 95,245 |
Trimble, Inc. | ||
4.75%, 12/01/24 (a) | 70,000 | 68,825 |
4.90%, 06/15/28 (a) | 100,000 | 97,832 |
TSMC Arizona Corp. | ||
1.75%, 10/25/26 (a) | 200,000 | 178,360 |
3.88%, 04/22/27 (a) | 200,000 | 192,436 |
Tyco Electronics Group S.A. | ||
3.45%, 08/01/24 (a) | 50,000 | 48,824 |
3.70%, 02/15/26 (a) | 100,000 | 96,628 |
3.13%, 08/15/27 (a) | 75,000 | 70,330 |
VeriSign, Inc. | ||
5.25%, 04/01/25 (a) | 100,000 | 98,987 |
4.75%, 07/15/27 (a) | 100,000 | 98,354 |
Verisk Analytics, Inc. | ||
4.00%, 06/15/25 (a) | 150,000 | 145,672 |
Visa, Inc. | ||
3.15%, 12/14/25 (a) | 600,000 | 575,382 |
1.90%, 04/15/27 (a) | 200,000 | 182,454 |
2.75%, 09/15/27 (a) | 200,000 | 185,912 |
VMware, Inc. | ||
1.00%, 08/15/24 (a) | 225,000 | 213,073 |
4.50%, 05/15/25 (a) | 100,000 | 98,003 |
1.40%, 08/15/26 (a) | 275,000 | 243,006 |
3.90%, 08/21/27 (a) | 200,000 | 189,920 |
Western Digital Corp. | ||
4.75%, 02/15/26 (a) | 375,000 | 357,660 |
Western Union Co. | ||
2.85%, 01/10/25 (a) | 100,000 | 95,298 |
1.35%, 03/15/26 (a) | 100,000 | 88,623 |
Workday, Inc. | ||
3.50%, 04/01/27 (a) | 175,000 | 166,049 |
34,409,301 | ||
Transportation 1.4% | ||
American Airlines 2016-1 Class AA Pass-Through Trust | ||
3.58%, 01/15/28 | 69,063 | 63,860 |
BNSF Funding Trust I | ||
6.61%, 12/15/55 (a)(b) | 75,000 | 72,771 |
Burlington Northern Santa Fe LLC | ||
3.40%, 09/01/24 (a) | 50,000 | 48,847 |
3.00%, 04/01/25 (a) | 100,000 | 96,414 |
3.65%, 09/01/25 (a) | 50,000 | 48,551 |
7.00%, 12/15/25 | 50,000 | 52,054 |
Canadian National Railway Co. | ||
2.95%, 11/21/24 (a) | 75,000 | 72,481 |
2.75%, 03/01/26 (a) | 75,000 | 70,687 |
SECURITY RATE, MATURITY DATE | FACE AMOUNT ($) | VALUE ($) |
Canadian Pacific Railway Co. | ||
1.35%, 12/02/24 (a) | 175,000 | 164,545 |
2.90%, 02/01/25 (a) | 140,000 | 134,448 |
1.75%, 12/02/26 (a) | 175,000 | 157,397 |
4.00%, 06/01/28 (a) | 100,000 | 95,753 |
CH Robinson Worldwide, Inc. | ||
4.20%, 04/15/28 (a) | 100,000 | 96,092 |
Continental Airlines 2012-2 Class A Pass-Through Trust | ||
4.00%, 04/29/26 | 118,595 | 114,921 |
CSX Corp. | ||
3.40%, 08/01/24 (a) | 75,000 | 73,276 |
3.35%, 11/01/25 (a) | 125,000 | 119,710 |
2.60%, 11/01/26 (a) | 100,000 | 92,655 |
3.25%, 06/01/27 (a) | 150,000 | 141,580 |
3.80%, 03/01/28 (a) | 100,000 | 95,596 |
FedEx Corp. | ||
3.25%, 04/01/26 (a) | 125,000 | 119,596 |
3.40%, 02/15/28 (a) | 100,000 | 93,184 |
GXO Logistics, Inc. | ||
1.65%, 07/15/26 (a) | 100,000 | 87,251 |
JB Hunt Transport Services, Inc. | ||
3.88%, 03/01/26 (a) | 100,000 | 96,712 |
Norfolk Southern Corp. | ||
2.90%, 06/15/26 (a) | 150,000 | 141,390 |
7.80%, 05/15/27 | 100,000 | 110,170 |
Ryder System, Inc. | ||
2.50%, 09/01/24 (a) | 70,000 | 67,302 |
4.63%, 06/01/25 (a) | 100,000 | 97,939 |
3.35%, 09/01/25 (a) | 90,000 | 85,624 |
1.75%, 09/01/26 (a) | 25,000 | 22,308 |
2.90%, 12/01/26 (a) | 100,000 | 91,686 |
2.85%, 03/01/27 (a) | 100,000 | 91,535 |
4.30%, 06/15/27 (a) | 50,000 | 48,136 |
5.25%, 06/01/28 (a) | 100,000 | 98,813 |
Southwest Airlines Co. | ||
5.25%, 05/04/25 (a) | 225,000 | 222,977 |
3.00%, 11/15/26 (a) | 50,000 | 45,976 |
5.13%, 06/15/27 (a) | 300,000 | 298,050 |
Union Pacific Corp. | ||
3.25%, 01/15/25 (a) | 65,000 | 63,060 |
3.75%, 07/15/25 (a) | 75,000 | 72,887 |
3.25%, 08/15/25 (a) | 75,000 | 72,193 |
4.75%, 02/21/26 (a) | 75,000 | 74,561 |
2.75%, 03/01/26 (a) | 100,000 | 94,683 |
2.15%, 02/05/27 (a) | 100,000 | 91,497 |
3.00%, 04/15/27 (a) | 75,000 | 70,615 |
United Airlines 2013-1 Class A Pass-Through Trust | ||
4.30%, 08/15/25 | 115,636 | 111,663 |
United Airlines 2020-1 Class A Pass-Through Trust | ||
5.88%, 10/15/27 | 323,408 | 321,347 |
United Airlines 2020-1 Class B Pass-Through Trust | ||
4.88%, 01/15/26 | 102,750 | 98,772 |
United Parcel Service, Inc. | ||
2.20%, 09/01/24 (a) | 100,000 | 96,522 |
3.90%, 04/01/25 (a) | 200,000 | 195,880 |
2.40%, 11/15/26 (a) | 100,000 | 93,666 |
3.05%, 11/15/27 (a) | 150,000 | 141,427 |
5,229,060 | ||
176,438,055 | ||
SECURITY RATE, MATURITY DATE | FACE AMOUNT ($) | VALUE ($) |
Utility 5.7% | ||
Electric 5.2% | ||
AES Corp. | ||
1.38%, 01/15/26 (a) | 150,000 | 134,046 |
5.45%, 06/01/28 (a) | 100,000 | 98,331 |
Alabama Power Co. | ||
3.75%, 09/01/27 (a) | 100,000 | 95,828 |
Ameren Corp. | ||
2.50%, 09/15/24 (a) | 50,000 | 48,018 |
3.65%, 02/15/26 (a) | 175,000 | 167,039 |
1.95%, 03/15/27 (a) | 100,000 | 89,051 |
1.75%, 03/15/28 (a) | 50,000 | 42,968 |
Ameren Illinois Co. | ||
3.25%, 03/01/25 (a) | 50,000 | 48,341 |
American Electric Power Co., Inc. | ||
1.00%, 11/01/25 (a) | 100,000 | 90,311 |
5.75%, 11/01/27 (a) | 175,000 | 179,098 |
3.88%, 02/15/62 (a)(b) | 125,000 | 100,388 |
Appalachian Power Co. | ||
3.40%, 06/01/25 (a) | 75,000 | 71,948 |
Arizona Public Service Co. | ||
3.15%, 05/15/25 (a) | 125,000 | 119,770 |
Avangrid, Inc. | ||
3.15%, 12/01/24 (a) | 160,000 | 153,720 |
3.20%, 04/15/25 (a) | 75,000 | 71,420 |
Berkshire Hathaway Energy Co. | ||
3.50%, 02/01/25 (a) | 30,000 | 29,024 |
4.05%, 04/15/25 (a) | 200,000 | 195,340 |
Black Hills Corp. | ||
3.95%, 01/15/26 (a) | 50,000 | 47,876 |
3.15%, 01/15/27 (a) | 150,000 | 139,207 |
CenterPoint Energy Houston Electric LLC | ||
2.40%, 09/01/26 (a) | 75,000 | 69,124 |
CenterPoint Energy, Inc. | ||
2.50%, 09/01/24 (a) | 100,000 | 96,131 |
1.45%, 06/01/26 (a) | 100,000 | 89,575 |
Cleco Corporate Holdings LLC | ||
3.74%, 05/01/26 (a) | 75,000 | 70,493 |
CMS Energy Corp. | ||
3.00%, 05/15/26 (a) | 100,000 | 93,720 |
Commonwealth Edison Co. | ||
2.55%, 06/15/26 (a) | 75,000 | 70,204 |
2.95%, 08/15/27 (a) | 50,000 | 46,525 |
Connecticut Light and Power Co. | ||
0.75%, 12/01/25 (a) | 75,000 | 67,407 |
3.20%, 03/15/27 (a) | 225,000 | 212,164 |
Consolidated Edison Co. of New York, Inc. | ||
3.80%, 05/15/28 (a) | 100,000 | 95,405 |
Constellation Energy Generation LLC | ||
3.25%, 06/01/25 (a) | 150,000 | 142,950 |
5.60%, 03/01/28 (a) | 150,000 | 151,546 |
Dominion Energy, Inc. | ||
3.07%, 08/15/24 (d) | 50,000 | 48,315 |
3.30%, 03/15/25 (a) | 50,000 | 48,028 |
3.90%, 10/01/25 (a) | 125,000 | 120,845 |
1.45%, 04/15/26 (a) | 125,000 | 112,602 |
2.85%, 08/15/26 (a) | 100,000 | 92,851 |
3.60%, 03/15/27 (a) | 50,000 | 47,221 |
4.25%, 06/01/28 (a) | 100,000 | 95,977 |
5.75%, 10/01/54 (a)(b) | 100,000 | 95,759 |
SECURITY RATE, MATURITY DATE | FACE AMOUNT ($) | VALUE ($) |
DTE Electric Co. | ||
3.38%, 03/01/25 (a) | 50,000 | 48,509 |
1.90%, 04/01/28 (a) | 100,000 | 87,727 |
DTE Energy Co. | ||
2.53%, 10/01/24 (d) | 100,000 | 95,785 |
4.22%, 11/01/24 (d) | 175,000 | 171,334 |
1.05%, 06/01/25 (a) | 150,000 | 137,500 |
2.85%, 10/01/26 (a) | 100,000 | 92,251 |
4.88%, 06/01/28 (a) | 100,000 | 97,891 |
Duke Energy Carolinas LLC | ||
2.95%, 12/01/26 (a) | 125,000 | 117,634 |
Duke Energy Corp. | ||
0.90%, 09/15/25 (a) | 100,000 | 91,057 |
2.65%, 09/01/26 (a) | 250,000 | 231,322 |
3.15%, 08/15/27 (a) | 100,000 | 92,558 |
5.00%, 12/08/27 (a) | 150,000 | 149,257 |
4.30%, 03/15/28 (a) | 150,000 | 144,379 |
3.25%, 01/15/82 (a)(b) | 75,000 | 55,991 |
Duke Energy Florida LLC | ||
3.20%, 01/15/27 (a) | 50,000 | 47,439 |
Duke Energy Progress LLC | ||
3.25%, 08/15/25 (a) | 100,000 | 96,159 |
Edison International | ||
3.55%, 11/15/24 (a) | 75,000 | 72,602 |
4.95%, 04/15/25 (a) | 90,000 | 88,468 |
4.70%, 08/15/25 | 75,000 | 73,308 |
5.75%, 06/15/27 (a) | 100,000 | 100,282 |
4.13%, 03/15/28 (a) | 100,000 | 93,612 |
Emera US Finance LP | ||
3.55%, 06/15/26 (a) | 125,000 | 118,419 |
Enel Americas S.A. | ||
4.00%, 10/25/26 (a) | 100,000 | 96,810 |
Entergy Corp. | ||
0.90%, 09/15/25 (a) | 125,000 | 112,465 |
2.95%, 09/01/26 (a) | 150,000 | 138,564 |
1.90%, 06/15/28 (a) | 100,000 | 85,381 |
Entergy Louisiana LLC | ||
0.95%, 10/01/24 (a) | 175,000 | 165,158 |
5.59%, 10/01/24 | 50,000 | 49,984 |
2.40%, 10/01/26 (a) | 100,000 | 91,787 |
3.25%, 04/01/28 (a) | 100,000 | 92,106 |
Evergy Metro, Inc. | ||
3.65%, 08/15/25 (a) | 75,000 | 72,152 |
Evergy, Inc. | ||
2.45%, 09/15/24 (a) | 200,000 | 192,164 |
Eversource Energy | ||
2.90%, 10/01/24 (a) | 75,000 | 72,191 |
3.15%, 01/15/25 (a) | 75,000 | 72,215 |
0.80%, 08/15/25 (a) | 50,000 | 45,125 |
1.40%, 08/15/26 (a) | 75,000 | 66,786 |
2.90%, 03/01/27 (a) | 100,000 | 92,353 |
4.60%, 07/01/27 (a) | 100,000 | 97,718 |
3.30%, 01/15/28 (a) | 100,000 | 92,167 |
5.45%, 03/01/28 (a) | 150,000 | 151,095 |
Exelon Corp. | ||
3.95%, 06/15/25 (a) | 125,000 | 121,146 |
3.40%, 04/15/26 (a) | 150,000 | 143,026 |
2.75%, 03/15/27 (a) | 125,000 | 114,602 |
5.15%, 03/15/28 (a) | 150,000 | 149,628 |
Florida Power & Light Co. | ||
2.85%, 04/01/25 (a) | 200,000 | 192,490 |
3.13%, 12/01/25 (a) | 100,000 | 95,777 |
5.05%, 04/01/28 (a) | 200,000 | 201,666 |
4.40%, 05/15/28 (a) | 100,000 | 98,158 |
SECURITY RATE, MATURITY DATE | FACE AMOUNT ($) | VALUE ($) |
Fortis, Inc. | ||
3.06%, 10/04/26 (a) | 190,000 | 175,530 |
Georgia Power Co. | ||
2.20%, 09/15/24 (a) | 100,000 | 95,727 |
3.25%, 03/30/27 (a) | 125,000 | 116,647 |
4.65%, 05/16/28 (a) | 100,000 | 98,142 |
Gulf Power Co. | ||
3.30%, 05/30/27 (a) | 50,000 | 47,339 |
Iberdrola International BV | ||
5.81%, 03/15/25 | 50,000 | 50,286 |
Indiana Michigan Power Co. | ||
3.85%, 05/15/28 (a) | 100,000 | 95,295 |
Interstate Power and Light Co. | ||
3.25%, 12/01/24 (a) | 100,000 | 96,642 |
IPALCO Enterprises, Inc. | ||
3.70%, 09/01/24 (a) | 110,000 | 106,439 |
ITC Holdings Corp. | ||
3.25%, 06/30/26 (a) | 75,000 | 71,072 |
3.35%, 11/15/27 (a) | 100,000 | 93,471 |
Louisville Gas and Electric Co. | ||
3.30%, 10/01/25 (a) | 100,000 | 96,030 |
MidAmerican Energy Co. | ||
3.50%, 10/15/24 (a) | 125,000 | 121,717 |
3.10%, 05/01/27 (a) | 75,000 | 70,166 |
National Grid PLC | ||
5.60%, 06/12/28 (a) | 150,000 | 150,733 |
National Rural Utilities Cooperative Finance Corp. | ||
2.85%, 01/27/25 (a) | 50,000 | 48,110 |
1.88%, 02/07/25 | 75,000 | 70,893 |
3.25%, 11/01/25 (a) | 225,000 | 214,261 |
4.45%, 03/13/26 (a) | 100,000 | 98,551 |
1.00%, 06/15/26 (a) | 100,000 | 88,674 |
3.05%, 04/25/27 (a) | 50,000 | 46,512 |
4.80%, 03/15/28 (a) | 150,000 | 148,753 |
5.25%, 04/20/46 (a)(b) | 75,000 | 70,634 |
NextEra Energy Capital Holdings, Inc. | ||
4.26%, 09/01/24 | 250,000 | 245,865 |
4.45%, 06/20/25 | 100,000 | 98,205 |
1.88%, 01/15/27 (a) | 300,000 | 267,477 |
3.55%, 05/01/27 (a) | 250,000 | 236,072 |
4.63%, 07/15/27 (a) | 250,000 | 244,710 |
4.90%, 02/28/28 (a) | 200,000 | 198,226 |
1.90%, 06/15/28 (a) | 200,000 | 171,544 |
4.80%, 12/01/77 (a)(b) | 50,000 | 44,141 |
3.80%, 03/15/82 (a)(b) | 100,000 | 84,549 |
Oncor Electric Delivery Co. LLC | ||
2.95%, 04/01/25 (a) | 75,000 | 71,877 |
0.55%, 10/01/25 (a) | 75,000 | 67,865 |
4.30%, 05/15/28 (a)(c) | 100,000 | 97,548 |
Pacific Gas and Electric Co. | ||
3.40%, 08/15/24 (a) | 75,000 | 72,566 |
3.50%, 06/15/25 (a) | 100,000 | 94,843 |
3.45%, 07/01/25 | 150,000 | 142,113 |
3.15%, 01/01/26 | 375,000 | 348,240 |
2.95%, 03/01/26 (a) | 100,000 | 91,937 |
3.30%, 03/15/27 (a) | 100,000 | 91,228 |
5.45%, 06/15/27 (a) | 100,000 | 97,444 |
2.10%, 08/01/27 (a) | 100,000 | 85,908 |
3.30%, 12/01/27 (a) | 125,000 | 110,292 |
3.00%, 06/15/28 (a) | 100,000 | 86,653 |
PECO Energy Co. | ||
3.15%, 10/15/25 (a) | 50,000 | 48,030 |
Pinnacle West Capital Corp. | ||
1.30%, 06/15/25 (a) | 100,000 | 91,092 |
SECURITY RATE, MATURITY DATE | FACE AMOUNT ($) | VALUE ($) |
PPL Capital Funding, Inc. | ||
3.10%, 05/15/26 (a) | 100,000 | 94,528 |
Public Service Electric & Gas Co. | ||
2.25%, 09/15/26 (a) | 50,000 | 46,035 |
Public Service Electric and Gas Co. | ||
3.70%, 05/01/28 (a) | 100,000 | 95,187 |
Public Service Enterprise Group, Inc. | ||
0.80%, 08/15/25 (a) | 100,000 | 90,524 |
0.95%, 03/15/26 (a) | 100,000 | 90,374 |
5.85%, 11/15/27 (a) | 100,000 | 102,255 |
Puget Energy, Inc. | ||
3.65%, 05/15/25 (a) | 75,000 | 71,869 |
2.38%, 06/15/28 (a) | 125,000 | 107,875 |
San Diego Gas & Electric Co. | ||
2.50%, 05/15/26 (a) | 125,000 | 116,762 |
Sierra Pacific Power Co. | ||
2.60%, 05/01/26 (a) | 100,000 | 93,330 |
Southern California Edison Co. | ||
3.70%, 08/01/25 (a) | 150,000 | 144,603 |
1.20%, 02/01/26 (a) | 100,000 | 89,579 |
4.70%, 06/01/27 (a) | 100,000 | 98,557 |
5.85%, 11/01/27 (a) | 150,000 | 153,673 |
5.30%, 03/01/28 (a) | 150,000 | 150,279 |
Southern Power Co. | ||
4.15%, 12/01/25 (a) | 75,000 | 73,526 |
0.90%, 01/15/26 (a) | 75,000 | 67,307 |
Southwestern Electric Power Co. | ||
1.65%, 03/15/26 (a) | 75,000 | 67,934 |
2.75%, 10/01/26 (a) | 125,000 | 115,251 |
System Energy Resources, Inc. | ||
6.00%, 04/15/28 (a) | 100,000 | 98,783 |
Tampa Electric Co. | ||
3.88%, 07/12/24 | 75,000 | 73,711 |
The Cleveland Electric Illuminating Co. | ||
5.50%, 08/15/24 | 50,000 | 49,933 |
The Southern Co. | ||
4.48%, 08/01/24 (d) | 100,000 | 98,312 |
5.15%, 10/06/25 | 100,000 | 99,652 |
3.25%, 07/01/26 (a) | 275,000 | 259,212 |
5.11%, 08/01/27 (d) | 150,000 | 148,855 |
4.85%, 06/15/28 (a) | 100,000 | 98,280 |
4.00%, 01/15/51 (a)(b) | 200,000 | 185,882 |
3.75%, 09/15/51 (a)(b) | 150,000 | 127,956 |
Tucson Electric Power Co. | ||
3.05%, 03/15/25 (a) | 50,000 | 47,866 |
Virginia Electric and Power Co. | ||
3.15%, 01/15/26 (a) | 150,000 | 143,134 |
2.95%, 11/15/26 (a) | 50,000 | 46,369 |
3.50%, 03/15/27 (a) | 150,000 | 142,257 |
3.75%, 05/15/27 (a) | 100,000 | 95,965 |
3.80%, 04/01/28 (a) | 75,000 | 71,134 |
WEC Energy Group, Inc. | ||
4.75%, 01/09/26 (a) | 100,000 | 98,616 |
5.15%, 10/01/27 (a) | 100,000 | 100,023 |
1.38%, 10/15/27 (a) | 100,000 | 85,580 |
4.75%, 01/15/28 (a) | 100,000 | 97,866 |
Wisconsin Electric Power Co. | ||
2.05%, 12/15/24 (a) | 100,000 | 95,136 |
Xcel Energy, Inc. | ||
3.30%, 06/01/25 (a) | 100,000 | 95,894 |
3.35%, 12/01/26 (a) | 75,000 | 70,560 |
1.75%, 03/15/27 (a) | 100,000 | 88,701 |
18,843,938 | ||
SECURITY RATE, MATURITY DATE | FACE AMOUNT ($) | VALUE ($) |
Natural Gas 0.5% | ||
Atmos Energy Corp. | ||
3.00%, 06/15/27 (a) | 100,000 | 93,846 |
CenterPoint Energy Resources Corp. | ||
5.25%, 03/01/28 (a) | 175,000 | 175,287 |
NiSource, Inc. | ||
0.95%, 08/15/25 (a) | 200,000 | 182,678 |
3.49%, 05/15/27 (a) | 150,000 | 141,528 |
5.25%, 03/30/28 (a) | 150,000 | 150,187 |
Sempra Energy | ||
3.30%, 04/01/25 (a) | 100,000 | 96,081 |
3.25%, 06/15/27 (a) | 150,000 | 138,915 |
3.40%, 02/01/28 (a) | 150,000 | 138,436 |
4.13%, 04/01/52 (a)(b) | 150,000 | 121,593 |
Southern California Gas Co. | ||
3.15%, 09/15/24 (a) | 75,000 | 72,773 |
3.20%, 06/15/25 (a) | 50,000 | 47,908 |
2.60%, 06/15/26 (a) | 100,000 | 93,460 |
2.95%, 04/15/27 (a) | 100,000 | 93,423 |
Southern Co. Gas Capital Corp. | ||
3.25%, 06/15/26 (a) | 75,000 | 70,733 |
Southwest Gas Corp. | ||
5.45%, 03/23/28 (a) | 100,000 | 99,933 |
1,716,781 | ||
Utility Other 0.0% | ||
American Water Capital Corp. | ||
3.40%, 03/01/25 (a) | 60,000 | 58,081 |
2.95%, 09/01/27 (a) | 100,000 | 92,541 |
150,622 | ||
20,711,341 | ||
Total Corporates (Cost $380,105,237) | 359,233,230 | |
SECURITY | NUMBER OF SHARES | VALUE ($) |
SHORT-TERM INVESTMENTS 0.2% OF NET ASSETS | ||
Money Market Funds 0.2% | ||
State Street Institutional U.S. Government Money Market Fund, Premier Class 5.03% (g) | 723,674 | 723,674 |
Total Short-Term Investments (Cost $723,674) | 723,674 | |
Total Investments in Securities (Cost $380,828,911) | 359,956,904 | |
NUMBER OF CONTRACTS | NOTIONAL AMOUNT ($) | CURRENT VALUE/ UNREALIZED APPRECIATION ($) | |
FUTURES CONTRACTS | |||
Short | |||
5 Year US Treasury Notes (CBOT), expires 09/29/23 | (4 ) | (428,375 ) | 4,088 |
(a) | The effective maturity may be shorter than the final maturity shown because of the possibility of interim principal payments and prepayments or as the result of embedded demand features (puts or calls). |
(b) | Security is in a fixed rate coupon period. Based on index eligibility requirements and the fund’s investment objective this security will be removed from the index prior to converting to a floating rate security. |
(c) | Securities exempt from registration under Rule 144A of the Securities Act of 1933, as amended. These securities may be resold in transactions exempt from registrations, normally to qualified institutional buyers. At the period end, the value of these amounted to $2,704,361 or 0.7% of net assets. |
(d) | Step up security that pays an initial coupon rate for a set period and increased coupon rates at one or more preset intervals. Rate shown is as of period end. |
(e) | Issuer is affiliated with the fund’s investment adviser. |
(f) | Interest rate is subject to adjustments from time to time if a nationally recognized statistical rating organization downgrades (or subsequently upgrades) the debt rating assigned to the bond. |
(g) | The rate shown is the annualized 7-day yield. |
CBOT — | Chicago Board of Trade |
REIT — | Real Estate Investment Trust |
SECURITY RATE, MATURITY DATE | VALUE AT 12/31/22 | PURCHASES | SALES | REALIZED GAINS (LOSSES) | NET CHANGE IN UNREALIZED APPRECIATION (DEPRECIATION) | ACCRETION OF DISCOUNTS (AMORTIZATION OF PREMIUMS) | VALUE AT 6/30/23 | FACE AMOUNT AT 6/30/23 | INTEREST INCOME EARNED |
CORPORATES 0.3% OF NET ASSETS | |||||||||
Financial Institutions 0.3% | |||||||||
Brokerage/Asset Managers/Exchanges 0.3% | |||||||||
The Charles Schwab Corp. | |||||||||
3.55%, 02/01/24 | $69,077 | $— | ($69,175) | ($2,799) | $3,095 | ($198) | $— | $— | $221 |
0.75%, 03/18/24 | 213,987 | — | (214,355) | (11,136) | 11,635 | (131) | — | — | 413 |
3.75%, 04/01/24 | 29,568 | — | (29,480) | (2,317) | 2,602 | (373) | — | — | 378 |
3.00%, 03/10/25 | 24,063 | — | — | — | (428) | 261 | 23,896 | 25,000 | 375 |
4.20%, 03/24/25 | 74,208 | — | — | — | 327 | (1,268) | 73,267 | 75,000 | 1,575 |
3.63%, 04/01/25 | 48,759 | — | — | — | 109 | (759) | 48,109 | 50,000 | 906 |
3.85%, 05/21/25 | 92,813 | — | — | — | 303 | (1,399) | 91,717 | 95,000 | 1,829 |
3.45%, 02/13/26 | 29,083 | — | — | — | (344) | (328) | 28,411 | 30,000 | 517 |
0.90%, 03/11/26 | 155,168 | — | — | — | (563) | 83 | 154,688 | 175,000 | 787 |
1.15%, 05/13/26 | 133,481 | — | (22,150) | (2,906) | 2,306 | (52) | 110,679 | 125,000 | 815 |
3.20%, 03/02/27 | 47,098 | 23,099 | — | — | (728) | 40 | 69,509 | 75,000 | 911 |
2.45%, 03/03/27 | 183,036 | 23,132 | (22,682) | (1,753) | (2,578) | 691 | 179,846 | 200,000 | 2,593 |
3.30%, 04/01/27 | 47,434 | — | — | — | (1,083) | 42 | 46,393 | 50,000 | 825 |
3.20%, 01/25/28 | — | 45,657 | — | — | 23 | 67 | 45,747 | 50,000 | 129 |
2.00%, 03/20/28 | — | 139,070 | — | — | (1,057) | 485 | 138,498 | 160,000 | 414 |
5.64%, 05/19/29 | — | 149,814 | — | — | 1,265 | 2 | 151,081 | 150,000 | 541 |
Total | $1,147,775 | $380,772 | ($357,842 ) | ($20,911 ) | $14,884 | ($2,837 ) | $1,161,841 | $13,229 | |
DESCRIPTION | QUOTED PRICES IN ACTIVE MARKETS FOR IDENTICAL ASSETS (LEVEL 1) | OTHER SIGNIFICANT OBSERVABLE INPUTS (LEVEL 2) | SIGNIFICANT UNOBSERVABLE INPUTS (LEVEL 3) | TOTAL |
Assets | ||||
Corporates1 | $— | $359,233,230 | $— | $359,233,230 |
Short-Term Investments1 | 723,674 | — | — | 723,674 |
Futures Contracts2 | 4,088 | — | — | 4,088 |
Total | $727,762 | $359,233,230 | $— | $359,960,992 |
1 | As categorized in the Portfolio Holdings. |
2 | Futures contracts are reported at cumulative unrealized appreciation or depreciation. |
Assets | ||
Investments in securities, at value - affiliated (cost $1,239,127) | $1,161,841 | |
Investments in securities, at value - unaffiliated (cost $379,589,784) | 358,795,063 | |
Deposit with broker for futures contracts | 54,406 | |
Receivables: | ||
Investments sold | 6,768,576 | |
Interest | 3,417,800 | |
Foreign tax reclaims | 11,600 | |
Variation margin on future contracts | 4,094 | |
Dividends | 2,616 | |
Income from securities on loan | + | 227 |
Total assets | 370,216,223 | |
Liabilities | ||
Payables: | ||
Investments bought | 6,536,795 | |
Management fees | + | 9,015 |
Total liabilities | 6,545,810 | |
Net assets | $363,670,413 | |
Net Assets by Source | ||
Capital received from investors | $389,016,658 | |
Total distributable loss | + | (25,346,245 ) |
Net assets | $363,670,413 | |
Net Asset Value (NAV) | ||||
Net Assets | ÷ | Shares Outstanding | = | NAV |
$363,670,413 | 7,700,000 | $47.23 | ||
For the period January 1, 2023 through June 30, 2023; unaudited | ||
Investment Income | ||
Interest received from securities - unaffiliated (net of foreign withholding tax of $603) | $5,122,314 | |
Dividends received from securities - unaffiliated | 19,274 | |
Interest received from securities - affiliated | 10,392 | |
Securities on loan, net | + | 505 |
Total investment income | 5,152,485 | |
Expenses | ||
Management fees | 55,502 | |
Total expenses | – | 55,502 |
Net investment income | 5,096,983 | |
REALIZED AND UNREALIZED GAINS (LOSSES) | ||
Net realized losses on sales of securities - affiliated | (6,976 ) | |
Net realized losses on sales of securities - unaffiliated | (2,531,934 ) | |
Net realized losses on sales of in-kind redemptions - affiliated | (13,935 ) | |
Net realized losses on sales of in-kind redemptions - unaffiliated | (634,856 ) | |
Net realized losses on futures contracts | + | (10,660 ) |
Net realized losses | (3,198,361 ) | |
Net change in unrealized appreciation (depreciation) on securities - affiliated | 14,884 | |
Net change in unrealized appreciation (depreciation) on securities - unaffiliated | 4,762,563 | |
Net change in unrealized appreciation (depreciation) on futures contracts | + | 4,011 |
Net change in unrealized appreciation (depreciation) | + | 4,781,458 |
Net realized and unrealized gains | 1,583,097 | |
Increase in net assets resulting from operations | $6,680,080 | |
OPERATIONS | |||
1/1/23-6/30/23 | 1/1/22-12/31/22 | ||
Net investment income | $5,096,983 | $6,088,961 | |
Net realized losses | (3,198,361 ) | (11,110,517 ) | |
Net change in unrealized appreciation (depreciation) | + | 4,781,458 | (20,747,758 ) |
Increase (decrease) in net assets resulting from operations | $6,680,080 | ($25,769,314 ) | |
DISTRIBUTIONS TO SHAREHOLDERS | |||
Total distributions | ($4,298,490 ) | ($6,101,610 ) | |
TRANSACTIONS IN FUND SHARES | |||||
1/1/23-6/30/23 | 1/1/22-12/31/22 | ||||
SHARES | VALUE | SHARES | VALUE | ||
Shares sold | 450,000 | $21,343,487 | 2,400,000 | $114,378,641 | |
Shares redeemed | + | (650,000 ) | (30,926,607 ) | (6,550,000 ) | (321,039,478 ) |
Net transactions in fund shares | (200,000 ) | ($9,583,120 ) | (4,150,000 ) | ($206,660,837 ) | |
SHARES OUTSTANDING AND NET ASSETS | |||||
1/1/23-6/30/23 | 1/1/22-12/31/22 | ||||
SHARES | NET ASSETS | SHARES | NET ASSETS | ||
Beginning of period | 7,900,000 | $370,871,943 | 12,050,000 | $609,403,704 | |
Total decrease | + | (200,000 ) | (7,201,530 ) | (4,150,000 ) | (238,531,761 ) |
End of period | 7,700,000 | $363,670,413 | 7,900,000 | $370,871,943 | |
1/1/23– 6/30/23* | 1/1/22– 12/31/22 | 1/1/21– 12/31/21 | 1/1/20– 12/31/20 | 10/10/191– 12/31/19 | ||
Per-Share Data | ||||||
Net asset value at beginning of period | $43.19 | $51.73 | $53.69 | $50.07 | $50.00 | |
Income (loss) from investment operations: | ||||||
Net investment income (loss)2 | 1.06 | 1.35 | 1.02 | 1.26 | 0.29 | |
Net realized and unrealized gains (losses) | 0.36 | (8.55 ) | (1.98 ) | 3.60 | 0.04 | |
Total from investment operations | 1.42 | (7.20 ) | (0.96 ) | 4.86 | 0.33 | |
Less distributions: | ||||||
Distributions from net investment income | (0.64 ) | (1.34 ) | (1.00 ) | (1.24 ) | (0.26 ) | |
Net asset value at end of period | $43.97 | $43.19 | $51.73 | $53.69 | $50.07 | |
Total return | 3.29 %3 | (14.00 %) | (1.80 %) | 9.83 % | 0.67 %3 | |
Ratios/Supplemental Data | ||||||
Ratios to average net assets: | ||||||
Total expenses | 0.03 %4 | 0.04 %5,6 | 0.05 %7 | 0.05 % | 0.06 %4,8 | |
Net investment income (loss) | 4.88 %4 | 2.97 % | 1.96 % | 2.43 % | 2.61 %4 | |
Portfolio turnover rate9 | 14 %3 | 10 % | 11 % | 36 % | 8 %3 | |
Net assets, end of period (x 1,000,000) | $5,131 | $328 | $375 | $191 | $110 | |
* | Unaudited. |
1 | Commencement of operations. |
2 | Calculated based on the average shares outstanding during the period. |
3 | Not annualized. |
4 | Annualized. |
5 | Effective July 1, 2022, the annual operating expense ratio was reduced to 0.03%. The ratio presented for the period ended December 31, 2022 is a blended ratio. |
6 | Ratio includes less than 0.005% of non-routine proxy expenses. |
7 | Effective December 20, 2021, the annual operating expense ratio was reduced to 0.04%. The ratio presented for period ended December 31, 2021 is a blended ratio. |
8 | Effective December 13, 2019, the annual operating expense ratio was reduced to 0.05%. The ratio presented for the period ended December 31, 2019 is a blended ratio. |
9 | Portfolio turnover rate excludes securities received or delivered from processing of in-kind creations or redemptions. |
SECURITY RATE, MATURITY DATE | FACE AMOUNT ($) | VALUE ($) |
CORPORATES 98.5% OF NET ASSETS | ||
Financial Institutions 35.3% | ||
Banking 22.8% | ||
Ally Financial, Inc. | ||
2.20%, 11/02/28 (a) | 2,350,000 | 1,882,162 |
8.00%, 11/01/31 | 7,397,000 | 7,684,438 |
American Express Co. | ||
4.05%, 05/03/29 (a) | 3,025,000 | 2,881,555 |
4.99%, 05/26/33 (a)(b) | 2,275,000 | 2,180,542 |
4.42%, 08/03/33 (a)(b) | 3,900,000 | 3,680,625 |
5.04%, 05/01/34 (a) | 3,500,000 | 3,430,210 |
Banco Santander S.A. | ||
3.31%, 06/27/29 | 3,000,000 | 2,675,250 |
3.49%, 05/28/30 | 3,000,000 | 2,614,230 |
2.75%, 12/03/30 | 4,400,000 | 3,441,812 |
2.96%, 03/25/31 | 2,200,000 | 1,822,326 |
3.23%, 11/22/32 (a)(b) | 3,000,000 | 2,380,500 |
Bank of America Corp. | ||
4.27%, 07/23/29 (a)(b) | 8,900,000 | 8,456,335 |
3.97%, 02/07/30 (a)(b) | 8,800,000 | 8,165,608 |
3.19%, 07/23/30 (a)(b) | 7,900,000 | 6,985,575 |
2.88%, 10/22/30 (a)(b) | 5,800,000 | 5,004,878 |
2.50%, 02/13/31 (a)(b) | 10,200,000 | 8,543,112 |
2.59%, 04/29/31 (a)(b) | 9,000,000 | 7,574,940 |
1.90%, 07/23/31 (a)(b) | 8,050,000 | 6,413,515 |
1.92%, 10/24/31 (a)(b) | 7,325,000 | 5,812,534 |
2.65%, 03/11/32 (a)(b) | 5,550,000 | 4,598,785 |
2.69%, 04/22/32 (a)(b) | 13,275,000 | 11,007,895 |
2.30%, 07/21/32 (a)(b) | 11,000,000 | 8,798,680 |
2.57%, 10/20/32 (a)(b) | 9,925,000 | 8,085,997 |
2.97%, 02/04/33 (a)(b) | 11,075,000 | 9,238,765 |
4.57%, 04/27/33 (a)(b) | 11,900,000 | 11,208,729 |
5.02%, 07/22/33 (a)(b) | 14,850,000 | 14,535,477 |
5.29%, 04/25/34 (a)(b) | 14,900,000 | 14,773,052 |
2.48%, 09/21/36 (a)(b) | 6,100,000 | 4,661,376 |
3.85%, 03/08/37 (a)(b) | 7,350,000 | 6,294,907 |
Bank of Montreal | ||
3.09%, 01/10/37 (a)(b) | 3,700,000 | 2,905,388 |
Bank of New York Mellon Corp. | ||
1.65%, 07/14/28 (a) | 1,700,000 | 1,458,141 |
3.00%, 10/30/28 (a) | 1,450,000 | 1,303,318 |
1.90%, 01/25/29 (a) | 1,125,000 | 940,658 |
3.85%, 04/26/29 (a) | 550,000 | 525,844 |
3.30%, 08/23/29 (a) | 2,525,000 | 2,270,581 |
4.60%, 07/26/30 (a)(b) | 1,700,000 | 1,643,747 |
1.65%, 01/28/31 (a) | 1,400,000 | 1,126,846 |
1.80%, 07/28/31 (a) | 1,400,000 | 1,105,216 |
2.50%, 01/26/32 (a) | 1,425,000 | 1,173,131 |
SECURITY RATE, MATURITY DATE | FACE AMOUNT ($) | VALUE ($) |
4.29%, 06/13/33 (a)(b) | 2,150,000 | 2,039,684 |
5.83%, 10/25/33 (a)(b) | 4,700,000 | 4,904,497 |
4.71%, 02/01/34 (a)(b) | 2,300,000 | 2,215,475 |
4.97%, 04/26/34 (a)(b) | 2,800,000 | 2,739,828 |
Bank of Nova Scotia | ||
4.85%, 02/01/30 | 3,700,000 | 3,574,422 |
2.15%, 08/01/31 | 1,975,000 | 1,577,413 |
2.45%, 02/02/32 | 2,575,000 | 2,103,234 |
4.59%, 05/04/37 (a)(b) | 3,700,000 | 3,180,483 |
BankUnited, Inc. | ||
5.13%, 06/11/30 (a) | 875,000 | 675,150 |
Barclays PLC | ||
5.09%, 06/20/30 (a)(b) | 4,450,000 | 4,053,015 |
2.65%, 06/24/31 (a)(b) | 2,900,000 | 2,332,586 |
2.67%, 03/10/32 (a)(b) | 3,175,000 | 2,503,742 |
2.89%, 11/24/32 (a)(b) | 3,700,000 | 2,915,970 |
5.75%, 08/09/33 (a)(b) | 3,000,000 | 2,904,660 |
7.44%, 11/02/33 (a)(b) | 6,300,000 | 6,821,892 |
6.22%, 05/09/34 (a)(b) | 5,550,000 | 5,535,126 |
7.12%, 06/27/34 (a)(b) | 1,950,000 | 1,950,371 |
3.56%, 09/23/35 (a)(b) | 3,050,000 | 2,418,010 |
Canadian Imperial Bank of Commerce | ||
3.60%, 04/07/32 (a)(c) | 2,975,000 | 2,675,447 |
Capital One Financial Corp. | ||
3.27%, 03/01/30 (a)(b) | 4,250,000 | 3,625,675 |
5.25%, 07/26/30 (a)(b) | 2,700,000 | 2,558,601 |
2.36%, 07/29/32 (a)(b) | 3,025,000 | 2,140,732 |
2.62%, 11/02/32 (a)(b) | 1,500,000 | 1,155,570 |
5.27%, 05/10/33 (a)(b) | 3,350,000 | 3,138,313 |
5.82%, 02/01/34 (a)(b) | 3,950,000 | 3,780,308 |
6.38%, 06/08/34 (a)(b) | 4,200,000 | 4,173,036 |
Citigroup, Inc. | ||
4.13%, 07/25/28 | 6,200,000 | 5,851,870 |
3.98%, 03/20/30 (a)(b) | 7,425,000 | 6,884,980 |
2.98%, 11/05/30 (a)(b) | 7,050,000 | 6,125,040 |
2.67%, 01/29/31 (a)(b) | 6,700,000 | 5,673,627 |
4.41%, 03/31/31 (a)(b) | 12,000,000 | 11,307,960 |
2.57%, 06/03/31 (a)(b) | 10,450,000 | 8,732,020 |
2.56%, 05/01/32 (a)(b) | 8,800,000 | 7,193,560 |
6.63%, 06/15/32 | 2,950,000 | 3,126,204 |
2.52%, 11/03/32 (a)(b) | 5,050,000 | 4,080,046 |
3.06%, 01/25/33 (a)(b) | 8,400,000 | 7,010,892 |
5.88%, 02/22/33 | 1,475,000 | 1,499,869 |
3.79%, 03/17/33 (a)(b) | 9,150,000 | 8,100,037 |
4.91%, 05/24/33 (a)(b) | 7,400,000 | 7,170,378 |
6.27%, 11/17/33 (a)(b) | 7,900,000 | 8,391,301 |
6.17%, 05/25/34 (a)(b) | 9,500,000 | 9,567,355 |
Citizens Financial Group, Inc. | ||
2.50%, 02/06/30 (a) | 975,000 | 768,651 |
3.25%, 04/30/30 (a) | 2,300,000 | 1,898,696 |
SECURITY RATE, MATURITY DATE | FACE AMOUNT ($) | VALUE ($) |
2.64%, 09/30/32 (a) | 1,950,000 | 1,382,784 |
5.64%, 05/21/37 (a)(b) | 1,075,000 | 929,811 |
Comerica Bank | ||
5.33%, 08/25/33 (a)(b) | 1,500,000 | 1,217,145 |
Comerica, Inc. | ||
4.00%, 02/01/29 (a) | 1,850,000 | 1,557,534 |
Credit Suisse USA, Inc. | ||
7.13%, 07/15/32 | 2,225,000 | 2,468,371 |
Deutsche Bank AG | ||
5.88%, 07/08/31 (a)(b) | 1,500,000 | 1,320,795 |
3.55%, 09/18/31 (a)(b) | 4,500,000 | 3,743,325 |
3.73%, 01/14/32 (a)(b) | 3,600,000 | 2,719,476 |
3.04%, 05/28/32 (a)(b) | 2,750,000 | 2,177,065 |
3.74%, 01/07/33 (a)(b) | 3,600,000 | 2,639,988 |
7.08%, 02/10/34 (a)(b) | 4,400,000 | 4,055,568 |
Discover Bank | ||
4.65%, 09/13/28 (a) | 2,600,000 | 2,417,818 |
2.70%, 02/06/30 (a) | 1,550,000 | 1,249,409 |
Discover Financial Services | ||
6.70%, 11/29/32 (a) | 2,250,000 | 2,325,915 |
Fifth Third Bancorp | ||
4.77%, 07/28/30 (a)(b) | 3,050,000 | 2,859,223 |
4.34%, 04/25/33 (a)(b) | 1,775,000 | 1,572,277 |
First Horizon Bank | ||
5.75%, 05/01/30 (a) | 1,325,000 | 1,152,790 |
Goldman Sachs Group, Inc. | ||
2.60%, 02/07/30 (a) | 6,075,000 | 5,203,055 |
3.80%, 03/15/30 (a) | 7,400,000 | 6,846,924 |
1.99%, 01/27/32 (a)(b) | 7,400,000 | 5,834,012 |
2.62%, 04/22/32 (a)(b) | 10,925,000 | 8,962,433 |
2.38%, 07/21/32 (a)(b) | 12,000,000 | 9,619,800 |
2.65%, 10/21/32 (a)(b) | 8,600,000 | 7,018,890 |
6.13%, 02/15/33 | 3,150,000 | 3,386,376 |
3.10%, 02/24/33 (a)(b) | 11,800,000 | 9,974,304 |
HSBC Holdings PLC | ||
2.21%, 08/17/29 (a)(b) | 5,600,000 | 4,693,248 |
4.95%, 03/31/30 | 7,500,000 | 7,392,600 |
3.97%, 05/22/30 (a)(b) | 8,950,000 | 8,048,645 |
2.85%, 06/04/31 (a)(b) | 4,500,000 | 3,752,280 |
2.36%, 08/18/31 (a)(b) | 4,400,000 | 3,526,116 |
2.80%, 05/24/32 (a)(b) | 8,800,000 | 7,135,040 |
2.87%, 11/22/32 (a)(b) | 5,450,000 | 4,406,543 |
4.76%, 03/29/33 (a)(b) | 5,800,000 | 5,240,764 |
5.40%, 08/11/33 (a)(b) | 7,300,000 | 7,137,137 |
8.11%, 11/03/33 (a)(b) | 6,000,000 | 6,656,520 |
6.25%, 03/09/34 (a)(b) | 6,700,000 | 6,869,979 |
6.55%, 06/20/34 (a)(b) | 6,100,000 | 6,080,053 |
Huntington Bancshares, Inc. | ||
2.55%, 02/04/30 (a) | 2,225,000 | 1,785,585 |
5.02%, 05/17/33 (a)(b) | 1,200,000 | 1,102,368 |
2.49%, 08/15/36 (a)(b) | 1,665,000 | 1,195,653 |
Huntington National Bank | ||
5.65%, 01/10/30 (a) | 2,600,000 | 2,504,814 |
ING Groep N.V. | ||
4.55%, 10/02/28 | 3,700,000 | 3,563,729 |
4.05%, 04/09/29 | 2,900,000 | 2,708,890 |
2.73%, 04/01/32 (a)(b) | 2,200,000 | 1,816,914 |
4.25%, 03/28/33 (a)(b) | 3,100,000 | 2,837,275 |
JPMorgan Chase & Co. | ||
4.20%, 07/23/29 (a)(b) | 7,450,000 | 7,093,741 |
4.45%, 12/05/29 (a)(b) | 7,275,000 | 6,987,710 |
3.70%, 05/06/30 (a)(b) | 7,350,000 | 6,755,458 |
4.57%, 06/14/30 (a)(b) | 5,925,000 | 5,699,198 |
8.75%, 09/01/30 | 1,400,000 | 1,691,830 |
2.74%, 10/15/30 (a)(b) | 11,100,000 | 9,581,076 |
SECURITY RATE, MATURITY DATE | FACE AMOUNT ($) | VALUE ($) |
4.49%, 03/24/31 (a)(b) | 9,575,000 | 9,202,724 |
2.52%, 04/22/31 (a)(b) | 8,175,000 | 6,932,972 |
2.96%, 05/13/31 (a)(b) | 8,500,000 | 7,286,710 |
1.76%, 11/19/31 (a)(b) | 4,150,000 | 3,289,082 |
1.95%, 02/04/32 (a)(b) | 8,975,000 | 7,157,832 |
2.58%, 04/22/32 (a)(b) | 9,800,000 | 8,143,016 |
2.55%, 11/08/32 (a)(b) | 8,900,000 | 7,302,895 |
2.96%, 01/25/33 (a)(b) | 9,900,000 | 8,364,807 |
4.59%, 04/26/33 (a)(b) | 8,300,000 | 7,917,038 |
4.91%, 07/25/33 (a)(b) | 13,400,000 | 13,109,220 |
5.72%, 09/14/33 (a)(b) | 10,600,000 | 10,759,106 |
5.35%, 06/01/34 (a)(b) | 7,000,000 | 7,072,310 |
KeyBank NA | ||
3.90%, 04/13/29 | 1,050,000 | 834,309 |
4.90%, 08/08/32 | 2,225,000 | 1,759,842 |
5.00%, 01/26/33 (a) | 3,050,000 | 2,636,359 |
KeyCorp | ||
2.55%, 10/01/29 | 2,150,000 | 1,628,819 |
4.79%, 06/01/33 (a)(b) | 2,225,000 | 1,878,879 |
Lloyds Banking Group PLC | ||
4.55%, 08/16/28 | 3,400,000 | 3,214,768 |
4.98%, 08/11/33 (a)(b) | 3,950,000 | 3,701,189 |
7.95%, 11/15/33 (a)(b) | 2,900,000 | 3,145,485 |
M&T Bank Corp. | ||
5.05%, 01/27/34 (a)(b) | 2,950,000 | 2,697,598 |
Mitsubishi UFJ Financial Group, Inc. | ||
4.05%, 09/11/28 | 2,900,000 | 2,756,102 |
3.74%, 03/07/29 | 4,375,000 | 4,055,669 |
3.20%, 07/18/29 | 5,475,000 | 4,845,265 |
2.56%, 02/25/30 | 3,450,000 | 2,929,878 |
2.05%, 07/17/30 | 3,600,000 | 2,922,156 |
5.48%, 02/22/31 (a)(b) | 1,500,000 | 1,493,295 |
2.31%, 07/20/32 (a)(b) | 5,400,000 | 4,306,014 |
2.49%, 10/13/32 (a)(b) | 2,150,000 | 1,731,395 |
2.85%, 01/19/33 (a)(b) | 2,975,000 | 2,457,677 |
4.32%, 04/19/33 (a)(b) | 2,050,000 | 1,899,489 |
5.13%, 07/20/33 (a)(b) | 4,400,000 | 4,317,984 |
5.47%, 09/13/33 (a)(b) | 2,100,000 | 2,114,217 |
5.44%, 02/22/34 (a)(b) | 3,700,000 | 3,691,897 |
5.41%, 04/19/34 (a)(b) | 3,000,000 | 2,981,100 |
Mizuho Financial Group, Inc. | ||
4.25%, 09/11/29 (a)(b) | 2,800,000 | 2,624,188 |
3.26%, 05/22/30 (a)(b) | 1,500,000 | 1,325,670 |
3.15%, 07/16/30 (a)(b) | 2,200,000 | 1,901,526 |
2.87%, 09/13/30 (a)(b) | 1,475,000 | 1,251,449 |
2.59%, 05/25/31 (a)(b) | 1,500,000 | 1,243,050 |
5.74%, 05/27/31 (a)(b) | 2,250,000 | 2,247,593 |
2.20%, 07/10/31 (a)(b) | 3,200,000 | 2,560,032 |
1.98%, 09/08/31 (a)(b) | 2,350,000 | 1,854,503 |
2.56%, 09/13/31 | 2,950,000 | 2,324,335 |
2.17%, 05/22/32 (a)(b) | 2,000,000 | 1,563,020 |
2.26%, 07/09/32 (a)(b) | 775,000 | 604,802 |
5.67%, 09/13/33 (a)(b) | 2,400,000 | 2,420,784 |
5.75%, 05/27/34 (a)(b) | 3,500,000 | 3,523,205 |
Morgan Stanley | ||
4.43%, 01/23/30 (a)(b) | 8,980,000 | 8,555,605 |
2.70%, 01/22/31 (a)(b) | 10,000,000 | 8,529,700 |
3.62%, 04/01/31 (a)(b) | 8,800,000 | 7,953,176 |
1.79%, 02/13/32 (a)(b) | 8,250,000 | 6,413,467 |
7.25%, 04/01/32 | 3,350,000 | 3,811,931 |
1.93%, 04/28/32 (a)(b) | 7,250,000 | 5,661,815 |
2.24%, 07/21/32 (a)(b) | 10,500,000 | 8,357,055 |
2.51%, 10/20/32 (a)(b) | 7,250,000 | 5,857,710 |
2.94%, 01/21/33 (a)(b) | 7,050,000 | 5,871,804 |
4.89%, 07/20/33 (a)(b) | 6,175,000 | 5,951,465 |
6.34%, 10/18/33 (a)(b) | 8,625,000 | 9,193,905 |
SECURITY RATE, MATURITY DATE | FACE AMOUNT ($) | VALUE ($) |
5.25%, 04/21/34 (a)(b) | 9,850,000 | 9,726,579 |
2.48%, 09/16/36 (a)(b) | 8,950,000 | 6,776,671 |
5.30%, 04/20/37 (a)(b) | 5,950,000 | 5,629,592 |
5.95%, 01/19/38 (a)(b) | 5,900,000 | 5,823,772 |
Natwest Group PLC | ||
5.08%, 01/27/30 (a)(b) | 5,700,000 | 5,464,077 |
4.45%, 05/08/30 (a)(b) | 4,150,000 | 3,821,403 |
6.02%, 03/02/34 (a)(b) | 3,000,000 | 3,025,740 |
3.03%, 11/28/35 (a)(b) | 2,475,000 | 1,897,830 |
NatWest Group PLC | ||
5.81%, 09/13/29 (a)(b) | 2,750,000 | 2,712,628 |
Northern Trust Corp. | ||
3.65%, 08/03/28 (a) | 1,475,000 | 1,399,583 |
3.15%, 05/03/29 (a) | 1,500,000 | 1,366,980 |
1.95%, 05/01/30 (a) | 2,950,000 | 2,432,482 |
6.13%, 11/02/32 (a) | 3,000,000 | 3,113,040 |
PNC Bank NA | ||
4.05%, 07/26/28 | 3,750,000 | 3,462,300 |
2.70%, 10/22/29 | 2,150,000 | 1,807,140 |
PNC Financial Services Group, Inc. | ||
3.45%, 04/23/29 (a) | 4,350,000 | 3,934,140 |
2.55%, 01/22/30 (a) | 5,915,000 | 5,002,020 |
2.31%, 04/23/32 (a)(b) | 3,000,000 | 2,439,630 |
4.63%, 06/06/33 (a)(b) | 2,700,000 | 2,485,188 |
6.04%, 10/28/33 (a)(b) | 4,575,000 | 4,703,374 |
5.07%, 01/24/34 (a)(b) | 4,400,000 | 4,222,636 |
Regions Financial Corp. | ||
1.80%, 08/12/28 (a) | 1,925,000 | 1,573,822 |
Royal Bank of Canada | ||
2.30%, 11/03/31 | 4,525,000 | 3,675,114 |
3.88%, 05/04/32 | 3,000,000 | 2,752,950 |
5.00%, 02/01/33 | 5,000,000 | 4,903,550 |
5.00%, 05/02/33 | 2,700,000 | 2,637,846 |
Santander UK Group Holdings PLC | ||
2.90%, 03/15/32 (a)(b) | 1,950,000 | 1,582,250 |
State Street Corp. | ||
4.14%, 12/03/29 (a)(b) | 1,725,000 | 1,641,407 |
2.40%, 01/24/30 | 2,200,000 | 1,903,022 |
2.20%, 03/03/31 | 2,550,000 | 2,078,429 |
3.15%, 03/30/31 (a)(b) | 1,450,000 | 1,279,712 |
2.62%, 02/07/33 (a)(b) | 1,950,000 | 1,637,942 |
4.42%, 05/13/33 (a)(b) | 1,450,000 | 1,387,360 |
4.16%, 08/04/33 (a)(b) | 2,200,000 | 2,048,772 |
4.82%, 01/26/34 (a)(b) | 2,150,000 | 2,092,939 |
5.16%, 05/18/34 (a)(b) | 2,850,000 | 2,836,007 |
3.03%, 11/01/34 (a)(b) | 1,475,000 | 1,257,364 |
Sumitomo Mitsui Financial Group, Inc. | ||
3.94%, 07/19/28 | 2,050,000 | 1,920,399 |
1.90%, 09/17/28 | 6,300,000 | 5,301,828 |
4.31%, 10/16/28 | 1,475,000 | 1,398,949 |
2.47%, 01/14/29 | 1,500,000 | 1,285,500 |
3.04%, 07/16/29 | 7,400,000 | 6,473,446 |
3.20%, 09/17/29 | 1,600,000 | 1,403,056 |
2.72%, 09/27/29 | 1,450,000 | 1,239,765 |
5.71%, 01/13/30 | 3,950,000 | 4,005,932 |
2.75%, 01/15/30 | 3,900,000 | 3,365,544 |
2.13%, 07/08/30 | 4,400,000 | 3,585,252 |
2.14%, 09/23/30 | 2,500,000 | 1,995,375 |
1.71%, 01/12/31 | 1,400,000 | 1,091,174 |
2.22%, 09/17/31 | 2,900,000 | 2,317,999 |
5.77%, 01/13/33 | 5,400,000 | 5,562,378 |
Synchrony Financial | ||
5.15%, 03/19/29 (a) | 1,935,000 | 1,761,314 |
2.88%, 10/28/31 (a) | 2,225,000 | 1,615,951 |
SECURITY RATE, MATURITY DATE | FACE AMOUNT ($) | VALUE ($) |
Toronto-Dominion Bank | ||
2.00%, 09/10/31 | 2,850,000 | 2,264,838 |
2.45%, 01/12/32 | 1,625,000 | 1,332,955 |
3.20%, 03/10/32 | 4,325,000 | 3,742,552 |
4.46%, 06/08/32 | 6,000,000 | 5,702,760 |
Truist Bank | ||
2.25%, 03/11/30 (a) | 3,750,000 | 2,990,513 |
Truist Financial Corp. | ||
3.88%, 03/19/29 (a) | 2,175,000 | 1,951,367 |
1.95%, 06/05/30 (a) | 2,050,000 | 1,632,579 |
4.92%, 07/28/33 (a)(b) | 2,950,000 | 2,697,687 |
6.12%, 10/28/33 (a)(b) | 2,700,000 | 2,756,106 |
5.12%, 01/26/34 (a)(b) | 4,600,000 | 4,363,606 |
5.87%, 06/08/34 (a)(b) | 4,250,000 | 4,253,680 |
US Bancorp | ||
3.00%, 07/30/29 (a) | 3,100,000 | 2,632,458 |
1.38%, 07/22/30 (a) | 4,200,000 | 3,219,846 |
2.68%, 01/27/33 (a)(b) | 2,750,000 | 2,210,285 |
4.97%, 07/22/33 (a)(b) | 3,925,000 | 3,567,432 |
5.85%, 10/21/33 (a)(b) | 4,450,000 | 4,476,655 |
4.84%, 02/01/34 (a)(b) | 5,850,000 | 5,484,667 |
5.84%, 06/12/34 (a)(b) | 4,500,000 | 4,534,626 |
2.49%, 11/03/36 (a)(b) | 3,750,000 | 2,749,800 |
Webster Financial Corp. | ||
4.10%, 03/25/29 (a) | 900,000 | 779,967 |
Wells Fargo & Co. | ||
4.15%, 01/24/29 (a) | 6,952,000 | 6,591,122 |
7.95%, 11/15/29 | 925,000 | 1,023,235 |
2.88%, 10/30/30 (a)(b) | 10,650,000 | 9,216,403 |
2.57%, 02/11/31 (a)(b) | 8,300,000 | 7,040,226 |
4.48%, 04/04/31 (a)(b) | 8,000,000 | 7,618,640 |
3.35%, 03/02/33 (a)(b) | 12,225,000 | 10,482,326 |
4.90%, 07/25/33 (a)(b) | 12,500,000 | 11,994,625 |
5.39%, 04/24/34 (a) | 11,150,000 | 11,090,236 |
Westpac Banking Corp. | ||
1.95%, 11/20/28 | 3,550,000 | 3,046,823 |
2.65%, 01/16/30 | 2,170,000 | 1,918,258 |
2.15%, 06/03/31 | 3,075,000 | 2,585,368 |
5.41%, 08/10/33 (a)(b) | 3,000,000 | 2,840,670 |
4.11%, 07/24/34 (a)(b) | 3,650,000 | 3,190,282 |
2.67%, 11/15/35 (a)(b) | 4,525,000 | 3,474,385 |
3.02%, 11/18/36 (a)(b) | 3,750,000 | 2,875,425 |
Wintrust Financial Corp. | ||
4.85%, 06/06/29 | 875,000 | 785,943 |
Zions Bancorp NA | ||
3.25%, 10/29/29 (a) | 1,400,000 | 1,032,206 |
1,172,409,253 | ||
Brokerage/Asset Managers/Exchanges 2.0% | ||
Affiliated Managers Group, Inc. | ||
3.30%, 06/15/30 (a) | 1,060,000 | 897,640 |
Ameriprise Financial, Inc. | ||
4.50%, 05/13/32 (a) | 1,535,000 | 1,472,433 |
5.15%, 05/15/33 (a) | 2,250,000 | 2,241,518 |
BlackRock, Inc. | ||
3.25%, 04/30/29 (a) | 2,625,000 | 2,442,405 |
2.40%, 04/30/30 (a) | 2,970,000 | 2,576,831 |
1.90%, 01/28/31 (a) | 3,730,000 | 3,062,255 |
2.10%, 02/25/32 (a) | 3,380,000 | 2,730,296 |
4.75%, 05/25/33 (a) | 3,500,000 | 3,445,085 |
Brookfield Capital Finance LLC | ||
6.09%, 06/14/33 (a) | 1,250,000 | 1,270,000 |
Brookfield Finance I UK PLC | ||
2.34%, 01/30/32 (a) | 1,740,000 | 1,357,705 |
SECURITY RATE, MATURITY DATE | FACE AMOUNT ($) | VALUE ($) |
Brookfield Finance, Inc. | ||
4.85%, 03/29/29 (a) | 3,175,000 | 3,053,683 |
4.35%, 04/15/30 (a) | 2,295,000 | 2,128,406 |
2.72%, 04/15/31 (a) | 1,450,000 | 1,188,971 |
Cboe Global Markets, Inc. | ||
1.63%, 12/15/30 (a) | 1,550,000 | 1,226,267 |
3.00%, 03/16/32 (a) | 915,000 | 786,122 |
CI Financial Corp. | ||
3.20%, 12/17/30 (a) | 2,960,000 | 2,223,552 |
CME Group, Inc. | ||
2.65%, 03/15/32 (a) | 2,240,000 | 1,908,861 |
Franklin Resources, Inc. | ||
1.60%, 10/30/30 (a) | 2,460,000 | 1,939,415 |
Intercontinental Exchange, Inc. | ||
3.75%, 09/21/28 (a) | 1,756,000 | 1,671,677 |
4.35%, 06/15/29 (a) | 3,660,000 | 3,587,020 |
2.10%, 06/15/30 (a) | 3,790,000 | 3,172,192 |
1.85%, 09/15/32 (a) | 4,565,000 | 3,519,798 |
4.60%, 03/15/33 (a) | 4,540,000 | 4,402,847 |
Jefferies Financial Group, Inc. | ||
4.15%, 01/23/30 | 3,010,000 | 2,716,314 |
2.63%, 10/15/31 (a) | 3,045,000 | 2,371,750 |
2.75%, 10/15/32 (a) | 1,620,000 | 1,253,378 |
Lazard Group LLC | ||
4.50%, 09/19/28 (a) | 1,610,000 | 1,527,713 |
4.38%, 03/11/29 (a) | 1,535,000 | 1,430,144 |
Nasdaq, Inc. | ||
1.65%, 01/15/31 (a) | 1,875,000 | 1,456,688 |
Nomura Holdings, Inc. | ||
2.17%, 07/14/28 | 3,100,000 | 2,617,113 |
2.71%, 01/22/29 | 1,400,000 | 1,184,834 |
5.61%, 07/06/29 | 1,750,000 | 1,727,600 |
3.10%, 01/16/30 | 4,360,000 | 3,727,233 |
2.68%, 07/16/30 | 3,200,000 | 2,619,936 |
2.61%, 07/14/31 | 2,950,000 | 2,344,807 |
3.00%, 01/22/32 | 2,320,000 | 1,881,613 |
6.18%, 01/18/33 | 2,250,000 | 2,321,797 |
Raymond James Financial, Inc. | ||
4.65%, 04/01/30 (a) | 1,510,000 | 1,474,153 |
Stifel Financial Corp. | ||
4.00%, 05/15/30 (a) | 1,225,000 | 1,054,774 |
The Charles Schwab Corp. | ||
4.00%, 02/01/29 (a)(d) | 1,725,000 | 1,622,552 |
3.25%, 05/22/29 (a)(d) | 1,750,000 | 1,546,913 |
2.75%, 10/01/29 (a)(d) | 1,275,000 | 1,087,244 |
4.63%, 03/22/30 (a)(d) | 1,450,000 | 1,424,335 |
1.65%, 03/11/31 (a)(d) | 2,175,000 | 1,674,293 |
2.30%, 05/13/31 (a)(d) | 2,175,000 | 1,734,932 |
1.95%, 12/01/31 (a)(d) | 2,485,000 | 1,895,136 |
2.90%, 03/03/32 (a)(d) | 2,945,000 | 2,440,374 |
5.85%, 05/19/34 (a)(b) | 3,500,000 | 3,555,405 |
100,996,010 | ||
Finance Companies 0.8% | ||
AerCap Ireland Capital DAC/AerCap Global Aviation Trust | ||
3.00%, 10/29/28 (a) | 10,910,000 | 9,472,935 |
3.30%, 01/30/32 (a) | 12,225,000 | 9,999,683 |
Air Lease Corp. | ||
2.10%, 09/01/28 (a) | 1,000,000 | 832,830 |
4.63%, 10/01/28 (a) | 1,500,000 | 1,411,245 |
3.25%, 10/01/29 (a) | 1,710,000 | 1,486,144 |
3.00%, 02/01/30 (a) | 1,950,000 | 1,634,861 |
3.13%, 12/01/30 (a) | 2,275,000 | 1,898,692 |
2.88%, 01/15/32 (a) | 2,305,000 | 1,855,110 |
SECURITY RATE, MATURITY DATE | FACE AMOUNT ($) | VALUE ($) |
Ares Capital Corp. | ||
3.20%, 11/15/31 (a) | 2,190,000 | 1,679,971 |
Blackstone Private Credit Fund | ||
4.00%, 01/15/29 (a) | 1,940,000 | 1,654,510 |
Blackstone Secured Lending Fund | ||
2.85%, 09/30/28 (a) | 1,865,000 | 1,531,855 |
FS KKR Capital Corp. | ||
3.13%, 10/12/28 (a) | 2,290,000 | 1,866,831 |
GATX Corp. | ||
4.55%, 11/07/28 (a) | 1,000,000 | 956,650 |
4.70%, 04/01/29 (a) | 1,465,000 | 1,405,419 |
4.00%, 06/30/30 (a) | 1,460,000 | 1,336,002 |
1.90%, 06/01/31 (a) | 600,000 | 461,214 |
3.50%, 06/01/32 (a) | 1,670,000 | 1,431,073 |
4.90%, 03/15/33 (a) | 1,170,000 | 1,113,161 |
Prospect Capital Corp. | ||
3.44%, 10/15/28 (a) | 890,000 | 686,261 |
42,714,447 | ||
Financial Other 0.1% | ||
ORIX Corp. | ||
2.25%, 03/09/31 (c) | 1,425,000 | 1,175,198 |
4.00%, 04/13/32 | 1,400,000 | 1,298,808 |
5.20%, 09/13/32 | 1,650,000 | 1,672,654 |
4,146,660 | ||
Insurance 5.0% | ||
ACE Capital Trust II | ||
9.70%, 04/01/30 | 1,000,000 | 1,196,670 |
Aflac, Inc. | ||
3.60%, 04/01/30 (a) | 3,270,000 | 3,013,959 |
Alleghany Corp. | ||
3.63%, 05/15/30 (a) | 1,455,000 | 1,353,252 |
Allstate Corp. | ||
1.45%, 12/15/30 (a) | 1,785,000 | 1,389,373 |
5.25%, 03/30/33 (a) | 2,400,000 | 2,395,656 |
5.35%, 06/01/33 | 750,000 | 752,978 |
American Financial Group, Inc. | ||
5.25%, 04/02/30 (a) | 875,000 | 856,984 |
American International Group, Inc. | ||
3.40%, 06/30/30 (a) | 1,610,000 | 1,428,376 |
5.13%, 03/27/33 (a) | 2,350,000 | 2,297,125 |
Anthem, Inc. | ||
2.88%, 09/15/29 (a) | 2,510,000 | 2,216,230 |
2.25%, 05/15/30 (a) | 3,290,000 | 2,760,968 |
2.55%, 03/15/31 (a) | 2,960,000 | 2,492,912 |
4.10%, 05/15/32 (a) | 1,750,000 | 1,634,255 |
Aon Corp. | ||
4.50%, 12/15/28 (a) | 1,025,000 | 986,778 |
3.75%, 05/02/29 (a) | 2,190,000 | 2,027,984 |
2.80%, 05/15/30 (a) | 2,965,000 | 2,573,561 |
2.05%, 08/23/31 (a) | 1,165,000 | 930,870 |
5.00%, 09/12/32 (a) | 1,535,000 | 1,517,194 |
Aon Corp./Aon Global Holdings PLC | ||
2.60%, 12/02/31 (a) | 1,450,000 | 1,199,600 |
5.35%, 02/28/33 (a) | 2,350,000 | 2,373,711 |
Arthur J Gallagher & Co. | ||
2.40%, 11/09/31 (a) | 1,160,000 | 928,325 |
5.50%, 03/02/33 (a) | 1,120,000 | 1,126,933 |
Assurant, Inc. | ||
3.70%, 02/22/30 (a) | 1,115,000 | 964,196 |
2.65%, 01/15/32 (a) | 1,015,000 | 762,072 |
SECURITY RATE, MATURITY DATE | FACE AMOUNT ($) | VALUE ($) |
Assured Guaranty US Holdings, Inc. | ||
3.15%, 06/15/31 (a) | 1,650,000 | 1,396,016 |
Athene Holding Ltd. | ||
6.15%, 04/03/30 (a) | 1,460,000 | 1,465,942 |
3.50%, 01/15/31 (a) | 1,600,000 | 1,322,160 |
6.65%, 02/01/33 (a) | 1,275,000 | 1,299,582 |
AXA S.A. | ||
8.60%, 12/15/30 | 1,300,000 | 1,568,346 |
AXIS Specialty Finance LLC | ||
3.90%, 07/15/29 (a) | 875,000 | 800,398 |
4.90%, 01/15/40 (a)(b) | 75,000 | 59,843 |
Berkshire Hathaway Finance Corp. | ||
1.85%, 03/12/30 (a) | 1,445,000 | 1,230,707 |
1.45%, 10/15/30 (a) | 2,240,000 | 1,825,197 |
2.88%, 03/15/32 (a) | 3,105,000 | 2,736,778 |
Brighthouse Financial, Inc. | ||
5.63%, 05/15/30 (a) | 1,995,000 | 1,938,222 |
Brown & Brown, Inc. | ||
4.50%, 03/15/29 (a) | 1,035,000 | 978,386 |
2.38%, 03/15/31 (a) | 2,140,000 | 1,730,875 |
4.20%, 03/17/32 (a) | 1,800,000 | 1,621,278 |
Centene Corp. | ||
2.45%, 07/15/28 (a) | 6,780,000 | 5,821,037 |
4.63%, 12/15/29 (a) | 10,220,000 | 9,438,783 |
3.38%, 02/15/30 (a) | 5,920,000 | 5,098,304 |
3.00%, 10/15/30 (a) | 6,500,000 | 5,431,075 |
2.50%, 03/01/31 (a) | 6,480,000 | 5,171,753 |
2.63%, 08/01/31 (a) | 3,760,000 | 3,006,233 |
Chubb INA Holdings, Inc. | ||
1.38%, 09/15/30 (a) | 3,005,000 | 2,387,653 |
CNA Financial Corp. | ||
3.90%, 05/01/29 (a) | 1,460,000 | 1,348,047 |
2.05%, 08/15/30 (a) | 1,445,000 | 1,158,457 |
5.50%, 06/15/33 (a) | 1,200,000 | 1,175,004 |
CNO Financial Group, Inc. | ||
5.25%, 05/30/29 (a) | 1,275,000 | 1,208,636 |
Corebridge Financial, Inc. | ||
3.85%, 04/05/29 (a) | 3,160,000 | 2,863,560 |
3.90%, 04/05/32 (a) | 4,570,000 | 3,988,787 |
Elevance Health, Inc. | ||
5.50%, 10/15/32 (a) | 1,925,000 | 1,980,190 |
4.75%, 02/15/33 (a) | 2,980,000 | 2,901,745 |
Enstar Group Ltd. | ||
4.95%, 06/01/29 (a) | 1,885,000 | 1,762,588 |
3.10%, 09/01/31 (a) | 1,790,000 | 1,406,546 |
Equitable Holdings, Inc. | ||
5.59%, 01/11/33 (a) | 1,550,000 | 1,525,649 |
Fairfax Financial Holdings Ltd. | ||
4.63%, 04/29/30 (a) | 2,005,000 | 1,882,073 |
3.38%, 03/03/31 (a) | 1,755,000 | 1,484,133 |
5.63%, 08/16/32 (a) | 2,490,000 | 2,415,773 |
Fidelity National Financial, Inc. | ||
4.50%, 08/15/28 (a) | 1,410,000 | 1,344,886 |
3.40%, 06/15/30 (a) | 1,900,000 | 1,665,103 |
2.45%, 03/15/31 (a) | 1,845,000 | 1,453,989 |
First American Financial Corp. | ||
4.00%, 05/15/30 (a) | 1,410,000 | 1,243,366 |
2.40%, 08/15/31 (a) | 1,890,000 | 1,442,051 |
Globe Life, Inc. | ||
4.55%, 09/15/28 (a) | 1,700,000 | 1,645,124 |
2.15%, 08/15/30 (a) | 1,160,000 | 915,472 |
4.80%, 06/15/32 (a) | 1,170,000 | 1,126,382 |
Hanover Insurance Group, Inc. | ||
2.50%, 09/01/30 (a) | 870,000 | 690,014 |
SECURITY RATE, MATURITY DATE | FACE AMOUNT ($) | VALUE ($) |
Hartford Financial Services Group, Inc. | ||
2.80%, 08/19/29 (a) | 1,855,000 | 1,604,853 |
Humana, Inc. | ||
3.70%, 03/23/29 (a) | 2,290,000 | 2,099,220 |
3.13%, 08/15/29 (a) | 1,505,000 | 1,330,330 |
4.88%, 04/01/30 (a) | 1,560,000 | 1,529,377 |
2.15%, 02/03/32 (a) | 2,215,000 | 1,748,809 |
5.88%, 03/01/33 (a) | 2,310,000 | 2,400,691 |
Jackson Financial, Inc. | ||
3.13%, 11/23/31 (a) | 1,450,000 | 1,122,213 |
5.67%, 06/08/32 (a)(c) | 1,050,000 | 1,001,259 |
Kemper Corp. | ||
2.40%, 09/30/30 (a) | 1,300,000 | 1,026,376 |
3.80%, 02/23/32 (a) | 1,365,000 | 1,134,561 |
Lincoln National Corp. | ||
3.05%, 01/15/30 (a) | 1,500,000 | 1,240,365 |
3.40%, 01/15/31 (a) | 1,750,000 | 1,482,320 |
3.40%, 03/01/32 (a) | 860,000 | 700,135 |
Loews Corp. | ||
3.20%, 05/15/30 (a) | 1,460,000 | 1,301,269 |
Manulife Financial Corp. | ||
3.70%, 03/16/32 (a) | 2,240,000 | 2,041,626 |
Markel Corp. | ||
3.35%, 09/17/29 (a) | 870,000 | 781,190 |
Marsh & McLennan Cos., Inc. | ||
4.38%, 03/15/29 (a) | 4,490,000 | 4,364,145 |
2.25%, 11/15/30 (a) | 2,275,000 | 1,894,916 |
2.38%, 12/15/31 (a) | 1,160,000 | 951,142 |
5.75%, 11/01/32 (a) | 1,460,000 | 1,536,606 |
MetLife, Inc. | ||
4.55%, 03/23/30 (a) | 3,275,000 | 3,210,777 |
6.50%, 12/15/32 | 1,760,000 | 1,946,226 |
PartnerRe Finance B LLC | ||
3.70%, 07/02/29 (a) | 1,460,000 | 1,340,762 |
4.50%, 10/01/50 (a)(b) | 200,000 | 168,726 |
Primerica, Inc. | ||
2.80%, 11/19/31 (a) | 1,800,000 | 1,493,478 |
Principal Financial Group, Inc. | ||
3.70%, 05/15/29 (a) | 1,465,000 | 1,345,060 |
2.13%, 06/15/30 (a) | 1,950,000 | 1,587,163 |
5.38%, 03/15/33 (a) | 1,270,000 | 1,264,323 |
Progressive Corp. | ||
4.95%, 06/15/33 (a) | 1,250,000 | 1,242,100 |
Prudential Financial, Inc. | ||
2.10%, 03/10/30 (a) | 1,450,000 | 1,226,802 |
5.70%, 09/15/48 (a)(b) | 2,975,000 | 2,864,508 |
3.70%, 10/01/50 (a)(b) | 2,425,000 | 2,040,880 |
5.13%, 03/01/52 (a)(b) | 2,910,000 | 2,621,008 |
6.00%, 09/01/52 (a)(b) | 3,625,000 | 3,473,040 |
6.75%, 03/01/53 (a)(b) | 1,610,000 | 1,621,801 |
Prudential Funding Asia PLC | ||
3.13%, 04/14/30 | 2,910,000 | 2,579,686 |
3.63%, 03/24/32 (a) | 150,000 | 133,986 |
Reinsurance Group of America, Inc. | ||
3.90%, 05/15/29 (a) | 2,150,000 | 1,962,068 |
3.15%, 06/15/30 (a) | 1,755,000 | 1,508,335 |
RenaissanceRe Holdings Ltd. | ||
3.60%, 04/15/29 (a) | 1,170,000 | 1,042,482 |
5.75%, 06/05/33 (a) | 2,000,000 | 1,960,280 |
Stewart Information Services Corp. | ||
3.60%, 11/15/31 (a) | 1,600,000 | 1,227,216 |
The Progressive Corp. | ||
4.00%, 03/01/29 (a) | 1,710,000 | 1,641,651 |
6.63%, 03/01/29 | 900,000 | 974,520 |
SECURITY RATE, MATURITY DATE | FACE AMOUNT ($) | VALUE ($) |
3.20%, 03/26/30 (a) | 1,605,000 | 1,440,680 |
3.00%, 03/15/32 (a) | 1,460,000 | 1,278,580 |
6.25%, 12/01/32 | 1,180,000 | 1,280,996 |
Travelers Property Casualty Corp. | ||
6.38%, 03/15/33 | 1,500,000 | 1,657,365 |
UnitedHealth Group, Inc. | ||
3.88%, 12/15/28 | 2,480,000 | 2,382,511 |
4.25%, 01/15/29 (a) | 3,750,000 | 3,649,162 |
4.00%, 05/15/29 (a) | 2,685,000 | 2,569,975 |
2.88%, 08/15/29 | 3,025,000 | 2,724,769 |
5.30%, 02/15/30 (a) | 3,760,000 | 3,853,812 |
2.00%, 05/15/30 | 3,630,000 | 3,060,199 |
2.30%, 05/15/31 (a) | 4,455,000 | 3,769,375 |
4.20%, 05/15/32 (a) | 4,515,000 | 4,312,141 |
5.35%, 02/15/33 (a) | 5,900,000 | 6,134,820 |
4.50%, 04/15/33 (a) | 4,525,000 | 4,414,454 |
Unum Group | ||
4.00%, 06/15/29 (a) | 1,470,000 | 1,355,252 |
Willis North America, Inc. | ||
4.50%, 09/15/28 (a) | 1,750,000 | 1,671,530 |
2.95%, 09/15/29 (a) | 2,360,000 | 2,038,049 |
5.35%, 05/15/33 (a) | 2,200,000 | 2,147,750 |
255,645,806 | ||
REITs 4.6% | ||
Agree LP | ||
2.90%, 10/01/30 (a) | 1,010,000 | 843,360 |
4.80%, 10/01/32 (a) | 900,000 | 838,611 |
2.60%, 06/15/33 (a) | 250,000 | 193,138 |
Alexandria Real Estate Equities, Inc. | ||
4.50%, 07/30/29 (a) | 900,000 | 853,434 |
2.75%, 12/15/29 (a) | 1,160,000 | 988,250 |
4.70%, 07/01/30 (a) | 1,310,000 | 1,248,286 |
4.90%, 12/15/30 (a) | 2,200,000 | 2,134,154 |
3.38%, 08/15/31 (a) | 2,240,000 | 1,924,429 |
2.00%, 05/18/32 (a) | 2,605,000 | 1,974,590 |
1.88%, 02/01/33 (a) | 3,010,000 | 2,207,052 |
American Assets Trust LP | ||
3.38%, 02/01/31 (a) | 1,600,000 | 1,256,400 |
American Homes 4 Rent LP | ||
4.90%, 02/15/29 (a) | 1,220,000 | 1,172,164 |
2.38%, 07/15/31 (a) | 1,300,000 | 1,039,766 |
3.63%, 04/15/32 (a) | 1,825,000 | 1,583,881 |
AvalonBay Communities, Inc. | ||
1.90%, 12/01/28 (a) | 1,160,000 | 985,234 |
3.30%, 06/01/29 (a) | 1,360,000 | 1,239,150 |
2.30%, 03/01/30 (a) | 2,040,000 | 1,713,926 |
2.45%, 01/15/31 (a) | 1,745,000 | 1,466,690 |
2.05%, 01/15/32 (a) | 2,035,000 | 1,637,015 |
5.00%, 02/15/33 (a) | 1,050,000 | 1,048,100 |
Boston Properties LP | ||
4.50%, 12/01/28 (a) | 3,100,000 | 2,861,548 |
3.40%, 06/21/29 (a) | 2,010,000 | 1,696,179 |
2.90%, 03/15/30 (a) | 2,085,000 | 1,687,787 |
3.25%, 01/30/31 (a) | 3,755,000 | 3,057,246 |
2.55%, 04/01/32 (a) | 2,625,000 | 1,981,639 |
Brandywine Operating Partnership LP | ||
4.55%, 10/01/29 (a) | 1,010,000 | 743,673 |
Brixmor Operating Partnership LP | ||
4.13%, 05/15/29 (a) | 2,285,000 | 2,044,915 |
4.05%, 07/01/30 (a) | 2,335,000 | 2,111,190 |
2.50%, 08/16/31 (a) | 1,440,000 | 1,124,698 |
Broadstone Net Lease LLC | ||
2.60%, 09/15/31 (a) | 1,075,000 | 776,279 |
SECURITY RATE, MATURITY DATE | FACE AMOUNT ($) | VALUE ($) |
Camden Property Trust | ||
4.10%, 10/15/28 (a) | 1,175,000 | 1,117,836 |
3.15%, 07/01/29 (a) | 1,795,000 | 1,598,842 |
2.80%, 05/15/30 (a) | 2,290,000 | 1,995,712 |
Corporate Office Properties LP | ||
2.00%, 01/15/29 (a) | 1,230,000 | 942,352 |
2.75%, 04/15/31 (a) | 1,765,000 | 1,347,189 |
CubeSmart LP | ||
2.25%, 12/15/28 (a) | 1,690,000 | 1,428,202 |
4.38%, 02/15/29 (a) | 1,025,000 | 963,121 |
3.00%, 02/15/30 (a) | 1,115,000 | 957,674 |
2.00%, 02/15/31 (a) | 1,305,000 | 1,020,915 |
2.50%, 02/15/32 (a) | 1,450,000 | 1,153,606 |
Digital Realty Trust LP | ||
4.45%, 07/15/28 (a) | 1,970,000 | 1,853,593 |
3.60%, 07/01/29 (a) | 2,675,000 | 2,384,575 |
EPR Properties | ||
3.75%, 08/15/29 (a) | 1,495,000 | 1,222,103 |
3.60%, 11/15/31 (a) | 1,280,000 | 1,001,459 |
ERP Operating LP | ||
4.15%, 12/01/28 (a) | 1,300,000 | 1,235,897 |
3.00%, 07/01/29 (a) | 1,750,000 | 1,545,635 |
2.50%, 02/15/30 (a) | 1,755,000 | 1,497,243 |
1.85%, 08/01/31 (a) | 1,450,000 | 1,144,500 |
Essential Properties LP | ||
2.95%, 07/15/31 (a) | 1,200,000 | 900,720 |
Essex Portfolio LP | ||
4.00%, 03/01/29 (a) | 1,600,000 | 1,481,104 |
3.00%, 01/15/30 (a) | 1,500,000 | 1,286,670 |
1.65%, 01/15/31 (a) | 865,000 | 657,487 |
2.55%, 06/15/31 (a) | 860,000 | 696,505 |
2.65%, 03/15/32 (a) | 1,885,000 | 1,521,308 |
Extra Space Storage LP | ||
3.90%, 04/01/29 (a) | 1,200,000 | 1,094,760 |
5.50%, 07/01/30 (a) | 1,300,000 | 1,290,928 |
2.55%, 06/01/31 (a) | 1,310,000 | 1,062,266 |
2.35%, 03/15/32 (a) | 1,735,000 | 1,359,962 |
Federal Realty Investment Trust | ||
3.20%, 06/15/29 (a) | 1,165,000 | 1,011,546 |
Federal Realty OP LP | ||
3.50%, 06/01/30 (a) | 1,165,000 | 1,016,800 |
Healthcare Realty Holdings LP | ||
3.10%, 02/15/30 (a) | 1,895,000 | 1,620,092 |
2.40%, 03/15/30 (a) | 125,000 | 100,253 |
2.00%, 03/15/31 (a) | 2,395,000 | 1,842,689 |
Healthpeak Properties, Inc. | ||
2.13%, 12/01/28 (a) | 1,600,000 | 1,356,832 |
3.50%, 07/15/29 (a) | 1,895,000 | 1,702,866 |
3.00%, 01/15/30 (a) | 2,390,000 | 2,079,037 |
2.88%, 01/15/31 (a) | 1,755,000 | 1,484,905 |
5.25%, 12/15/32 (a) | 1,620,000 | 1,584,684 |
Highwoods Realty LP | ||
4.20%, 04/15/29 (a) | 1,175,000 | 999,161 |
3.05%, 02/15/30 (a) | 1,265,000 | 1,001,273 |
2.60%, 02/01/31 (a) | 1,150,000 | 847,079 |
Host Hotels & Resorts LP | ||
3.38%, 12/15/29 (a) | 1,995,000 | 1,711,530 |
3.50%, 09/15/30 (a) | 2,190,000 | 1,861,040 |
2.90%, 12/15/31 (a) | 1,400,000 | 1,109,094 |
Hudson Pacific Properties LP | ||
4.65%, 04/01/29 (a) | 1,500,000 | 1,065,585 |
3.25%, 01/15/30 (a) | 1,210,000 | 768,604 |
SECURITY RATE, MATURITY DATE | FACE AMOUNT ($) | VALUE ($) |
Invitation Homes Operating Partnership LP | ||
2.30%, 11/15/28 (a) | 1,750,000 | 1,492,697 |
2.00%, 08/15/31 (a) | 1,875,000 | 1,455,356 |
4.15%, 04/15/32 (a) | 1,900,000 | 1,715,966 |
Kilroy Realty LP | ||
4.75%, 12/15/28 (a) | 1,200,000 | 1,068,144 |
4.25%, 08/15/29 (a) | 1,180,000 | 1,013,172 |
3.05%, 02/15/30 (a) | 1,515,000 | 1,191,699 |
2.50%, 11/15/32 (a) | 1,275,000 | 893,648 |
Kimco Realty Corp. | ||
2.70%, 10/01/30 (a) | 1,500,000 | 1,240,320 |
2.25%, 12/01/31 (a) | 1,450,000 | 1,130,884 |
3.20%, 04/01/32 (a) | 1,855,000 | 1,541,913 |
Kimco Realty OP LLC | ||
4.60%, 02/01/33 (a) | 1,900,000 | 1,760,635 |
Lexington Realty Trust | ||
2.70%, 09/15/30 (a) | 1,185,000 | 947,016 |
Life Storage LP | ||
4.00%, 06/15/29 (a) | 1,020,000 | 925,477 |
2.20%, 10/15/30 (a) | 1,235,000 | 989,519 |
2.40%, 10/15/31 (a) | 1,745,000 | 1,384,413 |
LXP Industrial Trust | ||
2.38%, 10/01/31 (a) | 1,145,000 | 871,265 |
Mid-America Apartments LP | ||
3.95%, 03/15/29 (a) | 1,930,000 | 1,822,981 |
2.75%, 03/15/30 (a) | 870,000 | 760,319 |
1.70%, 02/15/31 (a) | 1,300,000 | 1,030,458 |
National Health Investors, Inc. | ||
3.00%, 02/01/31 (a) | 1,220,000 | 941,498 |
National Retail Properties, Inc. | ||
4.30%, 10/15/28 (a) | 1,200,000 | 1,121,244 |
2.50%, 04/15/30 (a) | 1,155,000 | 962,565 |
Omega Healthcare Investors, Inc. | ||
3.63%, 10/01/29 (a) | 1,475,000 | 1,212,775 |
3.38%, 02/01/31 (a) | 2,100,000 | 1,669,332 |
3.25%, 04/15/33 (a) | 2,100,000 | 1,566,306 |
Phillips Edison Grocery Center Operating Partnership I LP | ||
2.63%, 11/15/31 (a) | 1,015,000 | 756,388 |
Physicians Realty LP | ||
2.63%, 11/01/31 (a) | 1,555,000 | 1,213,429 |
Piedmont Operating Partnership LP | ||
3.15%, 08/15/30 (a) | 940,000 | 687,939 |
2.75%, 04/01/32 (a) | 865,000 | 589,030 |
Prologis LP | ||
3.88%, 09/15/28 (a) | 670,000 | 634,778 |
4.00%, 09/15/28 (a) | 1,260,000 | 1,210,948 |
4.38%, 02/01/29 (a) | 925,000 | 889,924 |
2.88%, 11/15/29 (a) | 1,065,000 | 936,060 |
2.25%, 04/15/30 (a) | 3,205,000 | 2,725,788 |
1.75%, 07/01/30 (a) | 950,000 | 767,220 |
1.25%, 10/15/30 (a) | 2,165,000 | 1,683,937 |
1.75%, 02/01/31 (a) | 1,280,000 | 1,022,618 |
1.63%, 03/15/31 (a) | 1,165,000 | 921,993 |
2.25%, 01/15/32 (a) | 1,410,000 | 1,140,211 |
4.63%, 01/15/33 (a) | 2,000,000 | 1,955,920 |
4.75%, 06/15/33 (a) | 2,500,000 | 2,445,250 |
Public Storage | ||
1.95%, 11/09/28 (a) | 1,740,000 | 1,495,391 |
3.39%, 05/01/29 (a) | 1,460,000 | 1,351,026 |
2.30%, 05/01/31 (a) | 1,895,000 | 1,582,818 |
2.25%, 11/09/31 (a) | 1,700,000 | 1,396,023 |
Realty Income Corp. | ||
4.70%, 12/15/28 (a) | 1,400,000 | 1,360,506 |
3.25%, 06/15/29 (a) | 1,460,000 | 1,306,612 |
SECURITY RATE, MATURITY DATE | FACE AMOUNT ($) | VALUE ($) |
3.10%, 12/15/29 (a) | 1,740,000 | 1,525,493 |
4.85%, 03/15/30 (a) | 1,950,000 | 1,891,890 |
3.25%, 01/15/31 (a) | 2,820,000 | 2,467,331 |
5.63%, 10/13/32 (a) | 2,300,000 | 2,335,075 |
2.85%, 12/15/32 (a) | 2,040,000 | 1,664,905 |
1.80%, 03/15/33 (a) | 1,150,000 | 839,477 |
Regency Centers LP | ||
2.95%, 09/15/29 (a) | 1,240,000 | 1,065,842 |
3.70%, 06/15/30 (a) | 1,755,000 | 1,574,744 |
Retail Properties of America, Inc. | ||
4.75%, 09/15/30 (a) | 1,165,000 | 1,057,762 |
Rexford Industrial Realty LP | ||
2.13%, 12/01/30 (a) | 1,190,000 | 944,336 |
2.15%, 09/01/31 (a) | 1,150,000 | 899,346 |
Sabra Health Care LP | ||
3.90%, 10/15/29 (a) | 1,045,000 | 856,022 |
3.20%, 12/01/31 (a) | 2,325,000 | 1,737,612 |
Safehold Operating Partnership LP | ||
2.80%, 06/15/31 (a) | 1,150,000 | 896,345 |
2.85%, 01/15/32 (a) | 1,020,000 | 786,063 |
Simon Property Group LP | ||
2.45%, 09/13/29 (a) | 3,730,000 | 3,151,029 |
2.65%, 07/15/30 (a) | 2,185,000 | 1,862,144 |
2.20%, 02/01/31 (a) | 2,190,000 | 1,760,629 |
2.25%, 01/15/32 (a) | 1,970,000 | 1,541,505 |
2.65%, 02/01/32 (a) | 2,125,000 | 1,732,704 |
5.50%, 03/08/33 (a) | 2,100,000 | 2,088,429 |
Spirit Realty LP | ||
4.00%, 07/15/29 (a) | 1,160,000 | 1,028,456 |
3.40%, 01/15/30 (a) | 1,505,000 | 1,284,984 |
3.20%, 02/15/31 (a) | 1,310,000 | 1,073,820 |
2.70%, 02/15/32 (a) | 1,015,000 | 777,013 |
STORE Capital Corp. | ||
4.63%, 03/15/29 (a) | 1,065,000 | 899,446 |
2.75%, 11/18/30 (a) | 1,015,000 | 736,108 |
2.70%, 12/01/31 (a) | 1,150,000 | 798,997 |
Sun Communities Operating LP | ||
2.30%, 11/01/28 (a) | 1,365,000 | 1,150,954 |
2.70%, 07/15/31 (a) | 2,290,000 | 1,812,146 |
4.20%, 04/15/32 (a) | 1,750,000 | 1,532,335 |
5.70%, 01/15/33 (a) | 1,170,000 | 1,147,641 |
Tanger Properties LP | ||
2.75%, 09/01/31 (a) | 1,300,000 | 945,503 |
UDR, Inc. | ||
4.40%, 01/26/29 (a) | 925,000 | 870,934 |
3.20%, 01/15/30 (a) | 1,750,000 | 1,551,270 |
3.00%, 08/15/31 (a) | 1,755,000 | 1,493,856 |
2.10%, 08/01/32 (a) | 1,295,000 | 985,715 |
1.90%, 03/15/33 (a) | 1,000,000 | 740,150 |
2.10%, 06/15/33 (a) | 400,000 | 296,664 |
Ventas Realty LP | ||
4.40%, 01/15/29 (a) | 2,300,000 | 2,152,156 |
3.00%, 01/15/30 (a) | 1,935,000 | 1,658,450 |
4.75%, 11/15/30 (a) | 1,510,000 | 1,432,250 |
2.50%, 09/01/31 (a) | 1,450,000 | 1,152,243 |
Vornado Realty LP | ||
3.40%, 06/01/31 (a) | 1,070,000 | 777,730 |
Welltower, Inc. | ||
2.05%, 01/15/29 (a) | 1,445,000 | 1,206,199 |
4.13%, 03/15/29 (a) | 1,705,000 | 1,587,372 |
3.10%, 01/15/30 (a) | 2,240,000 | 1,951,578 |
2.75%, 01/15/31 (a) | 1,790,000 | 1,477,931 |
2.80%, 06/01/31 (a) | 2,290,000 | 1,900,975 |
2.75%, 01/15/32 (a) | 1,450,000 | 1,172,905 |
3.85%, 06/15/32 (a) | 1,605,000 | 1,419,093 |
SECURITY RATE, MATURITY DATE | FACE AMOUNT ($) | VALUE ($) |
WP Carey, Inc. | ||
3.85%, 07/15/29 (a) | 1,025,000 | 929,757 |
2.40%, 02/01/31 (a) | 1,950,000 | 1,569,301 |
2.45%, 02/01/32 (a) | 1,015,000 | 801,140 |
2.25%, 04/01/33 (a) | 750,000 | 566,100 |
235,701,284 | ||
1,811,613,460 | ||
Industrial 55.2% | ||
Basic Industry 2.9% | ||
Air Products and Chemicals, Inc. | ||
2.05%, 05/15/30 (a) | 2,650,000 | 2,255,203 |
4.80%, 03/03/33 (a) | 1,825,000 | 1,844,308 |
Albemarle Corp. | ||
5.05%, 06/01/32 (a) | 1,875,000 | 1,819,631 |
AngloGold Ashanti Holdings PLC | ||
3.38%, 11/01/28 (a) | 2,200,000 | 1,929,708 |
3.75%, 10/01/30 (a) | 2,050,000 | 1,756,030 |
ArcelorMittal S.A. | ||
4.25%, 07/16/29 (c) | 1,500,000 | 1,420,890 |
6.80%, 11/29/32 (a) | 2,950,000 | 3,032,482 |
BHP Billiton Finance USA Ltd. | ||
4.90%, 02/28/33 (a) | 2,200,000 | 2,194,346 |
Cabot Corp. | ||
4.00%, 07/01/29 (a) | 900,000 | 837,936 |
5.00%, 06/30/32 (a) | 1,275,000 | 1,222,623 |
Celanese US Holdings LLC | ||
6.33%, 07/15/29 (a) | 2,325,000 | 2,315,746 |
6.38%, 07/15/32 (a)(c) | 3,050,000 | 3,070,892 |
Dow Chemical Co. | ||
4.80%, 11/30/28 (a) | 1,790,000 | 1,776,253 |
7.38%, 11/01/29 | 2,400,000 | 2,673,624 |
2.10%, 11/15/30 (a) | 2,700,000 | 2,234,358 |
6.30%, 03/15/33 (a) | 1,700,000 | 1,831,665 |
DuPont de Nemours, Inc. | ||
4.73%, 11/15/28 (a) | 6,795,000 | 6,699,462 |
Eastman Chemical Co. | ||
4.50%, 12/01/28 (a) | 1,513,000 | 1,446,080 |
5.75%, 03/08/33 (a) | 1,500,000 | 1,502,070 |
Ecolab, Inc. | ||
4.80%, 03/24/30 (a) | 2,050,000 | 2,060,004 |
1.30%, 01/30/31 (a) | 1,700,000 | 1,340,229 |
2.13%, 02/01/32 (a) | 1,875,000 | 1,542,656 |
EI du Pont de Nemours and Co. | ||
2.30%, 07/15/30 (a) | 1,500,000 | 1,256,925 |
EIDP, Inc. | ||
4.80%, 05/15/33 (a) | 1,800,000 | 1,765,188 |
FMC Corp. | ||
3.45%, 10/01/29 (a) | 2,535,000 | 2,221,395 |
5.65%, 05/18/33 (a) | 550,000 | 537,878 |
Freeport-McMoRan, Inc. | ||
4.38%, 08/01/28 (a) | 1,425,000 | 1,345,784 |
5.25%, 09/01/29 (a) | 1,650,000 | 1,625,729 |
4.25%, 03/01/30 (a) | 1,450,000 | 1,340,757 |
4.63%, 08/01/30 (a) | 1,800,000 | 1,705,212 |
Georgia-Pacific LLC | ||
7.75%, 11/15/29 | 1,575,000 | 1,781,089 |
8.88%, 05/15/31 | 1,150,000 | 1,418,341 |
Huntsman International LLC | ||
4.50%, 05/01/29 (a) | 2,300,000 | 2,111,400 |
2.95%, 06/15/31 (a) | 1,200,000 | 961,692 |
SECURITY RATE, MATURITY DATE | FACE AMOUNT ($) | VALUE ($) |
International Flavors & Fragrances, Inc. | ||
4.45%, 09/26/28 (a) | 1,200,000 | 1,128,792 |
Linde, Inc. | ||
1.10%, 08/10/30 (a) | 2,150,000 | 1,713,615 |
LYB International Finance III LLC | ||
2.25%, 10/01/30 (a) | 1,475,000 | 1,213,011 |
5.63%, 05/15/33 (a) | 1,100,000 | 1,101,331 |
NewMarket Corp. | ||
2.70%, 03/18/31 (a) | 1,200,000 | 986,892 |
Newmont Corp. | ||
2.80%, 10/01/29 (a) | 2,100,000 | 1,813,266 |
2.25%, 10/01/30 (a) | 3,000,000 | 2,467,170 |
2.60%, 07/15/32 (a) | 3,000,000 | 2,452,260 |
Nucor Corp. | ||
2.70%, 06/01/30 (a) | 1,500,000 | 1,304,505 |
3.13%, 04/01/32 (a) | 1,600,000 | 1,387,168 |
Nutrien Ltd. | ||
4.20%, 04/01/29 (a) | 2,300,000 | 2,180,584 |
2.95%, 05/13/30 (a) | 1,550,000 | 1,351,926 |
Packaging Corp. of America | ||
3.00%, 12/15/29 (a) | 1,460,000 | 1,275,018 |
PPG Industries, Inc. | ||
2.80%, 08/15/29 (a) | 875,000 | 775,705 |
2.55%, 06/15/30 (a) | 900,000 | 770,139 |
Rayonier LP | ||
2.75%, 05/17/31 (a) | 1,700,000 | 1,373,957 |
Reliance Steel & Aluminum Co. | ||
2.15%, 08/15/30 (a) | 1,600,000 | 1,306,368 |
Rio Tinto Alcan, Inc. | ||
7.25%, 03/15/31 | 1,200,000 | 1,379,076 |
Rio Tinto Finance USA Ltd. | ||
7.13%, 07/15/28 | 2,225,000 | 2,456,400 |
Rio Tinto Finance USA PLC | ||
5.00%, 03/09/33 (a) | 2,000,000 | 2,019,480 |
Rohm & Haas Co. | ||
7.85%, 07/15/29 | 1,725,000 | 1,922,374 |
RPM International, Inc. | ||
4.55%, 03/01/29 (a) | 1,125,000 | 1,057,669 |
2.95%, 01/15/32 (a) | 850,000 | 680,068 |
Sherwin-Williams Co. | ||
2.95%, 08/15/29 (a) | 2,410,000 | 2,134,657 |
2.30%, 05/15/30 (a) | 1,500,000 | 1,262,790 |
2.20%, 03/15/32 (a) | 1,400,000 | 1,131,340 |
Steel Dynamics, Inc. | ||
3.45%, 04/15/30 (a) | 1,875,000 | 1,670,250 |
3.25%, 01/15/31 (a) | 1,000,000 | 869,750 |
Suzano Austria GmbH | ||
2.50%, 09/15/28 (a) | 1,475,000 | 1,256,966 |
6.00%, 01/15/29 (a) | 5,100,000 | 5,076,234 |
5.00%, 01/15/30 (a) | 2,975,000 | 2,793,584 |
3.75%, 01/15/31 (a) | 3,600,000 | 3,076,956 |
3.13%, 01/15/32 (a) | 2,875,000 | 2,307,504 |
Teck Resources Ltd. | ||
3.90%, 07/15/30 (a) | 1,750,000 | 1,593,183 |
Vale Overseas Ltd. | ||
3.75%, 07/08/30 (a) | 4,375,000 | 3,860,456 |
6.13%, 06/12/33 (a) | 4,000,000 | 4,012,160 |
Westlake Chemical Corp. | ||
3.38%, 06/15/30 (a) | 825,000 | 719,227 |
WestRock MWV LLC | ||
8.20%, 01/15/30 | 1,150,000 | 1,322,270 |
7.95%, 02/15/31 | 850,000 | 969,213 |
SECURITY RATE, MATURITY DATE | FACE AMOUNT ($) | VALUE ($) |
Weyerhaeuser Co. | ||
4.00%, 11/15/29 (a) | 2,300,000 | 2,130,375 |
4.00%, 04/15/30 (a) | 2,100,000 | 1,935,339 |
7.38%, 03/15/32 | 2,150,000 | 2,402,238 |
3.38%, 03/09/33 (a) | 1,350,000 | 1,163,808 |
WRKCo, Inc. | ||
4.90%, 03/15/29 (a) | 2,175,000 | 2,105,487 |
4.20%, 06/01/32 (a) | 1,525,000 | 1,390,480 |
3.00%, 06/15/33 (a) | 1,500,000 | 1,223,670 |
Yamana Gold, Inc. | ||
2.63%, 08/15/31 (a)(e) | 1,625,000 | 1,268,816 |
146,671,113 | ||
Capital Goods 5.3% | ||
3M Co. | ||
3.63%, 09/14/28 (a) | 1,850,000 | 1,724,995 |
3.38%, 03/01/29 (a)(c) | 2,300,000 | 2,112,642 |
2.38%, 08/26/29 (a) | 2,975,000 | 2,556,745 |
3.05%, 04/15/30 (a)(c) | 1,800,000 | 1,625,850 |
Acuity Brands Lighting, Inc. | ||
2.15%, 12/15/30 (a) | 1,475,000 | 1,186,402 |
Allegion PLC | ||
3.50%, 10/01/29 (a) | 1,175,000 | 1,044,340 |
Allegion US Holding Co., Inc. | ||
5.41%, 07/01/32 (a) | 1,850,000 | 1,831,981 |
Amcor Finance USA, Inc. | ||
5.63%, 05/26/33 (a) | 1,000,000 | 989,080 |
Amcor Flexibles North America, Inc. | ||
2.63%, 06/19/30 (a) | 1,525,000 | 1,269,791 |
2.69%, 05/25/31 (a) | 2,500,000 | 2,050,475 |
Amphenol Corp. | ||
4.35%, 06/01/29 (a) | 1,500,000 | 1,454,550 |
2.80%, 02/15/30 (a) | 2,725,000 | 2,395,002 |
2.20%, 09/15/31 (a) | 2,225,000 | 1,819,738 |
AptarGroup, Inc. | ||
3.60%, 03/15/32 (a) | 1,200,000 | 1,032,600 |
Avery Dennison Corp. | ||
4.88%, 12/06/28 (a) | 2,200,000 | 2,161,258 |
2.65%, 04/30/30 (a) | 1,425,000 | 1,199,665 |
2.25%, 02/15/32 (a) | 225,000 | 175,831 |
5.75%, 03/15/33 (a) | 1,100,000 | 1,124,475 |
Boeing Co. | ||
3.45%, 11/01/28 (a) | 1,050,000 | 955,038 |
3.20%, 03/01/29 (a) | 3,020,000 | 2,712,232 |
2.95%, 02/01/30 (a) | 2,250,000 | 1,960,245 |
5.15%, 05/01/30 (a) | 13,425,000 | 13,302,832 |
3.63%, 02/01/31 (a) | 4,175,000 | 3,770,150 |
6.13%, 02/15/33 | 1,125,000 | 1,174,286 |
Carlisle Cos., Inc. | ||
2.75%, 03/01/30 (a) | 2,225,000 | 1,898,570 |
2.20%, 03/01/32 (a) | 1,675,000 | 1,324,724 |
Carrier Global Corp. | ||
2.72%, 02/15/30 (a) | 6,050,000 | 5,217,520 |
2.70%, 02/15/31 (a)(e) | 2,150,000 | 1,821,286 |
Caterpillar, Inc. | ||
2.60%, 09/19/29 (a) | 1,455,000 | 1,310,373 |
2.60%, 04/09/30 (a) | 2,425,000 | 2,156,504 |
1.90%, 03/12/31 (a) | 1,475,000 | 1,239,457 |
Deere & Co. | ||
5.38%, 10/16/29 | 1,500,000 | 1,549,650 |
3.10%, 04/15/30 (a) | 2,150,000 | 1,967,830 |
7.13%, 03/03/31 | 850,000 | 985,380 |
Dover Corp. | ||
2.95%, 11/04/29 (a) | 825,000 | 728,294 |
SECURITY RATE, MATURITY DATE | FACE AMOUNT ($) | VALUE ($) |
Eagle Materials, Inc. | ||
2.50%, 07/01/31 (a) | 2,300,000 | 1,882,113 |
Eaton Corp. | ||
4.00%, 11/02/32 | 2,050,000 | 1,932,125 |
4.15%, 03/15/33 (a) | 3,950,000 | 3,757,200 |
Emerson Electric Co. | ||
2.00%, 12/21/28 (a) | 3,050,000 | 2,645,783 |
1.95%, 10/15/30 (a) | 1,450,000 | 1,202,891 |
2.20%, 12/21/31 (a) | 3,000,000 | 2,487,330 |
Flowserve Corp. | ||
3.50%, 10/01/30 (a) | 1,500,000 | 1,289,205 |
2.80%, 01/15/32 (a) | 1,575,000 | 1,256,299 |
Fortune Brands Home & Security, Inc. | ||
3.25%, 09/15/29 (a) | 2,225,000 | 1,949,033 |
4.00%, 03/25/32 (a) | 1,275,000 | 1,137,823 |
Fortune Brands Innovations, Inc. | ||
5.88%, 06/01/33 (a) | 1,250,000 | 1,253,113 |
GE Capital Funding LLC | ||
4.55%, 05/15/32 (a) | 1,625,000 | 1,577,924 |
General Dynamics Corp. | ||
3.63%, 04/01/30 (a) | 3,100,000 | 2,922,959 |
2.25%, 06/01/31 (a) | 1,300,000 | 1,095,666 |
General Electric Co. | ||
6.75%, 03/15/32 | 3,930,000 | 4,438,031 |
Honeywell International, Inc. | ||
4.25%, 01/15/29 (a) | 1,500,000 | 1,461,150 |
2.70%, 08/15/29 (a) | 2,375,000 | 2,118,049 |
1.95%, 06/01/30 (a) | 3,375,000 | 2,842,627 |
1.75%, 09/01/31 (a) | 4,400,000 | 3,537,864 |
5.00%, 02/15/33 (a) | 3,400,000 | 3,468,578 |
Hubbell, Inc. | ||
2.30%, 03/15/31 (a) | 950,000 | 784,425 |
Huntington Ingalls Industries, Inc. | ||
2.04%, 08/16/28 (a) | 1,800,000 | 1,517,112 |
4.20%, 05/01/30 (a) | 1,500,000 | 1,392,960 |
IDEX Corp. | ||
3.00%, 05/01/30 (a) | 1,550,000 | 1,363,876 |
2.63%, 06/15/31 (a) | 1,540,000 | 1,288,857 |
John Deere Capital Corp. | ||
3.45%, 03/07/29 | 1,820,000 | 1,703,702 |
3.35%, 04/18/29 | 1,850,000 | 1,723,404 |
2.80%, 07/18/29 | 1,715,000 | 1,540,001 |
4.85%, 10/11/29 | 650,000 | 651,944 |
2.45%, 01/09/30 | 1,640,000 | 1,440,970 |
4.70%, 06/10/30 | 750,000 | 745,568 |
1.45%, 01/15/31 | 3,950,000 | 3,160,513 |
2.00%, 06/17/31 | 2,850,000 | 2,351,392 |
3.90%, 06/07/32 | 1,650,000 | 1,560,883 |
4.35%, 09/15/32 | 1,750,000 | 1,718,132 |
Johnson Controls International plc | ||
1.75%, 09/15/30 (a) | 2,000,000 | 1,617,880 |
2.00%, 09/16/31 (a) | 1,450,000 | 1,160,015 |
4.90%, 12/01/32 (a) | 1,125,000 | 1,117,080 |
Kennametal, Inc. | ||
2.80%, 03/01/31 (a) | 875,000 | 704,725 |
L3Harris Technologies, Inc. | ||
2.90%, 12/15/29 (a) | 1,250,000 | 1,084,438 |
1.80%, 01/15/31 (a) | 1,925,000 | 1,528,027 |
Leggett & Platt, Inc. | ||
4.40%, 03/15/29 (a) | 1,500,000 | 1,429,500 |
Lockheed Martin Corp. | ||
1.85%, 06/15/30 (a) | 1,200,000 | 1,002,204 |
3.90%, 06/15/32 (a) | 2,425,000 | 2,288,109 |
5.25%, 01/15/33 (a) | 3,275,000 | 3,402,135 |
SECURITY RATE, MATURITY DATE | FACE AMOUNT ($) | VALUE ($) |
Martin Marietta Materials, Inc. | ||
2.50%, 03/15/30 (a) | 1,500,000 | 1,270,995 |
2.40%, 07/15/31 (a) | 2,750,000 | 2,249,995 |
Masco Corp. | ||
2.00%, 10/01/30 (a) | 925,000 | 730,861 |
2.00%, 02/15/31 (a) | 1,700,000 | 1,343,646 |
Mohawk Industries, Inc. | ||
3.63%, 05/15/30 (a) | 1,465,000 | 1,327,349 |
Northrop Grumman Corp. | ||
4.40%, 05/01/30 (a) | 1,925,000 | 1,879,705 |
4.70%, 03/15/33 (a) | 3,200,000 | 3,144,032 |
nVent Finance Sarl | ||
2.75%, 11/15/31 (a) | 550,000 | 440,528 |
5.65%, 05/15/33 (a) | 1,100,000 | 1,088,956 |
Oshkosh Corp. | ||
3.10%, 03/01/30 (a) | 900,000 | 789,984 |
Otis Worldwide Corp. | ||
2.57%, 02/15/30 (a) | 4,470,000 | 3,856,984 |
Owens Corning | ||
3.95%, 08/15/29 (a) | 1,350,000 | 1,256,202 |
3.88%, 06/01/30 (a) | 825,000 | 756,302 |
Parker-Hannifin Corp. | ||
3.25%, 06/14/29 (a) | 3,150,000 | 2,869,051 |
4.50%, 09/15/29 (a) | 3,050,000 | 2,968,809 |
Pentair Finance Sarl | ||
4.50%, 07/01/29 (a) | 1,150,000 | 1,084,508 |
5.90%, 07/15/32 (a) | 1,175,000 | 1,193,307 |
Raytheon Technologies Corp. | ||
4.13%, 11/16/28 (a) | 9,000,000 | 8,676,360 |
7.50%, 09/15/29 | 1,450,000 | 1,636,006 |
2.25%, 07/01/30 (a) | 3,250,000 | 2,748,200 |
1.90%, 09/01/31 (a) | 2,875,000 | 2,298,706 |
2.38%, 03/15/32 (a) | 2,875,000 | 2,362,215 |
5.15%, 02/27/33 (a) | 3,700,000 | 3,753,613 |
Regal Rexnord Corp. | ||
6.30%, 02/15/30 (a)(e) | 3,225,000 | 3,221,130 |
6.40%, 04/15/33 (a)(e) | 3,500,000 | 3,500,560 |
Republic Services, Inc. | ||
4.88%, 04/01/29 (a) | 600,000 | 599,820 |
2.30%, 03/01/30 (a) | 1,800,000 | 1,540,926 |
1.45%, 02/15/31 (a) | 1,925,000 | 1,513,012 |
1.75%, 02/15/32 (a) | 2,400,000 | 1,886,016 |
2.38%, 03/15/33 (a) | 2,200,000 | 1,793,638 |
Rockwell Automation, Inc. | ||
3.50%, 03/01/29 (a) | 1,245,000 | 1,173,251 |
1.75%, 08/15/31 (a) | 1,350,000 | 1,090,301 |
Sonoco Products Co. | ||
3.13%, 05/01/30 (a) | 1,710,000 | 1,493,548 |
2.85%, 02/01/32 (a) | 1,475,000 | 1,230,652 |
Stanley Black & Decker, Inc. | ||
4.25%, 11/15/28 (a) | 1,500,000 | 1,429,755 |
2.30%, 03/15/30 (a) | 2,250,000 | 1,863,000 |
3.00%, 05/15/32 (a)(c) | 1,500,000 | 1,279,485 |
Teledyne Technologies, Inc. | ||
2.75%, 04/01/31 (a) | 3,125,000 | 2,613,875 |
Textron, Inc. | ||
3.90%, 09/17/29 (a) | 900,000 | 828,252 |
3.00%, 06/01/30 (a) | 1,900,000 | 1,660,942 |
2.45%, 03/15/31 (a) | 1,500,000 | 1,237,485 |
Timken Co. | ||
4.50%, 12/15/28 (a) | 1,200,000 | 1,145,484 |
4.13%, 04/01/32 (a) | 975,000 | 878,826 |
Trane Technologies Financing Ltd. | ||
5.25%, 03/03/33 (a) | 2,200,000 | 2,230,206 |
SECURITY RATE, MATURITY DATE | FACE AMOUNT ($) | VALUE ($) |
Trane Technologies Global Holding Co., Ltd. | ||
3.75%, 08/21/28 (a) | 1,625,000 | 1,539,801 |
Trane Technologies Luxembourg Finance S.A. | ||
3.80%, 03/21/29 (a) | 2,240,000 | 2,112,768 |
Vontier Corp. | ||
2.95%, 04/01/31 (a) | 1,750,000 | 1,401,103 |
Vulcan Materials Co. | ||
3.50%, 06/01/30 (a) | 2,200,000 | 1,989,724 |
Waste Connections, Inc. | ||
4.25%, 12/01/28 (a) | 1,475,000 | 1,420,587 |
3.50%, 05/01/29 (a) | 1,500,000 | 1,382,670 |
2.60%, 02/01/30 (a) | 1,700,000 | 1,474,223 |
2.20%, 01/15/32 (a) | 1,925,000 | 1,558,865 |
3.20%, 06/01/32 (a) | 1,575,000 | 1,374,566 |
4.20%, 01/15/33 (a) | 2,450,000 | 2,306,846 |
Waste Management, Inc. | ||
2.00%, 06/01/29 (a) | 1,525,000 | 1,305,476 |
4.63%, 02/15/30 (a) | 2,150,000 | 2,119,556 |
1.50%, 03/15/31 (a) | 2,900,000 | 2,313,185 |
4.15%, 04/15/32 (a) | 3,100,000 | 2,955,633 |
4.63%, 02/15/33 (a) | 1,475,000 | 1,446,975 |
Westinghouse Air Brake Technologies Corp. | ||
4.95%, 09/15/28 (a)(f) | 3,775,000 | 3,661,561 |
Xylem, Inc. | ||
2.25%, 01/30/31 (a) | 1,500,000 | 1,247,325 |
269,910,748 | ||
Communications 8.5% | ||
Activision Blizzard, Inc. | ||
1.35%, 09/15/30 (a) | 1,575,000 | 1,261,796 |
America Movil S.A.B. de C.V. | ||
3.63%, 04/22/29 (a) | 2,900,000 | 2,661,011 |
2.88%, 05/07/30 (a) | 2,950,000 | 2,569,155 |
4.70%, 07/21/32 (a) | 2,300,000 | 2,222,812 |
American Tower Corp. | ||
5.25%, 07/15/28 (a) | 1,250,000 | 1,239,550 |
3.95%, 03/15/29 (a) | 1,775,000 | 1,640,686 |
3.80%, 08/15/29 (a) | 4,900,000 | 4,488,743 |
2.90%, 01/15/30 (a) | 2,385,000 | 2,063,454 |
2.10%, 06/15/30 (a) | 2,375,000 | 1,925,983 |
1.88%, 10/15/30 (a) | 2,550,000 | 2,017,637 |
2.70%, 04/15/31 (a) | 2,050,000 | 1,707,343 |
2.30%, 09/15/31 (a) | 2,025,000 | 1,615,525 |
4.05%, 03/15/32 (a) | 2,300,000 | 2,094,518 |
5.65%, 03/15/33 (a) | 2,450,000 | 2,497,555 |
AT&T, Inc. | ||
4.35%, 03/01/29 (a) | 9,225,000 | 8,863,288 |
4.30%, 02/15/30 (a) | 9,225,000 | 8,766,517 |
2.75%, 06/01/31 (a) | 9,050,000 | 7,644,444 |
2.25%, 02/01/32 (a) | 7,525,000 | 5,984,858 |
Bell Canada | ||
2.15%, 02/15/32 (a) | 1,750,000 | 1,409,293 |
Bell Telephone Co. of Canada or Bell Canada | ||
5.10%, 05/11/33 (a) | 2,600,000 | 2,570,880 |
British Telecommunications PLC | ||
5.13%, 12/04/28 (a) | 2,100,000 | 2,063,502 |
9.63%, 12/15/30 (f) | 7,900,000 | 9,707,994 |
Charter Communications Operating LLC/Charter Communications Operating Capital | ||
2.25%, 01/15/29 (a) | 3,675,000 | 3,062,451 |
5.05%, 03/30/29 (a) | 3,625,000 | 3,458,830 |
2.80%, 04/01/31 (a) | 4,750,000 | 3,834,342 |
2.30%, 02/01/32 (a) | 2,900,000 | 2,196,344 |
4.40%, 04/01/33 (a) | 3,000,000 | 2,640,210 |
SECURITY RATE, MATURITY DATE | FACE AMOUNT ($) | VALUE ($) |
Comcast Corp. | ||
4.15%, 10/15/28 (a) | 11,842,000 | 11,487,451 |
4.55%, 01/15/29 (a) | 2,000,000 | 1,967,620 |
2.65%, 02/01/30 (a) | 4,775,000 | 4,185,526 |
3.40%, 04/01/30 (a) | 5,150,000 | 4,737,485 |
4.25%, 10/15/30 (a) | 5,150,000 | 4,967,072 |
1.95%, 01/15/31 (a) | 4,450,000 | 3,644,906 |
1.50%, 02/15/31 (a) | 5,275,000 | 4,201,274 |
5.50%, 11/15/32 (a) | 2,850,000 | 2,964,028 |
4.25%, 01/15/33 | 5,150,000 | 4,904,911 |
4.65%, 02/15/33 (a) | 2,950,000 | 2,931,798 |
7.05%, 03/15/33 | 2,400,000 | 2,775,456 |
4.80%, 05/15/33 (a) | 2,750,000 | 2,725,607 |
Crown Castle International Corp. | ||
4.30%, 02/15/29 (a) | 1,900,000 | 1,791,605 |
3.10%, 11/15/29 (a) | 1,775,000 | 1,550,445 |
3.30%, 07/01/30 (a) | 2,200,000 | 1,951,312 |
2.25%, 01/15/31 (a) | 3,275,000 | 2,676,526 |
2.10%, 04/01/31 (a) | 3,025,000 | 2,425,354 |
2.50%, 07/15/31 (a) | 2,700,000 | 2,224,314 |
Crown Castle, Inc. | ||
4.80%, 09/01/28 (a) | 600,000 | 583,734 |
5.10%, 05/01/33 (a) | 2,300,000 | 2,268,490 |
Deutsche Telekom International Finance BV | ||
8.75%, 06/15/30 (f) | 10,525,000 | 12,616,949 |
9.25%, 06/01/32 | 1,300,000 | 1,655,212 |
Discovery Communications LLC | ||
4.13%, 05/15/29 (a) | 2,450,000 | 2,249,247 |
3.63%, 05/15/30 (a) | 3,125,000 | 2,746,031 |
Electronic Arts, Inc. | ||
1.85%, 02/15/31 (a) | 2,225,000 | 1,799,847 |
Fox Corp. | ||
4.71%, 01/25/29 (a) | 6,000,000 | 5,840,220 |
3.50%, 04/08/30 (a) | 1,875,000 | 1,690,688 |
Grupo Televisa S.A.B. | ||
8.50%, 03/11/32 | 900,000 | 1,063,701 |
Interpublic Group of Cos., Inc. | ||
4.65%, 10/01/28 (a) | 1,800,000 | 1,738,278 |
4.75%, 03/30/30 (a) | 1,950,000 | 1,892,651 |
2.40%, 03/01/31 (a) | 1,500,000 | 1,223,730 |
Koninklijke KPN N.V. | ||
8.38%, 10/01/30 | 1,725,000 | 1,994,652 |
Meta Platforms, Inc. | ||
4.80%, 05/15/30 (a) | 2,750,000 | 2,752,750 |
3.85%, 08/15/32 (a) | 8,850,000 | 8,229,261 |
4.95%, 05/15/33 (a) | 5,000,000 | 4,997,150 |
Netflix, Inc. | ||
5.88%, 11/15/28 | 5,650,000 | 5,863,457 |
6.38%, 05/15/29 | 2,400,000 | 2,542,776 |
Omnicom Group, Inc. | ||
2.45%, 04/30/30 (a) | 1,850,000 | 1,555,425 |
4.20%, 06/01/30 (a) | 1,750,000 | 1,642,253 |
2.60%, 08/01/31 (a) | 2,400,000 | 1,992,840 |
Orange S.A. | ||
9.00%, 03/01/31 | 7,350,000 | 9,040,867 |
Rogers Communications, Inc. | ||
3.80%, 03/15/32 (a)(e) | 5,975,000 | 5,231,351 |
Sprint Capital Corp. | ||
6.88%, 11/15/28 | 7,200,000 | 7,637,616 |
8.75%, 03/15/32 | 6,250,000 | 7,557,187 |
Take-Two Interactive Software, Inc. | ||
4.00%, 04/14/32 (a) | 1,525,000 | 1,400,179 |
Telefonica Europe BV | ||
8.25%, 09/15/30 | 3,800,000 | 4,394,662 |
SECURITY RATE, MATURITY DATE | FACE AMOUNT ($) | VALUE ($) |
TELUS Corp. | ||
3.40%, 05/13/32 (a) | 2,800,000 | 2,399,012 |
T-Mobile USA, Inc. | ||
4.80%, 07/15/28 (a) | 1,000,000 | 982,970 |
2.63%, 02/15/29 (a) | 4,050,000 | 3,523,540 |
2.40%, 03/15/29 (a) | 1,475,000 | 1,268,825 |
3.38%, 04/15/29 (a) | 7,575,000 | 6,818,030 |
3.88%, 04/15/30 (a) | 20,350,000 | 18,769,822 |
2.55%, 02/15/31 (a) | 7,425,000 | 6,175,447 |
2.88%, 02/15/31 (a) | 2,900,000 | 2,461,172 |
3.50%, 04/15/31 (a) | 7,550,000 | 6,662,120 |
2.25%, 11/15/31 (a) | 3,025,000 | 2,426,141 |
2.70%, 03/15/32 (a) | 2,900,000 | 2,404,854 |
5.20%, 01/15/33 (a) | 4,200,000 | 4,175,514 |
TWDC Enterprises 18 Corp. | ||
7.00%, 03/01/32 | 1,425,000 | 1,631,810 |
Verizon Communications, Inc. | ||
4.33%, 09/21/28 | 12,535,000 | 12,087,124 |
3.88%, 02/08/29 (a) | 3,275,000 | 3,079,220 |
4.02%, 12/03/29 (a) | 11,700,000 | 10,932,597 |
3.15%, 03/22/30 (a) | 4,575,000 | 4,076,599 |
1.50%, 09/18/30 (a) | 3,025,000 | 2,389,478 |
1.68%, 10/30/30 (a) | 3,350,000 | 2,653,502 |
7.75%, 12/01/30 | 1,750,000 | 2,041,148 |
1.75%, 01/20/31 (a) | 6,525,000 | 5,148,421 |
2.55%, 03/21/31 (a) | 12,725,000 | 10,643,572 |
2.36%, 03/15/32 (a) | 14,500,000 | 11,675,980 |
5.05%, 05/09/33 (a) | 1,950,000 | 1,929,467 |
ViacomCBS, Inc. | ||
4.20%, 06/01/29 (a) | 1,500,000 | 1,339,395 |
7.88%, 07/30/30 | 2,575,000 | 2,722,264 |
4.95%, 01/15/31 (a) | 3,925,000 | 3,547,690 |
4.20%, 05/19/32 (a)(c) | 3,500,000 | 2,935,450 |
5.50%, 05/15/33 | 500,000 | 460,100 |
Vodafone Group PLC | ||
7.88%, 02/15/30 | 2,225,000 | 2,553,966 |
6.25%, 11/30/32 | 1,450,000 | 1,545,584 |
Walt Disney Co. | ||
2.00%, 09/01/29 (a) | 5,950,000 | 5,069,162 |
3.80%, 03/22/30 | 3,750,000 | 3,550,012 |
2.65%, 01/13/31 | 7,500,000 | 6,534,600 |
6.55%, 03/15/33 | 1,100,000 | 1,228,117 |
Warnermedia Holdings, Inc. | ||
4.05%, 03/15/29 (a) | 4,200,000 | 3,842,076 |
4.28%, 03/15/32 (a) | 14,600,000 | 12,956,186 |
Weibo Corp. | ||
3.38%, 07/08/30 (a) | 2,150,000 | 1,722,559 |
436,886,141 | ||
Consumer Cyclical 6.7% | ||
Advance Auto Parts, Inc. | ||
3.90%, 04/15/30 (a) | 1,500,000 | 1,292,475 |
3.50%, 03/15/32 (a) | 975,000 | 786,562 |
Alibaba Group Holding Ltd. | ||
2.13%, 02/09/31 (a)(c) | 4,350,000 | 3,540,987 |
Amazon.com, Inc. | ||
3.45%, 04/13/29 (a) | 4,450,000 | 4,193,101 |
4.65%, 12/01/29 (a) | 4,400,000 | 4,417,776 |
1.50%, 06/03/30 (a) | 6,175,000 | 5,083,939 |
2.10%, 05/12/31 (a) | 8,875,000 | 7,468,667 |
3.60%, 04/13/32 (a) | 7,525,000 | 7,020,825 |
4.70%, 12/01/32 (a) | 6,700,000 | 6,755,543 |
SECURITY RATE, MATURITY DATE | FACE AMOUNT ($) | VALUE ($) |
American Honda Finance Corp. | ||
2.25%, 01/12/29 | 2,050,000 | 1,783,767 |
4.60%, 04/17/30 | 2,000,000 | 1,956,520 |
1.80%, 01/13/31 | 1,575,000 | 1,280,948 |
Aptiv PLC | ||
4.35%, 03/15/29 (a) | 850,000 | 818,321 |
3.25%, 03/01/32 (a) | 2,400,000 | 2,053,872 |
AutoNation, Inc. | ||
1.95%, 08/01/28 (a) | 1,550,000 | 1,266,970 |
4.75%, 06/01/30 (a) | 1,475,000 | 1,384,524 |
2.40%, 08/01/31 (a) | 1,000,000 | 762,320 |
3.85%, 03/01/32 (a) | 2,150,000 | 1,831,649 |
AutoZone, Inc. | ||
3.75%, 04/18/29 (a) | 1,425,000 | 1,319,864 |
4.00%, 04/15/30 (a) | 2,250,000 | 2,092,365 |
1.65%, 01/15/31 (a) | 1,725,000 | 1,347,173 |
4.75%, 08/01/32 (a) | 2,275,000 | 2,200,289 |
4.75%, 02/01/33 (a) | 1,600,000 | 1,533,376 |
Best Buy Co., Inc. | ||
4.45%, 10/01/28 (a) | 1,600,000 | 1,552,624 |
1.95%, 10/01/30 (a) | 1,850,000 | 1,493,320 |
Block Financial LLC | ||
2.50%, 07/15/28 (a) | 1,475,000 | 1,256,980 |
3.88%, 08/15/30 (a) | 1,950,000 | 1,721,850 |
Booking Holdings, Inc. | ||
4.63%, 04/13/30 (a) | 4,500,000 | 4,391,100 |
CBRE Services, Inc. | ||
2.50%, 04/01/31 (a) | 1,450,000 | 1,166,525 |
Choice Hotels International, Inc. | ||
3.70%, 12/01/29 (a) | 1,105,000 | 955,936 |
3.70%, 01/15/31 (a) | 1,375,000 | 1,163,085 |
Costco Wholesale Corp. | ||
1.60%, 04/20/30 (a) | 5,275,000 | 4,400,194 |
1.75%, 04/20/32 (a) | 2,950,000 | 2,388,290 |
Cummins, Inc. | ||
1.50%, 09/01/30 (a) | 2,750,000 | 2,229,975 |
Daimler Finance North America LLC | ||
8.50%, 01/18/31 | 4,525,000 | 5,632,946 |
Dick's Sporting Goods, Inc. | ||
3.15%, 01/15/32 (a) | 2,350,000 | 1,927,376 |
Dollar General Corp. | ||
5.20%, 07/05/28 (a) | 1,200,000 | 1,188,684 |
3.50%, 04/03/30 (a) | 2,875,000 | 2,577,179 |
5.00%, 11/01/32 (a) | 2,125,000 | 2,067,264 |
Dollar Tree, Inc. | ||
2.65%, 12/01/31 (a) | 2,300,000 | 1,881,469 |
eBay, Inc. | ||
2.70%, 03/11/30 (a) | 2,775,000 | 2,385,445 |
2.60%, 05/10/31 (a) | 2,325,000 | 1,947,211 |
6.30%, 11/22/32 (a) | 1,250,000 | 1,313,975 |
Expedia Group, Inc. | ||
3.25%, 02/15/30 (a) | 3,675,000 | 3,201,807 |
2.95%, 03/15/31 (a) | 1,500,000 | 1,272,435 |
General Motors Co. | ||
5.00%, 10/01/28 (a)(c) | 2,150,000 | 2,092,917 |
5.40%, 10/15/29 (a) | 3,000,000 | 2,928,540 |
5.60%, 10/15/32 (a) | 3,700,000 | 3,588,704 |
General Motors Financial Co., Inc. | ||
2.40%, 10/15/28 (a) | 2,900,000 | 2,460,998 |
5.65%, 01/17/29 (a) | 1,500,000 | 1,482,675 |
4.30%, 04/06/29 (a) | 3,000,000 | 2,759,610 |
5.85%, 04/06/30 (a) | 3,100,000 | 3,077,246 |
3.60%, 06/21/30 (a) | 3,150,000 | 2,732,341 |
2.35%, 01/08/31 (a) | 3,075,000 | 2,418,733 |
SECURITY RATE, MATURITY DATE | FACE AMOUNT ($) | VALUE ($) |
2.70%, 06/10/31 (a) | 3,025,000 | 2,416,884 |
3.10%, 01/12/32 (a) | 3,700,000 | 2,997,703 |
6.40%, 01/09/33 (a) | 2,675,000 | 2,720,475 |
Genuine Parts Co. | ||
1.88%, 11/01/30 (a) | 1,675,000 | 1,312,279 |
2.75%, 02/01/32 (a) | 1,500,000 | 1,234,650 |
GLP Capital LP/GLP Financing II, Inc. | ||
5.30%, 01/15/29 (a) | 2,200,000 | 2,101,726 |
4.00%, 01/15/30 (a) | 2,000,000 | 1,737,160 |
4.00%, 01/15/31 (a) | 2,075,000 | 1,796,743 |
3.25%, 01/15/32 (a) | 2,350,000 | 1,902,395 |
Home Depot, Inc. | ||
1.50%, 09/15/28 (a) | 3,100,000 | 2,656,421 |
3.90%, 12/06/28 (a) | 2,800,000 | 2,712,528 |
2.95%, 06/15/29 (a) | 5,144,000 | 4,688,602 |
2.70%, 04/15/30 (a) | 4,400,000 | 3,914,152 |
1.38%, 03/15/31 (a) | 3,650,000 | 2,886,164 |
1.88%, 09/15/31 (a) | 3,000,000 | 2,441,730 |
3.25%, 04/15/32 (a) | 3,775,000 | 3,394,442 |
4.50%, 09/15/32 (a)(c) | 3,825,000 | 3,781,089 |
Honda Motor Co., Ltd. | ||
2.97%, 03/10/32 (a) | 2,200,000 | 1,952,698 |
Hyatt Hotels Corp. | ||
4.38%, 09/15/28 (a) | 1,335,000 | 1,262,643 |
5.75%, 04/23/30 (a)(g) | 1,325,000 | 1,333,361 |
JD.com, Inc. | ||
3.38%, 01/14/30 (a) | 2,050,000 | 1,840,900 |
Lear Corp. | ||
4.25%, 05/15/29 (a) | 1,125,000 | 1,058,996 |
3.50%, 05/30/30 (a) | 975,000 | 862,329 |
2.60%, 01/15/32 (a) | 1,050,000 | 821,384 |
LKQ Corp. | ||
6.25%, 06/15/33 (a)(e) | 1,700,000 | 1,711,407 |
Lowe's Cos., Inc. | ||
1.70%, 09/15/28 (a) | 2,850,000 | 2,425,692 |
6.50%, 03/15/29 | 1,022,000 | 1,097,884 |
3.65%, 04/05/29 (a) | 4,450,000 | 4,130,668 |
4.50%, 04/15/30 (a) | 3,800,000 | 3,698,692 |
1.70%, 10/15/30 (a) | 3,725,000 | 2,988,381 |
2.63%, 04/01/31 (a) | 4,475,000 | 3,782,986 |
3.75%, 04/01/32 (a) | 4,400,000 | 3,986,268 |
5.00%, 04/15/33 (a) | 3,600,000 | 3,564,864 |
Magna International, Inc. | ||
2.45%, 06/15/30 (a) | 2,225,000 | 1,887,445 |
5.50%, 03/21/33 (a) | 1,550,000 | 1,580,985 |
Marriott International, Inc. | ||
4.65%, 12/01/28 (a) | 1,000,000 | 971,310 |
4.90%, 04/15/29 (a) | 2,350,000 | 2,288,477 |
4.63%, 06/15/30 (a) | 2,975,000 | 2,851,032 |
2.85%, 04/15/31 (a) | 3,300,000 | 2,777,940 |
3.50%, 10/15/32 (a) | 2,975,000 | 2,571,917 |
McDonald's Corp. | ||
2.63%, 09/01/29 (a) | 3,000,000 | 2,665,920 |
2.13%, 03/01/30 (a) | 2,200,000 | 1,875,676 |
3.60%, 07/01/30 (a) | 2,950,000 | 2,747,866 |
4.60%, 09/09/32 (a) | 2,325,000 | 2,306,586 |
MDC Holdings, Inc. | ||
3.85%, 01/15/30 (a) | 850,000 | 752,038 |
2.50%, 01/15/31 (a) | 1,125,000 | 888,998 |
NIKE, Inc. | ||
2.85%, 03/27/30 (a) | 4,600,000 | 4,162,356 |
NVR, Inc. | ||
3.00%, 05/15/30 (a) | 2,700,000 | 2,341,575 |
SECURITY RATE, MATURITY DATE | FACE AMOUNT ($) | VALUE ($) |
O'Reilly Automotive, Inc. | ||
3.90%, 06/01/29 (a) | 1,550,000 | 1,458,256 |
4.20%, 04/01/30 (a) | 1,375,000 | 1,300,076 |
1.75%, 03/15/31 (a) | 1,400,000 | 1,105,076 |
4.70%, 06/15/32 (a) | 2,600,000 | 2,505,906 |
PulteGroup, Inc. | ||
7.88%, 06/15/32 | 975,000 | 1,108,000 |
6.38%, 05/15/33 | 1,000,000 | 1,040,720 |
Ralph Lauren Corp. | ||
2.95%, 06/15/30 (a) | 2,225,000 | 1,967,078 |
Ross Stores, Inc. | ||
1.88%, 04/15/31 (a) | 1,450,000 | 1,145,674 |
Starbucks Corp. | ||
4.00%, 11/15/28 (a) | 2,311,000 | 2,219,138 |
3.55%, 08/15/29 (a) | 2,925,000 | 2,732,710 |
2.25%, 03/12/30 (a) | 2,225,000 | 1,884,775 |
2.55%, 11/15/30 (a) | 3,680,000 | 3,141,174 |
3.00%, 02/14/32 (a)(c) | 2,875,000 | 2,500,905 |
4.80%, 02/15/33 (a) | 1,500,000 | 1,484,745 |
Tapestry, Inc. | ||
3.05%, 03/15/32 (a) | 1,525,000 | 1,219,466 |
Target Corp. | ||
3.38%, 04/15/29 (a) | 2,900,000 | 2,720,171 |
2.35%, 02/15/30 (a) | 2,150,000 | 1,865,770 |
2.65%, 09/15/30 (a) | 1,400,000 | 1,224,286 |
4.50%, 09/15/32 (a) | 3,125,000 | 3,052,937 |
6.35%, 11/01/32 | 900,000 | 993,897 |
4.40%, 01/15/33 (a) | 1,450,000 | 1,411,952 |
TJX Cos., Inc. | ||
3.88%, 04/15/30 (a) | 1,425,000 | 1,361,231 |
1.60%, 05/15/31 (a) | 1,450,000 | 1,177,705 |
Toll Brothers Finance Corp. | ||
3.80%, 11/01/29 (a) | 1,175,000 | 1,055,597 |
Toyota Motor Corp. | ||
3.67%, 07/20/28 (c) | 1,500,000 | 1,437,525 |
2.76%, 07/02/29 | 1,500,000 | 1,355,430 |
2.36%, 03/25/31 (a) | 1,500,000 | 1,282,035 |
Toyota Motor Credit Corp. | ||
3.65%, 01/08/29 | 1,475,000 | 1,389,008 |
4.45%, 06/29/29 | 2,750,000 | 2,708,832 |
2.15%, 02/13/30 | 2,400,000 | 2,061,576 |
3.38%, 04/01/30 | 3,050,000 | 2,811,398 |
4.55%, 05/17/30 | 1,500,000 | 1,463,940 |
1.65%, 01/10/31 | 1,800,000 | 1,445,598 |
1.90%, 09/12/31 | 1,500,000 | 1,211,415 |
2.40%, 01/13/32 | 1,150,000 | 963,643 |
4.70%, 01/12/33 | 1,500,000 | 1,487,280 |
Tractor Supply Co. | ||
1.75%, 11/01/30 (a) | 1,975,000 | 1,567,084 |
5.25%, 05/15/33 (a) | 2,100,000 | 2,084,082 |
VF Corp. | ||
2.95%, 04/23/30 (a) | 2,300,000 | 1,895,706 |
VICI Properties LP | ||
4.95%, 02/15/30 (a) | 2,900,000 | 2,721,737 |
5.13%, 05/15/32 (a) | 4,625,000 | 4,334,596 |
Walgreens Boots Alliance, Inc. | ||
3.20%, 04/15/30 (a) | 1,500,000 | 1,277,490 |
Walmart, Inc. | ||
1.50%, 09/22/28 (a) | 3,725,000 | 3,236,354 |
3.25%, 07/08/29 (a) | 2,250,000 | 2,112,547 |
2.38%, 09/24/29 (a) | 950,000 | 842,527 |
7.55%, 02/15/30 | 1,450,000 | 1,696,283 |
4.00%, 04/15/30 (a) | 1,100,000 | 1,070,465 |
1.80%, 09/22/31 (a) | 5,975,000 | 4,971,618 |
SECURITY RATE, MATURITY DATE | FACE AMOUNT ($) | VALUE ($) |
4.15%, 09/09/32 (a) | 3,750,000 | 3,702,712 |
4.10%, 04/15/33 (a) | 4,450,000 | 4,326,824 |
344,868,634 | ||
Consumer Non-Cyclical 13.8% | ||
Abbott Laboratories | ||
1.40%, 06/30/30 (a) | 1,950,000 | 1,605,338 |
AbbVie, Inc. | ||
4.25%, 11/14/28 (a) | 5,000,000 | 4,856,100 |
3.20%, 11/21/29 (a) | 16,175,000 | 14,628,670 |
Adventist Health System | ||
2.95%, 03/01/29 (a) | 1,075,000 | 938,604 |
5.43%, 03/01/32 (a) | 1,050,000 | 1,043,879 |
Advocate Health & Hospitals Corp. | ||
3.83%, 08/15/28 (a) | 1,225,000 | 1,171,590 |
2.21%, 06/15/30 (a) | 850,000 | 713,337 |
Agilent Technologies, Inc. | ||
2.75%, 09/15/29 (a) | 1,500,000 | 1,310,475 |
2.10%, 06/04/30 (a) | 1,700,000 | 1,397,638 |
2.30%, 03/12/31 (a) | 2,575,000 | 2,108,745 |
Ahold Finance USA LLC | ||
6.88%, 05/01/29 | 1,500,000 | 1,603,635 |
Altria Group, Inc. | ||
4.80%, 02/14/29 (a) | 5,800,000 | 5,646,706 |
3.40%, 05/06/30 (a) | 2,225,000 | 1,965,142 |
2.45%, 02/04/32 (a) | 4,950,000 | 3,878,226 |
AmerisourceBergen Corp. | ||
2.80%, 05/15/30 (a) | 1,450,000 | 1,259,398 |
2.70%, 03/15/31 (a) | 2,950,000 | 2,516,468 |
Amgen, Inc. | ||
1.65%, 08/15/28 (a) | 3,275,000 | 2,802,974 |
3.00%, 02/22/29 (a) | 2,250,000 | 2,032,875 |
4.05%, 08/18/29 (a) | 3,800,000 | 3,602,818 |
2.45%, 02/21/30 (a) | 3,850,000 | 3,300,143 |
5.25%, 03/02/30 (a) | 8,025,000 | 8,049,797 |
2.30%, 02/25/31 (a) | 3,675,000 | 3,057,453 |
2.00%, 01/15/32 (a) | 3,050,000 | 2,427,312 |
3.35%, 02/22/32 (a) | 2,925,000 | 2,580,172 |
4.20%, 03/01/33 (a) | 2,300,000 | 2,150,753 |
5.25%, 03/02/33 (a) | 12,600,000 | 12,618,774 |
Anheuser-Busch InBev Worldwide, Inc. | ||
4.75%, 01/23/29 (a) | 12,270,000 | 12,231,840 |
3.50%, 06/01/30 (a) | 5,400,000 | 5,033,664 |
4.90%, 01/23/31 (a) | 2,300,000 | 2,344,758 |
Archer-Daniels-Midland Co. | ||
3.25%, 03/27/30 (a) | 2,950,000 | 2,708,129 |
2.90%, 03/01/32 (a) | 2,250,000 | 1,962,675 |
5.94%, 10/01/32 | 1,000,000 | 1,081,080 |
Ascension Health | ||
2.53%, 11/15/29 (a) | 2,525,000 | 2,176,954 |
Astrazeneca Finance LLC | ||
4.90%, 03/03/30 (a) | 2,100,000 | 2,104,221 |
2.25%, 05/28/31 (a) | 2,150,000 | 1,814,901 |
4.88%, 03/03/33 (a) | 1,600,000 | 1,624,816 |
AstraZeneca PLC | ||
4.00%, 01/17/29 (a) | 2,875,000 | 2,783,546 |
1.38%, 08/06/30 (a) | 3,800,000 | 3,060,900 |
Banner Health | ||
2.34%, 01/01/30 (a) | 1,025,000 | 878,036 |
1.90%, 01/01/31 (a) | 825,000 | 669,059 |
BAT Capital Corp. | ||
3.46%, 09/06/29 (a) | 1,425,000 | 1,239,251 |
4.91%, 04/02/30 (a) | 3,000,000 | 2,838,210 |
2.73%, 03/25/31 (a) | 3,725,000 | 2,968,862 |
SECURITY RATE, MATURITY DATE | FACE AMOUNT ($) | VALUE ($) |
4.74%, 03/16/32 (a) | 2,950,000 | 2,692,140 |
7.75%, 10/19/32 (a) | 1,600,000 | 1,763,344 |
Baxter International, Inc. | ||
2.27%, 12/01/28 (a) | 3,650,000 | 3,134,036 |
3.95%, 04/01/30 (a) | 1,475,000 | 1,362,074 |
1.73%, 04/01/31 (a) | 2,000,000 | 1,552,580 |
2.54%, 02/01/32 (a) | 4,600,000 | 3,729,404 |
Baylor Scott & White Holdings | ||
1.78%, 11/15/30 (a) | 825,000 | 659,200 |
Becton Dickinson & Co. | ||
2.82%, 05/20/30 (a) | 2,200,000 | 1,926,540 |
1.96%, 02/11/31 (a) | 3,050,000 | 2,476,905 |
4.30%, 08/22/32 (a) | 1,500,000 | 1,425,720 |
Biogen, Inc. | ||
2.25%, 05/01/30 (a) | 4,575,000 | 3,825,478 |
Bio-Rad Laboratories, Inc. | ||
3.70%, 03/15/32 (a) | 2,425,000 | 2,140,669 |
Bon Secours Mercy Health, Inc. | ||
4.30%, 07/01/28 (a) | 875,000 | 835,118 |
3.46%, 06/01/30 (a) | 100,000 | 89,802 |
2.10%, 06/01/31 (a) | 1,400,000 | 1,119,034 |
Boston Scientific Corp. | ||
2.65%, 06/01/30 (a) | 3,525,000 | 3,073,870 |
Bristol-Myers Squibb Co. | ||
3.40%, 07/26/29 (a) | 6,900,000 | 6,414,999 |
1.45%, 11/13/30 (a) | 3,625,000 | 2,916,602 |
2.95%, 03/15/32 (a) | 5,500,000 | 4,864,750 |
Brown-Forman Corp. | ||
4.75%, 04/15/33 (a) | 1,950,000 | 1,961,739 |
Brunswick Corp. | ||
2.40%, 08/18/31 (a) | 1,625,000 | 1,247,789 |
4.40%, 09/15/32 (a) | 1,350,000 | 1,182,033 |
Bunge Ltd. Finance Corp. | ||
2.75%, 05/14/31 (a) | 3,000,000 | 2,522,040 |
Campbell Soup Co. | ||
2.38%, 04/24/30 (a) | 1,550,000 | 1,307,704 |
Cedars-Sinai Health System | ||
2.29%, 08/15/31 (a) | 825,000 | 681,293 |
CHRISTUS Health | ||
4.34%, 07/01/28 (a) | 975,000 | 932,802 |
Church & Dwight Co., Inc. | ||
2.30%, 12/15/31 (a) | 1,200,000 | 993,096 |
5.60%, 11/15/32 (a) | 1,450,000 | 1,533,361 |
Cigna Corp. | ||
4.38%, 10/15/28 (a) | 11,275,000 | 10,926,490 |
2.40%, 03/15/30 (a) | 4,400,000 | 3,741,848 |
2.38%, 03/15/31 (a) | 4,525,000 | 3,802,357 |
Cigna Group | ||
5.40%, 03/15/33 (a) | 2,500,000 | 2,542,625 |
Clorox Co. | ||
4.40%, 05/01/29 (a) | 1,550,000 | 1,508,398 |
1.80%, 05/15/30 (a) | 1,500,000 | 1,230,315 |
4.60%, 05/01/32 (a) | 1,725,000 | 1,688,137 |
Coca-Cola Co. | ||
2.13%, 09/06/29 | 2,650,000 | 2,329,774 |
3.45%, 03/25/30 | 3,925,000 | 3,707,673 |
1.65%, 06/01/30 | 4,375,000 | 3,651,506 |
2.00%, 03/05/31 | 2,350,000 | 1,982,860 |
1.38%, 03/15/31 | 3,925,000 | 3,150,676 |
2.25%, 01/05/32 | 6,000,000 | 5,121,180 |
Coca-Cola Femsa S.A.B. de C.V. | ||
2.75%, 01/22/30 (a) | 3,050,000 | 2,699,372 |
1.85%, 09/01/32 (a) | 2,150,000 | 1,685,815 |
SECURITY RATE, MATURITY DATE | FACE AMOUNT ($) | VALUE ($) |
Colgate-Palmolive Co. | ||
3.25%, 08/15/32 (a) | 1,525,000 | 1,400,972 |
4.60%, 03/01/33 (a) | 1,500,000 | 1,529,100 |
CommonSpirit Health | ||
3.35%, 10/01/29 (a) | 2,720,000 | 2,395,749 |
2.78%, 10/01/30 (a) | 1,650,000 | 1,389,581 |
Conagra Brands, Inc. | ||
7.00%, 10/01/28 | 1,150,000 | 1,227,257 |
4.85%, 11/01/28 (a) | 3,850,000 | 3,758,100 |
8.25%, 09/15/30 | 925,000 | 1,072,454 |
Constellation Brands, Inc. | ||
4.65%, 11/15/28 (a) | 1,475,000 | 1,450,471 |
3.15%, 08/01/29 (a) | 2,375,000 | 2,147,237 |
2.88%, 05/01/30 (a) | 1,725,000 | 1,500,854 |
2.25%, 08/01/31 (a) | 3,000,000 | 2,456,190 |
4.75%, 05/09/32 (a) | 2,275,000 | 2,210,617 |
4.90%, 05/01/33 (a) | 2,100,000 | 2,064,174 |
CVS Health Corp. | ||
5.00%, 01/30/29 (a) | 2,500,000 | 2,476,850 |
3.25%, 08/15/29 (a) | 5,100,000 | 4,585,155 |
5.13%, 02/21/30 (a) | 5,000,000 | 4,969,550 |
3.75%, 04/01/30 (a) | 4,550,000 | 4,178,265 |
1.75%, 08/21/30 (a) | 3,725,000 | 2,977,914 |
5.25%, 01/30/31 (a) | 2,200,000 | 2,194,434 |
1.88%, 02/28/31 (a) | 4,050,000 | 3,221,653 |
2.13%, 09/15/31 (a) | 3,100,000 | 2,492,400 |
5.25%, 02/21/33 (a) | 5,325,000 | 5,307,587 |
5.30%, 06/01/33 (a) | 3,000,000 | 2,997,570 |
DENTSPLY SIRONA, Inc. | ||
3.25%, 06/01/30 (a) | 2,150,000 | 1,867,641 |
DH Europe Finance II Sarl | ||
2.60%, 11/15/29 (a) | 2,475,000 | 2,179,708 |
Diageo Capital PLC | ||
2.38%, 10/24/29 (a) | 2,900,000 | 2,519,462 |
2.00%, 04/29/30 (a) | 2,975,000 | 2,509,680 |
2.13%, 04/29/32 (a) | 2,200,000 | 1,789,876 |
5.50%, 01/24/33 (a) | 2,300,000 | 2,439,426 |
Eli Lilly & Co. | ||
3.38%, 03/15/29 (a) | 2,700,000 | 2,544,831 |
4.70%, 02/27/33 (a) | 2,900,000 | 2,937,874 |
Estee Lauder Cos., Inc. | ||
2.38%, 12/01/29 (a) | 1,950,000 | 1,688,388 |
2.60%, 04/15/30 (a) | 2,150,000 | 1,884,475 |
1.95%, 03/15/31 (a) | 1,775,000 | 1,460,790 |
4.65%, 05/15/33 (a) | 2,000,000 | 1,969,760 |
Flowers Foods, Inc. | ||
2.40%, 03/15/31 (a) | 1,500,000 | 1,227,960 |
GE HealthCare Technologies, Inc. | ||
5.86%, 03/15/30 (a) | 3,900,000 | 4,010,214 |
5.91%, 11/22/32 (a) | 5,200,000 | 5,441,436 |
General Mills, Inc. | ||
2.88%, 04/15/30 (a) | 2,175,000 | 1,934,619 |
2.25%, 10/14/31 (a) | 1,500,000 | 1,231,965 |
4.95%, 03/29/33 (a) | 3,000,000 | 2,978,850 |
Gilead Sciences, Inc. | ||
1.65%, 10/01/30 (a) | 2,875,000 | 2,351,146 |
GlaxoSmithKline Capital PLC | ||
3.38%, 06/01/29 (a) | 3,050,000 | 2,834,883 |
Haleon US Capital LLC | ||
3.38%, 03/24/29 (a) | 2,900,000 | 2,637,869 |
3.63%, 03/24/32 (a) | 5,975,000 | 5,361,308 |
Hasbro, Inc. | ||
3.90%, 11/19/29 (a) | 2,700,000 | 2,448,900 |
SECURITY RATE, MATURITY DATE | FACE AMOUNT ($) | VALUE ($) |
HCA, Inc. | ||
5.63%, 09/01/28 (a) | 4,700,000 | 4,712,643 |
5.88%, 02/01/29 (a) | 3,000,000 | 3,021,000 |
3.38%, 03/15/29 (a)(e) | 1,450,000 | 1,289,094 |
4.13%, 06/15/29 (a) | 6,125,000 | 5,675,364 |
3.50%, 09/01/30 (a) | 8,000,000 | 7,011,440 |
2.38%, 07/15/31 (a) | 2,525,000 | 2,021,717 |
3.63%, 03/15/32 (a)(e) | 5,925,000 | 5,147,047 |
5.50%, 06/01/33 (a) | 3,500,000 | 3,495,275 |
Hershey Co. | ||
2.45%, 11/15/29 (a) | 1,100,000 | 968,297 |
1.70%, 06/01/30 (a) | 975,000 | 809,621 |
4.50%, 05/04/33 (a) | 1,000,000 | 995,290 |
Hormel Foods Corp. | ||
1.80%, 06/11/30 (a) | 2,925,000 | 2,446,382 |
Illumina, Inc. | ||
2.55%, 03/23/31 (a) | 1,625,000 | 1,348,588 |
Ingredion, Inc. | ||
2.90%, 06/01/30 (a) | 1,725,000 | 1,493,954 |
JBS USA LUX S.A. | ||
5.50%, 01/15/30 (a)(e) | 3,700,000 | 3,550,520 |
3.75%, 12/01/31 (a)(e) | 1,400,000 | 1,157,926 |
3.63%, 01/15/32 (a)(e) | 2,850,000 | 2,315,283 |
3.00%, 05/15/32 (a)(e) | 3,100,000 | 2,401,973 |
5.75%, 04/01/33 (a)(e) | 5,950,000 | 5,616,205 |
JBS USA LUX SA/JBS USA Food Co./JBS USA Finance, Inc. | ||
3.00%, 02/02/29 (a)(e) | 1,975,000 | 1,681,476 |
JM Smucker Co. | ||
2.38%, 03/15/30 (a) | 1,500,000 | 1,279,230 |
2.13%, 03/15/32 (a) | 1,500,000 | 1,203,045 |
Johnson & Johnson | ||
6.95%, 09/01/29 | 987,000 | 1,139,363 |
1.30%, 09/01/30 (a) | 5,450,000 | 4,481,644 |
4.95%, 05/15/33 | 800,000 | 844,288 |
Kellogg Co. | ||
2.10%, 06/01/30 (a) | 1,375,000 | 1,140,769 |
7.45%, 04/01/31 | 1,850,000 | 2,110,091 |
5.25%, 03/01/33 (a) | 1,200,000 | 1,207,128 |
Kenvue, Inc. | ||
5.00%, 03/22/30 (a)(e) | 2,975,000 | 3,005,166 |
4.90%, 03/22/33 (a)(e) | 3,700,000 | 3,746,361 |
Keurig Dr Pepper, Inc. | ||
3.95%, 04/15/29 (a) | 2,950,000 | 2,781,289 |
3.20%, 05/01/30 (a) | 2,350,000 | 2,110,112 |
2.25%, 03/15/31 (a) | 1,425,000 | 1,174,884 |
4.05%, 04/15/32 (a) | 2,425,000 | 2,255,492 |
Kimberly-Clark Corp. | ||
3.95%, 11/01/28 (a) | 1,600,000 | 1,555,840 |
3.20%, 04/25/29 (a) | 2,085,000 | 1,939,467 |
3.10%, 03/26/30 (a) | 2,150,000 | 1,964,950 |
2.00%, 11/02/31 (a) | 1,700,000 | 1,407,209 |
4.50%, 02/16/33 (a) | 1,050,000 | 1,051,040 |
Kraft Heinz Foods Co. | ||
4.63%, 01/30/29 (a) | 1,025,000 | 1,011,029 |
3.75%, 04/01/30 (a) | 2,250,000 | 2,092,837 |
4.25%, 03/01/31 (a) | 1,175,000 | 1,120,656 |
6.75%, 03/15/32 | 900,000 | 994,716 |
Kroger Co. | ||
4.50%, 01/15/29 (a) | 1,825,000 | 1,787,095 |
2.20%, 05/01/30 (a) | 1,800,000 | 1,492,524 |
1.70%, 01/15/31 (a) | 1,525,000 | 1,197,125 |
7.50%, 04/01/31 | 1,050,000 | 1,197,315 |
SECURITY RATE, MATURITY DATE | FACE AMOUNT ($) | VALUE ($) |
Laboratory Corp. of America Holdings | ||
2.95%, 12/01/29 (a) | 2,100,000 | 1,846,047 |
2.70%, 06/01/31 (a) | 1,450,000 | 1,231,819 |
McCormick & Co., Inc. | ||
2.50%, 04/15/30 (a) | 1,500,000 | 1,271,400 |
1.85%, 02/15/31 (a) | 1,400,000 | 1,111,082 |
4.95%, 04/15/33 (a) | 1,600,000 | 1,572,960 |
Medtronic Global Holdings SCA | ||
4.50%, 03/30/33 (a) | 3,050,000 | 2,996,137 |
Merck & Co., Inc. | ||
1.90%, 12/10/28 (a) | 2,900,000 | 2,536,920 |
3.40%, 03/07/29 (a) | 5,150,000 | 4,832,708 |
4.30%, 05/17/30 (a) | 2,200,000 | 2,154,108 |
1.45%, 06/24/30 (a) | 3,650,000 | 2,981,210 |
2.15%, 12/10/31 (a) | 6,050,000 | 5,018,535 |
4.50%, 05/17/33 (a) | 4,400,000 | 4,372,500 |
Merck Sharp & Dohme Corp. | ||
5.95%, 12/01/28 | 950,000 | 1,013,147 |
Mondelez International, Inc. | ||
2.75%, 04/13/30 (a) | 2,225,000 | 1,952,415 |
1.50%, 02/04/31 (a) | 1,450,000 | 1,141,252 |
3.00%, 03/17/32 (a) | 2,275,000 | 1,973,358 |
1.88%, 10/15/32 (a) | 1,850,000 | 1,441,095 |
Novartis Capital Corp. | ||
2.20%, 08/14/30 (a) | 4,375,000 | 3,789,231 |
Ochsner LSU Health System of North Louisiana | ||
2.51%, 05/15/31 (a) | 1,175,000 | 881,497 |
OhioHealth Corp. | ||
2.30%, 11/15/31 (a) | 825,000 | 673,151 |
PepsiCo, Inc. | ||
7.00%, 03/01/29 | 1,600,000 | 1,791,184 |
2.63%, 07/29/29 (a) | 3,150,000 | 2,839,410 |
2.75%, 03/19/30 (a) | 4,525,000 | 4,076,934 |
1.63%, 05/01/30 (a) | 2,875,000 | 2,396,657 |
1.40%, 02/25/31 (a) | 2,250,000 | 1,813,275 |
1.95%, 10/21/31 (a) | 3,625,000 | 3,001,464 |
3.90%, 07/18/32 (a) | 3,650,000 | 3,518,381 |
4.45%, 02/15/33 (a) | 2,800,000 | 2,827,524 |
PerkinElmer, Inc. | ||
1.90%, 09/15/28 (a) | 1,700,000 | 1,439,815 |
3.30%, 09/15/29 (a) | 2,850,000 | 2,549,895 |
2.25%, 09/15/31 (a) | 1,450,000 | 1,167,772 |
Pfizer Investment Enterprises Pte. Ltd. | ||
4.65%, 05/19/30 (a) | 8,800,000 | 8,702,760 |
4.75%, 05/19/33 (a) | 14,600,000 | 14,560,434 |
Pfizer, Inc. | ||
3.60%, 09/15/28 (a) | 3,025,000 | 2,904,302 |
3.45%, 03/15/29 (a) | 5,250,000 | 4,944,030 |
2.63%, 04/01/30 (a) | 3,800,000 | 3,382,342 |
1.70%, 05/28/30 (a) | 3,300,000 | 2,744,082 |
1.75%, 08/18/31 (a) | 3,100,000 | 2,525,446 |
Pharmacia LLC | ||
6.60%, 12/01/28 | 1,900,000 | 2,049,853 |
Philip Morris International, Inc. | ||
3.38%, 08/15/29 (a) | 2,425,000 | 2,193,291 |
5.63%, 11/17/29 (a) | 3,650,000 | 3,724,387 |
5.13%, 02/15/30 (a) | 6,050,000 | 5,987,382 |
2.10%, 05/01/30 (a) | 2,425,000 | 2,009,597 |
1.75%, 11/01/30 (a) | 2,175,000 | 1,723,927 |
5.75%, 11/17/32 (a) | 4,825,000 | 4,952,669 |
5.38%, 02/15/33 (a) | 6,600,000 | 6,591,420 |
Piedmont Healthcare, Inc. | ||
2.04%, 01/01/32 (a) | 875,000 | 689,124 |
SECURITY RATE, MATURITY DATE | FACE AMOUNT ($) | VALUE ($) |
Pilgrim's Pride Corp. | ||
4.25%, 04/15/31 (a) | 2,900,000 | 2,490,027 |
3.50%, 03/01/32 (a) | 2,550,000 | 2,034,007 |
Procter & Gamble Co. | ||
3.00%, 03/25/30 | 4,475,000 | 4,145,237 |
1.20%, 10/29/30 | 3,825,000 | 3,095,955 |
1.95%, 04/23/31 | 2,900,000 | 2,467,436 |
2.30%, 02/01/32 | 2,475,000 | 2,160,130 |
4.05%, 01/26/33 | 2,550,000 | 2,522,358 |
Providence St Joseph Health Obligated Group | ||
2.53%, 10/01/29 (a) | 1,925,000 | 1,623,276 |
Quest Diagnostics, Inc. | ||
4.20%, 06/30/29 (a) | 1,500,000 | 1,451,025 |
2.95%, 06/30/30 (a) | 2,500,000 | 2,200,725 |
2.80%, 06/30/31 (a) | 1,600,000 | 1,380,416 |
Regeneron Pharmaceuticals, Inc. | ||
1.75%, 09/15/30 (a) | 3,700,000 | 2,950,972 |
Revvity, Inc. | ||
2.55%, 03/15/31 (a) | 1,200,000 | 987,312 |
Royalty Pharma PLC | ||
2.20%, 09/02/30 (a) | 2,850,000 | 2,297,385 |
2.15%, 09/02/31 (a) | 1,750,000 | 1,374,713 |
Rush Obligated Group | ||
3.92%, 11/15/29 (a) | 925,000 | 853,183 |
Smith & Nephew PLC | ||
2.03%, 10/14/30 (a) | 3,025,000 | 2,454,364 |
Stanford Health Care | ||
3.31%, 08/15/30 (a) | 825,000 | 745,536 |
STERIS Irish FinCo Unlimited Co. | ||
2.70%, 03/15/31 (a) | 2,000,000 | 1,675,980 |
Stryker Corp. | ||
1.95%, 06/15/30 (a) | 3,075,000 | 2,576,266 |
Sutter Health | ||
3.70%, 08/15/28 (a) | 1,000,000 | 931,130 |
2.29%, 08/15/30 (a) | 2,075,000 | 1,718,162 |
Sysco Corp. | ||
2.40%, 02/15/30 (a) | 1,540,000 | 1,316,207 |
5.95%, 04/01/30 (a) | 2,975,000 | 3,116,699 |
2.45%, 12/14/31 (a) | 1,350,000 | 1,105,056 |
Takeda Pharmaceutical Co., Ltd. | ||
5.00%, 11/26/28 (a) | 5,225,000 | 5,201,487 |
2.05%, 03/31/30 (a) | 7,500,000 | 6,239,775 |
Thermo Fisher Scientific, Inc. | ||
1.75%, 10/15/28 (a) | 2,125,000 | 1,832,600 |
2.60%, 10/01/29 (a) | 3,000,000 | 2,654,700 |
2.00%, 10/15/31 (a) | 3,575,000 | 2,919,309 |
4.95%, 11/21/32 (a) | 1,850,000 | 1,885,095 |
Tyson Foods, Inc. | ||
4.35%, 03/01/29 (a) | 3,050,000 | 2,909,517 |
Unilever Capital Corp. | ||
2.13%, 09/06/29 (a) | 2,500,000 | 2,165,375 |
1.38%, 09/14/30 (a) | 1,500,000 | 1,204,530 |
1.75%, 08/12/31 (a) | 2,700,000 | 2,186,622 |
5.90%, 11/15/32 | 3,000,000 | 3,287,370 |
Universal Health Services, Inc. | ||
2.65%, 10/15/30 (a) | 2,500,000 | 2,041,700 |
2.65%, 01/15/32 (a) | 1,550,000 | 1,231,894 |
UPMC | ||
5.04%, 05/15/33 (a) | 100,000 | 97,916 |
Viatris, Inc. | ||
2.70%, 06/22/30 (a) | 4,450,000 | 3,610,196 |
SECURITY RATE, MATURITY DATE | FACE AMOUNT ($) | VALUE ($) |
Whirlpool Corp. | ||
4.75%, 02/26/29 (a) | 2,090,000 | 2,041,846 |
2.40%, 05/15/31 (a) | 850,000 | 691,195 |
4.70%, 05/14/32 (a) | 900,000 | 865,620 |
5.50%, 03/01/33 (a) | 900,000 | 899,271 |
Zimmer Biomet Holdings, Inc. | ||
2.60%, 11/24/31 (a) | 2,275,000 | 1,890,935 |
Zoetis, Inc. | ||
3.90%, 08/20/28 (a) | 1,500,000 | 1,440,270 |
2.00%, 05/15/30 (a) | 2,200,000 | 1,839,794 |
5.60%, 11/16/32 (a) | 2,350,000 | 2,461,766 |
710,796,296 | ||
Energy 6.5% | ||
Apache Corp. | ||
4.38%, 10/15/28 (a) | 1,000,000 | 911,940 |
4.25%, 01/15/30 (a) | 1,000,000 | 891,390 |
Baker Hughes a GE Co., LLC/Baker Hughes Co-Obligor, Inc. | ||
3.14%, 11/07/29 (a) | 1,550,000 | 1,386,227 |
4.49%, 05/01/30 (a) | 1,425,000 | 1,381,623 |
Boardwalk Pipelines LP | ||
4.80%, 05/03/29 (a) | 1,450,000 | 1,393,247 |
3.40%, 02/15/31 (a) | 1,475,000 | 1,270,934 |
3.60%, 09/01/32 (a) | 1,550,000 | 1,321,902 |
BP Capital Markets America, Inc. | ||
3.94%, 09/21/28 (a) | 3,050,000 | 2,924,004 |
4.23%, 11/06/28 (a) | 6,000,000 | 5,838,540 |
3.63%, 04/06/30 (a) | 3,750,000 | 3,499,462 |
1.75%, 08/10/30 (a) | 2,900,000 | 2,376,086 |
2.72%, 01/12/32 (a) | 5,950,000 | 5,063,509 |
4.81%, 02/13/33 (a) | 6,675,000 | 6,587,958 |
BP Capital Markets PLC | ||
3.72%, 11/28/28 (a) | 2,300,000 | 2,178,560 |
Burlington Resources LLC | ||
7.20%, 08/15/31 | 1,350,000 | 1,545,467 |
7.40%, 12/01/31 | 1,000,000 | 1,158,450 |
Canadian Natural Resources Ltd. | ||
2.95%, 07/15/30 (a) | 1,425,000 | 1,227,011 |
7.20%, 01/15/32 | 1,175,000 | 1,284,087 |
6.45%, 06/30/33 | 1,000,000 | 1,033,850 |
Cenovus Energy, Inc. | ||
2.65%, 01/15/32 (a) | 1,475,000 | 1,193,128 |
Cheniere Corpus Christi Holdings LLC | ||
3.70%, 11/15/29 (a) | 3,500,000 | 3,179,085 |
Cheniere Energy Partners LP | ||
4.50%, 10/01/29 (a) | 4,350,000 | 3,999,259 |
4.00%, 03/01/31 (a) | 4,400,000 | 3,882,736 |
3.25%, 01/31/32 (a) | 3,500,000 | 2,892,085 |
5.95%, 06/30/33 (a)(e) | 3,500,000 | 3,514,560 |
Cheniere Energy, Inc. | ||
4.63%, 10/15/28 (a) | 4,400,000 | 4,124,736 |
Chevron Corp. | ||
2.24%, 05/11/30 (a) | 4,475,000 | 3,903,005 |
Chevron USA, Inc. | ||
3.25%, 10/15/29 (a) | 1,700,000 | 1,574,642 |
Conoco Funding Co. | ||
7.25%, 10/15/31 | 1,175,000 | 1,346,198 |
ConocoPhillips Co. | ||
6.95%, 04/15/29 | 3,725,000 | 4,106,663 |
5.90%, 10/15/32 | 1,500,000 | 1,617,750 |
Coterra Energy, Inc. | ||
4.38%, 03/15/29 (a) | 1,445,000 | 1,350,613 |
SECURITY RATE, MATURITY DATE | FACE AMOUNT ($) | VALUE ($) |
DCP Midstream Operating LP | ||
5.13%, 05/15/29 (a) | 1,800,000 | 1,763,280 |
8.13%, 08/16/30 | 1,100,000 | 1,244,738 |
3.25%, 02/15/32 (a) | 1,225,000 | 1,038,580 |
Devon Energy Corp. | ||
4.50%, 01/15/30 (a) | 1,730,000 | 1,630,923 |
7.88%, 09/30/31 | 2,000,000 | 2,269,900 |
7.95%, 04/15/32 | 1,125,000 | 1,296,416 |
Diamondback Energy, Inc. | ||
3.50%, 12/01/29 (a) | 2,925,000 | 2,639,725 |
3.13%, 03/24/31 (a) | 2,250,000 | 1,927,508 |
6.25%, 03/15/33 (a) | 3,400,000 | 3,524,576 |
Eastern Gas Transmission & Storage, Inc. | ||
3.00%, 11/15/29 (a) | 1,250,000 | 1,093,525 |
Enable Midstream Partners LP | ||
4.15%, 09/15/29 (a) | 1,635,000 | 1,507,110 |
Enbridge, Inc. | ||
3.13%, 11/15/29 (a) | 2,800,000 | 2,478,252 |
5.70%, 03/08/33 (a) | 6,800,000 | 6,895,812 |
Energy Transfer LP | ||
5.25%, 04/15/29 (a) | 4,550,000 | 4,443,712 |
3.75%, 05/15/30 (a) | 4,375,000 | 3,957,144 |
5.75%, 02/15/33 (a) | 4,500,000 | 4,533,435 |
Enterprise Products Operating LLC | ||
4.15%, 10/16/28 (a) | 2,900,000 | 2,778,548 |
3.13%, 07/31/29 (a) | 3,785,000 | 3,400,406 |
2.80%, 01/31/30 (a) | 3,725,000 | 3,268,948 |
5.35%, 01/31/33 (a) | 2,950,000 | 3,001,448 |
6.88%, 03/01/33 | 1,500,000 | 1,693,170 |
EOG Resources, Inc. | ||
4.38%, 04/15/30 (a) | 2,300,000 | 2,256,576 |
EQT Corp. | ||
5.00%, 01/15/29 (a) | 950,000 | 895,014 |
7.50%, 02/01/30 (a)(f) | 2,025,000 | 2,123,496 |
Exxon Mobil Corp. | ||
2.44%, 08/16/29 (a) | 3,725,000 | 3,318,565 |
3.48%, 03/19/30 (a) | 5,975,000 | 5,611,541 |
2.61%, 10/15/30 (a) | 5,875,000 | 5,162,950 |
Halliburton Co. | ||
2.92%, 03/01/30 (a) | 2,875,000 | 2,534,111 |
Helmerich and Payne, Inc. | ||
2.90%, 09/29/31 (a) | 1,775,000 | 1,434,005 |
Hess Corp. | ||
7.88%, 10/01/29 | 1,425,000 | 1,579,385 |
7.30%, 08/15/31 | 1,950,000 | 2,144,512 |
7.13%, 03/15/33 | 1,600,000 | 1,752,544 |
HF Sinclair Corp. | ||
4.50%, 10/01/30 (a) | 1,075,000 | 957,546 |
Kinder Morgan Energy Partners LP | ||
7.40%, 03/15/31 | 900,000 | 991,863 |
7.75%, 03/15/32 | 875,000 | 981,986 |
Kinder Morgan, Inc. | ||
2.00%, 02/15/31 (a) | 1,750,000 | 1,393,245 |
7.80%, 08/01/31 | 1,650,000 | 1,867,388 |
7.75%, 01/15/32 | 3,150,000 | 3,558,870 |
4.80%, 02/01/33 (a) | 2,850,000 | 2,698,722 |
5.20%, 06/01/33 (a) | 4,000,000 | 3,876,920 |
Magellan Midstream Partners LP | ||
3.25%, 06/01/30 (a) | 1,600,000 | 1,411,616 |
Marathon Oil Corp. | ||
6.80%, 03/15/32 | 1,675,000 | 1,737,327 |
MPLX LP | ||
4.80%, 02/15/29 (a) | 2,250,000 | 2,175,187 |
2.65%, 08/15/30 (a) | 4,500,000 | 3,772,260 |
SECURITY RATE, MATURITY DATE | FACE AMOUNT ($) | VALUE ($) |
4.95%, 09/01/32 (a) | 2,675,000 | 2,559,012 |
5.00%, 03/01/33 (a) | 3,600,000 | 3,455,820 |
National Fuel Gas Co. | ||
4.75%, 09/01/28 (a) | 850,000 | 806,038 |
2.95%, 03/01/31 (a) | 1,475,000 | 1,185,708 |
NOV, Inc. | ||
3.60%, 12/01/29 (a) | 1,460,000 | 1,305,401 |
Occidental Petroleum Corp. | ||
6.38%, 09/01/28 (a) | 1,800,000 | 1,839,780 |
8.88%, 07/15/30 (a) | 2,900,000 | 3,335,377 |
6.63%, 09/01/30 (a) | 4,000,000 | 4,158,280 |
6.13%, 01/01/31 (a) | 3,300,000 | 3,353,592 |
7.50%, 05/01/31 | 2,700,000 | 2,950,830 |
7.88%, 09/15/31 | 1,500,000 | 1,674,525 |
ONEOK, Inc. | ||
4.55%, 07/15/28 (a) | 2,450,000 | 2,326,250 |
4.35%, 03/15/29 (a) | 2,100,000 | 1,954,995 |
3.40%, 09/01/29 (a) | 2,175,000 | 1,903,451 |
3.10%, 03/15/30 (a) | 2,375,000 | 2,042,547 |
6.35%, 01/15/31 (a) | 1,605,000 | 1,654,209 |
6.10%, 11/15/32 (a) | 2,300,000 | 2,341,998 |
Ovintiv, Inc. | ||
8.13%, 09/15/30 | 900,000 | 991,062 |
7.20%, 11/01/31 | 1,050,000 | 1,109,997 |
7.38%, 11/01/31 | 1,550,000 | 1,663,042 |
Phillips 66 | ||
2.15%, 12/15/30 (a) | 2,550,000 | 2,082,942 |
Phillips 66 Co. | ||
3.15%, 12/15/29 (a) | 1,700,000 | 1,485,154 |
5.30%, 06/30/33 (a) | 1,500,000 | 1,498,635 |
Pioneer Natural Resources Co. | ||
1.90%, 08/15/30 (a) | 3,275,000 | 2,659,267 |
2.15%, 01/15/31 (a) | 3,000,000 | 2,458,290 |
Plains All American Pipeline LP/PAA Finance Corp. | ||
3.55%, 12/15/29 (a) | 3,000,000 | 2,645,190 |
3.80%, 09/15/30 (a) | 2,200,000 | 1,955,470 |
Sabine Pass Liquefaction LLC | ||
4.50%, 05/15/30 (a) | 5,975,000 | 5,685,212 |
Schlumberger Investment S.A. | ||
2.65%, 06/26/30 (a) | 3,975,000 | 3,482,895 |
Schlumberger Investment SA | ||
4.85%, 05/15/33 (a) | 900,000 | 888,237 |
Shell International Finance BV | ||
3.88%, 11/13/28 (a) | 4,500,000 | 4,358,610 |
2.38%, 11/07/29 (a) | 4,415,000 | 3,872,882 |
2.75%, 04/06/30 (a) | 5,600,000 | 5,016,536 |
Suncor Energy, Inc. | ||
7.15%, 02/01/32 | 1,500,000 | 1,623,195 |
Targa Resources Corp. | ||
4.20%, 02/01/33 (a) | 2,150,000 | 1,907,846 |
6.13%, 03/15/33 (a) | 2,700,000 | 2,761,398 |
Targa Resources Partners LP/Targa Resources Partners Finance Corp. | ||
6.88%, 01/15/29 (a) | 1,850,000 | 1,889,313 |
5.50%, 03/01/30 (a) | 2,900,000 | 2,792,671 |
4.88%, 02/01/31 (a) | 2,950,000 | 2,727,009 |
4.00%, 01/15/32 (a) | 2,975,000 | 2,581,645 |
Tennessee Gas Pipeline Co. LLC | ||
7.00%, 10/15/28 | 1,150,000 | 1,214,320 |
Texas Eastern Transmission LP | ||
7.00%, 07/15/32 | 1,350,000 | 1,503,725 |
Tosco Corp. | ||
8.13%, 02/15/30 | 1,100,000 | 1,281,973 |
SECURITY RATE, MATURITY DATE | FACE AMOUNT ($) | VALUE ($) |
TotalEnergies Capital International S.A. | ||
3.46%, 02/19/29 (a) | 3,550,000 | 3,320,066 |
2.83%, 01/10/30 (a) | 3,675,000 | 3,292,837 |
TotalEnergies Capital S.A. | ||
3.88%, 10/11/28 | 3,000,000 | 2,885,040 |
TransCanada PipeLines Ltd. | ||
4.10%, 04/15/30 (a) | 3,825,000 | 3,561,572 |
2.50%, 10/12/31 (a) | 3,025,000 | 2,451,702 |
Transcontinental Gas Pipe Line Co. LLC | ||
3.25%, 05/15/30 (a) | 2,400,000 | 2,136,384 |
Valero Energy Corp. | ||
4.00%, 04/01/29 (a) | 1,425,000 | 1,346,027 |
2.80%, 12/01/31 (a) | 1,475,000 | 1,215,149 |
7.50%, 04/15/32 | 2,200,000 | 2,491,786 |
Western Midstream Operating LP | ||
4.75%, 08/15/28 (a) | 1,350,000 | 1,283,594 |
4.30%, 02/01/30 (a) | 3,600,000 | 3,244,392 |
6.15%, 04/01/33 (a) | 2,250,000 | 2,267,617 |
Williams Cos., Inc. | ||
3.50%, 11/15/30 (a) | 2,950,000 | 2,648,480 |
7.50%, 01/15/31 | 975,000 | 1,074,236 |
2.60%, 03/15/31 (a) | 4,650,000 | 3,860,802 |
8.75%, 03/15/32 | 100,000 | 118,912 |
4.65%, 08/15/32 (a) | 3,275,000 | 3,103,881 |
5.65%, 03/15/33 (a) | 2,600,000 | 2,637,518 |
334,505,816 | ||
Industrial Other 0.2% | ||
Cintas Corp. No. 2 | ||
4.00%, 05/01/32 (a) | 2,525,000 | 2,403,547 |
Emory University | ||
2.14%, 09/01/30 (a) | 100,000 | 84,092 |
Jacobs Engineering Group, Inc. | ||
5.90%, 03/01/33 (a) | 1,625,000 | 1,597,440 |
Johns Hopkins University | ||
4.71%, 07/01/32 (a) | 850,000 | 849,983 |
Quanta Services, Inc. | ||
2.90%, 10/01/30 (a) | 3,175,000 | 2,702,623 |
2.35%, 01/15/32 (a) | 1,450,000 | 1,143,514 |
Yale University | ||
1.48%, 04/15/30 (a) | 1,550,000 | 1,282,532 |
10,063,731 | ||
Technology 9.8% | ||
Adobe, Inc. | ||
2.30%, 02/01/30 (a) | 3,875,000 | 3,402,366 |
Advanced Micro Devices, Inc. | ||
3.92%, 06/01/32 (a) | 1,550,000 | 1,472,872 |
Alphabet, Inc. | ||
1.10%, 08/15/30 (a) | 6,725,000 | 5,446,846 |
Amdocs Ltd. | ||
2.54%, 06/15/30 (a) | 1,975,000 | 1,655,425 |
Analog Devices, Inc. | ||
1.70%, 10/01/28 (a) | 2,300,000 | 1,979,702 |
2.10%, 10/01/31 (a) | 3,025,000 | 2,507,543 |
Apple Inc. | ||
1.40%, 08/05/28 (a) | 6,950,000 | 6,002,506 |
3.25%, 08/08/29 (a) | 3,000,000 | 2,813,490 |
2.20%, 09/11/29 (a) | 5,200,000 | 4,566,640 |
1.65%, 05/11/30 (a) | 5,200,000 | 4,384,224 |
1.25%, 08/20/30 (a) | 3,625,000 | 2,945,421 |
1.65%, 02/08/31 (a) | 8,325,000 | 6,906,586 |
SECURITY RATE, MATURITY DATE | FACE AMOUNT ($) | VALUE ($) |
1.70%, 08/05/31 (a) | 2,900,000 | 2,393,602 |
3.35%, 08/08/32 (a) | 4,550,000 | 4,251,019 |
Apple, Inc. | ||
4.15%, 05/10/30 (a) | 1,400,000 | 1,378,762 |
4.30%, 05/10/33 (a) | 2,900,000 | 2,887,211 |
Applied Materials, Inc. | ||
1.75%, 06/01/30 (a) | 2,300,000 | 1,924,847 |
Arrow Electronics, Inc. | ||
2.95%, 02/15/32 (a) | 1,450,000 | 1,198,831 |
Autodesk, Inc. | ||
2.85%, 01/15/30 (a) | 1,435,000 | 1,258,093 |
2.40%, 12/15/31 (a) | 3,025,000 | 2,484,856 |
Automatic Data Processing, Inc. | ||
1.25%, 09/01/30 (a) | 2,925,000 | 2,373,345 |
Avnet, Inc. | ||
3.00%, 05/15/31 (a) | 900,000 | 721,989 |
5.50%, 06/01/32 (a) | 900,000 | 859,824 |
Baidu, Inc. | ||
4.88%, 11/14/28 (a) | 1,200,000 | 1,174,152 |
3.43%, 04/07/30 (a) | 1,200,000 | 1,077,576 |
2.38%, 10/09/30 (a) | 900,000 | 746,037 |
2.38%, 08/23/31 (a) | 2,050,000 | 1,669,110 |
Broadcom, Inc. | ||
4.11%, 09/15/28 (a) | 3,000,000 | 2,839,140 |
4.00%, 04/15/29 (a)(e) | 2,500,000 | 2,313,475 |
4.75%, 04/15/29 (a) | 5,060,000 | 4,901,268 |
5.00%, 04/15/30 (a) | 1,800,000 | 1,768,680 |
4.15%, 11/15/30 (a) | 5,565,000 | 5,117,463 |
2.45%, 02/15/31 (a)(e) | 8,050,000 | 6,549,963 |
4.15%, 04/15/32 (a)(e) | 3,700,000 | 3,352,200 |
4.30%, 11/15/32 (a) | 6,250,000 | 5,730,437 |
2.60%, 02/15/33 (a)(e) | 5,125,000 | 3,998,679 |
3.42%, 04/15/33 (a)(e) | 6,050,000 | 5,071,412 |
Broadridge Financial Solutions, Inc. | ||
2.90%, 12/01/29 (a) | 2,300,000 | 1,970,870 |
2.60%, 05/01/31 (a) | 3,025,000 | 2,483,948 |
CDW LLC/CDW Finance Corp. | ||
3.28%, 12/01/28 (a) | 1,300,000 | 1,131,585 |
3.25%, 02/15/29 (a) | 1,850,000 | 1,604,653 |
3.57%, 12/01/31 (a) | 2,975,000 | 2,515,095 |
CGI, Inc. | ||
2.30%, 09/14/31 (a) | 1,200,000 | 939,192 |
Dell International LLC/EMC Corp. | ||
5.30%, 10/01/29 (a) | 5,280,000 | 5,246,736 |
6.20%, 07/15/30 (a) | 2,250,000 | 2,344,050 |
5.75%, 02/01/33 (a) | 3,000,000 | 3,032,160 |
DXC Technology Co. | ||
2.38%, 09/15/28 (a) | 2,050,000 | 1,714,538 |
Equifax, Inc. | ||
3.10%, 05/15/30 (a) | 1,875,000 | 1,623,656 |
2.35%, 09/15/31 (a) | 3,025,000 | 2,419,698 |
Equinix, Inc. | ||
3.20%, 11/18/29 (a) | 3,600,000 | 3,170,808 |
2.15%, 07/15/30 (a) | 3,300,000 | 2,677,488 |
2.50%, 05/15/31 (a) | 3,025,000 | 2,467,886 |
3.90%, 04/15/32 (a) | 3,550,000 | 3,195,532 |
FactSet Research Systems, Inc. | ||
3.45%, 03/01/32 (a) | 1,525,000 | 1,305,568 |
Fidelity National Information Services, Inc. | ||
3.75%, 05/21/29 (a) | 1,825,000 | 1,669,985 |
2.25%, 03/01/31 (a) | 3,850,000 | 3,083,888 |
5.10%, 07/15/32 (a) | 2,175,000 | 2,113,121 |
SECURITY RATE, MATURITY DATE | FACE AMOUNT ($) | VALUE ($) |
Fiserv, Inc. | ||
4.20%, 10/01/28 (a) | 2,925,000 | 2,803,993 |
3.50%, 07/01/29 (a) | 9,000,000 | 8,247,690 |
2.65%, 06/01/30 (a) | 2,950,000 | 2,517,707 |
5.60%, 03/02/33 (a) | 2,700,000 | 2,755,296 |
Flex Ltd. | ||
4.88%, 06/15/29 (a) | 1,850,000 | 1,775,482 |
4.88%, 05/12/30 (a) | 1,950,000 | 1,893,255 |
Fortinet, Inc. | ||
2.20%, 03/15/31 (a) | 1,525,000 | 1,242,311 |
Global Payments, Inc. | ||
3.20%, 08/15/29 (a) | 4,130,000 | 3,591,448 |
5.30%, 08/15/29 (a) | 1,100,000 | 1,075,492 |
2.90%, 05/15/30 (a) | 2,975,000 | 2,523,157 |
2.90%, 11/15/31 (a) | 2,200,000 | 1,795,948 |
5.40%, 08/15/32 (a) | 2,250,000 | 2,194,088 |
HP, Inc. | ||
4.00%, 04/15/29 (a) | 2,975,000 | 2,780,762 |
3.40%, 06/17/30 (a) | 2,475,000 | 2,177,678 |
2.65%, 06/17/31 (a) | 3,275,000 | 2,641,189 |
4.20%, 04/15/32 (a) | 3,050,000 | 2,738,442 |
5.50%, 01/15/33 (a) | 3,100,000 | 3,047,548 |
Intel Corp. | ||
1.60%, 08/12/28 (a) | 2,950,000 | 2,545,673 |
4.00%, 08/05/29 (a) | 2,300,000 | 2,191,417 |
2.45%, 11/15/29 (a) | 5,975,000 | 5,188,630 |
5.13%, 02/10/30 (a) | 3,725,000 | 3,752,975 |
3.90%, 03/25/30 (a) | 4,625,000 | 4,364,982 |
2.00%, 08/12/31 (a) | 3,800,000 | 3,105,246 |
4.15%, 08/05/32 (a) | 3,875,000 | 3,697,835 |
4.00%, 12/15/32 | 2,200,000 | 2,067,450 |
5.20%, 02/10/33 (a) | 6,250,000 | 6,315,500 |
International Business Machines Corp. | ||
3.50%, 05/15/29 | 9,550,000 | 8,831,362 |
1.95%, 05/15/30 (a) | 4,050,000 | 3,362,958 |
2.72%, 02/09/32 (a) | 1,550,000 | 1,327,358 |
4.40%, 07/27/32 (a) | 2,300,000 | 2,210,231 |
5.88%, 11/29/32 | 2,000,000 | 2,140,180 |
4.75%, 02/06/33 (a) | 1,850,000 | 1,817,847 |
Intuit, Inc. | ||
1.65%, 07/15/30 (a) | 1,500,000 | 1,218,975 |
Jabil, Inc. | ||
5.45%, 02/01/29 (a) | 900,000 | 894,411 |
3.60%, 01/15/30 (a) | 1,510,000 | 1,355,376 |
3.00%, 01/15/31 (a) | 1,800,000 | 1,532,610 |
Juniper Networks, Inc. | ||
3.75%, 08/15/29 (a) | 1,500,000 | 1,355,985 |
2.00%, 12/10/30 (a) | 1,225,000 | 952,891 |
Keysight Technologies, Inc. | ||
3.00%, 10/30/29 (a) | 1,525,000 | 1,340,994 |
KLA Corp. | ||
4.10%, 03/15/29 (a) | 2,375,000 | 2,288,550 |
4.65%, 07/15/32 (a) | 3,050,000 | 3,041,094 |
Kyndryl Holdings, Inc. | ||
2.70%, 10/15/28 (a) | 1,400,000 | 1,140,244 |
3.15%, 10/15/31 (a) | 1,975,000 | 1,483,363 |
Lam Research Corp. | ||
4.00%, 03/15/29 (a) | 2,950,000 | 2,852,030 |
1.90%, 06/15/30 (a) | 2,375,000 | 1,980,133 |
Leidos, Inc. | ||
4.38%, 05/15/30 (a) | 2,250,000 | 2,078,955 |
2.30%, 02/15/31 (a) | 2,975,000 | 2,348,495 |
5.75%, 03/15/33 (a) | 2,250,000 | 2,243,700 |
SECURITY RATE, MATURITY DATE | FACE AMOUNT ($) | VALUE ($) |
Marvell Technology, Inc. | ||
2.95%, 04/15/31 (a) | 2,350,000 | 1,971,650 |
Mastercard, Inc. | ||
2.95%, 06/01/29 (a) | 2,975,000 | 2,712,278 |
3.35%, 03/26/30 (a) | 4,525,000 | 4,225,219 |
1.90%, 03/15/31 (a) | 1,750,000 | 1,456,560 |
2.00%, 11/18/31 (a) | 2,400,000 | 1,988,136 |
4.85%, 03/09/33 (a) | 2,175,000 | 2,218,391 |
Micron Technology, Inc. | ||
5.33%, 02/06/29 (a) | 2,125,000 | 2,096,100 |
6.75%, 11/01/29 (a) | 3,750,000 | 3,901,125 |
4.66%, 02/15/30 (a) | 2,575,000 | 2,429,822 |
2.70%, 04/15/32 (a) | 3,025,000 | 2,391,293 |
5.88%, 02/09/33 (a) | 2,200,000 | 2,194,280 |
Moody's Corp. | ||
4.25%, 02/01/29 (a) | 1,225,000 | 1,181,329 |
2.00%, 08/19/31 (a) | 1,750,000 | 1,412,810 |
4.25%, 08/08/32 (a) | 1,450,000 | 1,378,298 |
Motorola Solutions, Inc. | ||
4.60%, 05/23/29 (a) | 2,475,000 | 2,400,725 |
2.30%, 11/15/30 (a) | 2,650,000 | 2,146,845 |
2.75%, 05/24/31 (a) | 2,450,000 | 2,012,602 |
5.60%, 06/01/32 (a) | 2,000,000 | 1,988,640 |
NetApp, Inc. | ||
2.70%, 06/22/30 (a) | 2,100,000 | 1,770,258 |
NVIDIA Corp. | ||
2.85%, 04/01/30 (a) | 4,550,000 | 4,128,715 |
2.00%, 06/15/31 (a) | 3,825,000 | 3,212,273 |
NXP BV/NXP Funding LLC | ||
5.55%, 12/01/28 (a) | 1,725,000 | 1,739,266 |
NXP BV/NXP Funding LLC/NXP USA, Inc. | ||
4.30%, 06/18/29 (a) | 2,900,000 | 2,736,875 |
3.40%, 05/01/30 (a) | 2,925,000 | 2,593,422 |
2.50%, 05/11/31 (a) | 2,900,000 | 2,369,967 |
2.65%, 02/15/32 (a) | 2,900,000 | 2,347,347 |
5.00%, 01/15/33 (a) | 2,900,000 | 2,794,846 |
Oracle Corp. | ||
6.15%, 11/09/29 (a) | 3,700,000 | 3,857,361 |
2.95%, 04/01/30 (a) | 9,650,000 | 8,428,985 |
4.65%, 05/06/30 (a) | 2,250,000 | 2,179,148 |
3.25%, 05/15/30 (a) | 1,575,000 | 1,406,507 |
2.88%, 03/25/31 (a) | 9,950,000 | 8,490,434 |
6.25%, 11/09/32 (a) | 6,850,000 | 7,280,043 |
4.90%, 02/06/33 (a) | 4,050,000 | 3,933,319 |
PayPal Holdings, Inc. | ||
2.85%, 10/01/29 (a) | 4,375,000 | 3,892,262 |
2.30%, 06/01/30 (a) | 3,025,000 | 2,565,744 |
4.40%, 06/01/32 (a) | 3,125,000 | 3,011,906 |
Qorvo, Inc. | ||
4.38%, 10/15/29 (a) | 2,450,000 | 2,221,097 |
QUALCOMM, Inc. | ||
2.15%, 05/20/30 (a) | 3,575,000 | 3,078,254 |
1.65%, 05/20/32 (a) | 3,700,000 | 2,922,889 |
4.25%, 05/20/32 (a) | 1,550,000 | 1,512,831 |
5.40%, 05/20/33 (a) | 2,100,000 | 2,213,778 |
RELX Capital, Inc. | ||
4.00%, 03/18/29 (a) | 2,760,000 | 2,645,377 |
3.00%, 05/22/30 (a) | 2,350,000 | 2,101,065 |
4.75%, 05/20/32 (a) | 1,500,000 | 1,475,820 |
Roper Technologies, Inc. | ||
4.20%, 09/15/28 (a) | 2,500,000 | 2,407,325 |
2.95%, 09/15/29 (a) | 2,075,000 | 1,839,654 |
2.00%, 06/30/30 (a) | 1,775,000 | 1,455,607 |
1.75%, 02/15/31 (a) | 3,050,000 | 2,422,158 |
SECURITY RATE, MATURITY DATE | FACE AMOUNT ($) | VALUE ($) |
S&P Global, Inc. | ||
4.75%, 08/01/28 (a) | 2,050,000 | 2,042,026 |
2.70%, 03/01/29 (a) | 3,750,000 | 3,391,912 |
4.25%, 05/01/29 (a) | 2,700,000 | 2,637,414 |
2.50%, 12/01/29 (a) | 1,500,000 | 1,310,550 |
1.25%, 08/15/30 (a) | 1,750,000 | 1,381,923 |
2.90%, 03/01/32 (a) | 4,475,000 | 3,889,401 |
Salesforce, Inc. | ||
1.50%, 07/15/28 (a) | 2,875,000 | 2,478,595 |
1.95%, 07/15/31 (a) | 4,575,000 | 3,780,597 |
ServiceNow, Inc. | ||
1.40%, 09/01/30 (a) | 4,575,000 | 3,629,073 |
Skyworks Solutions, Inc. | ||
3.00%, 06/01/31 (a) | 1,475,000 | 1,198,482 |
TD SYNNEX Corp. | ||
2.38%, 08/09/28 (a) | 1,725,000 | 1,422,694 |
2.65%, 08/09/31 (a) | 1,550,000 | 1,194,213 |
Teledyne FLIR LLC | ||
2.50%, 08/01/30 (a) | 1,425,000 | 1,181,867 |
Tencent Music Entertainment Group | ||
2.00%, 09/03/30 (a) | 1,500,000 | 1,185,090 |
Texas Instruments, Inc. | ||
2.25%, 09/04/29 (a) | 2,250,000 | 1,965,015 |
1.75%, 05/04/30 (a) | 2,225,000 | 1,870,758 |
1.90%, 09/15/31 (a) | 1,500,000 | 1,233,840 |
3.65%, 08/16/32 (a) | 1,200,000 | 1,116,948 |
4.90%, 03/14/33 (a) | 2,175,000 | 2,231,006 |
Trimble, Inc. | ||
6.10%, 03/15/33 (a) | 2,350,000 | 2,387,788 |
TSMC Arizona Corp. | ||
4.13%, 04/22/29 (a) | 1,500,000 | 1,437,255 |
2.50%, 10/25/31 (a) | 3,725,000 | 3,123,673 |
4.25%, 04/22/32 (a) | 2,950,000 | 2,851,322 |
Tyco Electronics Group S.A. | ||
2.50%, 02/04/32 (a) | 1,800,000 | 1,516,140 |
VeriSign, Inc. | ||
2.70%, 06/15/31 (a) | 2,200,000 | 1,832,842 |
Verisk Analytics, Inc. | ||
4.13%, 03/15/29 (a) | 1,825,000 | 1,746,379 |
5.75%, 04/01/33 (a) | 1,550,000 | 1,623,300 |
Visa, Inc. | ||
2.05%, 04/15/30 (a) | 4,100,000 | 3,521,121 |
1.10%, 02/15/31 (a) | 2,950,000 | 2,333,509 |
VMware, Inc. | ||
1.80%, 08/15/28 (a) | 2,375,000 | 1,997,613 |
4.70%, 05/15/30 (a) | 2,300,000 | 2,199,996 |
2.20%, 08/15/31 (a) | 4,425,000 | 3,481,236 |
Western Digital Corp. | ||
2.85%, 02/01/29 (a) | 1,500,000 | 1,200,450 |
3.10%, 02/01/32 (a) | 1,475,000 | 1,093,373 |
Western Union Co. | ||
2.75%, 03/15/31 (a) | 925,000 | 734,247 |
Workday, Inc. | ||
3.70%, 04/01/29 (a) | 2,250,000 | 2,090,385 |
3.80%, 04/01/32 (a) | 3,750,000 | 3,377,850 |
Xilinx, Inc. | ||
2.38%, 06/01/30 (a) | 2,250,000 | 1,945,463 |
500,440,967 | ||
Transportation 1.5% | ||
American Airlines 2016-3 Class AA Pass-Through Trust | ||
3.00%, 04/15/30 | 1,237,693 | 1,105,285 |
SECURITY RATE, MATURITY DATE | FACE AMOUNT ($) | VALUE ($) |
American Airlines 2017-1 Class AA Pass-Through Trust | ||
3.65%, 08/15/30 | 1,242,500 | 1,141,882 |
American Airlines 2017-2 Class AA Pass-Through Trust | ||
3.35%, 10/15/29 | 1,385,839 | 1,239,660 |
American Airlines 2019-1 Class AA Pass-Through Trust | ||
3.15%, 02/15/32 | 1,590,843 | 1,382,268 |
Canadian National Railway Co. | ||
6.90%, 07/15/28 | 1,360,000 | 1,488,275 |
3.85%, 08/05/32 (a) | 2,500,000 | 2,331,875 |
Canadian Pacific Railway Co. | ||
2.88%, 11/15/29 (a) | 100,000 | 88,717 |
2.05%, 03/05/30 (a) | 1,800,000 | 1,512,954 |
7.13%, 10/15/31 | 1,025,000 | 1,160,587 |
2.45%, 12/02/31 (a) | 4,300,000 | 3,783,097 |
CSX Corp. | ||
4.25%, 03/15/29 (a) | 2,825,000 | 2,740,872 |
2.40%, 02/15/30 (a) | 1,200,000 | 1,036,224 |
4.10%, 11/15/32 (a) | 2,800,000 | 2,653,000 |
FedEx Corp. | ||
4.20%, 10/17/28 (a) | 1,200,000 | 1,157,544 |
3.10%, 08/05/29 (a) | 2,970,000 | 2,679,415 |
4.25%, 05/15/30 (a) | 2,300,000 | 2,203,722 |
2.40%, 05/15/31 (a) | 3,050,000 | 2,534,855 |
GXO Logistics, Inc. | ||
2.65%, 07/15/31 (a) | 1,300,000 | 1,014,312 |
JetBlue 2019-1 Class AA Pass-Through Trust | ||
2.75%, 05/15/32 | 1,472,613 | 1,247,465 |
JetBlue 2020-1 Class A Pass-Through Trust | ||
Series 1A 4.00%, 11/15/32 (c) | 1,746,536 | 1,592,195 |
Norfolk Southern Corp. | ||
3.80%, 08/01/28 (a) | 1,750,000 | 1,658,038 |
2.55%, 11/01/29 (a) | 1,175,000 | 1,016,516 |
2.30%, 05/15/31 (a) | 1,500,000 | 1,249,530 |
3.00%, 03/15/32 (a) | 1,875,000 | 1,615,144 |
4.45%, 03/01/33 (a) | 1,500,000 | 1,437,060 |
Southwest Airlines Co. | ||
2.63%, 02/10/30 (a) | 2,060,000 | 1,758,004 |
Spirit Airlines Pass-Through Trust 2015-1A | ||
4.10%, 04/01/28 | 29,369 | 26,954 |
Triton Container International Ltd./TAL International Container Corp. | ||
3.25%, 03/15/32 (a) | 1,800,000 | 1,415,376 |
Union Pacific Corp. | ||
3.95%, 09/10/28 (a) | 3,500,000 | 3,394,545 |
6.63%, 02/01/29 | 1,125,000 | 1,228,511 |
3.70%, 03/01/29 (a) | 2,350,000 | 2,248,598 |
2.40%, 02/05/30 (a) | 2,425,000 | 2,113,315 |
2.38%, 05/20/31 (a) | 2,925,000 | 2,478,177 |
2.80%, 02/14/32 (a) | 3,875,000 | 3,349,589 |
4.50%, 01/20/33 (a) | 2,750,000 | 2,708,283 |
United Airlines 2016-1 Class AA Pass-Through Trust | ||
3.10%, 07/07/28 | 1,490,553 | 1,346,014 |
United Airlines 2016-2 Class AA Pass-Through Trust | ||
2.88%, 10/07/28 | 1,489,444 | 1,316,951 |
United Airlines 2018-1 Class AA Pass-Through Trust | ||
3.50%, 03/01/30 | 1,705,920 | 1,541,503 |
United Airlines 2019-1 Class AA Pass-Through Trust | ||
4.15%, 08/25/31 | 37,504 | 34,461 |
United Airlines 2019-2 Class AA Pass-Through Trust | ||
2.70%, 05/01/32 | 1,760,945 | 1,491,238 |
United Parcel Service, Inc. | ||
3.40%, 03/15/29 (a) | 2,000,000 | 1,892,800 |
2.50%, 09/01/29 (a) | 1,175,000 | 1,042,813 |
SECURITY RATE, MATURITY DATE | FACE AMOUNT ($) | VALUE ($) |
4.45%, 04/01/30 (a) | 2,400,000 | 2,392,008 |
4.88%, 03/03/33 (a) | 2,750,000 | 2,782,642 |
75,632,274 | ||
2,829,775,720 | ||
Utility 8.0% | ||
Electric 7.1% | ||
AEP Texas, Inc. | ||
2.10%, 07/01/30 (a) | 2,000,000 | 1,640,220 |
4.70%, 05/15/32 (a) | 1,575,000 | 1,511,984 |
5.40%, 06/01/33 (a) | 1,000,000 | 995,690 |
AES Corp. | ||
2.45%, 01/15/31 (a) | 3,000,000 | 2,429,580 |
Alabama Power Co. | ||
1.45%, 09/15/30 (a) | 1,750,000 | 1,387,662 |
3.05%, 03/15/32 (a) | 2,025,000 | 1,766,569 |
3.94%, 09/01/32 (a) | 1,350,000 | 1,252,449 |
Ameren Corp. | ||
3.50%, 01/15/31 (a) | 2,550,000 | 2,283,703 |
Ameren Illinois Co. | ||
1.55%, 11/15/30 (a) | 1,050,000 | 832,325 |
3.85%, 09/01/32 (a) | 1,500,000 | 1,384,020 |
4.95%, 06/01/33 (a) | 1,200,000 | 1,191,744 |
American Electric Power Co., Inc. | ||
4.30%, 12/01/28 (a) | 1,775,000 | 1,698,071 |
2.30%, 03/01/30 (a) | 1,125,000 | 935,663 |
5.95%, 11/01/32 (a) | 1,475,000 | 1,542,481 |
5.63%, 03/01/33 (a) | 2,700,000 | 2,753,001 |
Appalachian Power Co. | ||
2.70%, 04/01/31 (a) | 1,625,000 | 1,356,209 |
4.50%, 08/01/32 (a) | 1,500,000 | 1,411,635 |
Arizona Public Service Co. | ||
2.60%, 08/15/29 (a) | 1,150,000 | 988,575 |
2.20%, 12/15/31 (a) | 1,375,000 | 1,079,031 |
6.35%, 12/15/32 (a) | 1,250,000 | 1,326,875 |
Atlantic City Electric Co. | ||
4.00%, 10/15/28 (a) | 1,050,000 | 1,001,249 |
2.30%, 03/15/31 (a) | 1,350,000 | 1,123,092 |
Avangrid, Inc. | ||
3.80%, 06/01/29 (a) | 2,250,000 | 2,060,865 |
Baltimore Gas and Electric Co. | ||
2.25%, 06/15/31 (a) | 1,775,000 | 1,479,640 |
Berkshire Hathaway Energy Co. | ||
3.70%, 07/15/30 (a) | 3,275,000 | 3,010,478 |
1.65%, 05/15/31 (a) | 1,525,000 | 1,187,899 |
Black Hills Corp. | ||
3.05%, 10/15/29 (a) | 1,125,000 | 967,601 |
2.50%, 06/15/30 (a) | 1,400,000 | 1,157,702 |
4.35%, 05/01/33 (a) | 1,000,000 | 894,430 |
CenterPoint Energy Houston Electric LLC | ||
2.35%, 04/01/31 (a) | 1,125,000 | 947,801 |
3.00%, 03/01/32 (a) | 900,000 | 779,382 |
4.45%, 10/01/32 (a) | 1,550,000 | 1,497,098 |
6.95%, 03/15/33 | 950,000 | 1,090,876 |
4.95%, 04/01/33 (a) | 1,600,000 | 1,603,216 |
CenterPoint Energy, Inc. | ||
4.25%, 11/01/28 (a) | 20,000 | 18,784 |
2.95%, 03/01/30 (a) | 1,305,000 | 1,137,777 |
2.65%, 06/01/31 (a) | 1,450,000 | 1,214,448 |
CMS Energy Corp. | ||
4.75%, 06/01/50 (a)(b) | 1,475,000 | 1,274,002 |
3.75%, 12/01/50 (a)(b) | 1,125,000 | 867,499 |
SECURITY RATE, MATURITY DATE | FACE AMOUNT ($) | VALUE ($) |
Commonwealth Edison Co. | ||
3.70%, 08/15/28 (a) | 1,600,000 | 1,511,584 |
2.20%, 03/01/30 (a) | 1,060,000 | 898,445 |
3.15%, 03/15/32 (a) | 825,000 | 728,954 |
4.90%, 02/01/33 (a) | 1,250,000 | 1,248,038 |
Connecticut Light and Power Co. | ||
2.05%, 07/01/31 (a) | 1,300,000 | 1,060,293 |
Consolidated Edison Co. of New York, Inc. | ||
4.00%, 12/01/28 (a) | 1,483,000 | 1,421,559 |
3.35%, 04/01/30 (a) | 1,825,000 | 1,663,579 |
2.40%, 06/15/31 (a) | 2,650,000 | 2,207,582 |
5.20%, 03/01/33 (a) | 1,500,000 | 1,519,845 |
Constellation Energy Generation LLC | ||
5.80%, 03/01/33 (a) | 1,800,000 | 1,854,162 |
Consumers Energy Co. | ||
3.80%, 11/15/28 (a) | 925,000 | 874,097 |
3.60%, 08/15/32 (a) | 1,050,000 | 949,284 |
4.63%, 05/15/33 (a) | 2,000,000 | 1,953,660 |
Dominion Energy South Carolina, Inc. | ||
2.30%, 12/01/31 (a) | 350,000 | 285,768 |
6.63%, 02/01/32 | 850,000 | 940,568 |
5.30%, 05/15/33 | 1,150,000 | 1,163,685 |
Dominion Energy, Inc. | ||
3.38%, 04/01/30 (a) | 4,425,000 | 3,962,587 |
2.25%, 08/15/31 (a) | 2,540,000 | 2,053,615 |
4.35%, 08/15/32 (a) | 1,150,000 | 1,077,355 |
5.38%, 11/15/32 (a) | 2,975,000 | 2,994,218 |
6.30%, 03/15/33 | 975,000 | 1,039,448 |
DTE Electric Co. | ||
2.25%, 03/01/30 (a) | 1,825,000 | 1,559,298 |
2.63%, 03/01/31 (a) | 1,900,000 | 1,627,179 |
3.00%, 03/01/32 (a) | 1,550,000 | 1,336,317 |
5.20%, 04/01/33 (a) | 1,600,000 | 1,631,584 |
DTE Energy Co. | ||
3.40%, 06/15/29 (a) | 1,400,000 | 1,254,596 |
2.95%, 03/01/30 (a) | 900,000 | 782,352 |
Duke Energy Carolinas LLC | ||
3.95%, 11/15/28 (a) | 1,950,000 | 1,867,261 |
6.00%, 12/01/28 | 125,000 | 131,214 |
2.45%, 08/15/29 (a) | 1,350,000 | 1,168,479 |
2.45%, 02/01/30 (a) | 1,500,000 | 1,291,575 |
2.55%, 04/15/31 (a) | 1,750,000 | 1,489,862 |
2.85%, 03/15/32 (a) | 1,500,000 | 1,278,165 |
6.45%, 10/15/32 | 1,000,000 | 1,084,730 |
4.95%, 01/15/33 (a) | 3,775,000 | 3,756,804 |
Duke Energy Corp. | ||
3.40%, 06/15/29 (a) | 1,735,000 | 1,570,938 |
2.45%, 06/01/30 (a) | 2,625,000 | 2,207,336 |
2.55%, 06/15/31 (a) | 3,000,000 | 2,492,610 |
4.50%, 08/15/32 (a) | 3,600,000 | 3,403,404 |
Duke Energy Florida LLC | ||
3.80%, 07/15/28 (a) | 1,700,000 | 1,622,327 |
2.50%, 12/01/29 (a) | 2,050,000 | 1,775,156 |
1.75%, 06/15/30 (a) | 1,500,000 | 1,222,995 |
2.40%, 12/15/31 (a) | 1,940,000 | 1,597,105 |
Duke Energy Ohio, Inc. | ||
3.65%, 02/01/29 (a) | 1,200,000 | 1,117,296 |
2.13%, 06/01/30 (a) | 1,525,000 | 1,268,480 |
5.25%, 04/01/33 (a) | 1,175,000 | 1,188,806 |
Duke Energy Progress LLC | ||
3.70%, 09/01/28 (a) | 1,500,000 | 1,420,620 |
3.45%, 03/15/29 (a) | 1,800,000 | 1,656,450 |
2.00%, 08/15/31 (a) | 1,950,000 | 1,572,265 |
3.40%, 04/01/32 (a) | 1,550,000 | 1,374,261 |
5.25%, 03/15/33 (a) | 1,625,000 | 1,655,550 |
SECURITY RATE, MATURITY DATE | FACE AMOUNT ($) | VALUE ($) |
Edison International | ||
5.25%, 11/15/28 (a) | 1,500,000 | 1,463,655 |
6.95%, 11/15/29 (a) | 1,900,000 | 2,003,474 |
Emera US Finance LP | ||
2.64%, 06/15/31 (a) | 1,350,000 | 1,085,751 |
Entergy Arkansas LLC | ||
5.15%, 01/15/33 (a) | 1,250,000 | 1,257,500 |
Entergy Corp. | ||
2.80%, 06/15/30 (a) | 1,775,000 | 1,508,253 |
2.40%, 06/15/31 (a) | 1,925,000 | 1,561,387 |
Entergy Louisiana LLC | ||
1.60%, 12/15/30 (a) | 975,000 | 764,400 |
3.05%, 06/01/31 (a) | 1,050,000 | 914,099 |
2.35%, 06/15/32 (a) | 1,500,000 | 1,208,355 |
4.00%, 03/15/33 (a) | 2,325,000 | 2,118,819 |
Entergy Texas, Inc. | ||
4.00%, 03/30/29 (a) | 925,000 | 873,071 |
1.75%, 03/15/31 (a) | 1,950,000 | 1,547,052 |
Evergy Metro, Inc. | ||
2.25%, 06/01/30 (a) | 1,175,000 | 980,432 |
4.95%, 04/15/33 (a) | 850,000 | 837,939 |
Evergy, Inc. | ||
2.90%, 09/15/29 (a) | 2,375,000 | 2,074,040 |
Eversource Energy | ||
4.25%, 04/01/29 (a) | 1,450,000 | 1,384,823 |
1.65%, 08/15/30 (a) | 1,875,000 | 1,495,537 |
2.55%, 03/15/31 (a) | 1,000,000 | 833,330 |
3.38%, 03/01/32 (a) | 1,925,000 | 1,685,010 |
5.13%, 05/15/33 (a) | 2,100,000 | 2,075,514 |
Exelon Corp. | ||
4.05%, 04/15/30 (a) | 3,725,000 | 3,495,726 |
3.35%, 03/15/32 (a) | 1,925,000 | 1,677,098 |
5.30%, 03/15/33 (a) | 2,550,000 | 2,554,768 |
Florida Power & Light Co. | ||
4.63%, 05/15/30 (a) | 1,350,000 | 1,332,018 |
2.45%, 02/03/32 (a) | 4,425,000 | 3,730,540 |
5.10%, 04/01/33 (a) | 2,200,000 | 2,240,150 |
4.80%, 05/15/33 (a) | 2,000,000 | 1,988,060 |
Georgia Power Co. | ||
2.65%, 09/15/29 (a) | 2,495,000 | 2,161,044 |
4.70%, 05/15/32 (a) | 2,050,000 | 1,983,723 |
4.95%, 05/17/33 (a) | 2,900,000 | 2,866,418 |
Interstate Power and Light Co. | ||
4.10%, 09/26/28 (a) | 1,600,000 | 1,514,432 |
3.60%, 04/01/29 (a) | 1,000,000 | 917,600 |
2.30%, 06/01/30 (a) | 1,275,000 | 1,062,419 |
IPALCO Enterprises, Inc. | ||
4.25%, 05/01/30 (a) | 1,325,000 | 1,200,490 |
Kentucky Utilities Co. | ||
5.45%, 04/15/33 (a) | 1,000,000 | 1,020,410 |
Louisville Gas & Electric Co. | ||
5.45%, 04/15/33 (a) | 1,325,000 | 1,352,719 |
MidAmerican Energy Co. | ||
3.65%, 04/15/29 (a) | 2,550,000 | 2,373,693 |
6.75%, 12/30/31 | 1,175,000 | 1,310,442 |
National Grid PLC | ||
5.81%, 06/12/33 (a) | 2,400,000 | 2,444,112 |
National Rural Utilities Cooperative Finance Corp. | ||
3.90%, 11/01/28 (a) | 1,000,000 | 944,940 |
3.70%, 03/15/29 (a) | 1,300,000 | 1,208,246 |
2.40%, 03/15/30 (a) | 1,525,000 | 1,294,085 |
1.35%, 03/15/31 (a) | 1,150,000 | 878,520 |
1.65%, 06/15/31 (a) | 1,000,000 | 778,220 |
8.00%, 03/01/32 | 1,350,000 | 1,586,263 |
SECURITY RATE, MATURITY DATE | FACE AMOUNT ($) | VALUE ($) |
2.75%, 04/15/32 (a) | 1,575,000 | 1,315,913 |
4.02%, 11/01/32 (a) | 1,750,000 | 1,608,337 |
4.15%, 12/15/32 (a) | 1,200,000 | 1,124,280 |
5.80%, 01/15/33 (a) | 2,025,000 | 2,124,225 |
7.13%, 09/15/53 (a)(b) | 750,000 | 752,723 |
Nevada Power Co. | ||
3.70%, 05/01/29 (a) | 1,500,000 | 1,395,915 |
2.40%, 05/01/30 (a) | 1,300,000 | 1,100,398 |
NextEra Energy Capital Holdings, Inc. | ||
3.50%, 04/01/29 (a) | 1,550,000 | 1,420,451 |
2.75%, 11/01/29 (a) | 3,125,000 | 2,718,219 |
5.00%, 02/28/30 (a) | 1,800,000 | 1,781,586 |
2.25%, 06/01/30 (a) | 6,002,000 | 4,994,504 |
2.44%, 01/15/32 (a) | 3,175,000 | 2,581,370 |
5.00%, 07/15/32 (a) | 2,900,000 | 2,865,142 |
5.05%, 02/28/33 (a) | 2,900,000 | 2,866,418 |
5.65%, 05/01/79 (a)(b) | 1,500,000 | 1,397,115 |
Northern States Power Co. | ||
2.25%, 04/01/31 (a) | 1,300,000 | 1,085,422 |
NSTAR Electric Co. | ||
3.25%, 05/15/29 (a) | 1,300,000 | 1,193,491 |
3.95%, 04/01/30 (a) | 1,275,000 | 1,209,070 |
1.95%, 08/15/31 (a) | 825,000 | 663,762 |
Ohio Power Co. | ||
2.60%, 04/01/30 (a) | 1,025,000 | 881,654 |
1.63%, 01/15/31 (a) | 1,350,000 | 1,067,864 |
5.00%, 06/01/33 (a) | 1,000,000 | 985,480 |
Oklahoma Gas and Electric Co. | ||
3.80%, 08/15/28 (a) | 1,125,000 | 1,066,084 |
3.30%, 03/15/30 (a) | 830,000 | 747,473 |
3.25%, 04/01/30 (a) | 1,075,000 | 960,534 |
5.40%, 01/15/33 (a) | 1,375,000 | 1,399,970 |
Oncor Electric Delivery Co. LLC | ||
3.70%, 11/15/28 (a) | 1,875,000 | 1,772,569 |
5.75%, 03/15/29 (a) | 1,000,000 | 1,041,570 |
2.75%, 05/15/30 (a) | 2,050,000 | 1,799,203 |
7.00%, 05/01/32 | 1,450,000 | 1,647,635 |
4.15%, 06/01/32 (a) | 1,200,000 | 1,147,056 |
4.55%, 09/15/32 (a) | 2,150,000 | 2,095,433 |
7.25%, 01/15/33 | 950,000 | 1,104,071 |
Pacific Gas & Electric Co. | ||
6.10%, 01/15/29 (a) | 2,500,000 | 2,462,250 |
6.40%, 06/15/33 (a) | 3,400,000 | 3,381,844 |
Pacific Gas and Electric Co. | ||
3.75%, 07/01/28 | 2,703,000 | 2,433,754 |
4.65%, 08/01/28 (a) | 850,000 | 789,276 |
4.20%, 03/01/29 (a) | 1,200,000 | 1,081,116 |
4.55%, 07/01/30 (a) | 9,400,000 | 8,512,452 |
2.50%, 02/01/31 (a) | 5,875,000 | 4,612,991 |
3.25%, 06/01/31 (a) | 2,875,000 | 2,341,687 |
4.40%, 03/01/32 (a) | 325,000 | 282,575 |
5.90%, 06/15/32 (a) | 1,850,000 | 1,782,660 |
6.15%, 01/15/33 (a) | 2,875,000 | 2,828,396 |
PacifiCorp | ||
3.50%, 06/15/29 (a) | 1,200,000 | 1,077,972 |
2.70%, 09/15/30 (a) | 1,250,000 | 1,043,300 |
7.70%, 11/15/31 | 900,000 | 1,003,545 |
PECO Energy Co. | ||
4.90%, 06/15/33 (a) | 1,500,000 | 1,497,150 |
PPL Capital Funding, Inc. | ||
4.13%, 04/15/30 (a) | 1,300,000 | 1,210,248 |
PPL Electric Utilities Corp. | ||
5.00%, 05/15/33 (a) | 1,800,000 | 1,808,046 |
SECURITY RATE, MATURITY DATE | FACE AMOUNT ($) | VALUE ($) |
Progress Energy, Inc. | ||
7.75%, 03/01/31 | 1,975,000 | 2,245,239 |
7.00%, 10/30/31 | 1,150,000 | 1,262,447 |
Public Service Co. of Colorado | ||
1.90%, 01/15/31 (a) | 1,175,000 | 952,373 |
1.88%, 06/15/31 (a) | 2,200,000 | 1,756,876 |
4.10%, 06/01/32 (a) | 900,000 | 838,665 |
Public Service Co. of New Hampshire | ||
2.20%, 06/15/31 (a) | 1,050,000 | 870,996 |
Public Service Co. of Oklahoma | ||
2.20%, 08/15/31 (a) | 1,200,000 | 975,432 |
5.25%, 01/15/33 (a) | 1,400,000 | 1,396,626 |
Public Service Electric & Gas Co. | ||
4.65%, 03/15/33 (a) | 950,000 | 934,306 |
Public Service Electric and Gas Co. | ||
3.65%, 09/01/28 (a) | 950,000 | 889,438 |
3.20%, 05/15/29 (a) | 1,050,000 | 950,849 |
2.45%, 01/15/30 (a) | 965,000 | 834,387 |
1.90%, 08/15/31 (a) | 1,375,000 | 1,106,586 |
3.10%, 03/15/32 (a) | 1,500,000 | 1,311,885 |
4.90%, 12/15/32 (a) | 1,175,000 | 1,177,855 |
Public Service Enterprise Group, Inc. | ||
1.60%, 08/15/30 (a) | 1,675,000 | 1,313,971 |
2.45%, 11/15/31 (a) | 2,675,000 | 2,167,552 |
Puget Energy, Inc. | ||
4.10%, 06/15/30 (a) | 1,800,000 | 1,642,176 |
4.22%, 03/15/32 (a) | 1,350,000 | 1,215,905 |
San Diego Gas & Electric Co. | ||
1.70%, 10/01/30 (a) | 2,400,000 | 1,927,440 |
3.00%, 03/15/32 (a) | 1,450,000 | 1,245,594 |
Southern California Edison Co. | ||
4.20%, 03/01/29 (a) | 1,550,000 | 1,476,375 |
6.65%, 04/01/29 | 850,000 | 888,174 |
2.85%, 08/01/29 (a) | 1,550,000 | 1,362,559 |
2.25%, 06/01/30 (a) | 1,650,000 | 1,381,809 |
2.50%, 06/01/31 (a) | 1,275,000 | 1,062,802 |
2.75%, 02/01/32 (a) | 1,500,000 | 1,255,275 |
5.95%, 11/01/32 (a) | 2,225,000 | 2,335,849 |
Southwestern Electric Power Co. | ||
4.10%, 09/15/28 (a) | 1,875,000 | 1,783,706 |
5.30%, 04/01/33 (a) | 1,000,000 | 990,900 |
Tampa Electric Co. | ||
2.40%, 03/15/31 (a) | 1,200,000 | 986,424 |
The Southern Co. | ||
3.70%, 04/30/30 (a) | 3,025,000 | 2,780,852 |
5.70%, 10/15/32 (a) | 1,475,000 | 1,532,643 |
5.20%, 06/15/33 (a) | 2,000,000 | 1,987,160 |
Tucson Electric Power Co. | ||
1.50%, 08/01/30 (a) | 900,000 | 713,097 |
3.25%, 05/15/32 (a) | 950,000 | 829,749 |
Union Electric Co. | ||
3.50%, 03/15/29 (a) | 1,325,000 | 1,223,704 |
2.95%, 03/15/30 (a) | 1,400,000 | 1,244,670 |
2.15%, 03/15/32 (a) | 1,550,000 | 1,244,325 |
Virginia Electric & Power Co. | ||
5.00%, 04/01/33 (a) | 2,300,000 | 2,276,862 |
Virginia Electric and Power Co. | ||
2.88%, 07/15/29 (a) | 1,500,000 | 1,334,640 |
2.30%, 11/15/31 (a) | 1,450,000 | 1,183,026 |
2.40%, 03/30/32 (a) | 1,725,000 | 1,424,850 |
WEC Energy Group, Inc. | ||
2.20%, 12/15/28 (a) | 1,450,000 | 1,250,828 |
1.80%, 10/15/30 (a) | 1,350,000 | 1,077,692 |
SECURITY RATE, MATURITY DATE | FACE AMOUNT ($) | VALUE ($) |
Wisconsin Electric Power Co. | ||
4.75%, 09/30/32 (a) | 1,500,000 | 1,473,690 |
5.63%, 05/15/33 | 1,050,000 | 1,091,066 |
Wisconsin Power & Light Co. | ||
4.95%, 04/01/33 (a) | 750,000 | 744,390 |
Wisconsin Power and Light Co. | ||
3.00%, 07/01/29 (a) | 1,000,000 | 899,490 |
1.95%, 09/16/31 (a) | 875,000 | 696,526 |
3.95%, 09/01/32 (a) | 1,900,000 | 1,760,711 |
Xcel Energy, Inc. | ||
2.60%, 12/01/29 (a) | 1,500,000 | 1,285,860 |
3.40%, 06/01/30 (a) | 1,850,000 | 1,650,607 |
2.35%, 11/15/31 (a) | 875,000 | 698,276 |
4.60%, 06/01/32 (a) | 2,100,000 | 1,989,435 |
366,482,063 | ||
Natural Gas 0.6% | ||
Atmos Energy Corp. | ||
2.63%, 09/15/29 (a) | 1,475,000 | 1,305,463 |
1.50%, 01/15/31 (a) | 1,750,000 | 1,381,800 |
5.45%, 10/15/32 (a) | 900,000 | 931,977 |
CenterPoint Energy Resources Corp. | ||
1.75%, 10/01/30 (a) | 1,475,000 | 1,184,322 |
4.40%, 07/01/32 (a) | 1,475,000 | 1,414,112 |
5.40%, 03/01/33 (a) | 1,825,000 | 1,859,164 |
NiSource, Inc. | ||
2.95%, 09/01/29 (a) | 2,450,000 | 2,149,728 |
3.60%, 05/01/30 (a) | 2,975,000 | 2,687,674 |
1.70%, 02/15/31 (a) | 2,250,000 | 1,766,250 |
5.40%, 06/30/33 (a) | 1,200,000 | 1,204,836 |
ONE Gas, Inc. | ||
2.00%, 05/15/30 (a) | 900,000 | 747,918 |
4.25%, 09/01/32 (a) | 875,000 | 828,109 |
Piedmont Natural Gas Co., Inc. | ||
3.50%, 06/01/29 (a) | 1,775,000 | 1,612,250 |
2.50%, 03/15/31 (a) | 1,300,000 | 1,065,233 |
5.40%, 06/15/33 (a) | 750,000 | 748,815 |
Sempra Energy | ||
3.70%, 04/01/29 (a) | 1,475,000 | 1,353,150 |
Southern California Gas Co. | ||
2.55%, 02/01/30 (a) | 2,475,000 | 2,133,871 |
5.20%, 06/01/33 (a) | 1,250,000 | 1,235,938 |
Southern Co. Gas Capital Corp. | ||
1.75%, 01/15/31 (a) | 1,400,000 | 1,101,450 |
5.15%, 09/15/32 (a) | 1,475,000 | 1,467,994 |
Southwest Gas Corp. | ||
2.20%, 06/15/30 (a) | 1,325,000 | 1,077,715 |
4.05%, 03/15/32 (a) | 1,775,000 | 1,601,902 |
Spire Missouri, Inc. | ||
4.80%, 02/15/33 (a) | 1,125,000 | 1,111,860 |
31,971,531 | ||
Utility Other 0.3% | ||
American Water Capital Corp. | ||
3.75%, 09/01/28 (a) | 1,850,000 | 1,751,635 |
3.45%, 06/01/29 (a) | 1,600,000 | 1,486,688 |
2.80%, 05/01/30 (a) | 1,600,000 | 1,401,808 |
2.30%, 06/01/31 (a) | 1,625,000 | 1,352,293 |
4.45%, 06/01/32 (a) | 2,350,000 | 2,278,936 |
Essential Utilities, Inc. | ||
3.57%, 05/01/29 (a) | 1,175,000 | 1,071,412 |
2.70%, 04/15/30 (a) | 1,625,000 | 1,378,926 |
2.40%, 05/01/31 (a) | 1,125,000 | 915,469 |
SECURITY RATE, MATURITY DATE | FACE AMOUNT ($) | VALUE ($) |
United Utilities plc | ||
6.88%, 08/15/28 | 1,175,000 | 1,269,529 |
12,906,696 | ||
411,360,290 | ||
Total Corporates (Cost $5,141,514,244) | 5,052,749,470 | |
SECURITY | NUMBER OF SHARES | VALUE ($) |
SHORT-TERM INVESTMENTS 0.5% OF NET ASSETS | ||
Money Market Funds 0.5% | ||
State Street Institutional U.S. Government Money Market Fund, Premier Class 5.03% (h) | 7,053,687 | 7,053,687 |
State Street Institutional U.S. Government Money Market Fund, Premier Class 5.03% (h)(i) | 18,957,435 | 18,957,435 |
26,011,122 | ||
Total Short-Term Investments (Cost $26,011,122) | 26,011,122 | |
Total Investments in Securities (Cost $5,167,525,366) | 5,078,760,592 | |
NUMBER OF CONTRACTS | NOTIONAL AMOUNT ($) | CURRENT VALUE/ UNREALIZED APPRECIATION (DEPRECIATION) ($) | |
FUTURES CONTRACTS | |||
Long | |||
10 Year US Treasury Notes Ultra Futures, expires 09/20/23 | 7 | 829,062 | (9,307 ) |
5 Year US Treasury Notes (CBOT), expires 09/29/23 | 140 | 14,993,125 | (237,378 ) |
(246,685 ) | |||
Short | |||
10 Year US Treasury Notes (CBOT), expires 09/20/23 | (130 ) | (14,594,531 ) | 269,803 |
Total Net Unrealized Appreciation on Futures Contracts | 23,118 | ||
(a) | The effective maturity may be shorter than the final maturity shown because of the possibility of interim principal payments and prepayments or as the result of embedded demand features (puts or calls). |
(b) | Security is in a fixed rate coupon period. Based on index eligibility requirements and the fund’s investment objective this security will be removed from the index prior to converting to a floating rate security. |
(c) | All or a portion of this security is on loan. Securities on loan were valued at $18,532,058. |
(d) | Issuer is affiliated with the fund’s investment adviser. |
(e) | Securities exempt from registration under Rule 144A of the Securities Act of 1933, as amended. These securities may be resold in transactions exempt from registrations, normally to qualified institutional buyers. At the period end, the value of these amounted to $71,465,890 or 1.4% of net assets. |
(f) | Interest rate is subject to adjustments from time to time if a nationally recognized statistical rating organization downgrades (or subsequently upgrades) the debt rating assigned to the bond. |
(g) | Step up security that pays an initial coupon rate for a set period and increased coupon rates at one or more preset intervals. Rate shown is as of period end. |
(h) | The rate shown is the annualized 7-day yield. |
(i) | Security purchased with cash collateral received for securities on loan. |
CBOT — | Chicago Board of Trade |
REIT — | Real Estate Investment Trust |
SECURITY RATE, MATURITY DATE | VALUE AT 12/31/22 | PURCHASES | SALES | REALIZED GAINS (LOSSES) | NET CHANGE IN UNREALIZED APPRECIATION (DEPRECIATION) | ACCRETION OF DISCOUNTS (AMORTIZATION OF PREMIUMS) | VALUE AT 6/30/23 | FACE AMOUNT AT 6/30/23 | INTEREST INCOME EARNED |
CORPORATES 0.3% OF NET ASSETS | |||||||||
Financial Institutions 0.3% | |||||||||
Brokerage/Asset Managers/Exchanges 0.3% | |||||||||
The Charles Schwab Corp. | |||||||||
3.20%, 01/25/28 | $93,366 | $— | ($95,403) | ($11,008) | $13,159 | ($114) | $— | $— | $275 |
2.00%, 03/20/28 | 219,822 | — | (215,029) | (31,647) | 26,718 | 136 | — | — | 1,292 |
4.00%, 02/01/29 | 95,256 | 1,550,495 | — | — | (25,195) | 1,996 | 1,622,552 | 1,725,000 | 18,325 |
3.25%, 05/22/29 | 95,357 | 1,469,553 | — | — | (23,709) | 5,712 | 1,546,913 | 1,750,000 | 15,081 |
2.75%, 10/01/29 | 65,514 | 1,037,711 | — | — | (21,178) | 5,197 | 1,087,244 | 1,275,000 | 9,396 |
4.63%, 03/22/30 | 73,735 | 1,344,014 | (23,969) | 8 | 29,303 | 1,244 | 1,424,335 | 1,450,000 | 17,681 |
1.65%, 03/11/31 | 97,482 | 1,578,849 | — | — | (14,578) | 12,540 | 1,674,293 | 2,175,000 | 9,568 |
2.30%, 05/13/31 | 102,387 | 1,651,114 | — | — | (28,302) | 9,733 | 1,734,932 | 2,175,000 | 12,989 |
1.95%, 12/01/31 | 125,647 | 1,795,383 | — | — | (38,864) | 12,970 | 1,895,136 | 2,485,000 | 12,912 |
2.90%, 03/03/32 | 165,959 | 2,311,103 | (20,497) | (228) | (26,493) | 10,530 | 2,440,374 | 2,945,000 | 22,634 |
5.85%, 05/19/34 | — | 3,549,990 | — | — | 5,578 | (163) | 3,555,405 | 3,500,000 | 9,348 |
Total | $1,134,525 | $16,288,212 | ($354,898 ) | ($42,875 ) | ($103,561 ) | $59,781 | $16,981,184 | $129,501 | |
DESCRIPTION | QUOTED PRICES IN ACTIVE MARKETS FOR IDENTICAL ASSETS (LEVEL 1) | OTHER SIGNIFICANT OBSERVABLE INPUTS (LEVEL 2) | SIGNIFICANT UNOBSERVABLE INPUTS (LEVEL 3) | TOTAL |
Assets | ||||
Corporates1 | $— | $5,052,749,470 | $— | $5,052,749,470 |
Short-Term Investments1 | 26,011,122 | — | — | 26,011,122 |
Futures Contracts2 | 269,803 | — | — | 269,803 |
Liabilities | ||||
Futures Contracts2 | (246,685 ) | — | — | (246,685 ) |
Total | $26,034,240 | $5,052,749,470 | $— | $5,078,783,710 |
1 | As categorized in the Portfolio Holdings. |
2 | Futures contracts are reported at cumulative unrealized appreciation or depreciation. |
Assets | ||
Investments in securities, at value - affiliated (cost $17,268,682) | $16,981,184 | |
Investments in securities, at value - unaffiliated (cost $5,150,256,684) including securities on loan of $18,532,058 | 5,061,779,408 | |
Deposit with broker for futures contracts | 1,697,025 | |
Receivables: | ||
Investments sold | 108,219,775 | |
Interest | 55,269,570 | |
Income from securities on loan | 52,105 | |
Dividends | 34,374 | |
Foreign tax reclaims | + | 3,328 |
Total assets | 5,244,036,769 | |
Liabilities | ||
Collateral held for securities on loan | 18,957,435 | |
Payables: | ||
Investments bought | 93,610,226 | |
Management fees | 125,525 | |
Variation margin on futures contracts | + | 16,199 |
Total liabilities | 112,709,385 | |
Net assets | $5,131,327,384 | |
Net Assets by Source | ||
Capital received from investors | $5,216,921,311 | |
Total distributable loss | + | (85,593,927 ) |
Net assets | $5,131,327,384 | |
Net Asset Value (NAV) | ||||
Net Assets | ÷ | Shares Outstanding | = | NAV |
$5,131,327,384 | 116,700,000 | $43.97 | ||
For the period January 1, 2023 through June 30, 2023; unaudited | ||
Investment Income | ||
Interest received from securities - unaffiliated | $66,694,276 | |
Interest received from securities - affiliated | 189,282 | |
Dividends received from securities - unaffiliated | 125,377 | |
Securities on loan, net | + | 130,089 |
Total investment income | 67,139,024 | |
Expenses | ||
Management fees | 410,530 | |
Total expenses | – | 410,530 |
Net investment income | 66,728,494 | |
REALIZED AND UNREALIZED GAINS (LOSSES) | ||
Net realized losses on sales of securities - affiliated | (42,655 ) | |
Net realized losses on sales of securities - unaffiliated | (11,522,216 ) | |
Net realized losses on sales of in-kind redemptions - affiliated | (220 ) | |
Net realized losses on sales of in-kind redemptions - unaffiliated | (10,557 ) | |
Net realized losses on futures contracts | + | (753,088 ) |
Net realized losses | (12,328,736 ) | |
Net change in unrealized appreciation (depreciation) on securities - affiliated | (103,561 ) | |
Net change in unrealized appreciation (depreciation) on securities - unaffiliated | (37,637,042 ) | |
Net change in unrealized appreciation (depreciation) on futures contracts | + | 23,118 |
Net change in unrealized appreciation (depreciation) | + | (37,717,485 ) |
Net realized and unrealized losses | (50,046,221 ) | |
Increase in net assets resulting from operations | $16,682,273 | |
OPERATIONS | |||
1/1/23-6/30/23 | 1/1/22-12/31/22 | ||
Net investment income | $66,728,494 | $11,600,575 | |
Net realized losses | (12,328,736 ) | (20,699,949 ) | |
Net change in unrealized appreciation (depreciation) | + | (37,717,485 ) | (46,734,908 ) |
Increase (decrease) in net assets resulting from operations | $16,682,273 | ($55,834,282 ) | |
DISTRIBUTIONS TO SHAREHOLDERS | |||
Total distributions | ($45,966,335 ) | ($11,666,820 ) | |
TRANSACTIONS IN FUND SHARES | |||||
1/1/23-6/30/23 | 1/1/22-12/31/22 | ||||
SHARES | VALUE | SHARES | VALUE | ||
Shares sold | 109,950,000 | $4,869,777,948 | 5,450,000 | $246,351,970 | |
Shares redeemed | + | (850,000 ) | (37,442,943 ) | (5,100,000 ) | (225,629,306 ) |
Net transactions in fund shares | 109,100,000 | $4,832,335,005 | 350,000 | $20,722,664 | |
SHARES OUTSTANDING AND NET ASSETS | |||||
1/1/23-6/30/23 | 1/1/22-12/31/22 | ||||
SHARES | NET ASSETS | SHARES | NET ASSETS | ||
Beginning of period | 7,600,000 | $328,276,441 | 7,250,000 | $375,054,879 | |
Total increase (decrease) | + | 109,100,000 | 4,803,050,943 | 350,000 | (46,778,438 ) |
End of period | 116,700,000 | $5,131,327,384 | 7,600,000 | $328,276,441 | |
SCHWAB STRATEGIC TRUST (ORGANIZED JANUARY 27, 2009) | |
Schwab U.S. TIPS ETF | Schwab U.S. Dividend Equity ETF |
Schwab Short-Term U.S. Treasury ETF | Schwab International Dividend Equity ETF |
Schwab Intermediate-Term U.S. Treasury ETF | Schwab International Equity ETF |
Schwab Long-Term U.S. Treasury ETF | Schwab International Small-Cap Equity ETF |
Schwab U.S. Aggregate Bond ETF | Schwab Emerging Markets Equity ETF |
Schwab 1-5 Year Corporate Bond ETF | Schwab U.S. REIT ETF |
Schwab 5-10 Year Corporate Bond ETF | Schwab Fundamental U.S. Broad Market Index ETF |
Schwab U.S. Broad Market ETF | Schwab Fundamental U.S. Large Company Index ETF |
Schwab 1000 Index® ETF | Schwab Fundamental U.S. Small Company Index ETF |
Schwab U.S. Large-Cap ETF | Schwab Fundamental International Large Company Index ETF |
Schwab U.S. Large-Cap Growth ETF | Schwab Fundamental International Small Company Index ETF |
Schwab U.S. Large-Cap Value ETF | Schwab Fundamental Emerging Markets Large Company Index ETF |
Schwab U.S. Mid-Cap ETF | Schwab Ariel ESG ETF |
Schwab U.S. Small-Cap ETF | Schwab Municipal Bond ETF |
Schwab Crypto Thematic ETF | |
2. Significant Accounting Policies:
3. Risk Factors:
4. Affiliates and Affiliated Transactions:
SCHWAB U.S. TIPS ETF | SCHWAB SHORT-TERM U.S. TREASURY ETF | SCHWAB INTERMEDIATE-TERM U.S. TREASURY ETF | SCHWAB LONG-TERM U.S. TREASURY ETF | SCHWAB U.S. AGGREGATE BOND ETF | SCHWAB 1-5 YEAR CORPORATE BOND ETF | SCHWAB 5-10 YEAR CORPORATE BOND ETF |
0.04 % | 0.03 % | 0.03 % | 0.03 % | 0.03 % | 0.03 % | 0.03 % |
UNDERLYING FUNDS | ||||||
SCHWAB U.S. TIPS ETF | SCHWAB SHORT-TERM U.S. TREASURY ETF | SCHWAB LONG-TERM U.S. TREASURY ETF | SCHWAB U.S. AGGREGATE BOND ETF | SCHWAB 1-5 YEAR CORPORATE BOND ETF | SCHWAB 5-10 YEAR CORPORATE BOND ETF | |
Schwab Monthly Income Fund - Flexible Payout | — % | — % | 1.5 % | — % | — % | 0.0 %* |
Schwab Monthly Income Fund - Income Payout | — % | — % | 1.3 % | — % | 1.5 % | 0.1 % |
Schwab Monthly Income Fund - Target Payout | — % | — % | 0.9 % | — % | — % | 0.0 %* |
Schwab Target 2010 Index Fund | 0.0 %* | 0.0 %* | — % | 0.3 % | — % | — % |
Schwab Target 2015 Index Fund | 0.0 %* | 0.0 %* | — % | 0.4 % | — % | — % |
Schwab Target 2020 Index Fund | 0.1 % | 0.1 % | — % | 1.5 % | — % | — % |
Schwab Target 2025 Index Fund | 0.2 % | 0.1 % | — % | 2.7 % | — % | — % |
Schwab Target 2030 Index Fund | 0.1 % | 0.1 % | — % | 3.7 % | — % | — % |
Schwab Target 2035 Index Fund | — % | 0.0 %* | — % | 2.0 % | — % | — % |
Schwab Target 2040 Index Fund | — % | 0.0 %* | — % | 1.7 % | — % | — % |
Schwab Target 2045 Index Fund | — % | 0.0 %* | — % | 0.7 % | — % | — % |
Schwab Target 2050 Index Fund | — % | — % | — % | 0.6 % | — % | — % |
Schwab Target 2055 Index Fund | — % | — % | — % | 0.3 % | — % | — % |
Schwab Target 2060 Index Fund | — % | — % | — % | 0.2 % | — % | — % |
Schwab Target 2065 Index Fund | — % | — % | — % | 0.0 %* | — % | — % |
Schwab VIT Balanced Portfolio | 0.0 %* | 0.0 %* | — % | 0.4 % | — % | — % |
Schwab VIT Balanced with Growth Portfolio | 0.0 %* | 0.0 %* | — % | 0.6 % | — % | — % |
Schwab VIT Growth Portfolio | — % | — % | — % | 0.3 % | — % | — % |
* | Less than 0.05% |
5. Other Service Providers:
7. Borrowing from Banks:
8. Derivatives:
NOTIONAL AMOUNTS | NUMBER OF CONTRACTS | |
Schwab U.S. TIPS ETF | $— | — |
Schwab Short-Term U.S. Treasury ETF | — | — |
Schwab Intermediate-Term U.S. Treasury ETF | — | — |
Schwab Long-Term U.S. Treasury ETF | — | — |
Schwab U.S. Aggregate Bond ETF | — | — |
Schwab 1-5 Year Corporate Bond ETF | 342,923 | 3 |
Schwab 5-10 Year Corporate Bond ETF | 2,718,291 | 23 |
PURCHASES OF LONG-TERM U.S. GOVERNMENT SECURITIES* | PURCHASES OF OTHER LONG-TERM SECURITIES | TOTAL PURCHASES OF LONG-TERM SECURITIES | |
Schwab U.S. TIPS ETF | $1,378,453,138 | $— | $1,378,453,138 |
Schwab Short-Term U.S. Treasury ETF | 4,148,571,138 | — | 4,148,571,138 |
Schwab Intermediate-Term U.S. Treasury ETF | 1,401,956,457 | — | 1,401,956,457 |
Schwab Long-Term U.S. Treasury ETF | 55,865,289 | — | 55,865,289 |
Schwab U.S. Aggregate Bond ETF | 1,899,824,567 | 158,779,463 | 2,058,604,030 |
Schwab 1-5 Year Corporate Bond ETF | — | 56,024,219 | 56,024,219 |
Schwab 5-10 Year Corporate Bond ETF | — | 429,800,225 | 429,800,225 |
SALES/MATURITIES OF LONG-TERM U.S. GOVERNMENT SECURITIES* | SALES/MATURITIES OF OTHER LONG-TERM SECURITIES | TOTAL SALES/MATURITIES OF LONG-TERM SECURITIES | |
Schwab U.S. TIPS ETF | $1,504,985,924 | $— | $1,504,985,924 |
Schwab Short-Term U.S. Treasury ETF | 4,129,928,781 | — | 4,129,928,781 |
Schwab Intermediate-Term U.S. Treasury ETF | 1,410,897,493 | — | 1,410,897,493 |
Schwab Long-Term U.S. Treasury ETF | 23,420,545 | — | 23,420,545 |
Schwab U.S. Aggregate Bond ETF | 1,790,459,242 | 128,115,260 | 1,918,574,502 |
Schwab 1-5 Year Corporate Bond ETF | — | 54,865,634 | 54,865,634 |
Schwab 5-10 Year Corporate Bond ETF | — | 433,139,783 | 433,139,783 |
10. In-Kind Transactions:
IN-KIND PURCHASES OF SECURITIES | IN-KIND SALES OF SECURITIES | |
Schwab U.S. TIPS ETF | $2,562,192,178 | $5,031,623,939 |
Schwab Short-Term U.S. Treasury ETF | 5,303,150,069 | 1,173,578,753 |
Schwab Intermediate-Term U.S. Treasury ETF | 3,606,568,596 | 3,809,563,389 |
Schwab Long-Term U.S. Treasury ETF | 102,175,507 | 26,491,661 |
Schwab U.S. Aggregate Bond ETF | 180,238,490 | 116,708,297 |
Schwab 1-5 Year Corporate Bond ETF | 21,233,663 | 30,720,335 |
Schwab 5-10 Year Corporate Bond ETF | 4,804,457,799 | 36,116,767 |
11. Federal Income Taxes:
TAX COST | GROSS UNREALIZED APPRECIATION | GROSS UNREALIZED DEPRECIATION | NET UNREALIZED APPRECIATION (DEPRECIATION) | |
Schwab U.S. TIPS ETF | $13,148,647,805 | $- | ($1,700,700,428) | ($1,700,700,428) |
Schwab Short-Term U.S. Treasury ETF | 14,612,898,776 | - | (273,060,502 ) | (273,060,502 ) |
Schwab Intermediate-Term U.S. Treasury ETF | 7,707,598,192 | - | (391,862,492 ) | (391,862,492 ) |
Schwab Long-Term U.S. Treasury ETF | 321,842,344 | - | (23,484,333 ) | (23,484,333 ) |
Schwab U.S. Aggregate Bond ETF | 7,948,354,006 | - | (750,419,637 ) | (750,419,637 ) |
Schwab 1-5 Year Corporate Bond ETF | 380,915,919 | 148,514 | (21,103,441 ) | (20,954,927 ) |
Schwab 5-10 Year Corporate Bond ETF | 5,167,619,545 | 1,945,503 | (90,781,338 ) | (88,835,835 ) |
Schwab U.S. TIPS ETF | $367,609,106 |
Schwab Short-Term U.S. Treasury ETF | 276,041,179 |
Schwab Intermediate-Term U.S. Treasury ETF | 354,167,139 |
Schwab Long-Term U.S. Treasury ETF | 4,991,274 |
Schwab U.S. Aggregate Bond ETF | 275,794,945 |
Schwab 1-5 Year Corporate Bond ETF | 2,153,196 |
Schwab 5-10 Year Corporate Bond ETF | 5,261,468 |
PRIOR FISCAL YEAR END DISTRIBUTIONS | |
ORDINARY INCOME | |
Schwab U.S. TIPS ETF | $1,069,955,140 |
Schwab Short-Term U.S. Treasury ETF | 125,786,895 |
Schwab Intermediate-Term U.S. Treasury ETF | 140,863,160 |
Schwab Long-Term U.S. Treasury ETF | 2,856,565 |
Schwab U.S. Aggregate Bond ETF | 185,912,810 |
Schwab 1-5 Year Corporate Bond ETF | 6,101,610 |
Schwab 5-10 Year Corporate Bond ETF | 11,666,820 |
12. Subsequent Events:
Independent Trustees | |||
Name, Year of Birth, and Position(s) with the trust (Terms of office, and length of Time Served1) | Principal Occupations During the Past Five Years | Number of Portfolios in Fund Complex Overseen by the Trustee | Other Directorships |
Michael J. Beer 1961 Trustee (Trustee of The Charles Schwab Family of Funds, Schwab Investments, Schwab Capital Trust, Schwab Annuity Portfolios, Schwab Strategic Trust and Laudus Trust since 2022) | Retired. Director, President and Chief Executive Officer (Dec. 2016 – Sept. 2019), Principal Funds (investment management). | 106 | Director (2016 – 2019), Principal Funds, Inc. |
Robert W. Burns 1959 Trustee (Trustee of Schwab Strategic Trust since 2009; The Charles Schwab Family of Funds, Schwab Investments, Schwab Capital Trust, Schwab Annuity Portfolios and Laudus Trust since 2016) | Retired/Private Investor. | 106 | None |
Nancy F. Heller 1956 Trustee (Trustee of The Charles Schwab Family of Funds, Schwab Investments, Schwab Capital Trust, Schwab Annuity Portfolios, Schwab Strategic Trust and Laudus Trust since 2018) | Retired. | 106 | None |
David L. Mahoney 1954 Trustee (Trustee of The Charles Schwab Family of Funds, Schwab Investments, Schwab Capital Trust, Schwab Annuity Portfolios and Laudus Trust since 2011; Schwab Strategic Trust since 2016) | Private Investor. | 106 | Director (2004 – present), Corcept Therapeutics Incorporated Director (2009 – 2021), Adamas Pharmaceuticals, Inc. Director (2003 – 2019), Symantec Corporation |
Jane P. Moncreiff 1961 Trustee (Trustee of The Charles Schwab Family of Funds, Schwab Investments, Schwab Capital Trust, Schwab Annuity Portfolios, Schwab Strategic Trust and Laudus Trust since 2019) | Consultant (2018 – present), Fulham Advisers LLC (management consulting); Chief Investment Officer (2009 – 2017), CareGroup Healthcare System, Inc. (healthcare). | 106 | None |
Independent Trustees (continued) | |||
Name, Year of Birth, and Position(s) with the trust (Terms of office, and length of Time Served1) | Principal Occupations During the Past Five Years | Number of Portfolios in Fund Complex Overseen by the Trustee | Other Directorships |
Kimberly S. Patmore 1956 Trustee (Trustee of The Charles Schwab Family of Funds, Schwab Investments, Schwab Capital Trust, Schwab Annuity Portfolios, Schwab Strategic Trust and Laudus Trust since 2016) | Consultant (2008 – present), Patmore Management Consulting (management consulting). | 106 | None |
J. Derek Penn 1957 Trustee (Trustee of The Charles Schwab Family of Funds, Schwab Investments, Schwab Capital Trust, Schwab Annuity Portfolios, Schwab Strategic Trust and Laudus Trust since 2021) | Head of Equity Sales and Trading (2006 – 2018), BNY Mellon (financial services). | 106 | None |
Interested Trustees | |||
Name, Year of Birth, and Position(s) with the trust (Terms of office, and length of Time Served1) | Principal Occupations During the Past Five Years | Number of Portfolios in Fund Complex Overseen by the Trustee | Other Directorships |
Walter W. Bettinger II2 1960 Chairman and Trustee (Trustee of The Charles Schwab Family of Funds, Schwab Investments, Schwab Capital Trust and Schwab Annuity Portfolios since 2008; Schwab Strategic Trust since 2009; Laudus Trust since 2010) | Co-Chairman of the Board (July 2022 – present), Director and Chief Executive Officer (Oct. 2008 – present) and President (Feb. 2007 – Oct. 2021), The Charles Schwab Corporation; President and Chief Executive Officer (Oct. 2008 – Oct. 2021) and Director (May 2008 – Oct. 2021), Charles Schwab & Co., Inc.; Director (Apr. 2006 – present), Charles Schwab Bank, SSB; Director (Nov. 2017 – present), Charles Schwab Premier Bank, SSB; Director (July 2019 – present), Charles Schwab Trust Bank; Director (May 2008 – present), Chief Executive Officer (Aug. 2017 – present) and President (Aug. 2017 – Nov. 2021), Schwab Holdings, Inc.; Director (Oct. 2020 – present), TD Ameritrade Holding Corporation; Director (July 2016 – Oct. 2021), Charles Schwab Investment Management, Inc. | 106 | Director (2008 – present), The Charles Schwab Corporation |
Richard A. Wurster2 1973 Trustee (Trustee of The Charles Schwab Family of Funds, Schwab Investments, Schwab Capital Trust, Schwab Annuity Portfolios, Schwab Strategic Trust and Laudus Trust since 2022) | President (Oct. 2021 – present) and Executive Vice President – Schwab Asset Management Solutions (Apr. 2019 – Oct. 2021), The Charles Schwab Corporation; President, Director (Oct. 2021 – present), Executive Vice President – Schwab Asset Management Solutions (July 2019 – Oct. 2021) and Senior Vice President – Advisory (May 2016 – July 2019), Charles Schwab & Co., Inc.; President (Nov. 2021 – present), Schwab Holdings, Inc.; Director (Oct. 2021 – present) and Chief Executive Officer (Nov. 2019 – Jan. 2022), Charles Schwab Investment Management, Inc.; Director, Chief Executive Officer and President (Mar. 2018 – Oct. 2022), Charles Schwab Investment Advisory, Inc.; Chief Executive Officer (July 2016 – Apr. 2018) and President (Mar. 2017 – Apr. 2018), ThomasPartners, Inc.; Chief Executive Officer (July 2016 – Apr. 2018), Windhaven Investment Management, Inc. | 106 | None |
Officers of the Trust | |
Name, Year of Birth, and Position(s) with the trust (Terms of office, and length of Time Served3) | Principal Occupations During the Past Five Years |
Jonathan de St. Paer 1973 President and Chief Executive Officer (Officer of The Charles Schwab Family of Funds, Schwab Investments, Schwab Capital Trust, Schwab Annuity Portfolios, Schwab Strategic Trust and Laudus Trust since 2018) | Director (Apr. 2019 – present), President (Oct. 2018 – present), Chief Operating Officer (Jan. 2021 – present), and Chief Executive Officer (Apr. 2019 – Nov. 2019), Charles Schwab Investment Management, Inc.; Senior Vice President (June 2020 – Mar. 2022) and Chief Operating Officer (Jan. 2021 – Mar. 2022), Charles Schwab Investment Advisory, Inc.; Chief Executive Officer (Apr. 2019 – present), President (Nov. 2018 – present) and Trustee (Apr. 2019 – Dec. 2020), Schwab Funds, Laudus Trust and Schwab ETFs; Managing Director (May 2022 – present), Senior Vice President (Apr. 2019 – May 2022) and Senior Vice President ��� Strategy and Product Development (CSIM) (Jan. 2014 – Mar. 2019), Charles Schwab & Co., Inc. |
Mark Fischer 1970 Chief Operating Officer (Officer of The Charles Schwab Family of Funds, Schwab Investments, Schwab Capital Trust, Schwab Annuity Portfolios, Schwab Strategic Trust and Laudus Trust since 2013) | Chief Operating Officer (Dec. 2020 – present) and Treasurer and Chief Financial Officer (Jan. 2016 – Dec. 2022), Schwab Funds, Laudus Trust and Schwab ETFs; Managing Director (Mar. 2023 – present), Chief Financial Officer (Mar. 2020 – present) and Vice President (Oct. 2013 – Mar. 2023), Charles Schwab Investment Management, Inc. |
Dana Smith 1965 Treasurer and Chief Financial Officer (Officer of The Charles Schwab Family of Funds, Schwab Investments, Schwab Capital Trust, Schwab Annuity Portfolios, Schwab Strategic Trust and Laudus Trust since 2023) | Treasurer and Chief Financial Officer (Jan. 2023 – present) and Assistant Treasurer (Dec. 2015 – Dec. 2022), Schwab Funds, Laudus Trust and Schwab ETFs; Managing Director (Mar. 2023 – present), Vice President (Mar. 2022 – Mar. 2023) and Director (Oct. 2015 – Mar. 2022), Charles Schwab Investment Management, Inc. |
Officers of the Trust (continued) | |
Name, Year of Birth, and Position(s) with the trust (Terms of office, and length of Time Served3) | Principal Occupations During the Past Five Years |
Omar Aguilar 1970 Vice President and Chief Investment Officer (Officer of The Charles Schwab Family of Funds, Schwab Investments, Schwab Capital Trust, Schwab Annuity Portfolios, Schwab Strategic Trust and Laudus Trust since 2011) | Chief Executive Officer (Jan. 2022 – present), Chief Investment Officer (Apr. 2011 – present) and Senior Vice President (Apr. 2011 – Dec. 2021), Charles Schwab Investment Management, Inc.; Director, Chief Executive Officer and President (Oct. 2022 – present), Charles Schwab Investment Advisory, Inc.; Vice President and Chief Investment Officer (June 2011 – present), Schwab Funds, Laudus Trust and Schwab ETFs. |
Brett Wander 1961 Vice President and Chief Investment Officer (Officer of The Charles Schwab Family of Funds, Schwab Investments, Schwab Capital Trust, Schwab Annuity Portfolios, Schwab Strategic Trust and Laudus Trust since 2011) | Managing Director (Mar. 2023 – present), Chief Investment Officer (Apr. 2011 – present) and Senior Vice President (Apr. 2011 – Mar. 2023) Charles Schwab Investment Management, Inc.; Vice President and Chief Investment Officer (June 2011 – present), Schwab Funds, Laudus Trust and Schwab ETFs. |
William P. McMahon, Jr. 1972 Vice President and Chief Investment Officer (Officer of The Charles Schwab Family of Funds, Schwab Investments, Schwab Capital Trust, Schwab Annuity Portfolios, Schwab Strategic Trust and Laudus Trust since 2021) | Managing Director (Mar. 2023 – present), Chief Investment Officer (Jan. 2020 – present) and Senior Vice President (Jan. 2020 – Mar. 2023) Charles Schwab Investment Management, Inc.; Vice President and Chief Investment Officer (June 2021 – present), Schwab Funds, Laudus Trust and Schwab ETFs; Senior Vice President and Chief Investment Officer – ThomasPartners Strategies (Apr. 2018 – Dec. 2019), Charles Schwab Investment Advisory, Inc.; Senior Vice President and Chief Investment Officer (May 2001 – Apr. 2018), ThomasPartners, Inc. |
Catherine MacGregor 1964 Chief Legal Officer and Secretary, Schwab Funds and Schwab ETFs Chief Legal Officer, Vice President and Clerk, Laudus Trust (Officer of The Charles Schwab Family of Funds, Schwab Investments, Schwab Capital Trust, Schwab Annuity Portfolios and Laudus Trust since 2005; Schwab Strategic Trust since 2009) | Managing Director (Mar. 2023 – present), Chief Legal Officer (Mar. 2022 – present) and Vice President (Sept. 2005 – Mar. 2023), Charles Schwab Investment Management, Inc.; Managing Director (May 2022 – present) and Vice President (July 2005 – May 2022), Charles Schwab & Co., Inc.; Vice President (Dec. 2005 – present) and Chief Legal Officer and Clerk (Mar. 2007 – present), Laudus Trust; Chief Legal Officer and Secretary (Oct. 2021 – present), Vice President (Nov. 2005 – Oct. 2021) and Assistant Secretary (June 2007 – Oct. 2021), Schwab Funds; Chief Legal Officer and Secretary (Oct. 2021 – present), Vice President and Assistant Secretary (Oct. 2009 – Oct. 2021), Schwab ETFs. |
Schwab ETFs
Index ETF
Printed on recycled paper.

Total Returns for the 6 Months Ended June 30, 2023 | |
Schwab Municipal Bond ETF (Ticker Symbol: SCMB) | |
Market Price Return1 | 2.33% |
NAV Return1 | 2.45% |
ICE AMT-Free Core U.S. National Municipal Index | 2.74% |
ETF Category: Morningstar Muni National Interm2 | 2.27% |
Performance Details | page 4 |
 | Jason D. Diefenthaler, Managing Director and Head of Tax-Exempt Strategies for Schwab Asset Management, is responsible for the day-to-day co-management of the fund and for developing, managing, and implementing Schwab Asset Management’s tax-exempt fixed income investment strategies, including separately managed accounts, actively managed mutual funds, and exchange-traded funds (ETFs). Previously, Mr. Diefenthaler led the portfolio management team for the Wasmer SchroederTM Municipal Bond Strategies and was responsible for the day-to-day co-management of several tax-free Schwab Funds. Prior to that, he was the director of tax-exempt portfolio management at Wasmer Schroeder & Company, LLC (Schwab Asset Management became the investment adviser for Wasmer Schroeder Strategies in 2020). He oversaw all tax-exempt strategies and management of the Wasmer Schroeder High Yield Municipal Fund, which subsequently reorganized into the Schwab Opportunistic Municipal Bond Fund. Mr. Diefenthaler began his career with Wasmer Schroeder in 2000. He was a credit analyst for taxable and tax-exempt strategies before becoming a portfolio manager. |
 | Matthew Hastings, CFA, Managing Director and Head of Taxable Bond Strategies for Schwab Asset Management, is responsible for the day-to-day co-management of the fund. Mr. Hastings leads the portfolio management team for the Schwab Taxable Bond Funds and Schwab Fixed-Income ETFs. He also has overall responsibility for all aspects of the management of the funds. Prior to joining Schwab in 1999, Mr. Hastings was in fixed-income sales and trading at Lehman Brothers. He has worked in the fixed-income securities industry since 1996. |
 | Steven Hung, Senior Portfolio Manager for Schwab Asset Management, is responsible for the day-to-day co-management of the fund. He is primarily responsible for the management and oversight of corporate bonds within the taxable bond strategies, with additional responsibility for managing municipal bond index strategies. Mr. Hung has been a portfolio manager with Schwab Asset Management since 2005 and prior to that, served in various roles as an associate portfolio manager and trader since 1999. In 1998, he joined Schwab’s management training program and worked as a clerk on the options trading floor of the Pacific Coast Stock Exchange. |
 | John Khodarahmi, Senior Portfolio Manager for Schwab Asset Management, is responsible for the day-to-day co-management of the fund. He is a member of the team responsible for management of the Schwab Tax-Free Bond Funds and has been a portfolio manager with Schwab Asset Management since 2015. Prior to joining Schwab in 2015, Mr. Khodarahmi was a vice president and senior municipal trader at Eaton Vance Management for the firm’s tax-free bond funds. Previous to Eaton Vance, he was a vice president and portfolio manager at both Banc of America Montgomery Securities and Thomas Weisel Partners, managing corporate cash and high net worth portfolios. Prior to those roles, Mr. Khodarahmi was a municipal trader and underwriter for Fleet Securities, Inc. (now part of Bank of America). |
Fund and Inception Date | 6 Months | Since Inception* |
Fund: Schwab Municipal Bond ETF (10/12/22) | ||
Market Price Return2 | 2.33% | 5.61% |
NAV Return2 | 2.45% | 5.45% |
ICE AMT-Free Core U.S. National Municipal Index | 2.74% | 5.40% |
ETF Category: Morningstar Muni National Interm3 | 2.27% | N/A |
Fund Expense Ratio4: 0.03% | ||
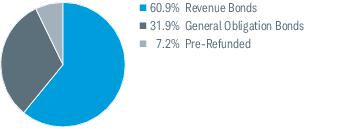
Weighted Average Maturity6 | 7.3 Yrs |
Weighted Average Duration6 | 6.1 Yrs |
EXPENSE RATIO (ANNUALIZED) 1 | BEGINNING ACCOUNT VALUE AT 1/1/23 | ENDING ACCOUNT VALUE (NET OF EXPENSES) AT 6/30/23 | EXPENSES PAID DURING PERIOD 1/1/23-6/30/23 2 | |
Schwab Municipal Bond ETF | ||||
Actual Return | 0.03% | $1,000.00 | $1,024.50 | $0.15 |
Hypothetical 5% Return | 0.03% | $1,000.00 | $1,024.65 | $0.15 |
1 | Based on the most recent six-month expense ratio. |
2 | Expenses for the fund are equal to its annualized expense ratio, multiplied by the average account value over the period, multiplied by 181 days in the period, and divided by 365 days in the fiscal year. |
1/1/23– 6/30/23* | 10/12/221– 12/31/22 | |||||
Per-Share Data | ||||||
Net asset value at beginning of period | $51.16 | $50.00 | ||||
Income (loss) from investment operations: | ||||||
Net investment income (loss)2 | 0.84 | 0.39 | ||||
Net realized and unrealized gains (losses) | 0.35 3 | 1.00 | ||||
Total from investment operations | 1.19 | 1.39 | ||||
Less distributions: | ||||||
Distributions from net investment income | (0.66 ) | (0.30 ) | ||||
Other capital2 | 0.06 | 0.07 | ||||
Net asset value at end of period | $51.75 | $51.16 | ||||
Total return | 2.45 %4 | 2.93 %4 | ||||
Ratios/Supplemental Data | ||||||
Ratios to average net assets: | ||||||
Total expenses | 0.03 %5 | 0.03 %5 | ||||
Net investment income (loss) | 3.31 %5 | 3.50 %5 | ||||
Portfolio turnover rate6 | 21 %4 | 13 %4 | ||||
Net assets, end of period (x 1,000) | $139,716 | $61,387 | ||||
* | Unaudited. |
1 | Commencement of operations. |
2 | Calculated based on the average shares outstanding during the period. |
3 | The per share amount does not accord with the change in aggregate gains and losses in securities during the period because of the timing of fund transactions in relation to fluctuating market values. |
4 | Not annualized. |
5 | Annualized. |
6 | Portfolio turnover rate excludes securities received or delivered from processing of in-kind creations or redemptions. |
ISSUER TYPE OF SECURITY, SERIES | RATE | MATURITY | FACE AMOUNT ($) | VALUE ($) |
MUNICIPAL SECURITIES 98.3% OF NET ASSETS | ||||
ALABAMA 0.6% | ||||
Alabama Federal Aid Highway Finance Auth | ||||
Special Obligation RB Series 2017A | 4.00% | 06/01/37 (a)(b) | 235,000 | 246,845 |
Alabama State Corrections Institution Finance Auth | ||||
RB Series 2022A | 5.25% | 07/01/47 (b) | 100,000 | 108,856 |
Birmingham Water Works Board | ||||
Water Refunding RB Series 2015A | 5.00% | 01/01/42 (a)(b) | 300,000 | 308,571 |
Tuscaloosa City Board of Education Capital Outlay Warrants | ||||
School Tax Warrants Series 2016 | 5.00% | 08/01/46 (a)(b) | 200,000 | 212,013 |
876,285 | ||||
ARIZONA 1.1% | ||||
Arizona Health Facilities Auth | ||||
RB (Banner Health) Series 2014A | 5.00% | 01/01/44 (a)(b) | 150,000 | 151,282 |
Glendale Municipal Property Corp | ||||
Sub Excise Tax Refunding RB Series 2012C | 4.00% | 07/01/38 (b) | 130,000 | 126,900 |
Maricopa Cnty | ||||
GO Bonds Series 2018C | 4.00% | 07/01/38 (b) | 400,000 | 400,757 |
Mesa | ||||
Utility Systems RB Series 2019A | 5.00% | 07/01/43 (b) | 75,000 | 80,778 |
Phoenix Civic Improvement Corp | ||||
Jr Lien Airport RB Series 2019A | 4.00% | 07/01/49 (b) | 100,000 | 96,294 |
Salt River Project Agricultural Improvement & Power District | ||||
Electric System RB Series 2017A | 5.00% | 01/01/36 (b) | 185,000 | 200,404 |
Electric System RB Series 2021A | 5.00% | 01/01/24 | 200,000 | 201,836 |
Refunding RB Series 2016A | 5.00% | 01/01/31 (b) | 300,000 | 322,138 |
1,580,389 | ||||
CALIFORNIA 20.1% | ||||
Alameda Cnty Transportation Commission | ||||
Sr Sales Tax RB Series 2022 | 5.00% | 03/01/45 (b) | 110,000 | 123,169 |
Anaheim Public Financing Auth | ||||
Sub Lease RB Series 1997C | 0.00% | 09/01/32 (c)(d) | 100,000 | 71,588 |
Baldwin Park USD | ||||
GO Bonds Series 2013 | 0.00% | 08/01/42 (a)(b)(c)(d) | 35,000 | 9,677 |
ISSUER TYPE OF SECURITY, SERIES | RATE | MATURITY | FACE AMOUNT ($) | VALUE ($) |
Bay Area Toll Auth | ||||
Sub Toll Bridge RB Series 2014S6 | 5.00% | 10/01/54 (a)(b) | 175,000 | 179,285 |
Sub Toll Bridge RB Series 2017 S7 | 4.00% | 04/01/32 (b) | 140,000 | 145,094 |
Sub Toll Bridge RB Series 2017S7 | 4.00% | 04/01/33 (b) | 190,000 | 196,415 |
Sub Toll Bridge RB Series 2017S7 | 3.25% | 04/01/36 (b) | 100,000 | 95,826 |
Beverly Hills USD | ||||
GO Bonds Series 2009 | 0.00% | 08/01/33 (d) | 150,000 | 105,672 |
California | ||||
GO Bonds | 5.00% | 08/01/23 | 195,000 | 195,272 |
GO Bonds | 4.00% | 11/01/23 | 100,000 | 100,324 |
GO Bonds | 5.00% | 08/01/24 | 60,000 | 61,333 |
GO Bonds | 5.00% | 11/01/24 | 50,000 | 51,381 |
GO Bonds | 5.00% | 11/01/25 (b) | 500,000 | 512,171 |
GO Bonds | 5.00% | 08/01/27 (b) | 200,000 | 213,073 |
GO Bonds | 5.00% | 11/01/28 | 120,000 | 134,344 |
GO Bonds | 5.00% | 11/01/29 | 100,000 | 113,988 |
GO Bonds | 5.00% | 10/01/30 (b) | 275,000 | 306,473 |
GO Bonds | 5.00% | 11/01/30 | 50,000 | 58,115 |
GO Bonds | 5.00% | 04/01/31 (b) | 125,000 | 140,801 |
GO Bonds | 4.00% | 09/01/31 (b) | 180,000 | 186,105 |
GO Bonds | 5.00% | 11/01/32 (b) | 520,000 | 579,866 |
GO Bonds | 5.00% | 12/01/32 (b) | 150,000 | 158,902 |
GO Bonds | 3.00% | 10/01/33 (b) | 325,000 | 320,807 |
GO Bonds | 3.75% | 04/01/37 (b) | 105,000 | 105,004 |
GO Bonds | 5.00% | 10/01/39 (b) | 200,000 | 230,883 |
GO Bonds | 4.00% | 04/01/49 (b) | 250,000 | 251,504 |
GO Bonds | 5.25% | 10/01/50 (b) | 170,000 | 194,756 |
GO Refunding Bonds | 5.00% | 08/01/25 | 380,000 | 395,857 |
GO Refunding Bonds | 5.00% | 10/01/25 | 490,000 | 512,173 |
GO Refunding Bonds | 5.00% | 12/01/26 | 300,000 | 321,518 |
GO Refunding Bonds | 5.00% | 03/01/27 (b) | 250,000 | 258,725 |
GO Refunding Bonds | 5.00% | 12/01/27 | 210,000 | 230,404 |
GO Refunding Bonds | 5.00% | 10/01/28 | 325,000 | 363,195 |
GO Refunding Bonds | 5.00% | 03/01/30 (b) | 150,000 | 154,997 |
GO Refunding Bonds | 5.00% | 04/01/31 (b) | 130,000 | 146,433 |
GO Refunding Bonds | 5.25% | 08/01/32 (c) | 300,000 | 359,299 |
GO Refunding Bonds | 5.00% | 09/01/32 (b) | 150,000 | 156,428 |
GO Refunding Bonds | 5.00% | 08/01/33 (b) | 400,000 | 407,779 |
GO Refunding Bonds | 5.00% | 03/01/35 (b) | 245,000 | 279,150 |
GO Refunding Bonds | 3.50% | 08/01/35 (b) | 200,000 | 200,175 |
GO Refunding Bonds | 3.00% | 10/01/36 (b) | 200,000 | 184,917 |
GO Refunding Bonds | 5.00% | 11/01/36 (b) | 95,000 | 104,575 |
GO Refunding Bonds | 5.00% | 04/01/37 (b) | 190,000 | 210,072 |
GO Refunding Bonds | 4.00% | 11/01/37 (b) | 150,000 | 155,371 |
GO Refunding Bonds | 5.00% | 09/01/41 (b) | 100,000 | 112,413 |
GO Refunding Bonds | 5.00% | 04/01/42 (b) | 100,000 | 112,750 |
GO Refunding Bonds | 5.00% | 10/01/42 (b) | 175,000 | 199,483 |
ULT GO Bonds | 5.00% | 10/01/26 (b) | 125,000 | 132,337 |
ISSUER TYPE OF SECURITY, SERIES | RATE | MATURITY | FACE AMOUNT ($) | VALUE ($) |
California Dept of Water Resources | ||||
Water System RB Series AS | 5.00% | 12/01/29 (a)(b) | 70,000 | 72,040 |
Water System RB Series BB | 5.00% | 12/01/23 | 250,000 | 252,074 |
California Educational Facilities Auth | ||||
RB (Loma Linda Univ) Series 2017A | 5.00% | 04/01/42 (b) | 500,000 | 516,693 |
RB (Santa Clara Univ) Series 2015 | 5.00% | 04/01/45 (b) | 170,000 | 173,876 |
RB (Stanford Univ) Series V1 | 5.00% | 05/01/49 (b) | 200,000 | 237,541 |
RB (Stanford Univ) Series V2 | 2.25% | 04/01/51 (b) | 300,000 | 199,186 |
California Health Facilities Financing Auth | ||||
RB (Sutter Health) Series 2013A | 5.00% | 08/15/52 (a)(b) | 80,000 | 80,166 |
California Infrastructure & Economic Development Bank | ||||
RB (UCSF 2130 3rd St) Series 2017 | 5.00% | 05/15/42 (b) | 100,000 | 106,936 |
RB (UCSF 2130 3rd St) Series 2017 | 5.00% | 05/15/47 (b) | 200,000 | 212,523 |
California Public Works Board | ||||
Lease RB Series 2014A | 5.00% | 09/01/27 (b) | 715,000 | 731,555 |
Lease RB Series 2021B | 4.00% | 05/01/46 (b) | 100,000 | 99,137 |
Lease RB Series 2021C | 5.00% | 11/01/46 (b) | 200,000 | 219,835 |
California State Univ | ||||
RB Series 2015A | 5.00% | 11/01/38 (b) | 60,000 | 62,360 |
RB Series 2015A | 4.00% | 11/01/43 (b) | 75,000 | 75,033 |
RB Series 2016A | 5.00% | 11/01/30 (b) | 200,000 | 213,226 |
Coast CCD | ||||
GO Bonds Series 2006B | 0.00% | 08/01/30 (c)(d) | 385,000 | 308,070 |
GO Bonds Series 2019F | 0.00% | 08/01/40 (b)(d) | 200,000 | 94,942 |
GO Refunding Bonds Series 2015 | 0.00% | 08/01/34 (a)(b)(d) | 150,000 | 95,631 |
Compton USD | ||||
GO Bonds Series 2019B | 4.00% | 06/01/49 (b)(c) | 150,000 | 148,593 |
East Bay Municipal Utility District | ||||
Water System Refunding RB Series 2014B | 5.00% | 06/01/25 | 310,000 | 322,172 |
Foothill Eastern Transportation Corridor Agency | ||||
Sr Lien RB Series 1995A | 0.00% | 01/01/24 (a)(d) | 100,000 | 98,487 |
Sr Lien Refunding RB Series 2021A | 4.00% | 01/15/46 (b) | 335,000 | 324,869 |
Sr Lien Toll RB Series A | 0.00% | 01/01/28 (a)(d) | 340,000 | 300,084 |
Grossmont-Cuyamaca CCD | ||||
GO Bonds Series 2018B | 4.00% | 08/01/47 (b) | 130,000 | 129,689 |
Hayward USD | ||||
GO Bonds Series 2020 | 4.00% | 08/01/45 (b)(c) | 150,000 | 148,143 |
Los Angeles | ||||
Sub Refunding RB Series 2018B | 5.00% | 06/01/25 | 215,000 | 223,564 |
Los Angeles CCD | ||||
GO Bonds Series C1 | 5.00% | 08/01/25 | 60,000 | 62,652 |
GO Refunding Bonds Series 2015A | 5.00% | 08/01/30 (a)(b) | 250,000 | 255,633 |
GO Refunding Bonds Series 2015C | 5.00% | 08/01/25 | 155,000 | 161,850 |
GO Refunding Bonds Series 2016 | 4.00% | 08/01/37 (b) | 50,000 | 50,764 |
Los Angeles Cnty Metropolitan Transportation Auth | ||||
Jr Sub Sales Tax Refunding RB Series 2020A3 | 5.00% | 06/01/33 (b) | 100,000 | 109,190 |
Los Angeles Dept of Airports | ||||
Sr RB Series 2020D | 4.00% | 05/15/48 (b) | 200,000 | 198,522 |
Sub RB Series 2022B | 4.00% | 05/15/48 (b) | 150,000 | 147,735 |
Sub Refunding RB Series 2021B | 5.00% | 05/15/45 (b) | 140,000 | 154,502 |
ISSUER TYPE OF SECURITY, SERIES | RATE | MATURITY | FACE AMOUNT ($) | VALUE ($) |
Los Angeles Dept of Water & Power | ||||
Power System RB Series 2017A | 5.00% | 07/01/47 (b) | 100,000 | 105,074 |
Power System RB Series 2018B | 5.00% | 01/01/24 (b) | 200,000 | 201,622 |
Power System RB Series 2019D | 5.00% | 07/01/44 (b) | 250,000 | 270,567 |
Power System RB Series 2020B | 5.00% | 07/01/40 (b) | 235,000 | 259,795 |
Power System RB Series 2022A | 5.00% | 07/01/51 (b) | 250,000 | 273,365 |
Water System RB Series 2020A | 5.00% | 07/01/50 (b) | 100,000 | 108,685 |
Water System RB Series 2022B | 4.00% | 07/01/49 (b) | 100,000 | 100,434 |
Water System Refunding RB Series 2022C | 5.00% | 07/01/41 (b) | 245,000 | 276,677 |
Los Angeles Municipal Improvement Corp | ||||
Lease Refunding RB Series 2016B | 4.00% | 11/01/33 (b) | 80,000 | 82,717 |
Los Angeles USD | ||||
GO Bonds Series 2016A | 4.00% | 07/01/33 (b) | 150,000 | 152,509 |
GO Bonds Series 2018B1 | 5.00% | 07/01/33 (b) | 125,000 | 137,157 |
GO Bonds Series 2020 RYQ | 4.00% | 07/01/44 (b) | 330,000 | 327,164 |
GO Bonds Series 2020C | 4.00% | 07/01/44 (b) | 150,000 | 148,711 |
GO Refunding Bonds Series 2014C | 5.00% | 07/01/25 (b) | 250,000 | 254,906 |
GO Refunding Bonds Series 2014C | 5.00% | 07/01/28 (b) | 485,000 | 494,169 |
GO Refunding Bonds Series 2017A | 5.00% | 07/01/25 | 200,000 | 208,371 |
Newport-Mesa USD | ||||
GO Bonds Series 2011 | 0.00% | 08/01/33 (d) | 250,000 | 179,642 |
Oakland USD | ||||
GO Bonds Series 2021A | 4.00% | 08/01/46 (b)(c) | 195,000 | 195,054 |
Orange County Transportation Auth | ||||
BAN 2021 | 5.00% | 10/15/24 (a) | 210,000 | 215,381 |
Palomar CCD | ||||
GO Bonds Series D | 4.00% | 08/01/46 (b) | 100,000 | 99,764 |
Peninsula Corridor Joint Powers Board | ||||
Sales Tax RB Series 2022A | 5.00% | 06/01/51 (b) | 250,000 | 273,686 |
Riverside Cnty Transportation Commission | ||||
Toll Sr Lien Refunding RB Series 2021B1 | 4.00% | 06/01/46 (b) | 150,000 | 142,450 |
Riverside County Public Finance Auth | ||||
Lease RB Series 2015 | 5.25% | 11/01/45 (a)(b) | 100,000 | 105,365 |
Sacramento Municipal Utility District | ||||
Electric RB Series 2020H | 4.00% | 08/15/45 (b) | 75,000 | 75,243 |
San Bernardino CCD | ||||
GO Bonds Series A | 4.00% | 08/01/49 (a)(b) | 60,000 | 63,141 |
San Diego Assoc of Governments | ||||
Capital Grant Receipts RB (Mid Coast Corridor Transit) Series 2019A | 5.00% | 11/15/25 (b) | 230,000 | 236,018 |
San Diego CCD | ||||
GO Bonds Series 2016 | 3.00% | 08/01/34 (b) | 60,000 | 58,811 |
GO Refunding Bonds Series 2016 | 5.00% | 08/01/29 (a)(b) | 145,000 | 154,942 |
San Diego Cnty Regional Airport Auth | ||||
Sub Airport RB Series 2021A | 4.00% | 07/01/46 (b) | 115,000 | 111,645 |
San Diego Cnty Regional Transportation Commission | ||||
Sales Tax RB Series 2016A | 5.00% | 04/01/48 (b) | 200,000 | 208,253 |
San Diego Public Facilities Financing Auth | ||||
Lease RB Series 2023A | 4.00% | 10/15/48 (b) | 125,000 | 123,934 |
Sub Sewer RB Series 2022A | 5.00% | 05/15/47 (b) | 15,000 | 16,600 |
Water Sub RB Series 2018A | 5.00% | 08/01/43 (b) | 200,000 | 213,920 |
ISSUER TYPE OF SECURITY, SERIES | RATE | MATURITY | FACE AMOUNT ($) | VALUE ($) |
San Diego USD | ||||
GO Bonds Series 2006F1 | 5.25% | 07/01/28 (c) | 90,000 | 101,402 |
GO Bonds Series 2016I | 0.00% | 07/01/36 (b)(d) | 175,000 | 103,618 |
GO Bonds Series 2020M2 | 4.00% | 07/01/50 (b) | 100,000 | 98,426 |
GO Refunding Bonds Series 2012R1 | 0.00% | 07/01/30 (d) | 50,000 | 40,077 |
GO Refunding Bonds Series 2016SR1 | 4.00% | 07/01/32 (b) | 220,000 | 227,331 |
Go Refunding Bonds Series R5 | 5.00% | 07/01/29 (b) | 115,000 | 123,189 |
San Francisco Airport Commission | ||||
RB 2nd Series 2014B | 5.00% | 05/01/44 (b) | 100,000 | 100,960 |
RB 2nd Series 2018E | 5.00% | 05/01/48 (b) | 100,000 | 105,205 |
San Francisco Municipal Transportation Agency | ||||
RB Series 2017 | 4.00% | 03/01/46 (b) | 440,000 | 439,134 |
San Francisco Public Utilities Commission | ||||
Wastewater RB Series 2018A | 4.00% | 10/01/43 (b) | 200,000 | 200,646 |
Water RB Series 2020A | 5.00% | 11/01/50 (b) | 295,000 | 321,281 |
Water Refunding RB Series 2016A | 5.00% | 11/01/26 | 350,000 | 375,426 |
Water Refunding RB Series 2016A | 5.00% | 11/01/35 (b) | 100,000 | 106,890 |
San Joaquin Hills Transportation Corridor Agency Toll | ||||
Jr Lien RB | 0.00% | 01/01/26 (a)(d) | 400,000 | 370,964 |
San Mateo SD | ||||
ULT GO Bonds Series 2020B | 4.00% | 08/01/51 (b) | 150,000 | 148,221 |
Santa Monica CCD | ||||
GO Bonds Series 2018A | 4.00% | 08/01/47 (b) | 250,000 | 247,932 |
Southern California Metropolitan Water District | ||||
RB Series 2021A | 5.00% | 10/01/46 (b) | 100,000 | 110,522 |
Sub Water Refunding RB Series 2017A | 2.50% | 07/01/26 | 350,000 | 340,968 |
Sub Water Refunding RB Series 2017A | 2.50% | 07/01/27 | 285,000 | 278,163 |
Sunnyvale Financing Auth | ||||
Lease RB Series 2020 | 4.00% | 04/01/50 (b) | 250,000 | 245,389 |
Sweetwater UHSD | ||||
GO Bonds Series 2022A1 | 5.00% | 08/01/52 (b) | 175,000 | 189,360 |
Twin Rivers USD | ||||
GO Bonds Series 2016 | 0.00% | 08/01/41 (b)(c)(d) | 390,000 | 170,718 |
Univ of California | ||||
General RB Series 2020BE | 5.00% | 05/15/41 (b) | 100,000 | 110,589 |
General RB Series 2023BN | 5.00% | 05/15/37 (b) | 250,000 | 296,663 |
Limited Project RB Series 2017M | 5.00% | 05/15/35 (b) | 90,000 | 97,252 |
Limited Project RB Series 2018O | 5.00% | 05/15/58 (b) | 245,000 | 260,386 |
RB Series 2018O | 4.00% | 05/15/48 (b) | 155,000 | 154,997 |
RB Series 2020 BE | 4.00% | 05/15/47 (b) | 250,000 | 250,436 |
RB Series 2021Q | 5.00% | 05/15/46 (b) | 90,000 | 99,080 |
28,018,149 | ||||
COLORADO 1.1% | ||||
Colorado | ||||
COP Series 2020A | 4.00% | 12/15/35 (b) | 150,000 | 155,519 |
COP Series 2021A | 4.00% | 12/15/39 (b) | 25,000 | 25,410 |
Colorado Regional Transportation District | ||||
COP Series 2015A | 4.00% | 06/01/40 (b) | 50,000 | 49,680 |
ISSUER TYPE OF SECURITY, SERIES | RATE | MATURITY | FACE AMOUNT ($) | VALUE ($) |
Colorado Springs | ||||
Utilities System Refunding RB Series 2022A | 5.00% | 11/15/30 | 75,000 | 87,069 |
Denver | ||||
RB Series 2021A | 4.00% | 08/01/51 (b) | 275,000 | 265,625 |
Denver SD #1 | ||||
GO Bonds Series 2022A | 5.00% | 12/01/45 (b)(c) | 200,000 | 221,620 |
Jefferson Cnty SD #R1 | ||||
GO Bonds Series 2018 | 5.00% | 12/15/34 (b)(c) | 145,000 | 159,687 |
Larimer & Weld SD #RE5J | ||||
GO Bonds Series 2021 | 4.00% | 12/01/45 (b)(c) | 200,000 | 198,370 |
Weld Cnty SD #6 | ||||
GO Bonds Series 2021 | 4.00% | 12/01/45 (b)(c) | 200,000 | 200,189 |
Weld Cnty SD #RE2 | ||||
GO Bonds Series 2016 | 5.00% | 12/01/44 (b)(c) | 220,000 | 236,861 |
1,600,030 | ||||
CONNECTICUT 1.9% | ||||
Connecticut | ||||
GO Bonds Series 2016A | 5.00% | 03/15/32 (b) | 115,000 | 120,528 |
GO Bonds Series 2016E | 5.00% | 10/15/24 | 55,000 | 56,362 |
GO Bonds Series 2016E | 3.00% | 10/15/32 (b) | 200,000 | 195,206 |
GO Bonds Series 2020A | 5.00% | 01/15/25 | 100,000 | 102,979 |
GO Bonds Series 2020A | 5.00% | 01/15/26 | 100,000 | 104,795 |
GO Bonds Series 2020A | 4.00% | 01/15/35 (b) | 180,000 | 189,742 |
GO Refunding Bonds Series 2022G | 5.00% | 11/15/27 | 210,000 | 228,461 |
Special Tax Obligation Bonds Series 2015A | 5.00% | 08/01/33 (b) | 750,000 | 776,239 |
Special Tax Obligation Bonds Series 2020A | 5.00% | 05/01/24 | 200,000 | 203,006 |
Transportation RB Series 2016A | 4.00% | 09/01/35 (b) | 170,000 | 172,558 |
Transportation RB Series 2020A | 5.00% | 05/01/27 | 500,000 | 538,771 |
2,688,647 | ||||
DELAWARE 0.1% | ||||
Delaware Transportation Auth | ||||
RB Series 2015 | 5.00% | 06/01/55 (b) | 200,000 | 202,943 |
DISTRICT OF COLUMBIA 1.9% | ||||
District of Columbia | ||||
GO Bonds Series 2015A | 5.00% | 06/01/36 (b) | 100,000 | 103,100 |
GO Bonds Series 2019A | 5.00% | 10/15/33 (b) | 150,000 | 168,256 |
GO Bonds Series 2019A | 5.00% | 10/15/44 (b) | 240,000 | 258,192 |
GO Refunding Bonds Series 2017A | 5.00% | 06/01/34 (b) | 75,000 | 80,805 |
GO Refunding Bonds Series 2023B | 5.00% | 06/01/29 | 115,000 | 129,636 |
Income Tax Secured RB Series 2019A | 5.00% | 03/01/30 (b) | 220,000 | 249,024 |
Income Tax Secured RB Series 2019A | 4.00% | 03/01/44 (b) | 200,000 | 198,134 |
Income Tax Secured RB Series 2022A | 5.00% | 07/01/40 (b) | 250,000 | 281,638 |
Income Tax Secured RB Series 2022A | 5.00% | 07/01/41 (b) | 250,000 | 280,671 |
Refunding RB (Georgetown Univ) Series 2017 | 5.00% | 04/01/35 (b) | 70,000 | 74,105 |
Refunding RB Series 2020B | 5.00% | 10/01/29 | 295,000 | 334,284 |
ISSUER TYPE OF SECURITY, SERIES | RATE | MATURITY | FACE AMOUNT ($) | VALUE ($) |
Washington Metropolitan Transit Auth | ||||
RB Series 2020A | 5.00% | 07/15/45 (b) | 125,000 | 135,604 |
RB Series 2021A | 5.00% | 07/15/46 (b) | 280,000 | 306,115 |
2,599,564 | ||||
FLORIDA 2.4% | ||||
Central Florida Expressway Auth | ||||
Sr Lien Refunding RB Series 2017 | 5.00% | 07/01/42 (b) | 125,000 | 130,940 |
Sr Lien Refunding RB Series 2021 | 4.00% | 07/01/34 (b)(c) | 175,000 | 187,294 |
Florida State Board of Education | ||||
Lottery Refunding RB Series 2017A | 5.00% | 07/01/27 | 165,000 | 178,337 |
Public Education Capital Outlay Refunding Bonds Series 2021A | 5.00% | 06/01/31 | 100,000 | 116,797 |
Public Education Capital Outlay Refunding Bonds Series 2021B | 5.00% | 06/01/29 | 125,000 | 140,909 |
Public Education Capital Outlay Refunding Bonds Series 2022C | 5.00% | 06/01/27 | 150,000 | 162,455 |
Public Education Refunding Bonds Series 2022C | 5.00% | 06/01/24 | 200,000 | 203,474 |
Fort Myers | ||||
Utility System Refunding RB Series 2019A | 4.00% | 10/01/44 (b) | 100,000 | 100,011 |
Fort Pierce Utilities Authority | ||||
Utilities Refunding RB Series 2022A | 4.00% | 10/01/52 (b) | 125,000 | 120,813 |
Hillsborough Cnty Aviation Auth | ||||
RB Series 2018F | 5.00% | 10/01/43 (b) | 115,000 | 121,772 |
Manatee Cnty | ||||
Refunding RB Series 2022 | 4.00% | 10/01/52 (b) | 75,000 | 73,647 |
Miami-Dade Cnty | ||||
Facilities Tax RB Series 2009C | 0.00% | 10/01/44 (c)(d) | 500,000 | 185,666 |
GO Refunding Bonds Series 2015B | 4.00% | 07/01/34 (b) | 50,000 | 50,457 |
RB Series 2017B | 5.00% | 10/01/33 (b) | 100,000 | 103,076 |
RB Series 2022 | 5.00% | 07/01/49 (b) | 200,000 | 216,285 |
Refunding RB Series 2009A | 6.88% | 10/01/34 (b)(c) | 240,000 | 294,305 |
Water & Sewer Refunding RB Series 2015 | 5.00% | 10/01/25 | 270,000 | 281,144 |
Water & Sewer System RB Series 2021 | 4.00% | 10/01/44 (b) | 25,000 | 24,728 |
Miami-Dade School Board | ||||
COP Series 2016C | 3.25% | 02/01/33 (b) | 150,000 | 148,333 |
South Florida Water Management District COP | ||||
Refunding COP Series 2015 | 5.00% | 10/01/35 (b) | 175,000 | 181,670 |
Tampa | ||||
Tax Bonds ( H. Lee Moffitt Cancer Center) Series 2020A | 0.00% | 09/01/45 (b)(d) | 300,000 | 101,281 |
Water & Wastewater RB Series 2022A | 5.25% | 10/01/57 (b) | 200,000 | 222,571 |
Tampa Bay Water | ||||
Utility System RB Series 2022 | 5.00% | 10/01/52 (b) | 35,000 | 38,255 |
3,384,220 | ||||
GEORGIA 2.1% | ||||
Atlanta | ||||
Water & Wastewater Refunding RB Series 2015 | 5.00% | 11/01/40 (b) | 60,000 | 61,447 |
Water & Wastewater Refunding RB Series 2018B | 5.00% | 11/01/43 (b) | 100,000 | 105,511 |
De Kalb Cnty | ||||
Water & Sewerage RB Series 2022 | 5.00% | 10/01/41 (b) | 225,000 | 252,679 |
Fulton Cnty | ||||
Water & Sewerage RB Series 2020A | 2.25% | 01/01/43 (b) | 150,000 | 106,716 |
ISSUER TYPE OF SECURITY, SERIES | RATE | MATURITY | FACE AMOUNT ($) | VALUE ($) |
Georgia | ||||
GO Bonds Series 2017A | 5.00% | 02/01/31 (b) | 200,000 | 215,463 |
GO Bonds Series 2019A | 5.00% | 07/01/29 | 200,000 | 226,676 |
GO Bonds Series 2020A | 5.00% | 08/01/32 (b) | 200,000 | 231,513 |
GO Bonds Series 2020A | 4.00% | 08/01/34 (b) | 140,000 | 150,022 |
GO Bonds Series 2021A | 5.00% | 07/01/33 (b) | 100,000 | 117,405 |
GO Bonds Series 2021A | 4.00% | 07/01/34 (b) | 80,000 | 86,452 |
GO Bonds Series 2021A | 4.00% | 07/01/38 (b) | 200,000 | 207,394 |
Georgia Municipal Electric Auth | ||||
Plant Vogtle Units 3 & 4 Project J Bonds Series 2023A | 5.00% | 07/01/64 (b)(c) | 200,000 | 210,177 |
RB Series 2019B | 5.00% | 01/01/59 (b) | 40,000 | 39,802 |
Georgia Port Auth | ||||
RB Series 2021 | 4.00% | 07/01/46 (b) | 10,000 | 9,912 |
RB Series 2022 | 4.00% | 07/01/52 (b) | 125,000 | 121,727 |
Gwinnett Cnty SD | ||||
Sales Tax GO Bonds Series 2022B | 5.00% | 08/01/27 | 80,000 | 87,096 |
Metropolitan Atlanta Rapid Transit Auth | ||||
Sales Tax Refunding RB Series 2016B | 5.00% | 07/01/33 (b) | 120,000 | 127,286 |
Sales Tax Refunding RB Series 2017C | 3.25% | 07/01/37 (b) | 100,000 | 92,777 |
Private Colleges & Universities Auth | ||||
RB (Emory Univ) Series 2020B | 5.00% | 09/01/25 | 250,000 | 260,524 |
Sandy Springs Public Facilities Auth | ||||
RB Series 2015 | 5.00% | 05/01/41 (a)(b) | 190,000 | 200,866 |
2,911,445 | ||||
HAWAII 0.7% | ||||
Hawaii | ||||
GO Bonds Series 2017FK | 4.00% | 05/01/31 (b) | 250,000 | 259,717 |
GO Refunding Bonds Series 2016FH | 4.00% | 10/01/31 (b) | 150,000 | 153,508 |
Honolulu | ||||
GO Bonds Series 2015A | 5.00% | 10/01/39 (b) | 180,000 | 184,094 |
GO Bonds Series 2021E | 5.00% | 03/01/31 | 285,000 | 329,340 |
926,659 | ||||
ILLINOIS 5.8% | ||||
Chicago | ||||
2nd Lien Water RB Series 2014 | 5.00% | 11/01/39 (b) | 225,000 | 227,492 |
GO Bonds Series 1999 | 0.00% | 01/01/34 (c)(d) | 60,000 | 38,090 |
GO Bonds Series 2023A | 5.00% | 01/01/35 (b) | 50,000 | 54,319 |
GO Bonds Series 2023A | 5.50% | 01/01/43 (b) | 500,000 | 534,825 |
GO Refunding Bonds Series 2020A | 5.00% | 01/01/29 | 180,000 | 192,449 |
Chicago Board of Education | ||||
Dedicated Tax Bonds Series 2016 | 6.10% | 04/01/36 (b) | 130,000 | 139,558 |
Dedicated Tax Bonds Series 2023 | 5.00% | 04/01/45 (b) | 200,000 | 206,999 |
Chicago O’Hare International Airport | ||||
Airport Sr Lien Refunding RB Series 2020A | 4.00% | 01/01/35 (b) | 200,000 | 206,976 |
General Airport Sr Lien Refunding RB Series 2015B | 5.00% | 01/01/33 (b) | 125,000 | 127,921 |
OHare General Airport Sr Lien Refunding RB Series 2015B | 5.00% | 01/01/30 (b) | 80,000 | 81,885 |
OHare General Airport Sr Lien Refunding RB Series 2020A | 5.00% | 01/01/34 (b) | 55,000 | 61,410 |
ISSUER TYPE OF SECURITY, SERIES | RATE | MATURITY | FACE AMOUNT ($) | VALUE ($) |
Sr Lien RB Series 2018B | 5.00% | 01/01/38 (b) | 100,000 | 107,090 |
Sr Lien Refunding RB Series 2015B | 5.00% | 01/01/26 (b) | 150,000 | 153,585 |
Cook Cnty | ||||
Sales Tax RB Series 2021A | 4.00% | 11/15/40 (b) | 250,000 | 247,894 |
Sales Tax RB Series 2021A | 4.00% | 11/15/41 (b) | 225,000 | 221,915 |
Illinois | ||||
GO Bonds Series 2013 | 5.50% | 07/01/38 (b) | 110,000 | 110,033 |
GO Bonds Series 2014 | 5.25% | 02/01/29 (b) | 200,000 | 201,977 |
GO Bonds Series 2017C | 5.00% | 11/01/29 (b) | 525,000 | 560,220 |
GO Bonds Series 2017D | 5.00% | 11/01/25 | 95,000 | 98,103 |
GO Bonds Series 2019B | 4.00% | 11/01/38 (b) | 200,000 | 194,601 |
GO Bonds Series 2020 | 5.50% | 05/01/39 (b) | 265,000 | 289,700 |
GO Bonds Series 2020B | 5.00% | 10/01/30 | 50,000 | 55,662 |
GO Bonds Series 2022A | 5.50% | 03/01/42 (b) | 175,000 | 192,711 |
GO Bonds Series May 2020 | 5.75% | 05/01/45 (b) | 250,000 | 272,381 |
GO Refunding Bonds Series 2016 | 5.00% | 02/01/24 | 345,000 | 347,640 |
GO Refunding Bonds Series 2016 | 5.00% | 02/01/25 | 150,000 | 153,233 |
GO Refunding Bonds Series 2023D | 5.00% | 07/01/36 (b) | 100,000 | 109,110 |
Illinois Finance Auth | ||||
RB (Univ of Chicago) Series 2015A | 5.00% | 10/01/40 (b) | 500,000 | 512,453 |
RB Series 2017 | 5.00% | 07/01/35 (b) | 75,000 | 79,986 |
Illinois Municipal Electric Agency | ||||
Power System Refunding RB Series 2015A | 4.00% | 02/01/34 (b) | 300,000 | 301,521 |
Illinois Toll Highway Auth | ||||
Refunding RB Series 2018A | 5.00% | 01/01/29 | 265,000 | 293,741 |
Sr RB Series 2020A | 5.00% | 01/01/45 (b) | 200,000 | 213,476 |
Toll Highway Sr RB Series 2014C | 5.00% | 01/01/36 (b) | 50,000 | 51,105 |
Toll Highway Sr RB Series 2017A | 5.00% | 01/01/42 (b) | 100,000 | 104,962 |
Toll Highway Sr RB Series 2021A | 4.00% | 01/01/46 (b) | 50,000 | 48,075 |
Toll Sr RB Series 2021A | 5.00% | 01/01/46 (b) | 250,000 | 269,167 |
Metropolitan Pier & Exposition Auth | ||||
RB Series 2002A | 0.00% | 06/15/34 (c)(d) | 325,000 | 210,656 |
Refunding Bonds (McCormick Place Expansion) Series 2020A | 5.00% | 06/15/50 (b) | 200,000 | 203,544 |
Refunding Bonds (McCormick Place) Series 2010B1 | 0.00% | 06/15/47 (c)(d) | 225,000 | 71,693 |
Refunding Bonds Series 2010B-1 | 0.00% | 06/15/43 (d) | 250,000 | 98,782 |
Metropolitan Water Reclamation District of Greater Chicago | ||||
ULT GO Bonds Series 2016C | 5.00% | 12/01/45 (b) | 100,000 | 102,201 |
ULT GO Refunding Bonds Series 2016A | 5.00% | 12/01/25 | 80,000 | 83,547 |
Sales Tax Securitization Corp | ||||
2nd Lien Sales Tax Securitization Bonds Series 2020A | 5.00% | 01/01/30 | 150,000 | 165,576 |
Schaumburg | ||||
GO Refunding Bonds Series 2013A | 4.00% | 12/01/41 (b) | 50,000 | 49,586 |
8,047,850 | ||||
INDIANA 0.2% | ||||
Indiana Finance Auth | ||||
State Revolving Fund Refunding Bonds Series 2015B | 5.00% | 02/01/24 | 90,000 | 90,933 |
Indianapolis Local Public Improvement Bond Bank | ||||
RB Series 1999E | 0.00% | 02/01/28 (c)(d) | 250,000 | 214,530 |
305,463 | ||||
ISSUER TYPE OF SECURITY, SERIES | RATE | MATURITY | FACE AMOUNT ($) | VALUE ($) |
IOWA 0.2% | ||||
Iowa Higher Education Loan Auth | ||||
RB (Grinnell College) Series 2017 | 5.00% | 12/01/46 (b) | 220,000 | 228,300 |
KANSAS 0.1% | ||||
Kansas Department of Transportation | ||||
Highway RB Series 2015B | 5.00% | 09/01/25 | 125,000 | 130,076 |
KENTUCKY 0.8% | ||||
Kentucky Municipal Power Agency | ||||
Power System Refunding RB Series 2015A | 4.00% | 09/01/39 (b)(c) | 325,000 | 313,066 |
Kentucky State Property & Buildings Commission | ||||
Refunding RB Series B | 5.00% | 11/01/25 | 285,000 | 296,353 |
Refunding RB Series B | 5.00% | 11/01/26 | 250,000 | 264,486 |
Kentucky Turnpike Auth | ||||
Economic Development Road Refunding RB Series 2017B | 5.00% | 07/01/25 | 255,000 | 263,472 |
Louisville & Jefferson Cnty Metro Sewer District | ||||
Sewer & Drainage System RB Series 2013B | 4.00% | 05/15/37 (b) | 25,000 | 25,003 |
1,162,380 | ||||
LOUISIANA 0.4% | ||||
Louisiana | ||||
Refunding RB Bonds Series 2015A | 4.50% | 05/01/39 (a)(b) | 250,000 | 256,361 |
Louisiana Public Facilities Auth | ||||
Refunding RB (Tulane Univ) Series 2020A | 5.00% | 04/01/45 (b) | 250,000 | 264,750 |
New Orleans | ||||
Water Refunding RB Series 2014 | 5.00% | 12/01/44 (a)(b) | 100,000 | 102,552 |
623,663 | ||||
MARYLAND 2.3% | ||||
Baltimore Cnty | ||||
GO Bonds | 5.00% | 03/01/53 (b) | 200,000 | 221,797 |
Maryland | ||||
GO Bonds 2nd Series 2017A | 5.00% | 08/01/27 | 315,000 | 342,180 |
GO Bonds 2nd Series 2019A | 2.13% | 08/01/33 (b) | 290,000 | 255,180 |
ULT GO Bonds Series 2017 | 5.00% | 03/15/29 (b) | 300,000 | 324,215 |
ULT GO Bonds Series 2017B | 5.00% | 08/01/25 | 775,000 | 806,704 |
Maryland Dept of Transportation | ||||
Consolidated Bonds Series 2021A | 2.13% | 10/01/36 (b) | 190,000 | 154,947 |
RB Series 2018 | 5.00% | 10/01/26 | 180,000 | 191,662 |
Transportation Bonds Series 2018 | 5.00% | 10/01/28 (b) | 85,000 | 90,895 |
Transportation Bonds Series 2019 | 2.50% | 10/01/33 (b) | 160,000 | 146,519 |
Maryland Health & Higher Educational Facilities Auth | ||||
RB (Anne Arundel Health System) Series 2014 | 4.00% | 07/01/39 (a)(b) | 245,000 | 246,882 |
Maryland Transportation Auth | ||||
Transportation Facilities RB Series 2020 | 4.00% | 07/01/50 (b) | 150,000 | 145,559 |
Prince Georges Cnty | ||||
GO Bonds Series 2018A | 5.00% | 07/15/29 (b) | 245,000 | 271,918 |
3,198,458 | ||||
ISSUER TYPE OF SECURITY, SERIES | RATE | MATURITY | FACE AMOUNT ($) | VALUE ($) |
MASSACHUSETTS 4.5% | ||||
Massachusetts | ||||
GO Bonds Series 2020E | 5.00% | 11/01/50 (b) | 300,000 | 322,726 |
GO Bonds Series 2015A | 4.00% | 05/01/35 (b) | 100,000 | 100,027 |
GO Bonds Series 2015B | 4.00% | 05/01/39 (b) | 100,000 | 100,001 |
GO Bonds Series 2015E | 3.25% | 09/01/40 (b) | 110,000 | 100,258 |
GO Bonds Series 2016E | 4.00% | 04/01/35 (b) | 45,000 | 45,331 |
GO Bonds Series 2016H | 5.00% | 12/01/26 | 75,000 | 80,329 |
GO Bonds Series 2017E | 5.00% | 11/01/31 (b) | 150,000 | 163,738 |
GO Bonds Series 2019E | 5.00% | 05/01/31 (b) | 200,000 | 203,000 |
GO Bonds Series 2020D | 3.00% | 07/01/35 (b) | 200,000 | 189,805 |
GO Bonds Series 2020D | 5.00% | 07/01/40 (b) | 105,000 | 115,117 |
GO Bonds Series 2020E | 5.00% | 11/01/45 (b) | 250,000 | 271,306 |
GO Bonds Series 2021A | 3.00% | 03/01/36 (b) | 250,000 | 234,081 |
GO Bonds Series 2021D | 5.00% | 09/01/50 (b) | 250,000 | 270,783 |
GO Bonds Series E | 3.00% | 11/01/34 (b) | 115,000 | 111,596 |
GO Refunding Bonds Series 2016C | 5.00% | 10/01/24 | 190,000 | 194,582 |
GO Refunding Bonds Series 2017E | 5.00% | 11/01/26 | 140,000 | 149,664 |
GO Refunding Bonds Series 2017E | 5.00% | 11/01/27 | 145,000 | 158,545 |
GO Refunding Bonds Series 2020D | 4.00% | 11/01/41 (b) | 150,000 | 150,617 |
Refunding GO Bonds Series 2006B | 5.25% | 09/01/24 (c) | 500,000 | 512,641 |
Massachusetts Bay Transportation Auth | ||||
Assessment Bonds Series 2022A1 | 3.13% | 07/01/41 (b) | 50,000 | 44,679 |
Sr Sales Tax Bonds Series 2005A | 5.00% | 07/01/25 | 145,000 | 150,669 |
Sub Sales Tax BAN RB Series 2021 | 4.00% | 05/01/25 (a) | 205,000 | 208,231 |
Sub Sales Tax BAN RB Series 2021 | 4.00% | 05/01/25 | 15,000 | 15,266 |
Massachusetts Development Finance Agency | ||||
RB (Boston Univ) Series 2013X | 5.00% | 10/01/48 (b) | 170,000 | 170,261 |
RB (Emerson College) Series 2016A | 5.00% | 01/01/47 (b) | 200,000 | 200,671 |
RB (Harvard Univ) Series 2016A | 5.00% | 07/15/24 | 250,000 | 255,144 |
RB (Harvard Univ) Series 2016A | 5.00% | 07/15/26 | 275,000 | 293,056 |
RB (Northeastern Univ) Series 2022 | 5.00% | 10/01/44 (b) | 85,000 | 94,795 |
Massachusetts School Building Auth | ||||
Sub Sales Tax Bonds Series 2018A | 5.25% | 02/15/48 (b) | 200,000 | 212,699 |
Sub Sales Tax Series 2018B | 5.25% | 02/15/48 (b) | 350,000 | 372,223 |
Massachusetts Transportation Fund | ||||
RB Series 2022B | 5.00% | 06/01/52 (b) | 300,000 | 326,826 |
Refunding RB Series 2021A | 5.00% | 06/01/43 (b) | 130,000 | 143,359 |
Massachusetts Water Resources Auth | ||||
General Refunding RB Series 2016C | 5.00% | 08/01/40 (a)(b) | 200,000 | 212,983 |
Refunding RB Series 2016C | 5.00% | 08/01/33 (a)(b) | 100,000 | 106,491 |
6,281,500 | ||||
MICHIGAN 0.7% | ||||
Great Lakes Water Auth | ||||
Sewage Disposal System Sr Lien Refunding RB Series 2016B | 5.00% | 07/01/30 (b) | 110,000 | 116,126 |
Lansing | ||||
Utility System RB Series 2019A | 5.00% | 07/01/48 (b) | 25,000 | 26,446 |
Michigan | ||||
Trunk Line Fund Bonds Series 2020B | 4.00% | 11/15/45 (b) | 150,000 | 147,559 |
ISSUER TYPE OF SECURITY, SERIES | RATE | MATURITY | FACE AMOUNT ($) | VALUE ($) |
Michigan Building Auth | ||||
Refunding RB Series 2015I | 5.00% | 04/15/33 (b) | 150,000 | 155,805 |
Michigan Finance Auth | ||||
RB (Public Lighting Auth) Series 2014B | 5.00% | 07/01/39 (b) | 200,000 | 200,311 |
Water System 2nd Lien Refunding RB Series 2014D6 | 5.00% | 07/01/36 (b)(c) | 100,000 | 101,023 |
Wayne Cnty Airport Auth | ||||
Airport RB Series 2021A | 5.00% | 12/01/46 (b) | 220,000 | 237,374 |
984,644 | ||||
MINNESOTA 0.4% | ||||
Minneapolis Metropolitan Council | ||||
ULT GO Series 2021C | 5.00% | 12/01/26 | 115,000 | 123,210 |
Minnesota | ||||
GO Bonds Series 2021A | 4.00% | 09/01/40 (b) | 200,000 | 206,356 |
GO Refunding Bonds Series 2017D | 5.00% | 10/01/23 | 250,000 | 251,093 |
580,659 | ||||
MISSISSIPPI 0.1% | ||||
Mississippi | ||||
GO Refunding Bonds Series 2017A | 5.00% | 10/01/34 (a)(b) | 75,000 | 81,857 |
West Ranking Utility Auth | ||||
RB Series 2018 | 5.00% | 01/01/48 (a)(b)(c) | 50,000 | 54,540 |
136,397 | ||||
MISSOURI 0.3% | ||||
Missouri Health & Educational Facilities Auth | ||||
Educational Facilities RB (St Louis Univ) Series 2019A | 5.00% | 10/01/46 (b) | 55,000 | 58,696 |
Univ of Missouri Curators | ||||
System Facilities RB Series 2020B | 5.00% | 11/01/30 | 325,000 | 375,635 |
434,331 | ||||
NEBRASKA 0.1% | ||||
Omaha Public Power District | ||||
Electric System RB Series 2017A | 4.00% | 02/01/42 (b) | 75,000 | 75,180 |
Electric System RB Series 2019A | 5.00% | 02/01/31 (b) | 110,000 | 122,801 |
197,981 | ||||
NEVADA 1.0% | ||||
Clark Cnty | ||||
Airport System Sub Lien Refunding RB Series 2019D | 5.00% | 07/01/23 | 145,000 | 145,000 |
Airport System Sub Refunding RB Series 2019D | 5.00% | 07/01/25 | 100,000 | 103,635 |
GO Bonds Series 2018A | 5.00% | 06/01/43 (b) | 165,000 | 174,838 |
Clark Cnty SD | ||||
GO Refunding Bonds Series 2017A | 5.00% | 06/15/25 | 200,000 | 206,793 |
ISSUER TYPE OF SECURITY, SERIES | RATE | MATURITY | FACE AMOUNT ($) | VALUE ($) |
Las Vegas Valley Water District | ||||
Refunding GO Bonds Series 2015 | 5.00% | 06/01/39 (b) | 270,000 | 274,874 |
Water Improvement GO Bonds Series 2022A | 4.00% | 06/01/51 (b) | 250,000 | 244,187 |
Water Improvement GO Refunding Bonds Series 2016A | 5.00% | 06/01/46 (b) | 200,000 | 206,189 |
1,355,516 | ||||
NEW JERSEY 4.9% | ||||
Hudson Cnty Improvement Auth | ||||
Lease RB (Hudson Cnty Courthouse) Series 2020 | 4.00% | 10/01/51 (b) | 150,000 | 148,960 |
New Jersey | ||||
GO Bonds | 4.00% | 06/01/33 (b) | 150,000 | 152,431 |
GO Bonds Series 2020A | 5.00% | 06/01/28 | 200,000 | 219,382 |
GO Bonds Series 2020A | 4.00% | 06/01/30 | 60,000 | 63,743 |
GO Bonds Series 2020A | 4.00% | 06/01/31 | 140,000 | 149,696 |
ULT GO Series 2020A | 5.00% | 06/01/29 | 305,000 | 340,812 |
New Jersey Economic Development Auth | ||||
RB Series 2016AAA | 5.00% | 06/15/41 (a)(b) | 190,000 | 203,649 |
Refunding Bonds Series 2005N1 | 5.50% | 09/01/26 (c) | 140,000 | 149,025 |
State Lease RB Series 2018A | 5.00% | 06/15/47 (b) | 250,000 | 257,066 |
Transportation Bonds Series 2022A | 5.00% | 11/01/52 (b) | 195,000 | 204,980 |
New Jersey Transportation Trust Fund Auth | ||||
RB Series 2013AA | 5.00% | 06/15/36 (b) | 220,000 | 220,000 |
RB Series 2016A1 | 5.00% | 06/15/28 (b) | 720,000 | 753,977 |
RB Series 2016A1 | 4.10% | 06/15/31 (b) | 525,000 | 534,013 |
RB Series 2018A | 5.00% | 06/15/31 (b) | 290,000 | 302,873 |
RB Series 2021A | 5.00% | 06/15/31 | 100,000 | 112,746 |
Transportation Bonds Series 2019BB | 5.00% | 06/15/50 (b) | 145,000 | 149,635 |
Transportation Bonds Series 2020AA | 5.00% | 06/15/50 (b) | 200,000 | 210,996 |
Transportation Program Bonds Series 2014AA | 5.00% | 06/15/38 (b) | 60,000 | 60,590 |
Transportation Program Bonds Series 2015AA | 4.75% | 06/15/38 (b) | 65,000 | 65,652 |
Transportation Program Notes Series 2014 BB1 | 5.00% | 06/15/33 (b) | 80,000 | 86,539 |
Transportation Program RB Series 2014AA | 4.25% | 06/15/44 (b) | 30,000 | 29,724 |
Transportation RB Series 2019BB | 3.50% | 06/15/46 (b) | 125,000 | 107,570 |
Transportation RB Series 2020AA | 4.00% | 06/15/50 (b) | 160,000 | 151,062 |
Transportation System Bonds Series 2009A | 0.00% | 12/15/33 (b)(d) | 130,000 | 87,404 |
Transportation System Bonds Series 2018A | 5.00% | 12/15/34 (b) | 365,000 | 393,213 |
Transportation System RB Series 2006C | 0.00% | 12/15/24 (c)(d) | 75,000 | 71,197 |
Transportation System RB Series 2009A | 0.00% | 12/15/34 (d) | 125,000 | 79,972 |
Transportation System RB Series 2010A | 0.00% | 12/15/28 (d) | 700,000 | 576,911 |
Transportation System RB Series 2021A | 4.00% | 06/15/34 (b) | 15,000 | 15,504 |
New Jersey Turnpike Auth | ||||
RB Series 2014A | 4.00% | 01/01/35 (b) | 125,000 | 125,310 |
RB Series 2015E | 5.00% | 01/01/45 (b) | 150,000 | 152,795 |
Refunding RB Series 2005D3 | 5.25% | 01/01/26 (c) | 300,000 | 313,792 |
Turnpike RB Series 2017A | 5.00% | 01/01/34 (b) | 185,000 | 196,228 |
Turnpike RB Series 2019A | 4.00% | 01/01/48 (b) | 155,000 | 153,735 |
6,841,182 | ||||
ISSUER TYPE OF SECURITY, SERIES | RATE | MATURITY | FACE AMOUNT ($) | VALUE ($) |
NEW MEXICO 0.1% | ||||
New Mexico Finance Auth | ||||
RB Series 2018A | 5.00% | 06/15/24 | 155,000 | 157,673 |
NEW YORK 22.6% | ||||
Hudson Yards Infrastructure | ||||
2nd Indenture RB Fiscal 2017 Series A | 4.00% | 02/15/36 (b) | 290,000 | 295,270 |
2nd Indenture RB Fiscal 2017 Series A | 4.00% | 02/15/44 (b) | 100,000 | 98,794 |
Long Island Power Auth | ||||
Electric System RB Series 2016B | 5.00% | 09/01/41 (b) | 190,000 | 197,632 |
Electric System RB Series 2018 | 5.00% | 09/01/38 (b) | 120,000 | 129,971 |
Metropolitan Transportation Auth | ||||
Dedicated Tax Fund Bonds Series 2017A | 5.00% | 11/15/35 (b) | 115,000 | 123,124 |
Dedicated Tax Fund Refunding Bonds Series 2012A | 0.00% | 11/15/30 (d) | 150,000 | 116,402 |
RB Series 2012E | 4.00% | 11/15/38 (b) | 200,000 | 197,505 |
RB Series 2012H | 3.63% | 11/15/37 (b) | 150,000 | 135,629 |
RB Series 2017B | 5.00% | 11/15/25 | 100,000 | 103,068 |
RB Series 2017D | 4.00% | 11/15/42 (b) | 205,000 | 197,226 |
RB Series 2020A1 | 4.00% | 11/15/52 (b) | 100,000 | 92,664 |
Refunding RB Series 2017B | 5.00% | 11/15/27 | 205,000 | 216,899 |
Refunding RB Series 2017C2 | 0.00% | 11/15/40 (d) | 405,000 | 178,439 |
Transportation RB Series 2012C | 4.25% | 11/15/42 (b) | 115,000 | 113,007 |
Transportation RB Series 2013A | 5.00% | 11/15/38 (b) | 85,000 | 85,006 |
Transportation RB Series 2013D | 5.00% | 11/15/38 (b) | 70,000 | 70,026 |
Transportation RB Series 2013E | 5.00% | 11/15/38 (b) | 155,000 | 155,058 |
Transportation RB Series 2014D1 | 5.00% | 11/15/39 (b) | 125,000 | 125,670 |
Transportation RB Series 2019C | 5.00% | 11/15/40 (b) | 175,000 | 183,385 |
Monroe Cnty IDA | ||||
RB (Univ of Rochester) Series 2017C | 4.00% | 07/01/43 (b) | 90,000 | 88,889 |
Nassau Cnty Interim Finance Auth | ||||
Sales Tax Secured Bonds Series 2021A | 5.00% | 11/15/31 (b) | 110,000 | 130,388 |
New York City | ||||
GO Bonds Fiscal 2014 Series D1 | 5.00% | 08/01/30 (b) | 200,000 | 200,518 |
GO Bonds Fiscal 2016 Series C | 5.00% | 08/01/31 (b) | 150,000 | 157,107 |
GO Bonds Fiscal 2016 Series C | 3.00% | 08/01/34 (b) | 180,000 | 176,572 |
GO Bonds Fiscal 2017 Series A1 | 4.00% | 08/01/34 (b) | 105,000 | 107,787 |
GO Bonds Fiscal 2018 Series B1 | 5.25% | 10/01/33 (b) | 445,000 | 486,456 |
GO Bonds Fiscal 2018 Series C | 5.00% | 08/01/24 | 300,000 | 305,930 |
GO Bonds Fiscal 2018 Series F1 | 5.00% | 04/01/34 (b) | 125,000 | 136,474 |
GO Bonds Fiscal 2019 Series A | 5.00% | 08/01/26 | 160,000 | 169,852 |
GO Bonds Fiscal 2019 Series D1 | 5.00% | 12/01/33 (b) | 90,000 | 99,365 |
GO Bonds Fiscal 2019 Series E | 5.00% | 08/01/27 | 100,000 | 108,227 |
GO Bonds Fiscal 2020 Series C1 | 5.00% | 08/01/25 | 310,000 | 321,921 |
GO Bonds Fiscal 2020 Series C1 | 5.00% | 08/01/30 | 500,000 | 571,981 |
GO Bonds Fiscal 2020 Series D1 | 4.00% | 03/01/50 (b) | 100,000 | 97,574 |
GO Bonds Fiscal 2021 Series F | 3.00% | 03/01/51 (b) | 200,000 | 152,823 |
GO Bonds Fiscal 2023 Series A1 | 5.00% | 09/01/25 | 265,000 | 275,648 |
GO Bonds Fiscal 2023 Series A1 | 4.00% | 09/01/46 (b) | 35,000 | 34,488 |
GO Bonds Series 2016A | 5.00% | 08/01/26 (b) | 135,000 | 140,136 |
ISSUER TYPE OF SECURITY, SERIES | RATE | MATURITY | FACE AMOUNT ($) | VALUE ($) |
ULT GO Series 2015F1 | 3.50% | 06/01/33 (b) | 185,000 | 186,220 |
ULT GO Series 2018F1 | 5.00% | 04/01/43 (b) | 125,000 | 132,442 |
New York City Municipal Water Finance Auth | ||||
Water & Sewer System 2nd Resolution RB Fiscal 2013 Series CC | 3.75% | 06/15/47 (b) | 100,000 | 93,474 |
Water & Sewer System 2nd Resolution RB Fiscal 2015 Series AA | 4.00% | 06/15/44 (b) | 80,000 | 79,584 |
Water & Sewer System 2nd Resolution RB Fiscal 2015 Series CC | 4.00% | 06/15/45 (b) | 35,000 | 34,738 |
Water & Sewer System 2nd Resolution RB Fiscal 2017 Series CC1 | 4.00% | 06/15/46 (b) | 200,000 | 198,244 |
Water & Sewer System 2nd Resolution RB Fiscal 2018 Series CC1 | 4.00% | 06/15/48 (b) | 150,000 | 148,196 |
Water & Sewer System 2nd Resolution RB Fiscal 2018 Series EE | 5.00% | 06/15/40 (b) | 200,000 | 213,116 |
Water & Sewer System 2nd Resolution RB Fiscal 2019 Series FF2 | 4.00% | 06/15/41 (b) | 200,000 | 200,373 |
Water & Sewer System 2nd Resolution RB Fiscal 2020 Series AA | 4.00% | 06/15/40 (b) | 500,000 | 502,043 |
Water & Sewer System 2nd Resolution RB Fiscal 2020 Series DD1 | 5.00% | 06/15/30 | 265,000 | 306,130 |
Water & Sewer System 2nd Resolution RB Fiscal 2020 Series FF | 5.00% | 06/15/41 (b) | 255,000 | 279,149 |
Water & Sewer System 2nd Resolution RB Fiscal 2021 Series AA1 | 5.00% | 06/15/29 | 300,000 | 340,046 |
Water & Sewer System 2nd Resolution RB Fiscal 2021 Series BB1 | 4.00% | 06/15/50 (b) | 200,000 | 196,943 |
Water & Sewer System 2nd Resolution RB Fiscal 2022 Series AA1 | 4.00% | 06/15/51 (b) | 15,000 | 14,749 |
Water & Sewer System 2nd Resolution RB Fiscal 2022 Series BB1 | 5.00% | 06/15/44 (b) | 325,000 | 357,452 |
Water & Sewer System 2nd Resolution RB Fiscal 2023 Series AA1 | 5.25% | 06/15/52 (b) | 30,000 | 33,636 |
New York City Transitional Finance Auth | ||||
Building Aid RB Fiscal 2015 Series S1 | 5.00% | 07/15/40 (b) | 200,000 | 204,243 |
Building Aid RB Fiscal 2015 Series S2 | 5.00% | 07/15/40 (b) | 200,000 | 205,721 |
Building Aid RB Fiscal 2016 Series S1 | 4.00% | 07/15/40 (b) | 100,000 | 100,101 |
Building Aid RB Fiscal 2019 Series S3A | 5.00% | 07/15/34 (b)(c) | 275,000 | 302,396 |
Building Aid RB Fiscal 2019 Series S3A | 5.00% | 07/15/35 (b) | 140,000 | 152,740 |
Building Aid RB Fiscal 2022 Series S1A | 5.00% | 07/15/29 (c) | 205,000 | 231,780 |
Future Tax Secured Sub Bonds Fiscal 2015 Series B1 | 5.00% | 08/01/32 (b) | 175,000 | 177,976 |
Future Tax Secured Sub Bonds Fiscal 2015 Series B1 | 5.00% | 08/01/36 (b) | 10,000 | 10,152 |
Future Tax Secured Sub Bonds Fiscal 2015 Series E1 | 5.00% | 02/01/41 (b) | 100,000 | 101,831 |
Future Tax Secured Sub Bonds Fiscal 2016 Series E1 | 3.00% | 02/01/33 (b) | 285,000 | 281,516 |
Future Tax Secured Sub Bonds Fiscal 2016 Series E1 | 5.00% | 02/01/39 (b) | 50,000 | 51,643 |
Future Tax Secured Sub Bonds Fiscal 2016 Series F3 | 3.00% | 02/01/39 (b) | 100,000 | 87,014 |
Future Tax Secured Sub Bonds Fiscal 2017 Series C | 5.00% | 11/01/25 | 300,000 | 313,527 |
Future Tax Secured Sub Bonds Fiscal 2017 Series F1 | 3.25% | 05/01/43 (b) | 105,000 | 91,533 |
Future Tax Secured Sub Bonds Fiscal 2018 Series A2 | 5.00% | 08/01/35 (b) | 85,000 | 91,199 |
Future Tax Secured Sub Bonds Fiscal 2020 Series A3 | 3.00% | 05/01/45 (b) | 250,000 | 200,676 |
Future Tax Secured Sub Bonds Fiscal 2020 Series B1 | 3.00% | 11/01/47 (b) | 150,000 | 117,801 |
Future Tax Secured Sub Bonds Fiscal 2021 Series A | 5.00% | 11/01/27 | 100,000 | 109,000 |
Future Tax Secured Sub Bonds Fiscal 2021 Series C1 | 4.00% | 05/01/42 (b) | 100,000 | 99,115 |
Future Tax Secured Sub Bonds Fiscal 2021 Series E1 | 4.00% | 02/01/40 (b) | 10,000 | 10,008 |
Future Tax Secured Sub Bonds Fiscal 2021 Series F1 | 5.00% | 11/01/27 | 100,000 | 109,000 |
Future Tax Secured Sub Bonds Fiscal 2021 Series F1 | 5.00% | 11/01/29 | 250,000 | 282,634 |
Future Tax Secured Sub Bonds Fiscal 2021 Series F1 | 5.00% | 11/01/33 (b) | 190,000 | 219,442 |
Future Tax Secured Sub Bonds Fiscal 2022 Series A1 | 5.00% | 11/01/28 | 215,000 | 238,665 |
Future Tax Secured Sub Bonds Fiscal 2022 Series B | 4.00% | 08/01/48 (b) | 150,000 | 147,264 |
Future Tax Secured Sub Bonds Fiscal 2022 Series B1 | 4.00% | 08/01/45 (b) | 85,000 | 83,994 |
Future Tax Secured Sub Bonds Fiscal 2022 Series B1 | 3.00% | 08/01/48 (b) | 200,000 | 155,849 |
Future Tax Secured Sub Bonds Fiscal 2022 Series C1 | 5.00% | 02/01/37 (b) | 250,000 | 283,871 |
Future Tax Secured Sub Bonds Fiscal 2022 Series F1 | 5.00% | 02/01/42 (b) | 165,000 | 182,194 |
Future Tax Secured Sub Bonds Fiscal 2022 Series F1 | 5.00% | 02/01/47 (b) | 150,000 | 163,702 |
Future Tax Secured Sub Bonds Fiscal 2023 Series B1 | 5.00% | 11/01/25 | 250,000 | 261,272 |
ISSUER TYPE OF SECURITY, SERIES | RATE | MATURITY | FACE AMOUNT ($) | VALUE ($) |
Future Tax Secured Sub Bonds Fiscal 2023 Series F1 | 5.00% | 02/01/44 (b) | 200,000 | 222,037 |
RB Fiscal 2018 Series S1 | 4.00% | 07/15/36 (b) | 150,000 | 152,780 |
RB Fiscal 2019 Series S2A | 5.00% | 07/15/35 (b)(c) | 175,000 | 190,925 |
RB Series C1 | 4.00% | 05/01/45 (b) | 285,000 | 281,643 |
New York Power Auth | ||||
RB Series 2020A | 4.00% | 11/15/50 (b) | 250,000 | 244,931 |
New York State Dormitory Auth | ||||
RB (Columbia Univ) Series 2020A | 5.00% | 10/01/50 (b) | 200,000 | 236,547 |
RB (New School Univ) Series 2016A | 4.00% | 07/01/43 (b) | 160,000 | 149,852 |
RB (New York Univ) Series 2016A | 5.00% | 07/01/33 (b) | 100,000 | 105,440 |
RB (New York Univ) Series 2019A | 4.00% | 07/01/45 (b) | 145,000 | 140,828 |
RB (New York Univ) Series 2021 | 4.00% | 07/01/46 (b) | 20,000 | 19,359 |
RB (Rockefeller Univ) Series 2019C | 4.00% | 07/01/49 (b) | 150,000 | 144,671 |
RB Series 2015A | 5.00% | 07/01/35 (b) | 200,000 | 206,450 |
RB Series 2019A | 4.00% | 07/01/44 (b) | 100,000 | 96,016 |
RB Series 2022A | 5.00% | 10/01/32 (b)(c) | 125,000 | 142,695 |
Refunding RB (Cornell Univ) Series 2020A | 4.00% | 07/01/50 (b) | 275,000 | 270,797 |
Sales Tax RB Series 2015B | 5.00% | 03/15/45 (b) | 100,000 | 102,728 |
Sales Tax RB Series 2018A | 5.00% | 03/15/40 (b) | 50,000 | 53,403 |
Sales Tax RB Series 2018E | 5.00% | 03/15/48 (b) | 250,000 | 265,495 |
State Personal Income Tax RB Series 2014C | 5.00% | 03/15/29 (b) | 300,000 | 303,674 |
State Personal Income Tax RB Series 2014C | 5.00% | 03/15/38 (b) | 75,000 | 75,748 |
State Personal Income Tax RB Series 2015A | 4.00% | 03/15/32 (b) | 175,000 | 178,171 |
State Personal Income Tax RB Series 2015B | 5.00% | 02/15/32 (b) | 200,000 | 205,239 |
State Personal Income Tax RB Series 2015B | 5.00% | 02/15/39 (b) | 250,000 | 254,696 |
State Personal Income Tax RB Series 2015E | 3.25% | 03/15/36 (b) | 55,000 | 52,834 |
State Personal Income Tax RB Series 2016A | 5.00% | 02/15/33 (b) | 200,000 | 211,638 |
State Personal Income Tax RB Series 2016A | 5.00% | 02/15/36 (b) | 100,000 | 105,120 |
State Personal Income Tax RB Series 2017A | 5.00% | 02/15/27 (a) | 75,000 | 80,585 |
State Personal Income Tax RB Series 2017A | 5.00% | 02/15/38 (b) | 100,000 | 105,195 |
State Personal Income Tax RB Series 2017B | 5.00% | 02/15/28 (b) | 310,000 | 335,034 |
State Personal Income Tax RB Series 2017B | 5.00% | 02/15/37 (b) | 55,000 | 58,463 |
State Personal Income Tax RB Series 2017B | 5.00% | 02/15/38 (b) | 125,000 | 132,578 |
State Personal Income Tax RB Series 2018A | 5.00% | 03/15/32 (b) | 100,000 | 110,236 |
State Personal Income Tax RB Series 2019A | 5.00% | 03/15/39 (b) | 60,000 | 64,909 |
State Personal Income Tax RB Series 2019D | 5.00% | 02/15/30 | 200,000 | 227,517 |
State Personal Income Tax RB Series 2019D | 5.00% | 02/15/33 (b) | 350,000 | 396,631 |
State Personal Income Tax RB Series 2019D | 4.00% | 02/15/47 (b) | 250,000 | 244,603 |
State Personal Income Tax RB Series 2019D | 5.00% | 02/15/48 (b) | 215,000 | 229,727 |
State Personal Income Tax RB Series 2020A | 4.00% | 03/15/36 (b) | 160,000 | 165,354 |
State Personal Income Tax RB Series 2020A | 3.00% | 03/15/41 (b) | 100,000 | 84,698 |
State Personal Income Tax RB Series 2021A | 5.00% | 02/15/25 (a) | 460,000 | 474,222 |
State Personal Income Tax RB Series 2021A | 5.00% | 03/15/31 | 310,000 | 358,685 |
State Personal Income Tax RB Series 2021A | 5.00% | 03/15/34 (b) | 60,000 | 69,126 |
State Personal Income Tax RB Series 2022A | 5.00% | 03/15/46 (b) | 200,000 | 218,252 |
State Personal Income Tax Refunding RB Series 2016D | 5.00% | 02/15/28 (b) | 270,000 | 285,877 |
State Sales Tax RB Series 2016A | 5.00% | 03/15/27 (a)(b) | 150,000 | 160,203 |
State Sales Tax RB Series 2018E | 5.00% | 03/15/34 (b) | 160,000 | 176,175 |
State Sales Tax RB Series 2018E | 5.00% | 03/15/41 (b) | 400,000 | 428,956 |
States Sales Tax RB Series 2018A | 4.00% | 03/15/47 (b) | 75,000 | 74,046 |
ISSUER TYPE OF SECURITY, SERIES | RATE | MATURITY | FACE AMOUNT ($) | VALUE ($) |
New York State Environmental Facilities Corp | ||||
State Clean Water & Drinking Water Revolving Funds RB Series 2020A | 4.00% | 06/15/45 (b) | 150,000 | 150,377 |
State Clean Water & Drinking Water Revolving Funds RB Series 2022A | 5.00% | 06/15/51 (b) | 250,000 | 275,129 |
New York State Thruway Auth | ||||
General Revenue Jr Obligations Series 2019B | 4.00% | 01/01/41 (b) | 125,000 | 123,314 |
General Revenue Jr Obligations Series 2019B | 3.00% | 01/01/53 (b)(c) | 85,000 | 63,123 |
Jr GO RB Series 2019B | 4.00% | 01/01/39 (b) | 175,000 | 175,527 |
Jr Obligation RB Series 2019B | 5.00% | 01/01/30 | 135,000 | 152,903 |
Jr RB Series 2016A | 4.00% | 01/01/51 (b) | 85,000 | 81,562 |
State Personal Income Tax RB Series 2021A1 | 5.00% | 03/15/35 (b) | 435,000 | 495,886 |
State Personal Income Tax RB Series 2021A1 | 4.00% | 03/15/41 (b) | 250,000 | 249,543 |
State Personal Income Tax RB Series 2021A1 | 4.00% | 03/15/56 (b) | 335,000 | 319,693 |
State Personal Income Tax RB Series 2022A | 5.00% | 03/15/30 | 200,000 | 228,373 |
State Personal Income Tax RB Series 2022A | 5.00% | 03/15/39 (b) | 190,000 | 214,523 |
New York State Urban Development Corp | ||||
Sales Tax RB Series 2021A | 3.00% | 03/15/50 (b) | 120,000 | 92,528 |
State Personal Income Tax RB Series 2015A | 5.00% | 03/15/45 (b) | 250,000 | 254,179 |
State Personal Income Tax RB Series 2016A | 5.00% | 03/15/27 (a)(b) | 55,000 | 57,843 |
State Personal Income Tax RB Series 2017A | 5.00% | 03/15/27 (a) | 155,000 | 167,138 |
State Personal Income Tax RB Series 2020A | 3.00% | 03/15/50 (b) | 105,000 | 80,505 |
State Sales Tax RB Series 2019A | 4.00% | 03/15/43 (b) | 100,000 | 99,587 |
State Sales Tax RB Series 2021A | 4.00% | 03/15/44 (b) | 60,000 | 59,605 |
Onondaga Cnty | ||||
RB (Syracuse Univ) Series 2019 | 4.00% | 12/01/49 (b) | 155,000 | 150,399 |
Port Auth of New York & New Jersey | ||||
Consolidated Bonds 184th Series | 5.00% | 09/01/35 (b) | 10,000 | 10,179 |
Consolidated Bonds 200th Series | 5.25% | 10/15/57 (b) | 200,000 | 209,173 |
Sales Tax Asset Receivable Corp | ||||
RB Fiscal 2015 Series A | 5.00% | 10/15/31 (a)(b) | 565,000 | 579,333 |
Suffolk Cnty Water Auth | ||||
Water System Refunding RB Series 2015 | 3.00% | 06/01/32 (b) | 300,000 | 300,725 |
Triborough Bridge & Tunnel Auth | ||||
General RB Series 2015A | 5.00% | 11/15/50 (b) | 150,000 | 152,363 |
General RB Series 2018A | 5.00% | 11/15/45 (b) | 200,000 | 211,811 |
General RB Series 2022A | 5.00% | 11/15/47 (b) | 290,000 | 316,135 |
General Refunding RB Series 2017C1 | 5.00% | 11/15/25 | 200,000 | 209,285 |
General Refunding RB Series 2018B | 5.00% | 11/15/30 | 50,000 | 58,046 |
Payroll Mobility Tax Sr Lien Bonds Series 2021C3 | 2.50% | 05/15/51 (b) | 100,000 | 66,991 |
Payroll Mobility Tax Sr Lien Bonds Series 2022A | 5.00% | 05/15/57 (b) | 200,000 | 214,944 |
Payroll Mobility Tax Sr Lien Bonds Series 2022C | 5.25% | 05/15/52 (b) | 250,000 | 276,723 |
Sales Tax RB Series 2022A | 4.00% | 05/15/57 (b) | 150,000 | 145,392 |
Sales Tax RB Series 2023A | 4.13% | 05/15/53 (b) | 100,000 | 98,225 |
Sales Tax RB Series 2023A | 4.25% | 05/15/58 (b) | 100,000 | 99,276 |
Sr Lien RB Series 2021A1 | 5.00% | 05/15/51 (b) | 75,000 | 80,793 |
Sr Lien RB Series 2021C3 | 4.00% | 05/15/51 (b) | 225,000 | 217,961 |
Sr Lien RB Series 2022A | 4.00% | 05/15/51 (b) | 175,000 | 169,525 |
Sr Lien RB Series 2022D2 | 4.50% | 05/15/47 (b) | 20,000 | 20,563 |
Sub Refunding RB Series 2013A | 0.00% | 11/15/31 (d) | 305,000 | 225,245 |
ISSUER TYPE OF SECURITY, SERIES | RATE | MATURITY | FACE AMOUNT ($) | VALUE ($) |
Utility Debt Securitization Auth | ||||
Restructuring Bonds Series 2015 | 5.00% | 12/15/33 (b) | 250,000 | 262,197 |
Restructuring Bonds Series 2015 | 5.00% | 12/15/36 (b) | 250,000 | 260,514 |
31,533,230 | ||||
NORTH CAROLINA 0.9% | ||||
North Carolina | ||||
Refunding RB Series 2014B | 5.00% | 06/01/24 | 150,000 | 152,565 |
North Carolina Capital Facilities Finance Agency | ||||
RB (Duke Univ) Series 2015B | 5.00% | 10/01/55 (a)(b) | 100,000 | 104,392 |
Refunding RB (Duke Univ) Series 2016B | 5.00% | 07/01/42 (b) | 100,000 | 105,307 |
North Carolina Turnpike Auth | ||||
BAN 2020 | 5.00% | 02/01/24 (a) | 250,000 | 252,507 |
RB Series 2019 | 0.00% | 01/01/40 (b)(d) | 200,000 | 97,780 |
RB Series 2019 | 0.00% | 01/01/41 (b)(d) | 195,000 | 90,558 |
Sr Lien RB Series 2019 | 4.00% | 01/01/55 (b) | 200,000 | 182,624 |
Toll RB (Monroe Expressway) Series 2016A | 5.00% | 07/01/54 (b) | 200,000 | 202,655 |
1,188,388 | ||||
OHIO 1.1% | ||||
American Municipal Power Ohio | ||||
RB (Greenup Hydroelectric) Series 2016A | 5.00% | 02/15/41 (b) | 275,000 | 279,742 |
Northeast Ohio Regional Sewer District | ||||
RB Series 2014 | 4.00% | 11/15/49 (a)(b) | 215,000 | 217,457 |
Ohio | ||||
GO Refunding Bonds Series 2015A | 5.00% | 09/15/24 | 75,000 | 76,734 |
GO Refunding Bonds Series 2015A | 5.00% | 09/01/25 | 100,000 | 104,167 |
GO Refunding Bonds Series 2020B | 5.00% | 08/01/25 | 100,000 | 103,989 |
Ohio Higher Educational Facility Commission | ||||
Refunding RB (Case Western Reserve Univ) Series 2016 | 5.00% | 12/01/40 (b) | 200,000 | 206,899 |
Ohio Turnpike Commission | ||||
Jr Lien RB Series 2018A | 5.00% | 02/15/32 (b) | 200,000 | 218,969 |
Turnpike RB Series 2021A | 5.00% | 02/15/46 (b) | 200,000 | 216,977 |
Ohio Water Development Auth | ||||
RB Series 2019 | 5.00% | 12/01/29 (b) | 150,000 | 169,936 |
1,594,870 | ||||
OKLAHOMA 0.3% | ||||
Canadian Cnty Educational Facilities Auth | ||||
Lease RB (Mustang Public Schools) Series 2017 | 3.00% | 09/01/29 (b) | 200,000 | 198,799 |
Oklahoma Grand River Dam Auth | ||||
Refunding RB Series 2016A | 5.00% | 06/01/31 (b) | 175,000 | 185,971 |
Oklahoma Turnpike Auth | ||||
2nd Sr RB Series 2017C | 4.00% | 01/01/42 (b) | 100,000 | 99,556 |
484,326 | ||||
ISSUER TYPE OF SECURITY, SERIES | RATE | MATURITY | FACE AMOUNT ($) | VALUE ($) |
OREGON 1.1% | ||||
Beaverton SD #48J | ||||
GO Bonds Series 2014 | 5.00% | 06/15/28 (a)(b)(c) | 100,000 | 101,737 |
GO Bonds Series 2014B | 5.00% | 06/15/31 (a)(b)(c) | 250,000 | 254,342 |
GO Bonds Series 2022B | 5.00% | 06/15/52 (b)(c) | 250,000 | 273,035 |
Oregon Dept of Transportation | ||||
Highway Sub Lien Refunding RB Series 2019A | 5.00% | 11/15/36 (b) | 200,000 | 222,206 |
Highway Tax Sub Lien RB Series 2020A | 5.00% | 11/15/40 (b) | 290,000 | 320,234 |
Tri-Cnty Metropolitan Transportation District | ||||
Sr Lien Payroll Tax RB Series 2018A | 5.00% | 09/01/43 (a)(b) | 305,000 | 332,282 |
1,503,836 | ||||
PENNSYLVANIA 3.4% | ||||
Delaware River Port Auth | ||||
RB Series 2013 | 5.00% | 01/01/31 (a)(b) | 120,000 | 121,084 |
Pennsylvania | ||||
GO Bonds 1st Series 2014 | 4.00% | 06/15/33 (b) | 15,000 | 15,149 |
GO Bonds 1st Series 2015 | 5.00% | 03/15/24 | 100,000 | 101,280 |
GO Bonds 1st Series 2020 | 2.00% | 05/01/39 (b) | 75,000 | 53,697 |
GO Bonds 1st Series 2022 | 5.00% | 10/01/25 | 200,000 | 208,475 |
GO Bonds 2nd Series 2015 | 4.00% | 08/15/34 (b) | 75,000 | 76,116 |
GO Bonds 2nd Series 2016 | 5.00% | 09/15/25 | 100,000 | 104,144 |
GO Bonds 2nd Series 2016 | 4.00% | 09/15/32 (b) | 325,000 | 333,965 |
GO Bonds 2nd Series 2016 | 3.00% | 09/15/36 (b) | 125,000 | 114,493 |
GO Refunding Bonds Series 2017 | 5.00% | 01/01/26 | 120,000 | 125,741 |
GO Refunding Bonds Series 2017 | 5.00% | 01/01/27 | 360,000 | 385,080 |
Pennsylvania Higher Educational Facilities Auth | ||||
RB (Thomas Jefferson Univ) Series 2015A | 5.25% | 09/01/50 (b) | 250,000 | 252,371 |
Pennsylvania State Turnpike Commission | ||||
RB Series 2021A | 5.00% | 12/01/46 (b) | 125,000 | 134,593 |
Refunding RB Series 2019 | 5.00% | 12/01/25 | 65,000 | 67,851 |
Sr RB Series 2021A | 4.00% | 12/01/51 (b) | 30,000 | 29,477 |
Sub RB Series 2015A1 | 4.00% | 12/01/41 (b) | 110,000 | 109,471 |
Sub RB Series 2017B2 | 4.00% | 06/01/38 (b) | 125,000 | 125,504 |
Sub RB Series 2017B2 | 4.00% | 06/01/39 (b) | 100,000 | 99,532 |
Sub RB Series 2021B | 5.00% | 12/01/46 (b) | 200,000 | 213,870 |
Sub Refunding RB 3rd Series 2016A | 5.00% | 12/01/30 (b) | 190,000 | 201,485 |
Sub Refunding RB 3rd Series 2016A | 3.38% | 12/01/41 (b) | 370,000 | 323,110 |
Turnpike Refunding RB Series 2019 | 5.00% | 12/01/24 | 75,000 | 76,841 |
Turnpike Sr RB Series 2015B | 5.00% | 12/01/40 (b) | 90,000 | 92,672 |
Philadelphia | ||||
Gas RB 16th Series A | 5.00% | 08/01/50 (b)(c) | 95,000 | 100,475 |
GO Bonds Series 2015B | 4.00% | 08/01/35 (b) | 200,000 | 202,142 |
Water & Wastewater RB Series 2015A | 5.00% | 07/01/45 (a)(b) | 60,000 | 61,070 |
Philadelphia IDA | ||||
RB (Thomas Jefferson Univ) Series 2017A | 5.00% | 09/01/47 (b) | 200,000 | 204,447 |
Philadelphia SD | ||||
GO Bonds Series 2018B | 4.00% | 09/01/43 (b)(c) | 195,000 | 194,206 |
GO Refunding Bonds Series 2016F | 5.00% | 09/01/28 (b)(c) | 110,000 | 115,389 |
ISSUER TYPE OF SECURITY, SERIES | RATE | MATURITY | FACE AMOUNT ($) | VALUE ($) |
Pittsburgh Water & Sewer Auth | ||||
Water & Sewer System Sub Refunding RB Series 2019B | 5.00% | 09/01/32 (c) | 375,000 | 438,501 |
4,682,231 | ||||
RHODE ISLAND 0.1% | ||||
Rhode Island Health & Educational Building Corp | ||||
Education Facility RB (Providence College) Series 2023 | 5.00% | 11/01/53 (b) | 150,000 | 159,830 |
SOUTH CAROLINA 0.4% | ||||
South Carolina Public Service Auth | ||||
Refunding RB Series 2016A | 5.00% | 12/01/29 (b) | 85,000 | 88,263 |
Refunding RB Series 2016A | 5.00% | 12/01/30 (b) | 125,000 | 129,837 |
Refunding RB Series 2022A | 4.00% | 12/01/52 (b) | 150,000 | 138,490 |
Revenue & Refunding Bonds Series 2020A | 5.00% | 12/01/31 (b) | 75,000 | 81,978 |
South Carolina Transportation Infrastructure Bank | ||||
Refunding RB Series 2021B | 5.00% | 10/01/25 | 105,000 | 109,473 |
548,041 | ||||
TENNESSEE 0.2% | ||||
Metro Government of Nashville & Davidson Cnty | ||||
GO Bonds Series 2018 | 4.00% | 07/01/33 (b) | 125,000 | 129,486 |
GO Bonds Series 2021C | 3.00% | 01/01/34 (b) | 125,000 | 120,048 |
249,534 | ||||
TEXAS 8.8% | ||||
Alamo CCD | ||||
Maintenance Tax Notes Series 2022 | 5.00% | 02/15/25 | 50,000 | 51,540 |
Aubrey ISD | ||||
ULT GO Bonds Series 2022 | 4.00% | 02/15/47 (b)(c) | 200,000 | 200,782 |
Austin ISD | ||||
ULT GO Bonds Series 2023 | 5.00% | 08/01/25 | 75,000 | 77,961 |
Bexar Cnty | ||||
Tax Refunding Bonds Series 2017 | 5.00% | 06/15/43 (a)(b) | 250,000 | 264,692 |
Central Texas Regional Mobility Auth | ||||
Sub Lien BAN Series 2021C | 5.00% | 01/01/27 (b) | 100,000 | 104,209 |
Cleburne ISD | ||||
ULT GO Bonds Series 2016 | 5.00% | 02/15/41 (b)(c) | 90,000 | 92,335 |
Conroe ISD | ||||
ULT GO Bonds Series 2022A | 4.00% | 02/15/47 (b)(c) | 375,000 | 374,847 |
Cypress-Fairbanks ISD | ||||
ULT GO Refunding Bonds Series 2016 | 5.00% | 02/15/26 (c) | 60,000 | 63,047 |
Dallas | ||||
GO Refunding Bonds Series 2017 | 3.00% | 02/15/33 (b)(c) | 125,000 | 121,653 |
Dallas Area Rapid Transit | ||||
Sr Lien Sales Tax Refunding RB Series 2007 | 5.25% | 12/01/30 (b)(c) | 315,000 | 365,952 |
Sr Lien Sales Tax Refunding RB Series 2021B | 4.00% | 12/01/51 (b) | 200,000 | 193,358 |
ISSUER TYPE OF SECURITY, SERIES | RATE | MATURITY | FACE AMOUNT ($) | VALUE ($) |
Dallas-Fort Worth International Airport | ||||
Jt Refunding RB Series 2020A | 5.00% | 11/01/24 | 200,000 | 204,607 |
Refunding RB Series 2020A | 5.00% | 11/01/27 | 230,000 | 249,333 |
Refunding RB Series 2021A | 4.00% | 11/01/46 (b) | 55,000 | 53,141 |
El Paso | ||||
Water & Sewer Refunding RB Series 2022 | 5.00% | 03/01/52 (b) | 250,000 | 267,419 |
Water & Sewer Refunding RB Series 2022A | 4.00% | 03/01/44 (b) | 200,000 | 196,279 |
Grand Parkway Transportation Corp | ||||
1st Tier Toll Refunding RB Series 2020C | 4.00% | 10/01/45 (b) | 250,000 | 244,729 |
1st Tier Toll Refunding RB Series 2020C | 4.00% | 10/01/49 (b) | 250,000 | 241,176 |
Sub Tier Toll RB Series 2018A | 5.00% | 10/01/35 (b) | 115,000 | 124,654 |
Greater Texoma Utility Auth | ||||
RB Series 2023 | 5.00% | 10/01/48 (b)(c) | 150,000 | 160,917 |
Harris Cnty | ||||
Refunding Bonds Series 2022A | 5.00% | 10/01/26 | 115,000 | 122,341 |
Toll Road Sr Lien Refunding RB Series 2016A | 5.00% | 08/15/33 (b) | 100,000 | 105,636 |
Toll Road Sr Lien Refunding RB Series 2018A | 4.00% | 08/15/48 (b) | 100,000 | 99,640 |
Harris Cnty Sports Auth | ||||
Sr Lien Refunding RB 2014A | 5.00% | 11/15/30 (b) | 150,000 | 152,889 |
Hidalgo Cnty | ||||
GO Bonds Series 2018A | 4.00% | 08/15/43 (b) | 200,000 | 200,386 |
Houston | ||||
Utility System 1st Lien Refunding RB Series 2014C | 5.00% | 05/15/24 | 270,000 | 273,916 |
Utility System 1st Lien Refunding RB Series 2019B | 5.00% | 11/15/49 (b) | 100,000 | 106,915 |
Utility System 1st Lien Refunding RB Series 2021A | 4.00% | 11/15/46 (b) | 50,000 | 49,738 |
Houston ISD | ||||
LT Refunding Bonds Series 2016A | 5.00% | 02/15/29 (b)(c) | 200,000 | 210,158 |
Leander ISD | ||||
ULT GO Refunding Bonds Series 2016A | 0.00% | 08/16/42 (b)(c)(d) | 350,000 | 151,834 |
Lower Colorado River Auth | ||||
Refunding RB (LCRA Transmission Services) Series 2020A | 5.00% | 05/15/50 (b) | 100,000 | 105,428 |
North Texas Tollway Auth | ||||
1st Tier RB Series 2008D | 0.00% | 01/01/31 (c)(d) | 170,000 | 131,059 |
1st Tier Refunding RB Series 2016A | 5.00% | 01/01/27 (b) | 275,000 | 277,071 |
1st Tier Refunding RB Series 2016A | 4.00% | 01/01/39 (b) | 50,000 | 50,003 |
1st Tier Refunding RB Series 2017A | 5.00% | 01/01/43 (b) | 145,000 | 150,841 |
2nd Tier Refunding RB Series 2019B | 5.00% | 01/01/24 | 500,000 | 504,080 |
Refunding RB Series 2008I | 6.50% | 01/01/43 (a)(b) | 295,000 | 308,856 |
Refunding RB Series 2014B | 5.00% | 01/01/31 (b) | 320,000 | 322,686 |
Refunding RB Series 2015A | 4.00% | 01/01/38 (b) | 150,000 | 149,421 |
Plano ISD | ||||
ULT GO Bonds Series 2023 | 5.00% | 02/15/42 (b) | 270,000 | 300,520 |
Port of Houston Auth | ||||
1st Lien RB Series 2021 | 5.00% | 10/01/51 (b) | 385,000 | 414,869 |
Prosper ISD | ||||
ULT GO Bonds Series 2022 | 4.00% | 02/15/52 (b)(c) | 150,000 | 147,277 |
ULT GO Bonds Series 2023 | 4.00% | 02/15/53 (b)(c) | 150,000 | 147,027 |
San Antonio | ||||
Electric & Gas Systems Refunding RB Series 2012 | 5.25% | 02/01/25 (b) | 295,000 | 304,480 |
Electric & Gas Systems Refunding RB Series 2020 | 5.00% | 02/01/49 (b) | 125,000 | 133,824 |
ISSUER TYPE OF SECURITY, SERIES | RATE | MATURITY | FACE AMOUNT ($) | VALUE ($) |
San Antonio Public Facilities Corp | ||||
Lease Refunding RB Series 2012 | 4.00% | 09/15/42 (b) | 50,000 | 48,067 |
Texas | ||||
GO Bonds Series 2014 | 5.00% | 04/01/26 (b) | 100,000 | 101,402 |
GO Refunding Bonds Series 2014 | 5.00% | 10/01/26 (a)(b) | 150,000 | 152,026 |
GO Refunding Bonds Series 2014 | 5.00% | 10/01/28 (a)(b) | 150,000 | 152,026 |
GO Refunding Bonds Series 2014A | 5.00% | 10/01/44 (a)(b) | 420,000 | 429,458 |
GO Refunding Bonds Series 2017A | 5.00% | 10/01/33 (b) | 100,000 | 107,829 |
GO Refunding Bonds Series 2017A | 5.00% | 10/01/34 (b) | 150,000 | 161,325 |
Texas A&M Univ | ||||
RB Series 2017E | 5.00% | 05/15/27 | 70,000 | 75,681 |
Texas Transportation Commission | ||||
State Highway Fund 1st Tier Refunding RB Series 2015 | 5.00% | 10/01/24 | 160,000 | 163,839 |
Texas Transportation Corp | ||||
Sr Lien Refunding RB (NTE Mobility Partners) Series 2019A | 5.00% | 12/31/35 (b) | 125,000 | 131,255 |
Texas Turnpike Auth | ||||
1st Tier RB Series 2002A | 0.00% | 08/15/27 (c)(d) | 100,000 | 86,839 |
1st Tier RB Series 2002A | 0.00% | 08/15/30 (c)(d) | 100,000 | 77,830 |
Texas Water Dev Brd | ||||
State Water Implementation Fund RB Series 2017A | 4.00% | 10/15/35 (b) | 200,000 | 204,538 |
State Water Implementation Fund RB Series 2018A | 5.00% | 10/15/43 (b) | 100,000 | 105,998 |
State Water Implementation Fund RB Series 2019A | 3.00% | 10/15/34 (b) | 125,000 | 123,932 |
State Water Implementation Fund RB Series 2019A | 4.00% | 10/15/49 (b) | 250,000 | 247,801 |
State Water Implementation Fund RB Series 2022 | 4.80% | 10/15/52 (b) | 65,000 | 69,251 |
State Water Implementation Fund RB Series 2022 | 5.00% | 10/15/57 (b) | 150,000 | 162,977 |
State Water RB Series 2022 | 4.45% | 10/15/36 (b) | 50,000 | 54,604 |
Trinity River Auth | ||||
Refunding RB Series 2020 | 3.00% | 08/01/31 (b) | 440,000 | 434,599 |
Univ of Texas | ||||
Financing System RB Series 2019B | 5.00% | 08/15/49 | 200,000 | 237,789 |
Financing System RB Series 2020A | 5.00% | 08/15/30 | 150,000 | 172,748 |
Financing System RB Series 2021A | 4.00% | 08/15/35 (b) | 50,000 | 52,452 |
Univ of Texas Permanent Univ Fund | ||||
RB Series 2022A | 5.00% | 07/01/32 | 75,000 | 88,690 |
Ysleta ISD | ||||
ULT GO Bonds Series 2020 | 4.00% | 08/15/50 (b)(c) | 100,000 | 96,006 |
12,312,488 | ||||
UTAH 0.2% | ||||
Utah | ||||
GO Refunding Bonds Series 2015 | 5.00% | 07/01/24 | 50,000 | 50,955 |
Utah Board of Regents | ||||
General RB (Univ of Utah) Series 2022A | 4.00% | 08/01/51 (b) | 150,000 | 146,990 |
Utah Transit Auth | ||||
Sub Sales Tax Refunding RB Series 2018 | 4.00% | 12/15/41 (b) | 115,000 | 115,348 |
313,293 | ||||
VIRGINIA 1.5% | ||||
Chesapeake Bay Bridge & Tunnel District | ||||
1st Tier RB Series 2016 | 5.00% | 07/01/46 (b) | 150,000 | 152,121 |
ISSUER TYPE OF SECURITY, SERIES | RATE | MATURITY | FACE AMOUNT ($) | VALUE ($) |
Hampton Roads Transportation Commission | ||||
Sr Lien BAN 2021A | 5.00% | 07/01/26 (a) | 570,000 | 603,179 |
Univ of Virginia | ||||
General RB Series 2019B | 5.00% | 09/01/49 (b) | 250,000 | 270,643 |
General Refunding RB Series 2017A | 5.00% | 04/01/42 (b) | 125,000 | 132,332 |
Virginia College Building Auth | ||||
Educational Facilities Refunding RB Series 2017E | 5.00% | 02/01/29 (b) | 315,000 | 344,026 |
Virginia Public Building Auth | ||||
Public Facilities RB Series 2021A2 | 4.00% | 08/01/39 (b) | 100,000 | 101,891 |
Virginia Transportation Board | ||||
Transportation Refunding RB Series 2017A | 5.00% | 05/15/31 (b) | 415,000 | 451,646 |
2,055,838 | ||||
WASHINGTON 3.1% | ||||
Central Puget Sound Regional Transit Auth | ||||
Sales & Motor Vehicle Tax Refunding Bonds Series 2021S1 | 5.00% | 11/01/27 | 130,000 | 141,866 |
Sales & Motor Vehicle Tax Refunding Bonds Series 2021S1 | 5.00% | 11/01/36 (b) | 250,000 | 284,409 |
Sales & Motor Vehicle Tax Refunding Bonds Series 2021S1 | 4.00% | 11/01/40 (b) | 60,000 | 60,262 |
Energy Northwest | ||||
Electric Refunding RB Series 2018B | 5.00% | 07/01/23 (a) | 330,000 | 330,000 |
Electric Refunding RB Series 2018C | 5.00% | 07/01/34 (b) | 85,000 | 93,595 |
Electric Refunding RB Series 2021A | 4.00% | 07/01/42 (b) | 480,000 | 482,472 |
Issaquah SD #411 | ||||
ULT GO Bonds Series 2016 | 4.00% | 12/01/31 (b)(c) | 50,000 | 51,185 |
King Cnty | ||||
LT GO Refunding Bonds Series 2021A | 4.00% | 01/01/27 | 330,000 | 342,446 |
Refunding RB Series 2016B | 4.00% | 07/01/34 (b) | 200,000 | 204,449 |
Northshore SD #417 | ||||
ULT GO Bonds Series 2018 | 5.00% | 12/01/35 (b)(c) | 100,000 | 108,854 |
ULT GO Refunding Bonds Series 2022 | 5.00% | 12/01/39 (b)(c) | 110,000 | 123,187 |
Seattle | ||||
Light & Power RB Series 2015A | 4.00% | 05/01/45 (b) | 150,000 | 147,221 |
Spokane SD #81 | ||||
ULT GO Bonds Series 2019 | 5.00% | 12/01/36 (b)(c) | 200,000 | 220,015 |
Tacoma SD #10 | ||||
ULT GO Bonds Series 2020B | 4.00% | 12/01/41 (b)(c) | 245,000 | 245,240 |
Washington | ||||
GO Bonds Series 2020C | 5.00% | 02/01/40 (b) | 160,000 | 175,086 |
GO Bonds Series 2020C | 5.00% | 02/01/41 (b) | 150,000 | 163,710 |
GO Bonds Series 2022A | 5.00% | 08/01/40 (b) | 155,000 | 172,522 |
GO Bonds Series 2022A | 5.00% | 08/01/44 (b) | 150,000 | 164,628 |
GO Bonds Series 2023A | 5.00% | 08/01/47 (b) | 250,000 | 275,170 |
GO Refunding Bonds Series R2013C | 4.00% | 07/01/26 (b) | 400,000 | 400,247 |
GO Refunding Bonds Series R2018C | 5.00% | 08/01/30 (b) | 40,000 | 43,243 |
Motor Vehicle Fuel Tax GO Refunding Bonds Series R2022D | 4.00% | 07/01/28 | 130,000 | 137,459 |
4,367,266 | ||||
WEST VIRGINIA 0.2% | ||||
W Virginia Parkway Auth | ||||
Sr Lien RB Series 2021 | 5.00% | 06/01/47 (b) | 190,000 | 206,058 |
ISSUER TYPE OF SECURITY, SERIES | RATE | MATURITY | FACE AMOUNT ($) | VALUE ($) |
WISCONSIN 0.4% | ||||
Wisconsin | ||||
GO Refunding Bonds Series 2 | 5.00% | 11/01/25 | 210,000 | 219,758 |
GO Refunding Bonds Series 2023-2 | 5.00% | 05/01/34 (b) | 105,000 | 125,557 |
Wisconsin Center District | ||||
Sr Tax RB Series 2020C | 0.00% | 12/15/50 (b)(c)(d) | 800,000 | 215,085 |
560,400 | ||||
WYOMING 0.1% | ||||
Campbell Solid Waste Facilities | ||||
RB Series 2019A | 3.63% | 07/15/39 (b) | 200,000 | 176,480 |
Total Municipal Securities (Cost $136,453,536) | 137,390,513 | |||
Total Investments in Securities (Cost $136,453,536) | 137,390,513 | |||
(a) | Refunded bond. |
(b) | The effective maturity may be shorter than the final maturity shown because the security is subject to a put, demand or call feature. |
(c) | Credit-enhanced or liquidity-enhanced. |
(d) | Zero coupon bond. |
BAN — | Bond anticipation note |
CCD — | Community college district |
COP — | Certificate of participation |
GO — | General obligation |
IDA — | Industrial development agency/authority |
ISD — | Independent school district |
LT — | Limited tax |
RB — | Revenue bond |
SD — | School district |
UHSD — | Union high school district |
ULT — | Unlimited tax |
USD — | Unified school district |
DESCRIPTION | QUOTED PRICES IN ACTIVE MARKETS FOR IDENTICAL ASSETS (LEVEL 1) | OTHER SIGNIFICANT OBSERVABLE INPUTS (LEVEL 2) | SIGNIFICANT UNOBSERVABLE INPUTS (LEVEL 3) | TOTAL |
Assets | ||||
Municipal Securities1 | $— | $137,390,513 | $— | $137,390,513 |
Total | $— | $137,390,513 | $— | $137,390,513 |
1 | As categorized in the Portfolio Holdings. |
Assets | ||
Investments in securities, at value - unaffiliated (cost $136,453,536) | $137,390,513 | |
Cash | 875,901 | |
Receivables: | ||
Interest | + | 1,694,409 |
Total assets | 139,960,823 | |
Liabilities | ||
Payables: | ||
Investments bought | 241,181 | |
Management fees | + | 3,438 |
Total liabilities | 244,619 | |
Net assets | $139,716,204 | |
Net Assets by Source | ||
Capital received from investors | $138,568,627 | |
Total distributable earnings | + | 1,147,577 |
Net assets | $139,716,204 | |
Net Asset Value (NAV) | ||||
Net Assets | ÷ | Shares Outstanding | = | NAV |
$139,716,204 | 2,700,000 | $51.75 | ||
For the period January 1, 2023 through June 30, 2023; unaudited | ||
Investment Income | ||
Interest received from securities - unaffiliated | $1,946,861 | |
Expenses | ||
Management fees | 17,464 | |
Total expenses | – | 17,464 |
Net investment income | 1,929,397 | |
REALIZED AND UNREALIZED GAINS (LOSSES) | ||
Net realized losses on sales of securities - unaffiliated | (185,022 ) | |
Net change in unrealized appreciation (depreciation) on securities - unaffiliated | + | 74,471 |
Net realized and unrealized losses | (110,551 ) | |
Increase in net assets resulting from operations | $1,818,846 | |
OPERATIONS | |||
1/1/23-6/30/23 | 10/12/22*-12/31/22 | ||
Net investment income | $1,929,397 | $326,335 | |
Net realized losses | (185,022 ) | (19,675 ) | |
Net change in unrealized appreciation (depreciation) | + | 74,471 | 862,506 |
Increase in net assets resulting from operations | $1,818,846 | $1,169,166 | |
DISTRIBUTIONS TO SHAREHOLDERS | |||
Total distributions | ($1,545,790 ) | ($294,645 ) | |
TRANSACTIONS IN FUND SHARES | |||||
1/1/23-6/30/23 | 10/12/22*-12/31/22 | ||||
SHARES | VALUE | SHARES | VALUE | ||
Shares sold | 1,500,000 | $77,923,930 | 1,200,000 | $60,454,448 | |
Other capital | — | 132,665 | — | 57,584 | |
Net transactions in fund shares | 1,500,000 | $78,056,595 | 1,200,000 | $60,512,032 | |
SHARES OUTSTANDING AND NET ASSETS | |||||
1/1/23-6/30/23 | 10/12/22*-12/31/22 | ||||
SHARES | NET ASSETS | SHARES | NET ASSETS | ||
Beginning of period | 1,200,000 | $61,386,553 | — | $— | |
Total increase | + | 1,500,000 | 78,329,651 | 1,200,000 | 61,386,553 |
End of period | 2,700,000 | $139,716,204 | 1,200,000 | $61,386,553 | |
* | Commencement of operations. |
SCHWAB STRATEGIC TRUST (ORGANIZED JANUARY 27, 2009) | |
Schwab Municipal Bond ETF | Schwab Short-Term U.S. Treasury ETF |
Schwab U.S. Broad Market ETF | Schwab Intermediate-Term U.S. Treasury ETF |
Schwab 1000 Index® ETF | Schwab Long-Term U.S. Treasury ETF |
Schwab U.S. Large-Cap ETF | Schwab U.S. Aggregate Bond ETF |
Schwab U.S. Large-Cap Growth ETF | Schwab 1-5 Year Corporate Bond ETF |
Schwab U.S. Large-Cap Value ETF | Schwab 5-10 Year Corporate Bond ETF |
Schwab U.S. Mid-Cap ETF | Schwab Fundamental U.S. Broad Market Index ETF |
Schwab U.S. Small-Cap ETF | Schwab Fundamental U.S. Large Company Index ETF |
Schwab U.S. Dividend Equity ETF | Schwab Fundamental U.S. Small Company Index ETF |
Schwab International Dividend Equity ETF | Schwab Fundamental International Large Company Index ETF |
Schwab International Equity ETF | Schwab Fundamental International Small Company Index ETF |
Schwab International Small-Cap Equity ETF | Schwab Fundamental Emerging Markets Large Company Index ETF |
Schwab Emerging Markets Equity ETF | Schwab Ariel ESG ETF |
Schwab U.S. REIT ETF | Schwab Crypto Thematic ETF |
Schwab U.S. TIPS ETF | |
2. Significant Accounting Policies:
3. Risk Factors:
4. Affiliates and Affiliated Transactions:
5. Other Service Providers:
6. Board of Trustees:
7. Borrowing from Banks:
8. Purchases and Sales/Maturities of Investment Securities:
PURCHASES OF SECURITIES | SALES OF SECURITIES |
$96,644,703 | $24,238,202 |
9. In-Kind Transactions:
IN-KIND PURCHASES OF SECURITIES | IN-KIND SALES OF SECURITIES |
$5,240,622 | $0 |
10. Federal Income Taxes:
TAX COST | GROSS UNREALIZED APPRECIATION | GROSS UNREALIZED DEPRECIATION | NET UNREALIZED APPRECIATION (DEPRECIATION) |
$136,453,536 | $1,667,886 | ($730,909) | $936,977 |
PRIOR FISCAL YEAR END DISTRIBUTIONS | ||
TAX-EXEMPT INCOME | ORDINARY INCOME | |
$294,373 | $272 | |
11. Subsequent Events:
Independent Trustees | |||
Name, Year of Birth, and Position(s) with the trust (Terms of office, and length of Time Served1) | Principal Occupations During the Past Five Years | Number of Portfolios in Fund Complex Overseen by the Trustee | Other Directorships |
Michael J. Beer 1961 Trustee (Trustee of The Charles Schwab Family of Funds, Schwab Investments, Schwab Capital Trust, Schwab Annuity Portfolios, Schwab Strategic Trust and Laudus Trust since 2022) | Retired. Director, President and Chief Executive Officer (Dec. 2016 – Sept. 2019), Principal Funds (investment management). | 106 | Director (2016 – 2019), Principal Funds, Inc. |
Robert W. Burns 1959 Trustee (Trustee of Schwab Strategic Trust since 2009; The Charles Schwab Family of Funds, Schwab Investments, Schwab Capital Trust, Schwab Annuity Portfolios and Laudus Trust since 2016) | Retired/Private Investor. | 106 | None |
Nancy F. Heller 1956 Trustee (Trustee of The Charles Schwab Family of Funds, Schwab Investments, Schwab Capital Trust, Schwab Annuity Portfolios, Schwab Strategic Trust and Laudus Trust since 2018) | Retired. | 106 | None |
David L. Mahoney 1954 Trustee (Trustee of The Charles Schwab Family of Funds, Schwab Investments, Schwab Capital Trust, Schwab Annuity Portfolios and Laudus Trust since 2011; Schwab Strategic Trust since 2016) | Private Investor. | 106 | Director (2004 – present), Corcept Therapeutics Incorporated Director (2009 – 2021), Adamas Pharmaceuticals, Inc. Director (2003 – 2019), Symantec Corporation |
Jane P. Moncreiff 1961 Trustee (Trustee of The Charles Schwab Family of Funds, Schwab Investments, Schwab Capital Trust, Schwab Annuity Portfolios, Schwab Strategic Trust and Laudus Trust since 2019) | Consultant (2018 – present), Fulham Advisers LLC (management consulting); Chief Investment Officer (2009 – 2017), CareGroup Healthcare System, Inc. (healthcare). | 106 | None |
Independent Trustees (continued) | |||
Name, Year of Birth, and Position(s) with the trust (Terms of office, and length of Time Served1) | Principal Occupations During the Past Five Years | Number of Portfolios in Fund Complex Overseen by the Trustee | Other Directorships |
Kimberly S. Patmore 1956 Trustee (Trustee of The Charles Schwab Family of Funds, Schwab Investments, Schwab Capital Trust, Schwab Annuity Portfolios, Schwab Strategic Trust and Laudus Trust since 2016) | Consultant (2008 – present), Patmore Management Consulting (management consulting). | 106 | None |
J. Derek Penn 1957 Trustee (Trustee of The Charles Schwab Family of Funds, Schwab Investments, Schwab Capital Trust, Schwab Annuity Portfolios, Schwab Strategic Trust and Laudus Trust since 2021) | Head of Equity Sales and Trading (2006 – 2018), BNY Mellon (financial services). | 106 | None |
Interested Trustees | |||
Name, Year of Birth, and Position(s) with the trust (Terms of office, and length of Time Served1) | Principal Occupations During the Past Five Years | Number of Portfolios in Fund Complex Overseen by the Trustee | Other Directorships |
Walter W. Bettinger II2 1960 Chairman and Trustee (Trustee of The Charles Schwab Family of Funds, Schwab Investments, Schwab Capital Trust and Schwab Annuity Portfolios since 2008; Schwab Strategic Trust since 2009; Laudus Trust since 2010) | Co-Chairman of the Board (July 2022 – present), Director and Chief Executive Officer (Oct. 2008 – present) and President (Feb. 2007 – Oct. 2021), The Charles Schwab Corporation; President and Chief Executive Officer (Oct. 2008 – Oct. 2021) and Director (May 2008 – Oct. 2021), Charles Schwab & Co., Inc.; Director (Apr. 2006 – present), Charles Schwab Bank, SSB; Director (Nov. 2017 – present), Charles Schwab Premier Bank, SSB; Director (July 2019 – present), Charles Schwab Trust Bank; Director (May 2008 – present), Chief Executive Officer (Aug. 2017 – present) and President (Aug. 2017 – Nov. 2021), Schwab Holdings, Inc.; Director (Oct. 2020 – present), TD Ameritrade Holding Corporation; Director (July 2016 – Oct. 2021), Charles Schwab Investment Management, Inc. | 106 | Director (2008 – present), The Charles Schwab Corporation |
Richard A. Wurster2 1973 Trustee (Trustee of The Charles Schwab Family of Funds, Schwab Investments, Schwab Capital Trust, Schwab Annuity Portfolios, Schwab Strategic Trust and Laudus Trust since 2022) | President (Oct. 2021 – present) and Executive Vice President – Schwab Asset Management Solutions (Apr. 2019 – Oct. 2021), The Charles Schwab Corporation; President, Director (Oct. 2021 – present), Executive Vice President – Schwab Asset Management Solutions (July 2019 – Oct. 2021) and Senior Vice President – Advisory (May 2016 – July 2019), Charles Schwab & Co., Inc.; President (Nov. 2021 – present), Schwab Holdings, Inc.; Director (Oct. 2021 – present) and Chief Executive Officer (Nov. 2019 – Jan. 2022), Charles Schwab Investment Management, Inc.; Director, Chief Executive Officer and President (Mar. 2018 – Oct. 2022), Charles Schwab Investment Advisory, Inc.; Chief Executive Officer (July 2016 – Apr. 2018) and President (Mar. 2017 – Apr. 2018), ThomasPartners, Inc.; Chief Executive Officer (July 2016 – Apr. 2018), Windhaven Investment Management, Inc. | 106 | None |
Officers of the Trust | |
Name, Year of Birth, and Position(s) with the trust (Terms of office, and length of Time Served3) | Principal Occupations During the Past Five Years |
Jonathan de St. Paer 1973 President and Chief Executive Officer (Officer of The Charles Schwab Family of Funds, Schwab Investments, Schwab Capital Trust, Schwab Annuity Portfolios, Schwab Strategic Trust and Laudus Trust since 2018) | Director (Apr. 2019 – present), President (Oct. 2018 – present), Chief Operating Officer (Jan. 2021 – present), and Chief Executive Officer (Apr. 2019 – Nov. 2019), Charles Schwab Investment Management, Inc.; Senior Vice President (June 2020 – Mar. 2022) and Chief Operating Officer (Jan. 2021 – Mar. 2022), Charles Schwab Investment Advisory, Inc.; Chief Executive Officer (Apr. 2019 – present), President (Nov. 2018 – present) and Trustee (Apr. 2019 – Dec. 2020), Schwab Funds, Laudus Trust and Schwab ETFs; Managing Director (May 2022 – present), Senior Vice President (Apr. 2019 – May 2022) and Senior Vice President – Strategy and Product Development (CSIM) (Jan. 2014 – Mar. 2019), Charles Schwab & Co., Inc. |
Mark Fischer 1970 Chief Operating Officer (Officer of The Charles Schwab Family of Funds, Schwab Investments, Schwab Capital Trust, Schwab Annuity Portfolios, Schwab Strategic Trust and Laudus Trust since 2013) | Chief Operating Officer (Dec. 2020 – present) and Treasurer and Chief Financial Officer (Jan. 2016 – Dec. 2022), Schwab Funds, Laudus Trust and Schwab ETFs; Managing Director (Mar. 2023 – present), Chief Financial Officer (Mar. 2020 – present) and Vice President (Oct. 2013 – Mar. 2023), Charles Schwab Investment Management, Inc. |
Dana Smith 1965 Treasurer and Chief Financial Officer (Officer of The Charles Schwab Family of Funds, Schwab Investments, Schwab Capital Trust, Schwab Annuity Portfolios, Schwab Strategic Trust and Laudus Trust since 2023) | Treasurer and Chief Financial Officer (Jan. 2023 – present) and Assistant Treasurer (Dec. 2015 – Dec. 2022), Schwab Funds, Laudus Trust and Schwab ETFs; Managing Director (Mar. 2023 – present), Vice President (Mar. 2022 – Mar. 2023) and Director (Oct. 2015 – Mar. 2022), Charles Schwab Investment Management, Inc. |
Officers of the Trust (continued) | |
Name, Year of Birth, and Position(s) with the trust (Terms of office, and length of Time Served3) | Principal Occupations During the Past Five Years |
Omar Aguilar 1970 Vice President and Chief Investment Officer (Officer of The Charles Schwab Family of Funds, Schwab Investments, Schwab Capital Trust, Schwab Annuity Portfolios, Schwab Strategic Trust and Laudus Trust since 2011) | Chief Executive Officer (Jan. 2022 – present), Chief Investment Officer (Apr. 2011 – present) and Senior Vice President (Apr. 2011 – Dec. 2021), Charles Schwab Investment Management, Inc.; Director, Chief Executive Officer and President (Oct. 2022 – present), Charles Schwab Investment Advisory, Inc.; Vice President and Chief Investment Officer (June 2011 – present), Schwab Funds, Laudus Trust and Schwab ETFs. |
Brett Wander 1961 Vice President and Chief Investment Officer (Officer of The Charles Schwab Family of Funds, Schwab Investments, Schwab Capital Trust, Schwab Annuity Portfolios, Schwab Strategic Trust and Laudus Trust since 2011) | Managing Director (Mar. 2023 – present), Chief Investment Officer (Apr. 2011 – present) and Senior Vice President (Apr. 2011 – Mar. 2023) Charles Schwab Investment Management, Inc.; Vice President and Chief Investment Officer (June 2011 – present), Schwab Funds, Laudus Trust and Schwab ETFs. |
William P. McMahon, Jr. 1972 Vice President and Chief Investment Officer (Officer of The Charles Schwab Family of Funds, Schwab Investments, Schwab Capital Trust, Schwab Annuity Portfolios, Schwab Strategic Trust and Laudus Trust since 2021) | Managing Director (Mar. 2023 – present), Chief Investment Officer (Jan. 2020 – present) and Senior Vice President (Jan. 2020 – Mar. 2023) Charles Schwab Investment Management, Inc.; Vice President and Chief Investment Officer (June 2021 – present), Schwab Funds, Laudus Trust and Schwab ETFs; Senior Vice President and Chief Investment Officer – ThomasPartners Strategies (Apr. 2018 – Dec. 2019), Charles Schwab Investment Advisory, Inc.; Senior Vice President and Chief Investment Officer (May 2001 – Apr. 2018), ThomasPartners, Inc. |
Catherine MacGregor 1964 Chief Legal Officer and Secretary, Schwab Funds and Schwab ETFs Chief Legal Officer, Vice President and Clerk, Laudus Trust (Officer of The Charles Schwab Family of Funds, Schwab Investments, Schwab Capital Trust, Schwab Annuity Portfolios and Laudus Trust since 2005; Schwab Strategic Trust since 2009) | Managing Director (Mar. 2023 – present), Chief Legal Officer (Mar. 2022 – present) and Vice President (Sept. 2005 – Mar. 2023), Charles Schwab Investment Management, Inc.; Managing Director (May 2022 – present) and Vice President (July 2005 – May 2022), Charles Schwab & Co., Inc.; Vice President (Dec. 2005 – present) and Chief Legal Officer and Clerk (Mar. 2007 – present), Laudus Trust; Chief Legal Officer and Secretary (Oct. 2021 – present), Vice President (Nov. 2005 – Oct. 2021) and Assistant Secretary (June 2007 – Oct. 2021), Schwab Funds; Chief Legal Officer and Secretary (Oct. 2021 – present), Vice President and Assistant Secretary (Oct. 2009 – Oct. 2021), Schwab ETFs. |
Schwab ETFs
Index ETF
Printed on recycled paper.
Item 2: Code of Ethics.
Not applicable to this semi-annual report.
Item 3: Audit Committee Financial Expert.
Not applicable to this semi-annual report.
Item 4: Principal Accountant Fees and Services.
Not applicable to this semi-annual report.
Item 5: Audit Committee of Listed Registrants.
Not applicable to this semi-annual report.
Item 6: Schedule of Investments.
The schedules of investments are included as part of the report to shareholders filed under Item 1 of this Form.
Item 7: Disclosure of Proxy Voting Policies and Procedures for Closed-End Management Investment Companies.
Not applicable.
Item 8: Portfolio Managers of Closed-End Management Investment Companies.
Not applicable.
Item 9: Purchases of Equity Securities by Closed-End Management Investment Company and Affiliated Purchasers.
Not applicable.
Item 10: Submission of Matters to a Vote of Security Holders.
Not applicable.
Item 11: Controls and Procedures.
| (a) | Based on their evaluation of Registrant’s disclosure controls and procedures, as of a date within 90 days of the filing date, Registrant’s Chief Executive Officer, Jonathan de St. Paer and Registrant’s Chief Financial Officer, Dana Smith, have concluded that Registrant’s disclosure controls and procedures are: (i) reasonably designed to ensure that information required to be disclosed in this report is appropriately communicated to Registrant’s officers to allow timely decisions regarding disclosures required in this report; (ii) reasonably designed to ensure that information required to be disclosed in this report is recorded, processed, summarized and reported in a timely manner; and (iii) are effective in achieving the goals described in (i) and (ii) above. |
| (b) | During the period covered by this report, there have been no changes in Registrant’s internal control over financial reporting that the above officers believe to have materially affected, or to be reasonably likely to materially affect, Registrant’s internal control over financial reporting. |
Item 12: Disclosure of Securities Lending Activities for Closed-End Management Investment Companies.
Not applicable.
Item 13: Exhibits.
| (a) (1) | Code of ethics – not applicable to this semi-annual report. |
| (2) |
| (b) |
Pursuant to the requirements of the Securities Exchange Act of 1934 and the Investment Company Act of 1940, the registrant has duly caused this report to be signed on its behalf by the undersigned, thereunto duly authorized.
(Registrant) Schwab Strategic Trust – Schwab Fixed-Income ETFs and Schwab Municipal Bond ETF
| By: | /s/ Jonathan de St. Paer | |
Jonathan de St. Paer Chief Executive Officer | ||
| Date: | August 16, 2023 | |
Pursuant to the requirements of the Securities Exchange Act of 1934 and the Investment Company Act of 1940, this report has been signed below by the following persons on behalf of the registrant and in the capacities and on the dates indicated.
| By: | /s/ Jonathan de St. Paer | |
Jonathan de St. Paer Chief Executive Officer | ||
| Date: | August 16, 2023 | |
| By: | /s/ Dana Smith | |
Dana Smith Chief Financial Officer | ||
| Date: | August 16, 2023 | |