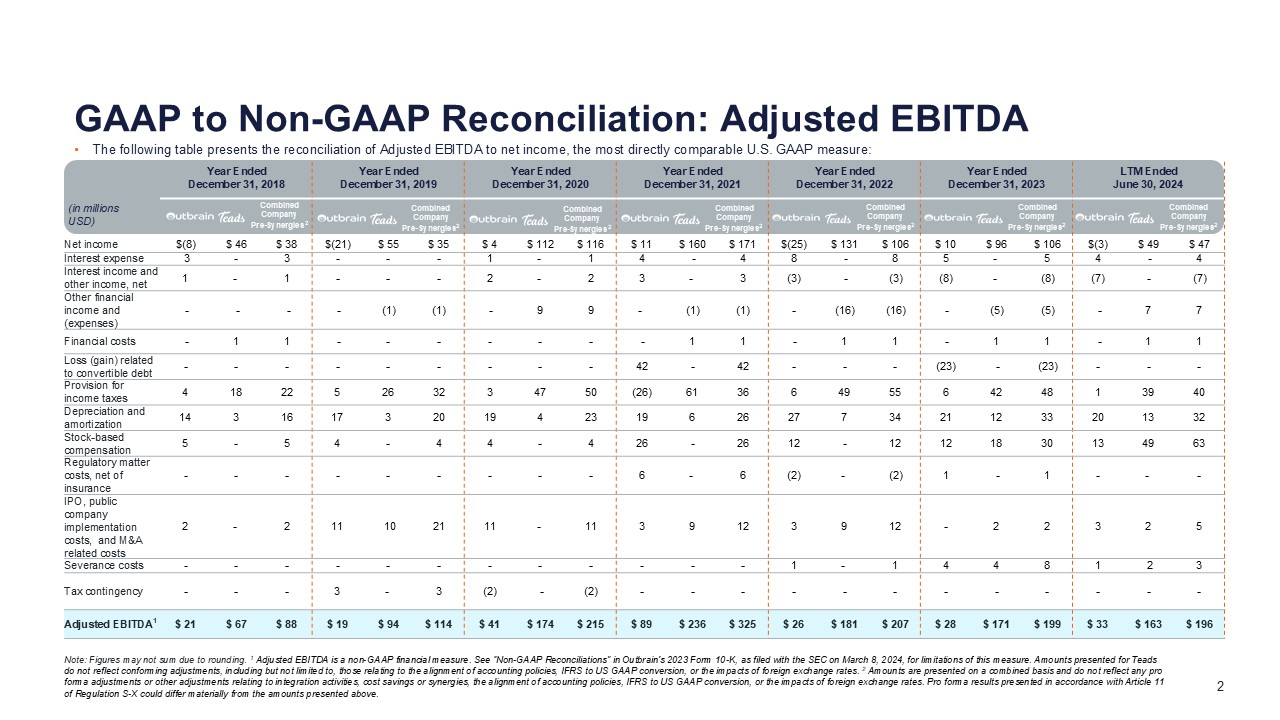
Year Ended December 31, 2018 Year Ended December 31, 2019 Year Ended December 31, 2020 Year Ended December 31, 2021 Year Ended December 31, 2022 Year Ended December 31, 2023 LTM Ended June 30, 2024 (in millions USD) Net income $(8) $ 46 $ 38 $(21) $ 55 $ 35 $ 4 $ 112 $ 116 $ 11 $ 160 $ 171 $(25) $ 131 $ 106 $ 10 $ 96 $ 106 $(3) $ 49 $ 47 Interest expense 3 - 3 - - - 1 - 1 4 - 4 8 - 8 5 - 5 4 - 4 Interest income and other income, net 1 - 1 - - - 2 - 2 3 - 3 (3) - (3) (8) - (8) (7) - (7) Other financial income and (expenses) - - - - (1) (1) - 9 9 - (1) (1) - (16) (16) - (5) (5) - 7 7 Financial costs - 1 1 - - - - - - - 1 1 - 1 1 - 1 1 - 1 1 Loss (gain) related to convertible debt - - - - - - - - - 42 - 42 - - - (23) - (23) - - - Provision for income taxes 4 18 22 5 26 32 3 47 50 (26) 61 36 6 49 55 6 42 48 1 39 40 Depreciation and amortization 14 3 16 17 3 20 19 4 23 19 6 26 27 7 34 21 12 33 20 13 32 Stock-based compensation 5 - 5 4 - 4 4 - 4 26 - 26 12 - 12 12 18 30 13 49 63 Regulatory matter costs, net of insurance - - - - - - - - - 6 - 6 (2) - (2) 1 - 1 - - - IPO, public company implementation costs, and M&A related costs 2 - 2 11 10 21 11 - 11 3 9 12 3 9 12 - 2 2 3 2 5 Severance costs - - - - - - - - - - - - 1 - 1 4 4 8 1 2 3 Tax contingency - - - 3 - 3 (2) - (2) - - - - - - - - - - - - Adjusted EBITDA1 $ 21 $ 67 $ 88 $ 19 $ 94 $ 114 $ 41 $ 174 $ 215 $ 89 $ 236 $ 325 $ 26 $ 181 $ 207 $ 28 $ 171 $ 199 $ 33 $ 163 $ 196 GAAP to Non-GAAP Reconciliation: Adjusted EBITDA Note: Figures may not sum due to rounding. 1 Adjusted EBITDA is a non-GAAP financial measure. See “Non-GAAP Reconciliations” in Outbrain's 2023 Form 10-K, as filed with the SEC on March 8, 2024, for limitations of this measure. Amounts presented for Teads do not reflect conforming adjustments, including but not limited to, those relating to the alignment of accounting policies, IFRS to US GAAP conversion, or the impacts of foreign exchange rates. 2 Amounts are presented on a combined basis and do not reflect any pro forma adjustments or other adjustments relating to integration activities, cost savings or synergies, the alignment of accounting policies, IFRS to US GAAP conversion, or the impacts of foreign exchange rates. Pro forma results presented in accordance with Article 11 of Regulation S-X could differ materially from the amounts presented above. The following table presents the reconciliation of Adjusted EBITDA to net income, the most directly comparable U.S. GAAP measure: Combined Company Pre-Synergies2 Combined Company Pre-Synergies2 Combined Company Pre-Synergies2 Combined Company Pre-Synergies2 Combined Company Pre-Synergies2 Combined Company Pre-Synergies2 Combined Company Pre-Synergies2