Washington, D.C. 20549
Kevin J. McCarthy
Form N-CSR is to be used by management investment companies to file reports with the Commission not later than 10 days after the transmission to stockholders of any report that is required to be transmitted to stockholders under Rule 30e-1 under the Investment Company Act of 1940 (17 CFR 270.30e-1). The Commission may use the information provided on Form N-CSR in its regulatory, disclosure review, inspection, and policymaking roles.
A registrant is required to disclose the information specified by Form N-CSR, and the Commission will make this information public. A registrant is not required to respond to the collection of information contained in Form N-CSR unless the Form displays a currently valid Office of Management and Budget (“OMB”) control number. Please direct comments concerning the accuracy of the information collection burden estimate and any suggestions for reducing the burden to Secretary, Securities and Exchange Commission, 450 Fifth Street, NW, Washington, DC 20549-0609. The OMB has reviewed this collection of information under the clearance requirements of 44 U.S.C. ss. 3507.
ITEM 1. REPORTS TO STOCKHOLDERS.
INVESTMENT ADVISER NAME CHANGE
Effective January 1, 2011, Nuveen Asset Management, the Funds’ investment adviser, changed its name to Nuveen Fund Advisors, Inc. (“Nuveen Fund Advisors”). Concurrently, Nuveen Fund Advisors formed a wholly-owned subsidiary, Nuveen Asset Management, LLC, to house its portfolio management capabilities.
NUVEEN INVESTMENTS COMPLETES STRATEGIC COMBINATION WITH FAF ADVISORS
On December 31, 2010, Nuveen Investments completed the strategic combination between Nuveen Asset Management, LLC, the largest investment affiliate of Nuveen Investments, and FAF Advisors. As part of this transaction, U.S. Bancorp – the parent of FAF Advisors – received cash consideration and a 9.5% stake in Nuveen Investments in exchange for the long-term investment business of FAF Advisors, including investment management responsibilities for the non-money market mutual funds of the First American Funds family. The approximately $27 billion of mutual fund and institutional assets managed by FAF Advisors, along with the investment professionals managing these assets and other key personnel, have become part of Nuveen Asset Management, LLC. With these additions to Nuveen Asset Management, LLC, this affiliate now manages more than $100 billion of assets across a broad range of strategies from municipal and taxable fixed income to traditional and specialized equity investments.
This combination does not affect the investment objectives or strategies of the Funds in this report. Over time, Nuveen Investments expects that the combination will provide even more ways to meet the needs of investors who work with financial advisors and consultants by enhancing the multi-boutique model of Nuveen Investments, which also includes highly respected investment teams at HydePark, NWQ Investment Management, Santa Barbara Asset Management, Symphony Asset Management, Tradewinds Global Investors and Winslow Capital. Nuveen Investments managed approximately $206 billion of assets as of March 31, 2011.
Table of Contents
| | | |
| Chairman’s Letter to Shareholders | | 4 |
| Portfolio Manager’s Comments | | 5 |
| Common Share Dividend and Share Price Information | | 15 |
| Performance Overviews | | 17 |
| Shareholder Meeting Report | | 27 |
| Report of Independent Registered Public Accounting Firm | | 31 |
| Portfolios of Investments | | 32 |
| Statement of Assets and Liabilities | | 90 |
| Statement of Operations | | 92 |
| Statement of Changes in Net Assets | | 94 |
| Statement of Cash Flows | | 98 |
| Financial Highlights | | 101 |
| Notes to Financial Statements | | 114 |
| Board Members and Officers | | 129 |
| Annual Investment Management Agreement Approval Process | | 134 |
| Board Approval of Sub-Advisory Arrangements | | 141 |
| Reinvest Automatically, Easily and Conveniently | | 142 |
| Glossary of Terms Used in this Report | | 144 |
| Other Useful Information | | 147 |
Chairman’s
Letter to Shareholders
Dear Shareholders,
In 2010, the global economy recorded another year of recovery from the financial and economic crises of 2008, but many of the factors that caused the downturn still weigh on the prospects for continued improvement. In the U.S., ongoing weakness in housing values has put pressure on homeowners and mortgage lenders. Similarly, the strong earnings recovery for corporations and banks is only slowly being translated into increased hiring or more active lending. Globally, deleveraging by private and public borrowers has inhibited economic growth and that process is far from complete.
Encouragingly, constructive actions are being taken by governments around the world to deal with economic issues. In the U.S., the recent passage of a stimulatory tax bill relieved some of the pressure on the Federal Reserve to promote economic expansion through quantitative easing and offers the promise of sustained economic growth. A number of European governments are undertaking programs that could significantly reduce their budget deficits. Governments across the emerging markets are implementing various steps to deal with global capital flows without undermining international trade and investment.
The success of these government actions could determine whether 2011 brings further economic recovery and financial market progress. One risk associated with the extraordinary efforts to strengthen U.S. economic growth is that the debt of the U.S. government will continue to grow to unprecedented levels. Another risk is that over time there could be inflationary pressures on asset values in the U.S. and abroad, because what happens in the U.S. impacts the rest of the world economy. Also, these various actions are being taken in a setting of heightened global economic uncertainty, primarily about the supplies of energy and other critical commodities. In this challenging environment, your Nuveen investment team continues to seek sustainable investment opportunities and to remain alert to potential risks in a recovery still facing many headwinds. On your behalf, we monitor their activities to assure they maintain their investment disciplines.
As you will note elsewhere in this report, on December 31, 2010, Nuveen Investments completed a strategic combination with FAF Advisors, Inc., the manager of the First American Funds. The combination adds highly respected and distinct investment teams to meet the needs of investors and their advisors and is designed to benefit all fund shareholders by creating a fund organization with the potential for further economies of scale and the ability to draw from even greater talent and expertise to meet those investor needs.
As of the end of June 2011, Nuveen Investments had completed the refinancing of all of the Auction Rate Preferred Securities issued by its taxable closed-end funds and 91% of the MuniPreferred shares issued by its tax-exempt closed-end funds. Please consult the Nuveen Investments web site, www.Nuveen.com, for the current status of this important refinancing program.
As always, I encourage you to contact your financial consultant if you have any questions about your investment in a Nuveen Fund. On behalf of the other members of your Fund Board, we look forward to continuing to earn your trust in the months and years ahead.
Sincerely,
Robert P. Bremner
Chairman of the Board
June 21, 2011
Portfolio Manager’s Comments
Nuveen New Jersey Investment Quality Municipal Fund, Inc. (NQJ)
Nuveen New Jersey Premium Income Municipal Fund, Inc. (NNJ)
Nuveen New Jersey Dividend Advantage Municipal Fund (NXJ)
Nuveen New Jersey Dividend Advantage Municipal Fund 2 (NUJ)
Nuveen New Jersey Municipal Value Fund (NJV)
Nuveen Pennsylvania Investment Quality Municipal Fund (NQP)
Nuveen Pennsylvania Premium Income Municipal Fund 2 (NPY)
Nuveen Pennsylvania Dividend Advantage Municipal Fund (NXM)
Nuveen Pennsylvania Dividend Advantage Municipal Fund 2 (NVY)
Nuveen Pennsylvania Municipal Value Fund (NPN)
Portfolio manager Paul Brennan reviews economic and municipal market conditions at the national and state levels, key investment strategies and the twelve-month performance of the Nuveen New Jersey and Pennsylvania Funds. Paul, with 20 years of investment experience, including 14 years with Nuveen, assumed portfolio management responsibility for these ten Funds in January 2011 from Cathryn Steeves, who managed NQJ, NNJ, NXJ, NUJ, NQP, NPY, NXM and NVY from 2006 to December 2010 and NJV and NPN from their inceptions in 2009 to December 2010.
What factors affected the U.S. economy and municipal market during the twelve-month reporting period ended April 30, 2011?
During this period, the U.S. economy demonstrated some signs of improvement, supported by the efforts of both the Federal Reserve (Fed) and the federal government. For its part, the Fed continued to hold the benchmark fed funds rate in a target range of zero to 0.25% since cutting it to this record low level in December 2008. At its April 2011 meeting, the central bank renewed its commitment to keeping the fed funds rate at “exceptionally low levels” for an “extended period.” The Fed also left unchanged its second round of quantitative easing, which calls for purchasing $600 billion in longer-term U.S. Treasury bonds by June 30, 2011. The goal of this plan is to lower long-term interest rates and thereby stimulate economic activity and create jobs. The federal government continued to focus on implementing the economic stimulus package passed in early 2009 aimed at providing job creation, tax relief, fiscal assistance to state and local governments, and expansion of unemployment benefits and other federal social welfare programs.
In the first quarter of 2011, the U.S. economy, as measured by the U.S. gross domestic product (GDP), grew at an annualized rate of 1.8%, marking the seventh consecutive
Certain statements in this report are forward-looking statements. Discussions of specific investments are for illustration only and are not intended as recommendations of individual investments. The forward-looking statements and other views expressed herein are those of the portfolio manager as of the date of this report. Actual future results or occurrences may differ significantly from those anticipated in any forward-looking statements, and the views expressed herein are subject to change at any time, due to numerous market and other factors. The Funds disclaim any obligation to update publicly or revise any forward-looking statements or views expressed herein.
Any reference to credit ratings for portfolio holdings denotes the highest rating assigned by a Nationally Recognized Statistical Rating Organization (NRSRO) such as Standard & Poor’s (S&P), Moody’s or Fitch. AAA, AA, A and BBB ratings are investment grade; BB, B, CCC, CC C, and D ratings are below investment grade. Holdings and ratings may change over time.
quarter of positive growth. The employment picture was somewhat improved, with the national jobless rate registering 9.0% in April 2011, down from 9.8% a year earlier. Inflation posted its largest twelve-month gain since October 2008, as the Consumer Price Index (CPI) rose 3.2% year-over-year as of April 2011, driven mainly by increased prices for energy. The core CPI (which excludes food and energy) increased 1.3% over this period. The housing market continued to be a major weak spot in the economy. For the twelve months ended March 2011 (most recent data available at the time this report was prepared), the average home price in the Standard & Poor’s (S&P)/Case-Shiller index of 20 major metropolitan areas lost 3.6%, with 12 of the 20 metropolitan areas hitting their lowest levels since housing prices peaked in 2006. As of April 2011, sales of new and existing homes fell 23.1% and 12.9%, respectively, from April 2010 levels.
The municipal bond market was affected by a significant decline in new tax-exempt issuance during this period. One reason for the decrease in new tax-exempt supply was the heavy issuance of taxable municipal debt under the Build America Bond (BAB) program, which was created as part of the American Recovery and Reinvestment Act of February 2009 and expired December 31, 2010. Between the beginning of this reporting period on May 1, 2010, and the end of the BAB program, taxable Build America Bond issuance totaled $83.9 billion, accounting for 28% of new bonds issued in the municipal market.
After rallying strongly over most of the period, the municipal market suffered a reversal in mid-November 2010, due largely to investor concerns about inflation, the federal deficit, and the deficit’s impact on demand for U.S. Treasury securities. Adding to this market pressure was media coverage of the strained finances of many state and local governments. As a result, money began to flow out of municipal bond funds, as yields rose and valuations declined. Toward the end of this period, we saw the environment in the municipal market improve, as some buyers were attracted by municipal bond valuations and yields, resulting in declining yields, and rising valuations.
Over the twelve months ended April 30, 2011, municipal bond issuance nationwide—both tax-exempt and taxable—totaled $364.3 billion. Demand for municipal bonds was exceptionally strong during the majority of this period, especially from individual investors. For the first four months of 2011, municipal issuance nationwide was down 49% from the first four months of 2010. This decline reflects the heavy issuance of BABs at the end of 2010, as borrowers took advantage of the program’s favorable terms before its expiration at year end.
How were economic and market conditions in New Jersey and Pennsylvania?
The economic recovery in New Jersey has progressed more slowly than in some other states, as a rebound in unemployment, large inventories of foreclosed properties and state budget problems continued to weigh down the state economy. New Jersey continued to benefit from a highly diverse base of professional, business, and financial services; education and health services, including pharmaceuticals; retail trade; and industry. In April 2011, New Jersey’s jobless rate was 9.3%, down from 9.6% in April 2010 but up from 9.1% at the end of 2010. The high levels of property foreclosures in New Jersey remained a downside risk to the state’s progress toward economic recuperation, and housing prices were not expected to begin recovering until 2012. Current estimates forecast a gap of approximately $11 billion in the fiscal 2012 state budget, equal to 37.4% of the fiscal 2011 budget. New Jersey must also find a way to address a $54 billion shortfall in the state’s pension funds. As of April 2011, New Jersey general obligation debt was rated Aa3 by Moody’s; the credit rating agency revised its outlook for New Jersey from stable to negative in September 2010. In February 2011, S&P lowered its rating for the state to AA- from AA, citing New Jersey’s debt levels and unfunded liabilities. S&P maintained its stable outlook. For the twelve months ended April 30, 2011, municipal issuance in New Jersey totaled $13.5 billion, an increase of 26% from the previous twelve months.
Pennsylvania’s progress in moving from recession to recovery has again accelerated, aided mainly by growth in health and education services. This sector represents the largest segment of the Pennsylvania economy, at 20% of employment compared with the national average of just under 15%. As of April 2011, the unemployment rate in Pennsylvania was 7.5%, the lowest since March 2009, down from 8.8% in April 2010. In addition to the improving employment situation, the recovery in the Pennsylvania economy also was helped by the fact that the recession in the Pennsylvania housing market was more modest than in other states. Home prices have stabilized since 2009, due in part to a state program aimed at assisting homeowners in refinancing and avoiding foreclosure. Current projections estimate a shortfall of $4.5 billion in the fiscal 2012 state budget, equal to 16.4% of the fiscal 2011 budget. This could result in additional layoffs among state workers, among other measures. As of April 2011, Moody’s and S&P rated Pennsylvania general obligation debt at Aa1 and AA, respectively. Moody’s listed its outlook for Pennsylvania as negative, while S&P posted a stable outlook. During the twelve months ended April 30, 2011, municipal issuance in the commonwealth totaled $15.7 billion, a decrease of 23% from that of the previous twelve-month period.
What key strategies were used to manage these Funds during this reporting period?
As previously mentioned, the new issue supply of tax-exempt bonds declined nationally during this period, due largely to the issuance of taxable bonds under the BAB program. The BAB program also significantly affected the availability of tax-exempt bonds in New Jersey and Pennsylvania. Between the beginning of this reporting period on May 1, 2010, and the end of the BAB program, BABs accounted for approximately 42% of municipal supply in New Jersey and 18% in Pennsylvania. Since interest payments from BABs represent taxable income, we did not view these bonds as appropriate investment opportunities for these Funds. Further compounding the supply situation was the drop-off in new municipal issuance during the first four months of 2011, when issuance in New Jersey and Pennsylvania declined 75% and 52%, respectively, from that of the same period in 2010.
In this environment of constrained tax-exempt municipal bond issuance, we continued to take a bottom-up approach to discovering undervalued sectors and individual credits with the potential to perform well over the long term. During this period, we found value in several areas of the market, including health care, higher education and transportation. In the transportation sector, we purchased toll road bonds issued for the Pennsylvania turnpike as well as for the Delaware River Turnpike-Toll Bridge, which are tax-exempt in both New Jersey and Pennsylvania.
Some of this investment activity resulted from opportunities created by the provisions of the BAB program. For example, tax-exempt supply was more plentiful in the health care and higher education sectors because, as 501(c)(3) (nonprofit) organizations, hospitals and private universities generally did not qualify for the BAB program and continued to issue bonds in the tax-exempt municipal market. In addition, bonds with proceeds earmarked for refundings, working capital, and private activities were not covered by the BAB program, and this resulted in attractive opportunities in other sectors of the market.
During this period, the Funds generally focused on purchasing longer bonds in order to take advantage of attractive yields at the longer end of the municipal yield curve. The purchase of longer bonds also provided some protection for the Funds’ duration and yield curve positioning in the event that the BAB program was extended and continued to have an impact on tax-exempt issuance, especially at the long end of the curve. The Funds also added to their positions in bonds rated BBB, as we saw heavier issuance of lower-rated bonds in the tax-exempt market during this period.
Cash for new purchases during this period was generated primarily by the proceeds from bond calls and maturing bonds, which we worked to redeploy to keep the Funds fully invested. In general, selling was minimal because of the difficulty in sourcing appropriate tax-exempt paper.
As of April 30, 2011, all ten of these Funds continued to use inverse floating rate securities. We employ inverse floaters as a form of leverage for a variety of reasons, including duration management, income enhancement and total return enhancement.
How did the Funds perform?
Individual results for the Nuveen New Jersey and Pennsylvania Funds, as well as relevant index and peer group information, are presented in the accompanying table.
Average Annual Total Returns on Common Share Net Asset Value
For periods ended 4/30/11
| | | | | | | | | | | |
| Fund | | | 1-Year | | 5-Year | | 10-Year |
| New Jersey Funds | | | | | | | | | | |
| NQJ | | | 0.67 | % | | 4.02 | % | | 5.37 | % |
| NNJ | | | 0.57 | % | | 4.19 | % | | 5.36 | % |
| NXJ | | | -0.38 | % | | 3.78 | % | | 5.45 | % |
| NUJ | | | 0.10 | % | | 3.91 | % | | N/A |
NJV1 | | | -2.17 | % | | N/A | | N/A |
| | | | | | | | | | | |
Standard & Poor’s (S&P) New Jersey Municipal Bond Index2 | | | 1.07 | % | | 4.17 | % | | 4.94 | % |
Standard & Poor’s (S&P) National Municipal Bond Index3 | | | 1.98 | % | | 4.18 | % | | 4.94 | % |
Lipper Other States Municipal Debt Funds Average4 | | | 0.70 | % | | 3.75 | % | | 5.48 | % |
| | | | | | | | | | | |
| Pennsylvania Funds | | | | | | | | | | |
| NQP | | | 1.27 | % | | 4.14 | % | | 5.57 | % |
| NPY | | | 1.75 | % | | 4.05 | % | | 5.56 | % |
| NXM | | | 1.23 | % | | 4.12 | % | | 6.25 | % |
| NVY | | | 1.89 | % | | 4.33 | % | | N/A |
NPN1 | | | 0.59 | % | | N/A | | N/A |
| | | | | | | | | | | |
Standard & Poor’s (S&P) Pennsylvania Municipal Bond Index2 | | | 2.22 | % | | 4.33 | % | | 5.03 | % |
Standard & Poor’s (S&P) National Municipal Bond Index3 | | | 1.98 | % | | 4.18 | % | | 4.94 | % |
Lipper Other States Municipal Debt Funds Average4 | | | 0.70 | % | | 3.75 | % | | 5.48 | % |
For the twelve months ended April 30, 2011, the total returns on common share net asset value (NAV) for the New Jersey and Pennsylvania Funds underperformed the returns for their respective state’s Standard & Poor’s (S&P) Municipal Bond Index. NVY performed in line with the S&P National Municipal Bond Index, while the remaining Funds trailed this index. For the same period, NQP, NPY, NXM and NVY outperformed the average return for the Lipper Other States Municipal Debt Funds Average, NQJ, NNJ and NPN performed in line with this benchmark, and NXJ, NUJ and NJV lagged the Lipper average.
Key management factors that influenced the Funds’ returns during this period included duration and yield curve positioning, credit exposure and sector allocation. The use of leverage also had an impact on the performance of NQJ, NNJ, NXJ, NUJ, NQP, NPY, NXM and NVY. (NJV and NPN do not use structural leverage.) Leverage is discussed in more detail on page ten.
| | Past performance is not predictive of future results. Current performance may be higher or lower than the data shown. Returns do not reflect the deduction of taxes that shareholders may have to pay on Fund distributions or upon the sale of Fund shares. |
| | |
| | For additional information, see the individual Performance Overview for your Fund in this report. |
| | |
| 1 | Unlike the other eight Funds in this report, NJV and NPN do not use structural leverage. |
| | |
| 2 | The Standard & Poor’s (S&P) Municipal Bond Indexes for New Jersey and Pennsylvania are unleveraged, market value-weighted indexes designed to measure the performance of the tax-exempt, investment-grade New Jersey and Pennsylvania municipal bond markets, respectively. These indexes do not reflect any initial or ongoing expenses and are not available for direct investment. |
| | |
| 3 | The Standard & Poor’s (S&P) National Municipal Bond Index is an unleveraged, market value-weighted index designed to measure the performance of the tax-exempt, investment-grade U.S. municipal bond market. This index does not reflect any initial or ongoing expenses and is not available for direct investment. |
| | |
| 4 | The Lipper Other States Municipal Debt Funds Average is calculated using the returns of all closed-end funds in this category for each period as follows: 1-year, 46 funds; 5-year, 46 funds; and 10-year, 27 funds. Shareholders should note that the performance of the Lipper Other States category represents the overall average of returns for funds from ten different states with a wide variety of municipal market conditions, which may make direct comparisons less meaningful. Lipper returns account for the effects of management fees and assume reinvestment of dividends, but do not reflect any applicable sales charges. The Lipper average is not available for direct investment. |
During this period, municipal bonds with intermediate maturities generally outperformed other maturity categories, with credits at the longest end of the yield curve posting the weakest returns. Among the New Jersey Funds, NQJ and NNJ were the most advantageously situated in terms of duration and yield curve positioning, with better exposure to the intermediate part of the curve and less exposure to the underper forming longer end of the curve. The same was true of NVY among the Pennsylvania Funds. NJV and NPN, on the other hand, had the longer durations typical of newer Funds that were more recently invested in long-term bonds. Their greater exposure to the underperforming longer segment of the curve detracted from their performance for this period. Overall, variations in duration and yield curve positioning among the Funds accounted for the majority of the differences in performance.
Credit exposure also played a role in performance. During the market reversal of late 2010, as redemption activity in high-yield funds increased and risk aversion mounted, lower-rated credits were negatively impacted. For the period as a whole, bonds rated BBB typically underperformed those rated AAA. As of April 30, 2011, NJV, NPN and NXJ had the heaviest weightings of bonds rated BBB and correspondingly lower weightings in AAA bonds. NNJ held the fewest BBB rated bonds, while NQP had the largest allocation of bonds rated AAA.
Holdings that generally made positive contributions to the Funds’ returns during this period included general obligation and other tax-supported bonds, housing credits and resource recovery bonds. The water and sewer and electric utilities sectors also outperformed the municipal market as a whole. All of these Funds had meaningful exposure to the tax-supported sector, which benefited their performance. The Pennsylvania Funds, particularly NQP, also had good allocations to the housing sector, especially the commonwealth’s single-family housing program. In addition, pre-refunded bonds, which are often backed by U.S. Treasury securities, were among the stronger performers during this period, primarily due to their shorter effective maturities and higher credit quality. As of April 30, 2011, NNJ had the largest exposure to pre-refunded bonds among the New Jersey Funds, while NQP had the heaviest allocation among the Pennsylvania Funds.
In contrast, the health care, transportation, and education sectors turned in relatively weaker performance. In general, the New Jersey Funds tended to have heavier weightings in health care and transportation, which detracted from their performance. Zero coupon bonds also were among the poorest performers.
IMPACT OF THE FUNDS’ LEVERAGE STRATEGIES ON PERFORMANCE
One important factor impacting the returns of all these Funds relative to the comparative indexes was the Funds’ use of leverage. The Funds use leverage because their
managers believe that, over time, leveraging provides opportunities for additional income and total return for common shareholders. However, use of leverage also can expose common shareholders to additional volatility. For example, as the prices of securities held by a Fund decline, the negative impact of these valuation changes on common share net asset value and common shareholder total return is magnified by the use of leverage. This is what happened in these Funds during the period, as the use of leverage hurt their overall performance.
RECENT DEVELOPMENTS REGARDING THE FUNDS’ REDEMPTION OF AUCTION RATE PREFERRED SHARES
Shortly after their respective inceptions, each of the Funds (except NJV and NPN) issued auction rate preferred shares (ARPS) to create structural leverage. As noted in past shareholder reports, the ARPS issued by many closed-end funds, including these Funds, have been hampered by a lack of liquidity since February 2008. Since that time, more ARPS have been submitted for sale in each of their regularly scheduled auctions than there have been offers to buy. In fact, offers to buy have been almost completely nonexistent since late February 2008. This means that these auctions have “failed to clear,” and that many, or all, of the ARPS shareholders who wanted to sell their shares in these auctions were unable to do so. This lack of liquidity in ARPS did not lower the credit quality of these shares, and ARPS shareholders unable to sell their shares continued to receive distributions at the “maximum rate” applicable to failed auctions, as calculated in accordance with the pre-established terms of the ARPS. In the recent market, with short term rates at multi-generational lows, those maximum rates also have been low.
One continuing implication for common shareholders from the auction failures is that each Fund’s cost of leverage likely has been incrementally higher at times than it otherwise might have been had the auctions continued to be successful. As a result, each Fund’s common share earnings likely have been incrementally lower at times than they otherwise might have been.
As noted in past shareholder reports, the Nuveen funds’ Board of Directors/Trustees authorized several methods that can be used separately or in combination to refinance a portion of the Nuveen funds’ outstanding ARPS. Some funds have utilized tender option bonds (TOBs), also known as inverse floating rate securities, for leverage purposes. The amount of TOBs that a fund may use varies according to the composition of each fund’s portfolio. Some funds have a greater ability to use TOBs than others. Some funds have issued Variable Rate Demand Preferred (VRDP) Shares or Variable MuniFund Term Preferred (VMTP) Shares, which are a floating rate form of preferred stock with a mandatory term redemption. Some funds have issued MuniFund Term Preferred (MTP) Shares, a fixed rate form of preferred stock with a mandatory redemption period of three to five years.
While all these efforts have reduced the total amount of outstanding ARPS issued by the Nuveen funds, the funds cannot provide any assurance on when the remaining outstanding ARPS might be redeemed.
During 2010 and 2011, certain Nuveen leveraged closed-end funds (including NXJ) received a demand letter from a law firm on behalf of purported holders of common shares of each such fund, alleging that Nuveen and the funds’ officers and Board of Directors/Trustees breached their fiduciary duties related to the redemption at par of the funds’ ARPS. In response, the Board established an ad hoc Demand Committee consisting of certain of its disinterested and independent Board members to investigate the claims. The Demand Committee retained independent counsel to assist it in conducting an extensive investigation. Based upon its investigation, the Demand Committee found that it was not in the best interests of each fund or its shareholders to take the actions suggested in the demand letters, and recommended that the full Board reject the demands made in the demand letters. After reviewing the findings and recommendation of the Demand Committee, the full Board of each fund unanimously adopted the Demand Committee’s recommendation.
Subsequently, the funds that received demand letters (including NXJ) were named in a consolidated complaint as nominal defendants in a putative shareholder derivative action captioned Martin Safier, et al. v. Nuveen Asset Management, et al. that was filed in the Circuit Court of Cook County, Illinois, Chancery Division (the “Cook County Chancery Court”) on February 18, 2011 (the “Complaint”). The Complaint, filed on behalf of purported holders of each fund’s common shares, also name Nuveen Fund Advisors, Inc. as a defendant, together with current and former Officers and interested Director/Trustees of each of the funds (together with the nominal defendants, collectively, the “Defendants”). The Complaint contains the same basic allegations contained in the demand letters. The suits seek a declaration that the Defendants have breached their fiduciary duties, an order directing the Defendants not to redeem any ARPS at their liquidation value using fund assets, indeterminate monetary damages in favor of the funds and an award of plaintiffs’ costs and disbursements in pursuing the action. Nuveen Fund Advisors, Inc. believes that the Complaint is without merit, and is defending vigorously against these charges.
As of April 30, 2011, each of the Funds have redeemed 100% of their original outstanding ARPS at par.
MTP Shares
As of April 30, 2011, the following Funds have issued and outstanding MTP Shares, at liquidation value, as shown in the accompanying table.
| Fund | | MTP Shares at Liquidation Value |
| NXJ | | $ | 44,861,000 |
| NUJ | | $ | 35,050,000 |
| NXM | | $ | 23,190,000 |
| NVY | | $ | 24,550,000 |
During the current reporting period, the following Funds completed the issuance of new and/or additional MTP Shares as shown in the accompanying table. The net proceeds from these offerings were used to refinance the Funds’ remaining outstanding ARPS at par. The newly-issued MTP Shares trade on the New York Stock Exchange (NYSE). These MTP Shares are included in the total amount of MTP Shares outstanding in the preceding table.
| Fund | | | MTP Shares Issued at Liquidation Value | | | MTP Series | | | Annual Interest Rate | | NYSE TICKER |
| NXJ | | $ | 44,861,000 | | | 2014 | | | 2.30 | % | | NXJ PrA |
| NUJ | | $ | 35,050,000 | | | 2015 | | | 2.00 | % | | NUJ PrC |
| NXM | | $ | 23,190,000 | | | 2015 | | | 2.10 | % | | NXM PrC |
| NVY | | $ | 24,550,000 | | | 2015 | | | 2.15 | % | | NVY PrC |
VRDP Shares
During the current reporting period, the following Funds completed the issuance of VRDP Shares as shown in the accompanying table. The net proceeds from these offerings were used to refinance the Funds’ remaining outstanding ARPS at par.
| Fund | | VRDP Shares Issued at Liquidation Value |
| NQJ | | $ | 144,300,000 |
| NNJ | | $ | 88,600,000 |
| NQP | | $ | 112,500,000 |
| NPY | | $ | 100,000,000 |
(Refer to Notes to Financial Statements, Footnote 1 – General Information and Significant Accounting Policies and Footnote 4 – Fund Shares for further details on MTP and VRDP Shares.)
At the time this report was prepared, all 84 of the Nuveen closed-end municipal funds that had issued ARPS have redeemed at par all or a portion of these shares. These redemptions bring the total amount of Nuveen’s municipal closed-end funds’ ARPS redemptions to approximately $10.0 billion of the approximately $11.0 billion originally outstanding. For up-to-date information, please visit the Nuveen CEF Auction Rate Preferred Resource Center at: http://www.nuveen.com/arps.
Regulatory Matters
During May 2011, Nuveen Securities, LLC entered into a settlement with the Financial Industry Regulatory Authority (FINRA) with respect to certain allegations regarding Nuveen-sponsored closed-end fund ARPS marketing brochures. As part of this settlement, Nuveen Securities, LLC neither admitted to nor denied FINRA’s allegations. Nuveen Securities, LLC is the broker-dealer subsidiary of Nuveen Investments.
The settlement with FINRA concludes an investigation that followed the widespread failure of auctions for ARPS and other auction rate securities, which generally began in mid-February 2008. In the settlement, FINRA alleged that certain marketing materials provided by Nuveen Securities, LLC were false and misleading. Nuveen Securities, LLC agreed to a censure and the payment of a $3 million fine.
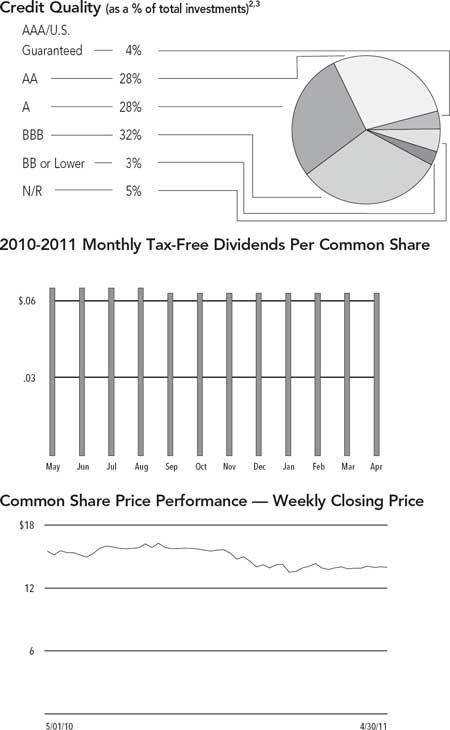
Common Share Dividend
and Share Price Information
During the twelve-month reporting period ended April 30, 2011, NQJ, NNJ, NXJ, NUJ, NQP, NPY, NXM and NVY each had one monthly dividend increase. The monthly dividend of NJV remained stable throughout the reporting period, while NPN’s dividend was cut effective September 2010.
Due to normal portfolio activity, common shareholders of the following Funds received capital gains net ordinary income distributions in December 2010 as follows:
| Fund | | Long-Term Capital Gains (per share) | | Short-Term Capital Gains and/or Ordinary Income (per share) | |
| NQJ | | $ | 0.0269 | | | — | |
| NNJ | | $ | 0.0117 | | | — | |
| NXJ | | $ | 0.0240 | | | — | |
| NUJ | | $ | 0.0381 | | | — | |
| NJV | | | — | | $ | 0.0246 | |
| NXM | | $ | 0.0486 | | | — | |
| NVY | | $ | 0.0480 | | | — | |
All of the Funds in this report seek to pay stable dividends at rates that reflect each Fund’s past results and projected future performance. During certain periods, each Fund may pay dividends at a rate that may be more or less than the amount of net investment income actually earned by the Fund during the period. If a Fund has cumulatively earned more than it has paid in dividends, it holds the excess in reserve as undistributed net investment income (UNII) as part of the Fund’s NAV. Conversely, if a Fund has cumulatively paid dividends in excess of its earnings, the excess constitutes negative UNII that is likewise reflected in the Fund’s NAV. Each Fund will, over time, pay all of its net investment income as dividends to shareholders. As of April 30, 2011, all of the Funds in this report had positive UNII balances for both tax and financial reporting purposes.
COMMON SHARE REPURCHASES AND SHARE PRICE INFORMATION
As of April 30, 2011, and since the inception of the Funds’ repurchase program, the following Funds have cumulatively repurchased and retired common shares as shown in the accompanying table. Since the inception of the Funds’ repurchase program, NJV, NVY and NPN have not repurchased any of their outstanding common shares.
| Fund | Common Shares Repurchased and Retired | | % of Outstanding Common Shares | |
| NQJ | 30,600 | | 0.1 | % |
| NNJ | 12,900 | | 0.1 | % |
| NXJ | 7,200 | | 0.1 | % |
| NUJ | 2,800 | | 0.1 | % |
| NQP | 220,600 | | 1.4 | % |
| NPY | 231,200 | | 1.5 | % |
| NXM | 10,600 | | 0.3 | % |
During the twelve-month reporting period, the Funds did not repurchase any of their outstanding common shares.
As of April 30, 2011 and during the twelve-month reporting period, the Funds’ common share prices were trading at (-) discounts to their common share NAVs as shown in the accompanying table.
| Fund | 4/30/11 (-) Discount | Twelve-Month Average (-) Discount |
| NQJ | (-)7.38 | % | (-)4.48 | % |
| NNJ | (-)5.49 | % | (-)3.53 | % |
| NXJ | (-)6.91 | % | (-)5.10 | % |
| NUJ | (-)7.72 | % | (-)2.78 | % |
| NJV | (-)6.18 | % | (-)4.79 | % |
| NQP | (-)7.23 | % | (-)5.49 | % |
| NPY | (-)9.10 | % | (-)6.29 | % |
| NXM | (-)8.21 | % | (-)5.09 | % |
| NVY | (-)7.67 | % | (-)4.15 | % |
| NPN | (-)5.61 | % | (-)1.91 | % |
| NQJ | | Nuveen New Jersey | |
| Performance | | Investment Quality | |
| OVERVIEW | | Municipal Fund, Inc. | |
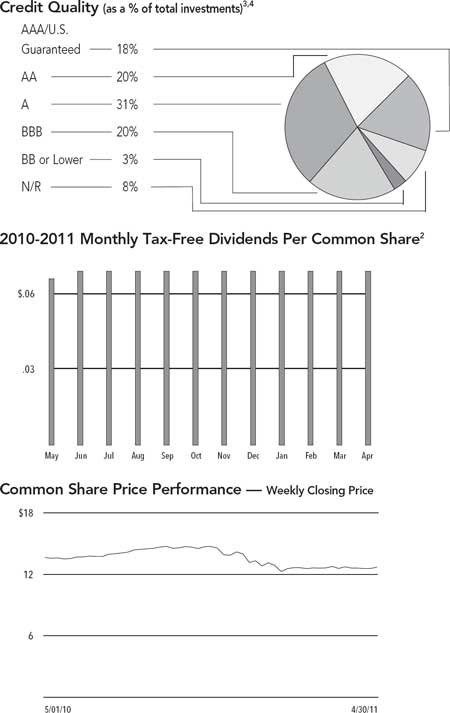
| Fund Snapshot | | | | |
| Common Share Price | | $ | 12.68 | |
| Common Share Net Asset Value (NAV) | | $ | 13.69 | |
| Premium/(Discount) to NAV | | | -7.38 | % |
| Market Yield | | | 6.53 | % |
Taxable-Equivalent Yield1 | | | 9.69 | % |
| Net Assets Applicable to Common Shares ($000) | | $ | 279,968 | |
| Leverage | | | | |
| (as a % of managed assets) | | | | |
| Structural Leverage | | | 33.51 | % |
| Effective Leverage | | | 34.99 | % |
| Average Annual Total Return | | | | | | | |
| (Inception 2/21/91) | | | | | | | |
| | | On Share Price | On NAV |
| 1-Year | | | -0.46 | % | | 0.67 | % |
| 5-Year | | | 2.95 | % | | 4.02 | % |
| 10-Year | | | 4.73 | % | | 5.37 | % |
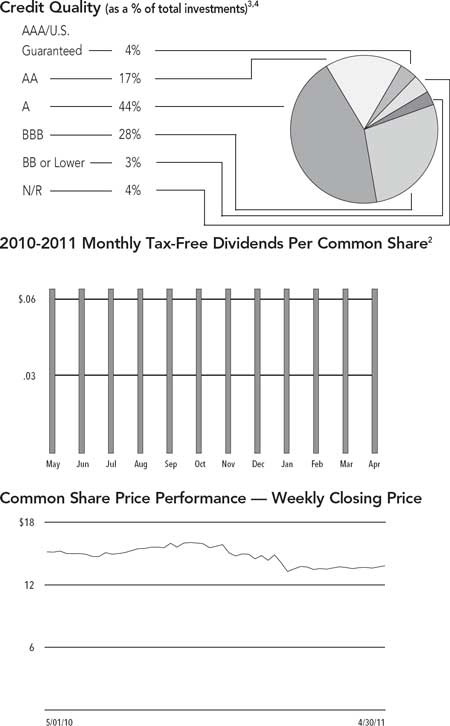
Portfolio Composition4 | | | | |
| (as a % of total investments) | | | | |
| Tax Obligation/Limited | | | 25.4 | % |
| Transportation | | | 20.5 | % |
| Health Care | | | 13.9 | % |
| U.S. Guaranteed | | | 11.7 | % |
| Education and Civic Organizations | | | 10.9 | % |
| Water and Sewer | | | 4.4 | % |
| Other | | | 13.2 | % |
| | Refer to the Glossary of Terms Used in this Report for further definition of the terms used within this Fund’s Performance Overview page. |
| 1 | Taxable-Equivalent Yield represents the yield that must be earned on a fully taxable investment in order to equal the yield of the Fund on an after-tax basis. It is based on a combined federal and state income tax rate of 32.6%. When comparing this Fund to investments that generate qualified dividend income, the Taxable-Equivalent Yield is lower. |
| 2 | The Fund paid shareholders a capital gains distribution in December 2010 of $0.0269 per share. |
| 3 | Ratings shown are the highest of Standard & Poor’s Group, Moody’s Investor Service, Inc. or Fitch, Inc. AAA includes bonds with an implied AAA rating since they are backed by U.S. Government or agency securities. AAA, AA, A and BBB ratings are investment grade; BB, B, CCC, CC, C and D ratings are below-investment grade. Holdings designated N/R are not rated by any of these national rating agencies. |
| 4 | Holdings are subject to change. |
| NNJ | | Nuveen New Jersey | |
| Performance | | Premium Income | |
| OVERVIEW | | Municipal Fund, Inc. | |
| | | as of April 30, 2011 |
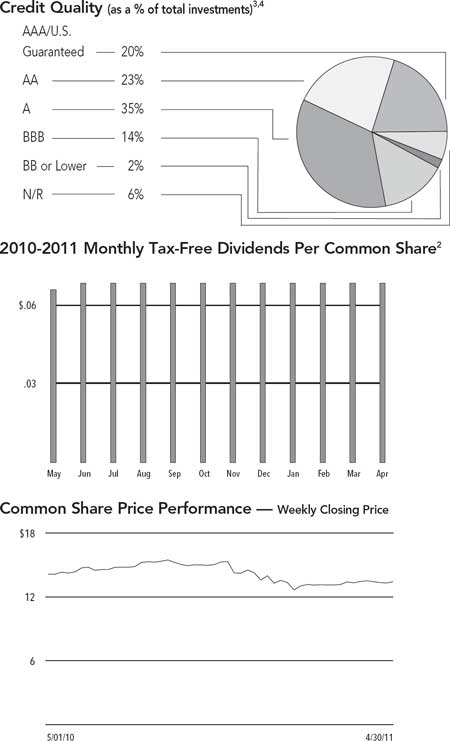
| Fund Snapshot | | | |
| Common Share Price | | $ | 13.44 | |
| Common Share Net Asset Value (NAV) | | $ | 14.22 | |
| Premium/(Discount) to NAV | | | -5.49 | % |
| Market Yield | | | 6.12 | % |
Taxable-Equivalent Yield1 | | | 9.08 | % |
| Net Assets Applicable to Common Shares ($000) | | $ | 171,212 | |
| | | | | |
| Leverage | | | | |
| (as a % of managed assets) | | | | |
| Structural Leverage | | | 33.62 | % |
| Effective Leverage | | | 35.03 | % |
| Average Annual Total Return | | | | | |
| (Inception 12/17/92) | | | | | |
| | | On Share Price | On NAV |
| 1-Year | | | 0.41 | % | | 0.57 | % |
| 5-Year | | | 3.71 | % | | 4.19 | % |
| 10-Year | | | 5.12 | % | | 5.36 | % |
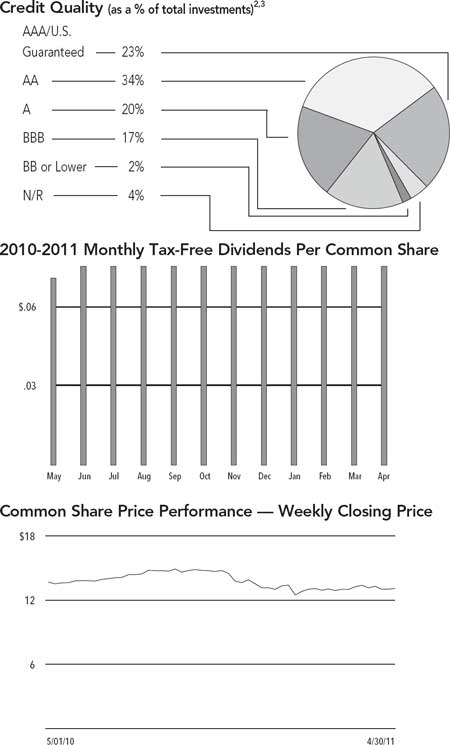
Portfolio Composition4 | | | | |
| (as a % of total investments) | | | | |
| Tax Obligation/Limited | | | 28.2 | % |
| Transportation | | | 17.0 | % |
| U.S. Guaranteed | | | 16.3 | % |
| Health Care | | | 11.3 | % |
| Education and Civic Organizations | | | 10.7 | % |
| Water and Sewer | | | 4.8 | % |
| Other | | | 11.7 | % |
| | Refer to the Glossary of Terms Used in this Report for further definition of the terms used within this Fund’s Performance Overview page. |
| 1 | Taxable-Equivalent Yield represents the yield that must be earned on a fully taxable investment in order to equal the yield of the Fund on an after-tax basis. It is based on a combined federal and state income tax rate of 32.6%. When comparing this Fund to investments that generate qualified dividend income, the Taxable-Equivalent Yield is lower. |
| 2 | The Fund paid shareholders a capital gains distribution in December 2010 of $0.0117 per share. |
| 3 | Ratings shown are the highest of Standard & Poor’s Group, Moody’s Investor Service, Inc. or Fitch, Inc. AAA includes bonds with an implied AAA rating since they are backed by U.S. Government or agency securities. AAA, AA, A and BBB ratings are investment grade; BB, B, CCC, CC, C and D ratings are below-investment grade. Holdings designated N/R are not rated by any of these national rating agencies. |
| 4 | Holdings are subject to change. |
| NXJ | | Nuveen New Jersey | |
| Performance | | Dividend Advantage | |
| OVERVIEW | | Municipal Fund | |
| | | as of April 30, 2011 |
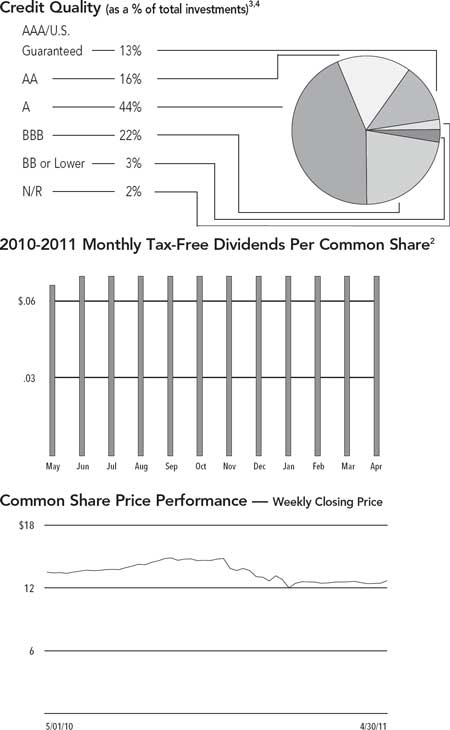
| Fund Snapshot | | | | |
| Common Share Price | | $ | 12.67 | |
| Common Share Net Asset Value (NAV) | | $ | 13.61 | |
| Premium/(Discount) to NAV | | | -6.91 | % |
| Market Yield | | | 6.58 | % |
Taxable-Equivalent Yield1 | | | 9.76 | % |
| Net Assets Applicable to Common Shares ($000) | | $ | 89,399 | |
| Leverage | | | | |
| (as a % of managed assets) | | | | |
| Structural Leverage | | | 32.66 | % |
| Effective Leverage | | | 34.92 | % |
| Average Annual Total Return | | | | | | | |
| (Inception 3/27/01) | | | | | | | |
| | | On Share Price | On NAV |
| 1-Year | | | 0.11 | % | | -0.38 | % |
| 5-Year | | | 2.18 | % | | 3.78 | % |
| 10-Year | | | 4.11 | % | | 5.45 | % |
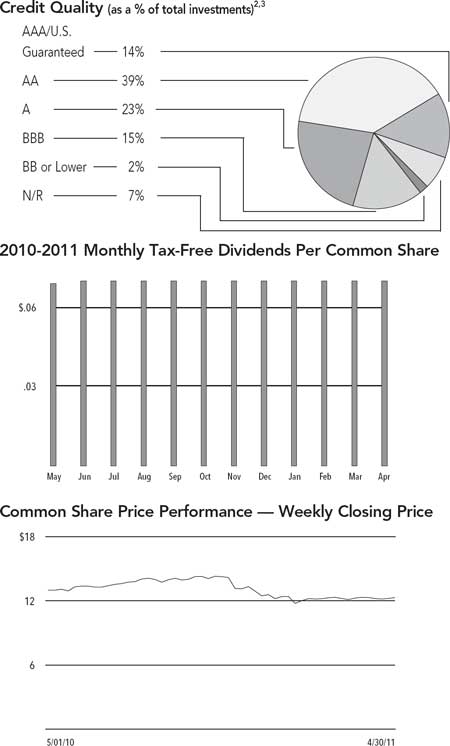
Portfolio Composition4 | | | | |
| (as a % of total investments) | | | | |
| Tax Obligation/Limited | | | 22.3 | % |
| Transportation | | | 16.4 | % |
| Water and Sewer | | | 14.8 | % |
| Health Care | | | 12.8 | % |
| U.S. Guaranteed | | | 11.9 | % |
| Education and Civic Organizations | | | 11.1 | % |
| Other | | | 10.7 | % |
| | Refer to the Glossary of Terms Used in this Report for further definition of the terms used within this Fund’s Performance Overview page. |
| 1 | Taxable-Equivalent Yield represents the yield that must be earned on a fully taxable investment in order to equal the yield of the Fund on an after-tax basis. It is based on a combined federal and state income tax rate of 32.6%. When comparing this Fund to investments that generate qualified dividend income, the Taxable-Equivalent Yield is lower. |
| 2 | The Fund paid shareholders a capital gains distribution in December 2010 of $0.0240 per share. |
| 3 | Ratings shown are the highest of Standard & Poor’s Group, Moody’s Investor Service, Inc. or Fitch, Inc. AAA includes bonds with an implied AAA rating since they are backed by U.S. Government or agency securities. AAA, AA, A and BBB ratings are investment grade; BB, B, CCC, CC, C and D ratings are below-investment grade. Holdings designated N/R are not rated by any of these national rating agencies. |
| 4 | Holdings are subject to change. |
| NUJ | | Nuveen New Jersey | |
| Performance | | Dividend Advantage | |
| OVERVIEW | | Municipal Fund 2 | |
| | | as of April 30, 2011 |
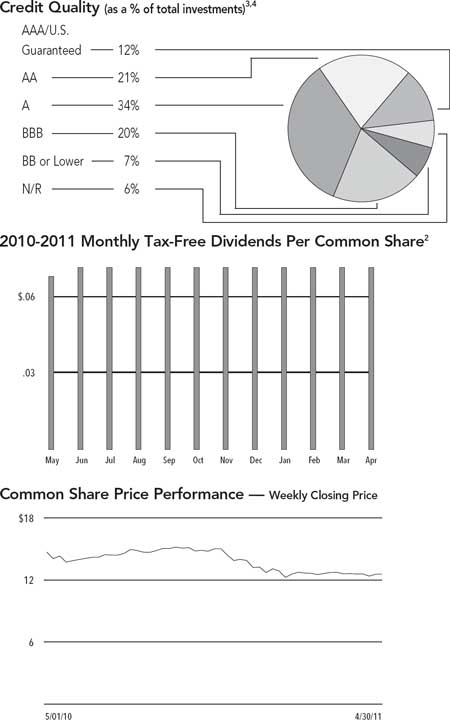
| Fund Snapshot | | | | |
| Common Share Price | | $ | 12.55 | |
| Common Share Net Asset Value (NAV) | | $ | 13.60 | |
| Premium/(Discount) to NAV | | | -7.72 | % |
| Market Yield | | | 6.84 | % |
Taxable-Equivalent Yield1 | | | 10.15 | % |
| Net Assets Applicable to Common Shares ($000) | | $ | 61,503 | |
| Leverage | | | | |
| (as a % of managed assets) | | | | |
| Structural Leverage | | | 35.79 | % |
| Effective Leverage | | | 37.20 | % |
| Average Annual Total Return | | | | | | | |
| (Inception 3/25/02) | | | | | | | |
| | | On Share Price | On NAV |
| 1-Year | | | -8.75 | % | | 0.10 | % |
| 5-Year | | | 1.89 | % | | 3.91 | % |
| Since Inception | | | 4.26 | % | | 5.57 | % |
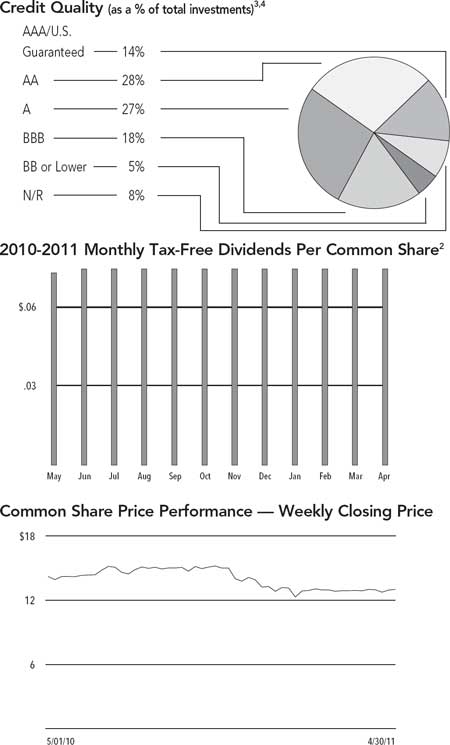
Portfolio Composition4 | | | | |
| (as a % of total investments) | | | | |
| Tax Obligation/Limited | | | 20.1 | % |
| Transportation | | | 18.6 | % |
| Health Care | | | 18.1 | % |
| U.S. Guaranteed | | | 10.4 | % |
| Education and Civic Organizations | | | 10.3 | % |
| Long-Term Care | | | 6.0 | % |
| Consumer Staples | | | 3.4 | % |
| Other | | | 13.1 | % |
| | Refer to the Glossary of Terms Used in this Report for further definition of the terms used within this Fund’s Performance Overview page. |
| 1 | Taxable-Equivalent Yield represents the yield that must be earned on a fully taxable investment in order to equal the yield of the Fund on an after-tax basis. It is based on a combined federal and state income tax rate of 32.6%. When comparing this Fund to investments that generate qualified dividend income, the Taxable-Equivalent Yield is lower. |
| 2 | The Fund paid shareholders a capital gains distribution in December 2010 of $0.0381 per share. |
| 3 | Ratings shown are the highest of Standard & Poor’s Group, Moody’s Investor Service, Inc. or Fitch, Inc. AAA includes bonds with an implied AAA rating since they are backed by U.S. Government or agency securities. AAA, AA, A and BBB ratings are investment grade; BB, B, CCC, CC, C and D ratings are below-investment grade. Holdings designated N/R are not rated by any of these national rating agencies. |
| 4 | Holdings are subject to change. |
| NJV | | Nuveen New Jersey | |
| Performance | | Municipal Value | |
| OVERVIEW | | Fund | |
| | | as of April 30, 2011 |
| Fund Snapshot | | | | |
| Common Share Price | | $ | 13.81 | |
| Common Share Net Asset Value (NAV) | | $ | 14.72 | |
| Premium/(Discount) to NAV | | | -6.18 | % |
| Market Yield | | | 5.56 | % |
Taxable-Equivalent Yield1 | | | 8.25 | % |
| Net Assets Applicable to Common Shares ($000) | | $ | 22,981 | |
| Leverage | | | | |
| (as a % of managed assets) | | | | |
| Structural Leverage | | | — | % |
| Effective Leverage | | | 6.13 | % |
| Average Annual Total Return | | | | | | | |
| (Inception 4/28/09) | | | | | | | |
| | | On Share Price | On NAV |
| 1-Year | | | -4.19 | % | | -2.17 | % |
| Since Inception | | | 0.93 | % | | 6.39 | % |
Portfolio Composition4 | | | | |
| (as a % of total investments) | | | | |
| Tax Obligation/Limited | | | 35.3 | % |
| Health Care | | | 30.4 | % |
| Education and Civic Organizations | | | 8.2 | % |
| Transportation | | | 6.6 | % |
| Consumer Staples | | | 5.2 | % |
| Other | | | 14.3 | % |
| | Refer to the Glossary of Terms Used in this Report for further definition of the terms used within this Fund’s Performance Overview page. |
| 1 | Taxable-Equivalent Yield represents the yield that must be earned on a fully taxable investment in order to equal the yield of the Fund on an after-tax basis. It is based on a combined federal and state income tax rate of 32.6%. When comparing this Fund to investments that generate qualified dividend income, the Taxable-Equivalent Yield is lower. |
| 2 | The Fund paid shareholders a net ordinary income distribution in December 2010 of $0.0246 per share. |
| 3 | Ratings shown are the highest of Standard & Poor’s Group, Moody’s Investor Service, Inc. or Fitch, Inc. AAA includes bonds with an implied AAA rating since they are backed by U.S. Government or agency securities. AAA, AA, A and BBB ratings are investment grade; BB, B, CCC, CC, C and D ratings are below-investment grade. Holdings designated N/R are not rated by any of these national rating agencies. |
| 4 | Holdings are subject to change. |
| NQP | | Nuveen Pennsylvania | |
| Performance | | Investment Quality | |
| OVERVIEW | | Municipal Fund | |
| | | as of April 30, 2011 |
| Fund Snapshot | | | | |
| Common Share Price | | $ | 13.09 | |
| Common Share Net Asset Value (NAV) | | $ | 14.11 | |
| Premium/(Discount) to NAV | | | -7.23 | % |
| Market Yield | | | 6.92 | % |
Taxable-Equivalent Yield1 | | | 9.91 | % |
| Net Assets Applicable to Common Shares ($000) | | $ | 226,905 | |
| Leverage | | | | |
| (as a % of managed assets) | | | | |
| Structural Leverage | | | 32.62 | % |
| Effective Leverage | | | 34.22 | % |
| Average Annual Total Return | | | | | |
| (Inception 2/21/91) | | | | | |
| | | On Share Price | On NAV |
| 1-Year | | | 2.43 | % | | 1.27 | % |
| 5-Year | | | 5.34 | % | | 4.14 | % |
| 10-Year | | | 4.64 | % | | 5.57 | % |
Portfolio Composition3 | | | | |
| (as a % of total investments) | | | | |
| Education and Civic Organizations | | | 18.4 | % |
| Tax Obligation/General | | | 18.0 | % |
| U.S. Guaranteed | | | 17.0 | % |
| Health Care | | | 10.7 | % |
| Transportation | | | 9.7 | % |
| Housing/Single Family | | | 6.1 | % |
| Water and Sewer | | | 4.9 | % |
| Utilities | | | 4.0 | % |
| Other | | | 11.2 | % |
| | Refer to the Glossary of Terms Used in this Report for further definition of the terms used within this Fund’s Performance Overview page. |
| 1 | Taxable-Equivalent Yield represents the yield that must be earned on a fully taxable investment in order to equal the yield of the Fund on an after-tax basis. It is based on a combined federal and state income tax rate of 30.2%. When comparing this Fund to investments that generate qualified dividend income, the Taxable-Equivalent Yield is lower. |
| 2 | Ratings shown are the highest of Standard & Poor’s Group, Moody’s Investor Service, Inc. or Fitch, Inc. AAA includes bonds with an implied AAA rating since they are backed by U.S. Government or agency securities. AAA, AA, A and BBB ratings are investment grade; BB, B, CCC, CC, C and D ratings are below-investment grade. Holdings designated N/R are not rated by any of these national rating agencies. |
| 3 | Holdings are subject to change. |
| NPY | | Nuveen Pennsylvania | |
| Performance | | Premium Income | |
| OVERVIEW | | Municipal Fund 2 | |
| | | as of April 30, 2011 |
| Fund Snapshot | | | | |
| Common Share Price | | $ | 12.29 | |
| Common Share Net Asset Value (NAV) | | $ | 13.52 | |
| Premium/(Discount) to NAV | | | -9.10 | % |
| Market Yield | | | 6.83 | % |
Taxable-Equivalent Yield1 | | | 9.79 | % |
| Net Assets Applicable to Common Shares ($000) | | $ | 210,839 | |
| Leverage | | | | |
| (as a % of managed assets) | | | | |
| Structural Leverage | | | 31.46 | % |
| Effective Leverage | | | 33.67 | % |
| Average Annual Total Return | | | | | | | |
| (Inception 3/18/93) | | | | | | | |
| | | On Share Price | On NAV |
| 1-Year | | | 1.48 | % | | 1.75 | % |
| 5-Year | | | 4.02 | % | | 4.05 | % |
| 10-Year | | | 5.31 | % | | 5.56 | % |
Portfolio Composition3 | | | | |
| (as a % of total investments) | | | | |
| Education and Civic Organizations | | | 17.3 | % |
| Transportation | | | 13.7 | % |
| U.S. Guaranteed | | | 13.4 | % |
| Health Care | | | 13.2 | % |
| Tax Obligation/General | | | 11.4 | % |
| Water and Sewer | | | 7.4 | % |
| Tax Obligation/Limited | | | 5.7 | % |
| Housing/Single Family | | | 4.4 | % |
| Other | | | 13.5 | % |
| | Refer to the Glossary of Terms Used in this Report for further definition of the terms used within this Fund’s Performance Overview page. |
| 1 | Taxable-Equivalent Yield represents the yield that must be earned on a fully taxable investment in order to equal the yield of the Fund on an after-tax basis. It is based on a combined federal and state income tax rate of 30.2%. When comparing this Fund to investments that generate qualified dividend income, the Taxable-Equivalent Yield is lower. |
| 2 | Ratings shown are the highest of Standard & Poor’s Group, Moody’s Investor Service, Inc. or Fitch, Inc. AAA includes bonds with an implied AAA rating since they are backed by U.S. Government or agency securities. AAA, AA, A and BBB ratings are investment grade; BB, B, CCC, CC, C and D ratings are below-investment grade. Holdings designated N/R are not rated by any of these national rating agencies. |
| 3 | Holdings are subject to change. |
| NXM | | Nuveen Pennsylvania | |
| Performance | | Dividend Advantage | |
| OVERVIEW | | Municipal Fund | |
| | | as of April 30, 2011 |
| Fund Snapshot | | | | |
| Common Share Price | | $ | 12.85 | |
| Common Share Net Asset Value (NAV) | | $ | 14.00 | |
| Premium/(Discount) to NAV | | | -8.21 | % |
| Market Yield | | | 6.77 | % |
Taxable-Equivalent Yield1 | | | 9.70 | % |
| Net Assets Applicable to Common Shares ($000) | | $ | 46,521 | |
| Leverage | | | | |
| (as a % of managed assets) | | | | |
| Structural Leverage | | | 32.68 | % |
| Effective Leverage | | | 34.44 | % |
Average Annual Total Return (Inception 3/27/01) | | | | | |
| | | On Share Price | On NAV |
| 1-Year | | | -0.27 | % | | 1.23 | % |
| 5-Year | | | 1.31 | % | | 4.12 | % |
| 10-Year | | | 4.90 | % | | 6.25 | % |
Portfolio Composition4 | | | | |
| (as a % of total investments) | | | | |
| Education and Civic Organizations | | | 16.1 | % |
| Long-Term Care | | | 13.6 | % |
| Health Care | | | 12.3 | % |
| U.S. Guaranteed | | | 11.3 | % |
| Tax Obligation/Limited | | | 9.4 | % |
| Tax Obligation/General | | | 9.3 | % |
| Transportation | | | 8.3 | % |
| Housing/Single Family | | | 4.8 | % |
| Other | | | 14.9 | % |
| | Refer to the Glossary of Terms Used in this Report for further definition of the terms used within this Fund’s Performance Overview page. |
| 1 | Taxable-Equivalent Yield represents the yield that must be earned on a fully taxable investment in order to equal the yield of the Fund on an after-tax basis. It is based on a combined federal and state income tax rate of 30.2%. When comparing this Fund to investments that generate qualified dividend income, the Taxable-Equivalent Yield is lower. |
| 2 | The Fund paid shareholders a capital gains distribution in December 2010 of $0.0486 per share. |
| 3 | Ratings shown are the highest of Standard & Poor’s Group, Moody’s Investor Service, Inc. or Fitch, Inc. AAA includes bonds with an implied AAA rating since they are backed by U.S. Government or agency securities. AAA, AA, A and BBB ratings are investment grade; BB, B, CCC, CC, C and D ratings are below-investment grade. Holdings designated N/R are not rated by any of these national rating agencies. |
| 4 | Holdings are subject to change. |
| NVY | | Nuveen Pennsylvania | |
| Performance | | Dividend Advantage | |
| OVERVIEW | | Municipal Fund 2 | |
| | | as of April 30, 2011 |
| Fund Snapshot | | | | |
| Common Share Price | | $ | 13.00 | |
| Common Share Net Asset Value (NAV) | | $ | 14.08 | |
| Premium/(Discount) to NAV | | | -7.67 | % |
| Market Yield | | | 6.88 | % |
Taxable-Equivalent Yield1 | | | 9.86 | % |
| Net Assets Applicable to Common Shares ($000) | | $ | 52,470 | |
| | | | | |
| Leverage | | | | |
| (as a % of managed assets) | | | | |
| Structural Leverage | | | 30.12 | % |
| Effective Leverage | | | 35.64 | % |
| Average Annual Total Return | | | | | |
| (Inception 3/25/02) | | | | | |
| | | On Share Price | On NAV |
| 1-Year | | | -2.00 | % | | 1.89 | % |
| 5-Year | | | 3.90 | % | | 4.33 | % |
| Since Inception | | | 4.66 | % | | 5.80 | % |
Portfolio Composition4 | | | | |
| (as a % of total investments) | | | | |
| Tax Obligation/Limited | | | 15.1 | % |
| Tax Obligation/General | | | 14.9 | % |
| U.S. Guaranteed | | | 14.0 | % |
| Education and Civic Organizations | | | 12.7 | % |
| Health Care | | | 9.7 | % |
| Water and Sewer | | | 6.8 | % |
| Transportation | | | 6.5 | % |
| Long-Term Care | | | 6.3 | % |
| Other | | | 14.0 | % |
| | Refer to the Glossary of Terms Used in this Report for further definition of the terms used within this Fund’s Performance Overview page. |
| 1 | Taxable-Equivalent Yield represents the yield that must be earned on a fully taxable investment in order to equal the yield of the Fund on an after-tax basis. It is based on a combined federal and state income tax rate of 30.2%. When comparing this Fund to investments that generate qualified dividend income, the Taxable-Equivalent Yield is lower. |
| 2 | The Fund paid shareholders a capital gains distribution in December 2010 of $0.0480 per share. |
| 3 | Ratings shown are the highest of Standard & Poor’s Group, Moody’s Investor Service, Inc. or Fitch, Inc. AAA includes bonds with an implied AAA rating since they are backed by U.S. Government or agency securities. AAA, AA, A and BBB ratings are investment grade; BB, B, CCC, CC, C and D ratings are below-investment grade. Holdings designated N/R are not rated by any of these national rating agencies. |
| 4 | Holdings are subject to change. |
| NPN | | Nuveen Pennsylvania | |
Performance | | Municipal Value Fund | |
OVERVIEW | | | |
| | | as of April 30, 2011 |
| Fund Snapshot | | | | |
| Common Share Price | | $ | 13.96 | |
| Common Share Net Asset Value (NAV) | | $ | 14.79 | |
| Premium/(Discount) to NAV | | | -5.61 | % |
| Market Yield | | | 5.42 | % |
Taxable-Equivalent Yield1 | | | 7.77 | % |
| Net Assets Applicable to Common Shares ($000) | | $ | 18,029 | |
| Leverage | | | | |
| (as a % of managed assets) | | | | |
| Structural Leverage | | | — | % |
| Effective Leverage | | | 11.10 | % |
| Average Annual Total Return | | | | | |
| (Inception 4/28/09) | | | | | |
| | | On Share Price | On NAV |
| 1-Year | | | -4.77 | % | | 0.59 | % |
| Since Inception | | | 1.35 | % | | 6.65 | % |
Portfolio Composition3 | | | | |
| (as a % of total investments) | | | | |
| Health Care | | | 27.9 | % |
| Tax Obligation/Limited | | | 16.9 | % |
| Water and Sewer | | | 15.4 | % |
| Education and Civic Organizations | | | 9.9 | % |
| Transportation | | | 5.7 | % |
| Housing/Multifamily | | | 4.7 | % |
| Housing/Single Family | | | 4.4 | % |
| Long-Term Care | | | 4.4 | % |
| Other | | | 10.7 | % |
| | Refer to the Glossary of Terms Used in this Report for further definition of the terms used within this Fund’s Performance Overview page. |
| 1 | Taxable-Equivalent Yield represents the yield that must be earned on a fully taxable investment in order to equal the yield of the Fund on an after-tax basis. It is based on a combined federal and state income tax rate of 30.2%. When comparing this Fund to investments that generate qualified dividend income, the Taxable-Equivalent Yield is lower. |
| 2 | Ratings shown are the highest of Standard & Poor’s Group, Moody’s Investor Service, Inc. or Fitch, Inc. AAA includes bonds with an implied AAA rating since they are backed by U.S. Government or agency securities. AAA, AA, A and BBB ratings are investment grade; BB, B, CCC, CC, C and D ratings are below-investment grade. Holdings designated N/R are not rated by any of these national rating agencies. |
| 3 | Holdings are subject to change. |
| NQJ | | Shareholder Meeting Report (Unaudited) |
| NNJ | | |
| NXJ | | The annual meeting of shareholders was held in the offices of Nuveen Investments on November 16, 2010; at this meeting the shareholders were asked to vote on the election of Board Members. |
| | NQJ | | NNJ | | NXJ |
| | Common and | | | | | | Common and | |
| | Preferred | Preferred | | Preferred | Preferred | | Preferred | Preferred |
| | shares voting | shares voting | | shares voting | shares voting | | shares voting | shares voting |
| | together | together | | together | together | | together | together |
| | as a class | as a class | | as a class | as a class | | as a class | as a class |
| Approval of the Board Members was reached as follows: | | | | | | | | |
| John P. Amboian | | | | | | | | |
| For | 18,197,493 | — | | 10,555,678 | — | | — | — |
| Withhold | 360,395 | — | | 250,202 | — | | — | — |
| Total | 18,557,888 | — | | 10,805,880 | — | | — | — |
| Robert P. Bremner | | | | | | | | |
| For | 18,192,181 | — | | 10,528,122 | — | | — | — |
| Withhold | 365,707 | — | | 277,758 | — | | — | — |
| Total | 18,557,888 | — | | 10,805,880 | — | | — | — |
| Jack B. Evans | | | | | | | | |
| For | 18,203,895 | — | | 10,535,333 | — | | — | — |
| Withhold | 353,993 | — | | 270,547 | — | | — | — |
| Total | 18,557,888 | — | | 10,805,880 | — | | — | — |
| William C. Hunter | | | | | | | | |
| For | — | 1,143 | | — | 686 | | — | 655 |
| Withhold | — | 150 | | — | 200 | | — | — |
| Total | — | 1,293 | | — | 886 | | — | 655 |
| David J. Kundert | | | | | | | | |
| For | 18,201,550 | — | | 10,534,839 | — | | — | — |
| Withhold | 356,338 | — | | 271,041 | — | | — | — |
| Total | 18,557,888 | — | | 10,805,880 | — | | — | — |
| William J. Schneider | | | | | | | | |
| For | — | 1,143 | | — | 686 | | — | 655 |
| Withhold | — | 150 | | — | 200 | | — | — |
| Total | — | 1,293 | | — | 886 | | — | 655 |
| Judith M. Stockdale | | | | | | | | |
| For | 18,179,478 | — | | 10,557,005 | — | | 6,022,670 | — |
| Withhold | 378,410 | — | | 248,875 | — | | 121,388 | — |
| Total | 18,557,888 | — | | 10,805,880 | — | | 6,144,058 | — |
| Carole E. Stone | | | | | | | | |
| For | 18,185,535 | — | | 10,550,142 | — | | 6,025,435 | — |
| Withhold | 372,353 | — | | 255,738 | — | | 118,623 | — |
| Total | 18,557,888 | — | | 10,805,880 | — | | 6,144,058 | — |
| Terence J. Toth | | | | | | | | |
| For | 18,211,106 | — | | 10,556,517 | — | | — | — |
| Withhold | 346,782 | — | | 249,363 | — | | — | — |
| Total | 18,557,888 | — | | 10,805,880 | — | | — | — |
| NUJ | | Shareholder Meeting Report (Unaudited) (continued) |
| NJV | | |
| | | NUJ | | NJV |
| | | Common and | | | |
| | | Preferred | Preferred | | |
| | | shares voting | shares voting | | |
| | | together | together | | Common |
| | | as a class | as a class | | Shares |
| Approval of the Board Members was reached as follows: | | | | | |
| John P. Amboian | | | | | |
| For | | — | — | | — |
| Withhold | | — | — | | — |
| Total | | — | — | | — |
| Robert P. Bremner | | | | | |
| For | | — | — | | — |
| Withhold | | — | — | | — |
| Total | | — | — | | — |
| Jack B. Evans | | | | | |
| For | | — | — | | — |
| Withhold | | — | — | | — |
| Total | | — | — | | — |
| William C. Hunter | | | | | |
| For | | — | 684 | | 1,486,486 |
| Withhold | | — | 1 | | 56,122 |
| Total | | — | 685 | | 1,542,608 |
| David J. Kundert | | | | | |
| For | | — | — | | — |
| Withhold | | — | — | | — |
| Total | | — | — | | — |
| William J. Schneider | | | | | |
| For | | — | 684 | | — |
| Withhold | | — | 1 | | — |
| Total | | — | 685 | | — |
| Judith M. Stockdale | | | | | |
| For | | 4,135,267 | — | | 1,486,486 |
| Withhold | | 87,675 | — | | 56,122 |
| Total | | 4,222,942 | — | | 1,542,608 |
| Carole E. Stone | | | | | |
| For | | 4,143,407 | — | | 1,486,486 |
| Withhold | | 79,535 | — | | 56,122 |
| Total | | 4,222,942 | — | | 1,542,608 |
| Terence J. Toth | | | | | |
| For | | — | — | | — |
| Withhold | | — | — | | — |
| Total | | — | — | | — |
| | NQP | | NPY | | NXM |
| | Common and | | | Common and | | | Common and | |
| | Preferred | Preferred | | Preferred | Preferred | | Preferred | Preferred |
| | shares voting | shares voting | | shares voting | shares voting | | shares voting | shares voting |
| | together | together | | together | together | | together | together |
| | as a class | as a class | | as a class | as a class | | as a class | as a class |
| Approval of the Board Members was reached as follows: | | | | | | | | |
| John P. Amboian | | | | | | | | |
| For | — | — | | — | — | | — | — |
| Withhold | — | — | | — | — | | — | — |
| Total | — | — | | — | — | | — | — |
| Robert P. Bremner | | | | | | | | |
| For | — | — | | — | — | | — | — |
| Withhold | — | — | | — | — | | — | — |
| Total | — | — | | — | — | | — | — |
| Jack B. Evans | | | | | | | | |
| For | — | — | | — | — | | — | — |
| Withhold | — | — | | — | — | | — | — |
| Total | — | — | | — | — | | — | — |
| William C. Hunter | | | | | | | | |
| For | — | 765 | | — | 680 | | — | 450 |
| Withhold | — | 250 | | — | — | | — | — |
| Total | — | 1,015 | | — | 680 | | — | 450 |
| David J. Kundert | | | | | | | | |
| For | — | — | | — | — | | — | — |
| Withhold | — | — | | — | — | | — | — |
| Total | — | — | | — | — | | — | — |
| William J. Schneider | | | | | | | | |
| For | — | 765 | | — | 680 | | — | 450 |
| Withhold | — | 250 | | — | — | | — | — |
| Total | — | 1,015 | | — | 680 | | — | 450 |
| Judith M. Stockdale | | | | | | | | |
| For | 14,074,193 | — | | 13,616,257 | — | | 3,090,478 | — |
| Withhold | 421,942 | — | | 490,288 | — | | 62,548 | — |
| Total | 14,496,135 | — | | 14,106,545 | — | | 3,153,026 | — |
| Carole E. Stone | | | | | | | | |
| For | 14,052,146 | — | | 13,646,933 | — | | 3,090,478 | — |
| Withhold | 443,989 | — | | 459,612 | — | | 62,548 | — |
| Total | 14,496,135 | — | | 14,106,545 | — | | 3,153,026 | — |
| Terence J. Toth | | | | | | | | |
| For | — | — | | — | — | | — | — |
| Withhold | — | — | | — | — | | — | — |
| Total | — | — | | — | — | | — | — |
| NVY | | Shareholder Meeting Report (Unaudited) (continued) |
| NPN | | |
| | NVY | | NPN |
| | Common and | | | |
| | Preferred | Preferred | | |
| | shares voting | shares voting | | |
| | together | together | | Common |
| | as a class | as a class | | Shares |
| Approval of the Board Members was reached as follows: | | | | |
| John P. Amboian | | | | |
| For | — | — | | — |
| Withhold | — | — | | — |
| Total | — | — | | — |
| Robert P. Bremner | | | | |
| For | — | — | | — |
| Withhold | — | — | | — |
| Total | — | — | | — |
| Jack B. Evans | | | | |
| For | — | — | | — |
| Withhold | — | — | | — |
| Total | — | — | | — |
| William C. Hunter | | | | |
| For | — | 394 | | 1,074,841 |
| Withhold | — | — | | 102,899 |
| Total | — | 394 | | 1,177,740 |
| David J. Kundert | | | | |
| For | — | — | | — |
| Withhold | — | — | | — |
| Total | — | — | | — |
| William J. Schneider | | | | |
| For | — | 394 | | — |
| Withhold | — | — | | — |
| Total | — | 394 | | — |
| Judith M. Stockdale | | | | |
| For | 3,515,672 | — | | 1,074,841 |
| Withhold | 87,178 | — | | 102,899 |
| Total | 3,602,850 | — | | 1,177,740 |
| Carole E. Stone | | | | |
| For | 3,487,632 | — | | 1,074,841 |
| Withhold | 115,218 | — | | 102,899 |
| Total | 3,602,850 | — | | 1,177,740 |
| Terence J. Toth | | | | |
| For | — | — | | — |
| Withhold | — | — | | — |
| Total | — | — | | — |
Report of Independent
Registered Public Accounting Firm
The Board of Directors/Trustees and Shareholders
Nuveen New Jersey Investment Quality Municipal Fund, Inc.
Nuveen New Jersey Premium Income Municipal Fund, Inc.
Nuveen New Jersey Dividend Advantage Municipal Fund
Nuveen New Jersey Dividend Advantage Municipal Fund 2
Nuveen New Jersey Municipal Value Fund
Nuveen Pennsylvania Investment Quality Municipal
Fund Nuveen Pennsylvania Premium Income Municipal Fund 2
Nuveen Pennsylvania Dividend Advantage Municipal
Fund Nuveen Pennsylvania Dividend Advantage Municipal Fund 2
Nuveen Pennsylvania Municipal Value Fund
We have audited the accompanying statements of assets and liabilities, including the portfolios of investments, of Nuveen New Jersey Investment Quality Municipal Fund, Inc., Nuveen New Jersey Premium Income Municipal Fund, Inc., Nuveen New Jersey Dividend Advantage Municipal Fund, Nuveen New Jersey Dividend Advantage Municipal Fund 2, Nuveen New Jersey Municipal Value Fund, Nuveen Pennsylvania Investment Quality Municipal Fund, Nuveen Pennsylvania Premium Income Municipal Fund 2, Nuveen Pennsylvania Dividend Advantage Municipal Fund, Nuveen Pennsylvania Dividend Advantage Municipal Fund 2, and Nuveen Pennsylvania Municipal Value Fund (the “Funds”) as of April 30, 2011, and the related statements of operations and cash flows (Nuveen New Jersey Investment Quality Municipal Fund, Inc., Nuveen New Jersey Premium Income Municipal Fund, Inc., Nuveen New Jersey Dividend Advantage Municipal Fund, Nuveen New Jersey Dividend Advantage Municipal Fund 2, Nuveen Pennsylvania Investment Quality Municipal Fund, Nuveen Pennsylvania Premium Income Municipal Fund 2, Nuveen Pennsylvania Dividend Advantage Municipal Fund, and Nuveen Pennsylvania Dividend Advantage Municipal Fund 2 only) for the year then ended, the statements of changes in net assets for each of the two years in the period then ended, and the financial highlights for each of the periods indicated therein. These financial statements and financial highlights are the responsibility of the Funds’ management. Our responsibility is to express an opinion on these financial statements and financial highlights based on our audits.
We conducted our audits in accordance with the standards of the Public Company Accounting Oversight Board (United States). Those standards require that we plan and perform the audits to obtain reasonable assurance about whether the financial statements and financial highlights are free of material misstatement. We were not engaged to perform an audit of the Funds’ internal control over financial reporting. Our audits included consideration of internal control over financial reporting as a basis for designing audit procedures that are appropriate in the circumstances, but not for the purpose of expressing an opinion on the effectiveness of the Funds’ internal control over financial reporting. Accordingly, we express no such opinion. An audit also includes examining, on a test basis, evidence supporting the amounts and disclosures in the financial statements and financial highlights, assessing the accounting principles used and significant estimates made by management, and evaluating the overall financial statement presentation. Our procedures included confirmation of securities owned as of April 30, 2011, by correspondence with the custodian and brokers or by other appropriate auditing procedures where replies from brokers were not received. We believe that our audits provide a reasonable basis for our opinion.
In our opinion, the financial statements and financial highlights referred to above present fairly, in all material respects, the financial positions of Nuveen New Jersey Investment Quality Municipal Fund, Inc., Nuveen New Jersey Premium Income Municipal Fund, Inc., Nuveen New Jersey Dividend Advantage Municipal Fund, Nuveen New Jersey Dividend Advantage Municipal Fund 2, Nuveen New Jersey Municipal Value Fund, Nuveen Pennsylvania Investment Quality Municipal Fund, Nuveen Pennsylvania Premium Income Municipal Fund 2, Nuveen Pennsylvania Dividend Advantage Municipal Fund, Nuveen Pennsylvania Dividend Advantage Municipal Fund 2, and Nuveen Pennsylvania Municipal Value Fund at April 30, 2011, and the results of their operations and cash flows (Nuveen New Jersey Investment Quality Municipal Fund, Inc., Nuveen New Jersey Premium Income Municipal Fund, Inc., Nuveen New Jersey Dividend Advantage Municipal Fund, Nuveen New Jersey Dividend Advantage Municipal Fund 2, Nuveen Pennsylvania Investment Quality Municipal Fund, Nuveen Pennsylvania Premium Income Municipal Fund 2, Nuveen Pennsylvania Dividend Advantage Municipal Fund, and Nuveen Pennsylvania Dividend Advantage Municipal Fund 2 only) for the year then ended, the changes in their net assets for each of the two years in the period then ended, and the financial highlights for each of the periods indicated therein in conformity with U.S. generally accepted accounting principles.

Chicago, Illinois
June 24, 2011
| | | Nuveen New Jersey Investment Quality Municipal Fund, Inc. |
| NQJ | | Portfolio of Investments |
April 30, 2011
| | Principal Amount (000) | | Description (1) | Optional Call Provisions (2) | Ratings (3) | | Value | |
| | | | Consumer Discretionary – 0.3% (0.2% of Total Investments) | | | | | |
| | | | Middlesex County Improvement Authority, New Jersey, Senior Revenue Bonds, Heldrich Center Hotel/Conference Center Project, Series 2005A: | | | | | |
| $ | 800 | | 5.000%, 1/01/32 | 1/15 at 100.00 | B3 | $ | 459,904 | |
| | 690 | | 5.125%, 1/01/37 | 1/15 at 100.00 | B3 | | 396,771 | |
| | 1,490 | | Total Consumer Discretionary | | | | 856,675 | |
| | | | Consumer Staples – 4.7 (3.2% of Total Investments) | | | | | |
| | | | Tobacco Settlement Financing Corporation, New Jersey, Tobacco Settlement Asset-Backed Bonds, Series 2007-1A: | | | | | |
| | 3,005 | | 4.500%, 6/01/23 | 6/17 at 100.00 | BBB | | 2,540,547 | |
| | 6,800 | | 4.750%, 6/01/34 | 6/17 at 100.00 | Baa3 | | 4,224,092 | |
| | 10,000 | | 5.000%, 6/01/41 | 6/17 at 100.00 | Baa3 | | 6,240,000 | |
| | 19,805 | | Total Consumer Staples | | | | 13,004,639 | |
| | | | Education and Civic Organizations – 16.1% (10.9% of Total Investments) | | | | | |
| | 1,000 | | New Jersey Economic Development Authority, Revenue Bonds, The Seeing Eye Inc., Series 2005, 5.000%, 12/01/24 – AMBAC Insured | 6/15 at 100.00 | N/R | | 981,690 | |
| | 2,000 | | New Jersey Educational Facilities Authority, Revenue Bonds, Fairleigh Dickinson University, Series 2002D, 5.250%, 7/01/32 – ACA Insured | 7/13 at 100.00 | N/R | | 1,751,900 | |
| | 500 | | New Jersey Educational Facilities Authority, Revenue Bonds, Fairleigh Dickinson University, Series 2004C, 5.500%, 7/01/23 | 7/14 at 100.00 | N/R | | 501,975 | |
| | 1,000 | | New Jersey Educational Facilities Authority, Revenue Bonds, Georgian Court University, Series 2007D, 5.000%, 7/01/27 | 7/17 at 100.00 | BBB+ | | 976,630 | |
| | | | New Jersey Educational Facilities Authority, Revenue Bonds, Kean University, Series 2007D: | | | | | |
| | 3,555 | | 5.000%, 7/01/32 – FGIC Insured | 7/17 at 100.00 | A2 | | 3,486,495 | |
| | 2,295 | | 5.000%, 7/01/39 – FGIC Insured | 7/17 at 100.00 | A2 | | 2,162,716 | |
| | 120 | | New Jersey Educational Facilities Authority, Revenue Bonds, Montclair State University, Series 2004L, 5.125%, 7/01/22 – NPFG Insured | 7/14 at 100.00 | A1 | | 124,177 | |
| | 1,225 | | New Jersey Educational Facilities Authority, Revenue Bonds, Montclair State University, Series 2005F, 5.000%, 7/01/16 – FGIC Insured | 7/15 at 100.00 | A1 | | 1,347,365 | |
| | 2,770 | | New Jersey Educational Facilities Authority, Revenue Bonds, Montclair State University, Series 2006A, 5.000%, 7/01/36 – AMBAC Insured | 7/16 at 100.00 | A1 | | 2,632,885 | |
| | | | New Jersey Educational Facilities Authority, Revenue Bonds, New Jersey Institute of Technology, Series 2004B: | | | | | |
| | 1,260 | | 5.000%, 7/01/19 – AMBAC Insured | 1/14 at 100.00 | A+ | | 1,299,463 | |
| | 2,510 | | 4.750%, 7/01/20 – AMBAC Insured | 1/14 at 100.00 | A+ | | 2,559,372 | |
| | 185 | | 4.250%, 7/01/24 – AMBAC Insured | 1/14 at 100.00 | A+ | | 184,528 | |
| | 1,500 | | New Jersey Educational Facilities Authority, Revenue Bonds, Passaic County Community College, Series 2010C, 5.250%, 7/01/32 | 7/20 at 100.00 | A2 | | 1,496,085 | |
| | 1,495 | | New Jersey Educational Facilities Authority, Revenue Bonds, Ramapo College, Series 2004H, 5.000%, 7/01/16 – FGIC Insured | 7/14 at 100.00 | A2 | | 1,607,544 | |
| | 610 | | New Jersey Educational Facilities Authority, Revenue Bonds, Rider University, Series 2004A, 5.500%, 7/01/23 – RAAI Insured | 7/14 at 100.00 | BBB+ | | 622,383 | |
| | 510 | | New Jersey Educational Facilities Authority, Revenue Bonds, Rider University, Series 2007C, 5.000%, 7/01/37 – RAAI Insured | 7/12 at 100.00 | BBB+ | | 440,941 | |
| | 1,430 | | New Jersey Educational Facilities Authority, Revenue Bonds, William Paterson University, Series 2004A, 5.125%, 7/01/21 – FGIC Insured | 7/14 at 100.00 | A1 | | 1,461,145 | |
| | 1,050 | | New Jersey Educational Facilities Authority, Revenue Refunding Bonds, Rider University, Series 2002A, 5.000%, 7/01/17 – RAAI Insured | 7/12 at 100.00 | BBB+ | | 1,068,018 | |
| | 450 | | New Jersey Higher Education Assistance Authority Student Loan Revenue Bonds Series 2010-2, 5.000%, 12/01/30 | 12/20 at 100.00 | Aa3 | | 433,913 | |
| | 2,000 | | New Jersey Higher Education Assistance Authority, Student Loan Revenue Bonds, Series 2000A, 6.125%, 6/01/17 – NPFG Insured (Alternative Minimum Tax) | 6/11 at 100.00 | Aaa | | 2,004,620 | |
| | Principal Amount (000) | | Description (1) | Optional Call Provisions (2) | Ratings (3) | | Value | |
| | | | Education and Civic Organizations (continued) | | | | | |
| $ | 2,000 | | New Jersey Higher Education Assistance Authority, Student Loan Revenue Bonds, Series 2008A, 6.125%, 6/01/30 – AGC Insured (Alternative Minimum Tax) | 6/18 at 100.00 | AA+ | $ | 2,068,300 | |
| | 720 | | New Jersey Higher Education Assistance Authority, Student Loan Revenue Bonds, Series 2010-1A, 5.000%, 12/01/25 | 12/19 at 100.00 | AA | | 702,850 | |
| | 950 | | New Jersey Higher Education Assistance Authority, Student Loan Revenue Bonds, Tender Option Bond Trust PA-4643, 19.550%, 6/01/30 (IF) (4) | 6/19 at 100.00 | AA | | 1,061,644 | |
| | 4,235 | | Puerto Rico Industrial, Tourist, Educational, Medical and Environmental Control Facilities Financing Authority, Higher Education Revenue Bonds, University of the Sacred Heart, Series 2001, 5.250%, 9/01/21 | 9/11 at 100.00 | BBB | | 4,235,508 | |
| | | | University of Medicine and Dentistry of New Jersey, Certificates of Participation, Child Health Institute, LLC, Series 2003: | | | | | |
| | 1,945 | | 5.000%, 4/15/20 – AMBAC Insured | 4/13 at 100.00 | BBB+ | | 1,971,880 | |
| | 1,370 | | 5.000%, 4/15/22 – AMBAC Insured | 4/13 at 100.00 | BBB+ | | 1,381,385 | |
| | | | University of Medicine and Dentistry of New Jersey, Revenue Bonds, Series 2002A: | | | | | |
| | 2,100 | | 5.000%, 12/01/24 – AMBAC Insured | 12/12 at 100.00 | Baa1 | | 2,101,806 | |
| | 4,000 | | 5.500%, 12/01/27 – AMBAC Insured | 12/12 at 100.00 | Baa1 | | 4,004,480 | |
| | 290 | | 5.000%, 12/01/31 – AMBAC Insured | 12/12 at 100.00 | Baa1 | | 266,226 | |
| | 45,075 | | Total Education and Civic Organizations | | | | 44,937,924 | |
| | | | Financials – 1.7% (1.2% of Total Investments) | | | | | |
| | 5,000 | | New Jersey Economic Development Authority, Revenue Refunding Bonds, Kapkowski Road Landfill Project, Series 2002, 5.750%, 10/01/21 | No Opt. Call | Ba2 | | 4,786,350 | |
| | | | Health Care – 20.4% (13.9% of Total Investments) | | | | | |
| | | | Camden County Improvement Authority, New Jersey, Revenue Bonds, Cooper Health System, Series 2004A: | | | | | |
| | 2,200 | | 5.000%, 2/15/25 | 2/15 at 100.00 | BBB | | 1,946,186 | |
| | 1,000 | | 5.750%, 2/15/34 | 8/14 at 100.00 | BBB | | 882,250 | |
| | 1,920 | | New Jersey Health Care Facilities Finance Authority, Revenue Bonds, AHS Hospital Corporation, Series 2008A, 5.000%, 7/01/27 | 7/18 at 100.00 | A1 | | 1,882,330 | |
| | 5,750 | | New Jersey Health Care Facilities Financing Authority, FHA-Insured Mortgage Revenue Bonds, Jersey City Medical Center, Series 2001, 5.000%,
8/01/41 – AMBAC Insured | 8/11 at 100.00 | N/R | | 5,402,873 | |
| | 1,175 | | New Jersey Health Care Facilities Financing Authority, Hospital Revenue Bonds, Virtua Health, Tender Option Bond Trust 3018, 19.492%, 7/01/38 – AGC Insured (IF) | 7/19 at 100.00 | AA+ | | 1,206,866 | |
| | 2,000 | | New Jersey Health Care Facilities Financing Authority, New Jersey, Revenue Bonds, Saint Peters University Hospital, Series 2007, 5.750%, 7/01/37 | 7/18 at 100.00 | BBB– | | 1,714,360 | |
| | 3,750 | | New Jersey Health Care Facilities Financing Authority, Revenue Bonds, Atlanticare Regional Medical Center, Series 2007, 5.000%, 7/01/37 | 7/17 at 100.00 | A+ | | 3,525,825 | |
| | 1,265 | | New Jersey Health Care Facilities Financing Authority, Revenue Bonds, CentraState Medical Center, Series 2006A, 5.000%, 7/01/30 – AGC Insured | 7/17 at 100.00 | Aa3 | | 1,236,689 | |
| | 400 | | New Jersey Health Care Facilities Financing Authority, Revenue Bonds, Children’s Specialized Hospital, Series 2005A, 5.500%, 7/01/36 | 7/15 at 100.00 | Baa3 | | 356,600 | |
| | 650 | | New Jersey Health Care Facilities Financing Authority, Revenue Bonds, Hunterdon Medical Center, Series 2006B, 5.000%, 7/01/36 | 7/16 at 100.00 | A– | | 574,509 | |
| | 615 | | New Jersey Health Care Facilities Financing Authority, Revenue Bonds, Hunterdon Medical Center, Series 2006, 5.125%, 7/01/35 | 7/16 at 100.00 | A– | | 556,169 | |
| | 3,000 | | New Jersey Health Care Facilities Financing Authority, Revenue Bonds, Kennedy Health System Obligated Group, Series 2001, 5.500%, 7/01/21 | 7/11 at 100.00 | A2 | | 3,001,470 | |
| | 3,535 | | New Jersey Health Care Facilities Financing Authority, Revenue Bonds, Meridian Health System Obligated Group, Series 1999, 5.250%, 7/01/29 – AGM Insured | 7/11 at 100.00 | AA+ | | 3,534,753 | |
| | | | New Jersey Health Care Facilities Financing Authority, Revenue Bonds, RWJ Health Care Corporation, Series 2005B: | | | | | |
| | 1,495 | | 5.000%, 7/01/25 – RAAI Insured | 7/15 at 100.00 | N/R | | 1,370,900 | |
| | 1,600 | | 5.000%, 7/01/35 – RAAI Insured | 7/15 at 100.00 | N/R | | 1,329,616 | |
| | | Nuveen New Jersey Investment Quality Municipal Fund, Inc. (continued) |
| NQJ | | Portfolio of Investments |
April 30, 2011
| | | | | | | | | |
| | Principal Amount (000) | | Description (1) | Optional Call Provisions (2) | Ratings (3) | | Value | |
| | | | Health Care (continued) | | | | | |
| $ | 1,885 | | New Jersey Health Care Facilities Financing Authority, Revenue Bonds, Saint Barnabas Health Care System, Series 2006A, 5.000%, 7/01/29 | 1/17 at 100.00 | BBB– | $ | 1,510,413 | |
| | 2,300 | | New Jersey Health Care Facilities Financing Authority, Revenue Bonds, Saint Joseph’s Healthcare System Obligated Group Issue, Series 2008, 6.625%, 7/01/38 | 7/18 at 100.00 | BBB– | | 2,255,725 | |
| | 2,850 | | New Jersey Health Care Facilities Financing Authority, Revenue Bonds, Shore Memorial Health System, Series 2003, 5.000%, 7/01/23 – RAAI Insured | 7/13 at 100.00 | N/R | | 2,696,699 | |
| | 3,300 | | New Jersey Health Care Facilities Financing Authority, Revenue Bonds, Somerset Medical Center, Series 2003, 5.500%, 7/01/33 | 7/13 at 100.00 | Ba2 | | 2,454,936 | |
| | | | New Jersey Health Care Facilities Financing Authority, Revenue Bonds, South Jersey Hospital System, Series 2006: | | | | | |
| | 670 | | 5.000%, 7/01/25 | 7/16 at 100.00 | A2 | | 667,936 | |
| | 4,410 | | 5.000%, 7/01/36 | 7/16 at 100.00 | A2 | | 4,027,124 | |
| | 1,295 | | 5.000%, 7/01/46 | 7/16 at 100.00 | A2 | | 1,145,272 | |
| | 2,000 | | New Jersey Health Care Facilities Financing Authority, Revenue Bonds, St. Peter’s University Hospital, Series 2000A, 6.875%, 7/01/20 | 7/11 at 100.00 | BBB– | | 2,001,200 | |
| | 3,135 | | New Jersey Health Care Facilities Financing Authority, Revenue Refunding Bonds, Bayshore Community Hospital, Series 2002, 5.125%, 7/01/32 – RAAI Insured | 1/12 at 100.00 | N/R | | 2,438,905 | |
| | 2,605 | | New Jersey Health Care Facilities Financing Authority, Revenue Refunding Bonds, St. Barnabas Healthcare System – West Hudson Hospital Obligated Group, Series 1998A, 5.000%, 7/01/23 – NPFG Insured | 7/11 at 100.00 | Baa1 | | 2,405,353 | |
| | 3,595 | | New Jersey Health Facilities Financing Authority, Revenue Bonds, Meridian Health, Series 2007-I, 5.000%, 7/01/38 – AGC Insured | 7/18 at 100.00 | AA+ | | 3,393,464 | |
| | 3,535 | | Newark, New Jersey, GNMA Collateralized Healthcare Facility Revenue Bonds, New Community Urban Renewal Corporation, Series 2001A, 5.200%, 6/01/30 | 6/12 at 102.00 | Aaa | | 3,520,012 | |
| | 61,935 | | Total Health Care | | | | 57,038,435 | |
| | | | Housing/Multifamily – 1.9% (1.3% of Total Investments) | | | | | |
| | | | New Jersey Economic Development Authority, Student Housing Revenue Bonds, Provident Group-Montclair Properties LLC, Montclair State University Student Housing Project, Series 2010A: | | | | | |
| | 1,830 | | 5.750%, 6/01/31 | 6/20 at 100.00 | Baa3 | | 1,704,261 | |
| | 1,050 | | 5.875%, 6/01/42 | 6/20 at 100.00 | Baa3 | | 943,572 | |
| | 2,743 | | Newark Housing Authority, New Jersey, GNMA Collateralized Housing Revenue Bonds, Fairview Apartments Project, Series 2000A, 6.400%, 10/20/34 (Alternative Minimum Tax) | 10/11 at 100.00 | Aaa | | 2,755,956 | |
| | 5,623 | | Total Housing/Multifamily | | | | 5,403,789 | |
| | | | Housing/Single Family – 1.9% (1.3% of Total Investments) | | | | | |
| | 300 | | New Jersey Housing and Mortgage Finance Agency, Home Buyer Program Revenue Bonds, Series 2000CC, 5.875%, 10/01/31 – NPFG Insured (Alternative Minimum Tax) | 10/11 at 100.00 | Aaa | | 300,093 | |
| | 335 | | New Jersey Housing and Mortgage Finance Agency, Single Family Housing Revenue Bonds, Series 2007T, 4.700%, 10/01/37 (Alternative Minimum Tax) | 4/17 at 100.00 | AA | | 304,900 | |
| | 2,330 | | Puerto Rico Housing Finance Corporation, Mortgage-Backed Securities Home Mortgage Revenue Bonds, Series 2001A, 5.200%, 12/01/33 | 6/11 at 100.00 | Aaa | | 2,330,419 | |
| | 2,330 | | Puerto Rico Housing Finance Corporation, Mortgage-Backed Securities Home Mortgage Revenue Bonds, Series 2001B, 5.300%, 12/01/28 (Alternative Minimum Tax) | 6/11 at 100.00 | Aaa | | 2,330,047 | |
| | 5,295 | | Total Housing/Single Family | | | | 5,265,459 | |
| | | | Long-Term Care – 2.8% (1.9% of Total Investments) | | | | | |
| | 1,870 | | Burlington County Bridge Commission, New Jersey, Economic Development Revenue Bonds, The Evergreens Project, Series 2007, 5.625%, 1/01/38 | 1/18 at 100.00 | N/R | | 1,493,999 | |
| | 1,125 | | New Jersey Economic Development Authority, First Mortgage Revenue Bonds, Winchester Gardens at Wards Homestead, Series 2004A, 5.750%, 11/01/24 | 11/14 at 100.00 | N/R | | 1,118,531 | |
| | 2,695 | | New Jersey Economic Development Authority, GNMA Collateralized Mortgage Revenue Bonds, Victoria Health Corporation, Series 2001A, 5.200%, 12/20/36 | 12/11 at 103.00 | Aaa | | 2,586,149 | |
| | Principal Amount (000) | | Description (1) | Optional Call Provisions (2) | Ratings (3) | | Value | |
| | | | Long-Term Care (continued) | | | | | |
| $ | 595 | | New Jersey Economic Development Authority, Revenue Bonds, Masonic Charity Foundation of New Jersey, Series 2001, 5.875%, 6/01/18 | 6/11 at 102.00 | A– | $ | 607,721 | |
| | 1,100 | | New Jersey Economic Development Authority, Revenue Bonds, Masonic Charity Foundation of New Jersey, Series 2002, 5.250%, 6/01/32 | 6/13 at 102.00 | A– | | 1,010,581 | |
| | 1,000 | | New Jersey Health Care Facilities Financing Authority, Revenue Bonds, House of the Good Shepherd Obligated Group, Series 2001, 5.100%, 7/01/21 – RAAI Insured | 7/11 at 100.00 | N/R | | 885,420 | |
| | 8,385 | | Total Long-Term Care | | | | 7,702,401 | |
| | | | Tax Obligation/General – 3.3% (2.2% of Total Investments) | | | | | |
| | 4,300 | | Jersey City, New Jersey, General Obligation Bonds, Series 2006A, 5.000%, 9/01/22 – AMBAC Insured | 9/16 at 100.00 | A2 | | 4,479,439 | |
| | 930 | | Middletown Township Board of Education, Monmouth County, New Jersey, Refunding Series 2010, 5.000%, 8/01/27 | 8/20 at 100.00 | AA | | 992,766 | |
| | | | West Deptford Township, New Jersey, General Obligation Bonds, Series 2004: | | | | | |
| | 1,690 | | 5.000%, 9/01/16 – AMBAC Insured | 9/14 at 100.00 | A– | | 1,785,806 | |
| | 1,865 | | 4.750%, 9/01/18 – AMBAC Insured | 9/14 at 100.00 | A– | | 1,931,114 | |
| | 8,785 | | Total Tax Obligation/General | | | | 9,189,125 | |
| | | | Tax Obligation/Limited – 37.2% (25.4% of Total Investments) | | | | | |
| | 1,775 | | Bergen County Improvement Authority, New Jersey, Guaranteed Lease Revenue Bonds, County Administration Complex Project, Series 2005, 5.000%, 11/15/26 | No Opt. Call | Aaa | | 2,037,931 | |
| | 1,965 | | Essex County Improvement Authority, New Jersey, Project Consolidation Revenue Bonds, Series 2007, 5.250%, 12/15/22 – AMBAC Insured | No Opt. Call | Aa2 | | 2,209,839 | |
| | 2,650 | | Garden State Preservation Trust, New Jersey, Open Space and Farmland Preservation Bonds, Series 2005C, 5.125%, 11/01/18 – AGM Insured | No Opt. Call | AAA | | 3,101,216 | |
| | | | Gloucester County Improvement Authority, New Jersey, Lease Revenue Bonds, Series 2005A: | | | | | |
| | 1,000 | | 5.000%, 9/01/21 – NPFG Insured | 9/15 at 100.00 | AA+ | | 1,070,750 | |
| | 1,420 | | 5.000%, 9/01/22 – NPFG Insured | 9/15 at 100.00 | AA+ | | 1,513,706 | |
| | | | Hudson County Improvement Authority, New Jersey, County Secured Lease Revenue Bonds, County Services Building Project, Series 2005: | | | | | |
| | 1,090 | | 5.000%, 4/01/25 – AMBAC Insured | 4/15 at 100.00 | AA– | | 1,120,596 | |
| | 2,525 | | 5.000%, 4/01/35 – AMBAC Insured | 4/15 at 100.00 | AA– | | 2,512,678 | |
| | 1,445 | | Lower Township Municipal Utilities Authority, Cape May County, New Jersey, Revenue Bonds, Series 2003D, 5.000%, 12/01/16 – FGIC Insured | No Opt. Call | N/R | | 1,506,889 | |
| | | | Middlesex County Improvement Authority, New Jersey, County Guaranteed Open Space Trust Fund Revenue Bonds, Series 2003: | | | | | |
| | 1,000 | | 5.250%, 9/15/16 | 9/13 at 100.00 | AAA | | 1,085,420 | |
| | 2,000 | | 5.250%, 9/15/18 | 9/13 at 100.00 | AAA | | 2,170,840 | |
| | 5,700 | | New Jersey Building Authority, State Building Revenue Bonds, Series 2007A, 5.000%, 6/15/26 | 6/16 at 100.00 | A+ | | 5,756,088 | |
| | | | New Jersey Economic Development Authority, Cigarette Tax Revenue Bonds, Series 2004: | | | | | |
| | 1,965 | | 5.500%, 6/15/24 | 6/12 at 100.00 | BBB | | 1,834,151 | |
| | 2,500 | | 5.750%, 6/15/29 | 6/14 at 100.00 | BBB | | 2,281,950 | |
| | 5,750 | | 5.750%, 6/15/34 | 6/14 at 100.00 | BBB | | 5,117,903 | |
| | 4,675 | | New Jersey Economic Development Authority, Lease Revenue Bonds, Liberty State Park Project, Series 2005C, 5.000%, 3/01/27 – AGM Insured | 3/15 at 100.00 | AA+ | | 4,708,754 | |
| | 5,000 | | New Jersey Economic Development Authority, Revenue Bonds, Motor Vehicle Surcharge, Series 2004A, 5.250%, 7/01/15 – NPFG Insured | 7/14 at 100.00 | A | | 5,431,800 | |
| | | | New Jersey Economic Development Authority, Revenue Bonds, Newark Downtown District Management Corporation Project, Series 2007: | | | | | |
| | 205 | | 5.125%, 6/15/27 | 6/17 at 100.00 | Baa3 | | 183,487 | |
| | 345 | | 5.125%, 6/15/37 | 6/17 at 100.00 | Baa3 | | 282,741 | |
| | | | New Jersey Economic Development Authority, School Facilities Construction Financing Program Bonds, Series 2007U: | | | | | |
| | 1,965 | | 5.000%, 9/01/37 – AMBAC Insured | 9/17 at 100.00 | A+ | | 1,855,078 | |
| | 3,930 | | 5.000%, 9/01/37 | 9/17 at 100.00 | A+ | | 3,710,156 | |
| | | Nuveen New Jersey Investment Quality Municipal Fund, Inc. (continued) |
| NQJ | | Portfolio of Investments |
April 30, 2011
| | | | | | | | | |
| | Principal Amount (000) | | Description (1) | Optional Call Provisions (2) | Ratings (3) | | Value | |
| | | | Tax Obligation/Limited (continued) | | | | | |
| $ | 1,925 | | New Jersey Educational Facilities Authority, Revenue Bonds, Higher Education Capital Improvement Fund, Refunding Series 2005A, 5.000%, 9/01/15 – AGM Insured | No Opt. Call | AA+ | $ | 2,107,798 | |
| | 2,500 | | New Jersey Health Care Facilities Financing Authority, Lease Revenue Bonds, Department of Human Services – Greystone Park Psychiatric Hospital, Series 2003, 5.000%, 9/15/25 | 9/13 at 100.00 | A+ | | 2,489,725 | |
| | | | New Jersey Health Care Facilities Financing Authority, Lease Revenue Bonds, Department of Human Services – Greystone Park Psychiatric Hospital, Series 2005: | | | | | |
| | 2,885 | | 5.000%, 9/15/18 – AMBAC Insured | 9/15 at 100.00 | A+ | | 3,044,252 | |
| | 4,455 | | 5.000%, 9/15/24 – AMBAC Insured | 9/15 at 100.00 | A+ | | 4,489,571 | |
| | 850 | | New Jersey Health Care Facilities Financing Authority, State Contract Bonds, Hospital Asset Transformation Program, Series 2008A, 5.250%, 10/01/38 | 10/18 at 100.00 | A+ | | 815,405 | |
| | | | New Jersey Transportation Trust Fund Authority, Federal Highway Aid Grant Anticipation Bonds, Series 2006: | | | | | |
| | 1,075 | | 5.000%, 6/15/17 – FGIC Insured | 6/16 at 100.00 | Aa3 | | 1,160,678 | |
| | 1,900 | | 5.000%, 6/15/18 – FGIC Insured | 6/16 at 100.00 | Aa3 | | 2,027,319 | |
| | 12,000 | | New Jersey Transportation Trust Fund Authority, Transportation System Bonds, Capital Appreciation Series 2010A, 0.000%, 12/15/30 | No Opt. Call | AA– | | 3,438,720 | |
| | 4,300 | | New Jersey Transportation Trust Fund Authority, Transportation System Bonds, Refunding Series 2006A, 5.500%, 12/15/22 | No Opt. Call | A+ | | 4,707,812 | |
| | 4,200 | | New Jersey Transportation Trust Fund Authority, Transportation System Bonds, Series 2004B, 5.500%, 12/15/16 – NPFG Insured | No Opt. Call | A+ | | 4,721,094 | |
| | 3,890 | | New Jersey Transportation Trust Fund Authority, Transportation System Bonds, Series 2005D, 5.000%, 6/15/19 – AGM Insured | 6/15 at 100.00 | AA+ | | 4,108,151 | |
| | | | New Jersey Transportation Trust Fund Authority, Transportation System Bonds, Series 2006C: | | | | | |
| | 10,000 | | 0.000%, 12/15/32 – AGM Insured | No Opt. Call | AA+ | | 2,333,000 | |
| | 15,355 | | 0.000%, 12/15/33 – AGM Insured | No Opt. Call | AA+ | | 3,321,440 | |
| | 15,310 | | 0.000%, 12/15/34 – AGM Insured | No Opt. Call | AA+ | | 3,066,899 | |
| | 2,500 | | New Jersey Transportation Trust Fund Authority, Transportation System Bonds, Series 2007A, 5.000%, 12/15/26 – AMBAC Insured | 12/17 at 100.00 | A+ | | 2,518,075 | |
| | 4,100 | | New Jersey Transportation Trust Fund Authority, Transportation System Bonds, Series 2010D, 5.000%, 12/15/24 | No Opt. Call | A+ | | 4,182,328 | |
| | 1,625 | | Passaic County Improvement Authority, New Jersey, Lease Revenue Bonds, Preakness Healthcare Center Project, Series 2005, 5.000%, 5/01/30 – AMBAC Insured | 5/15 at 100.00 | Aa3 | | 1,633,483 | |
| | 1,315 | | Puerto Rico Convention Center District Authority, Hotel Occupancy Tax Revenue Bonds, Series 2006A, 4.500%, 7/01/36 – CIFG Insured | 7/16 at 100.00 | A3 | | 1,041,717 | |
| | 2,000 | | Puerto Rico Sales Tax Financing Corporation, Sales Tax Revenue Bonds, First Subordinate Series 2010C, 6.000%, 8/01/39 | 8/20 at 100.00 | A+ | | 2,011,060 | |
| | 1,650 | | Virgin Islands Public Finance Authority, Matching Fund Loan Notes Revenue Bonds, Subordinate Lien Series 2010B, 5.250%, 10/01/29 | 10/20 at 100.00 | Baa2 | | 1,553,360 | |
| | 142,740 | | Total Tax Obligation/Limited | | | | 104,263,860 | |
| | | | Transportation – 30.0% (20.5% of Total Investments) | | | | | |
| | 2,250 | | Casino Reinvestment Development Authority, New Jersey, Parking Revenue Bonds, Series 2005A, 5.250%, 6/01/20 – NPFG Insured | 6/15 at 100.00 | A– | | 2,287,013 | |
| | | | Delaware River and Bay Authority, Delaware and New Jersey, Revenue Bonds, Series 2005: | | | | | |
| | 2,000 | | 5.000%, 1/01/25 – NPFG Insured | 1/15 at 100.00 | A1 | | 2,049,700 | |
| | 4,050 | | 5.000%, 1/01/26 – NPFG Insured | 1/15 at 100.00 | A1 | | 4,134,078 | |
| | 1,500 | | 5.000%, 1/01/27 – NPFG Insured | 1/15 at 100.00 | A1 | | 1,530,630 | |
| | | | Delaware River Port Authority, New Jersey and Pennsylvania, Revenue Bonds, Series 2010E: | | | | | |
| | 1,000 | | 5.000%, 1/01/40 – AGM Insured | 1/20 at 100.00 | AA+ | | 987,920 | |
| | 3,300 | | 5.000%, 1/01/40 | 1/20 at 100.00 | A– | | 3,260,136 | |
| | 2,960 | | Delaware River Port Authority, Pennsylvania and New Jersey, Revenue Refunding Bonds, Port District Project, Series 2001A, 5.200%, 1/01/27 – AGM Insured | 1/12 at 100.00 | AA+ | | 2,975,629 | |
| | 3,000 | | New Jersey Economic Development Authority, Revenue Bonds, American Airlines Inc., Series 1991, 7.100%, 11/01/31 (Alternative Minimum Tax) | 11/11 at 100.00 | CCC+ | | 2,444,580 | |
| | Principal Amount (000) | | Description (1) | Optional Call Provisions (2) | Ratings (3) | | Value | |
| | | | Transportation (continued) | | | | | |
| $ | 3,405 | | New Jersey Transit Corporation, Certificates of Participation, Federal Transit Administration Grants, Series 2005A, 5.000%, 9/15/18 – FGIC Insured | 9/15 at 100.00 | A1 | $ | 3,578,042 | |
| | 160 | | New Jersey Turnpike Authority, Revenue Bonds, Series 1991C, 6.500%, 1/01/16 – NPFG Insured | No Opt. Call | A+ | | 188,282 | |
| | 9,500 | | New Jersey Turnpike Authority, Revenue Bonds, Series 2003A, 5.000%, 1/01/19 – FGIC Insured | 7/13 at 100.00 | A+ | | 10,066,104 | |
| | 1,265 | | New Jersey Turnpike Authority, Revenue Bonds, Series 2005A, 5.250%, 1/01/29 – AGM Insured | No Opt. Call | AA+ | | 1,387,035 | |
| | 4,000 | | New Jersey Turnpike Authority, Revenue Bonds, Series 2009I, 5.000%, 1/01/35 | 1/20 at 100.00 | A+ | | 3,972,280 | |
| | 1,260 | | Passaic County Improvement Authority, New Jersey, County Guaranteed Parking Revenue Bonds, 200 Hospital Plaza Project, Series 2010, 5.000%, 5/01/42 | 5/20 at 100.00 | Aa3 | | 1,240,470 | |
| | | | Port Authority of New York and New Jersey, Consolidated Revenue Bonds, One Hundred Fortieth Series 2005: | | | | | |
| | 7,000 | | 5.000%, 12/01/28 – SYNCORA GTY Insured | 6/15 at 101.00 | Aa2 | | 7,207,269 | |
| | 3,000 | | 5.000%, 12/01/34 | No Opt. Call | Aa2 | | 3,022,560 | |
| | 1,000 | | Port Authority of New York and New Jersey, Consolidated Revenue Bonds, One Hundred Forty Eighth Series 2008, Trust 2920, 17.482%, 8/15/32 – AGM Insured (IF) | 8/17 at 100.00 | AA+ | | 1,039,480 | |
| | 2,000 | | Port Authority of New York and New Jersey, Consolidated Revenue Bonds, One Hundred Thirty-Fourth Series 2004, 5.000%, 7/15/34 | 1/14 at 101.00 | Aa2 | | 2,011,940 | |
| | | | Port Authority of New York and New Jersey, Consolidated Revenue Bonds, One Hundred Twenty-Fifth Series 2002: | | | | | |
| | 2,280 | | 5.000%, 10/15/26 – AGM Insured | 4/12 at 101.00 | AA+ | | 2,320,698 | |
| | 5,000 | | 5.000%, 4/15/32 – AGM Insured | 4/12 at 101.00 | AA+ | | 5,036,100 | |
| | | | Port Authority of New York and New Jersey, Special Project Bonds, JFK International Air Terminal LLC, Sixth Series 1997: | | | | | |
| | 3,500 | | 7.000%, 12/01/12 – NPFG Insured (Alternative Minimum Tax) | No Opt. Call | Baa1 | | 3,657,710 | |
| | 6,605 | | 5.750%, 12/01/22 – NPFG Insured (Alternative Minimum Tax) | 6/11 at 100.00 | Baa1 | | 6,357,774 | |
| | 12,130 | | 5.750%, 12/01/25 – NPFG Insured (Alternative Minimum Tax) | 6/11 at 100.00 | Baa1 | | 11,358,046 | |
| | 2,000 | | South Jersey Port Corporation, New Jersey, Marine Terminal Revenue Refunding Bonds, Series 2002K, 5.100%, 1/01/33 | 1/13 at 100.00 | A– | | 1,966,380 | |
| | 84,165 | | Total Transportation | | | | 84,079,856 | |
| | | | U.S. Guaranteed – 17.1% (11.7% of Total Investments) (5) | | | | | |
| | 2,500 | | Bergen County Improvement Authority, New Jersey, Revenue Bonds, Yeshiva Ktana of Passaic Project, Series 2002, 6.000%, 9/15/27 (Pre-refunded 9/01/12) | 9/12 at 101.00 | N/R (5) | | 2,700,575 | |
| | 1,500 | | New Jersey Educational Facilities Authority, Revenue Bonds, Kean University, Series 2003D, 5.250%, 7/01/20 (Pre-refunded 7/01/13) – FGIC Insured | 7/13 at 100.00 | A2 (5) | | 1,649,430 | |
| | 1,925 | | New Jersey Educational Facilities Authority, Revenue Bonds, Kean University, Series 2005B, 5.000%, 7/01/30 (Pre-refunded 7/01/16) – NPFG Insured | 7/16 at 100.00 | A– (5) | | 2,256,447 | |
| | 1,380 | | New Jersey Educational Facilities Authority, Revenue Bonds, Montclair State University, Series 2004L, 5.125%, 7/01/22 (Pre-refunded 7/01/14) – NPFG Insured | 7/14 at 100.00 | A2 (5) | | 1,558,903 | |
| | | | New Jersey Educational Facilities Authority, Revenue Bonds, Montclair State University, Series 2005F: | | | | | |
| | 2,000 | | 5.000%, 7/01/18 (Pre-refunded 7/01/15) – FGIC Insured | 7/15 at 100.00 | A1 (5) | | 2,301,740 | |
| | 1,175 | | 5.000%, 7/01/32 (Pre-refunded 7/01/15) – FGIC Insured | 7/15 at 100.00 | A1 (5) | | 1,352,272 | |
| | 2,000 | | New Jersey Educational Facilities Authority, Revenue Bonds, New Jersey City University, Series 2002A, 5.000%, 7/01/32 (Pre-refunded 7/01/12) – AMBAC Insured | 7/12 at 100.00 | A2 (5) | | 2,105,900 | |
| | | | New Jersey Educational Facilities Authority, Revenue Bonds, New Jersey Institute of Technology, Series 2001G: | | | | | |
| | 1,000 | | 5.250%, 7/01/20 (Pre-refunded 7/01/11) – NPFG Insured | 7/11 at 100.00 | A+ (5) | | 1,008,540 | |
| | 1,945 | | 5.250%, 7/01/21 (Pre-refunded 7/01/11) – NPFG Insured | 7/11 at 100.00 | A+ (5) | | 1,961,610 | |
| | 1,300 | | New Jersey Educational Facilities Authority, Revenue Bonds, Rowan University, Series 2003I, 5.125%, 7/01/21 (Pre-refunded 7/01/13) – FGIC Insured | 7/13 at 100.00 | A+ (5) | | 1,426,009 | |
| | | | New Jersey Educational Facilities Authority, Revenue Bonds, Rowan University, Series 2004C: | | | | | |
| | 1,195 | | 5.000%, 7/01/20 (Pre-refunded 7/01/14) – NPFG Insured | 7/14 at 100.00 | A+ (5) | | 1,348,474 | |
| | 1,875 | | 5.000%, 7/01/24 (Pre-refunded 7/01/14) – NPFG Insured | 7/14 at 100.00 | A+ (5) | | 2,115,806 | |
| | | Nuveen New Jersey Investment Quality Municipal Fund, Inc. (continued) |
| NQJ | | Portfolio of Investments |
April 30, 2011
| | Principal Amount (000) | | Description (1) | Optional Call Provisions (2) | Ratings (3) | | Value | |
| | | | U.S. Guaranteed (5) (continued) | | | | | |
| $ | 2,840 | | New Jersey Health Care Facilities Financing Authority, Revenue Bonds, Capital Health System Obligated Group, Series 2003A, 5.375%, 7/01/33 (Pre-refunded 7/01/13) | 7/13 at 100.00 | N/R (5) | $ | 3,096,963 | |
| | 7,860 | | New Jersey Health Care Facilities Financing Authority, Revenue Bonds, South Jersey Hospital System, Series 2002, 5.875%, 7/01/21 (Pre-refunded 7/01/12) | 7/12 at 100.00 | A2 (5) | | 8,361,310 | |
| | 1,690 | | New Jersey Health Care Facilities Financing Authority, Revenue Bonds, St. Clare’s Hospital, Series 2004A, 5.250%, 7/01/20 – RAAI Insured (ETM) | No Opt. Call | N/R (5) | | 1,970,743 | |
| | | | New Jersey Turnpike Authority, Revenue Bonds, Series 1991C: | | | | | |
| | 170 | | 6.500%, 1/01/16 (ETM) | No Opt. Call | AAA | | 206,453 | |
| | 55 | | 6.500%, 1/01/16 – NPFG Insured (ETM) | No Opt. Call | A+ (5) | | 67,293 | |
| | 2,505 | | 6.500%, 1/01/16 (ETM) | No Opt. Call | AAA | | 2,807,930 | |
| | 1,250 | | Newark Housing Authority, New Jersey, Port Authority Terminal Revenue Bonds, Series 2004, 5.250%, 1/01/21 (Pre-refunded 1/01/14) – NPFG Insured | 1/14 at 100.00 | AA– (5) | | 1,394,825 | |
| | | | Tobacco Settlement Financing Corporation, New Jersey, Tobacco Settlement Asset-Backed Bonds, Series 2002: | | | | | |
| | 955 | | 5.750%, 6/01/32 (Pre-refunded 6/01/12) | 6/12 at 100.00 | AAA | | 994,642 | |
| | 3,000 | | 6.000%, 6/01/37 (Pre-refunded 6/01/12) | 6/12 at 100.00 | AAA | | 3,184,560 | |
| | | | Tobacco Settlement Financing Corporation, New Jersey, Tobacco Settlement Asset-Backed Bonds, Series 2003: | | | | | |
| | 1,175 | | 6.125%, 6/01/24 (Pre-refunded 6/01/12) | 6/12 at 100.00 | AAA | | 1,185,845 | |
| | 2,625 | | 6.375%, 6/01/32 (Pre-refunded 6/01/13) | 6/13 at 100.00 | AAA | | 2,885,321 | |
| | 43,920 | | Total U.S. Guaranteed | | | | 47,941,591 | |
| | | | Utilities – 2.7% (1.9% of Total Investments) | | | | | |
| | 2,055 | | Mercer County Improvement Authority, New Jersey, Solid Waste Revenue Bonds, Regional Sludge Project, Series 2003, 5.000%, 12/15/14 – FGIC Insured | 12/13 at 100.00 | AA+ | | 2,239,888 | |
| | 2,500 | | Salem County Pollution Control Financing Authority, New Jersey, Pollution Control Revenue Refunding Bonds, PSEG Power LLC Project, Series 2001A, 5.750%, 4/01/31 (Alternative Minimum Tax) | 4/12 at 101.00 | Baa1 | | 2,446,250 | |
| | 3,000 | | Union County Utilities Authority, New Jersey, Solid Waste Facility Senior Lien Revenue Bonds, Ogden Martin Systems of Union Inc., Series 1998A, 5.000%, 6/01/23 – AMBAC Insured (Alternative Minimum Tax) | 6/11 at 100.00 | A | | 2,959,200 | |
| | 7,555 | | Total Utilities | | | | 7,645,338 | |
| | | | Water and Sewer – 6.4% (4.4% of Total Investments) | | | | | |
| | 3,000 | | Jersey City Municipal Utilities Authority, Hudson County, New Jersey, Sewer Revenue Bonds, Series 2001A-2, 5.200%, 7/15/21 – FGIC Insured (Alternative Minimum Tax) | 7/11 at 100.00 | BBB | | 3,000,960 | |
| | | | Lacey Municipal Utilities Authority, Ocean County, New Jersey, Water Revenue Bonds, Series 2003B: | | | | | |
| | 1,750 | | 5.000%, 12/01/17 – FGIC Insured | 12/13 at 100.00 | N/R | | 1,830,238 | |
| | 1,835 | | 5.000%, 12/01/18 – FGIC Insured | 12/13 at 100.00 | N/R | | 1,913,923 | |
| | 1,000 | | 5.000%, 12/01/19 – FGIC Insured | 12/13 at 100.00 | N/R | | 1,031,010 | |
| | 3,000 | | New Jersey Economic Development Authority, Water Facilities Revenue Bonds, New Jersey-American Water Company Inc. Project, Refunding Series 2010B, 5.600%, 11/01/34 (Alternative Minimum Tax) | 5/20 at 100.00 | A | | 2,972,910 | |
| | 1,080 | | New Jersey Economic Development Authority, Water Facilities Revenue Bonds, New Jersey-American Water Company Inc. Project, Refunding Series 2010D, 4.875%, 11/01/29 (Alternative Minimum Tax) | 11/20 at 100.00 | A | | 1,025,071 | |
| | Principal Amount (000) | | Description (1) | Optional Call Provisions (2) | Ratings (3) | | Value | |
| | | | Water and Sewer (continued) | | | | | |
| | | | North Hudson Sewerage Authority, New Jersey, Sewerage Revenue Refunding Bonds, Series 2002A: | | | | | |
| $ | 3,000 | | 5.250%, 8/01/16 – FGIC Insured | 8/12 at 100.00 | N/R | $ | 3,100,860 | |
| | 3,000 | | 5.250%, 8/01/18 – FGIC Insured | 8/12 at 100.00 | N/R | | 3,076,770 | |
| | 17,665 | | Total Water and Sewer | | | | 17,951,742 | |
| $ | 457,438 | | Total Investments (cost $421,705,226) – 146.5% | | | | 410,067,184 | |
| | | | Variable Rate Demand Preferred Shares, at Liquidation Value – (51.6)% (6) | | | | (144,300,000 | ) |
| | | | Other Assets Less Liabilities – 5.1% | | | | 14,200,804 | |
| | | | Net Assets Applicable to Common Shares – 100% | | | $ | 279,967,988 | |
| (1) | | All percentages shown in the Portfolio of Investments are based on net assets applicable to Common shares unless otherwise noted. |
| (2) | | Optional Call Provisions (not covered by the report of independent registered public accounting firm): Dates (month and year) and prices of the earliest optional call or redemption. There may be other call provisions at varying prices at later dates. Certain mortgage-backed securities may be subject to periodic principal paydowns. |
| (3) | | Ratings (not covered by the report of independent registered public accounting firm): Using the highest of Standard & Poor’s Group (“Standard & Poor’s”), Moody’s Investor Service, Inc. (“Moody’s”) or Fitch, Inc. (“Fitch”) rating. Ratings below BBB by Standard & Poor’s, Baa by Moody’s or BBB by Fitch are considered to be below investment grade. Holdings designated N/R are not rated by any of these national rating agencies. |
| (4) | | Investment, or portion of investment, has been pledged to collateralize the net payment obligations for investments in inverse floating rate transactions. |
| (5) | | Backed by an escrow or trust containing sufficient U.S. Government or U.S. Government agency securities, which ensure the timely payment of principal and interest. Such investments are normally considered to be equivalent to AAA rated securities. |
| (6) | | Variable Rate Demand Preferred Shares, at Liquidation Value as a percentage of Total Investments is 35.2%. |
| N/R | | Not rated. |
| (ETM) | | Escrowed to maturity. |
| (IF) | | Inverse floating rate investment. |
See accompanying notes to financial statements.
| | | Nuveen New Jersey Premium Income Municipal Fund, Inc. |
| NNJ | | Portfolio of Investments |
April 30, 2011
| | Principal Amount (000) | | Description (1) | Optional Call Provisions (2) | Ratings (3) | | Value | |
| | | | Consumer Discretionary – 0.3% (0.2% of Total Investments) | | | | | |
| | | | Middlesex County Improvement Authority, New Jersey, Senior Revenue Bonds, Heldrich Center Hotel/Conference Center Project, Series 2005A: | | | | | |
| $ | 480 | | 5.000%, 1/01/32 | 1/15 at 100.00 | B3 | $ | 275,942 | |
| | 415 | | 5.125%, 1/01/37 | 1/15 at 100.00 | B3 | | 238,637 | |
| | 895 | | Total Consumer Discretionary | | | | 514,579 | |
| | | | Consumer Staples – 3.8% (2.5% of Total Investments) | | | | | |
| | | | Tobacco Settlement Financing Corporation, New Jersey, Tobacco Settlement Asset-Backed Bonds, Series 2007-1A: | | | | | |
| | 785 | | 4.500%, 6/01/23 | 6/17 at 100.00 | BBB | | 663,670 | |
| | 3,945 | | 4.750%, 6/01/34 | 6/17 at 100.00 | Baa3 | | 2,450,595 | |
| | 5,300 | | 5.000%, 6/01/41 | 6/17 at 100.00 | Baa3 | | 3,307,200 | |
| | 10,030 | | Total Consumer Staples | | | | 6,421,465 | |
| | | | Education and Civic Organizations – 15.9% (10.7% of Total Investments) | | | | | |
| | 1,125 | | New Jersey Economic Development Authority, Revenue Bonds, The Seeing Eye Inc., Series 2005, 5.000%, 12/01/24 – AMBAC Insured | 6/15 at 100.00 | N/R | | 1,104,401 | |
| | 500 | | New Jersey Educational Facilities Authority, Revenue Bonds, Fairleigh Dickinson University, Series 2002D, 5.250%, 7/01/32 – ACA Insured | 7/13 at 100.00 | N/R | | 437,975 | |
| | 300 | | New Jersey Educational Facilities Authority, Revenue Bonds, Fairleigh Dickinson University, Series 2004C, 5.500%, 7/01/23 | 7/14 at 100.00 | N/R | | 301,185 | |
| | | | New Jersey Educational Facilities Authority, Revenue Bonds, Kean University, Series 2007D: | | | | | |
| | 2,090 | | 5.000%, 7/01/32 – FGIC Insured | 7/17 at 100.00 | A2 | | 2,049,726 | |
| | 3,350 | | 5.000%, 7/01/39 – FGIC Insured | 7/17 at 100.00 | A2 | | 3,156,906 | |
| | 100 | | New Jersey Educational Facilities Authority, Revenue Bonds, Montclair State University, Series 2004L, 5.125%, 7/01/19 – NPFG Insured | 7/14 at 100.00 | A1 | | 105,126 | |
| | 970 | | New Jersey Educational Facilities Authority, Revenue Bonds, Montclair State University, Series 2006A, 5.000%, 7/01/36 – AMBAC Insured | 7/16 at 100.00 | A1 | | 921,985 | |
| | | | New Jersey Educational Facilities Authority, Revenue Bonds, New Jersey Institute of Technology, Series 2004B: | | | | | |
| | 1,375 | | 5.000%, 7/01/18 – AMBAC Insured | 1/14 at 100.00 | A+ | | 1,427,649 | |
| | 725 | | 5.000%, 7/01/19 – AMBAC Insured | 1/14 at 100.00 | A+ | | 747,707 | |
| | 1,530 | | 4.750%, 7/01/20 – AMBAC Insured | 1/14 at 100.00 | A+ | | 1,560,095 | |
| | 1,000 | | New Jersey Educational Facilities Authority, Revenue Bonds, Passaic County Community College, Series 2010C, 5.375%, 7/01/41 | 7/20 at 100.00 | A2 | | 981,610 | |
| | | | New Jersey Educational Facilities Authority, Revenue Bonds, Ramapo College, Series 2004H: | | | | | |
| | 1,640 | | 5.000%, 7/01/18 – FGIC Insured | 7/14 at 100.00 | A2 | | 1,730,085 | |
| | 1,040 | | 5.000%, 7/01/23 – FGIC Insured | 7/14 at 100.00 | A2 | | 1,066,114 | |
| | 300 | | New Jersey Educational Facilities Authority, Revenue Bonds, Rider University, Series 2004A, 5.500%, 7/01/23 – RAAI Insured | 7/14 at 100.00 | BBB+ | | 306,090 | |
| | 270 | | New Jersey Higher Education Assistance Authority, Student Loan Revenue Bonds Series 2010-2, 5.000%, 12/01/30 | 12/20 at 100.00 | Aa3 | | 260,348 | |
| | 1,405 | | New Jersey Higher Education Assistance Authority, Student Loan Revenue Bonds, Series 1999A, 5.250%, 6/01/18 – NPFG Insured (Alternative Minimum Tax) | 6/11 at 100.00 | A | | 1,406,461 | |
| | 985 | | New Jersey Higher Education Assistance Authority, Student Loan Revenue Bonds, Series 2000A, 6.000%, 6/01/15 – NPFG Insured (Alternative Minimum Tax) | 6/11 at 100.00 | Aaa | | 987,738 | |
| | 2,000 | | New Jersey Higher Education Assistance Authority, Student Loan Revenue Bonds, Series 2008A, 6.125%, 6/01/30 – AGC Insured (Alternative Minimum Tax) | 6/18 at 100.00 | AA+ | | 2,068,300 | |
| | 450 | | New Jersey Higher Education Assistance Authority, Student Loan Revenue Bonds, Series 2010-1A, 5.000%, 12/01/25 | 12/19 at 100.00 | AA | | 439,281 | |
| | 550 | | New Jersey Higher Education Assistance Authority, Student Loan Revenue Bonds, Tender Option Bond Trust PA-4643, 19.550%, 6/01/30 (IF) (4) | 6/19 at 100.00 | AA | | 614,636 | |
| | Principal Amount (000) | | Description (1) | Optional Call Provisions (2) | Ratings (3) | | Value | |
| | | | Education and Civic Organizations (continued) | | | | | |
| $ | 2,025 | | University of Medicine and Dentistry of New Jersey, Certificates of Participation, Child Health Institute, LLC, Series 2003, 5.000%, 4/15/21 – AMBAC Insured | 4/13 at 100.00 | BBB+ | $ | 2,048,126 | |
| | 1,000 | | University of Medicine and Dentistry of New Jersey, Certificates of Participation, University Housing Associates, LLC, Series 2004, 5.000%, 6/15/29 – NPFG Insured | 6/14 at 100.00 | BBB+ | | 960,200 | |
| | 2,750 | | University of Medicine and Dentistry of New Jersey, Revenue Bonds, Series 2002A, 5.000%, 12/01/31 – AMBAC Insured | 12/12 at 100.00 | Baa1 | | 2,524,555 | |
| | 27,480 | | Total Education and Civic Organizations | | | | 27,206,299 | |
| | | | Financials – 0.8% (0.6% of Total Investments) | | | | | |
| | 1,500 | | New Jersey Economic Development Authority, Revenue Refunding Bonds, Kapkowski Road Landfill Project, Series 2002, 5.750%, 10/01/21 | No Opt. Call | Ba2 | | 1,435,905 | |
| | | | Health Care – 16.7% (11.3% of Total Investments) | | | | | |
| | | | Camden County Improvement Authority, New Jersey, Revenue Bonds, Cooper Health System, Series 2004A: | | | | | |
| | 685 | | 5.000%, 2/15/25 | 2/15 at 100.00 | BBB | | 605,972 | |
| | 620 | | 5.750%, 2/15/34 | 8/14 at 100.00 | BBB | | 546,995 | |
| | 1,120 | | New Jersey Health Care Facilities Finance Authority, Revenue Bonds, AHS Hospital Corporation, Series 2008A, 5.000%, 7/01/27 | 7/18 at 100.00 | A1 | | 1,098,026 | |
| | 695 | | New Jersey Health Care Facilities Financing Authority, Hospital Revenue Bonds, Virtua Health, Tender Option Bond Trust 3018, 19.492%, 7/01/38 – AGC Insured (IF) | 7/19 at 100.00 | AA+ | | 713,848 | |
| | 1,615 | | New Jersey Health Care Facilities Financing Authority, Revenue Bonds, Atlanticare Regional Medical Center, Series 2007, 5.000%, 7/01/37 | 7/17 at 100.00 | A+ | | 1,518,455 | |
| | 240 | | New Jersey Health Care Facilities Financing Authority, Revenue Bonds, Children’s Specialized Hospital, Series 2005A, 5.500%, 7/01/36 | 7/15 at 100.00 | Baa3 | | 213,960 | |
| | 700 | | New Jersey Health Care Facilities Financing Authority, Revenue Bonds, Hunterdon Medical Center, Series 2006B, 5.000%, 7/01/36 | 7/16 at 100.00 | A– | | 618,702 | |
| | 375 | | New Jersey Health Care Facilities Financing Authority, Revenue Bonds, Hunterdon Medical Center, Series 2006, 5.125%, 7/01/35 | 7/16 at 100.00 | A– | | 339,128 | |
| | 3,500 | | New Jersey Health Care Facilities Financing Authority, Revenue Bonds, Kennedy Health System Obligated Group, Series 2001, 5.625%, 7/01/31 | 7/11 at 100.00 | A2 | | 3,308,235 | |
| | 1,700 | | New Jersey Health Care Facilities Financing Authority, Revenue Bonds, Meridian Health System Obligated Group, Series 1999, 5.625%, 7/01/12 – AGM Insured | 7/11 at 100.00 | AA+ | | 1,705,627 | |
| | 465 | | New Jersey Health Care Facilities Financing Authority, Revenue Bonds, Palisades Medical Center of New York Presbyterian Healthcare System, Series 2002, 6.625%, 7/01/31 | 7/12 at 101.00 | BB+ | | 415,808 | |
| | 1,000 | | New Jersey Health Care Facilities Financing Authority, Revenue Bonds, RWJ Health Care Corporation, Series 2005B, 5.000%, 7/01/35 – RAAI Insured | 7/15 at 100.00 | N/R | | 831,010 | |
| | 1,160 | | New Jersey Health Care Facilities Financing Authority, Revenue Bonds, Saint Barnabas Health Care System, Series 2006A, 5.000%, 7/01/29 | 1/17 at 100.00 | BBB– | | 929,485 | |
| | 1,500 | | New Jersey Health Care Facilities Financing Authority, Revenue Bonds, Saint Joseph’s Healthcare System Obligated Group Issue, Series 2008, 6.625%, 7/01/38 | 7/18 at 100.00 | BBB– | | 1,471,125 | |
| | 1,675 | | New Jersey Health Care Facilities Financing Authority, Revenue Bonds, Shore Memorial Health System, Series 2003, 5.000%, 7/01/23 – RAAI Insured | 7/13 at 100.00 | N/R | | 1,584,902 | |
| | 2,010 | | New Jersey Health Care Facilities Financing Authority, Revenue Bonds, Somerset Medical Center, Series 2003, 5.500%, 7/01/33 | 7/13 at 100.00 | Ba2 | | 1,495,279 | |
| | | | New Jersey Health Care Facilities Financing Authority, Revenue Bonds, South Jersey Hospital System, Series 2006: | | | | | |
| | 1,245 | | 5.000%, 7/01/36 | 7/16 at 100.00 | A2 | | 1,136,909 | |
| | 1,155 | | 5.000%, 7/01/46 | 7/16 at 100.00 | A2 | | 1,021,459 | |
| | | | New Jersey Health Care Facilities Financing Authority, Revenue Bonds, St. Peter’s University Hospital, Series 2000A: | | | | | |
| | 2,050 | | 6.875%, 7/01/20 | 7/11 at 100.00 | BBB– | | 2,051,230 | |
| | 95 | | 6.875%, 7/01/30 | 7/11 at 100.00 | BBB– | | 94,438 | |
| | | Nuveen New Jersey Premium Income Municipal Fund, Inc. (continued) |
| NNJ | | Portfolio of Investments |
April 30, 2011
| | Principal Amount (000) | | Description (1) | Optional Call Provisions (2) | Ratings (3) | | Value | |
| | | | Health Care (continued) | | | | | |
| $ | 630 | | New Jersey Health Care Facilities Financing Authority, Revenue Refunding Bonds, Atlantic City Medical Center, Series 2002, 5.750%, 7/01/25 | 7/12 at 100.00 | A+ | $ | 638,417 | |
| | 1,710 | | New Jersey Health Care Facilities Financing Authority, Revenue Refunding Bonds, Bayshore Community Hospital, Series 2002, 5.000%, 7/01/22 – RAAI Insured | 1/12 at 100.00 | N/R | | 1,510,836 | |
| | 2,155 | | New Jersey Health Facilities Financing Authority, Revenue Bonds, Meridian Health, Series 2007-I, 5.000%, 7/01/38 – AGC Insured | 7/18 at 100.00 | AA+ | | 2,034,191 | |
| | 2,650 | | Puerto Rico Industrial, Tourist, Educational, Medical and Environmental Control Facilities Financing Authority, Adjustable Rate Industrial Revenue Bonds, American Home Products Corporation, Series 1983A, 5.100%, 12/01/18 | 6/11 at 100.00 | A1 | | 2,659,302 | |
| | 30,750 | | Total Health Care | | | | 28,543,339 | |
| | | | Housing/Multifamily – 3.6% (2.4% of Total Investments) | | | | | |
| | 340 | | Essex County Improvement Authority, New Jersey, FNMA Enhanced Multifamily Revenue Bonds, Mount Carmel Towers, Series 2002, 4.750%, 11/01/22 (Alternative Minimum Tax) | 11/12 at 100.00 | Aaa | | 340,830 | |
| | | | New Jersey Economic Development Authority, Student Housing Revenue Bonds, Provident Group-Montclair Properties LLC, Montclair State University Student Housing Project, Series 2010A: | | | | | |
| | 1,100 | | 5.750%, 6/01/31 | 6/20 at 100.00 | Baa3 | | 1,024,419 | |
| | 550 | | 5.875%, 6/01/42 | 6/20 at 100.00 | Baa3 | | 494,252 | |
| | 4,445 | | New Jersey Housing and Mortgage Finance Agency, Multifamily Housing Revenue Bonds, Series 1997A, 5.550%, 5/01/27 – AMBAC Insured (Alternative Minimum Tax) | 11/11 at 100.00 | A+ | | 4,298,669 | |
| | 6,435 | | Total Housing/Multifamily | | | | 6,158,170 | |
| | | | Housing/Single Family – 0.3% (0.2% of Total Investments) | | | | | |
| | 575 | | New Jersey Housing and Mortgage Finance Agency, Single Family Housing Revenue Bonds, Series 2007T, 4.700%, 10/01/37 (Alternative Minimum Tax) | 4/17 at 100.00 | AA | | 523,336 | |
| | | | Long-Term Care – 1.5% (1.0% of Total Investments) | | | | | |
| | 1,095 | | Burlington County Bridge Commission, New Jersey, Economic Development Revenue Bonds, The Evergreens Project, Series 2007, 5.625%, 1/01/38 | 1/18 at 100.00 | N/R | | 874,828 | |
| | 750 | | New Jersey Economic Development Authority, First Mortgage Revenue Bonds, Winchester Gardens at Wards Homestead, Series 2004A, 5.800%, 11/01/31 | 11/14 at 100.00 | N/R | | 718,800 | |
| | 1,000 | | New Jersey Economic Development Authority, Revenue Bonds, Masonic Charity Foundation of New Jersey, Series 2001, 5.500%, 6/01/21 | 6/11 at 102.00 | A– | | 1,010,940 | |
| | 2,845 | | Total Long-Term Care | | | | 2,604,568 | |
| | | | Tax Obligation/General – 7.0% (4.8% of Total Investments) | | | | | |
| | 2,250 | | Freehold Regional High School District, Monmouth County Board of Education, New Jersey, School District Refunding Bonds, Series 2001, 5.000%, 3/01/17 – FGIC Insured | No Opt. Call | AA | | 2,576,903 | |
| | 2,500 | | Jersey City, New Jersey, General Obligation Bonds, Series 2006A, 5.000%, 9/01/22 – AMBAC Insured | 9/16 at 100.00 | A2 | | 2,604,325 | |
| | 555 | | Middletown Township Board of Education, Monmouth County, New Jersey, Refunding Series 2010, 5.000%, 8/01/27 | 8/20 at 100.00 | AA | | 592,457 | |
| | 1,560 | | New Jersey, General Obligation Bonds, Series 1992D, 6.000%, 2/15/13 | No Opt. Call | AA– | | 1,697,873 | |
| | 2,655 | | Passaic County, New Jersey, General Improvement Refunding Bonds, Series 1993, 5.125%, 9/01/12 – FGIC Insured | No Opt. Call | Aa3 | | 2,726,446 | |
| | 1,780 | | West Deptford Township, New Jersey, General Obligation Bonds, Series 2004, 4.750%, 9/01/17 – AMBAC Insured | 9/14 at 100.00 | A– | | 1,859,869 | |
| | 11,300 | | Total Tax Obligation/General | | | | 12,057,873 | |
| | | | Tax Obligation/Limited – 41.8% (28.2% of Total Investments) | | | | | |
| | 1,000 | | Bergen County Improvement Authority, New Jersey, Guaranteed Lease Revenue Bonds, County Administration Complex Project, Series 2005, 5.000%, 11/15/26 | No Opt. Call | Aaa | | 1,148,130 | |
| | 5,385 | | Essex County Improvement Authority, New Jersey, Lease Revenue Bonds, Series 2003, 5.125%, 12/15/19 – AGM Insured | 12/13 at 100.00 | Aa2 | | 5,820,752 | |
| | | | | | | | | |
| | Principal Amount (000) | | Description (1) | Optional Call Provisions (2) | Ratings (3) | | Value | |
| | | | Tax Obligation/Limited (continued) | | | | | |
| $ | 1,155 | | Essex County Improvement Authority, New Jersey, Project Consolidation Revenue Bonds, Series 2007, 5.250%, 12/15/22 – AMBAC Insured | No Opt. Call | Aa2 | $ | 1,298,913 | |
| | 3,000 | | Garden State Preservation Trust, New Jersey, Open Space and Farmland Preservation Bonds, Series 2003B, 0.000%, 11/01/25 – AGM Insured | No Opt. Call | AAA | | 1,508,310 | |
| | 1,225 | | Garden State Preservation Trust, New Jersey, Open Space and Farmland Preservation Bonds, Series 2005C, 5.125%, 11/01/18 – AGM Insured | No Opt. Call | AAA | | 1,433,581 | |
| | | | Hudson County Improvement Authority, New Jersey, County Secured Lease Revenue Bonds, County Services Building Project, Series 2005: | | | | | |
| | 1,185 | | 5.000%, 4/01/25 – AMBAC Insured | 4/15 at 100.00 | AA– | | 1,218,263 | |
| | 2,755 | | 5.000%, 4/01/35 – AMBAC Insured | 4/15 at 100.00 | AA– | | 2,741,556 | |
| | 1,000 | | Middlesex County Improvement Authority, New Jersey, County Guaranteed Open Space Trust Fund Revenue Bonds, Series 2003, 5.250%, 9/15/16 | 9/13 at 100.00 | AAA | | 1,085,420 | |
| | 3,450 | | New Jersey Building Authority, State Building Revenue Bonds, Series 2007A, 5.000%, 6/15/25 | 6/16 at 100.00 | A+ | | 3,499,611 | |
| | | | New Jersey Economic Development Authority, Cigarette Tax Revenue Bonds, Series 2004: | | | | | |
| | 1,155 | | 5.500%, 6/15/24 | 6/12 at 100.00 | BBB | | 1,078,089 | |
| | 500 | | 5.750%, 6/15/29 | 6/14 at 100.00 | BBB | | 456,390 | |
| | 1,600 | | 5.500%, 6/15/31 | 6/14 at 100.00 | BBB | | 1,403,760 | |
| | 2,540 | | 5.750%, 6/15/34 | 6/14 at 100.00 | BBB | | 2,260,778 | |
| | 3,200 | | New Jersey Economic Development Authority, Revenue Bonds, Motor Vehicle Surcharge, Series 2004A, 5.250%, 7/01/15 – NPFG Insured | 7/14 at 100.00 | A | | 3,476,352 | |
| | | | New Jersey Economic Development Authority, Revenue Bonds, Newark Downtown District Management Corporation Project, Series 2007: | | | | | |
| | 120 | | 5.125%, 6/15/27 | 6/17 at 100.00 | Baa3 | | 107,407 | |
| | 205 | | 5.125%, 6/15/37 | 6/17 at 100.00 | Baa3 | | 168,006 | |
| | | | New Jersey Economic Development Authority, School Facilities Construction Financing Program Bonds, Series 2007U: | | | | | |
| | 1,155 | | 5.000%, 9/01/37 – AMBAC Insured | 9/17 at 100.00 | A+ | | 1,090,389 | |
| | 2,310 | | 5.000%, 9/01/37 | 9/17 at 100.00 | A+ | | 2,180,779 | |
| | 2,720 | | New Jersey Health Care Facilities Financing Authority, Lease Revenue Bonds, Department of Human Services – Greystone Park Psychiatric Hospital, Series 2003, 5.000%, 9/15/25 | 9/13 at 100.00 | A+ | | 2,708,821 | |
| | | | New Jersey Health Care Facilities Financing Authority, Lease Revenue Bonds, Department of Human Services – Greystone Park Psychiatric Hospital, Series 2005: | | | | | |
| | 2,615 | | 5.000%, 9/15/24 – AMBAC Insured | 9/15 at 100.00 | A+ | | 2,635,292 | |
| | 3,000 | | 5.000%, 9/15/28 – AMBAC Insured | 9/15 at 100.00 | A+ | | 2,891,820 | |
| | 505 | | New Jersey Health Care Facilities Financing Authority, State Contract Bonds, Hospital Asset Transformation Program, Series 2008A, 5.250%, 10/01/38 | 10/18 at 100.00 | A+ | | 484,447 | |
| | 1,500 | | New Jersey Sports and Exposition Authority, Convention Center Luxury Tax Bonds, Series 2004, 5.500%, 3/01/22 – NPFG Insured | No Opt. Call | Baa1 | | 1,619,430 | |
| | | | New Jersey Transportation Trust Fund Authority, Federal Highway Aid Grant Anticipation Bonds, Series 2006: | | | | | |
| | 400 | | 5.000%, 6/15/17 – FGIC Insured | 6/16 at 100.00 | Aa3 | | 431,880 | |
| | 715 | | 5.000%, 6/15/18 – FGIC Insured | 6/16 at 100.00 | Aa3 | | 762,912 | |
| | 12,000 | | New Jersey Transportation Trust Fund Authority, Transportation System Bonds, Capital Appreciation Series 2010A, 0.000%, 12/15/30 | No Opt. Call | AA– | | 3,438,720 | |
| | 1,700 | | New Jersey Transportation Trust Fund Authority, Transportation System Bonds, Refunding Series 2006A, 5.500%, 12/15/22 | No Opt. Call | A+ | | 1,861,228 | |
| | 2,600 | | New Jersey Transportation Trust Fund Authority, Transportation System Bonds, Series 2004B, 5.500%, 12/15/16 – NPFG Insured | No Opt. Call | A+ | | 2,922,582 | |
| | 2,000 | | New Jersey Transportation Trust Fund Authority, Transportation System Bonds, Series 2005B, 5.250%, 12/15/18 – FGIC Insured | 12/15 at 100.00 | A+ | | 2,136,540 | |
| | 1,110 | | New Jersey Transportation Trust Fund Authority, Transportation System Bonds, Series 2005D, 5.000%, 6/15/19 – AGM Insured | 6/15 at 100.00 | AA+ | | 1,172,249 | |
| | | Nuveen New Jersey Premium Income Municipal Fund, Inc. (continued) |
| NNJ | | Portfolio of Investments |
April 30, 2011
| | Principal Amount (000) | | Description (1) | Optional Call Provisions (2) | Ratings (3) | | Value | |
| | | | Tax Obligation/Limited (continued) | | | | | |
| | | | New Jersey Transportation Trust Fund Authority, Transportation System Bonds, Series 2006C: | | | | | |
| $ | 6,000 | | 0.000%, 12/15/32 – AGM Insured | No Opt. Call | AA+ | $ | 1,399,800 | |
| | 12,000 | | 0.000%, 12/15/33 – AGM Insured | No Opt. Call | AA+ | | 2,595,720 | |
| | 4,000 | | 0.000%, 12/15/34 – AGM Insured | No Opt. Call | AA+ | | 801,280 | |
| | 4,000 | | New Jersey Transportation Trust Fund Authority, Transportation System Bonds, Series 2007A, 5.000%, 12/15/26 – AMBAC Insured | 12/17 at 100.00 | A+ | | 4,028,920 | |
| | 800 | | New Jersey Transportation Trust Fund Authority, Transportation System Bonds, Series 2010D, 5.000%, 12/15/24 | No Opt. Call | A+ | | 816,064 | |
| | 780 | | Puerto Rico Convention Center District Authority, Hotel Occupancy Tax Revenue Bonds, Series 2006A, 4.500%, 7/01/36 – CIFG Insured | 7/16 at 100.00 | A3 | | 617,900 | |
| | 2,745 | | Union County Improvement Authority, New Jersey, General Obligation Lease Revenue Bonds, Plainfield Park Madison Redevelopment Project, Series 2003, 5.000%, 3/01/34 – AGM Insured | 3/13 at 100.00 | Aaa | | 2,700,751 | |
| | 2,445 | | Union County Improvement Authority, New Jersey, General Obligation Lease Revenue Bonds, Series 2003, 5.000%, 6/15/23 | 6/13 at 100.00 | Aa1 | | 2,587,544 | |
| | 1,000 | | Virgin Islands Public Finance Authority, Matching Fund Loan Notes Revenue Bonds, Subordinate Lien Series 2010B, 5.250%, 10/01/29 | 10/20 at 100.00 | Baa2 | | 941,430 | |
| | 97,575 | | Total Tax Obligation/Limited | | | | 71,531,816 | |
| | | | Transportation – 25.2% (17.0% of Total Investments) | | | | | |
| | 2,750 | | Casino Reinvestment Development Authority, New Jersey, Parking Revenue Bonds, Series 2005A, 5.250%, 6/01/20 – NPFG Insured | 6/15 at 100.00 | A– | | 2,795,238 | |
| | 2,500 | | Delaware River and Bay Authority, Delaware and New Jersey, Revenue Bonds, Series 2005, 5.000%, 1/01/27 – NPFG Insured | 1/15 at 100.00 | A1 | | 2,551,050 | |
| | 500 | | Delaware River Port Authority, New Jersey and Pennsylvania, Revenue Bonds, Series 2010E, 5.000%, 1/01/40 | 1/20 at 100.00 | A– | | 493,960 | |
| | 3,000 | | New Jersey Transit Corporation, Certificates of Participation, Federal Transit Administration Grants, Series 2002A, 5.500%, 9/15/14 – AMBAC Insured | No Opt. Call | Aa3 | | 3,299,310 | |
| | 1,875 | | New Jersey Transit Corporation, Certificates of Participation, Federal Transit Administration Grants, Series 2005A, 5.000%, 9/15/18 – FGIC Insured | 9/15 at 100.00 | A1 | | 1,970,288 | |
| | | | New Jersey Turnpike Authority, Revenue Bonds, Series 1991C: | | | | | |
| | 565 | | 6.500%, 1/01/16 – NPFG Insured | No Opt. Call | A+ | | 664,869 | |
| | 345 | | 6.500%, 1/01/16 – AMBAC Insured | No Opt. Call | A3 | | 405,982 | |
| | 5,750 | | New Jersey Turnpike Authority, Revenue Bonds, Series 2003A, 5.000%, 1/01/19 – FGIC Insured | 7/13 at 100.00 | A+ | | 6,092,641 | |
| | 2,500 | | New Jersey Turnpike Authority, Revenue Bonds, Series 2009I, 5.000%, 1/01/35 | 1/20 at 100.00 | A+ | | 2,482,675 | |
| | 240 | | Passaic County Improvement Authority, New Jersey, County Guaranteed Parking Revenue Bonds, 200 Hospital Plaza Project, Series 2010, 5.000%, 5/01/42 | 5/20 at 100.00 | Aa3 | | 236,280 | |
| | 2,750 | | Passaic County Improvement Authority, New Jersey, Revenue Bonds, Paterson Parking Deck Facility, Series 2005, 5.000%, 4/15/35 – AGM Insured | 4/15 at 100.00 | Aa3 | | 2,752,393 | |
| | | | Port Authority of New York and New Jersey, Consolidated Revenue Bonds, One Hundred Fortieth Series 2005: | | | | | |
| | 4,000 | | 5.000%, 12/01/28 – SYNCORA GTY Insured | 6/15 at 101.00 | Aa2 | | 4,118,440 | |
| | 3,000 | | 5.000%, 12/01/34 | No Opt. Call | Aa2 | | 3,022,560 | |
| | 585 | | Port Authority of New York and New Jersey, Consolidated Revenue Bonds, One Hundred Forty Eighth Series 2008, Trust 2920, 17.482%, 8/15/32 – AGM Insured (IF) | 8/17 at 100.00 | AA+ | | 608,096 | |
| | 1,000 | | Port Authority of New York and New Jersey, Consolidated Revenue Bonds, One Hundred Thirty-Fourth Series 2004, 5.000%, 7/15/34 | 1/14 at 101.00 | Aa2 | | 1,005,970 | |
| | 2,000 | | Port Authority of New York and New Jersey, Consolidated Revenue Bonds, One Hundred Twenty-Fifth Series 2002, 5.000%, 4/15/32 – AGM Insured | 4/12 at 101.00 | AA+ | | 2,014,440 | |
| | 8,000 | | Port Authority of New York and New Jersey, Special Project Bonds, JFK International Air Terminal LLC, Sixth Series 1997, 5.750%, 12/01/22 – NPFG Insured (Alternative Minimum Tax) | 6/11 at 100.00 | Baa1 | | 7,700,557 | |
| | 850 | | Trenton Parking Authority, Mercer County, New Jersey, Guaranteed Parking System Revenue Bonds, Series 2003, 5.000%, 10/01/24 – FGIC Insured | 10/13 at 100.00 | A3 | | 853,468 | |
| | 42,210 | | Total Transportation | | | | 43,068,217 | |
| | Principal Amount (000) | | Description (1) | Optional Call Provisions (2) | Ratings (3) | | Value | |
| | | | U.S. Guaranteed – 24.1% (16.3% of Total Investments) (5) | | | | | |
| $ | 2,075 | | Egg Harbor Township School District, Atlantic County, New Jersey, General Obligation Bonds, Series 2005, 5.000%, 4/01/27 (Pre-refunded 4/01/15) – NPFG Insured | 4/15 at 100.00 | Aa2 (5) | $ | 2,381,789 | |
| | 130 | | Essex County Improvement Authority, New Jersey, Lease Revenue Bonds, Series 2003, 5.125%, 12/15/19 (Pre-refunded 12/15/13) – AGM Insured | 12/13 at 100.00 | Aa2 (5) | | 145,009 | |
| | | | Manalapan-Englishtown Regional Board of Education, New Jersey, General Obligation Bonds, Series 2003: | | | | | |
| | 1,000 | | 5.000%, 10/01/27 (Pre-refunded 10/01/13) – NPFG Insured | 10/13 at 100.00 | BBB (5) | | 1,104,750 | |
| | 1,000 | | 5.000%, 10/01/27 (Pre-refunded 10/01/13) – NPFG Insured | 10/13 at 100.00 | AA– (5) | | 1,104,750 | |
| | 2,065 | | New Jersey Economic Development Authority, Revenue Bonds, Yeshiva Ktana of Passaic, Series 1993, 8.000%, 9/15/18 (ETM) | No Opt. Call | N/R (5) | | 2,541,891 | |
| | 595 | | New Jersey Educational Facilities Authority, Revenue Bonds, Kean University, Series 2005B, 5.000%, 7/01/30 (Pre-refunded 7/01/16) – NPFG Insured | 7/16 at 100.00 | A– (5) | | 697,447 | |
| | 1,145 | | New Jersey Educational Facilities Authority, Revenue Bonds, Montclair State University, Series 2004L, 5.125%, 7/01/19 (Pre-refunded 7/01/14) – NPFG Insured | 7/14 at 100.00 | A2 (5) | | 1,293,438 | |
| | 2,080 | | New Jersey Educational Facilities Authority, Revenue Bonds, Montclair State University, Series 2005F, 5.000%, 7/01/32 (Pre-refunded 7/01/15) – FGIC Insured | 7/15 at 100.00 | A1 (5) | | 2,393,810 | |
| | 400 | | New Jersey Educational Facilities Authority, Revenue Bonds, Rowan University, Series 2004C, 5.000%, 7/01/20 (Pre-refunded 7/01/14) – NPFG Insured | 7/14 at 100.00 | A+ (5) | | 451,372 | |
| | 3,950 | | New Jersey Environmental Infrastructure Trust, Environmental Infrastructure Bonds, Series 2001A, 4.750%, 9/01/20 (Pre-refunded 9/01/11) | 9/11 at 101.00 | AAA | | 4,048,711 | |
| | | | New Jersey Health Care Facilities Financing Authority, Revenue Bonds, Capital Health System Obligated Group, Series 2003A: | | | | | |
| | 750 | | 5.000%, 7/01/26 (Pre-refunded 7/01/13) | 7/13 at 100.00 | N/R (5) | | 811,845 | |
| | 1,670 | | 5.375%, 7/01/33 (Pre-refunded 7/01/13) | 7/13 at 100.00 | N/R (5) | | 1,821,102 | |
| | 3,000 | | New Jersey Health Care Facilities Financing Authority, Revenue Bonds, South Jersey Hospital System, Series 2002, 5.875%, 7/01/21 (Pre-refunded 7/01/12) | 7/12 at 100.00 | A2 (5) | | 3,191,340 | |
| | 1,270 | | New Jersey Health Care Facilities Financing Authority, Revenue Bonds, St. Clare’s Hospital, Series 2004A, 5.250%, 7/01/20 – RAAI Insured (ETM) | No Opt. Call | N/R (5) | | 1,480,972 | |
| | | | New Jersey Turnpike Authority, Revenue Bonds, Series 1991C: | | | | | |
| | 465 | | 6.500%, 1/01/16 (ETM) | No Opt. Call | AAA | | 564,710 | |
| | 195 | | 6.500%, 1/01/16 – NPFG Insured (ETM) | No Opt. Call | A+ (5) | | 238,584 | |
| | 120 | | 6.500%, 1/01/16 – AMBAC Insured (ETM) | No Opt. Call | A3 (5) | | 143,347 | |
| | 6,590 | | 6.500%, 1/01/16 (ETM) | No Opt. Call | AAA | | 7,386,927 | |
| | 1,760 | | 6.500%, 1/01/16 – AMBAC Insured (ETM) | No Opt. Call | A3 (5) | | 1,967,398 | |
| | 750 | | Newark Housing Authority, New Jersey, Port Authority Terminal Revenue Bonds, Series 2004, 5.250%, 1/01/21 (Pre-refunded 1/01/14) – NPFG Insured | 1/14 at 100.00 | AA– (5) | | 836,895 | |
| | 2,125 | | Puerto Rico Electric Power Authority, Power Revenue Bonds, Series 2005RR, 5.000%, 7/01/35 (Pre-refunded 7/01/15) – FGIC Insured | 7/15 at 100.00 | AAA | | 2,444,664 | |
| | | | Tobacco Settlement Financing Corporation, New Jersey, Tobacco Settlement Asset-Backed Bonds, Series 2003: | | | | | |
| | 1,290 | | 6.125%, 6/01/24 (Pre-refunded 6/01/12) | 6/12 at 100.00 | AAA | | 1,301,907 | |
| | 2,250 | | 6.375%, 6/01/32 (Pre-refunded 6/01/13) | 6/13 at 100.00 | AAA | | 2,473,133 | |
| | 350 | | Trenton Parking Authority, Mercer County, New Jersey, Guaranteed Parking System Revenue Bonds, Series 2003, 5.000%, 10/01/24 (Pre-refunded 10/01/13) – FGIC Insured | 10/13 at 100.00 | A3 (5) | | 386,663 | |
| | 37,025 | | Total U.S. Guaranteed | | | | 41,212,454 | |
| | | | Water and Sewer – 7.1% (4.8% of Total Investments) | | | | | |
| | | | Bayonne Municipal Utilities Authority, New Jersey, Water System Revenue Refunding Bonds, Series 2003A: | | | | | |
| | 1,450 | | 5.000%, 4/01/19 – SYNCORA GTY Insured | 4/13 at 100.00 | N/R | | 1,439,937 | |
| | 1,250 | | 5.000%, 4/01/24 – SYNCORA GTY Insured | 4/13 at 100.00 | N/R | | 1,145,813 | |
| | 765 | | Jersey City Sewer Authority, Hudson County, New Jersey, Sewer Revenue Refunding Bonds, Series 1993, 6.250%, 1/01/14 – AMBAC Insured | No Opt. Call | N/R | | 815,903 | |
| | | Nuveen New Jersey Premium Income Municipal Fund, Inc. (continued) |
| NNJ | | Portfolio of Investments |
April 30, 2011
| | Principal Amount (000) | | Description (1) | Optional Call Provisions (2) | Ratings (3) | | Value | |
| | | | Water and Sewer (continued) | | | | | |
| $ | 1,250 | | New Jersey Economic Development Authority, Water Facilities Revenue Bonds, New Jersey-American Water Company Inc. Project, Refunding Series 2010B, 5.600%, 11/01/34 (Alternative Minimum Tax) | 5/20 at 100.00 | A | $ | 1,238,713 | |
| | 420 | | New Jersey Economic Development Authority, Water Facilities Revenue Bonds, New Jersey-American Water Company Inc. Project, Refunding Series 2010D, 4.875%, 11/01/29 (Alternative Minimum Tax) | 11/20 at 100.00 | A | | 398,639 | |
| | 1,650 | | New Jersey Water Supply Authority, Water Supply Authority Bonds, Manasquan Reservoir, Series 2005, 5.000%, 8/01/31 – NPFG Insured | 8/15 at 100.00 | AA | | 1,686,317 | |
| | 3,500 | | North Hudson Sewerage Authority, New Jersey, Sewerage Revenue Refunding Bonds, Series 2002A, 5.250%, 8/01/19 – FGIC Insured | 8/12 at 100.00 | N/R | | 3,572,940 | |
| | 430 | | Stony Brook Regional Sewer Authority, Princeton, New Jersey, Revenue Refunding Bonds, Series 1993B, 5.450%, 12/01/12 | No Opt. Call | Aa1 | | 447,987 | |
| | 1,355 | | Wanaque Valley Regional Sewer Authority, Passaic County, New Jersey, Sewer Revenue Refunding Bonds, Series 1993B, 5.750%, 9/01/18 – AMBAC Insured | No Opt. Call | A1 | | 1,479,945 | |
| | 12,070 | | Total Water and Sewer | | | | 12,226,194 | |
| $ | 280,690 | | Total Investments (cost $256,390,870) – 148.1% | | | | 253,504,215 | |
| | | | Variable Rate Demand Preferred Shares, at Liquidation Value – (51.8)% (6) | | | | (88,600,000 | ) |
| | | | Other Assets Less Liabilities – 3.7% | | | | 6,308,081 | |
| | | | Net Assets Applicable to Common Shares – 100% | | | $ | 171,212,296 | |
| (1) | | All percentages shown in the Portfolio of Investments are based on net assets applicable to Common shares unless otherwise noted. |
| (2) | | Optional Call Provisions (not covered by the report of independent registered public accounting firm): Dates (month and year) and prices of the earliest optional call or redemption. There may be other call provisions at varying prices at later dates. Certain mortgage-backed securities may be subject to periodic principal paydowns. |
| (3) | | Ratings (not covered by the report of independent registered public accounting firm): Using the highest of Standard & Poor’s Group (“Standard & Poor’s”), Moody’s Investor Service, Inc. (“Moody’s”) or Fitch, Inc. (“Fitch”) rating. Ratings below BBB by Standard & Poor’s, Baa by Moody’s or BBB by Fitch are considered to be below investment grade. Holdings designated N/R are not rated by any of these national rating agencies. |
| (4) | | Investment, or portion of investment, has been pledged to collateralize the net payment obligations for investments in inverse floating rate transactions. |
| (5) | | Backed by an escrow or trust containing sufficient U.S. Government or U.S. Government agency securities, which ensure the timely payment of principal and interest. Such investments are normally considered to be equivalent to AAA rated securities. |
| (6) | | Variable Rate Demand Preferred Shares, at Liquidation Value as a percentage of Total Investments is 35.0%. |
| N/R | | Not rated. |
| (ETM) | | Escrowed to maturity. |
| (IF) | | Inverse floating rate investment. |
See accompanying notes to financial statements.
| | | Nuveen New Jersey Dividend Advantage Municipal Fund |
| NXJ | | Portfolio of Investments |
April 30, 2011
| | Principal Amount (000) | | Description (1) | Optional Call Provisions (2) | Ratings (3) | | Value | |
| | | | Consumer Discretionary – 0.3% (0.2% of Total Investments) | | | | | |
| | | | Middlesex County Improvement Authority, New Jersey, Senior Revenue Bonds, Heldrich Center Hotel/Conference Center Project, Series 2005A: | | | | | |
| $ | 260 | | 5.000%, 1/01/32 | 1/15 at 100.00 | B3 | $ | 149,469 | |
| | 230 | | 5.125%, 1/01/37 | 1/15 at 100.00 | B3 | | 132,257 | |
| | 490 | | Total Consumer Discretionary | | | | 281,726 | |
| | | | Consumer Staples – 4.9% (3.3% of Total Investments) | | | | | |
| | | | Tobacco Settlement Financing Corporation, New Jersey, Tobacco Settlement Asset-Backed Bonds, Series 2007-1A: | | | | | |
| | 800 | | 4.500%, 6/01/23 | 6/17 at 100.00 | BBB | | 676,352 | |
| | 2,895 | | 4.750%, 6/01/34 | 6/17 at 100.00 | Baa3 | | 1,798,345 | |
| | 3,000 | | 5.000%, 6/01/41 | 6/17 at 100.00 | Baa3 | | 1,872,000 | |
| | 6,695 | | Total Consumer Staples | | | | 4,346,697 | |
| | | | Education and Civic Organizations – 16.3% (11.1% of Total Investments) | | | | | |
| | 250 | | New Jersey Educational Facilities Authority, Revenue Bonds, Fairleigh Dickinson University, Series 2004C, 5.500%, 7/01/23 | 7/14 at 100.00 | N/R | | 250,988 | |
| | 325 | | New Jersey Educational Facilities Authority, Revenue Bonds, Georgian Court University, Series 2007D, 5.250%, 7/01/37 | 7/17 at 100.00 | BBB+ | | 293,189 | |
| | | | New Jersey Educational Facilities Authority, Revenue Bonds, Kean University, Series 2007D: | | | | | |
| | 1,115 | | 5.000%, 7/01/32 – FGIC Insured | 7/17 at 100.00 | A2 | | 1,093,514 | |
| | 735 | | 5.000%, 7/01/39 – FGIC Insured | 7/17 at 100.00 | A2 | | 692,635 | |
| | 60 | | New Jersey Educational Facilities Authority, Revenue Bonds, Montclair State University, Series 2004L, 5.125%, 7/01/21 – NPFG Insured | 7/14 at 100.00 | A1 | | 62,379 | |
| | 970 | | New Jersey Educational Facilities Authority, Revenue Bonds, Montclair State University, Series 2006A, 5.000%, 7/01/36 – AMBAC Insured | 7/16 at 100.00 | A1 | | 921,985 | |
| | 1,000 | | New Jersey Educational Facilities Authority, Revenue Bonds, New Jersey Institute of Technology, Series 2004B, 5.000%, 7/01/21 – AMBAC Insured | 1/14 at 100.00 | A+ | | 1,022,120 | |
| | 630 | | New Jersey Educational Facilities Authority, Revenue Bonds, William Paterson University, Series 2004A, 5.125%, 7/01/19 – FGIC Insured | 7/14 at 100.00 | A1 | | 650,507 | |
| | 300 | | New Jersey Educational Facilities Authority, Revenue Refunding Bonds, Rider University, Series 2002A, 5.000%, 7/01/17 – RAAI Insured | 7/12 at 100.00 | BBB+ | | 305,148 | |
| | 200 | | New Jersey Educational Facilities Authority, Revenue Refunding Bonds, Seton Hall University Project, Series 2001A, 5.250%, 7/01/16 – AMBAC Insured | 7/11 at 100.00 | A | | 201,312 | |
| | | | New Jersey Educational Facilities Authority, Revenue Refunding Bonds, Seton Hall University Project, Series 2001G: | | | | | |
| | 3,820 | | 4.875%, 7/01/21 – AMBAC Insured | 7/11 at 100.00 | A | | 3,825,194 | |
| | 1,600 | | 5.000%, 7/01/26 – AMBAC Insured | 7/11 at 100.00 | A | | 1,600,224 | |
| | 135 | | New Jersey Higher Education Assistance Authority, Student Loan Revenue Bonds Series 2010-2, 5.000%, 12/01/30 | 12/20 at 100.00 | Aa3 | | 130,174 | |
| | 270 | | New Jersey Higher Education Assistance Authority, Student Loan Revenue Bonds, Series 2010-1A, 5.000%, 12/01/25 | 12/19 at 100.00 | AA | | 263,569 | |
| | 300 | | New Jersey Higher Education Assistance Authority, Student Loan Revenue Bonds, Tender Option Bond Trust PA-4643, 19.550%, 6/01/30 (IF) (4) | 6/19 at 100.00 | AA | | 335,256 | |
| | | | Puerto Rico Industrial, Tourist, Educational, Medical and Environmental Control Facilities Financing Authority, Higher Education Revenue Bonds, University of the Sacred Heart, Series 2001: | | | | | |
| | 2,000 | | 5.250%, 9/01/21 | 9/11 at 100.00 | BBB | | 2,000,240 | |
| | 500 | | 5.250%, 9/01/31 | 9/11 at 100.00 | BBB | | 457,885 | |
| | 500 | | Puerto Rico Industrial, Tourist, Educational, Medical and Environmental Control Facilities Financing Authority, Higher Education Revenue Refunding Bonds, Ana G. Mendez University System, Series 2002, 5.500%, 12/01/31 | 12/12 at 101.00 | BBB– | | 429,985 | |
| | 14,710 | | Total Education and Civic Organizations | | | | 14,536,304 | |
| | | Nuveen New Jersey Dividend Advantage Municipal Fund (continued) |
| NXJ | | Portfolio of Investments |
April 30, 2011
| | Principal Amount (000) | | Description (1) | Optional Call Provisions (2) | Ratings (3) | | Value | |
| | | | Energy – 1.1% (0.7% of Total Investments) | | | | | |
| $ | 1,000 | | Virgin Islands, Senior Secured Revenue Bonds, Government Refinery | 1/13 at 100.00 | Baa3 | $ | 970,910 | |
| | | | Facilities – Hovensa LLC Coker, Series 2002, 6.500%, 7/01/21 (Alternative Minimum Tax) | | | | | |
| | | | Financials – 1.9% (1.3% of Total Investments) | | | | | |
| | 850 | | New Jersey Economic Development Authority, Economic Development Revenue Bonds, Glimcher Properties LP, Series 1998, 6.000%, 11/01/28 (Alternative Minimum Tax) | 5/11 at 100.00 | N/R | | 710,617 | |
| | 250 | | New Jersey Economic Development Authority, Industrial Development Revenue Refunding Bonds, Newark Airport Marriott Hotel, Series 1996, 7.000%, 10/01/14 | 10/11 at 100.00 | Ba1 | | 250,928 | |
| | 750 | | New Jersey Economic Development Authority, Revenue Refunding Bonds, Kapkowski Road Landfill Project, Series 2002, 5.750%, 10/01/21 | No Opt. Call | Ba2 | | 717,953 | |
| | 1,850 | | Total Financials | | | | 1,679,498 | |
| | | | Health Care – 18.7% (12.8% of Total Investments) | | | | | |
| | 310 | | Camden County Improvement Authority, New Jersey, Revenue Bonds, Cooper Health System, Series 2004A, 5.750%, 2/15/34 | 8/14 at 100.00 | BBB | | 273,498 | |
| | 560 | | New Jersey Health Care Facilities Finance Authority, Revenue Bonds, AHS Hospital Corporation, Series 2008A, 5.000%, 7/01/27 | 7/18 at 100.00 | A1 | | 549,013 | |
| | 370 | | New Jersey Health Care Facilities Financing Authority, Hospital Revenue Bonds, Virtua Health, Tender Option Bond Trust 3018, 19.492%, 7/01/38 – AGC Insured (IF) | 7/19 at 100.00 | AA+ | | 380,034 | |
| | 865 | | New Jersey Health Care Facilities Financing Authority, Revenue Bonds, Atlanticare Regional Medical Center, Series 2007, 5.000%, 7/01/37 | 7/17 at 100.00 | A+ | | 813,290 | |
| | 1,500 | | New Jersey Health Care Facilities Financing Authority, Revenue Bonds, CentraState Medical Center, Series 2006A, 5.000%, 7/01/30 – AGC Insured | 7/17 at 100.00 | Aa3 | | 1,466,430 | |
| | 130 | | New Jersey Health Care Facilities Financing Authority, Revenue Bonds, Children’s Specialized Hospital, Series 2005A, 5.500%, 7/01/36 | 7/15 at 100.00 | Baa3 | | 115,895 | |
| | 400 | | New Jersey Health Care Facilities Financing Authority, Revenue Bonds, Hunterdon Medical Center, Series 2006B, 5.000%, 7/01/36 | 7/16 at 100.00 | A– | | 353,544 | |
| | 180 | | New Jersey Health Care Facilities Financing Authority, Revenue Bonds, Hunterdon Medical Center, Series 2006, 5.125%, 7/01/35 | 7/16 at 100.00 | A– | | 162,781 | |
| | 3,500 | | New Jersey Health Care Facilities Financing Authority, Revenue Bonds, Kennedy Health System Obligated Group, Series 2001, 5.625%, 7/01/31 | 7/11 at 100.00 | A2 | | 3,308,235 | |
| | 445 | | New Jersey Health Care Facilities Financing Authority, Revenue Bonds, Saint Barnabas Health Care System, Series 2006A, 5.000%, 7/01/29 | 1/17 at 100.00 | BBB– | | 356,570 | |
| | 700 | | New Jersey Health Care Facilities Financing Authority, Revenue Bonds, Saint Joseph’s Healthcare System Obligated Group Issue, Series 2008, 6.625%, 7/01/38 | 7/18 at 100.00 | BBB– | | 686,525 | |
| | 895 | | New Jersey Health Care Facilities Financing Authority, Revenue Bonds, Shore Memorial Health System, Series 2003, 5.000%, 7/01/23 – RAAI Insured | 7/13 at 100.00 | N/R | | 846,858 | |
| | 2,000 | | New Jersey Health Care Facilities Financing Authority, Revenue Bonds, Somerset Medical Center, Series 2003, 5.500%, 7/01/33 | 7/13 at 100.00 | Ba2 | | 1,487,840 | |
| | | | New Jersey Health Care Facilities Financing Authority, Revenue Bonds, South Jersey Hospital System, Series 2006: | | | | | |
| | 665 | | 5.000%, 7/01/36 | 7/16 at 100.00 | A2 | | 607,265 | |
| | 615 | | 5.000%, 7/01/46 | 7/16 at 100.00 | A2 | | 543,894 | |
| | 1,100 | | New Jersey Health Care Facilities Financing Authority, Revenue Bonds, St. Peter’s University Hospital, Series 2000A, 6.875%, 7/01/20 | 7/11 at 100.00 | BBB– | | 1,100,660 | |
| | 2,500 | | New Jersey Health Care Facilities Financing Authority, Revenue Refunding Bonds, Burdette Tomlin Memorial Hospital, Series 1999, 5.500%, 7/01/29 | 7/11 at 100.00 | A2 | | 2,499,925 | |
| | 1,275 | | New Jersey Health Facilities Financing Authority, Revenue Bonds, Meridian Health, Series 2007-I, 5.000%, 7/01/38 – AGC Insured | 7/18 at 100.00 | AA+ | | 1,203,524 | |
| | 18,010 | | Total Health Care | | | | 16,755,781 | |
| | Principal Amount (000) | | Description (1) | Optional Call Provisions (2) | Ratings (3) | | Value | |
| | | | Housing/Multifamily – 0.9% (0.6% of Total Investments) | | | | | |
| | | | New Jersey Economic Development Authority, Student Housing Revenue Bonds, Provident Group-Montclair Properties LLC, Montclair State University Student Housing Project, Series 2010A: | | | | | |
| $ | 560 | | 5.750%, 6/01/31 | 6/20 at 100.00 | Baa3 | $ | 521,522 | |
| | 300 | | 5.875%, 6/01/42 | 6/20 at 100.00 | Baa3 | | 269,592 | |
| | 860 | | Total Housing/Multifamily | | | | 791,114 | |
| | | | Long-Term Care – 2.7% (1.9% of Total Investments) | | | | | |
| | 585 | | Burlington County Bridge Commission, New Jersey, Economic Development Revenue Bonds, The Evergreens Project, Series 2007, 5.625%, 1/01/38 | 1/18 at 100.00 | N/R | | 467,374 | |
| | 250 | | New Jersey Economic Development Authority, First Mortgage Revenue Bonds, Winchester Gardens at Wards Homestead, Series 2004A, 5.800%, 11/01/31 | 11/14 at 100.00 | N/R | | 239,600 | |
| | | | New Jersey Economic Development Authority, Revenue Bonds, Masonic Charity Foundation of New Jersey, Series 2001: | | | | | |
| | 1,000 | | 6.000%, 6/01/25 | 6/11 at 102.00 | A– | | 1,014,400 | |
| | 335 | | 5.500%, 6/01/31 | 6/11 at 102.00 | A– | | 329,781 | |
| | 500 | | New Jersey Economic Development Authority, Revenue Bonds, United Methodist Homes of New Jersey Obligated Group, Series 1998, 5.125%, 7/01/25 | 7/11 at 100.00 | BB+ | | 412,610 | |
| | 2,670 | | Total Long-Term Care | | | | 2,463,765 | |
| | | | Tax Obligation/General – 3.0% (2.1% of Total Investments) | | | | | |
| | 1,000 | | Jersey City, New Jersey, General Obligation Bonds, Series 2006A, 5.000%, 9/01/22 – AMBAC Insured | 9/16 at 100.00 | A2 | | 1,041,730 | |
| | 300 | | Middletown Township Board of Education, Monmouth County, New Jersey, Refunding Series 2010, 5.000%, 8/01/27 | 8/20 at 100.00 | AA | | 320,247 | |
| | 1,350 | | Puerto Rico, General Obligation and Public Improvement Bonds, Series 2001, 5.250%, 7/01/27 – AGM Insured | 7/11 at 100.00 | AA+ | | 1,349,892 | |
| | 2,650 | | Total Tax Obligation/General | | | | 2,711,869 | |
| | | | Tax Obligation/Limited – 32.7% (22.3% of Total Investments) | | | | | |
| | 600 | | Bergen County Improvement Authority, New Jersey, Guaranteed Lease Revenue Bonds, County Administration Complex Project, Series 2005, 5.000%, 11/15/26 | No Opt. Call | Aaa | | 688,878 | |
| | 1,745 | | Burlington County Bridge Commission, New Jersey, Guaranteed Pooled Loan Bonds, Series 2003, 5.000%, 12/01/18 – NPFG Insured | 12/13 at 100.00 | AA | | 1,890,132 | |
| | 1,000 | | Camden County Improvement Authority, New Jersey, County Guaranteed Lease Revenue Bonds, Series 2005A, 5.000%, 9/01/16 – AGM Insured | 9/15 at 100.00 | AA+ | | 1,120,740 | |
| | 1,100 | | Casino Reinvestment Development Authority, New Jersey, Hotel Room Fee Revenue Bonds, Series 2004, 5.250%, 1/01/16 – AMBAC Insured | 1/15 at 102.00 | A– | | 1,171,753 | |
| | 620 | | Essex County Improvement Authority, New Jersey, Project Consolidation Revenue Bonds, Series 2007, 5.250%, 12/15/22 – AMBAC Insured | No Opt. Call | Aa2 | | 697,252 | |
| | 815 | | Garden State Preservation Trust, New Jersey, Open Space and Farmland Preservation Bonds, Series 2005C, 5.125%, 11/01/18 – AGM Insured | No Opt. Call | AAA | | 953,770 | |
| | 1,785 | | New Jersey Building Authority, State Building Revenue Bonds, Series 2007A, 5.000%, 6/15/27 | 6/16 at 100.00 | A+ | | 1,797,727 | |
| | | | New Jersey Economic Development Authority, Cigarette Tax Revenue Bonds, Series 2004: | | | | | |
| | 615 | | 5.500%, 6/15/24 | 6/12 at 100.00 | BBB | | 574,047 | |
| | 600 | | 5.750%, 6/15/29 | 6/14 at 100.00 | BBB | | 547,668 | |
| | 1,200 | | 5.750%, 6/15/34 | 6/14 at 100.00 | BBB | | 1,068,084 | |
| | 1,200 | | New Jersey Economic Development Authority, Revenue Bonds, Motor Vehicle Surcharge, Series 2004A, 5.250%, 7/01/15 – NPFG Insured | 7/14 at 100.00 | A | | 1,303,632 | |
| | | | New Jersey Economic Development Authority, Revenue Bonds, Newark Downtown District Management Corporation Project, Series 2007: | | | | | |
| | 65 | | 5.125%, 6/15/27 | 6/17 at 100.00 | Baa3 | | 58,179 | |
| | 115 | | 5.125%, 6/15/37 | 6/17 at 100.00 | Baa3 | | 94,247 | |
| | | Nuveen New Jersey Dividend Advantage Municipal Fund (continued) |
| NXJ | | Portfolio of Investments April 30, 2011 |
| | Principal Amount (000) | | Description (1) | Optional Call Provisions (2) | Ratings (3) | | Value | |
| | | | Tax Obligation/Limited (continued) | | | | | |
| | | | New Jersey Economic Development Authority, School Facilities Construction Financing Program Bonds, Series 2007U: | | | | | |
| $ | 615 | | 5.000%, 9/01/37 – AMBAC Insured | 9/17 at 100.00 | A+ | $ | 580,597 | |
| | 1,235 | | 5.000%, 9/01/37 | 9/17 at 100.00 | A+ | | 1,165,914 | |
| | 525 | | New Jersey Educational Facilities Authority, Revenue Bonds, Higher Education Capital Improvement Fund, Refunding Series 2005A, 5.000%, 9/01/15 – AGM Insured | No Opt. Call | AA+ | | 574,854 | |
| | | | New Jersey Health Care Facilities Financing Authority, Lease Revenue Bonds, Department of Human Services – Greystone Park Psychiatric Hospital, Series 2005: | | | | | |
| | 925 | | 5.000%, 9/15/18 – AMBAC Insured | 9/15 at 100.00 | A+ | | 976,060 | |
| | 1,400 | | 5.000%, 9/15/24 – AMBAC Insured | 9/15 at 100.00 | A+ | | 1,410,864 | |
| | 250 | | New Jersey Health Care Facilities Financing Authority, State Contract Bonds, Hospital Asset Transformation Program, Series 2008A, 5.250%, 10/01/38 | 10/18 at 100.00 | A+ | | 239,825 | |
| | | | New Jersey Transportation Trust Fund Authority, Federal Highway Aid Grant Anticipation Bonds, Series 2006: | | | | | |
| | 350 | | 5.000%, 6/15/17 – FGIC Insured | 6/16 at 100.00 | Aa3 | | 377,895 | |
| | 610 | | 5.000%, 6/15/18 – FGIC Insured | 6/16 at 100.00 | Aa3 | | 650,876 | |
| | 6,000 | | New Jersey Transportation Trust Fund Authority, Transportation System Bonds, Capital Appreciation Series 2010A, 0.000%, 12/15/30 | No Opt. Call | AA– | | 1,719,360 | |
| | 1,300 | | New Jersey Transportation Trust Fund Authority, Transportation System Bonds, Refunding Series 2006A, 5.500%, 12/15/22 | No Opt. Call | A+ | | 1,423,292 | |
| | 1,300 | | New Jersey Transportation Trust Fund Authority, Transportation System Bonds, Series 2004B, 5.500%, 12/15/16 – NPFG Insured | No Opt. Call | A+ | | 1,461,291 | |
| | 1,280 | | New Jersey Transportation Trust Fund Authority, Transportation System Bonds, Series 2005D, 5.000%, 6/15/19 – AGM Insured | 6/15 at 100.00 | AA+ | | 1,351,782 | |
| | | | New Jersey Transportation Trust Fund Authority, Transportation System Bonds, Series 2006C: | | | | | |
| | 3,000 | | 0.000%, 12/15/32 – AGM Insured | No Opt. Call | AA+ | | 699,900 | |
| | 3,500 | | 0.000%, 12/15/33 – AGM Insured | No Opt. Call | AA+ | | 757,085 | |
| | 6,000 | | 0.000%, 12/15/34 – AGM Insured | No Opt. Call | AA+ | | 1,201,920 | |
| | 1,000 | | New Jersey Transportation Trust Fund Authority, Transportation System Bonds, Series 2007A, 5.000%, 12/15/26 – AMBAC Insured | 12/17 at 100.00 | A+ | | 1,007,230 | |
| | 800 | | New Jersey Transportation Trust Fund Authority, Transportation System Bonds, Series 2010D, 5.000%, 12/15/24 | No Opt. Call | A+ | | 816,064 | |
| | 405 | | Puerto Rico Convention Center District Authority, Hotel Occupancy Tax Revenue Bonds, Series 2006A, 4.500%, 7/01/36 – CIFG Insured | 7/16 at 100.00 | A3 | | 320,833 | |
| | 550 | | Virgin Islands Public Finance Authority, Matching Fund Loan Notes Revenue Bonds, Subordinate Lien Series 2010B, 5.250%, 10/01/29 | 10/20 at 100.00 | Baa2 | | 517,787 | |
| | 42,505 | | Total Tax Obligation/Limited | | | | 29,219,538 | |
| | | | Transportation – 24.0% (16.4% of Total Investments) | | | | | |
| | | | Delaware River and Bay Authority, Delaware and New Jersey, Revenue Bonds, Series 2005: | | | | | |
| | 1,000 | | 5.000%, 1/01/25 – NPFG Insured | 1/15 at 100.00 | A1 | | 1,024,850 | |
| | 1,000 | | 5.000%, 1/01/26 – NPFG Insured | 1/15 at 100.00 | A1 | | 1,020,760 | |
| | 500 | | 5.000%, 1/01/27 – NPFG Insured | 1/15 at 100.00 | A1 | | 510,210 | |
| | 500 | | Delaware River Port Authority, New Jersey and Pennsylvania, Revenue Bonds, Series 2010E, 5.000%, 1/01/40 | 1/20 at 100.00 | A– | | 493,960 | |
| | 900 | | New Jersey Economic Development Authority, Special Facilities Revenue Bonds, Continental Airlines Inc., Series 2000, 7.000%, 11/15/30 (Alternative Minimum Tax) | 5/11 at 101.00 | B | | 881,694 | |
| | 1,000 | | New Jersey Transit Corporation, Certificates of Participation, Federal Transit Administration Grants, Series 2002A, 5.500%, 9/15/14 – AMBAC Insured | No Opt. Call | Aa3 | | 1,099,770 | |
| | 1,000 | | New Jersey Transit Corporation, Certificates of Participation, Federal Transit Administration Grants, Series 2005A, 5.000%, 9/15/18 – FGIC Insured | 9/15 at 100.00 | A1 | | 1,050,820 | |
| | 50 | | New Jersey Turnpike Authority, Revenue Bonds, Series 1991C, 6.500%, 1/01/16 – NPFG Insured | No Opt. Call | A+ | | 58,838 | |
| | 3,000 | | New Jersey Turnpike Authority, Revenue Bonds, Series 2003A, 5.000%, 1/01/19 – FGIC Insured | 7/13 at 100.00 | A+ | | 3,178,770 | |
| | | | | | | | | |
| | Principal Amount (000) | | Description (1) | Optional Call Provisions (2) | Ratings (3) | | Value | |
| | | | Transportation (continued) | | | | | |
| $ | 300 | | New Jersey Turnpike Authority, Revenue Bonds, Series 2005A, 5.250%, 1/01/29 – AGM Insured | No Opt. Call | AA+ | $ | 328,941 | |
| | 1,000 | | New Jersey Turnpike Authority, Revenue Bonds, Series 2009I, 5.000%, 1/01/35 | 1/20 at 100.00 | A+ | | 993,070 | |
| | 240 | | Passaic County Improvement Authority, New Jersey, County Guaranteed Parking Revenue Bonds, 200 Hospital Plaza Project, Series 2010, 5.000%, 5/01/42 | 5/20 at 100.00 | Aa3 | | 236,280 | |
| | 1,500 | | Port Authority of New York and New Jersey, Consolidated Revenue Bonds, One Hundred Fortieth Series 2005, 5.000%, 12/01/34 | No Opt. Call | Aa2 | | 1,511,280 | |
| | 310 | | Port Authority of New York and New Jersey, Consolidated Revenue Bonds, One Hundred Forty Eighth Series 2008, Trust 2920, 17.482%, 8/15/32 – AGM Insured (IF) | 8/17 at 100.00 | AA+ | | 322,239 | |
| | 500 | | Port Authority of New York and New Jersey, Consolidated Revenue Bonds, One Hundred Thirty-Fourth Series 2004, 5.000%, 7/15/34 | 1/14 at 101.00 | Aa2 | | 502,985 | |
| | 5,000 | | Port Authority of New York and New Jersey, Special Project Bonds, JFK International Air Terminal LLC, Sixth Series 1997, 5.750%, 12/01/22 – NPFG Insured (Alternative Minimum Tax) | 6/11 at 100.00 | Baa1 | | 4,812,849 | |
| | 3,435 | | South Jersey Transportation Authority New Jersey, Transportation System Revenue Bonds, Series 1999, 5.125%, 11/01/22 – AMBAC Insured | 11/11 at 100.00 | A– | | 3,450,973 | |
| | 21,235 | | Total Transportation | | | | 21,478,289 | |
| | | | U.S. Guaranteed – 17.4% (11.9% of Total Investments) (5) | | | | | |
| | 385 | | New Jersey Educational Facilities Authority, Revenue Bonds, Kean University, Series 2005B, 5.000%, 7/01/30 (Pre-refunded 7/01/16) – NPFG Insured | 7/16 at 100.00 | A– (5) | | 451,289 | |
| | 690 | | New Jersey Educational Facilities Authority, Revenue Bonds, Montclair State University, Series 2004L, 5.125%, 7/01/21 (Pre-refunded 7/01/14) – NPFG Insured | 7/14 at 100.00 | A2 (5) | | 779,452 | |
| | | | New Jersey Educational Facilities Authority, Revenue Bonds, Montclair State University, Series 2005F: | | | | | |
| | 700 | | 5.000%, 7/01/17 (Pre-refunded 7/01/15) – FGIC Insured | 7/15 at 100.00 | A1 (5) | | 805,609 | |
| | 1,000 | | 5.000%, 7/01/24 (Pre-refunded 7/01/15) – FGIC Insured | 7/15 at 100.00 | A1 (5) | | 1,150,870 | |
| | 520 | | 5.000%, 7/01/32 (Pre-refunded 7/01/15) – FGIC Insured | 7/15 at 100.00 | A1 (5) | | 598,452 | |
| | 1,000 | | New Jersey Educational Facilities Authority, Revenue Bonds, New Jersey Institute of Technology, Series 2001G, 5.250%, 7/01/18 (Pre-refunded 7/01/11) – NPFG Insured | 7/11 at 100.00 | A+ (5) | | 1,008,540 | |
| | 1,085 | | New Jersey Educational Facilities Authority, Revenue Bonds, Rowan College, Series 2001C, 5.000%, 7/01/31 (Pre-refunded 7/01/11) – FGIC Insured | 7/11 at 101.00 | A+ (5) | | 1,082,190 | |
| | 625 | | New Jersey Educational Facilities Authority, Revenue Bonds, Rowan University, Series 2004C, 5.000%, 7/01/24 (Pre-refunded 7/01/14) – NPFG Insured | 7/14 at 100.00 | A+ (5) | | 705,269 | |
| | 890 | | New Jersey Health Care Facilities Financing Authority, Revenue Bonds, Capital Health System Obligated Group, Series 2003A, 5.375%, 7/01/33 (Pre-refunded 7/01/13) | 7/13 at 100.00 | N/R (5) | | 970,527 | |
| | 1,350 | | New Jersey Health Care Facilities Financing Authority, Revenue Bonds, South Jersey Hospital System, Series 2002, 5.875%, 7/01/21 (Pre-refunded 7/01/12) | 7/12 at 100.00 | A2 (5) | | 1,436,103 | |
| | 845 | | New Jersey Health Care Facilities Financing Authority, Revenue Bonds, St. Clare’s Hospital, Series 2004A, 5.250%, 7/01/20 – RAAI Insured (ETM) | No Opt. Call | N/R (5) | | 985,371 | |
| | | | New Jersey Turnpike Authority, Revenue Bonds, Series 1991C: | | | | | |
| | 130 | | 6.500%, 1/01/16 (ETM) | No Opt. Call | AAA | | 157,876 | |
| | 20 | | 6.500%, 1/01/16 – NPFG Insured (ETM) | No Opt. Call | A+ (5) | | 24,470 | |
| | 905 | | 6.500%, 1/01/16 (ETM) | No Opt. Call | AAA | | 1,014,442 | |
| | 375 | | Newark Housing Authority, New Jersey, Port Authority Terminal Revenue Bonds, Series 2004, 5.250%, 1/01/21 (Pre-refunded 1/01/14) – NPFG Insured | 1/14 at 100.00 | AA– (5) | | 418,448 | |
| | 1,900 | | Puerto Rico, General Obligation and Public Improvement Bonds, Series 2001, 5.250%, 7/01/27 (Pre-refunded 7/01/11) – AGM Insured | 7/11 at 100.00 | AAA | | 1,916,416 | |
| | | | Tobacco Settlement Financing Corporation, New Jersey, Tobacco Settlement Asset-Backed Bonds, Series 2003: | | | | | |
| | 825 | | 6.125%, 6/01/24 (Pre-refunded 6/01/12) | 6/12 at 100.00 | AAA | | 832,615 | |
| | 1,125 | | 6.375%, 6/01/32 (Pre-refunded 6/01/13) | 6/13 at 100.00 | AAA | | 1,236,566 | |
| | 14,370 | | Total U.S. Guaranteed | | | | 15,574,505 | |
| | | Nuveen New Jersey Dividend Advantage Municipal Fund (continued) |
| NXJ | | Portfolio of Investments |
April 30, 2011
| | Principal Amount (000) | | Description (1) | Optional Call Provisions (2) | Ratings (3) | | Value | |
| | | | Utilities – 0.9% (0.6% of Total Investments) | | | | | |
| $ | 750 | | New Jersey Economic Development Authority, Pollution Control Revenue Refunding Bonds, Public Service Electric and Gas Company, Series 2001A, 5.000%, 3/01/12 | No Opt. Call | Baa1 | $ | 770,063 | |
| | | | Water and Sewer – 21.8% (14.8% of Total Investments) | | | | | |
| | 225 | | Guam Government Waterworks Authority, Water and Wastewater System Revenue Bonds, Series 2005, 6.000%, 7/01/25 | 7/15 at 100.00 | Ba2 | | 214,061 | |
| | 4,635 | | New Jersey Economic Development Authority, Water Facilities Revenue Bonds, American Water Company, Series 1997B, 5.375%, 5/01/32 – FGIC Insured (Alternative Minimum Tax) | 11/11 at 100.00 | A | | 4,430,039 | |
| | 7,000 | | New Jersey Economic Development Authority, Water Facilities Revenue Bonds, Middlesex Water Company, Series 1998, 5.350%, 2/01/38 – NPFG Insured (Alternative Minimum Tax) | 8/11 at 100.00 | A | | 6,302,589 | |
| | 250 | | New Jersey Economic Development Authority, Water Facilities Revenue Bonds, New Jersey-American Water Company Inc. Project, Refunding Series 2010B, 5.600%, 11/01/34 (Alternative Minimum Tax) | 5/20 at 100.00 | A | | 247,743 | |
| | 320 | | New Jersey Economic Development Authority, Water Facilities Revenue Bonds, New Jersey-American Water Company Inc. Project, Refunding Series 2010D, 4.875%, 11/01/29 (Alternative Minimum Tax) | 11/20 at 100.00 | A | | 303,725 | |
| | 15,840 | | North Hudson Sewerage Authority, New Jersey, Sewerage Revenue Refunding Bonds, Series 2001A, 0.000%, 8/01/23 – NPFG Insured | No Opt. Call | Baa1 | | 7,987,793 | |
| | 28,270 | | Total Water and Sewer | | | | 19,485,950 | |
| $ | 156,065 | | Total Investments (cost $136,003,695) – 146.6% | | | | 131,066,009 | |
| | | | MuniFund Term Preferred Shares, at Liquidation Value – (50.2)% (6) | | | | (44,861,000 | ) |
| | | | Other Assets Less Liabilities – 3.6% | | | | 3,193,612 | |
| | | | Net Assets Applicable to Common Shares – 100% | | | $ | 89,398,621 | |
| (1) | | All percentages shown in the Portfolio of Investments are based on net assets applicable to Common shares unless otherwise noted. |
| (2) | | Optional Call Provisions (not covered by the report of independent registered public accounting firm): Dates (month and year) and prices of the earliest optional call or redemption. There may be other call provisions at varying prices at later dates. Certain mortgage-backed securities may be subject to periodic principal paydowns. |
| (3) | | Ratings (not covered by the report of independent registered public accounting firm): Using the highest of Standard & Poor’s Group (“Standard & Poor’s”), Moody’s Investor Service, Inc. (“Moody’s”) or Fitch, Inc. (“Fitch”) rating. Ratings below BBB by Standard & Poor’s, Baa by Moody’s or BBB by Fitch are considered to be below investment grade. Holdings designated N/R are not rated by any of these national rating agencies. |
| (4) | | Investment, or portion of investment, has been pledged to collateralize the net payment obligations for investments in inverse floating rate transactions. |
| (5) | | Backed by an escrow or trust containing sufficient U.S. Government or U.S. Government agency securities, which ensure the timely payment of principal and interest. Such investments are normally considered to be equivalent to AAA rated securities. |
| (6) | | MuniFund Term Preferred Shares, at Liquidation Value as a percentage of Total Investments is 34.2%. |
| N/R | | Not rated. |
| (ETM) | | Escrowed to maturity. |
| (IF) | | Inverse floating rate investment. |
See accompanying notes to financial statements.
| | | Nuveen New Jersey Dividend Advantage Municipal Fund 2 |
| NUJ | | Portfolio of Investments |
| | Principal Amount (000) | | Description (1) | Optional Call Provisions (2) | Ratings (3) | | Value | |
| | | | Consumer Discretionary – 0.3% (0.2% of Total Investments) | | | | | |
| | | | Middlesex County Improvement Authority, New Jersey, Senior Revenue Bonds, Heldrich Center Hotel/Conference Center Project, Series 2005A: | | | | | |
| $ | 180 | | 5.000%, 1/01/32 | 1/15 at 100.00 | B3 | $ | 103,478 | |
| | 150 | | 5.125%, 1/01/37 | 1/15 at 100.00 | B3 | | 86,255 | |
| | 330 | | Total Consumer Discretionary | | | | 189,733 | |
| | | | Consumer Staples – 5.2% (3.4% of Total Investments) | | | | | |
| | | | Tobacco Settlement Financing Corporation, New Jersey, Tobacco Settlement Asset-Backed Bonds, Series 2007-1A: | | | | | |
| | 625 | | 4.500%, 6/01/23 | 6/17 at 100.00 | BBB | | 528,400 | |
| | 2,050 | | 4.750%, 6/01/34 | 6/17 at 100.00 | Baa3 | | 1,273,440 | |
| | 2,200 | | 5.000%, 6/01/41 | 6/17 at 100.00 | Baa3 | | 1,372,800 | |
| | 4,875 | | Total Consumer Staples | | | | 3,174,640 | |
| | | | Education and Civic Organizations – 15.8% (10.3% of Total Investments) | | | | | |
| | 3,000 | | New Jersey Educational Facilities Authority, Revenue Bonds, College of New Jersey Project, Series 2002C, 4.750%, 7/01/19 – FGIC Insured | 7/12 at 100.00 | A2 | | 3,044,130 | |
| | 200 | | New Jersey Educational Facilities Authority, Revenue Bonds, Fairleigh Dickinson University, Series 2004C, 5.500%, 7/01/23 | 7/14 at 100.00 | N/R | | 200,790 | |
| | | | New Jersey Educational Facilities Authority, Revenue Bonds, Kean University, Series 2007D: | | | | | |
| | 790 | | 5.000%, 7/01/32 – FGIC Insured | 7/17 at 100.00 | A2 | | 774,777 | |
| | 495 | | 5.000%, 7/01/39 – FGIC Insured | 7/17 at 100.00 | A2 | | 466,468 | |
| | 575 | | New Jersey Educational Facilities Authority, Revenue Bonds, New Jersey Institute of Technology, Series 2004B, 5.000%, 7/01/21 – AMBAC Insured | 1/14 at 100.00 | A+ | | 587,719 | |
| | 500 | | New Jersey Educational Facilities Authority, Revenue Bonds, William Paterson University, Series 2004A, 5.125%, 7/01/19 – FGIC Insured | 7/14 at 100.00 | A1 | | 516,275 | |
| | 1,090 | | New Jersey Educational Facilities Authority, Revenue Refunding Bonds, Rider University, Series 2002A, 5.000%, 7/01/17 – RAAI Insured | 7/12 at 100.00 | BBB+ | | 1,108,704 | |
| | 105 | | New Jersey Higher Education Assistance Authority, Student Loan Revenue Bonds Series 2010-2, 5.000%, 12/01/30 | 12/20 at 100.00 | Aa3 | | 101,246 | |
| | 180 | | New Jersey Higher Education Assistance Authority, Student Loan Revenue Bonds, Series 2010-1A, 5.000%, 12/01/25 | 12/19 at 100.00 | AA | | 175,712 | |
| | 200 | | New Jersey Higher Education Assistance Authority, Student Loan Revenue Bonds, Tender Option Bond Trust PA-4643, 19.550%, 6/01/30 (IF) (4) | 6/19 at 100.00 | AA | | 223,504 | |
| | 910 | | Puerto Rico Industrial, Tourist, Educational, Medical and Environmental Control Facilities Financing Authority, Higher Education Revenue Bonds, Ana G. Mendez University System, Series 1999, 5.375%, 2/01/19 | 8/11 at 100.00 | BBB– | | 898,862 | |
| | 1,790 | | University of Medicine and Dentistry of New Jersey, Revenue Bonds, Series 2002A, 5.000%, 12/01/31 – AMBAC Insured | 12/12 at 100.00 | Baa1 | | 1,643,256 | |
| | 9,835 | | Total Education and Civic Organizations | | | | 9,741,443 | |
| | | | Energy – 1.6% (1.0% of Total Investments) | | | | | |
| | 1,000 | | Virgin Islands, Senior Secured Revenue Bonds, Government Refinery | 1/13 at 100.00 | Baa3 | | 970,910 | |
| | | | Facilities – Hovensa LLC Coker, Series 2002, 6.500%, 7/01/21 (Alternative Minimum Tax) | | | | | |
| | | | Financials – 5.1% (3.3% of Total Investments) | | | | | |
| | 600 | | New Jersey Economic Development Authority, Economic Development Revenue Bonds, Glimcher Properties LP, Series 1998, 6.000%, 11/01/28 (Alternative Minimum Tax) | 5/11 at 100.00 | N/R | | 501,612 | |
| | 1,250 | | New Jersey Economic Development Authority, Industrial Development Revenue Refunding Bonds, Newark Airport Marriott Hotel, Series 1996, 7.000%, 10/01/14 | 10/11 at 100.00 | Ba1 | | 1,254,638 | |
| | 1,450 | | New Jersey Economic Development Authority, Revenue Refunding Bonds, Kapkowski Road Landfill Project, Series 2002, 5.750%, 10/01/21 | No Opt. Call | Ba2 | | 1,388,042 | |
| | 3,300 | | Total Financials | | | | 3,144,292 | |
| | | | Health Care – 27.7% (18.1% of Total Investments) | | | | | |
| | 220 | | Camden County Improvement Authority, New Jersey, Revenue Bonds, Cooper Health System, Series 2004A, 5.750%, 2/15/34 | 8/14 at 100.00 | BBB | | 194,095 | |
| | | Nuveen New Jersey Dividend Advantage Municipal Fund 2 (continued) |
| NUJ | | Portfolio of Investments |
April 30, 2011
| | Principal Amount (000) | | Description (1) | Optional Call Provisions (2) | Ratings (3) | | Value | |
| | | | Health Care (continued) | | | | | |
| $ | 400 | | New Jersey Health Care Facilities Finance Authority, Revenue Bonds, AHS Hospital Corporation, Series 2008A, 5.000%, 7/01/27 | 7/18 at 100.00 | A1 | $ | 392,152 | |
| | | | New Jersey Health Care Facilities Financing Authority, FHA-Insured Mortgage Revenue Bonds, Jersey City Medical Center, Series 2001: | | | | | |
| | 425 | | 5.000%, 8/01/31 – AMBAC Insured | 8/11 at 100.00 | N/R | | 432,195 | |
| | 1,925 | | 5.000%, 8/01/41 – AMBAC Insured | 8/11 at 100.00 | N/R | | 1,808,788 | |
| | 260 | | New Jersey Health Care Facilities Financing Authority, Hospital Revenue Bonds, Virtua Health, Tender Option Bond Trust 3018, 19.492%, 7/01/38 – AGC Insured (IF) | 7/19 at 100.00 | AA+ | | 267,051 | |
| | 610 | | New Jersey Health Care Facilities Financing Authority, Revenue Bonds, Atlanticare Regional Medical Center, Series 2007, 5.000%, 7/01/37 | 7/17 at 100.00 | A+ | | 573,534 | |
| | 1,000 | | New Jersey Health Care Facilities Financing Authority, Revenue Bonds, CentraState Medical Center, Series 2006A, 5.000%, 7/01/30 – AGC Insured | 7/17 at 100.00 | Aa3 | | 977,620 | |
| | 90 | | New Jersey Health Care Facilities Financing Authority, Revenue Bonds, Children’s Specialized Hospital, Series 2005A, 5.500%, 7/01/36 | 7/15 at 100.00 | Baa3 | | 80,235 | |
| | 120 | | New Jersey Health Care Facilities Financing Authority, Revenue Bonds, Hunterdon Medical Center, Series 2006, 5.125%, 7/01/35 | 7/16 at 100.00 | A– | | 108,521 | |
| | | | New Jersey Health Care Facilities Financing Authority, Revenue Bonds, Kennedy Health System Obligated Group, Series 2001: | | | | | |
| | 400 | | 5.500%, 7/01/21 | 7/11 at 100.00 | A2 | | 400,196 | |
| | 140 | | 5.625%, 7/01/31 | 7/11 at 100.00 | A2 | | 132,329 | |
| | 715 | | New Jersey Health Care Facilities Financing Authority, Revenue Bonds, Meridian Health System Obligated Group, Series 1999, 5.250%, 7/01/29 – AGM Insured | 7/11 at 100.00 | Aa3 | | 714,950 | |
| | 1,185 | | New Jersey Health Care Facilities Financing Authority, Revenue Bonds, Palisades Medical Center of New York Presbyterian Healthcare System, Series 2002, 6.625%, 7/01/31 | 7/12 at 101.00 | BB+ | | 1,059,639 | |
| | 500 | | New Jersey Health Care Facilities Financing Authority, Revenue Bonds, Saint Joseph’s Healthcare System Obligated Group Issue, Series 2008, 6.625%, 7/01/38 | 7/18 at 100.00 | BBB– | | 490,375 | |
| | 630 | | New Jersey Health Care Facilities Financing Authority, Revenue Bonds, Shore Memorial Health System, Series 2003, 5.000%, 7/01/23 – RAAI Insured | 7/13 at 100.00 | N/R | | 596,112 | |
| | 1,520 | | New Jersey Health Care Facilities Financing Authority, Revenue Bonds, Somerset Medical Center, Series 2003, 5.500%, 7/01/33 | 7/13 at 100.00 | Ba2 | | 1,130,758 | |
| | | | New Jersey Health Care Facilities Financing Authority, Revenue Bonds, South Jersey Hospital System, Series 2006: | | | | | |
| | 2,455 | | 5.000%, 7/01/36 | 7/16 at 100.00 | A2 | | 2,241,857 | |
| | 435 | | 5.000%, 7/01/46 | 7/16 at 100.00 | A2 | | 384,705 | |
| | 775 | | New Jersey Health Care Facilities Financing Authority, Revenue Bonds, St. Peter’s University Hospital, Series 2000A, 6.875%, 7/01/20 | 7/11 at 100.00 | BBB– | | 775,465 | |
| | 1,390 | | New Jersey Health Care Facilities Financing Authority, Revenue Refunding Bonds, Atlantic City Medical Center, Series 2002, 5.750%, 7/01/25 | 7/12 at 100.00 | A+ | | 1,408,570 | |
| | 1,150 | | New Jersey Health Care Facilities Financing Authority, Revenue Refunding Bonds, Bayshore Community Hospital, Series 2002, 5.125%, 7/01/32 – RAAI Insured | 1/12 at 100.00 | N/R | | 894,654 | |
| | 960 | | New Jersey Health Facilities Financing Authority, Revenue Bonds, Meridian Health, Series 2007-I, 5.000%, 7/01/38 – AGC Insured | 7/18 at 100.00 | AA+ | | 906,182 | |
| | 1,100 | | Puerto Rico Industrial, Tourist, Educational, Medical and Environmental Control Facilities Financing Authority, Adjustable Rate Industrial Revenue Bonds, American Home Products Corporation, Series 1983A, 5.100%, 12/01/18 | 6/11 at 100.00 | A1 | | 1,103,861 | |
| | 18,405 | | Total Health Care | | | | 17,073,844 | |
| | | | Housing/Multifamily – 3.9% (2.6% of Total Investments) | | | | | |
| | | | New Jersey Economic Development Authority, Student Housing Revenue Bonds, Provident Group-Montclair Properties LLC, Montclair State University Student Housing Project, Series 2010A: | | | | | |
| | 380 | | 5.750%, 6/01/31 | 6/20 at 100.00 | Baa3 | | 353,890 | |
| | 200 | | 5.875%, 6/01/42 | 6/20 at 100.00 | Baa3 | | 179,728 | |
| | 1,920 | | New Jersey Housing and Mortgage Finance Agency, Multifamily Housing Revenue Bonds, Series 1997A, 5.650%, 5/01/40 – AMBAC Insured (Alternative Minimum Tax) | 11/11 at 100.00 | A+ | | 1,877,165 | |
| | 2,500 | | Total Housing/Multifamily | | | | 2,410,783 | |
| | | | Housing/Single Family – 0.3% (0.2% of Total Investments) | | | | | |
| | 215 | | New Jersey Housing and Mortgage Finance Agency, Single Family Housing Revenue Bonds, Series 2007T, 4.700%, 10/01/37 (Alternative Minimum Tax) | 4/17 at 100.00 | AA | | 195,682 | |
| | Principal Amount (000) | | Description (1) | Optional Call Provisions (2) | Ratings (3) | | Value | |
| | | | Long-Term Care – 9.3% (6.0% of Total Investments) | | | | | |
| $ | 415 | | Burlington County Bridge Commission, New Jersey, Economic Development Revenue Bonds, The Evergreens Project, Series 2007, 5.625%, 1/01/38 | 1/18 at 100.00 | N/R | $ | 331,556 | |
| | | | New Jersey Economic Development Authority, Revenue Bonds, Masonic Charity Foundation of New Jersey, Series 2001: | | | | | |
| | 1,000 | | 5.500%, 6/01/21 | 6/11 at 102.00 | A– | | 1,010,940 | |
| | 4,000 | | 5.500%, 6/01/31 | 6/11 at 102.00 | A– | | 3,937,680 | |
| | 520 | | New Jersey Economic Development Authority, Revenue Bonds, United Methodist Homes of New Jersey Obligated Group, Series 1998, 5.125%, 7/01/25 | 7/11 at 100.00 | BB+ | | 429,114 | |
| | 5,935 | | Total Long-Term Care | | | | 5,709,290 | |
| | | | Tax Obligation/General – 2.3% (1.5% of Total Investments) | | | | | |
| | 700 | | Jersey City, New Jersey, General Obligation Bonds, Series 2006A, 5.000%, 9/01/22 – AMBAC Insured | 9/16 at 100.00 | A2 | | 729,211 | |
| | 190 | | Middletown Township Board of Education, Monmouth County, New Jersey, Refunding Series 5.000%, 8/01/27 2010, | 8/20 at 100.00 | AA | | 202,823 | |
| | 385 | | Puerto Rico, General Obligation and Public Improvement Bonds, Series 2001, 5.125%, 7/01/23 – AGM Insured | 7/11 at 100.00 | AA+ | | 385,142 | |
| | 100 | | Woodbridge Township, Middlesex County, New Jersey, General Obligation Bonds, 5.000%, 7/15/19 | No Opt. Call | AA– | | 114,566 | |
| | 1,375 | | Total Tax Obligation/General | | | | 1,431,742 | |
| | | | Tax Obligation/Limited – 30.8% (20.1% of Total Investments) | | | | | |
| | 400 | | Bergen County Improvement Authority, New Jersey, Guaranteed Lease Revenue Bonds, County Administration Complex Project, Series 2005, 5.000%, 11/15/26 | No Opt. Call | Aaa | | 459,252 | |
| | 1,000 | | Burlington County Bridge Commission, New Jersey, Guaranteed Pooled Loan Bonds, Series 2003, 5.000%, 12/01/18 – NPFG Insured | 12/13 at 100.00 | AA | | 1,083,170 | |
| | 750 | | Casino Reinvestment Development Authority, New Jersey, Hotel Room Fee Revenue Bonds, Series 2004, 5.250%, 1/01/16 – AMBAC Insured | 1/15 at 102.00 | A– | | 798,923 | |
| | 435 | | Essex County Improvement Authority, New Jersey, Project Consolidation Revenue Bonds, Series 2007, 5.250%, 12/15/22 – AMBAC Insured | No Opt. Call | Aa2 | | 489,201 | |
| | 530 | | Garden State Preservation Trust, New Jersey, Open Space and Farmland Preservation Bonds, Series 2005C, 5.125%, 11/01/18 – AGM Insured | No Opt. Call | AAA | | 620,243 | |
| | 1,305 | | New Jersey Building Authority, State Building Revenue Bonds, Series 2007A, 5.000%, 6/15/26 | 6/16 at 100.00 | A+ | | 1,317,841 | |
| | | | New Jersey Economic Development Authority, Cigarette Tax Revenue Bonds, Series 2004: | | | | | |
| | 435 | | 5.500%, 6/15/24 | 6/12 at 100.00 | BBB | | 406,033 | |
| | 400 | | 5.750%, 6/15/29 | 6/14 at 100.00 | BBB | | 365,112 | |
| | 400 | | 5.500%, 6/15/31 | 6/14 at 100.00 | BBB | | 350,940 | |
| | 700 | | 5.750%, 6/15/34 | 6/14 at 100.00 | BBB | | 623,049 | |
| | | | New Jersey Economic Development Authority, Revenue Bonds, Newark Downtown District Management Corporation Project, Series 2007: | | | | | |
| | 50 | | 5.125%, 6/15/27 | 6/17 at 100.00 | Baa3 | | 44,753 | |
| | 75 | | 5.125%, 6/15/37 | 6/17 at 100.00 | Baa3 | | 61,466 | |
| | | | New Jersey Economic Development Authority, School Facilities Construction Financing Program Bonds, Series 2007U: | | | | | |
| | 435 | | 5.000%, 9/01/37 – AMBAC Insured | 9/17 at 100.00 | A+ | | 410,666 | |
| | 870 | | 5.000%, 9/01/37 | 9/17 at 100.00 | A+ | | 821,332 | |
| | 350 | | New Jersey Educational Facilities Authority, Revenue Bonds, Higher Education Capital Improvement Fund, Refunding Series 2005A, 5.000%, 9/01/15 – AGM Insured | No Opt. Call | AA+ | | 383,236 | |
| | | | New Jersey Health Care Facilities Financing Authority, Lease Revenue Bonds, Department of Human Services – Greystone Park Psychiatric Hospital, Series 2005: | | | | | |
| | 655 | | 5.000%, 9/15/18 – AMBAC Insured | 9/15 at 100.00 | A+ | | 691,156 | |
| | 985 | | 5.000%, 9/15/24 – AMBAC Insured | 9/15 at 100.00 | A+ | | 992,644 | |
| | 200 | | New Jersey Health Care Facilities Financing Authority, State Contract Bonds, Hospital Asset Transformation Program, Series 2008A, 5.250%, 10/01/38 | 10/18 at 100.00 | A+ | | 191,860 | |
| | | | New Jersey Transportation Trust Fund Authority, Federal Highway Aid Grant Anticipation Bonds, Series 2006: | | | | | |
| | 295 | | 5.000%, 6/15/17 – FGIC Insured | 6/16 at 100.00 | Aa3 | | 318,512 | |
| | 525 | | 5.000%, 6/15/18 – FGIC Insured | 6/16 at 100.00 | Aa3 | | 560,180 | |
| | 4,000 | | New Jersey Transportation Trust Fund Authority, Transportation System Bonds, Capital Appreciation Series 2010A, 0.000%, 12/15/30 | No Opt. Call | AA– | | 1,146,240 | |
| | | Nuveen New Jersey Dividend Advantage Municipal Fund 2 (continued) |
| NUJ | | Portfolio of Investments |
April 30, 2011
| | Principal Amount (000) | | Description (1) | Optional Call Provisions (2) | Ratings (3) | | Value | |
| | | | Tax Obligation/Limited (continued) | | | | | |
| $ | 800 | | New Jersey Transportation Trust Fund Authority, Transportation System Bonds, Refunding Series 2006A, 5.500%, 12/15/22 | No Opt. Call | A+ | $ | 875,872 | |
| | 900 | | New Jersey Transportation Trust Fund Authority, Transportation System Bonds, Series 2004B, 5.500%, 12/15/16 – NPFG Insured | No Opt. Call | A+ | | 1,011,663 | |
| | 665 | | New Jersey Transportation Trust Fund Authority, Transportation System Bonds, Series 2005D, 5.000%, 6/15/19 – AGM Insured | 6/15 at 100.00 | AA+ | | 702,293 | |
| | | | New Jersey Transportation Trust Fund Authority, Transportation System Bonds, Series 2006C: | | | | | |
| | 2,000 | | 0.000%, 12/15/32 – AGM Insured | No Opt. Call | AA+ | | 466,600 | |
| | 4,000 | | 0.000%, 12/15/33 – AGM Insured | No Opt. Call | AA+ | | 865,240 | |
| | 5,000 | | 0.000%, 12/15/34 – AGM Insured | No Opt. Call | AA+ | | 1,001,600 | |
| | 1,300 | | New Jersey Transportation Trust Fund Authority, Transportation System Bonds, Series 2010D, 5.000%, 12/15/24 | No Opt. Call | A+ | | 1,326,104 | |
| | 290 | | Puerto Rico Convention Center District Authority, Hotel Occupancy Tax Revenue Bonds, Series 2006A, 4.500%, 7/01/36 – CIFG Insured | 7/16 at 100.00 | A3 | | 229,732 | |
| | 350 | | Virgin Islands Public Finance Authority, Matching Fund Loan Notes Revenue Bonds, Subordinate Lien Series 2010B, 5.250%, 10/01/29 | 10/20 at 100.00 | Baa2 | | 329,501 | |
| | 30,100 | | Total Tax Obligation/Limited | | | | 18,944,414 | |
| | | | Transportation – 28.6% (18.6% of Total Investments) | | | | | |
| | 500 | | Delaware River and Bay Authority, Delaware and New Jersey, Revenue Bonds, Series 2005, 5.000%, 1/01/27 – NPFG Insured | 1/15 at 100.00 | A1 | | 510,210 | |
| | 700 | | Delaware River Port Authority, New Jersey and Pennsylvania, Revenue Bonds, Series 2010E, 5.000%, 1/01/40 | 1/20 at 100.00 | A– | | 691,544 | |
| | 600 | | New Jersey Economic Development Authority, Special Facilities Revenue Bonds, Continental Airlines Inc., Series 2000, 7.000%, 11/15/30 (Alternative Minimum Tax) | 5/11 at 101.00 | B | | 587,796 | |
| | 1,000 | | New Jersey Transit Corporation, Certificates of Participation, Federal Transit Administration Grants, Series 2002A, 5.500%, 9/15/14 – AMBAC Insured | No Opt. Call | Aa3 | | 1,099,770 | |
| | 765 | | New Jersey Transit Corporation, Certificates of Participation, Federal Transit Administration Grants, Series 2005A, 5.000%, 9/15/18 – FGIC Insured | 9/15 at 100.00 | A1 | | 803,877 | |
| | 2,000 | | New Jersey Turnpike Authority, Revenue Bonds, Series 2003A, 5.000%, 1/01/19 – FGIC Insured | 7/13 at 100.00 | A+ | | 2,119,180 | |
| | 1,500 | | New Jersey Turnpike Authority, Revenue Bonds, Series 2005A, 5.250%, 1/01/29 – AGM Insured | No Opt. Call | AA+ | | 1,644,705 | |
| | 360 | | Passaic County Improvement Authority, New Jersey, County Guaranteed Parking Revenue Bonds, 200 Hospital Plaza Project, Series 2010, 5.000%, 5/01/42 | 5/20 at 100.00 | Aa3 | | 354,420 | |
| | 500 | | Port Authority of New York and New Jersey, Consolidated Revenue Bonds, One Hundred Thirty-Fourth Series 2004, 5.000%, 7/15/34 | 1/14 at 101.00 | Aa2 | | 502,985 | |
| | 3,000 | | Port Authority of New York and New Jersey, Consolidated Revenue Bonds, One Hundred Twenty-Fifth Series 2002, 5.000%, 10/15/26 – AGM Insured | 4/12 at 101.00 | AA+ | | 3,053,550 | |
| | 2,000 | | Port Authority of New York and New Jersey, Consolidated Revenue Bonds, One Hundred Twenty-Seventh Series 2002, 5.125%, 6/15/37 – AMBAC Insured (Alternative Minimum Tax) | 6/14 at 100.00 | Aa2 | | 1,974,360 | |
| | | | Port Authority of New York and New Jersey, Special Project Bonds, JFK International Air Terminal LLC, Sixth Series 1997: | | | | | |
| | 4,000 | | 7.000%, 12/01/12 – NPFG Insured (Alternative Minimum Tax) | No Opt. Call | Baa1 | | 4,180,239 | |
| | 50 | | 5.750%, 12/01/22 – NPFG Insured (Alternative Minimum Tax) | 6/11 at 100.00 | Baa1 | | 48,129 | |
| | 16,975 | | Total Transportation | | | | 17,570,765 | |
| | | | U.S. Guaranteed – 16.0% (10.4% of Total Investments) (5) | | | | | |
| | 1,000 | | Bergen County Improvement Authority, New Jersey, Revenue Bonds, Yeshiva Ktana of Passaic Project, Series 2002, 6.000%, 9/15/27 (Pre-refunded 9/01/12) | 9/12 at 101.00 | N/R (5) | | 1,080,230 | |
| | 175 | | New Jersey Educational Facilities Authority, Revenue Bonds, Kean University, Series 2005B, 5.000%, 7/01/30 (Pre-refunded 7/01/16) – NPFG Insured | 7/16 at 100.00 | A– (5) | | 205,132 | |
| | | | New Jersey Health Care Facilities Financing Authority, Revenue Bonds, Capital Health System Obligated Group, Series 2003A: | | | | | |
| | 750 | | 5.000%, 7/01/26 (Pre-refunded 7/01/13) | 7/13 at 100.00 | N/R (5) | | 811,845 | |
| | 630 | | 5.375%, 7/01/33 (Pre-refunded 7/01/13) | 7/13 at 100.00 | N/R (5) | | 687,002 | |
| | 1,250 | | New Jersey Health Care Facilities Financing Authority, Revenue Bonds, South Jersey Hospital System, Series 2002, 5.875%, 7/01/21 (Pre-refunded 7/01/12) | 7/12 at 100.00 | A2 (5) | | 1,329,725 | |
| | Principal Amount (000) | | Description (1) | Optional Call Provisions (2) | Ratings (3) | | Value | |
| | | | U.S. Guaranteed (5) (continued) | | | | | |
| | | | New Jersey Turnpike Authority, Revenue Bonds, Series 1991C: | | | | | |
| $ | 170 | | 6.500%, 1/01/16 (ETM) | No Opt. Call | AAA | $ | 206,453 | |
| | 2,430 | | 6.500%, 1/01/16 (ETM) | No Opt. Call | AAA | | 2,723,860 | |
| | 250 | | Newark Housing Authority, New Jersey, Port Authority Terminal Revenue Bonds, Series 2004, 5.250%, 1/01/21 (Pre-refunded 1/01/14) – NPFG Insured | 1/14 at 100.00 | AA– (5) | | 278,965 | |
| | 505 | | Puerto Rico Public Finance Corporation, Commonwealth Appropriation Bonds, Series 2002E, 5.500%, 8/01/29 (Pre-refunded 2/01/12) | 2/12 at 100.00 | AAA | | 524,847 | |
| | | | Tobacco Settlement Financing Corporation, New Jersey, Tobacco Settlement Asset-Backed Bonds, Series 2003: | | | | | |
| | 590 | | 6.125%, 6/01/24 (Pre-refunded 6/01/12) | 6/12 at 100.00 | AAA | | 595,446 | |
| | 1,250 | | 6.375%, 6/01/32 (Pre-refunded 6/01/13) | 6/13 at 100.00 | AAA | | 1,373,963 | |
| | 9,000 | | Total U.S. Guaranteed | | | | 9,817,468 | |
| | | | Utilities – 4.5% (2.9% of Total Investments) | | | | | |
| | 2,300 | | Guam Power Authority, Revenue Bonds, Series 1999A, 5.250%, 10/01/34 – NPFG Insured | 10/11 at 100.00 | Baa1 | | 1,973,653 | |
| | 750 | | New Jersey Economic Development Authority, Pollution Control Revenue Refunding Bonds, Public Service Electric and Gas Company, Series 2001A, 5.000%, 3/01/12 | No Opt. Call | Baa1 | | 770,063 | |
| | 3,050 | | Total Utilities | | | | 2,743,716 | |
| | | | Water and Sewer – 2.2% (1.4% of Total Investments) | | | | | |
| | 150 | | Guam Government Waterworks Authority, Water and Wastewater System Revenue Bonds, Series 2005, 6.000%, 7/01/25 | 7/15 at 100.00 | Ba2 | | 142,707 | |
| | 500 | | New Jersey Economic Development Authority, Water Facilities Revenue Bonds, New Jersey-American Water Company Inc. Project, Refunding Series 2010B, 5.600%, 11/01/34 (Alternative Minimum Tax) | 5/20 at 100.00 | A | | 495,485 | |
| | 220 | | New Jersey Economic Development Authority, Water Facilities Revenue Bonds, New Jersey-American Water Company Inc. Project, Refunding Series 2010D, 4.875%, 11/01/29 (Alternative Minimum Tax) | 11/20 at 100.00 | A | | 208,811 | |
| | 500 | | North Hudson Sewerage Authority, New Jersey, Sewerage Revenue Refunding Bonds, Series 2002A, 5.250%, 8/01/19 – FGIC Insured | 8/12 at 100.00 | N/R | | 510,420 | |
| | 1,370 | | Total Water and Sewer | | | | 1,357,423 | |
| $ | 108,265 | | Total Investments (cost $97,729,320) – 153.6% | | | | 94,476,145 | |
| | | | MuniFund Term Preferred Shares, at Liquidation Value – (57.0)% (6) | | | | (35,050,000 | ) |
| | | | Other Assets Less Liabilities – 3.4% | | | | 2,076,768 | |
| | | | Net Assets Applicable to Common Shares – 100% | | | $ | 61,502,913 | |
| (1) | | All percentages shown in the Portfolio of Investments are based on net assets applicable to Common shares unless otherwise noted. |
| (2) | | Optional Call Provisions (not covered by the report of independent registered public accounting firm): Dates (month and year) and prices of the earliest optional call or redemption. There may be other call provisions at varying prices at later dates. Certain mortgage-backed securities may be subject to periodic principal paydowns. |
| (3) | | Ratings (not covered by the report of independent registered public accounting firm): Using the highest of Standard & Poor’s Group (“Standard & Poor’s”), Moody’s Investor Service, Inc. (“Moody’s”) or Fitch, Inc. (“Fitch”) rating. Ratings below BBB by Standard & Poor’s, Baa by Moody’s or BBB by Fitch are considered to be below investment grade. Holdings designated N/R are not rated by any of these national rating agencies. |
| (4) | | Investment, or portion of investment, has been pledged to collateralize the net payment obligations for investments in inverse floating rate transactions. |
| (5) | | Backed by an escrow or trust containing sufficient U.S. Government or U.S. Government agency securities, which ensure the timely payment of principal and interest. Such investments are normally considered to be equivalent to AAA rated securities. |
| (6) | | MuniFund Term Preferred Shares, at Liquidation Value as a percentage of Total Investments is 37.1%. |
| N/R | | Not rated. |
| (ETM) | | Escrowed to maturity. |
| (IF) | | Inverse floating rate investment. |
See accompanying notes to financial statements.
| | | Nuveen New Jersey Municipal Value Fund |
| NJV | | Portfolio of Investments |
April 30, 2011
| | Principal | | | Optional Call | | | | |
| | Amount (000) | | Description (1) | Provisions (2) | Ratings (3) | | Value | |
| | | | Consumer Staples – 5.4% (5.2% of Total Investments) | | | | | |
| $ | 2,000 | | Tobacco Settlement Financing Corporation, New Jersey, Tobacco Settlement Asset-Backed Bonds, Series 2007-1A, 5.000%, 6/01/41 | 6/17 at 100.00 | Baa3 | $ | 1,248,000 | |
| | | | Education and Civic Organizations – 8.5% (8.2% of Total Investments) | | | | | |
| | 900 | | New Jersey Educational Facilities Authority, Revenue Refunding Bonds, Kean University, Series 2009A, 5.500%, 9/01/36 | 9/19 at 100.00 | A2 | | 905,904 | |
| | 30 | | New Jersey Higher Education Assistance Authority, Student Loan Revenue Bonds Series 2010-2, 5.000%, 12/01/30 | 12/20 at 100.00 | Aa3 | | 28,928 | |
| | 1,000 | | New Jersey Higher Education Assistance Authority, Student Loan Revenue Bonds, Series 2009A, 5.625%, 6/01/30 | 6/19 at 100.00 | AA | | 1,029,380 | |
| | 1,930 | | Total Education and Civic Organizations | | | | 1,964,212 | |
| | | | Energy – 4.1% (3.9% of Total Investments) | | | | | |
| | 1,000 | | Virgin Islands Public Finance Authority, Revenue Bonds, Refinery Project – Hovensa LLC, Series 2003, 6.125%, 7/01/22 (Alternative Minimum Tax) | 1/14 at 100.00 | Baa3 | | 933,930 | |
| | | | Health Care – 31.9% (30.4% of Total Investments) | | | | | |
| | 600 | | Camden County Improvement Authority, New Jersey, Revenue Bonds, Cooper Health System, Series 2004A, 5.000%, 2/15/25 | 2/15 at 100.00 | BBB | | 530,778 | |
| | 450 | | Hospital Authority of Delaware County, Indiana, Hospital Revenue Bonds, Cardinal Health System, Series 2006, 5.000%, 8/01/24 | 8/16 at 100.00 | Baa3 | | 418,991 | |
| | 425 | | Illinois Finance Authority, Revenue Bonds, OSF Healthcare System, Series 2007A, 5.750%, 11/15/37 | 11/17 at 100.00 | A | | 398,667 | |
| | 2,000 | | New Jersey Health Care Facilities Financing Authority, Hospital Revenue Bonds, Virtua Health, Series 2009A, 5.500%, 7/01/38 – AGC Insured (UB) | 7/19 at 100.00 | AA+ | | 2,013,580 | |
| | 1,500 | | New Jersey Health Care Facilities Financing Authority, Revenue Bonds, Hunterdon Medical Center, Series 2006B, 5.000%, 7/01/36 | 7/16 at 100.00 | A– | | 1,325,790 | |
| | 750 | | New Jersey Health Care Facilities Financing Authority, Revenue Bonds, Saint Joseph’s Healthcare System Obligated Group Issue, Series 2008, 6.000%, 7/01/18 | No Opt. Call | BBB– | | 789,833 | |
| | 925 | | New Jersey Health Care Facilities Financing Authority, Revenue Bonds, South Jersey Hospital System, Series 2006, 5.000%, 7/01/36 | 7/16 at 100.00 | A2 | | 844,692 | |
| | 1,000 | | New Jersey Health Care Facilities Financing Authority, Revenue Refunding Bonds, Bayshore Community Hospital, Series 2002, 5.125%, 7/01/32 – RAAI Insured | 1/12 at 100.00 | N/R | | 777,960 | |
| | 220 | | Wisconsin Health and Educational Facilities Authority, Revenue Bonds, ProHealth Care, Inc. Obligated Group, Series 2009, 6.625%, 2/15/32 | 2/14 at 100.00 | A+ | | 224,822 | |
| | 7,870 | | Total Health Care | | | | 7,325,113 | |
| | | | Housing/Multifamily – 4.7% (4.5% of Total Investments) | | | | | |
| | | | New Jersey Economic Development Authority, Student Housing Revenue Bonds, Provident | | | | | |
| | | | Group-Montclair Properties LLC, Montclair State University Student Housing Project, Series 2010A: | | | | | |
| | 100 | | 5.750%, 6/01/31 | 6/20 at 100.00 | Baa3 | | 93,129 | |
| | 50 | | 5.875%, 6/01/42 | 6/20 at 100.00 | Baa3 | | 44,932 | |
| | 1,000 | | New Jersey Housing and Mortgage Finance Agency, Multifamily Housing Revenue Bonds, Series 2009A, 4.950%, 5/01/41 | 11/19 at 100.00 | A+ | | 947,270 | |
| | 1,150 | | Total Housing/Multifamily | | | | 1,085,331 | |
| | Principal | | | Optional Call | | | | |
| | Amount (000) | | Description (1) | Provisions (2) | Ratings (3) | | Value | |
| | | | Tax Obligation/General – 0.9% (0.9% of Total Investments) | | | | | |
| $ | 50 | | Monmouth County Improvement Authority, New Jersey, Governmental Loan Revenue Bonds, Series 2005, 5.000%, 12/01/14 – AMBAC Insured | No Opt. Call | N/R | $ | 53,936 | |
| | 150 | | Monmouth County Improvement Authority, New Jersey, Governmental Loan Revenue Bonds, Series 2007, 5.000%, 12/01/16 – AMBAC Insured | No Opt. Call | N/R | | 163,770 | |
| | 200 | | Total Tax Obligation/General | | | | 217,706 | |
| | | | Tax Obligation/Limited – 37.0% (35.3% of Total Investments) | | | | | |
| | 660 | | Guam Government, Limited Obligation Section 30 Revenue Bonds, Series 2009A, 5.750%, 12/01/34 New Jersey Economic Development Authority, Cigarette Tax Revenue Bonds, Series 2004: | 12/19 at 100.00 | BBB– | | 640,088 | |
| | 25 | | 5.500%, 6/15/16 – RAAI Insured | No Opt. Call | Baa3 | | 26,390 | |
| | 25 | | 5.625%, 6/15/18 | 6/11 at 100.00 | BBB | | 25,005 | |
| | 1,000 | | 5.750%, 6/15/34 | 6/14 at 100.00 | BBB | | 890,070 | |
| | 1,000 | | New Jersey Economic Development Authority, School Facilities Construction Financing Program Bonds, Refunding Series 2009AA, 5.250%, 12/15/33 | 6/19 at 100.00 | A+ | | 1,003,870 | |
| | 1,000 | | New Jersey Health Care Facilities Financing Authority, State Contract Bonds, Hospital Asset Transformation Program, Series 2008A, 5.250%, 10/01/38 | 10/18 at 100.00 | A+ | | 959,300 | |
| | 2,000 | | New Jersey Health Care Facilities Financing Authority, State Contract Bonds, Hospital Asset Transformation Program, Series 2009A, 5.750%, 10/01/31 | 10/19 at 100.00 | A+ | | 2,029,199 | |
| | 6,675 | | New Jersey Transportation Trust Fund Authority, Transportation System Bonds, Series 2009A, 0.000%, 12/15/39 | No Opt. Call | AA– | | 986,898 | |
| | 1,000 | | Puerto Rico Sales Tax Financing Corporation, Sales Tax Revenue Bonds, First Subordinate Series 2009A, 6.000%, 8/01/42 | 8/19 at 100.00 | A+ | | 1,001,819 | |
| | 105 | | Virgin Islands Public Finance Authority, Matching Fund Loan Notes Revenue Bonds, Senior Lien Series 2010A, 5.000%, 10/01/29 | 10/20 at 100.00 | BBB | | 95,675 | |
| | 1,000 | | Virgin Islands Public Finance Authority, Revenue Bonds, Senior Lien Matching Fund Loan Notes,Series 2009A-1, 5.000%, 10/01/39 | 10/19 at 100.00 | BBB | | 844,040 | |
| | 14,490 | | Total Tax Obligation/Limited | | | | 8,502,354 | |
| | | | Transportation – 6.9% (6.6% of Total Investments) | | | | | |
| | 500 | | New Jersey Economic Development Authority, Revenue Bonds, American Airlines Inc., Series 1991, 7.100%, 11/01/31 (Alternative Minimum Tax) | 11/11 at 100.00 | CCC+ | | 407,430 | |
| | 400 | | New Jersey Economic Development Authority, Special Facilities Revenue Bonds, Continental Airlines Inc., Series 2003, 9.000%, 6/01/33 (Alternative Minimum Tax) | 6/13 at 101.00 | B | | 415,976 | |
| | 765 | | New Jersey Turnpike Authority, Revenue Bonds, Series 2009E, 5.250%, 1/01/40 | 1/19 at 100.00 | A+ | | 766,859 | |
| | 1,665 | | Total Transportation | | | | 1,590,265 | |
| | | | U.S. Guaranteed – 4.4% (4.2% of Total Investments) (4) | | | | | |
| | 1,000 | | Cumberland County Improvement Authority, New Jersey, Solid Waste System Revenue Bonds, Series 2009B, 5.000%, 1/01/30 (Pre-refunded 7/01/11) | 7/11 at 100.00 | Baa1 (4) | | 1,007,980 | |
| | | Nuveen New Jersey Municipal Value Fund (continued) |
| NJV | | Portfolio of Investments |
April 30, 2011
| | Principal | | | Optional Call | | | | |
| | Amount (000) | | Description (1) | Provisions (2) | Ratings (3) | | Value | |
| | | | Water and Sewer – 0.9% (0.8% of Total Investments) | | | | | |
| $ | 220 | | New Jersey Economic Development Authority, Water Facilities Revenue Bonds, American Water Company, Series 1998A, 5.250%, 7/01/38 – FGIC Insured (Alternative Minimum Tax) | 7/11 at 100.00 | BBB | $ | 196,649 | |
| $ | 31,525 | | Total Investments (cost $23,459,225) – 104.7% | | | | 24,071,540 | |
| | | | Floating Rate Obligations – (6.5)% | | | | (1,500,000 | ) |
| | | | Other Assets Less Liabilities – 1.8% | | | | 409,220 | |
| | | | Net Assets Applicable to Common Shares – 100% | | | $ | 22,980,760 | |
| (1) | | All percentages shown in the Portfolio of Investments are based on net assets applicable to Common shares unless otherwise noted. |
| (2) | | Optional Call Provisions (not covered by the report of independent registered public accounting firm): Dates (month and year) and prices of the earliest optional call or redemption. There may be other call provisions at varying prices at later dates. Certain mortgage-backed securities may be subject to periodic principal paydowns. |
| (3) | | Ratings (not covered by the report of independent registered public accounting firm): Using the highest of Standard & Poor’s Group (“Standard & Poor’s”), Moody’s Investor Service, Inc. (“Moody’s”) or Fitch, Inc. (“Fitch”) rating. Ratings below BBB by Standard & Poor’s, Baa by Moody’s or BBB by Fitch are considered to be below investment grade. Holdings designated N/R are not rated by any of these national rating agencies. |
| (4) | | Backed by an escrow or trust containing sufficient U.S. Government or U.S. Government agency securities, which ensure the timely payment of principal and interest. Such investments are normally considered to be equivalent to AAA rated securities. |
| N/R | | Not rated. |
| (UB) | | Underlying bond of an inverse floating rate trust reflected as a financing transaction. See Notes to Financial Statements, Footnote 1 – General Information and Significant Accounting Policies, Inverse Floating Rate Securities for more information. |
See accompanying notes to financial statements.
| | | Nuveen Pennsylvania Investment Quality Municipal Fund |
| NQP | | Portfolio of Investments |
April 30, 2011
| | Principal | | | Optional Call | | | | |
| | Amount (000) | | Description (1) | Provisions (2) | Ratings (3) | | Value | |
| | | | Consumer Staples – 0.4% (0.3% of Total Investments) | | | | | |
| $ | 1,000 | | Pennsylvania Economic Development Financing Authority, Solid Waste Disposal Revenue Bonds, Procter & Gamble Paper Project, Series 2001, 5.375%, 3/01/31 (Alternative Minimum Tax) | No Opt. Call | AA– | $ | 1,008,450 | |
| | | | Education and Civic Organizations – 29.0% (18.4% of Total Investments) | | | | | |
| | 2,000 | | Allegheny County Higher Education Building Authority, Pennsylvania, College Revenue Bonds, Chatham College, Series 1998A, 5.250%, 9/01/18 | 9/11 at 100.00 | BBB | | 2,000,640 | |
| | 200 | | Allegheny County Higher Education Building Authority, Pennsylvania, College Revenue Refunding Bonds, Robert Morris College, Series 1998A, 6.000%, 5/01/28 | No Opt. Call | Baa3 | | 193,994 | |
| | 3,000 | | Allegheny County Higher Education Building Authority, Pennsylvania, Revenue Bonds, Carnegie Mellon University, Series 2002, 5.125%, 3/01/32 | 3/12 at 100.00 | AA– | | 3,003,330 | |
| | 1,235 | | Allegheny County Higher Education Building Authority, Pennsylvania, Revenue Bonds, Robert Morris University, Series 2006A, 4.750%, 2/15/26 | 2/16 at 100.00 | Baa3 | | 1,064,175 | |
| | 2,000 | | Chester County Industrial Development Authority, Pennsylvania, Educational Facilities Revenue Bonds, Westtown School, Series 2002, 5.000%, 1/01/26 – AMBAC Insured | 1/12 at 100.00 | A | | 2,004,400 | |
| | | | Delaware County Authority, Pennsylvania, Revenue Bonds, Villanova University, Series 2006: | | | | | |
| | 1,710 | | 5.000%, 8/01/23 – AMBAC Insured | 8/16 at 100.00 | A+ | | 1,793,363 | |
| | 840 | | 5.000%, 8/01/24 – AMBAC Insured | 8/16 at 100.00 | A+ | | 875,322 | |
| | | | Erie Higher Education Building Authority, Pennsylvania, College Revenue Bonds, Gannon University, Series 2007-GG3: | | | | | |
| | 790 | | 5.000%, 5/01/32 – RAAI Insured | 5/17 at 100.00 | N/R | | 674,549 | |
| | 250 | | 5.000%, 5/01/35 – RAAI Insured | 5/17 at 100.00 | N/R | | 207,100 | |
| | | | Indiana County Industrial Development Authority, Pennsylvania, Revenue Bonds, Student Cooperative Association Inc./Indiana University of Pennsylvania – Student Union Project, Series 1999B: | | | | | |
| | 815 | | 0.000%, 11/01/15 – AMBAC Insured | No Opt. Call | N/R | | 683,492 | |
| | 815 | | 0.000%, 11/01/16 – AMBAC Insured | No Opt. Call | N/R | | 646,588 | |
| | 815 | | 0.000%, 11/01/17 – AMBAC Insured | No Opt. Call | N/R | | 604,347 | |
| | 815 | | 0.000%, 11/01/18 – AMBAC Insured | No Opt. Call | N/R | | 563,442 | |
| | 815 | | 0.000%, 11/01/19 – AMBAC Insured | No Opt. Call | N/R | | 524,045 | |
| | 1,515 | | Montgomery County Higher Education and Health Authority, Pennsylvania, Revenue Bonds, Arcadia University, Series 2006, 4.500%, 4/01/30 – RAAI Insured | 4/16 at 100.00 | BBB+ | | 1,233,271 | |
| | 900 | | Montgomery County Higher Education and Health Authority, Pennsylvania, Revenue Bonds, Arcadia University, Series 2010, 5.625%, 4/01/40 | 4/20 at 100.00 | BBB+ | | 864,603 | |
| | 355 | | New Wilmington, Pennsylvania, Revenue, Westminster College, Series 2007G, 5.125%, 5/01/33 – RAAI Insured | 5/17 at 100.00 | N/R | | 310,661 | |
| | 8,000 | | Pennsylvania Higher Education Assistance Agency, Capital Acquisition Revenue Refunding Bonds, Series 2001, 5.000%, 12/15/30 – NPFG Insured | 11/11 at 100.00 | Baa1 | | 7,338,560 | |
| | 5,000 | | Pennsylvania Higher Educational Facilities Authority, General Revenue Bonds, State System of Higher Education, Series 2002W, 5.000%, 6/15/19 – AMBAC Insured | 6/12 at 100.00 | Aa2 | | 5,180,700 | |
| | 4,600 | | Pennsylvania Higher Educational Facilities Authority, General Revenue Bonds, State System of Higher Education, Series 2008AH, 5.000%, 6/15/33 | 6/18 at 100.00 | Aa2 | | 4,657,500 | |
| | 1,435 | | Pennsylvania Higher Educational Facilities Authority, Revenue Bonds, Allegheny College, Series 2006, 4.750%, 5/01/31 | 5/16 at 100.00 | A– | | 1,351,870 | |
| | 2,650 | | Pennsylvania Higher Educational Facilities Authority, Revenue Bonds, Drexel University, Series 2007A, 5.000%, 5/01/37 – NPFG Insured | 11/17 at 100.00 | A | | 2,478,254 | |
| | 5,000 | | Pennsylvania Higher Educational Facilities Authority, Revenue Bonds, Moravian College, Series 2001, 5.375%, 7/01/31 – RAAI Insured | 7/11 at 100.00 | N/R | | 4,603,850 | |
| | 3,870 | | Pennsylvania Higher Educational Facilities Authority, Revenue Bonds, Temple University, First Series of 2006, 5.000%, 4/01/21 – NPFG Insured | 4/16 at 100.00 | Aa3 | | 4,168,919 | |
| | 320 | | Pennsylvania Higher Educational Facilities Authority, Revenue Bonds, Thomas Jefferson University, Series 2002, 5.000%, 1/01/20 | 1/13 at 100.00 | A1 | | 327,821 | |
| | | Nuveen Pennsylvania Investment Quality Municipal Fund (continued) |
| NQP | | Portfolio of Investments April 30, 2011 |
| | Principal | | | Optional Call | | | | |
| | Amount (000) | | Description (1) | Provisions (2) | Ratings (3) | | Value | |
| | | | Education and Civic Organizations (continued) | | | | | |
| $ | 1,000 | | Pennsylvania Higher Educational Facilities Authority, Revenue Bonds, Thomas Jefferson University, Series 2010, 5.000%, 3/01/40 | 3/20 at 100.00 | AA– | $ | 954,430 | |
| | 2,000 | | Pennsylvania Higher Educational Facilities Authority, Revenue Bonds, University of Pennsylvania, Series 2005C, 5.000%, 7/15/38 | 7/15 at 100.00 | AA+ | | 2,020,640 | |
| | 2,945 | | Pennsylvania Higher Educational Facilities Authority, Revenue Bonds, Ursinus College, Series 2003, 5.375%, 1/01/20 – RAAI Insured | 7/13 at 100.00 | A– | | 3,004,607 | |
| | 785 | | Pennsylvania Higher Educational Facilities Authority, Revenue Bonds, York College Project, Series 2005EE1, 5.250%, 11/01/27 – SYNCORA GTY Insured | 11/15 at 100.00 | A | | 799,475 | |
| | 6,500 | | Pennsylvania State University, General Revenue Bonds, Series 2005, 5.000%, 9/01/29 (UB) | 9/15 at 100.00 | Aa1 | | 6,656,520 | |
| | 600 | | Philadelphia Authority for Industrial Development, Pennsylvania, Revenue Bonds, MaST Charter School Project, Series 2010, 6.000%, 8/01/35 | 8/20 at 100.00 | BBB+ | | 574,116 | |
| | 2,000 | | State Public School Building Authority, Pennsylvania, College Revenue Bonds, Northampton County Area Community College, Series 2011, 5.500%, 3/01/31 | 3/21 at 100.00 | A1 | | 2,022,560 | |
| | 1,665 | | Union County, Higher Education Facilities Financing Authority, Pennsylvania, Revenue Bonds, Bucknell University, Series 2002A, 5.250%, 4/01/18 | 4/13 at 100.00 | Aa2 | | 1,786,329 | |
| | 600 | | Wilkes-Barre Finance Authority, Pennsylvania, Revenue Bonds, University of Scranton, Series 2010, 5.000%, 11/01/40 | 11/20 at 100.00 | A | | 556,452 | |
| | 67,840 | | Total Education and Civic Organizations | | | | 65,729,925 | |
| | | | Health Care – 16.9% (10.7% of Total Investments) | | | | | |
| | | | Allegheny County Hospital Development Authority, Pennsylvania, Revenue Bonds, Ohio Valley General Hospital, Series 2005A: | | | | | |
| | 1,150 | | 5.000%, 4/01/25 | 4/15 at 100.00 | Ba2 | | 970,106 | |
| | 1,555 | | 5.125%, 4/01/35 | 4/15 at 100.00 | Ba2 | | 1,187,833 | |
| | 2,460 | | Centre County Hospital Authority, Pennsylvania, Hospital Revenue Bonds, Mount Nittany Medical Center Project, Series 2011, 7.000%, 11/15/46 (WI/DD, Settling 5/05/11) | 11/21 at 100.00 | A– | | 2,579,138 | |
| | 1,300 | | Erie County Hospital Authority, Pennsylvania, Hospital Revenue Bonds, Saint Vincent Health Center Project, Series 2010A, 7.000%, 7/01/27 | 7/20 at 100.00 | Baa3 | | 1,280,084 | |
| | 280 | | Erie County Hospital Authority, Pennsylvania, Revenue Bonds, Hamot Health Foundation, Series 2007, 5.000%, 11/01/37 – CIFG Insured | 11/17 at 100.00 | Aa3 | | 252,308 | |
| | 835 | | Franklin County Industrial Development Authority, Pennsylvania, Revenue Bonds, Chambersburg Hospital Project, Series 2010, 5.375%, 7/01/42 | No Opt. Call | A2 | | 769,419 | |
| | 1,890 | | Lancaster County Hospital Authority, Pennsylvania, Hospital Revenue Bonds, The Lancaster General Hospital Project, Series 2007A, 5.000%, 3/15/26 | 3/17 at 100.00 | AA– | | 1,904,251 | |
| | | | Lebanon County Health Facilities Authority, Pennsylvania, Revenue Bonds, Good Samaritan Hospital Project, Series 2002: | | | | | |
| | 250 | | 5.800%, 11/15/22 | 11/12 at 101.00 | BB+ | | 227,423 | |
| | 2,800 | | 5.900%, 11/15/28 | 11/12 at 101.00 | BB+ | | 2,381,176 | |
| | 3,280 | | Lehigh County General Purpose Authority, Pennsylvania, Hospital Revenue Bonds, Lehigh Valley Health Network, Series 2008A, 5.000%, 7/01/33 – AGM Insured | 7/18 at 100.00 | AA+ | | 3,133,778 | |
| | 1,250 | | Lehigh County General Purpose Authority, Pennsylvania, Revenue Bonds, Good Shepherd Group, Series 2004A, 5.500%, 11/01/24 | 11/14 at 100.00 | A | | 1,266,188 | |
| | 5,345 | | Lehigh County General Purpose Authority, Pennsylvania, Revenue Bonds, Good Shepherd Group, Series 2007, 5.000%, 11/01/30 – AGC Insured | 11/17 at 100.00 | AA+ | | 5,368,518 | |
| | | | Lycoming County Athority, Pennsylvania, Health System Revenue Bonds, Susquehanna Health System Project, Series 2009: | | | | | |
| | 3,000 | | 5.500%, 7/01/28 | 7/19 at 100.00 | BBB+ | | 2,800,710 | |
| | 1,000 | | 5.750%, 7/01/39 | 7/19 at 100.00 | BBB+ | | 904,730 | |
| | 710 | | Monroe County Hospital Authority, Pennsylvania, Hospital Revenue Bonds, Pocono Medical Center, Series 2007, 5.125%, 1/01/37 | 1/17 at 100.00 | A– | | 631,644 | |
| | 1,000 | | Montgomery County Higher Education and Health Authority, Pennsylvania, Hospital Revenue Bonds, Abington Memorial Hospital, Series 2002A, 5.000%, 6/01/22 | 6/12 at 101.00 | A | | 1,007,540 | |
| | 215 | | Montgomery County Industrial Development Authority, Pennsylvania, FHA Insured Mortgage Revenue Bonds, New Regional Medical Center Project, Series 2010, 5.375%, 8/01/38 | 8/20 at 100.00 | AA | | 216,305 | |
| | Principal | | | Optional Call | | | | |
| | Amount (000) | | Description (1) | Provisions (2) | Ratings (3) | | Value | |
| | | | Health Care (continued) | | | | | |
| $ | 1,000 | | Northampton County General Purpose Authority, Pennsylvania, Hospital Revenue Bonds, Saint Lukes Hospital Project, Series 2008A, 5.500%, 8/15/35 | 8/18 at 100.00 | A3 | $ | 889,710 | |
| | 335 | | Pennsylvania Economic Development Financing Authority, Health System Revenue Bonds , Albert Einstein Healthcare, Series 2009A, 6.250%, 10/15/23 | No Opt. Call | Baa1 | | 345,660 | |
| | 1,795 | | Philadelphia Hospitals and Higher Education Facilities Authority, Pennsylvania, Health System Revenue Bonds, Jefferson Health System, Series 2010B, 5.000%, 5/15/40 | 5/20 at 100.00 | AA | | 1,663,068 | |
| | 1,613 | | South Fork Municipal Authority, Pennsylvania, Hospital Revenue Bonds, Conemaugh Valley Memorial Hospital, 5.500%, 7/01/29 | 7/20 at 100.00 | Baa1 | | 1,515,849 | |
| | | | Southcentral Pennsylvania General Authority, Revenue Bonds, Hanover Hospital Inc., Series 2005: | | | | | |
| | 525 | | 5.000%, 12/01/27 – RAAI Insured | 12/15 at 100.00 | BBB– | | 444,796 | |
| | 370 | | 5.000%, 12/01/29 – RAAI Insured | 12/15 at 100.00 | BBB– | | 308,495 | |
| | | | Union County Hospital Authority, Pennsylvania, Hospital Revenue Bonds, Evangelical Community Hospital Project, Refunding and Improvement Series 2011: | | | | | |
| | 1,635 | | 6.875%, 8/01/31 | No Opt. Call | BBB+ | | 1,640,134 | |
| | 1,365 | | 7.000%, 8/01/41 | No Opt. Call | BBB+ | | 1,352,933 | |
| | 1,500 | | West Shore Area Hospital Authority, Cumberland County, Pennsylvania, Hospital Revenue Bonds, Holy Spirit Hospital of the Sisters of Christian Charity Project, Series 2001, 6.250%, 1/01/32 | 1/12 at 100.00 | BBB+ | | 1,455,855 | |
| | 1,875 | | West Shore Area Hospital Authority, Cumberland County, Pennsylvania, Hospital Revenue Bonds, Holy Spirit Hospital of the Sisters of Christian Charity Project, Series 2011, 6.500%, 1/01/36 | 1/21 at 100.00 | BBB+ | | 1,849,838 | |
| | 40,333 | | Total Health Care | | | | 38,347,489 | |
| | | | Housing/Multifamily – 3.4% (2.2% of Total Investments) | | | | | |
| | 200 | | Pennsylvania Higher Educational Facilities Authority, Revenue Bonds, Edinboro University Foundation Student Housing Project, Series 2010, 6.000%, 7/01/43 | No Opt. Call | BBB– | | 188,350 | |
| | 5,000 | | Pennsylvania Higher Educational Facilities Authority, Revenue Bonds, Slippery Rock University Foundation Inc., Series 2007A, 5.000%, 7/01/39 – SYNCORA GTY Insured | 7/17 at 100.00 | BBB+ | | 4,173,300 | |
| | 3,300 | | Pennsylvania Higher Educational Facilities Authority, Revenue Bonds, Slippery Rock University Foundation Inc., Student Housing Project, Series 2005A, 5.000%, 7/01/37 – SYNCORA GTY Insured | 7/15 at 100.00 | BBB+ | | 2,764,113 | |
| | 800 | | Philadelphia Authority for Industrial Development, Pennsylvania, Multifamily Housing Revenue Bonds, Presbyterian Homes Germantown – Morrisville Project, Series 2005A, 5.625%, 7/01/35 | 5/15 at 102.00 | Baa3 | | 661,304 | |
| | 9,300 | | Total Housing/Multifamily | | | | 7,787,067 | |
| | | | Housing/Single Family – 9.6% (6.1% of Total Investments) | | | | | |
| | 8,770 | | Pennsylvania Housing Finance Agency, Single Family Mortgage Revenue Bonds, Series 1995A, 4.900%, 10/01/37 (Alternative Minimum Tax) | 10/15 at 100.00 | AA+ | | 8,226,523 | |
| | 1,710 | | Pennsylvania Housing Finance Agency, Single Family Mortgage Revenue Bonds, Series 2006-93A, 4.950%, 10/01/26 (Alternative Minimum Tax) | 4/15 at 100.00 | AA+ | | 1,670,636 | |
| | | | Pennsylvania Housing Finance Agency, Single Family Mortgage Revenue Bonds, Series 2006-94A: | | | | | |
| | 1,515 | | 5.150%, 10/01/37 (Alternative Minimum Tax) | 10/15 at 100.00 | AA+ | | 1,447,598 | |
| | 1,510 | | 5.150%, 10/01/37 (Alternative Minimum Tax) (UB) | 10/15 at 100.00 | AA+ | | 1,442,820 | |
| | 1,355 | | Pennsylvania Housing Finance Agency, Single Family Mortgage Revenue Bonds, Series 2007-97A, 4.600%, 10/01/27 (Alternative Minimum Tax) | 10/16 at 100.00 | AA+ | | 1,347,697 | |
| | 1,905 | | Pennsylvania Housing Finance Agency, Single Family Mortgage Revenue Bonds, Series 2007-98A, 4.850%, 10/01/31 (Alternative Minimum Tax) | 10/16 at 100.00 | AA+ | | 1,758,525 | |
| | 2,800 | | Pennsylvania Housing Finance Agency, Single Family Mortgage Revenue Bonds, Series 2011-112, 5.000%, 10/01/25 | 10/20 at 100.00 | AA+ | | 2,841,944 | |
| | 910 | | Pittsburgh Urban Redevelopment Authority, Pennsylvania, Mortgage Revenue Bonds, Series 1997A, 6.250%, 10/01/28 (Alternative Minimum Tax) | 10/11 at 100.00 | Aa1 | | 918,672 | |
| | 2,125 | | Pittsburgh Urban Redevelopment Authority, Pennsylvania, Mortgage Revenue Bonds, Series 2001B, 5.450%, 10/01/32 (Alternative Minimum Tax) | 10/11 at 100.00 | Aa1 | | 2,124,894 | |
| | 22,600 | | Total Housing/Single Family | | | | 21,779,309 | |
| | | Nuveen Pennsylvania Investment Quality Municipal Fund (continued) |
| NQP | | Portfolio of Investments |
April 30, 2011
| | Principal | | | Optional Call | | | | |
| | Amount (000) | | Description (1) | Provisions (2) | Ratings (3) | | Value | |
| | | | Industrials – 4.5% (2.9% of Total Investments) | | | | | |
| $ | 5,000 | | Pennsylvania Economic Development Financing Authority, Exempt Facilities Revenue Bonds, Amtrak Project, Series 2001A, 6.375%, 11/01/41 (Alternative Minimum Tax) | 11/11 at 101.00 | A1 | $ | 5,005,950 | |
| | 5,000 | | Pennsylvania Industrial Development Authority, Economic Development Revenue Bonds, Series 2002, 5.500%, 7/01/12 – AMBAC Insured | No Opt. Call | A1 | | 5,276,950 | |
| | 10,000 | | Total Industrials | | | | 10,282,900 | |
| | | | Long-Term Care – 3.6% (2.3% of Total Investments) | | | | | |
| | 1,500 | | Cumberland County Municipal Authority Revenue Bonds, Pennsylvania, Diakon Lutheran Social Ministries Project, Series 2009, 6.375%, 1/01/39 | 1/19 at 100.00 | N/R | | 1,468,365 | |
| | 1,330 | | Cumberland County Municipal Authority, Pennsylvania, Revenue Bonds, Diakon Lutheran Social Ministries, Series 2007, 5.000%, 1/01/36 | 1/17 at 100.00 | N/R | | 1,083,498 | |
| | 1,500 | | Cumberland County Municipal Authority, Pennsylvania, Revenue Bonds, Presbyterian Homes Inc., Series 2003A, 5.000%, 12/01/26 – RAAI Insured | 12/12 at 100.00 | BBB+ | | 1,336,965 | |
| | 1,000 | | Delaware County Authority, Pennsylvania, Revenue Bonds, Elwyn, Inc. Project, Series 2010, 5.000%, 6/01/21 | 6/17 at 100.00 | BBB | | 986,720 | |
| | | | Lancaster County Hospital Authority, Pennsylvania, Health Center Revenue Bonds, Masonic Homes Project, Series 2006: | | | | | |
| | 1,550 | | 5.000%, 11/01/26 | 11/16 at 100.00 | A | | 1,503,159 | |
| | 415 | | 5.000%, 11/01/36 | 11/16 at 100.00 | A | | 374,641 | |
| | 1,500 | | Philadelphia Authority for Industrial Development, Pennsylvania, Revenue Bonds, Philadelphia Corporation for the Aging Project, Series 2001B, 5.250%, 7/01/26 – AMBAC Insured | 7/11 at 101.00 | Baa1 | | 1,432,665 | |
| | 8,795 | | Total Long-Term Care | | | | 8,186,013 | |
| | | | Materials – 1.2% (0.7% of Total Investments) | | | | | |
| | 1,260 | | Bradford County Industrial Development Authority, Pennsylvania, Solid Waste Disposal Revenue Bonds, International Paper Company, Series 2005B, 5.200%, 12/01/19 (Alternative Minimum Tax) | 12/15 at 100.00 | BBB | | 1,260,239 | |
| | 1,750 | | Pennsylvania Economic Development Financing Authority, Exempt Facilities Revenue Bonds, National Gypsum Company, Series 1997B, 6.125%, 11/01/27 (Alternative Minimum Tax) | 11/11 at 100.00 | N/R | | 1,417,920 | |
| | 3,010 | | Total Materials | | | | 2,678,159 | |
| | | | Tax Obligation/General – 28.3% (18.0% of Total Investments) | | | | | |
| | 3,430 | | Allegheny County, Pennsylvania, General Obligation Bonds, Series 2011C-65, 5.375%, 5/01/31 | 5/21 at 100.00 | A+ | | 3,457,714 | |
| | 3,000 | | Bethel Park School District, Allegheny County, Pennsylvania, General Obligation Bonds, Series 2009, 5.000%, 8/01/29 | 8/19 at 100.00 | Aa2 | | 3,160,440 | |
| | 6,000 | | Delaware Valley Regional Finance Authority, Pennsylvania, Local Government Revenue Bonds, Series 2002, 5.750%, 7/01/17 (UB) | No Opt. Call | A+ | | 6,768,420 | |
| | 7,350 | | Erie City School District, Erie County, Pennsylvania, General Obligation Bonds, Series 2000, 0.000%, 9/01/30 – AMBAC Insured | No Opt. Call | N/R | | 2,223,081 | |
| | 5,000 | | Pennsylvania Public School Building Authority, Lease Revenue Bonds, School District of Philadelphia, Series 2006B, 5.000%, 6/01/33 – AGM Insured (UB) | 12/16 at 100.00 | AA+ | | 4,979,900 | |
| | 4,830 | | Pennsylvania State, General Obligation Bonds, Series 2007, Residuals 1986, 12.519%, 3/01/15 (IF) | No Opt. Call | Aa1 | | 5,302,519 | |
| | 1,500 | | Philadelphia School District, Pennsylvania, General Obligation Bonds, Series 2007A, 5.000%, 6/01/34 – FGIC Insured | No Opt. Call | Aa2 | | 1,463,220 | |
| | 2,620 | | Philadelphia, Pennsylvania, General Obligation Bonds, Refunding Series 2011, 6.500%, 8/01/41 | 8/20 at 100.00 | A2 | | 2,727,734 | |
| | 4,135 | | Pine-Richland School District, Pennsylvania, General Obligation Bonds, School Improvement Series 2005, 5.000%, 7/15/35 – AGM Insured | 7/15 at 100.00 | AA+ | | 4,131,816 | |
| | 3,000 | | Pittsburgh School District, Allegheny County, Pennsylvania, General Obligation Refunding Bonds, Series 2002A, 5.500%, 9/01/15 – AGM Insured | No Opt. Call | AA+ | | 3,405,180 | |
| | 1,070 | | Schuylkill Valley School District, Berks County, Pennsylvania, General Obligation Bonds, Series 2006A, 5.000%, 4/01/22 – FGIC Insured | 4/16 at 100.00 | Aa3 | | 1,123,093 | |
| | 800 | | Scranton Parking Authority, Pennsylvania, Guaranteed Parking Revenue Bonds, Series 2004, 5.000%, 9/15/33 – FGIC Insured | 9/13 at 100.00 | BBB | | 708,864 | |
| | Principal | | | Optional Call | | | | |
| | Amount (000) | | Description (1) | Provisions (2) | Ratings (3) | | Value | |
| | | | Tax Obligation/General (continued) | | | | | |
| $ | 21,000 | | State Public School Building Authority, Pennsylvania, Lease Revenue Bonds, Philadelphia School District, Series 2003, 5.500%, 6/01/28 – AGM Insured (UB) | No Opt. Call | AAA | $ | 22,879,920 | |
| | 445 | | State Public School Building Authority, Pennsylvania, School Revenue Bonds, Conneaut School District, Series 2003, 5.250%, 11/01/21 – FGIC Insured | 11/13 at 100.00 | A | | 467,321 | |
| | 1,465 | | Stroudsburg Area School District, Monroe County, Pennsylvania, General Obligation Bonds, Series 2001A, 5.000%, 4/01/18 – AGM Insured | 4/12 at 100.00 | AA+ | | 1,512,012 | |
| | 65,645 | | Total Tax Obligation/General | | | | 64,311,234 | |
| | | | Tax Obligation/Limited – 4.4% (2.8% of Total Investments) | | | | | |
| | 2,140 | | Pennsylvania Turnpike Commission, Oil Franchise Tax Senior Lien Revenue Bonds, Series 2003A, 5.000%, 12/01/32 – NPFG Insured | 12/18 at 100.00 | AA | | 2,160,758 | |
| | 2,700 | | Philadelphia Municipal Authority, Pennsylvania, Lease Revenue Bonds, Series 2003B, 5.250%, 11/15/17 – AGM Insured | 11/13 at 100.00 | AA+ | | 2,862,027 | |
| | 3,140 | | Puerto Rico Infrastructure Financing Authority, Special Tax Revenue Bonds, Series 2005A, 0.000%, 7/01/32 – FGIC Insured | No Opt. Call | A3 | | 703,015 | |
| | 2,500 | | Puerto Rico Sales Tax Financing Corporation, Sales Tax Revenue Bonds, First Subordinate Series 2009A, 6.500%, 8/01/44 | 8/19 at 100.00 | A+ | | 2,614,900 | |
| | 1,625 | | Puerto Rico Sales Tax Financing Corporation, Sales Tax Revenue Bonds, First Subordinate Series 2010A, 5.500%, 8/01/42 | 2/20 at 100.00 | A+ | | 1,521,601 | |
| | 12,105 | | Total Tax Obligation/Limited | | | | 9,862,301 | |
| | | | Transportation – 15.3% (9.7% of Total Investments) | | | | | |
| | 630 | | Delaware River Joint Toll Bridge Commission, New Jersey and Pennsylvania, Revenue Bonds, Series 2003, 5.250%, 7/01/17 | 7/13 at 100.00 | A2 | | 673,722 | |
| | 400 | | Delaware River Port Authority, New Jersey and Pennsylvania, Revenue Bonds, Series 2010E, 5.000%, 1/01/40 | 1/20 at 100.00 | A– | | 395,168 | |
| | 2,035 | | Lehigh-Northampton Airport Authority, Pennsylvania, Airport Revenue Bonds, Lehigh Valley Airport System, Series 2000A, 6.000%, 5/15/30 – NPFG Insured (Alternative Minimum Tax) | 5/11 at 100.00 | Baa1 | | 1,947,129 | |
| | 5,400 | | Pennsylvania Economic Development Financing Authority, Revenue Bonds, Amtrak 30th Street Station Parking Garage, Series 2002, 5.800%, 6/01/23 – ACA Insured (Alternative Minimum Tax) | 6/12 at 102.00 | BBB+ | | 5,404,212 | |
| | 1,200 | | Pennsylvania Turnpike Commission, Motor License Fund-Enhanced Subordinate Special Revenue Bonds, Series 2010A, 5.000%, 12/01/38 | No Opt. Call | Aa3 | | 1,177,056 | |
| | 6,600 | | Pennsylvania Turnpike Commission, Turnpike Revenue Bonds, Capital Appreciation Series 2009E, 0.000%, 12/01/38 | 12/27 at 100.00 | A– | | 4,564,296 | |
| | 2,200 | | Pennsylvania Turnpike Commission, Turnpike Revenue Bonds, Series 2001R, 5.000%, 12/01/30 – AMBAC Insured | 12/11 at 101.00 | Aa3 | | 2,191,728 | |
| | | | Pennsylvania Turnpike Commission, Turnpike Revenue Bonds, Series 2006A: | | | | | |
| | 3,820 | | 5.000%, 12/01/22 – AMBAC Insured | 6/16 at 100.00 | Aa3 | | 4,062,341 | |
| | 2,930 | | 5.000%, 12/01/24 – AMBAC Insured | 6/16 at 100.00 | Aa3 | | 3,072,691 | |
| | 750 | | Pennsylvania Turnpike Commission, Turnpike Revenue Bonds, Subordinate Lien, Refunding Series 2009B-1, 5.000%, 12/01/37 | 12/19 at 100.00 | A– | | 697,890 | |
| | 5,000 | | Philadelphia Airport System, Pennsylvania, Revenue Bonds, Series 2001B, 5.250%, 6/15/31 – FGIC Insured (Alternative Minimum Tax) | 6/11 at 101.00 | A+ | | 4,735,150 | |
| | 3,600 | | Philadelphia Airport System, Pennsylvania, Revenue Bonds, Series 2005A, 4.750%, 6/15/35 – NPFG Insured (Alternative Minimum Tax) | 6/15 at 100.00 | A+ | | 3,080,880 | |
| | 3,000 | | Susquehanna Area Regional Airport Authority, Pennsylvania, Airport System Revenue Bonds, Subordinate Lien Series 2003D, 5.375%, 1/01/18 | 1/13 at 100.00 | Ba1 | | 2,706,360 | |
| | 37,565 | | Total Transportation | | | | 34,708,623 | |
| | | Nuveen Pennsylvania Investment Quality Municipal Fund (continued) |
| NQP | | Portfolio of Investments |
April 30, 2011
| | Principal | | | Optional Call | | | | |
| | Amount (000) | | Description (1) | Provisions (2) | Ratings (3) | | Value | |
| | | | U.S. Guaranteed – 26.8% (17.0% of Total Investments) (4) | | | | | |
| $ | 3,325 | | Delaware County Regional Water Quality Control Authority, Pennsylvania, Sewerage Revenue Bonds, Series 2001, 5.100%, 5/01/20 (Pre-refunded 11/01/11) – FGIC Insured | 11/11 at 100.00 | A1 (4) | $ | 3,406,562 | |
| | 1,400 | | Delaware County Regional Water Quality Control Authority, Pennsylvania, Sewerage Revenue Bonds, Series 2004, 5.250%, 5/01/20 (Pre-refunded 5/01/14) – NPFG Insured | 5/14 at 100.00 | A3 (4) | | 1,579,522 | |
| | 1,115 | | Erie County Hospital Authority, Pennsylvania, Revenue Bonds, Hamot Health Foundation, Series 2002, 5.250%, 11/01/15 (Pre-refunded 11/01/12) – AMBAC Insured | 11/12 at 100.00 | N/R (4) | | 1,186,193 | |
| | 5,000 | | Erie, Pennsylvania, Water Authority, Water Revenue Bonds, Series 2001A, 5.200%, 12/01/30 (Pre-refunded 12/01/11) – NPFG Insured | 12/11 at 100.00 | A3 (4) | | 5,140,350 | |
| | 6,275 | | Hempfield Area School District, Westmoreland County, Pennsylvania, General Obligation Bonds, Series 2002, 5.375%, 2/15/18 (Pre-refunded 2/15/12) – FGIC Insured | 2/12 at 100.00 | A (4) | | 6,528,008 | |
| | 1,125 | | Lehigh County General Purpose Authority, Pennsylvania, Hospital Revenue Bonds, St. Luke’s Hospital of Bethlehem, Series 2003, 5.375%, 8/15/33 (Pre-refunded 8/15/13) | 8/13 at 100.00 | AAA | | 1,244,903 | |
| | 680 | | Pennsylvania Higher Educational Facilities Authority, Revenue Bonds, Thomas Jefferson University, Series 2002, 5.000%, 1/01/20 (Pre-refunded 1/01/13) | 1/13 at 100.00 | A1 (4) | | 727,165 | |
| | 1,500 | | Pennsylvania, General Obligation Bonds, First Series 2006, 5.000%, 10/01/18 (Pre-refunded 10/01/16) | 10/16 at 100.00 | Aa1 (4) | | 1,769,400 | |
| | 500 | | Pennsylvania, General Obligation Bonds, Second Series 2005, 5.000%, 1/01/18 (Pre-refunded 1/01/16) | 1/16 at 100.00 | Aa1 (4) | | 580,020 | |
| | 10,935 | | Philadelphia Authority for Industrial Development, Pennsylvania, Lease Revenue Bonds, Series 2001B, 5.250%, 10/01/30 (Pre-refunded 10/01/11) – AGM Insured | 10/11 at 101.00 | AA+ (4) | | 11,275,516 | |
| | | | Philadelphia Authority for Industrial Development, Pennsylvania, Revenue Bonds, Franklin Towne Charter High School, Series 2006A: | | | | | |
| | 510 | | 5.250%, 1/01/27 (Pre-refunded 1/01/17) | 1/17 at 100.00 | N/R (4) | | 595,022 | |
| | 860 | | 5.375%, 1/01/32 (Pre-refunded 1/01/17) | 1/17 at 100.00 | N/R (4) | | 1,009,090 | |
| | 565 | | Philadelphia Gas Works, Pennsylvania, Revenue Bonds, Twelfth Series 1990B, 7.000%, 5/15/20 – NPFG Insured (ETM) | No Opt. Call | BBB (4) | | 691,984 | |
| | | | Philadelphia, Pennsylvania, Water and Wastewater Revenue Bonds, Series 2001A: | | | | | |
| | 5,525 | | 5.375%, 11/01/20 (Pre-refunded 11/01/12) – FGIC Insured | 11/12 at 100.00 | A1 (4) | | 5,933,850 | |
| | 3,185 | | 5.000%, 11/01/31 (Pre-refunded 11/01/12) – FGIC Insured | 11/12 at 100.00 | A1 (4) | | 3,402,790 | |
| | 6,100 | | Plum Borough School District, Allegheny County, Pennsylvania, General Obligation Bonds, Series 2001, 5.250%, 9/15/30 (Pre-refunded 9/15/11) – FGIC Insured | 9/11 at 100.00 | A+ (4) | | 6,214,985 | |
| | 1,615 | | Sayre Health Care Facility Authority, Pennsylvania, Revenue Bonds, Latrobe Area Hospital, Series 2002A, 5.250%, 7/01/13 (Pre-refunded 7/01/12) – AMBAC Insured | 7/12 at 100.00 | N/R (4) | | 1,703,260 | |
| | 960 | | St. Mary Hospital Authority, Pennsylvania, Health System Revenue Bonds, Catholic Health East, Series 2004B, 5.375%, 11/15/34 (Pre-refunded 11/15/14) | 11/14 at 100.00 | A1 (4) | | 1,095,254 | |
| | 2,835 | | Warrington Township Municipal Authority, Bucks County, Pennsylvania, Water and Sewer Revenue Bonds, Series 1991, 7.100%, 12/01/21 (Pre-refunded 11/15/15) – FGIC Insured | 11/15 at 100.00 | N/R (4) | | 3,368,405 | |
| | 2,770 | | West View Borough Municipal Authority, Allegheny County, Pennsylvania, Special Obligation Bonds, Series 1985A, 9.500%, 11/15/14 (ETM) | No Opt. Call | AAA | | 3,287,768 | |
| | 56,780 | | Total U.S. Guaranteed | | | | 60,740,047 | |
| | | | Utilities – 6.2% (4.0% of Total Investments) | | | | | |
| | 1,250 | | Allegheny County Industrial Development Authority, Pennsylvania, Pollution Control Revenue Refunding Bonds, Duquesne Light Company, Series 1999A, 4.350%, 12/01/13 – AMBAC Insured | No Opt. Call | BBB+ | | 1,309,425 | |
| | 1,430 | | Lehigh County Industrial Development Authority, Pennsylvania, Pollution Control Revenue Bonds, Pennsylvania Power and Light Company, Series 2005, 4.750%, 2/15/27 – FGIC Insured | 2/15 at 100.00 | BBB+ | | 1,314,113 | |
| | 700 | | Philadelphia Gas Works, Pennsylvania, Revenue Bonds, General Ordinance, Fifth Series 2004A-1, 5.000%, 9/01/26 – AGM Insured | 9/14 at 100.00 | AA+ | | 706,265 | |
| | 2,000 | | Philadelphia Gas Works, Pennsylvania, Revenue Bonds, General Ordinance, Seventeenth Series 2003, 5.375%, 7/01/19 – AGM Insured | 7/13 at 100.00 | AA+ | | 2,092,040 | |
| | Principal | | | Optional Call | | | | |
| | Amount (000) | | Description (1) | Provisions (2) | Ratings (3) | | Value | |
| | | | Utilities (continued) | | | | | |
| $ | 5,490 | | Philadelphia Gas Works, Pennsylvania, Revenue Bonds, Seventh Series, 2007, 5.000%, 10/01/37 – AMBAC Insured | 10/17 at 100.00 | BBB+ | $ | 4,937,212 | |
| | 3,700 | | York County Industrial Development Authority, Pennsylvania, Pollution Control Revenue Refunding Bonds, PSEG Power Project, Series 2001A, 5.500%, 9/01/20 | 3/12 at 101.00 | Baa1 | | 3,758,793 | |
| | 14,570 | | Total Utilities | | | | 14,117,848 | |
| | | | Water and Sewer – 7.7% (4.9% of Total Investments) | | | | | |
| | 2,100 | | Allegheny County Sanitary Authority, Pennsylvania, Sewerage Revenue Bonds, Series 2005A, 5.000%, 12/01/21 – NPFG Insured | 12/15 at 100.00 | A1 | | 2,202,060 | |
| | 2,205 | | Bethlehem Authority, Northampton and Lehigh Counties, Pennsylvania, Guaranteed Water Revenue Bonds, Series 2004, 5.000%, 11/15/20 – AGM Insured | 11/14 at 100.00 | AA+ | | 2,266,430 | |
| | 5,000 | | Delaware County Industrial Development Authority, Pennsylvania, Water Facilities Revenue Bonds, Philadelphia Water Company, Series 2001, 5.350%, 10/01/31 – AMBAC Insured (Alternative Minimum Tax) | 10/12 at 100.00 | AA– | | 5,004,150 | |
| | 2,000 | | Harrisburg Authority, Dauphin County, Pennsylvania, Water Revenue Refunding Bonds, Series 2004, 5.000%, 7/15/22 – AGM Insured | 7/14 at 100.00 | AA+ | | 1,830,639 | |
| | 1,600 | | Luzerne County Industrial Development Authority, Pennsylvania, Water Facility Revenue Refunding Bonds, Pennsylvania-American Water Company, Series 2009, 5.500%, 12/01/39 | 12/19 at 100.00 | A | | 1,563,855 | |
| | 500 | | Pennsylvania Economic Development Financing Authority, Sewage Sludge Disposal Revenue Bonds, Philadelphia Biosolids Facility Project, Series 2009, 6.250%, 1/01/32 | 1/20 at 100.00 | Baa3 | | 504,604 | |
| | 1,815 | | Philadelphia, Pennsylvania, Water and Wastewater Revenue Bonds, Series 2001A, 5.000%, 11/01/31 – FGIC Insured | 11/12 at 100.00 | A1 | | 1,815,000 | |
| | 2,150 | | Philadelphia, Pennsylvania, Water and Wastewater Revenue Bonds, Series 2005A, 5.000%, 7/01/23 – AGM Insured | 7/15 at 100.00 | AA+ | | 2,225,486 | |
| | 17,370 | | Total Water and Sewer | | | | 17,412,224 | |
| $ | 366,913 | | Total Investments (cost $359,425,221) – 157.3% | | | | 356,951,589 | |
| | | | Floating Rate Obligations – (11.8)% | | | | (26,715,000 | ) |
| | | | Variable Rate Demand Preferred Shares, at Liquidation Value – (49.6)% (5) | | | | (112,500,000 | ) |
| | | | Other Assets Less Liabilities – 4.1% | | | | 9,168,504 | |
| | | | Net Assets Applicable to Common Shares – 100% | | | $ | 226,905,093 | |
| (1) | | All percentages shown in the Portfolio of Investments are based on net assets applicable to Common shares unless otherwise noted. |
| (2) | | Optional Call Provisions (not covered by the report of independent registered public accounting firm): Dates (month and year) and prices of the earliest optional call or redemption. There may be other call provisions at varying prices at later dates. Certain mortgage-backed securities may be subject to periodic principal paydowns. |
| (3) | | Ratings (not covered by the report of independent registered public accounting firm): Using the highest of Standard & Poor’s Group (“Standard & Poor’s”), Moody’s Investor Service, Inc. (“Moody’s”) or Fitch, Inc. (“Fitch”) rating. Ratings below BBB by Standard & Poor’s, Baa by Moody’s or BBB by Fitch are considered to be below investment grade. Holdings designated N/R are not rated by any of these national rating agencies. |
| (4) | | Backed by an escrow or trust containing sufficient U.S. Government or U.S. Government agency securities, which ensure the timely payment of principal and interest. Such investments are normally considered to be equivalent to AAA rated securities. |
| (5) | | Variable Rate Demand Preferred Shares, at Liquidation Value as a percentage of Total Investments is 31.5%. |
| N/R | | Not rated. |
| WI/DD | | Purchased on a when-issued or delayed delivery basis. |
| (ETM) | | Escrowed to maturity. |
| (IF) | | Inverse floating rate investment. |
| (UB) | | Underlying bond of an inverse floating rate trust reflected as a financing transaction. See Notes to Financial Statements, Footnote 1 – General Information and Significant Accounting Policies, Inverse Floating Rate Securities for more information. |
See accompanying notes to financial statements.
| | | Nuveen Pennsylvania Premium Income Municipal Fund 2 |
| NPY | | Portfolio of Investments |
April 30, 2011
| | Principal | | | Optional Call | | | | |
| | Amount (000) | | Description (1) | Provisions (2) | Ratings (3) | | Value | |
| | | | Education and Civic Organizations – 25.4% (17.3% of Total Investments) | | | | | |
| $ | 200 | | Allegheny County Higher Education Building Authority, Pennsylvania, College Revenue Refunding Bonds, Robert Morris College, Series 1998A, 6.000%, 5/01/28 | No Opt. Call | Baa3 | $ | 193,994 | |
| | 1,245 | | Allegheny County Higher Education Building Authority, Pennsylvania, Revenue Bonds, Duquesne University, Series 2004A, 5.000%, 3/01/19 – FGIC Insured | 3/14 at 100.00 | A– | | 1,313,624 | |
| | 1,140 | | Allegheny County Higher Education Building Authority, Pennsylvania, Revenue Bonds, Robert Morris University, Series 2006A, 4.750%, 2/15/26 | 2/16 at 100.00 | Baa3 | | 982,315 | |
| | | | Delaware County Authority, Pennsylvania, Revenue Bonds, Villanova University, Series 2006: | | | | | |
| | 1,565 | | 5.000%, 8/01/23 – AMBAC Insured | 8/16 at 100.00 | A+ | | 1,641,294 | |
| | 770 | | 5.000%, 8/01/24 – AMBAC Insured | 8/16 at 100.00 | A+ | | 802,379 | |
| | | | Delaware County Authority, Pennsylvania, Revenue Refunding Bonds, Villanova University, Series 2003: | | | | | |
| | 1,705 | | 5.250%, 8/01/19 – FGIC Insured | 8/13 at 100.00 | A1 | | 1,816,814 | |
| | 1,350 | | 5.250%, 8/01/20 – FGIC Insured | 8/13 at 100.00 | A1 | | 1,435,185 | |
| | 1,000 | | 5.250%, 8/01/21 – FGIC Insured | 8/13 at 100.00 | A1 | | 1,046,600 | |
| | | | Erie Higher Education Building Authority, Pennsylvania, College Revenue Bonds, Gannon University, Series 2007-GG3: | | | | | |
| | 725 | | 5.000%, 5/01/32 – RAAI Insured | 5/17 at 100.00 | N/R | | 619,049 | |
| | 250 | | 5.000%, 5/01/35 – RAAI Insured | 5/17 at 100.00 | N/R | | 207,100 | |
| | 3,060 | | Indiana County Industrial Development Authority, Pennsylvania, Revenue Bonds, Student Cooperative Association Inc./Indiana University of Pennsylvania – Student Union Project, Series 2004, 5.000%, 11/01/24 – AMBAC Insured | 11/14 at 100.00 | N/R | | 2,676,490 | |
| | 1,575 | | Montgomery County Higher Education and Health Authority, Pennsylvania, Revenue Bonds, Arcadia University, Series 2006, 4.500%, 4/01/30 – RAAI Insured | 4/16 at 100.00 | BBB+ | | 1,282,113 | |
| | 855 | | Montgomery County Higher Education and Health Authority, Pennsylvania, Revenue Bonds, Arcadia University, Series 2010, 5.625%, 4/01/40 | 4/20 at 100.00 | BBB+ | | 821,373 | |
| | 325 | | New Wilmington, Pennsylvania, Revenue, Westminster College, Series 2007G, 5.125%, 5/01/33 – RAAI Insured | 5/17 at 100.00 | N/R | | 284,408 | |
| | 4,085 | | Pennsylvania Higher Educational Facilities Authority, General Revenue Bonds, State System of Higher Education, Series 2002W, 5.000%, 6/15/19 – AMBAC Insured | 6/12 at 100.00 | Aa2 | | 4,232,632 | |
| | 4,200 | | Pennsylvania Higher Educational Facilities Authority, General Revenue Bonds, State System of Higher Education, Series 2008AH, 5.000%, 6/15/33 | 6/18 at 100.00 | Aa2 | | 4,252,500 | |
| | 1,285 | | Pennsylvania Higher Educational Facilities Authority, Revenue Bonds, Allegheny College, Series 2006, 4.750%, 5/01/31 | 5/16 at 100.00 | A– | | 1,210,560 | |
| | 2,420 | | Pennsylvania Higher Educational Facilities Authority, Revenue Bonds, Drexel University, Series 2007A, 5.000%, 5/01/37 – NPFG Insured | 11/17 at 100.00 | A | | 2,263,160 | |
| | 3,000 | | Pennsylvania Higher Educational Facilities Authority, Revenue Bonds, Temple University, First Series of 2006, 5.000%, 4/01/21 – NPFG Insured | 4/16 at 100.00 | Aa3 | | 3,231,720 | |
| | 1,845 | | Pennsylvania Higher Educational Facilities Authority, Revenue Bonds, Thomas Jefferson University, Series 2002, 5.000%, 1/01/32 | 1/13 at 100.00 | A1 | | 1,826,107 | |
| | 1,000 | | Pennsylvania Higher Educational Facilities Authority, Revenue Bonds, Thomas Jefferson University, Series 2010, 5.000%, 3/01/40 | 3/20 at 100.00 | AA– | | 954,430 | |
| | 2,000 | | Pennsylvania Higher Educational Facilities Authority, Revenue Bonds, University of Pennsylvania, Series 2005C, 5.000%, 7/15/38 | 7/15 at 100.00 | AA+ | | 2,020,640 | |
| | 1,310 | | Pennsylvania Higher Educational Facilities Authority, Revenue Bonds, Ursinus College, Series 2003, 5.500%, 1/01/24 – RAAI Insured | 7/13 at 100.00 | A– | | 1,327,397 | |
| | 800 | | Pennsylvania Higher Educational Facilities Authority, Revenue Bonds, York College Project, Series 2005EE1, 5.250%, 11/01/27 – SYNCORA GTY Insured | 11/15 at 100.00 | A | | 814,752 | |
| | 1,000 | | Pennsylvania Higher Educational Facilities Authority, University of the Sciences in Philadelphia Revenue Bonds, Series 2005, 4.750%, 11/01/33 – SYNCORA GTY Insured | 5/15 at 100.00 | A3 | | 949,610 | |
| | 2,000 | | Pennsylvania State University, General Revenue Bonds, Series 2010, 5.000%, 3/01/35 | 3/20 at 100.00 | Aa1 | | 2,050,860 | |
| | Principal | | | Optional Call | | | | |
| | Amount (000) | | Description (1) | Provisions (2) | Ratings (3) | | Value | |
| | | | Education and Civic Organizations (continued) | | | | | |
| $ | 10,600 | | Pennsylvania State University, General Revenue Bonds, Series 2007A, 4.500%, 8/15/36 (UB) | 8/16 at 100.00 | Aa1 | $ | 10,010,322 | |
| | 530 | | Philadelphia Authority for Industrial Development, Pennsylvania, Revenue Bonds, MaST Charter School Project, Series 2010, 6.000%, 8/01/35 | 8/20 at 100.00 | BBB+ | | 507,136 | |
| | 1,545 | | State Public School Building Authority, Pennsylvania, College Revenue Bonds, Montgomery County Community College, Series 2005, 5.000%, 5/01/18 – AMBAC Insured | 5/15 at 100.00 | Aa2 | | 1,690,060 | |
| | 750 | | Union County, Higher Education Facilities Financing Authority, Pennsylvania, Revenue Bonds, Bucknell University, Series 2002A, 5.250%, 4/01/19 | 4/13 at 100.00 | Aa2 | | 803,768 | |
| | 300 | | Wilkes-Barre Finance Authority, Pennsylvania, Revenue Bonds, University of Scranton, Series 2010, 5.000%, 11/01/40 | 11/20 at 100.00 | A | | 278,226 | |
| | 54,435 | | Total Education and Civic Organizations | | | | 53,546,618 | |
| | | | Health Care – 19.4% (13.2% of Total Investments) | | | | | |
| | | | Allegheny County Hospital Development Authority, Pennsylvania, Revenue Bonds, Ohio Valley General Hospital, Series 2005A: | | | | | |
| | 1,150 | | 5.000%, 4/01/25 | 4/15 at 100.00 | Ba2 | | 970,106 | |
| | 1,455 | | 5.125%, 4/01/35 | 4/15 at 100.00 | Ba2 | | 1,111,445 | |
| | 1,640 | | Centre County Hospital Authority, Pennsylvania, Hospital Revenue Bonds, Mount Nittany Medical Center Project, Series 2011, 7.000%, 11/15/46 (WI/DD, Settling 5/05/11) | 11/21 at 100.00 | A– | | 1,719,425 | |
| | 1,200 | | Erie County Hospital Authority, Pennsylvania, Hospital Revenue Bonds, Saint Vincent Health Center Project, Series 2010A, 7.000%, 7/01/27 | 7/20 at 100.00 | Baa3 | | 1,181,616 | |
| | 395 | | Erie County Hospital Authority, Pennsylvania, Revenue Bonds, Hamot Health Foundation, Series 2007, 5.000%, 11/01/37 – CIFG Insured | 11/17 at 100.00 | Aa3 | | 355,935 | |
| | 835 | | Franklin County Industrial Development Authority, Pennsylvania, Revenue Bonds, Chambersburg Hospital Project, Series 2010, 5.375%, 7/01/42 | No Opt. Call | A2 | | 769,419 | |
| | 1,885 | | Lancaster County Hospital Authority, Pennsylvania, Hospital Revenue Bonds, The Lancaster General Hospital Project, Series 2007A, 5.000%, 3/15/26 | 3/17 at 100.00 | AA– | | 1,899,213 | |
| | 5,000 | | Lebanon County Health Facilities Authority, Pennsylvania, Revenue Bonds, Good Samaritan Hospital Project, Series 2002, 5.900%, 11/15/28 | 11/12 at 101.00 | BB+ | | 4,252,100 | |
| | 2,990 | | Lehigh County General Purpose Authority, Pennsylvania, Hospital Revenue Bonds, Lehigh Valley Health Network, Series 2008A, 5.000%, 7/01/33 – AGM Insured | 7/18 at 100.00 | AA+ | | 2,856,706 | |
| | 1,250 | | Lehigh County General Purpose Authority, Pennsylvania, Revenue Bonds, Good Shepherd Group, Series 2004A, 5.500%, 11/01/24 | 11/14 at 100.00 | A | | 1,266,188 | |
| | 4,505 | | Lehigh County General Purpose Authority, Pennsylvania, Revenue Bonds, Good Shepherd Group, Series 2007, 5.000%, 11/01/30 – AGC Insured | 11/17 at 100.00 | AA+ | | 4,524,822 | |
| | 2,500 | | Lycoming County Athority, Pennsylvania, Health System Revenue Bonds, Susquehanna Health System Project, Series 2009, 5.500%, 7/01/28 | 7/19 at 100.00 | BBB+ | | 2,333,925 | |
| | 650 | | Monroe County Hospital Authority, Pennsylvania, Hospital Revenue Bonds, Pocono Medical Center, Series 2007, 5.125%, 1/01/37 | 1/17 at 100.00 | A– | | 578,266 | |
| | 2,000 | | Montgomery County Higher Education and Health Authority, Pennsylvania, Hospital Revenue Bonds, Abington Memorial Hospital, Series 2002A, 5.000%, 6/01/22 | 6/12 at 101.00 | A | | 2,015,080 | |
| | 565 | | Montgomery County Industrial Development Authority, Pennsylvania, FHA Insured Mortgage Revenue Bonds, New Regional Medical Center Project, Series 2010, 5.375%, 8/01/38 | 8/20 at 100.00 | AA | | 568,430 | |
| | | | Northampton County General Purpose Authority, Pennsylvania, Hospital Revenue Bonds, Saint Lukes Hospital Project, Series 2008A: | | | | | |
| | 1,235 | | 5.250%, 8/15/23 | 8/18 at 100.00 | A3 | | 1,207,460 | |
| | 1,000 | | 5.500%, 8/15/35 | 8/18 at 100.00 | A3 | | 889,710 | |
| | 150 | | Pennsylvania Economic Development Financing Authority, Health System Revenue Bonds , Albert Einstein Healthcare, Series 2009A, 6.250%, 10/15/23 | No Opt. Call | Baa1 | | 154,773 | |
| | 3,575 | | Philadelphia Hospitals and Higher Education Facilities Authority, Pennsylvania, Health System Revenue Bonds, Jefferson Health System, Series 2010B, 5.000%, 5/15/40 | 5/20 at 100.00 | AA | | 3,312,238 | |
| | | | Pottsville Hospital Authority, Pennsylvania, Hospital Revenue Bonds, Pottsville Hospital and Warne Clinic, Series 1998: | | | | | |
| | 2,000 | | 5.500%, 7/01/18 | 7/11 at 100.00 | N/R | | 1,858,420 | |
| | 2,000 | | 5.625%, 7/01/24 | 7/11 at 100.00 | N/R | | 1,707,560 | |
| | | Nuveen Pennsylvania Premium Income Municipal Fund 2 (continued) |
| NPY | | Portfolio of Investments |
April 30, 2011
| | Principal | | | Optional Call | | | | |
| | Amount (000) | | Description (1) | Provisions (2) | Ratings (3) | | Value | |
| | | | Health Care (continued) | | | | | |
| | | | Southcentral Pennsylvania General Authority, Revenue Bonds, Hanover Hospital Inc., Series 2005: | | | | | |
| $ | 475 | | 5.000%, 12/01/27 – RAAI Insured | 12/15 at 100.00 | BBB– | $ | 402,434 | |
| | 330 | | 5.000%, 12/01/29 – RAAI Insured | 12/15 at 100.00 | BBB– | | 275,144 | |
| | | | Union County Hospital Authority, Pennsylvania, Hospital Revenue Bonds, Evangelical Community Hospital Project, Refunding and Improvement Series 2011: | | | | | |
| | 1,365 | | 6.875%, 8/01/31 | No Opt. Call | BBB+ | | 1,369,286 | |
| | 1,135 | | 7.000%, 8/01/41 | No Opt. Call | BBB+ | | 1,124,967 | |
| | 1,720 | | West Shore Area Hospital Authority, Cumberland County, Pennsylvania, Hospital Revenue Bonds, Holy Spirit Hospital of the Sisters of Christian Charity Project, Series 2011, 6.500%, 1/01/36 | 1/21 at 100.00 | BBB+ | | 1,696,918 | |
| | 575 | | Westmoreland County Industrial Development Authority, Pennsylvania, Health System Revenue Bonds, Excela Health Project, Series 2010A, 5.125%, 7/01/30 | 7/20 at 100.00 | A3 | | 543,743 | |
| | 43,580 | | Total Health Care | | | | 40,945,329 | |
| | | | Housing/Multifamily – 3.9% (2.6% of Total Investments) | | | | | |
| | 2,000 | | Delaware County Industrial Development Authority, Pennsylvania, Multifamily Housing Revenue Bonds, Darby Townhouses Project, Series 2002A, 5.500%, 4/01/32 (Mandatory put 4/01/22) (Alternative Minimum Tax) | 4/12 at 100.00 | AAA | | 2,015,640 | |
| | 750 | | Pennsylvania Higher Educational Facilities Authority, Revenue Bonds, Edinboro University Foundation Student Housing Project, Series 2010, 6.000%, 7/01/43 | No Opt. Call | BBB– | | 706,313 | |
| | | | Pennsylvania Higher Educational Facilities Authority, Revenue Bonds, Slippery Rock University Foundation Inc., Student Housing Project, Series 2005A: | | | | | |
| | 2,035 | | 5.000%, 7/01/19 – SYNCORA GTY Insured | 7/15 at 100.00 | BBB+ | | 2,053,926 | |
| | 3,400 | | 5.000%, 7/01/37 – SYNCORA GTY Insured | 7/15 at 100.00 | BBB+ | | 2,847,874 | |
| | 740 | | Philadelphia Authority for Industrial Development, Pennsylvania, Multifamily Housing Revenue Bonds, Presbyterian Homes Germantown – Morrisville Project, Series 2005A, 5.625%, 7/01/35 | 5/15 at 102.00 | Baa3 | | 611,706 | |
| | 8,925 | | Total Housing/Multifamily | | | | 8,235,459 | |
| | | | Housing/Single Family – 6.4% (4.4% of Total Investments) | | | | | |
| | 860 | | Pennsylvania Housing Finance Agency, Single Family Mortgage Revenue Bonds, Series 2006-93A, 4.950%, 10/01/26 (Alternative Minimum Tax) (UB) | 4/15 at 100.00 | AA+ | | 840,203 | |
| | 2,865 | | Pennsylvania Housing Finance Agency, Single Family Mortgage Revenue Bonds, Series 2006-94A, 5.150%, 10/01/37 (Alternative Minimum Tax) (UB) | 10/15 at 100.00 | AA+ | | 2,737,536 | |
| | 3,930 | | Pennsylvania Housing Finance Agency, Single Family Mortgage Revenue Bonds, Series 2006-95A, 4.900%, 10/01/37 (Alternative Minimum Tax) (UB) | 10/15 at 100.00 | AA+ | | 3,686,458 | |
| | 1,355 | | Pennsylvania Housing Finance Agency, Single Family Mortgage Revenue Bonds, Series 2007-97A, 4.600%, 10/01/27 (Alternative Minimum Tax) (UB) | 10/16 at 100.00 | AA+ | | 1,347,697 | |
| | 1,510 | | Pennsylvania Housing Finance Agency, Single Family Mortgage Revenue Bonds, Series 2007-98A, 4.850%, 10/01/31 (Alternative Minimum Tax) (UB) | 10/16 at 100.00 | AA+ | | 1,393,896 | |
| | 355 | | Pennsylvania Housing Finance Agency, Single Family Mortgage Revenue Bonds, Series 2008-103-C, 5.200%, 10/01/28 | 10/17 at 100.00 | AA+ | | 358,923 | |
| | 2,400 | | Pennsylvania Housing Finance Agency, Single Family Mortgage Revenue Bonds, Series 2011-112, 5.000%, 10/01/25 | 10/20 at 100.00 | AA+ | | 2,435,952 | |
| | 765 | | Pittsburgh Urban Redevelopment Authority, Pennsylvania, Mortgage Revenue Bonds, Series 1997A, 6.200%, 10/01/21 (Alternative Minimum Tax) | 10/11 at 100.00 | Aa1 | | 765,964 | |
| | 14,040 | | Total Housing/Single Family | | | | 13,566,629 | |
| | | | Industrials – 2.3% (1.6% of Total Investments) | | | | | |
| | 2,000 | | Pennsylvania Economic Development Financing Authority, Exempt Facilities Revenue Bonds, Amtrak Project, Series 2001A, 6.250%, 11/01/31 (Alternative Minimum Tax) | 11/11 at 101.00 | A1 | | 2,005,580 | |
| | 2,750 | | Pennsylvania Industrial Development Authority, Economic Development Revenue Bonds, Series 2002, 5.500%, 7/01/17 – AMBAC Insured | 7/12 at 101.00 | A1 | | 2,866,930 | |
| | 4,750 | | Total Industrials | | | | 4,872,510 | |
| | Principal | | | Optional Call | | | | |
| | Amount (000) | | Description (1) | Provisions (2) | Ratings (3) | | Value | |
| | | | Long-Term Care – 5.9% (4.0% of Total Investments) | | | | | |
| $ | 1,500 | | Cumberland County Municipal Authority Revenue Bonds, Pennsylvania, Diakon Lutheran Social Ministries Project, Series 2009, 6.375%, 1/01/39 | 1/19 at 100.00 | N/R | $ | 1,468,365 | |
| | 4,905 | | Cumberland County Municipal Authority, Pennsylvania, Revenue Bonds, Diakon Lutheran Social Ministries, Series 2007, 5.000%, 1/01/36 | 1/17 at 100.00 | N/R | | 3,995,907 | |
| | 1,000 | | Cumberland County Municipal Authority, Pennsylvania, Revenue Bonds, Presbyterian Homes Inc., Series 2003A, 5.000%, 12/01/22 – RAAI Insured | 12/12 at 100.00 | BBB+ | | 957,930 | |
| | 500 | | Delaware County Authority, Pennsylvania, Revenue Bonds, Elwyn, Inc. Project, Series 2010, 5.000%, 6/01/21 | 6/17 at 100.00 | BBB | | 493,360 | |
| | | | Lancaster County Hospital Authority, Pennsylvania, Health Center Revenue Bonds, Masonic Homes Project, Series 2006: | | | | | |
| | 1,565 | | 5.000%, 11/01/31 | 11/16 at 100.00 | A | | 1,456,749 | |
| | 230 | | 5.000%, 11/01/36 | 11/16 at 100.00 | A | | 207,633 | |
| | | | Pennsylvania Economic Development Financing Authority, Revenue Bonds, Dr. Gertrude A. Barber Center Inc., Series 2000: | | | | | |
| | 1,000 | | 6.150%, 12/01/20 – RAAI Insured | 8/11 at 100.00 | BBB | | 1,001,050 | |
| | 2,000 | | 5.900%, 12/01/30 – RAAI Insured | 6/11 at 100.00 | BBB | | 1,893,360 | |
| | 1,230 | | Pennsylvania Economic Development Financing Authority, Revenue Bonds, Northwestern Human Services Inc., Series 1998A, 5.250%, 6/01/28 | 6/11 at 100.00 | BB | | 925,673 | |
| | 13,930 | | Total Long-Term Care | | | | 12,400,027 | |
| | | | Materials – 2.3% (1.6% of Total Investments) | | | | | |
| | 1,190 | | Bradford County Industrial Development Authority, Pennsylvania, Solid Waste Disposal Revenue Bonds, International Paper Company, Series 2005B, 5.200%, 12/01/19 (Alternative Minimum Tax) | 12/15 at 100.00 | BBB | | 1,190,226 | |
| | 4,500 | | Pennsylvania Economic Development Financing Authority, Exempt Facilities Revenue Bonds, National Gypsum Company, Series 1997B, 6.125%, 11/01/27 (Alternative Minimum Tax) | 11/11 at 100.00 | N/R | | 3,646,080 | |
| | 5,690 | | Total Materials | | | | 4,836,306 | |
| | | | Tax Obligation/General – 16.8% (11.4% of Total Investments) | | | | | |
| | 3,000 | | Bethel Park School District, Allegheny County, Pennsylvania, General Obligation Bonds, Series 2009, 5.000%, 8/01/29 | 8/19 at 100.00 | Aa2 | | 3,160,440 | |
| | | | Harrisburg Redevelopment Authority, Dauphin County, Pennsylvania, Guaranteed Revenue Bonds, Series 1998B: | | | | | |
| | 1,750 | | 0.000%, 5/01/22 – AGM Insured | 5/16 at 75.56 | AA+ | | 860,703 | |
| | 2,750 | | 0.000%, 11/01/22 – AGM Insured | 5/16 at 73.64 | AA+ | | 1,306,690 | |
| | 2,750 | | 0.000%, 5/01/23 – AGM Insured | 5/16 at 71.71 | AA+ | | 1,246,575 | |
| | 260 | | Lower Merion School District, Montgomery County, Pennsylvania, General Obligation Bonds, Series 2007, 5.000%, 9/01/23 | 9/17 at 100.00 | Aaa | | 285,990 | |
| | 2,115 | | Owen J. Roberts School District, Chester County, Pennsylvania, General Obligation Bonds, Series 2006, 5.000%, 5/15/24 – AGM Insured | 5/16 at 100.00 | Aa2 | | 2,266,878 | |
| | 4,835 | | Pennsylvania State, General Obligation Bonds, Series 2007, Residuals 1986, 12.519%, 3/01/15 (IF) | No Opt. Call | Aa1 | | 5,308,008 | |
| | 1,500 | | Philadelphia School District, Pennsylvania, General Obligation Bonds, Series 2007A, 5.000%, 6/01/34 – FGIC Insured | No Opt. Call | Aa2 | | 1,463,220 | |
| | 3,775 | | Pine-Richland School District, Pennsylvania, General Obligation Bonds, School Improvement Series 2005, 5.000%, 7/15/35 – AGM Insured | 7/15 at 100.00 | AA+ | | 3,772,093 | |
| | 2,700 | | Pittsburgh, Pennsylvania, General Obligation Bonds, Series 2006B, 5.250%, 9/01/16 – AGM Insured | No Opt. Call | AA+ | | 2,983,500 | |
| | 6,710 | | Reading School District, Berks County, Pennsylvania, General Obligation Bonds, Series 2003B, 0.000%, 1/15/32 – FGIC Insured | No Opt. Call | A | | 1,985,422 | |
| | 2,250 | | Scranton Parking Authority, Pennsylvania , Guaranteed Revenue Bonds, Series 2007, 5.250%, 6/01/39 – RAAI Insured | 6/17 at 100.00 | N/R | | 1,865,385 | |
| | 940 | | Scranton Parking Authority, Pennsylvania, Guaranteed Parking Revenue Bonds, Series 2004, 5.000%, 9/15/33 – FGIC Insured | 9/13 at 100.00 | BBB | | 832,915 | |
| | | | State Public School Building Authority, Pennsylvania, School Revenue Bonds, Conneaut School District, Series 2003: | | | | | |
| | 360 | | 5.250%, 11/01/21 – FGIC Insured | 11/13 at 100.00 | A | | 378,058 | |
| | 490 | | 5.250%, 11/01/22 – FGIC Insured | 11/13 at 100.00 | A | | 512,770 | |
| | | Nuveen Pennsylvania Premium Income Municipal Fund 2 (continued) |
| NPY | | Portfolio of Investments |
April 30, 2011
| | Principal | | | Optional Call | | | | |
| | Amount (000) | | Description (1) | Provisions (2) | Ratings (3) | | Value | |
| | | | Tax Obligation/General (continued) | | | | | |
| $ | 1,500 | | State Public School Building Authority, Pennsylvania, School Revenue Bonds, York City School District, Series 2003, 4.000%, 5/01/21 – AGM Insured | 5/13 at 100.00 | Aa3 | $ | 1,513,680 | |
| | 1,535 | | Stroudsburg Area School District, Monroe County, Pennsylvania, General Obligation Bonds, Series 2001A, 5.000%, 4/01/19 – AGM Insured | 4/12 at 100.00 | AA+ | | 1,584,258 | |
| | 1,400 | | Woodland Hills School District, Allegheny County, Pennsylvania, General Obligation Bonds, Series 2005D, 5.000%, 9/01/17 – AGM Insured | 9/15 at 100.00 | AA+ | | 1,566,264 | |
| | 2,400 | | York County, Pennsylvania, General Obligation Bonds, Series 2006, 5.000%, 6/01/33 – NPFG Insured | 12/15 at 100.00 | AA | | 2,423,880 | |
| | 43,020 | | Total Tax Obligation/General | | | | 35,316,729 | |
| | | | Tax Obligation/Limited – 8.4% (5.7% of Total Investments) | | | | | |
| | 1,500 | | Erie County Convention Center Authority, Pennsylvania, Convention Center Revenue Bonds, Series 2005, 5.000%, 1/15/36 – FGIC Insured | 1/15 at 100.00 | AA– | | 1,444,290 | |
| | 1,950 | | Pennsylvania Turnpike Commission, Oil Franchise Tax Senior Lien Revenue Bonds, Series 2003A, 5.000%, 12/01/32 – NPFG Insured | 12/18 at 100.00 | AA | | 1,968,915 | |
| | 5,015 | | Philadelphia Municipal Authority, Pennsylvania, Lease Revenue Bonds, Series 2003B, 5.250%, 11/15/17 – AGM Insured | 11/13 at 100.00 | AA+ | | 5,315,950 | |
| | 6,000 | | Puerto Rico Highway and Transportation Authority, Highway Revenue Bonds, Series 2007N, 5.500%, 7/01/29 – AMBAC Insured | No Opt. Call | A3 | | 5,858,160 | |
| | 2,880 | | Puerto Rico Infrastructure Financing Authority, Special Tax Revenue Bonds, Series 2005A, 0.000%, 7/01/32 – FGIC Insured | No Opt. Call | A3 | | 644,803 | |
| | 2,405 | | Puerto Rico, Highway Revenue Bonds, Highway and Transportation Authority, Series 2003AA, 5.500%, 7/01/19 – NPFG Insured | No Opt. Call | A2 | | 2,521,667 | |
| | 19,750 | | Total Tax Obligation/Limited | | | | 17,753,785 | |
| | | | Transportation – 20.1% (13.7% of Total Investments) | | | | | |
| | 650 | | Delaware River Joint Toll Bridge Commission, New Jersey and Pennsylvania, Revenue Bonds, Series 2003, 5.250%, 7/01/17 | 7/13 at 100.00 | A2 | | 695,110 | |
| | 1,480 | | Delaware River Port Authority, New Jersey and Pennsylvania, Revenue Bonds, Series 2010E, 5.000%, 1/01/40 | 1/20 at 100.00 | A– | | 1,462,122 | |
| | 4,600 | | Pennsylvania Economic Development Financing Authority, Revenue Bonds, Amtrak 30th Street Station Parking Garage, Series 2002, 5.875%, 6/01/33 – ACA Insured (Alternative Minimum Tax) | 6/12 at 102.00 | BBB+ | | 4,383,984 | |
| | 2,200 | | Pennsylvania Turnpike Commission, Motor License Fund-Enhanced Subordinate Special Revenue Bonds, Series 2010A, 5.000%, 12/01/38 | No Opt. Call | Aa3 | | 2,157,936 | |
| | 5,500 | | Pennsylvania Turnpike Commission, Turnpike Revenue Bonds, Capital Appreciation Series 2009E, 0.000%, 12/01/38 | 12/27 at 100.00 | A– | | 3,803,580 | |
| | 3,575 | | Pennsylvania Turnpike Commission, Turnpike Revenue Bonds, Series 2001R, 5.000%, 12/01/30 – AMBAC Insured | 12/11 at 101.00 | Aa3 | | 3,561,558 | |
| | 2,680 | | Pennsylvania Turnpike Commission, Turnpike Revenue Bonds, Series 2006A, 5.000%, 12/01/24 – AMBAC Insured | 6/16 at 100.00 | Aa3 | | 2,810,516 | |
| | 1,400 | | Pennsylvania Turnpike Commission, Turnpike Revenue Bonds, Subordinate Lien, Refunding Series 2009B-1, 5.000%, 12/01/37 | 12/19 at 100.00 | A– | | 1,302,728 | |
| | 3,250 | | Philadelphia Airport System, Pennsylvania, Revenue Bonds, Series 2005A, 4.750%, 6/15/35 – NPFG Insured (Alternative Minimum Tax) | 6/15 at 100.00 | A+ | | 2,781,350 | |
| | 12,500 | | Philadelphia Authority for Industrial Development, Pennsylvania, Airport Revenue Bonds, Philadelphia Airport System Project, Series 2001A, 5.250%, 7/01/28 – FGIC Insured (Alternative Minimum Tax) | 7/11 at 101.00 | A+ | | 11,973,875 | |
| | 2,000 | | Pittsburgh Public Parking Authority, Pennsylvania, Parking Revenue Bonds, Series 2005B, 5.000%, 12/01/23 – FGIC Insured | 12/15 at 100.00 | BBB | | 1,998,420 | |
| | 6,700 | | Susquehanna Area Regional Airport Authority, Pennsylvania, Airport System Revenue Bonds, Series 2003B, 5.000%, 1/01/33 – AMBAC Insured | 1/13 at 100.00 | Baa3 | | 5,449,579 | |
| | 46,535 | | Total Transportation | | | | 42,380,758 | |
| | Principal | | | Optional Call | | | | |
| | Amount (000) | | Description (1) | Provisions (2) | Ratings (3) | | Value | |
| | | | U.S. Guaranteed – 19.7% (13.4% of Total Investments) (4) | | | | | |
| $ | 1,200 | | Butler County, Pennsylvania, General Obligation Bonds, Series 2003, 5.250%, 7/15/23 (Pre-refunded 7/15/13) – FGIC Insured | 7/13 at 100.00 | A+ (4) | $ | 1,322,340 | |
| | 1,615 | | Delaware County Regional Water Quality Control Authority, Pennsylvania, Sewerage Revenue Bonds, Series 2004, 5.250%, 5/01/23 (Pre-refunded 5/01/14) – NPFG Insured | 5/14 at 100.00 | A3 (4) | | 1,822,091 | |
| | 1,230 | | Erie County Hospital Authority, Pennsylvania, Revenue Bonds, Hamot Health Foundation, Series 2002, 5.250%, 11/01/16 (Pre-refunded 11/01/12) – AMBAC Insured | 11/12 at 100.00 | N/R (4) | | 1,308,536 | |
| | 2,600 | | Norristown Area School District, Montgomery County, Pennsylvania, General Obligation Bonds, Series 2003, 5.000%, 9/01/24 (Pre-refunded 3/01/13) – FGIC Insured | 3/13 at 100.00 | N/R (4) | | 2,810,626 | |
| | 735 | | Pennsylvania Higher Educational Facilities Authority, College Revenue Bonds, Ninth Series 1976, 7.625%, 7/01/15 (ETM) | No Opt. Call | Aaa | | 827,698 | |
| | 1,500 | | Pennsylvania Higher Educational Facilities Authority, Revenue Bonds, Temple University, Series 2001, 5.000%, 7/15/31 (Pre-refunded 7/15/11) – NPFG Insured | 7/11 at 101.00 | Aaa | | 1,530,060 | |
| | 3,905 | | Pennsylvania Higher Educational Facilities Authority, Revenue Bonds, Thomas Jefferson University, Series 2002, 5.000%, 1/01/32 (Pre-refunded 1/01/13) | 1/13 at 100.00 | A1 (4) | | 4,175,851 | |
| | 3,200 | | Pennsylvania, General Obligation Bonds, First Series 2006, 5.000%, 10/01/18 (Pre-refunded 10/01/16) | 10/16 at 100.00 | Aa1 (4) | | 3,774,720 | |
| | 1,000 | | Pennsylvania, General Obligation Bonds, Second Series 2005, 5.000%, 1/01/18 (Pre-refunded 1/01/16) | 1/16 at 100.00 | Aa1 (4) | | 1,160,040 | |
| | | | Philadelphia Authority for Industrial Development, Pennsylvania, Revenue Bonds, Franklin Towne Charter High School, Series 2006A: | | | | | |
| | 470 | | 5.250%, 1/01/27 (Pre-refunded 1/01/17) | 1/17 at 100.00 | N/R (4) | | 548,354 | |
| | 790 | | 5.375%, 1/01/32 (Pre-refunded 1/01/17) | 1/17 at 100.00 | N/R (4) | | 926,954 | |
| | | | Philadelphia Hospitals and Higher Education Facilities Authority, Pennsylvania, Hospital Revenue Bonds, Presbyterian Medical Center of Philadelphia, Series 1993: | | | | | |
| | 225 | | 6.500%, 12/01/11 (ETM) | No Opt. Call | AAA | | 232,346 | |
| | 3,740 | | 6.650%, 12/01/19 (ETM) | No Opt. Call | AAA | | 4,577,423 | |
| | | | Sayre Health Care Facility Authority, Pennsylvania, Revenue Bonds, Latrobe Area Hospital, Series 2002A: | | | | | |
| | 1,700 | | 5.250%, 7/01/14 (Pre-refunded 7/01/12) – AMBAC Insured | 7/12 at 100.00 | N/R (4) | | 1,792,905 | |
| | 1,200 | | 5.250%, 7/01/15 (Pre-refunded 7/01/12) – AMBAC Insured | 7/12 at 100.00 | N/R (4) | | 1,265,580 | |
| | 1,015 | | St. Mary Hospital Authority, Pennsylvania, Health System Revenue Bonds, Catholic Health East, Series 2004B, 5.375%, 11/15/34 (Pre-refunded 11/15/14) | 11/14 at 100.00 | A1 (4) | | 1,158,003 | |
| | | | State Public School Building Authority, Berkes County, Pennsylvania, School Revenue Bonds, Brandywine Heights Area School District, Series 2003: | | | | | |
| | 1,930 | | 5.000%, 2/01/20 (Pre-refunded 2/01/13) – FGIC Insured | 2/13 at 100.00 | Aa3 (4) | | 2,074,345 | |
| | 1,955 | | 5.000%, 2/01/21 (Pre-refunded 2/01/13) – FGIC Insured | 2/13 at 100.00 | Aa3 (4) | | 2,101,214 | |
| | 4,050 | | State Public School Building Authority, Pennsylvania, Lease Revenue Bonds, Philadelphia School District, Series 2003, 5.000%, 6/01/33 (Pre-refunded 6/01/13) – AGM Insured | 6/13 at 100.00 | AAA | | 4,410,288 | |
| | 2,500 | | West Cornwall Township Municipal Authority, Pennsylvania, College Revenue Bonds, Elizabethtown College Project, Series 2001, 5.900%, 12/15/18 (Pre-refunded 12/15/11) | 12/11 at 100.00 | BBB+ (4) | | 2,586,950 | |
| | 845 | | West View Borough Municipal Authority, Allegheny County, Pennsylvania, Special Obligation Bonds, Series 1985A, 9.500%, 11/15/14 (ETM) | No Opt. Call | AAA | | 1,002,947 | |
| | 37,405 | | Total U.S. Guaranteed | | | | 41,409,271 | |
| | | | Utilities – 5.4% (3.7% of Total Investments) | | | | | |
| | 1,125 | | Allegheny County Industrial Development Authority, Pennsylvania, Pollution Control Revenue Refunding Bonds, Duquesne Light Company, Series 1999A, 4.350%, 12/01/13 – AMBAC Insured | No Opt. Call | BBB+ | | 1,178,483 | |
| | 2,000 | | Indiana County Industrial Development Authority, Pennsylvania, Pollution Control Revenue Refunding Bonds, PSEG Power LLC, Series 2001A, 5.850%, 6/01/27 (Alternative Minimum Tax) | 6/12 at 101.00 | Baa1 | | 1,949,080 | |
| | 2,150 | | Lehigh County Industrial Development Authority, Pennsylvania, Pollution Control Revenue Bonds, Pennsylvania Power and Light Company, Series 2005, 4.750%, 2/15/27 – FGIC Insured | 2/15 at 100.00 | BBB+ | | 1,975,764 | |
| | 700 | | Philadelphia Gas Works, Pennsylvania, Revenue Bonds, General Ordinance, Fifth Series 2004A-1, 5.000%, 9/01/26 – AGM Insured | 9/14 at 100.00 | AA+ | | 706,265 | |
| | 1,000 | | Philadelphia Gas Works, Pennsylvania, Revenue Bonds, General Ordinance, Seventeenth Series 2003, 5.375%, 7/01/19 – AGM Insured | 7/13 at 100.00 | AA+ | | 1,046,020 | |
| | | Nuveen Pennsylvania Premium Income Municipal Fund 2 (continued) |
| NPY | | Portfolio of Investments |
April 30, 2011
| | Principal | | | Optional Call | | | | |
| | Amount (000) | | Description (1) | Provisions (2) | Ratings (3) | | Value | |
| | | | Utilities (continued) | | | | | |
| $ | 5,050 | | Philadelphia Gas Works, Pennsylvania, Revenue Bonds, Seventh Series, 2007, 5.000%, 10/01/37 – AMBAC Insured | 10/17 at 100.00 | BBB+ | $ | 4,541,516 | |
| | 12,025 | | Total Utilities | | | | 11,397,128 | |
| | | | Water and Sewer – 10.9% (7.4% of Total Investments) | | | | | |
| | | | Allegheny County Sanitary Authority, Pennsylvania, Sewerage Revenue Bonds, Series 2005A: | | | | | |
| | 1,900 | | 5.000%, 12/01/21 – NPFG Insured | 12/15 at 100.00 | A1 | | 1,992,340 | |
| | 2,120 | | 5.000%, 12/01/23 – NPFG Insured | 12/15 at 100.00 | A1 | | 2,193,351 | |
| | 545 | | 5.000%, 12/01/30 – NPFG Insured | 12/15 at 100.00 | A1 | | 546,302 | |
| | 2,500 | | Bethlehem Authority, Northampton and Lehigh Counties, Pennsylvania, Guaranteed Water Revenue Bonds, Series 2004, 5.000%, 11/15/20 – AGM Insured | 11/14 at 100.00 | AA+ | | 2,569,650 | |
| | 4,000 | | Bucks County Industrial Development Authority, Pennsylvania, Water Facility Revenue Bonds, Pennsylvania Suburban Water Company, Series 2002, 5.550%, 9/01/32 – NPFG Insured (Alternative Minimum Tax) | 3/12 at 100.00 | AA– | | 4,003,160 | |
| | 2,000 | | Harrisburg Authority, Dauphin County, Pennsylvania, Water Revenue Refunding Bonds, Series 2004, 5.000%, 7/15/22 – AGM Insured | 7/14 at 100.00 | AA+ | | 1,830,640 | |
| | 1,600 | | Luzerne County Industrial Development Authority, Pennsylvania, Water Facility Revenue Refunding Bonds, Pennsylvania-American Water Company, Series 2009, 5.500%, 12/01/39 | 12/19 at 100.00 | A | | 1,563,855 | |
| | | | Norristown Municipal Waste Authority, Pennsylvania, Sewer Revenue Bonds, Series 2003: | | | | | |
| | 1,140 | | 5.125%, 11/15/22 – FGIC Insured | 11/13 at 100.00 | N/R | | 1,151,627 | |
| | 2,535 | | 5.125%, 11/15/23 – FGIC Insured | 11/13 at 100.00 | N/R | | 2,549,398 | |
| | 500 | | Pennsylvania Economic Development Financing Authority, Sewage Sludge Disposal Revenue Bonds, Philadelphia Biosolids Facility Project, Series 2009, 6.250%, 1/01/32 | 1/20 at 100.00 | Baa3 | | 504,604 | |
| | 2,000 | | Philadelphia, Pennsylvania, Water and Wastewater Revenue Bonds, Series 2005A, 5.000%, 7/01/23 – AGM Insured | 7/15 at 100.00 | AA+ | | 2,070,220 | |
| | 2,000 | | Unity Township Municipal Authority, Pennsylvania, Sewerage Revenue Bonds, Series 2004, 5.000%, 12/01/34 – AGM Insured | 12/14 at 100.00 | AA+ | | 2,002,179 | |
| | 22,840 | | Total Water and Sewer | | | | 22,977,326 | |
| $ | 326,925 | | Total Investments (cost $311,379,614) – 146.9% | | | | 309,637,875 | |
| | | | Floating Rate Obligations – (5.9)% | | | | (12,385,000 | ) |
| | | | Variable Rate Demand Preferred Shares, at Liquidation Value – (47.4)% (5) | | | | (100,000,000 | ) |
| | | | Other Assets Less Liabilities – 6.4% | | | | 13,586,286 | |
| | | | Net Assets Applicable to Common Shares – 100% | | | $ | 210,839,161 | |
| (1) | | All percentages shown in the Portfolio of Investments are based on net assets applicable to Common shares unless otherwise noted. |
| (2) | | Optional Call Provisions (not covered by the report of independent registered public accounting firm): Dates (month and year) and prices of the earliest optional call or redemption. There may be other call provisions at varying prices at later dates. Certain mortgage-backed securities may be subject to periodic principal paydowns. |
| (3) | | Ratings (not covered by the report of independent registered public accounting firm): Using the highest of Standard & Poor’s Group (“Standard & Poor’s”), Moody’s Investor Service, Inc. (“Moody’s”) or Fitch, Inc. (“Fitch”) rating. Ratings below BBB by Standard & Poor’s, Baa by Moody’s or BBB by Fitch are considered to be below investment grade. Holdings designated N/R are not rated by any of these national rating agencies. |
| (4) | | Backed by an escrow or trust containing sufficient U.S. Government or U.S. Government agency securities, which ensure the timely payment of principal and interest. Such investments are normally considered to be equivalent to AAA rated securities. |
| (5) | | Variable Rate Demand Preferred Shares, at Liquidation Value as a percentage of Total Investments is 32.3%. |
| N/R | | Not rated. |
| WI/DD | | Purchased on a when-issued or delayed delivery basis. |
| (ETM) | | Escrowed to maturity. |
| (IF) | | Inverse floating rate investment. |
| (UB) | | Underlying bond of an inverse floating rate trust reflected as a financing transaction. See Notes to Financial Statements, Footnote 1 – General Information and Significant Accounting Policies, Inverse Floating Rate Securities for more information. |
See accompanying notes to financial statements.
| | | Nuveen Pennsylvania Dividend Advantage Municipal Fund |
| NXM | | Portfolio of Investments |
April 30, 2011
| | Principal | | | Optional Call | | | | |
| | Amount (000) | | Description (1) | Provisions (2) | Ratings (3) | | Value | |
| | | | Consumer Staples – 2.2% (1.5% of Total Investments) | | | | | |
| $ | 1,000 | | Pennsylvania Economic Development Financing Authority, Solid Waste Disposal Revenue Bonds, Procter & Gamble Paper Project, Series 2001, 5.375%, 3/01/31 (Alternative Minimum Tax) | No Opt. Call | AA– | $ | 1,008,450 | |
| | | | Education and Civic Organizations – 23.9% (16.1% of Total Investments) | | | | | |
| | 100 | | Allegheny County Higher Education Building Authority, Pennsylvania, College Revenue Refunding Bonds, Robert Morris College, Series 1998A, 6.000%, 5/01/28 | No Opt. Call | Baa3 | | 96,997 | |
| | 235 | | Allegheny County Higher Education Building Authority, Pennsylvania, Revenue Bonds, Robert Morris University, Series 2006A, 4.750%, 2/15/26 | 2/16 at 100.00 | Baa3 | | 202,495 | |
| | 700 | | Chester County Health and Education Facilities Authority, Pennsylvania, Revenue Bonds, Immaculata University, Series 2005, 5.500%, 10/15/25 | 10/15 at 102.00 | N/R | | 640,507 | |
| | 720 | | Chester County Industrial Development Authority, Pennsylvania, Avon Grove Charter School Revenue Bonds, Series 2007A, 6.375%, 12/15/37 | 12/17 at 100.00 | BB+ | | 598,932 | |
| | 300 | | Delaware County Authority, Pennsylvania, General Revenue Bonds, Eastern Univsersity, Series 2006, 4.500%, 10/01/27 – RAAI Insured | 10/16 at 100.00 | N/R | | 247,368 | |
| | | | Delaware County Authority, Pennsylvania, Revenue Bonds, Villanova University, Series 2006: | | | | | |
| | 295 | | 5.000%, 8/01/23 – AMBAC Insured | 8/16 at 100.00 | A+ | | 309,381 | |
| | 145 | | 5.000%, 8/01/24 – AMBAC Insured | 8/16 at 100.00 | A+ | | 151,097 | |
| | 160 | | Erie Higher Education Building Authority, Pennsylvania, College Revenue Bonds, Gannon University, Series 2007-GG3, 5.000%, 5/01/32 – RAAI Insured | 5/17 at 100.00 | N/R | | 136,618 | |
| | 200 | | Montgomery County Higher Education and Health Authority, Pennsylvania, Revenue Bonds, Arcadia University, Series 2010, 5.625%, 4/01/40 | 4/20 at 100.00 | BBB+ | | 192,134 | |
| | 1,000 | | Montgomery County Industrial Development Authority, Pennsylvania, Revenue Bonds, Hill School, Series 2005, 5.000%, 8/15/27 – NPFG Insured | 8/15 at 100.00 | A1 | | 1,017,110 | |
| | 75 | | New Wilmington, Pennsylvania, Revenue, Westminster College, Series 2007G, 5.125%, 5/01/33 – RAAI Insured | 5/17 at 100.00 | N/R | | 65,633 | |
| | 1,000 | | Pennsylvania Higher Educational Facilities Authority, General Revenue Bonds, State System of Higher Education, Series 2002W, 5.000%, 6/15/19 – AMBAC Insured | 6/12 at 100.00 | Aa2 | | 1,036,140 | |
| | 900 | | Pennsylvania Higher Educational Facilities Authority, General Revenue Bonds, State System of Higher Education, Series 2008AH, 5.000%, 6/15/33 | 6/18 at 100.00 | Aa2 | | 911,250 | |
| | 220 | | Pennsylvania Higher Educational Facilities Authority, Revenue Bonds, Allegheny College, Series 2006, 4.750%, 5/01/31 | 5/16 at 100.00 | A– | | 207,255 | |
| | 540 | | Pennsylvania Higher Educational Facilities Authority, Revenue Bonds, Drexel University, Series 2007A, 5.000%, 5/01/37 – NPFG Insured | 11/17 at 100.00 | A | | 505,003 | |
| | 1,500 | | Pennsylvania Higher Educational Facilities Authority, Revenue Bonds, Moravian College, Series 2001, 5.375%, 7/01/31 – RAAI Insured | 7/11 at 100.00 | N/R | | 1,381,155 | |
| | 700 | | Pennsylvania Higher Educational Facilities Authority, Revenue Bonds, Temple University, First Series of 2006, 5.000%, 4/01/21 – NPFG Insured | 4/16 at 100.00 | Aa3 | | 754,068 | |
| | 350 | | Pennsylvania Higher Educational Facilities Authority, Revenue Bonds, Thomas Jefferson University, Series 2002, 5.500%, 1/01/16 | 1/13 at 100.00 | A1 | | 368,494 | |
| | 1,000 | | Pennsylvania State University, General Revenue Bonds, Series 2010, 5.000%, 3/01/35 | 3/20 at 100.00 | Aa1 | | 1,025,430 | |
| | 470 | | Philadelphia Authority for Industrial Development, Pennsylvania, Revenue Bonds, Leadership Learning Partners, Series 2005A, 5.375%, 7/01/36 | 1/13 at 102.00 | N/R | | 329,437 | |
| | 110 | | Philadelphia Authority for Industrial Development, Pennsylvania, Revenue Bonds, MaST Charter School Project, Series 2010, 6.000%, 8/01/35 | 8/20 at 100.00 | BBB+ | | 105,255 | |
| | 230 | | Philadelphia Authority for Industrial Development, Pennsylvania, Revenue Bonds, Richard Allen Preparatory Charter School, Series 2006, 6.250%, 5/01/33 | 5/16 at 100.00 | BBB– | | 202,154 | |
| | 500 | | State Public School Building Authority, Pennsylvania, College Revenue Bonds, Northampton County Area Community College, Series 2011, 5.500%, 3/01/31 | 3/21 at 100.00 | A1 | | 505,640 | |
| | 150 | | Wilkes-Barre Finance Authority, Pennsylvania, Revenue Bonds, University of Scranton, Series 2010, 5.000%, 11/01/40 | 11/20 at 100.00 | A | | 139,113 | |
| | 11,600 | | Total Education and Civic Organizations | | | | 11,128,666 | |
| | | Nuveen Pennsylvania Dividend Advantage Municipal Fund (continued) |
| NXM | | Portfolio of Investments |
April 30, 2011
| | Principal | | | Optional Call | | | | |
| | Amount (000) | | Description (1) | Provisions (2) | Ratings (3) | | Value | |
| | | | Health Care – 18.4% (12.3% of Total Investments) | | | | | |
| $ | 550 | | Allegheny County Hospital Development Authority, Pennsylvania, Revenue Bonds, Ohio Valley General Hospital, Series 2005A, 5.125%, 4/01/35 | 4/15 at 100.00 | Ba2 | $ | 420,134 | |
| | 520 | | Allentown Area Hospital Authority, Pennsylvania, Revenue Bonds, Sacred Heart Hospital, Series 2005, 6.000%, 11/15/16 | No Opt. Call | Ca | | 487,578 | |
| | 200 | | Erie County Hospital Authority, Pennsylvania, Hospital Revenue Bonds, Saint Vincent Health Center Project, Series 2010A, 7.000%, 7/01/27 | 7/20 at 100.00 | Baa3 | | 196,936 | |
| | 80 | | Erie County Hospital Authority, Pennsylvania, Revenue Bonds, Hamot Health Foundation, Series 2007, 5.000%, 11/01/37 – CIFG Insured | 11/17 at 100.00 | Aa3 | | 72,088 | |
| | 835 | | Franklin County Industrial Development Authority, Pennsylvania, Revenue Bonds, Chambersburg Hospital Project, Series 2010, 5.375%, 7/01/42 | No Opt. Call | A2 | | 769,419 | |
| | 230 | | Fulton County, Pennsylvania, Industrial Development Authority Hospital Revenue Bonds, Fulton County Medical Center Project, Series 2006, 5.900%, 7/01/40 | 7/16 at 100.00 | N/R | | 182,933 | |
| | 600 | | Lebanon County Health Facilities Authority, Pennsylvania, Revenue Bonds, Good Samaritan Hospital Project, Series 2002, 5.900%, 11/15/28 | 11/12 at 101.00 | BB+ | | 510,252 | |
| | 650 | | Lehigh County General Purpose Authority, Pennsylvania, Hospital Revenue Bonds, Lehigh Valley Health Network, Series 2008A, 5.000%, 7/01/33 – AGM Insured | 7/18 at 100.00 | AA+ | | 621,023 | |
| | 250 | | Lehigh County General Purpose Authority, Pennsylvania, Revenue Bonds, Good Shepherd Group, Series 2004A, 5.500%, 11/01/24 | 11/14 at 100.00 | A | | 253,238 | |
| | 1,025 | | Lehigh County General Purpose Authority, Pennsylvania, Revenue Bonds, Good Shepherd Group, Series 2007, 5.000%, 11/01/37 – AGC Insured | 11/17 at 100.00 | AA+ | | 964,812 | |
| | 140 | | Monroe County Hospital Authority, Pennsylvania, Hospital Revenue Bonds, Pocono Medical Center, Series 2007, 5.125%, 1/01/37 | 1/17 at 100.00 | A– | | 124,550 | |
| | 165 | | Montgomery County Industrial Development Authority, Pennsylvania, FHA Insured Mortgage Revenue Bonds, New Regional Medical Center Project, Series 2010, 5.375%, 8/01/38 | 8/20 at 100.00 | AA | | 166,002 | |
| | 1,495 | | Philadelphia Hospitals and Higher Education Facilities Authority, Pennsylvania, Health System Revenue Bonds, Jefferson Health System, Series 2010B, 5.000%, 5/15/40 | 5/20 at 100.00 | AA | | 1,385,118 | |
| | 25 | | Pottsville Hospital Authority, Pennsylvania, Hospital Revenue Bonds, Pottsville Hospital and Warne Clinic, Series 1998, 5.625%, 7/01/24 | 7/11 at 100.00 | N/R | | 21,345 | |
| | 1,000 | | Washington County Hospital Authority, Pennsylvania, Revenue Bonds, Monongahela Valley Hospital Project, Series 2002, 5.500%, 6/01/17 | 6/12 at 101.00 | A3 | | 1,024,990 | |
| | 750 | | West Shore Area Hospital Authority, Cumberland County, Pennsylvania, Hospital Revenue Bonds, Holy Spirit Hospital of the Sisters of Christian Charity Project, Series 2001, 6.250%, 1/01/32 | 1/12 at 100.00 | BBB+ | | 727,928 | |
| | 625 | | West Shore Area Hospital Authority, Cumberland County, Pennsylvania, Hospital Revenue Bonds, Holy Spirit Hospital of the Sisters of Christian Charity Project, Series 2011, 6.500%, 1/01/36 | 1/21 at 100.00 | BBB+ | | 616,613 | |
| | 9,140 | | Total Health Care | | | | 8,544,959 | |
| | | | Housing/Multifamily – 1.7% (1.2% of Total Investments) | | | | | |
| | 150 | | Pennsylvania Higher Educational Facilities Authority, Revenue Bonds, Edinboro University Foundation Student Housing Project, Series 2010, 6.000%, 7/01/43 | No Opt. Call | BBB– | | 141,263 | |
| | 700 | | Pennsylvania Higher Educational Facilities Authority, Revenue Bonds, Slippery Rock University Foundation Inc., Student Housing Project, Series 2005A, 5.000%, 7/01/37 – SYNCORA GTY Insured | 7/15 at 100.00 | BBB+ | | 586,327 | |
| | 100 | | Philadelphia Authority for Industrial Development, Pennsylvania, Multifamily Housing Revenue Bonds, Presbyterian Homes Germantown – Morrisville Project, Series 2005A, 5.625%, 7/01/35 | 5/15 at 102.00 | Baa3 | | 82,663 | |
| | 950 | | Total Housing/Multifamily | | | | 810,253 | |
| | | | Housing/Single Family – 7.1% (4.8% of Total Investments) | | | | | |
| | 1,215 | | Allegheny County Residential Finance Authority, Pennsylvania, GNMA Mortgage-Backed Securities Program Single Family Mortgage Revenue Bonds, Series 1998DD-2, 5.400%, 11/01/29 (Alternative Minimum Tax) | 11/11 at 100.00 | Aaa | | 1,214,891 | |
| | 320 | | Pennsylvania Housing Finance Agency, Single Family Mortgage Revenue Bonds, Series 2006-93A, 4.950%, 10/01/26 (Alternative Minimum Tax) (UB) | 4/15 at 100.00 | AA+ | | 312,632 | |
| | 605 | | Pennsylvania Housing Finance Agency, Single Family Mortgage Revenue Bonds, Series 2006-94A, 5.150%, 10/01/37 (Alternative Minimum Tax) (UB) | 10/15 at 100.00 | AA+ | | 578,084 | |
| | 475 | | Pennsylvania Housing Finance Agency, Single Family Mortgage Revenue Bonds, Series 2006-95A, 4.900%, 10/01/37 (Alternative Minimum Tax) (UB) | 10/15 at 100.00 | AA+ | | 445,564 | |
| | Principal | | | Optional Call | | | | |
| | Amount (000) | | Description (1) | Provisions (2) | Ratings (3) | | Value | |
| | | | Housing/Single Family (continued) | | | | | |
| $ | 395 | | Pennsylvania Housing Finance Agency, Single Family Mortgage Revenue Bonds, Series 2007-98A, 4.850%, 10/01/31 (Alternative Minimum Tax) (UB) | 10/16 at 100.00 | AA+ | $ | 364,628 | |
| | 400 | | Pennsylvania Housing Finance Agency, Single Family Mortgage Revenue Bonds, Series 2011-112, 5.000%, 10/01/25 | 10/20 at 100.00 | AA+ | | 405,992 | |
| | 3,410 | | Total Housing/Single Family | | | | 3,321,791 | |
| | | | Industrials – 7.1% (4.8% of Total Investments) | | | | | |
| | 2,000 | | Pennsylvania Economic Development Financing Authority, Exempt Facilities Revenue Bonds, Amtrak Project, Series 2001A, 6.250%, 11/01/31 (Alternative Minimum Tax) | 11/11 at 101.00 | A1 | | 2,005,580 | |
| | 1,250 | | Pennsylvania Industrial Development Authority, Economic Development Revenue Bonds, Series 2002, 5.500%, 7/01/17 – AMBAC Insured | 7/12 at 101.00 | A1 | | 1,303,150 | |
| | 3,250 | | Total Industrials | | | | 3,308,730 | |
| | | | Long-Term Care – 20.3% (13.6% of Total Investments) | | | | | |
| | | | Bucks County Industrial Development Authority, Pennsylvania, Revenue Bonds, Lutheran Community at Telford Center, Series 2007: | | | | | |
| | 220 | | 5.750%, 1/01/27 | 1/17 at 100.00 | N/R | | 181,394 | |
| | 360 | | 5.750%, 1/01/37 | 1/17 at 100.00 | N/R | | 272,534 | |
| | 1,000 | | Cumberland County Municipal Authority Revenue Bonds, Pennsylvania, Diakon Lutheran Social Ministries Project, Series 2009, 6.375%, 1/01/39 | 1/19 at 100.00 | N/R | | 978,910 | |
| | 265 | | Cumberland County Municipal Authority, Pennsylvania, Revenue Bonds, Diakon Lutheran Social Ministries, Series 2007, 5.000%, 1/01/36 | 1/17 at 100.00 | N/R | | 215,885 | |
| | 230 | | Delaware County Authority, Pennsylvania, Revenue Bonds, Elwyn, Inc. Project, Series 2010, 5.000%, 6/01/21 | 6/17 at 100.00 | BBB | | 226,946 | |
| | 200 | | Lancaster County Hospital Authority, Pennsylvania, Health Center Revenue Bonds, Masonic Homes Project, Series 2006, 5.000%, 11/01/36 | 11/16 at 100.00 | A | | 180,550 | |
| | 2,100 | | Lancaster County Hospital Authority, Pennsylvania, Health Center Revenue Bonds, Willow Valley Retirement Communities Project, Series 2001, 5.875%, 6/01/31 | 12/11 at 100.00 | A– | | 2,079,126 | |
| | 185 | | Lancaster County Hospital Authority, Pennsylvania, Revenue Bonds, Brethren Village Project, Series 2008A, 6.375%, 7/01/30 | 7/17 at 100.00 | N/R | | 175,243 | |
| | 785 | | Lebanon County Health Facilities Authority, Pennsylvania, Health Center Revenue Bonds, Pleasant View Retirement Community, Series 2005A, 5.300%, 12/15/26 | 12/14 at 100.00 | N/R | | 677,282 | |
| | | | Pennsylvania Economic Development Financing Authority, Revenue Bonds, Northwestern Human Services Inc., Series 1998A: | | | | | |
| | 1,240 | | 5.250%, 6/01/14 | 6/11 at 100.00 | BB | | 1,177,938 | |
| | 50 | | 5.125%, 6/01/18 | 6/11 at 100.00 | BB | | 43,658 | |
| | | | Philadelphia Authority for Industrial Development, Pennsylvania, Revenue Bonds, Philadelphia Corporation for the Aging Project, Series 2001B: | | | | | |
| | 670 | | 5.250%, 7/01/23 – AMBAC Insured | 7/11 at 101.00 | Baa1 | | 670,496 | |
| | 2,875 | | 5.250%, 7/01/31 – AMBAC Insured | 7/11 at 101.00 | Baa1 | | 2,576,460 | |
| | 10,180 | | Total Long-Term Care | | | | 9,456,422 | |
| | | | Materials – 4.2% (2.8% of Total Investments) | | | | | |
| | 350 | | Allegheny County Industrial Development Authority, Pennsylvania, Revenue Bonds, United States Steel Corporation, Series 2005, 5.500%, 11/01/16 | No Opt. Call | BB | | 353,336 | |
| | 210 | | Bradford County Industrial Development Authority, Pennsylvania, Solid Waste Disposal Revenue Bonds, International Paper Company, Series 2005B, 5.200%, 12/01/19 (Alternative Minimum Tax) | 12/15 at 100.00 | BBB | | 210,040 | |
| | 750 | | Bucks County Industrial Development Authority, Pennsylvania, Environmental Improvement Revenue Bonds, USX Corporation Project, Series 1995, 5.400%, 11/01/17 (Mandatory put 11/01/11) | No Opt. Call | BBB+ | | 772,335 | |
| | 750 | | Pennsylvania Economic Development Financing Authority, Exempt Facilities Revenue Bonds, National Gypsum Company, Series 1997B, 6.125%, 11/01/27 (Alternative Minimum Tax) | 11/11 at 100.00 | N/R | | 607,680 | |
| | 2,060 | | Total Materials | | | | 1,943,391 | |
| | | Nuveen Pennsylvania Dividend Advantage Municipal Fund (continued) |
| NXM | | Portfolio of Investments |
April 30, 2011
| | Principal | | | Optional Call | | | | |
| | Amount (000) | | Description (1) | Provisions (2) | Ratings (3) | | Value | |
| | | | Tax Obligation/General – 13.9% (9.3% of Total Investments) | | | | | |
| $ | 500 | | Allegheny County, Pennsylvania, General Obligation Bonds, Series 2011C-65, 5.375%, 5/01/31 | 5/21 at 100.00 | A+ | $ | 504,040 | |
| | 375 | | Philadelphia School District, Pennsylvania, General Obligation Bonds, Series 2007A, 5.000%, 6/01/34 – FGIC Insured | No Opt. Call | Aa2 | | 365,805 | |
| | 840 | | Pine-Richland School District, Pennsylvania, General Obligation Bonds, School Improvement Series 2005, 5.000%, 7/15/35 – AGM Insured | 7/15 at 100.00 | AA+ | | 839,353 | |
| | 3,000 | | Pittsburgh School District, Allegheny County, Pennsylvania, General Obligation Refunding Bonds, Series 2002A, 5.500%, 9/01/14 – AGM Insured | No Opt. Call | AA+ | | 3,341,130 | |
| | 2,220 | | Reading School District, Berks County, Pennsylvania, General Obligation Bonds, Series 2003B, 0.000%, 1/15/32 – FGIC Insured | No Opt. Call | A | | 656,876 | |
| | 160 | | Scranton Parking Authority, Pennsylvania, Guaranteed Parking Revenue Bonds, Series 2004, 5.000%, 9/15/33 – FGIC Insured | 9/13 at 100.00 | BBB | | 141,773 | |
| | 600 | | York County, Pennsylvania, General Obligation Bonds, Series 2006, 5.000%, 6/01/33 – NPFG Insured | 12/15 at 100.00 | AA | | 605,970 | |
| | 7,695 | | Total Tax Obligation/General | | | | 6,454,947 | |
| | | | Tax Obligation/Limited – 14.1% (9.4% of Total Investments) | | | | | |
| | 1,000 | | Allegheny County Redevelopment Authority, Pennsylvania, TIF Revenue Bonds, Pittsburg Mills Project, Series 2004, 5.600%, 7/01/23 | No Opt. Call | N/R | | 899,320 | |
| | 450 | | Erie County Convention Center Authority, Pennsylvania, Convention Center Revenue Bonds, Series 2005, 5.000%, 1/15/36 – FGIC Insured | 1/15 at 100.00 | AA– | | 433,287 | |
| | 425 | | Pennsylvania Turnpike Commission, Oil Franchise Tax Senior Lien Revenue Bonds, Series 2003A, 5.000%, 12/01/32 – NPFG Insured | 12/18 at 100.00 | AA | | 429,123 | |
| | 1,000 | | Pennsylvania Turnpike Commission, Registration Fee Revenue Bonds, Series 2005A, 5.250%, 7/15/18 – AGM Insured | No Opt. Call | AA+ | | 1,156,320 | |
| | 1,000 | | Philadelphia Municipal Authority, Pennsylvania, Lease Revenue Bonds, Series 2003B, 5.250%, 11/15/17 – AGM Insured | 11/13 at 100.00 | AA+ | | 1,060,010 | |
| | 1,500 | | Philadelphia Redevelopment Authority, Pennsylvania, Revenue Bonds, Philadelphia Neighborhood Transformation Initiative, Series 2002A, 5.500%, 4/15/19 – FGIC Insured | 4/12 at 100.00 | A2 | | 1,539,870 | |
| | 750 | | Puerto Rico Highway and Transportation Authority, Highway Revenue Bonds, Series 2007N, 5.250%, 7/01/33 – NPFG Insured | No Opt. Call | A3 | | 679,755 | |
| | 630 | | Puerto Rico Infrastructure Financing Authority, Special Tax Revenue Bonds, Series 2005A, 0.000%, 7/01/32 – FGIC Insured | No Opt. Call | A3 | | 141,051 | |
| | 250 | | Washington County Redevelopment Authority, Pennsylvania, Tanger Outlet Victory Center Tax Increment Bonds, Series 2006A, 5.450%, 7/01/35 | 7/17 at 100.00 | N/R | | 204,363 | |
| | 7,005 | | Total Tax Obligation/Limited | | | | 6,543,099 | |
| | | | Transportation – 12.4% (8.3% of Total Investments) | | | | | |
| | 130 | | Delaware River Joint Toll Bridge Commission, New Jersey and Pennsylvania, Revenue Bonds, Series 2003, 5.250%, 7/01/17 | 7/13 at 100.00 | A2 | | 139,022 | |
| | 680 | | Delaware River Port Authority, New Jersey and Pennsylvania, Revenue Bonds, Series 2010E, 5.000%, 1/01/40 | 1/20 at 100.00 | A– | | 671,786 | |
| | 1,000 | | Pennsylvania Economic Development Financing Authority, Revenue Bonds, Amtrak 30th Street Station Parking Garage, Series 2002, 5.875%, 6/01/33 – ACA Insured (Alternative Minimum Tax) | 6/12 at 102.00 | BBB+ | | 953,040 | |
| | | | Pennsylvania Turnpike Commission, Motor License Fund-Enhanced Subordinate Special Revenue Bonds, Series 2010A: | | | | | |
| | 880 | | 0.000%, 12/01/34 | 12/20 at 100.00 | AA | | 650,434 | |
| | 250 | | 5.000%, 12/01/38 | No Opt. Call | Aa3 | | 245,220 | |
| | 420 | | Pennsylvania Turnpike Commission, Turnpike Revenue Bonds, Series 2006A, 5.000%, 12/01/24 – AMBAC Insured | 6/16 at 100.00 | Aa3 | | 440,454 | |
| | Principal | | | Optional Call | | | | |
| | Amount (000) | | Description (1) | Provisions (2) | Ratings (3) | | Value | |
| | | | Transportation (continued) | | | | | |
| $ | 150 | | Pennsylvania Turnpike Commission, Turnpike Revenue Bonds, Subordinate Lien, Refunding Series 2009B-1, 5.000%, 12/01/37 | 12/19 at 100.00 | A– | $ | 139,578 | |
| | 1,000 | | Pennsylvania Turnpike Commission, Turnpike Subordinate Revenue Bonds, Series 2009C, 0.000%, 6/01/33 – AGM Insured | 6/26 at 100.00 | AA+ | | 792,190 | |
| | 1,820 | | Philadelphia Authority for Industrial Development, Pennsylvania, Airport Revenue Bonds, Philadelphia Airport System Project, Series 2001A, 5.250%, 7/01/28 – FGIC Insured (Alternative Minimum Tax) | 7/11 at 101.00 | A+ | | 1,743,396 | |
| | 6,330 | | Total Transportation | | | | 5,775,120 | |
| | | | U.S. Guaranteed – 16.9% (11.3% of Total Investments) (4) | | | | | |
| | 2,250 | | Bucks County Industrial Development Authority, Pennsylvania, Revenue Bonds, George School Project, Series 2001, 5.125%, 9/15/31 (Pre-refunded 9/15/11) – AMBAC Insured | 9/11 at 100.00 | N/R (4) | | 2,289,353 | |
| | 1,000 | | Cumberland County Municipal Authority, Pennsylvania, Retirement Community Revenue Bonds, Wesley Affiliated Services Inc., Series 2002A, 7.125%, 1/01/25 (Pre-refunded 1/01/13) | 1/13 at 101.00 | N/R (4) | | 1,116,320 | |
| | 1,000 | | Delaware County Authority, Pennsylvania, College Revenue Refunding Bonds, Neumann College, Series 2001, 6.000%, 10/01/31 (Pre-refunded 10/01/11) | 10/11 at 100.00 | BBB (4) | | 1,023,970 | |
| | 200 | | Pennsylvania Economic Development Financing Authority, Exempt Facilities Revenue Bonds, Reliant Energy Inc., Series 2003A, 6.750%, 12/01/36 (Pre-refunded 6/01/11) (Alternative Minimum Tax) | 6/11 at 103.00 | B1 (4) | | 206,980 | |
| | 300 | | Pennsylvania, General Obligation Bonds, First Series 2006, 5.000%, 10/01/18 (Pre-refunded 10/01/16) | 10/16 at 100.00 | Aa1 (4) | | 353,880 | |
| | 255 | | Philadelphia Authority for Industrial Development, Pennsylvania, Revenue Bonds, Franklin Towne Charter High School, Series 2006A, 5.250%, 1/01/27 (Pre-refunded 1/01/17) | 1/17 at 100.00 | N/R (4) | | 297,511 | |
| | 350 | | Philadelphia Gas Works, Pennsylvania, Revenue Bonds, General Ordinance, Fourth Series 1998, 5.250%, 8/01/18 (Pre-refunded 8/01/13) – AGM Insured | 8/13 at 100.00 | AA+ (4) | | 385,340 | |
| | 130 | | Philadelphia Gas Works, Pennsylvania, Revenue Bonds, Twelfth Series 1990B, 7.000%, 5/15/20 – NPFG Insured (ETM) | No Opt. Call | BBB (4) | | 159,217 | |
| | 1,700 | | Philadelphia School District, Pennsylvania, General Obligation Bonds, Series 2002B, 5.625%, 8/01/18 (Pre-refunded 8/01/12) – FGIC Insured | 8/12 at 100.00 | Aa2 (4) | | 1,810,261 | |
| | 170 | | St. Mary Hospital Authority, Pennsylvania, Health System Revenue Bonds, Catholic Health East, Series 2004B, 5.375%, 11/15/34 (Pre-refunded 11/15/14) | 11/14 at 100.00 | A1 (4) | | 193,950 | |
| | 7,355 | | Total U.S. Guaranteed | | | | 7,836,782 | |
| | | | Utilities – 3.6% (2.4% of Total Investments) | | | | | |
| | 500 | | Allegheny County Industrial Development Authority, Pennsylvania, Pollution Control Revenue Refunding Bonds, Duquesne Light Company, Series 1999A, 4.350%, 12/01/13 – AMBAC Insured | No Opt. Call | BBB+ | | 523,769 | |
| | 140 | | Philadelphia Gas Works, Pennsylvania, Revenue Bonds, General Ordinance, Fifth Series 2004A-1, 5.000%, 9/01/26 – AGM Insured | 9/14 at 100.00 | AA+ | | 141,252 | |
| | 1,105 | | Philadelphia Gas Works, Pennsylvania, Revenue Bonds, Seventh Series, 2007, 5.000%, 10/01/37 – AMBAC Insured | 10/17 at 100.00 | BBB+ | | 993,737 | |
| | 1,745 | | Total Utilities | | | | 1,658,758 | |
| | | | Water and Sewer – 3.3% (2.2% of Total Investments) | | | | | |
| | 500 | | Bethlehem Authority, Northampton and Lehigh Counties, Pennsylvania, Guaranteed Water Revenue Bonds, Series 2004, 5.000%, 11/15/20 – AGM Insured | 11/14 at 100.00 | AA+ | | 513,929 | |
| | 600 | | Harrisburg Authority, Dauphin County, Pennsylvania, Water Revenue Refunding Bonds, Series 2004, 5.000%, 7/15/22 – AGM Insured | 7/14 at 100.00 | AA+ | | 549,191 | |
| | | Nuveen Pennsylvania Dividend Advantage Municipal Fund (continued) |
| NXM | | Portfolio of Investments |
April 30, 2011
| | Principal | | | Optional Call | | | | |
| | Amount (000) | | Description (1) | Provisions (2) | Ratings (3) | | Value | |
| | | | Water and Sewer (continued) | | | | | |
| $ | 400 | | Luzerne County Industrial Development Authority, Pennsylvania, Water Facility Revenue Refunding Bonds, Pennsylvania-American Water Company, Series 2009, 5.500%, 12/01/39 | 12/19 at 100.00 | A | $ | 390,964 | |
| | 100 | | Pennsylvania Economic Development Financing Authority, Sewage Sludge Disposal Revenue Bonds, Philadelphia Biosolids Facility Project, Series 2009, 6.250%, 1/01/32 | 1/20 at 100.00 | Baa3 | | 100,921 | |
| | 1,600 | | Total Water and Sewer | | | | 1,555,005 | |
| $ | 73,320 | | Total Investments (cost $70,571,889) – 149.1% | | | | 69,346,373 | |
| | | | Floating Rate Obligations – (2.3)% | | | | (1,070,000 | ) |
| | | | MuniFund Term Preferred Shares, at Liquidation Value – (49.9)% (5) | | | | (23,190,000 | ) |
| | | | Other Assets Less Liabilities – 3.1% | | | | 1,434,410 | |
| | | | Net Assets Applicable to Common Shares – 100% | | | $ | 46,520,783 | |
| (1) | | All percentages shown in the Portfolio of Investments are based on net assets applicable to Common shares unless otherwise noted. |
| (2) | | Optional Call Provisions (not covered by the report of independent registered public accounting firm): Dates (month and year) and prices of the earliest optional call or redemption. There may be other call provisions at varying prices at later dates. Certain mortgage-backed securities may be subject to periodic principal paydowns. |
| (3) | | Ratings (not covered by the report of independent registered public accounting firm): Using the highest of Standard & Poor’s Group (“Standard & Poor’s”), Moody’s Investor Service, Inc. (“Moody’s”) or Fitch, Inc. (“Fitch”) rating. Ratings below BBB by Standard & Poor’s, Baa by Moody’s or BBB by Fitch are considered to be below investment grade. Holdings designated N/R are not rated by any of these national rating agencies. |
| (4) | | Backed by an escrow or trust containing sufficient U.S. Government or U.S. Government agency securities, which ensure the timely payment of principal and interest. Such investments are normally considered to be equivalent to AAA rated securities. |
| (5) | | MuniFund Term Preferred Shares, at Liquidation Value as a percentage of Total Investments is 33.4%. |
| N/R | | Not rated. |
| (ETM) | | Escrowed to maturity. |
| (UB) | | Underlying bond of an inverse floating rate trust reflected as a financing transaction. See Notes to Financial Statements, Footnote 1 – General Information and Significant Accounting Policies, Inverse Floating Rate Securities for more information. |
See accompanying notes to financial statements.
| | | Nuveen Pennsylvania Dividend Advantage Municipal Fund 2 |
| NVY | | Portfolio of Investments |
April 30, 2011
| | Principal | | | Optional Call | | | | |
| | Amount (000) | | Description (1) | Provisions (2) | Ratings (3) | | Value | |
| | | | Education and Civic Organizations – 19.4% (12.7% of Total Investments) | | | | | |
| $ | 1,000 | | Allegheny County Higher Education Building Authority, Pennsylvania, College Revenue Refunding Bonds, Robert Morris College, Series 1998A, 6.000%, 5/01/28 | No Opt. Call | Baa3 | $ | 969,970 | |
| | 800 | | Chester County Health and Education Facilities Authority, Pennsylvania, Revenue Bonds, Immaculata University, Series 2005, 5.500%, 10/15/25 | 10/15 at 102.00 | N/R | | 732,008 | |
| | 720 | | Chester County Industrial Development Authority, Pennsylvania, Avon Grove Charter School Revenue Bonds, Series 2007A, 6.375%, 12/15/37 | 12/17 at 100.00 | BB+ | | 598,932 | |
| | 450 | | Delaware County Authority, Pennsylvania, General Revenue Bonds, Eastern Univsersity, Series 2006, 4.500%, 10/01/27 – RAAI Insured | 10/16 at 100.00 | N/R | | 371,052 | |
| | | | Delaware County Authority, Pennsylvania, Revenue Bonds, Villanova University, Series 2006: | | | | | |
| | 340 | | 5.000%, 8/01/23 – AMBAC Insured | 8/16 at 100.00 | A+ | | 356,575 | |
| | 165 | | 5.000%, 8/01/24 – AMBAC Insured | 8/16 at 100.00 | A+ | | 171,938 | |
| | 1,335 | | Delaware County Authority, Pennsylvania, Revenue Refunding Bonds, Villanova University, Series 2003, 5.250%, 8/01/17 – FGIC Insured | 8/13 at 100.00 | A1 | | 1,435,152 | |
| | 180 | | Erie Higher Education Building Authority, Pennsylvania, College Revenue Bonds, Gannon University, Series 2007-GG3, 5.000%, 5/01/32 – RAAI Insured | 5/17 at 100.00 | N/R | | 153,695 | |
| | 200 | | Montgomery County Higher Education and Health Authority, Pennsylvania, Revenue Bonds, Arcadia University, Series 2010, 5.625%, 4/01/40 | 4/20 at 100.00 | BBB+ | | 192,134 | |
| | 80 | | New Wilmington, Pennsylvania, Revenue, Westminster College, Series 2007G, 5.125%, 5/01/33 – RAAI Insured | 5/17 at 100.00 | N/R | | 70,008 | |
| | 1,050 | | Pennsylvania Higher Educational Facilities Authority, General Revenue Bonds, State System of Higher Education, Series 2008AH, 5.000%, 6/15/33 | 6/18 at 100.00 | Aa2 | | 1,063,125 | |
| | 285 | | Pennsylvania Higher Educational Facilities Authority, Revenue Bonds, Allegheny College, Series 2006, 4.750%, 5/01/31 | 5/16 at 100.00 | A– | | 268,490 | |
| | 610 | | Pennsylvania Higher Educational Facilities Authority, Revenue Bonds, Drexel University, Series 2007A, 5.000%, 5/01/37 – NPFG Insured | 11/17 at 100.00 | A | | 570,466 | |
| | 800 | | Pennsylvania Higher Educational Facilities Authority, Revenue Bonds, Temple University, First Series of 2006, 5.000%, 4/01/21 – NPFG Insured | 4/16 at 100.00 | Aa3 | | 861,792 | |
| | 530 | | Philadelphia Authority for Industrial Development, Pennsylvania, Revenue Bonds, Leadership Learning Partners, Series 2005A, 5.375%, 7/01/36 | 1/13 at 102.00 | N/R | | 371,493 | |
| | 120 | | Philadelphia Authority for Industrial Development, Pennsylvania, Revenue Bonds, MaST Charter School Project, Series 2010, 6.000%, 8/01/35 | 8/20 at 100.00 | BBB+ | | 114,823 | |
| | 270 | | Philadelphia Authority for Industrial Development, Pennsylvania, Revenue Bonds, Richard Allen Preparatory Charter School, Series 2006, 6.250%, 5/01/33 | 5/16 at 100.00 | BBB– | | 237,311 | |
| | 500 | | State Public School Building Authority, Pennsylvania, College Revenue Bonds, Northampton County Area Community College, Series 2011, 5.500%, 3/01/31 | 3/21 at 100.00 | A1 | | 505,640 | |
| | 1,000 | | Union County, Higher Education Facilities Financing Authority, Pennsylvania, Revenue Bonds, Bucknell University, Series 2002A, 5.250%, 4/01/20 | 4/13 at 100.00 | Aa2 | | 1,070,500 | |
| | 50 | | Wilkes-Barre Finance Authority, Pennsylvania, Revenue Bonds, University of Scranton, Series 2010, 5.000%, 11/01/40 | 11/20 at 100.00 | A | | 46,371 | |
| | 10,485 | | Total Education and Civic Organizations | | | | 10,161,475 | |
| | | | Health Care – 14.7% (9.7% of Total Investments) | | | | | |
| | 625 | | Allegheny County Hospital Development Authority, Pennsylvania, Revenue Bonds, Ohio Valley General Hospital, Series 2005A, 5.125%, 4/01/35 | 4/15 at 100.00 | Ba2 | | 477,425 | |
| | 600 | | Allentown Area Hospital Authority, Pennsylvania, Revenue Bonds, Sacred Heart Hospital, Series 2005, 6.000%, 11/15/16 | No Opt. Call | Ca | | 562,590 | |
| | 300 | | Erie County Hospital Authority, Pennsylvania, Hospital Revenue Bonds, Saint Vincent Health Center Project, Series 2010A, 7.000%, 7/01/27 | 7/20 at 100.00 | Baa3 | | 295,404 | |
| | | Nuveen Pennsylvania Dividend Advantage Municipal Fund 2 (continued) |
| NVY | | Portfolio of Investments |
April 30, 2011
| | Principal | | | Optional Call | | | | |
| | Amount (000) | | Description (1) | Provisions (2) | Ratings (3) | | Value | |
| | | | Health Care (continued) | | | | | |
| $ | 95 | | Erie County Hospital Authority, Pennsylvania, Revenue Bonds, Hamot Health Foundation, Series 2007, 5.000%, 11/01/37 – CIFG Insured | 11/17 at 100.00 | Aa3 | $ | 85,605 | |
| | 835 | | Franklin County Industrial Development Authority, Pennsylvania, Revenue Bonds, Chambersburg Hospital Project, Series 2010, 5.375%, 7/01/42 | No Opt. Call | A2 | | 769,419 | |
| | 270 | | Fulton County, Pennsylvania, Industrial Development Authority Hospital Revenue Bonds, Fulton County Medical Center Project, Series 2006, 5.900%, 7/01/40 | 7/16 at 100.00 | N/R | | 214,747 | |
| | 600 | | Lebanon County Health Facilities Authority, Pennsylvania, Revenue Bonds, Good Samaritan Hospital Project, Series 2002, 5.900%, 11/15/28 | 11/12 at 101.00 | BB+ | | 510,252 | |
| | 740 | | Lehigh County General Purpose Authority, Pennsylvania, Hospital Revenue Bonds, Lehigh Valley Health Network, Series 2008A, 5.000%, 7/01/33 – AGM Insured | 7/18 at 100.00 | AA+ | | 707,011 | |
| | 1,155 | | Lehigh County General Purpose Authority, Pennsylvania, Revenue Bonds, Good Shepherd Group, Series 2007, 5.000%, 11/01/37 – AGC Insured | 11/17 at 100.00 | AA+ | | 1,087,178 | |
| | 160 | | Monroe County Hospital Authority, Pennsylvania, Hospital Revenue Bonds, Pocono Medical Center, Series 2007, 5.125%, 1/01/37 | 1/17 at 100.00 | A– | | 142,342 | |
| | 175 | | Montgomery County Industrial Development Authority, Pennsylvania, FHA Insured Mortgage Revenue Bonds, New Regional Medical Center Project, Series 2010, 5.375%, 8/01/38 | 8/20 at 100.00 | AA | | 176,062 | |
| | 300 | | Philadelphia Hospitals and Higher Education Facilities Authority, Pennsylvania, Health System Revenue Bonds, Jefferson Health System, Series 2010B, 5.000%, 5/15/40 | 5/20 at 100.00 | AA | | 277,950 | |
| | 1,450 | | Washington County Hospital Authority, Pennsylvania, Revenue Bonds, Monongahela Valley Hospital Project, Series 2002, 6.250%, 6/01/22 | 6/12 at 101.00 | A3 | | 1,482,567 | |
| | 600 | | West Shore Area Hospital Authority, Cumberland County, Pennsylvania, Hospital Revenue Bonds, Holy Spirit Hospital of the Sisters of Christian Charity Project, Series 2001, 6.250%, 1/01/32 | 1/12 at 100.00 | BBB+ | | 582,342 | |
| | 335 | | West Shore Area Hospital Authority, Cumberland County, Pennsylvania, Hospital Revenue Bonds, Holy Spirit Hospital of the Sisters of Christian Charity Project, Series 2011, 6.500%, 1/01/36 | 1/21 at 100.00 | BBB+ | | 330,504 | |
| | 8,240 | | Total Health Care | | | | 7,701,398 | |
| | | | Housing/Multifamily – 1.8% (1.2% of Total Investments) | | | | | |
| | 200 | | Pennsylvania Higher Educational Facilities Authority, Revenue Bonds, Edinboro University Foundation Student Housing Project, Series 2010, 6.000%, 7/01/43 | No Opt. Call | BBB– | | 188,350 | |
| | 800 | | Pennsylvania Higher Educational Facilities Authority, Revenue Bonds, Slippery Rock University Foundation Inc., Student Housing Project, Series 2005A, 5.000%, 7/01/37 – SYNCORA GTY Insured | 7/15 at 100.00 | BBB+ | | 670,088 | |
| | 120 | | Philadelphia Authority for Industrial Development, Pennsylvania, Multifamily Housing Revenue Bonds, Presbyterian Homes Germantown – Morrisville Project, Series 2005A, 5.625%, 7/01/35 | 5/15 at 102.00 | Baa3 | | 99,196 | |
| | 1,120 | | Total Housing/Multifamily | | | | 957,634 | |
| | | | Housing/Single Family – 6.7% (4.4% of Total Investments) | | | | | |
| | | | Pennsylvania Housing Finance Agency, Single Family Mortgage Revenue Bonds, Series 2006-93A: | | | | | |
| | 175 | | 4.950%, 10/01/26 (Alternative Minimum Tax) | 4/15 at 100.00 | AA+ | | 170,972 | |
| | 185 | | 4.950%, 10/01/26 (Alternative Minimum Tax) (UB) | 4/15 at 100.00 | AA+ | | 180,741 | |
| | | | Pennsylvania Housing Finance Agency, Single Family Mortgage Revenue Bonds, Series 2006-94A: | | | | | |
| | 520 | | 5.150%, 10/01/37 (Alternative Minimum Tax) | 10/15 at 100.00 | AA+ | | 496,865 | |
| | 355 | | 5.150%, 10/01/37 (Alternative Minimum Tax) (UB) | 10/15 at 100.00 | AA+ | | 339,205 | |
| | | | Pennsylvania Housing Finance Agency, Single Family Mortgage Revenue Bonds, Series 2006-95A: | | | | | |
| | 245 | | 4.900%, 10/01/37 (Alternative Minimum Tax) | 10/15 at 100.00 | AA+ | | 229,817 | |
| | 225 | | 4.900%, 10/01/37 (Alternative Minimum Tax) (UB) | 10/15 at 100.00 | AA+ | | 211,057 | |
| | 1,100 | | Pennsylvania Housing Finance Agency, Single Family Mortgage Revenue Bonds, Series 2007-97A, 4.600%, 10/01/27 (Alternative Minimum Tax) (UB) | 10/16 at 100.00 | AA+ | | 1,094,071 | |
| | 430 | | Pennsylvania Housing Finance Agency, Single Family Mortgage Revenue Bonds, Series 2007-98A, 4.850%, 10/01/31 (Alternative Minimum Tax) (UB) | 10/16 at 100.00 | AA+ | | 396,937 | |
| | 400 | | Pennsylvania Housing Finance Agency, Single Family Mortgage Revenue Bonds, Series 2011-112, 5.000%, 10/01/25 | 10/20 at 100.00 | AA+ | | 405,992 | |
| | 3,635 | | Total Housing/Single Family | | | | 3,525,657 | |
| | Principal | | | Optional Call | | | | |
| | Amount (000) | | Description (1) | Provisions (2) | Ratings (3) | | Value | |
| | | | Industrials – 5.9% (3.9% of Total Investments) | | | | | |
| $ | 3,000 | | Pennsylvania Industrial Development Authority, Economic Development Revenue Bonds, Series 2002, 5.500%, 7/01/19 – AMBAC Insured | 7/12 at 101.00 | A1 | $ | 3,106,290 | |
| | | | Long-Term Care – 9.6% (6.3% of Total Investments) | | | | | |
| | | | Bucks County Industrial Development Authority, Pennsylvania, Revenue Bonds, Lutheran Community at Telford Center, Series 2007: | | | | | |
| | 250 | | 5.750%, 1/01/27 | 1/17 at 100.00 | N/R | | 206,130 | |
| | 400 | | 5.750%, 1/01/37 | 1/17 at 100.00 | N/R | | 302,816 | |
| | 1,000 | | Cumberland County Municipal Authority Revenue Bonds, Pennsylvania, Diakon Lutheran Social Ministries Project, Series 2009, 6.375%, 1/01/39 | 1/19 at 100.00 | N/R | | 978,910 | |
| | 300 | | Cumberland County Municipal Authority, Pennsylvania, Revenue Bonds, Diakon Lutheran Social Ministries, Series 2007, 5.000%, 1/01/36 | 1/17 at 100.00 | N/R | | 244,398 | |
| | 300 | | Delaware County Authority, Pennsylvania, Revenue Bonds, Elwyn, Inc. Project, Series 2010, 5.000%, 6/01/21 | 6/17 at 100.00 | BBB | | 296,016 | |
| | 205 | | Lancaster County Hospital Authority, Pennsylvania, Health Center Revenue Bonds, Masonic Homes Project, Series 2006, 5.000%, 11/01/36 | 11/16 at 100.00 | A | | 185,064 | |
| | 185 | | Lancaster County Hospital Authority, Pennsylvania, Revenue Bonds, Brethren Village Project, Series 2008A, 6.375%, 7/01/30 | 7/17 at 100.00 | N/R | | 175,243 | |
| | 785 | | Lebanon County Health Facilities Authority, Pennsylvania, Health Center Revenue Bonds, Pleasant View Retirement Community, Series 2005A, 5.300%, 12/15/26 | 12/14 at 100.00 | N/R | | 677,282 | |
| | | | Pennsylvania Economic Development Financing Authority, Revenue Bonds, Northwestern Human Services Inc., Series 1998A: | | | | | |
| | 1,260 | | 5.250%, 6/01/14 | 6/11 at 100.00 | BB | | 1,196,937 | |
| | 50 | | 5.125%, 6/01/18 | 6/11 at 100.00 | BB | | 43,658 | |
| | 750 | | Philadelphia Authority for Industrial Development, Pennsylvania, Revenue Bonds, Philadelphia Corporation for the Aging Project, Series 2001B, 5.250%, 7/01/23 – AMBAC Insured | 7/11 at 101.00 | Baa1 | | 750,555 | |
| | 5,485 | | Total Long-Term Care | | | | 5,057,009 | |
| | | | Materials – 4.4% (2.9% of Total Investments) | | | | | |
| | 400 | | Allegheny County Industrial Development Authority, Pennsylvania, Revenue Bonds, United States Steel Corporation, Series 2005, 5.500%, 11/01/16 | No Opt. Call | BB | | 403,812 | |
| | 280 | | Bradford County Industrial Development Authority, Pennsylvania, Solid Waste Disposal Revenue Bonds, International Paper Company, Series 2005B, 5.200%, 12/01/19 (Alternative Minimum Tax) | 12/15 at 100.00 | BBB | | 280,053 | |
| | 1,000 | | Bucks County Industrial Development Authority, Pennsylvania, Environmental Improvement Revenue Bonds, USX Corporation Project, Series 1995, 5.400%, 11/01/17 (Mandatory put 11/01/11) | No Opt. Call | BBB+ | | 1,029,780 | |
| | 750 | | Pennsylvania Economic Development Financing Authority, Exempt Facilities Revenue Bonds, National Gypsum Company, Series 1997B, 6.125%, 11/01/27 (Alternative Minimum Tax) | 11/11 at 100.00 | N/R | | 607,680 | |
| | 2,430 | | Total Materials | | | | 2,321,325 | |
| | | | Tax Obligation/General – 22.7% (14.9% of Total Investments) | | | | | |
| | 1,740 | | Butler County, Pennsylvania, Butler Area School District, General Obligation Bonds, Series 2002A, 5.375%, 10/01/26 – FGIC Insured | 10/12 at 100.00 | BBB | | 1,761,402 | |
| | 4,000 | | Delaware Valley Regional Finance Authority, Pennsylvania, Local Government Revenue Bonds, Series 2002, 5.750%, 7/01/17 (UB) | No Opt. Call | A+ | | 4,512,280 | |
| | | | Greensburg Salem School District, Westmoreland County, Pennsylvania, General Obligation Refunding Bonds, Series 2002: | | | | | |
| | 725 | | 5.375%, 9/15/15 – FGIC Insured | 9/12 at 100.00 | A+ | | 765,876 | |
| | 1,000 | | 5.375%, 9/15/16 – FGIC Insured | 9/12 at 100.00 | A+ | | 1,056,380 | |
| | 375 | | Philadelphia School District, Pennsylvania, General Obligation Bonds, Series 2007A, 5.000%, 6/01/34 – FGIC Insured | No Opt. Call | Aa2 | | 365,805 | |
| | 725 | | Philadelphia, Pennsylvania, General Obligation Bonds, Refunding Series 2011, 6.500%, 8/01/41 | 8/20 at 100.00 | A2 | | 754,812 | |
| | 950 | | Pine-Richland School District, Pennsylvania, General Obligation Bonds, School Improvement Series 2005, 5.000%, 7/15/35 – AGM Insured | 7/15 at 100.00 | AA+ | | 949,269 | |
| | | Nuveen Pennsylvania Dividend Advantage Municipal Fund 2 (continued) |
| NVY | | Portfolio of Investments |
April 30, 2011
| | Principal | | | Optional Call | | | | |
| | Amount (000) | | Description (1) | Provisions (2) | Ratings (3) | | Value | |
| | | | Tax Obligation/General (continued) | | | | | |
| $ | 225 | | Pittsburgh, Pennsylvania, General Obligation Bonds, Series 2006B, 5.250%, 9/01/16 – AGM Insured | No Opt. Call | AA+ | $ | 248,625 | |
| | 2,510 | | Reading School District, Berks County, Pennsylvania, General Obligation Bonds, Series 2003B, 0.000%, 1/15/32 – FGIC Insured | No Opt. Call | A | | 742,684 | |
| | 180 | | Scranton Parking Authority, Pennsylvania, Guaranteed Parking Revenue Bonds, Series 2004, 5.000%, 9/15/33 – FGIC Insured | 9/13 at 100.00 | BBB | | 159,494 | |
| | 600 | | York County, Pennsylvania, General Obligation Bonds, Series 2006, 5.000%, 6/01/33 – NPFG Insured | 12/15 at 100.00 | AA | | 605,970 | |
| | 13,030 | | Total Tax Obligation/General | | | | 11,922,597 | |
| | | | Tax Obligation/Limited – 23.0% (15.1% of Total Investments) | | | | | |
| | 1,000 | | Allegheny County Redevelopment Authority, Pennsylvania, TIF Revenue Bonds, Pittsburg Mills Project, Series 2004, 5.600%, 7/01/23 | No Opt. Call | N/R | | 899,320 | |
| | 1,500 | | Dormitory Authority of the State of New York, Revenue Bonds, School Districts Financing Program, Series 2009C, 5.125%, 10/01/36 – AGC Insured | 10/19 at 100.00 | AA+ | | 1,498,875 | |
| | 4,000 | | Harrisburg Parking Authority, Pennsylvania, Guaranteed Revenue Refunding Bonds, Series 2001J, 5.000%, 9/01/22 – NPFG Insured | 9/11 at 100.00 | Baa1 | | 3,768,200 | |
| | 610 | | Pennsylvania Turnpike Commission, Oil Franchise Tax Senior Lien Revenue Bonds, Series 2003A, 5.000%, 12/01/32 – NPFG Insured | 12/18 at 100.00 | AA | | 615,917 | |
| | 1,200 | | Pennsylvania Turnpike Commission, Registration Fee Revenue Bonds, Series 2005A, 5.250%, 7/15/18 – AGM Insured | No Opt. Call | AA+ | | 1,387,584 | |
| | | | Philadelphia Redevelopment Authority, Pennsylvania, Revenue Bonds, Philadelphia Neighborhood Transformation Initiative, Series 2002A: | | | | | |
| | 1,000 | | 5.500%, 4/15/18 – FGIC Insured | 4/12 at 100.00 | A2 | | 1,029,430 | |
| | 1,750 | | 5.500%, 4/15/22 – FGIC Insured | 4/12 at 100.00 | A2 | | 1,788,500 | |
| | 800 | | Puerto Rico Highway and Transportation Authority, Highway Revenue Bonds, Series 2007N, 5.250%, 7/01/33 – NPFG Insured | No Opt. Call | A3 | | 725,072 | |
| | 710 | | Puerto Rico Infrastructure Financing Authority, Special Tax Revenue Bonds, Series 2005A, 0.000%, 7/01/32 – FGIC Insured | No Opt. Call | A3 | | 158,962 | |
| | 250 | | Washington County Redevelopment Authority, Pennsylvania, Tanger Outlet Victory Center Tax Increment Bonds, Series 2006A, 5.450%, 7/01/35 | 7/17 at 100.00 | N/R | | 204,363 | |
| | 12,820 | | Total Tax Obligation/Limited | | | | 12,076,223 | |
| | | | Transportation – 9.9% (6.5% of Total Investments) | | | | | |
| | 130 | | Delaware River Joint Toll Bridge Commission, New Jersey and Pennsylvania, Revenue Bonds, Series 2003, 5.250%, 7/01/17 | 7/13 at 100.00 | A2 | | 139,022 | |
| | 720 | | Delaware River Port Authority, New Jersey and Pennsylvania, Revenue Bonds, Series 2010E, 5.000%, 1/01/40 | 1/20 at 100.00 | A– | | 711,302 | |
| | 1,000 | | Pennsylvania Economic Development Financing Authority, Revenue Bonds, Amtrak 30th Street Station Parking Garage, Series 2002, 5.875%, 6/01/33 – ACA Insured (Alternative Minimum Tax) | 6/12 at 102.00 | BBB+ | | 953,040 | |
| | | | Pennsylvania Turnpike Commission, Motor License Fund-Enhanced Subordinate Special Revenue Bonds, Series 2010A: | | | | | |
| | 875 | | 0.000%, 12/01/34 | 12/20 at 100.00 | AA | | 646,739 | |
| | 250 | | 5.000%, 12/01/38 | No Opt. Call | Aa3 | | 245,220 | |
| | 670 | | Pennsylvania Turnpike Commission, Turnpike Revenue Bonds, Series 2006A, 5.000%, 12/01/24 – AMBAC Insured | 6/16 at 100.00 | Aa3 | | 702,629 | |
| | 150 | | Pennsylvania Turnpike Commission, Turnpike Revenue Bonds, Subordinate Lien, Refunding Series 2009B-1, 5.000%, 12/01/37 | 12/19 at 100.00 | A– | | 139,578 | |
| | 1,000 | | Pennsylvania Turnpike Commission, Turnpike Subordinate Revenue Bonds, Series 2009C, 0.000%, 6/01/33 – AGM Insured | 6/26 at 100.00 | AA+ | | 792,190 | |
| | Principal | | | Optional Call | | | | |
| | Amount (000) | | Description (1) | Provisions (2) | Ratings (3) | | Value | |
| | | | Transportation (continued) | | | | | |
| $ | 1,000 | | Susquehanna Area Regional Airport Authority, Pennsylvania, Airport System Revenue Bonds, Series 2003A, 5.000%, 1/01/28 – AMBAC Insured (Alternative Minimum Tax) | 1/13 at 100.00 | Baa3 | $ | 860,910 | |
| | 5,795 | | Total Transportation | | | | 5,190,630 | |
| | | | U.S. Guaranteed – 21.4% (14.0% of Total Investments) (4) | | | | | |
| | 1,155 | | Bucks County Industrial Development Authority, Pennsylvania, Revenue Bonds, Pennswood Village Project, Series 2002A, 6.000%, 10/01/34 (Pre-refunded 10/01/12) | 10/12 at 101.00 | N/R (4) | | 1,252,817 | |
| | 1,000 | | Cumberland County Municipal Authority, Pennsylvania, Retirement Community Revenue Bonds, Wesley Affiliated Services Inc., Series 2002A, 7.125%, 1/01/25 (Pre-refunded 1/01/13) | 1/13 at 101.00 | N/R (4) | | 1,116,320 | |
| | 325 | | Delaware County Authority, Pennsylvania, College Revenue Refunding Bonds, Neumann College, Series 2001, 6.000%, 10/01/31 (Pre-refunded 10/01/11) | 10/11 at 100.00 | BBB (4) | | 332,790 | |
| | 2,000 | | Grove City Area Hospital Authority, Mercer County, Pennsylvania, Revenue Bonds, County Guaranteed, Woodland Place Project, Series 2002, 5.400%, 3/01/31 (Pre-refunded 3/01/12) – FGIC Insured | 3/12 at 100.00 | BBB (4) | | 2,082,820 | |
| | 1,100 | | Luzerne County, Pennsylvania, General Obligation Bonds, Series 2002B, 0.000%, 11/15/21 (Pre-refunded 11/15/12) – NPFG Insured | 11/12 at 57.98 | N/R (4) | | 628,265 | |
| | 225 | | Pennsylvania Economic Development Financing Authority, Exempt Facilities Revenue Bonds, Reliant Energy Inc., Series 2003A, 6.750%, 12/01/36 (Pre-refunded 6/01/11) (Alternative Minimum Tax) | 6/11 at 103.00 | B1 (4) | | 232,853 | |
| | 1,445 | | Pennsylvania Turnpike Commission, Registration Fee Revenue Bonds, Series 2001, 5.500%, 7/15/33 (Pre-refunded 7/15/11) – AMBAC Insured | 7/11 at 101.00 | Aa3 (4) | | 1,475,490 | |
| | 315 | | Philadelphia Authority for Industrial Development, Pennsylvania, Revenue Bonds, Franklin Towne Charter High School, Series 2006A, 5.250%, 1/01/27 (Pre-refunded 1/01/17) | 1/17 at 100.00 | N/R (4) | | 367,514 | |
| | 1,650 | | Philadelphia Gas Works, Pennsylvania, Revenue Bonds, General Ordinance, Fourth Series 1998, 5.250%, 8/01/20 (Pre-refunded 8/01/13) – AGM Insured | 8/13 at 100.00 | AA+ (4) | | 1,816,601 | |
| | 50 | | Philadelphia Gas Works, Pennsylvania, Revenue Bonds, Twelfth Series 1990B, 7.000%, 5/15/20 – NPFG Insured (ETM) | No Opt. Call | BBB (4) | | 61,238 | |
| | 1,500 | | Philadelphia School District, Pennsylvania, General Obligation Bonds, Series 2002A, 5.500%, 2/01/31 (Pre-refunded 2/01/12) – AGM Insured | 2/12 at 100.00 | AA+ (4) | | 1,558,440 | |
| | 225 | | St. Mary Hospital Authority, Pennsylvania, Health System Revenue Bonds, Catholic Health East, Series 2004B, 5.375%, 11/15/34 (Pre-refunded 11/15/14) | 11/14 at 100.00 | A1 (4) | | 256,700 | |
| | 25 | | West Shore Area Hospital Authority, Cumberland County, Pennsylvania, Hospital Revenue Bonds, Holy Spirit Hospital of the Sisters of Christian Charity Project, Series 2001, 6.150%, 1/01/21 (Pre-refunded 1/01/12) | 1/12 at 100.00 | BBB+ (4) | | 25,970 | |
| | 11,015 | | Total U.S. Guaranteed | | | | 11,207,818 | |
| | | | Utilities – 2.4% (1.6% of Total Investments) | | | | | |
| | 145 | | Philadelphia Gas Works, Pennsylvania, Revenue Bonds, General Ordinance, Fifth Series 2004A-1, 5.000%, 9/01/26 – AGM Insured | 9/14 at 100.00 | AA+ | | 146,298 | |
| | 1,240 | | Philadelphia Gas Works, Pennsylvania, Revenue Bonds, Seventh Series, 2007, 5.000%, 10/01/37 – AMBAC Insured | 10/17 at 100.00 | BBB+ | | 1,115,144 | |
| | 1,385 | | Total Utilities | | | | 1,261,442 | |
| | | Nuveen Pennsylvania Dividend Advantage Municipal Fund 2 (continued) |
| NVY | | Portfolio of Investments |
April 30, 2011
| | Principal | | | Optional Call | | | | |
| | Amount (000) | | Description (1) | Provisions (2) | Ratings (3) | | Value | |
| | | | Water and Sewer – 10.4% (6.8% of Total Investments) | | | | | |
| $ | 4,500 | | Bucks County Industrial Development Authority, Pennsylvania, Water Facility Revenue Bonds, Pennsylvania Suburban Water Company, Series 2002, 5.550%, 9/01/32 – NPFG Insured (Alternative Minimum Tax) | 3/12 at 100.00 | AA– | $ | 4,503,555 | |
| | 600 | | Harrisburg Authority, Dauphin County, Pennsylvania, Water Revenue Refunding Bonds, Series 2004, 5.000%, 7/15/22 – AGM Insured | 7/14 at 100.00 | AA+ | | 549,191 | |
| | 400 | | Luzerne County Industrial Development Authority, Pennsylvania, Water Facility Revenue Refunding Bonds, Pennsylvania-American Water Company, Series 2009, 5.500%, 12/01/39 | 12/19 at 100.00 | A | | 390,963 | |
| | 5,500 | | Total Water and Sewer | | | | 5,443,709 | |
| $ | 83,940 | | Total Investments (cost $80,779,177) – 152.3% | | | | 79,933,207 | |
| | | | Floating Rate Obligations – (8.3)% | | | | (4,370,000 | ) |
| | | | MuniFund Term Preferred Shares, at Liquidation Value – (46.8)% (5) | | | | (24,550,000 | ) |
| | | | Other Assets Less Liabilities – 2.8% | | | | 1,456,484 | |
| | | | Net Assets Applicable to Common Shares – 100% | | | $ | 52,469,691 | |
| (1) | | All percentages shown in the Portfolio of Investments are based on net assets applicable to Common shares unless otherwise noted. |
| (2) | | Optional Call Provisions (not covered by the report of independent registered public accounting firm): Dates (month and year) and prices of the earliest optional call or redemption. There may be other call provisions at varying prices at later dates. Certain mortgage-backed securities may be subject to periodic principal paydowns. |
| (3) | | Ratings (not covered by the report of independent registered public accounting firm): Using the highest of Standard & Poor’s Group (“Standard & Poor’s”), Moody’s Investor Service, Inc. (“Moody’s”) or Fitch, Inc. (“Fitch”) rating. Ratings below BBB by Standard & Poor’s, Baa by Moody’s or BBB by Fitch are considered to be below investment grade. Holdings designated N/R are not rated by any of these national rating agencies. |
| (4) | | Backed by an escrow or trust containing sufficient U.S. Government or U.S. Government agency securities, which ensure the timely payment of principal and interest. Such investments are normally considered to be equivalent to AAA rated securities. |
| (5) | | MuniFund Term Preferred Shares, at Liquidation Value as a percentage of Total Investments is 30.7%. |
| N/R | | Not rated. |
| (ETM) | | Escrowed to maturity. |
| (UB) | | Underlying bond of an inverse floating rate trust reflected as a financing transaction. See Notes to Financial Statements, Footnote 1 – General Information and Significant Accounting Policies, Inverse Floating Rate Securities for more information. |
See accompanying notes to financial statements.
| | | Nuveen Pennsylvania Municipal Value Fund |
| NPN | | Portfolio of Investments |
April 30, 2011
| | Principal | | | Optional Call | | | | |
| | Amount (000) | | Description (1) | Provisions (2) | Ratings (3) | | Value | |
| | | | Consumer Staples – 3.5% (3.7% of Total Investments) | | | | | |
| $ | 650 | | District of Columbia Tobacco Settlement Corporation, Tobacco Settlement Asset-Backed Bonds, Series 2001, 6.500%, 5/15/33 | No Opt. Call | BBB | $ | 638,040 | |
| | | | Education and Civic Organizations – 9.6% (9.9% of Total Investments) | | | | | |
| | 675 | | Delaware County Authority, Pennsylvania, Revenue Bonds, Neumann College, Series 2008, 6.000%, 10/01/30 | 10/18 at 100.00 | BBB | | 666,583 | |
| | 500 | | Lehigh County General Purpose Authority, Pennsylvania, College Revenue Bonds, Muhlenberg College Project, Series 2009, 5.250%, 2/01/39 | 2/19 at 100.00 | A+ | | 506,695 | |
| | 500 | | Montgomery County Higher Education and Health Authority, Pennsylvania, Revenue Bonds, Arcadia University, Series 2006, 5.000%, 4/01/36 – RAAI Insured | 4/16 at 100.00 | BBB+ | | 425,450 | |
| | 50 | | Philadelphia Authority for Industrial Development, Pennsylvania, Revenue Bonds, MaST Charter School Project, Series 2010, 6.000%, 8/01/35 | 8/20 at 100.00 | BBB+ | | 47,843 | |
| | 100 | | Wilkes-Barre Finance Authority, Pennsylvania, Revenue Bonds, University of Scranton, Series 2010, 5.000%, 11/01/40 | 11/20 at 100.00 | A | | 92,742 | |
| | 1,825 | | Total Education and Civic Organizations | | | | 1,739,313 | |
| | | | Health Care – 27.1% (27.9% of Total Investments) | | | | | |
| | 750 | | Allegheny County Hospital Development Authority, Pennsylvania, University of Pittsburgh Medical Center Revenue Bonds, Series 2009A, 5.500%, 8/15/34 | No Opt. Call | Aa3 | | 733,560 | |
| | 750 | | Geisinger Authority, Montour County, Pennsylvania, Health System Revenue Bonds, Geisinger Health System, Series 2009A, 5.250%, 6/01/39 | 6/19 at 100.00 | AA | | 744,518 | |
| | 350 | | Hospital Authority of Delaware County, Indiana, Hospital Revenue Bonds, Cardinal Health System, Series 2006, 5.000%, 8/01/24 | 8/16 at 100.00 | Baa3 | | 325,882 | |
| | 350 | | Illinois Finance Authority, Revenue Bonds, OSF Healthcare System, Series 2007A, 5.750%, 11/15/37 | 11/17 at 100.00 | A | | 328,314 | |
| | 500 | | Pennsylvania Economic Development Financing Authority, Health System Revenue Bonds , Albert Einstein Healthcare, Series 2009A, 6.250%, 10/15/23 | No Opt. Call | Baa1 | | 515,910 | |
| | 250 | | Philadelphia Hospitals and Higher Education Facilities Authority, Pennsylvania, Hospital Revenue Bonds, Temple University Hospital, Series 1993A, 6.625%, 11/15/23 | 5/11 at 100.00 | BBB | | 250,090 | |
| | 1,200 | | Southcentral Pennsylvania General Authority, Revenue Bonds, Hanover Hospital Inc., Series 2005, 5.000%, 12/01/29 – RAAI Insured | 12/15 at 100.00 | BBB– | | 1,000,521 | |
| | 745 | | St. Mary Hospital Authority, Pennsylvania, Health System Revenue Bonds, Catholic Health East, Series 2009D, 6.250%, 11/15/34 | 5/19 at 100.00 | A1 | | 774,040 | |
| | 200 | | Wisconsin Health and Educational Facilities Authority, Revenue Bonds, ProHealth Care, Inc. Obligated Group, Series 2009, 6.625%, 2/15/32 | 2/14 at 100.00 | A+ | | 204,384 | |
| | 5,095 | | Total Health Care | | | | 4,877,219 | |
| | | | Housing/Multifamily – 4.6% (4.7% of Total Investments) | | | | | |
| | 50 | | Pennsylvania Higher Educational Facilities Authority, Revenue Bonds, Edinboro University Foundation Student Housing Project, Series 2010, 6.000%, 7/01/43 | No Opt. Call | BBB– | | 47,088 | |
| | 800 | | Pittsburgh Urban Redevelopment Authority, Pennsylvania, Multifamily Housing Revenue Bonds, Eva P. Mithcell Residence Project, Series 2009, 5.100%, 10/20/44 | 10/19 at 100.00 | Aaa | | 780,176 | |
| | 850 | | Total Housing/Multifamily | | | | 827,264 | |
| | | | Housing/Single Family – 4.3% (4.4% of Total Investments) | | | | | |
| | 800 | | Pennsylvania Housing Finance Agency, Single Family Mortgage Revenue Bonds, Series 2009-105-C, 5.000%, 10/01/39 | 4/19 at 100.00 | AA+ | | 777,504 | |
| | | Nuveen Pennsylvania Municipal Value Fund (continued) |
| NPN | | Portfolio of Investments |
April 30, 2011
| | Principal | | | Optional Call | | | | |
| | Amount (000) | | Description (1) | Provisions (2) | Ratings (3) | | Value | |
| | | | Long-Term Care – 4.2% (4.4% of Total Investments) | | | | | |
| $ | 750 | | Montgomery County Industrial Development Authority, Pennsylvania, Retirement Communities Revenue Bonds, ACTS Retirement – Life Communities, Inc. Obligated Group, Series 2009A-1, 6.250%, 11/15/29 | 11/19 at 100.00 | BBB+ | $ | 761,865 | |
| | | | Tax Obligation/General – 4.0% (4.1% of Total Investments) | | | | | |
| | 700 | | Bethel Park School District, Allegheny County, Pennsylvania, General Obligation Bonds, Series 2009, 5.100%, 8/01/33 | 8/19 at 100.00 | Aa2 | | 721,343 | |
| | | | Tax Obligation/Limited – 16.5% (16.9% of Total Investments) | | | | | |
| | 550 | | Guam Government, Limited Obligation Section 30 Revenue Bonds, Series 2009A, 5.750%, 12/01/34 | 12/19 at 100.00 | BBB– | | 533,407 | |
| | 1,075 | | Harrisburg Parking Authority, Dauphin County, Pennsylvania, Guaranteed Parking Revenue Bonds, Series 2007R, 4.250%, 5/15/21 – SYNCORA GTY Insured | 11/16 at 100.00 | N/R | | 909,912 | |
| | 750 | | Philadelphia Municipal Authority, Philadelphia, Pennsylvania, Lease Revenue Bonds, Series 2009, 6.500%, 4/01/34 | No Opt. Call | A2 | | 772,373 | |
| | 750 | | Puerto Rico Sales Tax Financing Corporation, Sales Tax Revenue Bonds, First Subordinate Series 2009A, 6.000%, 8/01/42 | 8/19 at 100.00 | A+ | | 751,365 | |
| | 3,125 | | Total Tax Obligation/Limited | | | | 2,967,057 | |
| | | | Transportation – 5.5% (5.7% of Total Investments) | | | | | |
| | 240 | | Delaware River Port Authority, New Jersey and Pennsylvania, Revenue Bonds, Series 2010E, 5.000%, 1/01/40 | 1/20 at 100.00 | A– | | 237,101 | |
| | | | Pennsylvania Turnpike Commission, Motor License Fund-Enhanced Subordinate Special Revenue Bonds, Series 2010A: | | | | | |
| | 580 | | 0.000%, 12/01/34 | 12/20 at 100.00 | AA | | 428,695 | |
| | 100 | | 5.000%, 12/01/38 | No Opt. Call | Aa3 | | 98,088 | |
| | 50 | | Pennsylvania Turnpike Commission, Turnpike Revenue Bonds, Subordinate Lien, Refunding Series 2009B-1, 5.000%, 12/01/37 | 12/19 at 100.00 | A– | | 46,526 | |
| | 30 | | Susquehanna Area Regional Airport Authority, Pennsylvania, Airport System Revenue Bonds, Series 2003A, 5.000%, 1/01/28 – AMBAC Insured (Alternative Minimum Tax) | 1/13 at 100.00 | Baa3 | | 25,827 | |
| | 200 | | Susquehanna Area Regional Airport Authority, Pennsylvania, Airport System Revenue Bonds, Series 2003B, 5.000%, 1/01/33 – AMBAC Insured | 1/13 at 100.00 | Baa3 | | 162,674 | |
| | 1,200 | | Total Transportation | | | | 998,911 | |
| | | | U.S. Guaranteed – 0.0% (0.0% of Total Investments) (4) | | | | | |
| | 5 | | Allegheny County Hospital Development Authority, Pennsylvania, Hospital Revenue Bonds, Allegheny Valley Hospital – Sublessee, Series 1982Q, 7.000%, 8/01/15 (ETM) | No Opt. Call | AAA | | 5,909 | |
| | | | Utilities – 2.8% (2.9% of Total Investments) | | | | | |
| | 500 | | Delaware County Industrial Development Authority, Pennsylvania, Resource Recovery Revenue Refunding Bonds, Series 1997A, 6.100%, 7/01/13 (Mandatory put 1/01/13) | 7/11 at 100.00 | BB+ | | 500,960 | |
| | | | Water and Sewer – 15.0% (15.4% of Total Investments) | | | | | |
| | 750 | | Chester County Industrial Development Authority, Pennsylvania, Water Facilities Revenue Bonds, Aqua Pennsylvania Inc. Project, Series 2007A, 5.000%, 2/01/40 – FGIC Insured | 2/17 at 100.00 | AA– | | 696,593 | |
| | 750 | | New York City Municipal Water Finance Authority, New York, Water and Sewerage System Revenue Bonds, Tender Option Bond Trust 3484, 17.712%, 6/15/33 (IF) | 6/19 at 100.00 | AA+ | | 752,790 | |
| | Principal | | | Optional Call | | | | |
| | Amount (000) | | Description (1) | Provisions (2) | Ratings (3) | | Value | |
| | | | Water and Sewer (continued) | | | | | |
| | | | Philadelphia, Pennsylvania, Water and Wastewater Revenue Bonds, Series 2009A: | | | | | |
| $ | 750 | | 5.250%, 1/01/32 | 1/19 at 100.00 | A1 | $ | 756,540 | |
| | 500 | | 5.250%, 1/01/36 | 1/19 at 100.00 | A1 | | 491,140 | |
| | 2,750 | | Total Water and Sewer | | | | 2,697,063 | |
| $ | 18,250 | | Total Investments (cost $16,935,624) – 97.1% | | | | 17,512,448 | |
| | | | Other Assets Less Liabilities – 2.9% | | | | 516,242 | |
| | | | Net Assets Applicable to Common Shares – 100% | | | $ | 18,028,690 | |
| (1) | | All percentages shown in the Portfolio of Investments are based on net assets applicable to Common shares unless otherwise noted. |
| (2) | | Optional Call Provisions (not covered by the report of independent registered public accounting firm): Dates (month and year) and prices of the earliest optional call or redemption. There may be other call provisions at varying prices at later dates. Certain mortgage-backed securities may be subject to periodic principal paydowns. |
| (3) | | Ratings (not covered by the report of independent registered public accounting firm): Using the highest of Standard & Poor’s Group (“Standard & Poor’s”), Moody’s Investor Service, Inc. (“Moody’s”) or Fitch, Inc. (“Fitch”) rating. Ratings below BBB by Standard & Poor’s, Baa by Moody’s or BBB by Fitch are considered to be below investment grade. Holdings designated N/R are not rated by any of these national rating agencies. |
| (4) | | Backed by an escrow or trust containing sufficient U.S. Government or U.S. Government agency securities, which ensure the timely payment of principal and interest. |
| N/R | | Not rated. |
| (ETM) | | Escrowed to maturity. |
| (IF) | | Inverse floating rate investment. |
See accompanying notes to financial statements.
| | | Statement of |
| | | Assets & Liabilities |
| | | April 30, 2011 |
| | | New Jersey Investment Quality (NQJ | ) | New Jersey Premium Income (NNJ | ) | New Jersey Dividend Advantage (NXJ | ) | New Jersey Dividend Advantage 2 (NUJ | ) | New Jersey Municipal Value (NJV | ) |
| Assets | | | | | | | | | | | | | | | | |
| Investments, at value (cost $421,705,226, $256,390,870, $136,003,695, $97,729,320 and $23,459,225, respectively) | | $ | 410,067,184 | | $ | 253,504,215 | | $ | 131,066,009 | | $ | 94,476,145 | | $ | 24,071,540 | |
| Cash | | | 8,091,052 | | | 2,827,276 | | | 1,067,824 | | | 490,314 | | | 118,823 | |
| Receivables: | | | | | | | | | | | | | | | | |
| Interest | | | 7,018,244 | | | 4,043,628 | | | 2,218,662 | | | 1,654,353 | | | 416,645 | |
| Investments sold | | | — | | | — | | | — | | | — | | | — | |
| Deferred offering costs | | | 776,708 | | | 616,388 | | | 903,931 | | | 764,799 | | | — | |
| Other assets | | | 154,592 | | | 97,503 | | | 15,930 | | | 11,432 | | | 120 | |
| Total assets | | | 426,107,780 | | | 261,089,010 | | | 135,272,356 | | | 97,397,043 | | | 24,607,128 | |
| Liabilities | | | | | | | | | | | | | | | | |
| Floating rate obligations | | | — | | | — | | | — | | | — | | | 1,500,000 | |
| Payables: | | | | | | | | | | | | | | | | |
| Common share dividends | | | 1,225,587 | | | 708,056 | | | 433,320 | | | 312,030 | | | 89,383 | |
| Interest | | | — | | | — | | | 106,047 | | | 58,413 | | | — | |
| Investments purchased | | | — | | | 75,685 | | | — | | | 202,990 | | | — | |
| Offering costs | | | 277,516 | | | 271,967 | | | 368,750 | | | 191,995 | | | — | |
| MuniFund Term Preferred (MTP) shares, at liquidation value | | | — | | | — | | | 44,861,000 | | | 35,050,000 | | | — | |
| Variable Rate Demand Preferred (VRDP) shares, at liquidation value | | | 144,300,000 | | | 88,600,000 | | | — | | | — | | | — | |
| Accrued expenses: | | | | | | | | | | | | | | | | |
| Management fees | | | 215,593 | | | 133,484 | | | 70,186 | | | 46,237 | | | 11,515 | |
| Other | | | 121,096 | | | 87,522 | | | 34,432 | | | 32,465 | | | 25,470 | |
| Total liabilities | | | 146,139,792 | | | 89,876,714 | | | 45,873,735 | | | 35,894,130 | | | 1,626,368 | |
| Net assets applicable to Common shares | | $ | 279,967,988 | | $ | 171,212,296 | | $ | 89,398,621 | | $ | 61,502,913 | | $ | 22,980,760 | |
| Common shares outstanding | | | 20,453,722 | | | 12,036,596 | | | 6,569,912 | | | 4,523,313 | | | 1,560,787 | |
| Net asset value per Common share outstanding (net assets applicable to Common shares, divided by Common shares outstanding) | | $ | 13.69 | | $ | 14.22 | | $ | 13.61 | | $ | 13.60 | | $ | 14.72 | |
| Net assets applicable to Common shares consist of: | | | | | | | | | | | | | | | | |
| Common shares, $.01 par value per share | | $ | 204,537 | | $ | 120,366 | | $ | 65,699 | | $ | 45,233 | | $ | 15,608 | |
| Paid-in surplus | | | 288,688,845 | | | 171,855,376 | | | 93,302,558 | | | 64,079,893 | | | 22,286,072 | |
| Undistributed (Over-distribution of) net investment income | | | 4,215,712 | | | 2,849,697 | | | 1,417,049 | | | 927,258 | | | 81,348 | |
| Accumulated net realized gain (loss) | | | (1,503,064 | ) | | (726,488 | ) | | (448,999 | ) | | (296,296 | ) | | (14,583 | ) |
| Net unrealized appreciation (depreciation) | | | (11,638,042 | ) | | (2,886,655 | ) | | (4,937,686 | ) | | (3,253,175 | ) | | 612,315 | |
| Net assets applicable to Common shares | | $ | 279,967,988 | | $ | 171,212,296 | | $ | 89,398,621 | | $ | 61,502,913 | | $ | 22,980,760 | |
| Authorized shares: | | | | | | | | | | | | | | | | |
| Common | | | 200,000,000 | | | 200,000,000 | | | Unlimited | | | Unlimited | | | Unlimited | |
| Auction Rate Preferred Shares (“ARPS”) | | | 1,000,000 | | | 1,000,000 | | | Unlimited | | | Unlimited | | | N/A | |
| MTP | | | — | | | — | | | — | | | Unlimited | | | — | |
| VRDP | | | Unlimited | | | Unlimited | | | — | | | — | | | — | |
| N/A – Fund is not authorized to issue ARPS. | | | | | | | | | | | | | |
See accompanying notes to financial statements.
| | | Pennsylvania Investment Quality (NQP | ) | Pennsylvania Premium Income 2 (NPY | ) | Pennsylvania Dividend Advantage (NXM | ) | Pennsylvania Dividend Advantage 2 (NVY | ) | Pennsylvania Municipal Value (NPN | ) |
| Assets | | | | | | | | | | | | | | | | |
| Investments, at value (cost $359,425,221, $311,379,614, $70,571,889, $80,779,177 and $16,935,624, respectively) | | $ | 356,951,589 | | $ | 309,637,875 | | $ | 69,346,373 | | $ | 79,933,207 | | $ | 17,512,448 | |
| Cash | | | 1,472,800 | | | 10,827,472 | | | 98,547 | | | 274,151 | | | 294,948 | |
| Receivables: | | | | | | | | | | | | | | | | |
| Interest | | | 5,684,395 | | | 5,174,672 | | | 1,166,538 | | | 1,113,860 | | | 319,218 | |
| Investments sold | | | 5,370,000 | | | 60,000 | | | 70,000 | | | 5,000 | | | — | |
| Deferred offering costs | | | 684,469 | | | 649,086 | | | 604,974 | | | 630,338 | | | — | |
| Other assets | | | 123,704 | | | 112,298 | | | 8,311 | | | 29,515 | | | 90 | |
| Total assets | | | 370,286,957 | | | 326,461,403 | | | 71,294,743 | | | 81,986,071 | | | 18,126,704 | |
| Liabilities | | | | | | | | | | | | | | | | |
| Floating rate obligations | | | 26,715,000 | | | 12,385,000 | | | 1,070,000 | | | 4,370,000 | | | — | |
| Payables: | | | | | | | | | | | | | | | | |
| Common share dividends | | | 1,045,874 | | | 981,099 | | | 228,891 | | | 269,160 | | | 63,986 | |
| Interest | | | — | | | — | | | 40,583 | | | 43,985 | | | — | |
| Investments purchased | | | 2,552,644 | | | 1,701,762 | | | — | | | — | | | — | |
| Offering costs | | | 291,711 | | | 298,175 | | | 178,559 | | | 213,435 | | | — | |
| MuniFund Term Preferred (MTP) shares, at liquidation value | | | — | | | — | | | 23,190,000 | | | 24,550,000 | | | — | |
| Variable Rate Demand Preferred (VRDP) shares, at liquidation value | | | 112,500,000 | | | 100,000,000 | | | — | | | — | | | — | |
| Accrued expenses: | | | | | | | | | | | | | | | | |
| Management fees | | | 173,183 | | | 159,808 | | | 36,282 | | | 38,428 | | | 9,524 | |
| Other | | | 103,452 | | | 96,398 | | | 29,645 | | | 31,372 | | | 24,504 | |
| Total liabilities | | | 143,381,864 | | | 115,622,242 | | | 24,773,960 | | | 29,516,380 | | | 98,014 | |
| Net assets applicable to Common shares | | $ | 226,905,093 | | $ | 210,839,161 | | $ | 46,520,783 | | $ | 52,469,691 | | $ | 18,028,690 | |
| Common shares outstanding | | | 16,080,898 | | | 15,595,551 | | | 3,321,984 | | | 3,726,116 | | | 1,219,352 | |
| Net asset value per Common share outstanding (net assets applicable to Common shares, divided by Common shares outstanding) | | $ | 14.11 | | $ | 13.52 | | $ | 14.00 | | $ | 14.08 | | $ | 14.79 | |
| Net assets applicable to Common shares consist of: | | | | | | | | | | | | | | | | |
| Common shares, $.01 par value per share | | $ | 160,809 | | $ | 155,956 | | $ | 33,220 | | $ | 37,261 | | $ | 12,194 | |
| Paid-in surplus | | | 227,895,209 | | | 213,687,401 | | | 47,112,058 | | | 52,757,672 | | | 17,430,831 | |
| Undistributed (Over-distribution of) net investment income | | | 3,488,103 | | | 3,381,190 | | | 691,337 | | | 822,618 | | | 8,923 | |
| Accumulated net realized gain (loss) | | | (2,165,396 | ) | | (4,643,647 | ) | | (90,316 | ) | | (301,890 | ) | | (82 | ) |
| Net unrealized appreciation (depreciation) | | | (2,473,632 | ) | | (1,741,739 | ) | | (1,225,516 | ) | | (845,970 | ) | | 576,824 | |
| Net assets applicable to Common shares | | $ | 226,905,093 | | $ | 210,839,161 | | $ | 46,520,783 | | $ | 52,469,691 | | $ | 18,028,690 | |
| Authorized shares: | | | | | | | | | | | | | | | | |
| Common | | | Unlimited | | | Unlimited | | | Unlimited | | | Unlimited | | | Unlimited | |
| Auction Rate Preferred Shares (“ARPS”) | | | Unlimited | | | Unlimited | | | Unlimited | | | Unlimited | | | N/A | |
| MTP | | | — | | | — | | | Unlimited | | | Unlimited | | | — | |
| VRDP | | | Unlimited | | | Unlimited | | | — | | | — | | | — | |
| N/A – Fund is not authorized to issue ARPS. | | | | | | | | | | | | | |
See accompanying notes to financial statements.
| | | Statement of |
| | | Operations |
| | | Year Ended April 30, 2011 |
| | | New Jersey Investment Quality (NQJ | ) | New Jersey Premium Income (NNJ | ) | New Jersey Dividend Advantage (NXJ | ) | New Jersey Dividend Advantage 2 (NUJ | ) | New Jersey Municipal Value (NJV | ) |
| Investment Income | | $ | 21,783,159 | | $ | 13,153,905 | | $ | 6,997,889 | | $ | 5,000,869 | | $ | 1,488,050 | |
| Expenses | | | | | | | | | | | | | | | | |
| Management fees | | | 2,724,737 | | | 1,682,009 | | | 885,296 | | | 625,163 | | | 149,246 | |
| Auction fees | | | 160,003 | | | 103,066 | | | 55,482 | | | 16,895 | | | N/A | |
| Dividend disbursing agent fees | | | 15,014 | | | 15,890 | | | 10,000 | | | 10,000 | | | N/A | |
| Shareholders’ servicing agent fees and expenses | | | 29,925 | | | 18,496 | | | 1,520 | | | 12,562 | | | 164 | |
| Interest expense and amortization of offering costs | | | 560,305 | | | 347,447 | | | 138,226 | | | 506,533 | | | 13,301 | |
| Liquidity fees on VRDP shares | | | 802,210 | | | 492,555 | | | — | | | — | | | — | |
| Custodian’s fees and expenses | | | 83,394 | | | 57,297 | | | 33,017 | | | 26,312 | | | 9,419 | |
| Directors’/Trustees’ fees and expenses | | | 11,583 | | | 7,098 | | | 4,271 | | | 2,792 | | | 571 | |
| Professional fees | | | 31,944 | | | 27,036 | | | 83,484 | | | 21,348 | | | 19,203 | |
| Shareholders’ reports – printing and mailing expenses | | | 64,948 | | | 41,485 | | | 24,682 | | | 21,779 | | | 7,198 | |
| Stock exchange listing fees | | | 9,089 | | | 9,089 | | | 913 | | | 628 | | | 270 | |
| Other expenses | | | 3,464 | | | 4,775 | | | 11,948 | | | 13,500 | | | 4,670 | |
| Total expenses before custodian fee credit and expense reimbursement | | | 4,496,616 | | | 2,806,243 | | | 1,248,839 | | | 1,257,512 | | | 204,042 | |
| Custodian fee credit | | | (9,196 | ) | | (2,203 | ) | | (1,920 | ) | | (1,915 | ) | | (54 | ) |
| Expense reimbursement | | | — | | | — | | | (64,541 | ) | | (94,842 | ) | | — | |
| Net expenses | | | 4,487,420 | | | 2,804,040 | | | 1,182,378 | | | 1,160,755 | | | 203,988 | |
| Net investment income | | | 17,295,739 | | | 10,349,865 | | | 5,815,511 | | | 3,840,114 | | | 1,284,062 | |
| Realized and Unrealized Gain (Loss) | | | | | | | | | | | | | | | | |
| Net realized gain (loss) from investments | | | (1,061,298 | ) | | (738,378 | ) | | (458,296 | ) | | (299,168 | ) | | (9,202 | ) |
| Change in net unrealized appreciation (depreciation) of investments | | | (14,015,249 | ) | | (8,286,977 | ) | | (5,465,315 | ) | | (3,373,715 | ) | | (1,779,254 | ) |
| Net realized and unrealized gain (loss) | | | (15,076,547 | ) | | (9,025,355 | ) | | (5,923,611 | ) | | (3,672,883 | ) | | (1,788,456 | ) |
| Distributions to Auction Rate Preferred Shareholders | | | | | | | | | | | | | | | | |
| From net investment income | | | (208,792 | ) | | (131,586 | ) | | (177,530 | ) | | (64,953 | ) | | N/A | |
| From accumulated net realized gains | | | — | | | — | | | (1,845 | ) | | — | | | N/A | |
| Decrease in net assets applicable to Common shares from distributions to Auction Rate Preferred shareholders | | | (208,792 | ) | | (131,586 | ) | | (179,375 | ) | | (64,953 | ) | | N/A | |
| Net increase (decrease) in net assets applicable to Common shares from operations | | $ | 2,010,400 | | $ | 1,192,924 | | $ | (287,475 | ) | $ | 102,278 | | $ | (504,394 | ) |
| N/A – Fund is not authorized to issue ARPS. | | | | | | | | | | | | | |
See accompanying notes to financial statements.
| | | Pennsylvania Investment Quality (NQP | ) | Pennsylvania Premium Income 2 (NPY | ) | Pennsylvania Dividend Advantage (NXM | ) | Pennsylvania Dividend Advantage 2 (NVY | ) | Pennsylvania Municipal Value (NPN | ) |
| Investment Income | | $ | 18,702,528 | | $ | 16,718,040 | | $ | 3,728,108 | | $ | 4,241,592 | | $ | 1,117,886 | |
| Expenses | | | | | | | | | | | | | | | | |
| Management fees | | | 2,186,209 | | | 2,016,439 | | | 457,716 | | | 521,297 | | | 120,949 | |
| Auction fees | | | 128,373 | | | 113,885 | | | 9,994 | | | 12,611 | | | N/A | |
| Dividend disbursing agent fees | | | 10,904 | | | 15,890 | | | 10,000 | | | 10,000 | | | N/A | |
| Shareholders’ servicing agent fees and expenses | | | 32,576 | | | 27,697 | | | 12,589 | | | 9,550 | | | 164 | |
| Interest expense and amortization of offering costs | | | 588,417 | | | 495,764 | | | 367,361 | | | 386,710 | | | — | |
| Liquidity fees on VRDP shares | | | 625,423 | | | 555,933 | | | — | | | — | | | — | |
| Custodian’s fees and expenses | | | 69,122 | | | 63,087 | | | 22,083 | | | 22,481 | | | 8,110 | |
| Directors’/Trustees’ fees and expenses | | | 9,254 | | | 8,475 | | | 2,091 | | | 2,275 | | | 439 | |
| Professional fees | | | 28,541 | | | 27,679 | | | 20,681 | | | 21,425 | | | 18,967 | |
| Shareholders’ reports – printing and mailing expenses | | | 58,469 | | | 53,911 | | | 18,405 | | | 20,112 | | | 7,300 | |
| Stock exchange listing fees | | | 9,089 | | | 9,089 | | | 463 | | | 518 | | | 204 | |
| Other expenses | | | 4,420 | | | 3,429 | | | 14,846 | | | 13,604 | | | 4,632 | |
| Total expenses before custodian fee credit and expense reimbursement | | | 3,750,797 | | | 3,391,278 | | | 936,229 | | | 1,020,583 | | | 160,765 | |
| Custodian fee credit | | | (5,561 | ) | | (6,425 | ) | | (1,325 | ) | | (800 | ) | | (595 | ) |
| Expense reimbursement | | | — | | | — | | | (33,296 | ) | | (79,094 | ) | | — | |
| Net expenses | | | 3,745,236 | | | 3,384,853 | | | 901,608 | | | 940,689 | | | 160,170 | |
| Net investment income | | | 14,957,292 | | | 13,333,187 | | | 2,826,500 | | | 3,300,903 | | | 957,716 | |
| Realized and Unrealized Gain (Loss) | | | | | | | | | | | | | | | | |
| Net realized gain (loss) from investments | | | 745,530 | | | 76,022 | | | 160,763 | | | 125,330 | | | (2,036 | ) |
| Change in net unrealized appreciation (depreciation) of investments | | | (12,501,791 | ) | | (9,453,123 | ) | | (2,308,027 | ) | | (2,323,297 | ) | | (848,014 | ) |
| Net realized and unrealized gain (loss) | | | (11,756,261 | ) | | (9,377,101 | ) | | (2,147,264 | ) | | (2,197,967 | ) | | (850,050 | ) |
| Distributions to Auction Rate Preferred Shareholders | | | | | | | | | | | | | | | | |
| From net investment income | | | (167,467 | ) | | (144,895 | ) | | (46,324 | ) | | (53,580 | ) | | N/A | |
| From accumulated net realized gains | | | — | | | — | | | — | | | — | | | N/A | |
| Decrease in net assets applicable to Common shares from distributions to Auction Rate Preferred shareholders | | | (167,467 | ) | | (144,895 | ) | | (46,324 | ) | | (53,580 | ) | | N/A | |
| Net increase (decrease) in net assets applicable to Common shares from operations | | $ | 3,033,564 | | $ | 3,811,191 | | $ | 632,912 | | $ | 1,049,356 | | $ | 107,666 | |
| N/A – Fund is not authorized to issue ARPS. | | | | | | | | | | | | | |
See accompanying notes to financial statements.
| | | Statement of |
| | | Changes in Net Assets |
| | | New Jersey Investment Quality (NQJ) | | New Jersey Premium Income (NNJ) | |
| | | Year Ended 4/30/11 | | Year Ended 4/30/10 | | Year Ended 4/30/11 | | Year Ended 4/30/10 | |
| Operations | | | | | | | | | | | | | |
| Net investment income | | $ | 17,295,739 | | $ | 18,717,128 | | $ | 10,349,865 | | $ | 10,849,430 | |
| Net realized gain (loss) from investments | | | (1,061,298 | ) | | 233,477 | | | (738,378 | ) | | 152,799 | |
| Change in net unrealized appreciation (depreciation) of investments | | | (14,015,249 | ) | | 26,574,736 | | | (8,286,977 | ) | | 12,104,576 | |
| Distributions to Auction Rate Preferred Shareholders: | | | | | | | | | | | | | |
| From net investment income | | | (208,792 | ) | | (607,748 | ) | | (131,586 | ) | | (359,067 | ) |
| From accumulated net realized gains | | | — | | | — | | | — | | | (54,178 | ) |
| Net increase (decrease) in net assets applicable to Common shares from operations | | | 2,010,400 | | | 44,917,593 | | | 1,192,924 | | | 22,693,560 | |
| Distributions to Common Shareholders | | | | | | | | | | | | | |
| From net investment income | | | (16,874,323 | ) | | (15,463,016 | ) | | (9,863,992 | ) | | (8,895,046 | ) |
| From accumulated net realized gains | | | (550,205 | ) | | — | | | (140,828 | ) | | (202,215 | ) |
| Decrease in net assets applicable to Common shares from distributions to Common shareholders | | | (17,424,528 | ) | | (15,463,016 | ) | | (10,004,820 | ) | | (9,097,261 | ) |
| Capital Share Transactions | | | | | | | | | | | | | |
| Common shares: | | | | | | | | | | | | | |
| Proceeds from sale, net of offering costs | | | — | | | — | | | — | | | — | |
| Net proceeds issued to shareholders due to reinvestment of distributions | | | — | | | — | | | — | | | — | |
| Repurchased and retired | | | — | | | — | | | — | | | — | |
| Net increase (decrease) in net assets applicable to Common shares from capital share transactions | | | — | | | — | | | — | | | — | |
| Net increase (decrease) in net assets applicable to Common shares | | | (15,414,128 | ) | | 29,454,577 | | | (8,811,896 | ) | | 13,596,299 | |
| Net assets applicable to Common shares at the beginning of year | | | 295,382,116 | | | 265,927,539 | | | 180,024,192 | | | 166,427,893 | |
| Net assets applicable to Common shares at the end of year | | $ | 279,967,988 | | $ | 295,382,116 | | $ | 171,212,296 | | $ | 180,024,192 | |
| Undistributed (Over-distribution of) net investment income at the end of year | | $ | 4,215,712 | | $ | 3,984,461 | | $ | 2,849,697 | | $ | 2,486,061 | |
See accompanying notes to financial statements.
| | | New Jersey Dividend Advantage (NXJ) | | New Jersey Dividend Advantage 2 (NUJ) | | New Jersey Municipal Value (NJV) | |
| | | Year Ended 4/30/11 | | Year Ended 4/30/10 | | Year Ended 4/30/11 | | Year Ended 4/30/10 | | Year Ended 4/30/11 | | Year Ended 4/30/10 | |
| Operations | | | | | | | | | | | | | | | | | | | |
| Net investment income | | $ | 5,815,511 | | $ | 5,946,742 | | $ | 3,840,114 | | $ | 4,257,761 | | $ | 1,284,062 | | $ | 1,088,719 | |
| Net realized gain (loss) from investments | | | (458,296 | ) | | 212,974 | | | (299,168 | ) | | 242,640 | | | (9,202 | ) | | 31,233 | |
| Change in net unrealized appreciation (depreciation) of investments | | | (5,465,315 | ) | | 9,065,987 | | | (3,373,715 | ) | | 6,247,786 | | | (1,779,254 | ) | | 2,391,569 | |
| Distributions to Auction Rate Preferred Shareholders: | | | | | | | | | | | | | | | | | | | |
| From net investment income | | | (177,530 | ) | | (195,346 | ) | | (64,953 | ) | | (125,424 | ) | | N/A | | | N/A | |
| From accumulated net realized gains | | | (1,845 | ) | | (11,965 | ) | | — | | | (28,590 | ) | | N/A | | | N/A | |
| Net increase (decrease) in net assets applicable to Common shares from operations | | | (287,475 | ) | | 15,018,392 | | | 102,278 | | | 10,594,173 | | | (504,394 | ) | | 3,511,521 | |
| Distributions to Common Shareholders | | | | | | | | | | | | | | | | | | | |
| From net investment income | | | (5,456,312 | ) | | (4,901,156 | ) | | (3,864,727 | ) | | (3,539,791 | ) | | (1,198,684 | ) | | (1,092,472 | ) |
| From accumulated net realized gains | | | (157,678 | ) | | (47,303 | ) | | (172,338 | ) | | (116,187 | ) | | (38,395 | ) | | — | |
| Decrease in net assets applicable to Common shares from distributions to Common shareholders | | | (5,613,990 | ) | | (4,948,459 | ) | | (4,037,065 | ) | | (3,655,978 | ) | | (1,237,079 | ) | | (1,092,472 | ) |
| Capital Share Transactions | | | | | | | | | | | | | | | | | | | |
| Common shares: | | | | | | | | | | | | | | | | | | | |
| Proceeds from sale, net of offering costs | | | — | | | — | | | — | | | — | | | — | | | 1,412,160 | |
| Net proceeds issued to shareholders due to reinvestment of distributions | | | — | | | — | | | 27,622 | | | 16,041 | | | — | | | — | |
| Repurchased and retired | | | — | | | — | | | — | | | — | | | — | | | — | |
| Net increase (decrease) in net assets applicable to Common shares from capital share transactions | | | — | | | — | | | 27,622 | | | 16,041 | | | — | | | 1,412,160 | |
| Net increase (decrease) in net assets applicable to Common shares | | | (5,901,465 | ) | | 10,069,933 | | | (3,907,165 | ) | | 6,954,236 | | | (1,741,473 | ) | | 3,831,209 | |
| Net assets applicable to Common shares at the beginning of year | | | 95,300,086 | | | 85,230,153 | | | 65,410,078 | | | 58,455,842 | | | 24,722,233 | | | 20,891,024 | |
| Net assets applicable to Common shares at the end of year | | $ | 89,398,621 | | $ | 95,300,086 | | $ | 61,502,913 | | $ | 65,410,078 | | $ | 22,980,760 | | $ | 24,722,233 | |
| Undistributed (Over-distribution of) net investment income at the end of year | | $ | 1,417,049 | | $ | 1,216,150 | | $ | 927,258 | | $ | 921,270 | | $ | 81,348 | | $ | (3,755 | ) |
| N/A – Fund is not authorized to issue ARPS. | | | | | | | | | | | | | | | | |
See accompanying notes to financial statements.
| | | Statement of |
| | | Changes in Net Assets (continued) |
| | | Pennsylvania Investment Quality (NQP) | | Pennsylvania Premium Income 2 (NPY) | |
| | | Year Ended 4/30/11 | | Year Ended 4/30/10 | | Year Ended 4/30/11 | | Year Ended 4/30/10 | |
| Operations | | | | | | | | | | | | | |
| Net investment income | | $ | 14,957,292 | | $ | 15,528,056 | | $ | 13,333,187 | | $ | 14,161,218 | |
| Net realized gain (loss) from investments | | | 745,530 | | | 773,454 | | | 76,022 | | | 631,514 | |
| Change in net unrealized appreciation (depreciation) of investments | | | (12,501,791 | ) | | 17,712,020 | | | (9,453,123 | ) | | 19,352,139 | |
| Distributions to Auction Rate Preferred Shareholders: | | | | | | | | | | | | | |
| From net investment income | | | (167,467 | ) | | (496,083 | ) | | (144,895 | ) | | (452,125 | ) |
| From accumulated net realized gains | | | — | | | — | | | — | | | — | |
| Net increase (decrease) in net assets applicable to Common shares from operations | | | 3,033,564 | | | 33,517,447 | | | 3,811,191 | | | 33,692,746 | |
| Distributions to Common Shareholders | | | | | | | | | | | | | |
| From net investment income | | | (14,496,933 | ) | | (12,820,803 | ) | | (13,084,668 | ) | | (12,032,678 | ) |
| From accumulated net realized gains | | | — | | | — | | | — | | | — | |
| Decrease in net assets applicable to Common shares from distributions to Common shareholders | | | (14,496,933 | ) | | (12,820,803 | ) | | (13,084,668 | ) | | (12,032,678 | ) |
| Capital Share Transactions | | | | | | | | | | | | | |
| Common shares: | | | | | | | | | | | | | |
| Proceeds from sale, net of offering costs | | | — | | | — | | | — | | | — | |
| Net proceeds issued to shareholders due to reinvestment of distributions | | | — | | | — | | | — | | | — | |
| Repurchased and retired | | | — | | | (681,095 | ) | | — | | | (285,937 | ) |
| Net increase (decrease) in net assets applicable to Common shares from capital share transactions | | | — | | | (681,095 | ) | | — | | | (285,937 | ) |
| Net increase (decrease) in net assets applicable to Common shares | | | (11,463,369 | ) | | 20,015,549 | | | (9,273,477 | ) | | 21,374,131 | |
| Net assets applicable to Common shares at the beginning of year | | | 238,368,462 | | | 218,352,913 | | | 220,112,638 | | | 198,738,507 | |
| Net assets applicable to Common shares at the end of year | | $ | 226,905,093 | | $ | 238,368,462 | | $ | 210,839,161 | | $ | 220,112,638 | |
| Undistributed (Over-distribution of) net investment income at the end of year | | $ | 3,488,103 | | $ | 3,207,009 | | $ | 3,381,190 | | $ | 3,280,219 | |
See accompanying notes to financial statements.
| | | Pennsylvania Dividend Advantage (NXM) | | Pennsylvania Dividend Advantage 2 (NVY) | | Pennsylvania Municipal Value (NPN) | |
| | | Year Ended 4/30/11 | | Year Ended 4/30/10 | | Year Ended 4/30/11 | | Year Ended 4/30/10 | | Year Ended 4/30/11 | | Year Ended 4/30/10 | |
| Operations | | | | | | | | | | | | | | | | | | | |
| Net investment income | | $ | 2,826,500 | | $ | 3,195,336 | | $ | 3,300,903 | | $ | 3,629,769 | | $ | 957,716 | | $ | 843,167 | |
| Net realized gain (loss) from investments | | | 160,763 | | | 165,906 | | | 125,330 | | | 271,629 | | | (2,036 | ) | | 12,525 | |
| Change in net unrealized appreciation (depreciation) of investments | | | (2,308,027 | ) | | 4,967,411 | | | (2,323,297 | ) | | 4,435,061 | | | (848,014 | ) | | 1,424,838 | |
| Distributions to Auction Rate Preferred Shareholders: | | | | | | | | | | | | | | | | | | | |
| From net investment income | | | (46,324 | ) | | (87,707 | ) | | (53,580 | ) | | (76,694 | ) | | N/A | | | N/A | |
| From accumulated net realized gains | | | — | | | (20,673 | ) | | — | | | (41,621 | ) | | N/A | | | N/A | |
| Net increase (decrease) in net assets applicable to Common shares from operations | | | 632,912 | | | 8,220,273 | | | 1,049,356 | | | 8,218,144 | | | 107,666 | | | 2,280,530 | |
| Distributions to Common Shareholders | | | | | | | | | | | | | | | | | | | |
| From net investment income | | | (2,885,144 | ) | | (2,630,923 | ) | | (3,325,513 | ) | | (3,043,985 | ) | | (931,175 | ) | | (860,284 | ) |
| From accumulated net realized gains | | | (161,448 | ) | | (132,215 | ) | | (178,854 | ) | | (247,021 | ) | | — | | | — | |
| Decrease in net assets applicable to Common shares from distributions to Common shareholders | | | (3,046,592 | ) | | (2,763,138 | ) | | (3,504,367 | ) | | (3,291,006 | ) | | (931,175 | ) | | (860,284 | ) |
| Capital Share Transactions | | | | | | | | | | | | | | | | | | | |
| Common shares: | | | | | | | | | | | | | | | | | | | |
| Proceeds from sale, net of offering costs | | | — | | | — | | | — | | | — | | | — | | | 1,440,936 | |
| Net proceeds issued to shareholders due to reinvestment of distributions | | | — | | | — | | | 4,570 | | | — | | | 46,742 | | | 127,893 | |
| Repurchased and retired | | | — | | | (109,964 | ) | | — | | | — | | | — | | | — | |
| Net increase (decrease) in net assets applicable to Common shares from capital share transactions | | | — | | | (109,964 | ) | | 4,570 | | | — | | | 46,742 | | | 1,568,829 | |
| Net increase (decrease) in net assets applicable to Common shares | | | (2,413,680 | ) | | 5,347,171 | | | (2,450,441 | ) | | 4,927,138 | | | (776,767 | ) | | 2,989,075 | |
| Net assets applicable to Common shares at the beginning of year | | | 48,934,463 | | | 43,587,292 | | | 54,920,132 | | | 49,992,994 | | | 18,805,457 | | | 15,816,382 | |
| Net assets applicable to Common shares at the end of year | | $ | 46,520,783 | | $ | 48,934,463 | | $ | 52,469,691 | | $ | 54,920,132 | | $ | 18,028,690 | | $ | 18,805,457 | |
| Undistributed (Over-distribution of) net investment income at the end of year | | $ | 691,337 | | $ | 738,442 | | $ | 822,618 | | $ | 839,805 | | $ | 8,923 | | $ | (17,618 | ) |
| N/A – Fund is not authorized to issue ARPS. | | | | | | | | | | | | | | | | |
See accompanying notes to financial statements.
| | | Statement of |
| | | Cash Flows |
| | | Year Ended April 30, 2011 |
| | | | New Jersey | | | New Jersey | | | New Jersey | |
| | | | Investment | | | Premium | | | Dividend | |
| | | | Quality | | | Income | | | Advantage | |
| | | | (NQJ | ) | | (NNJ | ) | | (NXJ | ) |
| Cash Flows from Operating Activities: | | | | | | | | | | |
| Net Increase (Decrease) in Net Assets Applicable to Common Shares from Operations | | $ | 2,010,400 | | $ | 1,192,924 | | $ | (287,475 | ) |
| Adjustments to reconcile the net increase (decrease) in net assets applicable to Common shares from operations to net cash provided by (used in) operating activities: | | | | | | | | | | |
| Purchases of investments | | | (38,962,722 | ) | | (17,018,857 | ) | | (8,143,562 | ) |
| Proceeds from sales and maturities of investments | | | 45,958,758 | | | 19,012,957 | | | 7,981,182 | |
| Amortization (Accretion) of premiums and discounts, net | | | 214,107 | | | 211,212 | | | (468,073 | ) |
| (Increase) Decrease in: | | | | | | | | | | |
| Receivable for interest | | | 26,703 | | | (24,395 | ) | | (19,038 | ) |
| Receivable for investments sold | | | 230,000 | | | — | | | 1,498,274 | |
| Other assets | | | (49,477 | ) | | 4,663 | | | 74 | |
| Increase (Decrease) in: | | | | | | | | | | |
| Payable for interest | | | — | | | — | | | 106,047 | |
| Payable for investments purchased | | | — | | | 75,685 | | | — | |
| Payable for Auction Rate Preferred share dividends | | | (6,229 | ) | | (1,967 | ) | | (1,702 | ) |
| Accrued management fees | | | (10,571 | ) | | (6,052 | ) | | 2,333 | |
| Accrued other liabilities | | | (83,669 | ) | | (40,218 | ) | | (15,519 | ) |
| Net realized (gain) loss from investments | | | 1,061,298 | | | 738,378 | | | 458,296 | |
| Change in net unrealized (appreciation) depreciation of investments | | | 14,015,249 | | | 8,286,977 | | | 5,465,315 | |
| Taxes paid on undistributed capital gains | | | (1,034 | ) | | (6,128 | ) | | (2,352 | ) |
| Net cash provided by (used in) operating activities | | | 24,402,813 | | | 12,425,179 | | | 6,573,800 | |
| Cash Flows from Financing Activities: | | | | | | | | | | |
| (Increase) Decrease in deferred offering costs | | | (776,708 | ) | | (616,388 | ) | | (903,931 | ) |
| Increase (Decrease) in: | | | | | | | | | | |
| Cash overdraft balance | | | — | | | (239 | ) | | (315,129 | ) |
| Floating rate obligations | | | — | | | — | | | — | |
| Payable for offering costs | | | 277,516 | | | 271,967 | | | 368,750 | |
| ARPS, at liquidation value | | | (143,450,000 | ) | | (87,875,000 | ) | | (43,925,000 | ) |
| MTP shares, at liquidation value | | | — | | | — | | | 44,861,000 | |
| VRDP shares, at liquidation value | | | 144,300,000 | | | 88,600,000 | | | — | |
| Cash distributions paid to Common shareholders | | | (17,373,842 | ) | | (9,978,243 | ) | | (5,591,666 | ) |
| Net cash provided by (used in) financing activities | | | (17,023,034 | ) | | (9,597,903 | ) | | (5,505,976 | ) |
| Net Increase (Decrease) in Cash | | | 7,379,779 | | | 2,827,276 | | | 1,067,824 | |
| Cash at the beginning of year | | | 711,273 | | | — | | | — | |
| Cash at the End of Year | | $ | 8,091,052 | | $ | 2,827,276 | | $ | 1,067,824 | |
| Supplemental Disclosure of Cash Flow Information | | | | | | | | | | |
| Cash paid for interest (excluding amortization of offering costs) was as follows: | | | | | | | | | | |
| | | | New Jersey | | | New Jersey | | | New Jersey | |
| | | | Investment | | | Premium | | | Dividend | |
| | | | Quality | | | Income | | | Advantage | |
| | | | (NQJ | ) | | (NNJ | ) | | (NXJ | ) |
| | | $ | 541,263 | | $ | 332,335 | | $ | — | |
See accompanying notes to financial statements.
| | | New Jersey | | Pennsylvania | | Pennsylvania | |
| | | Dividend | | Investment | | Premium | |
| | | Advantage 2 | | Quality | | Income 2 | |
| | | (NUJ | ) | (NQP | ) | (NPY | ) |
| Cash Flows from Operating Activities: | | | | | | | | | | |
| Net Increase (Decrease) in Net Assets Applicable to Common Shares from Operations | | $ | 102,278 | | $ | 3,033,564 | | $ | 3,811,191 | |
| Adjustments to reconcile the net increase (decrease) in net assets applicable to Common shares from operations to net cash provided by (used in) operating activities: | | | | | | | | | | |
| Purchases of investments | | | (9,205,876 | ) | | (27,705,509 | ) | | (25,104,287 | ) |
| Proceeds from sales and maturities of investments | | | 6,476,725 | | | 34,392,230 | | | 29,229,757 | |
| Amortization (Accretion) of premiums and discounts, net | | | 8,986 | | | (15,321 | ) | | (345,803 | ) |
| (Increase) Decrease in: | | | | | | | | | | |
| Receivable for interest | | | (78,219 | ) | | 152,538 | | | 181,594 | |
| Receivable for investments sold | | | — | | | (5,130,000 | ) | | 7,088,211 | |
| Other assets | | | 52 | | | (30,717 | ) | | (31,315 | ) |
| Increase (Decrease) in: | | | | | | | | | | |
| Payable for interest | | | 58,413 | | | — | | | — | |
| Payable for investments purchased | | | 202,990 | | | 76,983 | | | 843,282 | |
| Payable for Auction Rate Preferred share dividends | | | (807 | ) | | (2,579 | ) | | (4,315 | ) |
| Accrued management fees | | | 3,289 | | | (8,228 | ) | | (6,834 | ) |
| Accrued other liabilities | | | (5,270 | ) | | (68,219 | ) | | 31,153 | |
| Net realized (gain) loss from investments | | | 299,168 | | | (745,530 | ) | | (76,022 | ) |
| Change in net unrealized (appreciation) depreciation of investments | | | 3,373,715 | | | 12,501,791 | | | 9,453,123 | |
| Taxes paid on undistributed capital gains | | | (2,279 | ) | | — | | | (30 | ) |
| Net cash provided by (used in) operating activities | | | 1,233,165 | | | 16,451,003 | | | 25,069,705 | |
| Cash Flows from Financing Activities: | | | | | | | | | | |
| (Increase) Decrease in deferred offering costs | | | (764,799 | ) | | (684,469 | ) | | (649,086 | ) |
| Increase (Decrease) in: | | | | | | | | | | |
| Cash overdraft balance | | | (1,871 | ) | | (819,241 | ) | | (1,235,713 | ) |
| Floating rate obligations | | | — | | | (90,000 | ) | | (320,000 | |
| Payable for offering costs | | | 191,995 | | | 291,711 | | | 298,175 | |
| ARPS, at liquidation value | | | (31,225,000 | ) | | (111,750,000 | ) | | (99,275,000 | ) |
| MTP shares, at liquidation value | | | 35,050,000 | | | — | | | — | |
| VRDP shares, at liquidation value | | | — | | | 112,500,000 | | | 100,000,000 | |
| Cash distributions paid to Common shareholders | | | (3,993,176 | ) | | (14,426,204 | ) | | (13,060,609 | ) |
| Net cash provided by (used in) financing activities | | | (742,851 | ) | | (14,978,203 | ) | | (14,242,233 | ) |
| Net Increase (Decrease) in Cash | | | 490,314 | | | 1,472,800 | | | 10,827,472 | |
| Cash at the beginning of year | | | — | | | — | | | — | |
| Cash at the End of Year | | $ | 490,314 | | $ | 1,472,800 | | $ | 10,827,472 | |
| Supplemental Disclosure of Cash Flow Information | | | | | | | | | | |
| Non-cash activities not included herein consist of reinvestment of Common share distributions of $27,622 for New Jersey Advantage 2 (NUJ). |
| Cash paid for interest (excluding amortization of offering costs) was as follows: |
| | | New Jersey | | Pennsylvania | | Pennsylvania | |
| | | Dividend | | Investment | | Premium | |
| | | Advantage 2 | | Quality | | Income 2 | |
| | | | (NUJ | ) | | (NQP | ) | | (NPY | ) |
| | | $ | 349,337 | | $ | 571,636 | | $ | 479,850 | |
See accompanying notes to financial statements.
| | | Statement of |
| | | Cash Flows (continued) |
| | | Year Ended April 30, 2011 |
| | | Pennsylvania Dividend Advantage (NXM | ) | Pennsylvania Dividend Advantage 2 (NVY | ) |
| Cash Flows from Operating Activities: | | | | | | | |
| Net Increase (Decrease) in Net Assets Applicable to Common Shares from Operations | | $ | 632,912 | | $ | 1,049,356 | |
| Adjustments to reconcile the net increase (decrease) in net assets applicable to Common shares from operations to net cash provided by (used in) operating activities: | | | | | | | |
| Purchases of investments | | | (7,859,653 | ) | | (5,870,237 | ) |
| Proceeds from sales and maturities of investments | | | 5,664,262 | | | 5,336,741 | |
| Amortization (Accretion) of premiums and discounts, net | | | (55,183 | ) | | (49,095 | ) |
| (Increase) Decrease in: | | | | | | | |
| Receivable for interest | | | (879 | ) | | 26,734 | |
| Receivable for investments sold | | | 2,247,135 | | | ��� | |
| Other assets | | | 40 | | | 24 | |
| Increase (Decrease) in: | | | | | | | |
| Payable for interest | | | 40,583 | | | 43,985 | |
| Payable for investments purchased | | | (200,814 | ) | | (200,814 | ) |
| Payable for Auction Rate Preferred share dividends | | | (872 | ) | | (1,362 | ) |
| Accrued management fees | | | 1,499 | | | 2,260 | |
| Accrued other liabilities | | | 14,404 | | | (4,087 | ) |
| Net realized (gain) loss from investments | | | (160,763 | ) | | (125,330 | ) |
| Change in net unrealized (appreciation) depreciation of investments | | | 2,308,027 | | | 2,323,297 | |
| Taxes paid on undistributed capital gains | | | (7,249 | ) | | (6,374 | ) |
| Net cash provided by (used in) operating activities | | | 2,623,449 | | | 2,525,098 | |
| Cash Flows from Financing Activities: | | | | | | | |
| (Increase) Decrease in deferred offering costs | | | (604,974 | ) | | (630,338 | ) |
| Increase (Decrease) in: | | | | | | | |
| Cash overdraft balance | | | — | | | — | |
| Floating rate obligations | | | (110,000 | ) | | (85,000 | ) |
| Payable for offering costs | | | 178,559 | | | 213,435 | |
| ARPS, at liquidation value | | | (22,500,000 | ) | | (23,000,000 | ) |
| MTP shares, at liquidation value | | | 23,190,000 | | | 24,550,000 | |
| VRDP shares, at liquidation value | | | — | | | — | |
| Cash distributions paid to Common shareholders | | | (3,038,809 | ) | | (3,492,983 | ) |
| Net cash provided by (used in) financing activities | | | (2,885,224 | ) | | (2,444,886 | ) |
| Net Increase (Decrease) in Cash | | | (261,775 | ) | | 80,212 | |
| Cash at the beginning of year | | | 360,322 | | | 193,939 | |
| Cash at the End of Year | | $ | 98,547 | | $ | 274,151 | |
| Supplemental Disclosure of Cash Flow Information | | | | | | | |
| Non-cash activities not included herein consist of reinvestment of Common shares distributions of $4,570 for Pennsylvania Dividend Advantage 2 (NVY). |
| Cash paid for interest (excluding amortization of offering costs) was as follows: |
| | | | | | | | |
| | | Pennsylvania | | Pennsylvania | |
| | | Dividend | | Dividend | |
| | | Advantage | | Advantage 2 | |
| | | (NXM | ) | (NVY | ) |
| | | $ | 249,843 | | $ | 271,332 | |
See accompanying notes to financial statements.
| | | Financial |
| | | Highlights |
| | | |
| | Selected data for a Common share outstanding throughout each period: |
| | | | | | Investment Operations | | Less Distributions | | | | | | | | | | |
| | | Beginning Common Share Net Asset Value | | Net Investment Income | | Net Realized/ Unrealized Gain (Loss) | | Distributions from Net Investment Income to Auction Rate Preferred Share- holders | (a) | Distributions from Capital Gains to Auction Rate Preferred Share- holders | (a) | Total | | Net Investment Income to Common Share- holders | | Capital Gains to Common Share- holders | | Total | | Discount from Common Shares Repurchased and Retired | | Ending Common Share Net Asset Value | | Ending Market Value | |
| New Jersey Investment Quality (NQJ) | | | | | | | | | | | | | | | | | | | | | | | | | | | |
| Year Ended 4/30: | | | | | | | | | | | | | | | | | | | | | | | | | | | | | | | | | | |
| 2011 | | $ | 14.44 | | $ | .85 | | $ | (.73 | ) | $ | (.01 | ) | $ | — | | $ | .11 | | $ | (.83 | ) | $ | (.03 | ) | $ | (.86 | ) | $ | — | | $ | 13.69 | | $ | 12.68 | |
| 2010 | | | 13.00 | | | .92 | | | 1.31 | | | (.03 | ) | | — | | | 2.20 | | | (.76 | ) | | — | | | (.76 | ) | | — | | | 14.44 | | | 13.56 | |
| 2009 | | | 14.26 | | | .91 | | | (1.22 | ) | | (.18 | ) | | (.03 | ) | | (.52 | ) | | (.65 | ) | | (.09 | ) | | (.74 | ) | | — | * | | 13.00 | | | 11.37 | |
| 2008 | | | 14.96 | | | .92 | | | (.67 | ) | | (.26 | ) | | (.01 | ) | | (.02 | ) | | (.65 | ) | | (.03 | ) | | (.68 | ) | | — | | | 14.26 | | | 13.09 | |
| 2007(f) | | | 14.53 | | | .75 | | | .47 | | | (.20 | ) | | (.01 | ) | | 1.01 | | | (.55 | ) | | (.03 | ) | | (.58 | ) | | — | | | 14.96 | | | 14.30 | |
| Year Ended 6/30: | | | | | | | | | | | | | | | | | | | | | | | | | | | | | | | | | | | | | |
| 2006 | | | 15.61 | | | .91 | | | (.75 | ) | | (.18 | ) | | (.03 | ) | | (.05 | ) | | (.79 | ) | | (.24 | ) | | (1.03 | ) | | — | | | 14.53 | | | 13.70 | |
| | | | | | | | | | | | | | | | | | | | | | | | | | | | | | | | | | | | | | |
| New Jersey Premium Income (NNJ) | | | | | | | | | | | | | | | | | | | | | | | | | | | |
| Year Ended 4/30: | | | | | | | | | | | | | | | | | | | | | | | | | | | | | | | | | | |
| 2011 | | | 14.96 | | | .86 | | | (.76 | ) | | (.01 | ) | | — | | | .09 | | | (.82 | ) | | (.01 | ) | | (.83 | ) | | — | | | 14.22 | | | 13.44 | |
| 2010 | | | 13.83 | | | .90 | | | 1.02 | | | (.03 | ) | | — | * | | 1.89 | | | (.74 | ) | | (.02 | ) | | (.76 | ) | | — | | | 14.96 | | | 14.19 | |
| 2009 | | | 14.64 | | | .88 | | | (.78 | ) | | (.17 | ) | | (.03 | ) | | (.10 | ) | | (.63 | ) | | (.08 | ) | | (.71 | ) | | — | * | | 13.83 | | | 11.96 | |
| 2008 | | | 15.23 | | | .90 | | | (.53 | ) | | (.25 | ) | | (.01 | ) | | .11 | | | (.66 | ) | | (.04 | ) | | (.70 | ) | | — | | | 14.64 | | | 13.48 | |
| 2007(f) | | | 14.79 | | | .74 | | | .49 | | | (.20 | ) | | — | * | | 1.03 | | | (.58 | ) | | (.01 | ) | | (.59 | ) | | — | | | 15.23 | | | 15.12 | |
| Year Ended 6/30: | | | | | | | | | | | | | | | | | | | | | | | | | | | | | | | | | | |
| 2006 | | | 16.05 | | | .90 | | | (.85 | ) | | (.17 | ) | | (.04 | ) | | (.16 | ) | | (.79 | ) | | (.31 | ) | | (1.10 | ) | | — | | | 14.79 | | | 14.16 | |
| (a) | The amounts shown are based on Common share equivalents. |
| (b) | Total Return Based on Market Value is the combination of changes in the market price per share and the effect of reinvested dividend income and reinvested capital gains distributions, if any, at the average price paid per share at the time of reinvestment. The last dividend declared in the period, which is typically paid on the first business day of the following month, is assumed to be reinvested at the ending market price. The actual reinvestment for the last dividend declared in the period may take place over several days, and in some instances may not be based on the market price, so the actual reinvestment price may be different from the price used in the calculation. Total returns are not annualized. |
| | |
| | Total Return Based on Common Share Net Asset Value is the combination of changes in Common share net asset value, reinvested dividend income at net asset value and reinvested capital gains distributions at net asset value, if any. The last dividend declared in the period, which is typically paid on the first business day of the following month, is assumed to be reinvested at the ending net asset value. The actual reinvest price for the last dividend declared in the period may often be based on the Fund’s market price (and not its net asset value), and therefore may be different from the price used in the calculation. Total returns are not annualized. |
| (c) | Ratios do not reflect the effect of custodian fee credits earned on the Fund’s net cash on deposit with the custodian bank, where applicable. |
| | | | | | Ratios/Supplemental Data | |
| | Total Returns | | | | Ratios to Average Net Assets Applicable to Common Shares(c)(d) | | | |
| | Based on Market Value | (b) | Based on Common Share Net Asset Value | (b) | Ending Net Assets Applicable to Common Shares (000) | | Expenses | (e) | Net Investment Income | | Portfolio Turnover Rate | |
| | | | | | | | | | | | | | | | | | | |
| | | | | | | | | | | | | | | | | | | |
| | | (.46 | )% | | .67 | % | | $279,968 | | | 1.55 | % | | 5.96 | % | | 9 | % |
| | | 26.39 | | | 17.23 | | | 295,382 | | | 1.16 | | | 6.57 | | | 4 | |
| | | (7.10 | ) | | (3.41 | ) | | 265,928 | | | 1.29 | | | 6.94 | | | 1 | |
| | | (3.64 | ) | | (.08 | ) | | 292,194 | | | 1.23 | | | 6.30 | | | 17 | |
| | | 8.75 | | | 7.05 | | | 306,402 | | | 1.20 | ** | | 6.04 | ** | | 7 | |
| | | | | | | | | | | | | | | | | | | |
| | | (3.62 | ) | | (.31 | ) | | 297,539 | | | 1.21 | | | 6.05 | | | 17 | |
| | | | | | | | | | | | | | | | | | | |
| | | | | | | | | | | | | | | | | | | |
| | | | | | | | | | | | | | | | | | | |
| | | .41 | | | .57 | | | 171,212 | | | 1.59 | | | 5.85 | | | 7 | |
| | | 25.45 | | | 13.90 | | | 180,024 | | | 1.19 | | | 6.19 | | | 3 | |
| | | (5.69 | ) | | (.40 | ) | | 166,428 | | | 1.28 | | | 6.44 | | | 1 | |
| | | (6.18 | ) | | .77 | | | 176,374 | | | 1.24 | | | 6.04 | | | 19 | |
| | | 11.10 | | | 7.03 | | | 183,540 | | | 1.21 | ** | | 5.83 | ** | | 6 | |
| | | | | | | | | | | | | | | | | | | |
| | | (3.36 | ) | | (1.04 | ) | | 178,199 | | | 1.19 | | | 5.81 | | | 12 | |
| (d) | Ratios do not reflect the effect of dividend payments to Auction Rate Preferred shareholders, where applicable; Net Investment Income ratios reflect income earned and expenses incurred on assets attributable to ARPS and/or VRDP shares, where applicable. |
| (e) | The expense ratios reflect, among other things, all interest expense and other costs related to VRDP shares and/or the interest expense deemed to have been paid by the Fund on the floating rate certificates issued by the special purpose trusts for the self-deposited inverse floaters held by the Fund, where applicable, both as described in Footnote 1 – General Information and Significant Accounting Policies, Variable Rate Demand Preferred Shares and Inverse Floating Rate Securities, respectively, as follows: |
| New Jersey Investment Quality (NQJ) | | | | |
| Year Ended 4/30: | | | | |
| 2011 | | | .51 | % |
| 2010 | | | — | |
| 2009 | | | — | |
| 2008 | | | — | |
| 2007(f) | | | — | |
| Year Ended 6/30: | | | | |
| 2006 | | | — | |
| | | | | |
| New Jersey Premium Income (NNJ) | | | | |
| Year Ended 4/30: | | | | |
| 2011 | | | .51 | |
| 2010 | | | — | |
| 2009 | | | — | |
| 2008 | | | — | |
| 2007(f) | | | — | |
| Year Ended 6/30: | | | | |
| 2006 | | | — | |
| (f) | For the ten months ended April 30, 2007. |
| * | Rounds to less than $.01 per share. |
| ** | Annualized. |
See accompanying notes to financial statements.
| | | Financial |
| | | Highlights (continued) |
| | | |
| | Selected data for a Common share outstanding throughout each period: |
| | | | | | Investment Operations | | Less Distributions | | | | | | | | | | | | | |
| | | Beginning Common Share Net Asset Value | | Net Investment Income | | Net Realized/ Unrealized Gain (Loss) | | Distributions from Net Investment Income to Auction Rate Preferred Share- holders | (a) | Distributions from Capital Gains to Auction Rate Preferred Share- holders | (a) | Total | | Net Investment Income to Common Share- holders | | Capital Gains to Common Share- holders | | Total | | Discount from Common Shares Repurchased and Retired | | Ending Common Share Net Asset Value | | Ending Market Value | |
| New Jersey Dividend Advantage (NXJ) | | | | | | | | | | | | | | | | | | | | | | | | | | | |
| Year Ended 4/30: | | | | | | | | | | | | | | | | | | | | | | | | | | | | | | | | | | |
| 2011 | | $ | 14.51 | | $ | .89 | | $ | (.91 | ) | $ | (.03 | ) | $ | — | * | $ | (.05 | ) | $ | (.83 | ) | $ | (.02 | ) | $ | (.85 | ) | $ | — | | $ | 13.61 | | $ | 12.67 | |
| 2010 | | | 12.97 | | | .91 | | | 1.42 | | | (.03 | ) | | — | * | | 2.30 | | | (.75 | ) | | (.01 | ) | | (.76 | ) | | — | | | 14.51 | | | 13.48 | |
| 2009 | | | 14.26 | | | .91 | | | (1.27 | ) | | (.16 | ) | | (.03 | ) | | (.55 | ) | | (.66 | ) | | (.08 | ) | | (.74 | ) | | — | * | | 12.97 | | | 11.15 | |
| 2008 | | | 15.09 | | | .94 | | | (.80 | ) | | (.25 | ) | | (.01 | ) | | (.12 | ) | | (.68 | ) | | (.03 | ) | | (.71 | ) | | — | | | 14.26 | | | 13.11 | |
| 2007(f) | | | 14.68 | | | .78 | | | .47 | | | (.19 | ) | | — | * | | 1.06 | | | (.64 | ) | | (.01 | ) | | (.65 | ) | | — | | | 15.09 | | | 15.75 | |
| Year Ended 6/30: | | | | | | | | | | | | | | | | | | | | | | | | | | | | | | | | | | |
| 2006 | | | 15.63 | | | .95 | | | (.77 | ) | | (.18 | ) | | (.01 | ) | | (.01 | ) | | (.84 | ) | | (.10 | ) | | (.94 | ) | | — | | | 14.68 | | | 14.35 | |
| | | | | | | | | | | | | | | | | | | | | | | | | | | | |
| New Jersey Dividend Advantage 2 (NUJ) | | | | | | | | | | | | | | | | | | | | | | | | | | | |
| Year Ended 4/30: | | | | | | | | | | | | | | | | | | | | | | | | | | | | | | | | | | |
| 2011 | | | 14.47 | | | .85 | | | (.82 | ) | | (.01 | ) | | — | | | .02 | | | (.85 | ) | | (.04 | ) | | (.89 | ) | | — | | | 13.60 | | | 12.55 | |
| 2010 | | | 12.93 | | | .94 | | | 1.45 | | | (.03 | ) | | (.01 | ) | | 2.35 | | | (.78 | ) | | (.03 | ) | | (.81 | ) | | — | | | 14.47 | | | 14.68 | |
| 2009 | | | 14.35 | | | .95 | | | (1.42 | ) | | (.17 | ) | | (.02 | ) | | (.66 | ) | | (.69 | ) | | (.07 | ) | | (.76 | ) | | — | * | | 12.93 | | | 11.46 | |
| 2008 | | | 15.31 | | | .97 | | | (.79 | ) | | (.23 | ) | | (.05 | ) | | (.10 | ) | | (.71 | ) | | (.15 | ) | | (.86 | ) | | — | | | 14.35 | | | 13.59 | |
| 2007(f) | | | 14.87 | | | .83 | | | .47 | | | (.20 | ) | | — | * | | 1.10 | | | (.66 | ) | | — | * | | (.66 | ) | | — | | | 15.31 | | | 16.50 | |
| Year Ended 6/30: | | | | | | | | | | | | | | | | | | | | | | | | | | | | | | | | | | |
| 2006 | | | 15.79 | | | .99 | | | (.76 | ) | | (.19 | ) | | (.01 | ) | | .03 | | | (.86 | ) | | (.09 | ) | | (.95 | ) | | — | | | 14.87 | | | 14.90 | |
| (a) | The amounts shown are based on Common share equivalents. |
| (b) | Total Return Based on Market Value is the combination of changes in the market price per share and the effect of reinvested dividend income and reinvested capital gains distributions, if any, at the average price paid per share at the time of reinvestment. The last dividend declared in the period, which is typically paid on the first business day of the following month, is assumed to be reinvested at the ending market price. The actual reinvestment for the last dividend declared in the period may take place over several days, and in some instances may not be based on the market price, so the actual reinvestment price may be different from the price used in the calculation. |
| | Total returns are not annualized. |
| | |
| | Total Return Based on Common Share Net Asset Value is the combination of changes in Common share net asset value, reinvested dividend income at net asset value and reinvested capital gains distributions at net asset value, if any. The last dividend declared in the period, which is typically paid on the first business day of the following month, is assumed to be reinvested at the ending net asset value. The actual reinvest price for the last dividend declared in the period may often be based on the Fund’s market price (and not its net asset value), and therefore may be different from the price used in the calculation. Total returns are not annualized. |
| (c) | After expense reimbursement from Adviser, where applicable. Ratios do not reflect the effect of custodian fee credits earned on the Fund’s net cash on deposit with the custodian bank, where applicable. As of March 31, 2011, the Adviser is no longer reimbursing New Jersey Dividend Advantage (NXJ) for any fees or expenses. |
| | | | Ratios/Supplemental Data | |
| | Total Returns | | | | | Ratios to Average Net Assets Applicable to Common Shares Before Reimbursement(d) | | Ratios to Average Net Assets Applicable to Common Shares After Reimbursement(c)(d) | | | | |
| | Based on Market Value | (b) | Based on Common Share Net Asset Value | (b) | Ending Net Assets Applicable to Common Shares (000) | | Expenses | (e) | Net Investment Income | | Expenses | (e) | Net Investment Income | | Portfolio Turnover Rate | |
| | | | | | | | | | | | | | | | | | | | | | | | | |
| | | | | | | | | | | | | | | | | | | | | | | | | |
| | | .11 | % | | (.38 | )% | $ | 89,399 | | | 1.34 | % | | 6.16 | % | | 1.27 | % | | 6.23 | % | | 6 | % |
| | | 28.17 | | | 18.03 | | | 95,300 | | | 1.18 | | | 6.35 | | | 1.04 | | | 6.49 | | | 4 | |
| | | (8.95 | ) | | (3.63 | ) | | 85,230 | | | 1.29 | | | 6.74 | | | 1.06 | | | 6.98 | | | — | *** |
| | | (12.31 | ) | | (.81 | ) | | 93,762 | | | 1.20 | | | 6.10 | | | .90 | | | 6.40 | | | 17 | |
| | | 14.37 | | | 7.26 | | | 99,203 | | | 1.20 | ** | | 5.85 | ** | | .84 | ** | | 6.22 | ** | | 9 | |
| | | | | | | | | | | | | | | | | | | | | | | | | |
| | | (.78 | ) | | (.05 | ) | | 96,378 | | | 1.19 | | | 5.83 | | | .77 | | | 6.26 | | | 16 | |
| | | | | | | | | | | | | | | | | | | | | | | | | |
| | | | | | | | | | | | | | | | | | | | | | | | | |
| | | (8.75 | ) | | .10 | | | 61,503 | | | 1.96 | | | 5.84 | | | 1.81 | | | 5.99 | | | 7 | |
| | | 35.95 | | | 18.55 | | | 65,410 | | | 1.22 | | | 6.54 | | | 1.00 | | | 6.76 | | | 4 | |
| | | (9.75 | ) | | (4.36 | ) | | 58,456 | | | 1.33 | | | 6.95 | | | 1.03 | | | 7.25 | | | — | *** |
| | | (12.41 | ) | | (.60 | ) | | 64,904 | | | 1.25 | | | 6.16 | | | .87 | | | 6.54 | | | 16 | |
| | | 15.40 | | | 7.50 | | | 69,238 | | | 1.24 | ** | | 6.03 | ** | | .80 | ** | | 6.47 | ** | | 11 | |
| | | | | | | | | | | | | | | | | | | | | | | | | |
| | | (.49 | ) | | .25 | | | 67,150 | | | 1.23 | | | 5.99 | | | .78 | | | 6.45 | | | 13 | |
| (d) | Ratios do not reflect the effect of dividend payments to Auction Rate Preferred shareholders, where applicable; Net Investment Income ratios reflect income earned and expenses incurred on assets attributable to ARPS and/or MTP shares, where applicable. |
| (e) | The expense ratios reflect, among other things, all interest expense and other costs related to MTP shares and/or the interest expense deemed to have been paid by the Fund on the floating rate certificates issued by the special purpose trusts for the self-deposited inverse floaters held by the Fund, both as described in Footnote 1 –General Information and Significant Accounting Policies, MuniFund Term Preferred Shares and Inverse Floating Rate Securities, respectively, as follows: |
| New Jersey Dividend Advantage (NXJ) | | | | |
| Year Ended 4/30: | | | | |
| 2011 | | | .15 | % |
| 2010 | | | — | |
| 2009 | | | — | |
| 2008 | | | — | |
| 2007(f) | | | — | |
| Year Ended 6/30: | | | | |
| 2006 | | | — | |
| | | | | |
| New Jersey Dividend Advantage 2 (NUJ) | | | | |
| Year Ended 4/30: | | | | |
| 2011 | | | .79 | |
| 2010 | | | — | |
| 2009 | | | — | |
| 2008 | | | — | |
| 2007(f) | | | — | |
| Year Ended 6/30: | | | | |
| 2006 | | | — | |
| (f) | For the ten months ended April 30, 2007. |
| * | Rounds to less than $.01 per share. |
| ** | Annualized. |
| *** | Rounds to less than 1%. |
See accompanying notes to financial statements.
| | | Financial |
| | | Highlights (continued) |
| | | |
| | Selected data for a Common share outstanding throughout each period: |
| | | | | | Investment Operations | | Less Distributions | | | | | | | | | | | | | |
| | | Beginning Common Share Net Asset Value | | Net Investment Income | | Net Realized/ Unrealized Gain (Loss) | | Distributions from Net Investment Income to Auction Rate Preferred Share- holders | (a) | Distributions from Capital Gains to Auction Rate Preferred Share- holders | (a) | Total | | Net Investment Income to Common Share- holders | | Capital Gains to Common Share- holders | | Total | | Discount from Common Shares Repur- chased and Retired | | Offering Costs | | Ending Common Share Net Asset Value | | Ending Market Value | |
| New Jersey Municipal Value (NJV) | | | | | | | | | | | | | | | | | | | | | | | | | | | |
| Year Ended 4/30: | | | | | | | | | | | | | | | | | | | | | | | | | | | | | | | | | |
| 2011 | | $ | 15.84 | | $ | .82 | | $ | (1.15 | ) | | N/A | | | N/A | | $ | (.33 | ) | $ | (.77 | ) | $ | (.02 | ) | $ | (.79 | ) | $ | — | | $ | — | | $ | 14.72 | | $ | 13.81 | |
| 2010 | | | 14.29 | | | .70 | | | 1.55 | | | N/A | | | N/A | | | 2.25 | | | (.70 | ) | | — | | | (.70 | ) | | — | | | — | * | | 15.84 | | | 15.21 | |
| 2009(f) | | | 14.33 | | | (.01 | ) | | — | | | N/A | | | N/A | | | (.01 | ) | | — | | | — | | | — | | | — | | | (.03 | ) | | 14.29 | | | 15.00 | |
| | | | | | | | | | | | | | | | | | | | | | | | | | | | |
| Pennsylvania Investment Quality (NQP) | | | | | | | | | | | | | | | | | | | | | | | | | | | |
| Year Ended 4/30: | | | | | | | | | | | | | | | | | | | | | | | | | | | | | | | | | |
| 2011 | | | 14.82 | | | .93 | | | (.73 | ) | $ | (.01 | ) | $ | — | | | .19 | | | (.90 | ) | | — | | | (.90 | ) | | — | | | — | | | 14.11 | | | 13.09 | |
| 2010 | | | 13.53 | | | .96 | | | 1.16 | | | (.03 | ) | | — | | | 2.09 | | | (.80 | ) | | — | | | (.80 | ) | | — | * | | — | | | 14.82 | | | 13.64 | |
| 2009 | | | 14.39 | | | .96 | | | (.94 | ) | | (.20 | ) | | — | | | (.18 | ) | | (.68 | ) | | — | | | (.68 | ) | | — | * | | — | | | 13.53 | | | 11.34 | |
| 2008 | | | 15.19 | | | .95 | | | (.81 | ) | | (.29 | ) | | — | | | (.15 | ) | | (.66 | ) | | — | | | (.66 | ) | | .01 | | | — | | | 14.39 | | | 13.10 | |
| 2007(g) | | | 14.71 | | | .77 | | | .47 | | | (.23 | ) | | — | | | 1.01 | | | (.53 | ) | | — | | | (.53 | ) | | — | | | — | | | 15.19 | | | 14.01 | |
| Year Ended 6/30: | | | | | | | | | | | | | | | | | | | | | | | | | | | | | | | | | |
| 2006 | | | 15.73 | | | .90 | | | (.87 | ) | | (.21 | ) | | (.02 | ) | | (.20 | ) | | (.71 | ) | | (.11 | ) | | (.82 | ) | | — | | | — | | | 14.71 | | | 12.95 | |
| (a) | The amounts shown are based on Common share equivalents. |
| (b) | Total Return Based on Market Value is the combination of changes in the market price per share and the effect of reinvested dividend income and reinvested capital gains distributions, if any, at the average price paid per share at the time of reinvestment. The last dividend declared in the period, which is typically paid on the first business day of the following month, is assumed to be reinvested at the ending market price. The actual reinvestment for the last dividend declared in the period may take place over several days, and in some instances may not be based on the market price, so the actual reinvestment price may be different from the price used in the calculation. |
| | Total returns are not annualized. |
| | |
| | Total Return Based on Common Share Net Asset Value is the combination of changes in Common share net asset value, reinvested dividend income at net asset value and reinvested capital gains distributions at net asset value, if any. The last dividend declared in the period, which is typically paid on the first business day of the following month, is assumed to be reinvested at the ending net asset value. The actual reinvest price for the last dividend declared in the period may often be based on the Fund’s market price (and not its net asset value), and therefore may be different from the price used in the calculation. Total returns are not annualized. |
| (c) | Ratios do not reflect the effect of custodian fee credits earned on the Fund’s net cash on deposit with the custodian bank, where applicable. |
| | | | | Ratios/Supplemental Data | |
| | | Total Returns | | | | | Ratios to Average Net Assets Applicable to Common Shares(c)(d) | | | | |
| | | Based on Market Value | (b) | Based on Common Share Net Asset Value | (b) | Ending Net Assets Applicable to Common Shares (000) | | Expenses | (e) | Net Investment Income (Loss) | | Portfolio Turnover Rate | |
| | | | | | | | | | | | | | | | | | | | |
| | | | | | | | | | | | | | | | | | | | |
| | | | (4.19 | )% | | (2.17 | )% | $ | 22,981 | | | .85 | % | | 5.32 | % | | 2 | % |
| | | | 6.32 | | | 16.05 | | | 24,722 | | | .82 | | | 4.63 | | | 5 | |
| | | | — | | | (.24 | ) | | 20,891 | | | .64 | ** | | (.64 | )** | | 0 | |
| | | | | | | | | | | | | | | | | | | | |
| | | | | | | | | | | | | | | | | | | | |
| | | | 2.43 | | | 1.27 | | | 226,905 | | | 1.60 | | | 6.38 | | | 8 | |
| | | | 27.87 | | | 15.74 | | | 238,368 | | | 1.23 | | | 6.72 | | | 6 | |
| | | | (7.99 | ) | | (1.01 | ) | | 218,353 | | | 1.50 | | | 7.23 | | | 3 | |
| | | | (1.78 | ) | | (.92 | ) | | 232,528 | | | 1.65 | | | 6.48 | | | 20 | |
| | | | 12.41 | | | 6.89 | | | 247,644 | | | 1.54 | ** | | 6.06 | ** | | 16 | |
| | | | | | | | | | | | | | | | | | | | |
| | | | (9.47 | ) | | (1.34 | ) | | 239,718 | | | 1.23 | | | 5.87 | | | 20 | |
| (d) | Ratios do not reflect the effect of dividend payments to Auction Rate Preferred shareholders, where applicable; Net Investment Income ratios reflect income earned and expenses incurred on assets attributable to ARPS and/or VRDP shares, where applicable. |
| (e) | The expense ratios reflect, among other things, all interest expense and other costs related to VRDP shares and/or the interest expense deemed to have been paid by the Fund on the floating rate certificates issued by the special purpose trusts for the self-deposited inverse floaters held by the Fund, where applicable, both as described in Footnote 1 – General Information and Significant Accounting Policies, Variable Rate Demand Preferred Shares and Inverse Floating Rate Securities, respectively, as follows: |
| New Jersey Municipal Value (NJV) | | | | |
| Year Ended 4/30: | | | | |
| 2011 | | | .06 | % |
| 2010 | | | .06 | |
| 2009(f) | | | — | |
| | | | | |
| Pennsylvania Investment Quality (NQP) | | | | |
| Year Ended 4/30: | | | | |
| 2011 | | | .55 | |
| 2010 | | | .07 | |
| 2009 | | | .19 | |
| 2008 | | | .38 | |
| 2007(g) | | | .29 | ** |
| Year Ended 6/30: | | | | |
| 2006 | | | — | |
| (f) | For the period April 28, 2009 (commencement of operations) through April 30, 2009. |
| (g) | For the ten months ended April 30, 2007. |
| * | Rounds to less than $.01 per share. |
| ** | Annualized. |
See accompanying notes to financial statements.
| | | Financial |
| | | Highlights (continued) |
| | | |
| | Selected data for a Common share outstanding throughout each period: |
| | | | | | Investment Operations | | Less Distributions | | | | | | | | | | | | | |
| | | Beginning Common Share Net Asset Value | | Net Investment Income | | Net Realized/ Unrealized Gain (Loss) | | Distributions from Net Investment Income to Auction Rate Preferred Share- holders | (a) | Distributions from Capital Gains to Auction Rate Preferred Share- holders | (a) | Total | | Net Investment Income to Common Share- holders | | Capital Gains to Common Share- holders | | Total | | Discount from Common Shares Repurchased and Retired | | Ending Common Share Net Asset Value | | Ending Market Value | |
| Pennsylvania Premium Income 2 (NPY) | | | | | | | | | | | | | | | | | | | | | | | | | | |
| Year Ended 4/30: | | | | | | | | | | | | | | | | | | | | | | | | | | | | | | | | | | |
| 2011 | | $ | 14.11 | | $ | .85 | | $ | (.59 | ) | $ | (.01 | ) | $ | — | | $ | .25 | | $ | (.84 | ) | $ | — | | $ | (.84 | ) | $ | — | | $ | 13.52 | | $ | 12.29 | |
| 2010 | | | 12.72 | | | .91 | | | 1.28 | | | (.03 | ) | | — | | | 2.16 | | | (.77 | ) | | — | | | (.77 | ) | | — | ** | | 14.11 | | | 12.91 | |
| 2009 | | | 13.74 | | | .91 | | | (1.12 | ) | | (.19 | ) | | — | | | (.40 | ) | | (.62 | ) | | — | | | (.62 | ) | | — | ** | | 12.72 | | | 10.60 | |
| 2008 | | | 14.70 | | | .90 | | | (.94 | ) | | (.26 | ) | | (.02 | ) | | (.32 | ) | | (.61 | ) | | (.04 | ) | | (.65 | ) | | .01 | | | 13.74 | | | 12.30 | |
| 2007(f) | | | 14.22 | | | .74 | | | .50 | | | (.21 | ) | | — | | | 1.03 | | | (.55 | ) | | — | | | (.55 | ) | | — | | | 14.70 | | | 13.67 | |
| Year Ended 6/30: | | | | | | | | | | | | | | | | | | | | | | | | | | | | | | | | | | |
| 2006 | | | 15.32 | | | .89 | | | (.80 | ) | | (.18 | ) | | (.03 | ) | | (.12 | ) | | (.77 | ) | | (.21 | ) | | (.98 | ) | | — | | | 14.22 | | | 12.96 | |
| | | | | | | | | | | | | | | | | | | | | | | | | | | | | | | | | | | | | | |
| Pennsylvania Dividend Advantage (NXM) | | | | | | | | | | | | | | | | | | | | | | | | | | |
| Year Ended 4/30: | | | | | | | | | | | | | | | | | | | | | | | | | | | | | | | | | | |
| 2011 | | | 14.73 | | | .85 | | | (.65 | ) | | (.01 | ) | | — | | | .19 | | | (.87 | ) | | (.05 | ) | | (.92 | ) | | — | | | 14.00 | | | 12.85 | |
| 2010 | | | 13.09 | | | .96 | | | 1.55 | | | (.03 | ) | | (.01 | ) | | 2.47 | | | (.79 | ) | | (.04 | ) | | (.83 | ) | | — | ** | | 14.73 | | | 13.77 | |
| 2009 | | | 14.47 | | | .97 | | | (1.47 | ) | | (.18 | ) | | — | | | (.68 | ) | | (.70 | ) | | — | | | (.70 | ) | | — | ** | | 13.09 | | | 11.31 | |
| 2008 | | | 15.36 | | | .97 | | | (.84 | ) | | (.25 | ) | | (.02 | ) | | (.14 | ) | | (.70 | ) | | (.05 | ) | | (.75 | ) | | — | | | 14.47 | | | 13.61 | |
| 2007(f) | | | 14.95 | | | .82 | | | .46 | | | (.21 | ) | | — | | | 1.07 | | | (.66 | ) | | — | | | (.66 | ) | | — | | | 15.36 | | | 15.70 | |
| Year Ended 6/30: | | | | | | | | | | | | | | | | | | | | | | | | | | | | | | | | | | |
| 2006 | | | 15.93 | | | .98 | | | (.78 | ) | | (.19 | ) | | (.01 | ) | | — | | | (.88 | ) | | (.10 | ) | | (.98 | ) | | — | | | 14.95 | | | 15.10 | |
| (a) | The amounts shown are based on Common share equivalents. |
| (b) | Total Return Based on Market Value is the combination of changes in the market price per share and the effect of reinvested dividend income and reinvested capital gains distributions, if any, at the average price paid per share at the time of reinvestment. The last dividend declared in the period, which is typically paid on the first business day of the following month, is assumed to be reinvested at the ending market price. The actual reinvestment for the last dividend declared in the period may take place over several days, and in some instances may not be based on the market price, so the actual reinvestment price may be different from the price used in the calculation. |
| | Total returns are not annualized. |
| | |
| | Total Return Based on Common Share Net Asset Value is the combination of changes in Common share net asset value, reinvested dividend income at net asset value and reinvested capital gains distributions at net asset value, if any. The last dividend declared in the period, which is typically paid on the first business day of the following month, is assumed to be reinvested at the ending net asset value. The actual reinvest price for the last dividend declared in the period may often be based on the Fund’s market price (and not its net asset value), and therefore may be different from the price used in the calculation. Total returns are not annualized. |
| (c) | After expense reimbursement from Adviser, where applicable. Ratios do not reflect the effect of custodian fee credits earned on the Fund’s net cash on deposit with the custodian bank, where applicable. As of March 31, 2011, the Adviser is no longer reimbursing Pennsylvania Dividend Advantage (NXM) for any fees or expenses. |
| | | | | Ratios/Supplemental Data | |
| | | Total Returns | | | | | Ratios to Average Net Assets Applicable to Common Shares Before Reimbursement(d) | | Ratios to Average Net Assets Applicable to Common Shares After Reimbursement(c)(d) | | | | |
| | | Based on Market Value | (b) | Based on Common Share Net Asset Value | (b) | Ending Net Assets Applicable to Common Shares (000) | | Expenses | (e) | Net Investment Income | | Expenses | (e) | Net Investment Income | | Portfolio Turnover Rate | |
| | | | | | | | | | | | | | | | | | | | | | | | | | |
| | | | | | | | | | | | | | | | | | | | | | | | | | |
| | | | 1.48 | % | | 1.75 | % | $ | 210,839 | | | 1.56 | % | | 6.13 | % | | N/A | | | N/A | | | 8 | % |
| | | | 29.70 | | | 17.35 | | | 220,113 | | | 1.21 | | | 6.67 | | | N/A | | | N/A | | | 5 | |
| | | | (8.43 | ) | | (2.65 | ) | | 198,739 | | | 1.35 | | | 7.28 | | | N/A | | | N/A | | | 6 | |
| | | | (5.26 | ) | | (2.06 | ) | | 215,252 | | | 1.55 | | | 6.36 | | | N/A | | | N/A | | | 27 | |
| | | | 9.83 | | | 7.31 | | | 232,650 | | | 1.40 | *** | | 6.08 | *** | | N/A | | | N/A | | | 15 | |
| | | | | | | | | | | | | | | | | | | | | | | | | | |
| | | | (8.42 | ) | | (.80* | ) | | 225,121 | | | 1.20 | | | 6.01 | | | N/A | | | N/A | | | 18 | |
| | | | | | | | | | | | | | | | | | | | | | | | | | |
| | | | | | | | | | | | | | | | | | | | | | | | | | |
| | | | (.27 | ) | | 1.23 | | | 46,521 | | | 1.94 | | | 5.78 | | | 1.87 | % | | 5.85 | % | | 8 | |
| | | | 29.85 | | | 19.29 | | | 48,934 | | | 1.26 | | | 6.66 | | | 1.11 | | | 6.81 | | | 5 | |
| | | | (11.67 | ) | | (4.57 | ) | | 43,587 | | | 1.37 | | | 7.17 | | | 1.14 | | | 7.39 | | | 4 | |
| | | | (8.46 | ) | | (.87 | ) | | 48,211 | | | 1.39 | | | 6.26 | | | 1.09 | | | 6.55 | | | 20 | |
| | | | 8.40 | | | 7.22 | | | 51,160 | | | 1.33 | *** | | 5.99 | *** | | .96 | *** | | 6.36 | *** | | 11 | |
| | | | | | | | | | | | | | | | | | | | | | | | | | |
| | | | (.56 | ) | | (.01 | ) | | 49,660 | | | 1.25 | | | 5.90 | | | .82 | | | 6.33 | | | 12 | |
| (d) | Ratios do not reflect the effect of dividend payments to Auction Rate Preferred shareholders, where applicable; Net Investment Income ratios reflect income earned and expenses incurred on assets attributable to ARPS, MTP shares and/or VRDP shares, where applicable. |
| (e) | The expense ratios reflect, among other things, all interest expense and other costs related to MTP and VRDP shares and/or the interest expense deemed to have been paid by the Fund on the floating rate certificates issued by the special purpose trusts for the self-deposited inverse floaters held by the Fund, each as described in Footnote 1 – General Information and Significant Accounting Policies, MuniFund Term Preferred Shares, Variable Rate Demand Preferred Shares and Inverse Floating Rate Securities, respectively, as follows: |
| Pennsylvania Premium Income 2 (NPY) | | | | |
| Year Ended 4/30: | | | | |
| 2011 | | | .52 | % |
| 2010 | | | .05 | |
| 2009 | | | .04 | |
| 2008 | | | .27 | |
| 2007(f) | | | .19 | *** |
| Year Ended 6/30: | | | | |
| 2006 | | | — | |
| | | | | |
| Pennsylvania Dividend Advantage (NXM) | | | | |
| Year Ended 4/30: | | | | |
| 2011 | | | .76 | |
| 2010 | | | .02 | |
| 2009 | | | — | |
| 2008 | | | .11 | |
| 2007(f) | | | .06 | *** |
| Year Ended 6/30: | | | | |
| 2006 | | | — | |
| (f) | For the ten months ended April 30, 2007. |
| N/A | Fund does not have a contractual reimbursement with the Adviser. |
| * | During the fiscal year ended June 30, 2006, Pennsylvania Premium Income 2 (NPY) received a payment from the Adviser of $27,169, to offset losses realized on the disposal of investments purchased in violation of the Fund’s investment restrictions. This reimbursement did not have an impact on the Fund’s Total Return Based on Common Share Net Asset Value. |
| ** | Rounds to less than $.01 per share. |
| *** | Annualized. |
See accompanying notes to financial statements.
| | | Financial |
| | | Highlights (continued) |
| | | |
| | Selected data for a Common share outstanding throughout each period: |
| | | | | | Investment Operations | | Less Distributions | | | | | | | | | | | | | |
| | | Beginning Common Share Net Asset Value | | Net Investment Income | | Net Realized/ Unrealized Gain (Loss) | | Distributions from Net Investment Income to Auction Rate Preferred Share- holders | (a) | Distributions from Capital Gains to Auction Rate Preferred Share- holders | (a) | Total | | Net Investment Income to Common Share- holders | | Capital Gains to Common Share- holders | | Total | | Discount from Common Shares Repur- chased and Retired | | Offering Costs | | Ending Common Share Net Asset Value | | Ending Market Value | |
| Pennsylvania Dividend Advantage 2 (NVY) | | | | | | | | | | | | | | | | | | | | | | | | | | | |
| Year Ended 4/30: | | | | | | | | | | | | | | | | | | | | | | | | | | | | | | | | |
| 2011 | | $ | 14.74 | | $ | .89 | | $ | (.60 | ) | $ | (.01 | ) | $ | — | | $ | .28 | | $ | (.89 | ) | $ | (.05 | ) | $ | (.94 | ) | $ | — | | $ | — | | $ | 14.08 | | $ | 13.00 | |
| 2010 | | | 13.42 | | | .97 | | | 1.27 | | | (.02 | ) | | (.01 | ) | | 2.21 | | | (.82 | ) | | (.07 | ) | | (.89 | ) | | — | | | — | | | 14.74 | | | 14.19 | |
| 2009 | | | 14.49 | | | .99 | | | (1.17 | ) | | (.19 | ) | | — | * | | (.37 | ) | | (.70 | ) | | — | * | | (.70 | ) | | — | | | — | | | 13.42 | | | 11.45 | |
| 2008 | | | 15.34 | | | .99 | | | (.80 | ) | | (.26 | ) | | (.02 | ) | | (.09 | ) | | (.71 | ) | | (.05 | ) | | (.76 | ) | | — | | | — | | | 14.49 | | | 13.40 | |
| 2007(f) | | | 14.93 | | | .83 | | | .44 | | | (.21 | ) | | (.01 | ) | | 1.05 | | | (.62 | ) | | (.02 | ) | | (.64 | ) | | — | | | — | | | 15.34 | | | 15.18 | |
| Year Ended 6/30: | | | | | | | | | | | | | | | | | | | | | | | | | | | | | | | | | |
| 2006 | | | 15.89 | | | .98 | | | (.85 | ) | | (.19 | ) | | (.01 | ) | | (.07 | ) | | (.79 | ) | | (.10 | ) | | (.89 | ) | | — | | | — | | | 14.93 | | | 14.16 | |
| | | | | | | | | | | | | | | | | | | | | | | | | | | | | | | | | | | | | | | | | |
| Pennsylvania Municipal Value (NPN) | | | | | | | | | | | | | | | | | | | | | | | | | | | |
| Year Ended 4/30: | | | | | | | | | | | | | | | | | | | | | | | | | | | | | | | | |
| 2011 | | | 15.46 | | | .79 | | | (.70 | ) | | N/A | | | N/A | | | .09 | | | (.76 | ) | | — | | | (.76 | ) | | — | | | — | | | 14.79 | | | 13.96 | |
| 2010 | | | 14.29 | | | .70 | | | 1.19 | | | N/A | | | N/A | | | 1.89 | | | (.72 | ) | | — | | | (.72 | ) | | — | | | — | * | | 15.46 | | | 15.43 | |
| 2009(g) | | | 14.33 | | | (.01 | ) | | — | | | N/A | | | N/A | | | (.01 | ) | | — | | | — | | | — | | | — | | | (.03 | ) | | 14.29 | | | 15.05 | |
| (a) | The amounts shown are based on Common share equivalents. |
| (b) | Total Return Based on Market Value is the combination of changes in the market price per share and the effect of reinvested dividend income and reinvested capital gains distributions, if any, at the average price paid per share at the time of reinvestment. The last dividend declared in the period, which is typically paid on the first business day of the following month, is assumed to be reinvested at the ending market price. The actual reinvestment for the last dividend declared in the period may take place over several days, and in some instances may not be based on the market price, so the actual reinvestment price may be different from the price used in the calculation. |
| | Total returns are not annualized. |
| | |
| | Total Return Based on Common Share Net Asset Value is the combination of changes in Common share net asset value, reinvested dividend income at net asset value and reinvested capital gains distributions at net asset value, if any. The last dividend declared in the period, which is typically paid on the first business day of the following month, is assumed to be reinvested at the ending net asset value. The actual reinvest price for the last dividend declared in the period may often be based on the Fund’s market price (and not its net asset value), and therefore may be different from the price used in the calculation. Total returns are not annualized. |
| (c) | After expense reimbursement from Adviser, where applicable. Ratios do not reflect the effect of custodian fee credits earned on the Fund’s net cash on deposit with the custodian bank, where applicable. |
| | | | | | | Ratios/Supplemental Data | |
| | | Total Returns | | | | Ratios to Average Net Assets Applicable to Common Shares Before Reimbursement(d) | | Ratios to Average Net Assets Applicable to Common Shares After Reimbursement(c)(d) | | | |
| | | Based on Market Value | (b) | Based on Common Share Net Asset Value | (b) | Ending Net Assets Applicable to Common Shares (000) | | Expenses | (e) | Net Investment Income (Loss) | | Expenses | (e) | Net Investment Income (Loss) | | Portfolio Turnover Rate | |
| | | | | | | | | | | | | | | | | | | | | | | | | | |
| | | | | | | | | | | | | | | | | | | | | | | | | | |
| | | | (2.00 | )% | | 1.89 | % | $ | 52,470 | | | 1.88 | % | | 5.94 | % | | 1.74 | % | | 6.08 | % | | 7 | % |
| | | | 32.47 | | | 16.80 | | | 54,920 | | | 1.30 | | | 6.61 | | | 1.08 | | | 6.83 | | | 5 | |
| | | | (9.16 | ) | | (2.33 | ) | | 49,993 | | | 1.37 | | | 7.07 | | | 1.06 | | | 7.38 | | | 4 | |
| | | | (6.81 | ) | | (.60 | ) | | 53,997 | | | 1.40 | | | 6.29 | | | 1.02 | | | 6.66 | | | 27 | |
| | | | 11.88 | | | 7.14 | | | 57,142 | | | 1.33 | ** | | 6.03 | ** | | .89 | ** | | 6.47 | ** | | 13 | |
| | | | | | | | | | | | | | | | | | | | | | | | | | |
| | | | .88 | | | (.46 | ) | | 55,597 | | | 1.24 | | | 5.93 | | | .79 | | | 6.38 | | | 13 | |
| | | | | | | | | | | | | | | | | | | | | | | | | | |
| | | | | | | | | | | | | | | | | | | | | | | | | | |
| | | | (4.77 | ) | | .59 | | | 18,029 | | | .87 | | | 5.17 | | | N/A | | | N/A | | | 3 | |
| | | | 7.52 | | | 13.49 | | | 18,805 | | | .82 | | | 4.68 | | | N/A | | | N/A | | | 5 | |
| | | | .33 | | | (.31 | ) | | 15,816 | | | .66 | ** | | (.66 | )** | | N/A | | | N/A | | | 0 | |
| (d) | Ratios do not reflect the effect of dividend payments to Auction Rate Preferred shareholders, where applicable; Net Investment Income ratios reflect income earned and expenses incurred on assets attributable to ARPS and/or MTP shares, where applicable. |
| (e) | The expense ratios reflect, among other things, all interest expense and other costs related to MTP shares and/or the interest expense deemed to have been paid by the Fund on the floating rate certificates issued by the special purpose trusts for the self-deposited inverse floaters held by the Fund, both each as described in Footnote 1 –General Information and Significant Accounting Policies, MuniFund Term Preferred Shares and Inverse Floating Rate Securities, respectively, as follows: |
| Pennsylvania Dividend Advantage 2 (NVY) | | | | |
| Year Ended 4/30: | | | | |
| 2011 | | | .71 | % |
| 2010 | | | .08 | |
| 2009 | | | .01 | |
| 2008 | | | .11 | |
| 2007(f) | | | .06 | ** |
| Year Ended 6/30: | | | | |
| 2006 | | | — | |
| | | | | |
| Pennsylvania Municipal Value (NPN) | | | | |
| Year Ended 4/30: | | | | |
| 2011 | | | — | % |
| 2010 | | | — | |
| 2009(g) | | | — | |
| (f) | For the ten months ended April 30, 2007. |
| (g) | For the period April 28, 2009 (commencement of operations) through April 30, 2009. N/A Fund does not have a contractual reimbursement with the Adviser. |
| * | Rounds to less than $.01 per share. |
| ** | Annualized. |
See accompanying notes to financial statements.
| | | Financial |
| | | Highlights (continued) |
| | | |
| | Selected data for a Common share outstanding throughout each period: |
| | | ARPS at End of Period | | MTP at End of Period | | VRDP at End of Period | |
| | | Aggregate Amount Outstanding (000) | | Liquidation and Market Value Per Share | | Asset Coverage Per Share | | Aggregate Amount Outstanding (000) | | Liquidation Value Per Share | | Ending Market Value Per Share | | Average Market Value Per Share | | Asset Coverage Per Share | | Aggregate Amount Outstanding (000) | | Liquidation Value Per Share | | Asset Coverage Per Share | |
| New Jersey Investment Quality (NQJ) | | | | | | | | | | | | | | | | | | | | | | | | |
| Year Ended 4/30: | | | | | | | | | | | | | | | | | | | | | | | | | | | |
| 2011 | | $ | — | | $ | — | | $ | — | | $ | — | | $ | — | | $ | — | | $ | — | | $ | — | | $ | 144,300 | | $ | 100,000 | | $ | 294,018 | |
| 2010 | | | 143,450 | | | 25,000 | | | 76,478 | | | — | | | — | | | — | | | — | | | — | | | — | | | — | | | — | |
| 2009 | | | 149,825 | | | 25,000 | | | 69,373 | | | — | | | — | | | — | | | — | | | — | | | — | | | — | | | — | |
| 2008 | | | 162,000 | | | 25,000 | | | 70,092 | | | — | | | — | | | — | | | — | | | — | | | — | | | — | | | — | |
| 2007(f) | | | 162,000 | | | 25,000 | | | 72,284 | | | — | | | — | | | — | | | — | | | — | | | — | | | — | | | — | |
| Year Ended 6/30: | | | | | | | | | | | | | | | | | | | | | | | | |
| 2006 | | | 162,000 | | | 25,000 | | | 70,917 | | | — | | | — | | | — | | | — | | | — | | | — | | | — | | | — | |
| | | | | | | | | | | | | | | | | | | | | | | | | |
| New Jersey Premium Income (NNJ) | | | | | | | | | | | | | | | | | | | | | | | | |
| Year Ended 4/30: | | | | | | | | | | | | | | | | | | | | | | | | |
| 2011 | | | — | | | — | | | — | | | — | | | — | | | — | | | — | | | — | | | 88,600 | | | 100,000 | | | 293,242 | |
| 2010 | | | 87,875 | | | 25,000 | | | 76,216 | | | — | | | — | | | — | | | — | | | — | | | — | | | — | | | — | |
| 2009 | | | 91,600 | | | 25,000 | | | 70,422 | | | — | | | — | | | — | | | — | | | — | | | — | | | — | | | — | |
| 2008 | | | 91,600 | | | 25,000 | | | 73,137 | | | — | | | — | | | — | | | — | | | — | | | — | | | — | | | — | |
| 2007(f) | | | 91,600 | | | 25,000 | | | 75,093 | | | — | | | — | | | — | | | — | | | — | | | — | | | — | | | — | |
| Year Ended 6/30: | | | | | | | | | | | | | | | | | | | | | | | | |
| 2006 | | | 91,600 | | | 25,000 | | | 73,635 | | | — | | | — | | | — | | | — | | | — | | | — | | | — | | | — | |
| | | | | | | | | | | | | | | | | | | | | | | | | | | | | | | | | | | |
| New Jersey Dividend Advantage (NXJ) | | | | | | | | | | | | | | | | | | | | | | | | |
| Year Ended 4/30: | | | | | | | | | | | | | | | | | | | | | | | | |
| 2011 | | | — | | | — | | | — | | | 44,861 | | | 10.00 | | | 9.94 | | | 9.95 | ^ | | 29.93 | | | — | | | — | | | — | |
| 2010 | | | 43,925 | | | 25,000 | | | 79,240 | | | — | | | — | | | — | | | — | | | — | | | — | | | — | | | — | |
| 2009 | | | 47,025 | | | 25,000 | | | 70,311 | | | — | | | — | | | — | | | — | | | — | | | — | | | — | | | — | |
| 2008 | | | 48,000 | | | 25,000 | | | 73,834 | | | — | | | — | | | — | | | — | | | — | | | — | | | — | | | — | |
| 2007(f) | | | 48,000 | | | 25,000 | | | 76,668 | | | — | | | — | | | — | | | — | | | — | | | — | | | — | | | — | |
| Year Ended 6/30: | | | | | | | | | | | | | | | | | | | | | | | | |
| 2006 | | | 48,000 | | | 25,000 | | | 75,197 | | | — | | | — | | | — | | | — | | | — | | | — | | | — | | | — | |
| | | | | | | | | | | | | | | | | | | | | | | | | | | | | | | | | | | |
| New Jersey Dividend Advantage 2 (NUJ) | | | | | | | | | | | | | | | | | | | | | | | | |
| Year Ended 4/30: | | | | | | | | | | | | | | | | | | | | | | | | |
| 2011 | | | — | | | — | | | — | | | 35,050 | | | 10.00 | | | 9.62 | | | 9.65 | ^^ | | 27.55 | | | — | | | — | | | — | |
| 2010 | | | 31,225 | | | 25,000 | | | 77,370 | | | — | | | — | | | — | | | — | | | — | | | — | | | — | | | — | |
| 2009 | | | 32,600 | | | 25,000 | | | 69,828 | | | — | | | — | | | — | | | — | | | — | | | — | | | — | | | — | |
| 2008 | | | 34,500 | | | 25,000 | | | 72,032 | | | — | | | — | | | — | | | — | | | — | | | — | | | — | | | — | |
| 2007(f) | | | 34,500 | | | 25,000 | | | 75,172 | | | — | | | — | | | — | | | — | | | — | | | — | | | — | | | — | |
| Year Ended 6/30: | | | | | | | | | | | | | | | | | | | | | | | | |
| 2006 | | | 34,500 | | | 25,000 | | | 73,659 | | | — | | | — | | | — | | | — | | | — | | | — | | | — | | | — | |
| | | | | | | | | | | | | | | | | | | | | | | | | | | | | | | | | | | |
| New Jersey Municipal Value (NJV) | | | | | | | | | | | | | | | | | | | | | | | | |
| Year Ended 4/30: | | | | | | | | | | | | | | | | | | | | | | | | |
| 2011 | | | N/A | | | N/A | | | N/A | | | — | | | — | | | — | | | — | | | — | | | — | | | — | | | — | |
| 2010 | | | N/A | | | N/A | | | N/A | | | — | | | — | | | — | | | — | | | — | | | — | | | — | | | — | |
| 2009(f) | | | N/A | | | N/A | | | N/A | | | — | | | — | | | — | | | — | | | — | | | — | | | — | | | — | |
| N/A | Fund is not authorized to issue ARPS. |
| ^ | For the period March 24, 2011 (issuance date of shares) through April 30, 2011. |
| ^^ | For the period October 1, 2010 (issuance date of shares) through April 30, 2011. |
See accompanying notes to financial statements.
| | | ARPS at End of Period | | MTP at End of Period | | VRDP at End of Period | |
| | | Aggregate Amount Outstanding (000) | | Liquidation and Market Value Per Share | | Asset Coverage Per Share | | Aggregate Amount Outstanding (000) | | Liquidation Value Per Share | | Ending Market Value Per Share | | Average Market Value Per Share | | Asset Coverage Per Share | | Aggregate Amount Outstanding (000) | | Liquidation Value Per Share | | Asset Coverage Per Share | |
| Pennsylvania Investment Quality (NQP) | | | | | | | | | | | | | | | | | | | | | |
| Year Ended 4/30: | | | | | | | | | | | | | | | | | | | | | | | | |
| 2011 | | $ | — | | $ | — | | $ | — | | $ | — | | $ | — | | $ | — | | $ | — | | $ | — | | $ | 112,500 | | $ | 100,000 | | $ | 301,693 | |
| 2010 | | | 111,750 | | | 25,000 | | | 78,326 | | | — | | | — | | | — | | | — | | | — | | | — | | | — | | | — | |
| 2009 | | | 111,750 | | | 25,000 | | | 73,849 | | | — | | | — | | | — | | | — | | | — | | | — | | | — | | | — | |
| 2008 | | | 132,000 | | | 25,000 | | | 69,039 | | | — | | | — | | | — | | | — | | | — | | | — | | | — | | | — | |
| 2007(g) | | | 132,000 | | | 25,000 | | | 71,902 | | | — | | | — | | | — | | | — | | | — | | | — | | | — | | | — | |
| Year Ended 6/30: | | | | | | | | | | | | | | | | | | | | | |
| 2006 | | | 132,000 | | | 25,000 | | | 70,401 | | | — | | | — | | | — | | | — | | | — | | | — | | | — | | | — | |
| | | | | | | | | | | | | | | | | | | | | | | | | | | | | | | | | | | |
| Pennsylvania Premium Income 2 (NPY) | | | | | | | | | | | | | | | | | | | | | |
| Year Ended 4/30: | | | | | | | | | | | | | | | | | | | | | |
| 2011 | | | — | | | — | | | — | | | — | | | — | | | — | | | — | | | — | | | 100,000 | | | 100,000 | | | 310,839 | |
| 2010 | | | 99,275 | | | 25,000 | | | 80,430 | | | — | | | — | | | — | | | — | | | — | | | — | | | — | | | — | |
| 2009 | | | 99,275 | | | 25,000 | | | 75,047 | | | — | | | — | | | — | | | — | | | — | | | — | | | — | | | — | |
| 2008 | | | 118,100 | | | 25,000 | | | 70,566 | | | — | | | — | | | — | | | — | | | — | | | — | | | — | | | — | |
| 2007(f) | | | 118,100 | | | 25,000 | | | 74,249 | | | — | | | — | | | — | | | — | | | — | | | — | | | — | | | — | |
| Year Ended 6/30: | | | | | | | | | | | | | | | | | | | | | |
| 2006 | | | 118,100 | | | 25,000 | | | 72,655 | | | — | | | — | | | — | | | — | | | — | | | — | | | — | | | — | |
| | | | | | | | | | | | | | | | | | | | | | |
| Pennsylvania Dividend Advantage (NXM) | | | | | | | | | | | | | | | | | | | | | |
| Year Ended 4/30: | | | | | | | | | | | | | | | | | | | | | |
| 2011 | | | — | | | — | | | — | | | 23,190 | | | 10.00 | | | 9.65 | | | 9.75 | ^^^ | | 30.06 | | | — | | | — | | | — | |
| 2010 | | | 22,500 | | | 25,000 | | | 79,372 | | | — | | | — | | | — | | | — | | | — | | | — | | | — | | | — | |
| 2009 | | | 22,500 | | | 25,000 | | | 73,430 | | | — | | | — | | | — | | | — | | | — | | | — | | | — | | | — | |
| 2008 | | | 25,000 | | | 25,000 | | | 73,211 | | | — | | | — | | | — | | | — | | | — | | | — | | | — | | | — | |
| 2007(f) | | | 25,000 | | | 25,000 | | | 76,160 | | | — | | | — | | | — | | | — | | | — | | | — | | | — | | | — | |
| Year Ended 6/30: | | | | | | | | | | | | | | | | | | | | | |
| 2006 | | | 25,000 | | | 25,000 | | | 74,660 | | | — | | | — | | | — | | | — | | | — | | | — | | | — | | | — | |
| | | | | | | | | | | | | | | | | | | | | | | | | | | | | | | | | | | |
| Pennsylvania Dividend Advantage 2 (NVY) | | | | | | | | | | | | | | | | | | | | | |
| Year Ended 4/30: | | | | | | | | | | | | | | | | | | | | | |
| 2011 | | | — | | | — | | | — | | | 24,550 | | | 10.00 | | | 9.75 | | | 9.68 | ^^^^ | | 31.37 | | | — | | | — | | | — | |
| 2010 | | | 23,000 | | | 25,000 | | | 84,696 | | | — | | | — | | | — | | | — | | | — | | | — | | | — | | | — | |
| 2009 | | | 23,000 | | | 25,000 | | | 79,340 | | | — | | | — | | | — | | | — | | | — | | | — | | | — | | | — | |
| 2008 | | | 28,500 | | | 25,000 | | | 72,366 | | | — | | | — | | | — | | | — | | | — | | | — | | | — | | | — | |
| 2007(f) | | | 28,500 | | | 25,000 | | | 75,124 | | | — | | | — | | | — | | | — | | | — | | | — | | | — | | | — | |
| Year Ended 6/30: | | | | | | | | | | | | | | | | | | | | | |
| 2006 | | | 28,500 | | | 25,000 | | | 73,769 | | | — | | | — | | | — | | | — | | | — | | | — | | | — | | | — | |
| | | | | | | | | | | | | | | | | | | | | | | | | | | | | | | | | | | |
| Pennsylvania Municipal Value (NPN) | | | | | | | | | | | | | | | | | | | | | |
| Year Ended 4/30: | | | | | | | | | | | | | | | | | | | | | |
| 2011 | | | N/A | | | N/A | | | N/A | | | — | | | — | | | — | | | — | | | — | | | — | | | — | | | — | |
| 2010 | | | N/A | | | N/A | | | N/A | | | — | | | — | | | — | | | — | | | — | | | — | | | — | | | — | |
| 2009(g) | | | N/A | | | N/A | | | N/A | | | — | | | — | | | — | | | — | | | — | | | — | | | — | | | — | |
| N/A | Fund is not authorized to issue ARPS. |
| ^^^ | For the period October 4, 2010 (issuance date of shares) through April 30, 2011. |
| ^^^^ | For the period October 27, 2010 (issuance date of shares) through April 30, 2011. |
See accompanying notes to financial statements.
| | | Notes to |
| | | Financial Statements |
1. General Information and Significant Accounting Policies
General Information
The state funds covered in this report and their corresponding Common share stock exchange symbols are Nuveen New Jersey Investment Quality Municipal Fund, Inc. (NQJ), Nuveen New Jersey Premium Income Municipal Fund, Inc. (NNJ), Nuveen New Jersey Dividend Advantage Municipal Fund (NXJ), Nuveen New Jersey Dividend Advantage Municipal Fund 2 (NUJ), Nuveen New Jersey Municipal Value Fund (NJV), Nuveen Pennsylvania Investment Quality Municipal Fund (NQP), Nuveen Pennsylvania Premium Income Municipal Fund 2 (NPY), Nuveen Pennsylvania Dividend Advantage Municipal Fund (NXM), Nuveen Pennsylvania Dividend Advantage Municipal Fund 2 (NVY) and Nuveen Pennsylvania Municipal Value Fund (NPN) (collectively, the “Funds”). Common shares of New Jersey Investment Quality (NQJ), New Jersey Premium Income (NNJ), Pennsylvania Investment Quality (NQP) and Pennsylvania Premium Income 2 (NPY), are traded on the New York Stock Exchange (“NYSE”) while Common shares of New Jersey Dividend Advantage (NXJ), New Jersey Dividend Advantage 2 (NUJ), New Jersey Municipal Value (NJV), Pennsylvania Dividend Advantage (NXM), Pennsylvania Dividend Advantage 2 (NVY) and Pennsylvania Municipal Value (NPN) are traded on the NYSE Amex. The Funds are registered under the Investment Company Act of 1940, as amended, as closed-end registered investment companies.
Effective January 1, 2011, the Funds’ adviser, Nuveen Asset Management, a wholly-owned subsidiary of Nuveen Investments, Inc. (“Nuveen”), changed its name to Nuveen Fund Advisors, Inc. (the “Adviser”). Concurrently, the Adviser formed a wholly-owned subsidiary, Nuveen Asset Management, LLC (the “Sub-Adviser”), to house its portfolio management capabilities and to serve as the Funds’ sub-adviser, and the Funds’ portfolio manager became an employee of the Sub-Adviser. This allocation of responsibilities between the Adviser and the Sub-Adviser affects each of the Funds. The Adviser will compensate the Sub-Adviser for the portfolio management services it provides to the Funds from each Fund’s management fee.
Each Fund seeks to provide current income exempt from both regular federal and designated state income taxes by investing primarily in a portfolio of municipal obligations issued by state and local government authorities within a single state or certain U.S. territories.
Significant Accounting Policies
The following is a summary of significant accounting policies followed by the Funds in the preparation of their financial statements in accordance with U.S. generally accepted accounting principles (“U.S. GAAP”).
Investment Valuation
Prices of municipal bonds are provided by a pricing service approved by the Funds’ Board of Directors/Trustees. These securities are generally classified as Level 2 for fair value measurement purposes. When price quotes are not readily available (which is usually the case for municipal bonds) the pricing service establishes a security’s fair value using methods that may include consideration of the following: yields or prices of investments of comparable quality, type of issue, coupon, maturity and rating, market quotes or indications of value from security dealers, evaluations of anticipated cash flows or collateral, general market conditions and other information and analysis, including the obligor’s credit characteristics considered relevant. In pricing certain securities, particularly less liquid and lower quality securities, the pricing service may consider information about a security, its issuer, or market activity, provided by the Adviser. These securities are generally classified as Level 2 or Level 3 depending on the priority of the significant inputs.
Certain securities may not be able to be priced by the pre-established pricing methods as described above. Such securities may be valued by the Funds’ Board of Directors/Trustees or its designee at fair value. These securities generally include, but are not limited to, restricted securities (securities which may not be publicly sold without registration under the Securities Act of 1933, as amended) for which a pricing service is unable to provide a market price; securities whose trading has been formally suspended; debt securities that have gone into default and for which there is no current market quotation; a security whose market price is not available from a pre-established pricing source; a security with respect to which an event has occurred that is likely to materially affect the value of the security after the market has closed but before the calculation of a Fund’s net asset value (as may be the case in non-U.S. markets on which the security is primarily traded) or make it difficult or impossible to obtain a reliable market quotation; and a security whose price, as provided by the pricing service, is not deemed to reflect the security’s fair value. As a general principle, the fair value of a security would appear to be the amount that the owner might reasonably expect to receive for it in a current sale. A variety of factors may be considered in determining the fair value of such securities, which may include consideration of the following: yields or prices of investments of comparable quality, type of issue, coupon, maturity and rating, market quotes or indications of value from security dealers, evaluations of anticipated cash flows or collateral, general market conditions and other information and analysis, including the obligor’s credit characteristics considered relevant.
These securities are generally classified as Level 2 or Level 3 depending on the priority of the significant inputs. Regardless of the method employed to value a particular security, all valuations are subject to review by the Funds’ Board of Directors/Trustees or its designee.
Refer to Footnote 2 – Fair Value Measurements for further details on the leveling of securities held by the Funds as of the end of the reporting period.
Investment Transactions
Investment transactions are recorded on a trade date basis. Realized gains and losses from transactions are determined on the specific identification method, which is the same basis used for federal income tax purposes. Investments purchased on a when-issued/delayed delivery basis may have extended settlement periods. Any investments so purchased are subject to market fluctuation during this period. The Funds have instructed the custodian to segregate assets with a current value at least equal to the amount of the when-issued/delayed delivery purchase commitments. At April 30, 2011, Pennsylvania Investment Quality (NQP) and Pennsylvania Premium Income 2 (NPY) had outstanding when-issued/delayed delivery purchase commitments of $2,552,644 and $1,701,762, respectively. There were no such outstanding purchase commitments in any of the other Funds.
Investment Income
Interest income, which reflects the amortization of premiums and includes accretion of discounts for financial reporting purposes, is recorded on an accrual basis. Investment income also reflects paydown gains and losses, if any.
Income Taxes
Each Fund is a separate taxpayer for federal income tax purposes. Each Fund intends to distribute substantially all of its net investment income and net capital gains to shareholders and to otherwise comply with the requirements of Subchapter M of the Internal Revenue Code applicable to regulated investment companies. Therefore, no federal income tax provision is required. Furthermore, each Fund intends to satisfy conditions that will enable interest from municipal securities, which is exempt from regular federal and designated state income taxes, to retain such tax-exempt status when distributed to shareholders of the Funds. Net realized capital gains and ordinary income distributions paid by the Funds are subject to federal taxation.
For all open tax years and all major taxing jurisdictions, management of the Funds has concluded that there are no significant uncertain tax positions that would require recognition in the financial statements. Open tax years are those that are open for examination by taxing authorities (i.e., generally the last four tax year ends and the interim tax period since then). Furthermore, management of the Funds is also not aware of any tax positions for which it is reasonably possible that the total amounts of unrecognized tax benefits will significantly change in the next twelve months.
Dividends and Distributions to Common Shareholders
Dividends from net investment income are declared monthly. Net realized capital gains and/or market discount from investment transactions, if any, are distributed to shareholders at least annually. Furthermore, capital gains are distributed only to the extent they exceed available capital loss carryforwards.
Distributions to Common shareholders of net investment income, net realized capital gains and/or market discount, if any, are recorded on the ex-dividend date. The amount and timing of distributions are determined in accordance with federal income tax regulations, which may differ from U.S. GAAP.
Auction Rate Preferred Shares
Each Fund except New Jersey Municipal Value (NJV) and Pennsylvania Municipal Value (NPN) is authorized to issue Auction Rate Preferred Shares (“ARPS”). During the fiscal year ended April 30, 2011, the Funds had outstanding ARPS, $25,000 stated value per share, which approximates market value, as a means of effecting financial leverage. Each Fund’s ARPS was issued in one or more Series. The dividend rate paid by the Funds on each Series was determined every seven days, pursuant to a dutch auction process overseen by the auction agent, and was payable at the end of each rate period.
Beginning in February 2008, more shares for sale were submitted in the regularly scheduled auctions for the ARPS issued by the Funds than there were offers to buy. This meant that these auctions “failed to clear,’’ and that many ARPS shareholders who wanted to sell their shares in these auctions were unable to do so. ARPS shareholders unable to sell their shares received distributions at the “maximum rate’’ applicable to failed auctions as calculated in accordance with the pre-established terms of the ARPS. As of April 30, 2011, each Fund redeemed all of their outstanding ARPS, at liquidation value, as follows:
| | | | New Jersey | | | New Jersey | | | New Jersey | | | New Jersey | |
| | | | Investment | | | Premium | | | Dividend | | | Dividend | |
| | | | Quality | | | Income | | | Advantage | | Advantage 2 | |
| | | | (NQJ | ) | | (NNJ | ) | | (NXJ | ) | | (NUJ | ) |
| ARPS redeemed, at liquidation value | | $ | 162,000,000 | | $ | 91,600,000 | | $ | 48,000,000 | | $ | 34,500,000 | |
| | | Notes to |
| | | Financial Statements (continued) |
| | | | | | | | | | | | | | |
| | | Pennsylvania | | Pennsylvania | | Pennsylvania | | Pennsylvania | |
| | | | Investment | | | Premium | | | Dividend | | | Dividend | |
| | | Quality | | Income 2 | | Advantage | | Advantage 2 | |
| | | | (NQP | ) | | (NPY | ) | | (NXM | ) | | (NVY | ) |
| ARPS redeemed, at liquidation value | | $ | 132,000,000 | | $ | 118,100,000 | | $ | 25,000,000 | | $ | 28,500,000 | |
During the fiscal year ended April 30, 2011, lawsuits pursuing claims made in a demand letter alleging that New Jersey Dividend Advantage’s (NXJ) Board of Trustees breached their fiduciary duties related to the redemption at par of its ARPS had been filed on behalf of shareholders of New Jersey Dividend Advantage (NXJ), against the Adviser, the Nuveen holding company, the majority owner of the holding company, the lone interested trustee, and current and former officers of New Jersey Dividend Advantage (NXJ). Nuveen and the other named defendants believe these lawsuits to be without merit, and all named parties intend to defend themselves vigorously. New Jersey Dividend Advantage (NXJ) believes that these lawsuits will not have a material effect on it or on the Adviser’s ability to serve as investment adviser to it.
MuniFund Term Preferred Shares
The following Funds have issued and outstanding MuniFund Term Preferred (“MTP”) Shares, with a $10 stated value per share. Proceeds from the issuance of MTP Shares, net of offering expenses, were used to redeem all, or a portion of, each Fund’s outstanding ARPS. Each Fund’s MTP Shares are issued in one Series. Dividends, which are recognized as interest expense for financial reporting purposes, will be paid monthly at a fixed annual rate, subject to adjustments in certain circumstances. The MTP Shares trade on the NYSE. As of April 30, 2011, the number of MTP Shares outstanding, annual interest rate and NYSE “ticker” symbol for each Fund are as follows:
| | | New Jersey Dividend Advantage (NXJ) | | New Jersey Dividend Advantage 2 (NUJ) | |
| | | | | | | Annual | | | | | | | | | Annual | | | | |
| | | | Shares | | | Interest | | | NYSE | | | Shares | | | Interest | | | NYSE | |
| | | Outstanding | | | Rate | | | Ticker | | Outstanding | | | Rate | | | Ticker | |
| Series: | | | | | | | | | | | | | | | | | | | |
| 2014 | | | 4,486,100 | | | 2.30 | % | | NXJ Pr A | | | — | | | — | | | — | |
| 2015 | | | — | | | — | | | — | | | 3,505,000 | | | 2.00 | % | | NUJ Pr C | |
| | | Pennsylvania Dividend Advantage (NXM) | | Pennsylvania Dividend Advantage 2 (NVY) | |
| | | | | | | Annual | | | | | | | | | Annual | | | | |
| | | | Shares | | | Interest | | | NYSE | | | Shares | | | Interest | | | NYSE | |
| | | Outstanding | | | Rate | | | Ticker | | Outstanding | | | Rate | | | Ticker | |
| Series: | | | | | | | | | | | | | | | | | | | |
| 2015 | | | 2,319,000 | | | 2.10 | % | | NXM Pr C | | | 2,455,000 | | | 2.15 | % | | NVY Pr C | |
Each Fund is obligated to redeem its MTP Shares by the date as specified in its offering document (“Term Redemption Date”), unless earlier redeemed or repurchased by the Fund. MTP Shares are subject to optional and mandatory redemption in certain circumstances. MTP Shares will be subject to redemption at the option of each Fund (“Optional Redemption Date”), subject to a payment of premium for one year following the Optional Redemption Date (“Premium Expiration Date”), and at par thereafter. MTP Shares also will be subject to redemption, at the option of each Fund, at par in the event of certain changes in the credit rating of the MTP Shares. Each Fund may be obligated to redeem certain of the MTP Shares if the Fund fails to maintain certain asset coverage and leverage ratio requirements and such failures are not cured by the applicable cure date. The redemption price per share is equal to the sum of the liquidation value per share plus any accumulated but unpaid dividends. The Term Redemption Date, Optional Redemption Date and Premium Expiration Date for each Fund’s MTP Shares are as follows:
| | | | New Jersey | | | New Jersey | | | Pennsylvania | | | Pennsylvania | |
| | | | Dividend | | | Dividend | | | Dividend | | | Dividend | |
| | | | Advantage | | | Advantage 2 | | | Advantage | | | Advantage 2 | |
| | | | (NXJ | ) | | (NUJ | ) | | (NXM | ) | | (NVY | ) |
| | | | Series 2014 | | | Series 2015 | | | Series 2015 | | | Series 2015 | |
| Term Redemption Date | | | April 1, 2014 | | | November 1, 2015 | | | November 1, 2015 | | | November 1, 2015 | |
| Optional Redemption Date | | | April 1, 2012 | | | November 1, 2011 | | | November 1, 2011 | | | November 1, 2011 | |
| Premium Expiration Date | | | March 31, 2013 | | | October 31, 2012 | | | October 31, 2012 | | | October 31, 2012 | |
The average liquidation value of MTP Shares outstanding for each Fund during the fiscal year ended April 30, 2011, was as follows:
| | | New Jersey Dividend Advantage | | | New Jersey Dividend Advantage 2 | | | Pennsylvania Dividend Advantage | | | Pennsylvania Dividend Advantage 2 | |
| | | (NXJ | )* | | (NUJ | )** | | (NXM | )*** | | (NVY | )**** |
| Average liquidation value of MTP Shares outstanding | | $ | 44,861,000 | | | $ | 34,950,943 | | | $ | 23,190,000 | | | $ | 24,431,370 | |
| * | For the period March 24, 2011 (issuance date of shares) through April 30, 2011. |
| ** | For the period October 1, 2010 (issuance date of shares) through April 30, 2011. |
| *** | For the period October 4, 2010 (issuance date of shares) through April 30, 2011. |
| **** | For the period October 27, 2010 (issuance date of shares) through April 30, 2011. |
For financial reporting purposes only, the liquidation value of MTP Shares is recorded as a liability on the Statement of Assets and Liabilities. Unpaid dividends on MTP Shares are recognized as a component of “Interest payable” on the Statement of Assets and Liabilities. Dividends paid on MTP Shares are recognized as a component of “Interest expense and amortization of offering costs” on the Statement of Operations.
Net amounts earned by Nuveen as the underwriter of New Jersey Dividend Advantage’s (NXJ) Share offering was recorded as a reduction of offering costs recognized by the Fund. During the fiscal year ended April 30, 2011, the amounts earned by Nuveen was as follows:
| | | New Jersey Dividend Advantage | |
| | | (NXJ | )* |
| Net amounts earned by Nuveen | | $ | 3,879 | |
* For the period March 24, 2011 (issuance date of shares) through April 30, 2011.
Variable Rate Demand Preferred Shares
The following Funds have issued and outstanding Variable Rate Demand Preferred (“VRDP”) Shares, with a $100,000 liquidation value per share. New Jersey Investment Quality (NQJ), New Jersey Premium Income (NNJ), Pennsylvania Investment Quality (NQP) and Pennsylvania Premium Income 2 (NPY) issued their VRDP Shares in a privately negotiated offering in August 2010. Proceeds from each Fund’s offering were used to redeem a portion of each Fund’s outstanding ARPS. The VRDP Shares were offered to institutional buyers pursuant to Rule 144A under the Securities Act of 1933. As of April 30, 2011, the number of VRDP Shares outstanding and maturity date for each Fund are as follows:
| | | New Jersey Investment Quality | | | New Jersey Premium Income | | | Pennsylvania Investment Quality | | | Pennsylvania Premium Income 2 | |
| | | (NQJ | ) | | (NNJ | ) | | (NQP | ) | | (NPY | ) |
| Series | | | 1 | | | | 1 | | | | 1 | | | | 1 | |
| Shares outstanding | | | 1,443 | | | | 886 | | | | 1,125 | | | | 1,000 | |
| Maturity | | August 1, 2040 | | | August 1, 2040 | | | August 1, 2040 | | | August 1, 2040 | |
VRDP Shares include a liquidity feature that allows VRDP shareholders to have their shares purchased by a liquidity provider with whom each Fund has contracted in the event that purchase orders for VRDP Shares in a remarketing are not sufficient in number to be matched with the sale orders in that remarketing. Each Fund is required to redeem any VRDP Shares that are still owned by the liquidity provider after six months of continuous, unsuccessful remarketing.
Dividends on the VRDP Shares (which are treated as interest payments for financial reporting purposes) are set weekly at a rate established by a remarketing agent; therefore, the market value of the VRDP Shares is expected to approximate its liquidation value. If remarketings for VRDP Shares are continuously unsuccessful for six months, the maximum rate is designed to escalate according to a specified schedule in order to enhance the remarketing agent’s ability to successfully remarket the VRDP Shares.
Subject to certain conditions, VRDP Shares may be redeemed, in whole or in part, at any time at the option of each Fund. Each Fund may also redeem certain of the VRDP Shares if the Fund fails to maintain certain asset coverage requirements and such failures are not cured by the applicable cure date. The redemption price per share is equal to the sum of the liquidation value per share plus any accumulated but unpaid dividends.
| | | Notes to |
| | | Financial Statements (continued) |
The average liquidation value outstanding and annualized dividend rate of VRDP Shares for each Fund during the fiscal year ended April 30, 2011, were as follows:
| | | New Jersey Investment Quality | | | New Jersey Premium Income | | | Pennsylvania Investment Quality | | | Pennsylvania Premium Income 2 | |
| | | (NQJ | )* | | (NNJ | )* | | (NQP | )* | | (NPY | )* |
| Average liquidation value outstanding | | | 144,300,000 | | | | 88,600,000 | | | | 112,500,000 | | | | 100,000,000 | |
| Annualized dividend rate | | | 0.52 | % | | | 0.52 | % | | | 0.52 | % | | | 0.52 | % |
* For the period August 12, 2010 (issuance date of shares) through April 30, 2011.
For financial reporting purposes only, the liquidation value of VRDP Shares is recognized as a liability on the Statement of Assets and Liabilities. Unpaid dividends on VRDP Shares are recognized as a component of “Interest payable” on the Statement of Assets and Liabilities. Dividends paid on the VRDP Shares are recognized as a component of “Interest expense and amortization of offering costs” on the Statement of Operations. In addition to interest expense, each Fund also pays a per annum liquidity fee to the liquidity provider, which is recognized as “Liquidity fees on VRDP shares” on the Statement of Operations.
Inverse Floating Rate Securities
Each Fund is authorized to invest in inverse floating rate securities. An inverse floating rate security is created by depositing a municipal bond, typically with a fixed interest rate, into a special purpose trust created by a broker-dealer. In turn, this trust (a) issues floating rate certificates, in face amounts equal to some fraction of the deposited bond’s par amount or market value, that typically pay short-term tax-exempt interest rates to third parties, and (b) issues to a long-term investor (such as one of the Funds) an inverse floating rate certificate (sometimes referred to as an “inverse floater”) that represents all remaining or residual interest in the trust. The income received by the inverse floater holder varies inversely with the short-term rate paid to the floating rate certificates’ holders, and in most circumstances the inverse floater holder bears substantially all of the underlying bond’s downside investment risk and also benefits disproportionately from any potential appreciation of the underlying bond’s value. The price of an inverse floating rate security will be more volatile than that of the underlying bond because the interest rate is dependent on not only the fixed coupon rate of the underlying bond but also on the short-term interest paid on the floating rate certificates, and because the inverse floating rate security essentially bears the risk of loss of the greater face value of the underlying bond.
A Fund may purchase an inverse floating rate security in a secondary market transaction without first owning the underlying bond (referred to as an “externally-deposited inverse floater”), or instead by first selling a fixed-rate bond to a broker-dealer for deposit into the special purpose trust and receiving in turn the residual interest in the trust (referred to as a “self-deposited inverse floater”). The inverse floater held by a Fund gives the Fund the right (a) to cause the holders of the floating rate certificates to tender their notes at par, and (b) to have the broker transfer the fixed-rate bond held by the trust to the Fund, thereby collapsing the trust. An investment in an externally-deposited inverse floater is identified in the Portfolio of Investments as “(IF) – Inverse floating rate investment.” An investment in a self-deposited inverse floater is accounted for as a financing transaction. In such instances, a fixed-rate bond deposited into a special purpose trust is identified in the Portfolio of Investments as “(UB) – Underlying bond of an inverse floating rate trust reflected as a financing transaction,” with the Fund accounting for the short-term floating rate certificates issued by the trust as “Floating rate obligations” on the Statement of Assets and Liabilities. In addition, the Fund reflects in “Investment Income” the entire earnings of the underlying bond and the related interest paid to the holders of the short-term floating rate certificates as a component of “Interest expense and amortization of offering costs” on the Statement of Operations.
During the fiscal year ended April 30, 2011, each Fund invested in externally-deposited inverse floaters and/or self-deposited inverse floaters.
Each Fund may also enter into shortfall and forbearance agreements (sometimes referred to as a “recourse trust” or “credit recovery swap”) (such agreements referred to herein as “Recourse Trusts”) with a broker-dealer by which a Fund agrees to reimburse the broker-dealer, in certain circumstances, for the difference between the liquidation value of the fixed-rate bond held by the trust and the liquidation value of the floating rate certificates issued by the trust plus any shortfalls in interest cash flows. Under these agreements, a Fund’s potential exposure to losses related to or on inverse floaters may increase beyond the value of a Fund’s inverse floater investments as a Fund may potentially be liable to fulfill all amounts owed to holders of the floating rate certificates. At period end, any such shortfall is recognized as “Unrealized depreciation on Recourse Trusts” on the Statement of Assets and Liabilities.
At April 30, 2011, each Fund’s maximum exposure to externally-deposited Recourse Trusts was as follows:
| | | New Jersey Investment Quality | | | New Jersey Premium Income | | | New Jersey Dividend Advantage | | | New Jersey Dividend Advantage 2 | | | New Jersey Municipal Value | |
| | | (NQJ | ) | | (NNJ | ) | | (NXJ | ) | | (NUJ | ) | | (NJV | ) |
| Maximum exposure to Recourse Trusts | | $ | 6,385,000 | | | $ | 3,725,000 | | | $ | 2,010,000 | | | $ | 1,380,000 | | | $ | — | |
| | | Pennsylvania Investment Quality | | | Pennsylvania Premium Income 2 | | | Pennsylvania Dividend Advantage | | | Pennsylvania Dividend Advantage 2 | | | Pennsylvania Municipal Value | |
| | | (NQP | ) | | (NPY | ) | | (NXM | ) | | (NVY | ) | | (NPN | ) |
| Maximum exposure to Recourse Trusts | | $ | — | | | $ | — | | | $ | — | | | $ | — | | | $ | — | |
The average floating rate obligations outstanding and average annual interest rate and fees related to self-deposited inverse floaters during the fiscal year ended April 30, 2011, were as follows:
| | | New Jersey Municipal Value | | | Pennsylvania Investment Quality | | | Pennsylvania Premium Income 2 | | | Pennsylvania Dividend Advantage | | | Pennsylvania Dividend Advantage 2 | |
| | | (NJV | ) | | (NQP | ) | | (NPY | ) | | (NXM | ) | | (NVY | ) |
| Average floating rate obligations outstanding | | $ | 1,500,000 | | | $ | 26,778,315 | | | $ | 12,731,507 | | | $ | 1,169,055 | | | $ | 4,428,836 | |
| Average annual interest rate and fees | | | 0.89 | % | | | 0.56 | % | | | 0.82 | % | | | 0.89 | % | | | 0.89 | % |
Derivative Financial Instruments
Each Fund is authorized to invest in certain derivative instruments, including foreign currency forwards, futures, options and swap contracts. Although the Funds are authorized to invest in such financial instruments, and may do so in the future, they did not make any such investments during the fiscal year ended April 30, 2011.
Market and Counterparty Credit Risk
In the normal course of business each Fund may invest in financial instruments and enter into financial transactions where risk of potential loss exists due to changes in the market (market risk) or failure of the other party to the transaction to perform (counterparty credit risk). The potential loss could exceed the value of the financial assets recorded on the financial statements. Financial assets, which potentially expose each Fund to counterparty credit risk, consist principally of cash due from counterparties on forward, option and swap transactions, when applicable. The extent of each Fund’s exposure to counterparty credit risk in respect to these financial assets approximates their carrying value as recorded on the Statement of Assets and Liabilities. Futures contracts, when applicable, expose a Fund to minimal counterparty credit risk as they are exchange traded and the exchange’s clearinghouse, which is counterparty to all exchange traded futures, guarantees the futures contracts against default.
Each Fund helps manage counterparty credit risk by entering into agreements only with counterparties the Adviser believes have the financial resources to honor their obligations and by having the Adviser monitor the financial stability of the counterparties. Additionally, counterparties may be required to pledge collateral daily (based on the daily valuation of the financial asset) on behalf of each Fund with a value approximately equal to the amount of any unrealized gain above a pre-determined threshold. Reciprocally, when each Fund has an unrealized loss, the Funds have instructed the custodian to pledge assets of the Funds as collateral with a value approximately equal to the amount of the unrealized loss above a pre-determined threshold. Collateral pledges are monitored and subsequently adjusted if and when the valuations fluctuate, either up or down, by at least the predetermined threshold amount.
Zero Coupon Securities
Each Fund is authorized to invest in zero coupon securities. A zero coupon security does not pay a regular interest coupon to its holders during the life of the security. Tax-exempt income to the holder of the security comes from accretion of the difference between the original purchase price of the security at issuance and the par value of the security at maturity and is effectively paid at maturity. The market prices of zero coupon securities generally are more volatile than the market prices of securities that pay interest periodically.
Organization and Offering Costs
Nuveen Investments, LLC, known as Nuveen Securities, LLC, effective April 30, 2010, has agreed to reimburse all organization expenses ($15,000 per Fund) and pay all offering costs (other than the sales load) that exceed $.03 per share for New Jersey Municipal Value (NJV) and Pennsylvania Municipal Value (NPN). New Jersey Municipal Value’s (NJV) and Pennsylvania Municipal Value’s (NPN) share of offering costs ($46,614 and $36,024, respectively) were recorded as reductions of the proceeds from the sale of shares.
Offering Costs
Costs incurred by New Jersey Dividend Advantage (NXJ), New Jersey Dividend Advantage 2 (NUJ), Pennsylvania Dividend Advantage (NXM) and Pennsylvania Dividend Advantage 2 (NVY) in connection with their offerings of MTP Shares ($935,763, $865,750, $682,850 and $703,250, respectively) were recorded as deferred charges, which will be amortized over the life of the shares. Costs incurred by New Jersey Investment Quality (NQJ), New Jersey Premium Income (NNJ), Pennsylvania Investment Quality (NQP) and Pennsylvania Premium Income 2 (NPY) in connection with their offerings of VRDP Shares ($795,750, $631,500, $701,250, and $665,000, respectively) were recorded as deferred charges which will be amortized over the life of the shares. Each Fund’s amortized deferred charges are recognized as a component of “Interest expense and amortization of offering costs” on the Statement of Operations.
| | | Notes to |
| | | Financial Statements (continued) |
Custodian Fee Credit
Each Fund has an arrangement with the custodian bank whereby certain custodian fees and expenses are reduced by net credits earned on each Fund’s cash on deposit with the bank. Such deposit arrangements are an alternative to overnight investments. Credits for cash balances may be offset by charges for any days on which a Fund overdraws its account at the custodian bank.
Indemnifications
Under the Funds’ organizational documents, their officers and directors/trustees are indemnified against certain liabilities arising out of the performance of their duties to the Funds. In addition, in the normal course of business, the Funds enter into contracts that provide general indemnifications to other parties. The Funds’ maximum exposure under these arrangements is unknown as this would involve future claims that may be made against the Funds that have not yet occurred. However, the Funds have not had prior claims or losses pursuant to these contracts and expect the risk of loss to be remote.
Use of Estimates
The preparation of financial statements in conformity with U.S. GAAP requires management to make estimates and assumptions that affect the reported amounts of assets and liabilities at the date of the financial statements and the reported amounts of increases and decreases in net assets applicable to Common shares from operations during the reporting period. Actual results may differ from those estimates.
2. Fair Value Measurements
Fair value is defined as the price that the Funds would receive upon selling an investment or transferring a liability in an orderly transaction to an independent buyer in the principal or most advantageous market of the investment. A three-tier hierarchy is used to maximize the use of observable market data and minimize the use of unobservable inputs and to establish classification of fair value measurements for disclosure purposes.
Observable inputs reflect the assumptions market participants would use in pricing the asset or liability. Observable inputs are based on market data obtained from sources independent of the reporting entity. Unobservable inputs reflect the reporting entity’s own assumptions about the assumptions market participants would use in pricing the asset or liability. Unobservable inputs are based on the best information available in the circumstances. The three-tier hierarchy of inputs is summarized in the three broad levels listed below:
Level 1 – Quoted prices in active markets for identical securities.
Level 2 – Other significant observable inputs (including quoted prices for similar securities, interest rates, prepayment speeds, credit risk, etc.).
Level 3 – Significant unobservable inputs (including management’s assumptions in determining the fair value of investments).
The inputs or methodologies used for valuing securities are not an indication of the risk associated with investing in those securities. The following is a summary of each Fund’s fair value measurements as of April 30, 2011:
| New Jersey Investment Quality (NQJ) | | | Level 1 | | | Level 2 | | | Level 3 | | | Total | |
| Investments: | | | | | | | | | | | | | |
| Municipal Bonds | | $ | — | | $ | 410,067,184 | | $ | — | | $ | 410,067,184 | |
| | | | | | | | | | | | | | |
| New Jersey Premium Income (NNJ) | | | Level 1 | | | Level 2 | | | Level 3 | | | Total | |
| Investments: | | | | | | | | | | | | | |
| Municipal Bonds | | $ | — | | $ | 253,504,215 | | $ | — | | $ | 253,504,215 | |
| | | | | | | | | | | | | | |
| New Jersey Dividend Advantage (NXJ) | | | Level 1 | | | Level 2 | | | Level 3 | | | Total | |
| Investments: | | | | | | | | | | | | | |
| Municipal Bonds | | $ | — | | $ | 131,066,009 | | $ | — | | $ | 131,066,009 | |
| | | | | | | | | | | | | | |
| New Jersey Dividend Advantage 2 (NUJ) | | | Level 1 | | | Level 2 | | | Level 3 | | | Total | |
| Investments: | | | | | | | | | | | | | |
| Municipal Bonds | | $ | — | | $ | 94,476,145 | | $ | — | | $ | 94,476,145 | |
| | | | | | | | | | | | | | |
| New Jersey Municipal Value (NJV) | | | Level 1 | | | Level 2 | | | Level 3 | | | Total | |
| Investments: | | | | | | | | | | | | | |
| Municipal Bonds | | $ | — | | $ | 24,071,540 | | $ | — | | $ | 24,071,540 | |
| | | | | | | | | | | | | | |
| Pennsylvania Investment Quality (NQP) | | | Level 1 | | | Level 2 | | | Level 3 | | | Total | |
| Investments: | | | | | | | | | | | | | |
| Municipal Bonds | | $ | — | | $ | 356,951,589 | | $ | — | | $ | 356,951,589 | |
| | | | | | | | | | | | | | |
| Pennsylvania Premium Income 2 (NPY) | | | Level 1 | | | Level 2 | | | Level 3 | | | Total | |
| Investments: | | | | | | | | | | | | | |
| Municipal Bonds | | $ | — | | $ | 309,637,875 | | $ | — | | $ | 309,637,875 | |
| Pennsylvania Dividend Advantage (NXM) | | | Level 1 | | | Level 2 | | | Level 3 | | | Total | |
| Investments: | | | | | | | | | | | | | |
| Municipal Bonds | | $ | — | | $ | 69,346,373 | | $ | — | | $ | 69,346,373 | |
| | | | | | | | | | | | | | |
| Pennsylvania Dividend Advantage 2 (NVY) | | | Level 1 | | | Level 2 | | | Level 3 | | | Total | |
| Investments: | | | | | | | | | | | | | |
| Municipal Bonds | | $ | — | | $ | 79,933,207 | | $ | — | | $ | 79,933,207 | |
| | | | | | | | | | | | | | |
| Pennsylvania Municipal Value (NPN) | | | Level 1 | | | Level 2 | | | Level 3 | | | Total | |
| Investments: | | | | | | | | | | | | | |
| Municipal Bonds | | $ | — | | $ | 17,512,448 | | $ | — | | $ | 17,512,448 | |
During the fiscal year ended April 30, 2011, the Funds recognized no significant transfers to/from Level 1, Level 2 or Level 3.
3. Derivative Instruments and Hedging Activities
The Funds record derivative instruments at fair value, with changes in fair value recognized on the Statement of Operations, when applicable. Even though the Funds’ investments in derivatives may represent economic hedges, they are not considered to be hedge transactions for financial reporting purposes. The Funds did not invest in derivative instruments during the fiscal year ended April 30, 2011.
4. Fund Shares
Common Shares
Transactions in Common shares were as follows:
| | | New Jersey Investment Quality (NQJ) | | | New Jersey Premium Income (NNJ) | | | New Jersey Dividend Advantage (NXJ) | |
| | | Year Ended 4/30/11 | | | Year Ended 4/30/10 | | | Year Ended 4/30/11 | | | Year Ended 4/30/10 | | | Year Ended 4/30/11 | | | Year Ended 4/30/10 | |
| Common shares: | | | | | | | | | | | | | | | | | | |
| Issued to shareholders due to reinvestment of distributions | | | — | | | | — | | | | — | | | | — | | | | — | | | | — | |
| Repurchased and retired | | | — | | | | — | | | | — | | | | — | | | | — | | | | — | |
| Weighted average Common share: | | | | | | | | | | | | | | | | | | | | | | | | |
| Price per share repurchased and retired | | $ | — | | | $ | — | | | $ | — | | | $ | — | | | $ | — | | | $ | — | |
| Discount per share repurchased and retired | | | — | | | | — | | | | — | | | | — | | | | — | | | | — | |
| | | New Jersey Dividend Advantage 2 (NUJ) | | | New Jersey Municipal Value (NJV) | |
| | | Year Ended 4/30/11 | | | Year Ended 4/30/10 | | | Year Ended 4/30/11 | | | Year Ended 4/30/10 | |
| Common shares: | | | | | | | | | | | | |
| Sold* | | | — | | | | — | | | | — | | | | 98,787 | |
| Issued to shareholders due to reinvestment of distributions | | | 1,880 | | | | 1,112 | | | | — | | | | — | |
| Repurchased and retired | | | — | | | | — | | | | — | | | | — | |
| Weighted average Common share: | | | | | | | | | | | | | | | | |
| Price per share repurchased and retired | | $ | — | | | $ | — | | | $ | — | | | $ | — | |
| Discount per share repurchased and retired | | | — | | | | — | | | | — | | | | — | |
| | | Pennsylvania Investment Quality (NQP) | | | Pennsylvania Premium Income 2 (NPY) | | | Pennsylvania Dividend Advantage (NXM) | |
| | | Year Ended 4/30/11 | | | Year Ended 4/30/10 | | | Year Ended 4/30/11 | | | Year Ended 4/30/10 | | | Year Ended 4/30/11 | | | Year Ended 4/30/10 | |
| Common shares: | | | | | | | | | | | | | | | | | | |
| Issued to shareholders due to reinvestment of distributions | | | — | | | | — | | | | — | | | | — | | | | — | | | | — | |
| Repurchased and retired | | | — | | | | (53,200 | ) | | | — | | | | (23,300 | ) | | | — | | | | (8,600 | ) |
| Weighted average Common share: | | | | | | | | | | | | | | | | | | | | | | | | |
| Price per share repurchased and retired | | | — | | | $ | 12.78 | | | | — | | | $ | 12.25 | | | | — | | | $ | 12.77 | |
| Discount per share repurchased and retired | | | — | | | | 12.13 | % | | | — | | | | 11.67 | % | | | — | | | | 11.69 | % |
| | | Notes to |
| | | Financial Statements (continued) |
| | | Pennsylvania Dividend Advantage 2 (NVY) | | | Pennsylvania Municipal Value (NPN) | |
| | | Year Ended 4/30/11 | | | Year Ended 4/30/10 | | | Year Ended 4/30/11 | | | Year Ended 4/30/10 | |
| Common shares: | | | | | | | | | | | | |
| Sold* | | | — | | | | — | | | | — | | | | 100,800 | |
| Issued to shareholders due to reinvestment of distributions | | | 307 | | | | — | | | | 3,001 | | | | 8,551 | |
| Repurchased and retired | | | — | | | | — | | | | — | | | | — | |
| Weighted average Common share: | | | | | | | | | | | | | | | | |
| Price per share repurchased and retired | | $ | — | | | $ | — | | | $ | — | | | $ | — | |
| Discount per share repurchased and retired | | | — | | | | — | | | | — | | | | — | |
* New Jersey Municipal Value (NJV) and Pennsylvania Municipal Value (NPN) were the only Funds to sell Common shares during the fiscal year ended April 30, 2010.
Preferred Shares
New Jersey Municipal Value (NJV) and Pennsylvania Municipal Value (NPN) are not authorized to issue ARPS. Transactions in ARPS were as follows:
| | | New Jersey Investment Quality (NQJ) | | | New Jersey Premium Quality (NNJ) | |
| | | Year Ended 4/30/11 | | | Year Ended 4/30/10 | | | Year Ended 4/30/11 | | | Year Ended 4/30/10 | |
| | | Shares | | | Amount | | | Shares | | | Amount | | | Shares | | | Amount | | | Shares | | | Amount | |
| ARPS redeemed: | | | | | | | | | | | | | | | | | | | | | | | | |
| Series M | | | 2,834 | | | $ | 70,850,000 | | | | 126 | | | $ | 3,150,000 | | | | — | | | $ | — | | | | — | | | $ | — | |
| Series T | | | — | | | | — | | | | — | | | | — | | | | 599 | | | | 14,975,000 | | | | 25 | | | | 625,000 | |
| Series W | | | — | | | | — | | | | — | | | | — | | | | 1,381 | | | | 34,525,000 | | | | 59 | | | | 1,475,000 | |
| Series TH | | | 1,772 | | | | 44,300,000 | | | | 78 | | | | 1,950,000 | | | | 1,535 | | | | 38,375,000 | | | | 65 | | | | 1,625,000 | |
| Series F | | | 1,132 | | | | 28,300,000 | | | | 51 | | | | 1,275,000 | | | | — | | | | — | | | | — | | | | — | |
| Total | | | 5,738 | | | $ | 143,450,000 | | | | 255 | | | $ | 6,375,000 | | | | 3,515 | | | $ | 87,875,000 | | | | 149 | | | $ | 3,725,000 | |
| | | New Jersey Dividend Advantage (NXJ) | | | New Jersey Dividend Advantage 2 (NUJ) | |
| | | Year Ended 4/30/11 | | | Year Ended 4/30/10 | | | Year Ended 4/30/11 | | | Year Ended 4/30/10 | |
| | | Shares | | | Amount | | | Shares | | | Amount | | | Shares | | | Amount | | | Shares | | | Amount | |
| ARPS redeemed: | | | | | | | | | | | | | | | | | | | | | | | | |
| Series T | | | 1,757 | | | $ | 43,925,000 | | | | 124 | | | $ | 3,100,000 | | | | — | | | $ | — | | | | — | | | $ | — | |
| Series W | | | — | | | | — | | | | — | | | | — | | | | 1,249 | | | | 31,225,000 | | | | 55 | | | | 1,375,000 | |
| Total | | | 1,757 | | | $ | 43,925,000 | | | | 124 | | | $ | 3,100,000 | | | | 1,249 | | | $ | 31,225,000 | | | | 55 | | | $ | 1,375,000 | |
| | | Pennsylvania Investment Quality (NQP) | | | Pennsylvania Premium Income 2 (NPY) | |
| | | Year Ended 4/30/11 | | | Year Ended 4/30/10 | | | Year Ended 4/30/11 | | | Year Ended 4/30/10 | |
| | | Shares | | | Amount | | | Shares | | | Amount | | | Shares | | | Amount | | | Shares | | | Amount | |
| ARPS redeemed: | | | | | | | | | | | | | | | | | | | | | | | | | | | | | | | | |
| Series M | | | — | | | $ | — | | | | — | | | $ | — | | | | 710 | | | $ | 17,750,000 | | | | — | | | $ | — | |
| Series T | | | 744 | | | | 18,600,000 | | | | — | | | | — | | | | — | | | | — | | | | — | | | | — | |
| Series W | | | 2,033 | | | | 50,825,000 | | | | — | | | | — | | | | — | | | | — | | | | — | | | | — | |
| Series TH | | | 1,693 | | | | 42,325,000 | | | | — | | | | — | | | | 1,748 | | | | 43,700,000 | | | | — | | | | — | |
| Series F | | | — | | | | — | | | | — | | | | — | | | | 1,513 | | | | 37,825,000 | | | | — | | | | — | |
| Total | | | 4,470 | | | $ | 111,750,000 | | | | — | | | $ | — | | | | 3,971 | | | $ | 99,275,000 | | | | — | | | $ | — | |
| | | Pennsylvania Dividend Advantage (NXM) | | | Pennsylvania Dividend Advantage 2 (NVY) | |
| | | Year Ended 4/30/11 | | | Year Ended4/30/10 | | | Year Ended 4/30/11 | | | Year Ended 4/30/10 | |
| | | | Shares | | | Amount | | | | Shares | | | Amount | | | Shares | | | Amount | | | Shares | | | Amount | |
| ARPS redeemed: | | | | | | | | | | | | | | | | | | | | | | | | | | | | | | | | |
| Series M | | | — | | | $ | — | | | | — | | | $ | — | | | | 920 | | | $ | 23,000,000 | | | | — | | | $ | — | |
| Series T | | | 900 | | | | 22,500,000 | | | | — | | | | — | | | | — | | | | — | | | | — | | | | — | |
| Total | | | 900 | | | $ | 22,500,000 | | | | — | | | $ | — | | | | 920 | | | $ | 23,000,000 | | | | — | | | $ | — | |
Transactions in MTP Shares were as follows:
| | | New Jersey Dividend Advantage (NXJ) | | | New Jersey Dividend Advantage 2 (NUJ) | |
| | | Year Ended 4/30/11 | | | Year Ended 4/30/10 | | | Year Ended 4/30/11 | | | Year Ended 4/30/10 | |
| | | Shares | | | Amount | | | Shares | | | Amount | | | Shares | | | Amount | | | Shares | | | Amount | |
| MTP Shares issued: | | | | | | | | | | | | | | | | | | | | | | | | |
| Series 2014 | | | 4,486,100 | | | $ | 44,861,000 | | | | — | | | $ | — | | | | — | | | $ | — | | | | — | | | $ | — | |
| Series 2015 | | | — | | | | — | | | | — | | | | — | | | | 3,505,000 | | | | 35,050,000 | | | | — | | | | — | |
| Total | | | 4,486,100 | | | $ | 44,861,000 | | | | — | | | $ | — | | | | 3,505,000 | | | $ | 35,050,000 | | | | — | | | $ | — | |
| | | Pennsylvania Dividend Advantage (NXM) | | | Pennsylvania Dividend Advantage 2 (NVY) | |
| | | Year Ended 4/30/11 | | | Year Ended 4/30/10 | | | Year Ended 4/30/11 | | | Year Ended 4/30/10 | |
| | | | Shares | | | | Amount | | | | Shares | | | | Amount | | | | Shares | | | | Amount | | | | Shares | | | | Amount | |
| MTP Shares issued: | | | | | | | | | | | | | | | | | | | | | | | | | | | | | | | | |
| Series 2015 | | | 2,319,000 | | | $ | 23,190,000 | | | | — | | | $ | — | | | | 2,455,000 | | | $ | 24,550,000 | | | | — | | | $ | — | |
Transactions in VRDP Shares were as follows:
| | | New Jersey Investment Quality (NQJ) | | | New Jersey Premium Quality (NNJ) | |
| | | Year Ended 4/30/11 | | | Year Ended 4/30/10 | | | Year Ended 4/30/11 | | | Year Ended 4/30/10 | |
| | | | Shares | | | | Amount | | | | Shares | | | | Amount | | | | Shares | | | | Amount | | | | Shares | | | | Amount | |
| VRDP Shares issued: | | | | | | | | | | | | | | | | | | | | | | | | | | | | | | | | |
| Series 1 | | | 1,443 | | | $ | 144,300,000 | | | | — | | | $ | — | | | | 886 | | | $ | 88,600,000 | | | | — | | | $ | — | |
| | | Pennsylvania Investment Quality (NQP) | | | Pennsylvania Premium Income 2 (NPY) | |
| | | Year Ended 4/30/11 | | | Year Ended 4/30/10 | | | Year Ended 4/30/11 | | | Year Ended 4/30/10 | |
| | | Shares | | | Amount | | | Shares | | | Amount | | | Shares | | | Amount | | | Shares | | | Amount | |
| VRDP Shares issued: | | | | | | | | | | | | | | | | | | | | | | | | |
| Series 1 | | | 1,125 | | | $ | 112,500,000 | | | | — | | | $ | — | | | | 1,000 | | | $ | 100,000,000 | | | | — | | | $ | — | |
5. Investment Transactions
Purchases and sales (including maturities but excluding short-term investments, where applicable) during the fiscal year ended April 30, 2011, were as follows:
| | | New Jersey Investment
Quality | | | New Jersey Premium
Income | | | New Jersey Dividend
Advantage | | | New Jersey Dividend Advantage 2 | | | New Jersey Municipal
Value | |
| | | (NQJ | ) | | (NNJ | ) | | (NXJ | ) | | (NUJ | ) | | (NJV | ) |
| Purchases | | $ | 38,962,722 | | | $ | 17,018,857 | | | $ | 8,143,562 | | | $ | 9,205,876 | | | $ | 546,589 | |
| Sales and maturities | | | 45,958,758 | | | | 19,012,957 | | | | 7,981,182 | | | | 6,476,725 | | | | 592,003 | |
| | | | | | | | | | | | | | | | |
| | | Pennsylvania Investment
Quality | | | Pennsylvania Premium
Income 2 | | | Pennsylvania Dividend
Advantage | | | Pennsylvania Dividend Advantage 2 | | | Pennsylvania Municipal
Value | |
| | | (NQP | ) | | (NPY | ) | | (NXM | ) | | (NVY | ) | | (NPN | ) |
| Purchases | | $ | 27,705,509 | | | $ | 25,104,287 | | | $ | 7,859,653 | | | $ | 5,870,237 | | | $ | 1,063,077 | |
| Sales and maturities | | | 34,392,230 | | | | 29,229,757 | | | | 5,664,262 | | | | 5,336,741 | | | | 590,000 | |
6. Income Tax Information
The following information is presented on an income tax basis. Differences between amounts for financial statement and federal income tax purposes are primarily due to timing differences in recognizing taxable market discount, timing differences in recognizing certain gains and losses on investment transactions and the treatment of investments in inverse floating rate securities reflected as financing transactions, if any. To the extent that differences
| | | Notes to |
| | | Financial Statements (continued) |
arise that are permanent in nature, such amounts are reclassified within the capital accounts as detailed below. Temporary differences do not require reclassification. Temporary and permanent differences do not impact the net asset values of the Funds.
At April 30, 2011, the cost and unrealized appreciation (depreciation) of investments, as determined on a federal income tax basis, were as follows:
| | | New Jersey Investment
Quality | | | New Jersey Premium
Income | | | New Jersey Dividend
Advantage | | | New Jersey Dividend
Advantage 2 | | | New Jersey Municipal
Value | |
| | | (NQJ | ) | | (NNJ | ) | | (NXJ | ) | | (NUJ | ) | | (NJV | ) |
| Cost of investments | | $ | 421,553,532 | | | $ | 256,134,943 | | | $ | 135,969,877 | | | $ | 97,682,929 | | | $ | 21,876,578 | |
| Gross unrealized: | | | | | | | | | | | | | | | | | | | | |
| Appreciation | | $ | 8,466,224 | | | $ | 7,476,075 | | | $ | 2,175,837 | | | $ | 1,662,180 | | | $ | 1,070,821 | |
| Depreciation | | | (19,952,572 | ) | | | (10,106,803 | ) | | | (7,079,705 | ) | | | (4,868,964 | ) | | | (375,879 | ) |
| Net unrealized appreciation (depreciation) of investments | | $ | (11,486,348 | ) | | $ | (2,630,728 | ) | | $ | (4,903,868 | ) | | $ | (3,206,784 | ) | | $ | 694,942 | |
| | | Pennsylvania Investment
Quality | | | Pennsylvania Premium
Income 2 | | | Pennsylvania Dividend
Advantage | | | Pennsylvania Dividend
Advantage 2 | | | Pennsylvania Municipal
Value | |
| | | (NQP | ) | | (NPY | ) | | (NXM | ) | | (NVY | ) | | (NPN | ) |
| Cost of investments | | $ | 333,135,779 | | | $ | 300,321,463 | | | $ | 69,699,714 | | | $ | 76,775,323 | | | $ | 16,868,863 | |
| Gross unrealized: | | | | | | | | | | | | | | | | | | | | |
| Appreciation | | $ | 8,950,403 | | | $ | 10,871,048 | | | $ | 1,634,791 | | | $ | 2,076,257 | | | $ | 772,118 | |
| Depreciation | | | (11,849,334 | ) | | | (13,939,604 | ) | | | (3,058,236 | ) | | | (3,288,722 | ) | | | (128,533 | ) |
| Net unrealized appreciation (depreciation) of investments | | $ | (2,898,931 | ) | | $ | (3,068,556 | ) | | $ | (1,423,445 | ) | | $ | (1,212,465 | ) | | $ | 643,585 | |
Permanent differences, primarily due to federal taxes paid, taxable market discount, nondeductible offering costs and distribution character reclassifications, resulted in reclassifications among the Funds’ components of Common share net assets at April 30, 2011, the Funds’ tax year end, as follows:
| | | New Jersey Investment
Quality | | | New Jersey Premium
Income | | | New Jersey Dividend
Advantage | | | New Jersey Dividend
Advantage 2 | | | New Jersey Municipal
Value | |
| | | (NQJ | ) | | (NNJ | ) | | (NXJ | ) | | (NUJ | ) | | (NJV | ) |
| Paid-in-surplus | | $ | (18,552 | ) | | $ | (19,602 | ) | | $ | (28,139 | ) | | $ | (97,971 | ) | | $ | — | |
| Undistributed (Over-distribution of) net investment income | | | 18,627 | | | | 9,349 | | | | 19,230 | | | | 95,554 | | | | (275 | ) |
| Accumulated net realized gain (loss) | | | (75 | ) | | | 10,253 | | | | 8,909 | | | | 2,417 | | | | 275 | |
| | | Pennsylvania Investment
Quality | | | Pennsylvania Premium
Income 2 | | | Pennsylvania Dividend
Advantage | | | Pennsylvania Dividend
Advantage 2 | | | Pennsylvania Municipal
Value | |
| | | (NQP | ) | | (NPY | ) | | (NXM | ) | | (NVY | ) | | (NPN | ) |
| Paid-in-surplus | | $ | (16,781 | ) | | $ | (15,745 | ) | | $ | (74,796 | ) | | $ | (72,675 | ) | | $ | 11,072 | |
| Undistributed (Over-distribution of) net investment income | | | (11,798 | ) | | | (2,653 | ) | | | 57,863 | | | | 61,002 | | | | — | |
| Accumulated net realized gain (loss) | | | 28,579 | | | | 18,398 | | | | 16,933 | | | | 11,673 | | | | (11,072 | ) |
The tax components of undistributed net tax-exempt income, net ordinary income and net long-term capital gains at April 30, 2011, the Funds’ tax year end, were as follows:
| | | New Jersey Investment
Quality | | | New Jersey Premium
Income | | | New Jersey Dividend
Advantage | | | New Jersey Dividend
Advantage 2 | | | New Jersey Municipal
Value | |
| | | (NQJ | ) | | (NNJ | ) | | (NXJ | ) | | (NUJ | ) | | (NJV | ) |
| Undistributed net tax-exempt income * | | $ | 5,455,189 | | | $ | 3,408,483 | | | $ | 1,944,334 | | | $ | 1,262,486 | | | $ | 111,689 | |
| Undistributed net ordinary income ** | | | 20,137 | | | | 9,799 | | | | 1,554 | | | | — | | | | — | |
| Undistributed net long-term capital gains | | | 6,774 | | | | 134,071 | | | | 36,841 | | | | 45,407 | | | | — | |
| | | Pennsylvania Investment
Quality | | | Pennsylvania Premium
Income 2 | | | Pennsylvania Dividend
Advantage | | | Pennsylvania Dividend
Advantage 2 | | | Pennsylvania Municipal
Value | |
| | | (NQP | ) | | (NPY | ) | | (NXM | ) | | (NVY | ) | | (NPN | ) |
| Undistributed net tax-exempt income* | | $ | 4,587,625 | | | $ | 4,116,260 | | | $ | 893,144 | | | $ | 1,066,413 | | | $ | 18,981 | |
| Undistributed net ordinary income** | | | 11,891 | | | | 10,771 | | | | 203 | | | | 177 | | | | — | |
| Undistributed net long-term capital gains | | | — | | | | — | | | | 187,034 | | | | 146,187 | | | | — | |
| * | Undistributed net tax-exempt income (on a tax basis) has not been reduced for the dividend declared on April 1, 2011, paid on May 2, 2011. |
| ** | Net ordinary income consists of taxable market discount income and net short-term capital gains, if any. |
The tax character of distributions paid during the Funds’ tax year ended April 30, 2011 and April 30, 2010, was designated for purposes of the dividends paid deduction as follows:
| 2011 | | New Jersey Investment
Quality | | | New Jersey Premium
Income | | | New Jersey Dividend
Advantage | | | New Jersey Dividend
Advantage 2 | | | New Jersey Municipal
Value | |
| | | (NQJ | ) | | (NNJ | ) | | (NXJ | ) | | (NUJ | ) | | (NJV | ) |
| Distributions from net tax-exempt income*** | | $ | 17,567,230 | | | $ | 10,298,550 | | | $ | 5,612,161 | | | $ | 4,263,861 | | | $ | 1,198,707 | |
| Distributions from net ordinary income** | | | — | | | | — | | | | — | | | | 3 | | | | 38,372 | |
| Distributions from net long-term capital gains**** | | | 550,205 | | | | 140,828 | | | | 159,911 | | | | 172,338 | | | | — | |
| 2011 | | Pennsylvania Investment
Quality | | | Pennsylvania Premium
Income 2 | | | Pennsylvania Dividend
Advantage | | | Pennsylvania Dividend
Advantage 2 | | | Pennsylvania Municipal
Value | |
| | | (NQP | ) | | (NPY | ) | | (NXM | ) | | (NVY | ) | | (NPN | ) |
| Distributions from net tax-exempt income*** | | $ | 15,015,026 | | | $ | 13,591,982 | | | $ | 3,166,778 | | | $ | 3,606,690 | | | $ | 933,419 | |
| Distributions from net ordinary income** | | | — | | | | — | | | | — | | | | — | | | | — | |
| Distributions from net long-term capital gains**** | | | — | | | | — | | | | 161,463 | | | | 179,017 | | | | — | |
| ** | Net ordinary income consists of taxable market discount income and net short-term capital gains, if any. |
| *** | The Funds hereby designate these amounts paid during the fiscal year ended April 30, 2011, as Exempt Interest Dividends |
| **** | The Funds designate as a long-term capital gain dividend, pursuant to the Internal Revenue Code Section 852(b)(3), the amount necessary to reduce earnings and profits of the Funds related to net capital gain to zero for the tax year ended April 30, 2011. |
| 2010 | | New Jersey Investment
Quality | | | New Jersey Premium
Income | | | New Jersey Dividend
Advantage | | | New Jersey Dividend
Advantage 2 | | | New Jersey Municipal
Value | |
| | | (NQJ | ) | | (NNJ | ) | | (NXJ | ) | | (NUJ | ) | | (NJV | ) |
| Distributions from net tax-exempt income | | $ | 15,878,706 | | | $ | 9,091,092 | | | $ | 5,024,573 | | | $ | 3,617,577 | | | $ | 992,582 | |
| Distributions from net ordinary income** | | | — | | | | 125,223 | | | | — | | | | — | | | | — | |
| Distributions from net long-term capital gains | | | — | | | | 131,170 | | | | 59,268 | | | | 144,777 | | | | — | |
| 2010 | | Pennsylvania Investment
Quality | | | Pennsylvania Premium
Income 2 | | | Pennsylvania Dividend
Advantage | | | Pennsylvania Dividend
Advantage 2 | | | Pennsylvania Municipal
Value | |
| | | (NQP | ) | | (NPY | ) | | (NXM | ) | | (NVY | ) | | (NPN | ) |
| Distributions from net tax-exempt income | | $ | 13,124,743 | | | $ | 12,185,755 | | | $ | 2,677,713 | | | $ | 3,074,243 | | | $ | 781,221 | |
| Distributions from net ordinary income** | | | 8 | | | | 112,103 | | | | — | | | | 32,001 | | | | — | |
| Distributions from net long-term capital gains | | | — | | | | — | | | | 152,888 | | | | 256,641 | | | | — | |
** Net ordinary income consists of taxable market discount income and net short-term capital gains, if any.
| | | Notes to |
| | | Financial Statements (continued) |
At April 30, 2011, the Funds’ tax year end, the following Funds had unused capital loss carryforwards available for federal income tax purposes to be applied against future capital gains, if any. If not applied, the carryforwards will expire as follows:
| | | New Jersey Municipal
Value | | | Pennsylvania Investment
Quality | | | Pennsylvania Premium
Income 2 | | | Pennsylvania Municipal
Value | |
| | | (NJV | ) | | (NQP | ) | | (NPY | ) | | (NPN | ) |
| Expiration: | | | | | | | | | | | | |
| April 30, 2016 | | $ | — | | | $ | — | | | $ | 77,818 | | | $ | — | |
| April 30, 2017 | | | — | | | | 1,637,403 | | | | 2,893,165 | | | | — | |
| April 30, 2019 | | | 18,711 | | | | — | | | | — | | | | 82 | |
| Total | | $ | 18,711 | | | $ | 1,637,403 | | | $ | 2,970,983 | | | $ | 82 | |
During the Funds’ tax year ended April 30, 2011, Pennsylvania Investment Quality (NQP) and Pennsylvania Premium Income 2 (NPY) utilized $774,109 and $94,420, respectively, of their capital loss carryforwards.
The Funds have elected to defer net realized losses from investments incurred from November 1, 2010 through April 30, 2011, the Funds’ tax year end, (“post-October losses”) in accordance with federal income tax regulations. Post-October losses are treated as having arisen on the first day of the following fiscal year. The following Funds have elected to defer post-October losses as follows:
| | | New Jersey Investment
Quality | | | New Jersey Premium
Income | | | New Jersey Dividend
Advantage | | | New Jersey Dividend
Advantage 2 | | | New Jersey Municipal
Value | | | Pennsylvania Dividend
Advantage 2 | |
| | | (NQJ | ) | | (NNJ | ) | | (NXJ | ) | | (NUJ | ) | | (NJV | ) | | (NVY | ) |
| Post-October capital losses | | $ | 1,509,839 | | | $ | 860,559 | | | $ | 485,839 | | | $ | 341,487 | | | $ | 8,950 | | | $ | 3,964 | |
7. Management Fees and Other Transactions with Affiliates
Each Fund’s management fee consists of two components — a fund-level fee, based only on the amount of assets within the Fund, and a complex-level fee, based on the aggregate amount of all fund assets managed by the Adviser. This pricing structure enables Fund shareholders to benefit from growth in the assets within their respective Fund as well as from growth in the amount of complex-wide assets managed by the Adviser.
The annual fund-level fee for each Fund, payable monthly, is calculated according to the following schedules:
| | New Jersey Investment Quality (NQJ) New Jersey Premium Income (NNJ) Pennsylvania Investment Quality (NQP) Pennsylvania Premium Income 2 (NPY) |
| Average Daily Managed Assets* | Fund-Level Fee Rate |
| For the first $125 million | .4500 | % |
| For the next $125 million | .4375 | |
| For the next $250 million | .4250 | |
| For the next $500 million | .4125 | |
| For the next $1 billion | .4000 | |
| For the next $3 billion | .3875 | |
| For managed assets over $5 billion | .3750 | |
| | New Jersey Dividend Advantage (NXJ) New Jersey Dividend Advantage 2 (NUJ) Pennsylvania Dividend Advantage (NXM) Pennsylvania Dividend Advantage 2 (NVY) |
| Average Daily Managed Assets* | Fund-Level Fee Rate |
| For the first $125 million | .4500 | % |
| For the next $125 million | .4375 | |
| For the next $250 million | .4250 | |
| For the next $500 million | .4125 | |
| For the next $1 billion | .4000 | |
| For managed assets over $2 billion | .3750 | |
| | New Jersey Municipal Value (NJV) Pennsylvania Municipal Value (NPN) |
| Average Daily Managed Assets* | Fund-Level Fee Rate |
| For the first $125 million | .4000 | % |
| For the next $125 million | .3875 | |
| For the next $250 million | .3750 | |
| For the next $500 million | .3625 | |
| For the next $1 billion | .3500 | |
| For managed assets over $2 billion | .3375 | |
The annual complex-level fee for each Fund, payable monthly, is calculated according to the following schedule:
| Complex-Level Managed Asset Breakpoint Level* | Effective Rate at Breakpoint Level |
| $55 billion | .2000 | % |
| $56 billion | .1996 | |
| $57 billion | .1989 | |
| $60 billion | .1961 | |
| $63 billion | .1931 | |
| $66 billion | .1900 | |
| $71 billion | .1851 | |
| $76 billion | .1806 | |
| $80 billion | .1773 | |
| $91 billion | .1691 | |
| $125 billion | .1599 | |
| $200 billion | .1505 | |
| $250 billion | .1469 | |
| $300 billion | .1445 | |
| * | For the fund-level and complex-level fees, managed assets include closed-end fund assets managed by the Adviser that are attributable to financial leverage. For these purposes, financial leverage includes the funds’ use of preferred stock and borrowings and certain investments in the residual interest certificates (also called inverse floating rate securities) in tender option bond (TOB) trusts, including the portion of assets held by a TOB trust that has been effectively financed by the trust’s issuance of floating rate securities, subject to an agreement by the Adviser as to certain funds to limit the amount of such assets for determining managed assets in certain circumstances. The complex-level fee is calculated based upon the aggregate daily managed assets of all Nuveen funds that constitute “eligible assets.” Eligible assets do not include assets attributable to investments in other Nuveen funds and assets in excess of $2 billion added to the Nuveen Fund complex in connection with the Adviser’s assumption of the management of the former First American Funds effective January 1, 2011. As of April 30, 2011, the complex-level fee rate for these Funds was .1785%. |
The management fee compensates the Adviser for overall investment advisory and administrative services and general office facilities. The Adviser has entered into Sub-Advisory Agreements with the Sub-Adviser under which the Sub-Adviser manages the investment portfolios of the Funds. The Sub-Adviser is compensated for its services to the Funds from the management fees paid to the Adviser.
The Funds pay no compensation directly to those of its directors/trustees who are affiliated with the Adviser or to its officers, all of whom receive remuneration for their services to the Funds from the Adviser or its affiliates. The Board of Directors/Trustees has adopted a deferred compensation plan for independent directors/trustees that enables directors/trustees to elect to defer receipt of all or a portion of the annual compensation they are entitled to receive from certain Nuveen advised funds. Under the plan, deferred amounts are treated as though equal dollar amounts had been invested in shares of select Nuveen-advised funds.
For the first ten years of New Jersey Dividend Advantage’s (NXJ) and Pennsylvania Dividend Advantage’s (NXM) operations, the Adviser has agreed to reimburse the Funds, as a percentage of average daily managed assets for fees and expenses in the amounts and for the time periods set forth below:
| Year Ending | | Year Ending | |
| March 31, | | March 31, | |
| 2001* | .30% | 2007 | .25% |
| 2002 | .30 | 2008 | .20 |
| 2003 | .30 | 2009 | .15 |
| 2004 | .30 | 2010 | .10 |
| 2005 | .30 | 2011 | .05 |
| 2006 | .30 | | |
* From the commencement of operations.
The Adviser has not agreed to reimburse New Jersey Dividend Advantage (NXJ) and Pennsylvania Dividend Advantage (NXM) for any portion of their fees and expenses beyond March 31, 2011.
| | | Notes to |
| | | Financial Statements (continued) |
For the first ten years of New Jersey Dividend Advantage 2’s (NUJ) and Pennsylvania Dividend Advantage 2’s (NVY) operations, the Adviser has agreed to reimburse the Funds, as a percentage of average daily managed assets for fees and expenses in the amounts and for the time periods set forth below:
| Year Ending | | Year Ending | |
| March 31, | | March 31, | |
| 2002* | .30% | 2008 | .25% |
| 2003 | .30 | 2009 | .20 |
| 2004 | .30 | 2010 | .15 |
| 2005 | .30 | 2011 | .10 |
| 2006 | .30 | 2012 | .05 |
| 2007 | .30 | | |
* From the commencement of operations.
The Adviser has not agreed to reimburse New Jersey Dividend Advantage 2 (NUJ) and Pennsylvania Dividend Advantage 2 (NVY) for any portion of their fees and expenses beyond March 31, 2012.
8. New Accounting Pronouncement
Fair Value Measurements and Disclosures
On May 12, 2011, the Financial Accounting Standards Board (“FASB”) issued an Accounting Standard Update (“ASU”) modifying Topic 820, Fair Value Measurements and Disclosures. At the same time, the International Accounting Standards Board (“IASB”) issued International Financial Reporting Standard (“IFRS”) 13, Fair Value Measurement. The objective by the FASB and IASB is convergence of their guidance on fair value measurements and disclosures. Specifically, the ASU requires reporting entities to disclose i) the amounts of any transfers between Level 1 and Level 2, and the reasons for the transfers, ii) for Level 3 fair value measurements, a) quantitative information about significant unobservable inputs used, b) a description of the valuation processes used by the reporting entity and c) a narrative description of the sensitivity of the fair value measurement to changes in unobservable inputs if a change in those inputs might result in a significantly higher or lower fair value measurement. The effective date of the ASU is for interim and annual periods beginning after December 15, 2011. At this time, management is evaluating the implications of this guidance and the impact it will have on the financial statement amounts and footnote disclosures, if any.
9. Subsequent Events
Regulatory Matters
Subsequent to the reporting period, Nuveen Securities, LLC (“Nuveen Securities”) entered into a settlement with the Financial Industry Regulatory Authority (“FINRA”) with respect to certain allegations regarding Nuveen-sponsored closed-end fund ARPS marketing brochures. As part of this settlement, Nuveen Securities neither admitted to nor denied FINRA’s allegations. Nuveen Securities is the broker-dealer subsidiary of Nuveen.
The settlement with FINRA concludes an investigation that followed the widespread failure of auctions for ARPS and other auction rate securities, which generally began in mid-February 2008. In the settlement, FINRA alleged that certain marketing materials provided by Nuveen Securities were false and misleading. Nuveen Securities agreed to a censure and the payment of a $3 million fine.
Board Members & Officers (Unaudited)
| | | The management of the Funds, including general supervision of the duties performed for the Funds by the Adviser, is the responsibility of the Board Members of the Funds. The number of board members of the Fund is currently set at ten. None of the board members who are not “interested” persons of the Funds (referred to herein as “independent board members”) has ever been a director or employee of, or consultant to, Nuveen or its affiliates. The names and business addresses of the board members and officers of the Funds, their principal occupations and other affiliations during the past five years, the number of portfolios each oversees and other directorships they hold are set forth below. |
| | Name, Birthdate & Address | | Position(s) Held with the Funds | | Year First Elected or Appointed and Term(1) | | Principal Occupation(s) Including other Directorships During Past 5 Years | | Number of Portfolios in Fund Complex Overseen by Board Member |
| | | | | | | | | | |
| Independent Board Members: | | | | | | | | |
| | | | | | | | | | |
| ■ | ROBERT P. BREMNER(2) | | | | | | Private Investor and Management Consultant; Treasurer and Director, Humanities Council of Washington, D.C.; Board Member, Independent Directors Council affiliated with the Investment Company Institute | | |
| | 8/22/40 333 W. Wacker Drive Chicago, IL 60606 | | Chairman of the Board and Board Member | | 1996 | | | 245 |
| | | | | | | | | | |
| ■ | JACK B. EVANS | | | | | | President, The Hall-Perrine Foundation, a private philanthropic corporation (since 1996); Director and Chairman, United Fire Group, a publicly held company; President Pro Tem of the Board of Regents for the State of Iowa University System; Director, Source Media Group; Life Trustee of Coe College and the Iowa College Foundation; formerly, Director, Alliant Energy; formerly, Director, Federal Reserve Bank of Chicago; formerly, President and Chief Operating Officer, SCI Financial Group, Inc., a regional financial services firm. | | |
| | 10/22/48 333 W. Wacker Drive Chicago, IL 60606 | | Board Member | | 1999 | | | 245 |
| | | | | | | | | |
| | | | | | | | | |
| | | | | | | | | |
| | | | | | | | | |
| | | | | | | | | | |
| ■ | WILLIAM C. HUNTER | | | | | | Dean, Tippie College of Business, University of Iowa (since 2006); Director (since 2004) of Xerox Corporation; Director (since 2005), Beta Gamma Sigma International Honor Society; Director of Wellmark, Inc. (since 2009); formerly, Dean and Distinguished Professor of Finance, School of Business at the University of Connecticut (2003-2006); previously, Senior Vice President and Director of Research at the Federal Reserve Bank of Chicago (1995-2003); formerly, Director (1997-2007), Credit Research Center at Georgetown University. | | |
| | 3/6/48 333 W. Wacker Drive Chicago, IL 60606 | | Board Member | | 2004 | | | 245 |
| | | | | | | | | |
| | | | | | | | | |
| | | | | | | | | |
| | | | | | | | | |
| | | | | | | | | | |
| ■ | DAVID J. KUNDERT(2) | | | | | | Director, Northwestern Mutual Wealth Management Company; retired (since 2004) as Chairman, JPMorgan Fleming Asset Management, President and CEO, Banc One Investment Advisors Corporation, and President, One Group Mutual Funds; prior thereto, Executive Vice President, Banc One Corporation and Chairman and CEO, Banc One Investment Management Group; Member, Board of Regents, Luther College; member of the Wisconsin Bar Association; member of Board of Directors, Friends of Boerner Botanical Gardens; member of Board of Directors and Chair of Investment Committee, Greater Milwaukee Foundation. | | |
| | 10/28/42 333 W. Wacker Drive Chicago, IL 60606 | | Board Member | | 2005 | | | 245 |
| | | | | | | | | |
| | | | | | | | | |
| | | | | | | | | |
| | | | | | | | | |
| | | | | | | | | |
| | | | | | | | | |
| | | | | | | | | | |
| ■ | WILLIAM J. SCHNEIDER(2) | | | | | | Chairman of Miller-Valentine Partners Ltd., a real estate investment company; formerly, Senior Partner and Chief Operating Officer (retired 2004) of Miller-Valentine Group; member, University of Dayton Business School Advisory Council;member, Mid-America Health System Board; formerly, member and chair, Dayton Philharmonic Orchestra Association; formerly, member, Business Advisory Council, Cleveland Federal Reserve Bank. | | |
| | 9/24/44333 W. Wacker Drive Chicago, IL 60606 | | Board Member | | 1997 | | | 245 |
| | | | | | | | | |
| | | | | | | | | |
| | | | | | | | | |
Board Members & Officers (Unaudited) (continued)
| | Name, | | Position(s) Held | | Year First | | Principal | | Number |
| | Birthdate | | with the Funds | | Elected or | | Occupation(s) | | of Portfolios |
| | & Address | | | | Appointed | | Including other | | in Fund Complex |
| | | | | | and Term(1) | | Directorships | | Overseen by |
| | | | | | | | During Past 5 Years | | Board Member |
| | | | | | | | | | |
| | Independent Board Members: | | | | | | | | |
| | | | | | | | Executive Director, Gaylord and Dorothy Donnelley Foundation (since 1994); prior thereto, Executive Director, Great Lakes Protection Fund (1990-1994). | | |
| ■ | JUDITH M. STOCKDALE | | | | | | |
| | 12/29/47 | | | | | | | |
| | 333 W. Wacker Drive | | Board Member | | 1997 | | | 245 |
| | Chicago, IL 60606 | | | | | | | | |
| | | | | | | | | | |
| ■ | CAROLE E. STONE(2) | | | | | | Director, Chicago Board Options Exchange (since 2006); Director, C2 Options Exchange, Incorporated (since 2009); formerly, Commissioner, New York State Commission on Public Authority Reform (2005-2010); formerly, Chair, New York Racing Association Oversight Board (2005-2007). | | |
| | 6/28/47 | | | | | | | |
| | 333 W. Wacker Drive | | Board Member | | 2007 | | | 245 |
| | Chicago, IL 60606 | | | | | | | |
| | | | | | | | | |
| | | | | | | | | | |
| ■ | VIRGINIA L. STRINGER | | | | | | Board Member, Mutual Fund Directors Forum; Member, Governing Board, Investment Company Institute’s Independent Directors Council; governance consultant and non-profit board member; former Owner and President, Strategic Management Resources, Inc. a management consulting firm; previously, held several executive positions in general management, marketing and human resources at IBM and The Pillsbury Company; Independent Director, First American Fund Complex (1987-2010) and Chair (1997-2010). | | |
| | 8/16/44 | | | | | | | |
| | 333 W. Wacker Drive | | Board Member | | 2011 | | | 245 |
| | Chicago, IL 60606 | | | | | | | |
| | | | | | | | | |
| | | | | | | | | |
| | | | | | | | | |
| | | | | | | | | |
| | | | | | | | | |
| | | | | | | | | | |
| ■ | TERENCE J. TOTH(2) | | | | | | Director, Legal & General Investment Management America, Inc. (since 2008); Managing Partner, Promus Capital (since 2008); formerly, CEO and President, Northern Trust Global Investments (2004-2007); Executive Vice President, Quantitative Management & Securities Lending (2000-2004); prior thereto, various positions with Northern Trust Company (since 1994); member: Goodman Theatre Board (since 2004), Chicago Fellowship Board (since 2005), and Catalyst Schools of Chicago Board (since 2008); formerly, member: Northern Trust Mutual Funds Board (2005-2007), Northern Trust Global Investments Board (2004-2007), Northern Trust Japan Board (2004-2007), Northern Trust Securities Inc. Board (2003-2007) and Northern Trust Hong Kong Board (1997-2004). | | |
| | 9/29/59 | | | | | | | |
| | 333 W. Wacker Drive | | Board Member | | 2008 | | | 245 |
| | Chicago, IL 60606 | | | | | | | |
| | | | | | | | | |
| | | | | | | | | |
| | | | | | | | | |
| | | | | | | | | |
| | | | | | | | | |
| | | | | | | | | |
| | | | | | | | | |
| | | | | | | | | |
| | | | | | | | | |
| | | | | | | | | | |
| Interested Board Member: | | | | | | | |
| | | | | | | | | | |
| ■ | JOHN P. AMBOIAN(3) | | | | | | Chief Executive Officer and Chairman (since 2007), and Director (since 1999) of Nuveen Investments, Inc., formerly, President (1999-2007); Chief Executive Officer (since 2007) of Nuveen Investments Advisors, Inc.; Director (since 1998) formerly, Chief Executive Officer (2007-2010) of Nuveen Fund Advisors, Inc. | | |
| | 6/14/61 | | | | | | | |
| | 333 W. Wacker Drive | | Board Member | | 2008 | | | 245 |
| | Chicago, IL 60606 | | | | | | | |
| | | | | | | | | |
| | | | | | | | | |
| | Name, Birthdate and Address | | Position(s) Held with the Funds | | Year First Elected or Appointed(4) | | Principal Occupation(s) During Past 5 Years | | Number of Portfolios in Fund Complex Overseen by Officer |
| | | | | | | | | | |
| Officers of the Funds: | | | | | | | | |
| | | | | | | | | |
| ■ | GIFFORD R. ZIMMERMAN | | | | | | Managing Director (since 2002), Assistant Secretary and Associate General Counsel of Nuveen Securities, LLC; Managing Director (since 2004) and Assistant Secretary (since 1994) of Nuveen Investments, Inc.; Managing Director (since 2002), Assistant Secretary (since 1997) and Co-General Counsel (since 2011) of Nuveen Fund Advisors, Inc.; Managing Director, Assistant Secretary and Associate General Counsel of Nuveen Asset Management, LLC (since 2011); Managing Director, Associate General Counsel and Assistant Secretary of Symphony Asset Management LLC (since 2003); Vice President and Assistant Secretary of NWQ Investment Management Company, LLC (since 2002), Nuveen Investments Advisers Inc. (since 2002), Tradewinds Global Investors LLC, and Santa Barbara Asset Management, LLC (since 2006), Nuveen HydePark Group LLC and Nuveen Investment Solutions, Inc. (since 2007) and of Winslow Capital Management Inc. (since 2010); Chief Administrative Officer and Chief Compliance Officer (since 2010) of Nuveen Commodities Asset Management, LLC; Chartered Financial Analyst. | | |
| | 9/9/56 333 W. Wacker Drive Chicago, IL 60606 | | Chief Administrative Officer | | 1988 | | | 245 |
| | | | | | | | | |
| | | | | | | | | |
| | | | | | | | | |
| | | | | | | | | |
| | | | | | | | | |
| | | | | | | | | |
| | | | | | | | | |
| | | | | | | | | |
| | | | | | | | | |
| | | | | | | | | |
| | | | | | | | | |
| | | | | | | | | |
| | | | | | | | | |
| | | | | | | | | |
| | | | | | | | | | |
| ■ | WILLIAM ADAMS IV | | | | | | Senior Executive Vice President, Global Structured Products (since 2010), formerly, Executive Vice President (1999-2010) of Nuveen Securities, LLC; Co-President of Nuveen Fund Advisors, Inc. (since 2011); Managing Director (since 2010) of Nuveen Commodities Asset Management, LLC. | | |
| | 6/9/55 333 W. Wacker Drive Chicago, IL 60606 | | Vice President | | 2007 | | | 133 |
| | | | | | | | | |
| | | | | | | | | | |
| ■ | CEDRIC H. ANTOSIEWICZ | | | | | | Managing Director of Nuveen Securities, LLC. | | |
| | 1/11/62 333 W. Wacker Drive Chicago, IL 60606 | | Vice President | | 2007 | | | | 133 |
| | | | | | | | | | |
| ■ | MARGO L. COOK | | | | | | Executive Vice President (since 2008) of Nuveen Investments, Inc. and of Nuveen Fund Advisors, Inc. (since 2011); previously, Head of Institutional Asset Management (2007-2008) of Bear Stearns Asset Management; Head of Institutional Asset Management (1986-2007) of Bank of NY Mellon; Chartered Financial Analyst. | | |
| | 4/11/64 333 W. Wacker Drive Chicago, IL 60606 | | Vice President | | 2009 | | | 245 |
| | | | | | | | | |
| | | | | | | | | |
| | | | | | | | | | |
| ■ | LORNA C. FERGUSON | | | | | | Managing Director (since 2004) of Nuveen Securities, LLC and Managing Director (since 2005) of Nuveen Fund Advisors, Inc. | | |
| | 10/24/45 333 W. Wacker Drive Chicago, IL 60606 | | Vice President | | 1998 | | | 245 |
| | | | | | | | | | |
| ■ | STEPHEN D. FOY | | | | | | | | |
| | 5/31/54 333 W. Wacker Drive Chicago, IL 60606 | | Vice President and Controller | | 1998 | | Senior Vice President (since 2010), formerly, Vice President (1993-2010) and Funds Controller (since 1998) of Nuveen Securities, LLC; Senior Vice President (since 2010), formerly, Vice President (2005-2010) of Nuveen Fund Advisors, Inc.; Certified Public Accountant. | | 245 |
| | | | | | | | | |
| | | | | | | | | |
Board Members & Officers (Unaudited) (continued)
| | Name, Birthdate and Address | | Position(s) Held with the Funds | | Year First Elected or Appointed(4) | | Principal Occupation(s) During Past 5 Years | | Number of Portfolios in Fund Complex Overseen by Officer |
| | | | | | | | | | |
| Officers of the Funds: | | | | | | | | |
| | | | | | | | | |
| ■ | SCOTT S. GRACE | | | | | | Managing Director, Corporate Finance & Development, Treasurer (since 2009) of Nuveen Securities, LLC; Managing Director and Treasurer (since 2009) of Nuveen Fund Advisors, Inc., Nuveen Investment Solutions, Inc., Nuveen Investments Advisers, Inc., Nuveen Investments Holdings Inc. and (since (2011) Nuveen Asset Management, LLC; Vice President and Treasurer of NWQ Investment Management Company, LLC, Tradewinds Global Investors, LLC, Symphony Asset Management LLC and Winslow Capital Management, Inc.; Vice President of Santa Barbara Asset Management, LLC; formerly, Treasurer (2006-2009), Senior Vice President (2008-2009), previously, Vice President (2006-2008) of Janus Capital Group, Inc.; formerly, Senior Associate in Morgan Stanley’s Global Financial Services Group (2000-2003); Chartered Accountant Designation. | | |
| | 8/20/70 333 W. Wacker Drive Chicago, IL 60606 | | Vice President and Treasurer | | 2009 | | | 245 |
| | | | | | | | | |
| | | | | | | | | |
| | | | | | | | | |
| | | | | | | | | |
| | | | | | | | | |
| | | | | | | | | |
| | | | | | | | | |
| | | | | | | | | |
| | | | | | | | | |
| | | | | | | | | | |
| ■ | WALTER M. KELLY | | | | | | Senior Vice President (since 2008), Vice President (2006-2008) of Nuveen Securities, LLC; Senior Vice President (since 2008) and Assistant Secretary (since 2008) of Nuveen Fund Advisors, Inc. | | |
| | 2/24/70 333 W. Wacker Drive Chicago, IL 60606 | | Chief Compliance Officer and Vice President | | 2003 | | | 245 |
| | | | | | | | | | |
| ■ | TINA M. LAZAR | | | | | | Senior Vice President (since 2009), formerly, Vice President of Nuveen Securities, LLC (1999-2009); Senior Vice President (since 2010), formerly, Vice President (2005-2010) of Nuveen Fund Advisors, Inc. | | |
| | 8/27/61 333 W. Wacker Drive Chicago, IL 60606 | | Vice President | | 2002 | | | 245 |
| | | | | | | | | | |
| ■ | LARRY W. MARTIN | | | | | | Senior Vice President (since 2010), formerly, Vice President (1993-2010), Assistant Secretary and Assistant General Counsel of Nuveen Securities, LLC; Senior Vice President (since 2011) of Nuveen Asset Management, LLC: Senior Vice President (since 2010), formerly, Vice President (2005-2010), and Assistant Secretary of Nuveen Investments, Inc.; Senior Vice President (since 2010), formerly Vice President (2005-2010), and Assistant Secretary (since 1997) of Nuveen Fund Advisors, Inc.; Vice President and Assistant Secretary of Nuveen Investments Advisers, Inc. (since 2002), NWQ Investment Management Company, LLC, Symphony Asset Management LLC (since 2003), Tradewinds Global Investors, LLC, Santa Barbara Asset Management, LLC (since 2006), Nuveen HydePark Group, LLC and Nuveen Investment Solutions, Inc. (since 2007), and of Winslow Capital Management, Inc. (since 2010); Vice President and Assistant Secretary of Nuveen Commodities Asset Management, LLC (since 2010). | | |
| | 7/27/51 333 W. Wacker Drive Chicago, IL 60606 | | Vice President and Assistant Secretary | | 1997 | | | 245 |
| | | | | | | | | |
| | | | | | | | | |
| | | | | | | | | |
| | | | | | | | | |
| | | | | | | | | |
| | | | | | | | | |
| | | | | | | | | |
| | | | | | | | | |
| | | | | | | | | |
| | | | | | | | | |
| | | | | | | | | |
| | | | | | | | | | |
| ■ | KEVIN J. MCCARTHY | | | | | | Managing Director (since 2008), formerly, Vice President (2007-2008), Nuveen Securities, LLC; Managing Director (since 2008), Assistant Secretary (since 2007) and Co-General Counsel (since 2011) of Nuveen Fund Advisors, Inc.; Managing Director, Assistant Secretary and Associate General Counsel (since 2011) of Nuveen Asset Management, LLC; Managing Director (since 2008), and Assistant Secretary, Nuveen Investment Holdings, Inc.; Vice President (since 2007) and Assistant Secretary of Nuveen Investments Advisers Inc., NWQ Investment Management Company, LLC, Tradewinds Global Investors LLC, NWQ Holdings, LLC, Symphony Asset Management LLC, Santa Barbara Asset Management, LLC, Nuveen HydePark Group, LLC, Nuveen Investment Solutions, Inc. (since 2007) and of Winslow Capital Management, Inc. (since 2010); Vice President and Secretary (since 2010) of Nuveen Commodities Asset Management, LLC; prior thereto, Partner, Bell, Boyd & Lloyd LLP (1997-2007). | | |
| | 3/26/66333 W. Wacker Drive Chicago, IL 60606 | | Vice President and Secretary | | 2007 | | | 245 |
| | | | | | | | | |
| | | | | | | | | |
| | | | | | | | | |
| | | | | | | | | |
| | | | | | | | | |
| | | | | | | | | |
| | | | | | | | | |
| | | | | | | | | |
| | | | | | | | | |
| | | | | | | | | |
| | | | | | | | | |
| | Name, Birthdate and Address | | Position(s) Held with the Funds | | Year First Elected or Appointed(4) | | Principal Occupation(s) During Past 5 Years | | Number of Portfolios in Fund Complex Overseen by Officer |
| | | | | | | | | | |
| Officers of the Funds: | | | | | | | | |
| | | | | | | | | | |
| ■ | KATHLEEN L. PRUDHOMME | | | | | | Managing Director, Assistant Secretary and Co-General Counsel (since 2011) of Nuveen Fund Advisors, Inc.; Managing Director, Assistant Secretary and Associate General Counsel (since 2011) of Nuveen Asset Management, LLC; Managing Director and Assistant Secretary (since 2011) of Nuveen Securities, LLC; formerly, Secretary of FASF (2004-2010); Deputy General Counsel, FAF Advisors, Inc. (2004-2010). | | |
| | 3/30/53 800 Nicollet Mall Minneapolis, MN 55402 | | Vice President and Assistant Secretary | | 2011 | | | 245 |
| | | | | | | | | |
| | | | | | | | | |
| (1) | For New Jersey Dividend Advantage (NXJ), New Jersey Dividend Advantage 2 (NUJ), New Jersey Municipal Value (NJV), Pennsylvania Investment Quality (NQP), Pennsylvania Premium Income 2 (NPY), Pennsylvania Dividend Advantage (NXM), Pennsylvania Dividend Advantage 2 (NVY), and Pennsylvania Municipal Value (NPN), The Board of Trustees are divided into three classes, Class I, Class II, and Class III, with each being elected to serve until the third succeeding annual shareholders’ meeting subsequent to its election or thereafter in each case when its respective successors are duly elected or appointed, except two Board Members are elected by the holders of Preferred Shares to serve until the next annual shareholders’ meeting subsequent to its election or thereafter in each case when its respective successors are duly elected or appointed. For New Jersey Investment Quality (NQJ) and New Jersey Premium Income (NNJ), the Board Members serve a one year term to serve until the next annual meeting or until their successors shall have been duly elected and qualified. The first year elected or appointed represents the year in which the Board Member was first elected or appointed to any fund in the Nuveen Complex. |
| (2) | Also serves as a trustee of the Nuveen Diversified Commodity Fund, an exchange-traded commodity pool managed by Nuveen Commodities Asset Management, LLC, an affiliate of the Adviser. |
| (3) | Mr. Amboian is an interested trustee because of his position with Nuveen Investments, Inc. and certain of its subsidiaries, which are affiliates of the Nuveen Funds. |
| (4) | Officers serve one year terms through August of each year. The year first elected or appointed represents the year in which the Officer was first elected or appointed to any fund in the Nuveen Complex. |
Annual Investment Management
Agreement Approval Process (Unaudited)
The Investment Company Act of 1940, as amended (the “1940 Act”), provides, in substance, that each investment advisory agreement between a fund and its investment adviser will continue in effect from year to year only if its continuance is approved at least annually by the fund’s board members, including by a vote of a majority of the board members who are not parties to the advisory agreement or “interested persons” of any parties (the “Independent Board Members”), cast in person at a meeting called for the purpose of considering such approval. In connection with such approvals, the fund’s board members must request and evaluate, and the investment adviser is required to furnish, such information as may be reasonably necessary to evaluate the terms of the advisory agreement. Accordingly, at a meeting held on May 25-26, 2010 (the “May Meeting”), the Boards of Trustees or Directors (as the case may be) (each, a “Board” and each Trustee or Director, a “Board Member”) of the Funds, including a majority of the Independent Board Members, considered and approved the continuation of the advisory agreements (each, an “Advisory Agreement”) between each Fund and Nuveen Asset Management (the “Adviser”) for an additional one-year period. In preparation for their considerations at the May Meeting, the Board also held a separate meeting on April 21-22, 2010 (the “April Meeting”). Accordingly, the factors considered and determinations made regarding the renewals by the Independent Board Members include those made at the April Meeting.
In addition, in evaluating the Advisory Agreements, the Independent Board Members reviewed a broad range of information relating to the Funds and the Adviser, including absolute and comparative performance, fee and expense information for the Funds (as described in more detail below), the profitability of Nuveen for its advisory activities (which includes its wholly owned subsidiaries), and other information regarding the organization, personnel, and services provided by the Adviser. The Independent Board Members also met quarterly as well as at other times as the need arose during the year and took into account the information provided at such meetings and the knowledge gained therefrom. Prior to approving the renewal of the Advisory Agreements, the Independent Board Members reviewed the foregoing information with their independent legal counsel and with management, reviewed materials from independent legal counsel describing applicable law and their duties in reviewing advisory contracts, and met with independent legal counsel in private sessions without management present. The Independent Board Members considered the legal advice provided by independent legal counsel and relied upon their knowledge of the Adviser, its services and the Funds resulting from their meetings and other interactions throughout the year and their own business judgment in determining the factors to be considered in evaluating the
Advisory Agreements. Each Board Member may have accorded different weight to the various factors in reaching his or her conclusions with respect to a Fund’s Advisory Agreement. The Independent Board Members did not identify any single factor as all-important or controlling. The Independent Board Members’ considerations were instead based on a comprehensive consideration of all the information presented. The principal factors considered by the Board and its conclusions are described below.
A. Nature, Extent and Quality of Services
In considering renewal of the Advisory Agreements, the Independent Board Members considered the nature, extent and quality of the Adviser’s services, including advisory services and administrative services. The Independent Board Members reviewed materials outlining, among other things, the Adviser’s organization and business; the types of services that the Adviser or its affiliates provide and are expected to provide to the Funds; the performance record of the applicable Fund (as described in further detail below); and any initiatives Nuveen had taken for the applicable fund product line, including continued activities to refinance auction rate preferred securities, manage leverage during periods of market turbulence and implement an enhanced leverage management process, modify investment mandates in light of market conditions and seek shareholder approval as necessary, maintain the fund share repurchase program and maintain shareholder communications to keep shareholders apprised of Nuveen’s efforts in refinancing preferred shares. In addition to the foregoing, the Independent Board Members also noted the additional services that the Adviser or its affiliates provide to closed-end funds, including, in particular, Nuveen’s continued commitment to supporting the secondary market for the common shares of its closed-end funds through a variety of programs designed to raise investor and analyst awareness and understanding of closed-end funds. These efforts include maintaining an investor relations program to provide timely information and education to financial advisers and investors; providing marketing for the closed-end funds; maintaining and enhancing a closed-end fund website; participating in conferences and having direct communications with analysts and financial advisors.
As part of their review, the Independent Board Members also evaluated the background, experience and track record of the Adviser’s investment personnel. In this regard, the Independent Board Members considered any changes in the personnel, and the impact on the level of services provided to the Funds, if any. The Independent Board Members also reviewed information regarding portfolio manager compensation arrangements to evaluate the Adviser’s ability to attract and retain high quality investment personnel, preserve stability, and reward performance but not provide an incentive for taking undue risks.
In addition to advisory services, the Independent Board Members considered the quality of administrative services provided by the Adviser and its affiliates including product management, fund administration, oversight of service providers, shareholder services, administration of Board relations, regulatory and portfolio compliance and legal
Annual Investment Management Agreement
Approval Process (Unaudited) (continued)
support. Given the importance of compliance, the Independent Board Members also considered the Adviser’s compliance program, including the report of the chief compliance officer regarding the Funds’ compliance policies and procedures.
Based on their review, the Independent Board Members found that, overall, the nature, extent and quality of services provided (and expected to be provided) to the respective Funds under the Advisory Agreements were satisfactory.
B. The Investment Performance of the Funds and the Adviser
The Board considered the performance results of each Fund over various time periods. The Board reviewed, among other things, each Fund’s historic investment performance as well as information comparing the Fund’s performance information with that of other funds (the “Performance Peer Group”) based on data provided by an independent provider of mutual fund data and with recognized and/or customized benchmarks. In this regard, the Board reviewed each Fund’s total return information compared to its Performance Peer Group for the quarter, one-, three- and five-year periods ending December 31, 2009 and for the same periods ending March 31, 2010 (or for the periods available for Funds that did not exist during part of the foregoing time frame). In addition, the Board reviewed each Fund’s total return information compared to recognized and/or customized benchmarks for the quarter, one- and three-year periods ending December 31, 2009 and for the same periods ending March 31, 2010 (or for the periods available for Funds that did not exist during part of the foregoing time frame). Moreover, the Board reviewed the peer ranking of the Nuveen municipal funds advised by the Adviser in the aggregate. The Independent Board Members also reviewed historic premium and discount levels. This information supplemented the Fund performance information provided to the Board at each of its quarterly meetings.
In reviewing peer comparison information, the Independent Board Members recognized that the Performance Peer Group of certain funds may not adequately represent the objectives and strategies of the funds, thereby limiting the usefulness of comparing a fund’s performance with that of its Performance Peer Group. In this regard, the Independent Board Members considered that the Performance Peer Groups of certain funds (including the Nuveen New Jersey Municipal Value Fund (the “New Jersey Value Fund”) and the Nuveen Pennsylvania Municipal Value Fund (the “Pennsylvania Value Fund”)) were classified as having significant differences from such funds based on considerations such as special fund objectives, potential investable universe and the composition of the peer set (e.g., the number and size of competing funds and number of competing managers).
Based on their review, the Independent Board Members determined that each Fund’s investment performance over time had been satisfactory. The Independent Board Members noted that the Nuveen Pennsylvania Dividend Advantage Municipal Fund and the Nuveen New Jersey Dividend Advantage Municipal Fund 2 generally demonstrated favorable performance in comparison to peers, performing in the top two quartiles in the one-, three- and five-year periods ending March 31, 2010. The performance of the
Nuveen Pennsylvania Premium Income Municipal Fund 2 (the “Pennsylvania Premium Fund 2”) and the Nuveen New Jersey Dividend Advantage Municipal Fund was over time satisfactory compared to peers, falling within the second or third quartile over various periods. While the Nuveen New Jersey Investment Quality Municipal Fund, Inc. (the “New Jersey Investment Quality Fund”), the Nuveen Pennsylvania Dividend Advantage Municipal Fund 2 (the “Pennsylvania Dividend Advantage Fund 2”), the Nuveen Pennsylvania Investment Quality Municipal Fund (the “Pennsylvania Investment Quality Fund”) and the Nuveen New Jersey Premium Income Municipal Fund, Inc. (the “New Jersey Premium Fund”) lagged their peers somewhat in the short-term one-year period, they demonstrated more favorable performance in the longer three- and five-year periods. The Board Members further recognized that the New Jersey Value Fund and the Pennsylvania Value Fund are relatively new funds, each with a performance history that is generally too short for a meaningful assessment of performance.
C. Fees, Expenses and Profitability
1. Fees and Expenses
The Board evaluated the management fees and expenses of each Fund reviewing, among other things, such Fund’s gross management fees, net management fees and net expense ratios in absolute terms as well as compared to the fee and expenses of a comparable universe of funds based on data provided by an independent fund data provider (the “Peer Universe”) and in certain cases, to a more focused subset of funds in the Peer Universe (the “Peer Group”) and any expense limitations.
The Independent Board Members further reviewed the methodology regarding the construction of the applicable Peer Universe and/or Peer Group. In reviewing the comparisons of fee and expense information, the Independent Board Members took into account that in certain instances various factors such as: the asset level of a fund relative to peers; the limited size and particular composition of the Peer Universe or Peer Group; the investment objectives of the peers; expense anomalies; changes in the funds comprising the Peer Universe or Peer Group from year to year; levels of reimbursement; the timing of information used; the differences in the type and use of leverage; and differences in the states reflected in the Peer Universe or Peer Group may impact the comparative data, thereby limiting the ability to make a meaningful comparison with peers, including, in particular, the New Jersey Value Fund and the Pennsylvania Value Fund.
In reviewing the fee schedule for a Fund, the Independent Board Members also considered the fund-level and complex-wide breakpoint schedules (described in further detail below) and any fee waivers and reimbursements provided by Nuveen (applicable, in particular, for certain closed-end funds launched since 1999). In their review, the Independent Board Members noted that the New Jersey Value Fund and the Pennsylvania Value Fund had net management fees above the peer average; however, the available peer set was limited as noted above. The New Jersey Investment Quality Fund, the New Jersey Premium Fund, the Pennsylvania Investment Quality Fund and the Pennsylvania Premium Fund 2 had net advisory
Annual Investment Management Agreement
Approval Process (Unaudited) (continued)
fees above the peer average, but the expense ratios were below, at or near the peer expense ratio average. Each other Fund had management fees and/or a net expense ratio below, at or near (within 5 basis points or less) the peer average of its Peer Group or Peer Universe.
Based on their review of the fee and expense information provided, the Independent Board Members determined that each Fund’s management fees were reasonable in light of the nature, extent and quality of services provided to the Fund.
2. Comparisons with the Fees of Other Clients
The Independent Board Members further reviewed information regarding the nature of services and fee rates offered by the Adviser to other clients, including municipal separately managed accounts and passively managed municipal bond exchange traded funds (ETFs) that are sub-advised by the Adviser. In evaluating the comparisons of fees, the Independent Board Members noted that the fee rates charged to the Funds and other clients vary, among other things, because of the different services involved and the additional regulatory and compliance requirements associated with registered investment companies, such as the Funds. Accordingly, the Independent Board Members considered the differences in the product types, including, but not limited to, the services provided, the structure and operations, product distribution and costs thereof, portfolio investment policies, investor profiles, account sizes and regulatory requirements. The Independent Board Members noted, in particular, that the range of services provided to the Funds (as discussed above) is much more extensive than that provided to separately managed accounts. Given the inherent differences in the products, particularly the extensive services provided to the Funds, the Independent Board Members believe such facts justify the different levels of fees.
3. Profitability of Nuveen
In conjunction with its review of fees, the Independent Board Members also considered the profitability of Nuveen for its advisory activities (which incorporated Nuveen’s wholly-owned affiliated sub-advisers) and its financial condition. The Independent Board Members reviewed the revenues and expenses of Nuveen’s advisory activities for the last two years, the allocation methodology used in preparing the profitability data and an analysis of the key drivers behind the changes in revenues and expenses that impacted profitability in 2009. The Independent Board Members noted this information supplemented the profitability information requested and received during the year to help keep them apprised of developments affecting profitability (such as changes in fee waivers and expense reimbursement commitments). In this regard, the Independent Board Members noted that they had also appointed an Independent Board Member as a point person to review and keep them apprised of changes to the profitability analysis and/or methodologies during the year. The Independent Board Members also considered Nuveen’s revenues for advisory activities, expenses, and profit margin compared to that of various unaffiliated management firms with similar amounts of
assets under management and relatively comparable asset composition prepared by Nuveen.
In reviewing profitability, the Independent Board Members recognized the subjective nature of determining profitability which may be affected by numerous factors including the allocation of expenses. Further, the Independent Board Members recognized the difficulties in making comparisons as the profitability of other advisers generally is not publicly available and the profitability information that is available for certain advisers or management firms may not be representative of the industry and may be affected by, among other things, the adviser’s particular business mix, capital costs, types of funds managed and expense allocations.
Notwithstanding the foregoing, the Independent Board Members reviewed Nuveen’s methodology and assumptions for allocating expenses across product lines to determine profitability. In reviewing profitability, the Independent Board Members recognized Nuveen’s investment in its fund business. Based on their review, the Independent Board Members concluded that Nuveen’s level of profitability for its advisory activities was reasonable in light of the services provided.
In evaluating the reasonableness of the compensation, the Independent Board Members also considered other amounts paid to the Adviser by the Funds as well as any indirect benefits (such as soft dollar arrangements, if any) the Adviser and its affiliates receive, or are expected to receive, that are directly attributable to the management of the Funds, if any. See Section E below for additional information on indirect benefits the Adviser may receive as a result of its relationship with the Funds. Based on their review of the overall fee arrangements of each Fund, the Independent Board Members determined that the advisory fees and expenses of the respective Fund were reasonable.
D. Economies of Scale and Whether Fee Levels Reflect These Economies of Scale
With respect to economies of scale, the Independent Board Members have recognized the potential benefits resulting from the costs of a fund being spread over a larger asset base, although economies of scale are difficult to measure and predict with precision, particularly on a fund-by-fund basis. One method to help ensure the shareholders share in these benefits is to include breakpoints in the advisory fee schedule. Generally, management fees for funds in the Nuveen complex are comprised of a fund-level component and a complex-level component, subject to certain exceptions. Accordingly, the Independent Board Members reviewed and considered the applicable fund-level breakpoints in the advisory fee schedules that reduce advisory fees as asset levels increase. Further, the Independent Board Members noted that although closed-end funds may from time-to-time make additional share offerings, the growth of their assets will occur primarily through the appreciation of such funds’ investment portfolio.
In addition to fund-level advisory fee breakpoints, the Board also considered the Funds’ complex-wide fee arrangement. Pursuant to the complex-wide fee arrangement, the
Annual Investment Management Agreement
Approval Process (Unaudited) (continued)
fees of the funds in the Nuveen complex are generally reduced as the assets in the fund complex reach certain levels. The complex-wide fee arrangement seeks to provide the benefits of economies of scale to fund shareholders when total fund complex assets increase, even if assets of a particular fund are unchanged or have decreased. The approach reflects the notion that some of Nuveen’s costs are attributable to services provided to all its funds in the complex and therefore all funds benefit if these costs are spread over a larger asset base.
Based on their review, the Independent Board Members concluded that the breakpoint schedules and complex-wide fee arrangement were acceptable and reflect economies of scale to be shared with shareholders when assets under management increase.
E. Indirect Benefits
In evaluating fees, the Independent Board Members received and considered information regarding potential “fall out” or ancillary benefits the Adviser or its affiliates may receive as a result of its relationship with each Fund. In this regard, the Independent Board Members considered any revenues received by affiliates of the Adviser for serving as agent at Nuveen’s trading desk and as co-manager in initial public offerings of new closed-end funds.
In addition to the above, the Independent Board Members considered whether the Adviser received any benefits from soft dollar arrangements whereby a portion of the commissions paid by a Fund for brokerage may be used to acquire research that may be useful to the Adviser in managing the assets of the Funds and other clients. The Independent Board Members noted that the Adviser does not currently have any soft dollar arrangements; however, to the extent certain bona fide agency transactions that occur on markets that traditionally trade on a principal basis and riskless principal transactions are considered as generating “commissions,” the Adviser intends to comply with the applicable safe harbor provisions.
Based on their review, the Independent Board Members concluded that any indirect benefits received by the Adviser as a result of its relationship with the Funds were reasonable and within acceptable parameters.
F. Other Considerations
The Independent Board Members did not identify any single factor discussed previously as all-important or controlling. The Board Members, including the Independent Board Members, unanimously concluded that the terms of the Advisory Agreements are fair and reasonable, that the Adviser’s fees are reasonable in light of the services provided to each Fund and that the Advisory Agreements be renewed.
Board Approval of Sub-Advisory
Arrangements (Unaudited)
Since the May Meeting, Nuveen has engaged in an internal restructuring (the “Restructuring”) pursuant to which the portfolio management services provided by the Adviser to the Funds were transferred to Nuveen Asset Management, LLC (“NAM LLC”), a newly-organized wholly-owned subsidiary of the Adviser and the Adviser changed its name to Nuveen Fund Advisors, Inc. (“NFA”). The Adviser, under its new name NFA, continues to serve as investment adviser to the Funds and, in that capacity, will continue to provide various oversight, administrative, compliance and other services. To effectuate the foregoing, NFA entered into sub-advisory agreements with NAM LLC on behalf of the Funds (each, a “Sub-Advisory Agreement”). Under each Sub-Advisory Agreement, NAM LLC, subject to the oversight of NFA and the Board, will furnish an investment program, make investment decisions for, and place all orders for the purchase and sale of securities for the portion of the respective Fund’s investment portfolio allocated to it by NFA. There have been no changes to the advisory fees paid by the Funds; rather, NFA will pay a portion of the investment advisory fee it receives to NAM LLC for its sub-advisory services. The Independent Board Members reviewed the allocation of fees between NFA and NAM LLC. NFA and NAM LLC do not anticipate any reduction in the nature or level of services provided to the Funds following the Restructuring. The personnel of NFA who engaged in portfolio management activities prior to the spinoff of NAM LLC are not expected to materially change as a result of the spinoff. In light of the foregoing, at a meeting held on November 16-18, 2010, the Board Members, including a majority of the Independent Board Members, approved the Sub-Advisory Agreements on behalf of the Funds. Given that the Restructuring was not expected to reduce the level or nature of services provided and the advisory fees paid by the Funds were the same, the factors considered and determinations made at the May Meeting in approving the Advisory Agreements were equally applicable to the approval of the Sub-Advisory Agreements.
Reinvest Automatically,
Easily and Conveniently
Nuveen makes reinvesting easy. A phone call is all it takes to set up your reinvestment account.
Nuveen Closed-End Funds Automatic Reinvestment Plan
Your Nuveen Closed-End Fund allows you to conveniently reinvest distributions in additional Fund shares.
By choosing to reinvest, you’ll be able to invest money regularly and automatically, and watch your investment grow through the power of compounding. Just like distributions in cash, there may be times when income or capital gains taxes may be payable on distributions that are reinvested.
It is important to note that an automatic reinvestment plan does not ensure a profit, nor does it protect you against loss in a declining market.
Easy and convenient
To make recordkeeping easy and convenient, each month you’ll receive a statement showing your total distributions, the date of investment, the shares acquired and the price per share, and the total number of shares you own.
How shares are purchased
The shares you acquire by reinvesting will either be purchased on the open market or newly issued by the Fund. If the shares are trading at or above net asset value at the time of valuation, the Fund will issue new shares at the greater of the net asset value or 95% of the then-current market price. If the shares are trading at less than net asset value, shares for your account will be purchased on the open market. If the Plan Agent begins purchasing Fund shares on the open market while shares are trading below net asset value, but the Fund’s shares subsequently trade at or above their net asset value before the Plan Agent is able to complete its purchases, the Plan Agent may cease open-market purchases and may invest the uninvested portion of the distribution in newly-issued Fund shares at a price equal to the greater of the shares’ net asset value or 95% of the shares’ market value on the last business day immediately prior to the purchase date. Distributions received to purchase shares in the open market will normally be invested shortly after the distribution payment date. No interest will be paid on distributions awaiting reinvestment. Because the market price of the shares may increase before purchases are completed, the average purchase price per share may
exceed the market price at the time of valuation, resulting in the acquisition of fewer shares than if the distribution had been paid in shares issued by the Fund. A pro rata portion of any applicable brokerage commissions on open market purchases will be paid by Plan participants. These commissions usually will be lower than those charged on individual transactions.
Flexible
You may change your distribution option or withdraw from the Plan at any time, should your needs or situation change.
You can reinvest whether your shares are registered in your name, or in the name of a brokerage firm, bank, or other nominee. Ask your investment advisor if his or her firm will participate on your behalf. Participants whose shares are registered in the name of one firm may not be able to transfer the shares to another firm and continue to participate in the Plan.
The Fund reserves the right to amend or terminate the Plan at any time. Although the Fund reserves the right to amend the Plan to include a service charge payable by the participants, there is no direct service charge to participants in the Plan at this time.
Call today to start reinvesting distributions
For more information on the Nuveen Automatic Reinvestment Plan or to enroll in or withdraw from the Plan, speak with your financial advisor or call us at (800) 257-8787.
Glossary of Terms
Used in this Report
| | | |
| ■ | | Auction Rate Bond: An auction rate bond is a security whose interest payments are adjusted periodically through an auction process, which process typically also serves as a means for buying and selling the bond. Auctions that fail to attract enough buyers for all the shares offered for sale are deemed to have “failed,” with current holders receiving a formula-based interest rate until the next scheduled auction. |
| | | |
| ■ | | Average Annual Total Return: This is a commonly used method to express an investment’s performance over a particular, usually multi-year time period. It expresses the return that would have been necessary each year to equal the investment’s actual cumulative performance (including change in NAV or market price and reinvested dividends and capital gains distributions, if any) over the time period being considered. |
| | | |
| ■ | | Average Effective Maturity: The market-value-weighted average of the effective maturity dates of the individual securities including cash. In the case of a bond that has been advance-refunded to a call date, the effective maturity is the date on which the bond is scheduled to be redeemed using the proceeds of an escrow account. In most other cases the effective maturity is the stated maturity date of the security. |
| | | |
| ■ | | Effective Leverage: Effective leverage is a Fund’s effective economic leverage, and includes both structural leverage and the leverage effects of certain derivative investments in the Fund’s portfolio. Currently, the leverage effects of Tender Option Bond (TOB) inverse floater holdings are included in effective leverage values, in addition to any structural leverage. |
| | | |
| ■ | | Inverse Floaters: Inverse floating rate securities, also known as inverse floaters, are created by depositing a municipal bond, typically with a fixed interest rate, into a special purpose trust created by a broker-dealer. This trust, in turn, (a) issues floating rate certificates typically paying short-term tax-exempt interest rates to third parties in amounts equal to some fraction of the deposited bond’s par amount or market value, and (b) issues an inverse floating rate certificate (sometimes referred to as an “inverse floater”) to an investor (such as a Fund) interested in gaining investment exposure to a long-term municipal bond. The income received by the holder of the inverse floater varies inversely with the short-term rate paid to the floating rate certificates’ holders, and in most circumstances the holder of the inverse floater bears substantially all of the underlying bond’s downside investment risk. The holder of the inverse floater typically also benefits disproportionately from any potential appreciation of the underlying bond’s value. Hence, an inverse floater essentially represents an investment in the underlying bond on a leveraged basis. |
| | | |
| ■ | | Leverage: Using borrowed money to invest in securities or other assets. |
| ■ | | Leverage-Adjusted Duration: Duration is a measure of the expected period over which a bond’s principal and interest will be paid, and consequently is a measure of the sensitivity of a bond’s or bond Fund’s value to changes when market interest rates change. Generally, the longer a bond’s or Fund’s duration, the more the price of the bond or Fund will change as interest rates change. Leverage-adjusted duration takes into account the leveraging process for a Fund and therefore is longer than the duration of the Fund’s portfolio of bonds. |
| | | |
| ■ | | Market Yield (also known as Dividend Yield or Current Yield): An investment’s current annualized dividend divided by its current market price. |
| | | |
| ■ | | Net Asset Value (NAV): A Fund’s NAV per common share is calculated by subtracting the liabilities of the Fund (including any Preferred shares issued in order to leverage the Fund) from its total assets and then dividing the remainder by the number of common shares outstanding. Fund NAVs are calculated at the end of each business day. |
| | | |
| ■ | | Pre-Refunding: Pre-Refunding, also known as advanced refundings or refinancings, is a procedure used by state and local governments to refinance municipal bonds to lower interest expenses. The issuer sells new bonds with a lower yield and uses the proceeds to buy U.S. Treasury securities, the interest from which is used to make payments on the higher-yielding bonds. Because of this collateral, pre-refunding generally raises a bond’s credit rating and thus its value. |
| | | |
| ■ | | Structural Leverage: Structural Leverage consists of preferred shares or debt issued by the fund. Both of these are part of a fund’s capital structure. Structural leverage is sometimes referred to as “40 Act Leverage” and is subject to asset coverage limits set in the Investment Company Act of 1940. |
| | | |
| ■ | | Taxable-Equivalent Yield: The yield necessary from a fully taxable investment to equal, on an after-tax basis, the yield of a municipal bond investment. |
| | | |
| ■ | | Zero Coupon Bond: A zero coupon bond does not pay a regular interest coupon to its holders during the life of the bond. Tax-exempt income to the holder of the bond comes from accretion of the difference between the original purchase price of the bond at issuance and the par value of the bond at maturity and is effectively paid at maturity. The market prices of zero coupon bonds generally are more volatile than the market prices of bonds that pay interest periodically. |
Notes
Other Useful Information
Board of
Directors/Trustees
John P. Amboian
Robert P. Bremner
Jack B. Evans
William C. Hunter
David J. Kundert
William J. Schneider
Judith M. Stockdale
Carole E. Stone
Virginia L. Stringer
Terence J. Toth
Fund Manager
Nuveen Fund Advisors, Inc.
333 West Wacker Drive
Chicago, IL 60606
Custodian
State Street Bank
& Trust Company
Boston, MA
Transfer Agent and Shareholder Services
State Street Bank & Trust
Company
Nuveen Funds
P.O. Box 43071
Providence, RI 02940-3071
(800) 257-8787
Legal Counsel
Chapman and Cutler LLP
Chicago, IL
Independent Registered
Public Accounting Firm
Ernst & Young LLP
Chicago, IL
Quarterly Portfolio of Investments and Proxy Voting Information
You may obtain (i) each Fund’s quarterly portfolio of investments, (ii) information regarding how the Funds voted proxies relating to portfolio securities held during the most recent twelve-month period ended June 30, and (iii) a description of the policies and procedures that the Funds used to determine how to vote proxies relating to portfolio securities without charge, upon request, by calling Nuveen Investments toll-free at (800) 257-8787 or on Nuveen’s website at www.nuveen.com.
You may also obtain this and other Fund information directly from the Securities and Exchange Commission (SEC). The SEC may charge a copying fee for this information. Visit the SEC on-line at http://www.sec.gov or in person at the SEC’s Public Reference Room in Washington, D.C. Call the SEC at (202) 942-8090 for room hours and operation. You may also request Fund information by sending an e-mail request to publicinfo@sec.gov or by writing to the SEC’s Public References Section at 100 F Street NE, Washington, D.C. 20549.
CEO Certification Disclosure
Each Fund’s Chief Executive Officer (CEO) has submitted to the New York Stock Exchange (NYSE) the annual CEO certification as required by Section 303A.12(a) of the NYSE Listed Company Manual.
Each Fund has filed with the SEC the certification of its Chief Executive Officer and Chief Financial Officer required by Section 302 of the Sarbanes-Oxley Act.
Common and Preferred Share Information
Each Fund intends to repurchase and/or redeem shares of its own common and/or auction rate preferred stock in the future at such times and in such amounts as is deemed advisable. During the period covered by this report, the Funds repurchased and/or redeemed shares of their common and/or auction rate preferred stock as shown in the accompanying table.
| | | | Auction Rate |
| | Common Shares | | Preferred Shares |
| Fund | Repurchased | | Redeemed |
| NQJ | — | | 5,738 |
| NNJ | — | | 3,515 |
| NXJ | — | | 1,757 |
| NUJ | — | | 1,249 |
| NJV | — | | N/A |
| NQP | — | | 4,470 |
| NPY | — | | 3,971 |
| NXM | — | | 900 |
| NVY | — | | 920 |
| NPN | — | | N/A |
N/A – Fund does not issue auction rate preferred shares.
Any future repurchases and/or redemptions will be reported to shareholders in the next annual or semi-annual report.
Nuveen Investments:
Serving Investors for Generations
Since 1898, financial advisors and their clients have relied on Nuveen Investments to provide dependable investment solutions through continued adherence to proven, long-term investing principles. Today, we offer a range of high quality equity and fixed-income solutions designed to be integral components of a well-diversified core portfolio.
Focused on meeting investor needs.
Nuveen Investments is a global investment management firm that seeks to help secure the long-term goals of institutions and high net worth investors as well as the consultants and financial advisors who serve them. We market our growing range of specialized investment solutions under the high-quality brands of HydePark, NWQ, Nuveen Asset Management, Santa Barbara, Symphony, Tradewinds and Winslow Capital. In total, Nuveen Investments managed approximately $206 billion of assets as of March 31, 2011.
Find out how we can help you.
To learn more about how the products and services of Nuveen Investments may be able to help you meet your financial goals, talk to your financial advisor, or call us at (800) 257-8787. Please read the information provided carefully before you invest.
Investors should consider the investment objective and policies, risk considerations, charges and expenses of any investment carefully. Where applicable, be sure to obtain a prospectus, which contains this and other relevant information. To obtain a prospectus, please contact your securities representative or Nuveen Investments, 333 W. Wacker Dr., Chicago, IL 60606. Please read the prospectus carefully before you invest or send money. Learn more about Nuveen Funds at: www.nuveen.com/cef
| | Nuveen makes things e-simple. | |
| | | |
| | It only takes a minute to sign up for e-Reports. Once enrolled, you’ll receive an e-mail as soon as your Nuveen Fund information is ready - no more waiting for delivery by regular mail. Just click on the link within the e-mail to see the report and save it on your computer if you wish. | |
| | | |
| | Free e-Reports right to your e-mail! www.investordelivery.com | |
| | | |
| | If you receive your Nuveen Fund distributions and statements from your financial advisor or brokerage account. | |
| | | |
| | OR www.nuveen.com/accountaccess | |
| | | |
| | If you receive your Nuveen Fund distributions and statements directly from Nuveen. | |
Distributed by Nuveen Securities, LLC 333 West Wacker Drive Chicago, IL 60606 www.nuveen.com | |
ITEM 2. CODE OF ETHICS.
As of the end of the period covered by this report, the registrant has adopted a code of ethics that applies to the registrant's principal executive officer, principal financial officer, principal accounting officer or controller, or persons performing similar functions. There were no amendments to or waivers from the Code during the period covered by this report. The registrant has posted the code of ethics on its website at www.nuveen.com/CEF/Info/Shareholder. (To view the code, click on Fund Governance and then click on Code of Conduct.)
ITEM 3. AUDIT COMMITTEE FINANCIAL EXPERT.
The registrant's Board of Directors or Trustees (“Board”) determined that the registrant has at least one “audit committee financial expert” (as defined in Item 3 of Form N-CSR) serving on its Audit Committee. The registrant's audit committee financial expert is Carole E. Stone, who is “independent” for purposes of Item 3 of Form N-CSR.
Ms. Stone served for five years as Director of the New York State Division of the Budget. As part of her role as Director, Ms. Stone was actively involved in overseeing the development of the State's operating, local assistance and capital budgets, its financial plan and related documents; overseeing the development of the State's bond-related disclosure documents and certifying that they fairly presented the State's financial position; reviewing audits of various State and local agencies and programs; and coordinating the State's system of internal audit and control. Prior to serving as Director, Ms Stone worked as a budget analyst/examiner with increasing levels of responsibility over a 30 year period, including approximately five years as Deputy Budget Director. Ms. Stone has also served as Chair of the New York State Racing Association Oversight Board, as Chair of the Public Authorities Control Board, as a Commissioner on the New York State Commission on Public Authority Reform and as a member of the Boards of Directors of several New York State public authorities. These positions have involved overseeing operations and finances of certain entities and assessing the adequacy of project/entity financing and financial reporting. Currently, Ms. Stone is on the Board of Directors of CBOE Holdings, Inc., of the Chicago Board Options Exchange, and of C2 Options Exchange. Ms. Stone's position on the boards of these entities and as a member of both CBOE Holdings' Audit Committee and its Finance Committee has involved, among other things, the oversight of audits, audit plans and preparation of financial statements.
ITEM 4. PRINCIPAL ACCOUNTANT FEES AND SERVICES.
The following tables show the amount of fees that Ernst & Young LLP, the Fund's auditor, billed to the Fund during the Fund's last two full fiscal years. For engagements with Ernst & Young LLP the Audit Committee approved in advance all audit services and non-audit services that Ernst & Young LLP provided to the Fund, except for those non-audit services that were subject to the pre-approval exception under Rule 2-01 of Regulation S-X (the “pre-approval exception”). The pre-approval exception for services provided directly to the Fund waives the pre-approval requirement for services other than audit, review or attest services if: (A) the aggregate amount of all such services provided constitutes no more than 5% of the total amount of revenues paid by the Fund to its accountant during the fiscal year in which the services are provided; (B) the Fund did not recognize the services as non-audit services at the time of the engagement; and (C) the services are promptly brought to the Audit Committee's attention, and the Committee (or its delegate) approves the services before the audit is completed.
The Audit Committee has delegated certain pre-approval responsibilities to its Chairman (or, in his absence, any other member of the Audit Committee).
SERVICES THAT THE FUND'S AUDITOR BILLED TO THE ADVISER AND AFFILIATED FUND SERVICE PROVIDERS
The tables also show the percentage of fees subject to the pre-approval exception. The pre-approval exception for services provided to the Adviser and any Affiliated Fund Service Provider (other than audit, review or attest services) waives the pre-approval requirement if: (A) the aggregate amount of all such services provided constitutes no more than 5% of the total amount of revenues paid to Ernst & Young LLP by the Fund, the Adviser and Affiliated Fund Service Providers during the fiscal year in which the services are provided that would have to be pre-approved by the Audit Committee; (B) the Fund did not recognize the services as non-audit services at the time of the engagement; and (C) the services are promptly brought to the Audit Committee's attention, and the Committee (or its delegate) approves the services before the Fund's audit is completed.
The following table shows the amount of fees that Ernst & Young LLP billed during the Fund's last two full fiscal years for non-audit services. The Audit Committee is required to pre-approve non-audit services that Ernst & Young LLP provides to the Adviser and any Affiliated Fund Services Provider, if the engagement related directly to the Fund's operations and financial reporting (except for those subject to the pre-approval exception described above). The Audit Committee requested and received information from Ernst & Young LLP about any non-audit services that Ernst & Young LLP rendered during the Fund's last fiscal year to the Adviser and any Affiliated Fund Service Provider. The Committee considered this information in evaluating Ernst & Young LLP's independence.
Audit Committee Pre-Approval Policies and Procedures. Generally, the Audit Committee must approve (i) all non-audit services to be performed for the Fund by the Fund's independent accountants and (ii) all audit and non-audit services to be performed by the Fund's independent accountants for the Affiliated Fund Service Providers with respect to operations and financial reporting of the Fund. Regarding tax and research projects conducted by the independent accountants for the Fund and Affiliated Fund Service Providers (with respect to operations and financial reports of the Fund) such engagements will be (i) pre-approved by the Audit Committee if they are expected to be for amounts greater than $10,000; (ii) reported to the Audit Committee chairman for his verbal approval prior to engagement if they are expected to be for amounts under $10,000 but greater than $5,000; and (iii) reported to the Audit Committee at the next Audit Committee meeting if they are expected to be for an amount under $5,000.
ITEM 5. AUDIT COMMITTEE OF LISTED REGISTRANTS.
ITEM 6. SCHEDULE OF INVESTMENTS.
a) See Portfolio of Investments in Item 1.
b) Not applicable.
ITEM 7. DISCLOSURE OF PROXY VOTING POLICIES AND PROCEDURES FOR CLOSED-END MANAGEMENT INVESTMENT COMPANIES.
ITEM 9. PURCHASES OF EQUITY SECURITIES BY CLOSED-END MANAGEMENT INVESTMENT COMPANY AND AFFILIATED PURCHASERS.
Not applicable.
ITEM 10. SUBMISSION OF MATTERS TO A VOTE OF SECURITY HOLDERS.
There have been no material changes to the procedures by which shareholders may recommend nominees to the registrant's Board implemented after the registrant last provided disclosure in response to this item.
ITEM 11. CONTROLS AND PROCEDURES.
ITEM 12. EXHIBITS.
File the exhibits listed below as part of this Form. Letter or number the exhibits in the sequence indicated.
Pursuant to the requirements of the Securities Exchange Act of 1934 and the Investment Company Act of 1940, the registrant has duly caused this report to be signed on its behalf by the undersigned, thereunto duly authorized.
Kevin J. McCarthy
Pursuant to the requirements of the Securities Exchange Act of 1934 and the Investment Company Act of 1940, this report has been signed below by the following persons on behalf of the registrant and in the capacities and on the dates indicated.
Gifford R. Zimmerman
Stephen D. Foy