UNITED STATES
SECURITIES AND EXCHANGE COMMISSION
Washington, D.C. 20549
FORM N-CSR
CERTIFIED SHAREHOLDER REPORT OF
REGISTERED MANAGEMENT INVESTMENT COMPANIES
Investment Company Act file number 811-22274
Nuveen New Jersey Municipal Value Fund
(Exact name of registrant as specified in charter)
Nuveen Investments
333 West Wacker Drive
Chicago, IL 60606
(Address of principal executive offices) (Zip code)
Kevin J. McCarthy
Nuveen Investments
333 West Wacker Drive
Chicago, IL 60606
(Name and address of agent for service)
Registrant’s telephone number, including area code: (312) 917-7700
Date of fiscal year end: April 30
Date of reporting period: April 30, 2015
Form N-CSR is to be used by management investment companies to file reports with the Commission not later than 10 days after the transmission to stockholders of any report that is required to be transmitted to stockholders under Rule 30e-1 under the Investment Company Act of 1940 (17 CFR 270.30e-1). The Commission may use the information provided on Form N-CSR in its regulatory, disclosure review, inspection, and policymaking roles.
A registrant is required to disclose the information specified by Form N-CSR, and the Commission will make this information public. A registrant is not required to respond to the collection of information contained in Form N-CSR unless the Form displays a currently valid Office of Management and Budget (“OMB”) control number. Please direct comments concerning the accuracy of the information collection burden estimate and any suggestions for reducing the burden to Secretary, Securities and Exchange Commission, 450 Fifth Street, NW, Washington, DC 20549-0609. The OMB has reviewed this collection of information under the clearance requirements of 44 U.S.C. ss. 3507.
ITEM 1. REPORTS TO STOCKHOLDERS.
Life is Complex
Nuveen makes things e-simple.
It only takes a minute to sign up for e-Reports. Once enrolled, you’ll receive an e-mail as soon as your Nuveen Investments Fund information is ready—no more waiting for delivery by regular mail. Just click on the link within the e-mail to see the report and save it on your computer if you wish.
Free e-Reports right to your e-mail!
www.investordelivery.com
If you receive your Nuveen Fund dividends and statements from your financial advisor or brokerage account.
or
www.nuveen.com/accountaccess
If you receive your Nuveen Fund dividends and statements directly from Nuveen.
Table of Contents
| Chairman’s Letter to Shareholders | 4 |
| | |
| Portfolio Manager’s Comments | 5 |
| | |
| Fund Leverage | 11 |
| | |
| Common Share Information | 13 |
| | |
| Risk Considerations | 15 |
| | |
| Performance Overview and Holding Summaries | 16 |
| | |
| Report of Independent Registered Public Accounting Firm | 20 |
| | |
| Portfolios of Investments | 21 |
| | |
| Statement of Assets and Liabilities | 54 |
| | |
| Statement of Operations | 55 |
| | |
| Statement of Changes in Net Assets | 56 |
| | |
| Statement of Cash Flows | 58 |
| | |
| Financial Highlights | 60 |
| | |
| Notes to Financial Statements | 65 |
| | |
| Additional Fund Information | 80 |
| | |
| Glossary of Terms Used in this Report | 81 |
| | |
| Reinvest Automatically, Easily and Conveniently | 83 |
| | |
| Board Members & Officers | 84 |
Chairman’s Letter to Shareholders
Dear Shareholders,
A pattern of divergence has emerged in the past year. Steady and moderate growth in the U.S. economy helped sustain the stock market’s bull run another year. U.S. bonds also performed well, amid subdued inflation, interest rates that remained unexpectedly low and concerns about the economic well-being of the rest of the world. The stronger domestic economy enabled the U.S. Federal Reserve (Fed) to gradually reduce its large scale bond purchases, known as quantitative easing (QE), without disruption to the markets, as well as beginning to set expectations for a transition into tightening mode.
The economic story outside the U.S. continues to improve. Despite the drama over Greece’s debt negotiations, the European economy appears to be stabilizing. Japan is on a moderate recovery path as it emerged from recession late last quarter. China’s economy decelerated and, despite running well above the rate of other major global economies, investors feared it looked slow by China’s standards. Some areas of concern were a surprisingly steep decline in oil prices, the U.S. dollar’s rally and an increase in geopolitical tensions, including the Russia-Ukraine crisis and terrorist attacks across the Middle East and Africa, as well as more recently in Europe.
While a backdrop of healthy economic growth in the U.S. and the continuation of accommodative monetary policy (with the central banks of Japan and Europe stepping in where the Fed has left off) bodes well for the markets, the global outlook has become more uncertain. Indeed, volatility is likely to feature more prominently in the investment landscape going forward. Such conditions underscore the importance of professional investment management. Experienced investment teams have weathered the market’s ups and downs in the past and emerged with a better understanding of the sensitivities of their asset class and investment style, particularly in times of turbulence. We recognize the importance of maximizing gains, while striving to minimize volatility.
And, the same is true for investors like you. Maintaining an appropriate time horizon, diversification and relying on practiced investment teams are among your best strategies for achieving your long-term investment objectives. Additionally, I encourage you to communicate with your financial consultant if you have questions about your investment in a Nuveen Fund. On behalf of the other members of the Nuveen Fund Board, we look forward to continuing to earn your trust in the months and years ahead.
William J. Schneider
Chairman of the Board
June 22, 2015
Portfolio Manager’s Comments
Nuveen New Jersey Dividend Advantage Municipal Fund (NXJ)
Nuveen New Jersey Municipal Value Fund (NJV)
Nuveen Pennsylvania Investment Quality Municipal Fund (NQP)
Nuveen Pennsylvania Municipal Value Fund (NPN)
These Funds feature portfolio management by Nuveen Asset Management, LLC, an affiliate of Nuveen Investments, Inc. Portfolio manager Paul L. Brennan, CFA, reviews U.S. economic and municipal market conditions, key investment strategies and the twelvemonth performance of the Nuveen New Jersey and Pennsylvania Funds. Paul assumed portfolio management responsibility for these four Funds in 2011.
FUND REORGANIZATIONS
During November 2013, the New Jersey Funds’ Board of Directors/Trustees approved a series of reorganizations for certain Funds included in this report (the Target Funds) to create one, larger-state Fund (the Acquiring Fund).
The reorganizations are as follows:
| Target Funds | Symbol | | Acquiring Fund | Symbol |
| Nuveen New Jersey Investment Quality Municipal Fund, Inc. | NQJ | | Nuveen New Jersey Dividend Advantage Municipal Fund | NXJ |
| Nuveen New Jersey Premium Income Municipal Fund, Inc. | NNJ | | | |
| Nuveen New Jersey Dividend Advantage Municipal Fund 2 | NUJ | | | |
On October 20, 2014, the reorganizations were approved by shareholders and the reorganizations became effective before the opening of business on November 11, 2014.
See Notes to Financial Statements, Note 1 – General Information and Significant Accounting Policies, Fund Reorganizations for further information.
What factors affected the U.S. economy and the national municipal bond market during the twelve-month reporting period ended April 30, 2015?
During this reporting period, the U.S. economy continued to expand at a moderate pace. The Federal Reserve (Fed) maintained efforts to bolster growth and promote progress toward its mandates of maximum employment and price stability by holding the benchmark fed funds rate at the record low level of zero to 0.25% that it established in December 2008. At its October 2014 meeting, the Fed announced that it would end its bond-buying stimulus program as of November 1, 2014, after tapering its monthly asset purchases of mortgage-backed and longer-term Treasury securities from the original $85 billion per month to $15 billion per
| Certain statements in this report are forward-looking statements. Discussions of specific investments are for illustration only and are not intended as recommendations of individual investments. The forward-looking statements and other views expressed herein are those of the portfolio manager as of the date of this report. Actual future results or occurrences may differ significantly from those anticipated in any forward-looking statements, and the views expressed herein are subject to change at any time, due to numerous market and other factors. The Funds disclaim any obligation to update publicly or revise any forward-looking statements or views expressed herein. |
Ratings shown are the highest rating given by one of the following national rating agencies: Standard & Poor’s (S&P), Moody’s Investors Service, Inc., (Moody’s) or Fitch, Inc. (Fitch). Credit ratings are subject to change. AAA, AA, A and BBB are investment grade ratings; BB, B, CCC, CC, C and D are below investment grade ratings. Certain bonds backed by U.S. Government or agency securities are regarded as having an implied rating equal to the rating of such securities. Holdings designated N/R are not rated by these national rating agencies.
Bond insurance guarantees only the payment of principal and interest on the bond when due, and not the value of the bonds themselves, which will fluctuate with the bond market and the financial success of the issuer and the insurer. Insurance relates specifically to the bonds in the portfolio and not to the share prices of a Fund. No representation is made as to the insurers’ ability to meet their commitments.
Refer to the Glossary of Terms Used in this Report for further definition of the terms used within this section.
Portfolio Manager’s Comments (continued)
month over the course of seven consecutive meetings (December 2013 through September 2014). In making the announcement, the Fed cited substantial improvement in the outlook for the labor market since the inception of the current asset purchase program as well as sufficient underlying strength in the broader economy to support ongoing progress toward maximum employment in a context of price stability. The Fed also reiterated that it would continue to look at a wide range of factors, including labor market conditions, indicators of inflationary pressures and readings on financial developments, in determining future actions. Additionally, the Fed stated that it would likely maintain the current target range for the fed funds rate for a considerable time after the end of the asset purchase program, especially if projected inflation continues to run below the Fed’s 2% longer run goal. However, if economic data shows faster progress, the Fed indicated that it could raise the fed funds rate sooner than expected.
The Fed changed its language slightly in December, indicating it would be “patient” in normalizing monetary policy. This shift helped ease investors’ worries that the Fed might raise rates too soon. However, as employment data released early in the year continued to look strong, anticipation began building that the Fed could raise its main policy rate as soon as June. As widely expected, after its March meeting, the Fed eliminated “patient” from its statement but also highlighted the policy makers’ less optimistic view of the economy’s overall health as well as downgraded their inflation projections. The Fed’s April meeting seemed to further signal that a June rate hike was off the table. While the Fed attributed the first quarter’s economic weakness to temporary factors, the meeting minutes from April revealed that many Committee members believed the economic data available in June would be insufficient to meet the Fed’s criteria for initiating a rate increase.
According to the government’s second estimate, the U.S. economy contracted at a 0.7% annualized rate in the first quarter of 2015, as measured by GDP, compared with an increase of 4.6% in the second quarter of 2014, 5.0% in the third quarter and 2.2% in the fourth quarter. The decline in real GDP growth rate from the fourth quarter of 2014 to the first quarter of 2015 primarily reflects a downturn in both state and local government spending, a decline in exports and consumer spending. These were partly offset by an upturn in federal government spending. The Consumer Price Index (CPI) fell 0.2% year-over-year as of April 2015. The core CPI (which excludes food and energy) increased 1.8% during the same period, below the Fed’s unofficial longer term inflation objective of 2.0%. As of April 30, 2015, the national unemployment rate was 5.4%, the lowest level since May 2008 and the level considered “full employment” by some Fed officials, down from the 6.2% reported in April 2014. The housing market continued to post consistent gains, with 35 consecutive months of year-over-year increases as of its most recent reading in March 2015. The average home price in the S&P/Case-Shiller Index of 20 major metropolitan areas rose 5.0% for the twelve months ended March 2015 (most recent data available at the time this report was prepared).
Municipal bonds enjoyed strong performance during the twelve-month reporting period, buoyed by a backdrop of low interest rates, improving investor sentiment and favorable supply-demand dynamics. Interest rates were widely expected to rise in 2014, as the economy improved and the Fed wound down its asset purchases. However, the 10-year Treasury yield ended the year even lower than where it began. As a result, fixed income asset classes performed surprisingly well (as yields fall, prices rise and vice versa). At the same time, investors grew more confident that the Fed’s tapering would proceed at a measured pace and that the credit woes of Detroit and Puerto Rico would be contained. In addition, credit fundamentals for state and local governments were generally stabilizing, although pockets of trouble remained. California and New York showed marked improvements during 2014, whereas Illinois, New Jersey and Puerto Rico, for example, still face considerable challenges.
Investors’ declining risk aversion bolstered demand for higher yielding assets, including municipal bonds, which reversed the tide of outflows municipal bond funds suffered in 2013. While demand and inflows rose, supply continued to be subdued in 2014. More municipal bonds left the market than were added, a condition known as net negative issuance. Part of the reason for net negative issuance was that a significant portion of issuer activity focused on current refundings, in which a new bond is issued to replace the called bond (in contrast to an advanced refunding, where the called bond remains in the market as a pre-refunded bond).
These factors helped drive municipal bond yields lower and tightened yield spreads relative to Treasuries in 2014 overall. However, as 2015 began, market conditions turned more volatile. A series of disappointing economic data underscored the fragility of the U.S. recovery, as well as cast further uncertainty on the timing of the Fed’s first rate hike. Issuance was unusually strong at the beginning of 2015, fueling concerns about potential oversupply conditions. Over the twelve months ended April 30, 2015, municipal bond issuance nationwide totaled $391.9 billion, an increase of 30.8% from the issuance for the twelve-month period ended April 30, 2014. The surge in gross issuance is due mostly to increased refunding deals as issuers have been actively and aggressively refunding their outstanding debt given the very low interest rate environment. These refunding transactions have ranged from 40%-60% of total issuance over the past few years. Thus, the net issuance (all bonds issued less bonds redeemed) is actually much lower than the gross issuance. In fact, the total municipal bonds outstanding has actually declined in each of the past four calendar years. So, the gross is surging, but the net is not and this has been an overall positive technical factor on municipal bond investment performance. At the same time, regulatory changes, increased risk aversion and expectations for rising interest rates have encouraged bond dealers, typically brokers and banks, to reduce the size of their inventories in recent years. By holding smaller amounts of bonds on their books, dealers seek to mitigate their exposure to bonds that could potentially be worth less or be more difficult to sell in the future. As a result, there has been less liquidity in the marketplace, which contributed to periods of increased price volatility in early 2015. The municipal bond market also experienced some seasonal weakness in the first few months of 2015 due to tax-related selling. Finally, divergence in economic growth and central bank policies around the world have reinforced an interest rate differential that favors demand for U.S. Treasuries, maintaining downward pressure on yields.
How were the economic and market environments in New Jersey and Pennsylvania during the twelve-month reporting period ended April 30, 2015?
New Jersey’s economy continues to struggle despite favorable characteristics that position it to do quite well, such as its proximity to New York City’s extensive job market, a shoreline along the Atlantic coast that benefits a strong tourism industry, and two large transportation hubs in the Port of New York and Newark and Newark airport. While the state’s economy is fairly diverse and average wages are above national counterparts in nearly every sector, it has lagged its neighbors and the nation in recovering from the recession. New Jersey has the slowest job growth rate in the northeast and total employment remains below pre-recession levels. The state’s unemployment rate as of April 2015 stood at 6.5%, well above the national average of 5.4%. The sluggishness of the state’s economy exacerbates fiscal pressures caused by growing pension, retirement health care, and debt service payments. In Fiscal Year 2015 expenditures on these three line items constitutes 17% of budgeted revenues. The state was to make significantly higher pension contributions in FY15 but opted to contribute a much lower amount. Labor groups challenged this move and the legal action made its way to the New Jersey Supreme Court which found that the state could contribute less than originally agreed to under the terms of current labor agreements. The court found that in order for the contributions to be binding that they would need to be voter-approved; as the pension contributions were not voter-approved there was no requirement on the part of the state to make the larger payments. The $33 billion Fiscal Year 2016 budget proposed by Governor Christie underfunds the court-mandated pension payment by more than half. The budget also fails to appropriate any new money for transportation capital projects; instead, all revenues generated by the state’s gas tax goes to pay debt service. Maintaining and upgrading infrastructure is key to economic growth and the state has put itself at a disadvantage by overleveraging these revenues. The state has been downgraded several times in recent years and now carries an A rating by S&P, an A2 with negative outlook by Moody’s and an A with negative outlook by Fitch. For the twelve months ending April 30, 2015, the state issued $10.6 billion in tax-exempt debt, a year-over-year increase of 18.2%.
Pennsylvania’s recovery has been a slow one. During the downturn, the commonwealth’s job losses were significant, but less so than nationally. Coming out of the recession, there was a quicker recovery of jobs lost in the commonwealth but the pace of employment growth has moderated. As of April 2015, Pennsylvania's unemployment rate was 5.3%, down from 6.0% in April 2014 and below the
Portfolio Manager’s Comments (continued)
national average of 5.4% for April 2015. Education and health services, which are among the more stable industries, remain the commonwealth’s largest employment sector at 20.2% of total employment. The natural gas industry continues to develop in the Marcellus Shale in western Pennsylvania. It is still relatively small compared to the Pennsylvania economy as a whole and the drop in natural gas prices has led to recent spending cutbacks among the gas producers. Offsetting this downside risk is the growth in investments in pipelines, processing centers, and refineries to transport natural gas liquids to other locations. On the fiscal front, Pennsylvania faces increasing pressure from a structurally unbalanced budget and the need for pension reform to address growing debt levels following years of underfunding and market-driven investment declines. The gap between planned expenditures and expected revenues in the current budget year has opened an operating shortfall of approximately $1.75 billion. The executive budget plan for Fiscal 2015-2016 is a bold one that proposes to raise approximately $4 billion in new revenue from increases in the personal income tax rate and in the sales and use tax. However, prior attempts to increase these taxes in 2008 and 2009 both failed to pass in the legislature. The governor’s budget plan also includes the issuance of $3 billion of pension obligation bonds to help alleviate the budgetary pressures for the commonwealth from the growing pension contributions. Currently, Pennsylvania’s unfunded pension liability is estimated at $53 billion, split between the State Employees Retirement System and the Public School Employees Retirement System. As of April 2015, Pennsylvania’s GO debt was rated Aa3 by Moody’s and AA- by S&P and Fitch. All three rating agencies had downgraded Pennsylvania GOs by one notch in 2014. For the twelve months ended April 2015, $16.3 billion in new municipal bonds were issued in the commonwealth, an increase of 82% from the previous twelve months.
What key strategies were used to manage these Funds during the twelve-month reporting period ended April 30, 2015?
A backdrop of supportive technical and fundamental factors helped sustain the municipal market’s rally during this reporting period. In the first nine months of the reporting period, yields fell sharply, particularly in the intermediate to longer maturity ranges, then plodded slightly upward in the subsequent three months. The overall decline in interest rates helped sustain a general rise in municipal bond prices for the reporting period as a whole. In general, Pennsylvania municipal paper outperformed the national market, while municipal bonds issued in New Jersey tended to lag the overall municipal market return for the reporting period. During this time, we continued to take a bottom-up approach to discovering sectors that appeared undervalued as well as individual credits that we believed had the potential to perform well over the long term.
While municipal supply nationally, as well as in New Jersey and Pennsylvania, improved during this twelve-month reporting period over that of the previous twelve months, much of this increase was attributable to refunding activity as bond issuers, prompted by low interest rates, sought to lower debt service costs by retiring older bonds from the proceeds of lower cost new bond issues. While some of this activity continued to be current refundings (in which the refunded bond matures or is redeemed within 90 days and therefore has no net effect on supply), we began to see an uptick in advance refundings (in which the refunded bond remains outstanding up to several more years). The increase in advance refundings contributed to greater supply in the marketplace, broadly speaking.
Much of our investment activity focus was on reinvesting the cash generated by current calls into bonds with intermediate and longer maturities that could help us offset the decline in rates and maintain investment performance potential. We also boosted the Funds’ exposure to credits with lower investment grade ratings, primarily A rated bonds. These Funds were well positioned coming into the reporting period, so we could be selective in looking for opportunities to purchase bonds that added value and continued to help us achieve our goals for the Funds.
During this reporting period, the New Jersey Funds found value in diversified areas of the marketplace, including transportation and health care. Additions in the transportation sector included tollroad bonds issued for bridges that connect New Jersey with both Delaware and Pennsylvania. The projects are managed by bi-state agencies, the Delaware River Port Authority and the Delaware River Joint Toll Bridge (New Jersey and Pennsylvania) and the Delaware River and Bay Authority (New Jersey and Delaware) and the bonds they issue are tax-exempt in both of their respective states. The two New Jersey Funds also bought New Jersey Transit Authority bonds for the state’s mass transit system. In health care, we added to the Funds’ positions in A rated bonds issued for Robert Wood Johnson University Hospital, one of the premier hospitals in the state.
Given the State of New Jersey’s ongoing fiscal challenges, we continued to limit exposure to state-supported obligations. We did buy a Jersey City University credit, which is partly subsidized by the state, but has less exposure to state government risk because it also receives tuition revenues. We also emphasized opportunities at the local (county and city/township) level, where many higher rated borrowers were issuing debt that we found attractive. Although the higher ratings of these local bonds offered lower yields, we believed the trade-off was worthwhile given the State’s recent credit downgrade (described in the performance section of this report), the relative underperformance of state-supported bonds and our goal to keep the Funds fully invested.
Buying activity in the Pennsylvania Funds was most active in the health care, tax obligation and higher education categories. Similar to New Jersey, Pennsylvania’s fiscal situation is hampered by an aging population, a lagging jobs recovery and pension legacy issues, to name a few concerns. As such, we similarly sought to minimize exposure to its state government-backed bonds.
Cash for purchases was generated primarily by proceeds from called and matured bonds, which we worked to redeploy to keep the Funds fully invested and support their income streams. As previously mentioned, call activity was elevated during the reporting period, providing ample cash and driving much of our trading. We sold some higher rated bonds to help preserve the Funds’ overweight allocations to lower rated segments, as well as decreased exposure to New Jersey State-backed bonds in NXJ and NJV.
As of April 30, 2015, all of these Funds continued to use inverse floating rate securities. We employ inverse floaters for a variety of reasons, including duration management, income enhancement and total return enhancement.
How did the Funds perform during the twelve-month reporting period ended April 30, 2015?
The tables in each Fund's Performance Overview and Holding Summaries section of this report provide the Funds’ total returns for the one-year, five-year, ten-year and since inception periods ended April 30, 2015. Each Fund’s total returns at common share net asset value (NAV) are compared with the performance of corresponding market indexes and Lipper classification averages.
For the twelve months ended April 30, 2015, the total returns at common share NAV for the Nuveen New Jersey and Pennsylvania Funds exceeded the returns for their respective state’s S&P Municipal Bond Index as well as the national S&P Municipal Bond Index. For the same period, the two New Jersey Funds lagged the average return for the Lipper New Jersey Municipal Debt Funds Classification Average, while NQP outperformed the Lipper Pennsylvania Municipal Debt Funds Classification Average and NPN underperformed this Lipper average.
Key management factors that influenced the Funds’ returns included duration and yield curve positioning, credit exposure and sector allocation. Keeping the Funds fully invested throughout the reporting period also was beneficial for performance. In addition, the use of regulatory leverage was an important positive factor affecting the performance of NXJ and NQP. One of the reasons that NJV and NPN trailed the other corresponding state Funds in this report for the twelve-month reporting period was that these two Funds do not use regulatory leverage. Leverage is discussed in more detail later in the Fund Leverage section of this report.
During this reporting period, municipal bonds with intermediate and longer maturities generally outperformed those with shorter maturities. In general, the Funds’ durations and yield curve positioning were positive for performance. Consistent with our long term strategy, these Funds tended to have longer durations than the municipal market in general, with overweightings in the longer parts of the yield curve that performed well and underweightings in the underperforming shorter end of the curve. This was especially true in NQP, which had the longest duration among the four Funds and its greater sensitivity to changes in interest rates benefited NQP’s performance. Overall, duration and yield curve positioning was the major driver of performance and differences in positioning accounted for much of the differences in performance.
During this reporting period, lower rated bonds generally outperformed higher quality bonds, as the municipal market rally continued and investors became more willing to accept risk. These Funds tended to have overweights in A rated and BBB rated bonds and underweights in the AAA rated and AA rated categories relative to their benchmark and credit exposure was generally
Portfolio Manager’s Comments (continued)
positive for their performance. As with duration, differences in credit allocation accounted for some of the differences in performance. NXJ, for example, had the highest allocation to bonds rated AAA and AA, which slightly hampered its performance.
Among the municipal market sectors, tobacco, health care (especially hospitals), industrial development revenue (IDR) and transportation (especially toll roads) were some of the top-performing groups during this reporting period. Tobacco bonds performed well due to their lower credit quality and the broader demand for higher yields. Health care, IDR and transportation bonds also benefited from investor demand for lower rated credits, as well as generally improving credit fundamentals across these sectors. NXJ and NJV maintained overweight allocations in the health care sector, which was advantageous to performance. Not only does the sector include many A rated credits, it also benefited from a rising trend of hospital consolidations in New Jersey. The two Funds’ allocations to New Jersey-issued tobacco bonds, transportation and utilities also delivered positive performance during this reporting period. NQP and NPN were most helped by their allocations to the health care, higher education, tax obligation (both general and limited) and transportation sectors.
The poorest performing market segment for the reporting period was pre-refunded bonds, which are often backed by U.S. Treasury securities. The underperformance of these bonds relative to the market can be attributed primarily to their shorter effective maturities and higher credit quality. All of these Funds had allocations of pre-refunded bonds, with NXJ having the heaviest weighting. General obligation (GO) credits also generally trailed the revenue sectors as well as the municipal market as a whole, although by a much narrower margin than pre-refunded bonds. This included New Jersey state GOs, which underperformed as the market penalized these bonds for credit downgrades by all three major rating agencies in 2014. In April 2014, S&P reduced the state’s GO rating to A+ from AA-, followed by another reduction to A in September, with the agency citing New Jersey’s sizeable structural imbalance and deferred pension payments leading to future budgetary pressures. Fitch also announced downgrades on New Jersey GOs to A+ from AA- in May 2014 and then to A in September 2014, echoing S&P’s assessment of the state's growing pension and retiree health care liabilities as well as its high levels of debt and overly optimistic revenue estimates that could add to future budget problems. In April 2015, Moody’s downgraded New Jersey to A2 from Aa3. As of April 2015, New Jersey state GO debt ratings were A2/A/A by Moody’s S&P and Fitch (with negative outlooks by Moody’s and Fitch) and New Jersey appropriation-backed debt was rated A3/A-/A- by Moody’s, S&P and Fitch, respectively, also with negative outlooks by Moody’s and Fitch. Pennsylvania, which faces some of the same budgetary and pension issues as New Jersey although to a lesser degree, also saw the ratings on its GO debt lowered in 2014, from Aa2/AA/AA to Aa3/AA-/AA- as of October 2014.
As noted in the previous Shareholder Fund Report, we continue to monitor the ongoing economic problems of Puerto Rico for any impact on the Funds’ holdings and performance. Shareholders should note that the exposure of NXJ, NJV, NQP and NPN to Puerto Rico debt during this reporting period was 0.86%, 0.33%, 0.75% and 0.30%, respectively. The Puerto Rico credits, many of them insured or pre-refunded, offered higher yields, added diversification and triple exemption (i.e., exemption from most federal, state and local taxes). However, Puerto Rico’s continued economic weakening, escalating debt service obligations, and long-standing inability to deliver a balanced budget led to multiple downgrades on its debt over the past two years. Puerto Rico general obligation debt is rated Caa2/CCC+/B (below investment grade) by Moody’s, S&P and Fitch, respectively, with negative outlooks.
On February 6, 2015, a federal court found Puerto Rico’s Recovery Act to be unconstitutional. Though the Commonwealth is pursuing an appeal of the ruling, the outcome is uncertain. Puerto Rico’s non-voting Representative in Congress recently introduced legislation that would make chapter 9 bankruptcy available to the Commonwealth’s public corporations. A congressional committee hearing was held on February 26, 2015, but the bill has not advanced out of committee.
In light of the evolving economic situation in Puerto Rico, Nuveen’s credit analysis of the Commonwealth had previously considered the possibility of a default and restructuring of public corporations and we adjusted our portfolios to prepare for such an outcome, although no such default or restructuring has occurred to date. The Nuveen complex’s entire exposure to obligations of the government of Puerto Rico and other Puerto Rico issuers totaled 0.33% of assets under management as of April 30, 2015. As of April 30, 2015, the Funds’ limited exposure to Puerto Rico generally was invested in bonds that were insured, pre-refunded (and therefore backed by securities such as U.S. Treasuries), or tobacco settlement bonds. Overall, the small size of our exposures meant that our Puerto Rico holdings had a negligible impact on performance.
Fund Leverage
IMPACT OF THE FUNDS’ LEVERAGE STRATEGIES ON PERFORMANCE
One important factor impacting the returns of the Funds relative to their comparative benchmarks was the Funds’ use of leverage through their issuance of preferred shares and/or investments in inverse floating rate securities, which represent leveraged investments in underlying bonds. As mentioned previously, NJV and NPN do not use regulatory leverage. The Funds use leverage because our research has shown that, over time, leveraging provides opportunities for additional income, particularly in the recent market environment where short-term market rates are at or near historical lows, meaning that the short-term rates the Fund has been paying on its leveraging instruments have been much lower than the interest the Fund has been earning on its portfolio of long-term bonds that it has bought with the proceeds of that leverage. However, use of leverage also can expose the Fund to additional price volatility. When a Fund uses leverage, the Fund will experience a greater increase in its net asset value if the municipal bonds acquired through the use of leverage increase in value, but it will also experience a correspondingly larger decline in its net asset value if the bonds acquired through leverage decline in value, which will make the Fund’s net asset value more volatile, and its total return performance more variable over time. In addition, income in levered funds will typically decrease in comparison to unlevered funds when short-term interest rates increase and increase when short-term interest rates decrease. Leverage made a positive contribution to the performance of these Funds over this reporting period.
As of April 30, 2015, the Funds’ percentages of leverage are as shown in the accompanying table.
| | NXJ | NJV | NQP | NPN | |
| Effective Leverage* | 38.62% | 9.03% | 37.06% | 2.64% | |
| Regulatory Leverage* | 31.95% | N/A | 30.94% | N/A | |
| * | Effective Leverage is a Fund’s effective economic leverage, and includes both regulatory leverage and the leverage effects of certain derivative and other investments in a Fund’s portfolio that increase the Fund’s investment exposure. Currently, the leverage effects of Tender Option Bond (TOB) inverse floater holdings are included in effective leverage values, in addition to any regulatory leverage. Regulatory leverage consists of preferred shares issued or borrowings of a Fund. Both of these are part of a Fund’s capital structure. Regulatory leverage is subject to asset coverage limits set forth in the Investment Company Act of 1940. |
| | |
| N/A | The Fund does not use Regulatory leverage. |
Fund Leverage (continued)
THE FUNDS’ REGULATORY LEVERAGE
As of April 30, 2015, the Funds have issued and outstanding, Variable Rate MuniFund Term Preferred (VMTP) Shares and Variable Rate Demand Preferred (VRDP) Shares as shown in the accompanying table. As mentioned previously, NJV and NPN do not use regulatory leverage.
| | | VMTP Shares | | | VRDP Shares | | | | |
| | | | | | Shares | | | | | | Shares | | | | |
| | | | | | Issued at | | | | | | Issued at | | | | |
| | | | | | Liquidation | | | | | | Liquidation | | | | |
| | | Series | | | Value | | | Series | | | Value | | | Total | |
| NXJ | | | — | | | | — | | | | 1 | | | $ | 81,000,000 | | | | |
| | | | — | | | | — | | | | 2 | * | | $ | 144,300,000 | | | | |
| | | | — | | | | — | | | | 3 | * | | $ | 88,600,000 | | | | |
| | | | | | | | | | | | | | | $ | 313,900,000 | | | $ | 313,900,000 | |
| NQP | | | 2017 | | | $ | 48,000,000 | | | | 2 | | | $ | 112,500,000 | | | | | |
| | | | — | | | | — | | | | 3 | | | $ | 105,000,000 | | | | | |
| | | | | | | $ | 48,000,000 | | | | | | | $ | 217,500,000 | | | $ | 265,500,000 | |
* VRDP Shares issued in connection with the reorganization.
During the current reporting period, NXJ and NQP refinanced all of their outstanding MTP Shares with the proceeds from newly issued VRDP and VMTP Shares, respectively.
Refer to Notes to Financial Statements, Note – 4 Fund Shares, Preferred Shares for further details on VMTP and VRDP Shares and each Fund’s respective transactions.
Common Share Information
COMMON SHARE DISTRIBUTION INFORMATION
The following information regarding the Funds’ distributions is current as of April 30, 2015. Each Fund’s distribution levels may vary over time based on each Fund’s investment activity and portfolio investments value changes.
During the current reporting period, each Fund’s distributions to common shareholders were as shown in the accompanying table.
| | | Per Common Share Amounts | |
| Ex-Dividend Date | | NXJ | | | NJV | | | NQP | | | NPN | |
| May 2014 | | $ | 0.0605 | | | $ | 0.0520 | | | $ | 0.0730 | | | $ | 0.0530 | |
| June | | | 0.0605 | | | | 0.0520 | | | | 0.0730 | | | | 0.0530 | |
| July | | | 0.0625 | | | | 0.0520 | | | | 0.0730 | | | | 0.0530 | |
| August | | | 0.0625 | | | | 0.0520 | | | | 0.0730 | | | | 0.0530 | |
| September | | | 0.0625 | | | | 0.0500 | | | | 0.0690 | | | | 0.0530 | |
| October | | | 0.0625 | | | | 0.0500 | | | | 0.0690 | | | | 0.0530 | |
| November | | | 0.0625 | | | | 0.0500 | | | | 0.0690 | | | | 0.0530 | |
| December | | | 0.0680 | | | | 0.0500 | | | | 0.0690 | | | | 0.0520 | |
| January | | | 0.0680 | | | | 0.0500 | | | | 0.0690 | | | | 0.0520 | |
| February | | | 0.0680 | | | | 0.0500 | | | | 0.0690 | | | | 0.0520 | |
| March | | | 0.0680 | | | | 0.0500 | | | | 0.0690 | | | | 0.0520 | |
| April 2015 | | | 0.0680 | | | | 0.0500 | | | | 0.0690 | | | | 0.0520 | |
| | | | | | | | | | | | | | | | | |
| Long-Term Capital Gain* | | $ | — | | | $ | 0.1784 | | | $ | — | | | $ | — | |
| Ordinary Income Distribution* | | $ | 0.0002 | | | $ | 0.0226 | | | $ | 0.0002 | | | $ | — | |
| | | | | | | | | | | | | | | | | |
| Market Yield** | | | 6.01 | % | | | 4.07 | % | | | 5.97 | % | | | 4.01 | % |
| Taxable-Equivalent Yield** | | | 8.92 | % | | | 6.04 | % | | | 8.55 | % | | | 5.74 | % |
| ** | Market Yield is based on the Fund’s current annualized monthly dividend divided by the Fund’s current market price as of the end of the reporting period. Taxable-Equivalent Yield represents the yield that must be earned on a fully taxable investment in order to equal the yield of the Fund on an after-tax basis. It is based on a combined federal and state income tax rate of 32.6% and 30.2% for New Jersey and Pennsylvania, respectively. When comparing a Fund to investments that generate qualified dividend income, the Taxable-Equivalent Yield is lower. |
Each Fund in this report seeks to pay regular monthly dividends out of its net investment income at a rate that reflects its past and projected net income performance. To permit each Fund to maintain a more stable monthly dividend, the Fund may pay dividends at a rate that may be more or less than the amount of net income actually earned by the Fund during the period. If a Fund has cumulatively earned more than it has paid in dividends, it will hold the excess in reserve as undistributed net investment income (UNII) as part of the Fund’s net asset value. Conversely, if a Fund has cumulatively paid in dividends more than it has earned, the excess will constitute a negative UNII that will likewise be reflected in the Fund’s net asset value. Each Fund will, over time, pay all its net investment income as dividends to shareholders.
As of April 30, 2015, the Funds had positive UNII balances for tax purposes and positive UNII balances for financial reporting purposes.
Common Share Information (continued)
All monthly dividends paid by the Funds during the current reporting period, were paid from net investment income. If a portion of the Fund’s monthly distributions was sourced from or comprised of elements other than net investment income, including capital gains and/or a return of capital, shareholders would have received a notice to that effect. For financial reporting purposes, the composition and per share amounts of each Fund’s dividends for the reporting period are presented in this report’s Statement of Changes in Net Assets and Financial Highlights, respectively. For income tax purposes, distribution information for each Fund as of its most recent tax year end is presented in Note 6 — Income Tax Information within the Notes to Financial Statements of this report.
COMMON SHARE REPURCHASES
During August 2014, the Funds’ Board of Trustees reauthorized an open-market share repurchase program, allowing each Fund to repurchase an aggregate of up to approximately 10% of its outstanding shares.
As of April 30, 2015, and since the inception of the Funds’ repurchase programs, the Funds have cumulatively repurchased and retired their outstanding common shares as shown in the accompanying table.
| | NXJ | NJV | NQP | NPN | |
| Common Shares Cumulatively Repurchased and Retired | 135,000 | 15,000 | 242,400 | 0 | |
| Common Shares Authorized for Repurchase | 655,000 | 155,000 | 3,790,000 | 120,000 | |
During the current reporting period, the Funds repurchased and retired their common shares at a weighted average price per common share and a weighted average discount per common share as shown in the accompanying table.
| | | NXJ | | | NJV | | | NQP | |
| Common Shares Repurchased and Retired | | | 112,500 | | | | 15,000 | | | | 4,500 | |
| Weighted Average Price per Common Share Repurchased and Retired | | $ | 13.47 | | | $ | 14.19 | | | $ | 13.68 | |
| Weighted Average Discount per Common Share Repurchased and Retired | | | 13.85 | % | | | 14.25 | % | | | 13.83 | % |
OTHER COMMON SHARE INFORMATION
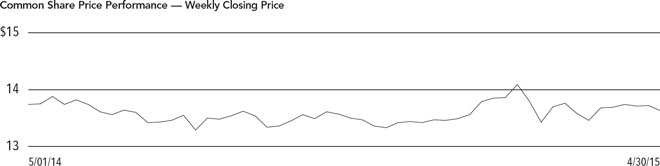
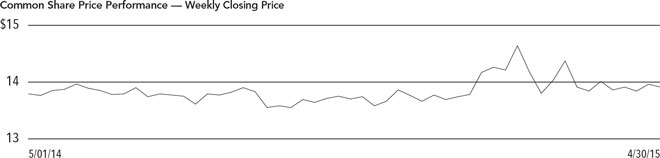
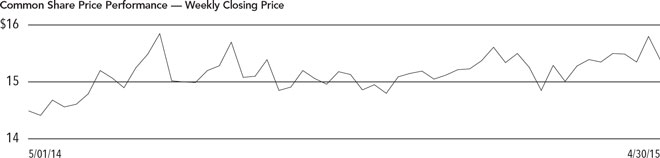
As of April 30, 2015, and during the current reporting period, the Funds’ common share prices were trading at a premium/(discount) to their common share NAVs as shown in the accompanying table.
| | | NXJ | | | NJV | | | NQP | | | NPN | |
| Common Share NAV | | $ | 15.53 | | | $ | 16.41 | | | $ | 15.64 | | | $ | 16.36 | |
| Common Share Price | | $ | 13.58 | | | $ | 14.75 | | | $ | 13.87 | | | $ | 15.57 | |
| Premium/(Discount) to NAV | | | (12.56 | )% | | | (10.12 | )% | | | (11.32 | )% | | | (4.83 | )% |
| 12-Month Average Premium/(Discount) to NAV | | | (13.14 | )% | | | (11.50 | )% | | | (11.42 | )% | | | (6.98 | )% |
Risk Considerations
Fund shares are not guaranteed or endorsed by any bank or other insured depository institution, and are not federally insured by the Federal Deposit Insurance Corporation. Past performance is no guarantee of future results. Fund common shares are subject to a variety of risks, including:
Investment, Price and Market Risk. An investment in common shares is subject to investment risk, including the possible loss of the entire principal amount that you invest. Your investment in common shares represents an indirect investment in the municipal securities owned by the Funds, which generally trade in the over-the-counter markets. Shares of closed-end investment companies like these Funds frequently trade at a discount to their net asset value (NAV). Your common shares at any point in time may be worth less than your original investment, even after taking into account the reinvestment of Fund dividends and distributions.
Tax Risk. The tax treatment of Fund distributions may be affected by new IRS interpretations of the Internal Revenue Code and future changes in tax laws and regulations.
Leverage Risk. Each Fund’s use of leverage creates the possibility of higher volatility for the Fund’s per share NAV, market price, distributions and returns. There is no assurance that a Fund’s leveraging strategy will be successful. Certain aspects of the recently adopted Volcker Rule may limit the availability of tender option bonds, which are used by the Funds for leveraging and duration management purposes. The effects of this new Rule, expected to take effect in mid-2015, may make it more difficult for a Fund to maintain current or desired levels of leverage and may cause the Fund to incur additional expenses to maintain its leverage.
Inverse Floater Risk. The Funds invest in inverse floaters. Due to their leveraged nature, these investments can greatly increase a Fund’s exposure to interest rate risk and credit risk. In addition, investments in inverse floaters involve the risk that the Fund could lose more than its original principal investment.
Issuer Credit Risk. This is the risk that a security in a Fund’s portfolio will fail to make dividend or interest payments when due.
Interest Rate Risk. Fixed-income securities such as bonds, preferred, convertible and other debt securities will decline in value if market interest rates rise.
Reinvestment Risk. If market interest rates decline, income earned from a Fund’s portfolio may be reinvested at rates below that of the original bond that generated the income.
Call Risk or Prepayment Risk. Issuers may exercise their option to prepay principal earlier than scheduled, forcing a Fund to reinvest in lower-yielding securities.
Derivatives Risk. The Funds may use derivative instruments which involve a high degree of financial risk, including the risk that the loss on a derivative may be greater than the principal amount investment.
Municipal Bond Market Liquidity Risk. Inventories of municipal bonds held by brokers and dealers have decreased in recent years, lessening their ability to make a market in these securities. This reduction in market making capacity has the potential to decrease a Fund’s ability to buy or sell bonds, and increase bond price volatility and trading costs, particularly during periods of economic or market stress. In addition, recent federal banking regulations may cause certain dealers to reduce their inventories of municipal bonds, which may further decrease a Fund’s ability to buy or sell bonds. As a result, the Fund may be forced to accept a lower price to sell a security, to sell other securities to raise cash, or to give up an investment opportunity, any of which could have a negative effect on performance. If the Fund needed to sell large blocks of bonds, those sales could further reduce the bonds’ prices and hurt performance.
| NXJ | |
| | Nuveen New Jersey Dividend Advantage Municipal Fund |
| | Performance Overview and Holding Summaries as of April 30, 2015 |
Refer to the Glossary of Terms Used in this Report for further definition of the terms used within this section.
Average Annual Total Returns as of April 30, 2015
| | | Average Annual |
| | | 1-Year | 5-Year | 10-Year |
| NXJ at Common Share NAV | | 6.77% | 6.76% | 5.54% |
| NXJ at Common Share Price | | 5.35% | 5.92% | 4.86% |
| S&P Municipal Bond New Jersey Index | | 3.31% | 4.89% | 4.74% |
| S&P Municipal Bond Index | | 4.86% | 4.92% | 4.63% |
| Lipper New Jersey Municipal Debt Funds Classification Average | | 7.64% | 7.12% | 5.78% |
Past performance is not predictive of future results. Current performance may be higher or lower than the data shown. Returns do not reflect the deduction of taxes that shareholders may have to pay on Fund distributions or upon the sale of Fund shares. Returns at NAV are net of Fund expenses, and assume reinvestment of distributions. Comparative index and Lipper return information is provided for the Fund’s shares at NAV only. Indexes and Lipper averages are not available for direct investment.
This data relates to the securities held in the Fund’s portfolio of investments as of the end of the reporting period. It should not be construed as a measure of performance for the Fund itself. Holdings are subject to change.
Ratings shown are the highest rating given by one of the following national rating agencies: Standard & Poor’s Group, Moody’s Investors Service, Inc. or Fitch, Inc. Credit ratings are subject to change. AAA, AA, A and BBB are investment grade ratings; BB, B, CCC, CC, C and D are below-investment grade ratings. Certain bonds backed by U.S. Government or agency securities are regarded as having an implied rating equal to the rating of such securities. Holdings designated N/R are not rated by these national rating agencies.
| Fund Allocation | |
| (% of net assets) | |
| Long-Term Municipal Bonds | 144.7% |
| Common Stocks | 0.3% |
| Other Assets Less Liabilities | 1.9% |
| Net Assets Plus VRDP Shares, | |
| at Liquidation Value | 146.9% |
| VRDP Shares, at | |
| Liquidation Value | (46.9)% |
| Net Assets | 100% |
| Portfolio Composition | |
| (% of total investments) | |
| Tax Obligation/Limited | 23.1% |
| Transportation | 18.7% |
| Health Care | 15.0% |
| Education and Civic Organizations | 10.8% |
| U.S. Guaranteed | 10.7% |
| Tax Obligation/General | 4.4% |
| Water and Sewer | 4.3% |
| Other | 13.0% |
| Total | 100% |
| Credit Quality | |
| (% of total investment exposure) | |
| AAA/U.S. Guaranteed | 15.8% |
| AA | 39.7% |
| A | 28.7% |
| BBB | 9.1% |
| BB or Lower | 5.7% |
| N/R (not rated) | 0.8% |
| N/A (not applicable) | 0.2% |
| Total | 100% |
| NJV | |
| | Nuveen New Jersey Municipal Value Fund |
| | Performance Overview and Holding Summaries as of April 30, 2015 |
Refer to the Glossary of Terms Used in this Report for further definition of the terms used within this section.
Average Annual Total Returns as of April 30, 2015
| | | Average Annual |
| | | 1-Year | 5-Year | Since Inception |
| NJV at Common Share NAV | | 6.68% | 5.97% | 7.53% |
| NJV at Common Share Price | | 7.62% | 4.94% | 5.16% |
| S&P Municipal Bond New Jersey Index | | 3.31% | 4.89% | 5.68% |
| S&P Municipal Bond Index | | 4.86% | 4.92% | 5.71% |
| Lipper New Jersey Municipal Debt Funds Classification Average | | 7.64% | 7.12% | 6.62% |
Since inception returns are from April 28, 2009. Past performance is not predictive of future results. Current performance may be higher or lower than the data shown. Returns do not reflect the deduction of taxes that shareholders may have to pay on Fund distributions or upon the sale of Fund shares. Returns at NAV are net of Fund expenses, and assume reinvestment of distributions. Comparative index and Lipper return information is provided for the Fund’s shares at NAV only. Indexes and Lipper averages are not available for direct investment.
This data relates to the securities held in the Fund’s portfolio of investments as of the end of the reporting period. It should not be construed as a measure of performance for the Fund itself. Holdings are subject to change.
Ratings shown are the highest rating given by one of the following national rating agencies: Standard & Poor’s Group, Moody’s Investors Service, Inc. or Fitch, Inc. Credit ratings are subject to change. AAA, AA, A and BBB are investment grade ratings; BB, B, CCC, CC, C and D are below-investment grade ratings. Certain bonds backed by U.S. Government or agency securities are regarded as having an implied rating equal to the rating of such securities. Holdings designated N/R are not rated by these national rating agencies.
| Fund Allocation | |
| (% of net assets) | |
| Long-Term Municipal Bonds | 101.0% |
| Common Stocks | 2.8% |
| Other Assets Less Liabilities | 2.1% |
Net Assets Plus Floating Rate Obligations | 105.9% |
| Floating Rate Obligations | (5.9)% |
| Net Assets | 100% |
| Portfolio Composition | |
| (% of total investments) | |
| Tax Obligation/Limited | 28.6% |
| Health Care | 18.5% |
| Education and Civic Organizations | 12.1% |
| Transportation | 10.4% |
| Tax Obligation/General | 9.3% |
| Housing/Multifamily | 6.2% |
| U.S. Guaranteed | 5.3% |
| Other | 9.6% |
| Total | 100% |
| Credit Quality | |
| (% of total investment exposure) | |
| AAA | 6.4% |
| AA | 34.1% |
| A | 33.1% |
| BBB | 18.2% |
| BB or Lower | 3.6% |
| N/R (not rated) | 2.0% |
| N/A (not applicable) | 2.6% |
| Total | 100% |
| NQP | |
| | Nuveen Pennsylvania Investment Quality Municipal Fund |
| | Performance Overview and Holding Summaries as of April 30, 2015 |
Refer to the Glossary of Terms Used in this Report for further definition of the terms used within this section.
Average Annual Total Returns as of April 30, 2015
| | | Average Annual |
| | | 1-Year | 5-Year | 10-Year |
| NQP at Common Share NAV | | 8.79% | 7.13% | 5.61% |
| NQP at Common Share Price | | 7.09% | 6.77% | 5.56% |
| S&P Municipal Bond Pennsylvania Index | | 5.43% | 5.10% | 4.77% |
| S&P Municipal Bond Index | | 4.86% | 4.92% | 4.63% |
| Lipper Pennsylvania Municipal Debt Funds Classification Average | | 8.33% | 6.98% | 5.34% |
Past performance is not predictive of future results. Current performance may be higher or lower than the data shown. Returns do not reflect the deduction of taxes that shareholders may have to pay on Fund distributions or upon the sale of Fund shares. Returns at NAV are net of Fund expenses, and assume reinvestment of distributions. Comparative index and Lipper return information is provided for the Fund’s shares at NAV only. Indexes and Lipper averages are not available for direct investment.
This data relates to the securities held in the Fund’s portfolio of investments as of the end of the reporting period. It should not be construed as a measure of performance for the Fund itself. Holdings are subject to change.
Ratings shown are the highest rating given by one of the following national rating agencies: Standard & Poor’s Group, Moody’s Investors Service, Inc. or Fitch, Inc. Credit ratings are subject to change. AAA, AA, A and BBB are investment grade ratings; BB, B, CCC, CC, C and D are below-investment grade ratings. Certain bonds backed by U.S. Government or agency securities are regarded as having an implied rating equal to the rating of such securities. Holdings designated N/R are not rated by these national rating agencies.
| Fund Allocation | |
| (% of net assets) | |
| Long-Term Municipal Bonds | 147.7% |
| Other Assets Less Liabilities | 2.0% |
Net Assets Plus Floating Rate Obligations, VMTP Shares, at Liquidation Value & VRDP Shares, at Liquidation Value | 149.7% |
| Floating Rate Obligations | (4.9)% |
| VMTP Shares, at Liquidation Value | (8.1)% |
| VRDP Shares, at Liquidation Value | (36.7)% |
| Net Assets | 100% |
| Portfolio Composition | |
| (% of total investments) | |
| Health Care | 20.6% |
| Tax Obligation/General | 19.0% |
| Education and Civic Organizations | 15.6% |
| Transportation | 7.7% |
| Tax Obligation/Limited | 7.5% |
| U.S. Guaranteed | 7.2% |
| Water and Sewer | 6.5% |
| Utilities | 4.5% |
| Other | 11.4% |
| Total | 100% |
| Credit Quality | |
| (% of total investment exposure) | |
| AAA/U.S. Guaranteed | 7.4% |
| AA | 48.6% |
| A | 26.9% |
| BBB | 10.8% |
| BB or Lower | 3.7% |
| N/R (not rated) | 2.6% |
| Total | 100% |
| NPN | |
| | Nuveen Pennsylvania Municipal Value Fund |
| | Performance Overview and Holding Summaries as of April 30, 2015 |
Refer to the Glossary of Terms Used in this Report for further definition of the terms used within this section.
Average Annual Total Returns as of April 30, 2015
| | | Average Annual |
| | | 1-Year | 5-Year | Since Inception |
| NPN at Common Share NAV | | 6.87% | 6.00% | 7.15% |
| NPN at Common Share Price | | 12.30% | 5.27% | 5.70% |
| S&P Municipal Bond Pennsylvania Index | | 5.43% | 5.10% | 5.75% |
| S&P Municipal Bond Index | | 4.86% | 4.92% | 5.71% |
| Lipper Pennsylvania Municipal Debt Funds Classification Average | | 8.33% | 6.98% | 6.36% |
Since inception returns are from April 28, 2009. Past performance is not predictive of future results. Current performance may be higher or lower than the data shown. Returns do not reflect the deduction of taxes that shareholders may have to pay on Fund distributions or upon the sale of Fund shares. Returns at NAV are net of Fund expenses, and assume reinvestment of distributions. Comparative index and Lipper return information is provided for the Fund’s shares at NAV only. Indexes and Lipper averages are not available for direct investment.
This data relates to the securities held in the Fund’s portfolio of investments as of the end of the reporting period. It should not be construed as a measure of performance for the Fund itself. Holdings are subject to change.
Ratings shown are the highest rating given by one of the following national rating agencies: Standard & Poor’s Group, Moody’s Investors Service, Inc. or Fitch, Inc. Credit ratings are subject to change. AAA, AA, A and BBB are investment grade ratings; BB, B, CCC, CC, C and D are below-investment grade ratings. Certain bonds backed by U.S. Government or agency securities are regarded as having an implied rating equal to the rating of such securities. Holdings designated N/R are not rated by these national rating agencies.
| Fund Allocation | |
| (% of net assets) | |
| Long-Term Municipal Bonds | 98.9% |
| Other Assets Less Liabilities | 1.1% |
| Net Assets | 100% |
| Portfolio Composition | |
| (% of total investments) | |
| Health Care | 23.4% |
| Education and Civic Organizations | 14.5% |
| Tax Obligation/Limited | 13.1% |
| Water and Sewer | 9.7% |
| Tax Obligation/General | 9.6% |
| U.S. Guaranteed | 5.8% |
| Housing/Multifamily | 5.3% |
| Long-Term Care | 4.7% |
| Other | 13.9% |
| Total | 100% |
| Credit Quality | |
| (% of total investment exposure) | |
| AAA/U.S. Guaranteed | 5.6% |
| AA | 48.1% |
| A | 26.5% |
| BBB | 17.0% |
| BB or Lower | 1.3% |
| N/R (not rated) | 1.5% |
| Total | 100% |
Report of Independent Registered Public Accounting Firm
The Board of Trustees and Shareholders of
Nuveen New Jersey Dividend Advantage Municipal Fund
Nuveen New Jersey Municipal Value Fund
Nuveen Pennsylvania Investment Quality Municipal Fund
Nuveen Pennsylvania Municipal Value Fund:
We have audited the accompanying statements of assets and liabilities, including the portfolios of investments, of Nuveen New Jersey Dividend Advantage Municipal Fund, Nuveen New Jersey Municipal Value Fund, Nuveen Pennsylvania Investment Quality Municipal Fund and Nuveen Pennsylvania Municipal Value Fund (the “Funds”) as of April 30, 2015, and the related statements of operations, changes in net assets and cash flows (Nuveen New Jersey Dividend Advantage Municipal Fund and Nuveen Pennsylvania Investment Quality Municipal Fund) and the financial highlights for the year then ended. These financial statements and financial highlights are the responsibility of the Funds’ management. Our responsibility is to express an opinion on these financial statements and financial highlights based on our audits. The statements of changes in net assets and the financial highlights for the periods presented through April 30, 2014, were audited by other auditors whose report dated June 25, 2014, expressed an unqualified opinion on those statements and those financial highlights.
We conducted our audits in accordance with the standards of the Public Company Accounting Oversight Board (United States). Those standards require that we plan and perform the audits to obtain reasonable assurance about whether the financial statements and financial highlights are free of material misstatement. An audit includes examining, on a test basis, evidence supporting the amounts and disclosures in the financial statements. Our procedures included confirmation of securities owned as of April 30, 2015, by correspondence with the custodian and brokers or other appropriate auditing procedures. An audit also includes assessing the accounting principles used and significant estimates made by management, as well as evaluating the overall financial statement presentation. We believe that our audits provide a reasonable basis for our opinion.
In our opinion, the financial statements and financial highlights referred to above present fairly, in all material respects, the financial position of the Funds as of April 30, 2015, the results of their operations, the changes in their net assets, their cash flows (Nuveen New Jersey Dividend Advantage Municipal Fund and Nuveen Pennsylvania Investment Quality Municipal Fund) and the financial highlights for the year then ended, in conformity with U.S. generally accepted accounting principles.
/s/ KPMG LLP
Chicago, Illinois
June 25, 2015
| NXJ | |
| | Nuveen New Jersey Dividend Advantage Municipal Fund |
| | Portfolio of Investments | April 30, 2015 |
| | Principal | | | | Optional Call | | | | | |
| | Amount (000) | | Description (1) | | Provisions (2) | | Ratings (3) | | Value | |
| | | | LONG-TERM INVESTMENTS – 145.0% (100.0% of Total Investments) | | | | | | | |
| | | | MUNICIPAL BONDS – 144.7% (99.8% of Total Investments) | | | | | | | |
| | | | Consumer Discretionary – 0.4% (0.3% of Total Investments) | | | | | | | |
| | | | Middlesex County Improvement Authority, New Jersey, Senior Revenue Bonds, Heldrich Center Hotel/Conference Center Project, Series 2005A: | | | | | | | |
| $ | 1,720 | | 5.000%, 1/01/32 | | 7/15 at 100.00 | | Caa1 | $ | 1,307,114 | |
| | 1,485 | | 5.125%, 1/01/37 | | 7/15 at 100.00 | | Caa1 | | 1,130,174 | |
| | 3,205 | | Total Consumer Discretionary | | | | | | 2,437,288 | |
| | | | Consumer Staples – 4.9% (3.3% of Total Investments) | | | | | | | |
| | | | Tobacco Settlement Financing Corporation, New Jersey, Tobacco Settlement Asset-Backed Bonds, Series 2007-1A: | | | | | | | |
| | 3,620 | | 4.500%, 6/01/23 | | 6/17 at 100.00 | | BB | | 3,627,023 | |
| | 32,225 | | 4.750%, 6/01/34 | | 6/17 at 100.00 | | B2 | | 24,989,843 | |
| | 4,890 | | 5.000%, 6/01/41 | | 6/17 at 100.00 | | B2 | | 3,846,278 | |
| | 40,735 | | Total Consumer Staples | | | | | | 32,463,144 | |
| | | | Education and Civic Organizations – 15.7% (10.8% of Total Investments) | | | | | | | |
| | 1,760 | | Camden County Improvement Authority, New Jersey, Lease Revenue Bonds Rowan University School of Osteopathic Medicine Project, Series 2013A, 5.000%, 12/01/32 | | 12/23 at 100.00 | | A | | 1,968,120 | |
| | 730 | | Gloucester County Improvement Authority, New Jersey, Revenue Bonds, Rowan University Projects, Series 2015A, 3.375%, 7/01/36 – AGM Insured | | 7/25 at 100.00 | | AA | | 695,778 | |
| | 2,025 | | New Jersey Economic Development Authority, Revenue Bonds, The Seeing Eye Inc., Refunding Series 2015, 5.000%, 3/01/25 | | No Opt. Call | | A | | 2,459,444 | |
| | 2,125 | | New Jersey Economic Development Authority, Revenue Bonds, The Seeing Eye Inc., Series 2005, 5.000%, 12/01/24 – AMBAC Insured | | 6/15 at 100.00 | | N/R | | 2,133,033 | |
| | 2,455 | | New Jersey Economic Development Authority, Rutgers University General Obligation Lease Revenue Bonds, Tender Option Bond Trust 3359, 18.033%, 6/15/46 (IF) (4) | | 6/23 at 100.00 | | AA– | | 3,603,744 | |
| | | | New Jersey Education Facilities Authority Revenue Bonds, The College of New Jersey Issue, Series 2013A: | | | | | | | |
| | 2,475 | | 5.000%, 7/01/38 | | 7/23 at 100.00 | | AA | | 2,732,078 | |
| | 3,250 | | 5.000%, 7/01/43 | | 7/23 at 100.00 | | AA | | 3,586,343 | |
| | 250 | | New Jersey Educational Facilities Authority, Revenue Bonds, Georgian Court University, Series 2007D, 5.000%, 7/01/27 | | 7/17 at 100.00 | | Baa2 | | 265,450 | |
| | | | New Jersey Educational Facilities Authority, Revenue Bonds, Kean University, Series 2007D: | | | | | | | |
| | 7,310 | | 5.000%, 7/01/32 – FGIC Insured | | 7/17 at 100.00 | | AA– | | 7,842,607 | |
| | 6,875 | | 5.000%, 7/01/39 – FGIC Insured | | 7/17 at 100.00 | | AA– | | 7,369,862 | |
| | 4,710 | | New Jersey Educational Facilities Authority, Revenue Bonds, Montclair State University, Series 2006A, 5.000%, 7/01/36 – AMBAC Insured | | 7/16 at 100.00 | | AA– | | 4,920,820 | |
| | 5,000 | | New Jersey Educational Facilities Authority, Revenue Bonds, Montclair State University, Series 2014A, 5.000%, 7/01/44 | | No Opt. Call | | AA– | | 5,625,450 | |
| | 5,955 | | New Jersey Educational Facilities Authority, Revenue Bonds, New Jersey City University, Series 2015A, 5.000%, 7/01/45 | | 7/25 at 100.00 | | AA | | 6,664,836 | |
| | | | New Jersey Educational Facilities Authority, Revenue Bonds, Passaic County Community College, Series 2010C: | | | | | | | |
| | 1,500 | | 5.250%, 7/01/32 | | 7/20 at 100.00 | | A2 | | 1,645,365 | |
| | 1,000 | | 5.375%, 7/01/41 | | 7/20 at 100.00 | | A2 | | 1,094,840 | |
| | 1,000 | | New Jersey Educational Facilities Authority, Revenue Bonds, Princeton University, Series 2007E, 5.000%, 7/01/33 | | No Opt. Call | | AAA | | 1,083,600 | |
| | 4,335 | | New Jersey Educational Facilities Authority, Revenue Bonds, Princeton University, Tender Option Bond Trust 2015-XF0099, 13.564%, 7/01/39 (IF) | | 7/21 at 100.00 | | AAA | | 5,999,640 | |
| NXJ | Nuveen New Jersey Dividend Advantage Municipal Fund |
| | Portfolio of Investments (continued) | April 30, 2015 |
| | Principal | | | | Optional Call | | | | | |
| | Amount (000) | | Description (1) | | Provisions (2) | | Ratings (3) | | Value | |
| | | | Education and Civic Organizations (continued) | | | | | | | |
| $ | 4,000 | | New Jersey Educational Facilities Authority, Revenue Bonds, Princeton University, Tender Option Bond Trust 4741, 13.836%, 7/01/44 (IF) (4) | | 7/24 at 100.00 | | AAA | $ | 5,900,560 | |
| | | | New Jersey Educational Facilities Authority, Revenue Bonds, Ramapo College, Series 2012B: | | | | | | | |
| | 550 | | 5.000%, 7/01/37 | | 7/22 at 100.00 | | A | | 601,518 | |
| | 1,050 | | 5.000%, 7/01/42 | | 7/22 at 100.00 | | A | | 1,147,660 | |
| | | | New Jersey Educational Facilities Authority, Revenue Bonds, Rider University, Series 2012A: | | | | | | | |
| | 1,120 | | 5.000%, 7/01/32 | | 7/21 at 100.00 | | BBB+ | | 1,202,152 | |
| | 740 | | 5.000%, 7/01/37 | | 7/21 at 100.00 | | BBB+ | | 791,326 | |
| | | | New Jersey Educational Facilities Authority, Revenue Bonds, Seton Hall University, Series 2013D: | | | | | | | |
| | 675 | | 5.000%, 7/01/38 | | 7/23 at 100.00 | | A | | 745,112 | |
| | 1,935 | | 5.000%, 7/01/43 | | 7/23 at 100.00 | | A | | 2,135,253 | |
| | | | New Jersey Educational Facilities Authority, Revenue Refunding Bonds, College of New Jersey, Series 2012A: | | | | | | | |
| | 200 | | 5.000%, 7/01/18 | | No Opt. Call | | AA | | 222,372 | |
| | 1,000 | | 5.000%, 7/01/19 | | No Opt. Call | | AA | | 1,133,560 | |
| | 3,420 | | New Jersey Higher Education Assistance Authority, Student Loan Revenue Bonds, Series 2008A, 6.125%, 6/01/30 – AGC Insured (Alternative Minimum Tax) | | 6/18 at 100.00 | | AA | | 3,684,503 | |
| | 1,305 | | New Jersey Higher Education Assistance Authority, Student Loan Revenue Bonds, Series 2010-1A, 5.000%, 12/01/25 | | 12/19 at 100.00 | | AA | | 1,380,664 | |
| | 960 | | New Jersey Higher Education Assistance Authority, Student Loan Revenue Bonds, Series 2010-2, 5.000%, 12/01/30 | | 12/20 at 100.00 | | Aa3 | | 1,034,986 | |
| | 1,750 | | New Jersey Higher Education Assistance Authority, Student Loan Revenue Bonds, Series 2011-1, 5.750%, 12/01/27 (Alternative Minimum Tax) | | 12/21 at 100.00 | | Aa3 | | 1,948,818 | |
| | | | New Jersey Higher Education Assistance Authority, Student Loan Revenue Bonds, Series 2012-1A: | | | | | | | |
| | 5,670 | | 4.250%, 12/01/25 (Alternative Minimum Tax) | | 12/22 at 100.00 | | AA | | 5,992,283 | |
| | 1,925 | | 4.375%, 12/01/26 (Alternative Minimum Tax) | | 12/22 at 100.00 | | AA | | 2,040,038 | |
| | 500 | | New Jersey Higher Education Assistance Authority, Student Loan Revenue Bonds, Series 2012-1B, 5.750%, 12/01/39 (Alternative Minimum Tax) | | 12/22 at 100.00 | | A | | 542,950 | |
| | | | New Jersey Higher Education Assistance Authority, Student Loan Revenue Bonds, Tender Option Bond Trust 4736: | | | | | | | |
| | 1,400 | | 11.649%, 12/01/23 (Alternative Minimum Tax) (IF) (4) | | 12/22 at 100.00 | | AA | | 1,512,672 | |
| | 1,250 | | 11.786%, 12/01/24 (Alternative Minimum Tax) (IF) (4) | | 12/22 at 100.00 | | AA | | 1,268,950 | |
| | 850 | | 12.217%, 12/01/25 (Alternative Minimum Tax) (IF) (4) | | 12/22 at 100.00 | | AA | | 853,944 | |
| | 250 | | 12.571%, 12/01/26 (Alternative Minimum Tax) (IF) (4) | | 12/22 at 100.00 | | AA | | 256,030 | |
| | 2,500 | | 13.561%, 12/01/27 (Alternative Minimum Tax) (IF) (4) | | 12/23 at 100.00 | | AA | | 2,614,500 | |
| | 2,000 | | New Jersey Higher Education Assistance Authority, Student Loan Revenue Bonds, Tender Option Bond Trust PA-4643, 19.730%, 6/01/30 (IF) (4) | | 6/19 at 100.00 | | AA | | 2,868,320 | |
| | 575 | | New Jersey Institute of Technology, New Jersey, General Obligation Bonds, Series 2012A, 5.000%, 7/01/42 | | 7/22 at 100.00 | | A1 | | 639,647 | |
| | 450 | | Puerto Rico Industrial, Tourist, Educational, Medical and Environmental Control Facilities Financing Authority, Higher Education Revenue Bonds, Ana G. Mendez University System Project, Refunding Series 2012, 5.125%, 4/01/32 | | 4/22 at 100.00 | | BBB– | | 394,160 | |
| | 350 | | Puerto Rico Industrial, Tourist, Educational, Medical and Environmental Control Facilities Financing Authority, Higher Education Revenue Bonds, Inter-American University of Puerto Rico Project, Refunding Series 2012, 5.000%, 10/01/31 | | 10/22 at 100.00 | | A– | | 352,510 | |
| | 500 | | Puerto Rico Industrial, Tourist, Educational, Medical and Environmental Control Facilities Financing Authority, Higher Education Revenue Refunding Bonds, Ana G. Mendez University System, Series 2002, 5.500%, 12/01/31 | | 7/15 at 100.00 | | BBB– | | 460,135 | |
| | 2,170 | | Rutgers State University, New Jersey, Revenue Bonds, Tender Option Bond Trust 3339, 17.903%, 5/01/43 (IF) (4) | | 5/23 at 100.00 | | AA– | | 3,260,121 | |
| | 91,850 | | Total Education and Civic Organizations | | | | | | 104,675,754 | |
| | Principal | | | | Optional Call | | | | | |
| | Amount (000) | | Description (1) | | Provisions (2) | | Ratings (3) | | Value | |
| | | | Financials – 1.7% (1.2% of Total Investments) | | | | | | | |
| | | | New Jersey Economic Development Authority, Revenue Refunding Bonds, Kapkowski Road Landfill Project, Series 2002: | | | | | | | |
| $ | 8,700 | | 5.750%, 10/01/21 | | No Opt. Call | | Ba2 | $ | 9,766,011 | |
| | 1,500 | | 6.500%, 4/01/28 | | No Opt. Call | | Ba2 | | 1,874,550 | |
| | 10,200 | | Total Financials | | | | | | 11,640,561 | |
| | | | Health Care – 21.7% (15.0% of Total Investments) | | | | | | | |
| | | | Camden County Improvement Authority, New Jersey, Health Care Redevelopment Revenue Bonds, Cooper Health System Obligated Group Issue, Refunding Series 2014A: | | | | | | | |
| | 175 | | 5.000%, 2/15/25 | | No Opt. Call | | BBB+ | | 200,935 | |
| | 220 | | 5.000%, 2/15/26 | | No Opt. Call | | BBB+ | | 250,785 | |
| | 320 | | 5.000%, 2/15/27 | | No Opt. Call | | BBB+ | | 361,402 | |
| | 1,385 | | 5.000%, 2/15/28 | | No Opt. Call | | BBB+ | | 1,544,732 | |
| | 1,385 | | 5.000%, 2/15/29 | | No Opt. Call | | BBB+ | | 1,534,899 | |
| | 2,500 | | 5.000%, 2/15/32 | | 2/24 at 100.00 | | BBB+ | | 2,740,900 | |
| | 80 | | 5.000%, 2/15/33 | | No Opt. Call | | BBB+ | | 87,458 | |
| | 145 | | 5.000%, 2/15/34 | | No Opt. Call | | BBB+ | | 158,404 | |
| | 200 | | 5.000%, 2/15/35 | | No Opt. Call | | BBB+ | | 218,174 | |
| | 6,100 | | Camden County Improvement Authority, New Jersey, Health Care Redevelopment Revenue Bonds, Cooper Health System Obligated Group Issue, Series 2013A, 5.750%, 2/15/42 | | 2/23 at 100.00 | | BBB+ | | 6,954,915 | |
| | 5,110 | | New Jersey Health Care Facilities Finance Authority, Revenue Bonds, AHS Hospital Corporation, Series 2008A, 5.000%, 7/01/27 | | 7/18 at 100.00 | | A+ | | 5,583,339 | |
| | 2,500 | | New Jersey Health Care Facilities Financing Authority, Hospital Revenue Bonds, Virtua Health, Tender Option Bond Trust 3018, 18.772%, 7/01/38 – AGC Insured (IF) (4) | | 7/19 at 100.00 | | AA | | 3,659,500 | |
| | | | New Jersey Health Care Facilities Financing Authority, New Jersey, Revenue Bonds, Saint Peters University Hospital, Refunding Series 2011: | | | | | | | |
| | 2,000 | | 6.000%, 7/01/26 | | 7/21 at 100.00 | | BB+ | | 2,238,680 | |
| | 2,500 | | 6.250%, 7/01/35 | | 7/21 at 100.00 | | BB+ | | 2,768,675 | |
| | 2,050 | | New Jersey Health Care Facilities Financing Authority, New Jersey, Revenue Bonds, Saint Peters University Hospital, Series 2007, 5.750%, 7/01/37 | | 7/18 at 100.00 | | BB+ | | 2,136,141 | |
| | 1,140 | | New Jersey Health Care Facilities Financing Authority, Revenue and Refunding Bonds, Barnabas Health, Series 2012A, 5.000%, 7/01/24 | | No Opt. Call | | A– | | 1,307,831 | |
| | | | New Jersey Health Care Facilities Financing Authority, Revenue and Refunding Bonds, Palisades Medical Center Obligated Group Issue, Series 2013: | | | | | | | |
| | 3,125 | | 5.250%, 7/01/31 | | 7/23 at 100.00 | | BBB | | 3,443,969 | |
| | 1,560 | | 5.500%, 7/01/43 | | 7/23 at 100.00 | | BBB | | 1,740,601 | |
| | 6,840 | | New Jersey Health Care Facilities Financing Authority, Revenue Bonds, Atlanticare Regional Medical Center, Series 2007, 5.000%, 7/01/37 | | 7/17 at 100.00 | | A+ | | 7,179,401 | |
| | 5,000 | | New Jersey Health Care Facilities Financing Authority, Revenue Bonds, Barnabas Health, Refunding Series 2014A, 5.000%, 7/01/44 | | 7/24 at 100.00 | | A– | | 5,470,750 | |
| | 3,765 | | New Jersey Health Care Facilities Financing Authority, Revenue Bonds, CentraState Medical Center, Series 2006A, 5.000%, 7/01/30 – AGC Insured | | 7/17 at 100.00 | | A3 | | 3,955,885 | |
| | | | New Jersey Health Care Facilities Financing Authority, Revenue Bonds, Hunterdon Medical Center, Refunding Series 2014A: | | | | | | | |
| | 2,055 | | 5.000%, 7/01/45 | | 7/24 at 100.00 | | A | | 2,258,507 | |
| | 3,295 | | 4.000%, 7/01/45 | | 7/24 at 100.00 | | A | | 3,196,447 | |
| | | | New Jersey Health Care Facilities Financing Authority, Revenue Bonds, Kennedy Health System Obligated Group Issue, Refunding Series 2012: | | | | | | | |
| | 4,140 | | 3.750%, 7/01/27 | | No Opt. Call | | A3 | | 4,172,540 | |
| | 3,375 | | 5.000%, 7/01/31 | | 7/22 at 100.00 | | A3 | | 3,707,977 | |
| | 1,500 | | 5.000%, 7/01/37 | | 7/22 at 100.00 | | A3 | | 1,623,210 | |
| | | | New Jersey Health Care Facilities Financing Authority, Revenue Bonds, Meridian Health System Obligated Group, Refunding Series 2011: | | | | | | | |
| | 3,000 | | 5.000%, 7/01/25 | | 7/18 at 100.00 | | A+ | | 3,428,040 | |
| | 3,000 | | 5.000%, 7/01/26 | | 7/22 at 100.00 | | A+ | | 3,407,160 | |
| | 2,500 | | 5.000%, 7/01/27 | | 7/22 at 100.00 | | A+ | | 2,814,300 | |
| NXJ | Nuveen New Jersey Dividend Advantage Municipal Fund | |
| | Portfolio of Investments (continued) | April 30, 2015 |
| | Principal | | | | Optional Call | | | | | |
| | Amount (000) | | Description (1) | | Provisions (2) | | Ratings (3) | | Value | |
| | | | Health Care (continued) | | | | | | | |
| $ | 1,450 | | New Jersey Health Care Facilities Financing Authority, Revenue Bonds, Meridian Health System Obligated Group, Refunding Series 2013A, 5.000%, 7/01/32 | | 7/23 at 100.00 | | A+ | $ | 1,615,851 | |
| | 7,690 | | New Jersey Health Care Facilities Financing Authority, Revenue Bonds, Meridian Health, Series 2007, 5.000%, 7/01/38 – AGC Insured | | 7/18 at 100.00 | | AA | | 8,211,459 | |
| | | | New Jersey Health Care Facilities Financing Authority, Revenue Bonds, Robert Wood Johnson University Hospital Issue, Series 2014A: | | | | | | | |
| | 3,785 | | 5.000%, 7/01/39 | | 7/24 at 100.00 | | A | | 4,172,205 | |
| | 5,955 | | 5.000%, 7/01/43 | | 7/24 at 100.00 | | A | | 6,559,313 | |
| | 3,945 | | New Jersey Health Care Facilities Financing Authority, Revenue Bonds, Robert Wood Johnson University Hospital, Series 2013A, 5.500%, 7/01/43 | | 7/23 at 100.00 | | A | | 4,566,456 | |
| | | | New Jersey Health Care Facilities Financing Authority, Revenue Bonds, RWJ Health Care Corporation, Series 2005B: | | | | | | | |
| | 1,620 | | 5.000%, 7/01/25 – RAAI Insured | | 7/15 at 100.00 | | AA | | 1,625,378 | |
| | 2,885 | | 5.000%, 7/01/35 – RAAI Insured | | 7/15 at 100.00 | | AA | | 2,891,232 | |
| | 7,670 | | New Jersey Health Care Facilities Financing Authority, Revenue Bonds, Saint Barnabas Health Care System, Refunding Series 2011A, 5.625%, 7/01/37 | | 7/21 at 100.00 | | A– | | 8,724,165 | |
| | 3,485 | | New Jersey Health Care Facilities Financing Authority, Revenue Bonds, Saint Barnabas Health Care System, Series 2006A, 5.000%, 7/01/29 | | 1/17 at 100.00 | | A– | | 3,618,057 | |
| | 5,000 | | New Jersey Health Care Facilities Financing Authority, Revenue Bonds, Saint Joseph’s Healthcare System Obligated Group Issue, Series 2008, 6.625%, 7/01/38 | | 7/18 at 100.00 | | BBB– | | 5,572,700 | |
| | 2,345 | | New Jersey Health Care Facilities Financing Authority, Revenue Bonds, Saint Luke’s Warren Hospital Obligated Group, Series 2013, 4.000%, 8/15/37 | | 8/23 at 100.00 | | A– | | 2,329,476 | |
| | | | New Jersey Health Care Facilities Financing Authority, Revenue Bonds, South Jersey Hospital System, Refunding Series 2006: | | | | | | | |
| | 670 | | 5.000%, 7/01/25 | | 7/16 at 100.00 | | A2 | | 695,359 | |
| | 8,780 | | 5.000%, 7/01/36 | | 7/16 at 100.00 | | A2 | | 9,042,434 | |
| | 3,415 | | 5.000%, 7/01/46 | | 7/16 at 100.00 | | A2 | | 3,505,395 | |
| | 3,750 | | Puerto Rico Industrial, Tourist, Educational, Medical and Environmental Control Facilities Financing Authority, Adjustable Rate Industrial Revenue Bonds, American Home Products Corporation, Series 1983A, 5.100%, 12/01/18 | | 6/15 at 100.00 | | A1 | | 3,822,037 | |
| | 133,410 | | Total Health Care | | | | | | 145,097,074 | |
| | | | Housing/Multifamily – 4.2% (2.9% of Total Investments) | | | | | | | |
| | 1,900 | | New Jersey Economic Development Authority, Revenue Bonds, Provident Group – Rowan Properties LLC – Rowan University Student Housing Project, Series 2015A, 5.000%, 1/01/48 (WI/DD, Settling 5/01/15) | | 1/25 at 100.00 | | BBB– | | 2,013,620 | |
| | 6,075 | | New Jersey Economic Development Authority, Revenue Bonds, West Campus Housing LLC – New Jersey City University Student Housing Project, Series 2015, 5.000%, 7/01/47 | | 7/25 at 100.00 | | BBB– | | 6,295,219 | |
| | | | New Jersey Economic Development Authority, Student Housing Revenue Bonds, Provident Group-Montclair Properties LLC, Montclair State University Student Housing Project, Series 2010A: | | | | | | | |
| | 3,870 | | 5.750%, 6/01/31 | | 6/20 at 100.00 | | Baa3 | | 4,341,289 | |
| | 2,100 | | 5.875%, 6/01/42 | | 6/20 at 100.00 | | Baa3 | | 2,348,619 | |
| | | | New Jersey Housing and Mortgage Finance Agency, Multifamily Housing Revenue Bonds, Series 2013-2: | | | | | | | |
| | 2,750 | | 4.350%, 11/01/33 (Alternative Minimum Tax) | | 11/22 at 100.00 | | AA | | 2,812,755 | |
| | 1,375 | | 4.600%, 11/01/38 (Alternative Minimum Tax) | | 11/22 at 100.00 | | AA | | 1,424,857 | |
| | 1,375 | | 4.750%, 11/01/46 (Alternative Minimum Tax) | | 11/22 at 100.00 | | AA | | 1,419,619 | |
| | 2,280 | | New Jersey Housing and Mortgage Finance Agency, Multifamily Revenue Bonds, Series 2015A, 4.000%, 11/01/45 | | 11/24 at 100.00 | | AA– | | 2,281,778 | |
| | 4,870 | | New Jersey Housing and Mortgage Finance Agency, Multifamily Revenue Bonds, Series 2015B, 1.000%, 11/01/17 | | No Opt. Call | | AA– | | 4,869,951 | |
| | 26,595 | | Total Housing/Multifamily | | | | | | 27,807,707 | |
| | Principal | | | | Optional Call | | | | | |
| | Amount (000) | | Description (1) | | Provisions (2) | | Ratings (3) | | Value | |
| | | | Housing/Single Family – 3.3% (2.3% of Total Investments) | | | | | | | |
| | | | New Jersey Housing & Mortgage Finance Agency, Single Family Home Mortgage Revenue Bonds, Series 2011A: | | | | | | | |
| $ | 10,000 | | 4.450%, 10/01/25 | | 10/21 at 100.00 | | Aa2 | $ | 10,854,300 | |
| | 10,000 | | 4.650%, 10/01/29 | | 4/21 at 100.00 | | Aa2 | | 10,642,800 | |
| | 805 | | New Jersey Housing and Mortgage Finance Agency, Single Family Housing Revenue Bonds, Series 2007T, 4.700%, 10/01/37 (Alternative Minimum Tax) | | 4/17 at 100.00 | | AA | | 814,765 | |
| | 20,805 | | Total Housing/Single Family | | | | | | 22,311,865 | |
| | | | Industrials – 0.2% (0.1% of Total Investments) | | | | | | | |
| | 1,340 | | Gloucester County Improvement Authority, New Jersey, Solid Waste Resource Recovery Revenue Refunding Bonds, Waste Management Inc. Project, Series 1999B, 6.850%, 12/01/29 (Mandatory put 12/01/17) | | No Opt. Call | | A– | | 1,383,322 | |
| | | | Long-Term Care – 2.2% (1.5% of Total Investments) | | | | | | | |
| | 5,255 | | Burlington County Bridge Commission, New Jersey, Economic Development Revenue Bonds, The Evergreens Project, Series 2007, 5.625%, 1/01/38 | | 1/18 at 100.00 | | N/R | | 5,429,834 | |
| | 510 | | New Jersey Economic Development Authority, Fixed Rate Revenue Bonds, Lions Gate Project, Series 2014, 5.250%, 1/01/44 | | 1/24 at 100.00 | | N/R | | 533,633 | |
| | 2,495 | | New Jersey Economic Development Authority, GNMA Collateralized Mortgage Revenue Bonds, Victoria Health Corporation, Series 2001A, 5.200%, 12/20/36 | | 7/15 at 100.00 | | Aa3 | | 2,504,281 | |
| | 4,920 | | New Jersey Economic Development Authority, Revenue Bonds, United Methodist Homes of New Jersey Obligated Group Issue, Refunding Series 2013, 5.000%, 7/01/34 | | 7/23 at 100.00 | | BBB– | | 5,215,741 | |
| | 710 | | New Jersey Economic Development Authority, Revenue Bonds, United Methodist Homes of New Jersey Obligated Group Issue, Refunding Series 2014A, 5.000%, 7/01/29 | | 7/24 at 100.00 | | BBB– | | 768,263 | |
| | 13,890 | | Total Long-Term Care | | | | | | 14,451,752 | |
| | | | Tax Obligation/General – 6.3% (4.4% of Total Investments) | | | | | | | |
| | 500 | | Carlstadt School District, Bergen County, New Jersey, General Obligation Bonds, Refunding Series 2014, 5.000%, 5/01/26 | | 5/24 at 100.00 | | AA– | | 590,350 | |
| | 2,225 | | Cumberland County Improvement Authority, New Jersey, County General Obligation Revenue Bonds, Technical High School Project, Series 2014, 5.000%, 9/01/39 – AGM Insured | | 9/24 at 100.00 | | AA | | 2,486,883 | |
| | 825 | | Elizabeth, Union County, New Jersey, General Obligation Bonds, General Improvement Series 2014, 3.125%, 4/01/27 – AGM Insured | | 4/24 at 100.00 | | AA | | 835,601 | |
| | 2,250 | | Freehold Regional High School District, Monmouth County, New Jersey, General Obligation Bonds, Refunding Series 2001, 5.000%, 3/01/17 – FGIC Insured | | No Opt. Call | | AA+ | | 2,420,595 | |
| | 690 | | Haddon Heights School District, Camden County, New Jersey, General Obligation Bonds, Refunding Series 2012, 3.250%, 1/01/30 | | 1/23 at 100.00 | | AA– | | 678,104 | |
| | 1,100 | | Linden, New Jersey, General Obligation Bonds, Refunding Series 2011, 4.000%, 5/01/23 | | 5/21 at 100.00 | | AA– | | 1,192,961 | |
| | 1,975 | | Middletown Township Board of Education, Monmouth County, New Jersey, Refunding Series 2010, 5.000%, 8/01/27 | | 8/20 at 100.00 | | AA | | 2,281,421 | |
| | 2,280 | | Monroe Township Board of Education, Middlesex County, New Jersey, General Obligation Bonds, Refunding Series 2015, 5.000%, 3/01/38 | | 3/25 at 100.00 | | AA– | | 2,597,034 | |
| | 1,000 | | Monroe Township, Middlesex County, New Jersey, General Obligation Bonds, Series 2003, 3.000%, 1/15/33 | | 1/22 at 100.00 | | AA | | 927,270 | |
| | 760 | | Montclair Township, Essex County, New Jersey, General Obligation Bonds, Parking Utility, Refunding Series 2014A, 5.000%, 1/01/37 | | 1/24 at 100.00 | | AA+ | | 859,134 | |
| | | | New Brunswick Parking Authority, Middlesex County, New Jersey, Guaranteed Parking Revenue Bonds, Refunding Series 2012: | | | | | | | |
| | 465 | | 5.000%, 9/01/28 | | 9/22 at 100.00 | | A+ | | 524,069 | |
| | 610 | | 5.000%, 9/01/29 | | 9/22 at 100.00 | | A+ | | 684,231 | |
| | 300 | | 5.000%, 9/01/31 | | 9/22 at 100.00 | | A+ | | 334,011 | |
| | 250 | | 3.625%, 9/01/34 | | 9/22 at 100.00 | | A+ | | 245,450 | |
| | 1,650 | | Newark Housing Authority, New Jersey, City-Secured Police Facility Revenue Bonds, South Ward Police Facility, Series 2009A, 6.750%, 12/01/38 – AGC Insured | | 12/19 at 100.00 | | A3 | | 1,965,893 | |
| NXJ | Nuveen New Jersey Dividend Advantage Municipal Fund | |
| | Portfolio of Investments (continued) | April 30, 2015 |
| | Principal | | | | Optional Call | | | | | |
| | Amount (000) | | Description (1) | | Provisions (2) | | Ratings (3) | | Value | |
| | | | Tax Obligation/General (continued) | | | | | | | |
| | | | South Brunswick Township, Middlesex County, New Jersey, General Obligation Bonds, Refunding Series 2014: | | | | | | | |
| $ | 740 | | 3.000%, 9/01/17 | | No Opt. Call | | AA | $ | 776,356 | |
| | 400 | | 5.000%, 9/01/22 | | No Opt. Call | | AA | | 480,984 | |
| | | | Sparta Township Board of Education, Sussex County, New Jersey, General Obligation Bonds, Refunding Series 2015: | | | | | | | |
| | 1,595 | | 5.000%, 2/15/32 | | 2/25 at 100.00 | | AA– | | 1,834,633 | |
| | 1,000 | | 5.000%, 2/15/34 | | 2/25 at 100.00 | | AA– | | 1,147,520 | |
| | 1,395 | | 5.000%, 2/15/35 | | 2/25 at 100.00 | | AA– | | 1,594,499 | |
| | 4,260 | | Sussex County, New Jersey, General Obligation Bonds, Refunding Series 2014, 4.000%, 2/15/22 | | No Opt. Call | | AA+ | | 4,829,605 | |
| | 420 | | The Board of Education of the Township of Mount Olive, Morris County, New Jersey School Bonds, Refunding Series 2014, 2.000%, 1/15/16 | | No Opt. Call | | AA | | 425,137 | |
| | 5,165 | | Union County Utilities Authority, New Jersey, Resource Recovery Facility Lease Revenue Refunding Bonds, Covantan Union Inc. Lessee, Series 2011B, 5.250%, 12/01/31 (Alternative Minimum Tax) | | 12/21 at 100.00 | | AA+ | | 5,644,777 | |
| | 2,515 | | Union County Utilities Authority, New Jersey, Solid Waste System County Deficiency Revenue Bonds, Series 2011A, 5.000%, 6/15/41 | | 6/21 at 100.00 | | AA+ | | 2,806,363 | |
| | 1,485 | | Washington Township Board of Education, Mercer County, New Jersey, General Obligation Bonds, Series 2005, 5.250%, 1/01/27 – AGM Insured | | No Opt. Call | | Aa3 | | 1,880,574 | |
| | 1,435 | | West Deptford Township, Gloucester County, New Jersey, General Obligation Bonds, Refunding Bonds, Series 2014, 4.000%, 9/01/28 – BAM Insured | | 9/24 at 100.00 | | AA | | 1,522,994 | |
| | 635 | | West Deptford Township, Gloucester County, New Jersey, General Obligation Bonds, Series 2005, 5.000%, 7/01/27 – AGM Insured | | 7/17 at 100.00 | | AA | | 685,482 | |
| | 100 | | Woodbridge Township, Middlesex County, New Jersey, General Obligation Bonds, Series 2010, 5.000%, 7/15/19 | | No Opt. Call | | AA+ | | 114,549 | |
| | 38,025 | | Total Tax Obligation/General | | | | | | 42,366,480 | |
| | | | Tax Obligation/Limited – 33.5% (23.1% of Total Investments) | | | | | | | |
| | 3,775 | | Bergen County Improvement Authority, New Jersey, Guaranteed Lease Revenue Bonds, County Administration Complex Project, Series 2005, 5.000%, 11/15/26 | | No Opt. Call | | Aaa | | 4,789,871 | |
| | 1,000 | | Camden County Improvement Authority, New Jersey, County Guaranteed Lease Revenue Bonds, Series 2005A, 5.000%, 9/01/16 – AGM Insured | | 9/15 at 100.00 | | AA | | 1,015,940 | |
| | 1,850 | | Casino Reinvestment Development Authority, New Jersey, Hotel Room Fee Revenue Bonds, Series 2004, 5.250%, 1/01/16 – AMBAC Insured | | 7/15 at 100.00 | | BBB– | | 1,893,604 | |
| | 4,175 | | Essex County Improvement Authority, New Jersey, Project Consolidation Revenue Bonds, Series 2007, 5.250%, 12/15/22 – AMBAC Insured | | No Opt. Call | | Aa2 | | 5,135,292 | |
| | 3,000 | | Garden State Preservation Trust, New Jersey, Open Space and Farmland Preservation Bonds, Refunding Series 2012A, 5.000%, 11/01/20 | | No Opt. Call | | AAA | | 3,522,210 | |
| | 3,000 | | Garden State Preservation Trust, New Jersey, Open Space and Farmland Preservation Bonds, Series 2003B, 0.000%, 11/01/25 – AGM Insured | | No Opt. Call | | AAA | | 2,247,180 | |
| | 3,145 | | Garden State Preservation Trust, New Jersey, Open Space and Farmland Preservation Bonds, Series 2005A, 5.750%, 11/01/28 – AGM Insured | | No Opt. Call | | AAA | | 3,909,361 | |
| | 5,120 | | Garden State Preservation Trust, New Jersey, Open Space and Farmland Preservation Bonds, Series 2005C, 5.125%, 11/01/18 – AGM Insured | | No Opt. Call | | AAA | | 5,803,366 | |
| | | | Government of Guam, Business Privilege Tax Bonds, Series 2011A: | | | | | | | |
| | 5,005 | | 5.250%, 1/01/36 | | 1/22 at 100.00 | | A | | 5,546,841 | |
| | 3,020 | | 5.125%, 1/01/42 | | 1/22 at 100.00 | | A | | 3,300,135 | |
| | 500 | | Government of Guam, Business Privilege Tax Bonds, Series 2012B-1, 5.000%, 1/01/29 | | 1/22 at 100.00 | | A | | 554,915 | |
| | 1,110 | | Hudson County Improvement Authority, New Jersey, County Secured Lease Revenue Bonds, Hudson County Plaza Refunding Project, Series 2013, 3.250%, 4/01/35 | | 4/22 at 100.00 | | Aa3 | | 1,043,123 | |
| | 3,450 | | New Jersey Building Authority, State Building Revenue Bonds, Series 2007A, 5.000%, 6/15/25 | | 6/16 at 100.00 | | A– | | 3,622,569 | |
| | Principal | | | | Optional Call | | | | | |
| | Amount (000) | | Description (1) | | Provisions (2) | | Ratings (3) | | Value | |
| | | | Tax Obligation/Limited (continued) | | | | | | | |
| | | | New Jersey Economic Development Authority, Cigarette Tax Revenue Refunding Bonds, Series 2012: | | | | | | | |
| $ | 4,400 | | 5.000%, 6/15/19 | | No Opt. Call | | BBB+ | $ | 4,927,076 | |
| | 310 | | 5.000%, 6/15/21 | | No Opt. Call | | BBB+ | | 353,980 | |
| | 6,400 | | 5.000%, 6/15/25 | | 6/22 at 100.00 | | BBB+ | | 7,164,736 | |
| | 3,480 | | 5.000%, 6/15/26 | | 6/22 at 100.00 | | BBB+ | | 3,867,428 | |
| | 7,945 | | 5.000%, 6/15/28 | | No Opt. Call | | BBB+ | | 8,700,013 | |
| | 415 | | 5.000%, 6/15/29 | | No Opt. Call | | BBB+ | | 452,300 | |
| | 4,675 | | New Jersey Economic Development Authority, Lease Revenue Bonds, Liberty State Park Project, Series 2005C, 5.000%, 3/01/27 – AGM Insured | | 6/15 at 100.00 | | AA | | 4,692,485 | |
| | 9,400 | | New Jersey Economic Development Authority, Revenue Bonds, Motor Vehicle Surcharge, Series 2004A, 5.250%, 7/01/15 – NPFG Insured | | 6/15 at 100.00 | | AA– | | 9,440,514 | |
| | | | New Jersey Economic Development Authority, Revenue Bonds, Newark Downtown District Management Corporation Project, Series 2007: | | | | | | | |
| | 440 | | 5.125%, 6/15/27 | | 6/17 at 100.00 | | Baa3 | | 455,783 | |
| | 740 | | 5.125%, 6/15/37 | | 6/17 at 100.00 | | Baa3 | | 759,958 | |
| | | | New Jersey Economic Development Authority, School Facilities Construction Financing Program Bonds, Refunding Series 2013NN: | | | | | | | |
| | 4,610 | | 5.000%, 3/01/22 | | No Opt. Call | | A– | | 5,112,306 | |
| | 5,000 | | 5.000%, 3/01/28 | | 3/23 at 100.00 | | A– | | 5,357,050 | |
| | | | New Jersey Economic Development Authority, School Facilities Construction Financing Program Bonds, Series 2007U: | | | | | | | |
| | 1,545 | | 5.000%, 9/01/37 – AMBAC Insured | | 9/17 at 100.00 | | A– | | 1,660,875 | |
| | 2,910 | | 5.000%, 9/01/37 | | 9/17 at 100.00 | | A– | | 3,112,332 | |
| | 2,395 | | New Jersey Educational Facilities Authority, Revenue Bonds, Higher Education Capital Improvement Fund, Refunding Series 2005A, 5.000%, 9/01/15 – AGM Insured | | No Opt. Call | | AA | | 2,433,128 | |
| | 1,805 | | New Jersey Health Care Facilities Financing Authority, State Contract Bonds, Hospital Asset Transformation Program, Series 2008A, 5.250%, 10/01/38 | | 10/18 at 100.00 | | A– | | 1,943,931 | |
| | | | New Jersey Transportation Trust Fund Authority, Federal Highway Aid Grant Anticipation Bonds, Series 2006: | | | | | | | |
| | 2,120 | | 5.000%, 6/15/17 – FGIC Insured | | 6/16 at 100.00 | | AA– | | 2,231,830 | |
| | 3,750 | | 5.000%, 6/15/18 – FGIC Insured | | 6/16 at 100.00 | | AA– | | 3,946,913 | |
| | 34,000 | | New Jersey Transportation Trust Fund Authority, Transportation System Bonds, Capital Appreciation Series 2010A, 0.000%, 12/15/30 | | No Opt. Call | | A– | | 16,166,320 | |
| | 8,100 | | New Jersey Transportation Trust Fund Authority, Transportation System Bonds, Refunding Series 2006A, 5.500%, 12/15/22 | | No Opt. Call | | A– | | 9,311,841 | |
| | 9,000 | | New Jersey Transportation Trust Fund Authority, Transportation System Bonds, Series 2004B, 5.500%, 12/15/16 – NPFG Insured | | No Opt. Call | | AA– | | 9,680,940 | |
| | | | New Jersey Transportation Trust Fund Authority, Transportation System Bonds, Series 2006C: | | | | | | | |
| | 21,000 | | 0.000%, 12/15/32 – AGM Insured | | No Opt. Call | | AA | | 9,284,100 | |
| | 34,855 | | 0.000%, 12/15/33 – AGM Insured | | No Opt. Call | | AA | | 14,712,296 | |
| | 30,310 | | 0.000%, 12/15/34 – AGM Insured | | No Opt. Call | | AA | | 12,144,611 | |
| | 7,500 | | New Jersey Transportation Trust Fund Authority, Transportation System Bonds, Series 2007A, 5.000%, 12/15/26 – AMBAC Insured | | 12/17 at 100.00 | | A– | | 8,158,125 | |
| | 7,000 | | New Jersey Transportation Trust Fund Authority, Transportation System Bonds, Series 2010D, 5.000%, 12/15/24 | | No Opt. Call | | A– | | 7,806,190 | |
| | | | Passaic County Improvement Authority, New Jersey, Lease Revenue Bonds, Preakness Healthcare Center Expansion Project, Series 2012: | | | | | | | |
| | 865 | | 5.000%, 5/01/21 | | No Opt. Call | | Aa3 | | 997,198 | |
| | 4,560 | | 3.500%, 5/01/35 | | 5/22 at 100.00 | | Aa3 | | 4,514,628 | |
| | 2,640 | | Puerto Rico Convention Center District Authority, Hotel Occupancy Tax Revenue Bonds, Series 2006A, 4.500%, 7/01/36 – CIFG Insured | | 7/16 at 100.00 | | CCC+ | | 2,238,456 | |
| | 2,500 | | Union County Improvement Authority, New Jersey, General Obligation Lease Bonds, County College Facility Project, Series 2014B, 5.000%, 2/01/20 | | No Opt. Call | | AA+ | | 2,894,350 | |
| NXJ | Nuveen New Jersey Dividend Advantage Municipal Fund | |
| | Portfolio of Investments (continued) | April 30, 2015 |
| | Principal | | | | Optional Call | | | | | |
| | Amount (000) | | Description (1) | | Provisions (2) | | Ratings (3) | | Value | |
| | | | Tax Obligation/Limited (continued) | | | | | | | |
| | | | Union County Improvement Authority, New Jersey, General Obligation Lease Bonds, Juvenile Detention Center Facility Project, Tender Option Bond Trust 1392: | | | | | | | |
| $ | 285 | | 24.384%, 5/01/28 (WI/DD, Settling 5/07/15) (IF) | | No Opt. Call | | Aa1 | $ | 650,336 | |
| | 285 | | 24.467%, 5/01/29 (WI/DD, Settling 5/07/15) (IF) | | No Opt. Call | | Aa1 | | 652,579 | |
| | 200 | | 24.467%, 5/01/30 (WI/DD, Settling 5/07/15) (IF) | | No Opt. Call | | Aa1 | | 460,040 | |
| | 370 | | 24.210%, 5/01/31 (WI/DD, Settling 5/07/15) (IF) | | No Opt. Call | | Aa1 | | 850,848 | |
| | 385 | | 24.344%, 5/01/32 (WI/DD, Settling 5/07/15) (IF) | | No Opt. Call | | Aa1 | | 887,745 | |
| | 400 | | 24.348%, 5/01/33 (WI/DD, Settling 5/07/15) (IF) | | No Opt. Call | | Aa1 | | 925,180 | |
| | 415 | | 24.467%, 5/01/34 (WI/DD, Settling 5/07/15) (IF) | | No Opt. Call | | Aa1 | | 958,609 | |
| | 3,975 | | Union County Improvement Authority, New Jersey, Lease Revenue Refunding Bonds, City of Plainfield – Park Madison Redevelopment Project, Tender Option Trust 1145, 17.454%, 3/01/34 (IF) (4) | | No Opt. Call | | AA+ | | 7,742,426 | |
| | 3,550 | | Virgin Islands Public Finance Authority, Matching Fund Loan Notes Revenue Bonds, Subordinate Lien Series 2010B, 5.250%, 10/01/29 | | 10/20 at 100.00 | | Baa2 | | 3,894,563 | |
| | 272,685 | | Total Tax Obligation/Limited | | | | | | 223,928,426 | |
| | | | Transportation – 27.1% (18.7% of Total Investments) | | | | | | | |
| | 5,550 | | Casino Reinvestment Development Authority, New Jersey, Parking Revenue Bonds, Series 2005A, 5.250%, 6/01/20 – NPFG Insured | | 6/15 at 100.00 | | AA– | | 5,569,480 | |
| | 2,400 | | Delaware River and Bay Authority, Delaware and New Jersey, Revenue Bonds, Series 2012A, 5.000%, 1/01/42 | | 1/23 at 100.00 | | A1 | | 2,674,368 | |
| | | | Delaware River and Bay Authority, Delaware and New Jersey, Revenue Bonds, Series 2014A: | | | | | | | |
| | 1,285 | | 5.000%, 1/01/34 | | 1/24 at 100.00 | | A1 | | 1,459,888 | |
| | 5,890 | | 4.125%, 1/01/39 | | 1/24 at 100.00 | | A1 | | 6,154,049 | |
| | 7,800 | | 5.000%, 1/01/44 | | 1/24 at 100.00 | | A1 | | 8,773,518 | |
| | | | Delaware River Joint Toll Bridge Commission, New Jersey and Pennsylvania, Bridge System Revenue Bonds, Refunding Series 2015: | | | | | | | |
| | 440 | | 3.000%, 7/01/27 – BAM Insured | | 7/25 at 100.00 | | AA | | 433,233 | |
| | 1,000 | | 4.000%, 7/01/34 – BAM Insured | | 7/25 at 100.00 | | AA | | 1,028,610 | |
| | 2,820 | | 4.000%, 7/01/35 – BAM Insured | | 7/25 at 100.00 | | AA | | 2,886,242 | |
| | | | Delaware River Joint Toll Bridge Commission, Pennsylvania, Revenue Bonds, Refunding Series 2012A: | | | | | | | |
| | 2,115 | | 5.000%, 7/01/24 | | 7/22 at 100.00 | | A1 | | 2,472,879 | |
| | 1,105 | | 5.000%, 7/01/25 | | 7/22 at 100.00 | | A1 | | 1,281,347 | |
| | 650 | | 4.000%, 7/01/26 | | 7/22 at 100.00 | | A1 | | 701,214 | |
| | 625 | | 4.000%, 7/01/27 | | 7/22 at 100.00 | | A1 | | 667,737 | |
| | | | Delaware River Port Authority, New Jersey and Pennsylvania, Revenue Bonds, Series 2010E: | | | | | | | |
| | 1,000 | | 5.000%, 1/01/40 – AGM Insured | | 1/20 at 100.00 | | AA | | 1,109,920 | |
| | 5,000 | | 5.000%, 1/01/40 | | 1/20 at 100.00 | | A | | 5,525,200 | |
| | 7,035 | | Delaware River Port Authority, New Jersey and Pennsylvania, Revenue Bonds, Series 2013, 5.000%, 1/01/40 | | 1/24 at 100.00 | | A | | 7,907,410 | |
| | | | Delaware River Port Authority, Pennsylvania and New Jersey, Revenue Refunding Bonds, Port District Project, Series 2012: | | | | | | | |
| | 1,635 | | 5.000%, 1/01/25 | | No Opt. Call | | BBB | | 1,876,179 | |
| | 1,350 | | 5.000%, 1/01/26 | | No Opt. Call | | BBB | | 1,536,678 | |
| | 3,595 | | 5.000%, 1/01/27 | | No Opt. Call | | BBB | | 4,080,217 | |
| | 5,555 | | New Jersey Economic Development Authority, Private Activity Bonds, The Goethals Bridge Replacement Project, Series 2013, 5.625%, 1/01/52 (Alternative Minimum Tax) | | 1/24 at 100.00 | | BBB– | | 6,225,600 | |
| | | | New Jersey Economic Development Authority, Special Facilities Revenue Bonds, Continental Airlines Inc., Series 1999: | | | | | | | |
| | 1,000 | | 5.125%, 9/15/23 (Alternative Minimum Tax) | | 9/15 at 100.00 | | B+ | | 1,103,700 | |
| | 1,800 | | 5.250%, 9/15/29 (Alternative Minimum Tax) | | 9/22 at 101.00 | | B+ | | 1,978,110 | |
| | 2,250 | | New Jersey Economic Development Authority, Special Facilities Revenue Bonds, Continental Airlines Inc., Series 2000A & 2000B, 5.625%, 11/15/30 (Alternative Minimum Tax) | | 3/24 at 101.00 | | B+ | | 2,536,807 | |
| | Principal | | | | Optional Call | | | | | |
| | Amount (000) | | Description (1) | | Provisions (2) | | Ratings (3) | | Value | |
| | | | Transportation (continued) | | | | | | | |
| | | | New Jersey Transit Corporation, Grant Anticipation Notes, Federal Transit Administration Section 5307 Urbanized Area Formula Funds, Series 2014A: | | | | | | | |
| $ | 6,000 | | 5.000%, 9/15/20 | | No Opt. Call | | A | $ | 6,849,360 | |
| | 5,750 | | 5.000%, 9/15/21 | | No Opt. Call | | A | | 6,625,437 | |
| | | | New Jersey Turnpike Authority, Revenue Bonds, Series 1991C: | | | | | | | |
| | 30 | | 6.500%, 1/01/16 | | No Opt. Call | | A3 | | 31,235 | |
| | 225 | | 6.500%, 1/01/16 – AMBAC Insured | | No Opt. Call | | A3 | | 234,265 | |
| | 510 | | 6.500%, 1/01/16 – NPFG Insured | | No Opt. Call | | AA– | | 531,002 | |
| | 3,065 | | New Jersey Turnpike Authority, Revenue Bonds, Series 2005A, 5.250%, 1/01/29 – AGM Insured | | No Opt. Call | | AA | | 3,759,958 | |
| | 7,500 | | New Jersey Turnpike Authority, Revenue Bonds, Series 2009I, 5.000%, 1/01/35 | | 1/20 at 100.00 | | A+ | | 8,251,425 | |
| | 7,620 | | New Jersey Turnpike Authority, Revenue Bonds, Series 2012B, 5.000%, 1/01/28 | | 1/23 at 100.00 | | A+ | | 8,684,895 | |
| | 3,625 | | New Jersey Turnpike Authority, Revenue Bonds, Tender Option Bond Trust 1154, 17.041%, 1/01/43 (IF) (4) | | 7/22 at 100.00 | | A+ | | 5,066,844 | |
| | 2,100 | | Passaic County Improvement Authority, New Jersey, County Guaranteed Parking Revenue Bonds, 200 Hospital Plaza Project, Series 2010, 5.000%, 5/01/42 | | 5/20 at 100.00 | | Aa3 | | 2,339,169 | |
| | 2,750 | | Passaic County Improvement Authority, New Jersey, Revenue Bonds, Paterson Parking Deck Facility, Series 2005, 5.000%, 4/15/35 – AGM Insured | | 7/15 at 100.00 | | A2 | | 2,759,432 | |
| | | | Port Authority of New York and New Jersey, Consolidated Revenue Bonds, One Hundred Fortieth Series 2005: | | | | | | | |
| | 11,000 | | 5.000%, 12/01/28 – SYNCORA GTY Insured | | 6/15 at 101.00 | | AA– | | 11,155,100 | |
| | 7,500 | | 5.000%, 12/01/34 | | 6/15 at 101.00 | | AA– | | 7,605,750 | |
| | 1,895 | | Port Authority of New York and New Jersey, Consolidated Revenue Bonds, One Hundred Forty Eighth Series 2008, Trust 2920, 17.902%, 8/15/32 – AGM Insured (IF) | | 8/17 at 100.00 | | AA | | 2,552,262 | |
| | 7,225 | | Port Authority of New York and New Jersey, Consolidated Revenue Bonds, One Hundred Seventy Ninth Series 2013, 5.000%, 12/01/43 | | 12/23 at 100.00 | | AA– | | 8,159,698 | |
| | 6,700 | | Port Authority of New York and New Jersey, Consolidated Revenue Bonds, One Hundred Seventy Seventh Series 2013, 4.000%, 1/15/43 (Alternative Minimum Tax) | | 1/23 at 100.00 | | AA– | | 6,717,353 | |
| | | | Port Authority of New York and New Jersey, Special Project Bonds, JFK International Air Terminal LLC, Sixth Series 1997: | | | | | | | |
| | 19,655 | | 5.750%, 12/01/22 – NPFG Insured (Alternative Minimum Tax) | | 6/15 at 100.00 | | AA– | | 19,764,478 | |
| | 12,130 | | 5.750%, 12/01/25 – NPFG Insured (Alternative Minimum Tax) | | 6/15 at 100.00 | | AA– | | 12,166,511 | |
| | 167,180 | | Total Transportation | | | | | | 181,236,560 | |
| | | | U.S. Guaranteed – 15.5% (10.7% of Total Investments) (5) | | | | | | | |
| | | | Gloucester County Improvement Authority, New Jersey, Lease Revenue Bonds, Series 2005A: | | | | | | | |
| | 1,000 | | 5.000%, 9/01/21 (Pre-refunded 9/01/15) – NPFG Insured | | 9/15 at 100.00 | | AA (5) | | 1,016,280 | |
| | 1,420 | | 5.000%, 9/01/22 (Pre-refunded 9/01/15) – NPFG Insured | | 9/15 at 100.00 | | AA (5) | | 1,443,118 | |
| | 375 | | Guam Government Waterworks Authority, Water and Wastewater System Revenue Bonds, Series 2005, 6.000%, 7/01/25 (Pre-refunded 7/01/15) | | 7/15 at 100.00 | | A– (5) | | 378,611 | |
| | 8,500 | | Jersey City, New Jersey, General Obligation Bonds, Series 2006A, 5.000%, 9/01/22 (Pre-refunded 9/01/16) – AMBAC Insured | | 9/16 at 100.00 | | A1 (5) | | 9,026,830 | |
| | | | New Jersey Building Authority, State Building Revenue Bonds, Series 2007A: | | | | | | | |
| | 7,005 | | 5.000%, 6/15/26 (Pre-refunded 6/15/16) | | 6/16 at 100.00 | | AA+ (5) | | 7,375,424 | |
| | 1,785 | | 5.000%, 6/15/27 (Pre-refunded 6/15/16) | | 6/16 at 100.00 | | AA+ (5) | | 1,879,391 | |
| | 95 | | New Jersey Economic Development Authority, Cigarette Tax Revenue Bonds, Series 2004, 5.500%, 6/15/16 (ETM) | | No Opt. Call | | Aaa | | 100,493 | |
| | 1,190 | | New Jersey Economic Development Authority, Revenue Bonds, Yeshiva Ktana of Passaic, Series 1993, 8.000%, 9/15/18 (ETM) | | No Opt. Call | | N/R (5) | | 1,342,855 | |
| NXJ | Nuveen New Jersey Dividend Advantage Municipal Fund | |
| | Portfolio of Investments (continued) | April 30, 2015 |
| | Principal | | | | Optional Call | | | | | |
| | Amount (000) | | Description (1) | | Provisions (2) | | Ratings (3) | | Value | |
| | | | U.S. Guaranteed (5) (continued) | | | | | | | |
| | | | New Jersey Economic Development Authority, School Facilities Construction Financing Program Bonds, Series 2007U: | | | | | | | |
| $ | 2,625 | | 5.000%, 9/01/37 (Pre-refunded 9/01/17) – AMBAC Insured | | 9/17 at 100.00 | | AAA | $ | 2,880,990 | |
| | 5,435 | | 5.000%, 9/01/37 (Pre-refunded 9/01/17) | | 9/17 at 100.00 | | AAA | | 5,965,021 | |
| | 3,080 | | New Jersey Educational Facilities Authority, Revenue Bonds, Kean University, Series 2005B, 5.000%, 7/01/30 (Pre-refunded 7/01/16) – NPFG Insured | | 7/16 at 100.00 | | AA– (5) | | 3,246,813 | |
| | | | New Jersey Educational Facilities Authority, Revenue Bonds, Montclair State University, Series 2005F: | | | | | | | |
| | 1,225 | | 5.000%, 7/01/16 (Pre-refunded 7/01/15) – FGIC Insured | | 7/15 at 100.00 | | A1 (5) | | 1,234,947 | |
| | 700 | | 5.000%, 7/01/17 (Pre-refunded 7/01/15) – FGIC Insured | | 7/15 at 100.00 | | A1 (5) | | 705,684 | |
| | 2,000 | | 5.000%, 7/01/18 (Pre-refunded 7/01/15) – FGIC Insured | | 7/15 at 100.00 | | A1 (5) | | 2,016,240 | |
| | 1,000 | | 5.000%, 7/01/24 (Pre-refunded 7/01/15) – FGIC Insured | | 7/15 at 100.00 | | A1 (5) | | 1,008,120 | |
| | 1,695 | | 5.000%, 7/01/32 (Pre-refunded 7/01/15) – FGIC Insured | | 7/15 at 100.00 | | A1 (5) | | 1,708,763 | |
| | 25 | | New Jersey Educational Facilities Authority, Revenue Bonds, University of Medicine and Dentistry of New Jersey, Refunding Series 2009B, 6.000%, 12/01/17 (ETM) | | No Opt. Call | | N/R (5) | | 27,603 | |
| | | | New Jersey Educational Facilities Authority, Revenue Bonds, University of Medicine and Dentistry of New Jersey, Refunding Series 2009B: | | | | | | | |
| | 25 | | 6.500%, 12/01/19 (Pre-refunded 6/01/19) | | 6/19 at 100.00 | | N/R (5) | | 30,245 | |
| | 100 | | 6.500%, 12/01/20 (Pre-refunded 6/01/19) | | 6/19 at 100.00 | | N/R (5) | | 120,982 | |
| | 5 | | 7.125%, 12/01/23 (Pre-refunded 6/01/19) | | 6/19 at 100.00 | | N/R (5) | | 6,173 | |
| | | | New Jersey Health Care Facilities Financing Authority, Lease Revenue Bonds, Department of Human Services – Greystone Park Psychiatric Hospital, Series 2005: | | | | | | | |
| | 4,465 | | 5.000%, 9/15/18 (Pre-refunded 9/15/15) – AMBAC Insured | | 9/15 at 100.00 | | A– (5) | | 4,546,084 | |
| | 9,455 | | 5.000%, 9/15/24 (Pre-refunded 9/15/15) – AMBAC Insured | | 9/15 at 100.00 | | A– (5) | | 9,626,703 | |
| | 3,000 | | 5.000%, 9/15/28 (Pre-refunded 9/15/15) – AMBAC Insured | | 9/15 at 100.00 | | A– (5) | | 3,054,480 | |
| | 860 | | New Jersey Health Care Facilities Financing Authority, Revenue Bonds, Children’s Specialized Hospital, Series 2005A, 5.500%, 7/01/36 (Pre-refunded 7/01/15) | | 7/15 at 100.00 | | BBB+ (5) | | 867,559 | |
| | 2,040 | | New Jersey Health Care Facilities Financing Authority, Revenue Bonds, Hunterdon Medical Center, Series 2006B, 5.000%, 7/01/36 (Pre-refunded 7/01/16) | | 7/16 at 100.00 | | A– (5) | | 2,151,466 | |
| | 1,340 | | New Jersey Health Care Facilities Financing Authority, Revenue Bonds, Hunterdon Medical Center, Series 2006, 5.125%, 7/01/35 (Pre-refunded 7/01/16) | | 7/16 at 100.00 | | A– (5) | | 1,415,174 | |
| | 85 | | New Jersey Health Care Facilities Financing Authority, Revenue Bonds, South Jersey Hospital System, Refunding Series 2006, 5.000%, 7/01/46 (Pre-refunded 7/01/16) | | 7/16 at 100.00 | | N/R (5) | | 89,644 | |
| | 3,805 | | New Jersey Health Care Facilities Financing Authority, Revenue Bonds, St. Clare’s Hospital, Series 2004A, 5.250%, 7/01/20 – RAAI Insured (ETM) | | 7/20 at 100.00 | | AA (5) | | 4,499,679 | |
| | 1,500 | | New Jersey Sports and Exposition Authority, Convention Center Luxury Tax Bonds, Series 2004, 5.500%, 3/01/22 – NPFG Insured (ETM) | | No Opt. Call | | AA– (5) | | 1,861,320 | |
| | 7,045 | | New Jersey Transit Corporation, Certificates of Participation, Federal Transit Administration Grants, Series 2005A, 5.000%, 9/15/18 (Pre-refunded 9/15/15) – FGIC Insured | | 9/15 at 100.00 | | AA– (5) | | 7,171,810 | |
| | 2,000 | | New Jersey Transportation Trust Fund Authority, Transportation System Bonds, Series 2005B, 5.250%, 12/15/18 (Pre-refunded 12/15/15) – FGIC Insured | | 12/15 at 100.00 | | AA+ (5) | | 2,063,380 | |
| | 6,945 | | New Jersey Transportation Trust Fund Authority, Transportation System Bonds, Series 2005D, 5.000%, 6/15/19 (Pre-refunded 6/15/15) – AGM Insured | | 6/15 at 100.00 | | AA+ (5) | | 6,986,601 | |
| | | | New Jersey Turnpike Authority, Revenue Bonds, Series 1991C: | | | | | | | |
| | 15 | | 6.500%, 1/01/16 (ETM) | | No Opt. Call | | A3 (5) | | 15,629 | |
| | 125 | | 6.500%, 1/01/16 – AMBAC Insured (ETM) | | No Opt. Call | | A3 (5) | | 130,244 | |
| | 265 | | 6.500%, 1/01/16 – NPFG Insured (ETM) | | No Opt. Call | | AA– (5) | | 276,117 | |
| | 950 | | 6.500%, 1/01/16 (ETM) | | No Opt. Call | | AA+ (5) | | 989,919 | |
| | 275 | | 6.500%, 1/01/16 – NPFG Insured (ETM) | | No Opt. Call | | AA– (5) | | 286,536 | |
| | 120 | | 6.500%, 1/01/16 – AMBAC Insured (ETM) | | No Opt. Call | | A3 (5) | | 125,034 | |
| | 610 | | 6.500%, 1/01/16 (ETM) | | No Opt. Call | | AA+ (5) | | 635,590 | |
| | 100 | | 6.500%, 1/01/16 – AMBAC Insured (ETM) | | No Opt. Call | | A3 (5) | | 104,195 | |
| | Principal | | | | Optional Call | | | | | |
| | Amount (000) | | Description (1) | | Provisions (2) | | Ratings (3) | | Value | |
| | | | U.S. Guaranteed (5) (continued) | | | | | | | |
| $ | 15,840 | | North Hudson Sewerage Authority, New Jersey, Sewerage Revenue Refunding Bonds, Series 2001A, 0.000%, 8/01/23 – NPFG Insured (ETM) | | No Opt. Call | | A3 (5) | $ | 13,386,226 | |
| | 2,125 | | Puerto Rico Electric Power Authority, Power Revenue Bonds, Series 2005RR, 5.000%, 7/01/35 (Pre-refunded 7/01/15) – FGIC Insured | | 7/15 at 100.00 | | AA+ (5) | | 2,141,617 | |
| | 102,250 | | Total U.S. Guaranteed | | | | | | 103,939,590 | |
| | | | Utilities – 1.8% (1.2% of Total Investments) | | | | | | | |
| | 1,510 | | Industrial Pollution Control Financing Authority of Cape May County (New Jersey), Pollution Control Revenue Refunding Bonds, 1991 Series A (Atlantic City Electric Company Project), 6.800%, 3/01/21 – NPFG Insured | | No Opt. Call | | AA– | | 1,837,051 | |
| | | | New Jersey Economic Development Authority, Energy Facilities Revenue Bonds, UMM Energy Partners, LLC Project, Series 2012A: | | | | | | | |
| | 1,000 | | 4.750%, 6/15/32 (Alternative Minimum Tax) | | No Opt. Call | | Baa3 | | 1,040,080 | |
| | 1,225 | | 5.125%, 6/15/43 (Alternative Minimum Tax) | | 6/22 at 100.00 | | Baa3 | | 1,298,353 | |
| | 5,000 | | New Jersey Economic Development Authority, Water Facilities Revenue Bonds, New Jersey-American Water Company Inc. Project, Refunding Series 2010B, 5.600%, 11/01/34 (Alternative Minimum Tax) | | 5/20 at 100.00 | | A1 | | 5,651,850 | |
| | 2,040 | | New Jersey Economic Development Authority, Water Facilities Revenue Bonds, New Jersey-American Water Company Inc. Project, Refunding Series 2010D, 4.875%, 11/01/29 (Alternative Minimum Tax) | | 11/20 at 100.00 | | A1 | | 2,190,919 | |
| | 10,775 | | Total Utilities | | | | | | 12,018,253 | |
| | | | Water and Sewer – 6.2% (4.3% of Total Investments) | | | | | | | |
| | | | Bergen County Utilities Authority, New Jersey, Water Pollution Control System Revenue Bonds, Refunding Series 2014: | | | | | | | |
| | 540 | | 3.000%, 12/15/28 | | 12/24 at 100.00 | | AA– | | 525,393 | |
| | 515 | | 3.000%, 12/15/29 | | 12/24 at 100.00 | | AA– | | 496,970 | |
| | 1,000 | | 3.125%, 12/15/30 | | 12/24 at 100.00 | | AA– | | 967,590 | |
| | 1,000 | | 3.125%, 12/15/31 | | 12/24 at 100.00 | | AA– | | 957,040 | |
| | | | New Jersey Economic Development Authority, Water Facilities Revenue Bonds, Middlesex Water Company, Series 2012C: | | | | | | | |
| | 1,460 | | 5.000%, 10/01/23 | | No Opt. Call | | A | | 1,732,494 | |
| | 15,670 | | 4.250%, 10/01/47 (Alternative Minimum Tax) | | 10/22 at 100.00 | | A | | 15,895,648 | |
| | 1,680 | | New Jersey Environmental Infrastructure Trust, Environmental Infrastructure Bonds, Series 2012A, 3.250%, 9/01/31 | | 9/21 at 100.00 | | AAA | | 1,692,466 | |
| | 6,270 | | New Jersey Environmental Infrastructure Trust, Environmental Infrastructure Bonds, Tender Option Bond Trust 4729, 7.418%, 9/01/21 (IF) (4) | | No Opt. Call | | AAA | | 8,109,430 | |
| | 1,650 | | New Jersey Water Supply Authority, Water Supply Authority Bonds, Manasquan Reservoir, Series 2005, 5.000%, 8/01/31 – NPFG Insured | | 8/15 at 100.00 | | AA | | 1,667,325 | |
| | | | North Hudson Sewerage Authority, New Jersey, Gross Revenue Senior Lien Lease Certificates, Series 2012A: | | | | | | | |
| | 3,820 | | 5.000%, 6/01/27 – NPFG Insured | | 6/22 at 100.00 | | A | | 4,312,398 | |
| | 4,000 | | 5.000%, 6/01/42 – NPFG Insured | | 6/22 at 100.00 | | A | | 4,355,200 | |
| | 660 | | Wanaque Valley Regional Sewer Authority, Passaic County, New Jersey, Sewer Revenue Refunding Bonds, Series 1993B, 5.750%, 9/01/18 – AMBAC Insured | | No Opt. Call | | A2 | | 700,399 | |
| | 38,265 | | Total Water and Sewer | | | | | | 41,412,353 | |
| $ | 971,210 | | Total Municipal Bonds (cost $912,064,123) | | | | | | 967,170,129 | |
| NXJ | Nuveen New Jersey Dividend Advantage Municipal Fund | |
| | Portfolio of Investments (continued) | April 30, 2015 |
| Shares | | Description (1) | | Value | |
| | | COMMON STOCKS – 0.3% (0.2% of Total Investments) | | | |
| | | Airlines – 0.3% (0.2% of Total Investments) | | | |
| 46,862 | | American Airlines Group Inc., (6) | $ | 2,262,732 | |
| | | Total Common Stocks (cost $0) | | 2,262,732 | |
| | | Total Long-Term Investments (cost $912,064,123) | | 969,432,861 | |
| | | Variable Rate Demand Preferred Shares, at Liquidation Value – (46.9)% (7) | | (313,900,000 | ) |
| | | Other Assets Less Liabilities – 1.9% | | 13,136,729 | |
| | | Net Assets Applicable to Common Shares – 100% | $ | 668,669,590 | |
| (1) | All percentages shown in the Portfolio of Investments are based on net assets applicable to Common shares unless otherwise noted. |
| (2) | Optional Call Provisions (not covered by the report of independent registered public accounting firm): Dates (month and year) and prices of the earliest optional call or redemption. There may be other call provisions at varying prices at later dates. Certain mortgage-backed securities may be subject to periodic principal paydowns. |
| (3) | Ratings (not covered by the report of independent registered public accounting firm): Using the highest of Standard & Poor’s Group (“Standard & Poor’s”), Moody’s Investors Service, Inc. (“Moody’s”) or Fitch, Inc. (“Fitch”) rating. Ratings below BBB by Standard & Poor’s, Baa by Moody’s or BBB by Fitch are considered to be below investment grade. Holdings designated N/R are not rated by any of these national rating agencies. |
| (4) | Investment, or portion of investment, has been pledged to collateralize the net payment obligations for investments in inverse floating rate transactions. |
| (5) | Backed by an escrow or trust containing sufficient U.S. Government or U.S. Government agency securities, which ensure the timely payment of principal and interest. Certain bonds backed by U.S. Government or agency securities are regarded as having an implied rating equal to the rating of such securities. |
| (6) | On November 28, 2011, AMR Corp. (“AMR”), the parent company of American Airlines Group, Inc. (“AAL”) filed for federal bankruptcy protection. On December 9, 2013, AMR emerged from federal bankruptcy with the acceptance of its reorganization plan by the bankruptcy court. Under the settlement agreement established to meet AMR’s unsecured bond obligations, the bondholders, including the Fund, received a distribution of AAL preferred stock which was converted to AAL common stock over a 120-day period. Every 30 days, a quarter of the preferred stock was converted to AAL common stock based on the 5-day volume-weighted average price and the amount of preferred shares tendered during the optional preferred conversion period. |
| (7) | Variable Rate Demand Preferred Shares, at Liquidation Value as a percentage of Total Investments is 32.4%. |
| (ETM) | Escrowed to maturity. |
| (IF) | Inverse floating rate investment. |
| (WI/DD) | Investment, or portion of investment, purchased on a when-issued or delayed delivery basis. |
See accompanying notes to financial statements.
| NJV | | |
| | Nuveen New Jersey Municipal Value Fund | |
| | Portfolio of Investments | April 30, 2015 |
| | Principal | | | | Optional Call | | | | | |
| | Amount (000) | | Description (1) | | Provisions (2) | | Ratings (3) | | Value | |
| | | | LONG-TERM INVESTMENTS – 103.8% (100.0% of Total Investments) | | | | | | | |
| | | | MUNICIPAL BONDS – 101.0% (97.3% of Total Investments) | | | | | | | |
| | | | Consumer Staples – 3.2% (3.0% of Total Investments) | | | | | | | |
| | | | Tobacco Settlement Financing Corporation, New Jersey, Tobacco Settlement Asset-Backed Bonds, Series 2007-1A: | | | | | | | |
| $ | 150 | | 4.750%, 6/01/34 | | 6/17 at 100.00 | | B2 | $ | 116,322 | |
| | 870 | | 5.000%, 6/01/41 | | 6/17 at 100.00 | | B2 | | 684,307 | |
| | 1,020 | | Total Consumer Staples | | | | | | 800,629 | |
| | | | Education and Civic Organizations – 12.5% (12.1% of Total Investments) | | | | | | | |
| | 110 | | Camden County Improvement Authority, New Jersey, Lease Revenue Bonds Rowan University School of Osteopathic Medicine Project, Series 2013A, 5.000%, 12/01/32 | | 12/23 at 100.00 | | A | | 123,007 | |
| | 40 | | Gloucester County Improvement Authority, New Jersey, Revenue Bonds, Rowan University Projects, Series 2015A, 3.375%, 7/01/36 – AGM Insured | | 7/25 at 100.00 | | AA | | 38,125 | |
| | 115 | | New Jersey Economic Development Authority, Revenue Bonds, The Seeing Eye Inc., Refunding Series 2015, 5.000%, 3/01/25 | | No Opt. Call | | A | | 139,672 | |
| | 45 | | New Jersey Economic Development Authority, Rutgers University General Obligation Lease Revenue Bonds, Tender Option Bond Trust 3359, 18.083%, 6/15/46 (IF) (4) | | 6/23 at 100.00 | | AA– | | 66,056 | |
| | 900 | | New Jersey Educational Facilities Authority, Revenue Bonds, Kean University, Refunding Series 2009A, 5.500%, 9/01/36 | | 9/19 at 100.00 | | A2 | | 1,025,892 | |
| | 155 | | New Jersey Educational Facilities Authority, Revenue Bonds, New Jersey City University, Series 2015A, 5.000%, 7/01/45 | | 7/25 at 100.00 | | AA | | 173,476 | |
| | | | New Jersey Educational Facilities Authority, Revenue Bonds, Rider University, Series 2012A: | | | | | | | |
| | 50 | | 5.000%, 7/01/32 | | 7/21 at 100.00 | | BBB+ | | 53,668 | |
| | 30 | | 5.000%, 7/01/37 | | 7/21 at 100.00 | | BBB+ | | 32,081 | |
| | 75 | | New Jersey Educational Facilities Authority, Revenue Bonds, Seton Hall University, Series 2013D, 5.000%, 7/01/38 | | 7/23 at 100.00 | | A | | 82,790 | |
| | 1,000 | | New Jersey Higher Education Assistance Authority, Student Loan Revenue Bonds, Series 2009A, 5.625%, 6/01/30 | | 6/19 at 100.00 | | AA | | 1,108,540 | |
| | 30 | | New Jersey Higher Education Assistance Authority, Student Loan Revenue Bonds, Series 2010-2, 5.000%, 12/01/30 | | 12/20 at 100.00 | | Aa3 | | 32,343 | |
| | 100 | | New Jersey Higher Education Assistance Authority, Student Loan Revenue Bonds, Series 2012-1B, 5.750%, 12/01/39 (Alternative Minimum Tax) | | 12/22 at 100.00 | | A | | 108,590 | |
| | 100 | | New Jersey Higher Education Assistance Authority, Student Loan Revenue Bonds, Tender Option Bond Trust 4736, 11.649%, 12/01/23 (Alternative Minimum Tax) (IF) (4) | | 12/22 at 100.00 | | AA | | 108,048 | |
| | 60 | | Rutgers State University, New Jersey, Revenue Bonds, Tender Option Bond Trust 3339, 17.903%, 5/01/43 (IF) (4) | | 5/23 at 100.00 | | AA– | | 90,142 | |
| | 2,810 | | Total Education and Civic Organizations | | | | | | 3,182,430 | |
| | | | Health Care – 19.2% (18.5% of Total Investments) | | | | | | | |
| | 105 | | Camden County Improvement Authority, New Jersey, Health Care Redevelopment Revenue Bonds, Cooper Health System Obligated Group Issue, Refunding Series 2014A, 5.000%, 2/15/25 | | No Opt. Call | | BBB+ | | 120,561 | |
| | 100 | | Camden County Improvement Authority, New Jersey, Health Care Redevelopment Revenue Bonds, Cooper Health System Obligated Group Issue, Series 2013A, 5.750%, 2/15/42 | | 2/23 at 100.00 | | BBB+ | | 114,015 | |
| | 105 | | Illinois Finance Authority, Revenue Bonds, OSF Healthcare System, Series 2007A, 5.750%,5.750%, 11/15/37 | | 11/17 at 100.00 | | A | | 114,327 | |
| | 5 | | New Jersey Health Care Facilities Finance Authority, Revenue Bonds, AHS Hospital Corporation, Series 2008A, 5.125%, 7/01/22 | | 7/18 at 100.00 | | A+ | | 5,529 | |
| NJV | Nuveen New Jersey Municipal Value Fund | |
| | Portfolio of Investments (continued) | April 30, 2015 |
| | Principal | | | | Optional Call | | | | | |
| | Amount (000) | | Description (1) | | Provisions (2) | | Ratings (3) | | Value | |
| | | | Health Care (continued) | | | | | | | |
| $ | 2,000 | | New Jersey Health Care Facilities Financing Authority, Hospital Revenue Bonds, Virtua Health, Series 2009A, 5.500%, 7/01/38 – AGC Insured (UB) (4) | | 7/19 at 100.00 | | AA | $ | 2,231,900 | |
| | 100 | | New Jersey Health Care Facilities Financing Authority, Revenue and Refunding Bonds, Palisades Medical Center Obligated Group Issue, Series 2013, 5.250%, 7/01/31 | | 7/23 at 100.00 | | BBB | | 110,207 | |
| | 100 | | New Jersey Health Care Facilities Financing Authority, Revenue Bonds, Hunterdon Medical Center, Refunding Series 2014A, 4.000%, 7/01/45 | | 7/24 at 100.00 | | A | | 97,009 | |
| | 20 | | New Jersey Health Care Facilities Financing Authority, Revenue Bonds, Meridian Health System Obligated Group, Refunding Series 2011, 5.000%, 7/01/21 | | No Opt. Call | | A+ | | 23,664 | |
| | 100 | | New Jersey Health Care Facilities Financing Authority, Revenue Bonds, Meridian Health, Series 2007, 5.000%, 7/01/38 – AGC Insured | | 7/18 at 100.00 | | AA | | 106,781 | |
| | 110 | | New Jersey Health Care Facilities Financing Authority, Revenue Bonds, Robert Wood Johnson University Hospital Issue, Series 2014A, 5.000%, 7/01/39 | | 7/24 at 100.00 | | A | | 121,253 | |
| | 100 | | New Jersey Health Care Facilities Financing Authority, Revenue Bonds, Robert Wood Johnson University Hospital, Series 2013A, 5.500%, 7/01/43 | | 7/23 at 100.00 | | A | | 115,753 | |
| | 70 | | New Jersey Health Care Facilities Financing Authority, Revenue Bonds, Saint Barnabas Health Care System, Refunding Series 2011A, 5.625%, 7/01/37 | | 7/21 at 100.00 | | A– | | 79,621 | |
| | 750 | | New Jersey Health Care Facilities Financing Authority, Revenue Bonds, Saint Joseph’s Healthcare System Obligated Group Issue, Series 2008, 6.000%, 7/01/18 | | No Opt. Call | | BBB– | | 803,835 | |
| | 100 | | New Jersey Health Care Facilities Financing Authority, Revenue Bonds, Saint Luke’s Warren Hospital Obligated Group, Series 2013, 4.000%, 8/15/37 | | 8/23 at 100.00 | | A– | | 99,338 | |
| | 705 | | New Jersey Health Care Facilities Financing Authority, Revenue Bonds, South Jersey Hospital System, Refunding Series 2006, 5.000%, 7/01/36 | | 7/16 at 100.00 | | A2 | | 726,072 | |
| | 4,470 | | Total Health Care | | | | | | 4,869,865 | |
| | | | Housing/Multifamily – 6.5% (6.2% of Total Investments) | | | | | | | |
| | 100 | | New Jersey Economic Development Authority, Revenue Bonds, Provident Group – Rowan Properties LLC – Rowan University Student Housing Project, Series 2015A, 5.000%, 1/01/48 (WI/DD, Settling 5/01/15) | | 1/25 at 100.00 | | BBB– | | 105,980 | |
| | 155 | | New Jersey Economic Development Authority, Revenue Bonds, West Campus Housing LLC – New Jersey City University Student Housing Project, Series 2015, 5.000%, 7/01/47 | | 7/25 at 100.00 | | BBB– | | 160,619 | |
| | | | New Jersey Economic Development Authority, Student Housing Revenue Bonds, Provident Group-Montclair Properties LLC, Montclair State University Student Housing Project, Series 2010A: | | | | | | | |
| | 100 | | 5.750%, 6/01/31 | | 6/20 at 100.00 | | Baa3 | | 112,178 | |
| | 50 | | 5.875%, 6/01/42 | | 6/20 at 100.00 | | Baa3 | | 55,919 | |
| | 1,000 | | New Jersey Housing and Mortgage Finance Agency, Multifamily Revenue Bonds, Series 2009A, 4.950%, 5/01/41 | | 11/19 at 100.00 | | AA– | | 1,018,560 | |
| | 60 | | New Jersey Housing and Mortgage Finance Agency, Multifamily Revenue Bonds, Series 2015A, 4.000%, 11/01/45 | | 11/24 at 100.00 | | AA– | | 60,047 | |
| | 130 | | New Jersey Housing and Mortgage Finance Agency, Multifamily Revenue Bonds, Series 2015B, 1.000%, 11/01/17 | | No Opt. Call | | AA– | | 129,999 | |
| | 1,595 | | Total Housing/Multifamily | | | | | | 1,643,302 | |
| | | | Housing/Single Family – 1.2% (1.2% of Total Investments) | | | | | | | |
| | 305 | | New Jersey Housing & Mortgage Finance Agency, Single Family Home Mortgage Revenue Bonds, Series 2011A, 4.500%, 10/01/29 | | 10/21 at 100.00 | | Aa2 | | 313,510 | |
| | | | Long-Term Care – 1.4% (1.3% of Total Investments) | | | | | | | |
| | 160 | | Burlington County Bridge Commission, New Jersey, Economic Development Revenue Bonds, The Evergreens Project, Series 2007, 5.625%, 1/01/38 | | 1/18 at 100.00 | | N/R | | 165,323 | |
| | 15 | | New Jersey Economic Development Authority, Fixed Rate Revenue Bonds, Lions Gate Project, Series 2014, 5.250%, 1/01/44 | | 1/24 at 100.00 | | N/R | | 15,695 | |
| | 140 | | New Jersey Economic Development Authority, Revenue Bonds, United Methodist Homes of New Jersey Obligated Group Issue, Refunding Series 2013, 5.000%, 7/01/34 | | 7/23 at 100.00 | | BBB– | | 148,415 | |
| | Principal | | | | Optional Call | | | | | |
| | Amount (000) | | Description (1) | | Provisions (2) | | Ratings (3) | | Value | |
| | | | Long-Term Care (continued) | | | | | | | |
| $ | 20 | | New Jersey Economic Development Authority, Revenue Bonds, United Methodist Homes of New Jersey Obligated Group Issue, Refunding Series 2014A, 5.000%, 7/01/29 | | 7/24 at 100.00 | | BBB– | $ | 21,641 | |
| | 335 | | Total Long-Term Care | | | | | | 351,074 | |
| | | | Tax Obligation/General – 9.7% (9.3% of Total Investments) | | | | | | | |
| | 100 | | Bloomfield Township Board of Education, Essex County, New Jersey, General Obligation Bonds, Series 2011, 3.000%, 9/01/16 | | No Opt. Call | | A | | 103,138 | |
| | 10 | | Hillsborough Township School District, Somerset County, New Jersey, General Obligation School Bonds, Series 2001, 5.375%, 10/01/16 – AGM Insured | | No Opt. Call | | AA | | 10,670 | |
| | 150 | | Monmouth County Improvement Authority, New Jersey, Governmental Loan Revenue Bonds, Series 2006, 5.000%, 12/01/15 – AMBAC Insured | | No Opt. Call | | N/R | | 153,818 | |
| | | | Monmouth County Improvement Authority, New Jersey, Governmental Loan Revenue Bonds, Series 2007: | | | | | | | |
| | 50 | | 5.000%, 12/01/15 – AMBAC Insured | | No Opt. Call | | N/R | | 51,264 | |
| | 150 | | 5.000%, 12/01/16 – AMBAC Insured | | No Opt. Call | | N/R | | 159,202 | |
| | 200 | | Monroe Township Board of Education of Gloucester County, New Jersey, General Obligation Bond, Refunding Series 2014, 3.000%, 3/01/17 | | No Opt. Call | | AA– | | 208,228 | |
| | 45 | | Monroe Township Board of Education, Middlesex County, New Jersey, General Obligation Bonds, Refunding Series 2011, 4.000%, 9/15/15 | | No Opt. Call | | AA– | | 45,603 | |
| | 110 | | Monroe Township Board of Education, Middlesex County, New Jersey, General Obligation Bonds, Refunding Series 2015, 5.000%, 3/01/38 | | 3/25 at 100.00 | | AA– | | 125,296 | |
| | 20 | | Montclair Township, Essex County, New Jersey, General Obligation Bonds, Parking Utility, Refunding Series 2014A, 5.000%, 1/01/37 | | 1/24 at 100.00 | | AA+ | | 22,609 | |
| | 500 | | Newark Housing Authority, New Jersey, City-Secured Police Facility Revenue Bonds, South Ward Police Facility, Series 2009A, 6.750%, 12/01/38 – AGC Insured | | 12/19 at 100.00 | | A3 | | 595,725 | |
| | 30 | | North Bergen Township, New Jersey, General Obligation Bonds, General Improvement Series 2009, 4.000%, 2/01/17 | | No Opt. Call | | AA– | | 31,679 | |
| | 350 | | South Brunswick Township Board of Education, Middlesex County, New Jersey, General Obligation Bonds, Refunding School Series 2014, 3.000%, 8/01/15 | | No Opt. Call | | AA+ | | 352,496 | |
| | 25 | | South Brunswick Township, Middlesex County, New Jersey, General Obligation Bonds, Refunding Series 2014, 3.000%, 9/01/17 | | No Opt. Call | | AA | | 26,228 | |
| | 100 | | Sussex County, New Jersey, General Obligation Bonds, Refunding Series 2014, 4.000%, 2/15/22 | | No Opt. Call | | AA+ | | 113,371 | |
| | 80 | | The Board of Education of the Township of Mount Olive, Morris County, New Jersey School Bonds, Refunding Series 2014, 2.000%, 1/15/16 | | No Opt. Call | | AA | | 80,978 | |
| | 150 | | Union County Utilities Authority, New Jersey, Resource Recovery Facility Lease Revenue Refunding Bonds, Covantan Union Inc. Lessee, Series 2011B, 5.250%, 12/01/31 (Alternative Minimum Tax) | | 12/21 at 100.00 | | AA+ | | 163,933 | |
| | 170 | | Union County Utilities Authority, New Jersey, Solid Waste System County Deficiency Revenue Bonds, Series 2011A, 5.000%, 6/15/41 | | 6/21 at 100.00 | | AA+ | | 189,694 | |
| | 25 | | Washington Borough, Warren County, New Jersey, General Obligation Bonds, Series 2008, 4.500%, 3/01/17 – AGM Insured | | No Opt. Call | | A2 | | 26,628 | |
| | 2,265 | | Total Tax Obligation/General | | | | | | 2,460,560 | |
| | | | Tax Obligation/Limited – 29.7% (28.6% of Total Investments) | | | | | | | |
| | 250 | | Burlington County Bridge Commission, New Jersey, Governmental Leasing Program Revenue Bonds, County Guaranteed, Refunding Series 2014, 3.000%, 8/15/16 | | No Opt. Call | | AA | | 258,210 | |
| | 285 | | Garden State Preservation Trust, New Jersey, Open Space and Farmland Preservation Bonds, Series 2005A, 5.750%, 11/01/28 – AGM Insured | | No Opt. Call | | AAA | | 354,266 | |
| | 630 | | Guam Government, Limited Obligation Section 30 Revenue Bonds, Series 2009A, 5.750%, 12/01/34 | | 12/19 at 100.00 | | BBB+ | | 692,080 | |
| NJV | Nuveen New Jersey Municipal Value Fund | |
| | Portfolio of Investments (continued) | April 30, 2015 |
| | Principal | | | | Optional Call | | | | | |
| | Amount (000) | | Description (1) | | Provisions (2) | | Ratings (3) | | Value | |
| | | | Tax Obligation/Limited (continued) | | | | | | | |
| | | | New Jersey Economic Development Authority, Cigarette Tax Revenue Refunding Bonds, Series 2012: | | | | | | | |
| $ | 250 | | 5.000%, 6/15/25 | | 6/22 at 100.00 | | BBB+ | $ | 279,872 | |
| | 400 | | 5.000%, 6/15/28 | | No Opt. Call | | BBB+ | | 438,012 | |
| | 700 | | New Jersey Health Care Facilities Financing Authority, State Contract Bonds, Hospital Asset Transformation Program, Series 2008A, 5.250%, 10/01/38 | | 10/18 at 100.00 | | A– | | 753,879 | |
| | 2,000 | | New Jersey Health Care Facilities Financing Authority, State Contract Bonds, Hospital Asset Transformation Program, Series 2009A, 5.750%, 10/01/31 | | 10/19 at 100.00 | | A– | | 2,276,600 | |
| | 3,380 | | New Jersey Transportation Trust Fund Authority, Transportation System Bonds, Series 2009A, 0.000%, 12/15/39 | | No Opt. Call | | A– | | 967,491 | |
| | 1,300 | | Puerto Rico Sales Tax Financing Corporation, Sales Tax Revenue Bonds, Series 2007A, 0.000%, 8/01/54 – AMBAC Insured | | No Opt. Call | | B | | 91,546 | |
| | 110 | | Union County Improvement Authority, New Jersey, General Obligation Lease Bonds, Juvenile Detention Center Facility Project, Tender Option Bond Trust 1392, 23.818%, 5/01/30 (WI/DD, Settling 5/07/15) (IF) | | No Opt. Call | | Aa1 | | 249,121 | |
| | 1,000 | | Virgin Islands Public Finance Authority, Matching Fund Loan Notes Revenue Bonds, Senior Lien Series 2009A-1, 5.000%, 10/01/39 | | 10/19 at 100.00 | | BBB | | 1,063,850 | |
| | 105 | | Virgin Islands Public Finance Authority, Matching Fund Loan Notes Revenue Bonds, Senior Lien Series 2010A, 5.000%, 10/01/29 | | 10/20 at 100.00 | | BBB | | 114,442 | |
| | 10,410 | | Total Tax Obligation/Limited | | | | | | 7,539,369 | |
| | | | Transportation – 10.7% (10.4% of Total Investments) | | | | | | | |
| | 250 | | Casino Reinvestment Development Authority, New Jersey, Parking Revenue Bonds, Series 2005A, 5.250%, 6/01/20 – NPFG Insured | | 6/15 at 100.00 | | AA– | | 250,878 | |
| | | | Delaware River and Bay Authority, Delaware and New Jersey, Revenue Bonds, Series 2014A: | | | | | | | |
| | 150 | | 4.125%, 1/01/39 | | 1/24 at 100.00 | | A1 | | 156,724 | |
| | 200 | | 5.000%, 1/01/44 | | 1/24 at 100.00 | | A1 | | 224,962 | |
| | 300 | | Delaware River Port Authority, Pennsylvania and New Jersey, Revenue Refunding Bonds, Port District Project, Series 2012, 5.000%, 1/01/27 | | No Opt. Call | | BBB | | 340,491 | |
| | 190 | | New Jersey Economic Development Authority, Private Activity Bonds, The Goethals Bridge Replacement Project, Series 2013, 5.625%, 1/01/52 (Alternative Minimum Tax) | | 1/24 at 100.00 | | BBB– | | 212,937 | |
| | 80 | | New Jersey Economic Development Authority, Special Facilities Revenue Bonds, Continental Airlines Inc., Series 2000A & 2000B, 5.625%, 11/15/30 (Alternative Minimum Tax) | | 3/24 at 101.00 | | B+ | | 90,198 | |
| | 200 | | New Jersey Transit Corporation, Grant Anticipation Notes, Federal Transit Administration Section 5307 Urbanized Area Formula Funds, Series 2014A, 5.000%, 9/15/15 | | No Opt. Call | | A | | 203,532 | |
| | | | New Jersey Turnpike Authority, Revenue Bonds, Series 1991C: | | | | | | | |
| | 35 | | 6.500%, 1/01/16 | | No Opt. Call | | A3 | | 36,441 | |
| | 10 | | 6.500%, 1/01/16 – AMBAC Insured | | No Opt. Call | | A3 | | 10,412 | |
| | 765 | | New Jersey Turnpike Authority, Revenue Bonds, Series 2009E, 5.250%, 1/01/40 | | 1/19 at 100.00 | | A+ | | 847,651 | |
| | 315 | | Port Authority of New York and New Jersey, Consolidated Revenue Bonds, One Hundred Seventy Ninth Series 2013, 5.000%, 12/01/43 | | 12/23 at 100.00 | | AA– | | 355,752 | |
| | 2,495 | | Total Transportation | | | | | | 2,729,978 | |
| | | | U.S. Guaranteed – 5.5% (5.3% of Total Investments) (5) | | | | | | | |
| | 140 | | New Jersey Economic Development Authority, Cigarette Tax Revenue Bonds, Series 2004, 5.500%, 6/15/16 – RAAI Insured (ETM) | | No Opt. Call | | Aaa | | 148,095 | |
| | 1,000 | | New Jersey Health Care Facilities Financing Authority, Revenue Bonds, Hunterdon Medical Center, Series 2006B, 5.000%, 7/01/36 (Pre-refunded 7/01/16) | | 7/16 at 100.00 | | A– (5) | | 1,054,640 | |
| | | | New Jersey Turnpike Authority, Revenue Bonds, Series 1991C: | | | | | | | |
| | 35 | | 6.500%, 1/01/16 (ETM) | | No Opt. Call | | A3 (5) | | 36,468 | |
| | 85 | | 6.500%, 1/01/16 (ETM) | | No Opt. Call | | AA+ (5) | | 88,572 | |
| | 45 | | 6.500%, 1/01/16 (ETM) | | No Opt. Call | | AA+ (5) | | 46,888 | |
| | 30 | | 6.500%, 1/01/16 – NPFG Insured (ETM) | | No Opt. Call | | AA– (5) | | 31,259 | |
| | 1,335 | | Total U.S. Guaranteed | | | | | | 1,405,922 | |
| | Principal | | | | Optional Call | | | | | |
| | Amount (000) | | Description (1) | | Provisions (2) | | Ratings (3) | | Value | |
| | | | Utilities – 1.4% (1.4% of Total Investments) | | | | | | | |
| $ | 300 | | Industrial Pollution Control Financing Authority of Cape May County (New Jersey), Pollution Control Revenue Refunding Bonds, 1991 Series A (Atlantic City Electric Company Project), 6.800%, 3/01/21 – NPFG Insured | | No Opt. Call | | AA– | $ | 364,977 | |
| $ | 27,340 | | Total Municipal Bonds (cost $23,295,013) | | | | | | 25,661,616 | |
| | | | | | | | | | | |
| | Shares | | Description | | | | | | Value | |
| | | | COMMON STOCKS – 2.8% (2.7% of Total Investments) | | | | | | | |
| | | | Airlines – 2.8% (2.7% of Total Investments) | | | | | | | |
| | 15,008 | | American Airlines Group Inc., (6) | | | | | | 724,661 | |
| | | | Total Common Stocks (cost $207,228) | | | | | | 724,661 | |
| | | | Total Long-Term Investments (cost $23,502,241) | | | | | | 26,386,277 | |
| | | | Floating Rate Obligations – (5.9)% | | | | | | (1,500,000 | ) |
| | | | Other Assets Less Liabilities – 2.1% | | | | | | 543,772 | |
| | | | Net Assets Applicable to Common Shares – 100% | | | | | $ | 25,430,049 | |
| (1) | All percentages shown in the Portfolio of Investments are based on net assets applicable to Common shares unless otherwise noted. |
| (2) | Optional Call Provisions (not covered by the report of independent registered public accounting firm): Dates (month and year) and prices of the earliest optional call or redemption. There may be other call provisions at varying prices at later dates. Certain mortgage-backed securities may be subject to periodic principal paydowns. |
| (3) | Ratings (not covered by the report of independent registered public accounting firm): Using the highest of Standard & Poor’s Group (“Standard & Poor’s”), Moody’s Investors Service, Inc. (“Moody’s”) or Fitch, Inc. (“Fitch”) rating. Ratings below BBB by Standard & Poor’s, Baa by Moody’s or BBB by Fitch are considered to be below investment grade. Holdings designated N/R are not rated by any of these national rating agencies. |
| (4) | Investment, or portion of investment, has been pledged to collateralize the net payment obligations for investments in inverse floating rate transactions. |
| (5) | Backed by an escrow or trust containing sufficient U.S. Government or U.S. Government agency securities, which ensure the timely payment of principal and interest. Certain bonds backed by U.S. Government or agency securities are regarded as having an implied rating equal to the rating of such securities. |
| (6) | On November 28, 2011, AMR Corp. (“AMR”), the parent company of American Airlines Group, Inc. (“AAL”) filed for federal bankruptcy protection. On December 9, 2013, AMR emerged from federal bankruptcy with the acceptance of its reorganization plan by the bankruptcy court. Under the settlement agreement established to meet AMR’s unsecured bond obligations, the bondholders, including the Fund, received a distribution of AAL preferred stock which was converted to AAL common stock over a 120-day period. Every 30 days, a quarter of the preferred stock was converted to AAL common stock based on the 5-day volume-weighted average price and the amount of preferred shares tendered during the optional preferred conversion period. |
| (ETM) | Escrowed to maturity. |
| (IF) | Inverse floating rate investment. |
| (UB) | Underlying bond of an inverse floating rate trust reflected as a financing transaction. See Notes to Financial Statements, Note 3 – Portfolio Securities and Investments in Derivatives, Inverse Floating Rate Securities for more information. |
| (WI/DD) | Investment, or portion of investment, purchased on a when-issued or delayed delivery basis. |
See accompanying notes to financial statements.
| NQP | |
| | Nuveen Pennsylvania Investment Quality Municipal Fund |
| | Portfolio of Investments | April 30, 2015 |
| | Principal | | | | Optional Call | | | | | |
| | Amount (000) | | Description (1) | | Provisions (2) | | Ratings (3) | | Value | |
| | | | LONG-TERM INVESTMENTS – 147.7% (100.0% of Total Investments) | | | | | | | |
| | | | MUNICIPAL BONDS – 147.7% (100.0% of Total Investments) | | | | | | | |
| | | | Consumer Staples – 0.4% (0.3% of Total Investments) | | | | | | | |
| $ | 2,000 | | Pennsylvania Economic Development Financing Authority, Solid Waste Disposal Revenue Bonds, Procter & Gamble Paper Project, Series 2001, 5.375%, 3/01/31 (Alternative Minimum Tax) | | No Opt. Call | | AA– | $ | 2,454,220 | |
| | | | Education and Civic Organizations – 23.1% (15.6% of Total Investments) | | | | | | | |
| | 1,500 | | Allegheny County Higher Education Building Authority, Pennsylvania, College Revenue Refunding Bonds, Robert Morris College, Series 1998A, 6.000%, 5/01/28 | | No Opt. Call | | Baa3 | | 1,771,710 | |
| | 5,020 | | Allegheny County Higher Education Building Authority, Pennsylvania, Revenue Bonds, Carnegie Mellon University, Series 2013, 5.000%, 3/01/28 | | 3/23 at 100.00 | | AA– | | 5,830,428 | |
| | | | Allegheny County Higher Education Building Authority, Pennsylvania, Revenue Bonds, Duquesne University, Series 2013A: | | | | | | | |
| | 1,000 | | 5.000%, 3/01/33 | | 3/23 at 100.00 | | A2 | | 1,109,210 | |
| | 2,865 | | 3.500%, 3/01/34 | | 3/23 at 100.00 | | A2 | | 2,707,139 | |
| | 2,610 | | Allegheny County Higher Education Building Authority, Pennsylvania, Revenue Bonds, Robert Morris University, Series 2006A, 4.750%, 2/15/26 | | 2/16 at 100.00 | | Baa3 | | 2,627,383 | |
| | 1,440 | | Chester County Industrial Development Authority, Pennsylvania, Avon Grove Charter School Revenue Bonds, Series 2007A, 6.375%, 12/15/37 | | 12/17 at 100.00 | | BBB– | | 1,533,024 | |
| | 1,020 | | Dallas Area Municipal Authority, Pennsylvania, Revenue Bonds, Misericordia University, Series 2014, 5.000%, 5/01/37 | | 5/24 at 100.00 | | Baa3 | | 1,103,936 | |
| | 750 | | Delaware County Authority, Pennsylvania, General Revenue Bonds, Eastern University, Series 2006, 4.500%, 10/01/27 – RAAI Insured | | 10/16 at 100.00 | | AA | | 761,108 | |
| | | | Erie Higher Education Building Authority, Pennsylvania, College Revenue Bonds, Gannon University, Series 2007-GG3: | | | | | | | |
| | 1,855 | | 5.000%, 5/01/32 – RAAI Insured | | 5/17 at 100.00 | | AA | | 1,902,581 | |
| | 500 | | 5.000%, 5/01/35 – RAAI Insured | | 5/17 at 100.00 | | AA | | 511,855 | |
| | | | Indiana County Industrial Development Authority, Pennsylvania, Revenue Bonds, Student Cooperative Association Inc./Indiana University of Pennsylvania – Student Union Project, Series 1999B: | | | | | | | |
| | 815 | | 0.000%, 11/01/15 – AMBAC Insured | | No Opt. Call | | N/R | | 810,338 | |
| | 815 | | 0.000%, 11/01/16 – AMBAC Insured | | No Opt. Call | | N/R | | 791,797 | |
| | 815 | | 0.000%, 11/01/17 – AMBAC Insured | | No Opt. Call | | N/R | | 768,113 | |
| | 815 | | 0.000%, 11/01/18 – AMBAC Insured | | No Opt. Call | | N/R | | 744,193 | |
| | 815 | | 0.000%, 11/01/19 – AMBAC Insured | | No Opt. Call | | N/R | | 721,593 | |
| | 5,235 | | Lycoming County Authority, Pennsylvania, Revenue Bonds, Pennsylvania College of Technology, Series 2012, 5.000%, 5/01/32 | | 5/22 at 100.00 | | A | | 5,678,351 | |
| | 2,390 | | Montgomery County Higher Education and Health Authority, Pennsylvania, Revenue Bonds, Arcadia University, Series 2006, 4.500%, 4/01/30 – RAAI Insured | | 4/16 at 100.00 | | AA | | 2,415,716 | |
| | 2,155 | | Montgomery County Higher Education and Health Authority, Pennsylvania, Revenue Bonds, Arcadia University, Series 2010, 5.625%, 4/01/40 | | 4/20 at 100.00 | | BBB | | 2,327,874 | |
| | 835 | | New Wilmington, Pennsylvania, Revenue, Westminster College, Series 2007G, 5.125%, 5/01/33 – RAAI Insured | | 5/17 at 100.00 | | AA | | 857,762 | |
| | 1,465 | | Pennsylvania Higher Educational Facilities Authority, Revenue Bonds, Holy Family University, Series 2013A, 6.500%, 9/01/38 | | 9/23 at 100.00 | | BBB– | | 1,626,355 | |
| | | | Pennsylvania Higher Educational Facilities Authority, Bryn Mawr College Revenue Bonds, Series 2014: | | | | | | | |
| | 2,545 | | 5.000%, 12/01/38 | | 12/24 at 100.00 | | AA | | 2,916,010 | |
| | 2,080 | | 5.000%, 12/01/44 | | 12/24 at 100.00 | | AA | | 2,353,894 | |
| | 10,750 | | Pennsylvania Higher Educational Facilities Authority, General Revenue Bonds, State System of Higher Education, Series 2008AH, 5.000%, 6/15/33 | | 6/18 at 100.00 | | Aa3 | | 11,790,921 | |
| | Principal | | | | Optional Call | | | | | |
| | Amount (000) | | Description (1) | | Provisions (2) | | Ratings (3) | | Value | |
| | | | Education and Civic Organizations (continued) | | | | | | | |
| $ | 1,195 | | Pennsylvania Higher Educational Facilities Authority, Philadelphia University Refunding Revenue Bonds, Refunding Series 2013, 5.000%, 6/01/32 | | 6/23 at 100.00 | | BBB | $ | 1,265,816 | |
| | 2,400 | | Pennsylvania Higher Educational Facilities Authority, Revenue Bonds, AICUP Financing Program-Mount Aloysius College Project, Series 2011R-1, 5.000%, 11/01/35 | | 11/21 at 100.00 | | A | | 2,568,840 | |
| | 3,225 | | Pennsylvania Higher Educational Facilities Authority, Revenue Bonds, Allegheny College, Series 2006, 4.750%, 5/01/31 | | 5/16 at 100.00 | | A– | | 3,335,843 | |
| | 6,220 | | Pennsylvania Higher Educational Facilities Authority, Revenue Bonds, Drexel University, Series 2007A, 5.000%, 5/01/37 – NPFG Insured | | 11/17 at 100.00 | | AA– | | 6,725,624 | |
| | 1,500 | | Pennsylvania Higher Educational Facilities Authority, Revenue Bonds, Drexel University, Series 2011A, 5.250%, 5/01/41 | | 5/21 at 100.00 | | A | | 1,659,825 | |
| | 1,000 | | Pennsylvania Higher Educational Facilities Authority, Revenue Bonds, Gwynedd Mercy College, Series 2012-KK1, 5.375%, 5/01/42 | | 5/22 at 100.00 | | BBB | | 1,085,740 | |
| | 320 | | Pennsylvania Higher Educational Facilities Authority, Revenue Bonds, LaSalle University, Series 2012, 4.000%, 5/01/32 | | 11/22 at 100.00 | | BBB+ | | 317,162 | |
| | 8,370 | | Pennsylvania Higher Educational Facilities Authority, Revenue Bonds, Temple University, First Series of 2006, 5.000%, 4/01/21 – NPFG Insured | | 4/16 at 100.00 | | AA– | | 8,735,351 | |
| | 2,000 | | Pennsylvania Higher Educational Facilities Authority, Revenue Bonds, Temple University, First Series of 2012, 5.000%, 4/01/42 | | 4/22 at 100.00 | | Aa3 | | 2,217,880 | |
| | 2,000 | | Pennsylvania Higher Educational Facilities Authority, Revenue Bonds, Thomas Jefferson University, Series 2010, 5.000%, 3/01/40 | | 3/20 at 100.00 | | A1 | | 2,145,200 | |
| | 760 | | Pennsylvania Higher Educational Facilities Authority, Revenue Bonds, Thomas Jefferson University, Series 2012, 5.000%, 3/01/42 | | 9/22 at 100.00 | | A1 | | 840,408 | |
| | 7,125 | | Pennsylvania Higher Educational Facilities Authority, Revenue Bonds, Thomas Jefferson University, Series 2015A, 5.250%, 9/01/50 | | 3/25 at 100.00 | | A1 | | 7,904,190 | |
| | | | Pennsylvania Higher Educational Facilities Authority, Revenue Bonds, University of the Sciences in Philadelphia, Series 2012: | | | | | | | |
| | 1,030 | | 4.000%, 11/01/39 | | 11/22 at 100.00 | | A3 | | 1,043,874 | |
| | 4,300 | | 5.000%, 11/01/42 | | 11/22 at 100.00 | | A3 | | 4,764,228 | |
| | 1,310 | | Pennsylvania Higher Educational Facilities Authority, Revenue Bonds, University of the Sciences in Philadelphia, Series 2015A, 5.000%, 11/01/36 | | 11/25 at 100.00 | | A3 | | 1,461,934 | |
| | 1,540 | | Pennsylvania Higher Educational Facilities Authority, Revenue Bonds, Widener University, Series 2013A, 5.500%, 7/15/38 | | No Opt. Call | | A– | | 1,709,277 | |
| | 1,585 | | Pennsylvania Higher Educational Facilities Authority, Revenue Bonds, York College Project, Series 2005EE1, 5.250%, 11/01/27 – SYNCORA GTY Insured | | 11/15 at 100.00 | | A | | 1,622,628 | |
| | 6,500 | | Pennsylvania State University, General Revenue Bonds, Series 2005, 5.000%, 9/01/29 | | 9/15 at 100.00 | | AA | | 6,597,825 | |
| | 3,005 | | Pennsylvania State University, General Revenue Bonds, Series 2010, 5.000%, 3/01/35 | | 3/20 at 100.00 | | AA | | 3,423,026 | |
| | 10,600 | | Pennsylvania State University, General Revenue Bonds, Tender Option Bond Trust 2015-XF0071, 4.500%, 8/15/36 (UB) | | 8/16 at 100.00 | | AA | | 11,019,972 | |
| | 1,000 | | Philadelphia Authority for Industrial Development, Pennsylvania, Revenue Bonds, Leadership Learning Partners, Series 2005A, 5.375%, 7/01/36 (6) | | 7/15 at 100.00 | | N/R | | 699,950 | |
| | 4,500 | | Philadelphia Authority for Industrial Development, Pennsylvania, Revenue Bonds, Philadelphia Performing Arts Charter School, Series 2013, 6.750%, 6/15/43 | | 6/20 at 100.00 | | BB– | | 4,611,690 | |
| | 500 | | Philadelphia Authority for Industrial Development, Pennsylvania, Revenue Bonds, Richard Allen Preparatory Charter School, Series 2006, 6.250%, 5/01/33 | | 5/16 at 100.00 | | BB+ | | 505,235 | |
| | 5,000 | | State Public School Building Authority, Pennsylvania, College Revenue Bonds, Northampton County Area Community College, Series 2011, 5.500%, 3/01/31 | | 3/21 at 100.00 | | A1 | | 5,802,300 | |
| | 1,100 | | Wilkes-Barre Finance Authority, Pennsylvania, Revenue Bonds, University of Scranton, Series 2010, 5.000%, 11/01/40 | | 11/20 at 100.00 | | A | | 1,201,728 | |
| | 128,175 | | Total Education and Civic Organizations | | | | | | 136,926,837 | |
| NQP | Nuveen Pennsylvania Investment Quality Municipal Fund | |
| | Portfolio of Investments (continued) | April 30, 2015 |
| | Principal | | | | Optional Call | | | | | |
| | Amount (000) | | Description (1) | | Provisions (2) | | Ratings (3) | | Value | |
| | | | Health Care – 30.4% (20.6% of Total Investments) | | | | | | | |
| | | | Allegheny County Hospital Development Authority, Pennsylvania, Revenue Bonds, Ohio Valley General Hospital, Series 2005A: | | | | | | | |
| $ | 2,300 | | 5.000%, 4/01/25 | | 7/15 at 100.00 | | Ba3 | $ | 2,300,207 | |
| | 4,160 | | 5.125%, 4/01/35 | | 7/15 at 100.00 | | Ba3 | | 4,157,254 | |
| | | | Beaver County Hospital Authority, Pennsylvania, Revenue Bonds, Heritage Valley Health System, Inc., Series 2012: | | | | | | | |
| | 4,010 | | 5.000%, 5/15/26 | | 5/21 at 100.00 | | A+ | | 4,573,686 | |
| | 1,910 | | 5.000%, 5/15/27 | | 5/21 at 100.00 | | A+ | | 2,161,318 | |
| | 2,000 | | 5.000%, 5/15/28 | | 5/21 at 100.00 | | A+ | | 2,256,020 | |
| | 3,300 | | Berks County Municipal Authority, Pennsylvania, Revenue Bonds, Reading Hospital and Medical Center Project, Series 2012A, 4.500%, 11/01/41 | | 5/22 at 100.00 | | AA– | | 3,408,042 | |
| | 4,000 | | Central Bradford Progress Authority, Pennsylvania, Revenue Bonds, Guthrie Health, Refunding Series 2011, 5.375%, 12/01/41 | | 12/21 at 100.00 | | AA– | | 4,551,000 | |
| | 4,100 | | Centre County Hospital Authority, Pennsylvania, Hospital Revenue Bonds, Mount Nittany Medical Center Project, Series 2011, 7.000%, 11/15/46 | | 11/21 at 100.00 | | A– | | 4,972,685 | |
| | 1,595 | | Chester County Health and Educational Facilities Authority, Pennsylvania, Health System Revenue Bonds, Jefferson Health System, Series 2010A, 5.000%, 5/15/40 | | 5/20 at 100.00 | | AA | | 1,754,963 | |
| | 3,400 | | Dauphin County General Authority, Pennsylvania, Health System Revenue Bonds, Pinnacle Health System Project, Series 2012A, 5.000%, 6/01/42 | | 6/22 at 100.00 | | A | | 3,647,996 | |
| | 1,500 | | Doylestown Hospital Authority, Pennsylvania, Hospital Revenue Bonds, Series 2013A, 5.000%, 7/01/28 | | 7/23 at 100.00 | | BBB | | 1,617,675 | |
| | 3,000 | | Erie County Hospital Authority, Pennsylvania, Hospital Revenue Bonds, Saint Vincent Health Center Project, Series 2010A, 7.000%, 7/01/27 | | 7/20 at 100.00 | | Ba2 | | 3,202,560 | |
| | 850 | | Erie County Hospital Authority, Pennsylvania, Revenue Bonds, Hamot Health Foundation, Series 2007, 5.000%, 11/01/37 – CIFG Insured | | 11/17 at 100.00 | | Aa3 | | 901,459 | |
| | 6,840 | | Franklin County Industrial Development Authority, Pennsylvania, Revenue Bonds, Chambersburg Hospital Project, Series 2010, 5.375%, 7/01/42 | | 7/20 at 100.00 | | A+ | | 7,514,287 | |
| | 500 | | Fulton County, Pennsylvania, Industrial Development Authority Hospital Revenue Bonds, Fulton County Medical Center Project, Series 2006, 5.900%, 7/01/40 | | 7/16 at 100.00 | | N/R | | 507,390 | |
| | 4,555 | | Geisinger Authority, Montour County, Pennsylvania, Health System Revenue Bonds, Geisinger Health System, Series 2014A, 5.000%, 6/01/41 | | 6/24 at 100.00 | | AA | | 5,097,774 | |
| | 1,370 | | Indiana County Hospital Authority, Pennsylvania, Hospital Revenue Bonds, Indiana Regional Medical Center, Series 2014A, 6.000%, 6/01/39 | | 6/23 at 100.00 | | Baa3 | | 1,551,087 | |
| | 3,385 | | Lancaster County Hospital Authority, Pennsylvania, Health System Revenue Bonds, Lancaster General Hospital Project, Tender Option Bond Trust 2015-XF0064, 13.562%, 1/01/36 (IF) | | 1/22 at 100.00 | | AA– | | 4,314,724 | |
| | 3,775 | | Lancaster County Hospital Authority, Pennsylvania, Hospital Revenue Bonds, The Lancaster General Hospital Project, Series 2007A, 5.000%, 3/15/26 | | 3/17 at 100.00 | | AA– | | 4,039,590 | |
| | | | Lebanon County Health Facilities Authority, Pennsylvania, Revenue Bonds, Good Samaritan Hospital Project, Series 2002: | | | | | | | |
| | 250 | | 5.800%, 11/15/22 | | 7/15 at 100.00 | | B+ | | 250,183 | |
| | 9,040 | | 5.900%, 11/15/28 | | 4/15 at 100.00 | | B+ | | 9,047,142 | |
| | 7,660 | | Lehigh County General Purpose Authority, Pennsylvania, Hospital Revenue Bonds, Lehigh Valley Health Network, Series 2008A, 5.000%, 7/01/33 – AGM Insured | | 7/18 at 100.00 | | AA | | 8,201,102 | |
| | 3,780 | | Lehigh County General Purpose Authority, Pennsylvania, Hospital Revenue Bonds, Lehigh Valley Health Network, Series 2012B, 4.000%, 7/01/43 | | No Opt. Call | | A+ | | 3,764,011 | |
| | | | Lehigh County General Purpose Authority, Pennsylvania, Revenue Bonds, Good Shepherd Group, Series 2007: | | | | | | | |
| | 9,850 | | 5.000%, 11/01/30 – AGC Insured | | 11/17 at 100.00 | | AA | | 10,654,448 | |
| | 2,180 | | 5.000%, 11/01/37 – AGC Insured | | 11/17 at 100.00 | | AA | | 2,360,569 | |
| | 4,600 | | Lehigh County General Purpose Authority, Pennsylvania, Revenue Bonds, Good Shepherd Group, Series 2012, 4.000%, 11/01/32 | | No Opt. Call | | A | | 4,601,472 | |
| | Principal | | | | Optional Call | | | | | |
| | Amount (000) | | Description (1) | | Provisions (2) | | Ratings (3) | | Value | |
| | | | Health Care (continued) | | | | | | | |
| | | | Lycoming County Authority, Pennsylvania, Health System Revenue Bonds, Susquehanna Health System Project, Series 2009A: | | | | | | | |
| $ | 6,000 | | 5.500%, 7/01/28 | | 7/19 at 100.00 | | A– | $ | 6,549,059 | |
| | 2,700 | | 5.750%, 7/01/39 | | 7/19 at 100.00 | | A– | | 2,936,358 | |
| | | | Monroe County Hospital Authority, Pennsylvania, Hospital Revenue Bonds, Pocono Medical Center, Series 2012A: | | | | | | | |
| | 365 | | 4.000%, 1/01/25 | | 1/22 at 100.00 | | A | | 383,633 | |
| | 3,000 | | 5.000%, 1/01/41 | | 1/22 at 100.00 | | A | | 3,214,740 | |
| | 1,660 | | Monroe County Hospital Authority, Pennsylvania, Hospital Revenue Bonds, Pocono Medical Center, Series 2007, 5.125%, 1/01/37 | | 1/17 at 100.00 | | A | | 1,716,672 | |
| | 3,730 | | Montgomery County Higher Education and Health Authority, Pennsylvania, Hospital Revenue Bonds, Abington Memorial Hospital Obligated Group, Series 2012A, 5.000%, 6/01/31 | | 6/22 at 100.00 | | A | | 4,121,426 | |
| | 1,115 | | Montgomery County Industrial Development Authority, Pennsylvania, FHA Insured Mortgage Revenue Bonds, New Regional Medical Center Project, Series 2010, 5.375%, 8/01/38 | | 8/20 at 100.00 | | AA | | 1,266,540 | |
| | 925 | | Montgomery County Industrial Development Authority, Pennsylvania, Health Facilities Revenue Bonds, Jefferson Health System, Series 2012A, 5.000%, 10/01/41 | | 4/22 at 100.00 | | AA | | 1,004,846 | |
| | | | Northampton County General Purpose Authority, Pennsylvania, Hospital Revenue Bonds, Saint Lukes Hospital Project, Series 2008A: | | | | | | | |
| | 1,235 | | 5.250%, 8/15/23 | | 8/18 at 100.00 | | A– | | 1,370,825 | |
| | 2,000 | | 5.500%, 8/15/35 | | 8/18 at 100.00 | | A– | | 2,213,100 | |
| | 4,205 | | Pennsylvania Economic Development Financing Authority, Health System Revenue Bonds , Albert Einstein Healthcare, Series 2009A, 6.250%, 10/15/23 | | 10/19 at 100.00 | | Baa2 | | 4,886,336 | |
| | 4,000 | | Pennsylvania Economic Development Financing Authority, Revenue Bonds, University of Pittsburgh Medical Center Health System, Series 2013A, 5.000%, 7/01/43 | | 7/23 at 100.00 | | Aa3 | | 4,419,960 | |
| | 3,100 | | Pennsylvania Higher Educational Facilities Authority, Revenue Bonds, University of Pennsylvania Health System, Series 2012A, 5.000%, 8/15/42 | | 8/22 at 100.00 | | AA– | | 3,417,781 | |
| | 2,440 | | Philadelphia Hospitals and Higher Education Facilities Authority, Pennsylvania, Hospital Revenue Bonds, Children’s Hospital of Philadelphia, Tender Option Bond Trust 2015-XF0114, 13.553%, 7/01/19 (IF) | | No Opt. Call | | AA | | 3,188,324 | |
| | 4,650 | | Philadelphia Hospitals and Higher Education Facilities Authority, Pennsylvania, Hospital Revenue Bonds, Temple University Health System Obligated Group, Series 2012A, 5.625%, 7/01/42 | | 7/22 at 100.00 | | BB+ | | 4,943,508 | |
| | | | Pocono Mountains Industrial Park Authority, Pennsylvania, Hospital Revenue Bonds, Saint Luke’s Hospital -Monroe Project, Series 2015A: | | | | | | | |
| | 3,000 | | 5.000%, 8/15/40 | | 2/25 at 100.00 | | A– | | 3,306,090 | |
| | 1,300 | | 4.000%, 8/15/45 | | 2/25 at 100.00 | | A– | | 1,261,026 | |
| | 640 | | Saint Mary Hospital Authority, Pennsylvania, Health System Revenue Bonds, Catholic Health East, Series 2010A, 5.000%, 11/15/40 | | 11/20 at 100.00 | | AA | | 710,067 | |
| | | | Southcentral Pennsylvania General Authority, Revenue Bonds, Hanover Hospital Inc., Series 2005: | | | | | | | |
| | 500 | | 5.000%, 12/01/25 – RAAI Insured | | 12/15 at 100.00 | | AA | | 507,835 | |
| | 1,000 | | 5.000%, 12/01/27 – RAAI Insured | | 12/15 at 100.00 | | AA | | 1,014,730 | |
| | 700 | | 5.000%, 12/01/29 – RAAI Insured | | 12/15 at 100.00 | | AA | | 709,856 | |
| | 1,415 | | 5.000%, 12/01/30 – RAAI Insured | | 12/15 at 100.00 | | AA | | 1,434,343 | |
| | 3,000 | | Southcentral Pennsylvania General Authority, Revenue Bonds, Wellspan Health Obligated Group, Series 2014A, 5.000%, 6/01/44 | | 6/24 at 100.00 | | Aa3 | | 3,330,300 | |
| | | | Union County Hospital Authority, Pennsylvania, Hospital Revenue Bonds, Evangelical Community Hospital Project, Refunding and Improvement Series 2011: | | | | | | | |
| | 3,130 | | 6.875%, 8/01/31 | | 8/21 at 100.00 | | BBB+ | | 3,736,844 | |
| | 2,500 | | 7.000%, 8/01/41 | | 8/21 at 100.00 | | BBB+ | | 2,981,975 | |
| | 3,470 | | Washington County Hospital Authority, Pennsylvania, Hospital Revenue Bonds, The Washington Hospital Project, Series 2013A, 5.000%, 7/01/28 | | 7/23 at 100.00 | | BBB+ | | 3,808,464 | |
| NQP | Nuveen Pennsylvania Investment Quality Municipal Fund | |
| | Portfolio of Investments (continued) | April 30, 2015 |
| | Principal | | | | Optional Call | | | | | |
| | Amount (000) | | Description (1) | | Provisions (2) | | Ratings (3) | | Value | |
| | | | Health Care (continued) | | | | | | | |
| | | | West Shore Area Authority, Cumberland County, Pennsylvania, Hospital Revenue Bonds, Holy Spirit Hospital of the Sisters of Christian Charity Project, Series 2011: | | | | | | | |
| $ | 325 | | 6.250%, 1/01/31 | | 1/21 at 100.00 | | AA | $ | 390,179 | |
| | 4,555 | | 6.500%, 1/01/36 | | 1/21 at 100.00 | | AA | | 5,480,303 | |
| | | | West Shore Area Authority, Cumberland County, Pennsylvania, Hospital Revenue Bonds, Holy Spirit Hospital of the Sisters of Christian Charity, Series 2011B: | | | | | | | |
| | 1,500 | | 5.625%, 1/01/32 | | 1/22 at 100.00 | | AA | | 1,772,115 | |
| | 1,970 | | 5.750%, 1/01/41 | | 1/22 at 100.00 | | AA | | 2,313,370 | |
| | 575 | | Westmoreland County Industrial Development Authority, Pennsylvania, Health System Revenue Bonds, Excela Health Project, Series 2010A, 5.125%, 7/01/30 | | 7/20 at 100.00 | | A3 | | 627,469 | |
| | 164,615 | | Total Health Care | | | | | | 180,426,718 | |
| | | | Housing/Multifamily – 4.1% (2.8% of Total Investments) | | | | | | | |
| | 160 | | Chester County Industrial Development Authority, Pennsylvania, Student Housing Revenue Bonds, University Student Housing, LLC Project at West Chester University Series 2013A, 5.000%, 8/01/45 | | 8/23 at 100.00 | | Baa3 | | 170,219 | |
| | 1,235 | | East Hempfield Township Industrial Development Authority, Pennsylvania, Student Services Inc – Student Housing Project at Millersville University, Series 2014, 5.000%, 7/01/46 | | No Opt. Call | | BBB– | | 1,299,146 | |
| | 1,900 | | East Hempfield Township Industrial Development Authority, Pennsylvania, Student Services Inc – Student Housing Project at Millersville University, Series 2015, 5.000%, 7/01/47 (WI/DD, Settling 5/05/15) | | 7/25 at 100.00 | | BBB– | | 2,006,913 | |
| | 1,300 | | Pennsylvania Higher Educational Facilities Authority, Revenue Bonds, Edinboro University Foundation Student Housing Project, Series 2010, 6.000%, 7/01/43 | | 7/20 at 100.00 | | Baa3 | | 1,416,103 | |
| | | | Pennsylvania Higher Educational Facilities Authority, Revenue Bonds, Foundation for Student Housing at Indiana University, Project Series 2012A: | | | | | | | |
| | 1,000 | | 5.000%, 7/01/27 | | 7/22 at 100.00 | | BBB+ | | 1,102,680 | |
| | 750 | | 5.000%, 7/01/32 | | 7/22 at 100.00 | | BBB+ | | 808,913 | |
| | 370 | | Pennsylvania Higher Educational Facilities Authority, Revenue Bonds, Shippensburg University Student Services, Inc. Student Housing Project at Shippensburg University of Pennsylvania, Series 2012, 5.000%, 10/01/44 | | No Opt. Call | | BBB– | | 385,281 | |
| | | | Pennsylvania Higher Educational Facilities Authority, Revenue Bonds, Slippery Rock University Foundation Inc. Student Housing Project, Series 2005A: | | | | | | | |
| | 2,035 | | 5.000%, 7/01/19 – SYNCORA GTY Insured | | 7/15 at 100.00 | | BBB | | 2,046,600 | |
| | 8,025 | | 5.000%, 7/01/37 – SYNCORA GTY Insured | | 7/15 at 100.00 | | BBB | | 8,042,012 | |
| | 5,000 | | Pennsylvania Higher Educational Facilities Authority, Revenue Bonds, Slippery Rock University Foundation Inc., Series 2007A, 5.000%, 7/01/39 – SYNCORA GTY Insured | | 7/17 at 100.00 | | BBB | | 5,066,300 | |
| | 1,760 | | Philadelphia Authority for Industrial Development, Pennsylvania, Multifamily Housing Revenue Bonds, Presbyterian Homes Germantown – Morrisville Project, Series 2005A, 5.625%, 7/01/35 | | 5/15 at 102.00 | | Baa3 | | 1,791,258 | |
| | 23,535 | | Total Housing/Multifamily | | | | | | 24,135,425 | |
| | | | Housing/Single Family – 4.6% (3.1% of Total Investments) | | | | | | | |
| | 1,455 | | Pennsylvania Housing Finance Agency, Single Family Mortgage Revenue Bonds, Series 2006-96B, 3.950%, 4/01/16 | | No Opt. Call | | AA+ | | 1,495,769 | |
| | | | Pennsylvania Housing Finance Agency, Single Family Mortgage Revenue Bonds, Series 2007-97A: | | | | | | | |
| | 1,355 | | 4.600%, 10/01/27 (Alternative Minimum Tax) | | 10/16 at 100.00 | | AA+ | | 1,400,271 | |
| | 2,455 | | 4.600%, 10/01/27 (Alternative Minimum Tax) (UB) | | 10/16 at 100.00 | | AA+ | | 2,537,021 | |
| | | | Pennsylvania Housing Finance Agency, Single Family Mortgage Revenue Bonds, Series 2012-114: | | | | | | | |
| | 4,595 | | 3.300%, 10/01/32 | | No Opt. Call | | AA+ | | 4,440,792 | |
| | 2,265 | | 3.650%, 10/01/37 | | No Opt. Call | | AA+ | | 2,258,069 | |
| | 2,655 | | 3.700%, 10/01/42 | | No Opt. Call | | AA+ | | 2,601,077 | |
| | | | Pennsylvania Housing Finance Agency, Single Family Mortgage Revenue Bonds, Series 2015-116B: | | | | | | | |
| | 2,330 | | 3.950%, 10/01/40 | | 10/24 at 100.00 | | AA+ | | 2,307,772 | |
| | 3,315 | | 4.000%, 4/01/45 | | 10/24 at 100.00 | | AA+ | | 3,291,994 | |
| | 1,050 | | Pennsylvania Housing Finance Agency, Single Family Mortgage Revenue Bonds, Tender Option Bond Trust 2015-XF0066, 14.221%, 4/01/29 (Alternative Minimum Tax) (IF) | | 10/22 at 100.00 | | AA+ | | 1,231,325 | |
| | Principal | | | | Optional Call | | | | | |
| | Amount (000) | | Description (1) | | Provisions (2) | | Ratings (3) | | Value | |
| | | | Housing/Single Family (continued) | | | | | | | |
| | | | Pennsylvania Housing Finance Agency, Single Family Mortgage Revenue Bonds, Tender Option Bonds Trust 2015-XF0109: | | | | | | | |
| $ | 4,150 | | 12.317%, 4/01/27 (IF) (4) | | 4/21 at 100.00 | | AA+ | $ | 4,839,191 | |
| | 600 | | 10.434%, 4/01/33 (IF) (4) | | 10/22 at 100.00 | | AA+ | | 625,362 | |
| | 26,225 | | Total Housing/Single Family | | | | | | 27,028,643 | |
| | | | Industrials – 1.1% (0.7% of Total Investments) | | | | | | | |
| | 750 | | Allegheny County Industrial Development Authority, Pennsylvania, Revenue Bonds, United States Steel Corporation, Series 2005, 5.500%, 11/01/16 | | No Opt. Call | | BB– | | 782,813 | |
| | | | Pennsylvania Economic Development Financing Authority, Exempt Facilities Revenue Refunding Bonds, Amtrak Project, Series 2012A: | | | | | | | |
| | 2,495 | | 5.000%, 11/01/23 (Alternative Minimum Tax) | | 11/22 at 100.00 | | A1 | | 2,840,558 | |
| | 545 | | 5.000%, 11/01/27 (Alternative Minimum Tax) | | 11/22 at 100.00 | | A1 | | 600,863 | |
| | 2,000 | | 5.000%, 11/01/41 (Alternative Minimum Tax) | | 11/22 at 100.00 | | A1 | | 2,144,600 | |
| | 5,790 | | Total Industrials | | | | | | 6,368,834 | |
| | | | Long-Term Care – 5.0% (3.4% of Total Investments) | | | | | | | |
| | | | Bucks County Industrial Development Authority, Pennsylvania, Revenue Bonds, Lutheran Community at Telford Center, Series 2007: | | | | | | | |
| | 470 | | 5.750%, 1/01/27 | | 1/17 at 100.00 | | N/R | | 479,315 | |
| | 760 | | 5.750%, 1/01/37 | | 1/17 at 100.00 | | N/R | | 769,994 | |
| | 5,000 | | Cumberland County Municipal Authority Revenue Bonds, Pennsylvania, Diakon Lutheran Social Ministries Project, Series 2009, 6.375%, 1/01/39 | | 1/19 at 100.00 | | BBB+ | | 5,531,549 | |
| | 6,505 | | Cumberland County Municipal Authority, Pennsylvania, Revenue Bonds, Diakon Lutheran Social Ministries, Series 2007, 5.000%, 1/01/36 | | 1/17 at 100.00 | | BBB+ | | 6,625,017 | |
| | 2,030 | | Delaware County Authority, Revenue Bonds, Elwyn, Inc. Project, Series 2010, 5.000%, 6/01/21 | | 6/17 at 100.00 | | BBB | | 2,138,544 | |
| | 640 | | Lancaster County Hospital Authority, Pennsylvania, Health Center Revenue Bonds, Masonic Villages Project, Series 2015, 5.000%, 11/01/35 | | 5/25 at 100.00 | | A | | 713,280 | |
| | 530 | | Lancaster County Hospital Authority, Pennsylvania, Health Center Revenue Bonds, Saint Anne’s Retirement Community, Inc., Series 2012, 5.000%, 4/01/33 | | 4/22 at 100.00 | | BB+ | | 546,223 | |
| | 370 | | Lancaster County Hospital Authority, Pennsylvania, Revenue Bonds, Brethren Village Project, Series 2008A, 6.375%, 7/01/30 | | 7/17 at 100.00 | | N/R | | 387,238 | |
| | | | Lancaster Industrial Development Authority, Pennsylvania, Revenue Bonds, Garden Spot Village Project, Series 2013: | | | | | | | |
| | 1,000 | | 5.375%, 5/01/28 | | 5/23 at 100.00 | | BBB | | 1,081,400 | |
| | 1,665 | | 5.750%, 5/01/35 | | 5/23 at 100.00 | | BBB | | 1,819,362 | |
| | 1,500 | | Langhorne Manor Boro Higher Education and Health Authority, Pennsylvania, Revenue Bonds, Woods Services Project, Series 2013, 4.000%, 11/15/38 | | 11/18 at 100.00 | | A– | | 1,496,565 | |
| | 2,115 | | Montgomery County Industrial Development Authority, Pennsylvania, Revenue Refunding Bonds, ACTS Retirement-Life Communities, Inc., Series 2012, 5.000%, 11/15/26 | | 5/22 at 100.00 | | A– | | 2,302,347 | |
| | | | Philadelphia Authority for Industrial Development, Pennsylvania, Revenue Bonds, Philadelphia Corporation for the Aging Project, Series 2001B: | | | | | | | |
| | 1,420 | | 5.250%, 7/01/23 – AMBAC Insured | | 7/15 at 100.00 | | BBB | | 1,424,828 | |
| | 1,500 | | 5.250%, 7/01/26 – AMBAC Insured | | 7/15 at 100.00 | | BBB | | 1,504,470 | |
| | 2,875 | | 5.250%, 7/01/31 – AMBAC Insured | | 7/15 at 100.00 | | BBB | | 2,882,590 | |
| | 28,380 | | Total Long-Term Care | | | | | | 29,702,722 | |
| | | | Materials – 1.6% (1.1% of Total Investments) | | | | | | | |
| | 2,940 | | Bradford County Industrial Development Authority, Pennsylvania, Solid Waste Disposal Revenue Bonds, International Paper Company, Series 2005B, 5.200%, 12/01/19 (Alternative Minimum Tax) | | 12/15 at 100.00 | | BBB | | 2,997,359 | |
| | 6,110 | | Pennsylvania Economic Development Financing Authority, Exempt Facilities Revenue Bonds, National Gypsum Company, Refunding Series 2014, 5.500%, 11/01/44 (Alternative Minimum Tax) | | 11/24 at 100.00 | | N/R | | 6,297,332 | |
| | 9,050 | | Total Materials | | | | | | 9,294,691 | |
| NQP | Nuveen Pennsylvania Investment Quality Municipal Fund | |
| | Portfolio of Investments (continued) | April 30, 2015 |
| | Principal | | | | Optional Call | | | | | |
| | Amount (000) | | Description (1) | | Provisions (2) | | Ratings (3) | | Value | |
| | | | Tax Obligation/General – 28.0% (19.0% of Total Investments) | | | | | | | |
| $ | 3,930 | | Allegheny County, Pennsylvania, General Obligation Bonds, Series 2011C-65, 5.375%, 5/01/31 Allegheny County, Pennsylvania, General Obligation Bonds, Series 2013C-72: | | 5/21 at 100.00 | | AA– | $ | 4,574,009 | |
| | 2,780 | | 5.250%, 12/01/32 | | 12/23 at 100.00 | | AA– | | 3,191,329 | |
| | 2,000 | | 5.250%, 12/01/33 | | 12/23 at 100.00 | | AA– | | 2,295,920 | |
| | | | Allegheny County, Pennsylvania, General Obligation Bonds, Series 2014C-74: | | | | | | | |
| | 1,750 | | 5.000%, 12/01/32 | | 12/24 at 100.00 | | AA– | | 1,991,185 | |
| | 1,285 | | 5.000%, 12/01/34 | | 12/24 at 100.00 | | AA– | | 1,458,706 | |
| | 5,100 | | Allegheny County, Pennsylvania, General Obligation Bonds, Series C69-C70 of 2012, 5.000%, 12/01/37 | | 12/22 at 100.00 | | AA– | | 5,677,524 | |
| | 6,025 | | Bethel Park School District, Allegheny County, Pennsylvania, General Obligation Bonds, Series 2009, 5.000%, 8/01/29 | | 8/19 at 100.00 | | Aa2 | | 6,843,014 | |
| | 3,000 | | Bristol Township School District, Bucks County, Pennsylvania, General Obligation Bonds, Series 2013, 5.250%, 6/01/43 | | 6/23 at 100.00 | | A1 | | 3,414,420 | |
| | | | Canon-McMillan School District, Washington County, Pennsylvania, General Obligation Bonds, Series 2014D: | | | | | | | |
| | 3,000 | | 5.000%, 12/15/37 | | 12/24 at 100.00 | | AA | | 3,391,110 | |
| | 1,075 | | 5.000%, 12/15/38 – BAM Insured | | 12/24 at 100.00 | | AA | | 1,213,256 | |
| | 1,100 | | 5.000%, 12/15/39 | | 12/24 at 100.00 | | AA | | 1,241,471 | |
| | | | Centre County, Pennsylvania, General Obligation Bonds, Series 2012B: | | | | | | | |
| | 310 | | 4.000%, 7/01/24 | | 7/20 at 100.00 | | AA | | 335,541 | |
| | 1,430 | | 4.000%, 7/01/25 | | 7/20 at 100.00 | | AA | | 1,538,065 | |
| | 915 | | 4.000%, 7/01/26 | | 7/20 at 100.00 | | AA | | 974,969 | |
| | 10,000 | | Delaware Valley Regional Finance Authority, Pennsylvania, Local Government Revenue Bonds, Series 2002, 5.750%, 7/01/17 (UB) | | No Opt. Call | | A+ | | 10,975,800 | |
| | 7,450 | | Erie City School District, Erie County, Pennsylvania, General Obligation Bonds, Series 2000, 0.000%, 9/01/30 – AMBAC Insured | | No Opt. Call | | N/R | | 4,135,570 | |
| | 6,680 | | Gateway School District, Allegheny County, Pennsylvania, General Obligation Bonds, Refunding Series 2012, 4.000%, 10/15/32 | | 10/22 at 100.00 | | Aa3 | | 6,913,666 | |
| | 1,050 | | Hampton Township School District, Allegheny County, Pennsylvania, General Obligation Bonds, Refunding Series 2011A, 4.000%, 11/15/18 | | No Opt. Call | | AA– | | 1,150,023 | |
| | 2,000 | | Hempfield School District, Lancaster County, Pennsylvania, General Obligation Bonds, Series 2011A, 4.000%, 10/15/15 | | No Opt. Call | | Aa2 | | 2,034,560 | |
| | 260 | | Lower Merion School District, Montgomery County, Pennsylvania, General Obligation Bonds, Series 2007, 5.000%, 9/01/23 | | 9/17 at 100.00 | | Aaa | | 285,550 | |
| | 1,260 | | Luzerne County, Pennsylvania, General Obligation Bonds, Series 2003C, 5.250%, 12/15/16 – FGIC Insured | | No Opt. Call | | AA– | | 1,333,521 | |
| | 2,000 | | Luzerne County, Pennsylvania, General Obligation Bonds, Series 2008B, 5.000%, 12/15/27 – AGM Insured | | 6/18 at 100.00 | | AA | | 2,179,340 | |
| | 2,620 | | Pennsylvania Economic Development Financing Authority, Parking System Revenue Bonds, Capitol Region Parking System, Junior Insured Series 2013C, 5.500%, 1/01/30 – AGM Insured | | 1/24 at 100.00 | | AA | | 3,079,469 | |
| | 5,000 | | Pennsylvania Public School Building Authority, Lease Revenue Bonds, School District of Philadelphia, Series 2006B, 5.000%, 6/01/33 – AGM Insured | | 12/16 at 100.00 | | AA | | 5,281,200 | |
| | 9,665 | | Pennsylvania State, General Obligation Bonds, Tender Option Bonds 2015-XF0084, 12.660%, 9/01/16 (IF) | | No Opt. Call | | AA– | | 11,703,542 | |
| | 3,925 | | Philadelphia School District, Pennsylvania, General Obligation Bonds, Series 2007A, 5.000%, 6/01/34 – FGIC Insured | | No Opt. Call | | AA– | | 4,481,644 | |
| | 1,555 | | Philadelphia School District, Pennsylvania, General Obligation Bonds, Series 2011D, 4.000%, 9/01/15 | | No Opt. Call | | A+ | | 1,574,562 | |
| | 3,345 | | Philadelphia, Pennsylvania, General Obligation Bonds, Refunding Series 2011, 6.500%, 8/01/41 | | 8/20 at 100.00 | | A+ | | 4,016,040 | |
| | 1,425 | | Pine-Richland School District, Pennsylvania, General Obligation Bonds, Refunding Series 2014B, 3.375%, 11/01/33 | | 11/24 at 100.00 | | AA– | | 1,424,801 | |
| | Principal | | | | Optional Call | | | | | |
| | Amount (000) | | Description (1) | | Provisions (2) | | Ratings (3) | | Value | |
| | | | Tax Obligation/General (continued) | | | | | | | |
| $ | 9,700 | | Pine-Richland School District, Pennsylvania, General Obligation Bonds, School Improvement Series 2005, 5.000%, 7/15/35 – AGM Insured | | 7/15 at 100.00 | | AA | $ | 9,782,159 | |
| | 745 | | Pittsburgh School District, Allegheny County, Pennsylvania, General Obligation Bonds, Series 2014A, 5.000%, 9/01/25 – BAM Insured | | 9/22 at 100.00 | | AA | | 864,230 | |
| | 3,000 | | Pittsburgh School District, Allegheny County, Pennsylvania, General Obligation Refunding Bonds, Series 2002A, 5.500%, 9/01/15 – AGM Insured | | No Opt. Call | | AA | | 3,053,100 | |
| | | | Pittsburgh, Pennsylvania, General Obligation Bonds, Series 2012B: | | | | | | | |
| | 2,590 | | 5.000%, 9/01/25 | | 9/22 at 100.00 | | A+ | | 3,013,284 | |
| | 6,790 | | 5.000%, 9/01/26 | | 9/22 at 100.00 | | A+ | | 7,830,907 | |
| | 2,925 | | Pittsburgh, Pennsylvania, General Obligation Bonds, Series 2006B, 5.250%,
9/01/16 – AGM Insured | | No Opt. Call | | AA | | 3,111,908 | |
| | 2,510 | | Radnor Township School District, Delaware County, Pennsylvania, General Obligation Bonds, Series 2012, 3.000%, 2/15/34 | | 2/18 at 100.00 | | Aa1 | | 2,448,179 | |
| | 1,635 | | Radnor Township, Pennsylvania, General Obligation Bonds, Series 2012, 4.000%, 11/01/37 | | 11/22 at 100.00 | | Aa1 | | 1,689,625 | |
| | 11,440 | | Reading School District, Berks County, Pennsylvania, General Obligation Bonds, Series 2003B, 0.000%, 1/15/32 – FGIC Insured | | No Opt. Call | | AA– | | 6,144,310 | |
| | 515 | | Richland School District, Cambria County, Pennsylvania, General Obligation Bonds, Series 2014A, 3.650%, 11/15/34 – BAM Insured | | 11/24 at 100.00 | | AA | | 518,564 | |
| | 1,245 | | Scranton, Pennsylvania, General Obligation Bonds, Series 2012A, 8.500%, 9/01/22 | | No Opt. Call | | N/R | | 1,310,201 | |
| | 1,255 | | Scranton, Pennsylvania, General Obligation Bonds, Series 2012C, 7.250%, 9/01/22 | | No Opt. Call | | N/R | | 1,273,386 | |
| | 1,150 | | South Park School District, Allegheny County, Pennsylvania, General Obligation Bonds, Series 2014, 3.375%, 8/01/32 – BAM Insured | | 2/20 at 100.00 | | AA | | 1,159,534 | |
| | 21,000 | | State Public School Building Authority, Pennsylvania, Lease Revenue Bonds, Philadelphia School District, Series 2003, 5.500%, 6/01/28 – AGM Insured (UB) (4) | | No Opt. Call | | AA | | 25,356,240 | |
| | 158,435 | | Total Tax Obligation/General | | | | | | 166,265,434 | |
| | | | Tax Obligation/Limited – 11.1% (7.5% of Total Investments) | | | | | | | |
| | 2,000 | | Allegheny County Redevelopment Authority, Pennsylvania, TIF Revenue Bonds, Pittsburg Mills Project, Series 2004, 5.600%, 7/01/23 | | 7/15 at 101.00 | | N/R | | 2,025,520 | |
| | 1,475 | | Allentown Neighborhood Improvement Zone Development Authority, Pennsylvania, Tax Revenue Bonds, Series 2012A, 5.000%, 5/01/35 | | 5/22 at 100.00 | | Baa2 | | 1,578,250 | |
| | 300 | | Commonwealth Financing Authority, Pennsylvania, State Appropriation Lease Bonds, Series 2013B, 4.000%, 6/01/15 | | No Opt. Call | | A+ | | 300,996 | |
| | 1,500 | | Dormitory Authority of the State of New York, Revenue Bonds, School Districts Financing Program, Series 2009C, 5.125%, 10/01/36 – AGC Insured | | 10/19 at 100.00 | | AA | | 1,698,495 | |
| | | | Government of Guam, Business Privilege Tax Bonds, Series 2011A: | | | | | | | |
| | 1,670 | | 5.250%, 1/01/36 | | 1/22 at 100.00 | | A | | 1,850,794 | |
| | 655 | | 5.125%, 1/01/42 | | 1/22 at 100.00 | | A | | 715,758 | |
| | | | Harrisburg Redevelopment Authority, Dauphin County, Pennsylvania, Guaranteed Revenue Bonds, Series 1998B: | | | | | | | |
| | 1,750 | | 0.000%, 5/01/22 – AGM Insured | | 5/16 at 75.56 | | AA | | 1,206,643 | |
| | 2,750 | | 0.000%, 11/01/22 – AGM Insured | | 5/16 at 73.64 | | AA | | 1,846,488 | |
| | 2,750 | | 0.000%, 5/01/23 – AGM Insured | | 5/16 at 71.71 | | AA | | 1,791,130 | |
| | 1,760 | | Monroe County Industrial Development Authority, Pennsylvania, Special Obligation Revenue Bonds, Tobyhanna Township Project, Series 2014, 6.875%, 7/01/33 | | 7/24 at 100.00 | | N/R | | 1,838,003 | |
| | 5,000 | | Pennsylvania Economic Development Financing Authority, Unemployment Compensation Revenue Bonds, Series 2012A, 5.000%, 7/01/16 | | No Opt. Call | | Aaa | | 5,275,350 | |
| | | | Pennsylvania Turnpike Commission, Motor License Fund-Enhanced Subordinate Special Revenue Bonds, Series 2010A: | | | | | | | |
| | 1,755 | | 0.000%, 12/01/34 | | 12/20 at 100.00 | | AA– | | 1,857,527 | |
| | 3,900 | | 5.000%, 12/01/38 | | 12/19 at 100.00 | | AA– | | 4,181,619 | |
| | 3,180 | | Pennsylvania Turnpike Commission, Motor License Fund-Enhanced Turnpike Subordinate Special Revenue Bonds, Series 2012A, 5.000%, 12/01/31 | | 12/21 at 100.00 | | AA– | | 3,527,351 | |
| NQP | Nuveen Pennsylvania Investment Quality Municipal Fund | |
| | Portfolio of Investments (continued) | April 30, 2015 |
| | Principal | | | | Optional Call | | | | | |
| | Amount (000) | | Description (1) | | Provisions (2) | | Ratings (3) | | Value | |
| | | | Tax Obligation/Limited (continued) | | | | | | | |
| $ | 7,000 | | Pennsylvania Turnpike Commission, Motor License Fund-Enhanced Turnpike Subordinate Special Revenue Bonds, Series 2013B-1, 5.250%, 12/01/43 | | 12/23 at 100.00 | | AA– | $ | 8,018,780 | |
| | | | Pennsylvania Turnpike Commission, Motor License Fund-Enhanced Turnpike Subordinate Special Revenue Bonds, Series 2014A: | | | | | | | |
| | 2,650 | | 0.000%, 12/01/37 | | No Opt. Call | | AA– | | 2,044,343 | |
| | 4,000 | | 0.000%, 12/01/44 | | No Opt. Call | | AA– | | 3,079,160 | |
| | 4,000 | | Pennsylvania Turnpike Commission, Motor License Fund-Enhanced Turnpike Subordinate Special Revenue, Series 2011B, 5.000%, 12/01/41 | | 12/21 at 100.00 | | AA– | | 4,384,600 | |
| | 5,125 | | Pennsylvania Turnpike Commission, Oil Franchise Tax Revenue Bonds, Senior Lien Series 2003A, 5.000%, 12/01/32 – NPFG Insured | | 12/18 at 100.00 | | AA | | 5,692,133 | |
| | 2,200 | | Pennsylvania Turnpike Commission, Registration Fee Revenue Bonds, Series 2005A, 5.250%, 7/15/18 – AGM Insured | | No Opt. Call | | AA | | 2,481,050 | |
| | 3,820 | | Pittsburgh and Allegheny County Sports and Exhibition Authority, Pennsylvania, Hotel Room Excise Tax Revenue Bonds, Refunding Series 2012, 5.000%, 2/01/26 – AGC Insured | | 8/22 at 100.00 | | AA | | 4,325,959 | |
| | | | Puerto Rico Highway and Transportation Authority, Highway Revenue Bonds, Series 2007N: | | | | | | | |
| | 4,225 | | 5.500%, 7/01/29 – AMBAC Insured | | No Opt. Call | | CCC+ | | 4,276,165 | |
| | 565 | | 5.250%, 7/01/33 – NPFG Insured | | No Opt. Call | | AA– | | 584,639 | |
| | 435 | | Puerto Rico, Highway Revenue Bonds, Highway and Transportation Authority, Series 2003AA, 5.500%, 7/01/19 – NPFG Insured | | No Opt. Call | | AA– | | 450,938 | |
| | 470 | | Washington County Redevelopment Authority, Pennsylvania, Tanger Outlet Victory Center Tax Increment Bonds, Series 2006A, 5.450%, 7/01/35 | | 7/17 at 100.00 | | N/R | | 478,498 | |
| | 64,935 | | Total Tax Obligation/Limited | | | | | | 65,510,189 | |
| | | | Transportation – 11.4% (7.7% of Total Investments) | | | | | | | |
| | 3,280 | | Delaware River Port Authority, New Jersey and Pennsylvania, Revenue Bonds, Series 2010E, 5.000%, 1/01/40 | | 1/20 at 100.00 | | A | | 3,624,531 | |
| | | | Delaware River Port Authority, Pennsylvania and New Jersey, Revenue Refunding Bonds, Port District Project, Series 2012: | | | | | | | |
| | 1,270 | | 5.000%, 1/01/22 | | No Opt. Call | | BBB | | 1,465,148 | |
| | 2,425 | | 5.000%, 1/01/23 | | No Opt. Call | | BBB | | 2,811,691 | |
| | 2,310 | | 5.000%, 1/01/24 | | No Opt. Call | | BBB | | 2,664,516 | |
| | 205 | | 5.000%, 1/01/25 | | No Opt. Call | | BBB | | 235,240 | |
| | 2,035 | | Lehigh-Northampton Airport Authority, Pennsylvania, Airport Revenue Bonds, Lehigh Valley Airport System, Series 2000A, 6.000%, 5/15/30 – NPFG Insured (Alternative Minimum Tax) | | 5/15 at 100.00 | | A3 | | 2,037,198 | |
| | 3,980 | | Pennsylvania Economic Development Financing Authority, Parking System Revenue Bonds, Capitol Region Parking System, Series 2013A, 5.250%, 1/01/44 – AGM Insured | | 1/24 at 100.00 | | AA | | 4,408,845 | |
| | 12,100 | | Pennsylvania Turnpike Commission, Turnpike Revenue Bonds, Capital Appreciation Series 2009E, 0.000%, 12/01/38 | | 12/27 at 100.00 | | A– | | 13,221,186 | |
| | | | Pennsylvania Turnpike Commission, Turnpike Revenue Bonds, Series 2006A: | | | | | | | |
| | 3,820 | | 5.000%, 12/01/22 – AMBAC Insured | | 6/16 at 100.00 | | A+ | | 4,004,926 | |
| | 6,700 | | 5.000%, 12/01/24 – AMBAC Insured | | 6/16 at 100.00 | | A+ | | 7,022,873 | |
| | 3,000 | | Pennsylvania Turnpike Commission, Turnpike Revenue Bonds, Series 2014C, 5.000%, 12/01/44 | | No Opt. Call | | A+ | | 3,348,180 | |
| | 2,450 | | Pennsylvania Turnpike Commission, Turnpike Revenue Bonds, Subordinate Lien, Refunding Series 2010B-1, 5.000%, 12/01/37 | | 12/19 at 100.00 | | A– | | 2,690,933 | |
| | 2,000 | | Pennsylvania Turnpike Commission, Turnpike Revenue Bonds, Subordinate Series 2009C, 0.000%, 6/01/33 – AGM Insured | | 6/26 at 100.00 | | AA | | 2,335,560 | |
| | 9,100 | | Philadelphia Airport System, Pennsylvania, Revenue Bonds, Series 2005A, 4.750%, 6/15/35 – NPFG Insured (Alternative Minimum Tax) | | 6/15 at 100.00 | | AA– | | 9,111,283 | |
| | 1,865 | | Philadelphia, Pennsylvania, Airport Revenue Bonds, Series 2010A, 5.250%, 6/15/28 | | 6/20 at 100.00 | | A+ | | 2,121,046 | |
| | 2,000 | | Pittsburgh Public Parking Authority, Pennsylvania, Parking Revenue Bonds, Series 2005B, 5.000%, 12/01/23 – FGIC Insured | | 12/15 at 100.00 | | AA– | | 2,045,940 | |
| | 2,080 | | Scranton Parking Authority, Pennsylvania, Guaranteed Parking Revenue Bonds, Series 2004, 5.000%, 9/15/33 – FGIC Insured | | 7/15 at 100.00 | | AA– | | 2,040,667 | |
| | Principal | | | | Optional Call | | | | | |
| | Amount (000) | | Description (1) | | Provisions (2) | | Ratings (3) | | Value | |
| | | | Transportation (continued) | | | | | | | |
| $ | 2,250 | | Scranton Parking Authority, Pennsylvania, Guaranteed Parking Revenue Bonds, Series 2007, 5.250%, 6/01/39 – RAAI Insured | | 6/17 at 100.00 | | AA | $ | 2,229,840 | |
| | 62,870 | | Total Transportation | | | | | | 67,419,603 | |
| | | | U.S. Guaranteed – 10.7% (7.2% of Total Investments) (5) | | | | | | | |
| | 315 | | Allentown Area Hospital Authority, Pennsylvania, Revenue Bonds, Sacred Heart Hospital, Series 2005, 6.000%, 11/15/16 (ETM) | | No Opt. Call | | N/R (5) | | 324,094 | |
| | | | Delaware County Authority, Pennsylvania, Revenue Bonds, Villanova University, Series 2006: | | | | | | | |
| | 3,910 | | 5.000%, 8/01/23 (Pre-refunded 8/01/16) – AMBAC Insured | | 8/16 at 100.00 | | A+ (5) | | 4,137,210 | |
| | 1,920 | | 5.000%, 8/01/24 (Pre-refunded 8/01/16) – AMBAC Insured | | 8/16 at 100.00 | | A+ (5) | | 2,031,571 | |
| | 1,875 | | Heidelberg, Lebanon County, Pennsylvania, Guaranteed Sewer Revenue Bonds, Series 2011, 5.125%, 12/01/46 (Pre-refunded 12/01/16) | | 12/16 at 100.00 | | AA– (5) | | 2,013,263 | |
| | | | Lancaster County Hospital Authority, Pennsylvania, Health Center Revenue Bonds, Masonic Homes Project, Series 2006: | | | | | | | |
| | 1,550 | | 5.000%, 11/01/26 (Pre-refunded 11/01/16) | | 11/16 at 100.00 | | A (5) | | 1,652,300 | |
| | 1,565 | | 5.000%, 11/01/31 (Pre-refunded 11/01/16) | | 11/16 at 100.00 | | A (5) | | 1,668,290 | |
| | 1,050 | | 5.000%, 11/01/36 (Pre-refunded 11/01/16) | | 11/16 at 100.00 | | A (5) | | 1,119,300 | |
| | 1,000 | | Montgomery County Industrial Development Authority, Pennsylvania, Revenue Bonds, Hill School, Series 2005, 5.000%, 8/15/27 (Pre-refunded 8/15/15) – NPFG Insured | | 8/15 at 100.00 | | A1 (5) | | 1,014,000 | |
| | 2,115 | | Owen J. Roberts School District, Chester County, Pennsylvania, General Obligation Bonds, Series 2006, 5.000%, 5/15/24 (Pre-refunded 5/15/16) – AGM Insured | | 5/16 at 100.00 | | Aa2 (5) | | 2,219,185 | |
| | 170 | | Pennsylvania Higher Educational Facilities Authority, College Revenue Bonds, Ninth Series 1976, 7.625%, 7/01/15 (ETM) | | No Opt. Call | | Aaa | | 172,135 | |
| | 4,000 | | Pennsylvania Higher Educational Facilities Authority, Revenue Bonds, University of Pennsylvania, Series 2005C, 5.000%, 7/15/38 (Pre-refunded 7/15/15) | | 7/15 at 100.00 | | AA+ (5) | | 4,039,040 | |
| | 5,060 | | Pennsylvania, General Obligation Bonds, First Series 2006, 5.000%, 10/01/18 (Pre-refunded 10/01/16) | | 10/16 at 100.00 | | AA– (5) | | 5,390,570 | |
| | 1,500 | | Pennsylvania, General Obligation Bonds, Second Series 2005, 5.000%, 1/01/18 (Pre-refunded 1/01/16) | | 1/16 at 100.00 | | AA– (5) | | 1,548,195 | |
| | | | Philadelphia Authority for Industrial Development, Pennsylvania, Revenue Bonds, Franklin Towne Charter High School, Series 2006A: | | | | | | | |
| | 1,550 | | 5.250%, 1/01/27 (Pre-refunded 1/01/17) | | 1/17 at 100.00 | | Baa1 (5) | | 1,664,003 | |
| | 1,650 | | 5.375%, 1/01/32 (Pre-refunded 1/01/17) | | 1/17 at 100.00 | | Baa1 (5) | | 1,774,773 | |
| | 465 | | Philadelphia Gas Works, Pennsylvania, Revenue Bonds, Twelfth Series 1990B, 7.000%, 5/15/20 – NPFG Insured (ETM) | | No Opt. Call | | AA– (5) | | 534,401 | |
| | 7,165 | | Philadelphia Hospitals and Higher Education Facilities Authority, Pennsylvania, Health System Revenue Bonds, Jefferson Health System, Series 2010B, 5.000%, 5/15/40 (Pre-refunded 5/15/20) | | 5/20 at 100.00 | | N/R (5) | | 8,403,757 | |
| | 2,575 | | Philadelphia Hospitals and Higher Education Facilities Authority, Pennsylvania, Hospital Revenue Bonds, Presbyterian Medical Center of Philadelphia, Series 1993, 6.650%, 12/01/19 (ETM) | | No Opt. Call | | AA+ (5) | | 2,927,749 | |
| | | | Philadelphia, Pennsylvania, Water and Wastewater Revenue Bonds, Series 2005A: | | | | | | | |
| | 4,150 | | 5.000%, 7/01/23 (Pre-refunded 7/01/15) – AGM Insured | | 7/15 at 100.00 | | AA (5) | | 4,183,906 | |
| | 4,575 | | 5.000%, 7/01/28 (Pre-refunded 7/01/15) – AGM Insured | | 7/15 at 100.00 | | AA (5) | | 4,612,195 | |
| | 1,470 | | Puerto Rico, Highway Revenue Bonds, Highway and Transportation Authority, Series 2003AA, 5.500%, 7/01/19 – NPFG Insured (ETM) | | No Opt. Call | | A3 (5) | | 1,727,926 | |
| | 1,070 | | Schuylkill Valley School District, Berks County, Pennsylvania, General Obligation Bonds, Series 2006A, 5.000%, 4/01/22 (Pre-refunded 4/01/16) – FGIC Insured | | 4/16 at 100.00 | | Aa3 (5) | | 1,116,748 | |
| | 1,613 | | South Fork Municipal Authority, Pennsylvania, Hospital Revenue Bonds, Conemaugh Valley Memorial Hospital, Series 2010, 5.500%, 7/01/29 (Pre-refunded 7/01/20) | | 7/20 at 100.00 | | N/R (5) | | 1,937,213 | |
| | 2,040 | | Warrington Township Municipal Authority, Bucks County, Pennsylvania, Water and Sewer Revenue Bonds, Series 1991, 7.100%, 12/01/21 (Pre-refunded 11/15/15) – FGIC Insured | | 11/15 at 100.00 | | N/R (5) | | 2,116,010 | |
| | 1,400 | | Woodland Hills School District, Allegheny County, Pennsylvania, General Obligation Bonds, Series 2005D, 5.000%, 9/01/17 (Pre-refunded 9/01/15) – AGM Insured | | 9/15 at 100.00 | | AA (5) | | 1,422,680 | |
| NQP | Nuveen Pennsylvania Investment Quality Municipal Fund | |
| | Portfolio of Investments (continued) | April 30, 2015 |
| | Principal | | | | Optional Call | | | | | |
| | Amount (000) | | Description (1) | | Provisions (2) | | Ratings (3) | | Value | |
| | | | U.S. Guaranteed (5) (continued) | | | | | | | |
| $ | 3,600 | | York County, Pennsylvania, General Obligation Bonds, Series 2006, 5.000%, 6/01/33 (Pre-refunded 12/01/15) – NPFG Insured | | 12/15 at 100.00 | | AA (5) | $ | 3,701,700 | |
| | 59,353 | | Total U.S. Guaranteed | | | | | | 63,452,214 | |
| | | | Utilities – 6.6% (4.5% of Total Investments) | | | | | | | |
| | 7,500 | | Beaver County Industrial Development Authority, Pennsylvania, Pollution Control Revenue Refunding Bonds, FirstEnergy Nuclear Generation Project, Series 2008A, 2.700%, 4/01/35 (Mandatory put 4/02/18) | | No Opt. Call | | BBB– | | 7,618,200 | |
| | 3,580 | | Lehigh County Industrial Development Authority, Pennsylvania, Pollution Control Revenue Bonds, Pennsylvania Power and Light Company, Series 2005, 4.750%, 2/15/27 – FGIC Insured | | 7/15 at 100.00 | | AA– | | 3,583,938 | |
| | 4,000 | | Luzerne County Industrial Development Authority, Pennsylvania, Water Facility Revenue Refunding Bonds, Pennsylvania-American Water Company, Series 2009, 5.500%, 12/01/39 | | 12/19 at 100.00 | | A1 | | 4,434,400 | |
| | 4,500 | | Pennsylvania Economic Development Financing Authority, Water Facilities Revenue Bonds, Aqua Pennsylvania, Inc. Project, Series 2009A, 5.000%, 10/01/39 | | 10/19 at 100.00 | | AA– | | 5,053,545 | |
| | 1,685 | | Philadelphia Gas Works, Pennsylvania, Revenue Bonds, General Ordinance, Fifth Series 2004A-1, 5.000%, 9/01/26 – AGM Insured | | 7/15 at 100.00 | | AA | | 1,691,302 | |
| | 3,000 | | Philadelphia Gas Works, Pennsylvania, Revenue Bonds, General Ordinance, Seventeenth Series 2003, 5.375%, 7/01/19 – AGM Insured | | 7/15 at 100.00 | | AA | | 3,011,340 | |
| | 12,885 | | Philadelphia Gas Works, Pennsylvania, Revenue Bonds, Seventh Series, 2007, 5.000%, 10/01/37 – AMBAC Insured | | 10/17 at 100.00 | | A– | | 13,859,879 | |
| | 37,150 | | Total Utilities | | | | | | 39,252,604 | |
| | | | Water and Sewer – 9.6% (6.5% of Total Investments) | | | | | | | |
| | | | Allegheny County Sanitary Authority, Pennsylvania, Sewer Revenue Bonds, Series 2005A: | | | | | | | |
| | 4,000 | | 5.000%, 12/01/21 – NPFG Insured | | 12/15 at 100.00 | | AA– | | 4,109,560 | |
| | 2,120 | | 5.000%, 12/01/23 – NPFG Insured | | 12/15 at 100.00 | | AA– | | 2,177,494 | |
| | 545 | | 5.000%, 12/01/30 – NPFG Insured | | 12/15 at 100.00 | | AA– | | 558,609 | |
| | | | Bucks County Water and Sewer Authority, Pennsylvania, Revenue Bonds, Tender Option Bond Trust 2015-XF0123: | | | | | | | |
| | 1,665 | | 13.125%, 12/01/19 – AGM Insured (IF) (4) | | No Opt. Call | | AA | | 2,252,146 | |
| | 825 | | 13.113%, 12/01/19 – AGM Insured (IF) (4) | | No Opt. Call | | AA | | 1,103,141 | |
| | 5,200 | | Harrisburg Authority, Dauphin County, Pennsylvania, Water Revenue Refunding Bonds, Series 2004, 5.000%, 7/15/22 – AGM Insured | | 7/15 at 100.00 | | AA | | 5,213,000 | |
| | | | Lehigh County Authority, Pennsylvania, Water and Sewer Capital Appreciation Revenue Bonds, City of Allentown Concession, Series 2013B: | | | | | | | |
| | 7,295 | | 0.000%, 12/01/34 | | No Opt. Call | | A | | 3,042,599 | |
| | 4,420 | | 0.000%, 12/01/35 | | No Opt. Call | | A | | 1,752,397 | |
| | 12,500 | | Lehigh County Authority, Pennsylvania, Water and Sewer Revenue Bonds, City of Allentown Concession, Series 2013A, 5.125%, 12/01/47 | | 12/23 at 100.00 | | A | | 14,084,123 | |
| | 1,100 | | Pennsylvania Economic Development Financing Authority, Sewage Sludge Disposal Revenue Bonds, Philadelphia Biosolids Facility Project, Series 2009, 6.250%, 1/01/32 | | 1/20 at 100.00 | | BBB | | 1,212,024 | |
| | 6,560 | | Philadelphia, Pennsylvania, Water and Wastewater Revenue Bonds, Series 2011A, 5.000%, 1/01/41 | | 1/21 at 100.00 | | A1 | | 7,083,816 | |
| | 2,500 | | Philadelphia, Pennsylvania, Water and Wastewater Revenue Bonds, Series 2013A, 5.125%, 1/01/43 | | 1/22 at 100.00 | | A1 | | 2,778,925 | |
| | 5,000 | | Pittsburgh Water and Sewer Authority, Pennsylvania, Water and Sewer System First Lien Revenue Refunding Bonds, Series 2013B, 5.250%, 9/01/40 | | 9/23 at 100.00 | | A | | 5,713,100 | |
| | 2,840 | | Robinson Township Municipal Authority, Allegheny County, Pennsylvania, Water and Sewer Revenue Bonds, Series 2014, 4.000%, 5/15/40 – BAM Insured | | 11/19 at 100.00 | | AA | | 2,843,465 | |
| | Principal | | | | Optional Call | | | | | |
| | Amount (000) | | Description (1) | | Provisions (2) | | Ratings (3) | | Value | |
| | | | Water and Sewer (continued) | | | | | | | |
| $ | 1,930 | | Westmoreland County Municipal Authority, Pennsylvania, Municipal Service Revenue Bonds, Tender Option Bond Trust 1171, 17.024%, 8/15/37 (IF) (4) | | 8/23 at 100.00 | | A+ | $ | 2,860,530 | |
| | 58,500 | | Total Water and Sewer | | | | | | 56,784,929 | |
| $ | 829,013 | | Total Long-Term Investments (cost $816,050,482) | | | | | | 875,023,063 | |
| | | | Floating Rate Obligations – (4.9)% | | | | | | (29,070,000 | ) |
| | | | Variable Rate MuniFund Term Preferred Shares, at Liquidation value – (8.1)%) (7) | | | | | | (48,000,000 | ) |
| | | | Variable Rate Demand Preferred Shares, at Liquidation value – (36.7)% (8) | | | | | | (217,500,000 | ) |
| | | | Other Assets Less Liabilities – 2.0% | | | | | | 12,086,519 | |
| | | | Net Assets Applicable to Common Shares – 100% | | | | | $ | 592,539,582 | |
| (1) | All percentages shown in the Portfolio of Investments are based on net assets applicable to Common shares unless otherwise noted. |
| (2) | Optional Call Provisions (not covered by the report of independent registered public accounting firm): Dates (month and year) and prices of the earliest optional call or redemption. There may be other call provisions at varying prices at later dates. Certain mortgage-backed securities may be subject to periodic principal paydowns. |
| (3) | Ratings (not covered by the report of independent registered public accounting firm): Using the highest of Standard & Poor’s Group (“Standard & Poor’s”), Moody’s Investors Service, Inc. (“Moody’s”) or Fitch, Inc. (“Fitch”) rating. Ratings below BBB by Standard & Poor’s, Baa by Moody’s or BBB by Fitch are considered to be below investment grade. Holdings designated N/R are not rated by any of these national rating agencies. |
| (4) | Investment, or portion of investment, has been pledged to collateralize the net payment obligations for investments in inverse floating rate transactions. |
| (5) | Backed by an escrow or trust containing sufficient U.S. Government or U.S. Government agency securities, which ensure the timely payment of principal and interest. Certain bonds backed by U.S. Government or agency securities are regarded as having an implied rating equal to the rating of such securities. |
| (6) | As of, or subsequent to, the end of the reporting period this security is non-income producing. Non-income producing, in the case of a fixed-income security, generally denotes that the issuer has (1) defaulted on the payment of principal or interest, (2) is under the protection of the Federal Bankruptcy Court or (3) the Fund’s Adviser has concluded that the issue is not likely to meet its future interest payment obligations and has ceased accruing additional income on the Fund’s records. |
| (7) | Variable Rate MuniFund Term Preferred Shares, at Liquidation Value as a percentage of Total Investments is 5.5%. |
| (8) | Variable Rate Demand Preferred Shares, at Liquidation Value as a percentage of Total Investments is 24.9%. |
| (ETM) | Escrowed to maturity. |
| (IF) | Inverse floating rate investment. |
| (UB) | Underlying bond of an inverse floating rate trust reflected as a financing transaction. See Notes to Financial Statements, Note 3 – Portfolio Securities and Investments in Derivatives, Inverse Floating Rate Securities for more information. |
| (WI/DD) | Investment, or portion of investment, purchased on a when-issued or delayed-delivery basis. |
See accompanying notes to financial statements.
| NPN | | |
| | Nuveen Pennsylvania Municipal Value Fund | |
| | Portfolio of Investments | April 30, 2015 |
| | Principal | | | | Optional Call | | | | | |
| | Amount (000) | | Description (1) | | Provisions (2) | | Ratings (3) | | Value | |
| | | | LONG-TERM INVESTMENTS – 98.9% (100.0% of Total Investments) | | | | | | | |
| | | | MUNICIPAL BONDS – 98.9% (100.0% of Total Investments) | | | | | | | |
| | | | Consumer Staples – 4.1% (4.2% of Total Investments) | | | | | | | |
| $ | 650 | | District of Columbia Tobacco Settlement Corporation, Tobacco Settlement Asset-Backed Bonds, Series 2001, 6.500%, 5/15/33 | | No Opt. Call | | Baa1 | $ | 825,338 | |
| | | | Education and Civic Organizations – 14.3% (14.5% of Total Investments) | | | | | | | |
| | 400 | | Allegheny County Higher Education Building Authority, Pennsylvania, Revenue Bonds, Carnegie Mellon University, Series 2013, 5.000%, 3/01/21 | | No Opt. Call | | AA– | | 473,868 | |
| | 30 | | Dallas Area Municipal Authority, Pennsylvania, Revenue Bonds, Misericordia University, Series 2014, 5.000%, 5/01/37 | | 5/24 at 100.00 | | Baa3 | | 32,469 | |
| | 675 | | Delaware County Authority, Pennsylvania, Revenue Bonds, Neumann College, Series 2008, 6.000%, 10/01/30 | | 10/18 at 100.00 | | BBB | | 757,316 | |
| | 500 | | Lehigh County General Purpose Authority, Pennsylvania, College Revenue Bonds, Muhlenberg College Project, Series 2009, 5.250%, 2/01/39 | | 2/19 at 100.00 | | A+ | | 544,445 | |
| | 450 | | Montgomery County Higher Education and Health Authority, Pennsylvania, Revenue Bonds, Arcadia University, Series 2006, 5.000%, 4/01/36 – RAAI Insured | | 4/16 at 100.00 | | AA | | 463,433 | |
| | 35 | | Pennsylvania Higher Educational Facilities Authority, Revenue Bonds, Holy Family University, Series 2013A, 6.500%, 9/01/38 | | 9/23 at 100.00 | | BBB– | | 38,855 | |
| | 120 | | Pennsylvania Higher Educational Facilities Authority, Philadelphia University Refunding Revenue Bonds, Refunding Series 2013, 5.000%, 6/01/32 | | 6/23 at 100.00 | | BBB | | 127,111 | |
| | 20 | | Pennsylvania Higher Educational Facilities Authority, Revenue Bonds, Thomas Jefferson University, Series 2012, 5.000%, 3/01/42 | | 9/22 at 100.00 | | A1 | | 22,116 | |
| | | | Pennsylvania Higher Educational Facilities Authority, Revenue Bonds, University of the Sciences in Philadelphia, Series 2012: | | | | | | | |
| | 35 | | 4.000%, 11/01/39 | | 11/22 at 100.00 | | A3 | | 35,471 | |
| | 60 | | 5.000%, 11/01/42 | | 11/22 at 100.00 | | A3 | | 66,478 | |
| | 75 | | Pennsylvania Higher Educational Facilities Authority, Revenue Bonds, Widener University, Series 2013A, 5.500%, 7/15/38 | | No Opt. Call | | A– | | 83,244 | |
| | 100 | | Philadelphia Authority for Industrial Development, Pennsylvania, Revenue Bonds, Philadelphia Performing Arts Charter School, Series 2013, 6.750%, 6/15/43 | | 6/20 at 100.00 | | BB– | | 102,482 | |
| | 100 | | Wilkes-Barre Finance Authority, Pennsylvania, Revenue Bonds, University of Scranton, Series 2010, 5.000%, 11/01/40 | | 11/20 at 100.00 | | A | | 109,248 | |
| | 2,600 | | Total Education and Civic Organizations | | | | | | 2,856,536 | |
| | | | Health Care – 23.2% (23.4% of Total Investments) | | | | | | | |
| | 650 | | Allegheny County Hospital Development Authority, Pennsylvania, Revenue Bonds, University of Pittsburgh Medical Center, Series 2009A, 5.500%, 8/15/34 | | 8/19 at 100.00 | | Aa3 | | 731,965 | |
| | 35 | | Dauphin County General Authority, Pennsylvania, Health System Revenue Bonds, Pinnacle Health System Project, Series 2012A, 5.000%, 6/01/42 | | 6/22 at 100.00 | | A | | 37,553 | |
| | 600 | | Geisinger Authority, Montour County, Pennsylvania, Health System Revenue Bonds, Geisinger Health System, Series 2009A, 5.250%, 6/01/39 | | 6/19 at 100.00 | | AA | | 666,414 | |
| | 100 | | Illinois Finance Authority, Revenue Bonds, OSF Healthcare System, Series 2007A, 5.750%, 11/15/37 | | 11/17 at 100.00 | | A | | 108,883 | |
| | 100 | | Lycoming County Authority, Pennsylvania, Health System Revenue Bonds, Susquehanna Health System Project, Series 2009A, 5.750%, 7/01/39 | | 7/19 at 100.00 | | A– | | 108,754 | |
| | 5 | | Montgomery County Higher Education and Health Authority, Pennsylvania, Hospital Revenue Bonds, Abington Memorial Hospital Obligated Group, Series 2009A, 5.125%, 6/01/33 | | 6/19 at 100.00 | | A | | 5,452 | |
| | Principal | | | | Optional Call | | | | | |
| | Amount (000) | | Description (1) | | Provisions (2) | | Ratings (3) | | Value | |
| | | | Health Care (continued) | | | | | | | |
| $ | 500 | | Pennsylvania Economic Development Financing Authority, Health System Revenue Bonds , Albert Einstein Healthcare, Series 2009A, 6.250%, 10/15/23 | | 10/19 at 100.00 | | Baa2 | $ | 581,015 | |
| | 100 | | Philadelphia Hospitals and Higher Education Facilities Authority, Pennsylvania, Hospital Revenue Bonds, Temple University Health System Obligated Group, Series 2012A, 5.625%, 7/01/42 | | 7/22 at 100.00 | | BB+ | | 106,312 | |
| | 1,200 | | Southcentral Pennsylvania General Authority, Revenue Bonds, Hanover Hospital Inc., Series 2005, 5.000%, 12/01/29 – RAAI Insured | | 12/15 at 100.00 | | AA | | 1,216,894 | |
| | 715 | | St. Mary Hospital Authority, Pennsylvania, Health System Revenue Bonds, Catholic Health East, Series 2009D, 6.250%, 11/15/34 | | 5/19 at 100.00 | | AA | | 825,789 | |
| | 100 | | West Shore Area Authority, Cumberland County, Pennsylvania, Hospital Revenue Bonds, Holy Spirit Hospital of the Sisters of Christian Charity Project, Series 2011, 6.250%, 1/01/31 | | 1/21 at 100.00 | | AA | | 120,055 | |
| | 100 | | West Shore Area Authority, Cumberland County, Pennsylvania, Hospital Revenue Bonds, Holy Spirit Hospital of the Sisters of Christian Charity, Series 2011B, 5.750%, 1/01/41 | | 1/22 at 100.00 | | AA | | 117,430 | |
| | 4,205 | | Total Health Care | | | | | | 4,626,516 | |
| | | | Housing/Multifamily – 5.2% (5.3% of Total Investments) | | | | | | | |
| | 15 | | Chester County Industrial Development Authority, Pennsylvania, Student Housing Revenue Bonds, University Student Housing, LLC Project at West Chester University Series 2013A, 5.000%, 8/01/45 | | 8/23 at 100.00 | | Baa3 | | 15,958 | |
| | 30 | | East Hempfield Township Industrial Development Authority, Pennsylvania, Student Services Inc – Student Housing Project at Millersville University, Series 2014, 5.000%, 7/01/46 | | No Opt. Call | | BBB– | | 31,558 | |
| | 100 | | East Hempfield Township Industrial Development Authority, Pennsylvania, Student Services Inc – Student Housing Project at Millersville University, Series 2015, 5.000%, 7/01/47 (WI/DD, Settling 5/05/15) | | 7/25 at 100.00 | | BBB– | | 105,627 | |
| | 50 | | Pennsylvania Higher Educational Facilities Authority, Revenue Bonds, Edinboro University Foundation Student Housing Project, Series 2010, 6.000%, 7/01/43 | | 7/20 at 100.00 | | Baa3 | | 54,466 | |
| | 800 | | Pittsburgh Urban Redevelopment Authority, Pennsylvania, Multifamily Housing Revenue Bonds, Eva P. Mitchell Residence Project, Series 2009, 5.100%, 10/20/44 | | 10/19 at 100.00 | | Aa1 | | 838,040 | |
| | 995 | | Total Housing/Multifamily | | | | | | 1,045,649 | |
| | | | Housing/Single Family – 1.7% (1.7% of Total Investments) | | | | | | | |
| | | | Pennsylvania Housing Finance Agency, Single Family Mortgage Revenue Bonds, Series 2012-114: | | | | | | | |
| | 55 | | 3.300%, 10/01/32 | | No Opt. Call | | AA+ | | 53,154 | |
| | 25 | | 3.650%, 10/01/37 | | No Opt. Call | | AA+ | | 24,924 | |
| | 35 | | 3.700%, 10/01/42 | | No Opt. Call | | AA+ | | 34,289 | |
| | 130 | | Pennsylvania Housing Finance Agency, Single Family Mortgage Revenue Bonds, Series 2015-116B, 4.000%, 4/01/45 | | 10/24 at 100.00 | | AA+ | | 129,098 | |
| | 50 | | Pennsylvania Housing Finance Agency, Single Family Mortgage Revenue Bonds, Tender Option Bond Trust 2015-XF0066, 14.221%, 10/01/33 (Alternative Minimum Tax) (IF) | | 10/22 at 100.00 | | AA+ | | 58,635 | |
| | 25 | | Pennsylvania Housing Finance Agency, Single Family Mortgage Revenue Bonds, Tender Option Bonds Trust 2015-XF0109, 10.434%, 10/01/38 (IF) (4) | | 4/22 at 100.00 | | AA+ | | 26,057 | |
| | 320 | | Total Housing/Single Family | | | | | | 326,157 | |
| | | | Long-Term Care – 4.7% (4.7% of Total Investments) | | | | | | | |
| | 20 | | Lancaster County Hospital Authority, Pennsylvania, Health Center Revenue Bonds, Masonic Villages Project, Series 2015, 5.000%, 11/01/35 | | 5/25 at 100.00 | | A | | 22,290 | |
| | 55 | | Lancaster Industrial Development Authority, Pennsylvania, Revenue Bonds, Garden Spot Village Project, Series 2013, 5.750%, 5/01/35 | | 5/23 at 100.00 | | BBB | | 60,099 | |
| | 750 | | Montgomery County Industrial Development Authority, Pennsylvania, Retirement Communities Revenue Bonds, ACTS Retirement – Life Communities, Inc. Obligated Group, Series 2009A-1, 6.250%, 11/15/29 | | 11/19 at 100.00 | | A– | | 853,275 | |
| | 825 | | Total Long-Term Care | | | | | | 935,664 | |
| NPN | Nuveen Pennsylvania Municipal Value Fund | |
| | Portfolio of Investments (continued) | April 30, 2015 |
| | Principal | | | | Optional Call | | | | | |
| | Amount (000) | | Description (1) | | Provisions (2) | | Ratings (3) | | Value | |
| | | | Materials – 0.7% (0.7% of Total Investments) | | | | | | | |
| $ | 140 | | Pennsylvania Economic Development Financing Authority, Exempt Facilities Revenue Bonds, National Gypsum Company, Refunding Series 2014, 5.500%, 11/01/44 (Alternative Minimum Tax) | | 11/24 at 100.00 | | N/R | $ | 144,292 | |
| | | | Tax Obligation/General – 9.5% (9.6% of Total Investments) | | | | | | | |
| | 220 | | Allegheny County, Pennsylvania, General Obligation Bonds, Series 2013C-72, 5.250%, 12/01/32 | | 12/23 at 100.00 | | AA– | | 252,551 | |
| | 700 | | Bethel Park School District, Allegheny County, Pennsylvania, General Obligation Bonds, Series 2009, 5.100%, 8/01/33 | | 8/19 at 100.00 | | Aa2 | | 792,897 | |
| | 115 | | Canon-McMillan School District, Washington County, Pennsylvania, General Obligation Bonds, Series 2014D, 5.000%, 12/15/39 | | 12/24 at 100.00 | | AA | | 129,790 | |
| | 145 | | Pine-Richland School District, Pennsylvania, General Obligation Bonds, Refunding Series 2014B, 3.375%, 11/01/33 | | 11/24 at 100.00 | | AA– | | 144,980 | |
| | 15 | | Pittsburgh School District, Allegheny County, Pennsylvania, General Obligation Bonds, Series 2014A, 5.000%, 9/01/25 – BAM Insured | | 9/22 at 100.00 | | AA | | 17,401 | |
| | 390 | | Pittsburgh, Pennsylvania, General Obligation Bonds, Series 2012B, 5.000%, 9/01/26 | | 9/22 at 100.00 | | A+ | | 449,787 | |
| | 65 | | Radnor Township School District, Delaware County, Pennsylvania, General Obligation Bonds, Series 2012, 3.000%, 2/15/34 | | 2/18 at 100.00 | | Aa1 | | 63,399 | |
| | 25 | | Scranton, Pennsylvania, General Obligation Bonds, Series 2012A, 8.500%, 9/01/22 | | No Opt. Call | | N/R | | 26,309 | |
| | 25 | | Scranton, Pennsylvania, General Obligation Bonds, Series 2012C, 7.250%, 9/01/22 | | No Opt. Call | | N/R | | 25,366 | |
| | 1,700 | | Total Tax Obligation/General | | | | | | 1,902,480 | |
| | | | Tax Obligation/Limited – 13.0% (13.1% of Total Investments) | | | | | | | |
| | 25 | | Allentown Neighborhood Improvement Zone Development Authority, Pennsylvania, Tax Revenue Bonds, Series 2012A, 5.000%, 5/01/35 | | 5/22 at 100.00 | | Baa2 | | 26,750 | |
| | 120 | | Government of Guam, Business Privilege Tax Bonds, Series 2011A, 5.250%, 1/01/36 | | 1/22 at 100.00 | | A | | 132,991 | |
| | 550 | | Guam Government, Limited Obligation Section 30 Revenue Bonds, Series 2009A, 5.750%, 12/01/34 | | 12/19 at 100.00 | | BBB+ | | 604,197 | |
| | 105 | | Monroe County Industrial Development Authority, Pennsylvania, Special Obligation Revenue Bonds, Tobyhanna Township Project, Series 2014, 6.875%, 7/01/33 | | 7/24 at 100.00 | | N/R | | 109,654 | |
| | | | Pennsylvania Turnpike Commission, Motor License Fund-Enhanced Subordinate Special Revenue Bonds, Series 2010A: | | | | | | | |
| | 580 | | 0.000%, 12/01/34 | | 12/20 at 100.00 | | AA– | | 613,884 | |
| | 100 | | 5.000%, 12/01/38 | | 12/19 at 100.00 | | AA– | | 107,221 | |
| | 100 | | Pennsylvania Turnpike Commission, Motor License Fund-Enhanced Turnpike Subordinate Special Revenue Bonds, Series 2014A, 0.000%, 12/01/37 | | No Opt. Call | | AA– | | 77,145 | |
| | 750 | | Philadelphia Municipal Authority, Pennsylvania, Lease Revenue Bonds, Series 2009, 6.500%, 4/01/34 | | 4/19 at 100.00 | | A+ | | 861,405 | |
| | 865 | | Puerto Rico Sales Tax Financing Corporation, Sales Tax Revenue Bonds, Series 2007A, 0.000%, 8/01/54 – AMBAC Insured | | No Opt. Call | | B | | 60,913 | |
| | 3,195 | | Total Tax Obligation/Limited | | | | | | 2,594,160 | |
| | | | Transportation – 3.3% (3.4% of Total Investments) | | | | | | | |
| | 240 | | Delaware River Port Authority, New Jersey and Pennsylvania, Revenue Bonds, Series 2010E, 5.000%, 1/01/40 | | 1/20 at 100.00 | | A | | 265,210 | |
| | 140 | | Pennsylvania Economic Development Financing Authority, Parking System Revenue Bonds, Capitol Region Parking System, Series 2013A, 5.250%, 1/01/44 – AGM Insured | | 1/24 at 100.00 | | AA | | 155,085 | |
| | 175 | | Pennsylvania Economic Development Financing Authority, Private Activity Revenue Bonds, Pennsylvania Rapid Bridge Replacement Project, Series 2015, 5.000%, 6/30/42 (Alternative Minimum Tax) | | 6/26 at 100.00 | | BBB | | 189,315 | |
| | 50 | | Pennsylvania Turnpike Commission, Turnpike Revenue Bonds, Subordinate Lien, Refunding Series 2010B-1, 5.000%, 12/01/37 | | 12/19 at 100.00 | | A– | | 54,917 | |
| | 605 | | Total Transportation | | | | | | 664,527 | |
| | Principal | | | | Optional Call | | | | | |
| | Amount (000) | | Description (1) | | Provisions (2) | | Ratings (3) | | Value | |
| | | | U.S. Guaranteed – 5.7% (5.8% of Total Investments) (5) | | | | | | | |
| $ | 5 | | Allegheny County Hospital Development Authority, Pennsylvania, Hospital Revenue Bonds, Allegheny Valley Hospital-Sublessee, Series 1982Q, 7.000%, 8/01/15 (ETM) | | No Opt. Call | | AA+ (5) | $ | 5,080 | |
| | 1,075 | | Harrisburg Parking Authority, Dauphin County, Pennsylvania, Guaranteed Parking Revenue Bonds, Series 2007R, 4.250%, 5/15/21 (Pre-refunded 11/15/16) – SYNCORA GTY Insured | | 11/16 at 100.00 | | N/R (5) | | 1,136,017 | |
| | 1,080 | | Total U.S. Guaranteed | | | | | | 1,141,097 | |
| | | | Utilities – 3.9% (3.9% of Total Investments) | | | | | | | |
| | 750 | | Chester County Industrial Development Authority, Pennsylvania, Water Facilities Revenue Bonds, Aqua Pennsylvania Inc. Project, Series 2007A, 5.000%, 2/01/40 – FGIC Insured (Alternative Minimum Tax) | | 2/17 at 100.00 | | AA– | | 767,130 | |
| | | | Water and Sewer – 9.6% (9.7% of Total Investments) | | | | | | | |
| | 175 | | Bucks County Water and Sewer Authority, Pennsylvania, Revenue Bonds, Tender Option Bond Trust 2015-XF0123, 13.113%, 12/01/33 – AGM Insured (IF) (4) | | 12/21 at 100.00 | | AA | | 234,000 | |
| | 200 | | Lehigh County Authority, Pennsylvania, Water and Sewer Revenue Bonds, City of Allentown Concession, Series 2013A, 5.125%, 12/01/47 | | 12/23 at 100.00 | | A | | 225,346 | |
| | | | Philadelphia, Pennsylvania, Water and Wastewater Revenue Bonds, Series 2009A: | | | | | | | |
| | 750 | | 5.250%, 1/01/32 | | 1/19 at 100.00 | | A1 | | 831,315 | |
| | 500 | | 5.250%, 1/01/36 | | 1/19 at 100.00 | | A1 | | 554,020 | |
| | 60 | | Robinson Township Municipal Authority, Allegheny County, Pennsylvania, Water and Sewer Revenue Bonds, Series 2014, 4.000%, 5/15/40 – BAM Insured | | 11/19 at 100.00 | | AA | | 60,073 | |
| | 1,685 | | Total Water and Sewer | | | | | | 1,904,754 | |
| $ | 18,750 | | Total Long-Term Investments (cost $17,325,272) | | | | | | 19,734,300 | |
| | | | Other Assets Less Liabilities – 1.1% | | | | | | 217,829 | |
| | | | Net Assets Applicable to Common Shares – 100% | | | | | $ | 19,952,129 | |
| (1) | All percentages shown in the Portfolio of Investments are based on net assets applicable to Common shares unless otherwise noted. |
| (2) | Optional Call Provisions (not covered by the report of independent registered public accounting firm): Dates (month and year) and prices of the earliest optional call or redemption. There may be other call provisions at varying prices at later dates. Certain mortgage-backed securities may be subject to periodic principal paydowns. |
| (3) | Ratings (not covered by the report of independent registered public accounting firm): Using the highest of Standard & Poor’s Group (“Standard & Poor’s”), Moody’s Investors Service, Inc. (“Moody’s”) or Fitch, Inc. (“Fitch”) rating. Ratings below BBB by Standard & Poor’s, Baa by Moody’s or BBB by Fitch are considered to be below investment grade. Holdings designated N/R are not rated by any of these national rating agencies. |
| (4) | Investment, or portion of investment, has been pledged to collateralize the net payment obligations for investments in inverse floating rate transactions. |
| (5) | Backed by an escrow or trust containing sufficient U.S. Government or U.S. Government agency securities, which ensure the timely payment of principal and interest. Certain bonds backed by U.S. Government or agency securities are regarded as having an implied rating equal to the rating of such securities. |
| (ETM) | Escrowed to maturity. |
| (IF) | Inverse floating rate investment. |
| (WI/DD) | Investment, or portion of investment, purchased on a when-issued or delayed delivery basis. |
See accompanying notes to financial statements.
| Statement of | | |
| | Assets and Liabilities | April 30, 2015 |
| | | | New Jersey | | | New Jersey | | | Pennsylvania | | | Pennsylvania | |
| | | | Dividend | | | Municipal | | | Investment | | | Municipal | |
| | | | Advantage | | | Value | | | Quality | | | Value | |
| | | | (NXJ | ) | | (NJV | ) | | (NQP | ) | | (NPN | ) |
| Assets | | | | | | | | | | | | | |
| Long-term investments, at value (cost $912,064,123, $23,502,241 $816,050,482 and $17,325,272, respectively) | | $ | 969,432,861 | | $ | 26,386,277 | | $ | 875,023,063 | | $ | 19,734,300 | |
| Cash | | | 306,143 | | | 527,289 | | | 752,576 | | | 140,220 | |
| Receivable for: | | | | | | | | | | | | | |
| Dividends | | | 4,686 | | | 1,501 | | | — | | | — | |
| Interest | | | 14,242,137 | | | 349,327 | | | 12,970,156 | | | 280,423 | |
| Investments sold | | | 7,662,896 | | | 143,840 | | | 2,625,000 | | | — | |
| Deferred offering costs | | | 1,758,847 | | | — | | | 1,230,277 | | | — | |
| Other assets | | | 369,473 | | | 135 | | | 288,017 | | | 101 | |
| Total assets | | | 993,777,043 | | | 27,408,369 | | | 892,889,089 | | | 20,155,044 | |
| Liabilities | | | | | | | | | | | | | |
| Floating rate obligations | | | — | | | 1,500,000 | | | 29,070,000 | | | — | |
| Payable for: | | | | | | | | | | | | | |
| Common share dividends | | | 2,664,773 | | | 74,358 | | | 2,352,227 | | | 60,937 | |
| Interest | | | — | | | — | | | 38,335 | | | — | |
| Investments purchased | | | 7,618,699 | | | 364,238 | | | 2,021,277 | | | 106,383 | |
| Offering costs | | | 102,456 | | | — | | | 208,858 | | | — | |
| Variable Rate MuniFund Term Preferred (“VMTP”) Shares, at liquidation value | | | — | | | — | | | 48,000,000 | | | — | |
| Variable Rate Demand Preferred (“VRDP”) Shares, at liquidation value | | | 313,900,000 | | | — | | | 217,500,000 | | | — | |
| Accrued expenses: | | | | | | | | | | | | | |
| Management fees | | | 493,482 | | | 12,877 | | | 431,840 | | | 9,552 | |
| Trustees fees | | | 120,028 | | | 184 | | | 116,336 | | | 144 | |
| Other | | | 208,015 | | | 26,663 | | | 610,634 | | | 25,899 | |
| Total liabilities | | | 325,107,453 | | | 1,978,320 | | | 300,349,507 | | | 202,915 | |
| Net assets applicable to common shares | | $ | 668,669,590 | | $ | 25,430,049 | | $ | 592,539,582 | | $ | 19,952,129 | |
| Common shares outstanding | | | 43,058,279 | | | 1,550,036 | | | 37,875,841 | | | 1,219,352 | |
| Net asset value (“NAV”) per common share outstanding | | $ | 15.53 | | $ | 16.41 | | $ | 15.64 | | $ | 16.36 | |
| Net assets applicable to common shares consist of: | | | | | | | | | | | | | |
| Common shares, $0.01 par value per share | | $ | 430,583 | | $ | 15,500 | | $ | 378,758 | | $ | 12,194 | |
| Paid-in surplus | | | 613,061,978 | | | 22,144,384 | | | 537,614,954 | | | 17,438,188 | |
| Undistributed (Over-distribution of) net investment income | | | 2,444,690 | | | 80,634 | | | 690,405 | | | 153,803 | |
| Accumulated net realized gain (loss) | | | (4,636,399 | ) | | 305,495 | | | (5,117,116 | ) | | (61,084 | ) |
| Net unrealized appreciation (depreciation) | | | 57,368,738 | | | 2,884,036 | | | 58,972,581 | | | 2,409,028 | |
| Net assets applicable to common shares | | $ | 668,669,590 | | $ | 25,430,049 | | $ | 592,539,582 | | $ | 19,952,129 | |
| Authorized shares: | | | | | | | | | | | | | |
| Common | | | Unlimited | | | Unlimited | | | Unlimited | | | Unlimited | |
| Preferred | | | Unlimited | | | N/A | | | Unlimited | | | N/A | |
| N/A — Fund is not authorized to issue Preferred Shares. |
See accompanying notes to financial statements.
| Statement of | | |
| | Operations | Year Ended April 30, 2015 |
| | | | New Jersey | | | New Jersey | | | Pennsylvania | | | Pennsylvania | |
| | | | Dividend | | | Municipal | | | Investment | | | Municipal | |
| | | | Advantage | | | Value | | | Quality | | | Value | |
| | | | (NXJ | ) | | (NJV | ) | | (NQP | ) | | (NPN | ) |
| Investment Income | | $ | 23,660,099 | | $ | 1,187,127 | | $ | 40,294,101 | | $ | 983,570 | |
| Expenses | | | | | | | | | | | | | |
| Management fees | | | 3,327,594 | | | 156,826 | | | 5,220,700 | | | 115,172 | |
| Interest expense and amortization of offering costs | | | 535,294 | | | 9,857 | | | 1,318,071 | | | — | |
| Liquidity fees | | | 1,522,551 | | | — | | | 2,021,405 | | | — | |
| Remarketing fees | | | 166,099 | | | — | | | 220,522 | | | — | |
| Custodian fees | | | 92,980 | | | 13,155 | | | 132,549 | | | 10,628 | |
| Trustees fees | | | 14,253 | | | 1,039 | | | 26,731 | | | 861 | |
| Professional fees | | | 49,774 | | | 21,420 | | | 77,565 | | | 21,230 | |
| Shareholder reporting expenses | | | 36,547 | | | 9,875 | | | 145,149 | | | 9,701 | |
| Shareholder servicing agent fees | | | 32,337 | | | 291 | | | 91,234 | | | 189 | |
| Stock exchange listing fees | | | 5,483 | | | 219 | | | 36,431 | | | 171 | |
| Investor relations expenses | | | 61,847 | | | 3,706 | | | 92,952 | | | 3,103 | |
| Reorganization expenses | | | 451,080 | | | — | | | — | | | — | |
| Other expenses | | | 80,597 | | | 7,433 | | | 79,130 | | | 6,811 | |
| Total expenses | | | 6,376,436 | | | 223,821 | | | 9,462,439 | | | 167,866 | |
| Net investment income (loss) | | | 17,283,663 | | | 963,306 | | | 30,831,662 | | | 815,704 | |
| Realized and Unrealized Gain (Loss) | | | | | | | | | | | | | |
| Net realized gain (loss) from investments | | | 2,172,472 | | | 672,509 | | | (451,244 | ) | | 18,377 | |
| Change in net unrealized appreciation (depreciation) of investments | | | (2,921,115 | ) | | (6,417 | ) | | 19,639,321 | | | 486,645 | |
| Net realized and unrealized gain (loss) | | | (748,643 | ) | | 666,092 | | | 19,188,077 | | | 505,022 | |
| Net increase (decrease) in net assets applicable to common shares from operations | | $ | 16,535,020 | | $ | 1,629,398 | | $ | 50,019,739 | | $ | 1,320,726 | |
See accompanying notes to financial statements.
| Statement of | |
| | Changes in Net Assets |
| | | New Jersey Dividend Advantage (NXJ) | | New Jersey Municipal Value (NJV) | |
| | | | Year | | | Year | | | Year | | | Year | |
| | | | Ended | | | Ended | | | Ended | | | Ended | |
| | | | 4/30/15 | | | 4/30/14 | | | 4/30/15 | | | 4/30/14 | |
| Operations | | | | | | | | | | | | | |
| Net investment income (loss) | | $ | 17,283,663 | | $ | 4,658,194 | | $ | 963,306 | | $ | 1,021,408 | |
| Net realized gain (loss) from investments | | | 2,172,472 | | | (202,790 | ) | | 672,509 | | | (102,599 | ) |
| Change in net unrealized appreciation (depreciation) of investments | | | (2,921,115 | ) | | (5,498,875 | ) | | (6,417 | ) | | (924,603 | ) |
| Net increase (decrease) in net assets applicable to common shares from operations | | | 16,535,020 | | | (1,043,471 | ) | | 1,629,398 | | | (5,794 | ) |
| Distributions to Common Shareholders | | | | | | | | | | | | | |
| From net investment income | | | (17,478,928 | ) | | (4,477,680 | ) | | (981,771 | ) | | (992,545 | ) |
| From accumulated net realized gains | | | — | | | — | | | (276,526 | ) | | (303,304 | ) |
| Decrease in net assets applicable to common shares from distributions to common shareholders | | | (17,478,928 | ) | | (4,477,680 | ) | | (1,258,297 | ) | | (1,295,849 | ) |
| Capital Share Transactions | | | | | | | | | | | | | |
| Common shares: | | | | | | | | | | | | | |
| Issued in the reorganizations | | | 570,950,389 | | | — | | | — | | | — | |
| Cost of shares repurchased and retired | | | (1,517,510 | ) | | (190,484 | ) | | (213,171 | ) | | — | |
| Net increase (decrease) in net assets applicable to common shares from capital share transactions | | | 569,432,879 | | | (190,484 | ) | | (213,171 | ) | | — | |
| Net increase (decrease) in net assets applicable to common shares | | | 568,488,971 | | | (5,711,635 | ) | | 157,930 | | | (1,301,643 | ) |
| Net assets applicable to common shares at the beginning of period | | | 100,180,619 | | | 105,892,254 | | | 25,272,119 | | | 26,573,762 | |
| Net assets applicable to common shares at the end of period | | $ | 668,669,590 | | $ | 100,180,619 | | $ | 25,430,049 | | $ | 25,272,119 | |
| Undistributed (Over-distribution of) net investment income at the end of period | | $ | 2,444,690 | | $ | 773,618 | | $ | 80,634 | | $ | 99,098 | |
See accompanying notes to financial statements.
| | | Pennsylvania Investment Quality (NQP) | | Pennsylvania Municipal Value (NPN) | |
| | | | Year | | | Year | | | Year | | | Year | |
| | | | Ended | | | Ended | | | Ended | | | Ended | |
| | | | 4/30/15 | | | 4/30/14 | | | 4/30/15 | | | 4/30/14 | |
| Operations | | | | | | | | | | | | | |
| Net investment income (loss) | | $ | 30,831,662 | | $ | 16,275,276 | | $ | 815,704 | | $ | 812,000 | |
| Net realized gain (loss) from investments | | | (451,244 | ) | | (477,117 | ) | | 18,377 | | | (80,435 | ) |
| Change in net unrealized appreciation (depreciation) of investments | | | 19,639,321 | | | (3,570,300 | ) | | 486,645 | | | (601,307 | ) |
| Net increase (decrease) in net assets applicable to common shares from operations | | | 50,019,739 | | | 12,227,859 | | | 1,320,726 | | | 130,258 | |
| Distributions to Common Shareholders | | | | | | | | | | | | | |
| From net investment income | | | (31,976,724 | ) | | (17,907,404 | ) | | (769,411 | ) | | (775,508 | ) |
| From accumulated net realized gains | | | — | | | — | | | — | | | (43,287 | ) |
| Decrease in net assets applicable to common shares from distributions to common shareholders | | | (31,976,724 | ) | | (17,907,404 | ) | | (769,411 | ) | | (818,795 | ) |
| Capital Share Transactions | | | | | | | | | | | | | |
| Common shares: | | | | | | | | | | | | | |
| Issued in the reorganizations | | | — | | | 319,256,565 | | | — | | | — | |
| Cost of shares repurchased and retired | | | (61,628 | ) | | (214,043 | ) | | — | | | — | |
| Net increase (decrease) in net assets applicable to common shares from capital share transactions | | | (61,628 | ) | | 319,042,522 | | | — | | | — | |
| Net increase (decrease) in net assets applicable to common shares | | | 17,981,387 | | | 313,362,977 | | | 551,315 | | | (688,537 | ) |
| Net assets applicable to common shares at the beginning of period | | | 574,558,195 | | | 261,195,218 | | | 19,400,814 | | | 20,089,351 | |
| Net assets applicable to common shares at the end of period | | $ | 592,539,582 | | $ | 574,558,195 | | $ | 19,952,129 | | $ | 19,400,814 | |
| Undistributed (Over-distribution of) net investment income at the end of period | | $ | 690,405 | | $ | 1,468,281 | | $ | 153,803 | | $ | 107,510 | |
See accompanying notes to financial statements.
| Statement of | | |
| | Cash Flows | Year Ended April 30, 2015 |
| | | | New Jersey | | | Pennsylvania | |
| | | | Dividend | | | Investment | |
| | | | Advantage | | | Quality | |
| | | | (NXJ | ) | | (NQP | ) |
| Cash Flows from Operating Activities: | | | | | | | |
| Net Increase (Decrease) in Net Assets Applicable to Common Shares from Operations | | $ | 16,535,020 | | $ | 50,019,739 | |
| Adjustments to reconcile the net increase (decrease) in net assets applicable to common shares from operations to net cash provided by (used in) operating activities: | | | | | | | |
| Purchases of investments | | | (75,068,701 | ) | | (79,011,792 | ) |
| Proceeds from sales and maturities of investments | | | 72,195,484 | | | 85,374,216 | |
| Investment transactions adjustments, net | | | (4,586 | ) | | 116,208 | |
| Taxes paid on undistributed capital gains | | | (21 | ) | | — | |
| Amortization (Accretion) of premiums and discounts, net | | | 1,352,486 | | | 1,121,510 | |
| Amortization of deferred offering costs | | | 96,458 | | | 369,363 | |
| (Increase) Decrease in: | | | | | | | |
| Receivable for dividends | | | 3,300 | | | — | |
| Receivable for interest | | | 77,376 | | | 274,827 | |
| Receivable for investments sold | | | (5,739,666 | ) | | (222,031 | ) |
| Other assets | | | (114,108 | ) | | 4,493 | |
| Increase (Decrease) in: | | | | | | | |
| Payable for interest | | | — | | | (46,232 | ) |
| Payable for investments purchased | | | 1,083,631 | | | 2,021,277 | |
| Accrued management fees | | | 417,708 | | | 12,241 | |
| Accrued Trustees fees | | | 118,773 | | | 28,123 | |
| Accrued reorganization expenses | | | — | | | (1,071,757 | ) |
| Accrued other expenses | | | (904,770 | ) | | 371,436 | |
| Net realized (gain) loss from investments | | | (2,172,472 | ) | | 451,244 | |
| Change in net unrealized (appreciation) depreciation of investments | | | 2,921,115 | | | (19,639,321 | ) |
| Net cash provided by (used in) operating activities | | | 10,797,027 | | | 40,173,544 | |
| Cash Flows from Financing Activities: | | | | | | | |
| (Payments for) deferred offering costs | | | (270,000 | ) | | (135,000 | ) |
| Increase (Decrease) in: | | | | | | | |
| Floating rate obligations | | | — | | | (8,100,000 | ) |
| Payable for offering costs | | | 102,456 | | | (321,538 | ) |
| MuniFund Term Preferred (“MTP”) Shares, at liquidation value | | | (35,050,000 | ) | | (47,740,000 | ) |
| VMTP Shares, at liquidation value | | | — | | | 48,000,000 | |
| VRDP Shares, at liquidation value | | | 36,000,000 | | | — | |
| Cash distributions paid to common shareholders | | | (15,191,288 | ) | | (32,109,923 | ) |
| Cost of common shares repurchased and retired | | | (1,517,510 | ) | | (61,628 | ) |
| Net cash provided by (used in) financing activities | | | (15,926,342 | ) | | (40,468,089 | ) |
| Net Increase (Decrease) in Cash | | | (5,129,315 | ) | | (294,545 | ) |
| Cash at beginning of period | | | 645,299 | | | 1,047,121 | |
| Cash acquired in connection with the Reorganizations | | | 4,790,159 | | | — | |
| Cash at the end of period | | $ | 306,143 | | $ | 752,576 | |
| | | | | | | | |
| | | | New Jersey | | | Pennsylvania | |
| | | | Dividend | | | Investment | |
| | | | Advantage | | | Quality | |
Supplemental Disclosure of Cash Flow Information* | | | (NXJ | ) | | (NQP | ) |
| Cash paid for interest (excluding amortization of offering costs) | | $ | 366,699 | | $ | 994,940 | |
| * | See Notes to Financial Statements, Note 1 – General Information and Significant Accounting Policies, Fund Reorganizations for more information of the non-cash activities related to New Jersey Dividend Advantage’s (NXJ) Reorganization. |
See accompanying notes to financial statements.
THIS PAGE INTENTIONALLY LEFT BLANK
Selected data for a common share outstanding throughout each period:
| | | | | | | | | | | | | | | | | | | | | Less Distributions to | | | | | | | | | | |
| | | | | | Investment Operations | | Common Shareholders | | Common Share | |
| | | Beginning Common Share NAV | | Net Investment Income (Loss) | | Net Realized/ Unrealized Gain (Loss) | | Distributions from Net Investment Income to ARPS Share- holders | (a) | Distributions from Accum- ulated Net Realized Gains to ARPS Share- holders | (a) | Total | | From Net Investment Income | | From Accum- ulated Net Realized Gains | | Total | | Discount Per Share Repurchased and Retired | | Ending NAV | | Ending Share Price | |
| New Jersey Dividend Advantage (NXJ) |
| Year Ended 4/30: | | | | | | | | | | | | | | | | | | | | | | | | | | | | | | | | | | |
| 2015 | | $ | 15.28 | | $ | 0.67 | | $ | 0.34 | | $ | — | | $ | — | | $ | 1.01 | | $ | (0.77 | ) | $ | — | | $ | (0.77 | ) | $ | 0.01 | | $ | 15.53 | | $ | 13.58 | |
| 2014 | | | 16.12 | | | 0.71 | | | (0.87 | ) | | — | | | — | | | (0.16 | ) | | (0.68 | ) | | — | | | (0.68 | ) | | — | * | | 15.28 | | | 13.64 | |
| 2013 | | | 15.31 | | | 0.63 | | | 0.93 | | | — | | | — | | | 1.56 | | | (0.75 | ) | | — | | | (0.75 | ) | | — | | | 16.12 | | | 14.94 | |
| 2012 | | | 13.61 | | | 0.71 | | | 1.83 | | | — | | | — | | | 2.54 | | | (0.83 | ) | | (0.01 | ) | | (0.84 | ) | | — | | | 15.31 | | | 14.92 | |
| 2011 | | | 14.51 | | | 0.89 | | | (0.91 | ) | | (0.03 | ) | | — | * | | (0.05 | ) | | (0.83 | ) | | (0.02 | ) | | (0.85 | ) | | — | | | 13.61 | | | 12.67 | |
| |
| New Jersey Municipal Value (NJV) |
| Year Ended 4/30: | | | | | | | | | | | | | | | | | | | | | | | | | | | | | | | | | | |
| 2015 | | | 16.15 | | | 0.62 | | | 0.43 | | | N/A | | | N/A | | | 1.05 | | | (0.63 | ) | | (0.18 | ) | | (0.81 | ) | | 0.02 | | | 16.41 | | | 14.75 | |
| 2014 | | | 16.98 | | | 0.65 | | | (0.66 | ) | | N/A | | | N/A | | | (0.01 | ) | | (0.63 | ) | | (0.19 | ) | | (0.82 | ) | | — | | | 16.15 | | | 14.48 | |
| 2013 | | | 16.62 | | | 0.67 | | | 0.61 | | | N/A | | | N/A | | | 1.28 | | | (0.67 | ) | | (0.25 | ) | | (0.92 | ) | | — | | | 16.98 | | | 16.02 | |
| 2012 | | | 14.72 | | | 0.75 | | | 1.91 | | | N/A | | | N/A | | | 2.66 | | | (0.76 | ) | | — | | | (0.76 | ) | | — | | | 16.62 | | | 16.34 | |
| 2011 | | | 15.84 | | | 0.82 | | | (1.15 | ) | | N/A | | | N/A | | | (0.33 | ) | | (0.77 | ) | | (0.02 | ) | | (0.79 | ) | | — | | | 14.72 | | | 13.81 | |
| (a) | The amounts shown for Auction Rate Preferred Shares (“ARPS”) are based on common share equivalents. |
| (b) | Total Return Based on Common Share NAV is the combination of changes in common share NAV, reinvested dividend income at NAV and reinvested capital gains distributions at NAV, if any. The last dividend declared in the period, which is typically paid on the first business day of the following month, is assumed to be reinvested at the ending NAV. The actual reinvest price for the last dividend declared in the period may often be based on the Fund’s market price (and not its NAV), and therefore may be different from the price used in the calculation. Total returns are not annualized. |
| | |
| | Total Return Based on Common Share Price is the combination of changes in the market price per share and the effect of reinvested dividend income and reinvested capital gains distributions, if any, at the average price paid per share at the time of reinvestment. The last dividend declared in the period, which is typically paid on the first business day of the following month, is assumed to be reinvested at the ending market price. The actual reinvestment for the last dividend declared in the period may take place over several days, and in some instances may not be based on the market price, so the actual reinvestment price may be different from the price used in the calculation. Total returns are not annualized. |
| (c) | After expense reimbursement from the Adviser, where applicable. As of March 31, 2011 the Adviser is no longer reimbursing New Jersey Dividend Advantage (NXJ) for any fees or expenses. |
| | | | | | | | Common Share Supplemental Data/ | |
| | | | | | | | Ratios applicable to Common Shares | |
| | Common Share | | | | | | Ratios to Average Net Assets | | | Ratios to Average Net Assets | | | |
| | Total Returns | | | | | | Before Reimbursement(d) | | | After Reimbursement(c)(d) | | | | |
| | | | | | | | | | | | | | | | | | | | | | | | |
| | Based on NAV | (b) | | Based on Share Price | (b) | | Ending Net Assets (000) | | | Expenses | (e) | | Net Investment Income (Loss) | | | Expenses | (e) | | Net Investment Income (Loss) | | | Portfolio Turnover Rate | (f) |
| | | | | | | | | | | | | | | | | | | | | | | | |
| | | | | | | | | | | | | | | | | | | | | | | | |
| | 6.77 | % | | 5.35 | % | $ | 668,670 | | | 1.71 | % | | 4.64 | % | | N/A | | | N/A | | | 14 | % |
| | (0.71 | ) | | (3.78 | ) | | 100,181 | | | 2.07 | | | 4.83 | | | N/A | | | N/A | | | 6 | |
| | 10.29 | | | 5.04 | | | 105,892 | | | 2.37 | | | 3.91 | | | N/A | | | N/A | | | 17 | |
| | 19.09 | | | 25.08 | | | 100,578 | | | 2.52 | | | 4.82 | | | N/A | | | N/A | | | 15 | |
| | (0.38 | ) | | 0.11 | | | 89,399 | | | 1.34 | | | 6.16 | | | 1.27 | % | | 6.23 | % | | 6 | |
| | | | | | | | | | | | | | | | | | | | | | | | |
| | | | | | | | | | | | | | | | | | | | | | | | |
| | 6.68 | | | 7.62 | | | 25,430 | | | 0.87 | | | 3.75 | | | N/A | | | N/A | | | 13 | |
| | 0.25 | | | (4.18 | ) | | 25,272 | | | 0.88 | | | 4.12 | | | N/A | | | N/A | | | 12 | |
| | 7.86 | | | 3.58 | | | 26,574 | | | 0.83 | | | 3.95 | | | N/A | | | N/A | | | 7 | |
| | 18.43 | | | 24.34 | | | 25,957 | | | 0.85 | | | 4.76 | | | N/A | | | N/A | | | 20 | |
| | (2.17 | ) | | (4.19 | ) | | 22,981 | | | 0.85 | | | 5.32 | | | N/A | | | N/A | | | 2 | |
| (d) | Ratios do not reflect the effect of dividend payments to ARPS shareholders, during periods when ARPS were outstanding; Net Investment Income (Loss) ratios reflect income earned and expenses incurred on assets attributable to ARPS and other subsequent forms of preferred shares issued by the Fund, where applicable. |
| (e) | The expense ratios reflect, among other things, all interest expense and other costs related to preferred shares (as described in Note 4 – Fund Shares, Preferred Shares) and/or the interest expense deemed to have been paid by the Fund on the floating rate certificates issued by the special purpose trusts for the self-deposited inverse floaters held by the Fund (as described in Note 3 – Portfolio Securities and Investments in Derivatives, Inverse Floating Rate Securities), where applicable, as follows: |
| New Jersey Dividend Advantage (NXJ) | | |
| Year Ended 4/30: | | |
| 2015 | 0.60 | % |
| 2014 | 0.98 | |
| 2013 | 1.27 | |
| 2012 | 1.41 | |
| 2011 | 0.15 | |
| New Jersey Municipal Value (NJV) | | |
| Year Ended 4/30: | | |
| 2015 | 0.04 | % |
| 2014 | 0.04 | |
| 2013 | 0.04 | |
| 2012 | 0.04 | |
| 2011 | 0.06 | |
| (f) | Portfolio Turnover Rate is calculated based on the lesser of long-term purchases or sales (as disclosed in Note 5 – Investment Transactions) divided by the average long-term market value during the period. |
| * | Rounds to less than $0.01 per share. |
| N/A | New Jersey Municipal Value (NJV) is not authorized to issue ARPS and does not have a contractual reimbursement agreement with the Adviser. New Jersey Dividend Advantage (NXJ) no longer has a contractual reimbursement agreement with the Adviser. |
See accompanying notes to financial statements.
Financial Highlights (continued)
Selected data for a common share outstanding throughout each period:
| | | | | | Investment Operations | | Less Distributions to Common Shareholders | | Common Share | |
| | | Beginning Common Share NAV | | Net Investment Income (Loss) | | Net Realized/ Unrealized Gain (Loss) | | Distributions from Net Investment Income to ARPS Share- holders | (a) | Distributions from Accum ulated Net Realized Gains to ARPS Share- holders | (a) | Total | | From Net Investment Income | | From Accum- ulated Net Realized Gains | | Total | | Discount Per Share Repurchased and Retired | | Ending NAV | | Ending Share Price | |
| Pennsylvania Investment Quality (NQP) | | | | | | | | | | | | | | | | | | | | | | | | | | | | |
| Year Ended 4/30: | | | | | | | | | | | | | | | | | | | | | | | | | | | | | | | | | | |
| 2015 | | $ | 15.17 | | $ | 0.81 | | $ | 0.50 | | $ | — | | $ | — | | $ | 1.31 | | $ | (0.84 | ) | $ | — | | $ | (0.84 | ) | $ | — | * | $ | 15.64 | | $ | 13.87 | |
| 2014 | | | 16.21 | | | 0.74 | | | (0.93 | ) | | — | | | — | | | (0.19 | ) | | (0.85 | ) | | — | | | (0.85 | ) | | — | * | | 15.17 | | | 13.76 | |
| 2013 | | | 15.78 | | | 0.80 | | | 0.54 | | | — | | | — | | | 1.34 | | | (0.91 | ) | | — | | | (0.91 | ) | | — | | | 16.21 | | | 15.24 | |
| 2012 | | | 14.11 | | | 0.90 | | | 1.70 | | | — | | | — | | | 2.60 | | | (0.93 | ) | | — | | | (0.93 | ) | | — | | | 15.78 | | | 15.67 | |
| 2011 | | | 14.82 | | | 0.93 | | | (0.73 | ) | | (0.01 | ) | | — | | | 0.19 | | | (0.90 | ) | | — | | | (0.90 | ) | | — | | | 14.11 | | | 13.09 | |
| | | | | | | | | | | | | | | | | | | | | | | | | | | | | | | | | | | | | | |
| Pennsylvania Municipal Value (NPN) | | | | | | | | | | | | | | | | | | | | | | | | | | | | |
| Year Ended 4/30: | | | | | | | | | | | | | | | | | | | | | | | | | | | | | | | | | | | | | |
| 2015 | | | 15.91 | | | 0.67 | | | 0.41 | | | N/A | | | N/A | | | 1.08 | | | (0.63 | ) | | — | | | (0.63 | ) | | — | | | 16.36 | | | 15.57 | |
| 2014 | | | 16.48 | | | 0.67 | | | (0.56 | ) | | N/A | | | N/A | | | 0.11 | | | (0.64 | ) | | (0.04 | ) | | (0.68 | ) | | — | | | 15.91 | | | 14.45 | |
| 2013 | | | 16.36 | | | 0.68 | | | 0.38 | | | N/A | | | N/A | | | 1.06 | | | (0.64 | ) | | (0.30 | ) | | (0.94 | ) | | — | | | 16.48 | | | 15.86 | |
| 2012 | | | 14.79 | | | 0.72 | | | 1.58 | | | N/A | | | N/A | | | 2.30 | | | (0.71 | ) | | (0.02 | ) | | (0.73 | ) | | — | | | 16.36 | | | 15.38 | |
| 2011 | | | 15.46 | | | 0.79 | | | (0.70 | ) | | N/A | | | N/A | | | 0.09 | | | (0.76 | ) | | — | | | (0.76 | ) | | — | | | 14.79 | | | 13.96 | |
| (a) | The amounts shown for Auction Rate Preferred Shares (“ARPS”) are based on common share equivalents. |
| (b) | Total Return Based on Common Share NAV is the combination of changes in common share NAV, reinvested dividend income at NAV and reinvested capital gains distributions at NAV, if any. The last dividend declared in the period, which is typically paid on the first business day of the following month, is assumed to be reinvested at the ending NAV. The actual reinvest price for the last dividend declared in the period may often be based on the Fund’s market price (and not its NAV), and therefore may be different from the price used in the calculation. Total returns are not annualized. |
| | |
| | Total Return Based on Common Share Price is the combination of changes in the market price per share and the effect of reinvested dividend income and reinvested capital gains distributions, if any, at the average price paid per share at the time of reinvestment. The last dividend declared in the period, which is typically paid on the first business day of the following month, is assumed to be reinvested at the ending market price. The actual reinvestment for the last dividend declared in the period may take place over several days, and in some instances may not be based on the market price, so the actual reinvestment price may be different from the price used in the calculation. Total returns are not annualized. |
| | | | | Common Share Supplemental Data/ Ratios Applicable to Common Shares | |
| | Common Share Total Returns | | | | | | Ratios to Average Net Asset (c) | | | |
| | | | | | | | | | | | | | | | | | | |
| | | Based on NAV | (b) | | Based on Share Price | (b) | | Ending Net Assets (000) | | | Expenses | (d) | | Net Investment Income (Loss) | | | Portfolio Turnover Rate | (e) |
| | | | | | | | | | | | | | | | | | | |
| | | | | | | | | | | | | | | | | | | |
| | | 8.79 | % | | 7.09 | % | $ | 592,540 | | | 1.60 | % | | 5.21 | % | | 9 | % |
| | | (0.69 | ) | | (3.65 | ) | | 574,558 | | | 1.87 | | | 5.33 | | | 8 | |
| | | 8.50 | | | 2.97 | | | 261,195 | | | 1.80 | | | 4.98 | | | 17 | |
| | | 18.88 | | | 27.48 | | | 253,937 | | | 1.63 | | | 6.00 | | | 18 | |
| | | 1.27 | | | 2.43 | | | 226,905 | | | 1.60 | | | 6.38 | | | 8 | |
| | | | | | | | | | | | | | | | | | | |
| | | | | | | | | | | | | | | | | | | |
| | | 6.87 | | | 12.30 | | | 19,952 | | | 0.85 | | | 4.11 | | | 5 | |
| | | 0.80 | | | (4.45 | ) | | 19,401 | | | 0.85 | | | 4.28 | | | 6 | |
| | | 6.58 | | | 9.39 | | | 20,089 | | | 0.81 | | | 4.11 | | | 7 | |
| | | 15.89 | | | 15.68 | | | 19,948 | | | 0.86 | | | 4.60 | | | 11 | |
| | | 0.59 | | | (4.77 | ) | | 18,029 | | | 0.87 | | | 5.17 | | | 3 | |
| (c) | Ratios do not reflect the effect of dividend payments to ARPS shareholders, during periods when ARPS were outstanding; Net Investment Income (Loss) ratios reflect income earned and expenses incurred on assets attributable to ARPS and other subsequent forms of preferred shares issued by the Fund, where applicable. |
| (d) | The expense ratios reflect, among other things, all interest expense and other costs related to preferred shares (as described in Note 4 – Fund Shares, Preferred Shares) and/or the interest expense deemed to have been paid by the Fund on the floating rate certificates issued by the special purpose trusts for the self-deposited inverse floaters held by the Fund (as described in Note 3 – Portfolio Securities and Investments in Derivatives, Inverse Floating Rate Securities), where applicable, as follows: |
| Pennsylvania Investment Quality (NQP) | | |
| Year Ended 4/30: | | |
| 2015 | 0.60 | % |
| 2014 | 0.68 | |
| 2013 | 0.72 | |
| 2012 | 0.61 | |
| 2011 | 0.55 | |
| Pennsylvania Municipal Value (NPN) | | |
| Year Ended 4/30: | | |
| 2015 | — | % |
| 2014 | — | |
| 2013 | — | |
| 2012 | — | |
| 2011 | — | |
| (e) | Portfolio Turnover Rate is calculated based on the lesser of long-term purchases or sales (as disclosed in Note 5 – Investment Transactions) divided by the average long-term market value during the period. |
| N/A | Fund is not authorized to issue ARPS. |
| * | Rounds to less than $0.01 per share. |
See accompanying notes to financial statements.
Financial Highlights (continued)
| | | | MTP Shares at the End of Period (a) | | | VMTP Shares at the End of Period | | | VRDP Shares at the End of Period | | | MTP, VMTP and VRDP Shares at the End of Period | |
| | | | Aggregate Amount Outstanding (000) | | | Asset Coverage Per $10 Share | | | Aggregate Amount Outstanding (000) | | | Asset Coverage Per $100,000 Share | | | Aggregate Amount Outstanding (000) | | | Asset Coverage Per $100,000 Share | | | Asset Coverage Per $1 Liquidation Preference | |
| New Jersey Dividend Advantage (NXJ) | | | | | | | | | | | | | | | | | | | |
| Year Ended 4/30: | | | | | | | | | | | | | | | | | | | | | | |
| 2015 | | $ | — | | $ | — | | $ | — | | $ | — | | $ | 313,900 | | $ | 313,020 | | $ | — | |
| 2014 | | | — | | | — | | | — | | | — | | | 45,000 | | | 322,624 | | | — | |
| 2013 | | | 44,861 | | | 33.60 | | | — | | | — | | | — | | | — | | | — | |
| 2012 | | | 44,861 | | | 32.42 | | | — | | | — | | | — | | | — | | | — | |
| 2011 | | | 44,861 | | | 29.93 | | | — | | | — | | | — | | | — | | | — | |
| | | | | | | | | | | | | | | | | | | | | | | |
| Pennsylvania Investment Quality (NQP) | | | | | | | | | | | | | | | | | | |
| Year Ended 4/30: | | | | | | | | | | | | | | | | | | | | | | |
| 2015 | | | — | | | — | | | 48,000 | | | 323,179 | | | 217,500 | | | 323,179 | | | 3.23 | |
| 2014 | | | 47,740 | | | 31.66 | | | — | | | — | | | 217,500 | | | 316,618 | | | 3.17 | |
| 2013 | | | — | | | — | | | — | | | — | | | 112,500 | | | 332,174 | | | — | |
| 2012 | | | — | | | — | | | — | | | — | | | 112,500 | | | 325,722 | | | — | |
| 2011 | | | — | | | — | | | — | | | — | | | 112,500 | | | 301,693 | | | — | |
| (a) | The Ending and Average Market Value Per Share for each Series of the Fund’s MTP Shares were as follows: |
| | | | 2015 | | | 2014 | | | 2013 | | | 2012 | | | 2011 | |
| New Jersey Dividend Advantage (NXJ) | | | | | | | | | | | | | | | | |
| Series 2014 (NXJ PRCCL) | | | | | | | | | | | | | | | | |
| Ending Market Value per Share | | $ | — | | $ | — | | $ | 10.02 | | $ | 10.08 | | $ | 9.94 | |
| Average Market Value per Share | | | — | | | 10.03 | ^^ | | 10.09 | | | 10.07 | | | 9.95 | ^ |
| Series 2015 (NXJ PRCCL) | | | | | | | | | | | | | | | | |
| Ending Market Value per Share | | | — | | | | | | | | | | | | | |
| Average Market Value per Share | | | 10.01 | ^^^ | | | | | | | | | | | | |
| | | | | | | | | | | | | | | | | |
| Pennsylvania Dividend Advantage (NQP) | | | | | | | | | | | | | | | | |
| Series 2015 (NQP PRCCL) | | | | | | | | | | | | | | | | |
| Ending Market Value per Share | | | — | | | 10.05 | | | | | | | | | | |
| Average Market Value per Share | | | 10.01 | ΩΩ | | 10.03 | Ω | | | | | | | | | |
| Series 2015 (NQP PRDCL) | | | | | | | | | | | | | | | | |
| Ending Market Value per Share | | | — | | | 10.04 | | | | | | | | | | |
| Average Market Value per Share | | | 10.02 | ΩΩ | | 10.03 | Ω | | | | | | | | | |
| ^ | For the period March 24, 2011 (first issuance of shares) through April 30, 2011. |
| ^^ | For the period May 1, 2013 through September 9, 2013. |
| ^^^ | For the period November 10, 2014 (effective date of the reorganizations) through February 9, 2015. |
| Ω | For the period February 11, 2014 (effective date of the reorganizations) through April 30, 2014. |
| ΩΩ | For the period May 1, 2014 through May 30, 2014. |
See accompanying notes to financial statements.
Notes to Financial Statements
1. General Information and Significant Accounting Policies
General Information
Fund Information
The funds covered in this report and their corresponding New York Stock Exchange (“NYSE”) or NYSE MKT symbols are as follows (each a “Fund” and collectively, the “Funds”):
• Nuveen New Jersey Dividend Advantage Municipal Fund (NXJ) (“New Jersey Dividend Advantage (NXJ)”)
• Nuveen New Jersey Municipal Value Fund (NJV) (“New Jersey Municipal Value (NJV)”)
• Nuveen Pennsylvania Investment Quality Municipal Fund (NQP) (“Pennsylvania Investment Quality (NQP)”)
• Nuveen Pennsylvania Municipal Value Fund (NPN) (“Pennsylvania Municipal Value (NPN)”)
The Funds are registered under the Investment Company Act of 1940, as amended, as diversified closed-end management investment companies. Common shares of New Jersey Dividend Advantage (NXJ) and Pennsylvania Investment Quality (NQP) are traded on the NYSE while common shares of New Jersey Municipal Value (NJV) and Pennsylvania Municipal Value (NPN) are traded on the NYSE MKT. New Jersey Dividend Advantage (NXJ), New Jersey Municipal Value (NJV), Pennsylvania Investment Quality (NQP) and Pennsylvania Municipal Value (NPN) were organized as Massachusetts business trusts on June 1, 1999, January 26, 2009, December 20, 1990 and January 26, 2009, respectively.
The end of the reporting period for the Funds is April 30, 2015, and the period covered by these Notes to Financial Statements is the fiscal year ended April 30, 2015 (“the current fiscal period”).
Investment Adviser
The Funds’ investment adviser is Nuveen Fund Advisors, LLC (the “Adviser”), a wholly-owned subsidiary of Nuveen Investments, Inc. (“Nuveen”). The Adviser is responsible for each Fund’s overall investment strategy and asset allocation decisions. The Adviser has entered into sub-advisory agreements with Nuveen Asset Management, LLC (the “Sub-Adviser”), a subsidiary of the Adviser, under which the Sub-Adviser manages the investment portfolios of the Funds.
Investment Objectives and Principal Investment Strategies
Each Fund seeks to provide current income exempt from both regular federal and designated state income taxes by investing primarily in a portfolio of municipal obligations issued by state and local government authorities within a single state or certain U.S. territories.
Fund Reorganizations
Effective prior to the opening of business on November 10, 2014, certain New Jersey Funds were reorganized into one, larger-state Fund included in this report (the “Reorganizations”) as follows:
| | Target Funds | Acquiring Fund | |
| | Nuveen New Jersey Investment Quality Municipal Fund, Inc. (NQJ) | New Jersey Dividend Advantage (NXJ) | |
| | (“New Jersey Investment Quality (NQJ)”) | | |
| | Nuveen New Jersey Premium Income Municipal Fund, Inc. (NNJ) | | |
| | (“New Jersey Premium Income (NNJ)”) | | |
| | Nuveen New Jersey Dividend Advantage Municipal Fund 2 (NUJ) | | |
| | (“New Jersey Dividend Advantage 2 (NUJ)”) | | |
For accounting and performance reporting purposes, the Acquiring Fund is the survivor.
Upon the closing of the Reorganizations, the Target Funds transfered their assets to the Acquiring Fund in exchange for common and preferred shares of the Acquiring Fund and the assumption by the Acquiring Fund of the liabilities of the Target Funds. The Target Funds were then liquidated, dissolved and terminated in accordance with their Declaration of Trust. Shareholders of the Target Funds became shareholders of the Acquiring Fund. Holders of common shares of the Target Funds received newly issued common shares of the Acquiring Fund, the aggregate net asset value (“NAV”) of which was equal to the aggregate NAV of the common shares of the Target Funds held immediately prior to the Reorganizations (including for this purpose fractional Acquiring Fund shares to which shareholders were entitled). Holders of preferred shares of the Target Funds received on a one-for-one basis newly issued preferred shares of the Acquiring Fund, in exchange for preferred shares of the Target Funds held immediately prior to the Reorganizations. Details of the New Jersey Funds’ Reorganizations are further described in Note 8 – Fund Reorganizations.
Notes to Financial Statements (continued)
Significant Accounting Policies
Each Fund is an investment company and follows accounting and reporting guidance under Financial Accounting Standards Board (FASB) Accounting Standards Codification (ASC) Topic 946, “Financial Services – Investment Companies.” The following is a summary of significant accounting policies followed by the Funds in the preparation of their financial statements in accordance with U.S. generally accepted accounting principles (“U.S. GAAP”).
Investment Transactions
Investment transactions are recorded on a trade date basis. Realized gains and losses from investment transactions are determined on the specific identification method, which is the same basis used for federal income tax purposes. Investments purchased on a when-issued/delayed delivery basis may have extended settlement periods. Any investments so purchased are subject to market fluctuation during this period. The Funds have instructed the custodian to earmark securities in the Funds’ portfolios with a current value at least equal to the amount of the when-issued/delayed delivery purchase commitments.
As of the end of the reporting period, the Funds’ outstanding when-issued/delayed delivery purchase commitments were as follows:
| | | New Jersey | | | New Jersey | | | Pennsylvania | | | Pennsylvania | |
| | | Dividend | | | Municipal | | | Investment | | | Municipal | |
| | | Advantage | | | Value | | | Quality | | | Value | |
| | | (NXJ | ) | | (NJV | ) | | (NQP | ) | | (NPN | ) |
| Outstanding when-issued/delayed delivery purchase commitments | | $ | 7,618,699 | | | $ | 364,238 | | | $ | 2,021,277 | | | $ | 106,383 | |
Investment Income
Investment income, which reflects the amortization of premiums and accretion of discounts for financial reporting purposes, is recorded on an accrual basis. Investment income also reflects paydown gains and losses, if any.
Professional Fees
Professional fees presented on the Statement of Operations consist of legal fees incurred in the normal course of operations, audit fees, tax consulting fees and, in some cases, workout expenditures. Workout expenditures are incurred in an attempt to protect or enhance an investment or to pursue other claims or legal actions on behalf of Fund shareholders. If a refund is received for workout expenditures paid in a prior reporting period, such amounts will be recognized as “Legal fee refund” on the Statement of Operations.
Dividends and Distributions to Common Shareholders
Dividends from net investment income are declared monthly. Net realized capital gains and/or market discount from investment transactions, if any, are distributed to shareholders at least annually. Furthermore, capital gains are distributed only to the extent they exceed available capital loss carryforwards.
Distributions to common shareholders of net investment income, net realized capital gains and/or market discount, if any, are recorded on the ex-dividend date. The amount and timing of distributions are determined in accordance with federal income tax regulations, which may differ from U.S. GAAP.
Indemnifications
Under the Funds’ organizational documents, their officers and trustees are indemnified against certain liabilities arising out of the performance of their duties to the Funds. In addition, in the normal course of business, the Funds enter into contracts that provide general indemnifications to other parties. The Funds’ maximum exposure under these arrangements is unknown as this would involve future claims that may be made against the Funds that have not yet occurred. However, the Funds have not had prior claims or losses pursuant to these contracts and expect the risk of loss to be remote.
Netting Agreements
In the ordinary course of business, the Funds may enter into transactions subject to enforceable International Swaps and Derivative Association, Inc. (“ISDA”) master agreements or other similar arrangements (“netting agreements”). Generally, the right to offset in netting agreements allows each Fund to offset any exposure to a specific counterparty with any collateral received or delivered to that counterparty based on the terms of the agreements. Generally, each Fund manages its cash collateral and securities collateral on a counterparty basis.
The Funds’ investments subject to netting agreements as of the end of the reporting period, if any, are further described in Note 3 – Portfolio Securities and Investments in Derivatives.
Use of Estimates
The preparation of financial statements in conformity with U.S. GAAP requires management to make estimates and assumptions that affect the reported amounts of assets and liabilities at the date of the financial statements and the reported amounts of increases and decreases in net assets applicable to common shares from operations during the reporting period. Actual results may differ from those estimates.
2. Investment Valuation and Fair Value Measurements
The fair valuation input levels as described below are for fair value measurement purposes.
Fair value is defined as the price that would be received upon selling an investment or transferring a liability in an orderly transaction to an independent buyer in the principal or most advantageous market for the investment. A three-tier hierarchy is used to maximize the use of observable market data and minimize the use of unobservable inputs and to establish classification of fair value measurements for disclosure purposes. Observable inputs reflect the assumptions market participants would use in pricing the asset or liability. Observable inputs are based on market data obtained from sources independent of the reporting entity. Unobservable inputs reflect the reporting entity’s own assumptions about the assumptions market participants would use in pricing the asset or liability. Unobservable inputs are based on the best information available in the circumstances. The following is a summary of the three-tiered hierarchy of valuation input levels.
| Level 1 – | Inputs are unadjusted and prices are determined using quoted prices in active markets for identical securities. |
| | |
| Level 2 – | Prices are determined using other significant observable inputs (including quoted prices for similar securities, interest rates, prepayment speeds, credit risk, etc.). |
| | |
| Level 3 – | Prices are determined using significant unobservable inputs (including management’s assumptions in determining the fair value of investments). |
Prices of fixed income securities are provided by a pricing service approved by the Funds’ Board of Trustees (the “Board”). The pricing service establishes a security’s fair value using methods that may include consideration of the following: yields or prices of investments of comparable quality, type of issue, coupon, maturity and rating, market quotes or indications of value from security dealers, evaluations of anticipated cash flows or collateral, general market conditions and other information and analysis, including the obligor’s credit characteristics considered relevant. These securities are generally classified as Level 2. In pricing certain securities, particularly less liquid and lower quality securities, the pricing service may consider information about a security, its issuer or market activity provided by the Adviser. These securities are generally classified as Level 2 or Level 3 depending on the priority of the significant inputs.
Common stocks and other equity-type securities are valued at the last sales price on the securities exchange on which such securities are primarily traded and are generally classified as Level 1. Securities primarily traded on the NASDAQ National Market (“NASDAQ”) are valued at the NASDAQ Official Closing Price and are generally classified as Level 1. However, securities traded on a securities exchange or NASDAQ for which there were no transactions on a given day or securities not listed on a securities exchange or NASDAQ are valued at the quoted bid price and are generally classified as Level 2.
Certain securities may not be able to be priced by the pre-established pricing methods as described above. Such securities may be valued by the Board and/or its appointee at fair value. These securities generally include, but are not limited to, restricted securities (securities which may not be publicly sold without registration under the Securities Act of 1933, as amended) for which a pricing service is unable to provide a market price; securities whose trading has been formally suspended; debt securities that have gone into default and for which there is no current market quotation; a security whose market price is not available from a pre-established pricing source; a security with respect to which an event has occurred that is likely to materially affect the value of the security after the market has closed but before the calculation of a Fund’s NAV (as may be the case in non-U.S. markets on which the security is primarily traded) or make it difficult or impossible to obtain a reliable market quotation; and a security whose price, as provided by the pricing service, is not deemed to reflect the security’s fair value. As a general principle, the fair value of a security would appear to be the amount that the owner might reasonably expect to receive for it in a current sale. A variety of factors may be considered in determining the fair value of such securities, which may include consideration of the following: yields or prices of investments of comparable quality, type of issue, coupon, maturity and rating, market quotes or indications of value from security dealers, evaluations of anticipated cash flows or collateral, general market conditions and other information and analysis, including the obligor’s credit characteristics considered relevant. These securities are generally classified as Level 2 or Level 3 depending on the priority of the significant inputs. Regardless of the method employed to value a particular security, all valuations are subject to review by the Board and/or its appointee.
Notes to Financial Statements (continued)
The inputs or methodologies used for valuing securities are not an indication of the risks associated with investing in those securities. The following is a summary of each Fund’s fair value measurements as of the end of the reporting period:
| New Jersey Dividend Advantage (NXJ) | | Level 1 | | | Level 2 | | | Level 3 | | | Total | |
| Long-Term Investments*: | | | | | | | | | | | | |
| Municipal Bonds | | $ | — | | | $ | 967,170,129 | | | $ | — | | | $ | 967,170,129 | |
| Common Stocks | | | 2,262,732 | | | | — | | | | — | | | | 2,262,732 | |
| Total | | $ | 2,262,732 | | | $ | 967,170,129 | | | $ | — | | | $ | 969,432,861 | |
| | | | | | | | | | | | | | | | | |
| New Jersey Municipal Value (NJV) | | | | | | | | | | | | | | | | |
| Long-Term Investments*: | | | | | | | | | | | | | | | | |
| Municipal Bonds | | $ | — | | | $ | 25,661,616 | | | $ | — | | | $ | 25,661,616 | |
| Common Stocks | | | 724,661 | | | | — | | | | — | | | | 724,661 | |
| Total | | $ | 724,661 | | | $ | 25,661,616 | | | $ | — | | | $ | 26,386,277 | |
| | | | | | | | | | | | | | | | | |
| Pennsylvania Investment Quality (NQP) | | | | | | | | | | | | | | | | |
| Long-Term Investments*: | | | | | | | | | | | | | | | | |
| Municipal Bonds | | $ | — | | | $ | 875,023,063 | | | $ | — | | | $ | 875,023,063 | |
| | | | | | | | | | | | | | | | | |
| Pennsylvania Municipal Value (NPN) | | | | | | | | | | | | | | | | |
| Long-Term Investments*: | | | | | | | | | | | | | | | | |
| Municipal Bonds | | $ | — | | | $ | 19,734,300 | | | $ | — | | | $ | 19,734,300 | |
* Refer to the Fund’s Portfolio of Investments for industry classifications.
The Board is responsible for the valuation process and has appointed the oversight of the daily valuation process to the Adviser’s Valuation Committee. The Valuation Committee, pursuant to the valuation policies and procedures adopted by the Board, is responsible for making fair value determinations, evaluating the effectiveness of the Funds’ pricing policies and reporting to the Board. The Valuation Committee is aided in its efforts by the Adviser’s dedicated Securities Valuation Team, which is responsible for administering the daily valuation process and applying fair value methodologies as approved by the Valuation Committee. When determining the reliability of independent pricing services for investments owned by the Funds, the Valuation Committee, among other things, conducts due diligence reviews of the pricing services and monitors the quality of security prices received through various testing reports conducted by the Securities Valuation Team.
The Valuation Committee will consider pricing methodologies it deems relevant and appropriate when making a fair value determination, based on the facts and circumstances specific to the portfolio instrument. Fair value determinations generally will be derived as follows, using public or private market information:
| (i) | If available, fair value determinations shall be derived by extrapolating from recent transactions or quoted prices for identical or comparable securities. |
| | |
| (ii) | If such information is not available, an analytical valuation methodology may be used based on other available information including, but not limited to: analyst appraisals, research reports, corporate action information, issuer financial statements and shelf registration statements. Such analytical valuation methodologies may include, but are not limited to: multiple of earnings, discount from market value of a similar freely-traded security, discounted cash flow analysis, book value or a multiple thereof, risk premium/yield analysis, yield to maturity and/or fundamental investment analysis. |
The purchase price of a portfolio instrument will be used to fair value the instrument only if no other valuation methodology is available or deemed appropriate, and it is determined that the purchase price fairly reflects the instrument’s current value.
For each portfolio security that has been fair valued pursuant to the policies adopted by the Board, the fair value price is compared against the last available and next available market quotations. The Valuation Committee reviews the results of such testing and fair valuation occurrences are reported to the Board.
3. Portfolio Securities and Investments in Derivatives
Portfolio Securities
Inverse Floating Rate Securities
Each Fund is authorized to invest in inverse floating rate securities. An inverse floating rate security is created by depositing a municipal bond (referred to as an “Underlying Bond”), typically with a fixed interest rate, into a special purpose trust (referred to as the “Trust”) created by or at the direction of one or more Funds. In turn, the Trust issues (a) floating rate certificates (referred to as “Floaters”), in face amounts equal to some fraction of the Underlying Bond’s par amount or market value, and (b) an inverse floating rate certificate (referred to as an “Inverse Floater”) that represents all remaining or residual interest in the Trust. Floaters typically pay short-term tax-exempt interest rates to third parties who are also provided a right to tender their certificate and receive its par value, which may be paid from the proceeds of a remarketing of the Floaters, by a loan to the Trust from a third party liquidity provider, or by the sale of assets from the Trust. The Inverse Floater is issued to a long term investor, such as one or more of the Funds. The income received by the Inverse Floater holder varies inversely with the short-term rate paid to holders of the Floaters, and in most
circumstances the Inverse Floater holder bears substantially all of the Underlying Bond’s downside investment risk and also benefits disproportionately from any potential appreciation of the Underlying Bond’s value. The value of an Inverse Floater will be more volatile than that of the Underlying Bond because the interest rate is dependent on not only the fixed coupon rate of the Underlying Bond but also on the short-term interest paid on the Floaters, and because the Inverse Floater essentially bears the risk of loss of the greater face value of the Underlying Bond.
The Inverse Floater held by a Fund gives the Fund the right to (a) cause the holders of the Floaters to tender their certificates at par, and (b) have the trustee of the Trust transfer the Underlying Bond held by the Trust to the Fund, thereby collapsing the Trust.
The Fund may acquire an Inverse Floater in a transaction where it (a) transfers an Underlying Bond that it owns to a Trust created by a third party or (b) transfers an Underlying Bond that it owns, or that it has purchased in a secondary market transaction for the purpose of creating an Inverse Floater, to a Trust created at its direction, and in return receives the Inverse Floater of the Trust (referred to as a “self-deposited Inverse Floater”). A Fund may also purchase an Inverse Floater in a secondary market transaction from a third party creator of the Trust without first owning the Underlying Bond (referred to as an “externally-deposited Inverse Floater”).
An investment in a self-deposited Inverse Floater is accounted for as a “financing” transaction (i.e., a secured borrowing). For a self-deposited Inverse Floater, the Underlying Bond deposited into the Trust is identified in the Fund’s Portfolio of Investments as “(UB) – Underlying bond of an inverse floating rate trust reflected as a financing transaction,” with the Fund recognizing the Floaters issued by the Trust as liabilities, at their liquidation value on the Statement of Assets and Liabilities as “Floating rate obligations.” In addition, the Fund recognizes in “Investment Income” the entire earnings of the Underlying Bond and recognizes the related interest paid to the holders of the Floaters as a component of “Interest expense and amortization of offering costs” on the Statement of Operations.
In contrast, an investment in an externally-deposited Inverse Floater is accounted for as a purchase of the inverse floater and is identified in the Fund’s Portfolio of Investments as “(IF) – Inverse floating rate investment.” For an externally-deposited Inverse Floater, a Fund’s Statement of Assets and Liabilities recognizes the Inverse Floater and not the Underlying Bond as an asset, and the Fund does not recognize the Floaters as a liability. Additionally, the Fund reflects in “Investment Income” only the net amount of earnings on the Inverse Floater (net of the interest paid to the holders of the Floaters and the expenses of the Trust), and does not show the amount of that interest paid as an interest expense on the Statement of Operations.
The average floating rate obligations outstanding and average annual interest rate and fees related to self-deposited Inverse Floaters during the current fiscal period were as follows:
| | | New Jersey | | | New Jersey | | | Pennsylvania | | | Pennsylvania | |
| | | Dividend | | | Municipal | | | Investment | | | Municipal | |
| | | Advantage | | | Value | | | Quality | | | Value | |
| Self-Deposited Inverse Floaters | | (NXJ | ) | | (NJV | ) | | (NQP | ) | | (NPN | ) |
| Average floating rate obligations outstanding | | $ | — | | | $ | 1,500,000 | | | $ | 34,457,151 | | | $ | — | |
| Average annual interest rate and fees | | | — | % | | | 0.66 | % | | | 0.33 | % | | | — | % |
As of the end of the reporting period, the total amount of floating rate obligations associated with each Fund’s self-deposited Inverse Floaters and externally-deposited Inverse Floaters was as follows:
| | | New Jersey | | | New Jersey | | | Pennsylvania | | | Pennsylvania | |
| | | Dividend | | | Municipal | | | Investment | | | Municipal | |
| | | Advantage | | | Value | | | Quality | | | Value | |
| Floating Rate Obligations Outstanding | | (NXJ | ) | | (NJV | ) | | (NQP | ) | | (NPN | ) |
| Floating rate obligations: self-deposited Inverse Floaters | | $ | — | | | $ | 1,500,000 | | | $ | 29,070,000 | | | $ | — | |
| Floating rate obligations: externally-deposited Inverse Floaters | | | 106,885,000 | | | | 1,025,000 | | | | 54,350,000 | | | | 540,000 | |
| Total | | $ | 106,885,000 | | | $ | 2,525,000 | | | $ | 83,420,000 | | | $ | 540,000 | |
Each Fund may also enter into shortfall and forbearance agreements (sometimes referred to as a “recourse arrangement” or “credit recovery swap”) (Trusts involving such agreements are referred to herein as “Recourse Trusts”), under which a Fund agrees to reimburse the liquidity provider for the Trust’s Floaters, in certain circumstances, for the amount (if any) by which the liquidation value of the Underlying Bond held by the Trust may fall short of the liquidation value of the Floaters issued by the Trust, plus any shortfalls in interest cash flows. Under these agreements, a Fund’s potential exposure to losses related to or on an Inverse Floater may increase beyond the value of the Inverse Floater as a Fund may potentially be liable to fulfill all amounts owed to holders of the Floaters. At period end, any such shortfall amount in the aggregate is recognized as “Unrealized depreciation on Recourse Trusts” on the Statement of Assets and Liabilities.
As of the end of the reporting period, each Fund’s maximum exposure to the floating rate obligations issued by externally-deposited Recourse Trusts was as follows:
| | | New Jersey | | | New Jersey | | | Pennsylvania | | | Pennsylvania | |
| | | Dividend | | | Municipal | | | Investment | | | Municipal | |
| | | Advantage | | | Value | | | Quality | | | Value | |
| Floating Rate Obligations – Externally-Deposited Recourse Trusts | | (NXJ | ) | | (NJV | ) | | (NQP | ) | | (NPN | ) |
| Maximum exposure to Recourse Trusts | | $ | 92,535,000 | | | $ | 1,025,000 | | | $ | 20,275,000 | | | $ | 400,000 | |
Notes to Financial Statements (continued)
Zero Coupon Securities
A zero coupon security does not pay a regular interest coupon to its holders during the life of the security. Income to the holder of the security comes from accretion of the difference between the original purchase price of the security at issuance and the par value of the security at maturity and is effectively paid at maturity. The market prices of zero coupon securities generally are more volatile than the market prices of securities that pay interest periodically.
Investments in Derivatives
In addition to the inverse floating rate securities in which each Fund invests, which are considered portfolio securities for financial reporting purposes, each Fund is authorized to invest in certain derivative instruments such as futures, options and swap contracts. Each Fund limits its investments in futures, options on futures and swap contracts to the extent necessary for the Adviser to claim exclusion from registration by the Commodity Futures Trading Commission as a commodity pool operator with respect to the Fund. The Funds record derivative instruments at fair value, with changes in fair value recognized on the Statement of Operations, when applicable. Even though the Funds’ investments in derivatives may represent economic hedges, they are not considered to be hedge transactions for financial reporting purposes.
Although the Funds are authorized to invest in derivative instruments and may do so in the future, they did not make any such investments during the current fiscal period.
Market and Counterparty Credit Risk
In the normal course of business each Fund may invest in financial instruments and enter into financial transactions where risk of potential loss exists due to changes in the market (market risk) or failure of the other party to the transaction to perform (counterparty credit risk). The potential loss could exceed the value of the financial assets recorded on the financial statements. Financial assets, which potentially expose each Fund to counterparty credit risk, consist principally of cash due from counterparties on forward, option and swap transactions, when applicable. The extent of each Fund’s exposure to counterparty credit risk in respect to these financial assets approximates their carrying value as recorded on the Statement of Assets and Liabilities.
Each Fund helps manage counterparty credit risk by entering into agreements only with counterparties the Adviser believes have the financial resources to honor their obligations and by having the Adviser monitor the financial stability of the counterparties. Additionally, counterparties may be required to pledge collateral daily (based on the daily valuation of the financial asset) on behalf of each Fund with a value approximately equal to the amount of any unrealized gain above a pre-determined threshold. Reciprocally, when each Fund has an unrealized loss, the Funds have instructed the custodian to pledge assets of the Funds as collateral with a value approximately equal to the amount of the unrealized loss above a pre-determined threshold. Collateral pledges are monitored and subsequently adjusted if and when the valuations fluctuate, either up or down, by at least the pre-determined threshold amount.
4. Fund Shares
Common Share Transactions
Transactions in common shares during the Funds’ current and prior fiscal period were as follows:
| | | New Jersey | | | New Jersey | |
| | | Dividend Advantage (NXJ) | | | Municipal Value (NJV) | |
| | | Year | | | Year | | | Year | | | Year | |
| | | Ended | | | Ended | | | Ended | | | Ended | |
| | | 4/30/15 | | | 4/30/14 | | | 4/30/15 | | | 4/30/14 | |
| Common shares: | | | | | | | | | | | | |
| Issued in the Reorganizations | | | 36,615,391 | | | | — | | | | — | | | | — | |
| Repurchased and retired | | | (112,500 | ) | | | (15,300 | ) | | | (15,000 | ) | | | — | |
| Weighted average common share: | | | | | | | | | | | | | | | | |
| Price per share repurchased and retired | | $ | 13.47 | | | $ | 12.43 | | | $ | 14.19 | | | $ | — | |
| Discount per share repurchased and retired | | | 13.85 | % | | | 13.65 | % | | | 14.25 | % | | | — | |
| | | Pennsylvania | | | Pennsylvania | |
| | | Investment Quality (NQP) | | | Municipal Value (NPN) | |
| | | Year | | | Year | | | Year | | | Year | |
| | | Ended | | | Ended | | | Ended | | | Ended | |
| | | 4/30/15 | | | 4/30/14 | | | 4/30/15 | | | 4/30/14 | |
| Common shares: | | | | | | | | | | | | | | | | |
| Issued in the Reorganizations | | | — | | | | 21,788,337 | | | | — | | | | — | |
| Repurchased and retired | | | (4,500 | ) | | | (17,300 | ) | | | — | | | | — | |
| Weighted average common share: | | | | | | | | | | | | | | | | |
| Price per share repurchased and retired | | $ | 13.68 | | | $ | 12.35 | | | | — | | | | — | |
| Discount per share repurchased and retired | | | 13.83 | % | | | 13.16 | % | | | — | | | | — | |
Preferred Shares
MuniFund Term Preferred Shares
During the current fiscal period, New Jersey Dividend Advantage (NXJ) and Pennsylvania Investment Quality (NQP) had issued and outstanding MuniFund Term Preferred (“MTP”) Shares, with a $10 liquidation value per share. The Fund’s MTP Shares were issued in one or more Series and trade on the NYSE.
On May 30, 2014, Pennsylvania Investment Quality (NQP) redeemed all of its outstanding Series 2015 MTP Shares. The Fund’s MTP Shares were redeemed at their $10.00 liquidation value per share, plus dividend amounts owed, using proceeds from its issuance of Variable Rate MuniFund Term Preferred (“VMTP”) Shares (as described below in Variable Rate MuniFund Term Preferred Shares).
On February 9, 2015, New Jersey Dividend Advantage (NXJ) redeemed all of its outstanding Series 2015 MTP Shares. The Fund’s MTP Shares were redeemed at their $10.00 liquidation value per share, plus dividend amounts owed, using proceeds from its issuance of Variable Rate Demand Preferred (“VRDP”) Shares (as described below in Variable Rate Demand Preferred Shares).
The average liquidation value of MTP Shares outstanding for each Fund during the current fiscal period, were as follows:
| | | New Jersey | | | Pennsylvania | |
| | | Dividend | | | Investment | |
| | | Advantage | | | Quality | |
| | | (NXJ | )* | | (NQP | )** |
| Average liquidation value of MTP Shares outstanding | | $ | 35,050,000 | | | $ | 47,740,000 | |
| * | MTP Shares issued in connection with its Reorganization for the period November 10, 2014 through February 9, 2015. |
| ** | For the period May 1, 2014 through May 30, 2014. |
For financial reporting purposes only, the liquidation value of MTP Shares is recorded as a liability and recognized as “MuniFund Term Preferred (“MTP”) Shares, at liquidation value” on the Statement of Assets and Liabilities. Dividends on MTP Shares, which are recognized as interest expense for financial reporting purposes, are paid monthly at a fixed annual rate, subject to adjustments in certain circumstances. Unpaid dividends on MTP Shares are recognized as a component of “Interest payable” on the Statement of Assets and Liabilities. Dividends accrued on MTP Shares are recognized as a component of “Interest expense and amortization of offering costs” on the Statement of Operations. Costs incurred by the Funds in connection with their offerings of MTP Shares were recorded as a deferred charge, which are amortized over the life of the shares and are recognized as components of “Deferred offering costs” on the Statement of Assets and Liabilities and “Interest expense and amortization of offering costs” on the Statement of Operations.
In conjunction with New Jersey Dividend Advantage’s (NXJ) and Pennsylvania Investment Quality’s (NQP) redemption of MTP Shares, the remaining deferred offering costs of $106,239 and $276,165 were fully expensed during the current fiscal period, as the redemptions were deemed extinguishments of debt.
Variable Rate MuniFund Term Preferred Shares
The following Fund has issued and outstanding VMTP Shares, with a $100,000 liquidation value per share. VMTP Shares are issued via private placement and are not publicly available.
As of the end of the reporting period, VMTP Shares outstanding, at liquidation value, for the Fund was as follows:
| | | | | | | | Shares | |
| | | | | | | | Outstanding | |
| | | | | | | | at $100,000 | |
| | | | | Shares | | | Per Share | |
| Fund | | Series | | Outstanding | | | Liquidation Value | |
| Pennsylvania Investment Quality (NQP) | | 2017 | | 480 | | $ | 48,000,000 | |
The Fund is obligated to redeem its VMTP Shares by the date as specified in its offering document (“Term Redemption Date”), unless earlier redeemed or repurchased by the Fund. VMTP Shares are subject to optional and mandatory redemption in certain circumstances. The VMTP Shares are subject to redemption at the option of the Fund (“Optional Redemption Date”), subject to payment of premium for one year following the date of issuance (“Premium Expiration Date”), and at par thereafter. The Fund may be obligated to redeem certain of the VMTP Shares if the Fund fails to maintain certain asset coverage and leverage ratio requirements and such failures are not cured by the applicable cure date. The redemption price per share is equal to the sum of the liquidation value per share plus any accumulated but unpaid dividends. The Term Redemption Date, Optional Redemption Date and Premium Expiration Date for the Fund’s series of VMTP Shares are as follows:
| | | Term | Optional | Premium | |
| Fund | Series | Redemption Date | Redemption Date | Expiration Date | |
| Pennsylvania Investment Quality (NQP) | 2017 | June 1, 2017 | June 1, 2015 | May 31, 2015 | |
Notes to Financial Statements (continued)
The average liquidation value of VMTP Shares outstanding and annualized dividend rate for the Fund during the current fiscal period were as follows:
| | | Pennsylvania | |
| | | Investment | |
| | | Quality | |
| | | (NQP | )* |
| Average liquidation value of VMTP Shares outstanding | | $ | 48,000,000 | |
| Annualized dividend rate | | | 0.97 | % |
* For the period May 20, 2014 (first issuance of shares) through April 30, 2015.
VMTP Shares generally do not trade, and market quotations are generally not available. VMTP Shares are short-term or short/intermediate-term instruments that pay a variable dividend rate tied to a short-term index, plus an additional fixed “spread” amount established at the time of issuance. The fair value of VMTP Shares is expected to be approximately their liquidation par value so long as the fixed “spread” on the VMTP Shares remains roughly in line with the “spread” rates being demanded by investors on instruments having similar terms in the current market environment. In present market conditions, the Fund’s Adviser has determined that fair value of VMTP Shares is their liquidation value, but their fair value could vary if market conditions change materially. For financial reporting purposes, the liquidation value of VMTP Shares is a liability and is recognized as “Variable Rate MuniFund Term Preferred (“VMTP”) Shares, at liquidation value” on the Statement of Assets and Liabilities.
Dividends on the VMTP shares (which are treated as interest payments for financial reporting purposes) are set weekly. Unpaid dividends on VMTP Shares are recognized as a component of “Interest payable” on the Statement of Assets and Liabilities, when applicable. Dividends accrued on VMTP Shares are recognized as a component of “Interest expense and amortization of offering costs” on the Statement of Operations.
Costs incurred by the Fund in connection with the Fund’s offering of VMTP Shares were recorded as a deferred charge, which are amortized over the life of the shares and are recognized as components of “Deferred offering costs” on the Statement of Assets and Liabilities and “Interest expense and amortization of offering costs” on the Statement of Operations.
The Fund incurred offering costs of $135,000 in connection with its issuance of Series 2017 VMTP Shares.
Variable Rate Demand Preferred Shares
The following Funds have issued and outstanding VRDP Shares, with a $100,000 liquidation value per share. VRDP Shares are issued via private placement and are not publicly available.
As of the end of the reporting period, the details of the Funds’ VRDP Shares outstanding were as follows:
| | | | | | | | | Shares | | | |
| | | | | | | | | Outstanding | | | |
| | | | | | Shares | | | at $100,000 Per Share | | | |
| Fund | | Series | | | Outstanding | | | Liquidation Value | | Maturity | |
| New Jersey Dividend Advantage (NXJ) | | | 1 | | | | 810 | | | $ | 81,000,000 | | August 3, 2043 | |
| | | | 2 | * | | | 1,443 | | | $ | 144,300,000 | | April 1, 2043 | |
| | | | 3 | * | | | 886 | | | $ | 88,600,000 | | April 1, 2043 | |
| Pennsylvania Investment Quality (NQP) | | | 2 | | | | 1,125 | | | $ | 112,500,000 | | December 1, 2042 | |
| | | | 3 | | | | 1,050 | | | $ | 105,000,000 | | December 1, 2042 | |
* VRDP Shares issued in connection with the Reorganization.
New Jersey Dividend Advantage (NXJ) issued an additional 360 Series 1 VRDP Shares on January 29, 2015 in connection with the redemption of its outstanding MTP Shares.
VRDP Shares include a liquidity feature that allows VRDP shareholders to have their shares purchased by a liquidity provider with whom each Fund has contracted in the event that purchase orders for VRDP Shares in a remarketing are not sufficient in number to be matched with the sale orders in that remarketing. Each Fund is required to redeem any VRDP Shares that are still owned by the liquidity provider after six months of continuous, unsuccessful remarketing. Each Fund pays an annual remarketing fee of 0.10% on the aggregate principal amount of all VRDP Shares outstanding. Each Fund’s VRDP Shares have successfully remarketed since issuance.
Dividends on the VRDP Shares (which are treated as interest payments for financial reporting purposes) are set weekly at a rate established by a remarketing agent; therefore, the market value of the VRDP Shares is expected to approximate its liquidation value. If remarketings for VRDP Shares are continuously unsuccessful for six months, the maximum rate is designed to escalate according to a specified schedule in order to enhance the remarketing agent’s ability to successfully remarket the VRDP Shares.
Subject to certain conditions, VRDP Shares may be redeemed, in whole or in part, at any time at the option of each Fund. Each Fund may also redeem certain of the VRDP Shares if the Fund fails to maintain certain asset coverage requirements and such failures are not cured by the applicable cure date. The redemption price per share is equal to the sum of the liquidation value per share plus any accumulated but unpaid dividends.
The average liquidation value of VRDP Shares outstanding and annualized dividend rate for each Fund during the current fiscal period were as follows:
| | | New Jersey | | | Pennsylvania | |
| | | Dividend | | | Investment | |
| | | Advantage | | | Quality | |
| | | (NXJ | )* | | (NQP | ) |
| Average liquidation value of VRDP Shares outstanding | | $ | 163,824,110 | | | $ | 217,500,000 | |
| Annualized dividend rate | | | 0.12 | % | | | 0.14 | % |
* Includes VRDP Shares issued in connection with its Reorganization.
For financial reporting purposes, the liquidation value of VRDP Shares is a liability and is recognized as “Variable Rate Demand Preferred (“VRDP”) Shares, at liquidation value” on the Statement of Assets and Liabilities. Unpaid dividends on VRDP Shares are recognized as a component of “Interest payable” on the Statement of Assets and Liabilities, when applicable. Dividends accrued on VRDP Shares are recognized as a component of “Interest expense and amortization of offering costs” on the Statement of Operations. Costs incurred by the Funds in connection with their offerings of VRDP Shares were recorded as a deferred charge, which are amortized over the life of the shares and are recognized as a component of “Deferred offering costs” on the Statement of Assets and Liabilities and “Interest expense and amortization of offering costs” on the Statement of Operations. In addition to interest expense, each Fund also pays a per annum liquidity fee to the liquidity provider, as well as a remarketing fee, which are recognized as “Liquidity fees” and “Remarketing fees,” respectively, on the Statement of Operations.
New Jersey Dividend Advantage (NXJ) incurred offering costs of $270,000 in connection with its issuance of Series 1 VRDP Shares.
Preferred Share Transactions
Transactions in preferred shares for the Funds during the Funds’ current and prior fiscal period, where applicable, are noted in the following tables.
Transactions in MTP Shares for the Funds, where applicable, were as follows:
| | | Year Ended | |
| | | April 30, 2015 | |
| | | | | NYSE | | | | | | |
| | | Series | | Ticker | | Shares | | | Amount | |
| New Jersey Dividend Advantage (NXJ) | | | | | | | | | | |
| MTP Shares issued in connection with the Reorganization | | 2015 | | NXJ PRCCL | | | 3,505,000 | | | $ | 35,050,000 | |
| MTP Shares redeemed | | 2015 | | NXJ PRCCL | | | (3,505,000 | ) | | | (35,050,000 | ) |
| Pennsylvania Investment Quality (NQP) | | | | | | | | | | | | |
| MTP Shares redeemed: | | 2015 | | NQP PRCCL | | | (2,319,000 | ) | | $ | (23,190,000 | ) |
| | | 2015 | | NQP PRDCL | | | (2,455,000 | ) | | | (24,550,000 | ) |
| Total | | | | | | | (4,774,000 | ) | | $ | (47,740,000 | ) |
| | | Year Ended | |
| | | April 30, 2014 | |
| | | | | NYSE/NYSE | | | | | | | | |
| | | Series | | MKT Ticker | | Shares | | | Amount | |
| New Jersey Dividend Advantage (NXJ) | | | | | | | | | | | | |
| MTP Shares redeemed | | 2014 | | NXJ PRACL | | | (4,486,100 | ) | | $ | (44,861,000 | ) |
| Pennsylvania Investment Quality (NQP) | | | | | | | | | | | | |
| MTP Shares issued in connection with the reorganization: | | 2015 | | NQP PRCCL | | | 2,319,000 | | | $ | 23,190,000 | |
| | | 2015 | | NQP PRDCL | | | 2,455,000 | | | $ | 24,550,000 | |
| Total | | | | | | | 4,774,000 | | | $ | 47,740,000 | |
Transactions in VMTP Shares for the Funds, where applicable, were as follows:
| | Year Ended | |
| | April 30, 2015 | |
| | Series | | Shares | | | Amount | |
| Pennsylvania Investment Quality (NQP) | | | | | | | |
| VMTP Shares issued | 2017 | | | 480 | | | $ | 48,000,000 | |
Notes to Financial Statements (continued)
Transactions in VRDP Shares for the Funds, where applicable, were as follows:
| | | Year Ended | |
| | | April 30, 2015 | |
| | | Series | | | Shares | | | Amount | |
| New Jersey Dividend Advantage (NXJ) | | | | | | | | | |
| VRDP Shares issued in connection with the Reorganization: | | | 2 | | | | 1,443 | | | $ | 144,300,000 | |
| | | | 3 | | | | 886 | | | | 88,600,000 | |
| VRDP Shares issued | | | 1 | | | | 360 | | | | 36,000,000 | |
| Total | | | | | | | 2,689 | | | $ | 268,900,000 | |
| | | Year Ended | |
| | | April 30, 2014 | |
| | | Series | | | Shares | | | Amount | |
| New Jersey Dividend Advantage (NXJ) | | | | | | | | | | | | |
| VRDP Shares issued | | | 1 | | | | 450 | | | $ | 45,000,000 | |
| Pennsylvania Investment Quality (NQP) | | | | | | | | | | | | |
| VRDP Shares issued | | | 3 | | | | 1,050 | | | $ | 105,000,000 | |
5. Investment Transactions
Long-term purchases and sales (including maturities) during the current fiscal period were as follows:
| | | New Jersey | | | New Jersey | | | Pennsylvania | | | Pennsylvania | |
| | | Dividend | | | Municipal | | | Investment | | | Municipal | |
| | | Advantage | | | Value | | | Quality | | | Value | |
| | | (NXJ | ) | | (NJV | ) | | (NQP | ) | | (NPN | ) |
| Purchases | | $ | 75,068,701 | | | $ | 3,571,093 | | | $ | 79,011,792 | | | $ | 1,079,113 | |
| Sales and maturities | | | 72,195,484 | | | | 4,132,777 | | | | 85,374,216 | | | | 984,887 | |
6. Income Tax Information
Each Fund is a separate taxpayer for federal income tax purposes. Each Fund intends to distribute substantially all of its net investment income and net capital gains to shareholders and to otherwise comply with the requirements of Subchapter M of the Internal Revenue Code applicable to regulated investment companies. Therefore, no federal income tax provision is required. Furthermore, each Fund intends to satisfy conditions that will enable interest from municipal securities, which is exempt from regular federal and designated state income taxes, to retain such tax-exempt status when distributed to shareholders of the Funds. Net realized capital gains and ordinary income distributions paid by the Funds are subject to federal taxation.
For all open tax years and all major taxing jurisdictions, management of the Funds has concluded that there are no significant uncertain tax positions that would require recognition in the financial statements. Open tax years are those that are open for examination by taxing authorities (i.e., generally the last four tax year ends and the interim tax period since then). Furthermore, management of the Funds is also not aware of any tax positions for which it is reasonably possible that the total amounts of unrecognized tax benefits will significantly change in the next twelve months.
The following information is presented on an income tax basis. Differences between amounts for financial statement and federal income tax purposes are primarily due to timing differences in recognizing taxable market discount, timing differences in recognizing certain gains and losses on investment transactions and the treatment of investments in inverse floating rate securities reflected as financing transactions, if any. To the extent that differences arise that are permanent in nature, such amounts are reclassified within the capital accounts as detailed below. Temporary differences do not require reclassification. Temporary and permanent differences do not impact the NAVs of the Funds.
As of April 30, 2015, the cost and unrealized appreciation (depreciation) of investments, as determined on a federal income tax basis, were as follows:
| | | New Jersey | | | New Jersey | | | Pennsylvania | | | Pennsylvania | |
| | | Dividend | | | Municipal | | | Investment | | | Municipal | |
| | | Advantage | | | Value | | | Quality | | | Value | |
| | | (NXJ | ) | | (NJV | ) | | (NQP | ) | | (NPN | ) |
| Cost of Investments | | $ | 911,549,624 | | | $ | 21,914,576 | | | $ | 787,222,098 | | | $ | 17,143,641 | |
| Gross unrealized: | | | | | | | | | | | | | | | | |
| Appreciation | | $ | 62,524,916 | | | $ | 3,005,275 | | | $ | 61,365,598 | | | $ | 2,606,002 | |
| Depreciation | | | (4,641,679 | ) | | | (33,574 | ) | | | (2,634,640 | ) | | | (15,343 | ) |
| Net unrealized appreciation (depreciation) of investments | | $ | 57,883,237 | | | $ | 2,971,701 | | | $ | 58,730,958 | | | $ | 2,590,659 | |
Permanent differences, primarily due to federal taxes paid, taxable market discount, nondeductible offering costs, nondeductible reorganization expenses and reorganization adjustments, resulted in reclassifications among the Funds’ components of common share net assets as of April 30, 2015, the Funds’ tax year end, as follows:
| | | New Jersey | | | New Jersey | | | Pennsylvania | | | Pennsylvania | |
| | | Dividend | | | Municipal | | | Investment | | | Municipal | |
| | | Advantage | | | Value | | | Quality | | | Value | |
| | | (NXJ | ) | | (NJV | ) | | (NQP | ) | | (NPN | ) |
| Paid-in-surplus | | $ | 4,024,059 | | | $ | — | | | $ | (369,360 | ) | | $ | — | |
| Undistributed (Over-distribution of) net investment income | | | 1,866,337 | | | | 1 | | | | 367,186 | | | | — | |
| Accumulated net realized gain (loss) | | | (5,890,396 | ) | | | (1 | ) | | | 2,174 | | | | — | |
The tax components of undistributed net tax-exempt income, net ordinary income and net long-term capital gains as of April 30, 2015, the Funds’ tax year end, were as follows:
| | | New Jersey | | | New Jersey | | | Pennsylvania | | | Pennsylvania | |
| | | Dividend | | | Municipal | | | Investment | | | Municipal | |
| | | Advantage | | | Value | | | Quality | | | Value | |
| | | (NXJ | ) | | (NJV | ) | | (NQP | ) | | (NPN | ) |
Undistributed net tax-exempt income1 | | $ | 4,837,748 | | | $ | 58,273 | | | $ | 2,471,078 | | | $ | 35,578 | |
Undistributed net ordinary income2 | | | 47,246 | | | | 24,637 | | | | 350,066 | | | | — | |
| Undistributed net long-term capital gains | | | 184,352 | | | | 293,056 | | | | — | | | | — | |
| 1 | Undistributed net tax-exempt income (on a tax basis) has not been reduced for the dividend declared on April 1, 2015, paid on May 1, 2015. |
| 2 | Net ordinary income consists of taxable market discount income and net short-term capital gains, if any. |
The tax character of distributions paid during the Funds’ tax years ended April 30, 2015 and April 30, 2014, was designated for purposes of the dividends paid deduction as follows:
| | | New Jersey | | | New Jersey | | | Pennsylvania | | | Pennsylvania | |
| | | Dividend | | | Municipal | | | Investment | | | Municipal | |
| | | Advantage | | | Value | | | Quality | | | Value | |
| 2015 | | (NXJ | ) | | (NJV | ) | | (NQP | ) | | (NPN | ) |
Distributions from net tax-exempt income3 | | $ | 15,305,648 | | | $ | 950,620 | | | $ | 33,000,772 | | | $ | 770,631 | |
Distributions from net ordinary income2 | | | 8,616 | | | | 35,031 | | | | 7,576 | | | | — | |
Distributions from net long-term capital gains4 | | | — | | | | 276,526 | | | | — | | | | — | |
| | | New Jersey | | | New Jersey | | | Pennsylvania | | | Pennsylvania | |
| | | Dividend | | | Municipal | | | Investment | | | Municipal | |
| | | Advantage | | | Value | | | Quality | | | Value | |
| 2014 | | (NXJ | ) | | (NJV | ) | | (NQP | ) | | (NPN | ) |
| Distributions from net tax-exempt income | | $ | 4,941,439 | | | $ | 976,582 | | | $ | 16,585,766 | | | $ | 775,216 | |
Distributions from net ordinary income2 | | | 1,865 | | | | 15,941 | | | | 56,083 | | | | 339 | |
| Distributions from net long-term capital gains | | | — | | | | 303,326 | | | | — | | | | 43,240 | |
| 2 | Net ordinary income consists of taxable market discount income and net short-term capital gains, if any. |
| 3 | The Funds hereby designate these amounts paid during the fiscal year ended April 30, 2015, as Exempt Interest Dividends. |
| 4 | The Funds designate as long-term capital gain dividend, pursuant to the Internal Revenue Code Section 852(b)(3), the amount necessary to reduce earnings and profits of the Funds related to net capital gain to zero for the tax year ended April 30, 2015. |
Notes to Financial Statements (continued)
As of April 30, 2015, the Funds’ tax year end, the Funds had unused capital loss carryforwards available for federal income tax purposes to be applied against future capital gains, if any. If not applied, the carryforwards will expire as shown in the following table. The losses not subject to expiration will be utilized first by a Fund.
| | | New Jersey | | | Pennsylvania | | | Pennsylvania | |
| | | Dividend | | | Investment | | | Municipal | |
| | | Advantage | | | Quality | | | Value | |
| | | (NXJ | )5 | | (NQP | ) | | (NPN | ) |
| Expiration: | | | | | | | | | |
| April 30, 2016 | | $ | — | | | $ | 2,167,149 | | | $ | — | |
| April 30, 2017 | | | — | | | | 13,518 | | | | — | |
| Not subject to expiration | | | 4,847,591 | | | | 2,173,796 | | | | 61,084 | |
| Total | | $ | 4,847,591 | | | $ | 4,354,463 | | | $ | 61,084 | |
| 5 | A portion of New Jersey Dividend Advantage’s (NXJ) capital loss carryforward is subject to an annual limitation under the Internal Revenue Code and related regulations. |
During the Funds’ tax year ended April 30, 2015, the following Funds utilized capital loss carryforwards as follows:
| | | New Jersey | | | New Jersey | | | Pennsylvania | |
| | | Dividend | | | Municipal | | | Municipal | |
| | | Advantage | | | Value | | | Value | |
| | | (NXJ | ) | | (NJV | ) | | (NPN | ) |
| Utilized capital loss carryforwards | | $ | 1,933,661 | | | $ | 99,123 | | | $ | 18,377 | |
7. Management Fees and Other Transactions with Affiliates
Each Fund’s management fee compensates the Adviser for overall investment advisory and administrative services and general office facilities. The Sub-Adviser is compensated for its services to the Funds from the management fees paid to the Adviser.
Each Fund’s management fee consists of two components – a fund-level fee, based only on the amount of assets within each individual Fund, and a complex-level fee, based on the aggregate amount of all eligible fund assets managed by the Adviser. This pricing structure enables Fund shareholders to benefit from growth in the assets within their respective Fund as well as from growth in the amount of complex-wide assets managed by the Adviser.
The annual Fund-level fee, payable monthly, for each Fund is calculated according to the following schedules:
| | New Jersey Dividend Advantage (NXJ) |
| Average Daily Managed Assets* | Fund-Level Fee |
| For the first $125 million | | 0.4500 | % |
| For the next $125 million | | 0.4375 | |
| For the next $250 million | | 0.4250 | |
| For the next $500 million | | 0.4125 | |
| For the next $1 billion | | 0.4000 | |
| For managed assets over $2 billion | | 0.3750 | |
| | New Jersey Municipal Value (NJV) |
| | Pennsylvania Municipal Value (NPN) |
| Average Daily Managed Assets* | Fund-Level Fee |
| For the first $125 million | | 0.4000 | % |
| For the next $125 million | | 0.3875 | |
| For the next $250 million | | 0.3750 | |
| For the next $500 million | | 0.3625 | |
| For the next $1 billion | | 0.3500 | |
| For managed assets over $2 billion | | 0.3375 | |
| | Pennsylvania Investment Quality (NQP) |
| Average Daily Managed Assets* | Fund-Level Fee |
| For the first $125 million | 0.4500 | % |
| For the next $125 million | 0.4375 | |
| For the next $250 million | 0.4250 | |
| For the next $500 million | 0.4125 | |
| For the next $1 billion | 0.4000 | |
| For the next $3 billion | 0.3875 | |
| For managed assets over $5 billion | 0.3750 | |
The annual complex-level fee, payable monthly, for each Fund is calculated according to the following schedule:
| Complex-Level Managed Asset Breakpoint Level* | Effective Rate at Breakpoint Level |
| $55 billion | 0.2000 | % |
| $56 billion | 0.1996 | |
| $57 billion | 0.1989 | |
| $60 billion | 0.1961 | |
| $63 billion | 0.1931 | |
| $66 billion | 0.1900 | |
| $71 billion | 0.1851 | |
| $76 billion | 0.1806 | |
| $80 billion | 0.1773 | |
| $91 billion | 0.1691 | |
| $125 billion | 0.1599 | |
| $200 billion | 0.1505 | |
| $250 billion | 0.1469 | |
| $300 billion | 0.1445 | |
* For the fund-level and complex-level fees, managed assets include closed-end fund assets managed by the Adviser that are attributable to certain types of leverage. For these purposes, leverage includes the funds’ use of preferred stock and borrowings and certain investments in the residual interest certificates (also called inverse floating rate securities) in tender option bond (TOB) trusts, including the portion of assets held by a TOB trust that has been effectively financed by the trust’s issuance of floating rate securities, subject to an agreement by the Adviser as to certain funds to limit the amount of such assets for determining managed assets in certain circumstances. The complex-level fee is calculated based upon the aggregate daily managed assets of all Nuveen Funds that constitute “eligible assets.” Eligible assets do not include assets attributable to investments in other Nuveen Funds or assets in excess of $2 billion added to the Nuveen Fund complex in connection with the Adviser’s assumption of the management of the former First American Funds effective January 1, 2011. As of April 30, 2015, the complex-level fee for each Fund was 0.1635%.
The Funds pay no compensation directly to those of its trustees who are affiliated with the Adviser or to its officers, all of whom receive remuneration for their services to the Funds from the Adviser or its affiliates. The Board has adopted a deferred compensation plan for independent trustees that enables trustees to elect to defer receipt of all or a portion of the annual compensation they are entitled to receive from certain Nuveen-advised funds. Under the plan, deferred amounts are treated as though equal dollar amounts had been invested in shares of select Nuveen-advised funds.
8. Fund Reorganizations
The Reorganizations were structured to qualify as tax-free reorganizations under the Internal Revenue Code for federal income tax purposes, and the Target Funds’ shareholders will recognize no gain or loss for federal income tax purposes as a result. Prior to the closing of each of the Reorganizations, the Target Funds distributed all of their net investment income and capital gains, if any. Such a distribution may be taxable to the Target Funds’ shareholders for federal income tax purposes.
Investments
The cost, fair value and net unrealized appreciation (depreciation) of the investments of the Target Funds as of the date of the Reorganizations, were as follows:
| | | New Jersey | | | New Jersey | | | New Jersey | |
| | | Investment | | | Premium | | | Dividend | |
| | | Quality | | | Income | | | Advantage 2 | |
| | | (NQJ | ) | | (NNJ | ) | | (NUJ | ) |
| Cost of investments | | $ | 423,515,296 | | | $ | 255,546,742 | | | $ | 94,559,060 | |
| Fair value of investments | | | 452,637,593 | | | | 273,027,822 | | | | 100,283,266 | |
| Net unrealized appreciation (depreciation) of investments | | | 29,122,297 | | | | 17,481,080 | | | | 5,724,206 | |
Notes to Financial Statements (continued)
For financial reporting purposes, assets received and shares issued by the Acquiring Fund were recorded at fair value; however, the cost basis of the investments received from the Target Funds were carried forward to align ongoing reporting of the Acquiring Funds’ realized and unrealized gains and losses with amounts distributable to shareholders for tax purposes.
Common Shares
The shares outstanding, net assets and NAV per common share outstanding immediately before and after the Reorganizations were as follows:
| | | New Jersey | | | New Jersey | | | New Jersey | |
| | | Investment | | | Premium | | | Dividend | |
| | | Quality | | | Income | | | Advantage 2 | |
| Target Funds – Prior to Reorganizations | | (NQJ | ) | | (NNJ | ) | | (NUJ | ) |
| Common shares outstanding | | | 20,468,835 | | | | 12,078,127 | | | | 4,452,314 | |
| Net assets applicable to common shares | | $ | 314,138,362 | | | $ | 188,636,201 | | | $ | 68,175,826 | |
| NAV per common share outstanding | | $ | 15.35 | | | $ | 15.62 | | | $ | 15.31 | |
| | | New Jersey | |
| | | Dividend | |
| | | Advantage | |
| Acquiring Fund – Prior to Reorganizations | | (NXJ | ) |
| Common shares outstanding | | | 6,480,388 | |
| Net assets applicable to common shares | | $ | 101,049,825 | |
| NAV per common share outstanding | | $ | 15.59 | |
| | | New Jersey | |
| | | Dividend | |
| | | Advantage | |
| Acquiring Fund – Post Reorganizations | | (NXJ | ) |
| Common shares outstanding | | | 43,095,779 | |
| Net assets applicable to common shares | | $ | 672,000,214 | |
| NAV per common share outstanding | | $ | 15.59 | |
Preferred Shares
In connection with the Reorganizations, holders of MTP and VRDP Shares of the Target Funds received on a one-for-one basis newly issued MTP and VRDP Shares of the Acquiring Fund, in exchange for MTP and VRDP Shares of the Target Funds held immediately prior to the Reorganizations.
Prior to the closing of the Reorganizations, details of the Target Funds’ outstanding MTP Shares were as follows:
| | | | | | | | Shares | | | | |
| | | | | | | | Outstanding | | | Annual | |
| | | NYSE MKT | | Shares | | | at $10 Per Share | | | Dividend | |
| Target Funds | Series | Ticker | | Outstanding | | | Liquidation Value | | | Rate | |
| New Jersey Dividend Advantage 2 (NUJ) | 2015 | NUJ PRC | | | 3,505,000 | | | $ | 35,050,000 | | | | 2.00 | % |
| Prior to the closing of the Reorganizations, details of the Target Funds’ outstanding VRDP Shares were as follows: |
| | | | | | | | Shares | | | |
| | | | | | | | Outstanding | | | |
| | | | | Shares | | | at $100,000 Per Share | | | |
| Target Funds | | Series | | Outstanding | | | Liquidation Value | | Maturity | |
| New Jersey Investment Quality (NQJ) | | | 2 | | | 1,443 | | | $ | 144,300,000 | | April 1, 2043 | |
| New Jersey Premium Income (NNJ) | | | 2 | | | 886 | | | $ | 88,600,000 | | April 1, 2043 | |
| Details of the Acquiring Fund’s MTP Shares issued in connection with the Reorganizations were as follows: |
| | | | | | | | Shares | | | | |
| | | | | | | | Outstanding | | | Annual | |
| | | NYSE | | Shares | | | at $10 Per Share | | | Dividend | |
| Acquiring Fund | Series | Ticker | | Outstanding | | | Liquidation Value | | | Rate | |
| New Jersey Dividend Advantage (NXJ) | 2015 | NXJ PRCCL | | | 3,505,000 | | | $ | 35,050,000 | | | | 2.00 | % |
Details of the Acquiring Fund’s VRDP Shares issued in connection with the Reorganizations were as follows:
| | | | | | | | | Shares | | | |
| | | | | | | | | Outstanding | | | |
| | | | | | Shares | | | at $100,000 Per Share | | | |
| Acquiring Fund | | Series | | | Outstanding | | | Liquidation Value | | Maturity | |
| New Jersey Dividend Advantage (NXJ) | | | 2 | | | | 1,443 | | | $ | 144,300,000 | | April 1, 2043 | |
| | | | 3 | | | | 886 | | | $ | 88,600,000 | | April 1, 2043 | |
Pro Forma Results of Operations
The beginning of the Target Funds’ current fiscal period was May 1, 2014. Assuming the Reorganizations had been completed on May 1, 2014, the beginning of the Acquiring Funds’ current fiscal period, the pro forma results of operations for the current fiscal period, are as follows:
| | | New Jersey | |
| | | Dividend | |
| | | Advantage | |
| Acquiring Fund – Pro Forma Results of Operations | | (NXJ | ) |
| Net investment income (loss) | | $ | 31,815,750 | |
| Net realized and unrealized gains (losses) | | | 15,581,346 | |
| Change in net assets resulting from operations | | | 47,397,095 | |
Because the combined investment portfolios for the Reorganizations have been managed as a single integrated portfolio since the Reorganizations were completed, it is not practicable to separate the amounts of revenue and earnings of the Target Funds that have been included in the Statement of Operations for the Acquiring Fund since the Reorganizations were consummated.
Cost and Expenses
In connection with the Reorganizations, the Acquiring Fund incurred certain associated costs and expenses. Such amounts were included as components of “Accrued other expenses” on the Statement of Assets and Liabilities and “Reorganization expenses” on the Statement of Operations.
Additional Fund Information
| Board of Trustees | | | | | |
| William Adams IV* | Jack B. Evans | William C. Hunter | David J. Kundert | John K. Nelson | William J. Schneider |
| Thomas S. Schreier, Jr.* | Judith M. Stockdale | Carole E. Stone | Virginia L. Stringer | Terence J. Toth | |
* Interested Board Member.
| Fund Manager | Custodian | Legal Counsel | Independent Registered | Transfer Agent and |
| Nuveen Fund Advisors, LLC | State Street Bank | Chapman and Cutler LLP | Public Accounting Firm | Shareholder Services |
| 333 West Wacker Drive | & Trust Company | Chicago, IL 60603 | KPMG LLP | State Street Bank |
| Chicago, IL 60606 | Boston, MA 02111 | | Chicago, IL 60601 | & Trust Company |
| | | | | Nuveen Funds |
| | | | | P.O. Box 43071 |
| | | | | Providence, RI 02940-3071 |
| | | | | (800) 257-8787 |
Quarterly Form N-Q Portfolio of Investments Information
Each Fund is required to file its complete schedule of portfolio holdings with the Securities and Exchange Commission (SEC) for the first and third quarters of each fiscal year on Form N-Q. You may obtain this information directly from the SEC. Visit the SEC on-line at http://www.sec.gov or in person at the SEC’s Public Reference Room in Washington, D.C. Call the SEC toll-free at (800) SEC-0330 for room hours and operation.
Nuveen Funds’ Proxy Voting Information
You may obtain (i) information regarding how each fund voted proxies relating to portfolio securities held during the most recent twelve-month period ended June 30, without charge, upon request, by calling Nuveen Investments toll-free at (800) 257-8787 or on Nuveen’s website at www.nuveen.com and (ii) a description of the policies and procedures that each fund used to determine how to vote proxies relating to portfolio securities without charge, upon request, by calling Nuveen Investments toll free at (800) 257-8787. You may also obtain this information directly from the SEC. Visit the SEC on-line at http://www.sec.gov.
CEO Certification Disclosure
Each Fund’s Chief Executive Officer (CEO) has submitted to the New York Stock Exchange (NYSE) the annual CEO certification as required by Section 303A.12(a) of the NYSE Listed Company Manual. Each Fund has filed with the SEC the certification of its CEO and Chief Financial Officer required by Section 302 of the Sarbanes-Oxley Act.
Common Share Repurchases
Each Fund intends to repurchase, through its open-market share repurchase program, shares of its own common stock at such times and in such amounts as is deemed advisable. During the period covered by this report, each Fund repurchased shares of its common stock, as shown in the accompanying table. Any future repurchases will be reported to shareholders in the next annual or semi-annual report.
| | NXJ | NJV | NQP | NPN | |
| Common shares repurchased | 112,500 | 15,000 | 4,500 | — | |
FINRA BrokerCheck
The Financial Industry Regulatory Authority (FINRA) provides information regarding the disciplinary history of FINRA member firms and associated investment professionals. This information as well as an investor brochure describing FINRA BrokerCheck is available to the public by calling the FINRA BrokerCheck Hotline number at (800) 289-9999 or by visiting www.FINRA.org.
Glossary of Terms Used in this Report
■ | Auction Rate Bond: An auction rate bond is a security whose interest payments are adjusted periodically through an auction process, which process typically also serves as a means for buying and selling the bond. Auctions that fail to attract enough buyers for all the shares offered for sale are deemed to have “failed,” with current holders receiving a formula-based interest rate until the next scheduled auction. |
■ | Average Annual Total Return: This is a commonly used method to express an investment’s performance over a particular, usually multi-year time period. It expresses the return that would have been necessary each year to equal the investment’s actual cumulative performance (including change in NAV or market price and reinvested dividends and capital gains distributions, if any) over the time period being considered. |
■ | Duration: Duration is a measure of the expected period over which a bond’s principal and interest will be paid, and consequently is a measure of the sensitivity of a bond’s or bond fund’s value to changes when market interest rates change. Generally, the longer a bond’s or fund’s duration, the more the price of the bond or fund will change as interest rates change. |
■ | Effective Leverage: Effective leverage is a fund’s effective economic leverage, and includes both regulatory leverage (see leverage) and the leverage effects of certain derivative investments in the fund’s portfolio. Currently, the leverage effects of Tender Option Bond (TOB) inverse floater holdings are included in effective leverage values, in addition to any regulatory leverage. |
■ | Gross Domestic Product (GDP): The total market value of all final goods and services produced in a country/region in a given year, equal to total consumer, investment and government spending, plus the value of exports, minus the value of imports. |
■ | Inverse Floating Rate Securities: Inverse floating rate securities, also known as inverse floaters or tender option bonds (TOBs), are created by depositing a municipal bond, typically with a fixed interest rate, into a special purpose trust created by a broker-dealer. This trust, in turn, (a) issues floating rate certificates typically paying short-term tax-exempt interest rates to third parties in amounts equal to some fraction of the deposited bond’s par amount or market value, and (b) issues an inverse floating rate certificate (sometimes referred to as an “inverse floater”) to an investor (such as a Fund) interested in gaining investment exposure to a long-term municipal bond. The income received by the holder of the inverse floater varies inversely with the short-term rate paid to the floating rate certificates’ holders, and in most circumstances the holder of the inverse floater bears substantially all of the underlying bond’s downside investment risk. The holder of the inverse floater typically also benefits disproportionately from any potential appreciation of the underlying bond’s value. Hence, an inverse floater essentially represents an investment in the underlying bond on a leveraged basis. |
■ | Leverage: Leverage is created whenever a fund has investment exposure (both reward and/or risk) equivalent to more than 100% of the investment capital. |
■ | Lipper New Jersey Municipal Debt Funds Classification Average: Calculated using the returns of all closed-end funds in this category. Lipper returns account for the effects of management fees and assume reinvestment of distributions, but do not reflect any applicable sales charges. |
■ | Lipper Pennsylvania Municipal Debt Funds Classification Average: Calculated using the returns of all closed-end funds in this category. Lipper returns account for the effects of management fees and assume reinvestment of distributions, but do not reflect any applicable sales charges. |
Glossary of Terms Used in this Report (continued)
■ | Net Asset Value (NAV) Per Share: A fund’s Net Assets is equal to its total assets (securities, cash, accrued earnings and receivables) less its total liabilities. NAV per share is equal to the fund’s Net Assets divided by its number of shares outstanding. |
■ | Pre-Refunding: Pre-Refunding, also known as advanced refundings or refinancings, is a procedure used by state and local governments to refinance municipal bonds to lower interest expenses. The issuer sells new bonds with a lower yield and uses the proceeds to buy U.S. Treasury securities, the interest from which is used to make payments on the higher-yielding bonds. Because of this collateral, pre-refunding generally raises a bond’s credit rating and thus its value. |
■ | Regulatory Leverage: Regulatory leverage consists of preferred shares issued by or borrowings of a fund. Both of these are part of a fund’s capital structure. Regulatory leverage is subject to asset coverage limits set in the Investment Company Act of 1940. |
■ | S&P Municipal Bond Index: An unleveraged, market value-weighted index designed to measure the performance of the tax-exempt, investment-grade U.S. municipal bond market. Index returns assume reinvestment of distributions, but do not reflect any applicable sales charges or management fees. |
■ | S&P Municipal Bond New Jersey Index: An unleveraged, market value-weighted index designed to measure the performance of the tax-exempt, investment-grade New Jersey municipal bond market. Index returns assume reinvestment of distributions, but do not reflect any applicable sales charges or management fees. |
■ | S&P Municipal Bond Pennsylvania Index: An unleveraged, market value-weighted index designed to measure the performance of the tax-exempt, investment-grade Pennsylvania municipal bond market. Index returns assume reinvestment of distributions, but do not reflect any applicable sales charges or management fees. |
■ | Total Investment Exposure: Total investment exposure is a fund’s assets managed by the Adviser that are attributable to financial leverage. For these purposes, financial leverage includes a fund’s use of preferred stock and borrowings and investments in the residual interest certificates (also called inverse floating rate securities) in tender option bond (TOB) trusts, including the portion of assets held by a TOB trust that has been effectively financed by the trust’s issuance of floating rate securities. |
■ | Zero Coupon Bond: A zero coupon bond does not pay a regular interest coupon to its holders during the life of the bond. Income to the holder of the bond comes from accretion of the difference between the original purchase price of the bond at issuance and the par value of the bond at maturity and is effectively paid at maturity. The market prices of zero coupon bonds generally are more volatile than the market prices of bonds that pay interest periodically. |
Reinvest Automatically, Easily and Conveniently
Nuveen makes reinvesting easy. A phone call is all it takes to set up your reinvestment account.
Nuveen Closed-End Funds Automatic Reinvestment Plan
Nuveen Closed-End Fund allows you to conveniently reinvest distributions in additional Fund shares. By choosing to reinvest, you’ll be able to invest money regularly and automatically, and watch your investment grow through the power of compounding. Just like distributions in cash, there may be times when income or capital gains taxes may be payable on distributions that are reinvested. It is important to note that an automatic reinvestment plan does not ensure a profit, nor does it protect you against loss in a declining market.
Easy and convenient
To make recordkeeping easy and convenient, each month you’ll receive a statement showing your total distributions, the date of investment, the shares acquired and the price per share, and the total number of shares you own.
How shares are purchased
The shares you acquire by reinvesting will either be purchased on the open market or newly issued by the Fund. If the shares are trading at or above net asset value at the time of valuation, the Fund will issue new shares at the greater of the net asset value or 95% of the then-current market price. If the shares are trading at less than net as -set value, shares for your account will be purchased on the open market. If the Plan Agent begins purchasing Fund shares on the open market while shares are trading below net asset value, but the Fund’s shares subsequently trade at or above their net asset value before the Plan Agent is able to complete its purchases, the Plan Agent may cease open-market purchases and may invest the uninvested portion of the distribution in newly-issued Fund shares at a price equal to the greater of the shares’ net asset value or 95% of the shares’ market value on the last business day imme -diately prior to the purchase date. Distributions received to purchase shares in the open market will normally be invested shortly after the distribution payment date. No interest will be paid on distributions awaiting reinvestment. Because the market price of the shares may increase before purchases are completed, the average purchase price per share may exceed the market price at the time of valuation, resulting in the acquisition of fewer shares than if the distribution had been paid in shares issued by the Fund. A pro rata portion of any applicable brokerage commissions on open market purchases will be paid by Plan participants. These commissions usually will be lower than those charged on individual transactions.
Flexible
You may change your distribution option or withdraw from the Plan at any time, should your needs or situation change. You can reinvest whether your shares are registered in your name, or in the name of a brokerage firm, bank, or other nominee. Ask your investment advisor if his or her firm will participate on your behalf. Participants whose shares are registered in the name of one firm may not be able to transfer the shares to another firm and continue to participate in the Plan. The Fund reserves the right to amend or terminate the Plan at any time. Although the Fund reserves the right to amend the Plan to include a service charge payable by the participants, there is no direct service charge to participants in the Plan at this time.
Call today to start reinvesting distributions
For more information on the Nuveen Automatic Reinvestment Plan or to enroll in or withdraw from the Plan, speak with your financial advisor or call us at (800) 257-8787.
Board Members & Officers
The management of the Funds, including general supervision of the duties performed for the Funds by the Adviser, is the responsibility of the Board of Trustees of the Funds. The number of trustees of the Funds is currently set at eleven. None of the trustees who are not “interested” persons of the Funds (referred to herein as “independent trustees”) has ever been a director or employee of, or consultant to, Nuveen or its affiliates. The names and business addresses of the trustees and officers of the Funds, their principal occupations and other affiliations during the past five years, the number of portfolios each oversees and other directorships they hold are set forth below.
| | Name, | | Position(s) Held | | Year First | | Principal | | Number |
| | Year of Birth | | with the Funds | | Elected or | | Occupation(s) | | of Portfolios |
| | & Address | | | | Appointed | | Including other | | in Fund Complex |
| | | | | | and Term(1) | | Directorships | | Overseen by |
| | | | | | | | During Past 5 Years | | Board Member |
| | | | | | | | | | |
| Independent Board Members: | | | | | | |
| | | | | | | | | | |
| ■ | WILLIAM J. SCHNEIDER 1944 333 W. Wacker Drive Chicago, IL 60606 | | Chairman and Board Member | | 1996 Class III | | Chairman of Miller-Valentine Partners, a real estate investment company; formerly, Senior Partner and Chief Operating Officer (retired (2004) of Miller-Valentine Group; an owner in several other Miller Valentine entities; Board Member of Med-America Health System, Board Member of WDPR Public Radio station; formerly, member, Business Advisory Council, Cleveland Federal Reserve Bank and University of Dayton Business School Advisory Council. | | 195 |
| | | | | | | | | | |
| ■ | JACK B. EVANS 1948 333 W. Wacker Drive Chicago, IL 60606 | | Board Member | | 1999 Class III | | President, The Hall-Perrine Foundation, a private philanthropic corporation (since 1996); Director and Chairman, United Fire Group, a publicly held company; formerly, President Pro-Tem of the Board of Regents for the State of Iowa University System; Director, Source Media Group; Life Trustee of Coe College; formerly, Director, Alliant Energy; formerly, Director, Federal Reserve Bank of Chicago; formerly, President and Chief Operating Officer, SCI Financial Group, Inc., a regional financial services firm. | | 195 |
| | | | | | | | | | |
| ■ | WILLIAM C. HUNTER 1948 333 W. Wacker Drive Chicago, IL 60606 | | Board Member | | 2004 Class I | | Dean Emeritus, formerly, Dean, Tippie College of Business, University of Iowa (2006-2012); Director (since 2004) of Xerox Corporation; Director (since 2005), and President (since July 2012) Beta Gamma Sigma, Inc., The International Business Honor Society; Director of Wellmark, Inc. (since 2009); formerly, Dean and Distinguished Professor of Finance, School of Business at the University of Connecticut (2003-2006); previously, Senior Vice President and Director of Research at the Federal Reserve Bank of Chicago (1995-2003); formerly, Director (1997-2007), Credit Research Center at Georgetown University. | | 195 |
| | | | | | | | | | |
| ■ | DAVID J. KUNDERT 1942 333 W. Wacker Drive Chicago, IL 60606 | | Board Member | | 2005 Class II | | Formerly, Director, Northwestern Mutual Wealth Management Company (2006-2013), retired (since 2004) as Chairman, JPMorgan Fleming Asset Management, President and CEO, Banc One Investment Advisors Corporation, and President, One Group Mutual Funds; prior thereto, Executive Vice President, Banc One Corporation and Chairman and CEO, Banc One Investment Management Group; Regent Emeritus, Member of Investment Committee, Luther College; member of the Wisconsin Bar Association; member of Board of Directors and Chair of Investment Committee, Greater Milwaukee Foundation; member of the Board of Directors (Milwaukee), College Possible. | | 195 |
| | Name, | | Position(s) Held | | Year First | | Principal | | Number |
| | Year of Birth | | with the Funds | | Elected or | | Occupation(s) | | of Portfolios |
| | & Address | | | | Appointed(1) | | During Past 5 Years | | in Fund Complex |
| | | | | | | | | | Overseen by |
| | | | | | | | | | Board Member |
| | | | | | | | | | |
| Independent Board Members (continued): | | | | | | |
| | | | | | | | | | |
| ■ | JOHN K. NELSON 1962 333 W. Wacker Drive Chicago, IL 60606 | | Board Member | | 2013 Class II | | Member of Board of Directors of Core12 LLC since 2008), a private firm which develops branding, marketing and communications strategies for clients; Director of The Curran Center for Catholic American Studies (since 2009) and The President’s Council, Fordham University (since 2010); formerly, senior external advisor to the financial services practice of Deloitte Consulting LLP (2012- 2014); formerly, Chairman of the Board of Trustees of Marian University (2010 as trustee, 2011-2014 as Chairman); formerly, Chief Executive Officer of ABN AMRO N.V. North America, and Global Head of its Financial Markets Division (2007-2008); prior senior positions held at ABN AMRO include Corporate Executive Vice President and Head of Global Markets-the Americas (2006- 2007), CEO of Wholesale Banking North America and Global Head of Foreign Exchange and Futures Markets (2001-2006), and Regional Commercial Treasurer and Senior Vice President Trading- North America (1996-2001); formerly, Trustee at St. Edmund Preparatory School in New York City. | | 195 |
| | | | | | | | | | |
| ■ | JUDITH M. STOCKDALE 1947 333 W. Wacker Drive Chicago, IL 60606 | | Board Member | | 1997 Class I | | Board Member, Land Trust Alliance (since 2013) and U.S. Endowment for Forestry and Communities (since 2013); formerly, Executive Director (1994-2012), Gaylord and Dorothy Donnelley Foundation; prior thereto, Executive Director, Great Lakes Protection Fund (1990-1994). | | 195 |
| | | | | | | | | | |
| ■ | CAROLE E. STONE 1947 333 W. Wacker Drive Chicago, IL 60606 | | Board Member | | 2007 Class I | | Director, Chicago Board Options Exchange, Inc. (since 2006); Director, C2 Options Exchange, Incorporated (since 2009); Director, CBOE Holdings, Inc. (since 2010); formerly, Commissioner, New York State Commission on Public Authority Reform (2005-2010). | | 195 |
| | | | | | | | | | |
| ■ | VIRGINIA L. STRINGER 1944 333 W. Wacker Drive Chicago, IL 60606 | | Board Member | | 2011 Class I | | Board Member, Mutual Fund Directors Forum; non-profit board member and former governance consultant; former Owner, and President Strategic Management Resources, Inc., a management consulting firm; former Member, Governing Board, Investment Company Institute’s Independent Directors Council; previously, held several executive positions in general management, marketing and human resources at IBM and The Pillsbury Company; Independent Director, First American Fund Complex (1987-2010) and Chair (1997-2010). | | 195 |
| | | | | | | | | | |
| ■ | TERENCE J. TOTH 1959 333 W. Wacker Drive Chicago, IL 60606 | | Board Member | | 2008 Class II | | Managing Partner, Promus Capital (since 2008); Director, Fulcrum IT Service LLC (since 2010), Quality Control Corporation (since 2012) and LogicMark LLC (since 2012); formerly, Director, Legal & General Investment Management America, Inc. (2008-2013); formerly, CEO and President, Northern Trust Global Investments (2004-2007); Executive Vice President, Quantitative Management & Securities Lending (2000-2004); prior thereto, various positions with Northern Trust Company (since 1994); member: Chicago Fellowship Board (since 2005), Catalyst Schools of Chicago Board (since 2008) and Mather Foundation Board (since 2012), and a member of its investment committee; formerly, Member, Northern Trust Mutual Funds Board (2005-2007), Northern Trust Global Investments Board (2004-2007), Northern Trust Japan Board (2004-2007), Northern Trust Securities Inc. Board (2003-2007) and Northern Trust Hong Kong Board (1997-2004). | | 195 |
Board Members & Officers (continued)
| | Name, | | Position(s) Held | | Year First | | Principal | | Number |
| | Year of Birth | | with the Funds | | Elected or | | Occupation(s) | | of Portfolios |
| | & Address | | | | Appointed(1) | | Including other Directorships | | in Fund Complex |
| | | | | | | | During Past 5 Years | | Overseen by |
| | | | | | | | | | Board Member |
| | | | | | | | | | |
| Interested Board Members: | | | | | | |
| | | | | | | | | | |
| ■ | WILLIAM ADAMS IV(2) 1955 333 W. Wacker Drive Chicago, IL 60606 | | Board Member | | 2013 Class II | | Senior Executive Vice President, Global Structured Products (since 2010); formerly, Executive Vice President, U.S. Structured Products, of Nuveen Investments, Inc. (1999-2010); Co-President of Nuveen Fund Advisors, LLC (since 2011); Executive Vice President of Nuveen Securities, LLC; President (since 2011), formerly, Managing Director (2010-2011) of Nuveen Commodities Asset Management, LLC; Board Member of the Chicago Symphony Orchestra and of Gilda’s Club Chicago. | | 195 |
| | | | | | | | | | |
| ■ | THOMAS S. SCHREIER, JR.(2) 1962 333 W. Wacker Drive Chicago, IL 60606 | | Board Member | | 2013 Class III | | Vice Chairman, Wealth Management of Nuveen Investments, Inc. (since 2011); Co-President of Nuveen Fund Advisors, LLC; Chairman of Nuveen Asset Management, LLC (since 2011); Co-Chief Executive Officer of Nuveen Securities, LLC (since 2011); Member of Board of Governors and Chairman’s Council of the Investment Company Institute; Director of Allina Health and a member of its Finance, Audit and Investment Committees: formerly, Chief Executive Officer (2000-2010) and Chief Investment Officer (2007-2010) of FAF Advisors, Inc.; formerly, President of First American Funds (2001-2010). | | 195 |
| | Name, | | Position(s) Held | | Year First | | Principal | | Number |
| | Year of Birth | | with the Funds | | Elected or | | Occupation(s) | | of Portfolios |
| | & Address | | | | Appointed(3) | | During Past 5 Years | | in Fund Complex |
| | | | | | | | | | Overseen |
| | | | | | | | | | by Officer |
| | | | | | | | | | |
| Officers of the Funds: | | | | | | |
| | | | | | | | | | |
| ■ | GIFFORD R. ZIMMERMAN 1956 333 W. Wacker Drive Chicago, IL 60606 | | Chief Administrative Officer | | 1988 | | Managing Director (since 2002), and Assistant Secretary of Nuveen Securities, LLC; Managing Director (since 2004) and Assistant Secretary (since 1994) of Nuveen Investments, Inc.; Managing Director (since 2002), Assistant Secretary (since 1997) and Co-General Counsel (since 2011) of Nuveen Fund Advisors, LLC; Managing Director, Assistant Secretary and Associate General Counsel of Nuveen Asset Management, LLC (since 2011); Managing Director and Assistant Secretary of Symphony Asset Management LLC (since 2003); Vice President and Assistant Secretary of NWQ Investment Management Company, LLC (since 2002), Nuveen Investments Advisers Inc. (since 2002), Santa Barbara Asset Management, LLC (since 2006), and of Winslow Capital Management, LLC, (since 2010); Vice President and Assistant Secretary (since 2013), formerly, Chief Administrative Officer and Chief Compliance Officer (2006-2013) of Nuveen Commodities Asset Management, LLC; Chartered Financial Analyst. | | 196 |
| | | | | | | | | | |
| ■ | CEDRIC H. ANTOSIEWICZ 1962 333 W. Wacker Drive Chicago, IL 60606 | | Vice President | | 2007 | | Managing Director of Nuveen Securities, LLC. (since 2004); Managing Director of Nuveen Fund Advisors, LLC (since 2014). | | 89 |
| | | | | | | | | | |
| ■ | MARGO L. COOK 1964 333 W. Wacker Drive Chicago, IL 60606 | | Vice President | | 2009 | | Executive Vice President (since 2008) of Nuveen Investments, Inc. and of Nuveen Fund Advisors, LLC (since 2011); Managing Director- Investment Services of Nuveen Commodities Asset Management, LLC (since August 2011); Co-Chief Executive Officer (since 2015) of Nuveen Securities, LLC; previously, Head of Institutional Asset Management (2007-2008) of Bear Stearns Asset Management; Chartered Financial Analyst. | | 196 |
| | Name, | | Position(s) Held | | Year First | | Principal | | Number |
| | Year of Birth | | with the Funds | | Elected or | | Occupation(s) | | of Portfolios |
| | & Address | | | | Appointed(3) | | During Past 5 Years | | in Fund Complex |
| | | | | | | | | | Overseen |
| | | | | | | | | | by Officer |
| | | | | | | | | | |
| Officers of the Funds (continued): | | | | | | |
| | | | | | | | | | |
| ■ | LORNA C. FERGUSON 1945 333 W. Wacker Drive Chicago, IL 60606 | | Vice President | | 1998 | | Managing Director (since 2005) of Nuveen Fund Advisors, LLC and Nuveen Securities, LLC (since 2004). | | 196 |
| | | | | | | | | | |
| ■ | STEPHEN D. FOY 1954 333 W. Wacker Drive Chicago, IL 60606 | | Vice President and Controller | | 1998 | | Managing Director (since 2014), formerly, Senior Vice President (2013-2014) and Vice President (2005-2013) of Nuveen Fund Advisors, LLC; Chief Financial Officer of Nuveen Commodities Asset Management, LLC (since 2010); Certified Public Accountant. | | 196 |
| | | | | | | | | | |
| ■ | SCOTT S. GRACE 1970 333 W. Wacker Drive Chicago, IL 60606 | | Vice President and Treasurer | | 2009 | | Managing Director, Head of Business Development and Strategy, Global Structured Products Group (since November 2014); Managing Director (since 2009) and, formerly, Treasurer, of Nuveen Investments Advisers Inc., Nuveen Investments Holdings, Inc., Nuveen Fund Advisors, LLC, Nuveen Securities, LLC and (since 2011) Nuveen Asset Management LLC; Vice President and, formerly, Treasurer of NWQ Investment Management Company, LLC, Tradewinds Global Investors, LLC, Symphony Asset Management LLC and Winslow Capital Management, LLC.; Vice President of Santa Barbara Asset Management, LLC; formerly, Treasurer (2006-2009), Senior Vice President (2008-2009), previously, Vice President (2006-2008) of Janus Capital Group, Inc.; Chartered Accountant Designation. | | 196 |
| | | | | | | | | | |
| ■ | WALTER M. KELLY 1970 333 W. Wacker Drive Chicago, IL 60606 | | Chief Compliance Officer and Vice President | | 2003 | | Senior Vice President (since 2008) of Nuveen Investment Holdings, Inc. | | 196 |
| | | | | | | | | | |
| ■ | TINA M. LAZAR 1961 333 W. Wacker Drive Chicago, IL 60606 | | Vice President | | 2002 | | Senior Vice President of Nuveen Investment Holdings, Inc. and Nuveen Securities, LLC. | | 196 |
| | | | | | | | | | |
| ■ | KEVIN J. MCCARTHY 1966 333 W. Wacker Drive Chicago, IL 60606 | | Vice President and Secretary | | 2007 | | Managing Director and Assistant Secretary (since 2008), Nuveen Securities, LLC; Managing Director (since 2008), Assistant Secretary since 2007) and Co-General Counsel (since 2011) of Nuveen Fund Advisors, LLC; Managing Director, Assistant Secretary and Associate General Counsel (since 2011) of Nuveen Asset Management, LLC; Managing Director and Assistant Secretary, Nuveen Investments, Inc.; Vice President (since 2007) and Assistant Secretary of Nuveen Investments Advisers Inc., NWQ Investment Management Company, LLC, Symphony Asset Management LLC, Santa Barbara Asset Management, LLC, and of Winslow Capital Management, LLC. (since 2010); Vice President and Secretary (since 2010) of Nuveen Commodities Asset Management, LLC. | | 196 |
Board Members & Officers (continued)
| | Name, | | Position(s) Held | | Year First | | Principal | | Number |
| | Year of Birth | | with the Funds | | Elected or | | Occupation(s) | | of Portfolios |
| | & Address | | | | Appointed(3) | | During Past 5 Years | | in Fund Complex |
| | | | | | | | | | Overseen |
| | | | | | | | | | by Officer |
| | | | | | | | | | |
| Officers of the Funds (continued): | | | | | | |
| | | | | | | | | | |
| ■ | KATHLEEN L. PRUDHOMME 1953 901 Marquette Avenue Minneapolis, MN 55402 | | Vice President and Assistant Secretary | | 2011 | | Managing Director, Assistant Secretary and Co-General Counsel (since 2011) of Nuveen Fund Advisors, LLC; Managing Director, Assistant Secretary and Associate General Counsel (since 2011) of Nuveen Asset Management, LLC; Managing Director and Assistant Secretary (since 2011) of Nuveen Securities, LLC; formerly, Deputy General Counsel, FAF Advisors, Inc. (2004-2010). | | 196 |
| | | | | | | | | | |
| ■ | JOEL T. SLAGER 1978 333 W. Wacker Drive Chicago, IL 60606 | | Vice President and Assistant Secretary | | 2013 | | Fund Tax Director for Nuveen Funds (since 2013); previously, Vice President of Morgan Stanley Investment Management, Inc., Assistant Treasurer of the Morgan Stanley Funds (from 2010 to 2013). | | 196 |
| (1) | The Board of Trustees is divided into three classes, Class I, Class II, and Class III, with each being elected to serve until the third succeeding annual shareholders’ meeting subsequent to its election or thereafter in each case when its respective successors are duly elected or appointed, except two board members are elected by the holders of Preferred Shares to serve until the next annual shareholders’ meeting subsequent to its election or thereafter in each case when its respective successors are duly elected or appointed. The year first elected or appointed represents the year in which the board member was first elected or appointed to any fund in the Nuveen Complex. |
| | |
| (2) | “Interested person” as defined in the 1940 Act, by reason of his position with Nuveen Investments, Inc. and certain of its subsidiaries, which are affiliates of the Nuveen Funds. |
| | |
| (3) | Officers serve one year terms through August of each year. The year first elected or appointed represents the year in which the Officer was first elected or appointed to any fund in the Nuveen Complex. |
Notes
Notes
Notes
| Nuveen Investments: |
| | Serving Investors for Generations |
Since 1898, financial advisors and their clients have relied on Nuveen Investments to provide dependable investment solutions through continued adherence to proven, long-term investing principles. Today, we offer a range of high quality equity and fixed-income solutions designed to be integral components of a well-diversified core portfolio.
Focused on meeting investor needs.
Nuveen Investments provides high-quality investment services designed to help secure the long-term goals of institutional and individual investors as well as the consultants and financial advisors who serve them. Nuveen Investments markets a wide range of specialized investment solutions which provide investors access to capabilities of its high-quality boutique investment affiliates—Nuveen Asset Management, Symphony Asset Management, NWQ Investment Management Company, Santa Barbara Asset Management, Tradewinds Global Investors, Winslow Capital Management and Gresham Investment Management. In total, Nuveen Investments managed approximately $233 billion as of March 31, 2015.
Find out how we can help you.
To learn more about how the products and services of Nuveen Investments may be able to help you meet your financial goals, talk to your financial advisor, or call us at (800) 257-8787. Please read the information provided carefully before you invest. Investors should consider the investment objective and policies, risk considerations, charges and expenses of any investment carefully. Where applicable, be sure to obtain a prospectus, which contains this and other relevant information. To obtain a prospectus, please contact your securities representative or Nuveen Investments, 333 W. Wacker Dr., Chicago, IL 60606. Please read the prospectus carefully before you invest or send money.
Learn more about Nuveen Funds at: www.nuveen.com/cef
| Distributed by Nuveen Investments, LLC | 333 West Wacker Drive | Chicago, IL 60606 | www.nuveen.com |  |
EAN-A-0415D 8573-INV-Y-06/16
ITEM 2. CODE OF ETHICS.
As of the end of the period covered by this report, the registrant has adopted a code of ethics that applies to the registrant’s principal executive officer, principal financial officer, principal accounting officer or controller, or persons performing similar functions. There were no amendments to or waivers from the Code during the period covered by this report. The registrant has posted the code of ethics on its website at www.nuveen.com/CEF/Shareholder/FundGovernance.aspx. (To view the code, click on Code of Conduct.)
ITEM 3. AUDIT COMMITTEE FINANCIAL EXPERT.
The registrant’s Board of Directors or Trustees (“Board”) determined that the registrant has at least one “audit committee financial expert” (as defined in Item 3 of Form N-CSR) serving on its Audit Committee. The registrant’s audit committee financial experts are Carole E. Stone and Jack B. Evans, who are “independent” for purposes of Item 3 of Form N-CSR.
Ms. Stone served for five years as Director of the New York State Division of the Budget. As part of her role as Director, Ms. Stone was actively involved in overseeing the development of the State’s operating, local assistance and capital budgets, its financial plan and related documents; overseeing the development of the State’s bond-related disclosure documents and certifying that they fairly presented the State’s financial position; reviewing audits of various State and local agencies and programs; and coordinating the State’s system of internal audit and control. Prior to serving as Director, Ms. Stone worked as a budget analyst/examiner with increasing levels of responsibility over a 30 year period, including approximately five years as Deputy Budget Director. Ms. Stone has also served as Chair of the New York State Racing Association Oversight Board, as Chair of the Public Authorities Control Board, as a Commissioner on the New York State Commission on Public Authority Reform and as a member of the Boards of Directors of several New York State public authorities. These positions have involved overseeing operations and finances of certain entities and assessing the adequacy of project/entity financing and financial reporting. Currently, Ms. Stone is on the Board of Directors of CBOE Holdings, Inc., of the Chicago Board Options Exchange, and of C2 Options Exchange. Ms. Stone’s position on the boards of these entities and as a member of both CBOE Holdings’ Audit Committee and its Finance Committee has involved, among other things, the oversight of audits, audit plans and preparation of financial statements.
Mr. Evans was formerly President and Chief Operating Officer of SCI Financial Group, Inc., a full service registered broker-dealer and registered investment adviser (“SCI”). As part of his role as President and Chief Operating Officer, Mr. Evans actively supervised the Chief Financial Officer (the “CFO”) and actively supervised the CFO’s preparation of financial statements and other filings with various regulatory authorities. In such capacity, Mr. Evans was actively involved in the preparation of SCI’s financial statements and the resolution of issues raised in connection therewith. Mr. Evans has also served on the audit committee of various reporting companies. At such companies, Mr. Evans was involved in the oversight of audits, audit plans, and the preparation of financial statements. Mr. Evans also formerly chaired the audit committee of the Federal Reserve Bank of Chicago.
ITEM 4. PRINCIPAL ACCOUNTANT FEES AND SERVICES.
Nuveen New Jersey Municipal Value Fund
The following tables show the amount of fees billed to the Fund during the Fund’s last two fiscal years by KPMG LLP, the Fund’s current auditor (engaged on August 7, 2014), and Ernst & Young LLP, the Fund’s former auditor. The audit fees billed to the Fund for the fiscal year 2015 are the only fees that have been billed to the Fund by KPMG LLP. All other fees listed in the tables below were billed to the Fund by Ernst & Young LLP. For engagements with KPMG LLP and Ernst & Young LLP, the Audit Committee approved in advance all audit services and non-audit services that KPMG LLP and Ernst & Young LLP provided to the Fund, except for those non-audit services that were subject to the pre-approval exception under Rule 2-01 of Regulation S-X (the “pre-approval exception”). The pre-approval exception for services provided directly to the Fund waives the pre-approval requirement for services other than audit, review or attest services if: (A) the aggregate amount of all such services provided constitutes no more than 5% of the total amount of revenues paid by the Fund to its accountant during the fiscal year in which the services are provided; (B) the Fund did not recognize the services as non-audit services at the time of the engagement; and (C) the services are promptly brought to the Audit Committee's attention, and the Committee (or its delegate) approves the services before the audit is completed.
The Audit Committee has delegated certain pre-approval responsibilities to its Chairman (or, in his absence, any other member of the Audit Committee).
SERVICES THAT THE FUND’S AUDITOR BILLED TO THE FUND
| | | Audit Fees Billed | | | Audit-Related Fees | | | Tax Fees | | | All Other Fees | |
| Fiscal Year Ended | | to Fund 1 | | | Billed to Fund 2 | | | Billed to Fund 3 | | | Billed to Fund 4 | |
| April 30, 2015 | | $ | 20,500 | | | $ | 0 | | | $ | 0 | | | $ | 0 | |
| | | | | | | | | | | | | | | | | |
| Percentage approved | | | 0 | % | | | 0 | % | | | 0 | % | | | 0 | % |
| pursuant to | | | | | | | | | | | | | | | | |
| pre-approval | | | | | | | | | | | | | | | | |
| exception | | | | | | | | | | | | | | | | |
| | | | | | | | | | | | | | | | | |
| April 30, 2014 | | $ | 21,750 | | | $ | 0 | | | $ | 0 | | | $ | 0 | |
| | | | | | | | | | | | | | | | | |
| Percentage approved | | | 0 | % | | | 0 | % | | | 0 | % | | | 0 | % |
| pursuant to | | | | | | | | | | | | | | | | |
| pre-approval | | | | | | | | | | | | | | | | |
| exception | | | | | | | | | | | | | | | | |
| | | | | | | | | | | | | | | | | |
1 "Audit Fees" are the aggregate fees billed for professional services for the audit of the Fund's annual financial statements and services provided in | |
| connection with statutory and regulatory filings or engagements. | | | | | | | | | | | | | |
| | | | | | | | | | | | | | | | | |
2 "Audit Related Fees" are the aggregate fees billed for assurance and related services reasonably related to the performance of the audit or review of | | | | | |
| financial statements that are not reported under "Audit Fees". These fees include offerings related to the Fund's common shares and leverage. | | | | | |
| | | | | | | | | | | | | | | | | |
3 "Tax Fees" are the aggregate fees billed for professional services for tax advice, tax compliance, and tax planning. These fees include: all global | | | | | |
| withholding tax services; excise and state tax reviews; capital gain, tax equalization and taxable basis calculation performed by the principal accountant. | | | | | |
| | | | | | | | | | | | | | | | | |
4 "All Other Fees" are the aggregate fees billed for products and services other than "Audit Fees", "Audit-Related Fees" and "Tax Fees". These fees | | | | | |
| represent all "Agreed-Upon Procedures" engagements pertaining to the Fund's use of leverage. | | | | | | | | | |
SERVICES THAT THE FUND’S AUDITOR BILLED TO THE ADVISER AND AFFILIATED FUND SERVICE PROVIDERS
The following tables show the amount of fees billed by KPMG LLP and Ernst & Young LLP to Nuveen Fund Advisors, LLC (formerly Nuveen Fund Advisors, Inc.) (the “Adviser”), and any entity controlling, controlled by or under common control with the Adviser that provides ongoing services to the Fund (“Affiliated Fund Service Provider”), for engagements directly related to the Fund’s operations and financial reporting, during the Fund’s last two full fiscal years.
The tables also show the percentage of fees subject to the pre-approval exception. The pre-approval exception for services provided to the Adviser and any Affiliated Fund Service Provider (other than audit, review or attest services) waives the pre-approval requirement if: (A) the aggregate amount of all such services provided constitutes no more than 5% of the total amount of revenues paid to KPMG LLP and Ernst & Young LLP by the Fund, the Adviser and Affiliated Fund Service Providers during the fiscal year in which the services are provided that would have to be pre-approved by the Audit Committee; (B) the Fund did not recognize the services as non-audit services at the time of the engagement; and (C) the services are promptly brought to the Audit Committee’s attention, and the Committee (or its delegate) approves the services before the Fund’s audit is completed.
| | Audit-Related Fees | Tax Fees Billed to | All Other Fees |
| | Billed to Adviser and | Adviser and | Billed to Adviser |
| | Affiliated Fund | Affiliated Fund | and Affiliated Fund |
| Fiscal Year Ended | Service Providers | Service Providers | Service Providers |
| April 30, 2015 | $ 0 | $ 0 | $ 0 |
| | | | |
| Percentage approved | 0% | 0% | 0% |
| pursuant to | | | |
| pre-approval | | | |
| exception | | | |
| April 30, 2014 | $ 0 | $ 0 | $ 0 |
| | | | |
| Percentage approved | 0% | 0% | 0% |
| pursuant to | | | |
| pre-approval | | | |
| exception | | | |
NON-AUDIT SERVICES
The following table shows the amount of fees that KPMG LLP and Ernst & Young LLP billed during the Fund’s last two full fiscal years for non-audit services. The Audit Committee is required to pre-approve non-audit services that KPMG LLP and Ernst & Young LLP provides to the Adviser and any Affiliated Fund Services Provider, if the engagement related directly to the Fund’s operations and financial reporting (except for those subject to the pre-approval exception described above). The Audit Committee requested and received information from KPMG LLP and Ernst & Young LLP about any non-audit services that KPMG LLP and Ernst & Young LLP rendered during the Fund’s last fiscal year to the Adviser and any Affiliated Fund Service Provider. The Committee considered this information in evaluating KPMG LLP and Ernst & Young LLP’s independence.
| | | Total Non-Audit Fees | | |
| | | billed to Adviser and | | |
| | | Affiliated Fund Service | Total Non-Audit Fees | |
| | | Providers (engagements | billed to Adviser and | |
| | | related directly to the | Affiliated Fund Service | |
| | Total Non-Audit Fees | operations and financial | Providers (all other | |
| Fiscal Year Ended | Billed to Fund | reporting of the Fund) | engagements) | Total |
| April 30, 2015 | $ 0 | $ 0 | $ 0 | $ 0 |
| April 30, 2014 | $ 0 | $ 0 | $ 0 | $ 0 |
| | | | | |
| | | | | |
| "Non-Audit Fees billed to Fund" for both fiscal year ends represent "Tax Fees" and "All Other Fees" billed to Fund in their respective | |
| amounts from the previous table. | | | | |
| | | | | |
| Less than 50 percent of the hours expended on the principal accountant's engagement to audit the registrant's financial statements for the most recent |
| fiscal year were attributed to work performed by persons other than the principal accountant's full-time, permanent employees. | |
Audit Committee Pre-Approval Policies and Procedures. Generally, the Audit Committee must approve (i) all non-audit services to be performed for the Fund by the Fund’s independent accountants and (ii) all audit and non-audit services to be performed by the Fund’s independent accountants for the Affiliated Fund Service Providers with respect to operations and financial reporting of the Fund. Regarding tax and research projects conducted by the independent accountants for the Fund and Affiliated Fund Service Providers (with respect to operations and financial reports of the Fund) such engagements will be (i) pre-approved by the Audit Committee if they are expected to be for amounts greater than $10,000; (ii) reported to the Audit Committee chairman for his verbal approval prior to engagement if they are expected to be for amounts under $10,000 but greater than $5,000; and (iii) reported to the Audit Committee at the next Audit Committee meeting if they are expected to be for an amount under $5,000.
ITEM 5. AUDIT COMMITTEE OF LISTED REGISTRANTS.
The registrant’s Board has a separately designated Audit Committee established in accordance with Section 3(a)(58)(A) of the Securities Exchange Act of 1934, as amended (15 U.S.C. 78c(a)(58)(A)). The members of the audit committee are Jack B. Evans, David J. Kundert, John K. Nelson, Carole E. Stone and Terence J. Toth.
ITEM 6. SCHEDULE OF INVESTMENTS.
a) See Portfolio of Investments in Item 1.
b) Not applicable.
ITEM 7. DISCLOSURE OF PROXY VOTING POLICIES AND PROCEDURES FOR CLOSED-END MANAGEMENT INVESTMENT COMPANIES.
Nuveen Fund Advisors, LLC is the registrant’s investment adviser (also referred to as the “Adviser”). The Adviser is responsible for the on-going monitoring of the Fund’s investment portfolio, managing the Fund’s business affairs and providing certain clerical, bookkeeping and administrative services. The Adviser has engaged Nuveen Asset Management, LLC (“Sub-Adviser”) as Sub-Adviser to provide discretionary investment advisory services. As part of these services, the Adviser has delegated to the Sub-Adviser the full responsibility for proxy voting on securities held in the registrant’s portfolio and related duties in accordance with the Sub-Adviser’s policies and procedures. The Adviser periodically monitors the Sub-Adviser’s voting to ensure that it is carrying out its duties. The Sub-Adviser’s proxy voting policies and procedures are attached to this filing as an exhibit and incorporated herein by reference.
ITEM 8. PORTFOLIO MANAGERS OF CLOSED-END MANAGEMENT INVESTMENT COMPANIES.
Nuveen Fund Advisors, LLC is the registrant’s investment adviser (also referred to as the “Adviser”). The Adviser is responsible for the selection and on-going monitoring of the Fund’s investment portfolio, managing the Fund’s business affairs and providing certain clerical, bookkeeping and administrative services. The Adviser has engaged Nuveen Asset Management, LLC (“Nuveen Asset Management” or “Sub-Adviser”) as Sub-Adviser to provide discretionary investment advisory services. The following section provides information on the portfolio manager at the Sub-Adviser:
The Portfolio Manager
The following individual has primary responsibility for the day-to-day implementation of the registrant’s investment strategies:
| Name | Fund |
| Paul Brennan | Nuveen New Jersey Municipal Value Fund |
Other Accounts Managed. In addition to managing the registrant, the portfolio manager is also primarily responsible for the day-to-day portfolio management of the following accounts:
| Portfolio Manager | Type of Account Managed | Number of Accounts | Assets* |
| Paul Brennan | Registered Investment Company | 14 | $19.43 billion |
| | Other Pooled Investment Vehicles | 2 | $351 million |
| | Other Accounts | 2 | $57.6 million |
| * | Assets are as of April 30, 2015. None of the assets in these accounts are subject to an advisory fee based on performance. |
POTENTIAL MATERIAL CONFLICTS OF INTEREST
Actual or apparent conflicts of interest may arise when a portfolio manager has day-to-day management responsibilities with respect to more than one account. More specifically, portfolio managers who manage multiple accounts are presented a number of potential conflicts, including, among others, those discussed below.
The management of multiple accounts may result in a portfolio manager devoting unequal time and attention to the management of each account. Nuveen Asset Management seeks to manage such competing interests for the time and attention of portfolio managers by having portfolio managers focus on a particular investment discipline. Most accounts managed by a portfolio manager in a particular investment strategy are managed using the same investment models.
If a portfolio manager identifies a limited investment opportunity which may be suitable for more than one account, an account may not be able to take full advantage of that opportunity due to an allocation of filled purchase or sale orders across all eligible accounts. To deal with these situations, Nuveen Asset Management has adopted procedures for allocating limited opportunities across multiple accounts.
With respect to many of its clients’ accounts, Nuveen Asset Management determines which broker to use to execute transaction orders, consistent with its duty to seek best execution of the transaction. However, with respect to certain other accounts, Nuveen Asset Management may be limited by the client with respect to the selection of brokers or may be instructed to direct trades through a particular broker. In these cases, Nuveen Asset Management may place separate, non-simultaneous, transactions for a Fund and other accounts which may temporarily affect the market price of the security or the execution of the transaction, or both, to the detriment of the Fund or the other accounts.
Some clients are subject to different regulations. As a consequence of this difference in regulatory requirements, some clients may not be permitted to engage in all the investment techniques or transactions or to engage in these transactions to the same extent as the other accounts managed by the portfolio manager. Finally, the appearance of a conflict of interest may arise where Nuveen Asset Management has an incentive, such as a performance-based management fee, which relates to the management of some accounts, with respect to which a portfolio manager has day-to-day management responsibilities.
Nuveen Asset Management has adopted certain compliance procedures which are designed to address these types of conflicts common among investment managers. However, there is no guarantee that such procedures will detect each and every situation in which a conflict arises.
Item 8(a)(3). FUND MANAGER COMPENSATION
Portfolio manager compensation consists primarily of base pay, an annual cash bonus and long term incentive payments.
Base pay. Base pay is determined based upon an analysis of the portfolio manager’s general performance, experience, and market levels of base pay for such position.
Annual cash bonus. The Fund’s portfolio managers are eligible for an annual cash bonus based on investment performance, qualitative evaluation and financial performance of Nuveen Asset Management.
A portion of each portfolio manager’s annual cash bonus is based on the Fund’s investment performance, generally measured over the past one- and three or five-year periods unless the portfolio manager’s tenure is shorter. Investment performance for the Fund generally is determined by evaluating the Fund’s performance relative to its benchmark(s) and/or Lipper industry peer group.
A portion of the cash bonus is based on a qualitative evaluation made by each portfolio manager’s supervisor taking into consideration a number of factors, including the portfolio manager’s team collaboration, expense management, support of personnel responsible for asset growth, and his or her compliance with Nuveen Asset Management’s policies and procedures.
The final factor influencing a portfolio manager’s cash bonus is the financial performance of Nuveen Asset Management based on its operating earnings.
Long-term incentive compensation. Certain key employees of Nuveen Investments and its affiliates, including certain portfolio managers, participate in a Long-Term Performance Plan designed to provide compensation opportunities that links a portion of each participant’s compensation to Nuveen Investments’ financial and operational performance. In addition, certain key employees of Nuveen Asset Management, including certain portfolio managers, have received profits interests in Nuveen Asset Management which entitle their holders to participate in the firm’s growth over time.
There are generally no differences between the methods used to determine compensation with respect to the Fund and the Other Accounts shown in the table above.
Beneficial Ownership of Securities. As of April 30, 2015 the portfolio manager beneficially owned the following dollar range of equity securities issued by the Registrant and other Nuveen Funds managed by Nuveen Asset Management’s municipal investment team.
| Name of Portfolio Manager | Fund | Dollar range of equity securities beneficially owned in Fund | Dollar range of equity securities beneficially owned in the remainder of Nuveen funds managed by Nuveen Asset Management’s municipal investment team |
| Paul Brennan | Nuveen New Jersey Municipal Value Fund | $0 | $ 500,001-$1,000,000 |
PORTFOLIO MANAGER BIO:
Paul Brennan, CFA, CPA, manages several Nuveen municipal national and state mutual funds and closed-end bond funds. Paul began his career in the investment business in 1991, as a municipal credit analyst for Flagship Financial, before becoming a portfolio manager in 1994. He joined Nuveen Investments in 1997, when Nuveen acquired Flagship Financial that year. He earned his B.S. in Accountancy and Finance from Wright State University. He is a CPA, has earned the Chartered Financial Analyst (CFA) designation, and currently sits on the Nuveen Asset Management Investment Management Committee.
ITEM 9. PURCHASES OF EQUITY SECURITIES BY CLOSED-END MANAGEMENT INVESTMENT COMPANY AND AFFILIATED PURCHASERS.
| Period* | (a) | (b) | (c) | (d)* |
| | TOTAL NUMBER OF | AVERAGE | TOTAL NUMBER OF SHARES | MAXIMUM NUMBER (OR |
| | SHARES (OR | PRICE | (OR UNITS) PURCHASED AS | APPROXIMATE DOLLAR VALUE) OF |
| | UNITS) | PAID PER | PART OF PUBLICLY | SHARES (OR UNITS) THAT MAY YET |
| | PURCHASED | SHARE (OR | ANNOUNCED PLANS OR | BE PURCHASED UNDER THE PLANS OR |
| | UNIT) | PROGRAMS | PROGRAMS | |
| | | | | |
| MAY 1-31, 2014 | | | | 155,000 |
| | | | | |
| JUNE 1-30, 2014 | | | | 155,000 |
| | | | | |
| JULY 1-31, 2013 | | | | 155,000 |
| | | | | |
| AUGUST 1-31, 2014 | 1,000 | $14.31 | 1,000 | 154,000 |
| | | | | |
| SEPTEMBER 1-30, 2014 | 300 | $14.13 | 300 | 153,700 |
| | | | | |
| OCTOBER 1-31, 2014 | 13,700 | $14.18 | 13,700 | 140,000 |
| | | | | |
| NOVEMBER 1-30, 2014 | | | | 140,000 |
| | | | | |
| DECEMBER 1-31, 2014 | | | | 140,000 |
| | | | | |
| JANUARY 1-31, 2015 | | | | 140,000 |
| | | | | |
| FEBRUARY 1-28, 2015 | | | | 140,000 |
| | | | | |
| MARCH 1-31, 2015 | | | 0 | 140,000 |
| | | | | |
| APRIL 1-30, 2015 | 0 | | | 140,000 |
| | | | | |
| TOTAL | 15,000 | | | |
* The registrant's repurchase program, for the repurchase of 155,000 shares, was authorized November 20, 2013. The program was reauthorized for a maximum repurchase amount of 155,000 shares on August 6, 2014. Any repurchases made by the registrant pursuant to the program were made through open-market transactions.
ITEM 10. SUBMISSION OF MATTERS TO A VOTE OF SECURITY HOLDERS.
There have been no material changes to the procedures by which shareholders may recommend nominees to the registrant’s Board implemented after the registrant last provided disclosure in response to this Item.
ITEM 11. CONTROLS AND PROCEDURES.
| (a) | The registrant’s principal executive and principal financial officers, or persons performing similar functions, have concluded that the registrant’s disclosure controls and procedures (as defined in Rule 30a-3(c) under the Investment Company Act of 1940, as amended (the “1940 Act”) (17 CFR 270.30a-3(c))) are effective, as of a date within 90 days of the filing date of this report that includes the disclosure required by this paragraph, based on their evaluation of the controls and procedures required by Rule 30a-3(b) under the 1940 Act (17 CFR 270.30a-3(b)) and Rules 13a-15(b) or 15d-15(b) under the Securities Exchange Act of 1934, as amended (the “Exchange Act”) (17 CFR 240.13a-15(b) or 240.15d-15(b)). |
| (b) | There were no changes in the registrant’s internal control over financial reporting (as defined in Rule 30a-3(d) under the 1940 Act (17 CFR 270.30a-3(d)) that occurred during the second fiscal quarter of the period covered by this report that has materially affected, or is reasonably likely to materially affect, the registrant’s internal control over financial reporting. |
ITEM 12. EXHIBITS.
File the exhibits listed below as part of this Form.
| (a)(1) | Any code of ethics, or amendment thereto, that is the subject of the disclosure required by Item 2, to the extent that the registrant intends to satisfy the Item 2 requirements through filing of an exhibit: Not applicable because the code is posted on registrant’s website at www.nuveen.com/CEF/Shareholder/FundGovernance.aspx and there were no amendments during the period covered by this report. (To view the code, click on Code of Conduct.) |
| (a)(2) | A separate certification for each principal executive officer and principal financial officer of the registrant as required by Rule 30a-2(a) under the 1940 Act (17 CFR 270.30a-2(a)) in the exact form set forth below: Ex-99.CERT Attached hereto. |
| (a)(3) | Any written solicitation to purchase securities under Rule 23c-1 under the 1940 Act (17 CFR 270.23c-1) sent or given during the period covered by the report by or on behalf of the registrant to 10 or more persons. Not applicable. |
| (b) | If the report is filed under Section 13(a) or 15(d) of the Exchange Act, provide the certifications required by Rule 30a-2(b) under the 1940 Act (17 CFR 270.30a-2(b)); Rule 13a-14(b) or Rule 15d-14(b) under the Exchange Act (17 CFR 240.13a-14(b) or 240.15d-14(b)), and Section 1350 of Chapter 63 of Title 18 of the United States Code (18 U.S.C. 1350) as an exhibit. A certification furnished pursuant to this paragraph will not be deemed “filed” for purposes of Section 18 of the Exchange Act (15 U.S.C. 78r), or otherwise subject to the liability of that section. Such certification will not be deemed to be incorporated by reference into any filing under the Securities Act of 1933 or the Exchange Act, except to the extent that the registrant specifically incorporates it by reference. Ex-99.906 CERT attached hereto. |
SIGNATURES
Pursuant to the requirements of the Securities Exchange Act of 1934 and the Investment Company Act of 1940, the registrant has duly caused this report to be signed on its behalf by the undersigned, thereunto duly authorized.
(Registrant) Nuveen New Jersey Municipal Value Fund
By (Signature and Title) /s/ Kevin J. McCarthy
Kevin J. McCarthy
Vice President and Secretary
Date: July 8, 2015
Pursuant to the requirements of the Securities Exchange Act of 1934 and the Investment Company Act of 1940, this report has been signed below by the following persons on behalf of the registrant and in the capacities and on the dates indicated.
By (Signature and Title) /s/ Gifford R. Zimmerman
Gifford R. Zimmerman
Chief Administrative Officer
(principal executive officer)
By (Signature and Title) /s/ Stephen D. Foy
Stephen D. Foy
Vice President and Controller
(principal financial officer)