NUVEEN INVESTMENTS ANNOUNCES STRATEGIC COMBINATION WITH FAF ADVISORS
On July 29, 2010, Nuveen Investments announced that U.S. Bancorp will receive a 9.5% stake in Nuveen Investments and cash consideration in exchange for the long-term asset business of U.S. Bancorp’s FAF Advisors. Nuveen Investments is the parent of Nuveen Asset Management (NAM), the investment adviser for the Funds included in this report.
FAF Advisors, which currently manages about $25 billion of long-term assets and serves as the advisor of the First American Funds, will be combined with NAM, which currently manages about $75 billion in municipal fixed income assets. Upon completion of the transaction, Nuveen Investments, which currently manages about $160 billion of assets across several high-quality affiliates, will manage a combined total of about $185 billion in institutional and retail assets.
This combination will not affect the investment objectives, strategies or policies of the Funds in this report. Over time, Nuveen Investments expects that the combination will provide even more ways to meet the needs of investors who work with financial advisors and consultants by enhancing the multi-boutique model of Nuveen Investments, which also includes highly respected investment teams at Hyde Park, NWQ Investment Management, Santa Barbara Asset Management, Symphony Asset Management, Tradewinds Global Investors and Winslow Capital.
The transaction is expected to close late in 2010, subject to customary conditions.
Chairman’s
Letter to Shareholders
Dear Shareholder,
Recent months have revealed the fragility and disparity of the global economic recovery. In the U.S., the rate of economic growth has slowed as various stimulus programs wind down, exposing weakness in the underlying economy. In contrast, many emerging market countries are experiencing a return to comparatively high rates of growth. Confidence in global financial markets has been undermined by concerns about high sovereign debt levels in Europe and the U.S. Until these countries can begin credible programs to reduce their budgetary deficits, market unease and hesitation will remain. On a more encouraging note, while the global recovery is expanding existing trade imbalances, policy makers in the leading economies are making a sustained effort to create a global framework through which various countries can take complimentary actions that should red uce those imbalances over time.
The U.S. economy is subject to unusually high levels of uncertainty as it struggles to recover from a devastating financial crisis. Unemployment remains stubbornly high, due to what appears to be both cyclical and structural forces. Federal Reserve policy makers are implementing another round of quantitative easing, a novel approach to provide support to the economy. However, the high levels of debt owed both by U.S. consumers and the U.S. government limit the Fed’s ability to engineer a stronger economic recovery.
The U.S. financial markets reflect the crosscurrents now impacting the U.S. economy. Today’s historically low interest rates reflect the Fed’s intervention in the financial markets and the demand for U.S. government debt by U.S. and overseas investors looking for a safe haven for investment. The continued corporate earnings recovery and recent electoral results are giving a boost to equity markets. Encouragingly, financial institutions are rebuilding their balance sheets and the financial reform legislation enacted last summer has the potential to address many of the most significant contributors to the financial crisis, although the details still have to be worked out.
In this difficult environment your Nuveen investment team continues to seek sustainable investment opportunities and, at the same time, remains alert for potential risks that may result from a recovery still facing many headwinds. As your representative, the Nuveen Fund Board monitors the activities of each investment team to assure that all maintain their investment disciplines. As always, I encourage you to contact your financial consultant if you have any questions about your investment in a Nuveen Fund.
On behalf of the other members of your Fund Board, we look forward to continuing to earn your trust in the months and years ahead.
Sincerely,
Robert P. Bremner
Chairman of the Board
November 22, 2010
Nuveen Investments 1
Portfolio Manager’s Comments
Nuveen New York Municipal Value Fund, Inc. (NNY)
Nuveen New York Municipal Value Fund 2 (NYV)
Nuveen New York Performance Plus Municipal Fund, Inc. (NNP)
Nuveen New York Dividend Advantage Municipal Fund (NAN)
Nuveen New York Dividend Advantage Municipal Fund 2 (NXK)
Portfolio manager Cathryn Steeves reviews economic and municipal market conditions at both the national and state levels, key investment strategies, and the performance of these Nuveen Funds for the twelve-month period ended September 30, 2010. Cathryn, who joined Nuveen in 1996, has managed NNY, NNP, NAN, and NXK since 2006. She added portfolio management responsibility for NYV at its inception in April 2009.
What factors affected the U.S. economy and municipal market during the twelve-month reporting period ended September 30, 2010?
During this reporting period, the U.S. economy remained under considerable stress, and both the Federal Reserve (Fed) and the federal government continued their efforts to improve the overall economic environment. For its part, the Fed held the benchmark fed funds rate in a target range of zero to 0.25% after cutting it to this record low level in December 2008. At its September 2010 meeting, the central bank renewed its commitment to keep the fed funds rate at “exceptionally low levels” for an “extended period.” The Fed also stated that it was “prepared to take further policy actions as needed” to support economic recovery. The federal government continued to focus on implementing the economic stimulus package passed early in 2009 that was intended to provide job creation, tax relief, fiscal assistance to state and local governments, and expand unemployment benefits and other federal social welfare programs.
These and other measures produced some signs of economic improvement. In the third quarter of 2010, the U.S gross domestic product achieved a preliminary growth rate of 2.0% on an annualized basis, the fifth consecutive quarter of positive growth and the first time this has been achieved since 2007-2008. The housing market also saw some improvement, with the average home price in the Standard & Poor’s (S&P)/Case-Shiller Index rising 1.7% over the twelve months ended August 2010 (the most recent data available at the time this report was produced). This put home prices nationally up 6.7% from their low point in April 2009 and back to levels on par with those of late 2003. At the same time, inflation remained relatively tame, as the Consumer Price Index rose just 1.1% year-over-year as of September 2010. However, unemployment remained a t
Certain statements in this report are forward-looking statements. Discussions of specific investments are for illustration only and are not intended as recommendations of individual investments. The forward-looking statements and other views expressed herein are those of the portfolio manager as of the date of this report. Actual future results or occurrences may differ significantly from those anticipated in any forward-looking statements, and the views expressed herein are subject to change at any time, due to numerous market and other factors. The Funds disclaim any obligation to update publicly or revise any forward-looking statements or views expressed herein.
Any reference to credit ratings for portfolio holdings refers to the highest rating assigned by a Nationally Recognized Statistical Rating Organization (“NRSRO”) such as Standard & Poor’s, Moody’s, or Fitch. AAA, AA, A and BBB ratings are investment grade; BB, B, CCC, CC, C and D ratings are below investment grade. Holdings and ratings may change over time.
2 Nuveen Investments
historically high levels. As of September 2010, the national unemployment rate was 9.6%, down from 9.8% in September 2009.
Municipal bond prices generally rose during this period, as the combination of strong demand and tight supply of new tax-exempt issuance to create favorable conditions. The reduced issuance of tax-exempt municipal debt was due in part to the introduction of the Build America Bond program in 2009. This new class of taxable municipal debt, created as part of the February 2009 economic stimulus package, currently offers municipal issuers a federal subsidy equal to 35% of a bond’s interest payments, providing issuers with an alternative to traditional tax-exempt debt that often proves to be lower in cost. During the twelve months ended September 30, 2010, taxable Build America Bonds issuance totaled $100.9 billion, accounting for 25% of new bonds issued in the municipal market.
Over the twelve months ended September 30, 2010, municipal bond issuance nationwide—both tax-exempt and taxable—totaled $403.9 billion, an increase of 12% compared with the twelve-month period ended September 30, 2009. However, if taxable Build America Bond issuance were removed from the equation, the supply of tax-exempt bonds alone fell more than 7%.
How were the economic and market environments in New York during this period?
Over the period, New York showed signs of economic recovery as job growth in the state outpaced the national average. Hiring increased in professional and business services, health care, and the leisure and hospitality sectors. However, the state’s financial sector continued to report job losses, as did construction and manufacturing, and state and local governments also continued to shed workers. With the uncertainty still surrounding the economic outlook combining with the impact of financial regulatory reform, some observers believe job growth in the financial sector may remain subdued for some time. As of September 2010, the unemployment rate in New York was 8.3%, down from 8.8% in September 2009 and below the U.S. average of 9.6%. News from the housing sector was also relatively positive. While housing prices in New York City rose a negl igible 0.1% over the twelve months ended August 2010 (the most recent data available at the time this report was produced), the city was one of only eight major metropolitan areas to record positive annual growth rates for the period, according to the S&P/Case-Shiller Home Price Index. Because New York experienced relatively low exposure to sub-prime lending during the housing boom, the state’s percentage of homes in foreclosure remained well below the national average.
In August 2010, more than four months after the April 1st deadline, New York passed a $136 billion budget for fiscal 2011. This represented an increase of 4% over fiscal 2010, closed a $9.2 billion deficit through increased fees and taxes, and cut aid to schools. Current plans also call for laying off 1,000 state workers in early 2011. As of September 30, 2010, Moody’s, S&P and Fitch rated New York general obligation debt at Aa2/AA/AA, respectively. For the twelve months ended September 30, 2010, municipal issuance in New York totaled $42.2 billion, an increase of 15%
Nuveen Investments 3
from the previous twelve months. This ranked New York second among state issuers, behind California.
What key strategies were used to manage the Funds during this reporting period?
As previously mentioned, the supply of tax-exempt bonds declined nationally during this period, due in part to the issuance of taxable Build America Bonds. This program also impacted the availability of tax-exempt bonds in New York, which ranked second (after California) in terms of dollar amount of bonds issued under the Build America Bond program in 2010. For the twelve months ended September 30, 2010, Build America Bonds accounted for almost 29% of municipal supply in New York. Since interest payments from Build America Bonds represent taxable income, we do not view these bonds as good investment opportunities for the Funds.
Despite the constrained issuance of tax-exempt municipal bonds, we continued to find attractive value opportunities, taking a bottom-up approach to discovering undervalued sectors and individual credits with the potential to perform well over the long term. Our focus generally remained on premium coupon bonds with maturities between 20 and 30 years. During the earlier part of the period, we also purchased bonds at the lower end of the quality spectrum, which we believed offered value relative to historical credit spreads. During this period, we found value in several areas of the market, including health care, higher education, housing and New York City general obligation (GO) bonds. We also added bonds for the new sports arena under construction in Brooklyn to NNY, NAN and NXK. In addition, NNY purchased airline bonds. NYV, which was introduced in April 2009, saw less investment activity during this period than the other New York Funds. This Fund’s portfolio was invested in 2009 at a time when yields were higher than they have been in recent months, and we believed it was prudent to maintain these holdings. We did add some hospital bonds and New York City GOs to NYV when attractive opportunities presented themselves.
Some of our investment activity resulted from opportunities created by the provisions of the Build America Bond program. For example, tax-exempt supply was more plentiful in the health care and higher education sectors because, as 501(c)(3) (nonprofit) organizations, hospitals and private universities generally do not qualify for the Build America Bond program and must continue to issue bonds in the tax-exempt municipal market. Bonds with proceeds earmarked for refundings, working capital, and private activities also are not covered by the Build America Bond program, and this resulted in attractive opportunities in various other sectors of the market.
The impact of the Build America Bond program also was evident in the area of longer-term issuance, as municipal issuers sought to take full advantage of the attractive financing terms offered by these bonds. Approximately 70% of Build America Bonds were issued with maturities of at least 30 years. Even though this significantly reduced
4 Nuveen Investments
the availability of tax-exempt credits with longer maturities, we continued to find good opportunities to purchase attractive longer-term bonds for these Funds.
Cash for new purchases during this period was generated primarily by the proceeds from a substantial number of bond calls as well as maturing bonds, which we worked to redeploy to keep the Funds fully invested. On the whole, selling was relatively minimal, as the bonds in our portfolios generally offered higher yields than those available in the current marketplace.
As of September 30, 2010, all five of these Funds continued to use inverse floating rate securities.1 We employ inverse floaters as a form of leverage for a variety of reasons, including duration management, income enhancement and total return enhancement.
How did the Funds perform?
Individual results for these Funds, as well as relevant index and peer group information, are presented in the accompanying table.
Average Annual Total Returns on Common Share Net Asset Value
For periods ended 9/30/10
| Fund | | 1-Year | | | 5-Year | | | 10-Year | |
NNY2 | | | 5.82 | % | | | 4.64 | % | | | 5.31 | % |
NYV2 | | | 6.26 | % | | | N/A | | | | N/A | |
| NNP | | | 8.46 | % | | | 5.54 | % | | | 7.39 | % |
| NAN | | | 8.28 | % | | | 5.24 | % | | | 7.45 | % |
| NXK | | | 8.27 | % | | | 5.53 | % | | | N/A | |
| | | | | | | | | | | | | |
Standard & Poor’s (S&P) New York Municipal Bond Index3 | | | 5.74 | % | | | 5.13 | % | | | 5.79 | % |
| | | | | | | | | | | | | |
Standard & Poor’s (S&P) National Municipal Bond Index4 | | | 5.85 | % | | | 4.91 | % | | | 5.71 | % |
| | | | | | | | | | | | | |
Lipper New York Municipal Debt Funds Average5 | | | 8.47 | % | | | 4.15 | % | | | 6.47 | % |
For the twelve months ended September 30, 2010, the total returns on common share net asset value (NAV) for all five of these New York Funds exceeded the return for the Standard & Poor’s (S&P) New York Municipal Bond Index. NYV, NNP, NAN and NXK also outperformed the S&P National Municipal Bond Index, while NNY performed in line with the national index. For this same period, NNP performed in line with the Lipper New York Municipal Debt Funds Average, while the remaining four Funds lagged the Lipper Average.
Key management factors that influenced the Funds’ returns during this period included duration and yield curve positioning, credit exposure and sector allocation. In addition, the use of structural leverage was an important positive factor affecting the Funds’ performances over this period. The primary reason that the returns of NNY and NYV trailed those of the other three Funds for the twelve-month period was that these two
| 1 | An inverse floating rate security, also known as an inverse floater, is a financial instrument designed to pay long-term tax-exempt interest at a rate that varies inversely with a short-term tax-exempt interest rate index. For the Nuveen Funds, the index typically used is the Securities Industry and Financial Markets Association (SIFMA) Municipal Swap Index (previously referred to as the Bond Market Association Index or BMA). Inverse floaters, including those inverse floating rate securities in which the Funds invested during this reporting period, are further defined within the Notes to Financial Statements and Glossary of Terms Used in this Report sections of this report. |
| | Past performance is not predictive of future results. Current performance may be higher or lower than the data shown. Returns do not reflect the deduction of taxes that shareholders may have to pay on Fund distributions or upon the sale of Fund shares. |
| | For additional information, see the individual Performance Overview for your Fund in this report. |
| 2 | NNY and NYV do not use structural leverage; the remaining three Funds in this report are leveraged. |
| 3 | The Standard & Poor’s (S&P) New York Municipal Bond Index is an unleveraged, market value-weighted index designed to measure the performance of the tax-exempt, investment-grade New York municipal bond market. This index does not reflect any initial or ongoing expenses and is not available for direct investment. |
| 4 | The Standard & Poor’s (S&P) National Municipal Bond Index is an unleveraged, market value-weighted index designed to measure the performance of the tax-exempt, investment-grade U.S. municipal bond market. This index does not reflect any initial or ongoing expenses and is not available for direct investment. |
| 5 | The Lipper New York Municipal Debt Funds Average is calculated using the returns of all closed-end funds in this category for each period as follows: 1-year, 17 funds; 5-year, 17 funds; and 10-year, 6 funds. Lipper returns account for the effects of management fees and assume reinvestment of dividends, but do not reflect any applicable sales charges. The Lipper average is not available for direct investment. |
Nuveen Investments 5
Funds do not use structural leverage. The impact of structural leverage is discussed in more detail on page seven.
During this period, municipal bonds with longer maturities generally outperformed those with shorter maturities, with credits at the shortest end of the municipal yield curve posting the weakest returns. The outperformance of longer term bonds was due in part to the decline in interest rates, particularly in the long intermediate and longer segments of the curve. The scarcity of tax-exempt bonds with longer maturities also drove up the prices of these bonds. Overall, duration and yield curve positioning proved positive for the performance of these Funds. All five of the Funds benefited from their underweightings in bonds with shorter maturities and overweightings in the intermediate part of the yield curve, which performed well. Although the net impact of its duration and yield curve positioning was positive, NNY had relatively more exposure to the underperforming short end of the curve, which detracted from its performance compared with the other Funds.
Credit exposure also played a role in performance. The demand for municipal bonds increased during this period driven by a variety of factors, including concerns about potential tax increases, the need to rebalance portfolio allocations and a growing appetite for additional risk. At the same time, the supply of new tax-exempt municipal paper declined, due largely to the Build America Bond program. As investors bid up municipal bond prices, bonds rated BBB or below and non-rated bonds generally outperformed those rated AAA. All of these Funds were overweighted in lower-rated and non-rated bonds and underweighted in bonds rated AAA, which added to their performance for this period.
Holdings that generally contributed positively to the Funds’ returns during this period included health care and housing bonds. Revenue bonds as a whole performed well, with transportation, leasing, and education among the other sectors that outperformed the general municipal market. Zero coupon bonds also were among the strongest performers. All of these Funds tended to be overweighted in the health care and housing sectors relative to the overall municipal market, which was positive for their performance. This was partially offset by their underweighting of the transportation sector.
In contrast, pre-refunded bonds, which are often backed by U.S. Treasury securities, continued to perform poorly during this period. While these securities continued to provide attractive tax-free income, the underperformance of these bonds can be attributed primarily to the price declines associated with their shorter effective maturities and higher credit quality. GO and other tax-supported bonds also struggled to keep pace with the municipal market return for the twelve months. All of these Funds were underweighted in pre-refunded and tax-supported bonds, which lessened the impact of these holdings. Among the revenue sectors, resource recovery trailed the overall municipal market by the widest margin, and water and sewer bonds also turned in a weak
6 Nuveen Investments
performance. Bonds backed by the 1998 master tobacco settlement agreement also posted relatively poor returns. With allocations of lower-rated tobacco bonds that ranged from approximately 1% to 3%, these Funds were underexposed to the tobacco sector, which was a slight positive for their performance.
IMPACT OF THE FUNDS’ LEVERAGE STRATEGIES ON PERFORMANCE
As mentioned previously, NNY and NYV do not use structural leverage. One important factor impacting the returns of NNP, NAN and NXK relative to the comparative indexes was the Funds’ use of financial leverage. The Funds use leverage because their managers believe that, over time, leveraging provides opportunities for additional income and total return for common shareholders. However, use of leverage also can expose common shareholders to additional volatility. For example, as the prices of securities held by a Fund decline, the negative impact of these valuation changes on common share net asset value and common shareholder total return is magnified by the use of leverage. Conversely, leverage may enhance common share returns during periods when the prices of securitie s held by a Fund generally are rising. Leverage made a positive contribution to the performance of NNP, NAN and NXK over this reporting period.
RECENT DEVELOPMENTS REGARDING THE FUNDS’ LEVERAGED CAPITAL STRUCTURE
Shortly after their inceptions, NNP, NAN and NXK issued auction rate preferred shares (ARPS) to create financial leverage. As noted in past shareholder reports, the ARPS issued by many closed-end funds, including these Funds, have been hampered by a lack of liquidity since February 2008. Since that time, more ARPS have been submitted for sale in each of their regularly scheduled auctions than there have been offers to buy. In fact, offers to buy have been almost completely non-existent since late February 2008. This means that these auctions have “failed to clear,” and that many, or all, of the ARPS shareholders who wanted to sell their shares in these auctions were unable to do so. This lack of liquidity in ARPS did not lower the credit quality of these shares, and ARPS shareholders unable to sell their shares continued to receive dist ributions at the “maximum rate” applicable to failed auctions, as calculated in accordance with the pre-established terms of the ARPS. In the recent market, with short-term rates at multi-generational lows, those maximum rates also have been low.
One continuing implication for common shareholders from the auction failures is that each Fund’s cost of leverage likely has been incrementally higher at times than it otherwise might have been had the auctions continued to be successful. As a result, each Fund’s common share earnings likely have been incrementally lower at times than they otherwise might have been.
As noted in past shareholder reports, the Nuveen funds’ Board of Directors/Trustees authorized several methods to refinance a portion of the Nuveen funds’ outstanding
Nuveen Investments 7
ARPS. Some funds have utilized tender option bonds (TOBs), also known as inverse floating rate securities, for leverage purposes. The amount of TOBs that a fund may use varies according to the composition of each fund’s portfolio. Some funds have a greater ability to use TOBs than others. Some funds have issued Variable Rate Demand Preferred (VRDP) Shares, a floating rate form of preferred stock. Some funds have issued MuniFund Term Preferred (MTP) Shares, a fixed rate form of preferred stock with a mandatory redemption period of five years.
While all these efforts have reduced the total amount of outstanding ARPS issued by the Nuveen funds, the funds cannot provide any assurance on when the remaining outstanding ARPS might be redeemed.
During 2010, 33 Nuveen leveraged closed-end funds, (including NNP), received a demand letter from a law firm on behalf of purported holders of common shares of each such fund, alleging that Nuveen and the funds’ officers and Board of Directors/ Trustees breached their fiduciary duties related to the redemption at par of the funds’ ARPS. In response, the Board established an ad hoc Demand Committee consisting of certain of its disinterested and independent Board members to investigate the claims. The Demand Committee retained independent counsel to assist it in conducting an extensive investigation. Based upon its investigation, the Demand Committee found that it was not in the best interests of each fund or its shareholders to take the actions suggested in the demand letters, and recommended that the full Board reject the demands made i n the demand letters. After reviewing the findings and recommendation of the Demand Committee, the full Board of each fund unanimously adopted the Demand Committee’s recommendation.
Subsequently, 26 of the funds that received demand letters (including NNP) were named as nominal defendants in a putative shareholder derivative action complaint captioned Safier and Smith v. Nuveen Asset Management, et al. that was filed in the Circuit Court of Cook County, Illinois, Chancery Division (the “Cook County Chancery Court”) on July 27, 2010. Three additional funds were named as nominal defendants in a similar complaint captioned Curbow v. Nuveen Asset Management, et al. filed in the Cook County Chancery Court on August 12, 2010, and three additional funds were named as nominal defendants in a similar complaint captioned Beidler v. Nuveen Asset Management, et al. filed in the Cook County Chancery Court on September 21, 2010 (collectively, the “Complaints”). The Complaints, filed on behalf of purported holders of each fund’s common shares, also name Nuveen Asset Management as a defendant, together with current and former Officers and interested Director/Trustees of each of the funds (together with the nominal defendants, collectively, the “Defendants”). The Complaints contain the same basic allegations contained in the demand letters. The suits seek a declaration that the Defendants have breached their fiduciary duties, an order directing the Defendants not to redeem any ARPS at their liquidation value using fund assets, indeterminate monetary damages in favor of the funds and an award of plaintiffs’ costs and disbursements in pursuing the action. Nuveen Asset Management believes that the Complaints are without merit, and intends to defend vigorously against these charges.
8 Nuveen Investments
As of September 30, 2010, the amounts of ARPS redeemed by NNP, NAN and NXK are as shown in the accompanying table.
| Fund | | | Auction Rate Preferred Shares | | | % of Original Auction Rate | |
| NNP | | $ | 124,300,000 | | | 100.0 | % |
| NAN | | $ | 47,100,000 | | | 68.3 | % |
| NXK | | $ | 47,000,000 | | | 100.0 | % |
MTP
During the current reporting period, NAN and NXK completed the issuance of $30 million and $37.89 million, respectively, of 2.70% and 2.55%, respectively, Series 2015 MTP. The net proceeds from these offerings were used to refinance each Fund’s outstanding ARPS at par. The newly-issued MTP shares trade on the New York Stock Exchange (NYSE) under the symbols “NAN Pr C” and “NXK Pr C”, respectively. MTP is a fixed-rate form of preferred stock with a mandatory redemption period, in this case, of five years. By issuing MTP, the Fund seeks to take advantage of the current historically low interest rate environment to lock in an attractive federally tax-exempt cost of leverage for a period as long as the term of the MTP. The Funds’ managers believe that issuing MTP may help each Fund mitigate the risk of a significant increase in their cost of leverage should short term interest rates rise sharply in the coming years.
Subsequent to the reporting period, NAN filed with the Securities and Exchange Commission (SEC) a registration statement seeking to register additional MTP. This registration statement declared effective by the SEC enables the Fund to issue to the public additional shares of MTP to refinance all or a portion of the Fund’s remaining ARPS. The issuance of additional MTP by the Fund is subject to market conditions. There is no assurance that MTP Shares will be issued.
VRDP
During the current reporting period, NNP issued $89 million of VRDP to redeem at par its remaining outstanding ARPS. As noted previously, VRDP is a newly-developed instrument that essentially replaces all or a portion of the ARPS used as leverage and potentially could be used to refinance all or a portion of the ARPS of other funds. VRDP shares include a liquidity feature that allows holders of VRDP to have their shares purchased by a liquidity provider in the event that sell orders have not been matched with purchase orders and successfully settled in a remarketing. VRDP is offered only to qualified institutional buyers, defined pursuant to Rule 144A under the Securities Act of 1933.
Refer to Notes to Financial Statements, Footnote 1 – General Information and Significant Accounting Policies and Footnote 4 – Fund Shares for further details on MTP and VRDP Shares.
As of September 30, 2010, 83 out of the 84 Nuveen closed-end municipal funds that had issued ARPS have redeemed at par all or a portion of these shares. These redemptions bring the total amount of Nuveen’s municipal closed-end funds’ ARPS redemptions to approximately $5.6 billion of the approximately $11.0 billion outstanding.
For up-to-date information, please visit the Nuveen CEF Auction Rate Preferred Resource Center at: http://www.nuveen.com/arps.
Nuveen Investments 9
Common Share Dividend and Share Price Information
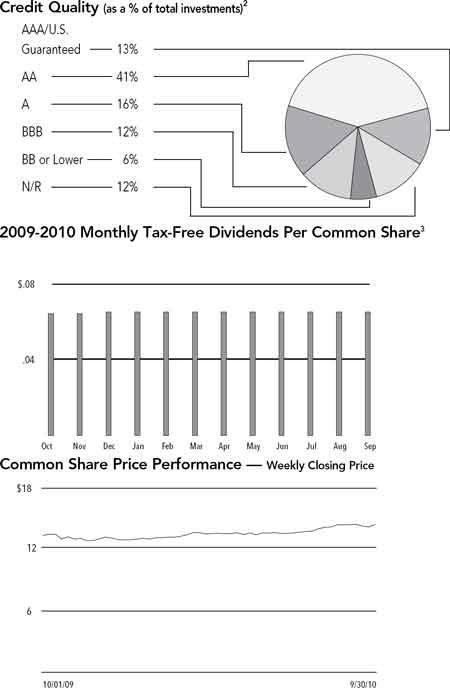
During the twelve-month reporting period ended September 30, 2010, NNP had two monthly dividend increases, while NAN and NXK each had one monthly dividend increase. The dividends of NNY and NYV remained stable throughout the period.
Due to normal portfolio activity, common shareholders of the following Funds received capital gains and/or net ordinary income distributions at the end of December 2009 as follows:
| Fund | | | Long-Term Capital Gains (per share | ) | | Short-Term Capital Gains and/or Ordinary Income (per share | ) |
| NNY | | $ | 0.0173 | | $ | 0.0050 | |
| NNP | | $ | 0.0154 | | | — | |
| NAN | | $ | 0.0431 | | | — | |
| NXK | | $ | 0.0076 | | $ | 0.0008 | |
All of the Funds in this report seek to pay stable dividends at rates that reflect each Fund’s past results and projected future performance. During certain periods, each Fund may pay dividends at a rate that may be more or less than the amount of net investment income actually earned by the Fund during the period. If a Fund has cumulatively earned more than it has paid in dividends, it holds the excess in reserve as undistributed net investment income (UNII) as part of the Fund’s NAV. Conversely, if a Fund has cumulatively paid dividends in excess of its earnings, the excess constitutes negative UNII that is likewise reflected in the Fund’s NAV. Each Fund will, over time, pay all of its net investment income as dividends to shareholders. As of September 30, 2010, all of the Funds in this report except NYV had positive UNII balanc es for financial reporting purposes and tax purposes. NYV had a negative UNII balance for financial reporting purposes and a positive balance for tax purposes.
COMMON SHARE REPURCHASES AND SHARE PRICE INFORMATION
As of September 30, 2010, and since the inception of the Funds’ repurchase program, the Funds have cumulatively repurchased and retired their common shares as shown in the accompanying table.
| Fund | | | Common Shares Repurchased and Retired | | | % of Outstanding Common Shares | |
| NNY | | | — | | | — | |
| NYV | | | — | | | — | |
| NNP | | | 27,800 | | | 0.2 | % |
| NAN | | | — | | | — | |
| NXK | | | 7,200 | | | 0.1 | % |
10 Nuveen Investments
The Funds did not repurchase and retire any of their outstanding common shares during the twelve-month reporting period.
As of September 30, 2010, the Funds’ common share prices were trading at (-) discounts to their common share NAVs as shown in the accompanying table.
| | | | 9/30/10 | | | 12-Month Average | |
| Fund | | | (-) Discount | | | (-) Discount | |
| NNY | | | -1.40 | % | | -1.19 | % |
| NYV | | | -4.47 | % | | -5.29 | % |
| NNP | | | -3.30 | % | | -6.56 | % |
| NAN | | | -4.88 | % | | -7.95 | % |
| NXK | | | -5.02 | % | | -7.64 | % |
Nuveen Investments 11
| | Nuveen New YorkMunicipal ValueFund, Inc. |
| | | as of September 30, 2010 |
| Fund Snapshot | | | | |
| Common Share Price | | $ | 9.88 | |
| Common Share Net Asset Value (NAV) | | $ | 10.02 | |
| Premium/(Discount) to NAV | | | -1.40 | % |
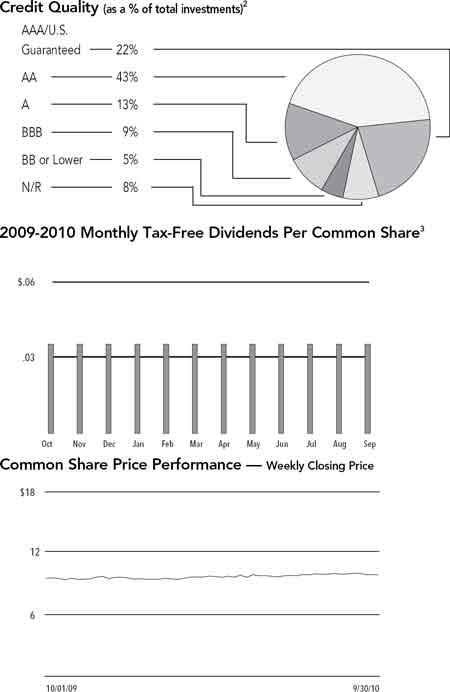
| Market Yield | | | 4.31 | % |
Taxable-Equivalent Yield1 | | | 6.42 | % |
| Net Assets Applicable to Common Shares ($000) | | $ | 152,031 | |
| Average Effective Maturity on Securities (Years) | | | 16.33 | |
| Modified Duration | | | 4.56 | |
| Average Annual Total Return | | | | | | | |
| (Inception 10/07/87) | | | | | | | |
| | | | On Share Price | | | On NAV | |
| 1-Year | | | 8.78 | % | | 5.82 | % |
| 5-Year | | | 6.28 | % | | 4.64 | % |
| 10-Year | | | 6.30 | % | | 5.31 | % |
Portfolio Composition2 | | | | |
| (as a % of total investments) | | | | |
| Tax Obligation/Limited | | | 23.1 | % |
| Education and Civic Organizations | | | 11.8 | % |
| Health Care | | | 11.7 | % |
| Transportation | | | 10.2 | % |
| Tax Obligation/General | | | 9.9 | % |
| Utilities | | | 7.0 | % |
| Housing/Multifamily | | | 6.2 | % |
| Long-Term Care | | | 5.3 | % |
| Other | | | 14.8 | % |
| | Refer to the Glossary of Terms Used in this Report for further definition of the terms used within this Fund’s Performance Overview page. |
| 1 | Taxable-Equivalent Yield represents the yield that must be earned on a fully taxable investment in order to equal the yield of the Fund on an after-tax basis. It is based on a combined federal and state income tax rate of 32.9%. When comparing this Fund to investments that generate qualified dividend income, the Taxable-Equivalent Yield is lower. |
| 2 | Holdings are subject to change. |
| 3 | The Fund paid shareholders capital gains and net ordinary income distributions in December 2009 of $0.0223 per share. |
12 Nuveen Investments
| NYV | | Nuveen New York |
| Performance | | Municipal Value |
| OVERVIEW | | Fund 2, Inc. |
| | | as of September 30, 2010 |
| Fund Snapshot | | | | |
| Common Share Price | | $ | 15.38 | |
| Common Share Net Asset Value (NAV) | | $ | 16.10 | |
| Premium/(Discount) to NAV | | | -4.47 | % |
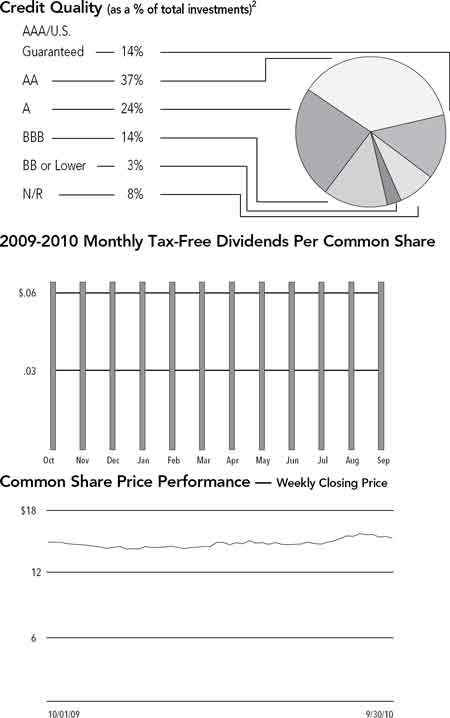
| Market Yield | | | 4.99 | % |
Taxable-Equivalent Yield1 | | | 7.44 | % |
| Net Assets Applicable to Common Shares ($000) | | $ | 37,796 | |
| Average Effective Maturity on Securities (Years) | | | 25.43 | |
| Modified Duration | | | 7.33 | |
| Cumulative Total Return | | | | | | | |
| (Inception 4/28/09) | | | | | | | |
| | | | On Share Price | | | On NAV | |
| 1-Year | | | 9.12 | % | | 6.26 | % |
| Since Inception | | | 6.85 | % | | 13.66 | % |
Portfolio Composition2 | | | | |
| (as a % of total investments) | | | | |
| Tax Obligation/Limited | | | 26.8 | % |
| Health Care | | | 20.7 | % |
| Education and Civic Organizations | | | 14.0 | % |
| Housing/Multifamily | | | 13.1 | % |
| Transportation | | | 10.3 | % |
| Tax Obligation/General | | | 5.9 | % |
| Other | | | 9.2 | % |
| | Refer to the Glossary of Terms Used in this Report for further definition of the terms used within this Fund’s Performance Overview page. |
| 1 | Taxable-Equivalent Yield represents the yield that must be earned on a fully taxable investment in order to equal the yield of the Fund on an after-tax basis. It is based on a combined federal and state income tax rate of 32.9%. When comparing this Fund to investments that generate qualified dividend income, the Taxable-Equivalent Yield is lower. |
| 2 | Holdings are subject to change. |
Nuveen Investments 13
| NNP | | Nuveen New York |
| Performance | | Performance Plus |
| | Municipal Fund, Inc. |
| | | as of September 30, 2010 |
| Fund Snapshot | | | | |
| Common Share Price | | $ | 15.52 | |
| Common Share Net Asset Value (NAV) | | $ | 16.05 | |
| Premium/(Discount) to NAV | | | -3.30 | % |
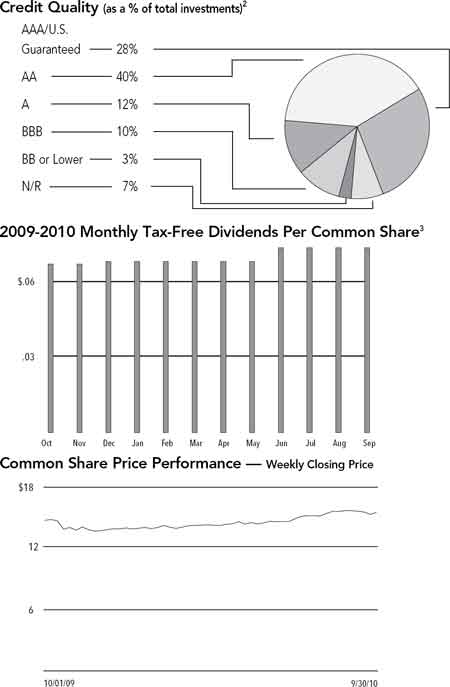
| Market Yield | | | 5.68 | % |
Taxable-Equivalent Yield1 | | | 8.46 | % |
| Net Assets Applicable to Common Shares ($000) | | $ | 241,450 | |
| Average Effective Maturity on Securities (Years) | | | 15.91 | |
| Leverage-Adjusted Duration | | | 7.06 | |
| Average Annual Total Return | | | | | | | |
| (Inception 11/15/89) | | | | | | | |
| | | | On Share Price | | | On NAV | |
| 1-Year | | | 11.39 | % | | 8.46 | % |
| 5-Year | | | 5.76 | % | | 5.54 | % |
| 10-Year | | | 7.75 | % | | 7.39 | % |
Portfolio Composition2 | | | | |
| (as a % of total investments) | | | | |
| Tax Obligation/Limited | | | 24.3 | % |
| Health Care | | | 13.1 | % |
| Education and Civic Organizations | | | 13.0 | % |
| U.S. Guaranteed | | | 9.0 | % |
| Transportation | | | 8.1 | % |
| Tax Obligation/General | | | 7.6 | % |
| Utilities | | | 6.2 | % |
| Water and Sewer | | | 5.0 | % |
| Housing/Multifamily | | | 5.0 | % |
| Other | | | 8.7 | % |
| | Refer to the Glossary of Terms Used in this Report for further definition of the terms used within this Fund’s Performance Overview page. |
| 1 | Taxable-Equivalent Yield represents the yield that must be earned on a fully taxable investment in order to equal the yield of the Fund on an after-tax basis. It is based on a combined federal and state income tax rate of 32.9%. When comparing this Fund to investments that generate qualified dividend income, the Taxable-Equivalent Yield is lower. |
| 2 | Holdings are subject to change. |
| 3 | The Fund paid shareholders a capital gains distribution in December 2009 of $0.0154 per share. |
14 Nuveen Investments
| NAN | | Nuveen New York |
| Performance | | Dividend Advantage |
| | Municipal Fund |
| | | as of September 30, 2010 |
| | | | | |
| Fund Snapshot | | | | |
| Common Share Price | | $ | 14.43 | |
| Common Share Net Asset Value (NAV) | | $ | 15.17 | |
| Premium/(Discount) to NAV | | | -4.88 | % |
| Market Yield | | | 5.45 | % |
Taxable-Equivalent Yield1 | | | 8.12 | % |
| Net Assets Applicable to Common Shares ($000) | | $ | 140,525 | |
| Average Effective Maturity on Securities (Years) | | | 17.83 | |
| Leverage-Adjusted Duration | | | 6.78 | |
| Average Annual Total Return | | | | | | | |
| (Inception 5/26/99) | | | | | | | |
| | | | On Share Price | | | On NAV | |
| 1-Year | | | 14.63 | % | | 8.28 | % |
| 5-Year | | | 4.15 | % | | 5.24 | % |
| 10-Year | | | 8.08 | % | | 7.45 | % |
Portfolio Composition2 | | | | |
| (as a % of total investments) | | | | |
| Tax Obligation/Limited | | | 22.7 | % |
| Health Care | | | 21.2 | % |
| Education and Civic Organizations | | | 12.3 | % |
| Transportation | | | 10.1 | % |
| Tax Obligation/General | | | 8.3 | % |
| Housing/Multifamily | | | 6.2 | % |
| Utilities | | | 4.5 | % |
| Other | | | 14.7 | % |
| | Refer to the Glossary of Terms Used in this Report for further definition of the terms used within this Fund’s Performance Overview page. |
| 1 | Taxable-Equivalent Yield represents the yield that must be earned on a fully taxable investment in order to equal the yield of the Fund on an after-tax basis. It is based on a combined federal and state income tax rate of 32.9%. When comparing this Fund to investments that generate qualified dividend income, the Taxable-Equivalent Yield is lower. |
| 2 | Holdings are subject to change. |
| 3 | The Fund paid shareholders a capital gains distribution in December 2009 of $0.0431 per share. |
Nuveen Investments 15
| NXK | | Nuveen New York |
| Performance | | Dividend Advantage |
| | Municipal Fund 2 |
| | | as of September 30, 2010 |
| Fund Snapshot | | | | |
| Common Share Price | | $ | 14.37 | |
| Common Share Net Asset Value (NAV) | | $ | 15.13 | |
| Premium/(Discount) to NAV | | | -5.02 | % |
| Market Yield | | | 5.55 | % |
Taxable-Equivalent Yield1 | | | 8.27 | % |
| Net Assets Applicable to Common Shares ($000) | | $ | 98,156 | |
| Average Effective Maturity on Securities (Years) | | | 16.50 | |
| Leverage-Adjusted Duration | | | 6.35 | |
| Average Annual Total Return | | | | | | | |
| (Inception 3/27/01) | | | | | | | |
| | | | On Share Price | | | On NAV | |
| 1-Year | | | 13.65 | % | | 8.27 | % |
| 5-Year | | | 5.14 | % | | 5.53 | % |
| Since Inception | | | 6.04 | % | | 6.82 | % |
Portfolio Composition2 | | | | |
| (as a % of total investments) | | | | |
| Tax Obligation/Limited | | | 22.6 | % |
| Health Care | | | 14.2 | % |
| Education and Civic Organizations | | | 14.0 | % |
| Transportation | | | 13.0 | % |
| Tax Obligation/General | | | 8.9 | % |
| Utilities | | | 7.5 | % |
| U.S. Guaranteed | | | 5.7 | % |
| Other | | | 14.1 | % |
| | Refer to the Glossary of Terms Used in this Report for further definition of the terms used within this Fund’s Performance Overview page. |
| 1 | Taxable-Equivalent Yield represents the yield that must be earned on a fully taxable investment in order to equal the yield of the Fund on an after-tax basis. It is based on a combined federal and state income tax rate of 32.9%. When comparing this Fund to investments that generate qualified dividend income, the Taxable-Equivalent Yield is lower. |
| 2 | Holdings are subject to change. |
| 3 | The Fund paid shareholders capital gains and net ordinary income distributions in December 2009 of $0.0084 per share. |
16 Nuveen Investments
Report of Independent
Registered Public Accounting Firm
The Board Directors/Trustees and Shareholders
Nuveen New York Municipal Value Fund, Inc.
Nuveen New York Municipal Value Fund 2
Nuveen New York Performance Plus Municipal Fund, Inc.
Nuveen New York Dividend Advantage Municipal Fund
Nuveen New York Dividend Advantage Municipal Fund 2
We have audited the accompanying statements of assets and liabilities, including the portfolios of investments, of Nuveen New York Municipal Value Fund, Inc., Nuveen New York Municipal Value Fund 2, Nuveen New York Performance Plus Municipal Fund, Inc., Nuveen New York Dividend Advantage Municipal Fund and Nuveen New York Dividend Advantage Municipal Fund 2 (the “Funds”), as of September 30, 2010, and the related statements of operations, changes in net assets, cash flows (Nuveen New York Performance Plus Municipal Fund, Inc., Nuveen New York Dividend Advantage Municipal Fund and Nuveen New York Dividend Advantage Municipal Fund 2 only) and the financial highlights for the each of the periods indicated therein. These financial statements and financial highlights are the responsibility of the Funds’ management. Our responsibility i s to express an opinion on these financial statements and financial highlights based on our audits.
We conducted our audits in accordance with the standards of the Public Company Accounting Oversight Board (United States). Those standards require that we plan and perform the audit to obtain reasonable assurance about whether the financial statements and financial highlights are free of material misstatement. We were not engaged to perform an audit of the Funds’ internal control over financial reporting. Our audits included consideration of internal control over financial reporting as a basis for designing audit procedures that are appropriate in the circumstances, but not for the purpose of expressing an opinion on the effectiveness of the Funds’ internal control over financial reporting. Accordingly, we express no such opinion. An audit also includes examining, on a test basis, evidence supporting the amounts and disclosures in the f inancial statements and financial highlights, assessing the accounting principles used and significant estimates made by management and evaluating the overall financial statement presentation. Our procedures included confirmation of securities owned as of September 30, 2010, by correspondence with the custodian. We believe that our audits provide a reasonable basis for our opinion.
In our opinion, the financial statements and financial highlights referred to above present fairly, in all material respects, the financial positions of Nuveen New York Municipal Value Fund, Inc., Nuveen New York Municipal Value Fund 2, Nuveen New York Performance Plus Municipal Fund, Inc., Nuveen New York Dividend Advantage Municipal Fund and Nuveen New York Dividend Advantage Municipal Fund 2 at September 30, 2010, the results of their operations, changes in their net assets, their cash flows (Nuveen New York Performance Plus Municipal Fund, Inc., Nuveen New York Dividend Advantage Municipal Fund and Nuveen New York Dividend Advantage Municipal Fund 2 only) and the financial highlights for each of the periods indicated therein in conformity with U.S. generally accepted accounting principles.
Chicago, Illinois
November 24, 2010
Nuveen Investments 17
| | | Nuveen New York Municipal Value Fund, Inc. |
| NNY | | Portfolio of Investments |
| | | September 30, 2010 |
| | Principal | | | Optional Call | | | | |
| | Amount (000) | | Description (1) | Provisions (2) | Ratings (3) | | Value | |
| | | | Consumer Discretionary – 1.2% (1.2% of Total Investments) | | | | | |
| $ | 275 | | New York City Industrial Development Agency, New York, Liberty Revenue Bonds, IAC/InterActiveCorp, Series 2005, 5.000%, 9/01/35 | 9/15 at 100.00 | BB+ | $ | 256,490 | |
| | 1,950 | | Seneca Nation of Indians Capital Improvements Authority, New York, Special Obligation Bonds, Series 2007A, 5.000%, 12/01/23 | 6/17 at 100.00 | BB | | 1,625,930 | |
| | 2,225 | | Total Consumer Discretionary | | | | 1,882,420 | |
| | | | Consumer Staples – 2.2% (2.2% of Total Investments) | | | | | |
| | 195 | | New York Counties Tobacco Trust II, Tobacco Settlement Pass-Through Bonds, Series 2001, 5.250%, 6/01/25 | 6/11 at 101.00 | BBB | | 186,153 | |
| | 1,500 | | New York Counties Tobacco Trust III, Tobacco Settlement Pass-Through Bonds, Series 2003, 5.750%, 6/01/33 | 6/13 at 100.00 | BBB | | 1,448,325 | |
| | 375 | | Puerto Rico, The Children’s Trust Fund, Tobacco Settlement Asset-Backed Refunding Bonds, Series 2002, 5.375%, 5/15/33 | 5/12 at 100.00 | BBB | | 375,638 | |
| | 140 | | Rensselaer Tobacco Asset Securitization Corporation, New York, Tobacco Settlement Asset-Backed Bonds, Series 2001A, 5.200%, 6/01/25 | 6/12 at 100.00 | BBB | | 132,959 | |
| | | | TSASC Inc., New York, Tobacco Asset-Backed Bonds, Series 2006: | | | | | |
| | 865 | | 4.750%, 6/01/22 | 6/16 at 100.00 | BBB | | 868,832 | |
| | 345 | | 5.000%, 6/01/26 | 6/16 at 100.00 | BBB | | 328,788 | |
| | 3,420 | | Total Consumer Staples | | | | 3,340,695 | |
| | | | Education and Civic Organizations – 11.7% (11.8% of Total Investments) | | | | | |
| | 275 | | Albany Industrial Development Agency, New York, Revenue Bonds, Albany Law School, Series 2007A, 5.000%, 7/01/31 | 7/17 at 100.00 | BBB | | 279,549 | |
| | 115 | | Albany Industrial Development Agency, New York, Revenue Bonds, Brighter Choice Charter Schools, Series 2007A, 5.000%, 4/01/37 | 4/17 at 100.00 | N/R | | 104,207 | |
| | 1,350 | | Brooklyn Arena Local Development Corporation, New York, Payment in Lieu of Taxes Revenue Bonds, Barclays Center Project, Series 2009, 6.250%, 7/15/40 | No Opt. Call | BBB– | | 1,471,973 | |
| | 90 | | Cattaraugus County Industrial Development Agency, New York, Revenue Bonds, St. Bonaventure University, Series 2006, 5.000%, 5/01/23 | 5/16 at 100.00 | BBB– | | 90,606 | |
| | 1,175 | | Dormitory Authority of the State of New York, General Revenue Bonds, Manhattan College, Series 2007A, 5.000%, 7/01/41 – RAAI Insured | 7/17 at 100.00 | N/R | | 1,175,576 | |
| | 1,000 | | Dormitory Authority of the State of New York, Housing Revenue Bonds, Fashion Institute of Technology, Series 2007, 5.250%, 7/01/34 – FGIC Insured | No Opt. Call | A | | 1,028,110 | |
| | 800 | | Dormitory Authority of the State of New York, Insured Revenue Bonds, D’Youville College, Series 2001, 5.250%, 7/01/20 – RAAI Insured | 7/11 at 102.00 | N/R | | 822,640 | |
| | 505 | | Dormitory Authority of the State of New York, Lease Revenue Bonds, State University Dormitory Facilities, Series 2004A, 5.000%, 7/01/29 – NPFG Insured | 7/15 at 100.00 | Aa2 | | 539,017 | |
| | 280 | | Dormitory Authority of the State of New York, Revenue Bonds, St. Joseph’s College, Series 2010, 5.250%, 7/01/35 | 7/20 at 100.00 | Baa1 | | 289,920 | |
| | | | Dormitory Authority of the State of New York, Second General Resolution Consolidated Revenue Bonds, City University System, Series 1993A: | | | | | |
| | 1,000 | | 5.750%, 7/01/18 | No Opt. Call | AA– | | 1,173,580 | |
| | 1,400 | | 6.000%, 7/01/20 | No Opt. Call | AA– | | 1,696,534 | |
| | 575 | | Dutchess County Industrial Development Agency, New York, Civic Facility Revenue Bonds, Bard College Project, Series 2007-A2, 4.500%, 8/01/36 | 8/17 at 100.00 | Baa1 | | 530,386 | |
| | 265 | | Hempstead Town Industrial Development Agency, New York, Revenue Bonds, Adelphi University, Civic Facility Project, Series 2005, 5.000%, 10/01/35 | 10/15 at 100.00 | A | | 271,951 | |
| | 880 | | Hempstead Town Local Development Corporation, New York, Revenue Bonds, Molloy College Project, Series 2009, 5.750%, 7/01/39 | 7/19 at 100.00 | BBB+ | | 944,302 | |
| | 245 | | New York City Industrial Development Agency, New York, Civic Facility Revenue Bonds, St. Francis College, Series 2004, 5.000%, 10/01/34 | 10/14 at 100.00 | A– | | 245,880 | |
| | Principal | | | Optional Call | | | | |
| | Amount (000) | | Description (1) | Provisions (2) | Ratings (3) | | Value | |
| | | | Education and Civic Organizations (continued) | | | | | |
| $ | 1,100 | �� | New York City Industrial Development Agency, New York, Civic Facility Revenue Bonds, YMCA of Greater New York, Series 2002, 5.250%, 8/01/21 | 2/11 at 100.00 | A– | $ | 1,105,104 | |
| | | | New York City Industrial Development Agency, New York, PILOT Revenue Bonds, Queens Baseball Stadium Project, Series 2006: | | | | | |
| | 1,500 | | 5.000%, 1/01/39 – AMBAC Insured | 1/17 at 100.00 | BB+ | | 1,410,330 | |
| | 1,175 | | 4.750%, 1/01/42 – AMBAC Insured | 1/17 at 100.00 | BB+ | | 1,051,296 | |
| | 1,610 | | New York City Industrial Development Authority, New York, PILOT Revenue Bonds, Yankee Stadium Project, Series 2006, 4.500%, 3/01/39 – FGIC Insured | 9/16 at 100.00 | BBB– | | 1,491,263 | |
| | 1,500 | | New York Liberty Development Corporation, Second Priority Liberty Revenue Refunding Bonds, Bank of America Tower at One Bryant Park Project, Series 2010, 5.625%, 1/15/46 | 1/20 at 100.00 | AA | | 1,592,925 | |
| | 170 | | Seneca County Industrial Development Authority, New York, Revenue Bonds, New York Chiropractic College, Series 2007, 5.000%, 10/01/27 | 10/17 at 100.00 | BBB | | 174,544 | |
| | 300 | | Troy Capital Resource Corporation, New York, Revenue Bonds, Rensselaer Polytechnic Institute, Series 2010A, 5.125%, 9/01/40 | 9/20 at 100.00 | A | | 311,934 | |
| | 17,310 | | Total Education and Civic Organizations | | | | 17,801,627 | |
| | | | Financials – 1.2% (1.2% of Total Investments) | | | | | |
| | 400 | | Liberty Development Corporation, New York, Goldman Sachs Headquarter Revenue Bonds, Series 2005, 5.250%, 10/01/35 | No Opt. Call | A1 | | 424,356 | |
| | 1,305 | | Liberty Development Corporation, New York, Goldman Sachs Headquarters Revenue Bonds Series 2007, 5.500%, 10/01/37 | No Opt. Call | A1 | | 1,436,544 | |
| | 1,705 | | Total Financials | | | | 1,860,900 | |
| | | | Health Care – 11.6% (11.7% of Total Investments) | | | | | |
| | 490 | | Cattaraugus County Industrial Development Agency, New York, Revenue Bonds, Olean General Hospital, Series 1998A, 5.250%, 8/01/23 | 2/11 at 100.00 | A+ | | 490,539 | |
| | 1,005 | | Dormitory Authority of the State of New York, FHA-Insured Mortgage Revenue Bonds, Montefiore Hospital, Series 2004, 5.000%, 8/01/29 – FGIC Insured | 2/15 at 100.00 | A | | 1,050,697 | |
| | 1,020 | | Dormitory Authority of the State of New York, FHA-Insured Mortgage Revenue Bonds, New York Hospital Medical Center of Queens, Series 2007, 4.650%, 8/15/27 | 2/17 at 100.00 | N/R | | 1,062,891 | |
| | 700 | | Dormitory Authority of the State of New York, FHA-Insured Revenue Bonds, Montefiore Medical Center, Series 2005, 5.000%, 2/01/22 – FGIC Insured | 2/15 at 100.00 | A | | 737,688 | |
| | 1,800 | | Dormitory Authority of the State of New York, FHA-Insured Revenue Bonds, St. Lukes Roosevelt Hospital, Series 2005, 4.900%, 8/15/31 | 8/15 at 100.00 | N/R | | 1,845,684 | |
| | 350 | | Dormitory Authority of the State of New York, Highland Hospital of Rochester Revenue Bonds, Series 2010, 5.000%, 7/01/26 | 7/20 at 100.00 | A2 | | 367,759 | |
| | 1,250 | | Dormitory Authority of the State of New York, Revenue Bonds, Catholic Health Services of Long Island Obligated Group – St. Catherine of Siena Medical Center, Series 2000A, 6.500%, 7/01/20 | 1/11 at 101.00 | A3 | | 1,265,263 | |
| | 2,350 | | Dormitory Authority of the State of New York, Revenue Bonds, Memorial Sloan Kettering Cancer Center, Series 2006-1, 5.000%, 7/01/35 | 7/16 at 100.00 | AA | | 2,455,421 | |
| | 1,550 | | Dormitory Authority of the State of New York, Revenue Bonds, New York and Presbyterian Hospital, Series 2004A, 5.250%, 8/15/15 – AGM Insured | 8/14 at 100.00 | AAA | | 1,722,996 | |
| | 500 | | Dormitory Authority of the State of New York, Revenue Bonds, South Nassau Communities Hospital, Series 2003B, 5.500%, 7/01/23 | 7/13 at 100.00 | Baa1 | | 514,665 | |
| | 500 | | Dormitory Authority of the State of New York, Revenue Bonds, Winthrop-South Nassau University Hospital Association, Series 2003A, 5.500%, 7/01/32 | 7/13 at 100.00 | Baa1 | | 505,290 | |
| | 290 | | Livingston County Industrial Development Agency, New York, Civic Facility Revenue Bonds, Nicholas H. Noyes Hospital, Series 2005, 6.000%, 7/01/30 | 1/11 at 100.00 | BB | | 278,316 | |
| | | | Madison County Industrial Development Agency, New York, Civic Facility Revenue Bonds, Oneida Health System, Series 2007A: | | | | | |
| | 280 | | 5.250%, 2/01/27 | No Opt. Call | BBB– | | 264,424 | |
| | 260 | | 5.500%, 2/01/32 | No Opt. Call | BBB– | | 247,447 | |
| | 245 | | Nassau County Industrial Development Agency, New York, Revenue Refunding Bonds, North Shore Health System Obligated Group, Series 2001B, 5.875%, 11/01/11 | No Opt. Call | Baa1 | | 249,672 | |
Nuveen Investments 19
| | | Nuveen New York Municipal Value Fund, Inc. (continued) |
| NNY | | Portfolio of Investments September 30, 2010 |
| | Principal | | | Optional Call | | | | |
| | Amount (000) | | Description (1) | Provisions (2) | Ratings (3) | | Value | |
| | | | Health Care (continued) | | | | | |
| $ | 500 | | New York City Health and Hospitals Corporation, New York, Health System Revenue Bonds, Series 1999A, 5.125%, 2/15/14 – AMBAC Insured | 2/11 at 100.00 | Aa3 | $ | 501,470 | |
| | | | New York City Health and Hospitals Corporation, New York, Health System Revenue Bonds, Series 2003A: | | | | | |
| | 1,175 | | 5.250%, 2/15/21 – AMBAC Insured | 2/13 at 100.00 | Aa3 | | 1,261,128 | |
| | 1,000 | | 5.250%, 2/15/22 – AMBAC Insured | 2/13 at 100.00 | Aa3 | | 1,072,530 | |
| | 475 | | New York City Industrial Development Agency, New York, Civic Facility Revenue Bonds, Staten Island University Hospital, Series 2001B, 6.375%, 7/01/31 | 7/12 at 100.00 | Baa3 | | 480,225 | |
| | 235 | | New York City Industrial Development Agency, New York, Civic Facility Revenue Bonds, Staten Island University Hospital, Series 2002C, 6.450%, 7/01/32 | 7/12 at 101.00 | Baa3 | | 239,806 | |
| | 570 | | Newark-Wayne Community Hospital, New York, Hospital Revenue Refunding and Improvement Bonds, Series 1993A, 7.600%, 9/01/15 | 3/11 at 100.00 | N/R | | 570,279 | |
| | 500 | | Yonkers Industrial Development Agency, New York, Revenue Bonds, St. John’s Riverside Hospital, Series 2001A, 7.125%, 7/01/31 | 7/11 at 101.00 | B– | | 502,105 | |
| | 17,045 | | Total Health Care | | | | 17,686,295 | |
| | | | Housing/Multifamily – 6.2% (6.2% of Total Investments) | | | | | |
| | 380 | | East Syracuse Housing Authority, New York, FHA-Insured Section 8 Assisted Revenue Refunding Bonds, Bennet Project, Series 2001A, 6.700%, 4/01/21 | 10/10 at 102.00 | AAA | | 388,383 | |
| | 1,690 | | New York City Housing Development Corporation, New York, Capital Fund Program Revenue Bonds, Series 2005A, 5.000%, 7/01/25 – FGIC Insured | 7/15 at 100.00 | AA+ | | 1,806,509 | |
| | | | New York City Housing Development Corporation, New York, Multifamily Housing Revenue Bonds, Series 2001A: | | | | | |
| | 1,000 | | 5.400%, 11/01/21 | 5/11 at 101.00 | AA | | 1,018,220 | |
| | 1,000 | | 5.500%, 11/01/31 | 5/11 at 101.00 | AA | | 1,015,250 | |
| | 1,000 | | 5.600%, 11/01/42 | 5/11 at 101.00 | AA | | 1,013,560 | |
| | 1,000 | | New York City Housing Development Corporation, New York, Multifamily Housing Revenue Bonds, Series 2009C-1, 5.500%, 11/01/34 | 5/19 at 100.00 | AA | | 1,054,860 | |
| | 1,250 | | New York City Housing Development Corporation, New York, Multifamily Housing Revenue Bonds, Series 2009M, 5.150%, 11/01/45 | 5/19 at 100.00 | AA | | 1,283,975 | |
| | 440 | | New York State Housing Finance Agency, Secured Mortgage Program Multifamily Housing Revenue Bonds, Series 2001E, 5.600%, 8/15/20 (Alternative Minimum Tax) | 8/11 at 100.00 | Aa1 | | 445,707 | |
| | 1,275 | | Westchester County Industrial Development Agency, New York, GNMA Collateralized Mortgage Loan Revenue Bonds, Living Independently for the Elderly Inc., Series 2001A, 5.375%, 8/20/21 | 8/11 at 102.00 | Aaa | | 1,324,853 | |
| | 9,035 | | Total Housing/Multifamily | | | | 9,351,317 | |
| | | | Housing/Single Family – 3.9% (3.9% of Total Investments) | | | | | |
| | 950 | | New York State Mortgage Agency, Homeowner Mortgage Revenue Bonds, Series 130, 4.650%, 4/01/27 (Alternative Minimum Tax) | 4/15 at 100.00 | Aa1 | | 951,150 | |
| | 370 | | New York State Mortgage Agency, Homeowner Mortgage Revenue Bonds, Series 148, 2007, 5.200%, 10/01/32 (Alternative Minimum Tax) | 10/17 at 100.00 | Aa1 | | 380,708 | |
| | 3,750 | | New York State Mortgage Agency, Homeowner Mortgage Revenue Bonds, Series 73A, 5.250%, 10/01/17 (Alternative Minimum Tax) | 3/11 at 100.00 | Aa1 | | 3,754,463 | |
| | 840 | | New York State Mortgage Agency, Mortgage Revenue Bonds, Thirty-Third Series A, 4.750%, 4/01/23 (Alternative Minimum Tax) | 4/13 at 101.00 | Aaa | | 857,396 | |
| | 5,910 | | Total Housing/Single Family | | | | 5,943,717 | |
| | | | Long-Term Care – 5.2% (5.3% of Total Investments) | | | | | |
| | 930 | | Dormitory Authority of the State of New York, FHA-Insured Mortgage Nursing Home Revenue Bonds, Eger Healthcare Center of Staten Island, Series 1998, 5.100%, 2/01/28 | 2/11 at 100.00 | AAA | | 944,071 | |
| | 2,250 | | Dormitory Authority of the State of New York, FHA-Insured Mortgage Nursing Home Revenue Bonds, Rosalind and Joseph Gurwin Jewish Geriatric Center of Long Island, Series 1997, 5.700%, 2/01/37 – AMBAC Insured | 2/11 at 100.00 | N/R | | 2,251,328 | |
| | Principal | | | Optional Call | | | | |
| | Amount (000) | | Description (1) | Provisions (2) | Ratings (3) | | Value | |
| | | | Long-Term Care (continued) | | | | | |
| $ | 2,000 | | Dormitory Authority of the State of New York, FHA-Insured Mortgage Revenue Bonds, W.K. Nursing Home Corporation, Series 1996, 6.125%, 2/01/36 | 2/11 at 100.00 | AAA | $ | 2,002,300 | |
| | 450 | | Dormitory Authority of the State of New York, GNMA Collateralized Revenue Bonds, Cabrini of Westchester Project, Series 2006, 5.200%, 2/15/41 | 2/17 at 103.00 | A– | | 467,465 | |
| | 270 | | Dormitory Authority of the State of New York, Non-State Supported Debt, Ozanam Hall of Queens Nursing Home Revenue Bonds, Series 2006, 5.000%, 11/01/31 | 11/16 at 100.00 | A1 | | 273,308 | |
| | 135 | | Dormitory Authority of the State of New York, Revenue Bonds, Providence Rest, Series 2005, 5.000%, 7/01/35 – ACA Insured | 7/15 at 100.00 | N/R | | 92,489 | |
| | 205 | | New York City Industrial Development Agency, New York, Civic Facility Revenue Bonds, Special Needs Facilities Pooled Program, Series 2000, 8.125%, 7/01/19 | 7/11 at 101.00 | N/R | | 209,420 | |
| | 530 | | New York City Industrial Development Agency, New York, Civic Facility Revenue Bonds, Special Needs Facilities Pooled Program, Series 2001A-1, 7.250%, 7/01/16 | 7/11 at 101.00 | N/R | | 539,609 | |
| | 820 | | New York City Industrial Development Agency, New York, Civic Facility Revenue Bonds, Special Needs Facilities Pooled Program, Series 2008A-1, 5.500%, 7/01/18 | 7/16 at 101.00 | N/R | | 769,349 | |
| | 235 | | Suffolk County Industrial Development Agency, New York, Civic Facility Revenue Bonds, Special Needs Facilities Pooled Program, Series 2008-B1, 5.800%, 7/01/23 | 7/16 at 101.00 | N/R | | 217,140 | |
| | 225 | | Yonkers Industrial Development Agency, New York, Civic Facilities Revenue Bonds, Special Needs Facilities Pooled Program Bonds, Series 2008-C1, 5.800%, 7/01/23 | 7/16 at 101.00 | N/R | | 207,900 | |
| | 8,050 | | Total Long-Term Care | | | | 7,974,379 | |
| | | | Materials – 0.2% (0.2% of Total Investments) | | | | | |
| | 240 | | Jefferson County Industrial Development Agency, New York, Solid Waste Disposal Revenue Bonds, International Paper Company Project, Series 2003A, 5.200%, 12/01/20 (Alternative Minimum Tax) | 12/13 at 100.00 | BBB | | 241,932 | |
| | | | Tax Obligation/General – 9.8% (9.9% of Total Investments) | | | | | |
| | 4,760 | | New York City, New York, General Obligation Bonds, Fiscal 2008 Series D, 5.125%, 12/01/25 | 12/17 at 100.00 | AA | | 5,334,580 | |
| | 2,000 | | New York City, New York, General Obligation Bonds, Fiscal 2010 Series C, 5.000%, 8/01/23 | 8/19 at 100.00 | AA | | 2,285,360 | |
| | 750 | | New York City, New York, General Obligation Bonds, Fiscal Series 2004C, 5.250%, 8/15/16 | 8/14 at 100.00 | AA | | 851,385 | |
| | 1,000 | | New York City, New York, General Obligation Bonds, Fiscal Series 2004E, 5.000%, 11/01/19 – AGM Insured | 11/14 at 100.00 | AAA | | 1,126,340 | |
| | 2,000 | | New York City, New York, General Obligation Bonds, Fiscal Series 2005F-1, 5.000%, 9/01/19 – SYNCORA GTY Insured | 9/15 at 100.00 | AA | | 2,270,700 | |
| | 2,795 | | New York City, New York, General Obligation Bonds, Fiscal Series 2007A, 5.000%, 8/01/25 | 8/16 at 100.00 | AA | | 3,093,534 | |
| | 13,305 | | Total Tax Obligation/General | | | | 14,961,899 | |
| | | | Tax Obligation/Limited – 23.0% (23.1% of Total Investments) | | | | | |
| | 1,000 | | Battery Park City Authority, New York, Senior Revenue Bonds, Series 2003A, 5.250%, 11/01/21 | 11/13 at 100.00 | AAA | | 1,112,990 | |
| | 395 | | Dormitory Authority of the State of New York, Department of Health Revenue Bonds, Series 2005A, 5.250%, 7/01/24 – CIFG Insured | 7/15 at 100.00 | AA– | | 427,339 | |
| | 275 | | Dormitory Authority of the State of New York, State Personal Income Tax Revenue Bonds, Series 2005F, 5.000%, 3/15/21 – AGM Insured | 3/15 at 100.00 | AAA | | 308,844 | |
| | 350 | | Erie County Industrial Development Agency, New York, School Facility Revenue Bonds, Buffalo City School District, Series 2004, 5.750%, 5/01/26 – AGM Insured | 5/14 at 100.00 | AAA | | 380,744 | |
| | | | Metropolitan Transportation Authority, New York, Dedicated Tax Fund Bonds, Series 2002A: | | | | | |
| | 2,000 | | 5.250%, 11/15/25 – AGM Insured | 11/12 at 100.00 | AAA | | 2,131,940 | |
| | 1,000 | | 5.000%, 11/15/30 | 11/12 at 100.00 | AA | | 1,058,630 | |
| | 1,500 | | Metropolitan Transportation Authority, New York, Dedicated Tax Fund Bonds, Series 2009B, 5.000%, 11/15/34 | 11/19 at 100.00 | AA | | 1,617,240 | |
| | 1,000 | | Metropolitan Transportation Authority, New York, State Service Contract Refunding Bonds, Series 2002A, 5.125%, 1/01/29 | 7/12 at 100.00 | AA– | | 1,050,250 | |
| | 560 | | Monroe Newpower Corporation, New York, Power Facilities Revenue Bonds, Series 2003, 5.500%, 1/01/34 | 1/13 at 102.00 | BBB | | 547,165 | |
Nuveen Investments 21
| | | Nuveen New York Municipal Value Fund, Inc. (continued) |
| NNY | | Portfolio of Investments September 30, 2010 |
| | Principal | | | Optional Call | | | | |
| | Amount (000) | | Description (1) | Provisions (2) | Ratings (3) | | Value | |
| | | | Tax Obligation/Limited (continued) | | | | | |
| | | | New York City Sales Tax Asset Receivable Corporation, New York, Dedicated Revenue Bonds, Local Government Assistance Corporation, Series 2004A: | | | | | |
| $ | 740 | | 5.000%, 10/15/25 – NPFG Insured | 10/14 at 100.00 | AAA | $ | 819,491 | |
| | 550 | | 5.000%, 10/15/26 – NPFG Insured | 10/14 at 100.00 | AAA | | 603,625 | |
| | 1,890 | | 5.000%, 10/15/29 – AMBAC Insured | 10/14 at 100.00 | AAA | | 2,074,275 | |
| | 1,200 | | New York City Transitional Finance Authority, New York, Building Aid Revenue Bonds, Fiscal Series 2007S-2, 5.000%, 1/15/28 – FGIC Insured | 1/17 at 100.00 | AA– | | 1,284,348 | |
| | 1,500 | | New York City Transitional Finance Authority, New York, Building Aid Revenue Bonds, Fiscal Series 2009-S5, 5.250%, 1/15/39 | 1/19 at 100.00 | AA– | | 1,639,425 | |
| | 1,330 | | New York City Transitional Finance Authority, New York, Future Tax Secured Bonds, Fiscal Series 2003E, 5.000%, 2/01/23 – FGIC Insured | 2/13 at 100.00 | AAA | | 1,432,237 | |
| | 1,530 | | New York City Transitional Finance Authority, New York, Future Tax Secured Bonds, Fiscal Series 2007C-1, 5.000%, 11/01/27 | 11/17 at 100.00 | AAA | | 1,704,864 | |
| | 1,000 | | New York State Environmental Facilities Corporation, Infrastructure Revenue Bonds, Series 2003A, 5.000%, 3/15/21 | 3/14 at 100.00 | AA– | | 1,062,080 | |
| | 2,100 | | New York State Environmental Facilities Corporation, State Personal Income Tax Revenue Bonds, Series 2008A, 5.000%, 12/15/27 (UB) | 12/17 at 100.00 | AAA | | 2,327,974 | |
| | 840 | | New York State Housing Finance Agency, State Personal Income Tax Revenue Bonds, Economic Development and Housing, Series 2006A, 5.000%, 3/15/36 | 9/15 at 100.00 | AAA | | 881,857 | |
| | 1,000 | | New York State Thruway Authority, Highway and Bridge Trust Fund Bonds, Second General, Series 2005B, 5.000%, 4/01/21 – AMBAC Insured | 10/15 at 100.00 | AA | | 1,126,300 | |
| | 1,175 | | New York State Thruway Authority, Highway and Bridge Trust Fund Bonds, Series 2007, 5.000%, 4/01/27 | 10/17 at 100.00 | AA | | 1,289,363 | |
| | 2,450 | | New York State Thruway Authority, Highway and Bridge Trust Fund Bonds, Series 2005B, 5.500%, 4/01/20 – AMBAC Insured (UB) | No Opt. Call | AA | | 3,001,569 | |
| | 1,065 | | New York State Thruway Authority, State Personal Income Tax Revenue Bonds, Series 2002A, 5.125%, 3/15/21 | 3/12 at 100.00 | AAA | | 1,139,997 | |
| | | | New York State Tobacco Settlement Financing Corporation, Tobacco Settlement Asset-Backed and State Contingency Contract-Backed Bonds, Series 2003A-1: | | | | | |
| | 1,800 | | 5.250%, 6/01/20 – AMBAC Insured | 6/13 at 100.00 | AA– | | 1,955,106 | |
| | 2,000 | | 5.250%, 6/01/22 – AMBAC Insured | 6/13 at 100.00 | AA– | | 2,155,740 | |
| | 1,000 | | New York State Tobacco Settlement Financing Corporation, Tobacco Settlement Asset-Backed and State Contingency Contract-Backed Bonds, Series 2003B-1C, 5.500%, 6/01/21 | 6/13 at 100.00 | AA– | | 1,085,070 | |
| | 600 | | New York State Urban Development Corporation, Special Project Revenue Bonds, University Facilities Grants, Series 1995, 5.875%, 1/01/21 | No Opt. Call | AA– | | 743,166 | |
| | 31,850 | | Total Tax Obligation/Limited | | | | 34,961,629 | |
| | | | Transportation – 10.2% (10.2% of Total Investments) | | | | | |
| | 180 | | Albany Parking Authority, New York, Revenue Bonds, Series 2001A, 5.625%, 7/15/25 | 7/11 at 101.00 | BBB+ | | 183,571 | |
| | 2,500 | | Metropolitan Transportation Authority, New York, Transportation Revenue Bonds, Series 2007B, 5.000%, 11/15/33 | 11/17 at 100.00 | A | | 2,612,550 | |
| | 500 | | Metropolitan Transportation Authority, New York, Transportation Revenue Refunding Bonds, Series 2002A, 5.500%, 11/15/19 – AMBAC Insured | 11/12 at 100.00 | A | | 539,970 | |
| | 1,500 | | New York City Industrial Development Agency, New York, Civic Facility Revenue Bonds, Bronx Parking Development Company, LLC Project, Series 2007, 5.875%, 10/01/46 | 10/17 at 102.00 | N/R | | 1,006,890 | |
| | 1,100 | | New York City Industrial Development Agency, New York, Special Facilities Revenue Bonds, British Airways PLC, Series 1998, 5.250%, 12/01/32 (Alternative Minimum Tax) | 12/10 at 100.00 | BB– | | 888,613 | |
| | 1,000 | | New York City Industrial Development Agency, New York, Special Facilities Revenue Bonds, JFK Airport – American Airlines Inc., Series 2002B, 8.500%, 8/01/28 (Alternative Minimum Tax) | 8/12 at 101.00 | B– | | 1,038,970 | |
| | 700 | | New York City Industrial Development Agency, New York, Special Facilities Revenue Bonds, Terminal One Group JFK Project, Series 2005, 5.500%, 1/01/24 (Alternative Minimum Tax) | 1/16 at 100.00 | A3 | | 732,704 | |
| | 1,000 | | New York City Industrial Development Authority, New York, JetBlue, 5.125%, 5/15/30 (Alternative Minimum Tax) | 5/12 at 100.00 | B– | | 856,580 | |
| | Principal | | | Optional Call | | | | |
| | Amount (000) | | Description (1) | Provisions (2) | Ratings (3) | | Value | |
| | | | Transportation (continued) | | | | | |
| $ | 165 | | New York State Thruway Authority, General Revenue Bonds, Series 2005F, 5.000%, 1/01/30 – AMBAC Insured | 1/15 at 100.00 | A+ | $ | 172,402 | |
| | 400 | | New York State Thruway Authority, General Revenue Bonds, Series 2005G, 5.000%, 1/01/30 – AGM Insured | 7/15 at 100.00 | AAA | | 425,588 | |
| | 500 | | Niagara Frontier Airport Authority, New York, Airport Revenue Bonds, Buffalo Niagara International Airport, Series 1999A, 5.625%, 4/01/29 – NPFG Insured (Alternative Minimum Tax) | 10/10 at 100.50 | A | | 501,840 | |
| | | | Port Authority of New York and New Jersey, Consolidated Revenue Bonds, One Hundred Fortieth Series 2005: | | | | | |
| | 1,000 | | 5.000%, 12/01/28 – SYNCORA GTY Insured | 6/15 at 101.00 | Aa2 | | 1,083,130 | |
| | 435 | | 5.000%, 12/01/31 – SYNCORA GTY Insured | 6/15 at 101.00 | Aa2 | | 465,106 | |
| | 325 | | Port Authority of New York and New Jersey, Consolidated Revenue Bonds, One Hundred Forty Eighth Series 2007, Trust 2920, 17.154%, 8/15/32 – AGM Insured (IF) | 8/17 at 100.00 | AA+ | | 430,391 | |
| | 2,500 | | Triborough Bridge and Tunnel Authority, New York, General Purpose Revenue Refunding Bonds, Series 2002B, 5.000%, 11/15/21 | 11/12 at 100.00 | Aa2 | | 2,693,650 | |
| | | | Triborough Bridge and Tunnel Authority, New York, Subordinate Lien General Purpose Revenue Refunding Bonds, Series 2002E: | | | | | |
| | 780 | | 5.500%, 11/15/20 – NPFG Insured | No Opt. Call | Aa3 | | 962,668 | |
| | 800 | | 5.250%, 11/15/22 – NPFG Insured | 11/12 at 100.00 | Aa3 | | 858,488 | |
| | 15,385 | | Total Transportation | | | | 15,453,111 | |
| | | | U.S. Guaranteed – 4.4% (4.5% of Total Investments) (4) | | | | | |
| | 220 | | Albany Parking Authority, New York, Revenue Bonds, Series 2001A, 5.625%, 7/15/25 (Pre-refunded 7/15/11) | 7/11 at 101.00 | BBB+ (4) | | 231,587 | |
| | 2,255 | | Dormitory Authority of the State of New York, Judicial Facilities Lease Revenue Bonds, Suffolk County Issue, Series 1986, 7.375%, 7/01/16 (ETM) | No Opt. Call | AAA | | 2,686,359 | |
| | 25 | | Dormitory Authority of the State of New York, Suffolk County, Lease Revenue Bonds, Judicial Facilities, Series 1991A, 9.500%, 4/15/14 – FGIC Insured (ETM) | 10/10 at 105.06 | Baa1 (4) | | 31,652 | |
| | 960 | | Metropolitan Transportation Authority, New York, Commuter Facilities Revenue Bonds, Series 1997B, 5.000%, 7/01/20 – AMBAC Insured (ETM) | 12/10 at 100.00 | N/R (4) | | 963,082 | |
| | 555 | | New York State Thruway Authority, State Personal Income Tax Revenue Bonds, Series 2002A, 5.125%, 3/15/21 (Pre-refunded 3/15/12) | 3/12 at 100.00 | Aa3 (4) | | 591,552 | |
| | 1,000 | | Niagara Falls, Niagara County, New York, General Obligation Water Treatment Plant Bonds, Series 1994, 7.250%, 11/01/11 – NPFG Insured (Alternative Minimum Tax) (ETM) | No Opt. Call | A (4) | | 1,074,280 | |
| | 1,120 | | Yonkers Industrial Development Agency, New York, Revenue Bonds, Community Development Properties – Yonkers Inc. Project, Series 2001A, 6.625%, 2/01/26 (Pre-refunded 2/01/11) | 2/11 at 100.00 | Baa3 (4) | | 1,142,602 | |
| | 6,135 | | Total U.S. Guaranteed | | | | 6,721,114 | |
| | | | Utilities – 7.0% (7.0% of Total Investments) | | | | | |
| | 1,000 | | Chautauqua County Industrial Development Agency, New York, Exempt Facility Revenue Bonds, NRG Dunkirk Power Project, Series 2009, 5.875%, 4/01/42 | 2/20 at 100.00 | Baa3 | | 1,040,339 | |
| | | | Long Island Power Authority, New York, Electric System General Revenue Bonds, Series 2006A: | | | | | |
| | 1,500 | | 5.000%, 12/01/23 – FGIC Insured | 6/16 at 100.00 | A | | 1,635,089 | |
| | 1,500 | | 5.000%, 12/01/24 – FGIC Insured | 6/16 at 100.00 | A | | 1,628,383 | |
| | 250 | | Long Island Power Authority, New York, Electric System General Revenue Bonds, Series 2006B, 5.000%, 12/01/35 – CIFG Insured | 6/16 at 100.00 | A– | | 260,235 | |
| | 1,000 | | Nassau County Industrial Development Authority, New York, Keyspan Glenwood Energy Project, Series 2003, 5.250%, 6/01/27 (Alternative Minimum Tax) | 6/13 at 100.00 | A– | | 1,022,520 | |
| | 1,500 | | New York State Energy Research and Development Authority, Pollution Control Revenue Bonds, New York State Electric and Gas Corporation, Series 2005A, 4.100%, 3/15/15 – NPFG Insured | 3/11 at 100.00 | A | | 1,510,320 | |
| | 500 | | Niagara County Industrial Development Agency, New York, Solid Waste Disposal Facility Revenue Bonds, American Ref-Fuel Company of Niagara LP, Series 2001A, 5.450%, 11/15/26 (Mandatory put 11/15/12) (Alternative Minimum Tax) | 11/11 at 101.00 | Baa2 | | 517,080 | |
Nuveen Investments 23
| | | Nuveen New York Municipal Value Fund, Inc. (continued) |
| NNY | | Portfolio of Investments September 30, 2010 |
| | Principal | | | Optional Call | | | | |
| | Amount (000) | | Description (1) | Provisions (2) | Ratings (3) | | Value | |
| | | | Utilities (continued) | | | | | |
| $ | 250 | | Niagara County Industrial Development Agency, New York, Solid Waste Disposal Facility Revenue Bonds, American Ref-Fuel Company of Niagara LP, Series 2001C, 5.625%, 11/15/24 (Mandatory put 11/15/14) (Alternative Minimum Tax) | 11/11 at 101.00 | Baa2 | $ | 256,540 | |
| | 1,500 | | Power Authority of the State of New York, General Revenue Bonds, Series 2000A, 5.250%, 11/15/40 | 11/10 at 100.00 | Aa2 | | 1,502,370 | |
| | 25 | | Power Authority of the State of New York, General Revenue Bonds, Series 2006A, 5.000%, 11/15/19 – FGIC Insured | 11/15 at 100.00 | Aa2 | | 28,149 | |
| | | | Suffolk County Industrial Development Agency, New York, Revenue Bonds, Nissequogue Cogeneration Partners Facility, Series 1998: | | | | | |
| | 705 | | 5.300%, 1/01/13 (Alternative Minimum Tax) | 1/11 at 100.00 | N/R | | 691,401 | |
| | 575 | | 5.500%, 1/01/23 (Alternative Minimum Tax) | 1/11 at 100.00 | N/R | | 530,530 | |
| | 10,305 | | Total Utilities | | | | 10,622,956 | |
| | | | Water and Sewer – 1.6% (1.6% of Total Investments) | | | | | |
| | 1,500 | | New York City Municipal Water Finance Authority, New York, Water and Sewerage System Revenue Bonds, Fiscal Series 2001D, 5.500%, 6/15/17 | 6/11 at 101.00 | AAA | | 1,568,730 | |
| | 740 | | New York City Municipal Water Finance Authority, New York, Water and Sewerage System Revenue Bonds, Fiscal Series 2003A, 5.375%, 6/15/19 | 6/12 at 100.00 | AAA | | 797,039 | |
| | 2,240 | | Total Water and Sewer | | | | 2,365,769 | |
| $ | 144,160 | | Total Investments (cost $144,564,200) – 99.4% | | | | 151,169,760 | |
| | | | Floating Rate Obligations – (2.1)% | | | | (3,255,000 | ) |
| | | | Other Assets Less Liabilities – 2.7% | | | | 4,116,123 | |
| | | | Net Assets Applicable to Common Shares – 100% | | | $ | 152,030,883 | |
| (1) | | All percentages shown in the Portfolio of Investments are based on net assets applicable to Common shares unless otherwise noted. |
| (2) | | Optional Call Provisions (not covered by the report of independent registered public accounting firm): Dates (month and year) and prices of the earliest optional call or redemption. There may be other call provisions at varying prices at later dates. Certain mortgage-backed securities may be subject to periodic principal paydowns. |
| (3) | | Ratings (not covered by the report of independent registered public accounting firm): Using the highest of Standard & Poor’s Group (“Standard & Poor’s”), Moody’s Investor Service, Inc. (“Moody’s”) or Fitch, Inc. (“Fitch”) rating. Ratings below BBB by Standard & Poor’s, Baa by Moody’s or BBB by Fitch are considered to be below investment grade. Holdings designated N/R are not rated by any of these national rating agencies. |
| (4) | | Backed by an escrow or trust containing sufficient U.S. Government or U.S. Government agency securities, which ensure the timely payment of principal and interest. Such investments are normally considered to be equivalent to AAA rated securities. |
| N/R | | Not rated. |
| (ETM) | | Escrowed to maturity. |
| (IF) | | Inverse floating rate investment. |
| (UB) | | Underlying bond of an inverse floating rate trust reflected as a financing transaction. See Notes to Financial Statements, Footnote 1 – General Information and Significant Accounting Policies, Inverse Floating Rate Securities for more information. |
See accompanying notes to financial statements.
| | | Nuveen New York Municipal Value Fund 2, Inc. |
| NYV | | Portfolio of Investments |
| | | September 30, 2010 |
| | Principal | | | Optional Call | | | | |
| | Amount (000) | | Description (1) | Provisions (2) | Ratings (3) | | Value | |
| | | | Consumer Staples – 3.5% (3.5% of Total Investments) | | | | | |
| $ | 1,350 | | District of Columbia Tobacco Settlement Corporation, Tobacco Settlement Asset-Backed Bonds, Series 2001, 6.500%, 5/15/33 | No Opt. Call | BBB | $ | 1,310,999 | |
| | | | Education and Civic Organizations – 13.8% (14.0% of Total Investments) | | | | | |
| | 1,200 | | Albany Industrial Development Agency, New York, Revenue Bonds, Brighter Choice Charter Schools, Series 2007A, 5.000%, 4/01/37 | 4/17 at 100.00 | N/R | | 1,087,380 | |
| | 1,000 | | Dormitory Authority of the State of New York, Lease Revenue Bonds, State University Dormitory Facilities, Series 2007, 5.000%, 7/01/37 | 7/17 at 100.00 | Aa2 | | 1,049,550 | |
| | 1,500 | | Dormitory Authority of the State of New York, Revenue Bonds, New York University, Series 2008A, 5.000%, 7/01/38 | 7/18 at 100.00 | AA– | | 1,595,445 | |
| | 5,095 | | New York City Industrial Development Agency, New York, Revenue Bonds, Yankee Stadium Project Pilot, Series 2009A, 0.000%, 3/01/40 – AGC Insured | No Opt. Call | AA+ | | 1,050,436 | |
| | 400 | | New York Liberty Development Corporation, Second Priority Liberty Revenue Refunding Bonds, Bank of America Tower at One Bryant Park Project, Series 2010, 5.625%, 1/15/46 | 1/20 at 100.00 | AA | | 424,780 | |
| | 9,195 | | Total Education and Civic Organizations | | | | 5,207,591 | |
| | | | Energy – 2.7% (2.8% of Total Investments) | | | | | |
| | 1,000 | | Virgin Islands Public Finance Authority, Revenue Bonds, Refinery Project – Hovensa LLC, Series 2003, 6.125%, 7/01/22 (Alternative Minimum Tax) | 1/14 at 100.00 | Baa3 | | 1,016,500 | |
| | | | Health Care – 20.3% (20.7% of Total Investments) | | | | | |
| | 500 | | Dormitory Authority of the State of New York, FHA-Insured Revenue Bonds, St. Lukes Roosevelt Hospital, Series 2005, 4.900%, 8/15/31 | 8/15 at 100.00 | N/R | | 512,690 | |
| | 50 | | Dormitory Authority of the State of New York, Highland Hospital of Rochester Revenue Bonds, Series 2010, 5.000%, 7/01/26 | 7/20 at 100.00 | A2 | | 52,537 | |
| | 1,000 | | Dormitory Authority of the State of New York, Insured Revenue Bonds, Franciscan Health Partnership Obligated Group – Frances Shervier Home and Hospital, Series 1997, 5.500%, 7/01/27 – RAAI Insured | 1/11 at 100.00 | A3 | | 1,000,230 | |
| | 1,500 | | Dormitory Authority of the State of New York, Revenue Bonds, North Shore Long Island Jewish Obligated Group, Series 2006B, 5.000%, 11/01/34 | 11/16 at 100.00 | A3 | | 1,531,470 | |
| | 1,500 | | Dormitory Authority of the State of New York, Revenue Bonds, North Shore Long Island Jewish Obligated Group, Series 2009A, 5.500%, 5/01/37 | 5/19 at 100.00 | A– | | 1,581,750 | |
| | 1,010 | | Dormitory Authority of the State of New York, Revenue Bonds, NYU Hospitals Center, Series 2007B, 5.625%, 7/01/37 | 7/17 at 100.00 | BBB | | 1,055,127 | |
| | 700 | | Hospital Authority of Delaware County, Indiana, Hospital Revenue Bonds, Cardinal Health System, Series 2006, 5.000%, 8/01/24 | 8/16 at 100.00 | Baa3 | | 681,548 | |
| | 725 | | Illinois Finance Authority, Revenue Bonds, OSF Healthcare System, Series 2007A, 5.750%, 11/15/37 | 11/17 at 100.00 | A | | 748,874 | |
| | 500 | | Wisconsin Health and Educational Facilities Authority, Revenue Bonds, ProHealth Care, Inc. Obligated Group, Series 2009, 6.625%, 2/15/32 | 2/14 at 100.00 | A+ | | 526,970 | |
| | 7,485 | | Total Health Care | | | | 7,691,196 | |
| | | | Housing/Multifamily – 12.8% (13.1% of Total Investments) | | | | | |
| | 1,500 | | New York City Housing Development Corporation, New York, FNMA Backed Progress of Peoples Development Multifamily Rental Housing Revenue Bonds, Series 2005B, 4.950%, 5/15/36 (Alternative Minimum Tax) | 11/15 at 100.00 | AAA | | 1,529,130 | |
| | 1,800 | | New York City Housing Development Corporation, New York, Multifamily Housing Revenue Bonds, Series 2004-H2, 5.125%, 11/01/34 (Alternative Minimum Tax) | 11/14 at 100.00 | AA | | 1,821,402 | |
| | 1,000 | | New York State Housing Finance Agency, Affordable Housing Revenue Bonds, Series 2009A, 5.250%, 11/01/41 | 5/19 at 100.00 | Aa2 | | 1,037,020 | |
| | 450 | | New York State Housing Finance Agency, Affordable Housing Revenue Bonds, Series 2009B, 4.500%, 11/01/29 | 5/19 at 100.00 | Aa2 | | 459,306 | |
| | 4,750 | | Total Housing/Multifamily | | | | 4,846,858 | |
Nuveen Investments 25
| | | Nuveen New York Municipal Value Fund 2, Inc. (continued) |
| NYV | | Portfolio of Investments September 30, 2010 |
| | Principal | | | Optional Call | | | | |
| | Amount (000) | | Description (1) | Provisions (2) | Ratings (3) | | Value | |
| | | | Tax Obligation/General – 5.8% (5.9% of Total Investments) | | | | | |
| $ | 1,500 | | New York City, New York, General Obligation Bonds, Fiscal 2009 Series J1, 5.000%, 5/15/36 | No Opt. Call | AA | $ | 1,610,145 | |
| | 500 | | New York City, New York, General Obligation Bonds, Fiscal 2010 Series C, 5.000%, 8/01/23 | 8/19 at 100.00 | AA | | 571,340 | |
| | 2,000 | | Total Tax Obligation/General | | | | 2,181,485 | |
| | | | Tax Obligation/Limited – 26.3% (26.8% of Total Investments) | | | | | |
| | 1,200 | | Dormitory Authority of the State of New York, State Personal Income Tax Revenue Bonds, Series 2009A, 5.000%, 3/15/38 | 3/19 at 100.00 | AAA | | 1,288,488 | |
| | 1,200 | | Guam Government, Limited Obligation Section 30 Revenue Bonds, Series 2009A, 5.750%, 12/01/34 | 12/19 at 100.00 | BBB– | | 1,263,648 | |
| | 1,710 | | Hudson Yards Infrastructure Corporation, New York, Revenue Bonds, Series 2006A, 5.000%, 2/15/47 | 2/17 at 100.00 | A | | 1,710,735 | |
| | 1,500 | | New York City Transitional Finance Authority, New York, Building Aid Revenue Bonds, Fiscal Series 2009-S5, 5.250%, 1/15/39 | 1/19 at 100.00 | AA– | | 1,639,425 | |
| | 2,000 | | New York State Urban Development Corporation, State Personal Income Tax Revenue Bonds, Tender Option Bond Trust 09-6W, 12.855%, 3/15/37 (IF) | 3/17 at 100.00 | AAA | | 2,368,220 | |
| | 1,500 | | Puerto Rico Sales Tax Financing Corporation, Sales Tax Revenue Bonds, First Subordinate Series 2009A, 6.000%, 8/01/42 | 8/19 at 100.00 | A+ | | 1,664,760 | |
| | 9,110 | | Total Tax Obligation/Limited | | | | 9,935,276 | |
| | | | Transportation – 10.1% (10.3% of Total Investments) | | | | | |
| | | | New York City Industrial Development Agency, New York, American Airlines-JFK International Airport Special Facility Revenue Bonds, Series 2005: | | | | | |
| | 500 | | 7.500%, 8/01/16 (Alternative Minimum Tax) | No Opt. Call | B– | | 525,630 | |
| | 500 | | 7.750%, 8/01/31 (Alternative Minimum Tax) | 8/16 at 101.00 | B– | | 530,090 | |
| | 2,000 | | New York City Industrial Development Agency, New York, Civic Facility Revenue Bonds, Bronx Parking Development Company, LLC Project, Series 2007, 5.750%, 10/01/37 | 10/17 at 100.00 | N/R | | 1,352,280 | |
| | 1,325 | | Triborough Bridge and Tunnel Authority, New York, General Purpose Revenue Bonds, Refunding Series 2008A, 5.000%, 11/15/33 | 5/18 at 100.00 | Aa2 | | 1,423,448 | |
| | 4,325 | | Total Transportation | | | | 3,831,448 | |
| | | | Water and Sewer – 2.9% (2.9% of Total Investments) | | | | | |
| | 1,000 | | New York City Municipal Water Finance Authority, New York, Water and Sewerage System Revenue Bonds, Second Generation Resolution, Series 2009FF, 5.000%, 6/15/40 | 6/19 at 100.00 | AA+ | | 1,078,590 | |
| $ | 40,215 | | Total Investments (cost $32,869,136) – 98.2% | | | | 37,099,943 | |
| | | | Other Assets Less Liabilities – 1.8% | | | | 695,800 | |
| | | | Net Assets Applicable to Common Shares – 100% | | | $ | 37,795,743 | |
| (1) | | All percentages shown in the Portfolio of Investments are based on net assets applicable to Common shares unless otherwise noted. |
| (2) | | Optional Call Provisions (not covered by the report of independent registered public accounting firm): Dates (month and year) and prices of the earliest optional call or redemption. There may be other call provisions at varying prices at later dates. Certain mortgage-backed securities may be subject to periodic principal paydowns. |
| (3) | | Ratings (not covered by the report of independent registered public accounting firm): Using the highest of Standard & Poor’s Group (“Standard & Poor’s”), Moody’s Investor Service, Inc. (“Moody’s”) or Fitch, Inc. (“Fitch”) rating. Ratings below BBB by Standard & Poor’s, Baa by Moody’s or BBB by Fitch are considered to be below investment grade. Holdings designated N/R are not rated by any of these national rating agencies. |
| N/R | | Not rated. |
| (IF) | | Inverse floating rate investment. |
See accompanying notes to financial statements.
| | | Nuveen New York Performance Plus Municipal Fund, Inc. |
| NNP | | Portfolio of Investments |
| | | September 30, 2010 |
| | Principal | | | Optional Call | | | | |
| | Amount (000) | | Description (1) | Provisions (2) | Ratings (3) | | Value | |
| | | | Consumer Discretionary – 0.3% (0.2% of Total Investments) | | | | | |
| $ | 685 | | New York City Industrial Development Agency, New York, Liberty Revenue Bonds, IAC/InterActiveCorp, Series 2005, 5.000%, 9/01/35 | 9/15 at 100.00 | BB+ | $ | 638,893 | |
| | | | Consumer Staples – 2.0% (1.4% of Total Investments) | | | | | |
| | 405 | | New York Counties Tobacco Trust II, Tobacco Settlement Pass-Through Bonds, Series 2001, 5.250%, 6/01/25 | 6/11 at 101.00 | BBB | | 386,625 | |
| | 1,000 | | New York Counties Tobacco Trust III, Tobacco Settlement Pass-Through Bonds, Series 2003, 5.750%, 6/01/33 | 6/13 at 100.00 | BBB | | 965,550 | |
| | 355 | | Rensselaer Tobacco Asset Securitization Corporation, New York, Tobacco Settlement Asset-Backed Bonds, Series 2001A, 5.200%, 6/01/25 | 6/12 at 100.00 | BBB | | 337,147 | |
| | | | TSASC Inc., New York, Tobacco Asset-Backed Bonds, Series 2006: | | | | | |
| | 2,295 | | 4.750%, 6/01/22 | 6/16 at 100.00 | BBB | | 2,305,167 | |
| | 930 | | 5.000%, 6/01/26 | 6/16 at 100.00 | BBB | | 886,299 | |
| | 4,985 | | Total Consumer Staples | | | | 4,880,788 | |
| | | | Education and Civic Organizations – 19.1% (13.0% of Total Investments) | | | | | |
| | 655 | | Albany Industrial Development Agency, New York, Revenue Bonds, Albany Law School, Series 2007A, 5.000%, 7/01/31 | 7/17 at 100.00 | BBB | | 665,834 | |
| | 275 | | Albany Industrial Development Agency, New York, Revenue Bonds, Brighter Choice Charter Schools, Series 2007A, 5.000%, 4/01/37 | 4/17 at 100.00 | N/R | | 249,191 | |
| | 1,285 | | Cattaraugus County Industrial Development Agency, New York, Revenue Bonds, St. Bonaventure University, Series 1998B, 5.000%, 9/15/13 | 3/11 at 100.00 | BBB– | | 1,286,850 | |
| | 90 | | Cattaraugus County Industrial Development Agency, New York, Revenue Bonds, St. Bonaventure University, Series 2006, 5.000%, 5/01/23 | 5/16 at 100.00 | BBB– | | 90,606 | |
| | 690 | | Dormitory Authority of the State of New York, Consolidated Revenue Bonds, City University System, Series 1993B, 6.000%, 7/01/14 – AGM Insured | No Opt. Call | AAA | | 754,163 | |
| | 2,815 | | Dormitory Authority of the State of New York, General Revenue Bonds, Manhattan College, Series 2007A, 5.000%, 7/01/41 – RAAI Insured | 7/17 at 100.00 | N/R | | 2,816,379 | |
| | 2,120 | | Dormitory Authority of the State of New York, General Revenue Bonds, New York University, Series 2001-1, 5.500%, 7/01/20 – AMBAC Insured | No Opt. Call | AA– | | 2,587,248 | |
| | 1,000 | | Dormitory Authority of the State of New York, Housing Revenue Bonds, Fashion Institute of Technology, Series 2007, 5.250%, 7/01/29 – FGIC Insured | No Opt. Call | A | | 1,069,920 | |
| | 1,215 | | Dormitory Authority of the State of New York, Lease Revenue Bonds, State University Dormitory Facilities, Series 2004A, 5.000%, 7/01/29 – NPFG Insured | 7/15 at 100.00 | Aa2 | | 1,296,842 | |
| | 230 | | Dormitory Authority of the State of New York, Revenue Bonds, Fashion Institute of Technology, Series 2000, 5.375%, 7/01/20 – AGM Insured | 7/12 at 100.00 | AAA | | 233,149 | |
| | 2,100 | | Dormitory Authority of the State of New York, Revenue Bonds, Marymount Manhattan College, Series 2009, 5.250%, 7/01/29 | 7/19 at 100.00 | Baa2 | | 2,178,120 | |
| | 5,000 | | Dormitory Authority of the State of New York, Revenue Bonds, New York University, Series 2007, 5.000%, 7/01/32 – AMBAC Insured | 7/17 at 100.00 | AA– | | 5,340,300 | |
| | 640 | | Dormitory Authority of the State of New York, Revenue Bonds, St. Joseph’s College, Series 2010, 5.250%, 7/01/35 | 7/20 at 100.00 | Baa1 | | 662,675 | |
| | 2,500 | | Dormitory Authority of the State of New York, Revenue Bonds, State University Educational Facilities, Series 1993A, 5.875%, 5/15/17 | No Opt. Call | AA– | | 2,987,175 | |
| | 1,850 | | Dutchess County Industrial Development Agency, New York, Civic Facility Revenue Bonds, Bard College Project, Series 2007-A2, 4.500%, 8/01/36 | 8/17 at 100.00 | Baa1 | | 1,706,459 | |
| | 635 | | Hempstead Town Industrial Development Agency, New York, Revenue Bonds, Adelphi University, Civic Facility Project, Series 2005, 5.000%, 10/01/35 | 10/15 at 100.00 | A | | 651,656 | |
| | 1,885 | | Hempstead Town Local Development Corporation, New York, Revenue Bonds, Molloy College Project, Series 2009, 5.750%, 7/01/39 | 7/19 at 100.00 | BBB+ | | 2,022,737 | |
| | 1,260 | | Madison County Capital Resource Corporation, New York, Revenue Bonds, Colgate University Project, Series 2010A, 5.000%, 7/01/40 | 7/20 at 100.00 | AA– | | 1,359,263 | |
| | | | Monroe County Industrial Development Agency, New York, Civic Facility Revenue Bonds, St. John Fisher College, Series 1999: | | | | | |
| | 1,000 | | 5.375%, 6/01/17 – RAAI Insured | 12/10 at 101.00 | N/R | | 1,010,990 | |
| | 2,365 | | 5.375%, 6/01/24 – RAAI Insured | 12/10 at 101.00 | N/R | | 2,376,470 | |
Nuveen Investments 27
| | | Nuveen New York Performance Plus Municipal Fund, Inc. (continued) |
| NNP | | Portfolio of Investments September 30, 2010 |
| | Principal | | | Optional Call | | | | |
| | Amount (000) | | Description (1) | Provisions (2) | Ratings (3) | | Value | |
| | | | Education and Civic Organizations (continued) | | | | | |
| $ | 580 | | New York City Industrial Development Agency, New York, Civic Facility Revenue Bonds, St. Francis College, Series 2004, 5.000%, 10/01/34 | 10/14 at 100.00 | A– | $ | 582,082 | |
| | 850 | | New York City Industrial Development Agency, New York, Civic Facility Revenue Bonds, YMCA of Greater New York, Series 2002, 5.250%, 8/01/21 | 2/11 at 100.00 | A– | | 853,944 | |
| | | | New York City Industrial Development Agency, New York, PILOT Revenue Bonds, Queens Baseball Stadium Project, Series 2006: | | | | | |
| | 2,000 | | 5.000%, 1/01/39 – AMBAC Insured | 1/17 at 100.00 | BB+ | | 1,880,440 | |
| | 2,300 | | 4.750%, 1/01/42 – AMBAC Insured | 1/17 at 100.00 | BB+ | | 2,057,856 | |
| | 3,855 | | New York City Industrial Development Authority, New York, PILOT Revenue Bonds, Yankee Stadium Project, Series 2006, 4.500%, 3/01/39 – FGIC Insured | 9/16 at 100.00 | BBB– | | 3,570,694 | |
| | 3,000 | | New York Liberty Development Corporation, Second Priority Liberty Revenue Refunding Bonds, Bank of America Tower at One Bryant Park Project, Series 2010, 5.625%, 1/15/46 | 1/20 at 100.00 | AA | | 3,185,850 | |
| | 420 | | Seneca County Industrial Development Authority, New York, Revenue Bonds, New York Chiropractic College, Series 2007, 5.000%, 10/01/27 | 10/17 at 100.00 | BBB | | 431,227 | |
| | 1,425 | | Troy Capital Resource Corporation, New York, Revenue Bonds, Rensselaer Polytechnic Institute, Series 2010A, 5.125%, 9/01/40 | 9/20 at 100.00 | A | | 1,481,687 | |
| | 660 | | Yonkers Industrial Development Agency, New York, Civic Facility Revenue Bonds, Sarah Lawrence College Project, Series 2001A Remarketed, 6.000%, 6/01/41 | 6/19 at 100.00 | A | | 707,837 | |
| | 44,700 | | Total Education and Civic Organizations | | | | 46,097,644 | |
| | | | Financials – 1.2% (0.8% of Total Investments) | | | | | |
| | 1,000 | | Liberty Development Corporation, New York, Goldman Sachs Headquarter Revenue Bonds, Series 2005, 5.250%, 10/01/35 | No Opt. Call | A1 | | 1,060,890 | |
| | 1,740 | | Liberty Development Corporation, New York, Goldman Sachs Headquarters Revenue Bonds Series 2007, 5.500%, 10/01/37 | No Opt. Call | A1 | | 1,915,392 | |
| | 2,740 | | Total Financials | | | | 2,976,282 | |
| | | | Health Care – 19.3% (13.1% of Total Investments) | | | | | |
| | 50 | | Dormitory Authority of the State of New York, FHA-Insured Mortgage Hospital Revenue Bonds, New York and Presbyterian Hospital, Series 1998, 4.750%, 8/01/27 – AMBAC Insured | 2/11 at 100.00 | N/R | | 50,014 | |
| | 365 | | Dormitory Authority of the State of New York, FHA-Insured Mortgage Hospital Revenue Bonds, St. James Mercy Hospital, Series 1998, 5.250%, 2/01/18 | 2/11 at 100.00 | AA– | | 367,303 | |
| | 1,235 | | Dormitory Authority of the State of New York, FHA-Insured Mortgage Revenue Bonds, Montefiore Hospital, Series 2004, 5.000%, 8/01/29 – FGIC Insured | 2/15 at 100.00 | A | | 1,291,155 | |
| | 1,700 | | Dormitory Authority of the State of New York, FHA-Insured Revenue Bonds, Montefiore Medical Center, Series 2005, 5.000%, 2/01/22 – FGIC Insured | 2/15 at 100.00 | A | | 1,791,528 | |
| | 8,500 | | Dormitory Authority of the State of New York, FHA-Insured Revenue Bonds, St. Lukes Roosevelt Hospital, Series 2005, 4.900%, 8/15/31 | 8/15 at 100.00 | N/R | | 8,715,730 | |
| | 350 | | Dormitory Authority of the State of New York, Highland Hospital of Rochester Revenue Bonds, Series 2010, 5.000%, 7/01/26 | 7/20 at 100.00 | A2 | | 367,759 | |
| | 3,750 | | Dormitory Authority of the State of New York, Revenue Bonds, Catholic Health Services of Long Island Obligated Group – St. Catherine of Siena Medical Center, Series 2000A, 6.500%, 7/01/20 | 1/11 at 101.00 | A3 | | 3,795,788 | |
| | 8,000 | | Dormitory Authority of the State of New York, Revenue Bonds, Catholic Health Services of Long Island Obligated Group – St. Charles Hospital and Rehabilitation Center, Series 1999A, 5.500%, 7/01/22 – NPFG Insured | 1/11 at 100.50 | A | | 8,048,160 | |
| | 1,950 | | Dormitory Authority of the State of New York, Revenue Bonds, Lenox Hill Hospital Obligated Group, Series 2001, 5.500%, 7/01/30 | 7/11 at 101.00 | Baa3 | | 1,951,424 | |
| | 5,590 | | Dormitory Authority of the State of New York, Revenue Bonds, Memorial Sloan Kettering Cancer Center, Series 2006, 5.000%, 7/01/35 (UB) | 7/16 at 100.00 | AA | | 5,840,767 | |
| | 2,840 | | Dormitory Authority of the State of New York, Revenue Bonds, New York and Presbyterian Hospital, Series 2004A, 5.250%, 8/15/15 – AGM Insured | 8/14 at 100.00 | AAA | | 3,156,972 | |
| | 1,800 | | Dormitory Authority of the State of New York, Revenue Bonds, North Shore Long Island Jewish Obligated Group, Series 2005A, 5.000%, 11/01/34 | 11/16 at 100.00 | Baa1 | | 1,831,086 | |
| | 1,250 | | Dormitory Authority of the State of New York, Revenue Bonds, South Nassau Communities Hospital, Series 2003B, 5.500%, 7/01/23 | 7/13 at 100.00 | Baa1 | | 1,286,663 | |
| | 900 | | Dormitory Authority of the State of New York, Revenue Bonds, Winthrop-South Nassau University Hospital Association, Series 2003A, 5.500%, 7/01/32 | 7/13 at 100.00 | Baa1 | | 909,522 | |
| | Principal | | | Optional Call | | | | |
| | Amount (000) | | Description (1) | Provisions (2) | Ratings (3) | | Value | |
| | | | Health Care (continued) | | | | | |
| | | | Madison County Industrial Development Agency, New York, Civic Facility Revenue Bonds, Oneida Health System, Series 2007A: | | | | | |
| $ | 710 | | 5.250%, 2/01/27 | No Opt. Call | BBB– | $ | 670,503 | |
| | 625 | | 5.500%, 2/01/32 | No Opt. Call | BBB– | | 594,825 | |
| | | | New York City Health and Hospitals Corporation, New York, Health System Revenue Bonds, Series 2003A: | | | | | |
| | 1,000 | | 5.250%, 2/15/21 – AMBAC Insured | 2/13 at 100.00 | Aa3 | | 1,073,300 | |
| | 1,250 | | 5.250%, 2/15/22 – AMBAC Insured | 2/13 at 100.00 | Aa3 | | 1,340,663 | |
| | 715 | | New York City Industrial Development Agency, New York, Civic Facility Revenue Bonds, Staten Island University Hospital, Series 2001B, 6.375%, 7/01/31 | 7/12 at 100.00 | Baa3 | | 722,865 | |
| | 705 | | New York City Industrial Development Agency, New York, Civic Facility Revenue Bonds, Staten Island University Hospital, Series 2002C, 6.450%, 7/01/32 | 7/12 at 101.00 | Baa3 | | 719,417 | |
| | 1,000 | | New York State Dormitory Authority, Revenue Bonds, NYU Hospitals Center, Refunding Series 2007A, 5.000%, 7/01/36 | 7/17 at 100.00 | BBB | | 1,009,620 | |
| | 1,100 | | Yonkers Industrial Development Agency, New York, Revenue Bonds, St. John’s Riverside Hospital, Series 2001A, 7.125%, 7/01/31 | 7/11 at 101.00 | B– | | 1,104,631 | |
| | 45,385 | | Total Health Care | | | | 46,639,695 | |
| | | | Housing/Multifamily – 7.3% (5.0% of Total Investments) | | | | | |
| | 4,530 | | New York City Housing Development Corporation, New York, Capital Fund Program Revenue Bonds, Series 2005A, 5.000%, 7/01/25 – NPFG Insured (UB) | 7/15 at 100.00 | AA+ | | 4,842,298 | |
| | | | New York City Housing Development Corporation, New York, Multifamily Housing Revenue Bonds, Series 2001A: | | | | | |
| | 1,610 | | 5.500%, 11/01/31 | 5/11 at 101.00 | AA | | 1,634,553 | |
| | 2,000 | | 5.600%, 11/01/42 | 5/11 at 101.00 | AA | | 2,027,120 | |
| | | | New York City Housing Development Corporation, New York, Multifamily Housing Revenue Bonds, Series 2002A: | | | | | |
| | 910 | | 5.375%, 11/01/23 (Alternative Minimum Tax) | 5/12 at 100.00 | AA | | 924,533 | |
| | 450 | | 5.500%, 11/01/34 (Alternative Minimum Tax) | 5/12 at 100.00 | AA | | 454,734 | |
| | 1,500 | | New York City Housing Development Corporation, New York, Multifamily Housing Revenue Bonds, Series 2004A, 5.250%, 11/01/30 | 5/14 at 100.00 | AA | | 1,546,335 | |
| | 345 | | New York City Housing Development Corporation, New York, Multifamily Housing Revenue Bonds, Series 2010-D1A, 5.000%, 11/01/42 | 5/20 at 100.00 | AA | | 352,901 | |
| | 2,000 | | New York State Housing Finance Agency, Affordable Housing Revenue Bonds, Series 2007B, 5.300%, 11/01/37 (Alternative Minimum Tax) | 11/17 at 100.00 | Aa2 | | 2,040,120 | |
| | 2,000 | | New York State Housing Finance Agency, Affordable Housing Revenue Bonds, Series 2010A, 5.000%, 11/01/42 | 5/20 at 100.00 | Aa2 | | 2,041,160 | |
| | 690 | | New York State Housing Finance Agency, Affordable Housing Revenue, Series 2007A, 5.250%, 11/01/38 (Alternative Minimum Tax) | 11/17 at 100.00 | Aa2 | | 703,455 | |
| | 1,100 | | New York State Housing Finance Agency, Secured Mortgage Program Multifamily Housing Revenue Bonds, Series 1999I, 6.200%, 2/15/20 (Alternative Minimum Tax) | 2/11 at 100.50 | Aa1 | | 1,106,919 | |
| | 17,135 | | Total Housing/Multifamily | | | | 17,674,128 | |
| | | | Housing/Single Family – 4.8% (3.3% of Total Investments) | | | | | |
| | 835 | | New York State Mortgage Agency, Homeowner Mortgage Revenue Bonds, 2007 Series 145, 5.125%, 10/01/37 (Alternative Minimum Tax) | 4/17 at 100.00 | Aa1 | | 850,005 | |
| | 2,295 | | New York State Mortgage Agency, Homeowner Mortgage Revenue Bonds, Series 130, 4.650%, 4/01/27 (Alternative Minimum Tax) | 4/15 at 100.00 | | | 2,297,777 | |
| | 880 | | New York State Mortgage Agency, Homeowner Mortgage Revenue Bonds, Series 148, 2007, 5.200%, 10/01/32 (Alternative Minimum Tax) | 10/17 at 100.00 | Aa1 | | 905,467 | |
| | 1,250 | | New York State Mortgage Agency, Homeowner Mortgage Revenue Bonds, Series 73A, 5.250%, 10/01/17 (Alternative Minimum Tax) | 3/11 at 100.00 | Aa1 | | 1,251,488 | |
| | 240 | | New York State Mortgage Agency, Homeowner Mortgage Revenue Bonds, Series 82, 5.650%, 4/01/30 (Alternative Minimum Tax) | 10/10 at 100.00 | Aa1 | | 240,173 | |
| | 4,405 | | New York State Mortgage Agency, Homeowner Mortgage Revenue Bonds, Series 97, 5.500%, 4/01/31 (Alternative Minimum Tax) | 4/11 at 100.00 | Aa1 | | 4,420,329 | |
| | 1,660 | | New York State Mortgage Agency, Mortgage Revenue Bonds, Thirty-Third Series A, 4.750%, 4/01/23 (Alternative Minimum Tax) | 4/13 at 101.00 | Aaa | | 1,694,379 | |
| | 11,565 | | Total Housing/Single Family | | | | 11,659,618 | |
Nuveen Investments 29
| | | Nuveen New York Performance Plus Municipal Fund, Inc. (continued) |
| NNP | | Portfolio of Investments September 30, 2010 |
| | Principal | | | Optional Call | | | | |
| | Amount (000) | | Description (1) | Provisions (2) | Ratings (3) | | Value | |
| | | | Long-Term Care – 4.2% (2.8% of Total Investments) | | | | | |
| $ | 1,100 | | Dormitory Authority of the State of New York, GNMA Collateralized Revenue Bonds, Cabrini of Westchester Project, Series 2006, 5.200%, 2/15/41 | 2/17 at 103.00 | A– | $ | 1,142,691 | |
| | 645 | | Dormitory Authority of the State of New York, Non-State Supported Debt, Ozanam Hall of Queens Nursing Home Revenue Bonds, Series 2006, 5.000%, 11/01/31 | 11/16 at 100.00 | A1 | | 652,901 | |
| | 1,375 | | Dormitory Authority of the State of New York, Revenue Bonds, Miriam Osborn Memorial Home Association, Series 2000B, 6.375%, 7/01/29 – ACA Insured | 1/11 at 102.00 | BBB | | 1,394,690 | |
| | | | Dormitory Authority of the State of New York, Revenue Bonds, Providence Rest, Series 2005: | | | | | |
| | 50 | | 5.125%, 7/01/30 – ACA Insured | 7/15 at 100.00 | N/R | | 37,073 | |
| | 425 | | 5.000%, 7/01/35 – ACA Insured | 7/15 at 100.00 | N/R | | 291,168 | |
| | 520 | | New York City Industrial Development Agency, New York, Civic Facility Revenue Bonds, Special Needs Facilities Pooled Program, Series 2000, 8.125%, 7/01/19 | 7/11 at 101.00 | N/R | | 531,211 | |
| | 1,350 | | New York City Industrial Development Agency, New York, Civic Facility Revenue Bonds, Special Needs Facilities Pooled Program, Series 2001A-1, 7.250%, 7/01/16 | 7/11 at 101.00 | N/R | | 1,374,476 | |
| | | | New York City Industrial Development Agency, New York, Civic Facility Revenue Bonds, Special Needs Facilities Pooled Program, Series 2008A-1: | | | | | |
| | 1,965 | | 5.500%, 7/01/18 | 7/16 at 101.00 | N/R | | 1,843,622 | |
| | 755 | | 5.800%, 7/01/23 | 7/16 at 101.00 | N/R | | 697,620 | |
| | 340 | | Suffolk County Industrial Development Agency, New York, Civic Facility Revenue Bonds, Special Needs Facilities Pooled Program, Series 2008-B1, 5.800%, 7/01/23 | 7/16 at 101.00 | N/R | | 314,160 | |
| | 1,780 | | Syracuse Housing Authority, New York, FHA-Insured Mortgage Revenue Bonds, Loretto Rest Residential Healthcare Facility, Series 1997A, 5.600%, 8/01/17 | 2/11 at 100.00 | AAA | | 1,785,910 | |
| | 10,305 | | Total Long-Term Care | | | | 10,065,522 | |
| | | | Materials – 0.3% (0.2% of Total Investments) | | | | | |
| | 575 | | Jefferson County Industrial Development Agency, New York, Solid Waste Disposal Revenue Bonds, International Paper Company Project, Series 2003A, 5.200%, 12/01/20 (Alternative Minimum Tax) | 12/13 at 100.00 | BBB | | 579,629 | |
| | | | Tax Obligation/General – 11.1% (7.6% of Total Investments) | | | | | |
| | 3,000 | | New York City, New York, General Obligation Bonds, Fiscal Series 2005F-1, 5.000%, 9/01/19 – SYNCORA GTY Insured | 9/15 at 100.00 | AA | | 3,406,050 | |
| | 400 | | New York City, New York, General Obligation Bonds, Fiscal Series 2009E, 5.000%, 8/01/28 | 8/19 at 100.00 | AA | | 443,800 | |
| | 1,800 | | New York City, New York, General Obligation Bonds, Series 2004C-1, 5.250%, 8/15/16 (UB) | 8/14 at 100.00 | AA | | 2,043,324 | |
| | 2,500 | | New York City, New York, General Obligation Bonds, Series 2004E, 5.000%, 11/01/19 – AGM Insured (UB) | 11/14 at 100.00 | AA+ | | 2,815,850 | |
| | 6,400 | | New York City, New York, General Obligation Bonds, Series 2006J-1, 5.000%, 6/01/25 (UB) | 6/16 at 100.00 | AA | | 7,077,626 | |
| | 10,000 | | New York City, New York, General Obligation Bonds, Series 2007D-1, 5.125%, 12/01/26 (UB) | 12/17 at 100.00 | AA | | 11,092,300 | |
| | 24,100 | | Total Tax Obligation/General | | | | 26,878,950 | |
| | | | Tax Obligation/Limited – 35.2% (23.9% of Total Investments) | | | | | |
| | 2,400 | | Battery Park City Authority, New York, Senior Revenue Bonds, Series 2003A, 5.000%, 11/01/23 | 11/13 at 100.00 | AAA | | 2,641,128 | |
| | | | Dormitory Authority of the State of New York, Lease Revenue Bonds, Nassau County Board of Cooperative Educational Services, Series 2001A: | | | | | |
| | 1,265 | | 5.250%, 8/15/17 – AGM Insured | 8/11 at 100.00 | AAA | | 1,308,137 | |
| | 1,385 | | 5.250%, 8/15/18 – AGM Insured | 8/11 at 100.00 | AAA | | 1,430,123 | |
| | 1,000 | | Dormitory Authority of the State of New York, Revenue Bonds, Mental Health Services Facilities Improvements, Series 2005D-1, 5.000%, 8/15/23 – FGIC Insured | 2/15 at 100.00 | AA– | | 1,074,180 | |
| | 690 | | Dormitory Authority of the State of New York, State Personal Income Tax Revenue Bonds, Series 2005F, 5.000%, 3/15/21 – AGM Insured | 3/15 at 100.00 | AAA | | 774,918 | |
| | 500 | | Hudson Yards Infrastructure Corporation, New York, Revenue Bonds, Series 2006A, 5.000%, 2/15/47 | 2/17 at 100.00 | A | | 500,215 | |
| | | | Metropolitan Transportation Authority, New York, Dedicated Tax Fund Bonds, Series 2002A: | | | | | |
| | 5,000 | | 5.250%, 11/15/25 – AGM Insured | 11/12 at 100.00 | AAA | | 5,329,850 | |
| | 2,500 | | 5.000%, 11/15/30 | 11/12 at 100.00 | AA | | 2,646,575 | |
| | | | Metropolitan Transportation Authority, New York, State Service Contract Refunding Bonds, Series 2002A: | | | | | |
| | 2,175 | | 5.750%, 7/01/18 | No Opt. Call | AA– | | 2,651,434 | |
| | 2,000 | | 5.125%, 1/01/29 | 7/12 at 100.00 | AA– | | 2,100,500 | |
| | 1,300 | | 5.000%, 7/01/30 – AMBAC Insured | 7/12 at 100.00 | AA– | | 1,361,399 | |
| | Principal | | | Optional Call | | | | |
| | Amount (000) | | Description (1) | Provisions (2) | Ratings (3) | | Value | |
| | | | Tax Obligation/Limited (continued) | | | | | |
| $ | 1,680 | | Monroe Newpower Corporation, New York, Power Facilities Revenue Bonds, Series 2003, 5.500%, 1/01/34 | 1/13 at 102.00 | BBB | $ | 1,641,494 | |
| | | | New York City Sales Tax Asset Receivable Corporation, New York, Dedicated Revenue Bonds, Local Government Assistance Corporation, Series 2004A: | | | | | |
| | 2,670 | | 5.000%, 10/15/25 – NPFG Insured (UB) | 10/14 at 100.00 | AAA | | 2,956,811 | |
| | 2,125 | | 5.000%, 10/15/26 – NPFG Insured (UB) | 10/14 at 100.00 | AAA | | 2,332,188 | |
| | 2,475 | | 5.000%, 10/15/29 – AMBAC Insured (UB) | 10/14 at 100.00 | AAA | | 2,716,313 | |
| | 3,100 | | New York City Transitional Finance Authority, New York, Building Aid Revenue Bonds, Fiscal Series 2007S-2, 5.000%, 1/15/28 – FGIC Insured | 1/17 at 100.00 | AA– | | 3,317,899 | |
| | 2,665 | | New York City Transitional Finance Authority, New York, Future Tax Secured Bonds, Fiscal Series 2003E, 5.000%, 2/01/23 – FGIC Insured | 2/13 at 100.00 | AAA | | 2,869,859 | |
| | 3,640 | | New York City Transitional Finance Authority, New York, Future Tax Secured Bonds, Fiscal Series 2007C-1, 5.000%, 11/01/27 | 11/17 at 100.00 | AAA | | 4,056,016 | |
| | 2,400 | | New York City Transitional Finance Authority, New York, Future Tax Secured Bonds, Tender Option Bond Trust 3545, 13.426%, 5/01/32 (IF) | 5/19 at 100.00 | AAA | | 2,959,296 | |
| | 1,000 | | New York State Environmental Facilities Corporation, Infrastructure Revenue Bonds, Series 2003A, 5.000%, 3/15/21 | 3/14 at 100.00 | AA– | | 1,062,080 | |
| | 5,000 | | New York State Environmental Facilities Corporation, State Personal Income Tax Revenue Bonds, Series 2008A, 5.000%, 12/15/27 (UB) | 12/17 at 100.00 | AAA | | 5,542,795 | |
| | 2,030 | | New York State Housing Finance Agency, State Personal Income Tax Revenue Bonds, Economic Development and Housing, Series 2006A, 5.000%, 3/15/36 | 9/15 at 100.00 | AAA | | 2,131,155 | |
| | 1,000 | | New York State Thruway Authority, Highway and Bridge Trust Fund Bonds, Second General, Series 2005B, 5.000%, 4/01/21 – AMBAC Insured | 10/15 at 100.00 | AA | | 1,126,300 | |
| | 2,800 | | New York State Thruway Authority, Highway and Bridge Trust Fund Bonds, Series 2007, 5.000%, 4/01/27 | 10/17 at 100.00 | AA | | 3,072,524 | |
| | 5,600 | | New York State Thruway Authority, Highway and Bridge Trust Fund Bonds, Series 2005B, 5.500%, 4/01/20 – AMBAC Insured (UB) | No Opt. Call | AA | | 6,860,728 | |
| | 4,285 | | New York State Thruway Authority, State Personal Income Tax Revenue Bonds, Series 2002A, 5.125%, 3/15/21 | 3/12 at 100.00 | AAA | | 4,586,750 | |
| | 1,600 | | New York State Thruway Authority, State Personal Income Tax Revenue Bonds, Series 2010A, 5.000%, 3/15/29 | 9/20 at 100.00 | AAA | | 1,803,888 | |
| | 6,700 | | New York State Tobacco Settlement Financing Corporation, Tobacco Settlement Asset-Backed and State Contingency Contract-Backed Bonds, Series 2003A-1, 5.250%, 6/01/20 – AMBAC Insured | 6/13 at 100.00 | AA– | | 7,277,339 | |
| | 3,000 | | New York State Tobacco Settlement Financing Corporation, Tobacco Settlement Asset-Backed and State Contingency Contract-Backed Bonds, Series 2003B-1C, 5.500%, 6/01/21 | 6/13 at 100.00 | AA– | | 3,255,210 | |
| | 1,300 | | New York State Urban Development Corporation, State Personal Income Tax Revenue Bonds, Series 2005B, 5.000%, 3/15/30 – AGM Insured | 3/15 at 100.00 | AAA | | 1,392,859 | |
| | 1,950 | | Puerto Rico Sales Tax Financing Corporation, Sales Tax Revenue Bonds, First Subordinate Series 2010A, 5.500%, 8/01/42 | 2/20 at 100.00 | A+ | | 2,080,338 | |
| | 77,235 | | Total Tax Obligation/Limited | | | | 84,860,301 | |
| | | | Transportation – 11.9% (8.1% of Total Investments) | | | | | |
| | 660 | | Albany Parking Authority, New York, Revenue Bonds, Series 2001B, 5.250%, 10/15/12 | 10/11 at 101.00 | BBB+ | | 688,380 | |
| | 1,500 | | Metropolitan Transportation Authority, New York, Transportation Revenue Bonds, Series 2003A, 5.000%, 11/15/15 – FGIC Insured | No Opt. Call | A | | 1,721,910 | |
| | 2,000 | | New York City Industrial Development Agency, New York, Civic Facility Revenue Bonds, Bronx Parking Development Company, LLC Project, Series 2007, 5.875%, 10/01/46 | 10/17 at 102.00 | N/R | | 1,342,520 | |
| | 1,900 | | New York City Industrial Development Agency, New York, Special Facilities Revenue Bonds, British Airways PLC, Series 1998, 5.250%, 12/01/32 (Alternative Minimum Tax) | 12/10 at 100.00 | BB– | | 1,534,877 | |
| | 1,550 | | New York City Industrial Development Agency, New York, Special Facilities Revenue Bonds, Terminal One Group JFK Project, Series 2005, 5.500%, 1/01/24 (Alternative Minimum Tax) | 1/16 at 100.00 | A3 | | 1,622,416 | |
| | 215 | | New York State Thruway Authority, General Revenue Bonds, Series 2005F, 5.000%, 1/01/30 – AMBAC Insured | 1/15 at 100.00 | A+ | | 224,645 | |
| | 1,100 | | New York State Thruway Authority, General Revenue Bonds, Series 2005G, 5.000%, 1/01/30 – AGM Insured (UB) | 7/15 at 100.00 | AA+ | | 1,170,367 | |
Nuveen Investments 31
| | | Nuveen New York Performance Plus Municipal Fund, Inc. (continued) |
| NNP | | Portfolio of Investments September 30, 2010 |
| | Principal | | | Optional Call | | | | |
| | Amount (000) | | Description (1) | Provisions (2) | Ratings (3) | | Value | |
| | | | Transportation (continued) | | | | | |
| $ | 1,000 | | Niagara Frontier Airport Authority, New York, Airport Revenue Bonds, Buffalo Niagara International Airport, Series 1999A, 5.625%, 4/01/29 – NPFG Insured (Alternative Minimum Tax) | 10/10 at 100.50 | A | $ | 1,003,680 | |
| | | | Port Authority of New York and New Jersey, Consolidated Revenue Bonds, One Hundred Fortieth Series 2005: | | | | | |
| | 2,300 | | 5.000%, 12/01/28 – SYNCORA GTY Insured | 6/15 at 101.00 | Aa2 | | 2,491,199 | |
| | 1,080 | | 5.000%, 12/01/31 – SYNCORA GTY Insured | 6/15 at 101.00 | Aa2 | | 1,154,747 | |
| | 770 | | Port Authority of New York and New Jersey, Consolidated Revenue Bonds, One Hundred Forty Eighth Series 2007, Trust 2920, 17.154%, 8/15/32 – AGM Insured (IF) | 8/17 at 100.00 | AA+ | | 1,019,696 | |
| | 2,040 | | Puerto Rico Ports Authority, Special Facilities Revenue Bonds, American Airlines Inc., Series 1996A, 6.250%, 6/01/26 (Alternative Minimum Tax) | 12/10 at 100.00 | CCC+ | | 1,768,150 | |
| | 2,000 | | Triborough Bridge and Tunnel Authority, New York, General Purpose Revenue Bonds, Series 2001A, 5.000%, 1/01/19 | 1/12 at 100.00 | Aa2 | | 2,096,240 | |
| | 5,750 | | Triborough Bridge and Tunnel Authority, New York, General Purpose Revenue Refunding Bonds, Series 2002B, 5.000%, 11/15/21 | 11/12 at 100.00 | Aa2 | | 6,195,395 | |
| | 2,400 | | Triborough Bridge and Tunnel Authority, New York, Subordinate Lien General Purpose Revenue Refunding Bonds, Series 2002E, 5.250%, 11/15/22 – NPFG Insured | 11/12 at 100.00 | Aa3 | | 2,575,464 | |
| | 1,750 | | Triborough Bridge and Tunnel Authority, New York, Subordinate Lien General Purpose Revenue Refunding Bonds, Tender Option Bond Trust 1184, 9.051%, 5/15/16 (IF) | No Opt. Call | Aa2 | | 2,024,575 | |
| | 28,015 | | Total Transportation | | | | 28,634,261 | |
| | | | U.S. Guaranteed – 13.3% (9.0% of Total Investments) (4) | | | | | |
| | 1,520 | | Dormitory Authority of the State of New York, FHA-Insured Nursing Home Mortgage Revenue Bonds, Shorefront Jewish Geriatric Center Inc., Series 2002, 5.200%, 2/01/32 (Pre-refunded 2/01/13) | 2/13 at 102.00 | Aaa | | 1,714,788 | |
| | 1,000 | | Dormitory Authority of the State of New York, Revenue Bonds, Columbia University, Series 2002B, 5.375%, 7/01/19 (Pre-refunded 7/01/12) | 7/12 at 100.00 | AAA | | 1,088,000 | |
| | 5,000 | | Metropolitan Transportation Authority, New York, Dedicated Tax Fund Bonds, Series 1998A, 4.500%, 4/01/18 (Pre-refunded 10/01/15) – FGIC Insured | 10/15 at 100.00 | AAA | | 5,837,250 | |
| | 2,215 | | New York State Thruway Authority, State Personal Income Tax Revenue Bonds, Series 2002A, 5.125%, 3/15/21 (Pre-refunded 3/15/12) | 3/12 at 100.00 | Aa3 (4) | | 2,360,880 | |
| | 3,595 | | New York State Urban Development Corporation, Service Contract Revenue Bonds, Correctional and Youth Facilities, Series 2002A, 5.500%, 1/01/17 (Pre-refunded 1/01/11) (Mandatory put 1/01/11) | 1/11 at 100.00 | AA– (4) | | 3,642,238 | |
| | 2,950 | | New York State Urban Development Corporation, State Personal Income Tax Revenue Bonds, Series 2003B, 5.000%, 3/15/22 (Pre-refunded 3/15/13) | 3/13 at 100.00 | AAA | | 3,262,818 | |
| | 1,600 | | Triborough Bridge and Tunnel Authority, New York, General Purpose Revenue Bonds, Series 1993B, 5.000%, 1/01/20 (ETM) | No Opt. Call | AAA | | 1,883,824 | |
| | 7,500 | | Triborough Bridge and Tunnel Authority, New York, General Purpose Revenue Bonds, Series 1999B, 5.500%, 1/01/30 (Pre-refunded 1/01/22) | 1/22 at 100.00 | AAA | | 9,776,250 | |
| | 2,520 | | Yonkers Industrial Development Agency, New York, Revenue Bonds, Community Development Properties – Yonkers Inc. Project, Series 2001A, 6.625%, 2/01/26 (Pre-refunded 2/01/11) | 2/11 at 100.00 | Baa3 (4) | | 2,570,854 | |
| | 27,900 | | Total U.S. Guaranteed | | | | 32,136,902 | |
| | | | Utilities – 9.1% (6.2% of Total Investments) | | | | | |
| | 2,200 | | Chautauqua County Industrial Development Agency, New York, Exempt Facility Revenue Bonds, NRG Dunkirk Power Project, Series 2009, 5.875%, 4/01/42 | 2/20 at 100.00 | Baa3 | | 2,288,748 | |
| | | | Long Island Power Authority, New York, Electric System General Revenue Bonds, Series 2006A: | | | | | |
| | 3,100 | | 5.000%, 12/01/23 – FGIC Insured | 6/16 at 100.00 | A | | 3,379,186 | |
| | 3,100 | | 5.000%, 12/01/24 – FGIC Insured | 6/16 at 100.00 | A | | 3,365,329 | |
| | 2,300 | | Nassau County Industrial Development Authority, New York, Keyspan Glenwood Energy Project, Series 2003, 5.250%, 6/01/27 (Alternative Minimum Tax) | 6/13 at 100.00 | A– | | 2,351,796 | |
| | 2,000 | | Niagara County Industrial Development Agency, New York, Solid Waste Disposal Facility Revenue Refunding Bonds, American Ref-Fuel Company of Niagara LP, Series 2001D, 5.550%, 11/15/24 (Mandatory put 11/15/15) | 11/11 at 101.00 | Baa2 | | 2,022,840 | |
| | 4,000 | | Power Authority of the State of New York, General Revenue Bonds, Series 2000A, 5.250%, 11/15/40 | 11/10 at 100.00 | Aa2 | | 4,006,320 | |
| | 820 | | Power Authority of the State of New York, General Revenue Bonds, Series 2006A, 5.000%, 11/15/19 – FGIC Insured | 11/15 at 100.00 | Aa2 | | 923,271 | |
| | 4,000 | | Suffolk County Industrial Development Agency, New York, Revenue Bonds, Nissequogue Cogeneration Partners Facility, Series 1998, 5.500%, 1/01/23 (Alternative Minimum Tax) | 1/11 at 100.00 | N/R | | 3,690,640 | |
| | 21,520 | | Total Utilities | | | | 22,028,130 | |
| | Principal | | | Optional Call | | | | |
| | Amount (000) | | Description (1) | Provisions (2) | Ratings (3) | | Value | |
| | | | Water and Sewer – 7.4% (5.0% of Total Investments) | | | | | |
| $ | 2,000 | | New York City Municipal Water Finance Authority, New York, Water and Sewerage System Revenue Bonds, Fiscal Series 2001D, 5.500%, 6/15/17 | 6/11 at 101.00 | AAA | $ | 2,091,640 | |
| | 2,225 | | New York City Municipal Water Finance Authority, New York, Water and Sewerage System Revenue Bonds, Fiscal Series 2003A, 5.375%, 6/15/19 | 6/12 at 100.00 | AAA | | 2,396,503 | |
| | 3,000 | | New York City Municipal Water Finance Authority, New York, Water and Sewerage System Revenue Bonds, Second Generation Resolution, Fiscal 2010 Series 2009BB, 5.000%, 6/15/27 | 6/19 at 100.00 | AA+ | | 3,381,930 | |
| | | | New York State Environmental Facilities Corporation, State Clean Water and Drinking Water Revolving Funds Revenue Bonds, Pooled Loan Issue, Series 2002F: | | | | | |
| | 1,345 | | 5.250%, 11/15/19 | 11/12 at 100.00 | AAA | | 1,459,407 | |
| | 4,060 | | 5.250%, 11/15/20 | 11/12 at 100.00 | AAA | | 4,405,345 | |
| | 3,840 | | New York State Environmental Facilities Corporation, State Revolving Fund, 2010 Master Financing Indenture Senior Lien, Series 2010C, 5.000%, 10/15/35 | 4/20 at 100.00 | AAA | | 4,217,127 | |
| | 16,470 | | Total Water and Sewer | | | | 17,951,952 | |
| $ | 333,315 | | Total Long-Term Investments (cost $335,321,675) – 146.5% (99.6% of Total Investments) | | | | 353,702,695 | |
| | | | Short-Term Investments – 0.6% (0.4% of Total Investments) | | | | | |
| | | | Tax Obligation/Limited – 0.6% (0.4% of Total Investments) | | | | | |
| $ | 1,495 | | Metropolitan Transportation Authority, New York, Dedicated Tax Fund Bonds, Variable RateDemand Revenue Obligations, Series 2008A, 0.310%, 11/01/31 – AGM Insured (5) | 1/11 at 100.00 | A-1 | | 1,495,000 | |
| | | | Total Short-Term Investments (cost $1,495,000) | | | | 1,495,000 | |
| | | | Total Investments (cost $336,816,675) – 147.1% | | | | 355,197,695 | |
| | | | Floating Rate Obligations – (14.3)% | | | | (34,645,000 | ) |
| | | | Variable Rate Demand Preferred Shares, at Liquidation Value – (36.9)% (6) | | | | (89,000,000 | ) |
| | | | Other Assets Less Liabilities – 4.1% | | | | 9,897,053 | |
| | | | Net Assets Applicable to Common Shares – 100% | | | $ | 241,449,748 | |
| (1) | | All percentages shown in the Portfolio of Investments are based on net assets applicable to Common shares unless otherwise noted. |
| (2) | | Optional Call Provisions (not covered by the report of independent registered public accounting firm): Dates (month and year) and prices of the earliest optional call or redemption. There may be other call provisions at varying prices at later dates. Certain mortgage-backed securities may be subject to periodic principal paydowns. |
| (3) | | Ratings (not covered by the report of independent registered public accounting firm): Using the highest of Standard & Poor’s Group (“Standard & Poor’s”), Moody’s Investor Service, Inc. (“Moody’s”) or Fitch, Inc. (“Fitch”) rating. Ratings below BBB by Standard & Poor’s, Baa by Moody’s or BBB by Fitch are considered to be below investment grade. Holdings designated N/R are not rated by any of these national rating agencies. |
| (4) | | Backed by an escrow or trust containing sufficient U.S. Government or U.S. Government agency securities, which ensure the timely payment of principal and interest. Such investments are normally considered to be equivalent to AAA rated securities. |
| (5) | | Investment has a maturity of more than one year, but has variable rate and demand features which qualify it as a short-term investment. The rate disclosed is that in effect at the end of the reporting period. This rate changes periodically based on market conditions or a specified market index. |
| (6) | | Variable Rate Demand Preferred Shares, at Liquidation Value as a percentage of Total Investments is 25.1%. |
| N/R | | Not rated. |
| (ETM) | | Escrowed to maturity. |
| (IF) | | Inverse floating rate investment. |
| (UB) | | Underlying bond of an inverse floating rate trust reflected as a financing transaction. See Notes to Financial Statements, Footnote 1 – General Information and Significant Accounting Policies, Inverse Floating Rate Securities for more information. |
See accompanying notes to financial statements.
Nuveen Investments 33
| | | Nuveen New York Dividend Advantage Municipal Fund |
| NAN | | Portfolio of Investments |
| | | September 30, 2010 |
| | Principal | | | Optional Call | | | | |
| | Amount (000) | | Description (1) | Provisions (2) | Ratings (3) | | Value | |
| | | | Consumer Discretionary – 2.8% (1.9% of Total Investments) | | | | | |
| $ | 950 | | New York City Industrial Development Agency, New York, Liberty Revenue Bonds, IAC/InterActiveCorp, Series 2005, 5.000%, 9/01/35 | 9/15 at 100.00 | BB+ | $ | 886,056 | |
| | 3,600 | | Seneca Nation of Indians Capital Improvements Authority, New York, Special Obligation Bonds, Series 2007A, 5.000%, 12/01/23 | 6/17 at 100.00 | BB | | 3,001,716 | |
| | 4,550 | | Total Consumer Discretionary | | | | 3,887,772 | |
| | | | Consumer Staples – 2.2% (1.5% of Total Investments) | | | | | |
| | 265 | | New York Counties Tobacco Trust II, Tobacco Settlement Pass-Through Bonds, Series 2001, 5.250%, 6/01/25 | 6/11 at 101.00 | BBB | | 252,977 | |
| | 765 | | Puerto Rico, The Children’s Trust Fund, Tobacco Settlement Asset-Backed Refunding Bonds, Series 2002, 5.375%, 5/15/33 | 5/12 at 100.00 | BBB | | 766,301 | |
| | 200 | | Rensselaer Tobacco Asset Securitization Corporation, New York, Tobacco Settlement Asset-Backed Bonds, Series 2001A, 5.200%, 6/01/25 | 6/12 at 100.00 | BBB | | 189,942 | |
| | | | TSASC Inc., New York, Tobacco Asset-Backed Bonds, Series 2006: | | | | | |
| | 770 | | 4.750%, 6/01/22 | 6/16 at 100.00 | BBB | | 773,411 | |
| | 1,125 | | 5.000%, 6/01/26 | 6/16 at 100.00 | BBB | | 1,072,136 | |
| | 3,125 | | Total Consumer Staples | | | | 3,054,767 | |
| | | | Education and Civic Organizations – 17.5% (12.3% of Total Investments) | | | | | |
| | 380 | | Albany Industrial Development Agency, New York, Revenue Bonds, Albany Law School, Series 2007A, 5.000%, 7/01/31 | 7/17 at 100.00 | BBB | | 386,285 | |
| | 160 | | Albany Industrial Development Agency, New York, Revenue Bonds, Brighter Choice Charter Schools, Series 2007A, 5.000%, 4/01/37 | 4/17 at 100.00 | N/R | | 144,984 | |
| | 1,725 | | Brooklyn Arena Local Development Corporation, New York, Payment in Lieu of Taxes Revenue Bonds, Barclays Center Project, Series 2009, 6.250%, 7/15/40 | No Opt. Call | BBB– | | 1,880,854 | |
| | 120 | | Cattaraugus County Industrial Development Agency, New York, Revenue Bonds, St. Bonaventure University, Series 2006, 5.000%, 5/01/23 | 5/16 at 100.00 | BBB– | | 120,808 | |
| | 1,635 | | Dormitory Authority of the State of New York, General Revenue Bonds, Manhattan College, Series 2007A, 5.000%, 7/01/41 – RAAI Insured | 7/17 at 100.00 | N/R | | 1,635,801 | |
| | 1,000 | | Dormitory Authority of the State of New York, Lease Revenue Bonds, State University Dormitory Facilities, Series 2003B, 5.250%, 7/01/32 (Mandatory put 7/01/13) – SYNCORA GTY Insured | No Opt. Call | Aa2 | | 1,108,320 | |
| | 705 | | Dormitory Authority of the State of New York, Lease Revenue Bonds, State University Dormitory Facilities, Series 2004A, 5.000%, 7/01/29 – NPFG Insured | 7/15 at 100.00 | Aa2 | | 752,489 | |
| | 195 | | Dormitory Authority of the State of New York, Revenue Bonds, Fashion Institute of Technology, Series 2000, 5.375%, 7/01/20 – AGM Insured | 7/12 at 100.00 | AAA | | 197,670 | |
| | 680 | | Dormitory Authority of the State of New York, Revenue Bonds, St. Joseph’s College, Series 2010, 5.250%, 7/01/35 | 7/20 at 100.00 | Baa1 | | 704,092 | |
| | 1,630 | | Dutchess County Industrial Development Agency, New York, Civic Facility Revenue Bonds, Bard College Project, Series 2007-A2, 4.500%, 8/01/36 | 8/17 at 100.00 | Baa1 | | 1,503,528 | |
| | 370 | | Hempstead Town Industrial Development Agency, New York, Revenue Bonds, Adelphi University, Civic Facility Project, Series 2005, 5.000%, 10/01/35 | 10/15 at 100.00 | A | | 379,705 | |
| | 250 | | Hempstead Town Local Development Corporation, New York, Revenue Bonds, Adelphi University Project, Series 2009B, 5.250%, 2/01/39 | 2/19 at 100.00 | A | | 266,278 | |
| | 1,085 | | Hempstead Town Local Development Corporation, New York, Revenue Bonds, Molloy College Project, Series 2009, 5.750%, 7/01/39 | 7/19 at 100.00 | BBB+ | | 1,164,281 | |
| | 3,070 | | Monroe County Industrial Development Agency, New York, Civic Facility Revenue Bonds, St. John Fisher College, Series 1999, 5.375%, 6/01/24 – RAAI Insured | 12/10 at 101.00 | N/R | | 3,084,890 | |
| | 330 | | New York City Industrial Development Agency, New York, Civic Facility Revenue Bonds, St. Francis College, Series 2004, 5.000%, 10/01/34 | 10/14 at 100.00 | A– | | 331,185 | |
| | 1,800 | | New York City Industrial Development Agency, New York, Civic Facility Revenue Bonds, YMCA of Greater New York, Series 2002, 5.250%, 8/01/21 | 2/11 at 100.00 | A– | | 1,808,352 | |
| | Principal | | | Optional Call | | | | |
| | Amount (000) | | Description (1) | Provisions (2) | Ratings (3) | | Value | |
| | | | Education and Civic Organizations (continued) | | | | | |
| | | | New York City Industrial Development Agency, New York, PILOT Revenue Bonds, Queens Baseball Stadium Project, Series 2006: | | | | | |
| $ | 160 | | 5.000%, 1/01/36 – AMBAC Insured | 1/17 at 100.00 | BB+ | $ | 151,538 | |
| | 1,000 | | 5.000%, 1/01/39 – AMBAC Insured | 1/17 at 100.00 | BB+ | | 940,220 | |
| | 1,630 | | 4.750%, 1/01/42 – AMBAC Insured | 1/17 at 100.00 | BB+ | | 1,458,394 | |
| | 2,240 | | New York City Industrial Development Authority, New York, PILOT Revenue Bonds, Yankee Stadium Project, Series 2006, 4.500%, 3/01/39 – FGIC Insured | 9/16 at 100.00 | BBB– | | 2,074,800 | |
| | 2,000 | | New York Liberty Development Corporation, Second Priority Liberty Revenue Refunding Bonds, Bank of America Tower at One Bryant Park Project, Series 2010, 5.625%, 1/15/46 | 1/20 at 100.00 | AA | | 2,123,900 | |
| | 1,500 | | Niagara County Industrial Development Agency, New York, Civic Facility Revenue Bonds, Niagara University, Series 2001A, 5.350%, 11/01/23 – RAAI Insured | 11/11 at 101.00 | BBB | | 1,532,895 | |
| | 245 | | Seneca County Industrial Development Authority, New York, Revenue Bonds, New York Chiropractic College, Series 2007, 5.000%, 10/01/27 | 10/17 at 100.00 | BBB | | 251,549 | |
| | 535 | | Troy Capital Resource Corporation, New York, Revenue Bonds, Rensselaer Polytechnic Institute, Series 2010A, 5.125%, 9/01/40 | 9/20 at 100.00 | A | | 556,282 | |
| | 24,445 | | Total Education and Civic Organizations | | | | 24,559,100 | |
| | | | Financials – 2.2% (1.5% of Total Investments) | | | | | |
| | 1,100 | | Liberty Development Corporation, New York, Goldman Sachs Headquarter Revenue Bonds, Series 2005, 5.250%, 10/01/35 | No Opt. Call | A1 | | 1,166,979 | |
| | 1,740 | | Liberty Development Corporation, New York, Goldman Sachs Headquarters Revenue Bonds Series 2007, 5.500%, 10/01/37 | No Opt. Call | A1 | | 1,915,392 | |
| | 2,840 | | Total Financials | | | | 3,082,371 | |
| | | | Health Care – 30.1% (21.2% of Total Investments) | | | | | |
| | | | Albany Industrial Development Agency, New York, Revenue Bonds, Albany Medical Center, Series 1999: | | | | | |
| | 1,035 | | 6.000%, 5/01/19 | 11/10 at 100.50 | N/R | | 1,037,525 | |
| | 1,460 | | 6.000%, 5/01/29 | 11/10 at 100.50 | N/R | | 1,399,089 | |
| | 1,785 | | Dormitory Authority of the State of New York, FHA-Insured Mortgage Hospital Revenue Bonds, Memorial Hospital of William F. and Gertrude F. Jones Inc., Series 1999, 5.250%, 8/01/19 – NPFG Insured | 2/11 at 100.00 | A | | 1,797,620 | |
| | 4,825 | | Dormitory Authority of the State of New York, FHA-Insured Mortgage Hospital Revenue Bonds, Montefiore Medical Center, Series 1999, 5.450%, 8/01/29 – AMBAC Insured | 2/11 at 100.50 | N/R | | 4,855,494 | |
| | 625 | | Dormitory Authority of the State of New York, FHA-Insured Mortgage Revenue Bonds, Montefiore Hospital, Series 2004, 5.000%, 8/01/29 – FGIC Insured | 2/15 at 100.00 | A | | 653,419 | |
| | 3,600 | | Dormitory Authority of the State of New York, FHA-Insured Revenue Bonds, St. Lukes Roosevelt Hospital, Series 2005, 4.900%, 8/15/31 | 8/15 at 100.00 | N/R | | 3,691,368 | |
| | 200 | | Dormitory Authority of the State of New York, Highland Hospital of Rochester Revenue Bonds, Series 2010, 5.200%, 7/01/32 | 7/20 at 100.00 | A2 | | 207,420 | |
| | | | Dormitory Authority of the State of New York, Insured Revenue Bonds, Franciscan Health Partnership Obligated Group – Frances Shervier Home and Hospital, Series 1997: | | | | | |
| | 2,000 | | 5.500%, 7/01/17 – RAAI Insured | 1/11 at 100.00 | A3 | | 2,002,060 | |
| | 2,000 | | 5.500%, 7/01/27 – RAAI Insured | 1/11 at 100.00 | A3 | | 2,000,460 | |
| | 2,000 | | Dormitory Authority of the State of New York, Revenue Bonds, Catholic Health Services of Long Island Obligated Group – St. Catherine of Siena Medical Center, Series 2000A, 6.500%, 7/01/20 | 1/11 at 101.00 | A3 | | 2,024,420 | |
| | | | Dormitory Authority of the State of New York, Revenue Bonds, Lenox Hill Hospital Obligated Group, Series 2001: | | | | | |
| | 1,165 | | 5.375%, 7/01/20 | 7/11 at 101.00 | Baa3 | | 1,172,340 | |
| | 500 | | 5.500%, 7/01/30 | 7/11 at 101.00 | Baa3 | | 500,365 | |
| | 3,160 | | Dormitory Authority of the State of New York, Revenue Bonds, Memorial Sloan Kettering Cancer Center, Series 2006, 5.000%, 7/01/35 (UB) | 7/16 at 100.00 | AA | | 3,301,758 | |
| | 1,375 | | Dormitory Authority of the State of New York, Revenue Bonds, New York and Presbyterian Hospital, Series 2004A, 5.250%, 8/15/15 – AGM Insured | 8/14 at 100.00 | AAA | | 1,528,464 | |
Nuveen Investments 35
| | | Nuveen New York Dividend Advantage Municipal Fund (continued) |
| NAN | | Portfolio of Investments September 30, 2010 |
| | Principal | | | Optional Call | | | | |
| | Amount (000) | | Description (1) | Provisions (2) | Ratings (3) | | Value | |
| | | | Health Care (continued) | | | | | |
| $ | 1,000 | | Dormitory Authority of the State of New York, Revenue Bonds, North Shore Long Island Jewish Obligated Group, Series 2005A, 5.000%, 11/01/34 | 11/16 at 100.00 | Baa1 | $ | 1,017,270 | |
| | 2,000 | | Dormitory Authority of the State of New York, Revenue Bonds, NYU Hospitals Center, Series 2007B, 5.625%, 7/01/37 | 7/17 at 100.00 | BBB | | 2,089,360 | |
| | 500 | | Dormitory Authority of the State of New York, Revenue Bonds, South Nassau Communities Hospital, Series 2003B, 5.500%, 7/01/23 | 7/13 at 100.00 | Baa1 | | 514,665 | |
| | 600 | | Dormitory Authority of the State of New York, Revenue Bonds, Winthrop-South Nassau University Hospital Association, Series 2003A, 5.500%, 7/01/32 | 7/13 at 100.00 | Baa1 | | 606,348 | |
| | 420 | | Livingston County Industrial Development Agency, New York, Civic Facility Revenue Bonds, Nicholas H. Noyes Hospital, Series 2005, 6.000%, 7/01/30 | 1/11 at 100.00 | BB | | 403,078 | |
| | | | Madison County Industrial Development Agency, New York, Civic Facility Revenue Bonds, Oneida Health System, Series 2007A: | | | | | |
| | 410 | | 5.250%, 2/01/27 | No Opt. Call | BBB– | | 387,192 | |
| | 360 | | 5.500%, 2/01/32 | No Opt. Call | BBB– | | 342,619 | |
| | 1,750 | | New York City Health and Hospitals Corporation, New York, Health System Revenue Bonds, Series 2003A, 5.250%, 2/15/22 – AMBAC Insured | 2/13 at 100.00 | Aa3 | | 1,876,928 | |
| | 555 | | New York City Industrial Development Agency, New York, Civic Facility Revenue Bonds, Staten Island University Hospital, Series 2001B, 6.375%, 7/01/31 | 7/12 at 100.00 | Baa3 | | 561,105 | |
| | 100 | | New York City Industrial Development Agency, New York, Civic Facility Revenue Bonds, Staten Island University Hospital, Series 2002C, 6.450%, 7/01/32 | 7/12 at 101.00 | Baa3 | | 102,045 | |
| | 4,000 | | Ulster County Industrial Development Agency, New York, Civic Facility Revenue Bonds, Kingston Hospital, Series 1999, 5.650%, 11/15/24 | 11/10 at 100.50 | A2 | | 4,046,280 | |
| | 2,980 | | Yates County Industrial Development Agency, New York, FHA-Insured Civic Facility Mortgage Revenue Bonds, Soldiers and Sailors Memorial Hospital, Series 1999A, 5.650%, 2/01/39 | 2/11 at 100.50 | N/R | | 3,258,630 | |
| | 950 | | Yonkers Industrial Development Agency, New York, Revenue Bonds, St. John’s Riverside Hospital, Series 2001A, 7.125%, 7/01/31 | 7/11 at 101.00 | B– | | 954,000 | |
| | 41,355 | | Total Health Care | | | | 42,331,322 | |
| | | | Housing/Multifamily – 8.8% (6.2% of Total Investments) | | | | | |
| | 400 | | Canton Capital Resource Corporation, New York, Student Housing Facility Revenue Bonds, Grasse River LLC at SUNY Canton Project Series 2010A, 5.000%, 5/01/40 | 5/20 at 100.00 | AAA | | 414,628 | |
| | 2,585 | | New York City Housing Development Corporation, New York, Capital Fund Program Revenue Bonds, Series 2005A, 5.000%, 7/01/25 – NPFG Insured (UB) | 7/15 at 100.00 | AA+ | | 2,763,210 | |
| | 3,000 | | New York City Housing Development Corporation, New York, Multifamily Housing Revenue Bonds, Series 2001A, 5.500%, 11/01/31 | 5/11 at 101.00 | AA | | 3,045,750 | |
| | 750 | | New York City Housing Development Corporation, New York, Multifamily Housing Revenue Bonds, Series 2004A, 5.250%, 11/01/30 | 5/14 at 100.00 | AA | | 773,168 | |
| | 4,000 | | New York City Housing Development Corporation, New York, Multifamily Housing Revenue Bonds, Series 2009J, 4.800%, 5/01/36 | 5/19 at 100.00 | AA | | 4,084,520 | |
| | 290 | | New York City Housing Development Corporation, New York, Multifamily Housing Revenue Bonds, Series 2010-D1A, 5.000%, 11/01/42 | 5/20 at 100.00 | AA | | 296,641 | |
| | 600 | | New York State Housing Finance Agency, Affordable Housing Revenue Bonds, Series 2009B, 4.500%, 11/01/29 | 5/19 at 100.00 | Aa2 | | 612,408 | |
| | 405 | | New York State Housing Finance Agency, Affordable Housing Revenue, Series 2007A, 5.250%, 11/01/38 (Alternative Minimum Tax) | 11/17 at 100.00 | Aa2 | | 412,898 | |
| | 12,030 | | Total Housing/Multifamily | | | | 12,403,223 | |
| | Principal | | | Optional Call | | | | |
| | Amount (000) | | Description (1) | Provisions (2) | Ratings (3) | | Value | |
| | | | Housing/Single Family – 3.8% (2.7% of Total Investments) | | | | | |
| $ | 645 | | Guam Housing Corporation, Mortgage-Backed Securities Program Single Family Mortgage Revenue Bonds, Series 1998A, 5.750%, 9/01/31 (Alternative Minimum Tax) | No Opt. Call | N/R | $ | 733,610 | |
| | 485 | | New York State Mortgage Agency, Homeowner Mortgage Revenue Bonds, 2007 Series 145, 5.125%, 10/01/37 (Alternative Minimum Tax) | 4/17 at 100.00 | Aa1 | | 493,715 | |
| | 1,350 | | New York State Mortgage Agency, Homeowner Mortgage Revenue Bonds, Series 130, 4.650%, 4/01/27 (Alternative Minimum Tax) | 4/15 at 100.00 | Aa1 | | 1,351,634 | |
| | 510 | | New York State Mortgage Agency, Homeowner Mortgage Revenue Bonds, Series 148, 2007, 5.200%, 10/01/32 (Alternative Minimum Tax) | 10/17 at 100.00 | Aa1 | | 524,759 | |
| | 1,370 | | New York State Mortgage Agency, Homeowner Mortgage Revenue Bonds, Series 82, 5.650%, 4/01/30 (Alternative Minimum Tax) | 10/10 at 100.00 | Aa1 | | 1,370,986 | |
| | 840 | | New York State Mortgage Agency, Mortgage Revenue Bonds, Thirty-Third Series A, 4.750%, 4/01/23 (Alternative Minimum Tax) | 4/13 at 101.00 | Aaa | | 857,396 | |
| | 5,200 | | Total Housing/Single Family | | | | 5,332,100 | |
| | | | Long-Term Care – 5.6% (4.0% of Total Investments) | | | | | |
| | 2,000 | | Dormitory Authority of the State of New York, FHA-Insured Nursing Home Mortgage Revenue Bonds, Gurwin Jewish Geriatric Center of Long Island, Series 2005A, 4.900%, 2/15/41 | 2/15 at 100.00 | AA | | 2,048,900 | |
| | 600 | | Dormitory Authority of the State of New York, GNMA Collateralized Revenue Bonds, Cabrini of Westchester Project, Series 2006, 5.200%, 2/15/41 | 2/17 at 103.00 | A– | | 623,286 | |
| | 375 | | Dormitory Authority of the State of New York, Non-State Supported Debt, Ozanam Hall of Queens Nursing Home Revenue Bonds, Series 2006, 5.000%, 11/01/31 | 11/16 at 100.00 | A1 | | 379,594 | |
| | 250 | | Dormitory Authority of the State of New York, Revenue Bonds, Providence Rest, Series 2005, 5.000%, 7/01/35 – ACA Insured | 7/15 at 100.00 | N/R | | 171,275 | |
| | 905 | | East Rochester Housing Authority, New York, Senior Living Revenue Bonds, Woodland Village Project, Series 2006, 5.500%, 8/01/33 | 8/16 at 101.00 | N/R | | 805,857 | |
| | 255 | | New York City Industrial Development Agency, New York, Civic Facility Revenue Bonds, Special Needs Facilities Pooled Program, Series 2000, 8.125%, 7/01/19 | 7/11 at 101.00 | N/R | | 260,498 | |
| | 750 | | New York City Industrial Development Agency, New York, Civic Facility Revenue Bonds, Special Needs Facilities Pooled Program, Series 2001A-1, 7.250%, 7/01/16 | 7/11 at 101.00 | N/R | | 763,598 | |
| | | | New York City Industrial Development Agency, New York, Civic Facility Revenue Bonds, Special Needs Facilities Pooled Program, Series 2008A-1: | | | | | |
| | 1,140 | | 5.500%, 7/01/18 | 7/16 at 101.00 | N/R | | 1,069,582 | |
| | 635 | | 5.800%, 7/01/23 | 7/16 at 101.00 | N/R | | 586,740 | |
| | 1,175 | | Yonkers Industrial Development Agency, New York, FHA-Insured Mortgage Revenue Bonds, Michael Malotz Skilled Nursing Pavilion, Series 1999, 5.450%, 2/01/29 – NPFG Insured | 2/11 at 100.00 | A | | 1,181,040 | |
| | 8,085 | | Total Long-Term Care | | | | 7,890,370 | |
| | | | Materials – 0.2% (0.2% of Total Investments) | | | | | |
| | 330 | | Jefferson County Industrial Development Agency, New York, Solid Waste Disposal Revenue Bonds, International Paper Company Project, Series 2003A, 5.200%, 12/01/20 (Alternative Minimum Tax) | 12/13 at 100.00 | BBB | | 332,657 | |
| | | | Tax Obligation/General – 11.8% (8.3% of Total Investments) | | | | | |
| | 3,700 | | New York City, New York, General Obligation Bonds, Fiscal Series 2007A, 5.000%, 8/01/25 | 8/16 at 100.00 | AA | | 4,095,197 | |
| | 2,000 | | New York City, New York, General Obligation Bonds, Fiscal Series 2010C, 5.000%, 8/01/23 | 8/19 at 100.00 | AA | | 2,285,360 | |
| | 1,000 | | New York City, New York, General Obligation Bonds, Series 2004C-1, 5.250%, 8/15/16 (UB) | 8/14 at 100.00 | AA | | 1,135,180 | |
| | 6,590 | | New York City, New York, General Obligation Bonds, Series 2007D-1, 5.125%, 12/01/25 (UB) | 12/17 at 100.00 | AA | | 7,385,479 | |
| | | | Rochester, New York, General Obligation Bonds, Series 1999: | | | | | |
| | 720 | | 5.250%, 10/01/18 – NPFG Insured | No Opt. Call | Aa3 | | 859,349 | |
| | 720 | | 5.250%, 10/01/19 – NPFG Insured | No Opt. Call | Aa3 | | 861,862 | |
| | 14,730 | | Total Tax Obligation/General | | | | 16,622,427 | |
Nuveen Investments 37
| | | Nuveen New York Dividend Advantage Municipal Fund (continued) |
| NAN | | Portfolio of Investments September 30, 2010 |
| | Principal | | | Optional Call | | | | |
| | Amount (000) | | Description (1) | Provisions (2) | Ratings (3) | | Value | |
| | | | Tax Obligation/Limited – 32.3% (22.7% of Total Investments) | | | | | |
| $ | 1,000 | | Battery Park City Authority, New York, Senior Revenue Bonds, Series 2003A, 5.250%, 11/01/21 | 11/13 at 100.00 | AAA | $ | 1,112,990 | |
| | 590 | | Dormitory Authority of the State of New York, Department of Health Revenue Bonds, Series 2005A, 5.250%, 7/01/24 – CIFG Insured | 7/15 at 100.00 | AA– | | 638,303 | |
| | 1,850 | | Dormitory Authority of the State of New York, Secured Hospital Revenue Refunding Bonds, Wyckoff Heights Medical Center, Series 1998H, 5.300%, 8/15/21 – NPFG Insured | 2/11 at 100.00 | AA– | | 1,852,738 | |
| | 185 | | Dormitory Authority of the State of New York, State Personal Income Tax Revenue Bonds, Series 2005F, 5.000%, 3/15/21 – AGM Insured | 3/15 at 100.00 | AAA | | 207,768 | |
| | 550 | | Erie County Industrial Development Agency, New York, School Facility Revenue Bonds, Buffalo City School District, Series 2004, 5.750%, 5/01/26 – AGM Insured (UB) | 5/14 at 100.00 | AA+ | | 598,312 | |
| | | | Metropolitan Transportation Authority, New York, Dedicated Tax Fund Bonds, Series 2002A: | | | | | |
| | 2,000 | | 5.250%, 11/15/25 – AGM Insured | 11/12 at 100.00 | AAA | | 2,131,940 | |
| | 2,000 | | 5.000%, 11/15/30 | 11/12 at 100.00 | AA | | 2,117,260 | |
| | 1,000 | | Metropolitan Transportation Authority, New York, State Service Contract Refunding Bonds, Series 2002A, 5.125%, 1/01/29 | 7/12 at 100.00 | AA– | | 1,050,250 | |
| | 1,130 | | Monroe Newpower Corporation, New York, Power Facilities Revenue Bonds, Series 2003, 5.500%, 1/01/34 | 1/13 at 102.00 | BBB | | 1,104,100 | |
| | | | New York City Sales Tax Asset Receivable Corporation, New York, Dedicated Revenue Bonds, Local Government Assistance Corporation, Series 2004A: | | | | | |
| | 1,100 | | 5.000%, 10/15/25 – NPFG Insured (UB) | 10/14 at 100.00 | AAA | | 1,218,162 | |
| | 810 | | 5.000%, 10/15/26 – NPFG Insured (UB) | 10/14 at 100.00 | AAA | | 888,975 | |
| | 2,375 | | 5.000%, 10/15/29 – AMBAC Insured (UB) | 10/14 at 100.00 | AAA | | 2,606,563 | |
| | 2,100 | | New York City Transitional Finance Authority, New York, Building Aid Revenue Bonds, Fiscal Series 2007S-2, 5.000%, 1/15/28 – FGIC Insured | 1/17 at 100.00 | AA– | | 2,247,609 | |
| | 1,670 | | New York City Transitional Finance Authority, New York, Future Tax Secured Bonds, Fiscal Series 2003E, 5.000%, 2/01/23 – FGIC Insured | 2/13 at 100.00 | AAA | | 1,798,373 | |
| | 2,115 | | New York City Transitional Finance Authority, New York, Future Tax Secured Bonds, Fiscal Series 2007C-1, 5.000%, 11/01/27 | 11/17 at 100.00 | AAA | | 2,356,723 | |
| | 1,000 | | New York State Environmental Facilities Corporation, Infrastructure Revenue Bonds, Series 2003A, 5.000%, 3/15/21 | 3/14 at 100.00 | AA– | | 1,062,080 | |
| | 2,920 | | New York State Environmental Facilities Corporation, State Personal Income Tax Revenue Bonds, Series 2008A, 5.000%, 12/15/26 (UB) | 12/17 at 100.00 | AAA | | 3,254,836 | |
| | 1,190 | | New York State Housing Finance Agency, State Personal Income Tax Revenue Bonds, Economic Development and Housing, Series 2006A, 5.000%, 3/15/36 | 9/15 at 100.00 | AAA | | 1,249,298 | |
| | 1,000 | | New York State Thruway Authority, Highway and Bridge Trust Fund Bonds, Second General, Series 2005B, 5.000%, 4/01/21 – AMBAC Insured | 10/15 at 100.00 | AA | | 1,126,300 | |
| | 1,625 | | New York State Thruway Authority, Highway and Bridge Trust Fund Bonds, Series 2007, 5.000%, 4/01/27 | 10/17 at 100.00 | AA | | 1,783,161 | |
| | 3,400 | | New York State Thruway Authority, Highway and Bridge Trust Fund Bonds, Series 2005B, 5.500%, 4/01/20 – AMBAC Insured (UB) | No Opt. Call | AA | | 4,165,442 | |
| | | | New York State Thruway Authority, State Personal Income Tax Revenue Bonds, Series 2010A: | | | | | |
| | 510 | | 5.000%, 3/15/29 | 9/20 at 100.00 | AAA | | 574,989 | |
| | 1,000 | | 5.000%, 3/15/30 | 9/20 at 100.00 | AAA | | 1,119,390 | |
| | | | New York State Tobacco Settlement Financing Corporation, Tobacco Settlement Asset-Backed and State Contingency Contract-Backed Bonds, Series 2003A-1: | | | | | |
| | 4,000 | | 5.250%, 6/01/20 – AMBAC Insured | 6/13 at 100.00 | AA– | | 4,344,680 | |
| | 2,000 | | 5.250%, 6/01/22 – AMBAC Insured | 6/13 at 100.00 | AA– | | 2,155,740 | |
| | 1,000 | | New York State Tobacco Settlement Financing Corporation, Tobacco Settlement Asset-Backed and State Contingency Contract-Backed Bonds, Series 2003B-1C, 5.500%, 6/01/21 | 6/13 at 100.00 | AA– | | 1,085,070 | |
| | 1,330 | | New York State Urban Development Corporation, State Personal Income Tax Revenue Bonds, Tender Option Bond Trust 09-6W, 12.855%, 3/15/37 (IF) | 3/17 at 100.00 | AAA | | 1,574,866 | |
| | 41,450 | | Total Tax Obligation/Limited | | | | 45,425,918 | |
| | Principal | | | Optional Call | | | | |
| | Amount (000) | | Description (1) | Provisions (2) | Ratings (3) | | Value | |
| | | | Transportation – 14.3% (10.1% of Total Investments) | | | | | |
| $ | 310 | | Albany Parking Authority, New York, Revenue Bonds, Series 2001A, 5.625%, 7/15/25 | 7/11 at 101.00 | BBB+ | $ | 316,150 | |
| | 3,000 | | Metropolitan Transportation Authority, New York, Transportation Revenue Bonds, Series 2007B, 5.000%, 11/15/33 | 11/17 at 100.00 | A | | 3,135,060 | |
| | 1,000 | | Metropolitan Transportation Authority, New York, Transportation Revenue Refunding Bonds, Series 2002A, 5.125%, 11/15/22 – FGIC Insured | 11/12 at 100.00 | A | | 1,066,180 | |
| | 1,750 | | New York City Industrial Development Agency, New York, American Airlines-JFK International Airport Special Facility Revenue Bonds, Series 2005, 7.750%, 8/01/31 (Alternative Minimum Tax) | 8/16 at 101.00 | B– | | 1,855,315 | |
| | | | New York City Industrial Development Agency, New York, Civic Facility Revenue Bonds, Bronx Parking Development Company, LLC Project, Series 2007: | | | | | |
| | 200 | | 5.750%, 10/01/37 | 10/17 at 100.00 | N/R | | 135,228 | |
| | 2,000 | | 5.875%, 10/01/46 | 10/17 at 102.00 | N/R | | 1,342,520 | |
| | 105 | | New York City Industrial Development Agency, New York, Special Facilities Revenue Bonds, British Airways PLC, Series 1998, 5.250%, 12/01/32 (Alternative Minimum Tax) | 12/10 at 100.00 | BB– | | 84,822 | |
| | 1,000 | | New York City Industrial Development Agency, New York, Special Facilities Revenue Bonds, JFK Airport – American Airlines Inc., Series 2002B, 8.500%, 8/01/28 (Alternative Minimum Tax) | 8/12 at 101.00 | B– | | 1,038,970 | |
| | 900 | | New York City Industrial Development Agency, New York, Special Facilities Revenue Bonds, Terminal One Group JFK Project, Series 2005, 5.500%, 1/01/24 (Alternative Minimum Tax) | 1/16 at 100.00 | A3 | | 942,048 | |
| | | | New York City Industrial Development Authority, New York, JetBlue,: | | | | | |
| | 450 | | 5.000%, 5/15/20 (Alternative Minimum Tax) | 5/12 at 100.00 | B– | | 407,619 | |
| | 1,000 | | 5.125%, 5/15/30 (Alternative Minimum Tax) | 5/12 at 100.00 | B– | | 856,580 | |
| | 160 | | New York State Thruway Authority, General Revenue Bonds, Series 2005F, 5.000%, 1/01/30 – AMBAC Insured | 1/15 at 100.00 | A+ | | 167,178 | |
| | 700 | | New York State Thruway Authority, General Revenue Bonds, Series 2005G, 5.000%, 1/01/30 – AGM Insured (UB) | 7/15 at 100.00 | AA+ | | 744,779 | |
| | 500 | | Niagara Frontier Airport Authority, New York, Airport Revenue Bonds, Buffalo Niagara International Airport, Series 1999A, 5.625%, 4/01/29 – NPFG Insured (Alternative Minimum Tax) | 10/10 at 100.50 | A | | 501,840 | |
| | | | Port Authority of New York and New Jersey, Consolidated Revenue Bonds, One Hundred Fortieth Series 2005: | | | | | |
| | 1,300 | | 5.000%, 12/01/28 – SYNCORA GTY Insured | 6/15 at 101.00 | Aa2 | | 1,408,069 | |
| | 615 | | 5.000%, 12/01/31 – SYNCORA GTY Insured | 6/15 at 101.00 | Aa2 | | 657,564 | |
| | 440 | | Port Authority of New York and New Jersey, Consolidated Revenue Bonds, One Hundred Forty Eighth Series 2007, Trust 2920, 17.154%, 8/15/32 – AGM Insured (IF) | 8/17 at 100.00 | AA+ | | 582,683 | |
| | 1,000 | | Triborough Bridge and Tunnel Authority, New York, General Purpose Revenue Bonds, Series 2001A, 5.250%, 1/01/16 | 1/12 at 100.00 | Aa2 | | 1,054,180 | |
| | 2,500 | | Triborough Bridge and Tunnel Authority, New York, General Purpose Revenue Refunding Bonds, Series 2002B, 5.000%, 11/15/21 | 11/12 at 100.00 | Aa2 | | 2,693,650 | |
| | 1,000 | | Triborough Bridge and Tunnel Authority, New York, Subordinate Lien General Purpose Revenue Refunding Bonds, Tender Option Bond Trust 1184, 9.051%, 5/15/16 (IF) | No Opt. Call | Aa2 | | 1,156,900 | |
| | 19,930 | | Total Transportation | | | | 20,147,335 | |
| | | | U.S. Guaranteed – 1.7% (1.2% of Total Investments) (4) | | | | | |
| | 390 | | Albany Parking Authority, New York, Revenue Bonds, Series 2001A, 5.625%, 7/15/25 (Pre-refunded 7/15/11) | 7/11 at 101.00 | BBB+ (4) | | 410,541 | |
| | 535 | | Metropolitan Transportation Authority, New York, Commuter Facilities Revenue Bonds, Series 1997B, 5.000%, 7/01/20 – AMBAC Insured (ETM) | 12/10 at 100.00 | N/R (4) | | 536,717 | |
| | 1,400 | | Yonkers Industrial Development Agency, New York, Revenue Bonds, Community Development Properties – Yonkers Inc. Project, Series 2001A, 6.625%, 2/01/26 (Pre-refunded 2/01/11) | 2/11 at 100.00 | Baa3 (4) | | 1,428,252 | |
| | 2,325 | | Total U.S. Guaranteed | | | | 2,375,510 | |
Nuveen Investments 39
| | | Nuveen New York Dividend Advantage Municipal Fund (continued) |
| NAN | | Portfolio of Investments September 30, 2010 |
| | Principal | | | Optional Call | | | | |
| | Amount (000) | | Description (1) | Provisions (2) | Ratings (3) | | Value | |
| | | | Utilities – 6.4% (4.5% of Total Investments) | | | | | |
| $ | 1,300 | | Chautauqua County Industrial Development Agency, New York, Exempt Facility Revenue Bonds, NRG Dunkirk Power Project, Series 2009, 5.875%, 4/01/42 | 2/20 at 100.00 | Baa3 | $ | 1,352,442 | |
| | | | Long Island Power Authority, New York, Electric System General Revenue Bonds, Series 2006A: | | | | | |
| | 2,500 | | 5.000%, 12/01/23 – FGIC Insured | 6/16 at 100.00 | A | | 2,725,150 | |
| | 500 | | 5.000%, 12/01/24 – FGIC Insured | 6/16 at 100.00 | A | | 542,795 | |
| | 1,400 | | Nassau County Industrial Development Authority, New York, Keyspan Glenwood Energy Project, Series 2003, 5.250%, 6/01/27 (Alternative Minimum Tax) | 6/13 at 100.00 | A– | | 1,431,527 | |
| | 250 | | Niagara County Industrial Development Agency, New York, Solid Waste Disposal Facility Revenue Bonds, American Ref-Fuel Company of Niagara LP, Series 2001C, 5.625%, 11/15/24 (Mandatory put 11/15/14) (Alternative Minimum Tax) | 11/11 at 101.00 | Baa2 | | 256,542 | |
| | 600 | | Niagara County Industrial Development Agency, New York, Solid Waste Disposal Facility Revenue Refunding Bonds, American Ref-Fuel Company of Niagara LP, Series 2001B, 5.550%, 11/15/24 (Mandatory put 11/15/13) (Alternative Minimum Tax) | 11/11 at 101.00 | Baa2 | | 615,719 | |
| | 2,000 | | Power Authority of the State of New York, General Revenue Bonds, Series 2000A, 5.250%, 11/15/30 | 11/10 at 100.00 | Aa2 | | 2,003,959 | |
| | 8,550 | | Total Utilities | | | | 8,928,134 | |
| | | | Water and Sewer – 2.5% (1.7% of Total Investments) | | | | | |
| | 1,130 | | New York City Municipal Water Finance Authority, New York, Water and Sewerage System Revenue Bonds, Fiscal Series 2003A, 5.375%, 6/15/19 | 6/12 at 100.00 | AAA | | 1,217,100 | |
| | 2,000 | | New York City Municipal Water Finance Authority, New York, Water and Sewerage System Revenue Bonds, Second Generation Resolution, Fiscal 2010 Series 2009BB, 5.000%, 6/15/27 | 6/19 at 100.00 | AA+ | | 2,254,620 | |
| | 3,130 | | Total Water and Sewer | | | | 3,471,720 | |
| $ | 192,075 | | Total Investments (cost $192,956,922) – 142.2% | | | | 199,844,726 | |
| | | | Floating Rate Obligations – (12.6)% | | | | (17,735,000 | ) |
| | | | MuniFund Term Preferred Shares, at Liquidation Value – (21.3)% (5) | | | | (30,000,000 | ) |
| | | | Other Assets Less Liabilities – 7.3% | | | | 10,314,963 | |
| | | | Auction Rate Preferred Shares, at Liquidation Value – (15.6)% (5) | | | | (21,900,000 | ) |
| | | | Net Assets Applicable to Common Shares – 100% | | | $ | 140,524,689 | |
| (1) | | All percentages shown in the Portfolio of Investments are based on net assets applicable to Common shares unless otherwise noted. |
| (2) | | Optional Call Provisions (not covered by the report of independent registered public accounting firm): Dates (month and year) and prices of the earliest optional call or redemption. There may be other call provisions at varying prices at later dates. Certain mortgage-backed securities may be subject to periodic principal paydowns. |
| (3) | | Ratings (not covered by the report of independent registered public accounting firm): Using the highest of Standard & Poor’s Group (“Standard & Poor’s”), Moody’s Investor Service, Inc. (“Moody’s”) or Fitch, Inc. (“Fitch”) rating. Ratings below BBB by Standard & Poor’s, Baa by Moody’s or BBB by Fitch are considered to be below investment grade. Holdings designated N/R are not rated by any of these national rating agencies. |
| (4) | | Backed by an escrow or trust containing sufficient U.S. Government or U.S. Government agency securities, which ensure the timely payment of principal and interest. Such investments are normally considered to be equivalent to AAA rated securities. |
| (5) | | MuniFund Term Preferred Shares and Auction Rate Preferred Shares, at Liquidation Value as a percentage of Total Investments are 15.0% and 11.0%, respectively. |
| N/R | | Not rated. |
| (ETM) | | Escrowed to maturity. |
| (IF) | | Inverse floating rate investment. |
| (UB) | | Underlying bond of an inverse floating rate trust reflected as a financing transaction. See Notes to Financial Statements, Footnote 1 – General Information and Significant Accounting Policies, Inverse Floating Rate Securities for more information. |
See accompanying notes to financial statements.
40 Nuveen Investments
| | | Nuveen New York Dividend Advantage Municipal Fund 2 |
| NXK | | Portfolio of Investments |
| | | September 30, 2010 |
| | Principal | | | Optional Call | | | | |
| | Amount (000) | | Description (1) | Provisions (2) | Ratings (3) | | Value | |
| | | | Consumer Discretionary – 2.3% (1.6% of Total Investments) | | | | | |
| $ | 700 | | New York City Industrial Development Agency, New York, Liberty Revenue Bonds, IAC/InterActiveCorp, Series 2005, 5.000%, 9/01/35 | 9/15 at 100.00 | BB+ | $ | 652,883 | |
| | 1,950 | | Seneca Nation of Indians Capital Improvements Authority, New York, Special Obligation Bonds, Series 2007A, 5.000%, 12/01/23 | 6/17 at 100.00 | BB | | 1,625,930 | |
| | 2,650 | | Total Consumer Discretionary | | | | 2,278,813 | |
| | | | Consumer Staples – 2.3% (1.5% of Total Investments) | | | | | |
| | 265 | | New York Counties Tobacco Trust II, Tobacco Settlement Pass-Through Bonds, Series 2001, 5.250%, 6/01/25 | 6/11 at 101.00 | BBB | | 252,977 | |
| | 500 | | New York Counties Tobacco Trust III, Tobacco Settlement Pass-Through Bonds, Series 2003, 5.750%, 6/01/33 | 6/13 at 100.00 | BBB | | 482,775 | |
| | 125 | | Rensselaer Tobacco Asset Securitization Corporation, New York, Tobacco Settlement Asset-Backed Bonds, Series 2001A, 5.200%, 6/01/25 | 6/12 at 100.00 | BBB | | 118,714 | |
| | | | TSASC Inc., New York, Tobacco Asset-Backed Bonds, Series 2006: | | | | | |
| | 575 | | 4.750%, 6/01/22 | 6/16 at 100.00 | BBB | | 577,547 | |
| | 835 | | 5.000%, 6/01/26 | 6/16 at 100.00 | BBB | | 795,763 | |
| | 2,300 | | Total Consumer Staples | | | | 2,227,776 | |
| | | | Education and Civic Organizations – 20.8% (14.0% of Total Investments) | | | | | |
| | 260 | | Albany Industrial Development Agency, New York, Revenue Bonds, Albany Law School, Series 2007A, 5.000%, 7/01/31 | 7/17 at 100.00 | BBB | | 264,300 | |
| | 110 | | Albany Industrial Development Agency, New York, Revenue Bonds, Brighter Choice Charter Schools, Series 2007A, 5.000%, 4/01/37 | 4/17 at 100.00 | N/R | | 99,677 | |
| | 1,225 | | Brooklyn Arena Local Development Corporation, New York, Payment in Lieu of Taxes Revenue Bonds, Barclays Center Project, Series 2009, 6.250%, 7/15/40 | No Opt. Call | BBB– | | 1,335,679 | |
| | 90 | | Cattaraugus County Industrial Development Agency, New York, Revenue Bonds, St. Bonaventure University, Series 2006, 5.000%, 5/01/23 | 5/16 at 100.00 | BBB– | | 90,606 | |
| | 1,125 | | Dormitory Authority of the State of New York, General Revenue Bonds, Manhattan College, Series 2007A, 5.000%, 7/01/41 – RAAI Insured | 7/17 at 100.00 | N/R | | 1,125,551 | |
| | 1,000 | | Dormitory Authority of the State of New York, Housing Revenue Bonds, Fashion Institute of Technology, Series 2007, 5.250%, 7/01/29 – FGIC Insured | No Opt. Call | A | | 1,069,920 | |
| | 2,000 | | Dormitory Authority of the State of New York, Insured Revenue Bonds, New York Medical College, Series 1998, 5.000%, 7/01/21 – NPFG Insured | 1/11 at 100.00 | A | | 2,006,340 | |
| | 1,000 | | Dormitory Authority of the State of New York, Lease Revenue Bonds, State University Dormitory Facilities, Series 2003B, 5.250%, 7/01/32 (Mandatory put 7/01/13) – SYNCORA GTY Insured | No Opt. Call | Aa2 | | 1,108,320 | |
| | 485 | | Dormitory Authority of the State of New York, Lease Revenue Bonds, State University Dormitory Facilities, Series 2004A, 5.000%, 7/01/29 – NPFG Insured | 7/15 at 100.00 | Aa2 | | 517,670 | |
| | 1,000 | | Dormitory Authority of the State of New York, Revenue Bonds, Canisius College, Series 2000, 5.250%, 7/01/30 – NPFG Insured | 7/11 at 101.00 | A | | 1,008,660 | |
| | 280 | | Dormitory Authority of the State of New York, Revenue Bonds, St. Joseph’s College, Series 2010, 5.250%, 7/01/35 | 7/20 at 100.00 | Baa1 | | 289,920 | |
| | 1,265 | | Dormitory Authority of the State of New York, Third General Resolution Consolidated Revenue Bonds, City University System, Series 1998-1, 5.250%, 7/01/25 – FGIC Insured | 1/11 at 100.00 | AA– | | 1,270,452 | |
| | 265 | | Hempstead Town Industrial Development Agency, New York, Revenue Bonds, Adelphi University, Civic Facility Project, Series 2005, 5.000%, 10/01/35 | 10/15 at 100.00 | A | | 271,951 | |
| | 1,475 | | Hempstead Town Local Development Corporation, New York, Revenue Bonds, Molloy College Project, Series 2009, 5.750%, 7/01/39 | 7/19 at 100.00 | BBB+ | | 1,582,778 | |
| | 2,190 | | Monroe County Industrial Development Agency, New York, Civic Facility Revenue Bonds, St. John Fisher College, Series 2001, 5.250%, 6/01/26 – RAAI Insured | 6/11 at 102.00 | N/R | | 2,203,907 | |
| | 245 | | New York City Industrial Development Agency, New York, Civic Facility Revenue Bonds, St. Francis College, Series 2004, 5.000%, 10/01/34 | 10/14 at 100.00 | A– | | 245,880 | |
| | 1,100 | | New York City Industrial Development Agency, New York, Civic Facility Revenue Bonds, YMCA of Greater New York, Series 2002, 5.250%, 8/01/21 | 2/11 at 100.00 | A– | | 1,105,104 | |
| | 1,120 | | New York City Industrial Development Agency, New York, PILOT Revenue Bonds, Queens Baseball Stadium Project, Series 2006, 4.750%, 1/01/42 – AMBAC Insured | 1/17 at 100.00 | BB+ | | 1,002,086 | |
Nuveen Investments 41
| | | Nuveen New York Dividend Advantage Municipal Fund 2 (continued) |
| NXK | | Portfolio of Investments September 30, 2010 |
| | Principal | | | Optional Call | | | | |
| | Amount (000) | | Description (1) | Provisions (2) | Ratings (3) | | Value | |
| | | | Education and Civic Organizations (continued) | | | | | |
| $ | 1,460 | | New York City Industrial Development Authority, New York, PILOT Revenue Bonds, Yankee Stadium Project, Series 2006, 4.500%, 3/01/39 – FGIC Insured | 9/16 at 100.00 | BBB– | $ | 1,352,325 | |
| | 1,500 | | New York Liberty Development Corporation, Second Priority Liberty Revenue Refunding Bonds, Bank of America Tower at One Bryant Park Project, Series 2010, 5.625%, 1/15/46 | 1/20 at 100.00 | AA | | 1,592,925 | |
| | 170 | | Seneca County Industrial Development Authority, New York, Revenue Bonds, New York Chiropractic College, Series 2007, 5.000%, 10/01/27 | 10/17 at 100.00 | BBB | | 174,544 | |
| | 300 | | Troy Capital Resource Corporation, New York, Revenue Bonds, Rensselaer Polytechnic Institute, Series 2010A, 5.125%, 9/01/40 | 9/20 at 100.00 | A | | 311,934 | |
| | 340 | | Yonkers Industrial Development Agency, New York, Civic Facility Revenue Bonds, Sarah Lawrence College Project, Series 2001A Remarketed, 6.000%, 6/01/41 | 6/19 at 100.00 | A | | 364,643 | |
| | 20,005 | | Total Education and Civic Organizations | | | | 20,395,172 | |
| | | | Financials – 2.0% (1.4% of Total Investments) | | | | | |
| | 500 | | Liberty Development Corporation, New York, Goldman Sachs Headquarter Revenue Bonds, Series 2005, 5.250%, 10/01/35 | No Opt. Call | A1 | | 530,445 | |
| | 1,305 | | Liberty Development Corporation, New York, Goldman Sachs Headquarters Revenue Bonds Series 2007, 5.500%, 10/01/37 | No Opt. Call | A1 | | 1,436,544 | |
| | 1,805 | | Total Financials | | | | 1,966,989 | |
| | | | Health Care – 20.9% (14.2% of Total Investments) | | | | | |
| | 3,000 | | Dormitory Authority of the State of New York, FHA-Insured Mortgage Hospital Revenue Bonds, Montefiore Medical Center, Series 1999, 5.500%, 8/01/38 – AMBAC Insured | 2/11 at 100.50 | N/R | | 3,018,240 | |
| | 2,505 | | Dormitory Authority of the State of New York, FHA-Insured Mortgage Revenue Bonds, New York Hospital Medical Center of Queens, Series 1999, 5.550%, 8/15/29 – AMBAC Insured | 2/11 at 100.50 | N/R | | 2,521,283 | |
| | 1,620 | | Dormitory Authority of the State of New York, FHA-Insured Revenue Bonds, Montefiore Medical Center, Series 2005, 5.000%, 2/01/22 – FGIC Insured | 2/15 at 100.00 | A | | 1,707,221 | |
| | 1,700 | | Dormitory Authority of the State of New York, FHA-Insured Revenue Bonds, St. Lukes Roosevelt Hospital, Series 2005, 4.900%, 8/15/31 | 8/15 at 100.00 | N/R | | 1,743,146 | |
| | 150 | | Dormitory Authority of the State of New York, Highland Hospital of Rochester Revenue Bonds, Series 2010, 5.200%, 7/01/32 | 7/20 at 100.00 | A2 | | 155,565 | |
| | 500 | | Dormitory Authority of the State of New York, Insured Revenue Bonds, Franciscan Health Partnership Obligated Group – Frances Shervier Home and Hospital, Series 1997, 5.500%, 7/01/17 – RAAI Insured | 1/11 at 100.00 | A3 | | 500,515 | |
| | | | Dormitory Authority of the State of New York, Revenue Bonds, Lenox Hill Hospital Obligated Group, Series 2001: | | | | | |
| | 710 | | 5.375%, 7/01/20 | 7/11 at 101.00 | Baa3 | | 714,473 | |
| | 500 | | 5.500%, 7/01/30 | 7/11 at 101.00 | Baa3 | | 500,365 | |
| | 2,300 | | Dormitory Authority of the State of New York, Revenue Bonds, Memorial Sloan Kettering Cancer Center, Series 2006, 5.000%, 7/01/35 (UB) | 7/16 at 100.00 | AA | | 2,403,178 | |
| | 505 | | Dormitory Authority of the State of New York, Revenue Bonds, New York and Presbyterian Hospital, Series 2004A, 5.250%, 8/15/15 – AGM Insured | 8/14 at 100.00 | AAA | | 561,363 | |
| | 1,500 | | Dormitory Authority of the State of New York, Revenue Bonds, NYU Hospitals Center, Series 2007B, 5.625%, 7/01/37 | 7/17 at 100.00 | BBB | | 1,567,020 | |
| | 500 | | Dormitory Authority of the State of New York, Revenue Bonds, Winthrop-South Nassau University Hospital Association, Series 2003A, 5.500%, 7/01/32 | 7/13 at 100.00 | Baa1 | | 505,290 | |
| | 290 | | Livingston County Industrial Development Agency, New York, Civic Facility Revenue Bonds, Nicholas H. Noyes Hospital, Series 2005, 6.000%, 7/01/30 | 1/11 at 100.00 | BB | | 278,316 | |
| | | | Madison County Industrial Development Agency, New York, Civic Facility Revenue Bonds, Oneida Health System, Series 2007A: | | | | | |
| | 275 | | 5.250%, 2/01/27 | No Opt. Call | BBB– | | 259,702 | |
| | 250 | | 5.500%, 2/01/32 | No Opt. Call | BBB– | | 237,930 | |
| | 250 | | Nassau County Industrial Development Agency, New York, Revenue Refunding Bonds, North Shore Health System Obligated Group, Series 2001B, 5.875%, 11/01/11 | No Opt. Call | Baa1 | | 254,768 | |
| | 850 | | New York City Health and Hospitals Corporation, New York, Health System Revenue Bonds, Series 1999A, 5.250%, 2/15/17 | 2/11 at 100.00 | Aa3 | | 852,525 | |
| | 500 | | New York City Health and Hospitals Corporation, New York, Health System Revenue Bonds, Series 2003A, 5.250%, 2/15/22 – AMBAC Insured | 2/13 at 100.00 | Aa3 | | 536,265 | |
42 Nuveen Investments
| | Principal | | | Optional Call | | | | |
| | Amount (000) | | Description (1) | Provisions (2) | Ratings (3) | | Value | |
| | | | Health Care (continued) | | | | | |
| $ | 475 | | New York City Industrial Development Agency, New York, Civic Facility Revenue Bonds, Staten Island University Hospital, Series 2001B, 6.375%, 7/01/31 | 7/12 at 100.00 | Baa3 | $ | 480,225 | |
| | 475 | | New York City Industrial Development Agency, New York, Civic Facility Revenue Bonds, Staten Island University Hospital, Series 2002C, 6.450%, 7/01/32 | 7/12 at 101.00 | Baa3 | | 484,714 | |
| | | | Suffolk County Industrial Development Agency, New York, Revenue Bonds, Huntington Hospital, Series 2002C: | | | | | |
| | 425 | | 6.000%, 11/01/22 | 11/12 at 100.00 | BBB+ | | 437,992 | |
| | 610 | | 5.875%, 11/01/32 | 11/12 at 100.00 | BBB+ | | 618,729 | |
| | 215 | | Yonkers Industrial Development Agency, New York, Revenue Bonds, St. John’s Riverside Hospital, Series 2001A, 7.125%, 7/01/31 | 7/11 at 101.00 | B– | | 215,905 | |
| | 20,105 | | Total Health Care | | | | 20,554,730 | |
| | | | Housing/Multifamily – 4.7% (3.1% of Total Investments) | | | | | |
| | 1,975 | | Amherst Industrial Development Agency, New York, Revenue Bonds, UBF Faculty/Student Housing Corporation, University of Buffalo Village Green Project, Series 2001A, 5.250%, 8/01/31 – AMBAC Insured | 8/11 at 102.00 | N/R | | 1,979,227 | |
| | 1,000 | | New York City Housing Development Corporation, New York, Multifamily Housing Revenue Bonds, Series 2001C-2, 5.400%, 11/01/33 (Alternative Minimum Tax) | 11/11 at 100.00 | AA | | 1,006,510 | |
| | | | New York City Housing Development Corporation, New York, Multifamily Housing Revenue Bonds, Series 2002A: | | | | | |
| | 455 | | 5.375%, 11/01/23 (Alternative Minimum Tax) | 5/12 at 100.00 | AA | | 462,266 | |
| | 225 | | 5.500%, 11/01/34 (Alternative Minimum Tax) | 5/12 at 100.00 | AA | | 227,367 | |
| | 500 | | New York City Housing Development Corporation, New York, Multifamily Housing Revenue Bonds, Series 2004A, 5.250%, 11/01/30 | 5/14 at 100.00 | AA | | 515,445 | |
| | 70 | | New York City Housing Development Corporation, New York, Multifamily Housing Revenue Bonds, Series 2010-D1A, 5.000%, 11/01/42 | 5/20 at 100.00 | AA | | 71,603 | |
| | 290 | | New York State Housing Finance Agency, Affordable Housing Revenue, Series 2007A, 5.250%, 11/01/38 (Alternative Minimum Tax) | 11/17 at 100.00 | Aa2 | | 295,655 | |
| | 4,515 | | Total Housing/Multifamily | | | | 4,558,073 | |
| | | | Housing/Single Family – 2.7% (1.8% of Total Investments) | | | | | |
| | 335 | | New York State Mortgage Agency, Homeowner Mortgage Revenue Bonds, 2007 Series 145, 5.125%, 10/01/37 (Alternative Minimum Tax) | 4/17 at 100.00 | Aa1 | | 341,020 | |
| | 950 | | New York State Mortgage Agency, Homeowner Mortgage Revenue Bonds, Series 130, 4.650%, 4/01/27 (Alternative Minimum Tax) | 4/15 at 100.00 | Aa1 | | 951,150 | |
| | 350 | | New York State Mortgage Agency, Homeowner Mortgage Revenue Bonds, Series 148, 2007, 5.200%, 10/01/32 (Alternative Minimum Tax) | 10/17 at 100.00 | Aa1 | | 360,129 | |
| | 980 | | New York State Mortgage Agency, Homeowner Mortgage Revenue Bonds, Series 82, 5.650%, 4/01/30 (Alternative Minimum Tax) | 10/10 at 100.00 | Aa1 | | 980,706 | |
| | 2,615 | | Total Housing/Single Family | | | | 2,633,005 | |
| | | | Long-Term Care – 5.6% (3.8% of Total Investments) | | | | | |
| | 450 | | Dormitory Authority of the State of New York, GNMA Collateralized Revenue Bonds, Cabrini of Westchester Project, Series 2006, 5.200%, 2/15/41 | 2/17 at 103.00 | A– | | 467,465 | |
| | 2,150 | | Dormitory Authority of the State of New York, Insured Revenue Bonds, Rehabilitation Association Pooled Loan Program 1, Series 2001A, 5.000%, 7/01/23 – AMBAC Insured | 7/11 at 102.00 | A2 | | 2,244,235 | |
| | 255 | | Dormitory Authority of the State of New York, Non-State Supported Debt, Ozanam Hall of Queens Nursing Home Revenue Bonds, Series 2006, 5.000%, 11/01/31 | 11/16 at 100.00 | A1 | | 258,124 | |
| | | | Dormitory Authority of the State of New York, Revenue Bonds, Providence Rest, Series 2005: | | | | | |
| | 50 | | 5.125%, 7/01/30 – ACA Insured | 7/15 at 100.00 | N/R | | 37,073 | |
| | 175 | | 5.000%, 7/01/35 – ACA Insured | 7/15 at 100.00 | N/R | | 119,893 | |
| | 635 | | East Rochester Housing Authority, New York, Senior Living Revenue Bonds, Woodland Village Project, Series 2006, 5.500%, 8/01/33 | 8/16 at 101.00 | N/R | | 565,436 | |
| | 525 | | New York City Industrial Development Agency, New York, Civic Facility Revenue Bonds, Special Needs Facilities Pooled Program, Series 2001A-1, 7.250%, 7/01/16 | 7/11 at 101.00 | N/R | | 534,518 | |
| | | | New York City Industrial Development Agency, New York, Civic Facility Revenue Bonds, Special Needs Facilities Pooled Program, Series 2008A-1: | | | | | |
| | 355 | | 5.500%, 7/01/18 | 7/16 at 101.00 | N/R | | 333,072 | |
| | 440 | | 5.800%, 7/01/23 | 7/16 at 101.00 | N/R | | 406,560 | |
Nuveen Investments 43
| | | Nuveen New York Dividend Advantage Municipal Fund 2 (continued) |
| NXK | | Portfolio of Investments September 30, 2010 |
| | Principal | | | Optional Call | | | | |
| | Amount (000) | | Description (1) | Provisions (2) | Ratings (3) | | Value | |
| | | | Long-Term Care (continued) | | | | | |
| $ | 430 | | Suffolk County Industrial Development Agency, New York, Civic Facility Revenue Bonds, Special Needs Facilities Pooled Program, Series 2008-B1, 5.500%, 7/01/18 | 7/16 at 100.00 | N/R | $ | 403,439 | |
| | 170 | | Yonkers Industrial Development Agency, New York, Civic Facilities Revenue Bonds, Special Needs Facilities Pooled Program Bonds, Series 2008-C1, 5.800%, 7/01/23 | 7/16 at 101.00 | N/R | | 157,080 | |
| | 5,635 | | Total Long-Term Care | | | | 5,526,895 | |
| | | | Materials – 0.2% (0.2% of Total Investments) | | | | | |
| | 230 | | Jefferson County Industrial Development Agency, New York, Solid Waste Disposal Revenue Bonds, International Paper Company Project, Series 2003A, 5.200%, 12/01/20 (Alternative Minimum Tax) | 12/13 at 100.00 | BBB | | 231,852 | |
| | | | Tax Obligation/General – 13.2% (8.9% of Total Investments) | | | | | |
| | 1,775 | | Bath Central School District, Steuben County, New York, General Obligation Bonds, Series 2002, 4.000%, 6/15/18 – FGIC Insured | 6/12 at 100.00 | A | | 1,825,392 | |
| | 45 | | New York City, New York, General Obligation Bonds, Fiscal Series 1998H, 5.375%, 8/01/27 – NPFG Insured | 2/11 at 100.00 | AA | | 45,150 | |
| | 2,000 | | New York City, New York, General Obligation Bonds, Fiscal Series 2005F-1, 5.000%, 9/01/19 – SYNCORA GTY Insured | 9/15 at 100.00 | AA | | 2,270,700 | |
| | 750 | | New York City, New York, General Obligation Bonds, Series 2004C-1, 5.250%, 8/15/16 (UB) | 8/14 at 100.00 | AA | | 851,385 | |
| | 2,600 | | New York City, New York, General Obligation Bonds, Fiscal Series 2006J-1, 5.000%, 6/01/25 (UB) | 6/16 at 100.00 | AA | | 2,875,285 | |
| | 4,540 | | New York City, New York, General Obligation Bonds, Series 2007D-1, 5.125%, 12/01/25 (UB) | 12/17 at 100.00 | AA | | 5,088,023 | |
| | 11,710 | | Total Tax Obligation/General | | | | 12,955,935 | |
| | | | Tax Obligation/Limited – 33.5% (22.6% of Total Investments) | | | | | |
| | 1,000 | | Battery Park City Authority, New York, Senior Revenue Bonds, Series 2003A, 5.250%, 11/01/21 | 11/13 at 100.00 | AAA | | 1,112,990 | |
| | 125 | | Dormitory Authority of the State of New York, State Personal Income Tax Revenue Bonds, Series 2005F, 5.000%, 3/15/21 – AGM Insured | 3/15 at 100.00 | AAA | | 140,384 | |
| | 1,500 | | Hudson Yards Infrastructure Corporation, New York, Revenue Bonds, Series 2006A, 5.000%, 2/15/47 | 2/17 at 100.00 | A | | 1,500,645 | |
| | 1,750 | | Metropolitan Transportation Authority, New York, Dedicated Tax Fund Bonds, Series 2002A, 5.250%, 11/15/25 – AGM Insured | 11/12 at 100.00 | AAA | | 1,865,448 | |
| | 560 | | Monroe Newpower Corporation, New York, Power Facilities Revenue Bonds, Series 2003, 5.500%, 1/01/34 | 1/13 at 102.00 | BBB | | 547,165 | |
| | | | New York City Sales Tax Asset Receivable Corporation, New York, Dedicated Revenue Bonds, Local Government Assistance Corporation, Series 2004A: | | | | | |
| | 1,140 | | 5.000%, 10/15/25 – NPFG Insured (UB) | 10/14 at 100.00 | AAA | | 1,262,459 | |
| | 835 | | 5.000%, 10/15/26 – NPFG Insured (UB) | 10/14 at 100.00 | AAA | | 916,413 | |
| | 750 | | 5.000%, 10/15/29 – AMBAC Insured (UB) | 10/14 at 100.00 | AAA | | 823,125 | |
| | 1,300 | | New York City Transitional Finance Authority, New York, Building Aid Revenue Bonds, Fiscal Series 2007S-2, 5.000%, 1/15/28 – FGIC Insured | 1/17 at 100.00 | AA– | | 1,391,377 | |
| | 1,000 | | New York City Transitional Finance Authority, New York, Future Tax Secured Bonds, Fiscal Series 2003E, 5.000%, 2/01/23 – FGIC Insured | 2/13 at 100.00 | AAA | | 1,076,870 | |
| | 1,200 | | New York City Transitional Finance Authority, New York, Future Tax Secured Bonds, Fiscal Series 2007B, 5.000%, 11/01/30 | 5/17 at 100.00 | AAA | | 1,309,080 | |
| | 1,460 | | New York City Transitional Finance Authority, New York, Future Tax Secured Bonds, Fiscal Series 2007C-1, 5.000%, 11/01/27 | 11/17 at 100.00 | AAA | | 1,626,863 | |
| | 1,000 | | New York City Transitional Finance Authority, New York, Future Tax Secured Refunding Bonds, Fiscal Series 2003D, 5.000%, 2/01/22 – NPFG Insured | 2/13 at 100.00 | AAA | | 1,078,070 | |
| | 3,775 | | New York City Transitional Finance Authority, New York, Future Tax Secured Revenue Bonds, Refunding Subordinate Lien Series 2010D, 5.000%, 11/01/25 | 5/20 at 100.00 | AAA | | 4,367,486 | |
| | 1,000 | | New York State Environmental Facilities Corporation, Infrastructure Revenue Bonds, Series 2003A, 5.000%, 3/15/21 | 3/14 at 100.00 | AA– | | 1,062,080 | |
| | 2,020 | | New York State Environmental Facilities Corporation, State Personal Income Tax Revenue Bonds, Series 2008A, 5.000%, 12/15/27 (UB) | 12/17 at 100.00 | AAA | | 2,239,289 | |
| | 840 | | New York State Housing Finance Agency, State Personal Income Tax Revenue Bonds, Economic Development and Housing, Series 2006A, 5.000%, 3/15/36 | 9/15 at 100.00 | AAA | | 881,857 | |
44 Nuveen Investments
| | Principal | | | Optional Call | | | | |
| | Amount (000) | | Description (1) | Provisions (2) | Ratings (3) | | Value | |
| | | | Tax Obligation/Limited (continued) | | | | | |
| | | | New York State Municipal Bond Bank Agency, Buffalo, Special Program Revenue Bonds, Series 2001A: | | | | | |
| $ | 1,070 | | 5.250%, 5/15/23 – AMBAC Insured | 5/11 at 100.00 | A1 | $ | 1,094,920 | |
| | 1,125 | | 5.250%, 5/15/24 – AMBAC Insured | 5/11 at 100.00 | A1 | | 1,151,201 | |
| | 1,125 | | New York State Thruway Authority, Highway and Bridge Trust Fund Bonds, Series 2007, 5.000%, 4/01/27 | 10/17 at 100.00 | AA | | 1,234,496 | |
| | 2,300 | | New York State Thruway Authority, Highway and Bridge Trust Fund Bonds, Series 2005B, 5.500%, 4/01/20 – AMBAC Insured (UB) | No Opt. Call | AA | | 2,817,799 | |
| | 2,100 | | New York State Tobacco Settlement Financing Corporation, Tobacco Settlement Asset-Backed and State Contingency Contract-Backed Bonds, Series 2003A-1, 5.250%, 6/01/22 – AMBAC Insured | 6/13 at 100.00 | AA– | | 2,263,527 | |
| | 1,000 | | New York State Tobacco Settlement Financing Corporation, Tobacco Settlement Asset-Backed and State Contingency Contract-Backed Bonds, Series 2003B-1C, 5.500%, 6/01/21 | 6/13 at 100.00 | AA– | | 1,085,070 | |
| | 29,975 | | Total Tax Obligation/Limited | | | | 32,848,614 | |
| | | | Transportation – 19.2% (13.0% of Total Investments) | | | | | |
| | 895 | | Albany Parking Authority, New York, Revenue Bonds, Series 2001A, 5.625%, 7/15/20 | 7/11 at 101.00 | BBB+ | | 916,981 | |
| | 2,500 | | Metropolitan Transportation Authority, New York, Transportation Revenue Bonds, Series 2007B, 5.000%, 11/15/33 | 11/17 at 100.00 | A | | 2,612,550 | |
| | 460 | | Metropolitan Transportation Authority, New York, Transportation Revenue Refunding Bonds, Series 2002A, 5.000%, 11/15/25 – FGIC Insured | 11/12 at 100.00 | A | | 485,309 | |
| | 1,250 | | New York City Industrial Development Agency, New York, American Airlines-JFK International Airport Special Facility Revenue Bonds, Series 2005, 7.750%, 8/01/31 (Alternative Minimum Tax) | 8/16 at 101.00 | B– | | 1,325,225 | |
| | 1,500 | | New York City Industrial Development Agency, New York, Civic Facility Revenue Bonds, Bronx Parking Development Company, LLC Project, Series 2007, 5.875%, 10/01/46 | 10/17 at 102.00 | N/R | | 1,006,890 | |
| | 50 | | New York City Industrial Development Agency, New York, Special Facilities Revenue Bonds, British Airways PLC, Series 1998, 5.250%, 12/01/32 (Alternative Minimum Tax) | 12/10 at 100.00 | BB– | | 40,392 | |
| | 1,000 | | New York City Industrial Development Agency, New York, Special Facilities Revenue Bonds, JFK Airport – American Airlines Inc., Series 2002B, 8.500%, 8/01/28 (Alternative Minimum Tax) | 8/12 at 101.00 | B– | | 1,038,970 | |
| | 650 | | New York City Industrial Development Agency, New York, Special Facilities Revenue Bonds, Terminal One Group JFK Project, Series 2005, 5.500%, 1/01/24 (Alternative Minimum Tax) | 1/16 at 100.00 | A3 | | 680,368 | |
| | | | New York City Industrial Development Authority, New York, JetBlue,: | | | | | |
| | 50 | | 5.000%, 5/15/20 (Alternative Minimum Tax) | 5/12 at 100.00 | B– | | 45,291 | |
| | 750 | | 5.125%, 5/15/30 (Alternative Minimum Tax) | 5/12 at 100.00 | B– | | 642,435 | |
| | 300 | | New York State Thruway Authority, General Revenue Bonds, Series 2005G, 5.000%, 1/01/30 – AGM Insured (UB) | 7/15 at 100.00 | AA+ | | 319,191 | |
| | 3,400 | | Niagara Frontier Airport Authority, New York, Airport Revenue Bonds, Buffalo Niagara International Airport, Series 1999A, 5.625%, 4/01/29 – NPFG Insured (Alternative Minimum Tax) | 10/10 at 100.50 | A | | 3,412,512 | |
| | | | Port Authority of New York and New Jersey, Consolidated Revenue Bonds, One Hundred Fortieth Series 2005: | | | | | |
| | 1,000 | | 5.000%, 12/01/28 – SYNCORA GTY Insured | 6/15 at 101.00 | Aa2 | | 1,083,130 | |
| | 280 | | 5.000%, 12/01/31 – SYNCORA GTY Insured | 6/15 at 101.00 | Aa2 | | 299,379 | |
| | 310 | | Port Authority of New York and New Jersey, Consolidated Revenue Bonds, One Hundred Forty Eighth Series 2007, Trust 2920, 17.154%, 8/15/32 – AGM Insured (IF) | 8/17 at 100.00 | AA+ | | 410,527 | |
| | 2,500 | | Triborough Bridge and Tunnel Authority, New York, General Purpose Revenue Refunding Bonds, Series 2002B, 5.000%, 11/15/21 | 11/12 at 100.00 | Aa2 | | 2,693,650 | |
| | 780 | | Triborough Bridge and Tunnel Authority, New York, Subordinate Lien General Purpose Revenue Refunding Bonds, Series 2002E, 5.500%, 11/15/20 – NPFG Insured | No Opt. Call | Aa3 | | 962,668 | |
| | 750 | | Triborough Bridge and Tunnel Authority, New York, Subordinate Lien General Purpose Revenue Refunding Bonds, Tender Option Bond Trust 1184, 9.051%, 5/15/16 (IF) | No Opt. Call | Aa2 | | 867,675 | |
| | 18,425 | | Total Transportation | | | | 18,843,143 | |
| | | | U.S. Guaranteed – 8.5% (5.7% of Total Investments) (4) | | | | | |
| | 2,750 | | Albany Industrial Development Agency, New York, Revenue Bonds, St. Rose College, Series 2001A, 5.375%, 7/01/31 (Pre-refunded 7/01/11) – AMBAC Insured | 7/11 at 101.00 | N/R (4) | | 2,883,898 | |
| | 1,105 | | Albany Parking Authority, New York, Revenue Bonds, Series 2001A, 5.625%, 7/15/20 (Pre-refunded 7/15/11) | 7/11 at 101.00 | BBB+ (4) | | 1,162,007 | |
| | 1,905 | | Dormitory Authority of the State of New York, Service Contract Bonds, Child Care Facilities Development Program, Series 2002, 5.375%, 4/01/17 (Pre-refunded 4/01/12) | 4/12 at 100.00 | AA– (4) | | 2,050,009 | |
Nuveen Investments 45
| | | Nuveen New York Dividend Advantage Municipal Fund 2 (continued) |
| NXK | | Portfolio of Investments September 30, 2010 |
| | Principal | | | Optional Call | | | | |
| | Amount (000) | | Description (1) | Provisions (2) | Ratings (3) | | Value | |
| | | | U.S. Guaranteed (4) (continued) | | | | | |
| $ | 2,205 | | New York State Urban Development Corporation, Service Contract Revenue Bonds, Correctional Facilities, Series 2000C, 5.125%, 1/01/21 (Pre-refunded 1/01/11) – AGM Insured | 1/11 at 100.00 | AAA | $ | 2,232,232 | |
| | 7,965 | | Total U.S. Guaranteed | | | | 8,328,146 | |
| | | | Utilities – 11.1% (7.5% of Total Investments) | | | | | |
| | | | Long Island Power Authority, New York, Electric System General Revenue Bonds, Series 2006A: | | | | | |
| | 1,700 | | 5.000%, 12/01/23 – FGIC Insured | 6/16 at 100.00 | A | | 1,853,102 | |
| | 1,700 | | 5.000%, 12/01/24 – FGIC Insured | 6/16 at 100.00 | A | | 1,845,503 | |
| | 250 | | Long Island Power Authority, New York, Electric System General Revenue Bonds, Series 2006B, 5.000%, 12/01/35 – CIFG Insured | 6/16 at 100.00 | A– | | 260,238 | |
| | 900 | | Nassau County Industrial Development Authority, New York, Keyspan Glenwood Energy Project, Series 2003, 5.250%, 6/01/27 (Alternative Minimum Tax) | 6/13 at 100.00 | A– | | 920,268 | |
| | 450 | | Niagara County Industrial Development Agency, New York, Solid Waste Disposal Facility Revenue Bonds, American Ref-Fuel Company of Niagara LP, Series 2001A, 5.450%, 11/15/26 (Mandatory put 11/15/12) (Alternative Minimum Tax) | 11/11 at 101.00 | Baa2 | | 465,372 | |
| | 2,000 | | Niagara County Industrial Development Agency, New York, Solid Waste Disposal Facility Revenue Refunding Bonds, American Ref-Fuel Company of Niagara LP, Series 2001D, 5.550%, 11/15/24 (Mandatory put 11/15/15) | 11/11 at 101.00 | Baa2 | | 2,022,840 | |
| | 2,000 | | Power Authority of the State of New York, General Revenue Bonds, Series 2000A, 5.250%, 11/15/40 | 11/10 at 100.00 | Aa2 | | 2,003,160 | |
| | | | Suffolk County Industrial Development Agency, New York, Revenue Bonds, Nissequogue Cogeneration Partners Facility, Series 1998: | | | | | |
| | 880 | | 5.300%, 1/01/13 (Alternative Minimum Tax) | 1/11 at 100.00 | N/R | | 863,024 | |
| | 750 | | 5.500%, 1/01/23 (Alternative Minimum Tax) | 1/11 at 100.00 | N/R | | 691,994 | |
| | 10,630 | | Total Utilities | | | | 10,925,501 | |
| | | | Water and Sewer – 1.1% (0.7% of Total Investments) | | | | | |
| | 1,000 | | New York City Municipal Water Finance Authority, New York, Water and Sewerage System Revenue Bonds, Fiscal Series 2001D, 5.500%, 6/15/17 | 6/11 at 101.00 | AAA | | 1,045,820 | |
| $ | 139,565 | | Total Investments (cost $140,537,247) – 148.1% | | | | 145,320,464 | |
| | | | Floating Rate Obligations – (12.4)% | | | | (12,150,000 | ) |
| | | | MuniFund Term Preferred Shares, at Liquidation Value – (38.6)% (5) | | | | (37,890,000 | ) |
| | | | Other Assets Less Liabilities – 2.9% | | | | 2,875,237 | |
| | | | Net Assets Applicable to Common Shares – 100% | | | $ | 98,155,701 | |
| (1) | | All percentages shown in the Portfolio of Investments are based on net assets applicable to Common shares unless otherwise noted. |
| (2) | | Optional Call Provisions (not covered by the report of independent registered public accounting firm): Dates (month and year) and prices of the earliest optional call or redemption. There may be other call provisions at varying prices at later dates. Certain mortgage-backed securities may be subject to periodic principal paydowns. |
| (3) | | Ratings (not covered by the report of independent registered public accounting firm): Using the highest of Standard & Poor’s Group (“Standard & Poor’s”), Moody’s Investor Service, Inc. (“Moody’s”) or Fitch, Inc. (“Fitch”) rating. Ratings below BBB by Standard & Poor’s, Baa by Moody’s or BBB by Fitch are considered to be below investment grade. Holdings designated N/R are not rated by any of these national rating agencies. |
| (4) | | Backed by an escrow or trust containing sufficient U.S. Government or U.S. Government agency securities, which ensure the timely payment of principal and interest. Such investments are normally considered to be equivalent to AAA rated securities. |
| (5) | | MuniFund Term Preferred Shares, at Liquidation Value as a percentage of Total Investments is 26.1%. |
| N/R | | Not rated. |
| (IF) | | Inverse floating rate investment. |
| (UB) | | Underlying bond of an inverse floating rate trust reflected as a financing transaction. See Notes to Financial Statements, Footnote 1 – General Information and Significant Accounting Policies, Inverse Floating Rate Securities for more information. |
See accompanying notes to financial statements.
46 Nuveen Investments
| | | Statement of |
| | | Assets & Liabilities |
| | | September 30, 2010 |
| | | New York Value (NNY | ) | New York Value 2 (NYV | ) | New York Performance Plus (NNP | ) | New York Dividend Advantage (NAN | ) | New York Dividend Advantage 2 (NXK | ) |
| Assets | | | | | | | | | | | | | | | | |
| Investments, at value (cost $144,564,200, $32,869,136, $336,816,675, $192,956,922 and $140,537,247, respectively) | | $ | 151,169,760 | | $ | 37,099,943 | | $ | 355,197,695 | | $ | 199,844,726 | | $ | 145,320,464 | |
| Cash | | | 1,116,493 | | | 300,426 | | | 1,212,391 | | | 7,004,295 | | | 627,752 | |
| Receivables: | | | | | | | | | | | | | | | | |
| Interest | | | 2,241,578 | | | 556,889 | | | 5,190,550 | | | 2,944,649 | | | 2,185,797 | |
| Investments sold | | | 1,360,000 | | | — | | | 3,679,800 | | | 777,500 | | | 10,000 | |
| Deferred offering costs | | | — | | | — | | | 1,297,776 | | | 612,976 | | | 749,815 | |
| Other assets | | | 2,316 | | | 82 | | | 117,082 | | | 31,755 | | | 40,126 | |
| Total assets | | | 155,890,147 | | | 37,957,340 | | | 366,695,294 | | | 211,215,901 | | | 148,933,954 | |
| Liabilities | | | | | | | | | | | | | | | | |
| Floating rate obligations | | | 3,255,000 | | | — | | | 34,645,000 | | | 17,735,000 | | | 12,150,000 | |
| Payables: | | | | | | | | | | | | | | | | |
| Auction Rate Preferred share dividends | | | N/A | | | N/A | | | — | | | 2,677 | | | — | |
| Common share dividends | | | 460,771 | | | 129,225 | | | 916,162 | | | 576,347 | | | 407,541 | |
| Interest | | | — | | | — | | | — | | | 67,500 | | | 80,516 | |
| Offering costs | | | — | | | — | | | 336,759 | | | 242,170 | | | 142,672 | |
| MuniFund Term Preferred shares, at liquidation value | | | — | | | — | | | — | | | 30,000,000 | | | 37,890,000 | |
| Variable Rate Demand Preferred shares, at liquidation value | | | — | | | — | | | 89,000,000 | | | — | | | — | |
| Accrued expenses: | | | | | | | | | | | | | | | | |
| Management fees | | | 67,164 | | | 19,966 | | | 187,179 | | | 108,288 | | | 71,084 | |
| Other | | | 76,329 | | | 12,406 | | | 160,446 | | | 59,230 | | | 36,440 | |
| Total liabilities | | | 3,859,264 | | | 161,597 | | | 125,245,546 | | | 48,791,212 | | | 50,778,253 | |
| Auction Rate Preferred shares, at liquidation value | | | N/A | | | N/A | | | — | | | 21,900,000 | | | — | |
| Net assets applicable to Common shares | | $ | 152,030,883 | | $ | 37,795,743 | | $ | 241,449,748 | | $ | 140,524,689 | | $ | 98,155,701 | |
| Common shares outstanding | | | 15,168,677 | | | 2,347,000 | | | 15,039,571 | | | 9,265,330 | | | 6,488,516 | |
| Net asset value per Common share outstanding (net assets applicable to Common shares, divided by Common shares outstanding) | | $ | 10.02 | | $ | 16.10 | | $ | 16.05 | | $ | 15.17 | | $ | 15.13 | |
| Net assets applicable to Common shares consist of: | | | | | | | | | | | | | | | | |
| Common shares, $.01 par value per share | | $ | 151,687 | | $ | 23,470 | | $ | 150,396 | | $ | 92,653 | | $ | 64,885 | |
| Paid-in surplus | | | 144,720,512 | | | 33,527,099 | | | 219,728,867 | | | 131,735,311 | | | 92,288,009 | |
| Undistributed (Over-distribution of) net investment income | | | 459,649 | | | (12,132 | ) | | 3,374,940 | | | 1,655,128 | | | 1,061,722 | |
| Accumulated net realized gain (loss) | | | 93,475 | | | 26,499 | | | (185,475 | ) | | 153,793 | | | (42,132 | ) |
| Net unrealized appreciation (depreciation) | | | 6,605,560 | | | 4,230,807 | | | 18,381,020 | | | 6,887,804 | | | 4,783,217 | |
| Net assets applicable to Common shares | | $ | 152,030,883 | | $ | 37,795,743 | | $ | 241,449,748 | | $ | 140,524,689 | | $ | 98,155,701 | |
| Authorized shares: | | | | | | | | | | | | | | | | |
| Common | | | 250,000,000 | | | Unlimited | | | 200,000,000 | | | Unlimited | | | Unlimited | |
| Auction Rate Preferred | | | N/A | | | N/A | | | 1,000,000 | | | Unlimited | | | Unlimited | |
| MuniFund Term Preferred | | | — | | | — | | | — | | | Unlimited | | | Unlimited | |
| Variable Rate Demand Preferred | | | — | | | — | | | Unlimited | | | — | | | — | |
N/A – Fund is not authorized to issue Auction Rate Preferred shares.
See accompanying notes to financial statements.
Nuveen Investments 47
| | | Statement of |
| | | Operations |
| | | Year Ended September 30, 2010 |
| | | New York Value (NNY | ) | New York Value 2 (NYV | ) | New York Performance Plus (NNP | ) | New York Dividend Advantage (NAN | ) | New York Dividend Advantage 2 (NXK | ) |
| Investment Income | | $ | 7,381,871 | | $ | 2,125,678 | | $ | 17,208,446 | | $ | 10,174,510 | | $ | 6,925,904 | |
| Expenses | | | | | | | | | | | | | | | | |
| Management fees | | | 802,962 | | | 239,351 | | | 2,238,471 | | | 1,300,964 | | | 913,257 | |
| Auction fees | | | N/A | | | N/A | | | 106,201 | | | 45,579 | | | 25,862 | |
| Dividend disbursing agent fees | | | N/A | | | N/A | | | 29,123 | | | 10,000 | | | 5,808 | |
| Shareholders’ servicing agent fees and expenses | | | 29,122 | | | — | | | 28,476 | | | 3,271 | | | 1,517 | |
| Interest expense and amortization of offering costs | | | 17,913 | | | — | | | 433,965 | | | 854,677 | | | 599,158 | |
| Liquidity fees | | | — | | | — | | | 463,304 | | | — | | | — | |
| Custodian’s fees and expenses | | | 36,612 | | | 11,270 | | | 63,556 | | | 42,657 | | | 32,552 | |
| Directors’/Trustees’ fees and expenses | | | 3,726 | | | 827 | | | 10,582 | | | 5,508 | | | 3,799 | |
| Professional fees | | | 19,728 | | | 1,397 | | | 88,724 | | | 26,454 | | | 19,788 | |
| Shareholders’ reports – printing and mailing expenses | | | 64,136 | | | 13,485 | | | 75,385 | | | 57,008 | | | 36,621 | |
| Stock exchange listing fees | | | 9,196 | | | 244 | | | 9,122 | | | 9,122 | | | 909 | |
| Investor relations expense | | | — | | | 1,421 | | | — | | | — | | | — | |
| Other expenses | | | 7,914 | | | 3,915 | | | 24,708 | | | 8,269 | | | 17,753 | |
| Total expenses before custodian fee credit and expense reimbursement | | | 991,309 | | | 271,910 | | | 3,571,617 | | | 2,363,509 | | | 1,657,024 | |
| Custodian fee credit | | | (1,126 | ) | | (266 | ) | | (5,474 | ) | | (4,311 | ) | | (2,135 | ) |
| Expense reimbursement | | | — | | | — | | | — | | | — | | | (107,049 | ) |
| Net expenses | | | 990,183 | | | 271,644 | | | 3,566,143 | | | 2,359,198 | | | 1,547,840 | |
| Net investment income | | | 6,391,688 | | | 1,854,034 | | | 13,642,303 | | | 7,815,312 | | | 5,378,064 | |
| Realized and Unrealized Gain (Loss) | | | | | | | | | | | | | | | | |
| Net realized gain (loss) from investments | | | 75,540 | | | 33,899 | | | 192,652 | | | 499,428 | | | 48,724 | |
| Change in net unrealized appreciation (depreciation) of investments | | | 2,049,615 | | | 362,901 | | | 5,514,582 | | | 2,747,265 | | | 2,278,535 | |
| Net realized and unrealized gain (loss) | | | 2,125,155 | | | 396,800 | | | 5,707,234 | | | 3,246,693 | | | 2,327,259 | |
| Distributions to Auction Rate Preferred Shareholders | | | | | | | | | | | | | | | | |
| From net investment income | | | N/A | | | N/A | | | (185,393 | ) | | (111,659 | ) | | (77,543 | ) |
| From accumulated net realized gains | | | N/A | | | N/A | | | (17,285 | ) | | (30,429 | ) | | (3,233 | ) |
| Decrease in net assets applicable to Common shares from distributions to Auction Rate Preferred shareholders | | | N/A | | | N/A | | | (202,678 | ) | | (142,088 | ) | | (80,776 | ) |
| Net increase (decrease) in net assets applicable to Common shares from operations | | $ | 8,516,843 | | $ | 2,250,834 | | $ | 19,146,859 | | $ | 10,919,917 | | $ | 7,624,547 | |
N/A – Fund is not authorized to issue Auction Rate Preferred shares.
See accompanying notes to financial statements.
48 Nuveen Investments
| | | Statement of |
| | | Changes in Net Assets |
| | | New York Value (NNY) | | New York Value 2 (NYV) | | New York Performance Plus (NNP) |
| | | Year Ended 9/30/10 | | Year Ended 9/30/09 | | Year Ended 9/30/10 | | For the period 4/28/09 (commencement of operations) through 9/30/09 | | Year Ended 9/30/10 | | Year Ended 9/30/09 | |
| Operations | | | | | | | | | | | | | | | | | | | |
| Net investment income | | $ | 6,391,688 | | $ | 6,447,771 | | $ | 1,854,034 | | $ | 537,162 | | $ | 13,642,303 | | $ | 14,517,338 | |
| Net realized gain (loss) from: | | | | | | | | | | | | | | | | | | | |
| Investments | | | 75,540 | | | 132,227 | | | 33,899 | | | (7,406 | ) | | 192,652 | | | 209,269 | |
| Futures | | | — | | | 176,461 | | | — | | | — | | | — | | | — | |
| Change in net unrealized appreciation (depreciation) of: | | | | | | | | | | | | | | | | | | | |
| Investments | | | 2,049,615 | | | 10,734,027 | | | 362,901 | | | 3,867,906 | | | 5,514,582 | | | 28,157,222 | |
| Futures | | | — | | | 13,211 | | | — | | | — | | | — | | | — | |
| Distributions to Auction Rate | | | | | | | | | | | | | | | | | | | |
| Preferred Shareholders: | | | | | | | | | | | | | | | | | | | |
| From net investment income | | | N/A | | | N/A | | | N/A | | | N/A | | | (185,393 | ) | | (815,348 | ) |
| From accumulated net realized gains | | | N/A | | | N/A | | | N/A | | | N/A | | | (17,285 | ) | | (608,160 | ) |
| Net increase (decrease) in net assets applicable to Common shares from operations | | | 8,516,843 | | | 17,503,697 | | | 2,250,834 | | | 4,397,662 | | | 19,146,859 | | | 41,460,321 | |
| Distributions to Common Shareholders | | | | | | | | | | | | | | | | | | | |
| From net investment income | | | (6,455,881 | ) | | (6,448,739 | ) | | (1,802,496 | ) | | (600,832 | ) | | (12,573,083 | ) | | (11,090,805 | ) |
| From accumulated net realized gains | | | (337,820 | ) | | (1,484,820 | ) | | — | | | — | | | (231,609 | ) | | (1,928,624 | ) |
| Decrease in net assets applicable to Common shares from distributions to Common shareholders | | | (6,793,701 | ) | | (7,933,559 | ) | | (1,802,496 | ) | | (600,832 | ) | | (12,804,692 | ) | | (13,019,429 | ) |
| Capital Share Transactions | | | | | | | | | | | | | | | | | | | |
| Common shares: | | | | | | | | | | | | | | | | | | | |
| Proceeds from sale of shares, net of offering costs | | | — | | | — | | | — | | | 33,450,300 | | | — | | | — | |
| Net proceeds from shares issued to shareholders due to reinvestment of distributions | | | 244,612 | | | 208,108 | | | — | | | — | | | — | | | — | |
| Repurchased and retired | | | — | | | — | | | — | | | — | | | — | | | (309,124 | ) |
| Net increase (decrease) in net assets applicable to Common shares from capital share transactions | | | 244,612 | | | 208,108 | | | — | | | 33,450,300 | | | — | | | (309,124 | ) |
| Net increase (decrease) in net assets applicable to Common shares | | | 1,967,754 | | | 9,778,246 | | | 448,338 | | | 37,247,130 | | | 6,342,167 | | | 28,131,768 | |
| Net assets applicable to Common shares at the beginning of period | | | 150,063,129 | | | 140,284,883 | | | 37,347,405 | | | 100,275 | | | 235,107,581 | | | 206,975,813 | |
| Net assets applicable to Common shares at the end of period | | $ | 152,030,883 | | $ | 150,063,129 | | $ | 37,795,743 | | $ | 37,347,405 | | $ | 241,449,748 | | $ | 235,107,581 | |
| Undistributed (Over-distribution of) net investment income at the end of period | | $ | 459,649 | | $ | 546,665 | | $ | (12,132 | ) | $ | (63,670 | ) | $ | 3,374,940 | | $ | 2,472,895 | |
N/A – Fund is not authorized to issue Auction Rate Preferred shares.
See accompanying notes to financial statements.
Nuveen Investments 49
| | | Statement of |
| | | Changes in Net Assets (continued) |
| | | New York Dividend Advantage (NAN) | | New York Dividend Advantage 2 (NXK) | |
| | | Year Ended 9/30/10 | | Year Ended 9/30/09 | | Year Ended 9/30/10 | | Year Ended 9/30/09 | |
| Operations | | | | | | | | | | | | | |
| Net investment income | | $ | 7,815,312 | | $ | 8,628,755 | | $ | 5,378,064 | | $ | 5,962,245 | |
| Net realized gain (loss) from: | | | | | | | | | | | | | |
| Investments | | | 499,428 | | | 237,884 | | | 48,724 | | | 32,039 | |
| Futures | | | — | | | — | | | — | | | — | |
| Change in net unrealized appreciation (depreciation) of: | | | | | | | | | | | | | |
| Investments | | | 2,747,265 | | | 15,279,735 | | | 2,278,535 | | | 10,675,788 | |
| Futures | | | — | | | — | | | — | | | — | |
| Distributions to Auction Rate | | | | | | | | | | | | | |
| Preferred Shareholders: | | | | | | | | | | | | | |
| From net investment income | | | (111,659 | ) | | (544,164 | ) | | (77,543 | ) | | (303,512 | ) |
| From accumulated net realized gains | | | (30,429 | ) | | (276,265 | ) | | (3,233 | ) | | (241,933 | ) |
| Net increase (decrease) in net assets applicable to Common shares from operations | | | 10,919,917 | | | 23,325,945 | | | 7,624,547 | | | 16,124,627 | |
| Distributions to Common Shareholders | | | | | | | | | | | | | |
| From net investment income | | | (7,264,019 | ) | | (6,777,589 | ) | | (5,170,050 | ) | | (4,735,461 | ) |
| From accumulated net realized gains | | | (399,336 | ) | | (813,496 | ) | | (49,313 | ) | | (901,605 | ) |
| Decrease in net assets applicable to Common shares from distributions to Common shareholders | | | (7,663,355 | ) | | (7,591,085 | ) | | (5,219,363 | ) | | (5,637,066 | ) |
| Capital Share Transactions | | | | | | | | | | | | | |
| Common shares: | | | | | | | | | | | | | |
| Proceeds from sale of shares, net of offering costs | | | — | | | — | | | — | | | — | |
| Net proceeds from shares issued to shareholders due to reinvestment of distributions | | | — | | | — | | | — | | | — | |
| Repurchased and retired | | | — | | | — | | | — | | | (76,617 | ) |
| Net increase (decrease) in net assets applicable to Common shares from capital share transactions | | | — | | | — | | | — | | | (76,617 | ) |
| Net increase (decrease) in net assets applicable to Common shares | | | 3,256,562 | | | 15,734,860 | | | 2,405,184 | | | 10,410,944 | |
| Net assets applicable to Common shares at the beginning of period | | | 137,268,127 | | | 121,533,267 | | | 95,750,517 | | | 85,339,573 | |
| Net assets applicable to Common shares at the end of period | | $ | 140,524,689 | | $ | 137,268,127 | | $ | 98,155,701 | | $ | 95,750,517 | |
| Undistributed (Over-distribution of) net investment income at the end of period | | $ | 1,655,128 | | $ | 1,124,909 | | $ | 1,061,722 | | $ | 855,114 | |
See accompanying notes to financial statements.
50 Nuveen Investments
| | | Statement of |
| | | Cash Flows |
| | | Year ended September 30, 2010 |
| | | New York Performance Plus (NNP | ) | New York Dividend Advantage (NAN | ) | New York Dividend Advantage 2 (NXK | ) |
| Cash Flows from Operating Activities: | | | | | | | | | | |
| Net Increase (Decrease) in Net Assets Applicable to Common Shares from Operations | | $ | 19,146,859 | | $ | 10,919,917 | | $ | 7,624,547 | |
| Adjustments to reconcile the net increase (decrease) in net assets applicable to Common shares from operations to net cash provided by (used in) operating activities: | | | | | | | | | | |
| Purchases of investments | | | (41,280,163 | ) | | (21,133,048 | ) | | (16,553,430 | ) |
| Proceeds from sales and maturities of investments | | | 31,362,550 | | | 20,133,750 | | | 8,566,316 | |
| Proceeds from (Purchases of) short-term investments, net | | | 12,822,285 | | | 8,673,657 | | | 2,742,583 | |
| Amortization (Accretion) of premiums and discounts, net | | | 628,365 | | | 350,231 | | | 289,551 | |
| (Increase) Decrease in receivable for interest | | | (129,383 | ) | | 14,608 | | | (123,061 | ) |
| (Increase) Decrease in receivable for investments sold | | | (3,289,800 | ) | | 2,735,950 | | | 2,355,531 | |
| (Increase) Decrease in other assets | | | (36,385 | ) | | (314 | ) | | 5,816 | |
| Increase (Decrease) in payable for investments purchased | | | — | | | (4,000,000 | ) | | — | |
| Increase (Decrease) in payable for Auction Rate Preferred share dividends | | | (5,147 | ) | | 298 | | | (3,492 | ) |
| Increase (Decrease) in payable for interest | | | — | | | 67,500 | | | 80,516 | |
| Increase (Decrease) in accrued management fees | | | 4,021 | | | 2,136 | | | 8,684 | |
| Increase (Decrease) in accrued other liabilities | | | 26,645 | | | 8,465 | | | (1,648 | ) |
| Net realized (gain) loss from investments | | | (192,652 | ) | | (499,428 | ) | | (48,724 | ) |
| Change in net unrealized (appreciation) depreciation of investments | | | (5,514,582 | ) | | (2,747,265 | ) | | (2,278,535 | ) |
| Taxes paid on undistributed capital gains | | | — | | | 20 | | | 435 | |
| Net cash provided by (used in) operating activities | | | 13,542,613 | | | 14,526,477 | | | 2,665,089 | |
| Cash Flows from Financing Activities: | | | | | | | | | | |
| Increase (Decrease) in floating rate obligations | | | — | | | — | | | (5,000 | ) |
| (Increase) Decrease in deferred offering costs | | | (1,297,776 | ) | | (612,976 | ) | | (749,815 | ) |
| Increase (Decrease) in payable for offering costs | | | 336,759 | | | 242,170 | | | 142,672 | |
| Increase (Decrease) in Auction Rate Preferred shares, at liquidation value | | | (87,650,000 | ) | | (29,500,000 | ) | | (34,100,000 | ) |
| Increase (Decrease) in MuniFund Term Preferred shares, liquidation value | | | — | | | 30,000,000 | | | 37,890,000 | |
| Increase (Decrease) in Variable Rate Demand Preferred shares, at liquidation value | | | 89,000,000 | | | — | | | — | |
| Cash distributions paid to Common shareholders | | | (12,719,205 | ) | | (7,651,376 | ) | | (5,215,194 | ) |
| Net cash provided by (used in) financing activities | | | (12,330,222 | ) | | (7,522,182 | ) | | (2,037,337 | ) |
| Net Increase (Decrease) in Cash | | | 1,212,391 | | | 7,004,295 | | | 627,752 | |
| Cash and cash equivalents at the beginning of year | | | — | | | — | | | — | |
| Cash and Cash Equivalents at the End of Year | | $ | 1,212,391 | | $ | 7,004,295 | | $ | 627,752 | |
| | | | | | | | | | | |
| Supplemental Disclosure of Cash Flow Information | | | | | | | | | | |
| | | New York | | New York | | New York | |
| | | Performance | | Dividend | | Dividend | |
| | | Plus | | Advantage | | Advantage 2 | |
| | | (NNP | ) | (NAN | ) | (NXK | ) |
| Cash paid for interest (excluding amortization of offering costs, where applicable) | | $ | 411,741 | | $ | 675,153 | | $ | 442,492 | |
See accompanying notes to financial statements.
Nuveen Investments 51
| | Notes to |
| | Financial Statements |
1. General Information and Significant Accounting Policies
The funds covered in this report and their corresponding Common share stock exchange symbols are Nuveen New York Municipal Value Fund, Inc. (NNY), Nuveen New York Municipal Value Fund 2 (NYV), Nuveen New York Performance Plus Municipal Fund, Inc. (NNP), Nuveen New York Dividend Advantage Municipal Fund (NAN) and Nuveen New York Dividend Advantage Municipal Fund 2 (NXK) (collectively, the “Funds”). Common shares of New York Value (NNY), New York Performance Plus (NNP) and New York Dividend Advantage (NAN) are traded on the New York Stock Exchange (“NYSE”) while Common shares of New York Value 2 (NYV) and New York Dividend Advantage 2 (NXK) are traded on the NYSE Amex. The Funds are registered under the Investment Company Act of 1940, as amended, as closed-end registered investment companies.
Prior to the commencement of operations, New York Value 2 (NYV) had no operations other than those related to organizational matters, the initial capital contribution of $100,275 by Nuveen Asset Management (the “Adviser”), a wholly-owned subsidiary of Nuveen Investments, Inc. (“Nuveen”), and the recording of the organization expense ($15,000) and its reimbursement by Nuveen Investments, LLC, also a wholly-owned subsidiary of Nuveen.
Each Fund seeks to provide current income exempt from both regular federal and New York state income taxes by investing primarily in a portfolio of municipal obligations issued by state and local government authorities within the state of New York or certain U.S. territories.
The following is a summary of significant accounting policies followed by the Funds in the preparation of their financial statements in accordance with U.S. generally accepted accounting principles (“U.S. GAAP”).
Investment Valuation
Prices of fixed-income securities are provided by a pricing service approved by the Funds’ Board of Directors/Trustees. These securities are generally classified as Level 2. Prices of fixed-income securities are based on the mean between the bid and asked price. When price quotes are not readily available (which is usually the case for municipal bonds) the pricing service establishes a security’s fair value using methods that may include consideration of the following: yields or prices of investments of comparable quality, type of issue, coupon, maturity and rating, market quotes or indications of value from security dealers, evaluations of anticipated cash flows or collateral, general market conditions and other information and analysis, including the obligor’s credit characteristics considered relevant. In pricing certain securi ties, particularly less liquid and lower quality securities, the pricing service may consider information provided by the Adviser in establishing a fair valuation for the security. These securities are generally classified as Level 2.
Futures contracts are valued using the closing settlement price or, in the absence of such a price, at the mean of the bid and ask prices. These securities are generally classified as Level 1.
Temporary investments in securities that have variable rate and demand features qualifying them as short-term investments are valued at amortized cost, which approximates market value. These securities are generally classified as Level 1 or Level 2.
Certain securities may not be able to be priced by the pre-established pricing methods as described above. Such securities may be valued by the Funds’ Board of Directors/Trustees or its designee at fair value. These securities generally include, but are not limited to, restricted securities (securities which may not be publicly sold without registration under the Securities Act of 1933, as amended) for which a pricing service is unable to provide a market price; securities whose trading has been formally suspended; debt securities that have gone into default and for which there is no current market quotation; a security whose market price is not available from a pre-established pricing source; a security with respect to which an event has occurred that is likely to materially affect the value of the security after the market has closed but be fore the calculation of a Fund’s net asset value (as may be the case in non-U.S. markets on which the security is primarily traded) or make it difficult or impossible to obtain a reliable market quotation; and a security whose price, as provided by the pricing service, is not deemed to reflect the security’s fair value. As a general principle, the fair value of a security would appear to be the amount that the owner might reasonably expect to receive for it in a current sale. A variety of factors may be considered in determining the fair value of such securities, which may include consideration of the following: yields or prices of investments of comparable quality, type of issue, coupon, maturity and rating, market quotes or indications of value from security dealers, evaluations of anticipated cash flows or collateral, general market conditions and other information and analysis, including the obligor’s credit characteristics considered relevant. These securities are generally classified as Level 2 or Level 3 depending on the priority of the significant inputs. Regardless of the method employed to value a particular security, all valuations are subject to review by the Funds’ Board of Directors/Trustees or its designee.
Refer to Footnote 2 – Fair Value Measurements for further details on the leveling of securities held by the Funds as of the end of the reporting period.
52 Nuveen Investments
Investment Transactions
Investment transactions are recorded on a trade date basis. Realized gains and losses from transactions are determined on the specific identification method. Investments purchased on a when-issued/delayed delivery basis may have extended settlement periods. Any investments so purchased are subject to market fluctuation during this period. The Funds have instructed the custodian to segregate assets with a current value at least equal to the amount of the when-issued/delayed delivery purchase commitments. At September 30, 2010, there were no such outstanding purchase commitments in any of the Funds.
Investment Income
Interest income, which reflects the amortization of premiums and includes accretion of discounts for financial reporting purposes, is recorded on an accrual basis. Investment income also reflects paydown gains and losses, if any.
Income Taxes
Each Fund is a separate taxpayer for federal income tax purposes. Each Fund intends to distribute substantially all of its net investment income and net capital gains to shareholders and to otherwise comply with the requirements of Subchapter M of the Internal Revenue Code applicable to regulated investment companies. Therefore, no federal income tax provision is required. Furthermore, each Fund intends to satisfy conditions that will enable interest from municipal securities, which is exempt from regular federal and New York state income taxes, to retain such tax-exempt status when distributed to shareholders of the Funds. Net realized capital gains and ordinary income distributions paid by the Funds are subject to federal taxation.
For all open tax years and all major taxing jurisdictions, management of the Funds has concluded that there are no significant uncertain tax positions that would require recognition in the financial statements. Open tax years are those that are open for examination by taxing authorities (i.e., generally the last four tax year ends and the interim tax period since then). Furthermore, management of the Funds is also not aware of any tax positions for which it is reasonably possible that the total amounts of unrecognized tax benefits will significantly change in the next twelve months.
Dividends and Distributions to Common Shareholders
Dividends from tax-exempt net investment income are declared monthly. Net realized capital gains and/or market discount from investment transactions, if any, are distributed to shareholders at least annually. Furthermore, capital gains are distributed only to the extent they exceed available capital loss carryforwards.
Distributions to Common shareholders of tax-exempt net investment income, net realized capital gains and/or market discount, if any, are recorded on the ex-dividend date. The amount and timing of distributions are determined in accordance with federal income tax regulations, which may differ from U.S. GAAP.
Auction Rate Preferred Shares
New York Value (NNY) and New York Value 2 (NYV) are not authorized to issue Auction Rate Preferred Shares (“ARPS”). New York Dividend Advantage (NAN) has issued and outstanding ARPS, $25,000 stated value per share, as a means of effecting financial leverage. The Fund’s ARPS are issued in one Series. The dividend rate paid by the Fund is determined every seven days, pursuant to a dutch auction process overseen by the auction agent, and is payable at the end of each rate period. As of September 30, 2010, the number of ARPS outstanding for New York Dividend Advantage (NAN) is as follows:
| | | New York Dividend Advantage (NAN | ) |
| Number of shares: | | | | |
| Series F | | | 876 | |
Beginning in February 2008, more shares for sale were submitted in the regularly scheduled auctions for the ARPS issued by the Funds than there were offers to buy. This meant that these auctions “failed to clear,” and that many ARPS shareholders who wanted to sell their shares in these auctions were unable to do so. ARPS shareholders unable to sell their shares received distributions at the “maximum rate” applicable to failed auctions as calculated in accordance with the pre-established terms of the ARPS. As of September 30, 2010, the aggregate amount of outstanding ARPS redeemed by each Fund is as follows:
| | | New York Performance Plus (NNP | ) | New York Dividend Advantage (NAN | ) | New York Dividend Advantage 2 (NXK | ) |
| ARPS redeemed, at liquidation value | | $ | 124,300,000 | | $ | 47,100,000 | | $ | 47,000,000 | |
Nuveen Investments 53
| | Notes to |
| | Financial Statements (continued) |
During the fiscal year ended September 30, 2009, lawsuits pursuing claims made in the demand letter alleging that New York Performance Plus’ (NNP) Board of Trustees breached their fiduciary duties related to the redemption at par of its ARPS had been filed on behalf of shareholders of New York Performance Plus (NNP), against the Adviser, the Nuveen holding company, the majority owner of the holding company, the lone interested trustee, and current and former officers of New York Performance Plus (NNP). Nuveen and the other named defendants believe these lawsuits to be without merit, and all named parties intend to defend themselves vigorously. New York Performance Plus (NNP) believes that these lawsuits will not have a material effect on it or on the Adviser’s ability to serve as investment adviser to it.
MuniFund Term Preferred Shares
The following Funds have issued and outstanding MuniFund Term Preferred (“MTP”) Shares, with a $10 stated value per share. Proceeds from the issuance of MTP Shares, net of offering expenses, were used to redeem all, or a portion of, each Fund’s outstanding ARPS. Each Fund’s MTP Shares are issued in one Series. Dividends, which are recognized as interest expense for financial reporting purposes, will be paid monthly at a fixed annual rate, subject to adjustments in certain circumstances. The MTP Shares trade on the NYSE. As of September 30, 2010, the number of MTP Shares outstanding, fixed annual rate and NYSE “ticker” symbol for each Fund are as follows:
| | | New York Dividend Advantage (NAN) | | New York Dividend Advantage 2 (NXK) |
| | | Shares Outstanding | | Fixed Annual Rate | | NYSE Ticker | | Shares Outstanding | | Fixed Annual Rate | | NYSE Ticker | |
| Series 2015 | | | 3,000,000 | | | 2.70 | % | | NAN Pr C | | | 3,789,000 | | | 2.55 | % | | NXK Pr C | |
Each Fund is obligated to redeem its MTP Shares by the date as specified in its offering document (“Term Redemption Date”), unless earlier redeemed or repurchased by the Fund. MTP Shares are subject to optional and mandatory redemption in certain circumstances. MTP Shares will be subject to redemption at the option of each Fund (“Optional Redemption Date”), subject to a payment of premium for one year following the Optional Redemption Date (“Premium Expiration Date”), and at par thereafter. MTP Shares also will be subject to redemption, at the option of each Fund, at par in the event of certain changes in the credit rating of the MTP Shares. Each Fund may be obligated to redeem certain of the MTP Shares if the Fund fails to maintain certain asset coverage and leverage ratio requirements and such failures are not cured by the applicable cure date. The redemption price per share is equal to the sum of the liquidation value per share plus any accumulated but unpaid dividends. The Term Redemption Date, Optional Redemption Date and Premium Expiration Date for each Fund’s MTP Shares are as follows:
| | | New York Dividend Advantage (NAN) Series 2015 | | New York Dividend Advantage 2 (NXK) Series 2015 | |
| Term Redemption Date | | | January 1, 2015 | | | May 1, 2015 | |
| Optional Redemption Date | | | January 1, 2011 | | | May 1, 2011 | |
| Premium Expiration Date | | | December 3, 2011 | | | April 30, 2012 | |
The average liquidation value of MTP Shares outstanding for each Fund during the fiscal year ended September 30, 2010, was as follows:
| | | New York Dividend Advantage (NAN | )* | New York Dividend Advantage 2 (NXK | )** |
| Average liquidation value of MTP Shares outstanding | | $ | 30,000,000 | | $ | 37,731,176 | |
| * | For the period December 21, 2009 (issuance date of shares) through September 30, 2010. |
| ** | For the period April 14, 2010 (issuance date of shares) through September 30, 2010. |
For financial reporting purposes only, the liquidation value of MTP Shares is recorded as a liability on the Statement of Assets and Liabilities. Unpaid dividends on MTP Shares are recognized as a component of “Interest payable” on the Statement of Assets and Liabilities. Dividends paid on MTP Shares are recognized as a component of “Interest expense and amortization of offering costs” on the Statement of Operations.
Net amounts earned by Nuveen as underwriter of each Fund’s MTP Share offering were recorded as reductions of offering costs recognized by the Funds. During the fiscal year ended September 30, 2010, there was no amounts earned by New York Dividend Advantage (NAN) and New York Dividend Advantage 2 (NXK).
Variable Rate Demand Preferred Shares
New York Performance Plus (NNP) has issued and outstanding 890 Series 1 Variable Rate Demand Preferred (“VRDP”) Shares, $100,000 liquidation value per share. The Fund issued its VRDP Shares in a privately negotiated offering in March 2010. Proceeds of the Fund’s offering were used to redeem all of the Fund’s outstanding ARPS. The VRDP Shares were offered to qualified institutional buyers pursuant to Rule 144A under the Securities Act of 1933 and have a maturity date of March 1, 2040.
54 Nuveen Investments
VRDP Shares include a liquidity feature that allows VRDP shareholders to have their shares purchased by a liquidity provider with whom the Fund has contracted in the event that purchase orders for VRDP Shares in a remarketing are not sufficient in number to be matched with the sale orders in that remarketing. The Fund is required to redeem any VRDP Shares that are still owned by the liquidity provider after six months of continuous, unsuccessful remarketing.
Dividends on the VRDP Shares (which are treated as interest payments for financial reporting purposes) are set weekly at a rate established by a remarketing agent; therefore, the market value of the VRDP Shares is expected to approximate its liquidation value. If remarketings for VRDP Shares are continuously unsuccessful for six months, the maximum rate is designed to escalate according to a specified schedule in order to enhance the remarketing agent’s ability to successfully remarket the VRDP Shares.
Subject to certain conditions, VRDP Shares may be redeemed, in whole or in part, at any time at the option of the Fund. The Fund may also redeem certain of the VRDP Shares if the Fund fails to maintain certain asset coverage requirements and such failures are not cured by the applicable cure date. The redemption price per share is equal to the sum of the liquidation value per share plus any accumulated but unpaid dividends.
New York Performance Plus (NNP) had all $89,000,000 of its VRDP Shares issued and outstanding during the period March 31, 2010 (issuance of shares) through September 30, 2010, with an annualized dividend rate of 0.42%.
For financial reporting purposes only, the liquidation value of VRDP Shares is recognized as a liability on the Statement of Assets and Liabilities. Unpaid dividends on VRDP Shares are recognized as a component of “Interest payable” on the Statement of Assets and Liabilities. Dividends paid on the VRDP Shares are recognized as a component of “Interest expense and amortization of offering costs” on the Statement of Operations. In addition to interest expense, each Fund also pays a per annum liquidity fee to the liquidity provider, which is recognized as “Liquidity fees” on the Statement of Operations.
Inverse Floating Rate Securities
Each Fund is authorized to invest in inverse floating rate securities. An inverse floating rate security is created by depositing a municipal bond, typically with a fixed interest rate, into a special purpose trust created by a broker-dealer. In turn, this trust (a) issues floating rate certificates, in face amounts equal to some fraction of the deposited bond’s par amount or market value, that typically pay short-term tax-exempt interest rates to third parties, and (b) issues to a long-term investor (such as one of the Funds) an inverse floating rate certificate (sometimes referred to as an “inverse floater”) that represents all remaining or residual interest in the trust. The income received by the inverse floater holder varies inversely with the short-term rate paid to the floating rate certificates’ holders, and in most circumstances the inverse floater holder bears substantially all of the underlying bond’s downside investment risk and also benefits disproportionately from any potential appreciation of the underlying bond’s value. The price of an inverse floating rate security will be more volatile than that of the underlying bond because the interest rate is dependent on not only the fixed coupon rate of the underlying bond but also on the short-term interest paid on the floating rate certificates, and because the inverse floating rate security essentially bears the risk of loss of the greater face value of the underlying bond.
A Fund may purchase an inverse floating rate security in a secondary market transaction without first owning the underlying bond (referred to as an “externally-deposited inverse floater”), or instead by first selling a fixed-rate bond to a broker-dealer for deposit into the special purpose trust and receiving in turn the residual interest in the trust (referred to as a “self-deposited inverse floater”). The inverse floater held by a Fund gives the Fund the right (a) to cause the holders of the floating rate certificates to tender their notes at par, and (b) to have the broker transfer the fixed-rate bond held by the trust to the Fund, thereby collapsing the trust. An investment in an externally-deposited inverse floater is identified in the Portfolio of Investments as “(IF) – Inverse floating rate investment.R 21; An investment in a self-deposited inverse floater is accounted for as a financing transaction. In such instances, a fixed-rate bond deposited into a special purpose trust is identified in the Portfolio of Investments as “(UB) – Underlying bond of an inverse floating rate trust reflected as a financing transaction,” with the Fund accounting for the short-term floating rate certificates issued by the trust as “Floating rate obligations” on the Statement of Assets and Liabilities. In addition, the Fund reflects in “Investment Income” the entire earnings of the underlying bond and recognizes the related interest paid to the holders of the short-term floating rate certificates is recognized as a component of “Interest expense and amortization of offering costs” on the Statement of Operations.
During the fiscal year ended September 30, 2010, each Fund invested in externally-deposited inverse floaters and/or self-deposited inverse floaters.
Each Fund may also enter into shortfall and forbearance agreements (sometimes referred to as a “recourse trust” or “credit recovery swap”) (such agreements referred to herein as “Recourse Trusts”) with a broker-dealer by which a Fund agrees to reimburse the broker-dealer, in certain circumstances, for the difference between the liquidation value of the fixed-rate bond held by the trust and the liquidation value of the floating rate certificates issued by the trust plus any shortfalls in interest cash flows. Under these agreements, a Fund’s potential exposure to losses related to or on inverse floaters may increase beyond the value of a Fund’s inverse floater investments as a Fund may potentially be liable to fulfill all amounts owed to holders of the floating rate certificates. At period end, any such shortfall is recognized as “Unrealized depreciation on Recourse Trusts” on the Statement of Assets and Liabilities.
Nuveen Investments 55
| | Notes to |
| | Financial Statements (continued) |
At September 30, 2010, each Fund’s maximum exposure to externally-deposited Recourse Trusts, is as follows:
| | | | New York Value (NNY | ) | | New York Value 2 (NYV | ) | | New York Performance Plus (NNP | ) | | New York Dividend Advantage (NAN | ) | | New York Dividend Advantage 2 (NXK | ) |
| Maximum exposure to Recourse Trusts | | $ | — | | $ | 4,000,000 | | $ | — | | $ | 2,670,000 | | $ | — | |
The average floating rate obligations outstanding and average annual interest rate and fees related to self-deposited inverse floaters during the fiscal year ended September 30, 2010, were as follows:
| | | | New York Value (NNY | ) | | New York Value 2 (NYV | ) | | New York Performance Plus (NNP | ) | | New York Dividend Advantage (NAN | ) | | New York Dividend Advantage 2 (NXK | ) |
| Average floating rate obligations outstanding | | $ | 3,255,000 | | $ | — | | $ | 34,645,000 | | $ | 17,735,000 | | $ | 12,150,000 | |
| Average annual interest rate and fees | | | 0.55 | % | | — | % | | 0.64 | % | | 0.64 | % | | 0.63 | % |
Futures Contracts
Each Fund is authorized to invest in futures contracts. Upon entering into a futures contract, a Fund is required to deposit with the broker an amount of cash or liquid securities equal to a specified percentage of the contract amount. This is known as the “initial margin.” Cash held by the broker to cover initial margin requirements on open futures contracts, if any, is recognized as “Deposits with brokers for open futures contracts” on the Statement of Assets and Liabilities. Subsequent payments (“variation margin”) are made or received by a Fund each day, depending on the daily fluctuation of the value of the contract. Variation margin is recognized as a receivable or payable for “Variation margin on futures contracts” on the Statement of Assets and Liabilities, when applicable.
During the period the futures contract is open, changes in the value of the contract are recorded as an unrealized gain or loss by “marking-to-market” on a daily basis to reflect the changes in market value of the contract and is recognized as “Change in net unrealized appreciation (depreciation) of futures contracts” on the Statement of Operations. When the contract is closed or expired, a Fund records a realized gain or loss equal to the difference between the value of the contract on the closing date and value of the contract when originally entered into, which is recognized as “Net realized gain (loss) from futures contracts” on the Statement of Operations.
Risks of investments in futures contracts include the possible adverse movement in the price of the securities or indices underlying the contracts, the possibility that there may not be a liquid secondary market for the contracts and/or that a change in the value of the contract may not correlate with a change in the value of the underlying securities or indices. The Funds did not enter into futures contracts during the fiscal year ended September 30, 2010.
Market and Counterparty Credit Risk
In the normal course of business each Fund may invest in financial instruments and enter into financial transactions where risk of potential loss exists due to changes in the market (market risk) or failure of the other party to the transaction to perform (counterparty credit risk). The potential loss could exceed the value of the financial assets recorded on the financial statements. Financial assets, which potentially expose each Fund to counterparty credit risk, consist principally of cash due from counterparties on forward, option and swap transactions, when applicable. The extent of each Fund’s exposure to counterparty credit risk in respect to these financial assets approximates their carrying value as recorded on the Statement of Assets and Liabilities. Futures contracts, when applicable, expose a Fund to minimal counterparty credit ri sk as they are exchange traded and the exchange’s clearinghouse, which is counterparty to all exchange traded futures, guarantees the futures contracts against default.
Each Fund helps manage counterparty credit risk by entering into agreements only with counterparties the Adviser believes have the financial resources to honor their obligations and by having the Adviser monitor the financial stability of the counterparties. Additionally, counterparties may be required to pledge collateral daily (based on the daily valuation of the financial asset) on behalf of each Fund with a value approximately equal to the amount of any unrealized gain above a pre-determined threshold. Reciprocally, when each Fund has an unrealized loss, the Funds have instructed the custodian to pledge assets of the Funds as collateral with a value approximately equal to the amount of the unrealized loss above a pre-determined threshold. Collateral pledges are monitored and subsequently adjusted if and when the valuations fluctuate, either up or down, by at least the pre-determined threshold amount.
Zero Coupon Securities
Each Fund is authorized to invest in zero coupon securities. A zero coupon security does not pay a regular interest coupon to its holders during the life of the security. Tax-exempt income to the holder of the security comes from accretion of the difference between the original purchase price of the security at issuance and the par value of the security at maturity and is effectively paid at maturity. The market prices of zero coupon securities generally are more volatile than the market prices of securities that pay interest periodically.
56 Nuveen Investments
Offering Costs
Costs incurred by New York Performance Plus (NNP) in connection with its offering of VRDP Shares ($1,320,000) were recorded as a deferred charge, which will be amortized over the 30-year life of the shares. Cost incurred by New York Dividend Advantage (NAN) and New York Dividend Advantage 2 (NXK) in connection with their offering of MTP Shares ($725,000 and $783,350, respectively) were recorded as a deferred charge, which will be amortized over the 5-year life of the shares. Each Fund’s amortized deferred charges are recognized as a component of “Interest expense and amortization of offering costs” on the Statement of Operations.
Custodian Fee Credit
Each Fund has an arrangement with the custodian bank whereby certain custodian fees and expenses are reduced by net credits earned on each Fund’s cash on deposit with the bank. Such deposit arrangements are an alternative to overnight investments. Credits for cash balances may be offset by charges for any days on which a Fund overdraws its account at the custodian bank.
Indemnifications
Under the Funds’ organizational documents, their officers and directors/trustees are indemnified against certain liabilities arising out of the performance of their duties to the Funds. In addition, in the normal course of business, the Funds enter into contracts that provide general indemnifications to other parties. The Funds’ maximum exposure under these arrangements is unknown as this would involve future claims that may be made against the Funds that have not yet occurred. However, the Funds have not had prior claims or losses pursuant to these contracts and expect the risk of loss to be remote.
Use of Estimates
The preparation of financial statements in conformity with U.S. GAAP requires management to make estimates and assumptions that affect the reported amounts of assets and liabilities at the date of the financial statements and the reported amounts of increases and decreases in net assets applicable to Common shares from operations during the reporting period. Actual results may differ from those estimates.
2. Fair Value Measurements
In determining the value of each Fund’s investments, various inputs are used. These inputs are summarized in the three broad levels listed below:
| | |
| | Level 1 – Quoted prices in active markets for identical securities. |
| | Level 2 – Other significant observable inputs (including quoted prices for similar securities, interest rates, prepayment speeds, credit risk, etc.). |
| | Level 3 – Significant unobservable inputs (including management’s assumptions in determining the fair value of investments). |
The inputs or methodologies used for valuing securities are not an indication of the risk associated with investing in those securities. The following is a summary of each Fund’s fair value measurements as of September 30, 2010:
| | | | | | | | | | | | | | |
| New York Value (NNY) | | | Level 1 | | | Level 2 | | | Level 3 | | | Total | |
| Investments: | | | | | | | | | | | | | |
| Municipal Bonds | | $ | — | | $ | 151,169,760 | | $ | — | | $ | 151,169,760 | |
| | | | | | | | | | | | | | |
| New York Value 2 (NYV) | | | Level 1 | | | Level 2 | | | Level 3 | | | Total | |
| Investments: | | | | | | | | | | | | | |
| Municipal Bonds | | $ | — | | $ | 37,099,943 | | $ | — | | $ | 37,099,943 | |
| | | | | | | | | | | | | | |
| New York Performance Plus (NNP) | | | Level 1 | | | Level 2 | | | Level 3 | | | Total | |
| Investments: | | | | | | | | | | | | | |
| Municipal Bonds | | $ | — | | $ | 353,702,695 | | $ | — | | $ | 353,702,695 | |
| Short-Term Investments | | | — | | | 1,495,000 | | | — | | | 1,495,000 | |
| Total | | $ | — | | $ | 355,197,695 | | $ | — | | $ | 355,197,695 | |
| | | | | | | | | | | | | | |
| New York Dividend Advantage (NAN) | | | Level 1 | | | Level 2 | | | Level 3 | | | Total | |
| Investments: | | | | | | | | | | | | | |
| Municipal Bonds | | $ | — | | $ | 199,844,726 | | $ | — | | $ | 199,844,726 | |
| | | | | | | | | | | | | | |
| New York Dividend Advantage 2 (NXK) | | | Level 1 | | | Level 2 | | | Level 3 | | | Total | |
| Investments: | | | | | | | | | | | | | |
| Municipal Bonds | | $ | — | | $ | 145,320,464 | | $ | — | | $ | 145,320,464 | |
Nuveen Investments 57
| | Notes to |
| | Financial Statements (continued) |
3. Derivative Instruments and Hedging Activities
The Funds record derivative instruments at fair value, with changes in fair value recognized on the Statement of Operations, when applicable. Even though the Funds’ investments in derivatives may represent economic hedges, they are not considered to be hedge transactions for financial reporting purposes. The Funds did not invest in derivative instruments during the fiscal year ended September 30, 2010.
4. Fund Shares
Common Shares
Transactions in Common shares were as follows:
| | | New York Value (NNY) | | New York Value 2 (NYV) | | New York Performance Plus (NNP) |
| | | | Year Ended 9/30/10 | | | Year Ended 9/30/09 | | | Year Ended 9/30/10 | | | For the period 4/28/09 (commencement of operations) through 9/30/09 | | | Year Ended 9/30/10 | | | Year Ended 9/30/09 | |
| Common shares: | | | | | | | | | | | | | | | | | | | |
| Sold* | | | — | | | — | | | — | | | 2,340,000 | | | — | | | — | |
| Issued to shareholders due | | | | | | | | | | | | | | | | | | | |
| to reinvestment of distributions | | | 24,956 | | | 23,357 | | | — | | | — | | | — | | | — | |
| Repurchased and retired | | | — | | | — | | | — | | | — | | | — | | | (27,800 | ) |
| Weighted average Common share: | | | | | | | | | | | | | | | | | | | |
| Price per share repurchased and retired | | | — | | | — | | | — | | | — | | | — | | $ | 11.10 | |
| Discount per share repurchased and retired | | | — | | | — | | | — | | | — | | | — | | | 19.25 | % |
| | | New York Dividend Advantage (NAN) | | New York Dividend Advantage 2 (NXK) | |
| | | | Year Ended 9/30/10 | | | Year Ended 9/30/09 | | | Year Ended 9/30/10 | | | Year Ended 9/30/09 | |
| Common shares: | | | | | | | | | | | | | |
| Issued to shareholders due to reinvestment of distributions | | | — | | | — | | | — | | | — | |
| Repurchased and retired | | | — | | | — | | | — | | | (7,200 | ) |
| Weighted average Common share: | | | | | | | | | | | | | |
| Price per share repurchased and retired | | | — | | | — | | | — | | $ | 10.62 | |
| Discount per share repurchased and retired | | | — | | | — | | | — | | | 18.33 | % |
* New York Value 2 (NYV) was the only Fund to sell Common shares during the fiscal year ended September 30, 2009.
Preferred Shares
New York Value (NNY) and New York Value 2 (NYV) are not authorized to issue ARPS. Transactions in ARPS were as follows:
| | | New York Performance Plus (NNP) | | New York Dividend Advantage (NAN) |
| | | Year Ended 9/30/10 | | | Year Ended 9/30/09 | | | Year Ended 9/30/10 | | | Year Ended 9/30/09 | | |
| | | Shares | | Amount | | Shares | | Amount | | Shares | | Amount | | Shares | | Amount | |
| ARPS redeemed: | | | | | | | | | | | | | | | | | | | | | | | | | |
| Series M | | | 1,129 | | $ | 28,225,000 | | | — | | $ | — | | | — | | $ | — | | | — | | $ | — | |
| Series T | | | 564 | | | 14,100,000 | | | — | | | — | | | — | | | — | | | — | | | — | |
| Series W | | | 1,410 | | | 35,250,000 | | | — | | | — | | | — | | | — | | | — | | | — | |
| Series F | | | 403 | | | 10,075,000 | | | — | | | — | | | 1,180 | | | 29,500,000 | | | — | | | — | |
| Total | | | 3,506 | | $ | 87,650,000 | | | — | | $ | — | | | 1,180 | | $ | 29,500,000 | | | — | | $ | — | |
58 Nuveen Investments
| | | New York Dividend Advantage 2 (NXK) |
| | | Year Ended 9/30/10 | | | Year Ended 9/30/09 | | |
| | | Shares | | Amount | | Shares | | Amount | |
| ARPS redeemed: | | | | | | | | | | | | | |
| Series W | | | 1,364 | | $ | 34,100,000 | | | — | | $ | — | |
Transactions in MTP Shares were as follows:
| | | New York Dividend Advantage (NAN) | | New York Dividend Advantage 2 (NXK) |
| | | Year Ended 9/30/10 | | | Year Ended 9/30/09 | | | Year Ended 9/30/10 | | | Year Ended 9/30/09 | | |
| | | Shares | | Amount | | Shares | | Amount | | Shares | | Amount | | Shares | | Amount | |
| MTP Shares issued: | | | | | | | | | | | | | | | | | | | | | | | | | |
| Series 2015 | | | 3,000,000 | | $ | 30,000,000 | | | — | | | — | | | 3,789,000 | | $ | 37,890,000 | | | — | | | — | |
Transactions in VRDP Shares were as follows:
| | | | New York Performance Plus (NNP) |
| | | | Year Ended 9/30/10 | | | | | Year Ended 9/30/09 | | | |
| | | | Shares | | | Amount | | | Shares | | | Amount | |
| VRDP Shares issued: | | | | | | | | | | | | | |
| Series 1 | | | 890 | | $ | 89,000,000 | | | — | | | — | |
5. Investment Transactions
Purchases and sales (including maturities but excluding short-term investments) during the fiscal year ended September 30, 2010, were as follows:
| | | New York Value (NNY | ) | New York Value 2 (NYV | ) | New York Performance Plus (NNP | ) | New York Dividend Advantage (NAN | ) | New York Dividend Advantage 2 (NXK | ) |
| Purchases | | $ | 16,570,178 | | $ | 2,168,730 | | $ | 41,280,163 | | $ | 21,133,048 | | $ | 16,553,430 | |
| Sales and maturities | | | 7,255,000 | | | 901,954 | | | 31,362,550 | | | 20,133,750 | | | 8,566,316 | |
6. Income Tax Information
The following information is presented on an income tax basis. Differences between amounts for financial statement and federal income tax purposes are primarily due to the timing differences in recognizing taxable market discount, timing differences in recognizing certain gains and losses on investment transactions and the treatment of investments in inverse floating rate securities reflected as financing transactions, if any. To the extent that differences arise that are permanent in nature, such amounts are reclassified within the capital accounts as detailed below. Temporary differences do not require reclassification. Temporary and permanent differences do not impact the net asset values of the Funds.
At September 30, 2010, the cost and unrealized appreciation (depreciation) of investments, as determined on a federal income tax basis, were as follows:
| | | | New York Value (NNY | ) | | New York Value 2 (NYV | ) | | New York Performance Plus (NNP | ) | | New York Dividend Advantage (NAN | ) | | New York Dividend Advantage 2 (NXK | ) |
| Cost of investments | | $ | 140,958,415 | | $ | 32,815,607 | | $ | 301,679,082 | | $ | 175,095,536 | | $ | 128,241,516 | |
| Gross unrealized: | | | | | | | | | | | | | | | | |
| Appreciation | | $ | 8,073,509 | | $ | 4,284,336 | | $ | 21,384,308 | | $ | 8,859,981 | | $ | 6,053,854 | |
| Depreciation | | | (1,119,465 | ) | | — | | | (2,514,475 | ) | | (1,846,668 | ) | | (1,123,683 | ) |
| Net unrealized appreciation (depreciation) of investments | | $ | 6,954,044 | | $ | 4,284,336 | | $ | 18,869,833 | | $ | 7,013,313 | | $ | 4,930,171 | |
Nuveen Investments 59
| | | Notes to |
| | | Financial Statements (continued) |
| |
Permanent differences, primarily due to federal taxes paid, taxable market discount and distribution character reclassifications, resulted in reclassifications among the Funds’ components of Common share net assets at September 30, 2010, the Funds’ tax year end, as follows:
| | | | New York Value (NNY) | | | New York Value 2 (NYV) | | | New York Performance Plus (NNP) | | | New York Dividend Advantage (NAN) | | | New York Dividend Advantage 2 (NXK) | |
| Paid-in-surplus | | $ | 4,418 | | $ | (6 | ) | $ | (22,220 | ) | $ | (112,003 | ) | $ | (75,711 | ) |
| Undistributed (Over-distribution of) net investment income | | | (22,823 | ) | | — | | | 18,218 | | | 90,585 | | | 76,137 | |
| Accumulated net realized gain (loss) | | | 18,405 | | | 6 | | | 4,002 | | | 21,418 | | | (426 | ) |
The tax components of undistributed net tax-exempt income, net ordinary income and net long-term capital gains at September 30, 2010, the Funds’ tax year end, were as follows:
| | | New York Value (NNY | ) | New York Value 2 (NYV | ) | New York Performance Plus (NNP | ) | New York Dividend Advantage (NAN | ) | New York Dividend Advantage 2 (NXK | ) |
| Undistributed net tax-exempt income * | | $ | 642,880 | | $ | 84,387 | | $ | 4,019,520 | | $ | 2,212,159 | | $ | 1,476,291 | |
| Undistributed net ordinary income ** | | | 6,773 | | | 26,661 | | | — | | | — | | | 7,280 | |
| Undistributed net long-term capital gains | | | 93,474 | | | — | | | 196,126 | | | 349,886 | | | 48,053 | |
| * | Undistributed net tax-exempt income (on a tax basis) has not been reduced for the dividend declared on September 1, 2010, and paid on October 1, 2010. |
| ** | Net ordinary income consists of taxable market discount income and net short-term capital gains, if any. |
The tax character of distributions paid during the Funds’ tax years ended September 30, 2010 and September 30, 2009, was designated for purposes of the dividends paid deduction as follows:
| 2010 | | New York Value (NNY | | New York Value 2 (NYV | ) | New York Performance Plus (NNP | ) | New York Dividend Advantage (NAN | ) | New York Dividend Advantage 2 (NXK | ) |
| Distributions from net tax-exempt income *** | | $ | 6,454,995 | | $ | 1,802,496 | | $ | 12,854,886 | | $ | 7,928,615 | | $ | 5,604,844 | |
| Distributions from net ordinary income ** | | | 75,868 | | | — | | | — | | | — | | | 5,541 | |
| Distributions from net long-term capital gains **** | | | 261,952 | | | — | | | 248,894 | | | 429,765 | | | 52,537 | |
60 Nuveen Investments
| 2009 | | New York Value (NNY | ) | New York Value 2 (NYV | )***** | New York Performance Plus (NNP | ) | New York Dividend Advantage (NAN | ) | New York Dividend Advantage 2 (NXK | ) |
| Distributions from net tax-exempt income | | $ | 6,447,404 | | $ | 450,624 | | $ | 11,827,384 | | $ | 7,301,446 | | $ | 5,057,663 | |
| Distributions from net ordinary income ** | | | 535,895 | | | — | | | 1,105,907 | | | 651,694 | | | 466,316 | |
| Distributions from net long-term capital gains | | | 949,431 | | | — | | | 1,488,610 | | | 438,066 | | | 677,222 | |
| ** | Net ordinary income consists of taxable market discount income and net short-term capital gains, if any. |
| *** | The Funds hereby designate these amounts paid during the fiscal year ended September 30, 2010, as Exempt Interest Dividends. |
| **** | The Funds designated as a long-term capital gain dividend, pursuant to the Internal Revenue Code Section 852 (b)(3), the amount necessary to reduce earnings and profits of the Funds related to net capital gain to zero for the tax year ended September 30, 2010. |
| ***** | For the period April 28, 2009 (commencement of operations) through September 30, 2009. |
7. Management Fees and Other Transactions with Affiliates
Each Fund’s management fee is separated into two components — a fund-level fee, based only on the amount of assets within each individual Fund, and a complex-level fee, based on the aggregate amount of all fund assets managed by the Adviser. This pricing structure enables each Fund’s shareholders to benefit from growth in the assets within their respective Fund as well as from growth in the amount of complex-wide assets managed by the Adviser.
New York Value (NNY) pays an annual fund-level fee, payable monthly, of .15% of the average daily net assets* of the Fund, as well as 4.125% of the gross interest income (excluding interest on bonds underlying a “self-deposited inverse floater” trust that is attributed to the Fund over and above the net interest earned on the inverse floater itself) of the Fund.
The annual fund-level fee for the following Funds, payable monthly, is calculated according to the following schedules:
| New York Performance Plus (NNP | ) |
| Average Daily Managed Assets* | Fund-Level Fee Rate | |
| For the first $125 million | | | .4500 | % |
| For the next $125 million | | | .4375 | |
| For the next $250 million | | | .4250 | |
| For the next $500 million | | | .4125 | |
| For the next $1 billion | | | .4000 | |
| For the next $3 billion | | | .3875 | |
| For managed assets over $5 billion | | | .3750 | |
| | New York Value 2 (NYV | ) |
| Average Daily Managed Assets* | Fund-Level Fee Rate | |
| For the first $125 million | | | .4000 | % |
| For the next $125 million | | | .3875 | |
| For the next $250 million | | | .3750 | |
| For the next $500 million | | | .3625 | |
| For the next $1 billion | | | .3500 | |
| For managed assets over $2 billion | | | .3375 | |
| | New York Dividend Advantage (NAN | ) |
| | New York Dividend Advantage 2 (NXK | ) |
| Average Daily Managed Assets* | Fund-Level Fee Rate | |
| For the first $125 million | | | .4500 | % |
| For the next $125 million | | | .4375 | |
| For the next $250 million | | | .4250 | |
| For the next $500 million | | | .4125 | |
| For the next $1 billion | | | .4000 | |
| For managed assets over $2 billion | | | .3750 | |
Nuveen Investments 61
| | | Notes to |
| | | Financial Statements (continued) |
| | | |
The annual complex-level fee for each fund, payable monthly, is calculated according to the following schedule:
| Complex-Level Managed Asset Breakpoint Level* | Effective Rate at Breakpoint Level |
| $55 billion | | .2000 | % |
| $56 billion | | .1996 | |
| $57 billion | | .1989 | |
| $60 billion | | .1961 | |
| $63 billion | | .1931 | |
| $66 billion | | .1900 | |
| $71 billion | | .1851 | |
| $76 billion | | .1806 | |
| $80 billion | | .1773 | |
| $91 billion | | .1691 | |
| $125 billion | | .1599 | |
| $200 billion | | .1505 | |
| $250 billion | | .1469 | |
| $300 billion | | .1445 | |
| * | For the fund-level and complex-level fees, managed assets include closed-end fund assets managed by the Adviser that are attributable to financial leverage. For these purposes, financial leverage includes the funds’ use of preferred stock and borrowings and certain investments in the residual interest certificates (also called inverse floating rate securities) in tender option bond (TOB) trusts, including the portion of assets held by a TOB trust that has been effectively financed by the trust’s issuance of floating rate securities, subject to an agreement by the Adviser as to certain funds to limit the amount of such assets for determining managed assets in certain circumstances. The complex-level fee is calculated based upon the aggregate daily managed assets of all Nuveen funds, with such daily managed assets defined separately for e ach fund in its management agreement, but excluding assets attributable to investments in other Nuveen funds. As of September 30, 2010, the complex-level fee rate was .1822%. |
The management fee compensates the Adviser for overall investment advisory and administrative services and general office facilities. The Funds pay no compensation directly to those of its directors/trustees who are affiliated with the Adviser or to its officers, all of whom receive remuneration for their services to the Funds from the Adviser or its affiliates. The Board of Directors/Trustees has adopted a deferred compensation plan for independent directors/trustees that enables directors/trustees to elect to defer receipt of all or a portion of the annual compensation they are entitled to receive from certain Nuveen advised funds. Under the plan, deferred amounts are treated as though equal dollar amounts had been invested in shares of select Nuveen advised funds.
For the first ten years of New York Dividend Advantage 2’s (NXK) operations, the Adviser has agreed to reimburse the Fund, as a percentage of average daily managed assets for fees and expenses in the amounts and for the time periods set forth below:
Year Ending March 31, | | | | | Year Ending March 31, | | | |
| 2001* | | .30 | % | | 2007 | | .25 | % |
| 2002 | | .30 | | | 2008 | | .20 | |
| 2003 | | .30 | | | 2009 | | .15 | |
| 2004 | | .30 | | | 2010 | | .10 | |
| 2005 | | .30 | | | 2011 | | .05 | |
| 2006 | | .30 | | | | | | |
* From the commencement of operations.
The Adviser has not agreed to reimburse New York Dividend Advantage 2 (NXK) for any portion of its fees and expenses beyond March 31, 2011.
8. New Accounting Standards
Fair Value Measurements
On January 21, 2010, Financial Accounting Standards Board issued changes to the authoritative guidance under U.S. GAAP for fair value measurements. The objective of which is to provide guidance on how investment assets and liabilities are to be valued and disclosed. Specifically, the amendment requires reporting entities disclose Level 3 activity for purchases, sales, issuances and settlements in the Level 3 roll-forward on a gross basis rather than as one net number. The effective date of the amendment is for interim and annual periods beginning after December 15, 2010. At this time, management is evaluating the implications of this guidance and the impact it will have to the financial statement amounts and footnote disclosures, if any.
62 Nuveen Investments
9. Subsequent Events
MTP Shares
Subsequent to the reporting period, New York Dividend Advantage (NAN) filed with the Securities and Exchange Commission (“SEC”) a registration statement seeking to register additional MTP Shares. This registration statement declared effective by the SEC, enables the Fund to issue to the public additional MTP Shares to refinance New York Dividend Advantage’s (NAN) remaining ARPS. The issuance of MTP Shares by New York Dividend Advantage (NAN) is subject to market conditions. There is no assurance that MTP Shares will be issued.
Nuveen Investments 63
Selected data for a Common share outstanding throughout each period:
| | | | | Investment Operations | | Less Distributions | | | | | | | | | |
| | | Beginning Common Share Net Asset Value | | Net Investment Income | | Net Realized/ Unrealized Gain (Loss) | | Total | | Net Investment Income to Common Share- holders | | Capital Gains to Common Share- holders | | Total | | Discount from Common Shares Repur- chased and Retired | | Offering Costs | | Ending Common Share Net Asset Value | | Ending Market Value | |
| New York Value (NNY) |
| Year Ended 9/30: |
| 2010 | �� | $ | 9.91 | | $ | .42 | | $ | .14 | | $ | .56 | | $ | (.43 | ) | $ | (.02 | ) | $ | (.45 | ) | $ | — | | $ | — | | $ | 10.02 | | $ | 9.88 | |
| 2009 | | | 9.28 | | | .43 | | | .73 | | | 1.16 | | | (.43 | ) | | (.10 | ) | | (.53 | ) | | — | | | — | | | 9.91 | | | 9.51 | |
| 2008 | | | 9.94 | | | .43 | | | (.65 | ) | | (.22 | ) | | (.43 | ) | | (.01 | ) | | (.44 | ) | | — | | | — | | | 9.28 | | | 9.01 | |
| 2007 | | | 10.09 | | | .43 | | | (.15 | ) | | .28 | | | (.43 | ) | | — | | | (.43 | ) | | — | | | — | | | 9.94 | | | 9.50 | |
| 2006 | | | 10.07 | | | .44 | | | .01 | | | .45 | | | (.43 | ) | | — | | | (.43 | ) | | — | | | — | | | 10.09 | | | 9.51 | |
| New York Value 2 (NYV) |
| Year Ended 9/30: |
| 2010 | | | 15.91 | | | .79 | | | .17 | | | .96 | | | (.77 | ) | | — | | | (.77 | ) | | — | | | — | | | 16.10 | | | 15.38 | |
| 2009(d) | | | 14.33 | | | .23 | | | 1.64 | | | 1.87 | | | (.26 | ) | | — | | | (.26 | ) | | — | | | (.03 | ) | | 15.91 | | | 14.84 | |
64 Nuveen Investments
| | | Ratios/Supplemental Data | |
| Total Returns | | | | Ratios to Average Net Assets Applicable to Common Shares(b) | | | |
Based on Market Value | (a) | Based on Common Share Net Asset Value | (a) | Ending Net Assets Applicable to Common Shares (000 | ) | Expenses Including Interest | (c) | Expenses Excluding Interest | | Net Investment Income | | Portfolio Turnover Rate | |
| | | | | | | | | | | | | | |
| 8.78 | % | | 5.82 | % | $ | 152,031 | | | .67 | % | | .65 | % | | 4.30 | % | | 5 | % |
| 11.78 | | | 13.00 | | | 150,063 | | | .71 | | | .68 | | | 4.58 | | | 3 | |
| (.62 | ) | | (2.38 | ) | | 140,285 | | | .71 | | | .68 | | | 4.39 | | | 16 | |
| 4.40 | | | 2.79 | | | 150,321 | | | .69 | | | .65 | | | 4.32 | | | 15 | |
| 7.50 | | | 4.56 | | | 152,573 | | | .66 | | | .66 | | | 4.35 | | | 13 | |
| | | | | | | | | | | | | | | | | | | | |
| | | | | | | | | | | | | | | | | | | | |
| 9.12 | | | 6.26 | | | 37,796 | | | .74 | | | .74 | | | 5.04 | | | 2 | |
| .73 | | | 12.99 | | | 37,347 | | | . 84 | * | | .84 | * | | 3.66 | * | | 4 | |
| (a) | Total Return Based on Market Value is the combination of changes in the market price per share and the effect of reinvested dividend income and reinvested capital gains distributions, if any, at the average price paid per share at the time of reinvestment. The last dividend declared in the period, which is typically paid on the first business day of the following month, is assumed to be reinvested at the ending market price. The actual reinvestment for the last dividend declared in the period may take place over several days, and in some instances may not be based on the market price, so the actual reinvestment price may be different from the price used in the calculation. Total returns are not annualized. |
| | Total Return Based on Common Share Net Asset Value is the combination of changes in Common share net asset value, reinvested dividend income at net asset value and reinvested capital gains distributions at net asset value, if any. The last dividend declared in the period, which is typically paid on the first business day of the following month, is assumed to be reinvested at the ending net asset value. The actual reinvest price for the last dividend declared in the period may often be based on the Fund’s market price (and not its net asset value), and therefore may be different from the price used in the calculation. Total returns are not annualized. |
| (b) | Ratios do not reflect the effect of custodian fee credits earned on the Fund’s net cash on deposit with the custodian bank, where applicable. |
| (c) | The expense ratios reflect, among other things, the interest expense deemed to have been paid by the Fund on the floating rate certificates issued by the special purpose trusts for the self-deposited inverse floaters held by the Fund, where applicable, as described in Footnote 1 – General Information and Significant Accounting Policies, Inverse Floating Rate Securities. |
| (d) | For the period April 28, 2009 (commencement of operations) through September 30, 2009. |
| * | Annualized. |
See accompanying notes to financial statements.
Nuveen Investments 65
| | | Financial |
| | | Highlights (continued) |
Selected data for a Common share outstanding throughout each period:
| | | Investment Operations | | Less Distributions | | | |
| | | Beginning Common Share Net Asset Value | | Net Investment Income | | Net Realized/ Unrealized Gain (Loss | ) | Distributions from Net Investment Income to Auction Rate Preferred Share- holders | (a) | Distributions from Capital Gains to Auction Rate Preferred Share- holders | (a) | Total | | Net Investment Income to Common Share- holders | | Capital Gains to Common Share- holders | | Total | | Discount from Common Shares Repur- chased and Retired | | Ending Common Share Net Asset Value | | Ending Market Value | |
| New York Performance Plus (NNP) | |
| Year Ended 9/30: | |
| 2010 | | $ | 15.63 | | $ | .91 | | $ | .38 | | $ | (.01 | ) | $ | — | * | $ | 1.28 | | $ | (.84 | ) | $ | (.02 | ) | $ | (.86 | ) | $ | — | | $ | 16.05 | | $ | 15.52 | |
| 2009 | | | 13.74 | | | .96 | | | 1.89 | | | (.05 | ) | | (.04 | ) | | 2.76 | | | (.74 | ) | | (.13 | ) | | (.87 | ) | | — | * | | 15.63 | | | 14.77 | |
| 2008 | | | 15.48 | | | .98 | | | (1.69 | ) | | (.27 | ) | | (.01 | ) | | (.99 | ) | | (.72 | ) | | (.03 | ) | | (.75 | ) | | — | | | 13.74 | | | 11.16 | |
| 2007 | | | 16.01 | | | .99 | | | (.41 | ) | | (.27 | ) | | (.01 | ) | | .30 | | | (.77 | ) | | (.06 | ) | | (.83 | ) | | — | | | 15.48 | | | 14.30 | |
| 2006 | | | 16.44 | | | 1.01 | | | — | * | | (.20 | ) | | (.05 | ) | | .76 | | | (.89 | ) | | (.30 | ) | | (1.19 | ) | | — | | | 16.01 | | | 15.88 | |
| New York Dividend Advantage (NAN) | |
| Year Ended 9/30: | |
| 2010 | | | 14.82 | | | .84 | | | .34 | | | (.01 | ) | | — | * | | 1.17 | | | (.78 | ) | | (.04 | ) | | (.82 | ) | | — | | | 15.17 | | | 14.43 | |
| 2009 | | | 13.12 | | | .93 | | | 1.68 | | | (.06 | ) | | (.03 | ) | | 2.52 | | | (.73 | ) | | (.09 | ) | | (.82 | ) | | — | | | 14.82 | | | 13.38 | |
| 2008 | | | 14.95 | | | .96 | | | (1.76 | ) | | (.24 | ) | | (.02 | ) | | (1.06 | ) | | (.70 | ) | | (.07 | ) | | (.77 | ) | | — | | | 13.12 | | | 11.36 | |
| 2007 | | | 15.49 | | | .97 | | | (.39 | ) | | (.24 | ) | | (.02 | ) | | .32 | | | (.77 | ) | | (.09 | ) | | (.86 | ) | | — | | | 14.95 | | | 14.33 | |
| 2006 | | | 15.83 | | | .98 | | | — | * | | (.21 | ) | | (.03 | ) | | .74 | | | (.89 | ) | | (.19 | ) | | (1.08 | ) | | — | | | 15.49 | | | 15.60 | |
| | | Auction Rate Preferred Shares at End of Period | | MuniFund Term Preferred Shares at End of Period | | Auction Rate Preferred Shares and MuniFund Term Preferred Shares at End of Period | | Variable Rate Demand Preferred Shares at End of Period | |
| | | Aggregate Amount Outstanding (000 | ) | Liquidation Value Per Share | | Asset Coverage Per Share | | Aggregate Amount Outstanding (000 | ) | Liquidation Value Per Share | | Ending Market Value Per Share | | Average Market Value Per Share | | Asset Coverage Per Share | | Asset Coverage Per $1 Liquidation Preference | | Aggregate Amount Outstanding (000 | ) | Liquidation Value Per Share | | Asset Coverage Per Share | |
| New York Performance Plus (NNP) | |
| Year Ended 9/30: | |
| 2010 | | $ | — | | $ | — | | $ | — | | $ | — | | $ | — | | $ | — | | $ | — | | $ | — | | $ | — | | $ | 89,000 | | $ | 100,000 | | $ | 371,292 | |
| 2009 | | | 87,650 | | | 25,000 | | | 92,059 | | | — | | | — | | | — | | | — | | | — | | | — | | | — | | | — | | | — | |
| 2008 | | | 87,650 | | | 25,000 | | | 84,035 | | | — | | | — | | | — | | | — | | | — | | | — | | | — | | | — | | | — | |
| 2007 | | | 124,300 | | | 25,000 | | | 71,914 | | | — | | | — | | | — | | | — | | | — | | | — | | | — | | | — | | | — | |
| 2006 | | | 124,300 | | | 25,000 | | | 73,395 | | | — | | | — | | | — | | | — | | | — | | | — | | | — | | | — | | | — | |
| New York Dividend Advantage (NAN) | |
| Year Ended 9/30: | |
| 2010 | | | 21,900 | | | 25,000 | | | 92,690 | | | 30,000 | | | 10.00 | | | 10.16 | | | 10.09 | ^ | | 37.08 | | | 3.71 | | | — | | | — | | | — | |
| 2009 | | | 51,400 | | | 25,000 | | | 91,765 | | | — | | | — | | | — | | | — | | | — | | | — | | | — | | | — | | | — | |
| 2008 | | | 51,400 | | | 25,000 | | | 84,112 | | | — | | | — | | | — | | | — | | | — | | | — | | | — | | | — | | | — | |
| 2007 | | | 69,000 | | | 25,000 | | | 75,183 | | | — | | | — | | | — | | | — | | | — | | | — | | | — | | | — | | | — | |
| 2006 | | | 69,000 | | | 25,000 | | | 76,865 | | | — | | | — | | | — | | | — | | | — | | | — | | | — | | | — | | | — | |
66 Nuveen Investments
| | | | Ratios/Supplemental Data |
| Total Returns | | | | | Ratios to Average Net Assets Applicable to Common Shares Before Reimbursement(c) | | Ratios to Average Net Assets Applicable to Common Shares After Reimbursement(c)(d) | | | | |
Based on Market Value | (b) | Based on Common Share Net Asset Value | (b) | Ending Net Assets Applicable to Common Shares (000 | ) | Expenses Including Interest | (e) | Expenses Excluding Interest | | Net Investment Income | | Expenses Including Interest | (e) | Expenses Excluding Interest | | Net Investment Income | | Portfolio Turnover Rate | |
| | | | | | | | | | | | | | | | | | | | |
| 11.39% | | | 8.46 | % | $ | 241,450 | | | 1.53 | % | | 1.35 | % | | 5.84 | % | | N/A | | | N/A | | | N/A | | | 9 | % |
| 42.29 | | | 21.05 | | | 235,108 | | | 1.39 | | | 1.17 | | | 6.91 | | | N/A | | | N/A | | | N/A | | | 1 | |
| (17.61) | | | (6.71 | ) | | 206,976 | | | 1.42 | | | 1.27 | | | 6.48 | | | N/A | | | N/A | | | N/A | | | 16 | |
| (5.02) | | | 1.90 | | | 233,258 | | | 1.29 | | | 1.22 | | | 6.33 | | | N/A | | | N/A | | | N/A | | | 14 | |
| 6.69 | | | 4.91 | | | 240,618 | | | 1.22 | | | 1.22 | | | 6.33 | | | N/A | | | N/A | | | N/A | | | 13 | |
| | | | | | | | | | | | | | | | | | | | | | | | | | | | | |
| | | | | | | | | | | | | | | | | | | | | | | | | | | | | |
| 14.63 | | | 8.28 | | | 140,525 | | | 1.74 | | | 1.19 | | | 5.74 | | | 1.74 | % | | 1.19 | % | | 5.74 | % | | 10 | |
| 26.58 | | | 20.29 | | | 137,268 | | | 1.37 | | | 1.17 | | | 7.07 | | | 1.31 | | | 1.11 | | | 7.13 | | | 4 | |
| (16.02) | | | (7.45 | ) | | 121,533 | | | 1.36 | | | 1.23 | | | 6.45 | | | 1.22 | | | 1.09 | | | 6.59 | | | 17 | |
| (2.86) | | | 2.07 | | | 138,504 | | | 1.29 | | | 1.19 | | | 6.15 | | | 1.07 | | | .97 | | | 6.36 | | | 18 | |
| 3.49 | | | 4.91 | | | 143,147 | | | 1.18 | | | 1.18 | | | 6.11 | | | .89 | | | .89 | | | 6.40 | | | 15 | |
| (a) | The amounts shown are based on Common share equivalents. |
| (b) | Total Return Based on Market Value is the combination of changes in the market price per share and the effect of reinvested dividend income and reinvested capital gains distributions, if any, at the average price paid per share at the time of reinvestment. The last dividend declared in the period, which is typically paid on the first business day of the following month, is assumed to be reinvested at the ending market price. The actual reinvestment for the last dividend declared in the period may take place over several days, and in some instances may not be based on the market price, so the actual reinvestment price may be different from the price used in the calculation. Total returns are not annualized. |
| | Total Return Based on Common Share Net Asset Value is the combination of changes in Common share net asset value, reinvested dividend income at net asset value and reinvested capital gains distributions at net asset value, if any. The last dividend declared in the period, which is typically paid on the first business day of the following month, is assumed to be reinvested at the ending net asset value. The actual reinvest price for the last dividend declared in the period may often be based on the Fund’s market price (and not its net asset value), and therefore may be different from the price used in the calculation. Total returns are not annualized. |
| (c) | Ratios do not reflect the effect of dividend payments to Auction Rate Preferred shareholders; Net Investment Income ratios reflect income earned and expenses incurred on assets attributable to Auction Rate Preferred shares, MuniFund Term Preferred shares and/or Variable Rate Demand Preferred shares, where applicable. |
| (d) | After expense reimbursement from the Adviser, where applicable. Ratios do not reflect the effect of custodian fee credits earned on the Fund’s net cash on deposit with the custodian bank, where applicable. As of August 1, 2009, the Adviser is no longer reimbursing New York Dividend Advantage (NAN) for any fees and expenses. |
| (e) | The expense ratios reflect, among other things and where applicable, payments to MuniFund Term Preferred shareholders, Variable Rate Demand Preferred shareholders and/or the interest expense deemed to have been paid by the Fund on the floating rate certificates issued by the special purpose trusts for the self-deposited inverse floaters held by the Fund, where applicable, as described in Footnote 1 – General Information and Significant Accounting Policies, MuniFund Term Preferred Shares, Variable Rate Demand Preferred Shares and Inverse Floating Rate Securities, respectively. |
| * | Rounds to less than $.01 per share. |
| ^ | For the period December 21, 2009 (issuance date of shares) through September 30, 2010. |
| N/A | Fund does not have a contractual reimbursement with the Adviser. |
See accompanying notes to financial statements.
Nuveen Investments 67
| | | Financial |
| | | Highlights (continued) |
Selected data for a Common share outstanding throughout each period:
| | | | | Investment Operations | | Less Distributions | | | | | | | |
| | | Beginning Common Share Net Asset Value | | Net Investment Income | | Net Realized/ Unrealized Gain (Loss | ) | Distributions from Net Investment Income to Auction Rate Preferred Share- holders | (a) | Distributions from Capital Gains to Auction Rate Preferred Share- holders | (a) | Total | | Net Investment Income to Common Share- holders | | Capital Gains to Common Share- holders | | Total | | Discount from Common Shares Repur- chased and Retired | | Ending Common Share Net Asset Value | | Ending Market Value | |
| New York Dividend Advantage 2 (NXK) | |
| Year Ended 9/30: | |
| 2010 | | $ | 14.76 | | $ | .83 | | $ | .36 | | $ | (.01 | ) | $ | — | * | $ | 1.18 | | $ | (.80 | ) | $ | (.01 | ) | $ | (.81 | ) | $ | — | | $ | 15.13 | | $ | 14.37 | |
| 2009 | | | 13.14 | | | .92 | | | 1.66 | | | (.05 | ) | | (.04 | ) | | 2.49 | | | (.73 | ) | | (.14 | ) | | (.87 | ) | | — | * | | 14.76 | | | 13.41 | |
| 2008 | | | 14.80 | | | .95 | | | (1.64 | ) | | (.23 | ) | | (.01 | ) | | (.93 | ) | | (.69 | ) | | (.04 | ) | | (.73 | ) | | — | | | 13.14 | | | 11.15 | |
| 2007 | | | 15.29 | | | .95 | | | (.34 | ) | | (.24 | ) | | (.02 | ) | | .35 | | | (.76 | ) | | (.08 | ) | | (.84 | ) | | — | | | 14.80 | | | 14.16 | |
| 2006 | | | 15.57 | | | .97 | | | .05 | | | (.20 | ) | | (.03 | ) | | .79 | | | (.87 | ) | | (.20 | ) | | (1.07 | ) | | — | | | 15.29 | | | 15.47 | |
| | | Auction Rate Preferred Shares at End of Period | | MuniFund Term Preferred Shares at End of Period | |
| | | Aggregate Amount Outstanding (000 | ) | Liquidation Value Per Share | | Asset Coverage Per Share | | Aggregate Amount Outstanding (000 | ) | Liquidation Value Per Share | | Ending Market Value Per Share | | Average Market Value Per Share | | Asset Coverage Per Share | |
| New York Dividend Advantage 2 (NXK) | |
| Year Ended 9/30: | |
| 2010 | | $ | — | | $ | — | | $ | — | | $ | 37,890 | | $ | 10.00 | | $ | 10.14 | | $ | 10.05 | ^ | $ | 35.91 | |
| 2009 | | | 34,100 | | | 25,000 | | | 95,198 | | | — | | | — | | | — | | | — | | | — | |
| 2008 | | | 34,100 | | | 25,000 | | | 87,566 | | | — | | | — | | | — | | | — | | | — | |
| 2007 | | | 47,000 | | | 25,000 | | | 76,140 | | | — | | | — | | | — | | | — | | | — | |
| 2006 | | | 47,000 | | | 25,000 | | | 77,695 | | | — | | | — | | | — | | | — | | | — | |
68 Nuveen Investments
| | | | | Ratios/Supplemental Data |
| Total Returns | | | | Ratios to Average Net Assets Applicable to Common Shares Before Reimbursement(c) | | Ratios to Average Net Assets Applicable to Common Shares After Reimbursement(c)(d) | | | |
Based on Market Value | (b) | Based on Common Share Net Asset Value | (b) | Ending Net Assets Applicable to Common Shares (000 | ) | Expenses Including Interest | (e) | Expenses Excluding Interest | | Net Investment Income | | Expenses Including Interest | (e) | Expenses Excluding Interest | | Net Investment Income | | Portfolio Turnover Rate | |
| | | | | | | | | | | | | | | | | | | | |
| 13.65 | % | | 8.27 | % | $ | 98,156 | | | 1.74 | % | | 1.19 | % | | 5.54 | % | | 1.63 | % | | 1.08 | % | | 5.65 | % | | 6 | % |
| 29.95 | | | 20.06 | | | 95,751 | | | 1.36 | | | 1.16 | | | 6.83 | | | 1.18 | | | .98 | | | 7.01 | | | 0 | |
| (16.79 | ) | | (6.63 | ) | | 85,340 | | | 1.37 | | | 1.23 | | | 6.25 | | | 1.11 | | | .97 | | | 6.51 | | | 17 | |
| (3.20 | ) | | 2.35 | | | 96,144 | | | 1.32 | | | 1.22 | | | 5.98 | | | .99 | | | .89 | | | 6.31 | | | 17 | |
| 7.96 | | | 5.37 | | | 99,067 | | | 1.19 | | | 1.19 | | | 5.96 | | | .78 | | | .78 | | | 6.36 | | | 14 | |
| (a) | The amounts shown are based on Common share equivalents. |
| (b) | Total Return Based on Market Value is the combination of changes in the market price per share and the effect of reinvested dividend income and reinvested capital gains distributions, if any, at the average price paid per share at the time of reinvestment. The last dividend declared in the period, which is typically paid on the first business day of the following month, is assumed to be reinvested at the ending market price. The actual reinvestment for the last dividend declared in the period may take place over several days, and in some instances may not be based on the market price, so the actual reinvestment price may be different from the price used in the calculation. Total returns are not annualized. |
| | Total Return Based on Common Share Net Asset Value is the combination of changes in Common share net asset value, reinvested dividend income at net asset value and reinvested capital gains distributions at net asset value, if any. The last dividend declared in the period, which is typically paid on the first business day of the following month, is assumed to be reinvested at the ending net asset value. The actual reinvest price for the last dividend declared in the period may often be based on the Fund’s market price (and not its net asset value), and therefore may be different from the price used in the calculation. Total returns are not annualized. |
| (c) | Ratios do not reflect the effect of dividend payments to Auction Rate Preferred shareholders; Net Investment Income ratios reflect income earned and expenses incurred on assets attributable to Auction Rate Preferred shares and/or MuniFund Term Preferred Shares, where applicable. |
| (d) | After expense reimbursement from the Adviser, where applicable. Ratios do not reflect the effect of custodian fee credits earned on the Fund’s net cash on deposit with the custodian bank, where applicable. |
| (e) | The expense ratios reflect, among other things, payments to Munifund Term Preferred shareholders and/or the interest expense deemed to have been paid by the Fund on the floating rate certificates issued by the special purpose trusts for the self-deposited inverse floaters held by the Fund, where applicable, both as described in Footnote 1 – General Information and Significant Accounting Policies, MuniFund Term Preferred Shares and Inverse Floating Rate Securities, respectively. |
| * | Rounds to less than $.01 per share. |
| ^ | For the period April 14, 2010 (issuance date of shares) through September 30, 2010. |
See accompanying notes to financial statements.
Nuveen Investments 69
Board Members & Officers (Unaudited)
The management of the Funds, including general supervision of the duties performed for the Funds by the Adviser, is the responsibility of the Board Members of the Funds. The number of board members of the Fund is currently set at nine. None of the board members who are not “interested” persons of the Funds (referred to herein as “independent board members”) has ever been a director or employee of, or consultant to, Nuveen or its affiliates. The names and business addresses of the board members and officers of the Funds, their principal occupations and other affiliations during the past five years, the number of portfolios each oversees and other directorships they hold are set forth below.
| | Name, Birthdate & Address | | Position(s) Held with the Funds | | Year First Elected or Appointed and Term(1) | | Principal Occupation(s) Including other Directorships During Past 5 Years | | Number of Portfolios in Fund Complex Overseen by Board Member |
| | | | | | | | | | |
| | Independent Board Members: | | | | | | | | |
| ■ | ROBERT P. BREMNER(2) | | | | | | | | |
| | 8/22/40 333 W. Wacker Drive Chicago, IL 60606 | | Chairman of the Board and Board Member | | 1996 | | Private Investor and Management Consultant; Treasurer and Director, Humanities Council of Washington, D.C. | | 205 |
| | | | | | | | | | |
| ■ | JACK B. EVANS | | | | | | | | |
| | 10/22/48 333 W. Wacker Drive Chicago, IL 60606 | | Board Member | | 1999 | | President, The Hall-Perrine Foundation, a private philanthropic corporation (since 1996); Director and Chairman, United Fire Group, a publicly held company; President Pro Tem of the Board of Regents for the State of Iowa University System; Director, Gazette Companies; Life Trustee of Coe College and the Iowa College Foundation; formerly, Director, Alliant Energy; formerly, Director, Federal Reserve Bank of Chicago; formerly, President and Chief Operating Officer, SCI Financial Group, Inc., a regional financial services firm. | | 205 |
| | | | | | | | | | |
| ■ | WILLIAM C. HUNTER | | | | | | | | |
| | 3/6/48 333 W. Wacker Drive Chicago, IL 60606 | | Board Member | | 2004 | | Dean, Tippie College of Business, University of Iowa (since 2006); Director (since 2004) of Xerox Corporation; Director (since 2005), Beta Gamma Sigma International Honor Society; formerly, Dean and Distinguished Professor of Finance, School of Business at the University of Connecticut (2003-2006); previously, Senior Vice President and Director of Research at the Federal Reserve Bank of Chicago (1995-2003); formerly, Director (1997-2007), Credit Research Center at Georgetown University. | | 205 |
| | | | | | | | | | |
| ■ | DAVID J. KUNDERT(2) | | | | | | | | |
| | 10/28/42 333 W. Wacker Drive Chicago, IL 60606 | | Board Member | | 2005 | | Director, Northwestern Mutual Wealth Management Company; retired (since 2004) as Chairman, JPMorgan Fleming Asset Management, President and CEO, Banc One Investment Advisors Corporation, and President, One Group Mutual Funds; prior thereto, Executive Vice President, Banc One Corporation and Chairman and CEO, Banc One Investment Management Group; Member, Board of Regents, Luther College; member of the Wisconsin Bar Association; member of Board of Directors, Friends of Boerner Botanical Gardens; member of Board of Directors and chair of Investment Committee, Greater Milwaukee Foundation. | | 205 |
| | | | | | | | | | |
| ■ | WILLIAM J. SCHNEIDER(2) | | | | | | | | |
| | 9/24/44 333 W. Wacker Drive Chicago, IL 60606 | | Board Member | | 1997 | | Chairman of Miller-Valentine Partners Ltd., a real estate investment company; formerly, Senior Partner and Chief Operating Officer (retired, 2004) of Miller-Valentine Group; member, University of Dayton Business School Advisory Council;member, Mid-America Health System board; formerly, member and chair, Dayton Philharmonic Orchestra Association; formerly, member, Business Advisory Council, Cleveland Federal Reserve Bank. | | 205 |
70 Nuveen Investments
| | Name, Birthdate & Address | | Position(s) Held with the Funds | | Year First Elected or Appointed and Term(1) | | Principal Occupation(s) Including other Directorships During Past 5 Years | | Number of Portfolios in Fund Complex Overseen by Board Member |
| | | | | | | | | | |
| | Independent Board Members: | | | | | | | | |
| ■ | JUDITH M. STOCKDALE | | | | | | | | |
| | 12/29/47 333 W. Wacker Drive Chicago, IL 60606 | | Board Member | | 1997 | | Executive Director, Gaylord and Dorothy Donnelley Foundation (since 1994); prior thereto, Executive Director, Great Lakes Protection Fund (1990-1994). | | 205 |
| | | | | | | | | | |
| ■ | CAROLE E. STONE(2) | | | | | | | | |
| | 6/28/47 333 W. Wacker Drive Chicago, IL 60606 | | Board Member | | 2007 | | Director, Chicago Board Options Exchange (since 2006); Director, C2 Options Exchange, Incorporated (since 2009); formerly, Commissioner, New York State Commission on Public Authority Reform (2010); formerly, Chair, New York Racing Association Oversight Board (2005-2007). | | 205 |
| | | | | | | | | | |
| ■ | TERENCE J. TOTH(2) | | | | | | | | |
| | 9/29/59 333 W. Wacker Drive Chicago, IL 60606 | | Board Member | | 2008 | | Director, Legal & General Investment Management America, Inc. (since 2008); Managing Partner, Promus Capital (since 2008); formerly, CEO and President, Northern Trust Global Investments (2004-2007); Executive Vice President, Quantitative Management & Securities Lending (2000-2004); prior thereto, various positions with Northern Trust Company (since 1994); member: Goodman Theatre Board (since 2004), Chicago Fellowship Boards (since 2005), University of Illinois Leadership Council Board (since 2007) and Catalyst Schools of Chicago Board (since 2008); formerly, member: Northern Trust Mutual Funds Board (2005-2007), Northern Trust Global Investments Board (2004-2007), Northern Trust Japan Board (2004-2007), Northern Trust Securities Inc. Board (2003-2007) and Northern Trust Hong Kong Board (1997-2004). | | 205 |
| | | | | | | | | | |
| | Interested Board Member: | | | | | | | | |
| ■ | JOHN P. AMBOIAN(3) | | | | | | | | |
| | 6/14/61 333 W. Wacker Drive Chicago, IL 60606 | | Board Member | | 2008 | | Chief Executive Officer (since July 2007), Director (since 1999) and Chairman (since 2007) of Nuveen Investments, Inc.; Chief Executive Officer (since 2007) of Nuveen Asset Management, Nuveen Investments Advisors, Inc. | | 205 |
| | | | | | | | | | |
| | Officers of the Funds: | | | | | | | | |
| ■ | GIFFORD R. ZIMMERMAN | | | | | | | | |
| | 9/9/56 333 W. Wacker Drive Chicago, IL 60606 | | Chief Administrative Officer | | 1988 | | Managing Director (since 2002), Assistant Secretary and Associate General Counsel of Nuveen Investments, LLC; Managing Director (since 2004) and Assistant Secretary (since 1994) of Nuveen Investments, Inc.; Managing Director, Associate General Counsel and Assistant Secretary, of Nuveen Asset Management (since 2002) and of Symphony Asset Management LLC, (since 2003); Vice President and Assistant Secretary of NWQ Investment Management Company, LLC. (since 2002), Nuveen Investments Advisers Inc. (since 2002), Tradewinds Global Investors, LLC, and Santa Barbara Asset Management, LLC (since 2006), Nuveen HydePark Group LLC and Nuveen Investment Solutions, Inc. (since 2007) and of Winslow Capital Management, Inc. (since 2010); Chief Administrative Officer and Chief Compliance Officer (since 2010) of Nuveen Commodities Asset Management, LLC; Chartered Fin ancial Analyst. | | 205 |
Nuveen Investments 71
Board Members & Officers (Unaudited) (continued)
| | | | | | | | | | |
| | Name, Birthdate and Address | | Position(s) Held with the Funds | | Year First Elected or Appointed(4) | | Principal Occupation(s) During Past 5 Years | | Number of Portfolios in Fund Complex Overseen by Officer |
| | | | | | | | | | |
| | Officers of the Funds: | | | | | | | | |
| ■ | WILLIAM ADAMS IV | | | | | | | | |
| | 6/9/55 333 W. Wacker Drive Chicago, IL 60606 | | Vice President | | 2007 | | Executive Vice President of Nuveen Investments, Inc.; Executive Vice President, U.S. Structured Products of Nuveen Investments, LLC, (since 1999), ; Managing Director (since 2010) of Nuveen Commodities Asset Management, LLC. | | 130 |
| | | | | | | | | | |
| ■ | MARGO L. COOK | | | | | | | | |
| | 4/11/64 333 W. Wacker Drive Chicago, IL 60606 | | Vice President | | 2009 | | Executive Vice President (since 2008) of Nuveen Investments, Inc.; previously, Head of Institutional Asset Management (2007-2008) of Bear Stearns Asset Management; Head of Institutional Asset Management (1986-2007) of Bank of NY Mellon; Chartered Financial Analyst. | | 205 |
| | | | | | | | | | |
| ■ | LORNA C. FERGUSON | | | | | | | | |
| | 10/24/45 333 W. Wacker Drive Chicago, IL 60606 | | Vice President | | 1998 | | Managing Director (since 2004) of Nuveen Investments, LLC and Managing Director (since 2005) of Nuveen Asset Management. | | 205 |
| | | | | | | | | | |
| ■ | STEPHEN D. FOY | | | | | | | | |
| | 5/31/54 333 W. Wacker Drive Chicago, IL 60606 | | Vice President and Controller | | 1998 | | Senior Vice President (since 2010), formerly, Vice President (1993- 2010) and Funds Controller (since 1998) of Nuveen Investments, LLC; Senior Vice President (since 2010), formerly, Vice President (2005-2010) of Nuveen Asset Management; Certified Public Accountant. | | 205 |
| | | | | | | | | | |
| ■ | SCOTT S. GRACE | | | | | | | | |
| | 8/20/70 333 W. Wacker Drive Chicago, IL 60606 | | Vice President and Treasurer | | 2009 | | Managing Director, Corporate Finance & Development, Treasurer (since 2009) of Nuveen Investments, LLC; Managing Director and Treasurer of Nuveen Asset Management (since 2009); Nuveen Investment Solutions, Inc., Nuveen Investments Advisers, Inc., and Nuveen Investments Holdings, Inc.; Vice President and Treasurer of NWQ Investment Management Company, LLC, Tradewinds Global Investors, LLC, Symphony Asset Management LLC and Winslow Capital Management, Inc.; Vice President of Santa Barbara Asset Management, LLC; formerly, Treasurer (2006-2009), Senior Vice President (2008-2009), previously, Vice President (2006-2008) of Janus Capital Group, Inc.; formerly, Senior Associate in Morgan Stanley’s Global Financial Services Group (2000- 2003); Chartered Accountant Designation. | | 205 |
| | | | | | | | | | |
| ■ | WALTER M. KELLY | | | | | | | | |
| | 2/24/70 333 W. Wacker Drive Chicago, IL 60606 | | Chief Compliance Officer and Vice President | | 2003 | | Senior Vice President (since 2008), Vice President (2006-2008) formerly, Assistant Vice President and Assistant General Counsel (2003-2006) of Nuveen Investments, LLC; Senior Vice President (since 2008), formerly, Vice President (2006-2008) and Assistant Secretary (since 2008) of Nuveen Asset Management. | | 205 |
| | | | | | | | | | |
| ■ | TINA M. LAZAR | | | | | | | | |
| | 8/27/61 333 W. Wacker Drive Chicago, IL 60606 | | Vice President | | 2002 | | Senior Vice President (since 2009), formerly, Vice President of Nuveen Investments, LLC (1999-2009); Senior Vice President (since 2010), formerly, Vice President (2005-2010) of Nuveen Asset Management. | | 205 |
72 Nuveen Investments
| | Name, Birthdate and Address | | Position(s) Held with the Funds | | Year First Elected or Appointed(4) | | Principal Occupation(s) During Past 5 Years | | Number of Portfolios in Fund Complex Overseen by Officer |
| | | | | | | | | | |
| | Officers of the Funds: | | | | | | | | |
| ■ | KEVIN J. MCCARTHY | | | | | | | | |
| | 3/26/66 333 W. Wacker Drive Chicago, IL 60606 | | Vice President and Secretary | | 2007 | | Managing Director (since 2008), formerly, Vice President (2007-2008), Nuveen Investments, LLC; Managing Director (since 2008), formerly, Vice President, and Assistant Secretary, Nuveen Asset Management, and Nuveen Investments Holdings, Inc.; Vice President (since 2007) and Assistant Secretary, Nuveen Investment Advisers Inc., NWQ Investment Management Company, LLC, Tradewinds Global Investors LLC, NWQ Holdi ngs, LLC, Symphony Asset Management LLC, Santa Barbara Asset Management LLC, Nuveen HydePark Group, LLC and Nuveen Investment Solutions, Inc. (since 2007) and of Winslow Capital Management, Inc. (since 2010); Vice President and Secretary (since 2010) of Nuveen Commodities Asset Management, LLC; prior thereto, Partner, Bell, Boyd & Lloyd LLP (1997-2007). | | 205 |
| | |
| (1) | For New York Municipal Value (NNY) and New York Municipal Value 2 (NYV) Board Members serve three year terms. The Board of Trustees for NNY and NYV are divided into three classes, Class I, Class II, and Class III, with each being elected to serve until the third succeeding annual shareholders’ meeting subsequent to its election or thereafter in each case when its respective successors are duly elected or appointed. For New York Dividend Advantage (NAN) and New York Dividend Advantage 2 (NXK), Board Members serve three year terms, except for two board members who are elected by the holders of Preferred Shares to serve until the next annual shareholders’ meeting subsequent to its election or thereafter in each case when its respective successors are duly elected or appointed. The Board of Trustees for NAN and NXK is divided into three cla sses, Class I, Class II, and Class III, with each being elected to serve until the third succeeding annual shareholders’ meeting subsequent to its election or thereafter in each case when its respective successors are duly elected or appointed, except two board members are elected by the holders of Preferred Shares to serve until the next annual shareholders’ meeting subsequent to its election or thereafter in each case when its respective successors are duly elected or appointed. For New York Performance Plus (NNP), the Board Members serve a one year term to serve until the next annual meeting or until their successors shall have been duly elected and qualified. The first year elected or appointed represents the year in which the board member was first elected or appointed to any fund in the Nuveen Complex. |
| (2) | Also serves as a trustee of the Nuveen Diversified Commodity Fund, an exchange-traded commodity pool managed by Nuveen Commodities Asset Management, LLC, an affiliate of Nuveen Asset Management. |
| (3) | Mr. Amboian is an interested trustee because of his position with Nuveen Investments, Inc. and certain of its subsidiaries, which are affiliates of the Nuveen Funds. |
| (4) | Officers serve one year terms through August of each year. The year first elected or appointed represents the year in which the Officer was first elected or appointed to any fund in the Nuveen Complex. |
Nuveen Investments 73
Annual Investment Management
Agreement Approval Process (Unaudited)
The Investment Company Act of 1940, as amended (the “1940 Act”), provides, in substance, that each investment advisory agreement between a fund and its investment adviser will continue in effect from year to year only if its continuance is approved at least annually by the fund’s board members, including by a vote of a majority of the board members who are not parties to the advisory agreement or “interested persons” of any parties (the “Independent Board Members”), cast in person at a meeting called for the purpose of considering such approval. In connection with such approvals, the fund’s board members must request and evaluate, and the investment adviser is required to furnish, such inf ormation as may be reasonably necessary to evaluate the terms of the advisory agreement. Accordingly, at a meeting held on May 25-26, 2010 (the “May Meeting”), the Boards of Trustees or Directors (as the case may be) (each a “Board” and each Trustee or Director, a “Board Member”) of the Funds, including a majority of the Independent Board Members, considered and approved the continuation of the advisory agreements (each an “Advisory Agreement”) between each Fund and Nuveen Asset Management (the “Adviser”) for an additional one-year period. In preparation for their considerations at the May Meeting, the Board also held a separate meeting on April 21-22, 2010 (the “ April Meeting”). Accordingly, the factors considered and determinations made regarding the renewals by the Independent Board Members include those made at the April Meeting.
In addition, in evaluating the Advisory Agreements, the Independent Board Members reviewed a broad range of information relating to the Funds and the Adviser, including absolute and comparative performance, fee and expense information for the Funds (as described in more detail below), the profitability of Nuveen for its advisory activities (which includes its wholly owned subsidiaries), and other information regarding the organization, personnel, and services provided by the Adviser. The Independent Board Members also met quarterly as well as at other times as the need arose during the year and took into account the information provided at such meetings and the knowledge gained therefrom. Prior to approving the renewal of the Advisory Agreements, the Independent Board Members reviewed the foregoing information with their independent legal counsel a nd with management, reviewed materials from independent legal counsel describing applicable law and their duties in reviewing advisory contracts, and met with independent legal counsel in private sessions without management present. The Independent Board Members considered the legal advice provided by independent legal counsel and relied upon their knowledge of the Adviser, its services and the Funds resulting from their meetings and other interactions throughout the year and their own business judgment in determining the factors to be considered in evaluating the Advisory Agreements. Each Board Member may have accorded different weight to the various factors in reaching his or her conclusions with respect to a Fund’s Advisory Agreement. The Independent Board Members did not identify any single factor as
74 Nuveen Investments
all-important or controlling. The Independent Board Members’ considerations were instead based on a comprehensive consideration of all the information presented. The principal factors considered by the Board and its conclusions are described below.
A. Nature, Extent and Quality of Services
In considering renewal of the Advisory Agreements, the Independent Board Members considered the nature, extent and quality of the Adviser’s services, including advisory services and administrative services. The Independent Board Members reviewed materials outlining, among other things, the Adviser’s organization and business; the types of services that the Adviser or its affiliates provide and are expected to provide to the Funds; the performance record of the applicable Fund (as described in further detail below); and any initiatives Nuveen had taken for the applicable fund product line, including continued activities to refinance auction rate preferred securities, manage leverage during periods of market turbulence and implement an enhanced leverage management process, modify investment mandates in light of market conditions and seek shareholder approval as necessary, maintain the fund share repurchase program and maintain shareholder communications to keep shareholders apprised of Nuveen’s efforts in refinancing preferred shares. In addition to the foregoing, the Independent Board Members also noted the additional services that the Adviser or its affiliates provide to closed-end funds, including, in particular, Nuveen’s continued commitment to supporting the secondary market for the common shares of its closed-end funds through a variety of programs designed to raise investor and analyst awareness and understanding of closed-end funds. These efforts include maintaining an investor relations program to provide timely information and education to financial advisers and investors; providing marketing for the closed-end funds; maintaining and enhancing a closed-end fund website; participating in conferences and having direct communications with analysts and financial advisors.
As part of their review, the Independent Board Members also evaluated the background, experience and track record of the Adviser’s investment personnel. In this regard, the Independent Board Members considered any changes in the personnel, and the impact on the level of services provided to the Funds, if any. The Independent Board Members also reviewed information regarding portfolio manager compensation arrangements to evaluate the Adviser’s ability to attract and retain high quality investment personnel, preserve stability, and reward performance but not provide an incentive for taking undue risks.
In addition to advisory services, the Independent Board Members considered the quality of administrative services provided by the Adviser and its affiliates including product management, fund administration, oversight of service providers, shareholder services, administration of Board relations, regulatory and portfolio compliance and legal support. Given the importance of compliance, the Independent Board Members also considered the Adviser’s compliance program, including the report of the chief compliance officer regarding the Funds’ compliance policies and procedures.
Based on their review, the Independent Board Members found that, overall, the nature, extent and quality of services provided (and expected to be provided) to the respective Funds under the Advisory Agreements were satisfactory.
Nuveen Investments 75
Annual Investment Management Agreement
Approval Process (Unaudited) (continued)
B. The Investment Performance of the Funds and the Adviser
The Board considered the performance results of each Fund over various time periods. The Board reviewed, among other things, each Fund’s historic investment performance as well as information comparing the Fund’s performance information with that of other funds (the “Performance Peer Group”) based on data provided by an independent provider of mutual fund data and with recognized and/or customized benchmarks. In this regard, the Board reviewed each Fund’s total return information compared to its Performance Peer Group for the quarter, one-, three- and five-year periods ending December 31, 2009 and for the same periods ending March 31, 2010 (or for the periods available for Funds that did not exist during part of the foregoing time frame). In addition, the Board r eviewed each Fund’s total return information compared to recognized and/or customized benchmarks for the quarter, one- and three-year periods ending December 31, 2009 and for the same periods ending March 31, 2010 (or for the periods available for Funds that did not exist during part of the foregoing time frame). Moreover, the Board reviewed the peer ranking of the Nuveen municipal funds advised by the Adviser in the aggregate. The Independent Board Members also reviewed historic premium and discount levels. This information supplemented the Fund performance information provided to the Board at each of its quarterly meetings.
In reviewing peer comparison information, the Independent Board Members recognized that the Performance Peer Group of certain funds may not adequately represent the objectives and strategies of the funds, thereby limiting the usefulness of comparing a fund’s performance with that of its Performance Peer Group. In this regard, the Independent Board Members considered that the Performance Peer Groups of certain funds (including the Nuveen New York Municipal Value Fund, Inc. (the “NY Municipal Value Fund”) and the Nuveen New York Municipal Value Fund 2 (the “NY Municipal Value Fund 2”)) were classified as having significant differences from such funds based on considerations such as special fund objectives, po tential investable universe and the composition of the peer set (e.g., the number and size of competing funds and number of competing managers).
Based on their review, the Independent Board Members determined that each Fund’s investment performance over time had been satisfactory. In particular, the Independent Board Members noted that the performance of the Nuveen New York Dividend Advantage Municipal Fund (the “NY Dividend Advantage Fund”) over time was satisfactory compared to peers, falling within the second or third quartile over various periods. In addition, they noted that while the Nuveen New York Performance Plus Municipal Fund, Inc. (the “NY Performance Plus Fund”) and the Nuveen New York Dividend Advantage Municipal Fund 2 (the “NY Dividend Advantage Fund 2”) lagged thei r peers somewhat in the short-term one-year period, they demonstrated more favorable performance in the longer three- and five-year periods. The Independent Board Members also noted that although the NY Municipal Value Fund underperformed its benchmark in the three-year period, it outperformed the performance of its benchmark in the one-year period. Finally, the Independent Board Members noted that the NY Municipal Value Fund 2 is a relatively new fund with a performance history that is generally too short for a meaningful assessment of performance.
76 Nuveen Investments
C. Fees, Expenses and Profitability
1. Fees and Expenses
The Board evaluated the management fees and expenses of each Fund reviewing, among other things, such Fund’s gross management fees, net management fees and net expense ratios in absolute terms as well as compared to the fee and expenses of a comparable universe of funds based on data provided by an independent fund data provider (the “Peer Universe”) and in certain cases, to a more focused subset of funds in the Peer Universe (the “Peer Group”) and any expense limitations.
The Independent Board Members further reviewed the methodology regarding the construction of the applicable Peer Universe and/or Peer Group. In reviewing the comparisons of fee and expense information, the Independent Board Members took into account that in certain instances various factors such as: the asset level of a fund relative to peers; the limited size and particular composition of the Peer Universe or Peer Group; the investment objectives of the peers; expense anomalies; changes in the funds comprising the Peer Universe or Peer Group from year to year; levels of reimbursement; the timing of information used; the differences in the type and use of leverage; and differences in the states reflected in the Peer Universe or Peer Group may impact the comparative data, thereby limiting the ability to make a meaningful comparison with peers, incl uding for the NY Municipal Value Fund and the NY Municipal Value Fund 2.
In reviewing the fee schedule for a Fund, the Independent Board Members also considered the fund-level and complex-wide breakpoint schedules (described in further detail below) and any fee waivers and reimbursements provided by Nuveen (applicable, in particular, for certain closed-end funds launched since 1999). The Independent Board Members noted that the NY Dividend Advantage Fund 2 had net management fees and/or a net expense ratio below, at or near (within 5 basis points or less) the peer average of its Peer Group or Peer Universe. They also noted that the NY Dividend Advantage Fund and the NY Performance Plus Fund had net advisory fees above the peer average but net expense ratios below, at or near the peer expense ratio average. Finally, the Independent Board Members noted that although the net management fees of the NY Municipal Value Fund and the NY Municipal Value Fund 2 were above the peer average and the available peer set was limited, their net expense ratios were below or near the peer average.
Based on their review of the fee and expense information provided, the Independent Board Members determined that each Fund’s management fees were reasonable in light of the nature, extent and quality of services provided to the Fund.
2. Comparisons with the Fees of Other Clients
The Independent Board Members further reviewed information regarding the nature of services and fee rates offered by the Adviser to other clients, including municipal separately managed accounts and passively managed municipal bond exchange traded funds (ETFs) that are sub-advised by the Adviser. In evaluating the comparisons of fees, the Independent Board Members noted that the fee rates charged to the Funds and other clients vary, among other things, because of the different services involved and the additional regulatory and compliance requirements associated with registered investment companies, such as the Funds. Accordingly, the
Nuveen Investments 77
Annual Investment Management Agreement
Approval Process (Unaudited) (continued)
Independent Board Members considered the differences in the product types, including, but not limited to, the services provided, the structure and operations, product distribution and costs thereof, portfolio investment policies, investor profiles, account sizes and regulatory requirements. The Independent Board Members noted, in particular, that the range of services provided to the Funds (as discussed above) is much more extensive than that provided to separately managed accounts. Given the inherent differences in the products, particularly the extensive services provided to the Funds, the Independent Board Members believe such facts justify the different levels of fees.
3. Profitability of Nuveen
In conjunction with its review of fees, the Independent Board Members also considered the profitability of Nuveen for its advisory activities (which incorporated Nuveen’s wholly-owned affiliated sub-advisers) and its financial condition. The Independent Board Members reviewed the revenues and expenses of Nuveen’s advisory activities for the last two years, the allocation methodology used in preparing the profitability data and an analysis of the key drivers behind the changes in revenues and expenses that impacted profitability in 2009. The Independent Board Members noted this information supplemented the profitability information requested and received during the year to help keep them apprised of developments affecting profitability (such as changes in fee waivers and expense reimbursement commitments). In this regard, the Independen t Board Members noted that they had also appointed an Independent Board Member as a point person to review and keep them apprised of changes to the profitability analysis and/or methodologies during the year. The Independent Board Members also considered Nuveen’s revenues for advisory activities, expenses, and profit margin compared to that of various unaffiliated management firms with similar amounts of assets under management and relatively comparable asset composition prepared by Nuveen.
In reviewing profitability, the Independent Board Members recognized the subjective nature of determining profitability which may be affected by numerous factors including the allocation of expenses. Further, the Independent Board Members recognized the difficulties in making comparisons as the profitability of other advisers generally is not publicly available and the profitability information that is available for certain advisers or management firms may not be representative of the industry and may be affected by, among other things, the adviser’s particular business mix, capital costs, types of funds managed and expense allocations. Notwithstanding the foregoing, the Independent Board Members reviewed Nuveen’s methodology and assumptions for allocating expenses across product lines to determine profitability. In reviewing profitabi lity, the Independent Board Members recognized Nuveen’s investment in its fund business. Based on their review, the Independent Board Members concluded that Nuveen’s level of profitability for its advisory activities was reasonable in light of the services provided.
In evaluating the reasonableness of the compensation, the Independent Board Members also considered other amounts paid to the Adviser by the Funds as well as any indirect benefits (such as soft dollar arrangements, if any) the Adviser and its affil-
78 Nuveen Investments
iates receive, or are expected to receive, that are directly attributable to the management of the Funds, if any. See Section E below for additional information on indirect benefits the Adviser may receive as a result of its relationship with the Funds. Based on their review of the overall fee arrangements of each Fund, the Independent Board Members determined that the advisory fees and expenses of the respective Fund were reasonable.
D. Economies of Scale and Whether Fee Levels Reflect These Economies of Scale
With respect to economies of scale, the Independent Board Members have recognized the potential benefits resulting from the costs of a fund being spread over a larger asset base, although economies of scale are difficult to measure and predict with precision, particularly on a fund-by-fund basis. One method to help ensure the shareholders share in these benefits is to include breakpoints in the advisory fee schedule. Generally, management fees for funds in the Nuveen complex are comprised of a fund-level component and a complex-level component, subject to certain exceptions. Accordingly, the Independent Board Members reviewed and considered the applicable fund-level breakpoints in the advisory fee schedules that reduce advisory fees as asset levels increase. Further, the Independent Board Members noted that although closed-end funds may from time- to-time make additional share offerings, the growth of their assets will occur primarily through the appreciation of such funds’ investment portfolio.
In addition to fund-level advisory fee breakpoints, the Board also considered the Funds’ complex-wide fee arrangement. Pursuant to the complex-wide fee arrangement, the fees of the funds in the Nuveen complex are generally reduced as the assets in the fund complex reach certain levels. The complex-wide fee arrangement seeks to provide the benefits of economies of scale to fund shareholders when total fund complex assets increase, even if assets of a particular fund are unchanged or have decreased. The approach reflects the notion that some of Nuveen’s costs are attributable to services provided to all its funds in the complex and therefore all funds benefit if these costs are spread over a larger asset base.
Based on their review, the Independent Board Members concluded that the breakpoint schedules and complex-wide fee arrangement were acceptable and reflect economies of scale to be shared with shareholders when assets under management increase.
E. Indirect Benefits
In evaluating fees, the Independent Board Members received and considered information regarding potential “fall out” or ancillary benefits the Adviser or its affiliates may receive as a result of its relationship with each Fund. In this regard, the Independent Board Members considered any revenues received by affiliates of the Adviser for serving as agent at Nuveen’s trading desk and as co-manager in initial public offerings of new closed-end funds.
In addition to the above, the Independent Board Members considered whether the Adviser received any benefits from soft dollar arrangements whereby a portion of the commissions paid by a Fund for brokerage may be used to acquire research that may be useful to the Adviser in managing the assets of the Funds and other clients. The
Nuveen Investments 79
Annual Investment Management Agreement
Approval Process (Unaudited) (continued)
Independent Board Members noted that the Adviser does not currently have any soft dollar arrangements; however, to the extent certain bona fide agency transactions that occur on markets that traditionally trade on a principal basis and riskless principal transactions are considered as generating “commissions,” the Adviser intends to comply with the applicable safe harbor provisions.
Based on their review, the Independent Board Members concluded that any indirect benefits received by the Adviser as a result of its relationship with the Funds were reasonable and within acceptable parameters.
F. Other Considerations
The Independent Board Members did not identify any single factor discussed previously as all-important or controlling. The Board Members, including the Independent Board Members, unanimously concluded that the terms of the Advisory Agreements are fair and reasonable, that the Adviser’s fees are reasonable in light of the services provided to each Fund and that the Advisory Agreements be renewed.
80 Nuveen Investments
Reinvest Automatically
Easily and Conveniently
Nuveen makes reinvesting easy. A phone call is all it takes to set up your reinvestment account.
Nuveen Closed-End Funds Dividend Reinvestment Plan
Your Nuveen Closed-End Fund allows you to conveniently reinvest dividends and/or capital gains distributions in additional Fund shares.
By choosing to reinvest, you’ll be able to invest money regularly and automatically, and watch your investment grow through the power of tax-free compounding. Just like dividends or distributions in cash, there may be times when income or capital gains taxes may be payable on dividends or distributions that are reinvested.
It is important to note that an automatic reinvestment plan does not ensure a profit, nor does it protect you against loss in a declining market.
Easy and convenient
To make recordkeeping easy and convenient, each month you’ll receive a statement showing your total dividends and distributions, the date of investment, the shares acquired and the price per share, and the total number of shares you own.
How shares are purchased
The shares you acquire by reinvesting will either be purchased on the open market or newly issued by the Fund. If the shares are trading at or above net asset value at the time of valuation, the Fund will issue new shares at the greater of the net asset value or 95% of the then-current market price. If the shares are trading at less than net asset value, shares for your account will be purchased on the open market. If the Plan Agent begins purchasing Fund shares on the open market while shares are trading below net asset value, but the Fund’s shares subsequently trade at or above their net asset value before the Plan Agent is able to complete its purchases, the Plan Agent may cease open-market purchases and may invest the uninvested portion of the distribution in newly-issued Fund shares at a price equal to the greater of the shares’ ne t asset value or 95% of the shares’ market value on the last business day immediately prior to the purchase date. Dividends and distributions received to purchase shares in the open market will normally be invested shortly after the dividend payment date. No interest will be paid on dividends and distributions awaiting reinvestment. Because the market price of the shares may increase before purchases are completed, the average purchase price
Nuveen Investments 81
Reinvest Automatically,
Easily and Conveniently (continued)
per share may exceed the market price at the time of valuation, resulting in the acquisition of fewer shares than if the dividend or distribution had been paid in shares issued by the Fund. A pro rata portion of any applicable brokerage commissions on open market purchases will be paid by Plan participants. These commissions usually will be lower than those charged on individual transactions.
Flexible
You may change your distribution option or withdraw from the Plan at any time, should your needs or situation change.
You can reinvest whether your shares are registered in your name, or in the name of a brokerage firm, bank, or other nominee. Ask your investment advisor if his or her firm will participate on your behalf. Participants whose shares are registered in the name of one firm may not be able to transfer the shares to another firm and continue to participate in the Plan.
The Fund reserves the right to amend or terminate the Plan at any time. Although the Fund reserves the right to amend the Plan to include a service charge payable by the participants, there is no direct service charge to participants in the Plan at this time.
Call today to start reinvesting dividends and/or distributions
For more information on the Nuveen Automatic Reinvestment Plan or to enroll in or withdraw from the Plan, speak with your financial advisor or call us at (800) 257-8787.
82 Nuveen Investments
Glossary of Terms
Used in this Report
| ■ | Auction Rate Bond: An auction rate bond is a security whose interest payments are adjusted periodically through an auction process, which process typically also serves as a means for buying and selling the bond. Auctions that fail to attract enough buyers for all the shares offered for sale are deemed to have “failed,” with current holders receiving a formula-based interest rate until the next scheduled auction. |
| | |
| ■ | Average Annual Total Return: This is a commonly used method to express an investment’s performance over a particular, usually multi-year time period. It expresses the return that would have been necessary each year to equal the investment’s actual cumulative performance (including change in NAV or market price and reinvested dividends and capital gains distributions, if any) over the time period being considered. |
| | |
| ■ | Average Effective Maturity: The weighted average of the effective maturity dates of the fixed-income securities in the portfolio. A bond’s effective maturity takes into account the possibility that it may be called by the issuer before its stated maturity date. In this case, the bond trades as though it had a shorter maturity than its stated maturity. |
| | |
| ■ | Inverse Floaters: Inverse floating rate securities, also known as inverse floaters, are created by depositing a municipal bond, typically with a fixed interest rate, into a special purpose trust created by a broker-dealer. This trust, in turn, (a) issues floating rate certificates typically paying short-term tax-exempt interest rates to third parties in amounts equal to some fraction of the deposited bond’s par amount or market value, and (b) issues an inverse floating rate certificate (sometimes referred to as an “inverse floater”) to an investor (such as a Fund) interested in gaining investment exposure to a long-term municipal bond. The income received by the holder of the inverse floater varies inversely with the short-term rate paid to the floating ra te certificates’ holders, and in most circumstances the holder of the inverse floater bears substantially all of the underlying bond’s downside investment risk. The holder of the inverse floater typically also benefits disproportionately from any potential appreciation of the underlying bond’s value. Hence, an inverse floater essentially represents an investment in the underlying bond on a leveraged basis. |
Nuveen Investments 83
Glossary of Terms
Used in this Report (continued)
| ■ | Leverage-Adjusted Duration: Duration is a measure of the expected period over which a bond’s principal and interest will be paid, and consequently is a measure of the sensitivity of a bond’s or bond Fund’s value to changes when market interest rates change. Generally, the longer a bond’s or Fund’s duration, the more the price of the bond or Fund will change as interest rates change. Leverage-adjusted duration takes into account the leveraging process for a Fund and therefore is longer than the duration of the Fund’s portfolio of bonds. |
| | |
| ■ | Market Yield (also known as Dividend Yield or Current Yield): An investment’s current annualized dividend divided by its current market price. |
| | |
| ■ | Net Asset Value (NAV): A Fund’s NAV per common share is calculated by subtracting the liabilities of the Fund (including any Preferred shares issued in order to leverage the Fund) from its total assets and then dividing the remainder by the number of common shares outstanding. Fund NAVs are calculated at the end of each business day. |
| | |
| ■ | Pre-refunding: Pre-refunding, also known as advanced refundings or refinancings, is a procedure used by state and local governments to refinance municipal bonds to lower interest expenses. The issuer sells new bonds with a lower yield and uses the proceeds to buy U.S. Treasury securities, the interest from which is used to make payments on the higher-yielding bonds. Because of this collateral, pre-refunding generally raises a bond’s credit rating and thus its value. |
| | |
| ■ | Taxable-Equivalent Yield: The yield necessary from a fully taxable investment to equal, on an after-tax basis, the yield of a municipal bond investment. |
| | |
| ■ | Zero Coupon Bond: A zero coupon bond does not pay a regular interest coupon to its holders during the life of the bond. Tax-exempt income to the holder of the bond comes from accretion of the difference between the original purchase price of the bond at issuance and the par value of the bond at maturity and is effectively paid at maturity. The market prices of zero coupon bonds generally are more volatile than the market prices of bonds that pay interest periodically. |
84 Nuveen Investments
Other Useful Information
Board of
Directors/Trustees
John P. Amboian
Robert P. Bremner
Jack B. Evans
William C. Hunter
David J. Kundert
William J. Schneider
Judith M. Stockdale
Carole E. Stone
Terence J. Toth
Fund Manager
Nuveen Asset Management
333 West Wacker Drive
Chicago, IL 60606
Custodian
State Street Bank & Trust
Company
Boston, MA
Transfer Agent and
Shareholder Services
State Street Bank & Trust
Company
Nuveen Funds
P.O. Box 43071
Providence, RI 02940-3071
(800) 257-8787
Legal Counsel
Chapman and Cutler LLP
Chicago, IL
Independent Registered
Public Accounting Firm
Ernst & Young LLP
Chicago, IL
Quarterly Portfolio of Investments and Proxy Voting Information
You may obtain (i) each Fund’s quarterly portfolio of investments, (ii) information regarding how the Funds voted proxies relating to portfolio securities held during the most recent twelve-month period ended June 30, and (iii) a description of the policies and procedures that the Funds used to determine how to vote proxies relating to portfolio securities without charge, upon request, by calling Nuveen Investments toll-free at (800) 257-8787 or on Nuveen’s website at www.nuveen.com.
You may also obtain this and other Fund information directly from the Securities and Exchange Commission (SEC). The SEC may charge a copying fee for this information. Visit the SEC on-line at http://www.sec.gov or in person at the SEC’s Public Reference Room in Washington, D.C. Call the SEC at (202) 942-8090 for room hours and operation. You may also request Fund information by sending an e-mail request to publicinfo@sec.gov or by writing to the SEC’s Public References Section at 100 F Street NE, Washington, D.C. 20549.
CEO Certification Disclosure
Each Fund’s Chief Executive Officer (CEO) has submitted to the New York Stock Exchange (NYSE) the annual CEO certification as required by Section 303A.12(a) of the NYSE Listed Company Manual.
Each Fund has filed with the SEC the certification of its Chief Executive Officer and Chief Financial Officer required by Section 302 of the Sarbanes-Oxley Act.
Common and Preferred Share Information
Each Fund intends to repurchase and/or redeem shares of its own common and/or auction rate preferred stock in the future at such times and in such amounts as is deemed advisable. During the period covered by this report, the Funds repurchased and/or redeemed shares of their common and/or auction rate preferred stock as shown in the accompanying table.
| | | Auction Rate | |
| | Common Shares | Preferred Shares | |
| Fund | Repurchased | Redeemed | |
| NNY | | — | | N/A | |
| NYV | | — | | N/A | |
| NNP | | — | | 3,506 | |
| NAN | | — | | 1,180 | |
| NXK | | — | | 1,364 | |
N/A – Fund is not authorized to issue auction rate preferred shares.
Any future repurchases and/or redemptions will be reported to shareholders in the next annual or semi-annual report.
Nuveen Investments 85
Nuveen Investments:
Serving Investors for Generations
Since 1898, financial advisors and their clients have relied on Nuveen Investments to provide dependable investment solutions through continued adherence to proven, long-term investing principles. Today, we offer a range of high quality equity and fixed-income solutions designed to be integral components of a well-diversified core portfolio.
Focused on meeting investor needs.
Nuveen Investments is a global investment management firm that seeks to help secure the long-term goals of institutions and high net worth investors as well as the consultants and financial advisors who serve them. We market our growing range of specialized investment solutions under the high-quality brands of HydePark, NWQ, Nuveen, Santa Barbara, Symphony, Tradewinds and Winslow Capital. In total, Nuveen Investments managed more than $160 billion of assets on September 30, 2010.
Find out how we can help you.
To learn more about how the products and services of Nuveen Investments may be able to help you meet your financial goals, talk to your financial advisor, or call us at (800) 257-8787. Please read the information provided carefully before you invest.
Investors should consider the investment objective and policies, risk considerations, charges and expenses of any investment carefully. Where applicable, be sure to obtain a prospectus, which contains this and other relevant information. To obtain a prospectus, please contact your securities representative or Nuveen Investments, 333 W. Wacker Dr., Chicago, IL 60606. Please read the prospectus carefully before you invest or send money. Learn more about Nuveen Funds at: www.nuveen.com/cef
Nuveen makes things e-simple. It only takes a minute to sign up for e-Reports. Once enrolled, you’ll receive an e-mail as soon as your Nuveen Investments Fund information is ready—no more waiting for delivery by regular mail. Just click on the link within the e-mail to see the report and save it on your computer if you wish. Free e-Reports right to your e-mail! www.investordelivery.com If you receive your Nuveen Fund distributions and statements from your financial advisor or brokerage account. OR www.nuveen.com/accountaccess If you receive your Nuveen Fund distributions and statements directly from Nuveen. |
Distributed by
Nuveen Investments, LLC
333 West Wacker Drive
Chicago, IL 60606
www.nuveen.com
EAN-A-0910D