Life is Complex.
Nuveen makes things e-simple.
It only takes a minute to sign up for e-Reports. Once enrolled, you'll receive an e-mail as soon as your Nuveen Fund information is ready—no more waiting for delivery by regular mail. Just click on the link within the e-mail to see the report and save it on your computer if you wish.
Free e-Reports
right to your e-mail!
www.investordelivery.com
If you receive your Nuveen Fund
dividends and statements from your
financial advisor or brokerage account.
or
www.nuveen.com/client-access
If you receive your Nuveen Fund
dividends and statements directly from
Nuveen.
NOT FDIC INSURED MAY LOSE
VALUE NO BANK GUARANTEE
Table of Contents
| | |
| Chairman's Letter to Shareholders | 4 |
| | |
| Portfolio Manager's Comments | 5 |
| | |
| Fund Leverage | 9 |
| | |
| Common Share Information | 11 |
| | |
| Risk Considerations | 13 |
| | |
| Performance Overview and Holding Summaries | 14 |
| | |
| Report of Independent Registered Public Accounting Firm | 18 |
| | |
| Portfolios of Investments | 19 |
| | |
| Statement of Assets and Liabilities | 51 |
| | |
| Statement of Operations | 52 |
| | |
| Statement of Changes in Net Assets | 53 |
| | |
| Statement of Cash Flows | 55 |
| | |
| Financial Highlights | 56 |
| | |
| Notes to Financial Statements | 61 |
| | |
| Additional Fund Information | 76 |
| | |
| Glossary of Terms Used in this Report | 77 |
| | |
| Reinvest Automatically, Easily and Conveniently | 79 |
| | |
| Board Members & Officers | 80 |
3
Chairman's Letter to Shareholders
Dear Shareholders,
Financial markets rallied in the early months of 2019, in sharp contrast to the downturn at the end of 2018, leaving investors to wonder whether such bullishness is warranted or sustainable. By the close of 2018, economic softness in China, Europe and Japan had proven more persistent than expected. The temporary boost to the U.S. economy from tax law changes appeared to be fading. Corporate earnings and profits were slowing, and some corporate managements, especially at high-profile technology companies, were downgrading their outlooks. Politics remained unpredictable, most notably with the Brexit and U.S.-China trade talks ongoing. The European Central Bank (ECB) ended its crisis-era monetary stimulus program with pledges to keep interest rates low for an extended period, while the U.S. Federal Reserve (Fed) planned to continue raising interest rates into 2019.
As the new year began, economic data have remained a mixed bag, and investors will be closely watching the first quarter 2019 corporate earnings reports. However, market sentiment shifted significantly after both the Fed and ECB turned remarkably more dovish in their interest rate projections and lowered their growth forecasts. The U.S. and China appear to be making progress on trade talks, such that President Trump did not increase tariffs as initially planned in March 2019. While these events did reduce some of the markets' uncertainty, downside risks still appear to be rising.
Nevertheless, we believe the likelihood of a near-term recession remains low. Global growth is indeed slowing, but it's still positive. The U.S. economy remains strong, even in the face of late-cycle pressures. Low unemployment and firming wages should continue to support consumer spending, and the November mid-term elections resulted in change, but no major surprises. In China, the government remains committed to using fiscal stimulus to offset softening exports. Europe also remains vulnerable to trade policy as well as Brexit uncertainty, but underlying strengths in European economies, including low unemployment that drives domestic demand, remain supportive of a mild expansion. In a slower growth environment, there are opportunities for investors who seek them more selectively.
We expect volatility and challenging conditions to persist in 2019 but also think there is potential for upside. You can prepare your investment portfolio by working with your financial advisor to review your goals, timeline and risk tolerance. On behalf of the other members of the Nuveen Fund Board, we look forward to continuing to earn your trust in the months and years ahead.
Sincerely,
Terence J. Toth
Chairman of the Board
April 23, 2019
4
Portfolio Manager's Comments
Nuveen New York Municipal Value Fund, Inc. (NNY)
Nuveen New York Municipal Value Fund 2 (NYV)
Nuveen New York Quality Municipal Income Fund (NAN)
Nuveen New York AMT-Free Quality Municipal Income Fund (NRK)
These Funds feature portfolio management by Nuveen Asset Management, LLC (NAM), an affiliate of Nuveen, LLC. Portfolio manager Scott R. Romans, PhD, discusses U.S. economic and municipal market conditions at the national and state levels, key investment strategies and the twelve-month performance of the Nuveen New York Funds. Scott assumed portfolio management responsibility for these four Funds in 2011.
What factors affected the U.S. economy and the national municipal bond market during the twelve-month reporting period ended February 28, 2019?
The U.S. economy continued to grow at a solid pace during the reporting period. Gross domestic product (GDP), which measures the value of goods and services produced by the nation's economy less the value of the goods and services used up in production, adjusted for price changes, grew at an annualized rate of 2.2% in the fourth quarter of 2018, according to the Bureau of Economic Analysis "third" estimate. Consumer and business spending supported growth in the final months of 2018, while a weaker housing market and a larger trade deficit subtracted from GDP. For the full year 2018, U.S. GDP growth came in at 2.9%, as economic activity cooled over the second half of 2018 after peaking at 4.2% (annualized) in the second quarter of 2018.
Consumer spending, the largest driver of the economy, remained well supported by low unemployment, wage gains and tax cuts. As reported by the Bureau of Labor Statistics, the unemployment rate fell to 3.8% in February 2019 from 4.1% in February 2018 and job gains averaged around 209,000 per month for the past twelve months. As the jobs market has tightened, average hourly earnings grew at an annualized rate of 3.4% in February 2019. However, falling energy prices led to a slower rate of inflation over the past twelve months. The Consumer Price Index (CPI) increased 1.5% over the twelve-month reporting period ended February 28, 2019 before seasonal adjustment, as reported by the Bureau of Labor Statistics.
Low mortgage rates and low inventory drove home prices higher during this recovery cycle. But the pace of price increases has slowed as mortgage rates drifted higher and homes have become less affordable. The S&P CoreLogic Case-Shiller U.S. National Home Price Index, which covers all nine U.S. census divisions, was up 4.3% year-over-year in January 2019 (most recent data avail-
This material is not intended to be a recommendation or investment advice, does not constitute a solicitation to buy, sell or hold a security or an investment strategy and is not provided in a fiduciary capacity. The information provided does not take into account the specific objectives or circumstances of any particular investor, or suggest any specific course of action. Investment decisions should be made based on an investor's objectives and circumstances and in consultation with his or her advisors.Certain statements in this report are forward-looking statements. Discussions of specific investments are for illustration only and are not intended as recommendations of individual investments. The forward-looking statements and other views expressed herein are those of the portfolio manager as of the date of this report. Actual future results or occurrences may differ significantly from those anticipated in any forward-looking statements, and the views expressed herein are subject to change at any time, due to numerous market and other factors. The Funds disclaim any obligation to update publicly or revise any forward-looking statements or views expressed herein.
For financial reporting purposes, the ratings disclosed are the highest rating given by one of the following national rating agencies: Standard & Poor's (S&P), Moody's Investors Service, Inc. (Moody's) or Fitch, Inc. (Fitch). This treatment of split-rated securities may differ from that used for other purposes, such as for Fund investment policies. Credit ratings are subject to change. AAA, AA, A and BBB are investment grade ratings, while BB, B, CCC, CC, C and D are below investment grade ratings. Holdings designated N/R are not rated by these national rating agencies.
Bond insurance guarantees only the payment of principal and interest on the bond when due, and not the value of the bonds themselves, which will fluctuate with the bond market and the financial success of the issuer and the insurer. Insurance relates specifically to the bonds in the portfolio and not to the share prices of a Fund. No representation is made as to the insurers' ability to meet their commitments.
Refer to the Glossary of Terms Used in this Report for further definition of the terms used within this section.
5
Portfolio Manager's Comments (continued)
able at the time this report was prepared). The 10-City and 20-City Composites reported year-over-year increases of 3.2% and 3.6%, respectively.
As some data began pointing to slower momentum in the overall economy, the Federal Reserve (Fed) notably shifted its stance. From December 2015 through December 2018, the Fed had gradually lifted its main policy interest rate to prevent the economy from overheating. In its final meeting of 2018, the Fed indicated that two more rate hikes might be forthcoming in 2019, roiling the markets, which had expected a more dovish tone. However, as more recent data revealed a mixed picture of the economy, the Fed said it would adopt a more "patient" approach, signaling the possibility of no rate hikes in 2019. As expected, the Fed held rates steady at its January 2019 committee meeting. Subsequent to the end of the reporting period, at its March 2019 meeting, the Fed again kept rates unchanged and further clarified that it will discontinued rolling assets off its balance sheet in September 2019, sooner than many observers expected.
During the twelve-month reporting period, geopolitical news remained a prominent market driver. The U.S. moved forward with tariffs on imported goods from China, as well as on steel and aluminum from Canada, Mexico and Europe. These countries announced retaliatory measures in kind, intensifying concerns about a trade war, although there have been some positive developments. In July 2018, the U.S. and the European Union announced they would refrain from further tariffs while they negotiate trade terms, and in October 2018, the U.S., Mexico and Canada agreed to a new trade deal to replace the North American Free Trade Agreement. At the November 2018 G-20 summit, the U.S. and China settled on a 90-day trade truce, and after the countries resumed trade talks in early 2019, President Trump said he would not increase the tariffs in March 2019 as planned. Brexit negotiations continued to be uncertain, and Prime Minister Theresa May faced significant difficulty getting a plan approved in Parliament. (Subsequent to the end of the reporting period, the European Union approved a conditional delay, allowing the U.K. more time to approve a plan.) Europe also contended with Italy's new euroskeptic coalition government, the "yellow vest" protests in France, immigration policy concerns and political risk in Turkey. The U.S. Treasury issued additional sanctions on Russia in April 2018 and re-imposed sanctions on Iran following the U.S. withdrawal from the 2015 nuclear agreement. Bearish crude oil supply news, along with heightened tensions between the U.S. and Saudi Arabia after the disappearance of a Saudi journalist, drove oil price volatility. On the Korean peninsula, the leaders of South Korea and North Korea met during April 2018 and jointly announced a commitment toward peace, while the U.S. and North Korea held a denuclearization summit in June 2018 and a second summit in February 2019 without securing an agreement. In late December 2018, the U.S. government entered a 35-day partial shutdown due to an impasse on border security funding. Concerns about a second shutdown were alleviated after the government passed a funding bill in February 2019.
Municipal bonds delivered positive performance in this reporting period. Interest rates were increasing through much of the reporting period, as a strong economic backdrop kept the Fed on its course of monetary tightening. The 10-year U.S. Treasury yield peaked at 3.24% in November 2018. However, in December 2018, market volatility spiked as uncertain trade policy, Brexit negotiations, and weak macro data in Europe and China weighed on the U.S. growth outlook. Equities and riskier segments of the bond market sold off sharply in the fourth quarter of 2018. Following the Fed's December meeting, investor expectations for a pause in rate increases drove repricing in the markets, driving long-term interest meaningfully lower through the end of the reporting period. While the U.S. Treasury yield curve flattened over this reporting period, the municipal yield curve "twisted" by flattening at the short end and steepening at the long end of the curve. For the twelve-month period overall, municipal bond yields were marginally lower, belying larger intra-period swings.
Supply and demand conditions in the municipal bond market were favorable to performance in this reporting period, particularly in the latter three months. Issuance has been subdued since the passage of the Tax Cuts and Jobs Act of 2017. Because new issue advance refunding bonds are no longer tax exempt under the new tax law, the total supply of municipal bonds has decreased, boosting the scarcity value of existing municipal bonds. Municipal bond issuance nationwide totaled $347.3 billion in this reporting period, a 19.0% decrease from the issuance for the twelve-month reporting period ended February 28, 2018. Nevertheless, the overall low level of interest rates encouraged issuers to continue to actively refund their outstanding debt. In these transactions the issuers are issuing new bonds and taking the bond proceeds and redeeming (calling) old bonds. These refunding transactions have
6
ranged from 40% to 60% of total issuance over the past few years. Thus, the net issuance (all bonds issued less bonds redeemed) is actually much lower than the gross issuance. So, while gross issuance volume has been strong, the net has not, and this was an overall positive technical factor on municipal bond investment performance in recent years. Although the pace of refundings is slowing, net negative issuance is expected to continue.
Low global interest rates have continued to drive investors toward higher after-tax yielding assets, including U.S. municipal bonds. The Fed's pivot to a more dovish stance in early 2019 also brought investors back to fixed income markets, including municipal bonds, driving large inflows into the asset class in the early months of 2019. Additionally, as tax payers have begun to assess the impact of the 2017 tax law, which caps the state and local tax (SALT) deduction for individuals, demand for tax-exempt municipal bonds, especially in states with high income and/or property taxes, is expected to increase.
How were the economic and market environments in New York during the reporting period ended February 28, 2019?
New York State's $1.5 trillion economy represents 8.0% of U.S. gross domestic product and, according to the International Monetary Fund, would be the eleventh largest economy in the world on a stand-alone basis. As of February 2019, the state's unemployment rate registered 3.9%, above the national average of 3.8%. New York State's financial condition has generally improved over the past decade, and Fiscal Year 2018 posted a General Fund surplus. On a significantly positive note, New York State has collected approximately $11 billion in various settlements and assessments from the financial industry over the past four years. Proceeds from those settlements have been used to bolster reserves, foster economic development upstate and provide funds for the replacement of the Tappan Zee Bridge. The adopted $175.5 billion budget for Fiscal Year 2020 is 4.3% higher than the adopted Fiscal Year 2019 budget. The Fiscal Year 2020 budget contains a new transfer tax on multi-million dollar homes. It also lays the groundwork for a commuter tax in Manhattan, though the details of that tax are to be worked out later. The 2020 budget also raises education spending by $1.2 billion, a 4.5% increase. It makes permanent the 2% property tax cap and extends the temporary "millionaire's tax" on wealthy individuals for an additional five years. New York is a high-income state, with per-capita income at 121% of the U.S. average, the third-highest among the 50 states. New York is also a heavily indebted state. According to Moody's, New York ranked fifth in the nation in debt per capita in 2017 (NY: $3,082; median: $987), eighth in debt per capita as a percentage of personal income (NY: 5.2%; median: 2.3%) and ninth in debt to gross state domestic product (NY: 4.1%; median: 2.1%). The state's pensions have traditionally been well funded, though the funding ratios have declined in recent years. As of February 2019, Moody's rates New York Aa1 with a stable outlook. Moody's upgraded New York State from Aa2 to Aa1 on June 16, 2014, citing the State's sustained improvements in fiscal governance. S&P rates the state AA+ with a stable outlook. S&P upgraded New York State from AA to AA+ on July 23, 2014, citing the State's improved budget framework. New York municipal bond issuance totaled $42 billion for the twelve-month period ended February 28, 2019, an 11.4% decrease from the same period a year earlier. This ranked New York second among state issuers behind only California.
What key strategies were used to manage these Funds during the twelve-month reporting period ended February 28, 2019?
Municipal bonds performed well during the reporting period amid positive fundamental credit conditions and a favorable technical supply-demand balance. New York's municipal bond market underperformed the national market in this reporting period.
We also note that New York is among the states with the highest personal income and property taxes, which will be more meaningfully affected by the new limits on state and local tax, or SALT, deductions. In early 2019, as individuals were beginning to file their tax returns under the new caps, some were likely to see higher-than-expected tax liabilities, especially in New York and other high income tax states. As a result, demand for in-state municipal bonds, which offer both state and federal tax advantages, is expected to grow.
We continued to take a bottom-up approach to discovering sectors that appeared undervalued as well as individual credits that we believed had the potential to perform well over the long term. During the reporting period, we added higher grade bonds offering 5% coupon rates from the tax-supported (including general obligation bonds), higher education, ports and utilities sectors. We also
7
Portfolio Manager's Comments (continued)
took advantage of prevailing market conditions in the fourth quarter of 2018, when credit spreads widened and yields rose, to buy several lower investment grade (i.e., BBB rated) credits in the higher education, health care and airports sectors. The proceeds from called and maturing bonds funded most of our purchase activity in the reporting period.
As of February 28, 2019, NNY, NAN and NRK continued to use inverse floating rate securities. We employ inverse floaters for a variety of reasons, including duration management, income enhancement and total return enhancement. As part of our duration management strategies, NRK also used forward interest rates swaps during part of the reporting period to help reduce price volatility risk to movements in U.S. interest rates relative to the Fund's benchmark. The swap position had a negligible impact on performance and was eliminated before the end of this reporting period.
How did the New York Funds perform during the twelve-month reporting period ended February 28, 2019?
The tables in each Fund's Performance Overview and Holding Summaries section of this report provide the Funds' total returns for the one-year, five-year, ten-year and/or since inception periods ended February 28, 2019. Each Fund's total returns at net asset value (NAV) are compared with the performance of corresponding market indexes and a Lipper classification average.
For the twelve-month reporting period ended February 28, 2019, the total return at common share NAV for all four Funds exceeded the returns for both the S&P Municipal Bond New York Index and the national S&P Municipal Bond Index.
The Funds' performance over this reporting period was mainly driven by individual credit selection. NNY's, NAN's and NRK's holdings in insured Puerto Rico sales tax bonds, known as COFINA bonds, significantly outperformed in this reporting period on news that a COFINA settlement agreement was finalized. (NYV did not have any Puerto Rico exposure during this reporting period.) Another standout performer was Bronx Parking Development Company, which owns parking facilities around Yankee Stadium. Bronx Parking defaulted on its debt several years ago when utilization was significantly lower than expected. However, the bond rebounded recently on improving utilization due to the Yankees winning more and optimism for a potential bondholder-friendly redevelopment project. Among the four Funds, NAN held the largest position in Bronx Parking bonds, NNY and NYV owned smaller positions and NRK had no exposure to the credits.
Yield curve and duration positioning, credit ratings allocations and sector allocations had minimal impact on performance in this reporting period. The Funds benefited from positive returns in higher education bonds, health care credits and tender option bonds, but negative returns in pre-refunded bonds detracted from performance.
The use of regulatory leverage was a factor affecting the performance of NAN and NRK. NNY and NYV do not use regulatory leverage. Leverage is discussed in more detail later in the Fund Leverage section of this report.
8
Fund Leverage
IMPACT OF THE FUNDS' LEVERAGE STRATEGIES ON PERFORMANCE
One important factor impacting the returns of the Funds' common shares relative to their comparative benchmarks was the Funds' use of leverage through their issuance of preferred shares and/or investments in inverse floating rate securities, which represent leveraged investments in underlying bonds. The Funds use leverage because our research has shown that, over time, leveraging provides opportunities for additional income, particularly in the recent market environment where short-term market rates are at or near historical lows, meaning that the short-term rates the Fund has been paying on its leveraging instruments in recent years have been much lower than the interest the Fund has been earning on its portfolio of long-term bonds that it has bought with the proceeds of that leverage.
However, use of leverage can expose Fund common shares to additional price volatility. When a Fund uses leverage, the Fund common shares will experience a greater increase in their net asset value if the municipal bonds acquired through the use of leverage increase in value, but will also experience a correspondingly larger decline in their net asset value if the bonds acquired through leverage decline in value, which will make the shares' net asset value more volatile, and total return performance more variable, over time.
In addition, common share income in levered funds will typically decrease in comparison to unlevered funds when short-term interest rates increase and increase when short-term interest rates decrease. Over the last few quarters, short-term interest rates have indeed increased from their extended lows after the 2007-09 financial crisis. This increase has reduced common share net income, and also reduced potential for long-term total returns. Nevertheless, the ability to effectively borrow at current short-term rates is still resulting in enhanced common share income, and management believes that the advantages of continuation of leverage outweigh the associated increase in risk and volatility described above.
Leverage from inverse floating rate securities had a negligible impact on performance for NNY over this reporting period. Leverage had a positive impact on the performance of NAN and NRK over this reporting period.
As of February 28, 2019, the Funds' percentages of leverage are as shown in the accompanying table.
| | | | | |
| | NNY | NYV | NAN | NRK |
| Effective Leverage* | 1.21% | 0.00% | 38.94% | 38.69% |
| Regulatory Leverage* | 0.00% | 0.00% | 34.24% | 37.65% |
| * | Effective leverage is a Fund's effective economic leverage, and includes both regulatory leverage and the leverage effects of certain derivative and other investments in a Fund's portfolio that increase the Fund's investment exposure. Currently, the leverage effects of Tender Option Bond (TOB) inverse floater holdings are included in effective leverage values, in addition to any regulatory leverage. Regulatory leverage consists of preferred shares issued or borrowings of a Fund. Both of these are part of a Fund's capital structure. A Fund, however, may from time to time borrow on a typically transient basis in connection with its day-to-day operations, primarily in connection with the need to settle portfolio trades. Such incidental borrowings are excluded from the calculation of a Fund's effective leverage ratio. Regulatory leverage is subject to asset coverage limits set forth in the Investment Company Act of 1940. |
9
Fund Leverage (continued)
THE FUNDS' REGULATORY LEVERAGE
As of February 28, 2019, the following Funds have issued and outstanding preferred shares as shown in the accompanying table. As mentioned previously, NNY and NYV do not use regulatory leverage.
| | | | | | | | | | |
| | | | | | Variable Rate | | | | |
| | | Variable Rate | | | Remarketed | | | | |
| | | Preferred* | | | Preferred** | | | | |
| | | Shares | | | Shares | | | | |
| | | Issued at | | | Issued at | | | | |
| | | Liquidation | | | Liquidation | | | | |
| | | Preference | | | Preference | | | Total | |
| NAN | | $ | 147,000,000 | | | $ | 89,000,000 | | | $ | 236,000,000 | |
| NRK | | $ | — | | | $ | 743,800,000 | | | $ | 743,800,000 | |
| * | Preferred shares of the Fund featuring a floating rate dividend based on a predetermined formula or spread to an index rate. Includes the following preferred shares AMTP, iMTP, VMTP, MFP- VRM and VRDP in Special Rate Mode, where applicable. See Notes to Financial Statements, Note 4 - Fund Shares, Preferred Shares for further details. |
| ** | Preferred shares of the Fund featuring floating rate dividends set by a remarketing agent via a regular remarketing. Includes the following preferred shares VRDP not in special rate mode, MFP- VRRM and MFP-VRDM, where applicable. See Notes to Financial Statements, Note 4 - Fund Shares, Preferred Shares for further details. |
Refer to Notes to Financial Statements, Note 4 – Fund Shares, Preferred Shares for further details on preferred shares and each Funds' respective transactions.
10
Common Share Information
COMMON SHARE DISTRIBUTION INFORMATION
The following information regarding the Funds' distributions is current as of February 28, 2019. Each Fund's distribution levels may vary over time based on each Fund's investment activity and portfolio investments value changes.
During the current reporting period, each Fund's distributions to common shareholders were as shown in the accompanying table.
| | | | | | | | | | | | | |
| | | | | | Per Common Share Amounts | | | | |
| Monthly Distributions (Ex-Dividend Date) | | NNY | | | NYV | | | NAN | | | NRK | |
| March 2018 | | $ | 0.0300 | | | $ | 0.0425 | | | $ | 0.0480 | | | $ | 0.0450 | |
| April | | | 0.0300 | | | | 0.0425 | | | | 0.0480 | | | | 0.0450 | |
| May | | | 0.0300 | | | | 0.0425 | | | | 0.0480 | | | | 0.0450 | |
| June | | | 0.0300 | | | | 0.0425 | | | | 0.0480 | | | | 0.0450 | |
| July | | | 0.0300 | | | | 0.0425 | | | | 0.0480 | | | | 0.0450 | |
| August | | | 0.0300 | | | | 0.0425 | | | | 0.0480 | | | | 0.0450 | |
| September | | | 0.0300 | | | | 0.0425 | | | | 0.0480 | | | | 0.0450 | |
| October | | | 0.0300 | | | | 0.0425 | | | | 0.0480 | | | | 0.0450 | |
| November | | | 0.0300 | | | | 0.0425 | | | | 0.0480 | | | | 0.0450 | |
| December | | | 0.0300 | | | | 0.0425 | | | | 0.0480 | | | | 0.0450 | |
| January | | | 0.0300 | | | | 0.0425 | | | | 0.0480 | | | | 0.0450 | |
| February 2019 | | | 0.0300 | | | | 0.0425 | | | | 0.0480 | | | | 0.0450 | |
| Total Distributions from Net Investment Income | | $ | 0.3600 | | | $ | 0.5100 | | | $ | 0.5760 | | | $ | 0.5400 | |
| | |
| Yields | | | | | | | | | | | | | | | | |
| Market Yield* | | | 3.72 | % | | | 3.73 | % | | | 4.48 | % | | | 4.37 | % |
| Taxable-Equivalent Yield* | | | 5.33 | % | | | 5.32 | % | | | 6.44 | % | | | 6.29 | % |
| * | Market Yield is based on the Fund's current annualized monthly dividend divided by the Fund's current market price as of the end of the reporting period. Taxable-Equivalent Yield represents the yield that must be earned on a fully taxable investment in order to equal the yield of the Fund on an after-tax basis. It is based on a combined federal and state income tax rate of 30.2%, 29.9%, 30.4% and 30.5% for NNY, NYV, NAN and NRK, respectively. Your actual combined federal and state income tax rate may differ from the assumed rate. The Taxable-Equivalent Yield also takes into account the percentage of the Fund's income generated and paid by the Fund (based on payments made during the previous calendar year) that was either exempt from federal income tax but not from state income tax (e.g., income from an out-of-state municipal bond), or was exempt from neither federal nor state income tax. Separately, if the comparison were instead to invest- ments that generate qualified dividend income, which is taxable at a rate lower than an individual's ordinary graduated tax rate, the fund's Taxable-Equivalent Yield would be lower. |
Each Fund seeks to pay regular monthly dividends out of its net investment income at a rate that reflects its past and projected net income performance. To permit each Fund to maintain a more stable monthly dividend, the Fund may pay dividends at a rate that may be more or less than the amount of net income actually earned by the Fund during the period. Distributions to shareholders are determined on a tax basis, which may differ from amounts recorded in the accounting records. In instances where the monthly dividend exceeds the earned net investment income, the Fund would report a negative undistributed net ordinary income. Refer to Note 6 – Income Tax Information for additional information regarding the amounts of undistributed net ordinary income and undistributed net long-term capital gains and the character of the actual distributions paid by the Fund during the period.
All monthly dividends paid by each Fund during the current reporting period were paid from net investment income. If a portion of the Fund's monthly distributions is sourced or comprised of elements other than net investment income, including capital gains and/or a return of capital, shareholders will be notified of those sources. For financial reporting purposes, the per share amounts of each Fund's distributions for the reporting period are presented in this report's Financial Highlights. For income tax purposes, distribution information for each Fund as of its most recent tax year end is presented in Note 6 – Income Tax Information within the Notes to Financial Statements of this report.
11
Common Share Information (continued)
COMMON SHARE REPURCHASES
During August 2018, the Funds' Board of Directors/Trustees reauthorized an open-market share repurchase program, allowing each Fund to repurchase an aggregate of up to approximately 10% of its outstanding shares.
As of February 28, 2019, and since the inception of the Funds' repurchase programs, the Funds have cumulatively repurchased and retired their outstanding common shares as shown in the accompanying table.
| | | | | |
| | NNY | NYV | NAN | NRK |
| Common shares cumulatively repurchased and retired | — | — | 277,714 | 390,000 |
| Common shares authorized for repurchase | 1,520,000 | 235,000 | 3,110,000 | 8,760,000 |
During the current reporting period, the following Fund repurchased and retired its common shares at a weighted average price per share and a weighted average discount per share as shown in the accompanying table.
| | | | | | | |
| | | NAN | | | NRK | |
| Common shares repurchased and retired | | | 275,214 | | | | 383,200 | |
| Weighted average price per common share repurchased and retired | | $ | 12.29 | | | $ | 11.60 | |
| Weighted average discount per common share repurchased and retired | | | 15.03 | % | | | 15.49 | % |
OTHER COMMON SHARE INFORMATION
As of February 28, 2019, and during the current reporting period, the Funds' common share prices were trading at a premium/(discount) to their common share NAVs as shown in the accompanying table.
| | | | | | | | | | | | | |
| | | NNY | | | NYV | | | NAN | | | NRK | |
| Common share NAV | | $ | 9.87 | | | $ | 15.34 | | | $ | 14.69 | | | $ | 14.12 | |
| Common share price | | $ | 9.67 | | | $ | 13.68 | | | $ | 12.87 | | | $ | 12.36 | |
| Premium/(Discount) to NAV | | | (2.03 | )% | | | (10.82 | )% | | | (12.39 | )% | | | (12.46 | )% |
| 12-month average premium/(discount) to NAV | | | (5.33 | )% | | | (10.85 | )% | | | (14.08 | )% | | | (14.03 | )% |
12
Risk Considerations
Fund shares are not guaranteed or endorsed by any bank or other insured depository institution, and are not federally insured by the Federal Deposit Insurance Corporation.
Nuveen New York Municipal Value Fund, Inc. (NNY)
Investing in closed-end funds involves risk; principal loss is possible. There is no guarantee the Fund's investment objectives will be achieved. Closed-end fund shares may frequently trade at a discount or premium to their net asset value. Debt or fixed income securities such as those held by the Fund, are subject to market risk, credit risk, interest rate risk, derivatives risk, liquidity risk, and income risk. As interest rates rise, bond prices fall. State concentration makes the Fund more susceptible to local adverse economic, political, or regulatory changes affecting municipal bond issuers. These and other risk considerations such as tax risk are described in more detail on the Fund's web page at www.nuveen.com/NNY.
Nuveen New York Municipal Value Fund 2 (NYV)
Investing in closed-end funds involves risk; principal loss is possible. There is no guarantee the Fund's investment objectives will be achieved. Closed-end fund shares may frequently trade at a discount or premium to their net asset value. Debt or fixed income securities such as those held by the Fund, are subject to market risk, credit risk, interest rate risk, derivatives risk, liquidity risk, and income risk. As interest rates rise, bond prices fall. State concentration makes the Fund more susceptible to local adverse economic, political, or regulatory changes affecting municipal bond issuers. These and other risk considerations such as tax risk are described in more detail on the Fund's web page at www.nuveen.com/NYV.
Nuveen New York Quality Municipal Income Fund (NAN)
Investing in closed-end funds involves risk; principal loss is possible. There is no guarantee the Fund's investment objectives will be achieved. Closed-end fund shares may frequently trade at a discount or premium to their net asset value. Debt or fixed income securities such as those held by the Fund, are subject to market risk, credit risk, interest rate risk, derivatives risk, liquidity risk, and income risk. As interest rates rise, bond prices fall. Leverage increases return volatility and magnifies the Fund's potential return and its risks; there is no guarantee a fund's leverage strategy will be successful. State concentration makes the Fund more susceptible to local adverse economic, political, or regulatory changes affecting municipal bond issuers. These and other risk considerations such as inverse floater risk and tax risk are described in more detail on the Fund's web page at www.nuveen.com/NAN.
Nuveen New York AMT-Free Quality Municipal Income Fund (NRK)
Investing in closed-end funds involves risk; principal loss is possible. There is no guarantee the Fund's investment objectives will be achieved. Closed-end fund shares may frequently trade at a discount or premium to their net asset value. Debt or fixed income securities such as those held by the Fund, are subject to market risk, credit risk, interest rate risk, derivatives risk, liquidity risk, and income risk. As interest rates rise, bond prices fall. Leverage increases return volatility and magnifies the Fund's potential return and its risks; there is no guarantee a fund's leverage strategy will be successful. State concentration makes the Fund more susceptible to local adverse economic, political, or regulatory changes affecting municipal bond issuers. These and other risk considerations such as inverse floater risk and tax risk are described in more detail on the Fund's web page at www.nuveen.com/NRK.
13
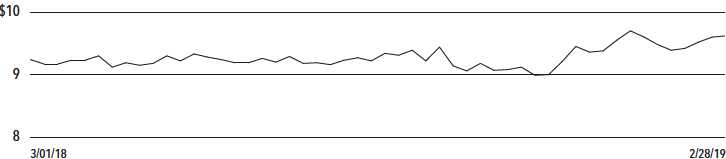
| NNY | Nuveen New York Municipal Value Fund, Inc. Performance Overview and Holding Summaries as of February 28, 2019 |
| | | | |
| Refer to the Glossary of Terms Used in this Report for further definition of the terms used within this section. |
Average Annual Total Returns as of February 28, 2019 |
| | | Average Annual |
| | | 1-Year | | | 5-Year | | | 10-Year | |
| NNY at Common Share NAV | | | 4.37 | % | | | 4.03 | % | | | 4.79 | % |
| NNY at Common Share Price | | | 8.52 | % | | | 4.45 | % | | | 5.03 | % |
| S&P Municipal Bond New York Index | | | 3.64 | % | | | 3.35 | % | | | 4.53 | % |
| S&P Municipal Bond Index | | | 4.03 | % | | | 3.45 | % | | | 4.77 | % |
Past performance is not predictive of future results. Current performance may be higher or lower than the data shown. Returns do not reflect the deduction of taxes that shareholders may have to pay on Fund distributions or upon the sale of Fund shares. Returns at NAV are net of Fund expenses, and assume reinvestment of distributions. Comparative index return information is provided for the Fund's shares at NAV only. Indexes are not available for direct investment.
Common Share Price Performance — Weekly Closing Price
This data relates to the securities held in the Fund's portfolio of investments as of the end of the reporting period. It should not be construed as a measure of performance for the Fund itself. Holdings are subject to change.
For financial reporting purposes, the ratings disclosed are the highest rating given by one of the following national rating agencies: Standard & Poor's Group, Moody's Investors Service, Inc. or Fitch, Inc. This treatment of split-rated securities may differ from that used for other purposes, such as for Fund investment policies. Credit ratings are subject to change. AAA, AA, A and BBB are investment grade ratings; BB, B, CCC, CC, C and D are below-investment grade ratings. Holdings designated N/R are not rated by these national rating agencies.
| | |
Fund Allocation | |
(% of net assets) | |
| Long-Term Municipal Bonds | 100.2% |
| Other Assets Less Liabilities | 1.0% |
Net Assets Plus Floating Rate | |
Obligations | 101.2% |
| Floating Rate Obligations | (1.2)% |
Net Assets | 100% |
| | |
Portfolio Composition | |
(% of total investments) | |
| Transportation | 23.6% |
| Education and Civic Organizations | 18.5% |
| Tax Obligation/Limited | 15.9% |
| Water and Sewer | 11.5% |
| U.S. Guaranteed | 10.7% |
| Utilities | 6.7% |
| Consumer Staples | 6.2% |
| Other | 6.9% |
Total | 100% |
| | |
Portfolio Credit Quality | |
(% of total investment exposure) | |
| U.S. Guaranteed | 10.7% |
| AAA | 15.3% |
| AA | 35.0% |
| A | 11.2% |
| BBB | 12.2% |
| BB or Lower | 9.6% |
| N/R (not rated) | 6.0% |
Total | 100% |
14
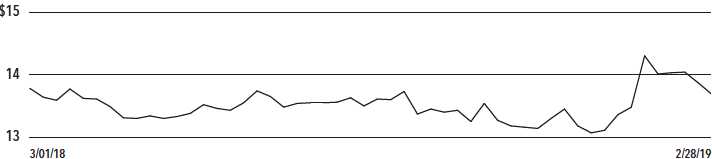
| NYV | Nuveen New York Municipal Value Fund 2 Performance Overview and Holding Summaries as of February 28, 2019 |
| | | | |
| Refer to the Glossary of Terms Used in this Report for further definition of the terms used within this section. |
Average Annual Total Returns as of February 28, 2019 |
| | | Average Annual |
| | | 1-Year | | | 5-Year | | | Since Inception | |
| NYV at Common Share NAV | | | 5.05 | % | | | 3.85 | % | | | 5.07 | % |
| NYV at Common Share Price | | | 3.08 | % | | | 3.71 | % | | | 3.64 | % |
| S&P Municipal Bond New York Index | | | 3.64 | % | | | 3.35 | % | | | 4.37 | % |
| S&P Municipal Bond Index | | | 4.03 | % | | | 3.45 | % | | | 4.60 | % |
Since inception returns are from 4/28/09. Past performance is not predictive of future results. Current performance may be higher or lower than the data shown. Returns do not reflect the deduction of taxes that shareholders may have to pay on Fund distributions or upon the sale of Fund shares. Returns at NAV are net of Fund expenses, and assume reinvestment of distributions. Comparative index return information is provided for the Fund's shares at NAV only. Indexes are not available for direct investment.
Common Share Price Performance — Weekly Closing Price
This data relates to the securities held in the Fund's portfolio of investments as of the end of the reporting period. It should not be construed as a measure of performance for the Fund itself. Holdings are subject to change.
For financial reporting purposes, the ratings disclosed are the highest rating given by one of the following national rating agencies: Standard & Poor's Group, Moody's Investors Service, Inc. or Fitch, Inc. This treatment of split-rated securities may differ from that used for other purposes, such as for Fund investment policies. Credit ratings are subject to change. AAA, AA, A and BBB are investment grade ratings; BB, B, CCC, CC, C and D are below-investment grade ratings. Holdings designated N/R are not rated by these national rating agencies.
| | |
Fund Allocation | |
(% of net assets) | |
| Long-Term Municipal Bonds | 88.7% |
| Short-Term Municipal Bonds | 6.9% |
| Other Assets Less Liabilities | 4.4% |
Net Assets | 100% |
| | |
Portfolio Composition | |
(% of total investments) | |
| Transportation | 24.5% |
| Education and Civic Organizations | 18.6% |
| Water and Sewer | 14.5% |
| Tax Obligation/Limited | 11.1% |
| U.S. Guaranteed | 8.9% |
| Consumer Staples | 5.0% |
| Utilities | 4.5% |
| Other | 12.9% |
Total | 100% |
| | |
Portfolio Credit Quality | |
(% of total investment exposure) | |
| U.S. Guaranteed | 8.9% |
| AAA | 8.9% |
| AA | 52.3% |
| A | 10.5% |
| BBB | 5.9% |
| BB or Lower | 7.3% |
| N/R (not rated) | 6.2% |
Total | 100% |
15
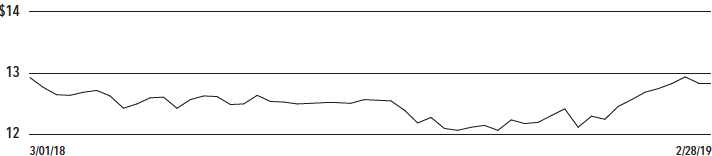
| NAN | Nuveen New York Quality Municipal Income Fund Performance Overview and Holding Summaries as of February 28, 2019 |
| | | | |
| Refer to the Glossary of Terms Used in this Report for further definition of the terms used within this section. |
Average Annual Total Returns as of February 28, 2019 |
| | | Average Annual |
| | | 1-Year | | | 5-Year | | | 10-Year | |
| NAN at Common Share NAV | | | 4.46 | % | | | 4.78 | % | | | 6.56 | % |
| NAN at Common Share Price | | | 3.49 | % | | | 4.61 | % | | | 6.93 | % |
| S&P Municipal Bond New York Index | | | 3.64 | % | | | 3.35 | % | | | 4.53 | % |
| S&P Municipal Bond Index | | | 4.03 | % | | | 3.45 | % | | | 4.77 | % |
Past performance is not predictive of future results. Current performance may be higher or lower than the data shown. Returns do not reflect the deduction of taxes that shareholders may have to pay on Fund distributions or upon the sale of Fund shares. Returns at NAV are net of Fund expenses, and assume reinvestment of distributions. Comparative index return information is provided for the Fund's shares at NAV only. Indexes are not available for direct investment.
Common Share Price Performance — Weekly Closing Price
This data relates to the securities held in the Fund's portfolio of investments as of the end of the reporting period. It should not be construed as a measure of performance for the Fund itself. Holdings are subject to change.
For financial reporting purposes, the ratings disclosed are the highest rating given by one of the following national rating agencies: Standard & Poor's Group, Moody's Investors Service, Inc. or Fitch, Inc. This treatment of split-rated securities may differ from that used for other purposes, such as for Fund investment policies. Credit ratings are subject to change. AAA, AA, A and BBB are investment grade ratings; BB, B, CCC, CC, C and D are below-investment grade ratings. Holdings designated N/R are not rated by these national rating agencies.
| | |
Fund Allocation | |
(% of net assets) | |
| Long-Term Municipal Bonds | 158.3% |
| Other Assets Less Liabilities | 1.1% |
Net Assets Plus Floating Rate Obligations, | |
AMTP Shares, net of deferred offering | |
costs & VRDP Shares, net of deferred | |
offering costs | 159.4% |
| Floating Rate Obligations | (7.6)% |
| AMTP Shares, net of deferred offering costs | (32.4)% |
| VRDP Shares, net of deferred offering costs | (19.4)% |
Net Assets | 100% |
| | |
Portfolio Composition | |
(% of total investments) | |
| Transportation | 19.0% |
| Tax Obligation/Limited | 17.7% |
| Education and Civic Organizations | 16.4% |
| Water and Sewer | 9.4% |
| U.S. Guaranteed | 8.9% |
| Tax Obligation/General | 8.3% |
| Utilities | 6.1% |
| Consumer Staples | 5.6% |
| Other | 8.6% |
Total | 100% |
| | |
Portfolio Credit Quality | |
(% of total investment exposure) | |
| U.S. Guaranteed | 8.7% |
| AAA | 14.8% |
| AA | 42.0% |
| A | 9.1% |
| BBB | 9.6% |
| BB or Lower | 9.8% |
| N/R (not rated) | 6.0% |
Total | 100% |
16
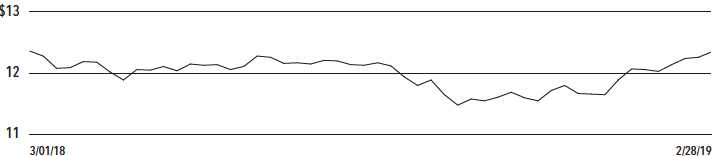
| NRK | Nuveen New York AMT-Free Quality Municipal Income Fund Performance Overview and Holding Summaries as of February 28, 2019 |
| | | | |
| Refer to the Glossary of Terms Used in this Report for further definition of the terms used within this section. |
Average Annual Total Returns as of February 28, 2019 |
| | | Average Annual |
| | | 1-Year | | | 5-Year | | | 10-Year | |
| NRK at Common Share NAV | | | 4.75 | % | | | 5.10 | % | | | 5.22 | % |
| NRK at Common Share Price | | | 5.01 | % | | | 4.71 | % | | | 6.14 | % |
| S&P Municipal Bond New York Index | | | 3.64 | % | | | 3.35 | % | | | 4.53 | % |
| S&P Municipal Bond Index | | | 4.03 | % | | | 3.45 | % | | | 4.77 | % |
Past performance is not predictive of future results. Current performance may be higher or lower than the data shown. Returns do not reflect the deduction of taxes that shareholders may have to pay on Fund distributions or upon the sale of Fund shares. Returns at NAV are net of Fund expenses, and assume reinvestment of distributions. Comparative index return information is provided for the Fund's shares at NAV only. Indexes averages are not available for direct investment.
Common Share Price Performance — Weekly Closing Price
This data relates to the securities held in the Fund's portfolio of investments as of the end of the reporting period. It should not be construed as a measure of performance for the Fund itself. Holdings are subject to change.
For financial reporting purposes, the ratings disclosed are the highest rating given by one of the following national rating agencies: Standard & Poor's Group, Moody's Investors Service, Inc. or Fitch, Inc. This treatment of split-rated securities may differ from that used for other purposes, such as for Fund investment policies. Credit ratings are subject to change. AAA, AA, A and BBB are investment grade ratings; BB, B, CCC, CC, C and D are below-investment grade ratings. Holdings designated N/R are not rated by these national rating agencies.
| | |
Fund Allocation | |
(% of net assets) | |
| Long-Term Municipal Bonds | 161.4% |
| Other Assets Less Liabilities | 1.5% |
Net Assets Plus Floating Rate Obligations, | |
MFP Shares, net of deferred offering | |
costs & VRDP Shares, net of deferred | |
offering costs | 162.9% |
| Floating Rate Obligations | (2.7)% |
| MFP Shares, net of deferred offering costs | (6.5)% |
| VRDP Shares, net of deferred offering costs | (53.7)% |
Net Assets | 100% |
| | |
Portfolio Composition | |
(% of total investments) | |
| Tax Obligation/Limited | 26.5% |
| Education and Civic Organizations | 17.8% |
| Water and Sewer | 11.0% |
| Transportation | 10.1% |
| U.S. Guaranteed | 8.2% |
| Utilities | 7.5% |
| Tax Obligation/General | 7.3% |
| Consumer Staples | 6.4% |
| Other | 5.2% |
Total | 100% |
| | |
Portfolio Credit Quality | |
(% of total investment exposure) | |
| U.S. Guaranteed | 8.2% |
| AAA | 15.5% |
| AA | 45.7% |
| A | 8.8% |
| BBB | 6.8% |
| BB or Lower | 6.1% |
| N/R (not rated) | 8.9% |
Total | 100% |
17
Report of Independent Registered Public Accounting Firm
To the Shareholders and Board of Directors/Trustees of
Nuveen New York Municipal Value Fund, Inc.
Nuveen New York Municipal Value Fund 2
Nuveen New York Quality Municipal Income Fund
Nuveen New York AMT-Free Quality Municipal Income Fund:
Opinion on the Financial Statements
We have audited the accompanying statements of assets and liabilities of Nuveen New York Municipal Value Fund, Inc., Nuveen New York Municipal Value Fund 2, Nuveen New York Quality Municipal Income Fund, and Nuveen New York AMT-Free Quality Municipal Income Fund (the "Funds"), including the portfolios of investments, as of February 28, 2019, the related statements of operations for the year then ended, the statements of changes in net assets for each of the years in the two year period then ended, the statements of cash flows (Nuveen New York Quality Municipal Income Fund and Nuveen New York AMT-Free Quality Municipal Income Fund) for the year then ended, and the related notes (collectively, the "financial statements") and the financial highlights for each of the years in the two year period then ended, the five-month period from October 1, 2016 through February 28, 2017, and each of the years in the three-year period ended September 30, 2016. In our opinion, the financial statements and financial highlights present fairly, in all material respects, the financial position of the Funds as of February 28, 2019, the results of their operations and their cash flows (where applicable) for the year then ended, the changes in their net assets for each of the years in the two year period then ended, and the financial highlights for each of the years in the two year period then ended, the five-month period from October 1, 2016 through February 28, 2017, and each of the years in the three-year period ended September 30, 2016, in conformity with U.S. generally accepted accounting principles.
Basis for Opinion
These financial statements and financial highlights are the responsibility of the Funds' management. Our responsibility is to express an opinion on these financial statements and financial highlights based on our audits. We are a public accounting firm registered with the Public Company Accounting Oversight Board (United States) (PCAOB) and are required to be independent with respect to the Funds in accordance with the U.S. federal securities laws and the applicable rules and regulations of the Securities and Exchange Commission and the PCAOB.
We conducted our audits in accordance with the standards of the PCAOB. Those standards require that we plan and perform the audit to obtain reasonable assurance about whether the financial statements and financial highlights are free of material misstatement, whether due to error or fraud. Our audits included performing procedures to assess the risks of material misstatement of the financial statements and financial highlights, whether due to error or fraud, and performing procedures that respond to those risks. Such procedures included examining, on a test basis, evidence regarding the amounts and disclosures in the financial statements and financial highlights. Such procedures also included confirmation of securities owned as of February 28, 2019, by correspondence with custodians and brokers or other appropriate auditing procedures. Our audits also included evaluating the accounting principles used and significant estimates made by management, as well as evaluating the overall presentation of the financial statements and financial highlights. We believe that our audits provide a reasonable basis for our opinion.
/s/ KPMG LLP
We have served as the auditor of one or more Nuveen investment companies since 2014.
Chicago, IL
April 26, 2019
18
| NNY | Nuveen New York Municipal Value Fund, Inc. Portfolio of Investments February 28, 2019 |
Principal | | | Optional Call | | |
Amount (000) | | Description (1) | Provisions (2) | Ratings (3) | Value |
| | | LONG-TERM INVESTMENTS – 100.2% (100.0% of Total Investments) | | | |
| | | MUNICIPAL BONDS – 100.2% (100.0% of Total Investments) | | | |
| | | Consumer Staples – 6.3% (6.2% of Total Investments) | | | |
| $ 1,000 | | Erie County Tobacco Asset Securitization Corporation, New York, Tobacco Settlement | 3/19 at 100.00 | BB+ | $ 999,940 |
| | | Asset-Backed Bonds, Series 2005A, 5.000%, 6/01/38 | | | |
| 500 | | Nassau County Tobacco Settlement Corporation, New York, Tobacco Settlement Asset-Backed | 2/19 at 100.00 | B– | 500,080 |
| | | Bonds, Refunding Series 2006A-2, 5.250%, 6/01/26 | | | |
| 2,875 | | Nassau County Tobacco Settlement Corporation, New York, Tobacco Settlement Asset-Backed | 3/19 at 100.00 | B– | 2,790,762 |
| | | Bonds, Series 2006A-3, 5.000%, 6/01/35 | | | |
| | | New York Counties Tobacco Trust VI, New York, Tobacco Settlement Pass-Through Bonds, | | | |
| | | Series Series 2016A-1: | | | |
| 890 | | 5.625%, 6/01/35 | No Opt. Call | BBB | 945,545 |
| 3,060 | | 5.750%, 6/01/43 | No Opt. Call | BBB | 3,395,529 |
| 230 | | TSASC Inc., New York, Tobacco Asset-Backed Bonds, Series 2006, 5.000%, 6/01/48 | 6/27 at 100.00 | N/R | 221,088 |
| 500 | | TSASC Inc., New York, Tobacco Settlement Asset-Backed Bonds, Series 2017B, | No Opt. Call | B+ | 540,245 |
| | | 5.000%, 6/01/25 | | | |
| 9,055 | | Total Consumer Staples | | | 9,393,189 |
| | | Education and Civic Organizations – 18.6% (18.5% of Total Investments) | | | |
| 415 | | Albany Industrial Development Agency, New York, Revenue Bonds, Brighter Choice Charter | 3/19 at 100.00 | B | 389,146 |
| | | Schools, Series 2007A, 5.000%, 4/01/37 | | | |
| 750 | | Buffalo and Erie County Industrial Land Development Corporation, New York, Revenue | 12/20 at 100.00 | B+ | 772,238 |
| | | Bonds, Enterprise Charter School Project, Series 2011A, 7.500%, 12/01/40 | | | |
| 1,250 | | Build New York City Resource Corporation, New York, Revenue Bonds, City University of | 6/24 at 100.00 | Aa2 | 1,392,312 |
| | | New York – Queens College, Q Student Residences, LLC Project, Refunding Series 2014A, | | | |
| | | 5.000%, 6/01/43 | | | |
| | | Build New York City Resource Corporation, New York, Revenue Bonds, South Bronx Charter | | | |
| | | School for International Cultures and the Arts Project, Series 2013A: | | | |
| 215 | | 5.000%, 4/15/33 | 4/23 at 100.00 | BB+ | 220,040 |
| 310 | | 5.000%, 4/15/43 | 4/23 at 100.00 | BB+ | 314,817 |
| 415 | | Dormitory Authority of the State of New York, General Revenue Bonds, Saint Johns | 7/23 at 100.00 | A– | 452,255 |
| | | University, Series 2013A, 5.000%, 7/01/44 | | | |
| 1,000 | | Dormitory Authority of the State of New York, Housing Revenue Bonds, Fashion Institute | No Opt. Call | Baa2 | 1,193,840 |
| | | of Technology, Series 2007, 5.250%, 7/01/34 – FGIC Insured | | | |
| | | Dormitory Authority of the State of New York, Lease Revenue Bonds, State University | | | |
| | | Dormitory Facilities, Series 2015A: | | | |
| 235 | | 5.000%, 7/01/31 | 7/25 at 100.00 | Aa3 | 270,687 |
| 265 | | 5.000%, 7/01/33 | 7/25 at 100.00 | Aa3 | 303,070 |
| | | Dormitory Authority of the State of New York, Revenue Bonds, Icahn School of Medicine at | | | |
| | | Mount Sinai, Refunding Series 2015A: | | | |
| 1,330 | | 5.000%, 7/01/40 | 7/25 at 100.00 | A– | 1,471,858 |
| 2,180 | | 5.000%, 7/01/45 | 7/25 at 100.00 | A– | 2,400,703 |
| 1,955 | | Dormitory Authority of the State of New York, Revenue Bonds, New School University, | 7/25 at 100.00 | A– | 2,159,982 |
| | | Series 2015A, 5.000%, 7/01/45 | | | |
| 760 | | Dormitory Authority of the State of New York, Revenue Bonds, New York University, Series | 7/25 at 100.00 | Aa2 | 873,012 |
| | | 2015A, 5.000%, 7/01/35 | | | |
| 2,385 | | Dormitory Authority of the State of New York, Revenue Bonds, New York University, Series | 7/26 at 100.00 | Aa2 | 2,708,501 |
| | | 2016A, 5.000%, 7/01/39 | | | |
| 1,000 | | Dormitory Authority of the State of New York, Revenue Bonds, New York University, Series | 7/28 at 100.00 | Aa2 | 1,161,730 |
| | | 2018A, 5.000%, 7/01/40 | | | |
19
NNY | Nuveen New York Municipal Value Fund, Inc. Portfolio of Investments (continued) February 28, 2019 |
Principal | | | Optional Call | | |
Amount (000) | | Description (1) | Provisions (2) | Ratings (3) | Value |
| | | Education and Civic Organizations (continued) | | | |
| $ 2,000 | | Dormitory Authority of the State of New York, Revenue Bonds, New York University, Series | 7/29 at 100.00 | Aa2 | $ 2,337,480 |
| | | 2019A, 5.000%, 7/01/42 | | | |
| 280 | | Dormitory Authority of the State of New York, Revenue Bonds, Saint Joseph's College, | 7/20 at 100.00 | Ba1 | 284,463 |
| | | Series 2010, 5.250%, 7/01/35 | | | |
| 680 | | Dormitory Authority of the State of New York, Revenue Bonds, Vaughn College of | 12/26 at 100.00 | BB– | 714,911 |
| | | Aeronautics & Technology, Series 2016A, 5.500%, 12/01/36, 144A | | | |
| 580 | | Glen Cove Local Economic Assistance Corporation, New York, Revenue Bonds, Garvies Point | 1/34 at 100.00 | N/R | 476,342 |
| | | Public Improvement Project, Capital Appreciation Series 2016C, 0.000%, 1/01/55 (4) | | | |
| 300 | | Hempstead Town Local Development Corporation, New York, Revenue Bonds, Adelphi | 9/23 at 100.00 | A– | 328,983 |
| | | University Project, Series 2013, 5.000%, 9/01/43 | | | |
| | | Monroe County Industrial Development Corporation, New York, Revenue Bonds, St. John | | | |
| | | Fisher College, Series 2011: | | | |
| 1,000 | | 6.000%, 6/01/30 | 6/21 at 100.00 | A– | 1,085,710 |
| 1,000 | | 6.000%, 6/01/34 | 6/21 at 100.00 | A– | 1,085,710 |
| 50 | | New Rochelle Corporation, New York, Local Development Revenue Bonds, Iona College | 7/25 at 100.00 | BBB | 54,435 |
| | | Project, Series 2015A, 5.000%, 7/01/45 | | | |
| | | New York City Industrial Development Agency, New York, PILOT Revenue Bonds, Queens | | | |
| | | Baseball Stadium Project, Series 2006: | | | |
| 1,500 | | 5.000%, 1/01/39 – AMBAC Insured | 3/19 at 100.00 | BBB | 1,518,975 |
| 1,175 | | 4.750%, 1/01/42 – AMBAC Insured | 3/19 at 100.00 | BBB | 1,175,787 |
| | | New York City Industrial Development Authority, New York, PILOT Revenue Bonds, Yankee | | | |
| | | Stadium Project, Series 2006: | | | |
| 1,610 | | 4.500%, 3/01/39 – FGIC Insured | 3/19 at 100.00 | Baa1 | 1,611,352 |
| 800 | | 4.750%, 3/01/46 – NPFG Insured | 3/19 at 100.00 | Baa1 | 800,552 |
| 300 | | Troy Capital Resource Corporation, New York, Revenue Bonds, Rensselaer Polytechnic | 9/20 at 100.00 | A3 | 312,687 |
| | | Institute, Series 2010A, 5.125%, 9/01/40 | | | |
| 25,740 | | Total Education and Civic Organizations | | | 27,871,578 |
| | | Financials – 0.8% (0.8% of Total Investments) | | | |
| 1,000 | | Liberty Development Corporation, New York, Goldman Sachs Headquarters Revenue Bonds | No Opt. Call | A | 1,267,270 |
| | | Series 2007, 5.500%, 10/01/37 | | | |
| | | Health Care – 1.5% (1.5% of Total Investments) | | | |
| 350 | | Dormitory Authority of the State of New York, Highland Hospital of Rochester Revenue | 7/20 at 100.00 | A | 363,069 |
| | | Bonds, Series 2010, 5.000%, 7/01/26 | | | |
| 650 | | Dutchess County Local Development Corporation, New York, Revenue Bonds, Health Quest | 7/26 at 100.00 | A– | 653,269 |
| | | Systems, Inc. Project, Series 2016B, 4.000%, 7/01/41 | | | |
| 290 | | Livingston County Industrial Development Agency, New York, Civic Facility Revenue Bonds, | 3/19 at 100.00 | BB | 293,135 |
| | | Nicholas H. Noyes Hospital, Series 2005, 6.000%, 7/01/30 | | | |
| 250 | | Suffolk County Economic Development Corporation, New York, Revenue Bonds, Catholic | 7/21 at 100.00 | A– | 266,438 |
| | | Health Services of Long Island Obligated Group Project, Refunding Series 2011, 5.000%, 7/01/28 | | | |
| 460 | | Yonkers Industrial Development Agency, New York, Revenue Bonds, St. John's Riverside | 3/19 at 100.00 | B– | 460,175 |
| | | Hospital, Series 2001A, 7.125%, 7/01/31 | | | |
| 145 | | Yonkers Industrial Development Agency, New York, Revenue Bonds, St. John's Riverside | 3/19 at 100.00 | B– | 145,055 |
| | | Hospital, Series 2001B, 7.125%, 7/01/31 | | | |
| 2,145 | | Total Health Care | | | 2,181,141 |
| | | Housing/Multifamily – 1.6% (1.6% of Total Investments) | | | |
| 135 | | East Syracuse Housing Authority, New York, FHA-Insured Section 8 Assisted Revenue | 3/19 at 100.00 | AA | 135,450 |
| | | Refunding Bonds, Bennet Project, Series 2001A, 6.700%, 4/01/21 | | | |
| 1,000 | | New York City Housing Development Corporation, New York, Multifamily Housing Revenue | 5/19 at 100.00 | AA+ | 1,005,810 |
| | | Bonds, Series 2009C-1, 5.500%, 11/01/34 | | | |
20
| | | | | | |
Principal | | | Optional Call | | |
Amount (000) | | Description (1) | Provisions (2) | Ratings (3) | Value |
| | | Housing/Multifamily (continued) | | | |
| $ 1,250 | | New York City Housing Development Corporation, New York, Multifamily Housing Revenue | 5/19 at 100.00 | AA+ | $ 1,256,787 |
| | | Bonds, Series 2009M, 5.150%, 11/01/45 | | | |
| 2,385 | | Total Housing/Multifamily | | | 2,398,047 |
| | | Industrials – 1.9% (1.9% of Total Investments) | | | |
| 425 | | Build New York City Resource Corporation, New York, Solid Waste Disposal Revenue Bonds, | 1/25 at 100.00 | N/R | 452,183 |
| | | Pratt Paper NY, Inc. Project, Series 2014, 5.000%, 1/01/35 (AMT), 144A | | | |
| 2,350 | | New York Liberty Development Corporation, New York, Liberty Revenue Bonds, 3 World Trade | 11/24 at 100.00 | N/R | 2,450,274 |
| | | Center Project, Class 1 Series 2014, 5.000%, 11/15/44, 144A | | | |
| 2,775 | | Total Industrials | | | 2,902,457 |
| | | Long-Term Care – 0.3% (0.3% of Total Investments) | | | |
| 270 | | Dormitory Authority of the State of New York, Non-State Supported Debt, Ozanam Hall of | 3/19 at 100.00 | A2 | 270,353 |
| | | Queens Nursing Home Revenue Bonds, Series 2006, 5.000%, 11/01/31 | | | |
| 225 | | Yonkers Industrial Development Agency, New York, Civic Facilities Revenue Bonds, Special | 3/19 at 100.00 | N/R | 223,540 |
| | | Needs Facilities Pooled Program Bonds, Series 2008-C1, 5.800%, 7/01/23 | | | |
| 495 | | Total Long-Term Care | | | 493,893 |
| | | Tax Obligation/General – 0.8% (0.8% of Total Investments) | | | |
| 1,000 | | New York City, New York, General Obligation Bonds, Series 2014A-1, 5.000%, 8/01/26 | 8/23 at 100.00 | AA | 1,132,450 |
| 90 | | New York City, New York, General Obligation Bonds, Series 2017B-1, 5.000%, 12/01/41 | 12/26 at 100.00 | AA | 101,737 |
| 1,090 | | Total Tax Obligation/General | | | 1,234,187 |
| | | Tax Obligation/Limited – 15.9% (15.9% of Total Investments) | | | |
| 1,400 | | Dormitory Authority of the State of New York, Second General Resolution Consolidated | No Opt. Call | AA | 1,448,342 |
| | | Revenue Bonds, City University System, Series 1993A, 6.000%, 7/01/20 | | | |
| 2,290 | | Dormitory Authority of the State of New York, State Personal Income Tax Revenue Bonds, | 2/22 at 100.00 | AA+ | 2,469,101 |
| | | General Purpose Series 2012D, 5.000%, 2/15/37 | | | |
| 640 | | Dormitory Authority of the State of New York, State Sales Tax Revenue Bonds, Series | 9/25 at 100.00 | AA+ | 731,315 |
| | | 2015B. Group A,B&C, 5.000%, 3/15/35 | | | |
| 2,500 | | Government of Guam, Business Privilege Tax Bonds, Refunding Series 2015D, 5.000%, 11/15/28 | 11/25 at 100.00 | BB | 2,745,925 |
| 3,000 | | New York City Transitional Finance Authority, New York, Building Aid Revenue Bonds, | 7/25 at 100.00 | AA | 3,363,660 |
| | | Series 2015S-2, 5.000%, 7/15/40 | | | |
| 1,000 | | New York City Transitional Finance Authority, New York, Building Aid Revenue Bonds, | 7/28 at 100.00 | AA | 1,164,020 |
| | | Series 2017S-3, 5.250%, 7/15/45 | | | |
| 445 | | New York City Transitional Finance Authority, New York, Building Aid Revenue Bonds, | 7/28 at 100.00 | AA | 519,253 |
| | | Series 2019S-3A, 5.000%, 7/15/36 | | | |
| 1,680 | | New York City Transitional Finance Authority, New York, Future Tax Secured Bonds, | 5/23 at 100.00 | AAA | 1,858,013 |
| | | Series 2013I, 5.000%, 5/01/38 | | | |
| 1,225 | | New York City Transitional Finance Authority, New York, Future Tax Secured Bonds, | 2/24 at 100.00 | AAA | 1,376,692 |
| | | Series 2014D-1, 5.000%, 2/01/35 | | | |
| 1,020 | | New York City Transitional Finance Authority, New York, Future Tax Secured Bonds, | 8/28 at 100.00 | AAA | 1,183,700 |
| | | Series 2019A-1, 5.000%, 8/01/38 | | | |
| 2,450 | | New York State Thruway Authority, Highway and Bridge Trust Fund Bonds, Second General, | No Opt. Call | AA+ | 2,552,753 |
| | | Series 2005B, 5.500%, 4/01/20 – AMBAC Insured (UB) (5) | | | |
| 600 | | New York State Urban Development Corporation, Special Project Revenue Bonds, University | No Opt. Call | AA | 626,646 |
| | | Facilities Grants, Series 1995, 5.875%, 1/01/21 | | | |
| 1,107 | | Puerto Rico Urgent Interest Fund Corp (COFINA), National Custodial Taxable Trust Unit, | | | |
| | | Series 2007A Sr. Bond, 0.000%, 8/01/43 (8) | No Opt. Call | N/R | 928,068 |
| 3,362 | | Puerto Rico Urgent Interest Fund Corp (COFINA), National Custodial Trust Tax-Exempt Trust | No Opt. Call | N/R | 2,967,133 |
| | | Unit, Series 2017A Sr. Bond, 0.000%, 8/01/43 (8) | | | |
| 22,719 | | Total Tax Obligation/Limited | | | 23,934,621 |
21
NNY | Nuveen New York Municipal Value Fund, Inc. Portfolio of Investments (continued) February 28, 2019 |
Principal | | | Optional Call | | |
Amount (000) | | Description (1) | Provisions (2) | Ratings (3) | Value |
| | | Transportation – 23.6% (23.6% of Total Investments) | | | |
| $ 2,500 | | Metropolitan Transportation Authority, New York, Transportation Revenue Bonds, Refunding | 11/25 at 100.00 | AA– | $ 2,837,100 |
| | | Series 2015D-1, 5.000%, 11/15/30 | | | |
| 815 | | Metropolitan Transportation Authority, New York, Transportation Revenue Bonds, Series | 11/22 at 100.00 | A1 | 873,786 |
| | | 2012E, 5.000%, 11/15/42 | | | |
| 2,000 | | Metropolitan Transportation Authority, New York, Transportation Revenue Bonds, Series | 5/24 at 100.00 | AA– | 2,225,660 |
| | | 2014B, 5.250%, 11/15/38 | | | |
| 5,000 | | Metropolitan Transportation Authority, New York, Transportation Revenue Bonds, Series | 11/26 at 100.00 | AA– | 5,664,550 |
| | | 2016C-1, 5.000%, 11/15/34 | | | |
| 1,500 | | New York City Industrial Development Agency, New York, Civic Facility Revenue Bonds, | 3/19 at 101.00 | N/R | 982,500 |
| | | Bronx Parking Development Company, LLC Project, Series 2007, 5.875%, 10/01/46 (6) | | | |
| 660 | | New York Liberty Development Corporation, New York, Liberty Revenue Bonds, 4 World Trade | 11/21 at 100.00 | A+ | 703,646 |
| | | Center Project, Series 2011, 5.000%, 11/15/44 | | | |
| 2,630 | | New York Transportation Development Corporation, New York, Special Facilities Bonds, | 7/24 at 100.00 | BBB | 2,785,696 |
| | | LaGuardia Airport Terminal B Redevelopment Project, Series 2016A, 5.000%, 7/01/46 (AMT) | | | |
| | | New York Transportation Development Corporation, New York, Special Facility Revenue | | | |
| | | Bonds, American Airlines, Inc. John F Kennedy International Airport Project, Refunding | | | |
| | | Series 2016: | | | |
| 765 | | 5.000%, 8/01/26 (AMT) | 8/21 at 100.00 | BB | 801,452 |
| 2,020 | | 5.000%, 8/01/31 (AMT) | 8/21 at 100.00 | BB | 2,095,528 |
| 2,000 | | New York Transportation Development Corporation, New York, Special Facility Revenue | 1/28 at 100.00 | Baa3 | 2,281,760 |
| | | Bonds, Delta Air Lines, Inc. – LaGuardia Airport Terminals C&D Redevelopment Project, Series | | | |
| | | 2018, 5.000%, 1/01/32 (AMT) | | | |
| 5,900 | | Port Authority of New York and New Jersey, Consolidated Revenue Bonds, One Hundred | 5/25 at 100.00 | AA– | 6,644,285 |
| | | Eighty-Ninth Series 2015, 5.000%, 5/01/40 | | | |
| 1,575 | | Port Authority of New York and New Jersey, Consolidated Revenue Bonds, One Hundred | 12/23 at 100.00 | AA– | 1,763,716 |
| | | Seventy Ninth Series 2013, 5.000%, 12/01/43 | | | |
| 1,165 | | Port Authority of New York and New Jersey, Consolidated Revenue Bonds, Two Hundred | 9/28 at 100.00 | AA– | 1,214,862 |
| | | Eleventh Series 2018, 4.000%, 9/01/43 | | | |
| | | Port Authority of New York and New Jersey, Special Project Bonds, JFK International Air | | | |
| | | Terminal LLC Project, Eighth Series 2010: | | | |
| 225 | | 6.500%, 12/01/28 | 3/19 at 100.00 | BBB+ | 234,779 |
| 1,160 | | 6.000%, 12/01/36 | 12/20 at 100.00 | BBB+ | 1,228,080 |
| 780 | | Triborough Bridge and Tunnel Authority, New York, General Purpose Revenue Bonds, | No Opt. Call | A+ | 830,310 |
| | | Refunding Subordinate Lien Series 2002E, 5.500%, 11/15/20 – NPFG Insured | | | |
| 2,000 | | Triborough Bridge and Tunnel Authority, New York, General Revenue Bonds, Refunding | 11/28 at 100.00 | AA– | 2,357,800 |
| | | Series 2018C, 5.000%, 11/15/37 | | | |
| 32,695 | | Total Transportation | | | 35,525,510 |
| | | U.S. Guaranteed – 10.7% (10.7% of Total Investments) (7) | | | |
| 1,350 | | Brooklyn Arena Local Development Corporation, New York, Payment in Lieu of Taxes Revenue | 1/20 at 100.00 | AA+ | 1,405,161 |
| | | Bonds, Barclays Center Project, Series 2009, 6.250%, 7/15/40 (Pre-refunded 1/15/20) | | | |
| 525 | | Dormitory Authority of the State of New York, Revenue Bonds, New School University, | 7/20 at 100.00 | A– | 550,436 |
| | | Series 2010, 5.250%, 7/01/30 (Pre-refunded 7/01/20) | | | |
| 2,100 | | Dormitory Authority of the State of New York, Revenue Bonds, NYU Hospitals Center, | 7/20 at 100.00 | A– | 2,222,325 |
| | | Series 2011A, 6.000%, 7/01/40 (Pre-refunded 7/01/20) | | | |
| 880 | | Hempstead Town Local Development Corporation, New York, Revenue Bonds, Molloy College | 7/19 at 100.00 | N/R | 892,083 |
| | | Project, Series 2009, 5.750%, 7/01/39 (Pre-refunded 7/01/19) | | | |
| 400 | | Long Island Power Authority, New York, Electric System Revenue Bonds, Series 2011A, | 5/21 at 100.00 | A– | 429,084 |
| | | 5.000%, 5/01/38 (Pre-refunded 5/01/21) | | | |
22
| | | | | | |
Principal | | | Optional Call | | |
Amount (000) | | Description (1) | Provisions (2) | Ratings (3) | Value |
| | | U.S. Guaranteed (7) (continued) | | | |
| $ 1,500 | | Metropolitan Transportation Authority, New York, Dedicated Tax Fund Bonds, Series 2009B, | 11/19 at 100.00 | AA | $ 1,536,345 |
| | | 5.000%, 11/15/34 (Pre-refunded 11/15/19) | | | |
| 2,685 | | Metropolitan Transportation Authority, New York, Transportation Revenue Bonds, Series | 11/22 at 100.00 | A1 | 3,017,564 |
| | | 2012E, 5.000%, 11/15/42 (Pre-refunded 11/15/22) | | | |
| 1,100 | | Metropolitan Transportation Authority, New York, Transportation Revenue Bonds, Series | 11/23 at 100.00 | AA– | 1,270,181 |
| | | 2013E, 5.000%, 11/15/31 (Pre-refunded 11/15/23) | | | |
| 3,000 | | Monroe County Industrial Development Corporation, New York, Revenue Bonds, University | 7/21 at 100.00 | AA– | 3,238,260 |
| | | of Rochester Project, Series 2011B, 5.000%, 7/01/41 (Pre-refunded 7/01/21) | | | |
| 45 | | Suffolk County Economic Development Corporation, New York, Revenue Bonds, Catholic | 7/21 at 100.00 | N/R | 48,466 |
| | | Health Services of Long Island Obligated Group Project, Refunding Series 2011, 5.000%, | | | |
| | | 7/01/28 (Pre-refunded 7/01/21) | | | |
| 1,345 | | Tompkins County Development Corporation, New York, Revenue Bonds, Ithaca College, Series | 1/21 at 100.00 | N/R | 1,436,178 |
| | | 2011, 5.375%, 7/01/41 (Pre-refunded 1/01/21) – AGM Insured | | | |
| 14,930 | | Total U.S. Guaranteed | | | 16,046,083 |
| | | Utilities – 6.7% (6.7% of Total Investments) | | | |
| 1,000 | | Chautauqua County Industrial Development Agency, New York, Exempt Facility Revenue | 2/20 at 100.00 | BBB– | 1,027,720 |
| | | Bonds, NRG Dunkirk Power Project, Series 2009, 5.875%, 4/01/42 | | | |
| 90 | | Guam Power Authority, Revenue Bonds, Series 2012A, 5.000%, 10/01/34 | 10/22 at 100.00 | BBB | 94,429 |
| 135 | | Long Island Power Authority, New York, Electric System General Revenue Bonds, Series | 9/24 at 100.00 | A– | 148,831 |
| | | 2014A, 5.000%, 9/01/44 | | | |
| 475 | | Long Island Power Authority, New York, Electric System General Revenue Bonds, Series | 9/27 at 100.00 | A– | 532,266 |
| | | 2017, 5.000%, 9/01/47 | | | |
| 1,250 | | Long Island Power Authority, New York, Electric System Revenue Bonds, Series 2012A, | 9/22 at 100.00 | A– | 1,354,200 |
| | | 5.000%, 9/01/37 | | | |
| 400 | | Niagara Area Development Corporation, New York, Solid Waste Disposal Facility Revenue | 7/23 at 100.00 | B1 | 397,164 |
| | | Refunding Bonds, Covanta Energy Project, Series 2018A, 4.750%, 11/01/42 (AMT), 144A | | | |
| 295 | | Suffolk County Industrial Development Agency, New York, Revenue Bonds, Nissequogue | 3/19 at 100.00 | N/R | 295,065 |
| | | Cogeneration Partners Facility, Series 1998, 5.500%, 1/01/23 (AMT) | | | |
| | | Utility Debt Securitization Authority, New York, Restructuring Bonds, Series 2013TE: | | | |
| 4,440 | | 5.000%, 12/15/34 | 12/23 at 100.00 | AAA | 5,012,138 |
| 1,100 | | 5.000%, 12/15/41 | 12/23 at 100.00 | AAA | 1,232,176 |
| 9,185 | | Total Utilities | | | 10,093,989 |
| | | Water and Sewer – 11.5% (11.5% of Total Investments) | | | |
| 300 | | Buffalo Municipal Water Finance Authority, New York, Water System Revenue Bonds, | 7/25 at 100.00 | A | 347,085 |
| | | Refunding Series 2015A, 5.000%, 7/01/29 | | | |
| 3,000 | | New York City Municipal Water Finance Authority, New York, Water and Sewer System Second | 6/27 at 100.00 | AA+ | 3,386,280 |
| | | General Resolution Revenue Bonds, Series 2018CC-1, 5.000%, 6/15/48 | | | |
| 1,000 | | New York City Municipal Water Finance Authority, New York, Water and Sewer System Second | 12/27 at 100.00 | AA+ | 1,150,250 |
| | | General Resolution Revenue Bonds, Series 2018EE, 5.000%, 6/15/40 | | | |
| | | New York State Environmental Facilities Corporation, State Clean Water and Drinking | | | |
| | | Water Revolving Funds Revenue Bonds, New York City Municipal Water Finance Authority Projects, | | | |
| | | Second Resolution Subordinated SRF Series 2015A: | | | |
| 2,100 | | 5.000%, 6/15/36 | 6/25 at 100.00 | AAA | 2,413,173 |
| 2,500 | | 5.000%, 6/15/40 | 6/25 at 100.00 | AAA | 2,843,175 |
| 1,000 | | New York State Environmental Facilities Corporation, State Clean Water and Drinking | 6/27 at 100.00 | AAA | 1,138,460 |
| | | Water Revolving Funds Revenue Bonds, New York City Municipal Water Finance Authority | | | |
| | | Projects-Second Resolution Bonds, Subordinated SRF Series 2017A, 5.000%, 6/15/46 | | | |
23
NNY | Nuveen New York Municipal Value Fund, Inc. Portfolio of Investments (continued) February 28, 2019 |
Principal | | | Optional Call | | |
Amount (000) | | Description (1) | Provisions (2) | Ratings (3) | Value |
| | | Water and Sewer (continued) | | | |
| $ 4,300 | | New York State Environmental Facilities Corporation, State Clean Water and Drinking | 6/27 at 100.00 | AAA | $ 4,891,121 |
| | | Water Revolving Funds Revenue Bonds, New York City Municipal Water Finance Authority | | | |
| | | Projects-Second Resolution Bonds, Subordinated SRF Series 2017E, 5.000%, 6/15/47 | | | |
| 1,000 | | New York State Environmental Facilities Corporation, State Revolving Funds Revenue | 2/22 at 100.00 | AAA | 1,079,991 |
| | | Bonds, 2010 Master Financing Program, Series 2012B, 5.000%, 2/15/42 | | | |
| 15,200 | | Total Water and Sewer | | | 17,249,535 |
| $ 139,414 | | Total Long-Term Investments (cost $144,551,027) | | | 150,591,500 |
| | | Floating Rate Obligations – (1.2)% | | | (1,840,000) |
| | | Other Assets Less Liabilities – 1.0% | | | 1,529,461 |
| | | Net Asset Applicable to Common Shares – 100% | | | $ 150,280,961 |
| | |
| (1) | All percentages shown in the Portfolio of Investments are based on net assets applicable to common shares unless otherwise noted. |
| (2) | Optional Call Provisions: Dates (month and year) and prices of the earliest optional call or redemption. There may be other call provisions at varying prices at later dates. Certain mortgage-backed securities may be subject to periodic principal paydowns. Optional Call Provisions are not covered by the report of independent registered public accounting firm. |
| (3) | For financial reporting purposes, the ratings disclosed are the highest of Standard & Poor's Group ("Standard & Poor's"), Moody's Investors Service, Inc. ("Moody's") or Fitch, Inc. ("Fitch") rating. This treatment of split-rated securities may differ from that used for other purposes, such as for Fund investment policies. Ratings below BBB by Standard & Poor's, Baa by Moody's or BBB by Fitch are considered to be below investment grade. Holdings designated N/R are not rated by any of these national rating agencies. Ratings are not covered by the report of independent registered public accounting firm. |
| (4) | Step-up coupon bond, a bond with a coupon that increases ("steps up"), usually at regular intervals, while the bond is outstanding. The rate shown is the coupon as of the end of the reporting period. |
| (5) | Investment, or portion of investment, has been pledged to collateralize the net payment obligations for investments in inverse floating rate transactions. |
| (6) | As of, or subsequent to, the end of the reporting period, this security is non-income producing. Non-income producing, in the case of a fixed-income security, generally denotes that the issuer has (1) defaulted on the payment of principal or interest, (2) is under the protection of the Federal Bankruptcy Court or (3) the Fund's Adviser has concluded that the issue is not likely to meet its future interest payment obligations and has ceased accruing additional income on the Fund's records. |
| (7) | Backed by an escrow or trust containing sufficient U.S. Government or U.S. Government agency securities, which ensure the timely payment of principal and interest. |
| (8) | Effective February 12, 2019, the par value of the original bonds was replaced with taxable and tax exempt Puerto Rico Sales Tax Financing Corporation (commonly known as COFINA) bond units that are collateralized by a bundle of zero and coupon paying bonds. The quantity shown represents units in a trust, which were assigned according to the original bond's accreted value. These securities do not have a stated coupon interest rate and income will be recognized through accretion of the discount associated with the trust units. The factor at which these units accrete can also decrease, primarily for principal payments generated from coupon payments received or dispositions of the underlying bond collateral. The quantity of units will not change as a result of these principal payments. |
| 144A | Investment is exempt from registration under Rule 144A of the Securities Act of 1933, as amended. These investments may only be resold in transactions exempt from registration, which are normally those transactions with qualified institutional buyers. |
| AMT | Alternative Minimum Tax |
| UB | Underlying bond of an inverse floating rate trust reflected as a financing transaction. See Notes to Financial Statements, Note 3 - Portfolio Securities and Investments in Derivatives. Inverse Floating Rate Securities for more information. |
| | See accompanying notes to financial statements. |
24
| NYV | Nuveen New York Municipal Value Fund 2 Portfolio of Investments February 28, 2019 |
| | | | | | |
Principal | | | Optional Call | | |
Amount (000) | | Description (1) | Provisions (2) | Ratings (3) | Value |
| | | LONG-TERM INVESTMENTS – 88.7% (92.7% of Total Investments) | | | |
| | | MUNICIPAL BONDS – 88.7% (92.7% of Total Investments) | | | |
| | | Consumer Staples – 4.8% (5.0% of Total Investments) | | | |
| $ 1,000 | | District of Columbia Tobacco Settlement Corporation, Tobacco Settlement Asset-Backed | No Opt. Call | A– | $ 1,084,170 |
| | | Bonds, Series 2001, 6.500%, 5/15/33 | | | |
| 100 | | Erie County Tobacco Asset Securitization Corporation, New York, Tobacco Settlement | 3/19 at 100.00 | BB+ | 99,994 |
| | | Asset-Backed Bonds, Series 2005A, 5.000%, 6/01/38 | | | |
| | | New York Counties Tobacco Trust VI, New York, Tobacco Settlement Pass-Through Bonds, | | | |
| | | Series Series 2016A-1: | | | |
| 115 | | 5.625%, 6/01/35 | No Opt. Call | BBB | 122,177 |
| 380 | | 5.750%, 6/01/43 | No Opt. Call | BBB | 421,667 |
| 1,595 | | Total Consumer Staples | | | 1,728,008 |
| | | Education and Civic Organizations – 17.7% (18.6% of Total Investments) | | | |
| 1,200 | | Albany Industrial Development Agency, New York, Revenue Bonds, Brighter Choice Charter | 3/19 at 100.00 | B | 1,125,240 |
| | | Schools, Series 2007A, 5.000%, 4/01/37 | | | |
| 80 | | Buffalo and Erie County Industrial Land Development Corporation, New York, Revenue | No Opt. Call | B+ | 80,690 |
| | | Bonds, Enterprise Charter School Project, Series 2011A, 6.000%, 12/01/19 | | | |
| | | Build New York City Resource Corporation, New York, Revenue Bonds, South Bronx Charter | | | |
| | | School for International Cultures and the Arts Project, Series 2013A: | | | |
| 50 | | 5.000%, 4/15/33 | 4/23 at 100.00 | BB+ | 51,172 |
| 75 | | 5.000%, 4/15/43 | 4/23 at 100.00 | BB+ | 76,166 |
| 100 | | Dormitory Authority of the State of New York, General Revenue Bonds, Saint Johns | 7/23 at 100.00 | A– | 108,977 |
| | | University, Series 2013A, 5.000%, 7/01/44 | | | |
| 200 | | Dormitory Authority of the State of New York, Revenue Bonds, New York University, Series | 7/25 at 100.00 | Aa2 | 229,740 |
| | | 2015A, 5.000%, 7/01/35 | | | |
| 1,000 | | Dormitory Authority of the State of New York, Revenue Bonds, New York University, Series | 7/28 at 100.00 | Aa2 | 1,147,020 |
| | | 2018A, 5.000%, 7/01/48 | | | |
| 1,000 | | Dormitory Authority of the State of New York, Revenue Bonds, Non State Supported Debt, | 7/20 at 100.00 | Aa1 | 1,039,480 |
| | | Cornell University, Series 2010A, 5.000%, 7/01/40 | | | |
| 165 | | Dormitory Authority of the State of New York, Revenue Bonds, Vaughn College of | 12/26 at 100.00 | BB– | 173,471 |
| | | Aeronautics & Technology, Series 2016A, 5.500%, 12/01/36, 144A | | | |
| 145 | | Glen Cove Local Economic Assistance Corporation, New York, Revenue Bonds, Garvies Point | 1/34 at 100.00 | N/R | 119,086 |
| | | Public Improvement Project, Capital Appreciation Series 2016C, 0.000%, 1/01/55 (4) | | | |
| 100 | | Hempstead Town Local Development Corporation, New York, Revenue Bonds, Adelphi | 9/23 at 100.00 | A– | 110,195 |
| | | University Project, Series 2013, 5.000%, 9/01/38 | | | |
| 4,895 | | New York City Industrial Development Agency, New York, Revenue Bonds, Yankee Stadium | No Opt. Call | AA | 2,136,863 |
| | | Project PILOT, Series 2009A, 0.000%, 3/01/40 – AGC Insured | | | |
| 9,010 | | Total Education and Civic Organizations | | | 6,398,100 |
| | | Financials – 1.1% (1.1% of Total Investments) | | | |
| 300 | | Liberty Development Corporation, New York, Goldman Sachs Headquarters Revenue Bonds | No Opt. Call | A | 380,181 |
| | | Series 2007, 5.500%, 10/01/37 | | | |
| | | Health Care – 1.0% (1.0% of Total Investments) | | | |
| 50 | | Dormitory Authority of the State of New York, Highland Hospital of Rochester Revenue | 7/20 at 100.00 | A | 51,867 |
| | | Bonds, Series 2010, 5.000%, 7/01/26 | | | |
| 150 | | Dutchess County Local Development Corporation, New York, Revenue Bonds, Health Quest | 7/26 at 100.00 | A– | 150,755 |
| | | Systems, Inc. Project, Series 2016B, 4.000%, 7/01/41 | | | |
25
NYV | Nuveen New York Municipal Value Fund 2 Portfolio of Investments (continued) February 28, 2019 |
Principal | | | Optional Call | | |
Amount (000) | | Description (1) | Provisions (2) | Ratings (3) | Value |
| | | Health Care (continued) | | | |
| $ 150 | | Yonkers Industrial Development Agency, New York, Revenue Bonds, St. John's Riverside | 3/19 at 100.00 | B– | $ 150,057 |
| | | Hospital, Series 2001B, 7.125%, 7/01/31 | | | |
| 350 | | Total Health Care | | | 352,679 |
| | | Housing/Multifamily – 4.0% (4.2% of Total Investments) | | | |
| 1,000 | | New York State Housing Finance Agency, Affordable Housing Revenue Bonds, Series 2009A, | 5/19 at 100.00 | Aa2 | 1,005,950 |
| | | 5.250%, 11/01/41 | | | |
| 450 | | New York State Housing Finance Agency, Affordable Housing Revenue Bonds, Series 2009B, | 5/19 at 100.00 | Aa2 | 452,147 |
| | | 4.500%, 11/01/29 | | | |
| 1,450 | | Total Housing/Multifamily | | | 1,458,097 |
| | | Industrials – 2.0% (2.1% of Total Investments) | | | |
| 105 | | Build New York City Resource Corporation, New York, Solid Waste Disposal Revenue Bonds, | 1/25 at 100.00 | N/R | 111,716 |
| | | Pratt Paper NY, Inc. Project, Series 2014, 5.000%, 1/01/35 (AMT), 144A | | | |
| 580 | | New York Liberty Development Corporation, New York, Liberty Revenue Bonds, 3 World Trade | 11/24 at 100.00 | N/R | 604,748 |
| | | Center Project, Class 1 Series 2014, 5.000%, 11/15/44, 144A | | | |
| 685 | | Total Industrials | | | 716,464 |
| | | Tax Obligation/General – 4.3% (4.5% of Total Investments) | | | |
| 1,000 | | Nassau County, New York, General Obligation Bonds, General Improvement Series 2016C, | 4/26 at 100.00 | A+ | 1,126,630 |
| | | 5.000%, 4/01/35 | | | |
| 400 | | Yonkers, New York, General Obligation Bonds, Refunding Series 2011A, 5.000%, 10/01/24 – | 10/21 at 100.00 | AA | 435,124 |
| | | AGM Insured | | | |
| 1,400 | | Total Tax Obligation/General | | | 1,561,754 |
| | | Tax Obligation/Limited – 10.6% (11.1% of Total Investments) | | | |
| 1,500 | | Dormitory Authority of the State of New York, State Sales Tax Revenue Bonds, Series | 9/25 at 100.00 | AA+ | 1,714,020 |
| | | 2015B. Group A,B&C, 5.000%, 3/15/35 | | | |
| 540 | | Hudson Yards Infrastructure Corporation, New York, Revenue Bonds, Second Indenture | 2/27 at 100.00 | Aa3 | 609,800 |
| | | Series 2017A, 5.000%, 2/15/42 | | | |
| 300 | | New York City Transitional Finance Authority, New York, Future Tax Secured Bonds, | 2/24 at 100.00 | AAA | 337,149 |
| | | Series 2014D-1, 5.000%, 2/01/35 | | | |
| 1,000 | | Sales Tax Asset Receivable Corporation of New York City, New York, Sales Tax Asset | 10/24 at 100.00 | AA+ | 1,154,340 |
| | | Revenue Bonds, Series 2015A, 5.000%, 10/15/30 | | | |
| 3,340 | | Total Tax Obligation/Limited | | | 3,815,309 |
| | | Transportation – 16.4% (17.2% of Total Investments) | | | |
| 2,000 | | New York City Industrial Development Agency, New York, Civic Facility Revenue Bonds, | 3/19 at 101.00 | N/R | 1,310,000 |
| | | Bronx Parking Development Company, LLC Project, Series 2007, 5.750%, 10/01/37 (5) | | | |
| 155 | | New York Liberty Development Corporation, New York, Liberty Revenue Bonds, 4 World Trade | 11/21 at 100.00 | A+ | 165,250 |
| | | Center Project, Series 2011, 5.000%, 11/15/44 | | | |
| 645 | | New York Transportation Development Corporation, New York, Special Facilities Bonds, | 7/24 at 100.00 | BBB | 683,184 |
| | | LaGuardia Airport Terminal B Redevelopment Project, Series 2016A, 5.000%, 7/01/46 (AMT) | | | |
| | | New York Transportation Development Corporation, New York, Special Facility Revenue | | | |
| | | Bonds, American Airlines, Inc. John F Kennedy International Airport Project, Refunding | | | |
| | | Series 2016: | | | |
| 220 | | 5.000%, 8/01/26 (AMT) | 8/21 at 100.00 | BB | 230,483 |
| 420 | | 5.000%, 8/01/31 (AMT) | 8/21 at 100.00 | BB | 435,704 |
| 400 | | New York Transportation Development Corporation, New York, Special Facility Revenue | 1/28 at 100.00 | Baa3 | 456,352 |
| | | Bonds, Delta Air Lines, Inc. – LaGuardia Airport Terminals C&D Redevelopment Project, Series | | | |
| | | 2018, 5.000%, 1/01/32 (AMT) | | | |
26
Principal | | | Optional Call | | |
Amount (000) | | Description (1) | Provisions (2) | Ratings (3) | Value |
| | | Transportation (continued) | | | |
| $ 765 | | Port Authority of New York and New Jersey, Consolidated Revenue Bonds, Two Hundred | 9/28 at 100.00 | AA– | $ 797,742 |
| | | Eleventh Series 2018, 4.000%, 9/01/43 | | | |
| 800 | | Port Authority of New York and New Jersey, Consolidated Revenue Bonds, Two Hundred Fifth | 11/27 at 100.00 | AA– | 910,552 |
| | | Series 2017, 5.000%, 11/15/47 | | | |
| | | Port Authority of New York and New Jersey, Special Project Bonds, JFK International Air | | | |
| | | Terminal LLC Project, Eighth Series 2010: | | | |
| 180 | | 6.500%, 12/01/28 | 3/19 at 100.00 | BBB+ | 187,823 |
| 140 | | 6.000%, 12/01/36 | 12/20 at 100.00 | BBB+ | 148,217 |
| 525 | | Triborough Bridge and Tunnel Authority, New York, General Purpose Revenue Bonds, MTA | 5/27 at 100.00 | AA– | 594,704 |
| | | Bridges & Tunnels, Series 2017A, 5.000%, 11/15/47 | | | |
| 6,250 | | Total Transportation | | | 5,920,011 |
| | | U.S. Guaranteed – 8.5% (8.9% of Total Investments) (6) | | | |
| 290 | | Albany Capital Resource Corporation, New York, St. Peter's Hospital Project, Series | 11/20 at 100.00 | N/R | 311,071 |
| | | 2011, 6.000%, 11/15/25 (Pre-refunded 11/15/20) | | | |
| 1,500 | | Dormitory Authority of the State of New York, Revenue Bonds, North Shore Long Island | 5/19 at 100.00 | A– | 1,509,510 |
| | | Jewish Obligated Group, Series 2009A, 5.500%, 5/01/37 (Pre-refunded 5/01/19) | | | |
| – | | Dormitory Authority of the State of New York, State Personal Income Tax Revenue Bonds, | 3/19 at 100.00 | AA+ | – |
| | | Education Series 2009A, 5.000%, 3/15/38 (Pre-refunded 3/15/19) | | | |
| 1,200 | | Guam Government, Limited Obligation Section 30 Revenue Bonds, Series 2009A, 5.750%, | 12/19 at 100.00 | N/R | 1,237,440 |
| | | 12/01/34 (Pre-refunded 12/01/19) | | | |
| 2,990 | | Total U.S. Guaranteed | | | 3,058,021 |
| | | Utilities – 4.4% (4.5% of Total Investments) | | | |
| 25 | | Guam Power Authority, Revenue Bonds, Series 2012A, 5.000%, 10/01/34 | 10/22 at 100.00 | BBB | 26,230 |
| 285 | | Long Island Power Authority, New York, Electric System General Revenue Bonds, Series | 9/24 at 100.00 | A– | 314,198 |
| | | 2014A, 5.000%, 9/01/44 | | | |
| 105 | | Long Island Power Authority, New York, Electric System General Revenue Bonds, Series | 9/27 at 100.00 | A– | 117,659 |
| | | 2017, 5.000%, 9/01/47 | | | |
| 100 | | Niagara Area Development Corporation, New York, Solid Waste Disposal Facility Revenue | 7/23 at 100.00 | B1 | 99,291 |
| | | Refunding Bonds, Covanta Energy Project, Series 2018A, 4.750%, 11/01/42 (AMT), 144A | | | |
| 905 | | Utility Debt Securitization Authority, New York, Restructuring Bonds, Series 2013TE, | 12/23 at 100.00 | AAA | 1,013,745 |
| | | 5.000%, 12/15/41 | | | |
| 1,420 | | Total Utilities | | | 1,571,123 |
| | | Water and Sewer – 13.9% (14.5% of Total Investments) | | | |
| 900 | | New York City Municipal Water Finance Authority, New York, Water and Sewer System | 12/21 at 100.00 | AA+ | 966,042 |
| | | Revenue Bonds, Second Generation Resolution, Series 2012BB, 5.000%, 6/15/44 | | | |
| 2,000 | | New York City Municipal Water Finance Authority, New York, Water and Sewer System Second | 12/27 at 100.00 | AA+ | 2,300,500 |
| | | General Resolution Revenue Bonds, Series 2018EE, 5.000%, 6/15/40 | | | |
| | | New York State Environmental Facilities Corporation, State Clean Water and Drinking | | | |
| | | Water Revolving Funds Revenue Bonds, New York City Municipal Water Finance Authority | | | |
| | | Projects-Second Resolution Bonds, Subordinated SRF Series 2018B: | | | |
| 500 | | 5.000%, 6/15/43 | 6/28 at 100.00 | AAA | 578,560 |
| 1,000 | | 5.000%, 6/15/48 | 6/28 at 100.00 | AAA | 1,150,790 |
| 4,400 | | Total Water and Sewer | | | 4,995,892 |
| $ 33,190 | | Total Long-Term Investments (cost $29,595,243) | | | 31,955,639 |
27
NYV | Nuveen New York Municipal Value Fund 2 Portfolio of Investments (continued) February 28, 2019 |
Principal | | | Optional Call | | |
Amount (000) | | Description (1) | Provisions (2) | Ratings (3) | Value |
| | | SHORT-TERM INVESTMENTS – 6.9% (7.3% of Total Investments) | | | |
| | | MUNICIPAL BONDS – 6.9% (7.3% of Total Investments) | | | |
| | | Transportation – 6.9% (7.3% of Total Investments) | | | |
| $ 2,500 | | Triborough Bridge and Tunnel Authority, New York, General Purpose Revenue Bonds, MTA | 4/19 at 100.00 | AA+ | $ 2,500,000 |
| | | Bridges & Tunnels, Variable Rate Demand Obligation, Refunding Series 2002F, | | | |
| | | 1.650%, 11/01/32 (7) | | | |
| $ 2,500 | | Total Short-Term Investments (cost $2,500,000) | | | 2,500,000 |
| | | Total Investments (cost $32,095,243) – 95.6% | | | 34,455,639 |
| | | Other Assets Less Liabilities – 4.4% | | | 1,596,377 |
| | | Net Asset Applicable to Common Shares – 100% | | | $ 36,052,016 |
| | |
| (1) | All percentages shown in the Portfolio of Investments are based on net assets applicable to common shares unless otherwise noted. |
| (2) | Optional Call Provisions: Dates (month and year) and prices of the earliest optional call or redemption. There may be other call provisions at varying prices at later dates. Certain mortgage-backed securities may be subject to periodic principal paydowns. Optional Call Provisions are not covered by the report of independent registered public accounting firm. |
| (3) | For financial reporting purposes, the ratings disclosed are the highest of Standard & Poor's Group ("Standard & Poor's"), Moody's Investors Service, Inc. ("Moody's") or Fitch, Inc. ("Fitch") rating. This treatment of split-rated securities may differ from that used for other purposes, such as for Fund investment policies. Ratings below BBB by Standard & Poor's, Baa by Moody's or BBB by Fitch are considered to be below investment grade. Holdings designated N/R are not rated by any of these national rating agencies. Ratings are not covered by the report of independent registered public accounting firm. |
| (4) | Step-up coupon bond, a bond with a coupon that increases ("steps up"), usually at regular intervals, while the bond is outstanding. The rate shown is the coupon as of the end of the reporting period. |
| (5) | As of, or subsequent to, the end of the reporting period, this security is non-income producing. Non-income producing, in the case of a fixed-income security, generally denotes that the issuer has (1) defaulted on the payment of principal or interest, (2) is under the protection of the Federal Bankruptcy Court or (3) the Fund's Adviser has concluded that the issue is not likely to meet its future interest payment obligations and has ceased accruing additional income on the Fund's records. |
| (6) | Backed by an escrow or trust containing sufficient U.S. Government or U.S. Government agency securities, which ensure the timely payment of principal and interest. |
| (7) | Investment has a maturity of greater than one year, but has variable rate and/or demand features which qualify it as a short-term investment. The rate disclosed, as well as the reference rate and spread, where applicable, is that in effect as of the end of the reporting period. This rate changes periodically based on market conditions or a specified market index. |
| 144A | Investment is exempt from registration under Rule 144A of the Securities Act of 1933, as amended. These investments may only be resold in transactions exempt from registration, which are normally those transactions with qualified institutional buyers. |
| AMT | Alternative Minimum Tax |
| | See accompanying notes to financial statements. |
28
| | |
| NAN | Nuveen New York Quality Municipal Income Fund Portfolio of Investments
February 28, 2019 |
| | | | | | |
Principal | | | Optional Call | | |
Amount (000) | | Description (1) | Provisions (2) | Ratings (3) | Value |
| | | LONG-TERM INVESTMENTS – 158.3% (100.0% of Total Investments) | | | |
| | | MUNICIPAL BONDS – 158.3% (100.0% of Total Investments) | | | |
| | | Consumer Staples – 8.8% (5.6% of Total Investments) | | | |
| | | Erie County Tobacco Asset Securitization Corporation, New York, Tobacco Settlement | | | |
| | | Asset-Backed Bonds, Series 2005A: | | | |
| $ 12,500 | | 5.000%, 6/01/38 | 3/19 at 100.00 | BB+ | $ 12,499,250 |
| 3,210 | | 5.000%, 6/01/45 | 3/19 at 100.00 | B+ | 3,141,113 |
| 1,350 | | Nassau County Tobacco Settlement Corporation, New York, Tobacco Settlement Asset-Backed | 2/19 at 100.00 | B– | 1,350,216 |
| | | Bonds, Refunding Series 2006A-2, 5.250%, 6/01/26 | | | |
| 12,415 | | Nassau County Tobacco Settlement Corporation, New York, Tobacco Settlement Asset-Backed | 3/19 at 100.00 | B– | 12,051,241 |
| | | Bonds, Series 2006A-3, 5.000%, 6/01/35 | | | |
| | | New York Counties Tobacco Trust VI, New York, Tobacco Settlement Pass-Through Bonds, | | | |
| | | Series Series 2016A-1: | | | |
| 335 | | 5.625%, 6/01/35 | No Opt. Call | BBB | 355,907 |
| 1,145 | | 5.750%, 6/01/43 | No Opt. Call | BBB | 1,270,549 |
| | | TSASC Inc., New York, Tobacco Asset-Backed Bonds, Series 2006: | | | |
| 2,620 | | 5.000%, 6/01/45 | 6/27 at 100.00 | B+ | 2,532,649 |
| 7,155 | | 5.000%, 6/01/48 | 6/27 at 100.00 | N/R | 6,877,744 |
| 40,730 | | Total Consumer Staples | | | 40,078,669 |
| | | Education and Civic Organizations – 26.0% (16.4% of Total Investments) | | | |
| 1,855 | | Albany Industrial Development Agency, New York, Revenue Bonds, Brighter Choice Charter | 3/19 at 100.00 | B | 1,739,434 |
| | | Schools, Series 2007A, 5.000%, 4/01/37 | | | |
| 3,265 | | Buffalo and Erie County Industrial Land Development Corporation, New York, Revenue | 12/20 at 100.00 | B+ | 3,361,807 |
| | | Bonds, Enterprise Charter School Project, Series 2011A, 7.500%, 12/01/40 | | | |
| | | Build New York City Resource Corporation, New York, Revenue Bonds, City University of | | | |
| | | New York – Queens College, Q Student Residences, LLC Project, Refunding Series 2014A: | | | |
| 1,025 | | 5.000%, 6/01/32 | 6/24 at 100.00 | Aa2 | 1,163,713 |
| 2,070 | | 5.000%, 6/01/43 | 6/24 at 100.00 | Aa2 | 2,305,670 |
| | | Build New York City Resource Corporation, New York, Revenue Bonds, Metropolitan College | | | |
| | | of New York, Series 2014: | | | |
| 1,405 | | 5.250%, 11/01/34 | 11/24 at 100.00 | BB | 1,434,519 |
| 1,300 | | 5.000%, 11/01/39 | 11/24 at 100.00 | BB | 1,288,339 |
| | | Build New York City Resource Corporation, New York, Revenue Bonds, South Bronx Charter | | | |
| | | School for International Cultures and the Arts Project, Series 2013A: | | | |
| 950 | | 5.000%, 4/15/33 | 4/23 at 100.00 | BB+ | 972,268 |
| 1,380 | | 5.000%, 4/15/43 | 4/23 at 100.00 | BB+ | 1,401,445 |
| 1,760 | | Dormitory Authority of the State of New York, General Revenue Bonds, Saint Johns | 7/23 at 100.00 | A– | 1,917,995 |
| | | University, Series 2013A, 5.000%, 7/01/44 | | | |
| 2,000 | | Dormitory Authority of the State of New York, Housing Revenue Bonds, Fashion Institute | No Opt. Call | Baa2 | 2,370,600 |
| | | of Technology, Series 2007, 5.250%, 7/01/29 – FGIC Insured | | | |
| 3,915 | | Dormitory Authority of the State of New York, Lease Revenue Bonds, State University | 7/23 at 100.00 | Aa3 | 4,407,546 |
| | | Dormitory Facilities, Refunding Series 2013A, 5.000%, 7/01/27 | | | |
| 3,500 | | Dormitory Authority of the State of New York, Lease Revenue Bonds, State University | 7/22 at 100.00 | Aa2 | 3,799,670 |
| | | Dormitory Facilities, Series 2012A, 5.000%, 7/01/37 | | | |
| | | Dormitory Authority of the State of New York, Lease Revenue Bonds, State University | | | |
| | | Dormitory Facilities, Series 2015A: | | | |
| 1,120 | | 5.000%, 7/01/31 | 7/25 at 100.00 | Aa3 | 1,290,083 |
| 1,245 | | 5.000%, 7/01/33 | 7/25 at 100.00 | Aa3 | 1,423,857 |
| 5,090 | | Dormitory Authority of the State of New York, Revenue Bonds, Icahn School of Medicine at | 7/25 at 100.00 | A– | 5,632,899 |
| | | Mount Sinai, Refunding Series 2015A, 5.000%, 7/01/40 | | | |
29
| | | | | |
NAN | Nuveen New York Quality Municipal Income Fund | |
| | Portfolio of Investments (continued) | | | |
| | February 28, 2019 | | | |
| |
| |
| |
| |
Principal | | | Optional Call | | |
Amount (000) | | Description (1) | Provisions (2) | Ratings (3) | Value |
| | | Education and Civic Organizations (continued) | | | |
| $ 2,100 | | Dormitory Authority of the State of New York, Revenue Bonds, Marymount Manhattan | 7/19 at 100.00 | Baa2 | $ 2,120,853 |
| | | College, Series 2009, 5.250%, 7/01/29 | | | |
| 1,955 | | Dormitory Authority of the State of New York, Revenue Bonds, New School University, | 7/25 at 100.00 | A– | 2,159,982 |
| | | Series 2015A, 5.000%, 7/01/45 | | | |
| 2,120 | | Dormitory Authority of the State of New York, Revenue Bonds, New York University, Series | No Opt. Call | Aa2 | 2,230,494 |
| | | 2001-1, 5.500%, 7/01/20 – AMBAC Insured | | | |
| | | Dormitory Authority of the State of New York, Revenue Bonds, New York University, | | | |
| | | Series 2015A: | | | |
| 1,000 | | 5.000%, 7/01/34 | 7/25 at 100.00 | Aa2 | 1,150,600 |
| 2,300 | | 5.000%, 7/01/35 | 7/25 at 100.00 | Aa2 | 2,642,010 |
| | | Dormitory Authority of the State of New York, Revenue Bonds, New York University, | | | |
| | | Series 2016A: | | | |
| 5,100 | | 5.000%, 7/01/33 | 7/26 at 100.00 | Aa2 | 5,922,630 |
| 3,765 | | 5.000%, 7/01/36 | 7/26 at 100.00 | Aa2 | 4,322,107 |
| 1,055 | | 5.000%, 7/01/39 | 7/26 at 100.00 | Aa2 | 1,198,100 |
| 2,500 | | Dormitory Authority of the State of New York, Revenue Bonds, New York University, Series | 7/29 at 100.00 | Aa2 | 2,895,525 |
| | | 2019A, 5.000%, 7/01/49 | | | |
| 8,000 | | Dormitory Authority of the State of New York, Revenue Bonds, Non State Supported Debt, | 7/20 at 100.00 | Aa1 | 8,315,840 |
| | | Cornell University, Series 2010A, 5.000%, 7/01/40 | | | |
| 1,600 | | Dormitory Authority of the State of New York, Revenue Bonds, Saint Joseph's College, | 7/20 at 100.00 | Ba1 | 1,625,504 |
| | | Series 2010, 5.250%, 7/01/35 | | | |
| 3,140 | | Dormitory Authority of the State of New York, Revenue Bonds, Vaughn College of | 12/26 at 100.00 | BB– | 3,301,208 |
| | | Aeronautics & Technology, Series 2016A, 5.500%, 12/01/36, 144A | | | |
| 2,705 | | Glen Cove Local Economic Assistance Corporation, New York, Revenue Bonds, Garvies Point | 1/34 at 100.00 | N/R | 2,221,562 |
| | | Public Improvement Project, Capital Appreciation Series 2016C, 0.000%, 1/01/55 (4) | | | |
| 250 | | Hempstead Town Local Development Corporation, New York, Revenue Bonds, Adelphi | 3/19 at 100.00 | A– | 250,590 |
| | | University Project, Series 2009B, 5.250%, 2/01/39 | | | |
| | | Hempstead Town Local Development Corporation, New York, Revenue Bonds, Adelphi | | | |
| | | University Project, Series 2013: | | | |
| 1,005 | | 5.000%, 9/01/38 | 9/23 at 100.00 | A– | 1,107,460 |
| 265 | | 5.000%, 9/01/43 | 9/23 at 100.00 | A– | 290,602 |
| 5,000 | | Madison County Capital Resource Corporation, New York, Revenue Bonds, Colgate University | 7/25 at 100.00 | AA | 5,652,750 |
| | | Project, Refunding Series 2015A, 5.000%, 7/01/40 | | | |
| 1,260 | | Madison County Capital Resource Corporation, New York, Revenue Bonds, Colgate University | 7/20 at 100.00 | AA | 1,312,277 |
| | | Project, Series 2010A, 5.000%, 7/01/40 | | | |
| 890 | | Monroe County Industrial Development Corporation, New York, Revenue Bonds, St. John | 6/21 at 100.00 | A– | 966,282 |
| | | Fisher College, Series 2011, 6.000%, 6/01/30 | | | |
| 3,030 | | New Rochelle Corporation, New York, Local Development Revenue Bonds, Iona College | 7/25 at 100.00 | BBB | 3,298,731 |
| | | Project, Series 2015A, 5.000%, 7/01/45 | | | |
| | | New York City Industrial Development Agency, New York, PILOT Revenue Bonds, Queens | | | |
| | | Baseball Stadium Project, Series 2006: | | | |
| 1,000 | | 5.000%, 1/01/31 – AMBAC Insured | 3/19 at 100.00 | BBB | 1,002,740 |
| 235 | | 5.000%, 1/01/36 – AMBAC Insured | 3/19 at 100.00 | BBB | 235,618 |
| 3,515 | | 5.000%, 1/01/39 – AMBAC Insured | 3/19 at 100.00 | BBB | 3,559,465 |
| 5,050 | | 4.750%, 1/01/42 – AMBAC Insured | 3/19 at 100.00 | BBB | 5,053,383 |
| 400 | | 5.000%, 1/01/46 – AMBAC Insured | 3/19 at 100.00 | BBB | 405,408 |
| | | New York City Industrial Development Authority, New York, PILOT Revenue Bonds, Yankee | | | |
| | | Stadium Project, Series 2006: | | | |
| 7,555 | | 4.500%, 3/01/39 – FGIC Insured | 3/19 at 100.00 | Baa1 | 7,561,346 |
| 2,750 | | 4.750%, 3/01/46 – NPFG Insured | 3/19 at 100.00 | Baa1 | 2,751,898 |
| 1,000 | | New York City Trust for Cultural Resources, New York, Revenue Bonds, Whitney Museum of | 1/21 at 100.00 | AA | 1,057,140 |
| | | American Art, Series 2011, 5.000%, 7/01/31 | | | |
| 1,500 | | New York City Trust for Cultural Resources, New York, Revenue Bonds, Wildlife | 8/23 at 100.00 | AA– | 1,675,740 |
| | | Conservation Society, Series 2013A, 5.000%, 8/01/33 | | | |
30
| | | | | | |
Principal | | | Optional Call | | |
Amount (000) | | Description (1) | Provisions (2) | Ratings (3) | Value |
| | | Education and Civic Organizations (continued) | | | |
| $ 1,515 | | Onondaga Civic Development Corporation, New York, Revenue Bonds, Le Moyne College | 7/25 at 100.00 | Baa2 | $ 1,625,231 |
| | | Project, Series 2015, 5.000%, 7/01/40 | | | |
| | | Saint Lawrence County Industrial Development Agency Civic Development Corporation, New | | | |
| | | York, Revenue Bonds, Clarkson University Project, Series 2012A: | | | |
| 1,050 | | 5.250%, 9/01/33 | 3/22 at 100.00 | Baa1 | 1,133,276 |
| 1,750 | | 5.000%, 9/01/41 | 3/22 at 100.00 | Baa1 | 1,863,750 |
| 2,260 | | Troy Capital Resource Corporation, New York, Revenue Bonds, Rensselaer Polytechnic | 9/20 at 100.00 | A3 | 2,355,575 |
| | | Institute, Series 2010A, 5.125%, 9/01/40 | | | |
| 110,500 | | Total Education and Civic Organizations | | | 117,775,522 |
| | | Financials – 3.2% (2.0% of Total Investments) | | | |
| 4,725 | | Liberty Development Corporation, New York, Goldman Sachs Headquarter Revenue Bonds, | No Opt. Call | A | 5,805,796 |
| | | Series 2005, 5.250%, 10/01/35 | | | |
| 6,885 | | Liberty Development Corporation, New York, Goldman Sachs Headquarters Revenue Bonds | No Opt. Call | A | 8,725,154 |
| | | Series 2007, 5.500%, 10/01/37 | | | |
| 11,610 | | Total Financials | | | 14,530,950 |
| | | Health Care – 3.8% (2.4% of Total Investments) | | | |
| | | Dormitory Authority of the State of New York, Highland Hospital of Rochester Revenue | | | |
| | | Bonds, Series 2010: | | | |
| 350 | | 5.000%, 7/01/26 | 7/20 at 100.00 | A | 363,069 |
| 350 | | 5.200%, 7/01/32 | 7/20 at 100.00 | A | 363,045 |
| 3,700 | | Dormitory Authority of the State of New York, Revenue Bonds, North Shore Long Island | 5/25 at 100.00 | A– | 4,036,774 |
| | | Jewish Obligated Group, Series 2015A, 5.000%, 5/01/43 | | | |
| 500 | | Dutchess County Local Development Corporation, New York, Revenue Bonds, Health Quest | 7/20 at 100.00 | A– | 529,570 |
| | | Systems Inc, Series 2010A, 5.750%, 7/01/30 | | | |
| 4,120 | | Dutchess County Local Development Corporation, New York, Revenue Bonds, Health Quest | 7/26 at 100.00 | A– | 4,704,916 |
| | | Systems, Inc. Project, Series 2016B, 5.000%, 7/01/32 | | | |
| 710 | | Livingston County Industrial Development Agency, New York, Civic Facility Revenue Bonds, | 3/19 at 100.00 | BB | 717,675 |
| | | Nicholas H. Noyes Hospital, Series 2005, 6.000%, 7/01/30 | | | |
| 715 | | Monroe County Industrial Development Corporation, New York, FHA Insured Mortgage Revenue | 2/21 at 100.00 | AA | 771,464 |
| | | Bonds, Unity Hospital of Rochester Project, Series 2010, 5.750%, 8/15/35 | | | |
| 2,730 | | Suffolk County Economic Development Corporation, New York, Revenue Bonds, Catholic | 7/21 at 100.00 | A– | 2,909,498 |
| | | Health Services of Long Island Obligated Group Project, Refunding Series 2011, 5.000%, 7/01/28 | | | |
| 2,080 | | Yonkers Industrial Development Agency, New York, Revenue Bonds, St. John's Riverside | 3/19 at 100.00 | B– | 2,080,790 |
| | | Hospital, Series 2001A, 7.125%, 7/01/31 | | | |
| 595 | | Yonkers Industrial Development Agency, New York, Revenue Bonds, St. John's Riverside | 3/19 at 100.00 | B– | 595,226 |
| | | Hospital, Series 2001B, 7.125%, 7/01/31 | | | |
| 15,850 | | Total Health Care | | | 17,072,027 |
| | | Housing/Multifamily – 1.7% (1.0% of Total Investments) | | | |
| 4,000 | | New York City Housing Development Corporation, New York, Multifamily Housing Revenue | 5/19 at 100.00 | AA+ | 4,013,960 |
| | | Bonds, Series 2009J, 4.800%, 5/01/36 | | | |
| 705 | | New York City Housing Development Corporation, New York, Multifamily Housing Revenue | 5/20 at 100.00 | AA+ | 727,200 |
| | | Bonds, Series 2010D-1A, 5.000%, 11/01/42 | | | |
| 600 | | New York State Housing Finance Agency, Affordable Housing Revenue Bonds, Series 2009B, | 5/19 at 100.00 | Aa2 | 602,862 |
| | | 4.500%, 11/01/29 | | | |
| 2,000 | | New York State Housing Finance Agency, Affordable Housing Revenue Bonds, Series 2010A, | 5/20 at 100.00 | Aa2 | 2,030,280 |
| | | 5.000%, 11/01/42 | | | |
| 190 | | New York State Housing Finance Agency, Secured Mortgage Program Multifamily Housing | 3/19 at 100.00 | Aa1 | 190,502 |
| | | Revenue Bonds, Series 1999I, 6.200%, 2/15/20 (AMT) | | | |
| 7,495 | | Total Housing/Multifamily | | | 7,564,804 |
31
| | | | | |
NAN | Nuveen New York Quality Municipal Income Fund | |
| | Portfolio of Investments (continued) | | | |
| | February 28, 2019 | | | |
| |
| |
Principal | | | Optional Call | | |
Amount (000) | | Description (1) | Provisions (2) | Ratings (3) | Value |
| | | Housing/Single Family – 0.1% (0.1% of Total Investments) | | | |
| $ 645 | | Guam Housing Corporation, Mortgage-Backed Securities Program Single Family Mortgage | No Opt. Call | N/R | $ 654,707 |
| | | Revenue Bonds, Series 1998A, 5.750%, 9/01/31 (AMT) | | | |
| | | Industrials – 4.4% (2.8% of Total Investments) | | | |
| 1,935 | | Build New York City Resource Corporation, New York, Solid Waste Disposal Revenue Bonds, | 1/25 at 100.00 | N/R | 2,058,763 |
| | | Pratt Paper NY, Inc. Project, Series 2014, 5.000%, 1/01/35 (AMT), 144A | | | |
| 17,145 | | New York Liberty Development Corporation, New York, Liberty Revenue Bonds, 3 World Trade | 11/24 at 100.00 | N/R | 17,876,577 |
| | | Center Project, Class 1 Series 2014, 5.000%, 11/15/44, 144A | | | |
| 19,080 | | Total Industrials | | | 19,935,340 |
| | | Long-Term Care – 0.5% (0.3% of Total Investments) | | | |
| 1,275 | | Dormitory Authority of the State of New York, Non-State Supported Debt, Ozanam Hall of | 3/19 at 100.00 | A2 | 1,276,670 |
| | | Queens Nursing Home Revenue Bonds, Series 2006, 5.000%, 11/01/31 | | | |
| 835 | | New York City Industrial Development Agency, New York, Civic Facility Revenue Bonds, | 3/19 at 100.00 | N/R | 812,062 |
| | | Special Needs Facilities Pooled Program, Series 2008A-1, 5.800%, 7/01/23 | | | |
| 170 | | Yonkers Industrial Development Agency, New York, Civic Facilities Revenue Bonds, Special | 3/19 at 100.00 | N/R | 168,897 |
| | | Needs Facilities Pooled Program Bonds, Series 2008-C1, 5.800%, 7/01/23 | | | |
| 2,280 | | Total Long-Term Care | | | 2,257,629 |
| | | Tax Obligation/General – 13.1% (8.3% of Total Investments) | | | |
| | | Nassau County, New York, General Obligation Bonds, General Improvement Series, | | | |
| | | Refunding 2016A: | | | |
| 3,630 | | 5.000%, 1/01/28 | 1/26 at 100.00 | A+ | 4,238,787 |
| 500 | | 5.000%, 1/01/38 | 1/26 at 100.00 | A+ | 556,100 |
| | | Nassau County, New York, General Obligation Bonds, General Improvement Series 2016C: | | | |
| 1,395 | | 5.000%, 4/01/35 | 4/26 at 100.00 | A+ | 1,571,649 |
| 2,000 | | 5.000%, 4/01/43 | 4/26 at 100.00 | A+ | 2,205,000 |
| 400 | | New York City, New York, General Obligation Bonds, Series 2009E, 5.000%, 8/01/28 | 8/19 at 100.00 | AA | 405,472 |
| 1,000 | | New York City, New York, General Obligation Bonds, Series 2012B, 5.000%, 8/01/30 | 8/22 at 100.00 | AA | 1,098,670 |
| 980 | | New York City, New York, General Obligation Bonds, Series 2012I, 5.000%, 8/01/32 | 8/22 at 100.00 | AA | 1,073,982 |
| 5,000 | | New York City, New York, General Obligation Bonds, Series 2014A-1, | 8/23 at 100.00 | AA | 5,662,250 |
| | | 5.000%, 8/01/26 | | | |
| 8,775 | | New York City, New York, General Obligation Bonds, Series 2017B-1, | 12/26 at 100.00 | AA | 9,919,348 |
| | | 5.000%, 12/01/41 | | | |
| 4,000 | | New York City, New York, General Obligation Bonds, Series 2018B-1, | 10/27 at 100.00 | AA | 4,611,800 |
| | | 5.000%, 10/01/37 | | | |
| | | New York City, New York, General Obligation Bonds, Series 2018E-1: | | | |
| 7,000 | | 5.000%, 3/01/38 (UB) (5) | 3/28 at 100.00 | AA | 8,103,830 |
| 1,000 | | 5.000%, 3/01/39 | 3/28 at 100.00 | AA | 1,150,320 |
| | | New York City, New York, General Obligation Bonds, Series 2018F-1: | | | |
| 6,480 | | 5.000%, 4/01/40 | 4/28 at 100.00 | AA | 7,430,487 |
| 1,420 | | 5.000%, 4/01/43 | 4/28 at 100.00 | AA | 1,617,536 |
| 1,965 | | New York City, New York, General Obligation Bonds, Subseries G-1 Fiscal Series 2012, | 4/22 at 100.00 | AA | 2,147,666 |
| | | 5.000%, 4/01/28 | | | |
| | | New York City, New York, General Obligation Bonds, Tender Option Bond Trust 2016-XG0082: | | | |
| 3,125 | | 14.803%, 3/01/31, 144A (IF) (5) | 3/23 at 100.00 | AA | 4,515,125 |
| 1,525 | | 14.803%, 3/01/31, 144A (IF) (5) | 3/23 at 100.00 | AA | 2,203,381 |
| 720 | | Rochester, New York, General Obligation Bonds, Series 1999, 5.250%, 10/01/19 – NPFG Insured | No Opt. Call | AA– | 735,221 |
| 50,915 | | Total Tax Obligation/General | | | 59,246,624 |
| | | Tax Obligation/Limited – 28.0% (17.7% of Total Investments) | | | |
| 980 | | Dormitory Authority of the State of New York, State Personal Income Tax Revenue Bonds, | 3/21 at 100.00 | AA+ | 1,036,321 |
| | | General Purpose Series 2011C, 5.000%, 3/15/41 | | | |
32
| | | | | | |
Principal | | | Optional Call | | |
Amount (000) | | Description (1) | Provisions (2) | Ratings (3) | Value |
| | | Tax Obligation/Limited (continued) | | | |
| $ 1,000 | | Dormitory Authority of the State of New York, State Personal Income Tax Revenue Bonds, | 2/22 at 100.00 | AA+ | $ 1,082,080 |
| | | General Purpose Series 2012D, 5.000%, 2/15/33 | | | |
| 5,000 | | Dormitory Authority of the State of New York, State Personal Income Tax Revenue Bonds, | 2/23 at 100.00 | AA+ | 5,494,400 |
| | | General Purpose Series 2013A, 5.000%, 2/15/43 | | | |
| 2,080 | | Dormitory Authority of the State of New York, State Personal Income Tax Revenue Bonds, | 3/24 at 100.00 | AA+ | 2,327,104 |
| | | General Purpose Series 2014C. Group C, 5.000%, 3/15/44 | | | |
| 1,000 | | Dormitory Authority of the State of New York, State Sales Tax Revenue Bonds, Series | 9/25 at 100.00 | AA+ | 1,142,680 |
| | | 2015B. Group A,B&C, 5.000%, 3/15/35 | | | |
| 6,000 | | Dormitory Authority of the State of New York, State Sales Tax Revenue Bonds, Series | 9/28 at 100.00 | AA+ | 6,883,080 |
| | | 2018E Group 4, 5.000%, 3/15/44 | | | |
| | | Government of Guam, Business Privilege Tax Bonds, Refunding Series 2015D: | | | |
| 3,225 | | 5.000%, 11/15/28 | 11/25 at 100.00 | BB | 3,542,243 |
| 2,355 | | 5.000%, 11/15/34 | 11/25 at 100.00 | BB | 2,514,999 |
| 3,750 | | Hudson Yards Infrastructure Corporation, New York, Revenue Bonds, Second Indenture | 2/27 at 100.00 | Aa3 | 4,234,725 |
| | | Series 2017A, 5.000%, 2/15/42 | | | |
| | | Hudson Yards Infrastructure Corporation, New York, Revenue Bonds, Series 2011A: | | | |
| 2,550 | | 5.750%, 2/15/47 | 2/21 at 100.00 | AA– | 2,734,569 |
| 1,910 | | 5.250%, 2/15/47 | 2/21 at 100.00 | AA– | 2,021,792 |
| | | Metropolitan Transportation Authority, New York, Dedicated Tax Fund Bonds, Refunding | | | |
| | | Series 2012A: | | | |
| 1,815 | | 5.000%, 11/15/27 | 11/22 at 100.00 | AA | 2,019,296 |
| 2,250 | | 5.000%, 11/15/29 | 11/22 at 100.00 | AA | 2,499,008 |
| 3,500 | | New York City Transitional Finance Authority, New York, Building Aid Revenue Bonds, | 7/28 at 100.00 | AA | 4,050,760 |
| | | Series 2017S-3, 5.000%, 7/15/38 | | | |
| 9,000 | | New York City Transitional Finance Authority, New York, Building Aid Revenue Bonds, | 7/28 at 100.00 | AA | 10,741,590 |
| | | Series 2018S-4A, 5.250%, 7/15/36 | | | |
| 2,000 | | New York City Transitional Finance Authority, New York, Building Aid Revenue Bonds, | 7/28 at 100.00 | AA | 2,275,720 |
| | | Series 2019S-1, 5.000%, 7/15/45 | | | |
| 890 | | New York City Transitional Finance Authority, New York, Building Aid Revenue Bonds, | 7/28 at 100.00 | AA | 1,038,505 |
| | | Series 2019S-3A, 5.000%, 7/15/36 | | | |
| 1,870 | | New York City Transitional Finance Authority, New York, Building Aid Revenue Bonds, | 7/22 at 100.00 | AA | 2,049,034 |
| | | Series 2013S-1, 5.000%, 7/15/31 | | | |
| | | New York City Transitional Finance Authority, New York, Future Tax Secured Bonds, | | | |
| | | Series 2012E-1: | | | |
| 3,775 | | 5.000%, 2/01/37 | 2/22 at 100.00 | AAA | 4,070,922 |
| 3,950 | | 5.000%, 2/01/42 | 2/22 at 100.00 | AAA | 4,248,067 |
| 3,090 | | New York City Transitional Finance Authority, New York, Future Tax Secured Bonds, | 2/23 at 100.00 | AAA | 3,442,940 |
| | | Series 2013F-1, 5.000%, 2/01/29 | | | |
| 7,860 | | New York City Transitional Finance Authority, New York, Future Tax Secured Bonds, | 5/23 at 100.00 | AAA | 8,692,846 |
| | | Series 2013I, 5.000%, 5/01/38 | | | |
| 4,170 | | New York City Transitional Finance Authority, New York, Future Tax Secured Bonds, | 2/24 at 100.00 | AAA | 4,686,371 |
| | | Series 2014D-1, 5.000%, 2/01/35 | | | |
| 5,000 | | New York City Transitional Finance Authority, New York, Future Tax Secured Bonds, | 8/26 at 100.00 | AAA | 5,731,200 |
| | | Series 2017B-1, 5.000%, 8/01/36 | | | |
| 2,825 | | New York City Transitional Finance Authority, New York, Future Tax Secured Revenue | 11/20 at 100.00 | AAA | 2,997,381 |
| | | Bonds, Subordinate Lien Series 2011C, 5.500%, 11/01/35 | | | |
| 2,000 | | New York City Transitional Finance Authority, New York, Future Tax Secured Revenue | 2/21 at 100.00 | AAA | 2,116,300 |
| | | Bonds, Subordinate Series 2011-D1, 5.000%, 2/01/35 | | | |
| 2,400 | | New York City Transitional Finance Authority, New York, Future Tax Secured Revenue | 5/19 at 100.00 | AAA | 2,433,792 |
| | | Bonds, Tender Option Bond Trust 2015-XF0080, 11.310%, 5/01/38, 144A (IF) | | | |
| 6,000 | | New York City, New York, Educational Construction Fund Revenue Bonds, Series 2011A, | 4/21 at 100.00 | AA– | 6,448,080 |
| | | 5.750%, 4/01/41 | | | |
33
| | | | | |
NAN | Nuveen New York Quality Municipal Income Fund | |
| | Portfolio of Investments (continued) | | | |
| | February 28, 2019 | | | |
| |
| |
| |
| |
Principal | | | Optional Call | | |
Amount (000) | | Description (1) | Provisions (2) | Ratings (3) | Value |
| | | Tax Obligation/Limited (continued) | | | |
| $ 11,300 | | New York State Thruway Authority, Highway and Bridge Trust Fund Bonds, Second General, | No Opt. Call | AA+ | $ 11,773,922 |
| | | Series 2005B, 5.500%, 4/01/20 – AMBAC Insured (UB) (5) | | | |
| 2,110 | | New York State Thruway Authority, State Personal Income Tax Revenue Bonds, Series 2010A, | 9/20 at 100.00 | AA+ | 2,215,162 |
| | | 5.000%, 3/15/29 | | | |
| 829 | | Puerto Rico Sales Tax Financing Corporation, Sales Tax Revenue Bonds, Series 2007A, | No Opt. Call | N/R | 695,109 |
| | | 0.000%, 8/01/45 (10) | | | |
| 1,181 | | Puerto Rico Urgent Interest Fund Corp (COFINA), National Custodial Taxable Trust Unit, | No Opt. Call | N/R | 989,939 |
| | | Series 2007A Sr. Bond, 0.000%, 8/01/43 (10) | | | |
| | | Puerto Rico Urgent Interest Fund Corp (COFINA), National Custodial Trust Tax-Exempt Trust | | | |
| | | Unit, Series 2007A Sr. Bond: | | | |
| 3,586 | | 0.000%, 8/01/43 (10) | No Opt. Call | N/R | 3,164,942 |
| 2,518 | | 0.000%, 8/01/45 (10) | No Opt. Call | N/R | 2,222,325 |
| | | Syracuse Industrial Development Authority, New York, PILOT Revenue Bonds, Carousel | | | |
| | | Center Project, Refunding Series 2016A: | | | |
| 2,000 | | 5.000%, 1/01/29 (AMT) | 1/26 at 100.00 | A– | 2,228,040 |
| 1,000 | | 5.000%, 1/01/35 (AMT) | 1/26 at 100.00 | A– | 1,081,120 |
| 116,769 | | Total Tax Obligation/Limited | | | 126,926,364 |
| | | Transportation – 30.1% (19.0% of Total Investments) | | | |
| 7,500 | | Metropolitan Transportation Authority, New York, Transportation Revenue Bonds, Refunding | 11/25 at 100.00 | AA– | 8,511,300 |
| | | Series 2015D-1, 5.000%, 11/15/30 | | | |
| 1,540 | | Metropolitan Transportation Authority, New York, Transportation Revenue Bonds, Series | 11/22 at 100.00 | A1 | 1,651,080 |
| | | 2012E, 5.000%, 11/15/42 | | | |
| 5,425 | | Metropolitan Transportation Authority, New York, Transportation Revenue Bonds, Series | 5/25 at 100.00 | AA– | 5,902,888 |
| | | 2015A-1, 5.000%, 11/15/45 | | | |
| | | Metropolitan Transportation Authority, New York, Transportation Revenue Bonds, | | | |
| | | Series 2016C-1: | | | |
| 2,500 | | 5.000%, 11/15/34 | 11/26 at 100.00 | AA– | 2,832,275 |
| 12,560 | | 5.000%, 11/15/56 | 11/26 at 100.00 | AA– | 13,681,357 |
| | | New York City Industrial Development Agency, New York, Civic Facility Revenue Bonds, | | | |
| | | Bronx Parking Development Company, LLC Project, Series 2007: | | | |
| 200 | | 5.750%, 10/01/37 (6) | 3/19 at 101.00 | N/R | 131,000 |
| 5,500 | | 5.875%, 10/01/46 (6) | 3/19 at 101.00 | N/R | 3,602,500 |
| 2,850 | | New York Liberty Development Corporation, New York, Liberty Revenue Bonds, 4 World Trade | 11/21 at 100.00 | A+ | 3,038,471 |
| | | Center Project, Series 2011, 5.000%, 11/15/44 | | | |
| 1,350 | | New York State Thruway Authority, General Revenue Junior Indebtedness Obligations, | 1/26 at 100.00 | A2 | 1,477,616 |
| | | Series 2016A, 5.000%, 1/01/51 | | | |
| 12,110 | | New York Transportation Development Corporation, New York, Special Facilities Bonds, | 7/24 at 100.00 | BBB | 12,826,912 |
| | | LaGuardia Airport Terminal B Redevelopment Project, Series 2016A, 5.000%, 7/01/46 (AMT) | | | |
| | | New York Transportation Development Corporation, New York, Special Facility Revenue | | | |
| | | Bonds, American Airlines, Inc. John F Kennedy International Airport Project, Refunding | | | |
| | | Series 2016: | | | |
| 1,760 | | 5.000%, 8/01/26 (AMT) | 8/21 at 100.00 | BB | 1,843,864 |
| 11,470 | | 5.000%, 8/01/31 (AMT) | 8/21 at 100.00 | BB | 11,898,863 |
| | | New York Transportation Development Corporation, New York, Special Facility Revenue | | | |
| | | Bonds, Delta Air Lines, Inc. – LaGuardia Airport Terminals C&D Redevelopment Project, | | | |
| | | Series 2018: | | | |
| 3,000 | | 5.000%, 1/01/31 (AMT) | 1/28 at 100.00 | Baa3 | 3,440,700 |
| 8,500 | | 5.000%, 1/01/32 (AMT) | 1/28 at 100.00 | Baa3 | 9,697,480 |
| 8,780 | | Port Authority of New York and New Jersey, Consolidated Revenue Bonds, One Hundred | 5/25 at 100.00 | AA– | 9,824,293 |
| | | Eighty-Ninth Series 2015, 5.000%, 5/01/45 | | | |
| 5,000 | | Port Authority of New York and New Jersey, Consolidated Revenue Bonds, One Hundred Sixty | 1/21 at 100.00 | AA– | 5,250,200 |
| | | Sixth Series 2011, 5.000%, 1/15/41 | | | |
34
| | | | | | |
Principal | | | Optional Call | | |
Amount (000) | | Description (1) | Provisions (2) | Ratings (3) | Value |
| | | Transportation (continued) | | | |
| | | Port Authority of New York and New Jersey, Consolidated Revenue Bonds, Two Hundred | | | |
| | | Eleventh Series 2018: | | | |
| $ 2,330 | | 4.000%, 9/01/43 | 9/28 at 100.00 | AA– | $ 2,429,724 |
| 6,000 | | 5.000%, 9/01/48 (UB) (5) | 9/28 at 100.00 | AA– | 6,900,240 |
| 4,000 | | Port Authority of New York and New Jersey, Consolidated Revenue Bonds, Two Hundred Fifth | 11/27 at 100.00 | AA– | 4,552,760 |
| | | Series 2017, 5.000%, 11/15/47 | | | |
| | | Port Authority of New York and New Jersey, Consolidated Revenue Bonds, Two Hundred | | | |
| | | Series 2017: | | | |
| 4,000 | | 5.000%, 10/15/47 | 4/27 at 100.00 | AA– | 4,520,560 |
| 5,000 | | 5.250%, 10/15/57 | 4/27 at 100.00 | AA– | 5,729,950 |
| | | Port Authority of New York and New Jersey, Special Project Bonds, JFK International Air | | | |
| | | Terminal LLC Project, Eighth Series 2010: | | | |
| 1,020 | | 6.500%, 12/01/28 | 3/19 at 100.00 | BBB+ | 1,064,329 |
| 5,000 | | 6.000%, 12/01/36 | 12/20 at 100.00 | BBB+ | 5,293,450 |
| 3,500 | | Triborough Bridge and Tunnel Authority, New York, General Purpose Revenue Bonds, MTA | 5/27 at 100.00 | AA– | 3,964,695 |
| | | Bridges & Tunnels, Series 2017A, 5.000%, 11/15/47 | | | |
| 5,000 | | Triborough Bridge and Tunnel Authority, New York, General Purpose Revenue Bonds, | 5/26 at 100.00 | AA– | 5,616,400 |
| | | Refunding Series 2016A, 5.000%, 11/15/46 | | | |
| 780 | | Triborough Bridge and Tunnel Authority, New York, General Purpose Revenue Bonds, | No Opt. Call | A+ | 830,310 |
| | | Refunding Subordinate Lien Series 2002E, 5.500%, 11/15/20 – NPFG Insured | | | |
| 126,675 | | Total Transportation | | | 136,513,217 |
| | | U.S. Guaranteed – 14.1% (8.9% of Total Investments) (7) | | | |
| | | Brooklyn Arena Local Development Corporation, New York, Payment in Lieu of Taxes Revenue | | | |
| | | Bonds, Barclays Center Project, Series 2009: | | | |
| 2,950 | | 6.250%, 7/15/40 (Pre-refunded 1/15/20) | 1/20 at 100.00 | AA+ | 3,070,537 |
| 1,000 | | 6.375%, 7/15/43 (Pre-refunded 1/15/20) | 1/20 at 100.00 | AA+ | 1,041,930 |
| 400 | | Canton Capital Resource Corporation, New York, Student Housing Facility Revenue Bonds, | 5/20 at 100.00 | AA | 415,820 |
| | | Grasse River LLC at SUNY Canton Project Series 2010A, 5.000%, 5/01/40 (Pre-refunded 5/01/20) | | | |
| 1,750 | | Dormitory Authority of the State of New York, Revenue Bonds, New School University, | 7/20 at 100.00 | A– | 1,834,788 |
| | | Series 2010, 5.250%, 7/01/30 (Pre-refunded 7/01/20) | | | |
| 1,000 | | Dormitory Authority of the State of New York, Revenue Bonds, North Shore Long Island | 5/21 at 100.00 | A– | 1,072,710 |
| | | Jewish Obligated Group, Series 2011A, 5.000%, 5/01/41 (Pre-refunded 5/01/21) | | | |
| 5,500 | | Dormitory Authority of the State of New York, Revenue Bonds, NYU Hospitals Center, | 7/20 at 100.00 | A– | 5,820,375 |
| | | Series 2011A, 6.000%, 7/01/40 (Pre-refunded 7/01/20) | | | |
| 4,000 | | Guam Government Waterworks Authority, Water and Wastewater System Revenue Bonds, Series | 7/20 at 100.00 | A– | 4,207,960 |
| | | 2010, 5.625%, 7/01/40 (Pre-refunded 7/01/20) | | | |
| 4,445 | | Hempstead Town Local Development Corporation, New York, Revenue Bonds, Molloy College | 7/19 at 100.00 | N/R | 4,506,030 |
| | | Project, Series 2009, 5.750%, 7/01/39 (Pre-refunded 7/01/19) | | | |
| | | Hudson Yards Infrastructure Corporation, New York, Revenue Bonds, Senior Fiscal 2012 | | | |
| | | Series 2011A: | | | |
| 4,150 | | 5.750%, 2/15/47 (Pre-refunded 2/15/21) | 2/21 at 100.00 | Aa3 | 4,483,867 |
| 90 | | 5.250%, 2/15/47 (Pre-refunded 2/15/21) | 2/21 at 100.00 | Aa3 | 96,380 |
| 8,265 | | Long Island Power Authority, New York, Electric System Revenue Bonds, Series 2011A, | 5/21 at 100.00 | A– | 8,865,948 |
| | | 5.000%, 5/01/38 (Pre-refunded 5/01/21) | | | |
| | | Metropolitan Transportation Authority, New York, Transportation Revenue Bonds, | | | |
| | | Series 2010D: | | | |
| 4,000 | | 5.000%, 11/15/34 (Pre-refunded 11/15/20) | 11/20 at 100.00 | AA– | 4,234,360 |
| 1,560 | | 5.250%, 11/15/40 (Pre-refunded 11/15/20) | 11/20 at 100.00 | AA– | 1,657,906 |
| 5,100 | | Metropolitan Transportation Authority, New York, Transportation Revenue Bonds, Series | 11/22 at 100.00 | A1 | 5,731,686 |
| | | 2012E, 5.000%, 11/15/42 (Pre-refunded 11/15/22) | | | |
| 2,000 | | Metropolitan Transportation Authority, New York, Transportation Revenue Bonds, Series | 11/23 at 100.00 | AA– | 2,309,420 |
| | | 2013E, 5.000%, 11/15/31 (Pre-refunded 11/15/23) | | | |
35
| | | | | |
NAN | Nuveen New York Quality Municipal Income Fund | |
| | Portfolio of Investments (continued) | | | |
| | February 28, 2019 | | | |
| |
| |
| |
Principal | | | Optional Call | | |
Amount (000) | | Description (1) | Provisions (2) | Ratings (3) | Value |
| | | U.S. Guaranteed (7) (continued) | | | |
| $ 2,175 | | New York City Transitional Finance Authority, New York, Future Tax Secured Revenue | 11/20 at 100.00 | N/R | $ 2,315,440 |
| | | Bonds, Subordinate Lien Series 2011C, 5.500%, 11/01/35 (Pre-refunded 11/01/20) | | | |
| 1,810 | | New York City, New York, General Obligation Bonds, Subseries G-1 Fiscal Series 2012, | 4/22 at 100.00 | N/R | 1,993,335 |
| | | 5.000%, 4/01/28 (Pre-refunded 4/01/22) | | | |
| 470 | | Suffolk County Economic Development Corporation, New York, Revenue Bonds, Catholic | 7/21 at 100.00 | N/R | 506,204 |
| | | Health Services of Long Island Obligated Group Project, Refunding Series 2011, 5.000%, | | | |
| | | 7/01/28 (Pre-refunded 7/01/21) | | | |
| 560 | | Triborough Bridge and Tunnel Authority, New York, General Purpose Revenue Bonds, Series | No Opt. Call | AA+ | 576,139 |
| | | 1993B, 5.000%, 1/01/20 (ETM) | | | |
| 7,500 | | Triborough Bridge and Tunnel Authority, New York, General Purpose Revenue Bonds, Series | 1/22 at 100.00 | AA+ | 8,163,750 |
| | | 1999B, 5.500%, 1/01/30 (Pre-refunded 1/01/22) | | | |
| 1,000 | | Yonkers Industrial Development Agency, New York, Civic Facility Revenue Bonds, Sarah | 6/19 at 100.00 | BBB | 1,010,710 |
| | | Lawrence College Project, Series 2001A Remarketed, 6.000%, 6/01/41 (Pre-refunded 6/01/19) | | | |
| 59,725 | | Total U.S. Guaranteed | | | 63,915,295 |
| | | Utilities – 9.6% (6.1% of Total Investments) | | | |
| 3,500 | | Chautauqua County Industrial Development Agency, New York, Exempt Facility Revenue | 2/20 at 100.00 | BBB– | 3,597,020 |
| | | Bonds, NRG Dunkirk Power Project, Series 2009, 5.875%, 4/01/42 | | | |
| 370 | | Guam Power Authority, Revenue Bonds, Series 2012A, 5.000%, 10/01/34 | 10/22 at 100.00 | BBB | 388,208 |
| 1,460 | | Long Island Power Authority, New York, Electric System General Revenue Bonds, Series | 9/24 at 100.00 | A– | 1,609,577 |
| | | 2014A, 5.000%, 9/01/44 | | | |
| 1,590 | | Long Island Power Authority, New York, Electric System General Revenue Bonds, Series | 9/27 at 100.00 | A– | 1,781,690 |
| | | 2017, 5.000%, 9/01/47 | | | |
| 1,250 | | Long Island Power Authority, New York, Electric System Revenue Bonds, Series 2012A, | 9/22 at 100.00 | A– | 1,354,200 |
| | | 5.000%, 9/01/37 | | | |
| 1,920 | | Niagara Area Development Corporation, New York, Solid Waste Disposal Facility Revenue | 7/23 at 100.00 | B1 | 1,906,387 |
| | | Refunding Bonds, Covanta Energy Project, Series 2018A, 4.750%, 11/01/42 (AMT), 144A | | | |
| 2,435 | | Suffolk County Industrial Development Agency, New York, Revenue Bonds, Nissequogue | 3/19 at 100.00 | N/R | 2,435,536 |
| | | Cogeneration Partners Facility, Series 1998, 5.500%, 1/01/23 (AMT) | | | |
| 3,785 | | Utility Debt Securitization Authority, New York, Restructuring Bonds, Refunding Series | 12/25 at 100.00 | AAA | 4,340,222 |
| | | 2015, 5.000%, 12/15/37 | | | |
| | | Utility Debt Securitization Authority, New York, Restructuring Bonds, Series 2013TE: | | | |
| 3,800 | | 5.000%, 12/15/33 | 12/23 at 100.00 | AAA | 4,295,178 |
| 1,060 | | 5.000%, 12/15/34 | 12/23 at 100.00 | AAA | 1,196,591 |
| 8,030 | | 5.000%, 12/15/41 | 12/23 at 100.00 | AAA | 8,994,885 |
| 1,515 | | Utility Debt Securitization Authority, New York, Restructuring Bonds, Series 2016A, | 6/26 at 100.00 | AAA | 1,751,310 |
| | | 5.000%, 12/15/35 | | | |
| | | Utility Debt Securitization Authority, New York, Restructuring Bonds, Series 2017: | | | |
| 4,500 | | 5.000%, 12/15/38 | 12/27 at 100.00 | AAA | 5,241,330 |
| 4,000 | | 5.000%, 12/15/39 | 12/27 at 100.00 | AAA | 4,643,960 |
| 39,215 | | Total Utilities | | | 43,536,094 |
| | | Water and Sewer – 14.9% (9.4% of Total Investments) | | | |
| 4,140 | | New York City Municipal Water Finance Authority, New York, Water and Sewer System | 12/21 at 100.00 | AA+ | 4,443,793 |
| | | Revenue Bonds, Second Generation Resolution, Series 2012BB, 5.000%, 6/15/44 | | | |
| 5,000 | | New York City Municipal Water Finance Authority, New York, Water and Sewer System Second | 6/24 at 100.00 | AA+ | 5,651,400 |
| | | General Resolution Revenue Bonds, Series 2014DD, 5.000%, 6/15/35 | | | |
| 10,000 | | New York City Municipal Water Finance Authority, New York, Water and Sewer System Second | 12/27 at 100.00 | AA+ | 11,355,000 |
| | | General Resolution Revenue Bonds, Series 2018DD1, 5.000%, 6/15/48 (UB) | | | |
| 9,285 | | New York City Municipal Water Finance Authority, New York, Water and Sewer System Second | 12/27 at 100.00 | AA+ | 10,680,071 |
| | | General Resolution Revenue Bonds, Series 2018EE, 5.000%, 6/15/40 (UB) | | | |
| 9,750 | | New York State Environmental Facilities Corporation, State Clean Water and Drinking | 6/21 at 100.00 | AAA | 10,383,653 |
| | | Water Revolving Funds Revenue Bonds, New York City Municipal Water Finance Authority | | | |
| | | Projects, Second Resolution Series 2011B, 5.000%, 6/15/41 | | | |
36
| | | | | | |
Principal | | | Optional Call | | |
Amount (000) | | Description (1) | Provisions (2) | Ratings (3) | Value |
| | | Water and Sewer (continued) | | | |
| $ 1,000 | | New York State Environmental Facilities Corporation, State Clean Water and Drinking | 6/25 at 100.00 | AAA | $ 1,137,270 |
| | | Water Revolving Funds Revenue Bonds, New York City Municipal Water Finance Authority | | | |
| | | Projects, Second Resolution Subordinated SRF Series 2015A, 5.000%, 6/15/40 | | | |
| | | New York State Environmental Facilities Corporation, State Clean Water and Drinking | | | |
| | | Water Revolving Funds Revenue Bonds, New York City Municipal Water Finance Authority | | | |
| | | Projects-Second Resolution Bonds, Subordinated SRF Series 2017E: | | | |
| 5,590 | | 5.000%, 6/15/42 | 6/27 at 100.00 | AAA | 6,396,134 |
| 400 | | 5.000%, 6/15/47 | 6/27 at 100.00 | AAA | 454,988 |
| | | New York State Environmental Facilities Corporation, State Clean Water and Drinking | | | |
| | | Water Revolving Funds Revenue Bonds, New York City Municipal Water Finance Authority | | | |
| | | Projects-Second Resolution Bonds, Subordinated SRF Series 2018B: | | | |
| 7,500 | | 5.000%, 6/15/43 | 6/28 at 100.00 | AAA | 8,678,400 |
| 3,680 | | 5.000%, 6/15/48 | 6/28 at 100.00 | AAA | 4,234,907 |
| 3,840 | | New York State Environmental Facilities Corporation, State Revolving Funds Revenue | 4/20 at 100.00 | AAA | 3,975,629 |
| | | Bonds, 2010 Master Financing Program, Series 2010C, 5.000%, 10/15/35 | | | |
| 60,185 | | Total Water and Sewer | | | 67,391,245 |
| $ 661,674 | | Total Long-Term Investments (cost $687,290,933) | | | 717,398,487 |
| | | Floating Rate Obligations – (7.6)% | | | (34,300,000) |
| | | Adjustable Rate MuniFund Term Preferred Shares, net of deferred offering costs – (32.4)% (8) | | | (146,818,962) |
| | | Variable Rate Demand Preferred Shares, net of deferred offering costs – (19.4)% (9) | | | (88,045,718) |
| | | Other Assets Less Liabilities – 1.1% | | | 4,946,431 |
| | | Net Asset Applicable to Common Shares – 100% | | | $ 453,180,238 |
| | |
| (1) | All percentages shown in the Portfolio of Investments are based on net assets applicable to common shares unless otherwise noted. |
| (2) | Optional Call Provisions: Dates (month and year) and prices of the earliest optional call or redemption. There may be other call provisions at varying prices at later dates. Certain mortgage-backed securities may be subject to periodic principal paydowns. Optional Call Provisions are not covered by the report of independent registered public accounting firm. |
| (3) | For financial reporting purposes, the ratings disclosed are the highest of Standard & Poor's Group ("Standard & Poor's"), Moody's Investors Service, Inc. ("Moody's") or Fitch, Inc. ("Fitch") rating. This treatment of split-rated securities may differ from that used for other purposes, such as for Fund investment policies. Ratings below BBB by Standard & Poor's, Baa by Moody's or BBB by Fitch are considered to be below investment grade. Holdings designated N/R are not rated by any of these national rating agencies. Ratings are not covered by the report of independent registered public accounting firm. |
| (4) | Step-up coupon bond, a bond with a coupon that increases ("steps up"), usually at regular intervals, while the bond is outstanding. The rate shown is the coupon as of the end of the reporting period. |
| (5) | Investment, or portion of investment, has been pledged to collateralize the net payment obligations for investments in inverse floating rate transactions. |
| (6) | As of, or subsequent to, the end of the reporting period, this security is non-income producing. Non-income producing, in the case of a fixed-income security, generally denotes that the issuer has (1) defaulted on the payment of principal or interest, (2) is under the protection of the Federal Bankruptcy Court or (3) the Fund's Adviser has concluded that the issue is not likely to meet its future interest payment obligations and has ceased accruing additional income on the Fund's records. |
| (7) | Backed by an escrow or trust containing sufficient U.S. Government or U.S. Government agency securities, which ensure the timely payment of principal and interest. |
| (8) | Adjustable Rate MuniFund Term Preferred Shares, net of deferred offering costs as a percentage of Total Investments is 20.5%. |
| (9) | Variable Rate Demand Preferred Shares, net of deferred offering costs as a percentage of Total Investments is 12.3%. |
| (10) | Effective February 12, 2019, the par value of the original bonds was replaced with taxable and tax exempt Puerto Rico Sales Tax Financing Corporation (commonly known as COFINA) bond units that are collateralized by a bundle of zero and coupon paying bonds. The quantity shown represents units in a trust, which were assigned according to the original bond's accreted value. These securities do not have a stated coupon interest rate and income will be recognized through accretion of the discount associated with the trust units. The factor at which these units accrete can also decrease, primarily for principal payments generated from coupon payments received or dispositions of the underlying bond collateral. The quantity of units will not change as a result of these principal payments. |
| 144A | Investment is exempt from registration under Rule 144A of the Securities Act of 1933, as amended. These investments may only be resold in transactions exempt from registration, which are normally those transactions with qualified institutional buyers. |
| AMT | Alternative Minimum Tax |
| ETM | Escrowed to maturity. |
| IF | Inverse floating rate security issued by a tender option bond ("TOB") trust, the interest rate on which varies inversely with the Securities Industry Financial Markets Association (SIFMA) short-term rate, which resets weekly, or a similar short-term rate, and is reduced by the expenses related to the TOB trust. |
| UB | Underlying bond of an inverse floating rate trust reflected as a financing transaction. See Notes to Financial Statements, Note 3 - Portfolio Securities and Investments in Derivatives. Inverse Floating Rate Securities for more information. |
| | See accompanying notes to financial statements. |
37
| | |
| NRK | Nuveen New York AMT-Free Quality Municipal Income Fund Portfolio of Investments February 28, 2019 |
| | | | | | |
Principal | | | Optional Call | | |
Amount (000) | | Description (1) | Provisions (2) | Ratings (3) | Value |
| | | LONG-TERM INVESTMENTS – 161.4% (100.0% of Total Investments) | | | |
| | | MUNICIPAL BONDS – 161.4% (100.0% of Total Investments) | | | |
| | | Consumer Staples – 10.3% (6.4% of Total Investments) | | | |
| $ 8,000 | | Erie County Tobacco Asset Securitization Corporation, New York, Tobacco Settlement | 3/19 at 19.57 | N/R | $ 1,056,080 |
| | | Asset-Backed Bonds, 1st Subordinate Series 2005B, 0.000%, 6/01/47 | | | |
| | | Erie County Tobacco Asset Securitization Corporation, New York, Tobacco Settlement | | | |
| | | Asset-Backed Bonds, Series 2005A: | | | |
| 27,580 | | 5.000%, 6/01/38 | 3/19 at 100.00 | BB+ | 27,578,345 |
| 13,500 | | 5.000%, 6/01/45 | 3/19 at 100.00 | B+ | 13,210,290 |
| 10,000 | | Erie County Tobacco Asset Securitization Corporation, New York, Tobacco Settlement | 3/19 at 14.14 | N/R | 907,600 |
| | | Asset-Backed Bonds, Series 2005C, 0.000%, 6/01/50 | | | |
| 1,310 | | Nassau County Tobacco Settlement Corporation, New York, Tobacco Settlement Asset-Backed | 2/19 at 100.00 | B– | 1,310,210 |
| | | Bonds, Refunding Series 2006A-2, 5.250%, 6/01/26 | | | |
| 26,865 | | Nassau County Tobacco Settlement Corporation, New York, Tobacco Settlement Asset-Backed | 3/19 at 100.00 | B– | 26,077,856 |
| | | Bonds, Series 2006A-3, 5.000%, 6/01/35 | | | |
| 4,680 | | New York Counties Tobacco Trust VI, New York, Tobacco Settlement Pass-Through Bonds, | 6/26 at 100.00 | N/R | 4,747,766 |
| | | Turbo Term Series 2016A. Including 2016A-1, 2016A-2A and 2016A-2B, 5.000%, 6/01/51 | | | |
| | | TSASC Inc., New York, Tobacco Asset-Backed Bonds, Series 2006: | | | |
| 4,135 | | 5.000%, 6/01/45 | 6/27 at 100.00 | B+ | 3,997,139 |
| 49,715 | | 5.000%, 6/01/48 | 6/27 at 100.00 | N/R | 47,788,544 |
| 145,785 | | Total Consumer Staples | | | 126,673,830 |
| | | Education and Civic Organizations – 28.7% (17.8% of Total Investments) | | | |
| 3,150 | | Brooklyn Arena Local Development Corporation, New York, Payment in Lieu of Taxes Revenue | 1/27 at 100.00 | BBB– | 3,389,116 |
| | | Bonds, Barclays Center Project, Refunding Series 2016A, 5.000%, 7/15/42 | | | |
| | | Brooklyn Arena Local Development Corporation, New York, Payment in Lieu of Taxes Revenue | | | |
| | | Bonds, Barclays Center Project, Series 2009: | | | |
| 9,995 | | 0.000%, 7/15/45 | No Opt. Call | BBB– | 2,923,338 |
| 29,145 | | 0.000%, 7/15/47 | No Opt. Call | BBB– | 7,990,102 |
| | | Build New York City Resource Corporation, New York, Revenue Bonds, Bronx Charter School | | | |
| | | for Excellence, Series 2013A: | | | |
| 250 | | 5.000%, 4/01/33 | 4/23 at 100.00 | BBB– | 260,070 |
| 2,535 | | 5.500%, 4/01/43 | 4/23 at 100.00 | BBB– | 2,654,272 |
| | | Build New York City Resource Corporation, New York, Revenue Bonds, Metropolitan College | | | |
| | | of New York, Series 2014: | | | |
| 1,000 | | 5.250%, 11/01/29 | 11/24 at 100.00 | BB | 1,036,030 |
| 5,705 | | 5.250%, 11/01/34 | 11/24 at 100.00 | BB | 5,824,862 |
| 1,500 | | 5.000%, 11/01/39 | 11/24 at 100.00 | BB | 1,486,545 |
| | | Build New York City Resource Corporation, New York, Revenue Bonds, South Bronx Charter | | | |
| | | School for International Cultures and the Arts Project, Series 2013A: | | | |
| 2,690 | | 5.000%, 4/15/33 | 4/23 at 100.00 | BB+ | 2,753,054 |
| 4,090 | | 5.000%, 4/15/43 | 4/23 at 100.00 | BB+ | 4,153,559 |
| 3,655 | | Dobbs Ferry Local Development Corporation, New York, Revenue Bonds, Mercy College | 7/24 at 100.00 | A | 4,015,237 |
| | | Project, Series 2014, 5.000%, 7/01/44 | | | |
| 4,990 | | Dormitory Authority of the State of New York, General Revenue Bonds, Saint Johns | 7/23 at 100.00 | A– | 5,437,952 |
| | | University, Series 2013A, 5.000%, 7/01/44 | | | |
| 1,655 | | Dormitory Authority of the State of New York, General Revenue Bonds, Saint Johns | 7/25 at 100.00 | A– | 1,874,138 |
| | | University, Series 2015A, 5.000%, 7/01/37 | | | |
| 4,265 | | Dormitory Authority of the State of New York, Housing Revenue Bonds, Fashion Institute | No Opt. Call | Baa2 | 5,091,728 |
| | | of Technology, Series 2007, 5.250%, 7/01/34 – FGIC Insured | | | |
38
| | | | | | |
Principal | | | Optional Call | | |
Amount (000) | | Description (1) | Provisions (2) | Ratings (3) | Value |
| | | Education and Civic Organizations (continued) | | | |
| $ 6,000 | | Dormitory Authority of the State of New York, Insured Revenue Bonds, Mount Sinai School | No Opt. Call | A– | $ 6,755,040 |
| | | of Medicine, Series 1994A, 5.150%, 7/01/24 – NPFG Insured | | | |
| | | Dormitory Authority of the State of New York, Insured Revenue Bonds, Touro College and | | | |
| | | University System, Series 2014A: | | | |
| 1,685 | | 5.250%, 1/01/34 | 7/24 at 100.00 | BBB– | 1,827,045 |
| 2,185 | | 5.500%, 1/01/39 | 7/24 at 100.00 | BBB– | 2,367,906 |
| 2,820 | | 5.500%, 1/01/44 | 7/24 at 100.00 | BBB– | 3,040,524 |
| 14,585 | | Dormitory Authority of the State of New York, Lease Revenue Bonds, State University | 7/23 at 100.00 | Aa3 | 16,419,939 |
| | | Dormitory Facilities, Refunding Series 2013A, 5.000%, 7/01/27 | | | |
| 4,750 | | Dormitory Authority of the State of New York, Lease Revenue Bonds, State University | 7/21 at 100.00 | Aa2 | 5,061,220 |
| | | Dormitory Facilities, Series 2011A, 5.000%, 7/01/41 | | | |
| 3,750 | | Dormitory Authority of the State of New York, Lease Revenue Bonds, State University | 7/22 at 100.00 | Aa2 | 4,071,075 |
| | | Dormitory Facilities, Series 2012A, 5.000%, 7/01/37 | | | |
| | | Dormitory Authority of the State of New York, Lease Revenue Bonds, State University | | | |
| | | Dormitory Facilities, Series 2015A: | | | |
| 3,095 | | 5.000%, 7/01/31 | 7/25 at 100.00 | Aa3 | 3,565,007 |
| 3,465 | | 5.000%, 7/01/33 | 7/25 at 100.00 | Aa3 | 3,962,782 |
| | | Dormitory Authority of the State of New York, Lease Revenue Bonds, State University | | | |
| | | Dormitory Facilities, Series 2017A: | | | |
| 2,930 | | 5.000%, 7/01/34 | 7/27 at 100.00 | Aa3 | 3,408,293 |
| 1,625 | | 5.000%, 7/01/46 | 7/27 at 100.00 | Aa3 | 1,835,714 |
| | | Dormitory Authority of the State of New York, Revenue Bonds, Barnard College, | | | |
| | | Series 2007A: | | | |
| 405 | | 5.000%, 7/01/25 – FGIC Insured | 3/19 at 100.00 | Baa2 | 406,110 |
| 1,320 | | 5.000%, 7/01/37 – NPFG Insured | 3/19 at 100.00 | Baa2 | 1,323,551 |
| | | Dormitory Authority of the State of New York, Revenue Bonds, Convent of the Sacred | | | |
| | | Heart, Series 2011: | | | |
| 1,000 | | 5.625%, 11/01/35 – AGM Insured | 5/21 at 100.00 | AA | 1,076,060 |
| 5,980 | | 5.750%, 11/01/40 – AGM Insured | 5/21 at 100.00 | AA | 6,445,244 |
| 12,970 | | Dormitory Authority of the State of New York, Revenue Bonds, Icahn School of Medicine at | 7/25 at 100.00 | A– | 14,353,380 |
| | | Mount Sinai, Refunding Series 2015A, 5.000%, 7/01/40 | | | |
| 1,000 | | Dormitory Authority of the State of New York, Revenue Bonds, Marymount Manhattan | 7/19 at 100.00 | Baa2 | 1,009,930 |
| | | College, Series 2009, 5.250%, 7/01/29 | | | |
| | | Dormitory Authority of the State of New York, Revenue Bonds, New York University, | | | |
| | | Series 2001-1: | | | |
| 1,500 | | 5.500%, 7/01/24 – AMBAC Insured | No Opt. Call | Aa2 | 1,788,690 |
| 4,000 | | 5.500%, 7/01/40 – AMBAC Insured | No Opt. Call | Aa2 | 5,197,640 |
| | | Dormitory Authority of the State of New York, Revenue Bonds, New York University, | | | |
| | | Series 2015A: | | | |
| 9,000 | | 5.000%, 7/01/34 | 7/25 at 100.00 | Aa2 | 10,355,400 |
| 8,955 | | 5.000%, 7/01/45 | 7/25 at 100.00 | Aa2 | 10,135,179 |
| 10,850 | | Dormitory Authority of the State of New York, Revenue Bonds, New York University, Series | 7/26 at 100.00 | Aa2 | 12,647,736 |
| | | 2016A, 5.000%, 7/01/32 | | | |
| | | Dormitory Authority of the State of New York, Revenue Bonds, New York University, | | | |
| | | Series 2017A: | | | |
| 4,000 | | 5.000%, 7/01/38 | 7/27 at 100.00 | Aa2 | 4,619,520 |
| 5,620 | | 5.000%, 7/01/39 | 7/27 at 100.00 | Aa2 | 6,460,921 |
| 11,175 | | Dormitory Authority of the State of New York, Revenue Bonds, New York University, Series | 7/28 at 100.00 | Aa2 | 12,817,948 |
| | | 2018A, 5.000%, 7/01/48 | | | |
| 5,000 | | Dormitory Authority of the State of New York, Revenue Bonds, New York University, Series | 7/29 at 100.00 | Aa2 | 5,843,700 |
| | | 2019A, 5.000%, 7/01/42 | | | |
| 2,800 | | Dormitory Authority of the State of New York, Revenue Bonds, Non State Supported Debt, | 7/20 at 100.00 | Aa1 | 2,911,664 |
| | | Cornell University, Series 2008C, 5.000%, 7/01/37 | | | |
39
| | | | | |
NRK | Nuveen New York AMT-Free Quality | | |
| | Municipal Income Fund | | | |
| | Portfolio of Investments (continued) | | | |
| | February 28, 2019 | | | |
| |
| |
Principal | | | Optional Call | | |
Amount (000) | | Description (1) | Provisions (2) | Ratings (3) | Value |
| | | Education and Civic Organizations (continued) | | | |
| | | Dormitory Authority of the State of New York, Revenue Bonds, Non State Supported Debt, | | | |
| | | Cornell University, Series 2010A: | | | |
| $ 5,000 | | 5.000%, 7/01/35 | 7/20 at 100.00 | Aa1 | $ 5,202,750 |
| 11,560 | | 5.000%, 7/01/40 | 7/20 at 100.00 | Aa1 | 12,016,389 |
| | | Dormitory Authority of the State of New York, Revenue Bonds, Pratt Institute, | | | |
| | | Series 2015A: | | | |
| 800 | | 5.000%, 7/01/39 | 7/24 at 100.00 | A2 | 887,584 |
| 1,500 | | 5.000%, 7/01/44 | 7/24 at 100.00 | A2 | 1,656,405 |
| | | Dormitory Authority of the State of New York, Revenue Bonds, Rochester Institute of | | | |
| | | Technology, Series 2006A: | | | |
| 2,500 | | 5.250%, 7/01/20 – AMBAC Insured | No Opt. Call | A1 | 2,617,750 |
| 2,000 | | 5.250%, 7/01/21 – AMBAC Insured | No Opt. Call | A1 | 2,163,200 |
| | | Dormitory Authority of the State of New York, Revenue Bonds, Saint Joseph's College, | | | |
| | | Series 2010: | | | |
| 1,815 | | 5.250%, 7/01/25 | 3/19 at 100.00 | Ba1 | 1,818,485 |
| 2,000 | | 5.250%, 7/01/35 | 7/20 at 100.00 | Ba1 | 2,031,880 |
| 8,925 | | Dormitory Authority of the State of New York, Revenue Bonds, Vaughn College of | 12/26 at 100.00 | BB– | 9,383,209 |
| | | Aeronautics & Technology, Series 2016A, 5.500%, 12/01/36, 144A | | | |
| 1,000 | | Dutchess County Local Development Corporation, New York, Revenue Bonds, Marist College | 7/23 at 100.00 | A2 | 1,099,190 |
| | | Project, Series 2013A, 5.000%, 7/01/39 | | | |
| 7,695 | | Glen Cove Local Economic Assistance Corporation, New York, Revenue Bonds, Garvies Point | 1/34 at 100.00 | N/R | 6,319,750 |
| | | Public Improvement Project, Capital Appreciation Series 2016C, 0.000%, 1/01/55 (4) | | | |
| | | Hempstead Town Local Development Corporation, New York, Revenue Bonds, Adelphi | | | |
| | | University Project, Series 2013: | | | |
| 1,785 | | 5.000%, 9/01/38 | 9/23 at 100.00 | A– | 1,966,981 |
| 1,785 | | 5.000%, 9/01/43 | 9/23 at 100.00 | A– | 1,957,449 |
| 1,400 | | Monroe County Industrial Development Corporation, New York, Revenue Bonds, Saint John | 6/24 at 100.00 | A– | 1,603,756 |
| | | Fisher College, Series 2014A, 5.500%, 6/01/39 | | | |
| 1,220 | | New Rochelle Corporation, New York, Local Development Revenue Bonds, Iona College | 7/25 at 100.00 | BBB | 1,328,202 |
| | | Project, Series 2015A, 5.000%, 7/01/45 | | | |
| | | New York City Industrial Development Agency, New York, Payment in Lieu of Taxes Revenue | | | |
| | | Bonds, Queens Baseball Stadium Project, Series 2009: | | | |
| 1,000 | | 6.125%, 1/01/29 – AGC Insured | 3/19 at 100.00 | AA | 1,003,370 |
| 1,000 | | 6.375%, 1/01/39 – AGC Insured | 3/19 at 100.00 | AA | 1,003,340 |
| | | New York City Industrial Development Agency, New York, PILOT Revenue Bonds, Queens | | | |
| | | Baseball Stadium Project, Series 2006: | | | |
| 6,815 | | 5.000%, 1/01/31 – AMBAC Insured | 3/19 at 100.00 | BBB | 6,833,673 |
| 5,000 | | 5.000%, 1/01/36 – AMBAC Insured | 3/19 at 100.00 | BBB | 5,013,150 |
| 1,030 | | 4.750%, 1/01/42 – AMBAC Insured | 3/19 at 100.00 | BBB | 1,030,690 |
| 14,500 | | 5.000%, 1/01/46 – AMBAC Insured | 3/19 at 100.00 | BBB | 14,696,040 |
| 4,730 | | New York City Industrial Development Agency, New York, Revenue Bonds, Yankee Stadium | 3/19 at 100.00 | AA | 4,751,900 |
| | | Project PILOT, Series 2009A, 7.000%, 3/01/49 – AGC Insured | | | |
| | | New York City Industrial Development Authority, New York, PILOT Revenue Bonds, Yankee | | | |
| | | Stadium Project, Series 2006: | | | |
| 4,280 | | 5.000%, 3/01/31 – FGIC Insured | 3/19 at 100.00 | Baa1 | 4,310,559 |
| 31,650 | | 5.000%, 3/01/36 – NPFG Insured | 3/19 at 100.00 | Baa1 | 31,709,185 |
| 20,210 | | 4.500%, 3/01/39 – FGIC Insured | 3/19 at 100.00 | Baa1 | 20,226,976 |
| 3,400 | | New York City Trust for Cultural Resources, New York, Revenue Bonds, Whitney Museum of | 1/21 at 100.00 | AA | 3,594,276 |
| | | American Art, Series 2011, 5.000%, 7/01/31 | | | |
| | | Niagara Area Development Corporation, New York, Niagara University Project, | | | |
| | | Series 2012A: | | | |
| 600 | | 5.000%, 5/01/35 | 5/22 at 100.00 | BBB+ | 643,470 |
| 1,000 | | 5.000%, 5/01/42 | 5/22 at 100.00 | BBB+ | 1,060,900 |
40
| | | | | | |
Principal | | | Optional Call | | |
Amount (000) | | Description (1) | Provisions (2) | Ratings (3) | Value |
| | | Education and Civic Organizations (continued) | | | |
| $ 1,450 | | Onondaga Civic Development Corporation, New York, Revenue Bonds, Le Moyne College | 7/22 at 100.00 | Baa2 | $ 1,512,118 |
| | | Project, Series 2012, 5.000%, 7/01/42 | | | |
| 1,000 | | Onongada County Trust For Cultural Resources, New York, Revenue Bonds, Syracuse | 12/21 at 100.00 | AA– | 1,077,660 |
| | | University Project, Series 2011, 5.000%, 12/01/36 | | | |
| 3,700 | | Troy Capital Resource Corporation, New York, Revenue Bonds, Rensselaer Polytechnic | 9/20 at 100.00 | A3 | 3,856,473 |
| | | Institute, Series 2010A, 5.125%, 9/01/40 | | | |
| 359,440 | | Total Education and Civic Organizations | | | 352,973,981 |
| | | Financials – 1.6% (1.0% of Total Investments) | | | |
| 1,615 | | Liberty Development Corporation, New York, Goldman Sachs Headquarter Revenue Bonds, | No Opt. Call | A | 1,984,415 |
| | | Series 2005, 5.250%, 10/01/35 | | | |
| 13,835 | | Liberty Development Corporation, New York, Goldman Sachs Headquarters Revenue Bonds | No Opt. Call | A | 17,532,681 |
| | | Series 2007, 5.500%, 10/01/37 | | | |
| 15,450 | | Total Financials | | | 19,517,096 |
| | | Health Care – 3.2% (2.0% of Total Investments) | | | |
| 1,250 | | Build New York City Resource Corporation, New York, Revenue Bonds, New York Methodist | 7/24 at 100.00 | A | 1,408,912 |
| | | Hospital Project, Refunding Series 2014, 5.000%, 7/01/27 | | | |
| | | Dormitory Authority of the State of New York, Revenue Bonds, Orange Regional Medical | | | |
| | | Center Obligated Group, Series 2017: | | | |
| 1,000 | | 5.000%, 12/01/34, 144A | 6/27 at 100.00 | BBB– | 1,115,540 |
| 300 | | 5.000%, 12/01/36, 144A | 6/27 at 100.00 | BBB– | 331,929 |
| 900 | | Dutchess County Local Development Corporation, New York, Revenue Bonds, Health Quest | 7/20 at 100.00 | A– | 950,526 |
| | | Systems Inc, Series 2010A, 5.750%, 7/01/40 | | | |
| | | Dutchess County Local Development Corporation, New York, Revenue Bonds, Health Quest | | | |
| | | Systems, Inc. Project, Series 2016B: | | | |
| 2,000 | | 4.000%, 7/01/41 | 7/26 at 100.00 | A– | 2,010,060 |
| 7,940 | | 5.000%, 7/01/46 | 7/26 at 100.00 | A– | 8,697,000 |
| 1,875 | | Monroe County Industrial Development Corporation, New York, FHA Insured Mortgage Revenue | 2/21 at 100.00 | AA | 2,023,069 |
| | | Bonds, Unity Hospital of Rochester Project, Series 2010, 5.750%, 8/15/35 | | | |
| 3,900 | | Monroe County Industrial Development Corporation, New York, Revenue Bonds, Rochester | 12/22 at 100.00 | A– | 4,190,121 |
| | | General Hospital Project, Series 2013A, 5.000%, 12/01/42 | | | |
| 2,800 | | Monroe County Industrial Development Corporation, New York, Revenue Bonds, Rochester | 12/26 at 100.00 | A– | 3,071,152 |
| | | General Hospital Project, Series 2017, 5.000%, 12/01/46 | | | |
| 5,585 | | Suffolk County Economic Development Corporation, New York, Revenue Bonds, Catholic | 7/21 at 100.00 | A– | 5,952,214 |
| | | Health Services of Long Island Obligated Group Project, Refunding Series 2011, 5.000%, 7/01/28 | | | |
| 565 | | Westchester County Health Care Corporation, New York, Senior Lien Revenue Bonds, Series | 11/20 at 100.00 | Baa2 | 598,798 |
| | | 2010-C2, 6.125%, 11/01/37 | | | |
| 2,260 | | Westchester County Local Development Corporation, New York, Revenue Bonds, Westchester | 11/25 at 100.00 | Baa2 | 2,421,387 |
| | | Medical Center Obligated Group Project, Refunding Series 2016, 5.000%, 11/01/46 | | | |
| 5,275 | | Yonkers Industrial Development Agency, New York, Revenue Bonds, St. John's Riverside | 3/19 at 100.00 | B– | 5,277,004 |
| | | Hospital, Series 2001A, 7.125%, 7/01/31 | | | |
| 1,870 | | Yonkers Industrial Development Agency, New York, Revenue Bonds, St. John's Riverside | 3/19 at 100.00 | B– | 1,870,711 |
| | | Hospital, Series 2001B, 7.125%, 7/01/31 | | | |
| 37,520 | | Total Health Care | | | 39,918,423 |
| | | Housing/Multifamily – 0.1% (0.1% of Total Investments) | | | |
| 1,040 | | New York City Housing Development Corporation, New York, Multifamily Housing Revenue | 5/20 at 100.00 | AA+ | 1,072,750 |
| | | Bonds, Series 2010D-1A, 5.000%, 11/01/42 | | | |
| 450 | | New York State Housing Finance Agency, Affordable Housing Revenue Bonds, Series 2009B, | 5/19 at 100.00 | Aa2 | 452,146 |
| | | 4.500%, 11/01/29 | | | |
| 1,490 | | Total Housing/Multifamily | | | 1,524,896 |
41
| | | | | |
NRK | Nuveen New York AMT-Free Quality | | |
| | Municipal Income Fund | | | |
| | Portfolio of Investments (continued) | | | |
| | February 28, 2019 | | | |
| |
| |
Principal | | | Optional Call | | |
Amount (000) | | Description (1) | Provisions (2) | Ratings (3) | Value |
| | | Industrials – 3.2% (2.0% of Total Investments) | | | |
| $ 38,030 | | New York Liberty Development Corporation, New York, Liberty Revenue Bonds, 3 World Trade | 11/24 at 100.00 | N/R | $ 39,652,740 |
| | | Center Project, Class 1 Series 2014, 5.000%, 11/15/44, 144A | | | |
| | | Long-Term Care – 0.1% (0.1% of Total Investments) | | | |
| 1,225 | | Suffolk County Economic Development Corporation, New York, Revenue Bonds, Peconic | 12/20 at 100.00 | BBB– | 1,285,135 |
| | | Landing At Southold, Inc. Project, Refunding Series 2010, 6.000%, 12/01/40 | | | |
| | | Tax Obligation/General – 11.9% (7.3% of Total Investments) | | | |
| | | Nassau County, New York, General Obligation Bonds, General Improvement Series 2009C: | | | |
| 985 | | 5.000%, 10/01/29 – AGC Insured | 10/19 at 100.00 | AA | 1,004,542 |
| 15 | | 5.000%, 10/01/29 – AGC Insured | 10/19 at 100.00 | AA | 15,298 |
| 11,365 | | Nassau County, New York, General Obligation Bonds, General Improvement Series 2018B, | 7/28 at 100.00 | AA | 12,808,128 |
| | | 5.000%, 7/01/49 – AGM Insured | | | |
| | | Nassau County, New York, General Obligation Bonds, General Improvement Series, | | | |
| | | Refunding 2016A: | | | |
| 5,860 | | 5.000%, 1/01/31 | 1/26 at 100.00 | A+ | 6,696,632 |
| 500 | | 5.000%, 1/01/38 | 1/26 at 100.00 | A+ | 556,100 |
| 5,030 | | Nassau County, New York, General Obligation Bonds, General Improvement Series 2016C, | 4/26 at 100.00 | A+ | 5,710,056 |
| | | 5.000%, 4/01/33 | | | |
| 5 | | New York City, New York, General Obligation Bonds, Series 2004E, 5.000%, | 3/19 at 100.00 | AA | 5,015 |
| | | 11/01/20 – AGM Insured | | | |
| 1,200 | | New York City, New York, General Obligation Bonds, Series 2009E, 5.000%, 8/01/28 | 8/19 at 100.00 | AA | 1,216,416 |
| | | New York City, New York, General Obligation Bonds, Series 2012A-1: | | | |
| 6,085 | | 5.000%, 10/01/31 | 10/22 at 100.00 | AA | 6,704,209 |
| 1,000 | | 5.000%, 10/01/33 | 10/22 at 100.00 | AA | 1,099,950 |
| 1,570 | | 5.000%, 10/01/34 | 10/22 at 100.00 | AA | 1,725,210 |
| 8,665 | | New York City, New York, General Obligation Bonds, Series 2012B, 5.000%, 8/01/30 | 8/22 at 100.00 | AA | 9,519,975 |
| | | New York City, New York, General Obligation Bonds, Series 2012I: | | | |
| 1,000 | | 5.000%, 8/01/30 | 8/22 at 100.00 | AA | 1,098,670 |
| 2,000 | | 5.000%, 8/01/31 | 8/22 at 100.00 | AA | 2,193,880 |
| | | New York City, New York, General Obligation Bonds, Series 2013F-1: | | | |
| 5,000 | | 5.000%, 3/01/29 | 3/23 at 100.00 | AA | 5,572,300 |
| 3,400 | | 5.000%, 3/01/31 | 3/23 at 100.00 | AA | 3,778,114 |
| 2,190 | | 5.000%, 3/01/32 | 3/23 at 100.00 | AA | 2,430,878 |
| 1,000 | | 5.000%, 3/01/33 | 3/23 at 100.00 | AA | 1,108,780 |
| 3,735 | | New York City, New York, General Obligation Bonds, Series 2014A-1, | 8/23 at 100.00 | AA | 4,229,701 |
| | | 5.000%, 8/01/26 | | | |
| 8,000 | | New York City, New York, General Obligation Bonds, Series 2014D-1, | 8/23 at 100.00 | AA | 8,976,640 |
| | | 5.000%, 8/01/30 | | | |
| 7,665 | | New York City, New York, General Obligation Bonds, Series 2015A, 5.000%, 8/01/33 | 8/24 at 100.00 | AA | 8,728,749 |
| 9,600 | | New York City, New York, General Obligation Bonds, Series 2017B-1, | 12/26 at 100.00 | AA | 10,851,936 |
| | | 5.000%, 12/01/41 | | | |
| 7,560 | | New York City, New York, General Obligation Bonds, Series 2018B-1, | 10/27 at 100.00 | AA | 9,049,169 |
| | | 5.250%, 10/01/33 | | | |
| | | New York City, New York, General Obligation Bonds, Series 2018E-1: | | | |
| 7,000 | | 5.000%, 3/01/37 | 3/28 at 100.00 | AA | 8,133,720 |
| 3,580 | | 5.000%, 3/01/39 | 3/28 at 100.00 | AA | 4,118,146 |
| 11,355 | | 5.000%, 3/01/41 | 3/28 at 100.00 | AA | 12,979,560 |
| | | New York City, New York, General Obligation Bonds, Series 2011D-I: | | | |
| 2,785 | | 5.000%, 10/01/30 | 10/21 at 100.00 | AA | 3,001,005 |
| 2,880 | | 5.000%, 10/01/34 | 10/21 at 100.00 | AA | 3,095,078 |
| 1,740 | | New York City, New York, General Obligation Bonds, Subseries G-1 Fiscal Series 2012, | 4/22 at 100.00 | AA | 1,901,750 |
| | | 5.000%, 4/01/28 | | | |
42
| | | | | | |
Principal | | | Optional Call | | |
Amount (000) | | Description (1) | Provisions (2) | Ratings (3) | Value |
| | | Tax Obligation/General (continued) | | | |
| | | Rensselaer County, New York, General Obligation Bonds, Series 1991: | | | |
| $ 960 | | 6.700%, 2/15/20 – AMBAC Insured | No Opt. Call | AA | $ 1,006,762 |
| 747 | | 6.700%, 2/15/21 – AMBAC Insured | No Opt. Call | AA | 821,110 |
| | | Rochester, New York, General Obligation Bonds, Series 1999: | | | |
| 735 | | 5.250%, 10/01/20 – NPFG Insured | No Opt. Call | AA– | 777,145 |
| 735 | | 5.250%, 10/01/21 – NPFG Insured | No Opt. Call | AA– | 802,620 |
| 730 | | 5.250%, 10/01/22 – NPFG Insured | No Opt. Call | AA– | 822,652 |
| 730 | | 5.250%, 10/01/23 – NPFG Insured | No Opt. Call | AA– | 845,814 |
| 730 | | 5.250%, 10/01/24 – NPFG Insured | No Opt. Call | AA– | 867,685 |
| 730 | | 5.250%, 10/01/25 – NPFG Insured | No Opt. Call | AA– | 887,935 |
| 725 | | 5.250%, 10/01/26 – NPFG Insured | No Opt. Call | AA– | 897,630 |
| 129,592 | | Total Tax Obligation/General | | | 146,038,960 |
| | | Tax Obligation/Limited – 42.7% (26.5% of Total Investments) | | | |
| 105 | | Dormitory Authority of the State of New York, Revenue Bonds, School Districts Financing | 10/19 at 100.00 | AA | 107,304 |
| | | Program, Series 2009A, 5.625%, 10/01/29 – AGC Insured | | | |
| 335 | | Dormitory Authority of the State of New York, Revenue Bonds, State University | No Opt. Call | Aa2 | 337,646 |
| | | Educational Facilities, Series 1993A, 5.500%, 5/15/19 – AMBAC Insured | | | |
| | | Dormitory Authority of the State of New York, State Personal Income Tax Revenue Bonds, | | | |
| | | General Purpose Series 2011C: | | | |
| 995 | | 5.000%, 3/15/34 | 3/21 at 100.00 | AA+ | 1,054,839 |
| 24,000 | | 5.000%, 3/15/41 | 3/21 at 100.00 | AA+ | 25,379,280 |
| | | Dormitory Authority of the State of New York, State Personal Income Tax Revenue Bonds, | | | |
| | | General Purpose Series 2012D: | | | |
| 7,550 | | 5.000%, 2/15/33 | 2/22 at 100.00 | AA+ | 8,169,704 |
| 10,000 | | 5.000%, 2/15/40 | 2/22 at 100.00 | AA+ | 10,770,200 |
| | | Dormitory Authority of the State of New York, State Personal Income Tax Revenue Bonds, | | | |
| | | General Purpose Series 2014A: | | | |
| 5,000 | | 5.000%, 2/15/29 | 2/24 at 100.00 | AA+ | 5,706,050 |
| 10,000 | | 5.000%, 2/15/30 | 2/24 at 100.00 | AA+ | 11,351,500 |
| 7,000 | | Dormitory Authority of the State of New York, State Personal Income Tax Revenue Bonds, | 3/24 at 100.00 | AA+ | 7,831,600 |
| | | General Purpose Series 2014C. Group C, 5.000%, 3/15/44 | | | |
| 2,500 | | Dormitory Authority of the State of New York, State Personal Income Tax Revenue Bonds, | 3/25 at 100.00 | AA+ | 2,850,750 |
| | | General Purpose Series 2015A, 5.000%, 3/15/33 | | | |
| 7,500 | | Dormitory Authority of the State of New York, State Personal Income Tax Revenue Bonds, | 2/27 at 100.00 | AA+ | 8,550,525 |
| | | General Purpose, Series 2017A, 5.000%, 2/15/38 | | | |
| 28,280 | | Dormitory Authority of the State of New York, State Sales Tax Revenue Bonds, Series | 3/23 at 100.00 | AA+ | 31,140,522 |
| | | 2013A, 5.000%, 3/15/43 | | | |
| 12,045 | | Dormitory Authority of the State of New York, State Sales Tax Revenue Bonds, Series | 9/25 at 100.00 | AA+ | 13,717,087 |
| | | 2015B. Group A,B&C, 5.000%, 3/15/36 | | | |
| 3,000 | | Dormitory Authority of the State of New York, State Sales Tax Revenue Bonds, Series | 3/27 at 100.00 | AA+ | 3,441,660 |
| | | 2017A, 5.000%, 3/15/37 | | | |
| 10,000 | | Dormitory Authority of the State of New York, State Sales Tax Revenue Bonds, Series | 3/28 at 100.00 | AA+ | 10,358,600 |
| | | 2018C, 4.000%, 3/15/45 | | | |
| 1,080 | | Erie County Industrial Development Agency, New York, School Facility Revenue Bonds, | 5/23 at 100.00 | AA | 1,213,607 |
| | | Buffalo City School District, Refunding Series 2013A, 5.000%, 5/01/28 | | | |
| | | Government of Guam, Business Privilege Tax Bonds, Refunding Series 2015D: | | | |
| 5,045 | | 5.000%, 11/15/27 | 11/25 at 100.00 | BB | 5,576,138 |
| 6,770 | | 5.000%, 11/15/34 | 11/25 at 100.00 | BB | 7,229,954 |
| | | Hudson Yards Infrastructure Corporation, New York, Revenue Bonds, Second Indenture | | | |
| | | Series 2017A: | | | |
| 8,185 | | 5.000%, 2/15/38 | 2/27 at 100.00 | Aa3 | 9,331,473 |
| 21,015 | | 5.000%, 2/15/45 | 2/27 at 100.00 | Aa3 | 23,632,628 |
43
| | | | | |
NRK | Nuveen New York AMT-Free Quality | | |
| | Municipal Income Fund | | | |
| | Portfolio of Investments (continued) | | | |
| | February 28, 2019 | | | |
| |
| |
Principal | | | Optional Call | | |
Amount (000) | | Description (1) | Provisions (2) | Ratings (3) | Value |
| | | Tax Obligation/Limited (continued) | | | |
| | | Hudson Yards Infrastructure Corporation, New York, Revenue Bonds, Senior Fiscal 2012 | | | |
| | | Series 2011A: | | | |
| $ 8,770 | | 5.750%, 2/15/47 | 2/21 at 100.00 | AA– | $ 9,404,773 |
| 5,735 | | 5.250%, 2/15/47 | 2/21 at 100.00 | AA– | 6,070,669 |
| 1,765 | | 5.000%, 2/15/47 – AGM Insured | 2/21 at 100.00 | AA | 1,850,973 |
| 3,675 | | Monroe County Industrial Development Agency, New York, School Facility Revenue Bonds, | 5/23 at 100.00 | AA | 4,121,806 |
| | | Rochester Schools Modernization Project, Series 2013, 5.000%, 5/01/28 | | | |
| | | New York City Transitional Finance Authority, New York, Building Aid Revenue Bonds, | | | |
| | | Series 2015S-1: | | | |
| 5,400 | | 5.000%, 7/15/33 | 1/25 at 100.00 | AA | 6,106,806 |
| 5,360 | | 5.000%, 7/15/43 | 1/25 at 100.00 | AA | 5,947,563 |
| 11,000 | | New York City Transitional Finance Authority, New York, Building Aid Revenue Bonds, | 7/25 at 100.00 | AA | 12,333,420 |
| | | Series 2015S-2, 5.000%, 7/15/40 | | | |
| 7,500 | | New York City Transitional Finance Authority, New York, Building Aid Revenue Bonds, | 1/26 at 100.00 | AA | 7,759,350 |
| | | Series 2016S-1, 4.000%, 7/15/40 | | | |
| 5,625 | | New York City Transitional Finance Authority, New York, Building Aid Revenue Bonds, | 7/28 at 100.00 | AA | 6,547,612 |
| | | Series 2017S-3, 5.250%, 7/15/45 | | | |
| 2,500 | | New York City Transitional Finance Authority, New York, Building Aid Revenue Bonds, | 7/28 at 100.00 | AA | 2,983,775 |
| | | Series 2018S-4A, 5.250%, 7/15/36 | | | |
| 7,945 | | New York City Transitional Finance Authority, New York, Building Aid Revenue Bonds, | 7/28 at 100.00 | AA | 9,270,703 |
| | | Series 2019S-3A, 5.000%, 7/15/36 | | | |
| | | New York City Transitional Finance Authority, New York, Future Tax Secured Bonds, | | | |
| | | Series 2012E-1: | | | |
| 6,225 | | 5.000%, 2/01/37 | 2/22 at 100.00 | AAA | 6,712,978 |
| 24,155 | | 5.000%, 2/01/42 | 2/22 at 100.00 | AAA | 25,977,736 |
| 32,500 | | New York City Transitional Finance Authority, New York, Future Tax Secured Bonds, | 5/22 at 100.00 | AAA | 35,203,025 |
| | | Series 2012F-1, 5.000%, 5/01/39 | | | |
| 5,100 | | New York City Transitional Finance Authority, New York, Future Tax Secured Bonds, | 2/23 at 100.00 | AAA | 5,682,522 |
| | | Series 2013F-1, 5.000%, 2/01/29 | | | |
| 13,530 | | New York City Transitional Finance Authority, New York, Future Tax Secured Bonds, | 2/24 at 100.00 | AAA | 15,172,001 |
| | | Series 2014D-1, 5.000%, 2/01/37 | | | |
| | | New York City Transitional Finance Authority, New York, Future Tax Secured Bonds, | | | |
| | | Series 2015B-1: | | | |
| 5,000 | | 5.000%, 8/01/33 | 8/24 at 100.00 | AAA | 5,693,900 |
| 3,960 | | 5.000%, 8/01/35 | 8/24 at 100.00 | AAA | 4,490,165 |
| 1,225 | | New York City Transitional Finance Authority, New York, Future Tax Secured Bonds, | 5/26 at 100.00 | AAA | 1,271,746 |
| | | Series 2017A-1, 4.000%, 5/01/42 | | | |
| 8,100 | | New York City Transitional Finance Authority, New York, Future Tax Secured Bonds, | 8/26 at 100.00 | AAA | 8,430,723 |
| | | Series 2017B-1, 4.000%, 8/01/41 | | | |
| | | New York City Transitional Finance Authority, New York, Future Tax Secured Bonds, | | | |
| | | Series 2019A-1: | | | |
| 1,375 | | 5.000%, 8/01/38 | 8/28 at 100.00 | AAA | 1,595,674 |
| 4,000 | | 5.000%, 8/01/40 | 8/28 at 100.00 | AAA | 4,608,560 |
| | | New York City Transitional Finance Authority, New York, Future Tax Secured Revenue | | | |
| | | Bonds, Subordinate Lien Series 2011C: | | | |
| 5,645 | | 5.500%, 11/01/35 | 11/20 at 100.00 | AAA | 5,989,458 |
| 1,000 | | 5.000%, 11/01/39 | 11/20 at 100.00 | AAA | 1,048,850 |
| 8,490 | | New York City Transitional Finance Authority, New York, Future Tax Secured Revenue | 2/21 at 100.00 | AAA | 8,983,693 |
| | | Bonds, Subordinate Series 2011-D1, 5.000%, 2/01/35 | | | |
| | | New York City, New York, Educational Construction Fund Revenue Bonds, Series 2011A: | | | |
| 18,575 | | 5.750%, 4/01/33 – AGM Insured | 4/21 at 100.00 | N/R | 20,001,560 |
| 4,000 | | 5.750%, 4/01/41 | 4/21 at 100.00 | AA– | 4,298,720 |
| 28,795 | | New York State Thruway Authority, Highway and Bridge Trust Fund Bonds, Second General, | No Opt. Call | AA+ | 30,002,662 |
| | | Series 2005B, 5.500%, 4/01/20 – AMBAC Insured | | | |
44
| | | | | | |
Principal | | | Optional Call | | |
Amount (000) | | Description (1) | Provisions (2) | Ratings (3) | Value |
| | | Tax Obligation/Limited (continued) | | | |
| | | New York State Thruway Authority, State Personal Income Tax Revenue Bonds, Series 2010A: | | | |
| $ 1,600 | | 5.000%, 3/15/29 | 9/20 at 100.00 | AA+ | $ 1,679,744 |
| 1,945 | | 5.000%, 3/15/30 | 9/20 at 100.00 | AA+ | 2,041,336 |
| 3,735 | | New York State Urban Development Corporation, Revenue Bonds, State Facilities, Refunding | No Opt. Call | AA | 3,820,980 |
| | | Series 1995, 5.700%, 4/01/20 – AGM Insured (UB) (5) | | | |
| 12,070 | | New York State Urban Development Corporation, State Personal Income Tax Revenue Bonds, | 3/23 at 100.00 | AA+ | 13,428,599 |
| | | General Purpose Series 2013C, 5.000%, 3/15/32 | | | |
| 1,320 | | Puerto Rico Sales Tax Financing Corporation, Sales Tax Revenue Bonds, Series 2007A, | No Opt. Call | N/R | 1,106,614 |
| | | 0.000%, 8/01/45 (9) | | | |
| | | Puerto Rico Urgent Interest Fund Corp (COFINA), National Custodial Taxable Trust Unit, | | | |
| | | Series 2007A Sr. Bond: | | | |
| 319 | | 0.000%, 8/01/41 (9) | No Opt. Call | N/R | 267,447 |
| 1,053 | | 0.000%, 8/01/42 (9) | No Opt. Call | N/R | 882,942 |
| 699 | | 0.000%, 8/01/44 (9) | No Opt. Call | N/R | 585,937 |
| 12,696 | | 0.000%, 8/01/46 (9) | No Opt. Call | N/R | 10,643,284 |
| | | Puerto Rico Urgent Interest Fund Corp (COFINA), National Custodial Trust Tax-Exempt Trust Unit, | | | |
| | | Series 2007A Sr. Bond: | | | |
| 969 | | 0.000%, 8/01/41 (9) | No Opt. Call | N/R | 855,065 |
| 3,199 | | 0.000%, 8/01/42 (9) | No Opt. Call | N/R | 2,822,804 |
| 2,123 | | 0.000%, 8/01/44 (9) | No Opt. Call | N/R | 1,873,236 |
| 4,009 | | 0.000%, 8/01/45 (9) | No Opt. Call | N/R | 3,537,940 |
| 38,556 | | 0.000%, 8/01/46 (9) | No Opt. Call | N/R | 34,026,839 |
| 185 | | Suffolk County Industrial Development Agency, New York, Revenue Bonds, Hampton Bays | 3/19 at 100.00 | Baa2 | 185,518 |
| | | Public Library, Series 1999A, 6.000%, 10/01/19 – NPFG Insured | | | |
| 2,730 | | Suffolk County Judicial Facilities Agency, New York, Lease Revenue Bonds, H. Lee | 11/23 at 100.00 | BBB+ | 2,971,660 |
| | | Dennison Building, Series 2013, 5.000%, 11/01/33 | | | |
| 494,563 | | Total Tax Obligation/Limited | | | 526,042,435 |
| | | Transportation – 16.4% (10.1% of Total Investments) | | | |
| 4,910 | | Buffalo and Fort Erie Public Bridge Authority, New York, Toll Bridge System Revenue | 1/27 at 100.00 | A+ | 5,474,748 |
| | | Bonds, Series 2017, 5.000%, 1/01/47 | | | |
| 10,000 | | Metropolitan Transportation Authority, New York, Transportation Revenue Bonds, Green | 5/26 at 100.00 | AA– | 10,942,200 |
| | | Climate Bond Certified Series 2016A-1, 5.000%, 11/15/46 | | | |
| | | Metropolitan Transportation Authority, New York, Transportation Revenue Bonds, Refunding | | | |
| | | Green Series 2016B: | | | |
| 1,815 | | 4.000%, 11/15/34 | 11/26 at 100.00 | AA– | 1,910,886 |
| 4,000 | | 5.000%, 11/15/35 | 11/26 at 100.00 | AA– | 4,514,840 |
| 13,950 | | Metropolitan Transportation Authority, New York, Transportation Revenue Bonds, Refunding | 11/22 at 100.00 | AA– | 15,263,672 |
| | | Series 2012F, 5.000%, 11/15/30 | | | |
| | | Metropolitan Transportation Authority, New York, Transportation Revenue Bonds, | | | |
| | | Series 2013E: | | | |
| 1,785 | | 5.000%, 11/15/32 | 11/23 at 100.00 | AA– | 1,965,428 |
| 10,000 | | 5.000%, 11/15/38 | 11/23 at 100.00 | AA– | 10,890,900 |
| 9,370 | | Metropolitan Transportation Authority, New York, Transportation Revenue Bonds, Series | 5/24 at 100.00 | AA– | 10,455,983 |
| | | 2014B, 5.250%, 11/15/35 | | | |
| 2,700 | | Metropolitan Transportation Authority, New York, Transportation Revenue Bonds, Series | 5/25 at 100.00 | AA– | 2,937,843 |
| | | 2015A-1, 5.000%, 11/15/45 | | | |
| 2,570 | | Metropolitan Transportation Authority, New York, Transportation Revenue Bonds, Series | 11/26 at 100.00 | AA– | 2,911,579 |
| | | 2016C-1, 5.000%, 11/15/34 | | | |
| 8,055 | | New York Liberty Development Corporation, New York, Liberty Revenue Bonds, 4 World Trade | 11/21 at 100.00 | A+ | 8,587,677 |
| | | Center Project, Series 2011, 5.000%, 11/15/44 | | | |
45
| | | | | |
NRK | Nuveen New York AMT-Free Quality | | |
| | Municipal Income Fund | | | |
| | Portfolio of Investments (continued) | | | |
| | February 28, 2019 | | | |
| |
| |
Principal | | | Optional Call | | |
Amount (000) | | Description (1) | Provisions (2) | Ratings (3) | Value |
| | | Transportation (continued) | | | |
| | | New York State Thruway Authority, General Revenue Junior Indebtedness Obligations, | | | |
| | | Series 2016A: | | | |
| $ 2,000 | | 5.000%, 1/01/36 | 1/26 at 100.00 | A2 | $ 2,257,800 |
| 7,500 | | 5.000%, 1/01/41 | 1/26 at 100.00 | A2 | 8,368,050 |
| 1,285 | | 5.000%, 1/01/46 | 1/26 at 100.00 | A2 | 1,422,842 |
| 19,230 | | 5.000%, 1/01/51 | 1/26 at 100.00 | A2 | 21,047,812 |
| | | Port Authority of New York and New Jersey, Consolidated Revenue Bonds, One Hundred | | | |
| | | Eighty-Forth Series 2014: | | | |
| 3,950 | | 5.000%, 9/01/34 | 9/24 at 100.00 | AA– | 4,496,206 |
| 1,000 | | 5.000%, 9/01/35 | 9/24 at 100.00 | AA– | 1,136,620 |
| 5,155 | | 5.000%, 9/01/36 | 9/24 at 100.00 | AA– | 5,850,770 |
| 9,755 | | 5.000%, 9/01/39 | 9/24 at 100.00 | AA– | 11,028,710 |
| | | Port Authority of New York and New Jersey, Consolidated Revenue Bonds, One Hundred | | | |
| | | Eighty-Ninth Series 2015: | | | |
| 3,595 | | 5.000%, 5/01/35 | 5/25 at 100.00 | AA– | 4,103,189 |
| 10,780 | | 5.000%, 5/01/45 | 5/25 at 100.00 | AA– | 12,062,173 |
| 9,000 | | Port Authority of New York and New Jersey, Consolidated Revenue Bonds, One Hundred | 10/25 at 100.00 | AA– | 10,290,960 |
| | | Ninety-Fourth Series 2015, 5.250%, 10/15/55 | | | |
| 2,000 | | Port Authority of New York and New Jersey, Consolidated Revenue Bonds, One Hundred | 12/23 at 100.00 | AA– | 2,239,640 |
| | | Seventy Ninth Series 2013, 5.000%, 12/01/43 | | | |
| 1,515 | | Port Authority of New York and New Jersey, Consolidated Revenue Bonds, Two Hundred | 9/28 at 100.00 | AA– | 1,579,842 |
| | | Eleventh Series 2018, 4.000%, 9/01/43 | | | |
| 1,000 | | Port Authority of New York and New Jersey, Consolidated Revenue Bonds, Two Hundred Fifth | 11/27 at 100.00 | AA– | 1,138,190 |
| | | Series 2017, 5.000%, 11/15/47 | | | |
| | | Port Authority of New York and New Jersey, Consolidated Revenue Bonds, Two Hundred Ninth | | | |
| | | Series 2018: | | | |
| 1,500 | | 5.000%, 7/15/36 | 7/28 at 100.00 | AA– | 1,769,115 |
| 1,200 | | 5.000%, 7/15/37 | 7/28 at 100.00 | AA– | 1,408,980 |
| 1,000 | | 5.000%, 7/15/38 | 7/28 at 100.00 | AA– | 1,168,890 |
| 2,000 | | Port Authority of New York and New Jersey, Consolidated Revenue Bonds, Two Hundred | 4/27 at 100.00 | AA– | 2,260,280 |
| | | Series 2017, 5.000%, 10/15/47 | | | |
| 2,500 | | Port Authority of New York and New Jersey, Special Project Bonds, JFK International Air | 3/19 at 100.00 | BBB+ | 2,608,650 |
| | | Terminal LLC Project, Eighth Series 2010, 6.500%, 12/01/28 | | | |
| 1,500 | | Triborough Bridge and Tunnel Authority, New York, General Purpose Revenue Bonds, MTA | 5/27 at 100.00 | AA– | 1,732,710 |
| | | Bridges & Tunnels, Series 2017A, 5.000%, 11/15/37 | | | |
| 500 | | Triborough Bridge and Tunnel Authority, New York, General Purpose Revenue Bonds, MTA | 11/27 at 100.00 | AA– | 573,145 |
| | | Bridges & Tunnels, Series 2017C-2, 5.000%, 11/15/42 | | | |
| | | Triborough Bridge and Tunnel Authority, New York, General Purpose Revenue Bonds, MTA | | | |
| | | Bridges & Tunnels, Series 2018A: | | | |
| 8,755 | | 5.000%, 11/15/43 | 5/28 at 100.00 | AA– | 10,076,480 |
| 10,000 | | 5.000%, 11/15/45 | 5/28 at 100.00 | AA– | 11,481,400 |
| 5,480 | | Triborough Bridge and Tunnel Authority, New York, General Purpose Revenue Bonds, | No Opt. Call | A+ | 5,833,460 |
| | | Refunding Subordinate Lien Series 2002E, 5.500%, 11/15/20 – NPFG Insured | | | |
| 181,355 | | Total Transportation | | | 201,791,670 |
| | | U.S. Guaranteed – 13.2% (8.2% of Total Investments) (6) | | | |
| 5,315 | | Albany Capital Resource Corporation, New York, St. Peter's Hospital Project, Series | 11/20 at 100.00 | N/R | 5,712,243 |
| | | 2011, 6.125%, 11/15/30 (Pre-refunded 11/15/20) | | | |
| | | Canton Capital Resource Corporation, New York, Student Housing Facility Revenue Bonds, | | | |
| | | Grasse River LLC at SUNY Canton Project Series 2010A: | | | |
| 1,000 | | 5.000%, 5/01/40 (Pre-refunded 5/01/20) | 5/20 at 100.00 | AA | 1,039,550 |
| 1,000 | | 5.000%, 5/01/45 (Pre-refunded 5/01/20) – AGM Insured | 5/20 at 100.00 | AA | 1,039,550 |
46
| | | | | | |
Principal | | | Optional Call | | |
Amount (000) | | Description (1) | Provisions (2) | Ratings (3) | Value |
| | | U.S. Guaranteed (6) (continued) | | | |
| $ 2,455 | | Dormitory Authority of the State of New York, FHA-Insured Mortgage Hospital Revenue | 8/19 at 100.00 | N/R | $ 2,506,088 |
| | | Bonds, Hospital for Special Surgery, Series 2009, 6.250%, 8/15/34 (Pre-refunded 8/15/19) | | | |
| 6,215 | | Dormitory Authority of the State of New York, Lease Revenue Bonds, State University | 7/19 at 100.00 | Aa2 | 6,285,292 |
| | | Dormitory Facilities, Series 2009A, 5.000%, 7/01/39 (Pre-refunded 7/01/19) | | | |
| 1,000 | | Dormitory Authority of the State of New York, Master BOCES Program Lease Revenue Bonds, | 8/19 at 100.00 | AA | 1,015,710 |
| | | Nassau County Board of Cooperative Educational Services, Series 2009, 5.000%, 8/15/28 | | | |
| | | (Pre-refunded 8/15/19) – AGC Insured | | | |
| 875 | | Dormitory Authority of the State of New York, Revenue Bonds, New School University, | 7/20 at 100.00 | A– | 917,394 |
| | | Series 2010, 5.250%, 7/01/30 (Pre-refunded 7/01/20) | | | |
| | | Dormitory Authority of the State of New York, Revenue Bonds, New York University, | | | |
| | | Series 2009A: | | | |
| 10,000 | | 5.250%, 7/01/34 (Pre-refunded 7/01/19) | 7/19 at 100.00 | Aa2 | 10,121,200 |
| 3,890 | | 5.000%, 7/01/39 (Pre-refunded 7/01/19) | 7/19 at 100.00 | Aa2 | 3,933,996 |
| 13,500 | | Dormitory Authority of the State of New York, Revenue Bonds, New York University, Series | 7/19 at 100.00 | Aa2 | 13,652,685 |
| | | 2009B, 5.000%, 7/01/39 (Pre-refunded 7/01/19) | | | |
| 4,000 | | Dormitory Authority of the State of New York, Revenue Bonds, North Shore Long Island | 5/21 at 100.00 | A– | 4,290,840 |
| | | Jewish Obligated Group, Series 2011A, 5.000%, 5/01/41 (Pre-refunded 5/01/21) | | | |
| 895 | | Dormitory Authority of the State of New York, Revenue Bonds, School Districts Financing | 10/19 at 100.00 | AA | 916,203 |
| | | Program, Series 2009A, 5.625%, 10/01/29 (Pre-refunded 10/01/19) – AGC Insured | | | |
| 10,125 | | Erie County Industrial Development Agency, New York, School Facility Revenue Bonds, | 5/19 at 100.00 | AA | 10,182,004 |
| | | Buffalo City School District Project, Series 2009A, 5.000%, 5/01/31 (Pre-refunded 5/01/19) | | | |
| 3,000 | | Guam Power Authority, Revenue Bonds, Series 2010A, 5.000%, 10/01/37 (Pre-refunded | 10/20 at 100.00 | AA | 3,158,460 |
| | | 10/01/20) – AGM Insured | | | |
| | | Hudson Yards Infrastructure Corporation, New York, Revenue Bonds, Series 2011A: | | | |
| 14,260 | | 5.750%, 2/15/47 (Pre-refunded 2/15/21) | 2/21 at 100.00 | Aa3 | 15,407,217 |
| 265 | | 5.250%, 2/15/47 (Pre-refunded 2/15/21) | 2/21 at 100.00 | Aa3 | 283,786 |
| 85 | | 5.000%, 2/15/47 (Pre-refunded 2/15/21) – AGM Insured | 2/21 at 100.00 | AA | 90,619 |
| 3,310 | | Long Island Power Authority, New York, Electric System Revenue Bonds, Series 2008A, | 5/19 at 100.00 | AA+ | 3,330,985 |
| | | 5.500%, 5/01/33 (Pre-refunded 5/01/19) – BHAC Insured | | | |
| 5,000 | | Long Island Power Authority, New York, Electric System Revenue Bonds, Series 2011A, | 5/21 at 100.00 | A– | 5,363,550 |
| | | 5.000%, 5/01/38 (Pre-refunded 5/01/21) | | | |
| 27,285 | | Metropolitan Transportation Authority, New York, Transportation Revenue Bonds, Series | 11/20 at 100.00 | AA– | 28,997,407 |
| | | 2010D, 5.250%, 11/15/40 (Pre-refunded 11/15/20) | | | |
| 6,090 | | Metropolitan Transportation Authority, New York, Transportation Revenue Bonds, Series | 5/23 at 100.00 | AA– | 6,937,789 |
| | | 2013B, 5.000%, 11/15/30 (Pre-refunded 5/15/23) | | | |
| 480 | | Metropolitan Transportation Authority, New York, Transportation Revenue Bonds, Series | 5/23 at 100.00 | AA– | 546,821 |
| | | 2013C, 5.000%, 11/15/32 (Pre-refunded 5/15/23) | | | |
| 1,900 | | Metropolitan Transportation Authority, New York, Transportation Revenue Bonds, Series | 11/23 at 100.00 | AA– | 2,215,381 |
| | | 2013D, 5.250%, 11/15/30 (Pre-refunded 11/15/23) | | | |
| 14,000 | | Metropolitan Transportation Authority, New York, Transportation Revenue Bonds, Series | 11/23 at 100.00 | AA– | 16,165,940 |
| | | 2013E, 5.000%, 11/15/31 (Pre-refunded 11/15/23) | | | |
| 4,355 | | New York City Transitional Finance Authority, New York, Future Tax Secured Revenue | 11/20 at 100.00 | N/R | 4,636,202 |
| | | Bonds, Subordinate Lien Series 2011C, 5.500%, 11/01/35 (Pre-refunded 11/01/20) | | | |
| 1,605 | | New York City, New York, General Obligation Bonds, Subseries G-1 Fiscal Series 2012, | 4/22 at 100.00 | N/R | 1,767,570 |
| | | 5.000%, 4/01/28 (Pre-refunded 4/01/22) | | | |
| 955 | | Suffolk County Economic Development Corporation, New York, Revenue Bonds, Catholic | 7/21 at 100.00 | N/R | 1,028,564 |
| | | Health Services of Long Island Obligated Group Project, Refunding Series 2011, 5.000%, | | | |
| | | 7/01/28 (Pre-refunded 7/01/21) | | | |
47
| | | | | |
NRK | Nuveen New York AMT-Free Quality | | |
| | Municipal Income Fund | | | |
| | Portfolio of Investments (continued) | | | |
| | February 28, 2019 | | | |
| |
| |
Principal | | | Optional Call | | |
Amount (000) | | Description (1) | Provisions (2) | Ratings (3) | Value |
| | | U.S. Guaranteed (6) (continued) | | | |
| | | Tompkins County Development Corporation, New York, Revenue Bonds, Ithaca College, | | | |
| | | Series 2011: | | | |
| $ 1,390 | | 5.500%, 7/01/33 (Pre-refunded 1/01/21) – AGM Insured | 1/21 at 100.00 | N/R | $ 1,487,342 |
| 1,000 | | 5.250%, 7/01/36 (Pre-refunded 1/01/21) – AGM Insured | 1/21 at 100.00 | N/R | 1,065,560 |
| 4,000 | | 5.375%, 7/01/41 (Pre-refunded 1/01/21) – AGM Insured | 1/21 at 100.00 | N/R | 4,271,160 |
| 4,485 | | Westchester County Health Care Corporation, New York, Senior Lien Revenue Bonds, Series | 11/20 at 100.00 | N/R | 4,816,486 |
| | | 2010-C2, 6.125%, 11/01/37 (Pre-refunded 11/01/20) | | | |
| 153,735 | | Total U.S. Guaranteed | | | 163,183,594 |
| | | Utilities – 12.2% (7.5% of Total Investments) | | | |
| 2,450 | | Chautauqua County Industrial Development Agency, New York, Exempt Facility Revenue | 2/20 at 100.00 | BBB– | 2,517,914 |
| | | Bonds, NRG Dunkirk Power Project, Series 2009, 5.875%, 4/01/42 | | | |
| 1,045 | | Guam Power Authority, Revenue Bonds, Series 2012A, 5.000%, 10/01/34 | 10/22 at 100.00 | BBB | 1,096,424 |
| | | Long Island Power Authority, New York, Electric System General Revenue Bonds, | | | |
| | | Series 2000A: | | | |
| 8,000 | | 0.000%, 6/01/24 – AGM Insured | No Opt. Call | AA | 7,108,080 |
| 8,000 | | 0.000%, 6/01/25 – AGM Insured | No Opt. Call | AA | 6,913,360 |
| 20,000 | | 0.000%, 6/01/26 – AGM Insured | No Opt. Call | AA | 16,748,000 |
| 10,000 | | 0.000%, 6/01/27 – AGM Insured | No Opt. Call | AA | 8,061,000 |
| 15,000 | | 0.000%, 6/01/28 – AGM Insured | No Opt. Call | AA | 11,613,750 |
| 10,000 | | 0.000%, 6/01/29 – AGM Insured | No Opt. Call | AA | 7,494,700 |
| 2,590 | | Long Island Power Authority, New York, Electric System General Revenue Bonds, Series | 9/24 at 100.00 | A– | 2,855,346 |
| | | 2014A, 5.000%, 9/01/44 | | | |
| 6,520 | | Long Island Power Authority, New York, Electric System General Revenue Bonds, Series | 9/27 at 100.00 | A– | 7,306,051 |
| | | 2017, 5.000%, 9/01/47 | | | |
| | | Utility Debt Securitization Authority, New York, Restructuring Bonds, Refunding Series 2015: | | | |
| 5,090 | | 5.000%, 12/15/36 | 12/25 at 100.00 | AAA | 5,853,704 |
| 8,925 | | 5.000%, 12/15/37 | 12/25 at 100.00 | AAA | 10,234,208 |
| | | Utility Debt Securitization Authority, New York, Restructuring Bonds, Series 2013TE: | | | |
| 9,500 | | 5.000%, 12/15/32 | 12/23 at 100.00 | AAA | 10,761,125 |
| 22,290 | | 5.000%, 12/15/41 | 12/23 at 100.00 | AAA | 24,968,366 |
| 7,000 | | Utility Debt Securitization Authority, New York, Restructuring Bonds, Series 2016A, | 6/26 at 100.00 | AAA | 8,091,860 |
| | | 5.000%, 12/15/35 | | | |
| | | Utility Debt Securitization Authority, New York, Restructuring Bonds, Series 2016B: | | | |
| 3,750 | | 5.000%, 12/15/33 | 6/26 at 100.00 | AAA | 4,368,300 |
| 3,575 | | 5.000%, 12/15/34 | 6/26 at 100.00 | AAA | 4,150,039 |
| 3,275 | | 5.000%, 12/15/35 | 6/26 at 100.00 | AAA | 3,785,835 |
| 5,000 | | Utility Debt Securitization Authority, New York, Restructuring Bonds, Series 2017, | 12/27 at 100.00 | AAA | 5,804,950 |
| | | 5.000%, 12/15/39 | | | |
| 152,010 | | Total Utilities | | | 149,733,012 |
| | | Water and Sewer – 17.8% (11.0% of Total Investments) | | | |
| 5,160 | | New York City Municipal Water Finance Authority, New York, Water and Sewer System | 12/21 at 100.00 | AA+ | 5,538,641 |
| | | Revenue Bonds, Second Generation Resolution, Series 2012BB, 5.000%, 6/15/44 | | | |
| 4,085 | | New York City Municipal Water Finance Authority, New York, Water and Sewer System Second | 6/23 at 100.00 | AA+ | 4,532,185 |
| | | General Resolution Revenue Bonds, Series 2013DD, 5.000%, 6/15/35 | | | |
| 10,000 | | New York City Municipal Water Finance Authority, New York, Water and Sewer System Second | 6/24 at 100.00 | AA+ | 11,302,800 |
| | | General Resolution Revenue Bonds, Series 2014DD, 5.000%, 6/15/35 | | | |
48
| | | | | | |
Principal | | | Optional Call | | |
Amount (000) | | Description (1) | Provisions (2) | Ratings (3) | Value |
| | | Water and Sewer (continued) | | | |
| $ 5,000 | | New York City Municipal Water Finance Authority, New York, Water and Sewer System Second | 6/25 at 100.00 | AA+ | $ 5,636,950 |
| | | General Resolution Revenue Bonds, Series 2015HH, 5.000%, 6/15/39 | | | |
| 15,000 | | New York City Municipal Water Finance Authority, New York, Water and Sewer System Second | 6/26 at 100.00 | AA+ | 16,811,550 |
| | | General Resolution Revenue Bonds, Series 2017CC-1, 5.000%, 6/15/46 | | | |
| | | New York City Municipal Water Finance Authority, New York, Water and Sewer System Second | | | |
| | | General Resolution Revenue Bonds, Series 2018AA: | | | |
| 5,000 | | 5.000%, 6/15/37 | 6/27 at 100.00 | AA+ | 5,771,050 |
| 3,000 | | 5.000%, 6/15/38 | 6/27 at 100.00 | AA+ | 3,450,960 |
| 3,000 | | New York City Municipal Water Finance Authority, New York, Water and Sewer System Second | 6/27 at 100.00 | AA+ | 3,386,280 |
| | | General Resolution Revenue Bonds, Series 2018CC-1, 5.000%, 6/15/48 | | | |
| 25,000 | | New York City Municipal Water Finance Authority, New York, Water and Sewer System Second | 12/27 at 100.00 | AA+ | 28,387,500 |
| | | General Resolution Revenue Bonds, Series 2018DD1, 5.000%, 6/15/48 (UB) | | | |
| 1,400 | | New York City Municipal Water Finance Authority, New York, Water and Sewer System Second | 12/27 at 100.00 | AA+ | 1,610,350 |
| | | General Resolution Revenue Bonds, Series 2018EE, 5.000%, 6/15/40 | | | |
| | | New York City Municipal Water Finance Authority, New York, Water and Sewer System Second | | | |
| | | General Resolution Revenue Bonds, Series 2018FF: | | | |
| 13,815 | | 5.000%, 6/15/38 | 6/28 at 100.00 | AA+ | 16,110,224 |
| 10,000 | | 5.000%, 6/15/40 | 6/28 at 100.00 | AA+ | 11,576,700 |
| 2,580 | | New York State Environmental Facilities Corporation, State Clean Water and Drinking | 6/24 at 100.00 | AAA | 2,964,472 |
| | | Water Revolving Funds Revenue Bonds, New York City Municipal Water Finance Authority | | | |
| | | Projects, Second Resolution Subordinated Series 2014A, 5.000%, 6/15/30 | | | |
| 3,110 | | New York State Environmental Facilities Corporation, State Clean Water and Drinking | 6/25 at 100.00 | AAA | 3,573,794 |
| | | Water Revolving Funds Revenue Bonds, New York City Municipal Water Finance Authority | | | |
| | | Projects, Second Resolution Subordinated SRF Series 2015A, 5.000%, 6/15/36 | | | |
| 1,940 | | New York State Environmental Facilities Corporation, State Clean Water and Drinking | 6/26 at 100.00 | AAA | 2,009,200 |
| | | Water Revolving Funds Revenue Bonds, New York City Municipal Water Finance Authority | | | |
| | | Projects-Second Resolution Bonds, Series 2016A, 4.000%, 6/15/46 | | | |
| 7,350 | | New York State Environmental Facilities Corporation, State Clean Water and Drinking | 6/27 at 100.00 | AAA | 8,409,943 |
| | | Water Revolving Funds Revenue Bonds, New York City Municipal Water Finance Authority | | | |
| | | Projects-Second Resolution Bonds, Subordinated SRF Series 2017A, 5.000%, 6/15/42 | | | |
| | | New York State Environmental Facilities Corporation, State Clean Water and Drinking | | | |
| | | Water Revolving Funds Revenue Bonds, New York City Municipal Water Finance Authority | | | |
| | | Projects-Second Resolution Bonds, Subordinated SRF Series 2017E: | | | |
| 3,500 | | 5.000%, 6/15/42 | 6/27 at 100.00 | AAA | 4,004,735 |
| 4,000 | | 5.000%, 6/15/47 | 6/27 at 100.00 | AAA | 4,549,880 |
| 13,500 | | 5.000%, 6/15/47 (UB) (5) | 6/27 at 100.00 | AAA | 15,355,845 |
| 10,430 | | New York State Environmental Facilities Corporation, State Clean Water and Drinking | 6/28 at 100.00 | AAA | 12,002,740 |
| | | Water Revolving Funds Revenue Bonds, New York City Municipal Water Finance Authority | | | |
| | | Projects-Second Resolution Bonds, Subordinated SRF Series 2018B, 5.000%, 6/15/48 | | | |
| 22,340 | | New York State Environmental Facilities Corporation, State Revolving Funds Revenue | 5/24 at 100.00 | AAA | 25,097,426 |
| | | Bonds, 2010 Master Financing Program, Green Series 2014B, 5.000%, 5/15/44 | | | |
| 5,000 | | New York State Environmental Facilities Corporation, State Revolving Funds Revenue | 8/26 at 100.00 | AAA | 5,686,700 |
| | | Bonds, 2010 Master Financing Program, Green Series 2016B, 5.000%, 8/15/41 | | | |
| 3,845 | | New York State Environmental Facilities Corporation, State Revolving Funds Revenue | 4/20 at 100.00 | AAA | 3,980,805 |
| | | Bonds, 2010 Master Financing Program, Series 2010C, 5.000%, 10/15/35 | | | |
| 3,095 | | New York State Environmental Facilities Corporation, State Revolving Funds Revenue | 2/22 at 100.00 | AAA | 3,342,569 |
| | | Bonds, 2010 Master Financing Program, Series 2012B, 5.000%, 2/15/42 | | | |
| 7,020 | | Suffolk County Water Authority, New York, Waterworks Revenue Bonds, Series 2015A, | 6/25 at 100.00 | AAA | 8,328,388 |
| | | 5.250%, 6/01/36 | | | |
| 2,230 | | Upper Mohawk Valley Regional Water Finance Authority, New York, Water System Revenue | No Opt. Call | A1 | 2,057,376 |
| | | Bonds, Series 2000, 0.000%, 4/01/23 – AMBAC Insured | | | |
49
| | |
NRK | Nuveen New York AMT-Free Quality |
| | Municipal Income Fund |
| | Portfolio of Investments (continued) |
| | February 28, 2019 |
| |
Principal | | | Optional Call | | |
Amount (000) | | Description (1) | Provisions (2) | Ratings (3) | Value |
| | | Water and Sewer (continued) | | | |
| | | Water Authority of Western Nassau County, New York, Water System Revenue Bonds, | | | |
| | | Series 2015A: | | | |
| $ 1,325 | | 5.000%, 4/01/40 | 4/25 at 100.00 | AA– | $ 1,488,889 |
| 1,950 | | 5.000%, 4/01/45 | 4/25 at 100.00 | AA– | 2,180,802 |
| 193,675 | | Total Water and Sewer | | | 219,148,754 |
| $ 1,903,870 | | Total Long-Term Investments (cost $1,880,715,169) | | | 1,987,484,526 |
| | | Floating Rate Obligations – (2.7)% | | | (33,600,000) |
| | | MuniFund Preferred Shares, net of deferred offering costs – (6.5)% (7) | | | (79,524,811) |
| | | Variable Rate Demand Preferred Shares, net of deferred offering costs – (53.7)% (8) | | | (661,148,650) |
| | | Other Assets Less Liabilities – 1.5% | | | 18,560,216 |
| | | Net Asset Applicable to Common Shares – 100% | | | $ 1,231,771,281 |
| | |
| (1) | All percentages shown in the Portfolio of Investments are based on net assets applicable to common shares unless otherwise noted. |
| (2) | Optional Call Provisions: Dates (month and year) and prices of the earliest optional call or redemption. There may be other call provisions at varying prices at later dates. Certain mortgage-backed securities may be subject to periodic principal paydowns. Optional Call Provisions are not covered by the report of independent registered public accounting firm. |
| (3) | For financial reporting purposes, the ratings disclosed are the highest of Standard & Poor's Group ("Standard & Poor's"), Moody's Investors Service, Inc. ("Moody's") or Fitch, Inc. ("Fitch") rating. This treatment of split-rated securities may differ from that used for other purposes, such as for Fund investment policies. Ratings below BBB by Standard & Poor's, Baa by Moody's or BBB by Fitch are considered to be below investment grade. Holdings designated N/R are not rated by any of these national rating agencies. Ratings are not covered by the report of independent registered public accounting firm. |
| (4) | Step-up coupon bond, a bond with a coupon that increases ("steps up"), usually at regular intervals, while the bond is outstanding. The rate shown is the coupon as of the end of the reporting period. |
| (5) | Investment, or portion of investment, has been pledged to collateralize the net payment obligations for investments in inverse floating rate transactions. |
| (6) | Backed by an escrow or trust containing sufficient U.S. Government or U.S. Government agency securities, which ensure the timely payment of principal and interest. |
| (7) | MuniFund Preferred Shares, net of deferred offering costs as a percentage of Total Investments is 4.0%. |
| (8) | Variable Rate Demand Preferred Shares, net of deferred offering costs as a percentage of Total Investments is 33.3%. |
| (9) | Effective February 12, 2019, the par value of the original bonds was replaced with taxable and tax exempt Puerto Rico Sales Tax Financing Corporation (commonly known as COFINA) bond units that are collateralized by a bundle of zero and coupon paying bonds. The quantity shown represents units in a trust, which were assigned according to the original bond's accreted value. These securities do not have a stated coupon interest rate and income will be recognized through accretion of the discount associated with the trust units. The factor at which these units accrete can also decrease, primarily for principal payments generated from coupon payments received or dispositions of the underlying bond collateral. The quantity of units will not change as a result of these principal payments. |
| 144A | Investment is exempt from registration under Rule 144A of the Securities Act of 1933, as amended. These investments may only be resold in transactions exempt from registration, which are normally those transactions with qualified institutional buyers. |
| UB | Underlying bond of an inverse floating rate trust reflected as a financing transaction. See Notes to Financial Statements, Note 3 - Portfolio Securities and Investments in Derivatives. Inverse Floating Rate Securities for more information. |
| | See accompanying notes to financial statements. |
50
Statement of Assets and Liabilities
February 28, 2019
| | | | | | | | | | | | | |
| | | NNY | | | NYV | | | NAN | | | NRK | |
Assets | | | | | | | | | | | | |
| Long-term investments, at value (cost $144,551,027, $29,595,243 | | | | | | | | | | | | |
| $687,290,933 and $1,880,715,169, respectively) | | $ | 150,591,500 | | | $ | 31,955,639 | | | $ | 717,398,487 | | | $ | 1,987,484,526 | |
| Short-term investments, at value (cost approximates value) | | | — | | | | 2,500,000 | | | | — | | | | — | |
| Cash | | | 466,859 | | | | 104,518 | | | | — | | | | 825,535 | |
| Receivable for: | | | | | | | | | | | | | | | | |
| Interest | | | 1,599,475 | | | | 439,833 | | | | 8,365,429 | | | | 22,139,606 | |
| Investments sold | | | — | | | | 1,200,000 | | | | — | | | | — | |
| Other assets | | | 749 | | | | 369 | | | | 126,221 | | | | 714,929 | |
| Total assets | | | 152,658,583 | | | | 36,200,359 | | | | 725,890,137 | | | | 2,011,164,596 | |
Liabilities | | | | | | | | | | | | | | | | |
| Cash overdraft | | | — | | | | — | | | | 1,289,750 | | | | — | |
| Floating rate obligations | | | 1,840,000 | | | | — | | | | 34,300,000 | | | | 33,600,000 | |
| Payable for: | | | | | | | | | | | | | | | | |
| Dividends | | | 422,369 | | | | 95,334 | | | | 1,368,665 | | | | 3,705,945 | |
| Interest | | | — | | | | — | | | | 296,525 | | | | — | |
| Offering costs | | | — | | | | — | | | | 68,288 | | | | — | |
| Adjustable Rate MuniFund Term Preferred ("AMTP") Shares, net of deferred offering | | | | | | | | | | | | | | | | |
| costs (liquidation preference $—, $—, $147,000,000 and $—, respectively) | | | — | | | | — | | | | 146,818,962 | | | | — | |
| MuniFund Preferred ("MFP") Shares, net of deferred offering | | | | | | | | | | | | | | | | |
| costs (liquidation preference $—, $—, $— and $80,000,000, respectively) | | | — | | | | — | | | | — | | | | 79,524,811 | |
| Variable Rate Demand Preferred ("VRDP") Shares, net of deferred offering | | | | | | | | | | | | | | | | |
| costs (liquidation preference $—, $—, $89,000,000 and $663,800,000, | | | | | | | | | | | | | | | | |
| respectively) | | | — | | | | — | | | | 88,045,718 | | | | 661,148,650 | |
| Accrued expenses: | | | | | | | | | | | | | | | | |
| Management fees | | | 56,188 | | | | 15,442 | | | | 333,174 | | | | 876,130 | |
| Directors/Trustees fees | | | 745 | | | | 179 | | | | 68,754 | | | | 266,700 | |
| Professional fees | | | 23,384 | | | | 22,757 | | | | 28,558 | | | | 35,632 | |
| Other | | | 34,936 | | | | 14,631 | | | | 91,505 | | | | 235,447 | |
| Total liabilities | | | 2,377,622 | | | | 148,343 | | | | 272,709,899 | | | | 779,393,315 | |
| Net assets applicable to common shares | | $ | 150,280,961 | | | $ | 36,052,016 | | | $ | 453,180,238 | | | $ | 1,231,771,281 | |
| Common shares outstanding | | | 15,218,656 | | | | 2,349,612 | | | | 30,851,332 | | | | 87,235,304 | |
| Net asset value ("NAV") per common share outstanding | | $ | 9.87 | | | $ | 15.34 | | | $ | 14.69 | | | $ | 14.12 | |
Net assets applicable to common shares consist of: | | | | | | | | | | | | | | | | |
| Common shares, $0.01 par value per share | | $ | 152,187 | | | $ | 23,496 | | | $ | 308,513 | | | $ | 872,353 | |
| Paid-in-surplus | | | 145,257,846 | | | | 33,599,476 | | | | 435,802,132 | | | | 1,173,961,689 | |
| Total distributable earnings | | | 4,870,928 | | | | 2,429,044 | | | | 17,069,593 | | | | 56,937,239 | |
| Net assets applicable to common shares | | $ | 150,280,961 | | | $ | 36,052,016 | | | $ | 453,180,238 | | | $ | 1,231,771,281 | |
| Authorized shares: | | | | | | | | | | | | | | | | |
| Common | | | 250,000,000 | | | Unlimited | | | Unlimited | | | Unlimited | |
| Preferred | | | N/A | | | | N/A | | | Unlimited | | | Unlimited | |
| N/A – Fund is not authorized to issue preferred shares. | | | | | | | | | |
See accompanying notes to financial statements.
51
| |
| Statement of Operations |
| |
| Year Ended February 28, 2019 |
| |
| |
| |
| | |
| | | NNY | | | NYV | | | NAN | | | NRK | |
Investment Income | | $ | 6,289,877 | | | $ | 1,515,328 | | | $ | 29,833,035 | | | $ | 80,430,949 | |
Expenses | | | | | | | | | | | | | | | | |
| Management fees | | | 718,989 | | | | 199,356 | | | | 4,301,027 | | | | 11,411,635 | |
| Interest expense and amortization of offering costs | | | 36,789 | | | | — | | | | 5,525,750 | | | | 12,368,754 | |
| Liquidity fees | | | — | | | | — | | | | 789,632 | | | | 5,284,727 | |
| Remarketing fees | | | — | | | | — | | | | 90,236 | | | | 884,769 | |
| Custodian fees | | | 25,621 | | | | 10,538 | | | | 78,495 | | | | 189,586 | |
| Directors/Trustees fees | | | 4,416 | | | | 1,055 | | | | 20,354 | | | | 58,310 | |
| Professional fees | | | 26,539 | | | | 23,244 | | | | 49,401 | | | | 94,520 | |
| Shareholder reporting expenses | | | 23,332 | | | | 12,106 | | | | 41,134 | | | | 80,172 | |
| Shareholder servicing agent fees | | | 12,917 | | | | 134 | | | | 28,276 | | | | 35,704 | |
| Stock exchange listing fees | | | 6,799 | | | | 6,742 | | | | 8,599 | | | | 24,214 | |
| Investor relations expenses | | | 3,111 | | | | 1,144 | | | | 12,489 | | | | 34,822 | |
| Other | | | 15,639 | | | | 12,171 | | | | 105,824 | | | | 202,505 | |
| Total expenses | | | 874,152 | | | | 266,490 | | | | 11,051,217 | | | | 30,669,718 | |
| Net investment income (loss) | | | 5,415,725 | | | | 1,248,838 | | | | 18,781,818 | | | | 49,761,231 | |
Realized and Unrealized Gain (Loss) | | | | | | | | | | | | | | | | |
| Net realized gain (loss) from: | | | | | | | | | | | | | | | | |
| Investments | | | 648,737 | | | | (97,223 | ) | | | 458,444 | | | | (3,649,148 | ) |
| Swaps | | | — | | | | — | | | | — | | | | 719,434 | |
| Change in net unrealized appreciation | | | | | | | | | | | | | | | | |
| (depreciation) of: | | | | | | | | | | | | | | | | |
| Investments | | | 382,665 | | | | 610,192 | | | | (184,137 | ) | | | 9,909,799 | |
| Swaps | | | — | | | | — | | | | — | | | | (627,281 | ) |
| Net realized and unrealized gain (loss) | | | 1,031,402 | | | | 512,969 | | | | 274,307 | | | | 6,352,804 | |
| Net increase (decrease) in net assets | | | | | | | | | | | | | | | | |
| applicable to common shares | | | | | | | | | | | | | | | | |
| from operations | | $ | 6,447,127 | | | $ | 1,761,807 | | | $ | 19,056,125 | | | $ | 56,114,035 | |
See accompanying notes to financial statements.
52
Statement of Changes in Net Assets
| | | | | | | | | | | | | |
| | | NNY | | | NYV | |
| | | Year Ended | | | Year Ended(1) | | | Year Ended | | | Year Ended(1) | |
| | | 2/28/19 | | | 2/28/18 | | | 2/28/19 | | | 2/28/18 | |
Operations | | | | | | | | | | | | |
| Net investment income (loss) | | $ | 5,415,725 | | | $ | 5,592,374 | | | $ | 1,248,838 | | | $ | 1,283,958 | |
| Net realized gain (loss) from: | | | | | | | | | | | | | | | | |
| Investments | | | 648,737 | | | | (18,325 | ) | | | (97,223 | ) | | | 428,386 | |
| Swaps | | | — | | | | — | | | | — | | | | — | |
| Change in net unrealized appreciation | | | | | | | | | | | | | | | | |
| (depreciation) of: | | | | | | | | | | | | | | | | |
| Investments | | | 382.665 | | | | (1,047,218 | ) | | | 610,192 | | | | (910,750 | ) |
| Swaps | | | — | | | | — | | | | — | | | | — | |
| Net increase (decrease) in net assets | | | | | | | | | | | | | | | | |
| applicable to common shares | | | | | | | | | | | | | | | | |
| from operations | | | 6,447,127 | | | | 4,526,831 | | | | 1,761,807 | | | | 801,594 | |
Distributions to Common Shareholders(2) | | | | | | | | | | | | | | | | |
Dividends(3) | | | (5,478,716 | ) | | | (5,733,138 | ) | | | (1,198,302 | ) | | | (1,641,674 | ) |
| Decrease in net assets applicable to | | | | | | | | | | | | | | | | |
| common shares from distributions | | | | | | | | | | | | | | | | |
| to common shareholders | | | (5,478,716 | ) | | | (5,733,138 | ) | | | (1,198,302 | ) | | | (1,641,674 | ) |
Capital Share Transactions | | | | | | | | | | | | | | | | |
| Common shares: | | | | | | | | | | | | | | | | |
| Net proceeds from shares issued | | | | | | | | | | | | | | | | |
| to shareholders due to | | | | | | | | | | | | | | | | |
| reinvestment of distributions | | | — | | | | 160,451 | | | | — | | | | — | |
| Cost of shares repurchased and retired | | | — | | | | — | | | | — | | | | — | |
| Net increase (decrease) in net assets | | | | | | | | | | | | | | | | |
| applicable to common shares from | | | | | | | | | | | | | | | | |
| capital share transactions | | | — | | | | 160,451 | | | | — | | | | — | |
| Net increase (decrease) in net assets | | | | | | | | | | | | | | | | |
| applicable to common shares | | | 968,411 | | | | (1,045,856 | ) | | | 563,505 | | | | (840,080 | ) |
| Net assets applicable to common | | | | | | | | | | | | | | | | |
| shares at the beginning of period | | | 149,312,550 | | | | 150,358,406 | | | | 35,488,511 | | | | 36,328,591 | |
| Net assets applicable to common | | | | | | | | | | | | | | | | |
| shares at the end of period | | $ | 150,280,961 | | | $ | 149,312,550 | | | $ | 36,052,016 | | | $ | 35,488,511 | |
(1) | Prior period amounts have been conformed to current year presentation. See Notes to Financial Statements, Note 9 – New Accounting Pronouncements for further details. |
(2) | The composition and per share amounts of the Funds' distributions are presented in the Financial Highlights. The distribution information for the Funds as of its most recent tax year end is presented within the Notes to Financial Statements, Note 6 – Income Tax Information. |
(3) | For the fiscal year ended February 28, 2018, NNY's, NAN's and NRK's distributions to shareholders were paid from net investment income, while NYV's distributions were paid from net investment income and accumulated net realized gains. |
See accompanying notes to financial statements.
53
| |
| Statement of Changes in Net Assets (continued) |
| |
| |
| |
| | |
| | | NAN | | | NRK | |
| | | Year Ended | | | Year Ended(1) | | | Year Ended | | | Year Ended(1) | |
| | | 2/28/19 | | | 2/28/18 | | | 2/28/19 | | | 2/28/18 | |
Operations | | | | | | | | | | | | |
| Net investment income (loss) | | $ | 18,781,818 | | | $ | 20,706,021 | | | $ | 49,761,231 | | | $ | 54,014,720 | |
| Net realized gain (loss) from: | | | | | | | | | | | | | | | | |
| Investments | | | 458,444 | | | | 14,211 | | | | (3,649,148 | ) | | | (3,657,093 | ) |
| Swaps | | | — | | | | — | | | | 719,434 | | | | — | |
| Change in net unrealized appreciation | | | | | | | | | | | | | | | | |
| (depreciation) of: | | | | | | | | | | | | | | | | |
| Investments | | | (184,137 | ) | | | (5,818,305 | ) | | | 9,909,799 | | | | (14,283,185 | ) |
| Swaps | | | — | | | | — | | | | (627,281 | ) | | | 627,281 | |
| Net increase (decrease) in net assets | | | | | | | | | | | | | | | | |
| applicable to common shares | | | | | | | | | | | | | | | | |
| from operations | | | 19,056,125 | | | | 14,901,927 | | | | 56,114,035 | | | | 36,701,723 | |
Distributions to Common Shareholders(2) | | | | | | | | | | | | | | | | |
Dividends(3) | | | (17,862,975 | ) | | | (21,695,203 | ) | | | (47,247,461 | ) | | | (54,016,808 | ) |
| Decrease in net assets applicable to | | | | | | | | | | | | | | | | |
| common shares from distributions | | | | | | | | | | | | | | | | |
| to common shareholders | | | (17,862,975 | ) | | | (21,695,203 | ) | | | (47,247,461 | ) | | | (54,016,808 | ) |
Capital Share Transactions | | | | | | | | | | | | | | | | |
| Common shares: | | | | | | | | | | | | | | | | |
| Net proceeds from shares issued | | | | | | | | | | | | | | | | |
| to shareholders due to | | | | | | | | | | | | | | | | |
| reinvestment of distributions | | | — | | | | — | | | | — | | | | — | |
| Cost of shares repurchased and retired | | | (3,387,483 | ) | | | — | | | | (4,453,608 | ) | | | — | |
| Net increase (decrease) in net assets | | | | | | | | | | | | | | | | |
| applicable to common shares from | | | | | | | | | | | | | | | | |
| capital share transactions | | | (3,387,483 | ) | | | — | | | | (4,453,608 | ) | | | — | |
| Net increase (decrease) in net assets | | | | | | | | | | | | | | | | |
| applicable to common shares | | | (2,194,333 | ) | | | (6,793,276 | ) | | | 4,412,966 | | | | (17,315,085 | ) |
| Net assets applicable to common | | | | | | | | | | | | | | | | |
| shares at the beginning of period | | | 455,374,571 | | | | 462,167,847 | | | | 1,227,358,315 | | | | 1,244,673,400 | |
| Net assets applicable to common | | | | | | | | | | | | | | | | |
| shares at the end of period | | $ | 453,180,238 | | | $ | 455,374,571 | | | $ | 1,231,771,281 | | | $ | 1,227,358,315 | |
(1) | Prior period amounts have been conformed to current year presentation. See Notes to Financial Statements, Note 9 – New Accounting Pronouncements for further details. |
(2) | The composition and per share amounts of the Funds' distributions are presented in the Financial Highlights. The distribution information for the Funds as of its most recent tax year end is presented within the Notes to Financial Statements, Note 6 – Income Tax Information. |
(3) | For the fiscal year ended February 28, 2018, NNY's, NAN's and NRK's distributions to shareholders were paid from net investment income, while NYV's distributions were paid from net investment income and accumulated net realized gains. |
See accompanying notes to financial statements.
54
| | | |
| Statement of Cash Flows | | |
| |
| Year Ended February 28, 2019 | | |
| |
| |
| |
| | |
| | | NAN | | | NRK | |
Cash Flows from Operating Activities: | | | | | | |
Net Increase (Decrease) in Net Assets Applicable to Common Shares | | | | | | |
from Operations | | $ | 19,056,125 | | | $ | 56,114,035 | |
| Adjustments to reconcile the net increase (decrease) in net assets | | | | | | | | |
| applicable to common shares from operations to net cash provided by | | | | | | | | |
| (used in) operating activities: | | | | | | | | |
| Purchases of investments | | | (189,071,559 | ) | | | (434,925,411 | ) |
| Proceeds from sales and maturities of investments | | | 162,464,021 | | | | 410,128,695 | |
| Taxes paid | | | (802 | ) | | | (269 | ) |
| Amortization (Accretion) of premiums and discounts, net | | | 3,697,012 | | | | 5,934,283 | |
| Amortization of deferred offering costs | | | 49,361 | | | | 133,912 | |
| (Increase) Decrease in: | | | | | | | | |
| Receivable for interest | | | (199,128 | ) | | | (38,240 | ) |
| Receivable for investments sold | | | 8,210,771 | | | | 6,524,915 | |
| Other assets | | | 11,054 | | | | 29,928 | |
| Increase (Decrease) in: | | | | | | | | |
| Payable for interest | | | 72,400 | | | | — | |
| Payable for investments purchased | | | (9,204,760 | ) | | | (6,657,586 | ) |
| Payable for offering costs | | | 68,288 | | | | — | |
| Accrued management fees | | | 7,204 | | | | 4,851 | |
| Accrued Directors/Trustees fees | | | (6,474 | ) | | | (26,649 | ) |
| Accrued professional fees | | | 567 | | | | 1,645 | |
| Accrued other expenses | | | (31,229 | ) | | | (135,409 | ) |
| Net realized (gain) loss from Investments | | | (458,444 | ) | | | 3,649,148 | |
| Change in net unrealized (appreciation) depreciation of: | | | | | | | | |
| Investments | | | 184,137 | | | | (9,909,799 | ) |
| Swaps | | | — | | | | 627,281 | |
| Net cash provided by (used in) operating activities | | | (5,151,456 | ) | | | 31,455,330 | |
Cash Flows from Financing Activities: | | | | | | | | |
| Proceeds from borrowings | | | 20,509,309 | | | | 18,200,000 | |
| Repayments for borrowings | | | (20,509,309 | ) | | | (18,200,000 | ) |
| Proceeds from AMTP Shares issued, at liquidation preference | | | 147,000,000 | | | | — | |
| (Payments for) VMTP Shares redeemed, at liquidation preference | | | (147,000,000 | ) | | | — | |
| (Payments for) deferred offering cost | | | (185,000 | ) | | | — | |
| Increase (Decrease) in: | | | | | | | | |
| Cash overdraft | | | 922,166 | | | | — | |
| Floating rate obligations | | | 25,825,000 | | | | 20,745,000 | |
| Cash distributions paid to common shareholders | | | (18,023,227 | ) | | | (47,442,485 | ) |
| Cost of common shares repurchased and retired | | | (3,387,483 | ) | | | (4,453,608 | ) |
| Net cash provided by (used in) financing activities | | | 5,151,456 | | | | (31,151,093 | ) |
Net Increase (Decrease) in Cash | | | — | | | | 304,237 | |
| Cash at the beginning of period | | | — | | | | 521,298 | |
| Cash at the end of period | | $ | — | | | $ | 825,535 | |
| | |
Supplemental Disclosure of Cash Flow Information | | NAN | | | NRK | |
| Cash paid for interest (excluding amortization of offering costs) | | $ | 5,403,989 | | | $ | 12,231,937 | |
| | |
| | |
See accompanying notes to financial statements. |
55
| |
| Financial Highlights |
| |
| |
| |
| |
| Selected data for a common share outstanding throughout each period: |
| |
| |
| | |
| | | | | | Investment Operations | | | Less Distributions to Common Shareholders | | | Common Share | |
| | | Beginning Common Share NAV | | | Net Investment Income (Loss) | | | Net Realized/ Unrealized Gain (Loss) | | | Total | | | From Net Investment Income | | | From Accumu- lated Net Realized Gains | | | Total | | | Ending NAV | | | Ending Share Price | |
NNY | | | | | | | | | | | | | | | | | | | | | | | | | | | |
Year Ended 2/28-2/29: | | | | | | | |
| 2019 | | $ | 9.81 | | | $ | 0.36 | | | $ | 0.06 | | | $ | 0.42 | | | $ | (0.36 | ) | | $ | — | | | $ | (0.36 | ) | | $ | 9.87 | | | $ | 9.67 | |
| 2018 | | | 9.89 | | | | 0.37 | | | | (0.07 | ) | | | 0.30 | | | | (0.38 | ) | | | — | | | | (0.38 | ) | | | 9.81 | | | | 9.26 | |
| 2017(d) | | | 10.33 | | | | 0.16 | | | | (0.44 | ) | | | (0.28 | ) | | | (0.16 | ) | | | — | | | | (0.16 | ) | | | 9.89 | | | | 9.70 | |
| Year Ended 9/30: | |
| 2016 | | | 10.01 | | | | 0.41 | | | | 0.30 | | | | 0.71 | | | | (0.39 | ) | | | — | | | | (0.39 | ) | | | 10.33 | | | | 10.33 | |
| 2015 | | | 10.08 | | | | 0.40 | | | | (0.08 | ) | | | 0.32 | | | | (0.39 | ) | | | — | | | | (0.39 | ) | | | 10.01 | | | | 9.71 | |
| 2014 | | | 9.65 | | | | 0.41 | | | | 0.41 | | | | 0.82 | | | | (0.39 | ) | | | — | | | | (0.39 | ) | | | 10.08 | | | | 9.71 | |
| | |
NYV | | | | | | | | | | | | | | | | | | | | | | | | | | | | | | | | | | | | |
Year Ended 2/28-2/29: | |
| 2019 | | | 15.10 | | | | 0.53 | | | | 0.22 | | | | 0.75 | | | | (0.51 | ) | | | — | | | | (0.51 | ) | | | 15.34 | | | | 13.68 | |
| 2018 | | | 15.46 | | | | 0.55 | | | | (0.21 | ) | | | 0.34 | | | | (0.59 | ) | | | (0.11 | ) | | | (0.70 | ) | | | 15.10 | | | | 13.78 | |
| 2017(d) | | | 16.14 | | | | 0.25 | | | | (0.64 | ) | | | (0.39 | ) | | | (0.29 | ) | | | — | | | | (0.29 | ) | | | 15.46 | | | | 14.87 | |
Year Ended 9/30: | |
| 2016 | | | 15.89 | | | | 0.81 | | | | 0.07 | | | | 0.88 | | | | (0.63 | ) | | | — | | | | (0.63 | ) | | | 16.14 | | | | 15.90 | |
| 2015 | | | 15.94 | | | | 0.67 | | | | (0.08 | ) | | | 0.59 | | | | (0.64 | ) | | | — | | | | (0.64 | ) | | | 15.89 | | | | 14.85 | |
| 2014 | | | 15.16 | | | | 0.68 | | | | 0.76 | | | | 1.44 | | | | (0.66 | ) | | | — | | | | (0.66 | ) | | | 15.94 | | | | 14.44 | |
| (a) | Total Return Based on Common share NAV is the combination of changes in common share NAV, reinvested dividend income at NAV and reinvested capital gains distributions at NAV, if any. The last dividend declared in the period, which is typically paid on the first business day of the following month, is assumed to be reinvested at the ending NAV. The actual reinvest price for the last dividend declared in the period may often be based on the Fund's market price (and not its NAV), and therefore may be different from the price used in the calculation. Total returns are not annualized. |
| | Total Return Based on Common Share Price is the combination of changes in the market price per share and the effect of reinvested dividend income and reinvested capital gains distributions, if any, at the average price paid per share at the time of reinvestment. The last dividend declared in the period, which is typically paid on the first busi- ness day of the following month, is assumed to be reinvested at the ending market price. The actual reinvestment for the last dividend declared in the period may take place over several days, and in some instances may not be based on the market price, so the actual reinvestment price may be different from the price used in the calculation. Total returns are not annualized. |
56
| | | | | | | | | | | | | | | | | |
Common Share Total Returns | | | Common Share Supplemental Data/ Ratios Applicable to Common Shares | |
| | | | | Ratios to Average Net Assets | | | | |
| | |
| | | | Based | | | | | | | | | | | | | |
Based | | | on | | | Ending | | | | | | Net | | | Portfolio | |
on | | | Share | | | Net | | | | | | Investment | | | Turnover | |
NAV(a) | | | Price(a) | | | Assets (000) | | | Expenses(b) | | | Income (Loss) | | | Rate(c) | |
| | |
| | |
| | 4.37 | % | | | 8.52 | % | | $ | 150,281 | | | | 0.59 | % | | | 3.63 | % | | | 17 | % |
| | 3.01 | | | | (0.80 | ) | | | 149,313 | | | | 0.60 | | | | 3.69 | | | | 12 | |
| | (2.71 | ) | | | (4.54 | ) | | | 150,358 | | | | 0.63 | * | | | 3.77 | * | | | 14 | |
| | |
| | 7.23 | | | | 10.56 | | | | 156,939 | | | | 0.60 | | | | 4.04 | | | | 15 | |
| | 3.22 | | | | 4.05 | | | | 152,137 | | | | 0.60 | | | | 3.98 | | | | 31 | |
| | 8.63 | | | | 12.76 | | | | 153,087 | | | | 0.63 | | | | 4.13 | | | | 23 | |
| | |
| | |
| | |
| | 5.05 | | | | 3.08 | | | | 36,052 | | | | 0.75 | | | | 3.50 | | | | 34 | |
| | 2.17 | | | | (2.83 | ) | | | 35,489 | | | | 0.75 | | | | 3.53 | | | | 27 | |
| | (2.41 | ) | | | (4.67 | ) | | | 36,329 | | | | 0.85 | * | | | 3.90 | * | | | 13 | |
| | |
| | 5.62 | | | | 11.45 | | | | 37,927 | | | | 0.76 | | | | 5.01 | | | | 8 | |
| | 3.74 | | | | 7.34 | | | | 37,326 | | | | 0.75 | | | | 4.19 | | | | 11 | |
| | 9.69 | | | | 8.12 | | | | 37,455 | | | | 0.76 | | | | 4.37 | | | | 19 | |
| (b) | The expense ratios reflect, among other things, the interest expense deemed to have been paid by the Fund on the floating rate certificates issued by the special purpose trusts for the self-deposited inverse floaters held by the Fund (as described in Note 3 – Portfolio Securities and Investments in Derivatives, Inverse Floating Rate Securities), where applicable, as follows: |
| | | | | |
NNY | | | NYV | |
| Year Ended 2/28-2/29: | | | Year Ended 2/28-2/29: | |
| 2019 | 0.02% | | 2019 | —% |
| 2018 | 0.03 | | 2018 | — |
| 2017(d) | 0.03* | | 2017(d) | — |
| Year Ended 9/30: | | | Year Ended 9/30: | |
| 2016 | 0.02 | | 2016 | — |
| 2015 | 0.01 | | 2015 | — |
| 2014 | 0.01 | | 2014 | — |
| (c) | Portfolio Turnover Rate is calculated based on the lesser of long-term purchases or sales (as disclosed in Note 5 – Investment Transactions) divided by the average long-term market value during the period. |
| (d) | For the five months ended February 28, 2017. |
| * | Annualized. |
See accompanying notes to financial statements.
57
| |
| Financial Highlights (continued) |
| |
| |
| |
| |
| Selected data for a common share outstanding throughout each period: |
| |
| |
| | |
| | | | | | Investment Operations | | | Less Distributions to Common Shareholders | | | Common Share | |
| | | Beginning Common Share NAV | | | Net Investment Income (Loss) | | | Net Realized/ Unrealized Gain (Loss) | | | Total | | | From Net Investment Income | | | From Accumulated Net Realized Gains | | | Total | | | Discount per Share Repurchased and Retired | | | Ending NAV | | | Ending Share Price | |
NAN | | | | | | | | | | | | | | | | | | | | | | | | | | | | | | |
| Year Ended 2/28-2/29: | | | | |
| 2019 | | $ | 14.63 | | | $ | 0.61 | | | $ | 0.01 | | | $ | 0.62 | | | $ | (0.58 | ) | | $ | — | | | $ | (0.58 | ) | | $ | 0.02 | | | $ | 14.69 | | | $ | 12.87 | |
| 2018 | | | 14.85 | | | | 0.67 | | | | (0.19 | ) | | | 0.48 | | | | (0.70 | ) | | | — | | | | (0.70 | ) | | | — | | | | 14.63 | | | | 13.02 | |
| 2017(e) | | | 15.78 | | | | 0.29 | | | | (0.92 | ) | | | (0.63 | ) | | | (0.30 | ) | | | — | | | | (0.30 | ) | | | — | | | | 14.85 | | | | 13.75 | |
Year Ended 9/30: | | | | | |
| 2016 | | | 15.26 | | | | 0.76 | | | | 0.55 | | | | 1.31 | | | | (0.79 | ) | | | — | * | | | (0.79 | ) | | | — | | | | 15.78 | | | | 15.33 | |
| 2015 | | | 15.36 | | | | 0.71 | | | | (0.04 | ) | | | 0.67 | | | | (0.77 | ) | | | — | | | | (0.77 | ) | | | — | * | | | 15.26 | | | | 13.42 | |
| 2014 | | | 14.33 | | | | 0.67 | | | | 1.12 | | | | 1.79 | | | | (0.76 | ) | | | — | | | | (0.76 | ) | | | — | | | | 15.36 | | | | 13.33 | |
| | |
NRK | | | | | | | | | | | | | | | | | | | | | | | | | | | | | | | | | | | | | | | | |
Year Ended 2/28-2/29: | | | | | | | | | | | | | | | | | |
| 2019 | | | 14.01 | | | | 0.57 | | | | 0.07 | | | | 0.64 | | | | (0.54 | ) | | | — | | | | (0.54 | ) | | | 0.01 | | | | 14.12 | | | | 12.36 | |
| 2018 | | | 14.21 | | | | 0.62 | | | | (0.20 | ) | | | 0.42 | | | | (0.62 | ) | | | — | | | | (0.62 | ) | | | — | | | | 14.01 | | | | 12.31 | |
| 2017(e) | | | 15.17 | | | | 0.27 | | | | (0.96 | ) | | | (0.69 | ) | | | (0.27 | ) | | | — | | | | (0.27 | ) | | | — | | | | 14.21 | | | | 12.93 | |
Year Ended 9/30: | | | | | | | | | |
| 2016 | | | 14.36 | | | | 0.69 | | | | 0.82 | | | | 1.51 | | | | (0.70 | ) | | | — | | | | (0.70 | ) | | | — | | | | 15.17 | | | | 14.12 | |
| 2015 | | | 14.39 | | | | 0.72 | | | | (0.02 | ) | | | 0.70 | | | | (0.73 | ) | | | — | | | | (0.73 | ) | | | — | | | | 14.36 | | | | 12.59 | |
| 2014 | | | 13.57 | | | | 0.76 | | | | 0.88 | | | | 1.64 | | | | (0.82 | ) | | | — | | | | (0.82 | ) | | | — | | | | 14.39 | | | | 12.80 | |
| (a) | Total Return Based on Common Share NAV is the combination of changes in common share NAV, reinvested dividend income at NAV and reinvested capital gains distributions at NAV, if any. The last dividend declared in the period, which is typically paid on the first business day of the following month, is assumed to be reinvested at the ending NAV. The actual reinvest price for the last dividend declared in the period may often be based on the Fund's market price (and not its NAV), and therefore may be different from the price used in the calculation. Total returns are not annualized. |
| | Total Return Based on Common Share Price is the combination of changes in the market price per share and the effect of reinvested dividend income and reinvested capital gains distri- butions, if any, at the average price paid per share at the time of reinvestment. The last dividend declared in the period, which is typically paid on the first business day of the following month, is assumed to be reinvested at the ending market price. The actual reinvestment for the last dividend declared in the period may take place over several days, and in some instances may not be based on the market price, so the actual reinvestment price may be different from the price used in the calculation. Total returns are not annualized. |
| * | Rounds to less than $0.01 per share. |
58
| | | | | | | | | | | | | | | | | |
| | | | | | | Common Share Supplemental Data/ Ratios Applicable to Common Shares | |
Common Share Total Returns | | | | | | Ratios to Average Net Assets(b) | | | | |
| | |
| | |
| | |
| | | | Based | | | | | | | | | | | | | |
Based | | | on | | | Ending | | | | | | Net | | | Portfolio | |
on | | | Share | | | Net | | | | | | Investment | | | Turnover | |
NAV(a) | | | Price(a) | | | Assets (000) | | | Expenses(c) | | | Income (Loss) | | | Rate(d) | |
| | |
| | |
| | 4.46 | % | | | 3.49 | % | | $ | 453,180 | | | | 2.45 | % | | | 4.16 | % | | | 23 | % |
| | 3.19 | | | | (0.44 | ) | | | 455,375 | | | | 2.10 | | | | 4.43 | | | | 14 | |
| | (3.97 | ) | | | (8.32 | ) | | | 462,128 | | | | 2.01 | ** | | | 4.74 | ** | | | 20 | |
| | |
| | 8.77 | | | | 20.51 | | | | 491,272 | | | | 1.62 | | | | 4.86 | | | | 16 | |
| | 4.47 | | | | 6.53 | | | | 474,842 | | | | 1.70 | | | | 4.71 | | | | 17 | |
| | 12.79 | | | | 9.29 | | | | 142,279 | | | | 2.55 | | | | 4.54 | | | | 20 | |
| | |
| | |
| | |
| | 4.75 | | | | 5.01 | | | | 1,231,771 | | | | 2.51 | | | | 4.08 | | | | 21 | |
| | 2.90 | | | | (0.18 | ) | | | 1,227,358 | | | | 2.13 | | | | 4.28 | | | | 13 | |
| | (4.52 | ) | | | (6.49 | ) | | | 1,244,673 | | | | 2.03 | ** | | | 4.60 | ** | | | 13 | |
| | |
| | 10.71 | | | | 18.04 | | | | 1,329,069 | | | | 1.55 | | | | 4.66 | | | | 10 | |
| | 4.98 | | | | 4.06 | | | | 1,257,927 | | | | 1.43 | | | | 5.01 | | | | 18 | |
| | 12.48 | | | | 11.53 | | | | 1,260,498 | | | | 1.57 | | | | 5.50 | | | | 25 | |
| (b) | Net Investment Income (Loss) ratios reflect income earned and expenses incurred on assets attributable to preferred shares issued by the Fund. |
| (c) | The expense ratios reflect, among other things, all interest expense and other costs related to preferred shares (as described in Note 4 – Fund Shares, Preferred Shares) and/or the interest expense deemed to have been paid by the Fund on the floating rate certificates issued by the special purpose trusts for the self-deposited inverse floaters held by the Fund (as described in Note 3 – Portfolio Securities and Investments in Derivatives, Inverse Floating Rate Securities), where applicable, as follows: |
| | | | | |
NAN | | | NRK | |
| Year Ended 2/28-2/29: | | | Year Ended 2/28-2/29: | |
| 2019 | 1.42% | | 2019 | 1.52% |
| 2018 | 1.07 | | 2018 | 1.14 |
| 2017(e) | 0.96** | | 2017(e) | 1.02** |
| Year Ended 9/30: | | | Year Ended 9/30: | |
| 2016 | 0.65 | | 2016 | 0.62 |
| 2015 | 0.50 | | 2015 | 0.48 |
| 2014 | 1.20 | | 2014 | 0.58 |
| (d) | Portfolio Turnover Rate is calculated based on the lesser of long-term purchases or sales (as disclosed in Note 5 – Investment Transactions) divided by the average long-term market value during the period. |
| (e) | For the five months ended February 28, 2017. |
| ** | Annualized. |
See accompanying notes to financial statements.
59
Financial Highlights (continued)
| | | | | | | | | | | | | | | | | | | | | | | | | | | | | | | | | | | | | | | | |
| | | iMTP Shares at the End of Period | | | MFP Shares at the End of Period | | | MTP Shares at the End of Period(a) | | | AMTP Shares at the End of Period | | | VMTP Shares at the End of Period | | | VRDP Shares at the End of Period | | | iMTP, MFP, MTP, AMTP, VMTP and/or VRDP Shares at the End of Period | |
| | | Aggregate Amount Outstanding (000) | | | Asset CoveragePer $5,000 Share | | | Aggregate Amount Outstanding (000) | | | Asset CoveragePer $100,000 Share | | | Aggregate Amount Outstanding (000) | | | Asset CoveragePer $10 Share | | | Aggregate Amount Outstanding (000) | | | Asset CoveragePer $100,000Share | | | Aggregate Amount Outstanding (000) | | | Asset CoveragePer $100,000 Share | | | Aggregate Amount Outstanding (000) | | | Asset Coverage Per $100,000 Share | | | Asset Coverage Per $1 Liquidation Preference | |
NAN | | | | | | | | | | | | | | | | | | | | | | | | | | | | | | | | | | | | | | | |
Year Ended 2/28-2/29: | | | | | | | | | | |
| 2019 | | $ | — | | | $ | — | | | $ | — | | | $ | — | | | $ | — | | | $ | — | | | $ | 147,000 | | | $ | 292,026 | | | $ | — | | | $ | — | | | $ | 89,000 | | | $ | 292,026 | | | $ | 2.92 | |
| 2018 | | | — | | | | — | | | | — | | | | — | | | | — | | | | — | | | | — | | | | — | | | | 147,000 | | | | 292,955 | | | | 89,000 | | | | 292,955 | | | | 2.93 | |
| 2017(b) | | | — | | | | — | | | | — | | | | — | | | | — | | | | — | | | | — | | | | — | | | | 147,000 | | | | 295,834 | | | | 89,000 | | | | 295,834 | | | | 2.96 | |
Year Ended 9/30: | | | | | | | | | | | | | | | | | | | | | |
| 2016 | | | — | | | | — | | | | — | | | | — | | | | — | | | | — | | | | — | | | | — | | | | 147,000 | | | | 308,166 | | | | 89,000 | | | | 308,166 | | | | 3.08 | |
| 2015 | | | — | | | | — | | | | — | | | | — | | | | — | | | | — | | | | — | | | | — | | | | 94,000 | | | | 359,477 | | | | 89,000 | | | | 359,477 | | | | 3.59 | |
| 2014 | | | — | | | | — | | | | — | | | | — | | | | — | | | | — | | | | — | | | | — | | | | 56,000 | | | | 354,070 | | | | — | | | | — | | | | — | |
| | |
NRK | | | | | | | | | | | | | | | | | | | | | | | | | | | | | | | | | | | | | | | | | | | | | | | | | | | | |
Year Ended 2/28-2/29: | | | | | | | | | | | | | | | | | | | | | | | | | |
| 2019 | | | — | | | | — | | | | 80,000 | | | | 265,605 | | | | — | | | | — | | | | — | | | | — | | | | — | | | | — | | | | 663,800 | | | | 265,605 | | | | 2.66 | |
| 2018 | | | — | | | | — | | | | 80,000 | | | | 265,012 | | | | — | | | | — | | | | — | | | | — | | | | — | | | | — | | | | 663,800 | | | | 265,012 | | | | 2.65 | |
| 2017(b) | | | 79,000 | | | | 13,378 | | | | — | | | | — | | | | — | | | | — | | | | — | | | | — | | | | — | | | | — | | | | 663,800 | | | | 267,565 | | | | 2.68 | |
Year Ended 9/30: | | | | | | | | | | | | | |
| 2016 | | | 79,000 | | | | 13,946 | | | | — | | | | — | | | | — | | | | — | | | | — | | | | — | | | | — | | | | — | | | | 663,800 | | | | 278,927 | | | | 2.79 | |
| 2015 | | | 79,000 | | | | 16,077 | | | | — | | | | — | | | | — | | | | — | | | | — | | | | — | | | | — | | | | — | | | | 488,800 | | | | 321,544 | | | | 3.22 | |
| 2014 | | | 79,000 | | | | 16,100 | | | | — | | | | — | | | | — | | | | — | | | | — | | | | — | | | | — | | | | — | | | | 488,800 | | | | 321,997 | | | | 3.22 | |
| |
| (a) | The Ending and Average Market Value Per Share for each Series of the Fund's MTP Shares were as follows: |
| | |
| | | 2014 | |
NAN | | | |
Series 2015 (NAN PRC) | | | |
| Ending Market Value per Share | | $ | — | |
| Average Market Value per Share | | | 10.04 | Ω |
Series 2016 (NAN PRD) | | | | |
| Ending Market Value per Share | | | — | |
| Average Market Value per Share | | | 10.05 | Ω |
| | | | | |
NRK | | | | |
Series 2015 (NRK PRC) | | | | |
| Ending Market Value per Share | | | — | |
| Average Market Value per Share | | | 10.04 | Ω |
| (b) | For the five months ended February 28, 2017. |
| For the period October 1, 2013 through June 13, 2014. |
See accompanying notes to financial statements.
60
Notes to
Financial Statements
1. General Information and Significant Accounting Policies
General Information
Fund Information
The funds covered in this report and their corresponding New York Stock Exchange ("NYSE") symbols are as follows (each a "Fund" and collectively, the "Funds"):
| ● | Nuveen New York Municipal Value Fund, Inc. (NNY) |
| ● | Nuveen New York Municipal Value Fund 2 (NYV) |
| ● | Nuveen New York Quality Municipal Income Fund (NAN) |
| ● | Nuveen New York AMT-Free Quality Municipal Income Fund (NRK) |
The Funds are registered under the Investment Company Act of 1940 (the "1940 Act"), as amended, as diversified closed-end management investment companies. NNY was incorporated under the state laws of Minnesota on July 14, 1987. NYV, NAN and NRK were organized as Massachusetts business trusts on January 26, 2009, December 1, 1998 and April 9, 2002, respectively.
The end of the reporting period for the Funds is February 28, 2019, and the period covered by these Notes to Financial Statements is the fiscal year ended February 28, 2019 (the "current fiscal period").
Investment Adviser
The Funds' investment adviser is Nuveen Fund Advisors, LLC (the "Adviser"), a subsidiary of Nuveen, LLC ("Nuveen"). Nuveen is the investment management arm of Teachers Insurance and Annuity Association of America (TIAA). The Adviser has overall responsibility for management of the Funds, oversees the management of the Funds' portfolios, manages the Funds' business affairs and provides certain clerical, bookkeeping and other administrative services, and, if necessary, asset allocation decisions. The Adviser has entered into sub-advisory agreements with Nuveen Asset Management, LLC (the "Sub-Adviser"), a subsidiary of the Adviser, under which the Sub-Adviser manages the investment portfolios of the Funds.
Investment Objectives and Principal Investment Strategies
Each Fund seeks to provide current income exempt from both regular federal and New York state income taxes, and in the case of NRK the alternative minimum tax ("AMT") applicable to individuals, by investing primarily in a portfolio of municipal obligations issued by state and local government authorities within the state of New York or certain U.S. territories. Under normal market conditions, each Fund invests at least 80% of the sum of its net assets and the amount of any borrowings for investment purposes in municipal bonds that pay interest that is exempt from regular federal personal income tax and a single state's personal income tax. Each Fund may invest up to 20% in municipal securities that are exempt from regular federal income tax, but not from that single state's income tax if, in the Sub-Adviser's judgement, such purchases are expected to enhance the Fund's after-tax total return potential. To the extent that each Fund invest in bonds of municipal issuers located in other states, each Fund may have income that is not exempt from state personal income tax.
Significant Accounting Policies
Each Fund is an investment company and follows accounting and reporting guidance under Financial Accounting Standards Board ("FASB") Accounting Standards Codification (ASC) Topic 946 "Financial Services – Investment Companies." The following is a summary of significant accounting policies followed by the Funds in the preparation of their financial statements in accordance with U.S. generally accepted accounting principles ("U.S. GAAP").
Investment Transactions
Investment transactions are recorded on a trade date basis. Realized gains and losses from investment transactions are determined on the specific identification method, which is the same basis used for federal income tax purposes. Investments purchased on a when-issued/delayed delivery basis may have extended settlement periods. Any investments so purchased are subject to market fluctuation during this period. The Funds have earmarked securities in their portfolios with a current value at least equal to the amount of the when-issued/delayed delivery purchase commitments.
As of the end of the reporting period, the Funds did not have any when-issued/delayed delivery purchase commitments.
Investment Income
Dividend Income is recorded on the ex-dividend date. Investment income is comprised of interest income, which reflects the amortization of premiums and accretion of discounts for financial reporting purposes, and is recorded on an accrual basis. Investment income also reflects payment-in-kind ("PIK") interest and paydown gains and losses, if any. PIK interest represents income received in the form of securities in lieu of cash.
61
Notes to Financial Statements (continued)
Professional Fees
Professional fees presented on the Statement of Operations consist of legal fees incurred in the normal course of operations, audit fees, tax consulting fees and, in some cases, workout expenditures. Workout expenditures are incurred in an attempt to protect or enhance an investment or to pursue other claims or legal actions on behalf of Fund shareholders. If a refund is received for workout expenditures paid in a prior reporting period, such amounts will be recognized as "Legal fee refund" on the Statement of Operations.
Dividends and Distributions to Common Shareholders
Dividends from net investment income, if any, are declared monthly. Net realized capital gains and/or market discount from investment transactions, if any, are distributed to shareholders at least annually. Furthermore, capital gains are distributed only to the extent they exceed available capital loss carryforwards.
Distributions to common shareholders of net investment income, net realized capital gains and/or market discount, if any, are recorded on the ex-dividend date. The amount and timing of distributions are determined in accordance with federal income tax regulations, which may differ from U.S. GAAP.
Compensation
The Funds pay no compensation directly to those of its directors/trustees who are affiliated with the Adviser or to its officers, all of whom receive remuneration for their services to the Funds from the Adviser or its affiliates. The Funds' Board of Trustees (the "Board") has adopted a deferred compensation plan for independent directors/trustees that enables trustees to elect to defer receipt of all or a portion of the annual compensation they are entitled to receive from certain Nuveen-advised funds. Under the plan, deferred amounts are treated as though equal dollar amounts had been invested in shares of select Nuveen-advised funds.
Indemnifications
Under the Funds' organizational documents, their officers and directors/trustees are indemnified against certain liabilities arising out of the performance of their duties to the Funds. In addition, in the normal course of business, the Funds enter into contracts that provide general indemnifications to other parties. The Funds' maximum exposure under these arrangements is unknown as this would involve future claims that may be made against the Funds that have not yet occurred. However, the Funds have not had prior claims or losses pursuant to these contracts and expect the risk of loss to be remote.
Netting Agreements
In the ordinary course of business, the Funds may enter into transactions subject to enforceable International Swaps and Derivative Association, Inc. (ISDA) master agreements or other similar arrangements ("netting agreements"). Generally, the right to offset in netting agreements allows each Fund to offset certain securities and derivatives with a specific counterparty, when applicable, as well as any collateral received or delivered to that counterparty based on the terms of the agreements. Generally, each Fund manages its cash collateral and securities collateral on a counterparty basis.
The Funds' investments subject to netting agreements as of the end of the reporting period, if any, are further described in Note 3 – Portfolio Securities and Investments in Derivatives.
Use of Estimates
The preparation of financial statements in conformity with U.S. GAAP requires management to make estimates and assumptions that affect the reported amounts of assets and liabilities at the date of the financial statements and the reported amounts of increases and decreases in net assets applicable to common shares from operations during the current fiscal period. Actual results may differ from those estimates.
2. Investment Valuation and Fair Value Measurements
The fair valuation input levels as described below are for fair value measurement purposes.
Fair value is defined as the price that would be received upon selling an investment or transferring a liability in an orderly transaction to an independent buyer in the principal or most advantageous market for the investment. A three-tier hierarchy is used to maximize the use of observable market data and minimize the use of unobservable inputs and to establish classification of fair value measurements for disclosure purposes. Observable inputs reflect the assumptions market participants would use in pricing the asset or liability. Observable inputs are based on market data obtained from sources independent of the reporting entity. Unobservable inputs reflect the reporting entity's own assumptions about the assumptions market participants would use in pricing the asset or liability. Unobservable inputs are based on the best information available in the circumstances. The following is a summary of the three-tiered hierarchy of valuation input levels.
Level 1 – Inputs are unadjusted and prices are determined using quoted prices in active markets for identical securities.
Level 2 – Prices are determined using other significant observable inputs (including quoted prices for similar securities, interest rates, credit spread, etc.).
Level 3 – Prices are determined using significant unobservable inputs (including management's assumptions in determining the fair value of investments).
62
Prices of fixed income securities are provided by an independent pricing service ("pricing service") approved by the Board. The pricing service establishes a security's fair value using methods that may include consideration of the following: yields or prices of investments of comparable quality, type of issue, coupon, maturity and rating, market quotes or indications of value from security dealers, evaluations of anticipated cash flows or collateral, general market conditions and other information and analysis, including the obligor's credit characteristics considered relevant. These securities are generally classified as Level 2. In pricing certain securities, particularly less liquid and lower quality securities, the pricing service may consider information about a security, its issuer or market activity, provided by the Adviser. These securities are generally classified as Level 2 or Level 3 depending on the observability of the significant inputs.
Certain securities may not be able to be priced by the pre-established pricing methods as described above. Such securities may be valued by the Board and/or its appointee at fair value. These securities generally include, but are not limited to, restricted securities (securities which may not be publicly sold without registration under the Securities Act of 1933, as amended) for which a pricing service is unable to provide a market price; securities whose trading has been formally suspended; debt securities that have gone into default and for which there is no current market quotation; a security whose market price is not available from a pre-established pricing source; a security with respect to which an event has occurred that is likely to materially affect the value of the security after the market has closed but before the calculation of a Fund's net asset value ("NAV") (as may be the case in non-U.S. markets on which the security is primarily traded) or make it difficult or impossible to obtain a reliable market quotation; and a security whose price, as provided by the pricing service, is not deemed to reflect the security's fair value. As a general principle, the fair value of a security would appear to be the amount that the owner might reasonably expect to receive for it in a current sale. A variety of factors may be considered in determining the fair value of such securities, which may include consideration of the following: yields or prices of investments of comparable quality, type of issue, coupon, maturity and rating, market quotes or indications of value from security dealers, evaluations of anticipated cash flows or collateral, general market conditions and other information and analysis, including the obligor's credit characteristics considered relevant. These securities are generally classified as Level 2 or Level 3 depending on the observability of the significant inputs. Regardless of the method employed to value a particular security, all valuations are subject to review by the Board and/or its appointee.
The inputs or methodologies used for valuing securities are not an indication of the risks associated with investing in those securities. The following is a summary of each Fund's fair value measurements as of the end of the reporting period:
| | | | | | | | | | | | | |
NNY | | Level 1 | | | Level 2 | | | Level 3 | | | Total | |
| Long-Term Investments*: | | | | | | | | | | | | |
| Municipal Bonds | | $ | — | | | $ | 150,591,500 | | | $ | — | | | $ | 150,591,500 | |
NYV | | | | | | | | | | | | | | | | |
| Long-Term Investments*: | | | | | | | | | | | | | | | | |
| Municipal Bonds | | $ | — | | | $ | 31,955,639 | | | $ | — | | | $ | 31,955,639 | |
| Short-Term Investments*: | | | | | | | | | | | | | | | | |
| Municipal Bonds | | | — | | | | 2,500,000 | | | | — | | | | 2,500,000 | |
| Total | | $ | — | | | $ | 34,455,639 | | | $ | — | | | $ | 34,455,639 | |
NAN | | | | | | | | | | | | | | | | |
| Long-Term Investments*: | | | | | | | | | | | | | | | | |
| Municipal Bonds | | $ | — | | | $ | 717,398,487 | | | $ | — | | | $ | 717,398,487 | |
NRK | | | | | | | | | | | | | | | | |
| Long-Term Investments*: | | | | | | | | | | | | | | | | |
| Municipal Bonds | | $ | — | | | $ | 1,987,484,526 | | | $ | — | | | $ | 1,987,484,526 | |
| * | Refer to the Fund's Portfolio of Investments for industry classifications. |
3. Portfolio Securities and Investments in Derivatives
Portfolio Securities
Inverse Floating Rate Securities
Each Fund is authorized to invest in inverse floating rate securities. An inverse floating rate security is created by depositing a municipal bond (referred to as an "Underlying Bond"), typically with a fixed interest rate, into a special purpose tender option bond ("TOB") trust (referred to as the "TOB Trust") created by or at the direction of one or more Funds. In turn, the TOB Trust issues (a) floating rate certificates (referred to as "Floaters"), in face amounts equal to some fraction of the Underlying Bond's par amount or market value, and (b) an inverse floating rate certificate (referred to as an "Inverse Floater") that represents all remaining or residual interest in the TOB Trust. Floaters typically pay short-term tax-exempt interest rates to third parties who are also provided a right to tender their certificate and receive its par value, which may be paid from the proceeds of a remarketing of the Floaters, by a loan to the TOB Trust from a third party liquidity provider ("Liquidity Provider"), or by the sale of assets from the TOB Trust. The Inverse
63
Notes to Financial Statements (continued)
Floater is issued to a long term investor, such as one or more of the Funds. The income received by the Inverse Floater holder varies inversely with the short-term rate paid to holders of the Floaters, and in most circumstances the Inverse Floater holder bears substantially all of the Underlying Bond's downside investment risk and also benefits disproportionately from any potential appreciation of the Underlying Bond's value. The value of an Inverse Floater will be more volatile than that of the Underlying Bond because the interest rate is dependent on not only the fixed coupon rate of the Underlying Bond but also on the short-term interest paid on the Floaters, and because the Inverse Floater essentially bears the risk of loss (and possible gain) of the greater face value of the Underlying Bond.
The Inverse Floater held by a Fund gives the Fund the right to (a) cause the holders of the Floaters to tender their certificates at par (or slightly more than par in certain circumstances), and (b) have the trustee of the TOB Trust (the "Trustee") transfer the Underlying Bond held by the TOB Trust to the Fund, thereby collapsing the TOB Trust.
The Fund may acquire an Inverse Floater in a transaction where it (a) transfers an Underlying Bond that it owns to a TOB Trust created by a third party or (b) transfers an Underlying Bond that it owns, or that it has purchased in a secondary market transaction for the purpose of creating an Inverse Floater, to a TOB Trust created at its direction, and in return receives the Inverse Floater of the TOB Trust (referred to as a "self-deposited Inverse Floater"). A Fund may also purchase an Inverse Floater in a secondary market transaction from a third party creator of the TOB Trust without first owning the Underlying Bond (referred to as an "externally-deposited Inverse Floater").
An investment in a self-deposited Inverse Floater is accounted for as a "financing" transaction (i.e., a secured borrowing). For a self-deposited Inverse Floater, the Underlying Bond deposited into the TOB Trust is identified in the Fund's Portfolio of Investments as "(UB) – Underlying bond of an inverse floating rate trust reflected as a financing transaction," with the Fund recognizing as liabilities, labeled "Floating rate obligations" on the Statement of Assets and Liabilities, (a) the liquidation value of Floaters issued by the TOB Trust, and (b) the amount of any borrowings by the TOB Trust from a Liquidity Provider to enable the TOB Trust to purchase outstanding Floaters in lieu of a remarketing. In addition, the Fund recognizes in "Investment Income" the entire earnings of the Underlying Bond, and recognizes (a) the interest paid to the holders of the Floaters or on the TOB Trust's borrowings, and (b) other expenses related to remarketing, administration, trustee, liquidity and other services to a TOB Trust, as a component of "Interest expense and amortization of offering costs" on the Statement of Operations.
In contrast, an investment in an externally-deposited Inverse Floater is accounted for as a purchase of the Inverse Floater and is identified in the Fund's Portfolio of Investments as "(IF) – Inverse floating rate investment." For an externally-deposited Inverse Floater, a Fund's Statement of Assets and Liabilities recognizes the Inverse Floater and not the Underlying Bond as an asset, and the Fund does not recognize the Floaters, or any related borrowings from a Liquidity Provider, as a liability. Additionally, the Fund reflects in "Investment Income" only the net amount of earnings on the Inverse Floater (net of the interest paid to the holders of the Floaters or the Liquidity Provider as lender, and the expenses of the Trust), and does not show the amount of that interest paid or the expenses of the TOB Trust as described above as interest expense on the Statement of Operations.
Fees paid upon the creation of a TOB Trust for self-deposited Inverse Floaters and externally-deposited Inverse Floaters are recognized as part of the cost basis of the Inverse Floater and are capitalized over the term of the TOB Trust.
As of the end of the reporting period, the aggregate value of Floaters issued by each Fund's TOB Trust for self-deposited Inverse Floaters and externally-deposited Inverse Floaters was as follows:
| | | | | | | | | | | | | |
Floating Rate Obligations Outstanding | | NNY | | | NYV | | | NAN | | | NRK | |
| Floating rate obligations: self-deposited Inverse Floaters | | $ | 1,840,000 | | | $ | — | | | $ | 34,300,000 | | | $ | 33,600,000 | |
| Floating rate obligations: externally-deposited Inverse Floaters | | | — | | | | — | | | | 18,750,000 | | | | — | |
| Total | | $ | 1,840,000 | | | $ | — | | | $ | 53,050,000 | | | $ | 33,600,000 | |
During the current fiscal period, the average amount of Floaters (including any borrowings from a Liquidity Provider) outstanding, and the average annual interest rate and fees related to self-deposited Inverse Floaters, were as follows:
| | | | | | | | | | | | | |
Self-Deposited Inverse Floaters | | NNY | | | NYV | | | NAN | | | NRK | |
| Average floating rate obligations outstanding | | $ | 1,840,000 | | | $ | — | | | $ | 24,284,041 | | | $ | 33,588,151 | |
| Average annual interest rate and fees | | | 2.00 | % | | | — | % | | | 2.01 | % | | | 2.04 | % |
TOB Trusts are supported by a liquidity facility provided by a Liquidity Provider pursuant to which the Liquidity Provider agrees, in the event that Floaters are (a) tendered to the Trustee for remarketing and the remarketing does not occur, or (b) subject to mandatory tender pursuant to the terms of the TOB Trust agreement, to either purchase Floaters or to provide the Trustee with an advance from a loan facility to fund the purchase of Floaters by the TOB Trust. In certain circumstances, the Liquidity Provider may otherwise elect to have the Trustee sell the Underlying Bond to retire the Floaters that were tendered and not remarketed prior to providing such a loan. In these circumstances, the Liquidity Provider remains obligated to provide a loan to the extent that the proceeds of the sale of the Underlying Bond is not sufficient to pay the purchase price of the Floaters.
64
The size of the commitment under the loan facility for a given TOB Trust is at least equal to the balance of that TOB Trust's outstanding Floaters plus any accrued interest. In consideration of the loan facility, fee schedules are in place and are charged by the Liquidity Provider(s). Any loans made by the Liquidity Provider will be secured by the purchased Floaters held by the TOB Trust. Interest paid on any outstanding loan balances will be effectively borne by the Fund that owns the Inverse Floaters of the TOB Trust that has incurred the borrowing and may be at a rate that is greater than the rate that would have been paid had the Floaters been successfully remarketed.
As described above, any amounts outstanding under a liquidity facility are recognized as a component of "Floating rate obligations" on the Statement of Assets and Liabilities by the Fund holding the corresponding Inverse Floaters issued by the borrowing TOB Trust. As of the end of the reporting period, there were no loans outstanding under any such facility.
Each Fund may also enter into shortfall and forbearance agreements (sometimes referred to as a "recourse arrangement") (TOB Trusts involving such agreements are referred to herein as "Recourse Trusts"), under which a Fund agrees to reimburse the Liquidity Provider for the Trust's Floaters, in certain circumstances, for the amount (if any) by which the liquidation value of the Underlying Bond held by the TOB Trust may fall short of the sum of the liquidation value of the Floaters issued by the TOB Trust plus any amounts borrowed by the TOB Trust from the Liquidity Provider, plus any shortfalls in interest cash flows. Under these agreements, a Fund's potential exposure to losses related to or on an Inverse Floater may increase beyond the value of the Inverse Floater as a Fund may potentially be liable to fulfill all amounts owed to holders of the Floaters or the Liquidity Provider. Any such shortfall amount in the aggregate is recognized as "Unrealized depreciation on Recourse Trusts" on the Statement of Assets and Liabilities.
As of the end of the reporting period, each Fund's maximum exposure to the Floaters issued by Recourse Trusts for self-deposited Inverse Floaters and externally-deposited Inverse Floaters was as follows:
| | | | | | | | | | | | | |
Floating Rate Obligations — Recourse Trusts | | NNY | | | NYV | | | NAN | | | NRK | |
| Maximum exposure to Recourse Trusts: self-deposited Inverse Floaters | | $ | 1,840,000 | | | $ | — | | | $ | 34,300,000 | | | $ | 33,600,000 | |
| Maximum exposure to Recourse Trusts: externally-deposited Inverse Floaters | | | — | | | | — | | | | 13,950,000 | | | | — | |
| Total | | $ | 1,840,000 | | | $ | — | | | $ | 48,250,000 | | | $ | 33,600,000 | |
Zero Coupon Securities
A zero coupon security does not pay a regular interest coupon to its holders during the life of the security. Income to the holder of the security comes from accretion of the difference between the original purchase price of the security at issuance and the par value of the security at maturity and is effectively paid at maturity. The market prices of zero coupon securities generally are more volatile than the market prices of securities that pay interest periodically.
Investments in Derivatives
In addition to the inverse floating rate securities in which each Fund may invest, which are considered portfolio securities for financial reporting purposes, each Fund is authorized to invest in certain other derivative instruments such as futures, options and swap contracts. Each Fund limits its investments in futures, options on futures and swap contracts to the extent necessary for the Adviser to claim the exclusion from registration by the Commodity Futures Trading Commission as a commodity pool operator with respect to the Fund. The Funds record derivative instruments at fair value, with changes in fair value recognized on the Statement of Operations, when applicable. Even though the Funds' investments in derivatives may represent economic hedges, they are not considered to be hedge transactions for financial reporting purposes.
Interest Rate Swap Contracts
Interest rate swap contracts involve a Fund's agreement with the counterparty to pay or receive a fixed rate payment in exchange for the counterparty receiving or paying a variable rate payment. Forward interest rate swap contracts involve a Fund's agreement with a counterparty to pay, in the future, a fixed or variable rate payment in exchange for the counterparty paying the Fund a variable or fixed rate payment, the accruals for which would begin at a specified date in the future (the "effective date").
The amount of the payment obligation for an interest rate swap is based on the notional amount and the termination date of the contract. Interest rate swap contracts do not involve the delivery of securities or other underlying assets or principal. Accordingly, the risk of loss with respect to the swap counterparty on such transactions is limited to the net amount of interest payments that the Fund is to receive.
Interest rate swap contracts are valued daily. Upon entering into an interest rate swap contract (and beginning on the effective date for a forward interest rate swap contract), the Fund accrues the fixed rate payment expected to be paid or received and the variable rate payment expected to be received or paid on the interest rate swap contracts on a daily basis, and recognizes the daily change in the fair value of the Fund's contractual rights and obligations under the contracts. For an over-the-counter ("OTC") swap that is not cleared through a clearing house ("OTC Uncleared"), the amount recorded on these transactions is recognized on the Statement of Assets and Liabilities as a component of "Unrealized appreciation or depreciation on interest rate swaps."
65
Notes to Financial Statements (continued)
Upon the execution of an OTC swap cleared through a clearing house ("OTC Cleared"), the Fund is obligated to deposit cash or eligible securities, also known as "initial margin," into an account at its clearing broker equal to a specified percentage of the contract amount. Cash deposited by the Fund to cover initial margin requirements on open swap contracts, if any, is recognized as a component of "Cash collateral at brokers for investments in swaps" on the Statement of Assets and Liabilities. Investments in OTC Cleared swaps obligate the Fund and the clearing broker to settle monies on a daily basis representing changes in the prior day's "mark-to-market" of the swap contract. If the Fund has unrealized appreciation, the clearing broker will credit the Fund's account with an amount equal to the appreciation. Conversely, if the Fund has unrealized depreciation, the clearing broker will debit the Fund's account with an amount equal to the depreciation. These daily cash settlements are also known as "variation margin." Variation margin for OTC Cleared swaps is recognized as a receivable and/or payable for "Variation margin on swap contracts" on the Statement of Assets and Liabilities. Upon the execution of an OTC Uncleared swap, neither the Fund nor the counterparty is required to deposit initial margin as the trades are recorded bilaterally between both parties to the swap contract, and the terms of the variation margin are subject to a predetermined threshold negotiated by the Fund and the counterparty. Variation margin for OTC Uncleared swaps is recognized as a component of "Unrealized appreciation or depreciation on interest rate swaps" as described in the preceding paragraph.
The net amount of periodic payments settled in cash are recognized as a component of "Net realized gain (loss) from swaps" on the Statement of Operations, in addition to the net realized gain or loss recorded upon the termination of the swap contract. For tax purposes, payments expected to be received or paid on the swap contracts are treated as ordinary income or expense, respectively. Changes in the value of the swap contracts during the fiscal period are recognized as a component of "Change in net unrealized appreciation (depreciation) of swaps" on the Statement of Operations. In certain instances, payments are made or received upon entering into the swap contract to compensate for differences between the stated terms of the swap agreements and prevailing market conditions (credit spreads, currency exchange rates, interest rates, and other relevant factors). Payments received or made at the beginning of the measurement period, if any, are recognized as "Interest rate swaps premiums received and/or paid" on the Statement of Assets and Liabilities.
During the current fiscal period, NRK invested in forward interest rate swap contracts to help reduce the Fund's duration.
The average notional amount of interest rate swaps contracts outstanding during the current fiscal period was as follows:
| | | | |
| | | NRK | |
| Average notional amount of interest rate swap contracts outstanding* | | $ | 6,200,000 | |
| * | The average notional amount is calculated based on the outstanding notional at the beginning of the current fiscal period and at the end of each fiscal quarter within the current fiscal period. |
The following table presents the amount of net realized gain (loss) and change in net unrealized appreciation (depreciation) recognized on swap contracts on the Statement of Operations during the current fiscal period, and the primary underlying risk exposure.
| | | | | |
| | | | | Unrealized |
| | | | Net Realized | Appreciation |
| | Underlying | Derivative | Gain (Loss) from | (Depreciation) of |
Fund | Risk Exposure | Instrument | Swaps | Swaps |
NRK | Interest rate | Swaps | $719,434 | $(627,281) |
Market and Counterparty Credit Risk
In the normal course of business each Fund may invest in financial instruments and enter into financial transactions where risk of potential loss exists due to changes in the market (market risk) or failure of the other party to the transaction to perform (counterparty credit risk). The potential loss could exceed the value of the financial assets recorded on the financial statements. Financial assets, which potentially expose each Fund to counterparty credit risk, consist principally of cash due from counterparties on forward, option and swap transactions, when applicable. The extent of each Fund's exposure to counterparty credit risk in respect to these financial assets approximates their carrying value as recorded on the Statement of Assets and Liabilities.
Each Fund helps manage counterparty credit risk by entering into agreements only with counterparties the Adviser believes have the financial resources to honor their obligations and by having the Adviser monitor the financial stability of the counterparties. Additionally, counterparties may be required to pledge collateral daily (based on the daily valuation of the financial asset) on behalf of each Fund with a value approximately equal to the amount of any unrealized gain above a pre-determined threshold. Reciprocally, when each Fund has an unrealized loss, the Funds have instructed the custodian to pledge assets of the Funds as collateral with a value approximately equal to the amount of the unrealized loss above a pre-determined threshold. Collateral pledges are monitored and subsequently adjusted if and when the valuations fluctuate, either up or down, by at least the pre-determined threshold amount.
66
4. Fund Shares
Common Share Transactions
Transactions in common shares for the Funds during the Funds' current and prior fiscal period, where applicable, were as follows:
| | | | | | | | | | | | | | | | | | | |
| | | NNY | | | NAN | | | NRK | |
| | | Year | | | Year | | | Year | | | Year | | | Year | | | Year | |
| | | Ended | | | Ended | | | Ended | | | Ended | | | Ended | | | Ended | |
| | | 2/28/19 | | | 2/28/18 | | | 2/28/19 | | | 2/28/18 | | | 2/28/19 | | | 2/28/18 | |
| Common shares: | | | | | | | | | | | | | | | | | | |
| Issued to shareholders due to reinvestment of distributions | | | — | | | | 16,015 | | | | — | | | | — | | | | — | | | | — | |
| Repurchased and retired | | | — | | | | — | | | | (275,214 | ) | | | — | | | | (383,200 | ) | | | — | |
| Weighted average common share: | | | | | | | | | | | | | | | | | | | | | | | | |
| Price per share repurchased and retired | | | — | | | | — | | | $ | 12.29 | | | | — | | | $ | 11.60 | | | | — | |
| Discount per share repurchased and retired | | | — | | | | — | | | | 15.03 | % | | | — | | | | 15.49 | % | | | — | |
Preferred Shares
Adjustable Rate MuniFund Term Preferred Shares
NAN has issued and has outstanding Adjustable Rate MuniFund Term Preferred ("AMTP") Shares, with a $100,000 liquidation preference per share. AMTP Shares are issued via private placement and are not publicly available.
The details of NAN's AMTP Shares outstanding as of the end of the reporting period, were as follows:
| | | | | |
| | | | | Liquidation |
| | | | | Preference |
| | | | | Net of |
| | | Shares | Liquidation | Deferred |
Fund | Series | Outstanding | Preference | Offering Costs |
NAN | 2028 | 1,470 | $147,000,000 | $146,818,962 |
The Fund is obligated to redeem its AMTP Shares by the date as specified in its offering document ("Term Redemption Date"), unless earlier redeemed by the Fund. AMTP Shares are subject to optional and mandatory redemption in certain circumstances. The AMTP Shares may be redeemed at the option of the Fund, subject to payment of premium for approximately six months following the date of issuance ("Premium Expiration Date"), and at the redemption price per share thereafter. The redemption price per share is equal to the sum of the liquidation preference per share plus any accumulated but unpaid dividends.
AMTP Shares are short-term or short/intermediate-term instruments that pay a variable dividend rate tied to a short-term index, plus an additional fixed "spread" amount which is initially established at the time of issuance and may be adjusted in the future based upon a mutual agreement between the majority owner and the Fund. From time-to-time the majority owner may propose to the Fund an adjustment to the dividend rate. Should the majority owner and the Fund fail to agree upon an adjusted dividend rate, and such proposed dividend rate adjustment is not withdrawn, the Fund will be required to redeem all outstanding shares upon the end of a notice period.
In addition, the Fund may be obligated to redeem a certain amount of the AMTP Shares if the Fund fails to maintain certain asset coverage and leverage ratio requirements and such failures are not cured by the applicable cure date. The Term Redemption Date and Premium Expiration Date for the Fund's AMTP Shares are as follows:
| | | | | | | | | | |
| | | Liquidation | | Notice | | | | Term | Premium |
Fund | | Preference | | Period | | Series | | Redemption Date | Expiration Date |
NAN | | $ | 147,000,000 | | 360-day | | | 2028 | | December 1, 2028* | November 30, 2019 |
* Subject to early termination by either the Fund or the holder.
The average liquidation preference of AMTP Shares outstanding and annualized dividend rate for the Fund during the current fiscal period were as follows:
| | | | |
| | | NAN* | |
| Average liquidation preference of AMTP Shares outstanding | | $ | 147,000,000 | |
| Annualized dividend rate | | | 2.58 | % |
| * | For the period December 13, 2018 through February 28, 2019. |
67
Notes to Financial Statements (continued)
AMTP Shares are subject to restrictions on transfer, generally do not trade, and market quotations are generally not available. The fair value of AMTP Shares is expected to be approximately their liquidation preference so long as the fixed "spread" on the AMTP Shares remains roughly in line with the "spread" being demanded by investors on instruments having similar terms in the current market environment. In present market conditions, the Funds' Adviser has determined that the fair value of AMTP Shares is approximately their liquidation preference, but their fair value could vary if market conditions change materially. For financial reporting purposes, the liquidation preference of AMTP Shares is a liability and is recognized as a component of "Adjustable Rate MuniFund Term Preferred ("AMTP") Shares, net of deferred offering costs" on the Statement of Assets and Liabilities.
AMTP Share dividends are treated as interest payments for financial reporting purposes. Unpaid dividends on AMTP Shares are recognized as a component of "Interest payable" on the Statement of Assets and Liabilities. Dividends accrued on AMTP Shares are recognized as a component of "Interest expense and amortization of offering costs" on the Statement of Operations.
NAN incurred offering costs of $185,000 in connection with its offering of AMTP Shares were recorded as deferred charges which are amortized over the life of the shares and are recognized as components of "Adjustable Rate MuniFund Term Preferred ("AMTP") Shares, net of deferred offering costs" on the Statement of Assets and Liabilities and "Interest expense and amortization of offering costs" on the Statement of Operations.
MuniFund Preferred Shares
NRK has issued and has outstanding MuniFund Preferred ("MFP") Shares, with a $100,000 liquidation preference per share. These MFP Shares were issued via private placement and are not publically available.
The Fund is obligated to redeem its MFP Shares by the date as specified in its offering documents ("Term Redemption Date"), unless earlier redeemed by the Fund. MFP Shares are initially issued in a pre-specified mode, however, MFP Shares can be subsequently designated as an alternative mode at a later date at the discretion of the Fund. The modes within MFP Shares detail the dividend mechanics and are described as follows. At a subsequent date, the Fund may establish additional mode structures with the MFP Share.
| ● | Variable Rate Remarketed Mode ("VRRM") – Dividends for MFP Shares within this mode will be established by a remarketing agent; therefore, the market value of the MFP Shares is expected to approximate its liquidation preference. Shareholders have the ability to request a best-efforts tender of its shares upon seven days notice. If the remarketing agent is unable to identify an alternative purchaser, the shares will be retained by the shareholder requesting tender and the subsequent dividend rate will increase to its step-up dividend rate. If after one consecutive year of unsuccessful remarketing attempts, the Fund will be required to designate an alternative mode or redeem the shares.
The Fund will pay a remarketing fee on the aggregate principal amount of all MFP Shares while designated in VRRM. Payments made by the Fund to the remarketing agent are recognized as "Remarketing fees" on the Statement of Operations. |
| ● | Variable Rate Mode ("VRM") – Dividends for MFP Shares designated in this mode are based upon a short-term index plus an additional fixed "spread" amount established at the time of issuance or renewal / conversion of its mode. At the end of the period of the mode, the Fund will be required to either extend the term of the mode, designate an alternative mode or redeem the MFP Shares.
The fair value of MFP Shares while in VRM are expected to approximate their liquidation preference so long as the fixed "spread" on the shares remains roughly in line with the "spread" being demanded by investors on instruments having similar terms in the current market. In current market conditions, the Adviser has determined that the fair value of the shares are approximately their liquidation preference, but their fair value could vary if market conditions change materially. |
| ● | Variable Rate Demand Mode ("VRDM") – Dividends for MFP Shares designated in this mode will be established by a remarketing agent; therefore, the market value of the MFP Shares is expected to approximate its liquidation preference. While in this mode, shares will have an unconditional liquidity feature that enable its shareholders to require a liquidity provider, which the Fund has entered into a contractual agreement, to purchase shares in the event that the shares are not able to be successfully remarketed. In the event that shares within this mode are unable to be successfully remarketed and are purchased by the liquidity provider, the dividend rate will be the maximum rate which is designed to escalate according to a specified schedule in order to enhance the remarketing agent's ability to successfully remarket the shares. The Fund is required to redeem any shares that are still owned by a liquidity provider after six months of continuous, unsuccessful remarketing.
The Fund will pay a liquidity and remarketing fee on the aggregate principal amount of all MFP Shares while within VRDM. Payments made by the Fund to the liquidity provider and remarketing agent are recognized as "Liquidity fees" and "Remarketing fees", respectively, on the Statement of Operations. |
For financial reporting purposes, the liquidation preference of MFP Shares is recorded as a liability and is recognized as a component of "MuniFund Preferred ("MFP") Shares, net of deferred offering costs" on the Statement of Assets and Liabilities. Dividends on the MFP shares are treated as interest payments for financial reporting purposes. Unpaid dividends on MFP shares are recognized as a component on "Interest payable" on the Statement of Assets and Liabilities. Dividends accrued on MFP Shares are recognized as a component of "Interest expense and amortization of offering costs" on the Statement of Operations.
68
Subject to certain conditions, MFP Shares may be redeemed, in whole or in part, at any time at the option of the Fund. The Fund may also be required to redeem certain MFP shares if the Fund fails to maintain certain asset coverage requirements and such failures are not cured by the applicable cure date. The redemption price per share in all circumstances is equal to the liquidation preference per share plus any accumulated but unpaid dividends.
Costs incurred in connection with the Fund's offering of MFP Shares were recorded as deferred charges which are amortized over the life of the shares. These offering costs are recognized as a component of "MuniFund Preferred ("MFP") Shares, net of deferred offering costs" on the Statement of Assets and Liabilities and "Interest expense and amortization of offering costs" on the Statement of Operations.
As of the end of the reporting period, details of the Fund's MFP Shares outstanding were as follows:
| | | | | | | | |
| | | | Liquidation | | | | |
| | | | Preference, | | | | |
| | | Shares | net of deferred | Liquidation | Term | | Mode |
Fund | Series | Outstanding | offering costs | Preference | Redemption Date | Mode | Termination Date |
NRK | A | 800 | $79,524,811 | $80,000,000 | May 1, 2047 | VRRM | N/A |
The average liquidation preference of MFP Shares outstanding and annualized dividend rate for the Fund during the current fiscal period were as follows:
| | | | |
| | | NRK | |
| Average liquidation preference of MFP Shares outstanding | | $ | 80,000,000 | |
| Annualized dividend rate | | | 1.76 | % |
Variable Rate MuniFund Term Preferred Shares
The following Fund had issued and had outstanding Variable Rate MuniFund Term Preferred ("VMTP") Shares, with a $100,000 liquidation preference per share. VMTP Shares are issued via private placement and are not publicly available.
On December 13, 2018, NAN redeemed all of its outstanding Series 2019 VMTP Shares. The Fund's VMTP Shares were redeemed at their $100,000 liquidation value per share, plus dividend amounts owed, using proceeds from its issuance of AMTP Shares (as described above in Adjustable Rate MuniFund Term Preferred Shares).
The average liquidation preference of VMTP Shares outstanding and annualized dividend rate for each Fund during the current fiscal period were as follows:
| | | | |
| | | NAN* | |
| Average liquidation preference of VMTP Shares outstanding | | $ | 147,000,000 | |
| Annualized dividend rate | | | 2.39 | % |
| * | For the period March 1, 2018 through December 12, 2018. |
VMTP Shares are subject to restrictions on transfer, generally do not trade, and market quotations are generally not available. VMTP Shares are short-term or short/intermediate-term instruments that pay a variable dividend rate tied to a short-term index, plus an additional fixed "spread" amount established at the time of issuance. The fair value of VMTP Shares is expected to be approximately their liquidation preference so long as the fixed "spread" on the VMTP Shares remains roughly in line with the "spread" being demanded by investors on instruments having similar terms in the current market environment. In present market conditions, the Funds' Adviser has determined that fair value of VMTP Shares is approximately their liquidation preference, but their fair value could vary if market conditions change materially. For financial reporting purposes, the liquidation preference of VMTP Shares is a liability and is recognized as a component of "Variable Rate MuniFund Term Preferred ("VMTP") Shares, net of deferred offering costs" on the Statement of Assets and Liabilities.
Dividends on the VMTP shares (which are treated as interest payments for financial reporting purposes) are set weekly. Unpaid dividends on VMTP Shares are recognized as a component of "Interest payable" on the Statement of Assets and Liabilities. Dividends accrued on VMTP Shares are recognized as a component of "Interest expense and amortization of offering costs" on the Statement of Operations.
Costs incurred in connection with each Fund's offering of VMTP Shares were recorded as deferred charges, and were amortized over the life of the shares and are recognized as components of "Variable Rate MuniFund Term Preferred ("VMTP") Shares, net of deferred offering costs" on the Statement of Assets and Liabilities and "Interest expense and amortization of offering costs" on the Statement of Operations.
Variable Rate Demand Preferred Shares
The following Funds have issued and have outstanding Variable Rate Demand Preferred ("VRDP") Shares, with a $100,000 liquidation preference per share. VRDP Shares are issued via private placement and are not publicly available.
69
Notes to Financial Statements (continued)
As of the end of the reporting period, NAN and NRK had $88,045,718 and $661,148,650 VRDP Shares at liquidation preference, net of deferred offering costs, respectively. Further details of each Fund's MFP Shares outstanding as of the end of the reporting period, were as follows:
| | | | | |
| | | Shares | Liquidation | |
Fund | Series | Outstanding | Preference | Maturity |
NAN | 1 | 890 | $ 89,000,000 | March 1, 2040 |
NRK | | | | |
| | 1 | 1,123 | $112,300,000 | August 1, 2040 |
| | 2 | 1,648 | $164,800,000 | August 1, 2040 |
| | 3 | 1,617 | $161,700,000 | December 1, 2040 |
| | 4 | 500 | $ 50,000,000 | June 1, 2040 |
| | 5 | 1,750 | $175,000,000 | June 1, 2046 |
VRDP Shares include a liquidity feature that allows VRDP shareholders to have their shares purchased by a liquidity provider with whom each Fund has contracted in the event that the VRDP Shares are not able to be successfully remarketed. Each Fund is required to redeem any VRDP Shares that are still owned by the liquidity provider after six months of continuous, unsuccessful remarketing. Each Fund pays an annual remarketing fee of 0.10% on the aggregate principal amount of all VRDP Shares outstanding. Each Fund's VRDP Shares have successfully remarketed since issuance.
Dividends on the VRDP Shares (which are treated as interest payments for financial reporting purposes) are set at a rate established by a remarketing agent; therefore, the market value of the VRDP Shares is expected to approximate its liquidation preference. In the event that VRDP Shares are unable to be successfully remarketed, the dividend rate will be the maximum rate which is designed to escalate according to a specified schedule in order to enhance the remarketing agent's ability to successfully remarket the VRDP Shares.
Subject to certain conditions, VRDP Shares may be redeemed, in whole or in part, at any time at the option of each Fund. Each Fund may also redeem certain of the VRDP Shares if the Fund fails to maintain certain asset coverage requirements and such failures are not cured by the applicable cure date. The redemption price per share is equal to the sum of the liquidation preference per share plus any accumulated but unpaid dividends.
The average liquidation preference of VRDP Shares outstanding and annualized dividend rate for each Fund during the current fiscal period were as follows:
| | | | | | | |
| | | NAN | | | NRK | |
| Average liquidation preference of VRDP Shares outstanding | | $ | 89,000,000 | | | $ | 663,800,000 | |
| Annualized dividend rate | | | 1.59 | % | | | 1.53 | % |
For financial reporting purposes, the liquidation preference of VRDP Shares is a liability and is recognized as a component of "Variable Rate Demand Preferred ("VRDP") Shares, net of deferred offering costs" on the Statement of Assets and Liabilities. Unpaid dividends on VRDP Shares are recognized as a component of "Interest payable" on the Statement of Assets and Liabilities, when applicable. Dividends accrued on VRDP Shares are recognized as a component of "Interest expense and amortization of offering costs" on the Statement of Operations. Costs incurred by the Funds in connection with their offerings of VRDP Shares were recorded as a deferred charge, which are amortized over the life of the shares and are recognized as a component of "Variable Rate Demand Preferred ("VRDP") Shares, net of deferred offering costs" on the Statement of Assets and Liabilities and "Interest expense and amortization of offerings costs" on the Statement of Operations. In addition to interest expense, each Fund also pays a per annum liquidity fee to the liquidity provider, as well as a remarketing fee, which are recognized as "Liquidity fees" and "Remarketing fees," respectively, on the Statement of Operations.
Preferred Share Transactions
Transactions in preferred shares for the Funds during the Funds' current and prior fiscal period, where applicable, are noted in the following tables.
Transactions in VMTP Shares for the Funds, where applicable, were as follows:
| | | | | | | | |
| | Year Ended | |
| | February 28, 2019 | |
NAN | Series | | Shares | | | Amount | |
| VMTP Shares redeemed | 2019 | | | (1,470 | ) | | $ | (147,000,000 | ) |
| | | | | | | | | | |
| | Year Ended | |
| | February 28, 2019 | |
NAN | Series | | Shares | | | Amount | |
| AMTP Shares issued | 2028 | | | 1,470 | | | $ | 147,000,000 | |
70
5. Investment Transactions
Long-term purchases and sales (including maturities but excluding derivative transactions, where applicable) during the current fiscal period were as follows:
| | | | | | | | | | | | | |
| | | NNY | | | NYV | | | NAN | | | NRK | |
| Purchases | | $ | 25,173,360 | | | $ | 11,756,130 | | | $ | 189,071,559 | | | $ | 434,925,411 | |
| Sales and maturities | | | 24,729,910 | | | | 15,485,476 | | | | 162,464,021 | | | | 410,128,695 | |
6. Income Tax Information
Each Fund is a separate taxpayer for federal income tax purposes. Each Fund intends to distribute substantially all of its net investment income and net capital gains to shareholders and to otherwise comply with the requirements of Subchapter M of the Internal Revenue Code applicable to regulated investment companies. Therefore, no federal income tax provision is required. Furthermore, each Fund intends to satisfy conditions that will enable interest from municipal securities, which is exempt from regular federal and New York state income taxes, and in the case of NRK the AMT applicable to individuals, to retain such tax-exempt status when distributed to shareholders of the Funds. Net realized capital gains and ordinary income distributions paid by the Funds are subject to federal taxation.
For all open tax years and all major taxing jurisdictions, management of the Funds has concluded that there are no significant uncertain tax positions that would require recognition in the financial statements. Open tax years are those that are open for examination by taxing authorities (i.e., generally the last four tax year ends and the interim tax period since then). Furthermore, management of the Funds is also not aware of any tax positions for which it is reasonably possible that the total amounts of unrecognized tax benefits will significantly change in the next twelve months.
The following information is presented on an income tax basis. Differences between amounts for financial statement and federal income tax purposes are primarily due to the timing differences in recognizing taxable market discount, timing differences in recognizing certain gains and losses on investment transactions and the treatment of investments in inverse floating rate securities reflected as financing transactions, if any. To the extent that differences arise that are permanent in nature, such amounts are reclassified within the capital accounts as detailed below. Temporary differences do not require reclassification. Temporary and permanent differences do not impact the NAVs of the Funds.
The table below presents the cost and unrealized appreciation (depreciation) of each Fund's investment portfolio, as determined on a federal income tax basis, as of February 28, 2019.
| | | | | |
| | NNY | NYV | NAN | NRK |
| Tax cost of investments | $142,636,785 | $31,873,963 | $652,682,896 | $1,846,330,225 |
| Gross unrealized: | | | | |
| Appreciation | $ 6,494,787 | $ 2,611,902 | $ 31,956,140 | $ 109,091,793 |
| Depreciation | (380,504) | (30,226) | (1,540,631) | (1,537,503) |
| Net unrealized appreciation (depreciation) of investments | $ 6,114,283 | $ 2,581,676 | $ 30,415,509 | $ 107,554,290 |
Permanent differences, primarily due to federal taxes paid, taxable market discount and nondeductible offering costs, resulted in reclassifications among the Funds' components of common share net assets as of February 28, 2019, the Funds' tax year end.
The tax components of undistributed net tax-exempt income, net ordinary income and net long-term capital gains as of February 28, 2019, the Funds' tax year end, were as follows:
| | | | | | | | | | | | | |
| | | NNY | | | NYV | | | NAN | | | NRK | |
Undistributed net tax-exempt income1 | | $ | 398,834 | | | $ | 88,708 | | | $ | 1,324,400 | | | $ | 1,861,573 | |
Undistributed net ordinary income2 | | | 168,676 | | | | — | | | | 175,434 | | | | 183,998 | |
| Undistributed net long-term capital gains | | | — | | | | — | | | | — | | | | — | |
1 | Undistributed net tax-exempt income (on a tax basis) has not been reduced for the dividend declared on February 1, 2019, and paid on March 1, 2019. |
2 | Net ordinary income consists of taxable market discount income and net short-term capital gains, if any. |
71
Notes to Financial Statements (continued)
The tax character of distributions paid during the Funds' tax years ended February 28, 2019 and February 28, 2018 was designated for purposes of the dividends paid deduction as follows:
| | | | | | | | | | | | | |
2019 | | NNY | | | NYV | | | NAN | | | NRK | |
Distributions from net tax-exempt income3 | | $ | 5,430,441 | | | $ | 1,193,590 | | | $ | 22,899,246 | | | $ | 59,010,927 | |
Distributions from net ordinary income2 | | | 48,275 | | | | 4,712 | | | | 64,052 | | | | 20,610 | |
| Distributions from net long-term capital gains | | | — | | | | — | | | | — | | | | — | |
| | |
2018 | | NNY | | | NYV | | | NAN | | | NRK | |
| Distributions from net tax-exempt income | | $ | 5,703,718 | | | $ | 1,346,669 | | | $ | 25,379,025 | | | $ | 62,250,319 | |
Distributions from net ordinary income2 | | | 51,743 | | | | 63,843 | | | | 171,196 | | | | 19,932 | |
| Distributions from net long-term capital gains | | | — | | | | 248,784 | | | | — | | | | — | |
2 | Net ordinary income consists of taxable market discount income and net short-term capital gains, if any. |
3 | The Funds hereby designate these amounts paid during the fiscal year ended February 28, 2019, as Exempt Interest Dividends. |
As of February 28, 2019, the Funds' tax year end, the Funds had unused capital losses carrying forward available for federal income tax purposes to be applied against future capital gains, if any. The capital losses are not subject to expiration.
| | | | | | | | | | | | | |
| | | NNY | | | NYV | | | NAN4 | | | NRK | |
| Not subject to expiration: | | | | | | | | | | | | |
| Short-term | | $ | 1,354,305 | | | $ | 141,481 | | | $ | 10,739,381 | | | $ | 37,853,446 | |
| Long-term | | | — | | | | — | | | | 2,328,980 | | | | 10,883,587 | |
| Total | | $ | 1,354,305 | | | $ | 141,481 | | | $ | 13,068,361 | | | $ | 48,737,033 | |
4 | A portion of NAN's capital loss carryforward is subject to an annual limitation under the Internal Revenue Code and related regulations. |
During the Funds' tax year ended February 28, 2019, the following Funds utilized capital loss carryforwards as follows:
| | | | | | | |
| | | NNY | | | NAN | |
| Utilized capital loss carryforwards | | $ | 649,711 | | | $ | 520,185 | |
7. Management Fees and Other Transactions with Affiliates
Management Fees
Each Fund's management fee compensates the Adviser for overall investment advisory and administrative services and general office facilities. The Sub-Adviser is compensated for its services to the Funds from the management fees paid to the Adviser.
Each Fund's management fee consists of two components — a fund-level fee, based only on the amount of assets within each individual Fund, and a complex-level fee, based on the aggregate amount of all eligible fund assets managed by the Adviser and for NNY a gross interest income component. This pricing structure enables Fund shareholders to benefit from growth in the assets within their respective Fund as well as from growth in the amount of complex-wide assets managed by the Adviser.
NNY pays an annual fund-level fee, payable monthly, of 0.15% of the average daily net assets of the Fund, as well as 4.125% of the gross interest income (excluding interest on bonds underlying a "self-deposited inverse floater" trust that is attributed to the Fund over and above the net interest earned on the inverse floater itself) of the Fund.
72
The annual fund-level fee, payable monthly, for each Fund (excluding NNY) is calculated according to the following schedules:
| | | | |
| | | NYV | |
Average Daily Net Assets* | | Fund-Level Fee Rate | |
| For the first $125 million | | | 0.4000 | % |
| For the next $125 million | | | 0.3875 | |
| For the next $250 million | | | 0.3750 | |
| For the next $500 million | | | 0.3625 | |
| For the next $1 billion | | | 0.3500 | |
| For the next $3 billion | | | 0.3250 | |
| For managed assets over $5 billion | | | 0.3125 | |
| | | | | |
| | | NAN | |
| | | NRK | |
Average Daily Managed Assets* | | Fund-Level Fee Rate | |
| For the first $125 million | | | 0.4500 | % |
| For the next $125 million | | | 0.4375 | |
| For the next $250 million | | | 0.4250 | |
| For the next $500 million | | | 0.4125 | |
| For the next $1 billion | | | 0.4000 | |
| For the next $3 billion | | | 0.3750 | |
| For managed assets over $5 billion | | | 0.3625 | |
The annual complex-level fee, payable monthly, for each Fund is calculated by multiplying the current complex-wide fee rate, determined according to the following schedule by the Fund's daily managed assets (net assets for NNY and NYV):
| | | | |
Complex-Level Eligible Asset Breakpoint Level* | | Effective Complex-Level Fee Rate at Breakpoint Level | |
| $55 billion | | | 0.2000 | % |
| $56 billion | | | 0.1996 | |
| $57 billion | | | 0.1989 | |
| $60 billion | | | 0.1961 | |
| $63 billion | | | 0.1931 | |
| $66 billion | | | 0.1900 | |
| $71 billion | | | 0.1851 | |
| $76 billion | | | 0.1806 | |
| $80 billion | | | 0.1773 | |
| $91 billion | | | 0.1691 | |
| $125 billion | | | 0.1599 | |
| $200 billion | | | 0.1505 | |
| $250 billion | | | 0.1469 | |
| $300 billion | | | 0.1445 | |
| * | For the complex-level fees, managed assets include closed-end fund assets managed by the Adviser that are attributable to certain types of leverage. For these purposes, leverage includes the funds' use of preferred stock and borrowings and certain investments in the residual interest certificates (also called inverse floating rate securities) in tender option bond (TOB) trusts, including the portion of assets held by a TOB trust that has been effectively financed by the trust's issuance of floating rate securities, subject to an agreement by the Adviser as to certain funds to limit the amount of such assets for determining managed assets in certain circumstances. The complex-level fee is calculated based upon the aggregate daily managed assets of all Nuveen open-end and closed-end funds that constitute "eligible assets." Eligible assets do not include assets attributable to investments in other Nuveen funds or assets in excess of a determined amount (originally $2 billion) added to the Nuveen fund complex in connection with the Adviser's assumption of the management of the former First American Funds effective January 1, 2011. As of February 28, 2019, the complex-level fee for each Fund was 0.1591%. |
Other Transactions with Affiliates
Each Fund is permitted to purchase or sell securities from or to certain other funds managed by the Adviser ("inter-fund trade") under specified conditions outlined in procedures adopted by the Board. These procedures have been designed to ensure that any inter-fund trade of securities by the Fund from or to another fund that is, or could be, considered an affiliate of the Fund under certain limited circumstances by virtue of having a common investment adviser (or affiliated investment adviser), common officer and/or common trustee complies with Rule 17a-7 of the 1940 Act. Further, as defined under these procedures, each inter-fund trade is effected at the current market price as provided by an independent pricing service. Unsettled inter-fund trades as of the end of the reporting period are recognized as a component of "Receivable for investments sold" and/or "Payable for investments purchased" on the Statement of Assets and Liabilities, when applicable.
73
Notes to Financial Statements (continued)
During the current fiscal period, the Funds engaged in inter-fund trades pursuant to these procedures as follows:
| | | | | | | | | | | | | |
Inter-Fund Trades | | NNY | | | NYV | | | NAN | | | NRK | |
| Purchases | | $ | 2,000,608 | | | $ | 2,825,833 | | | $ | 12,436,533 | | | $ | 69,570,668 | |
| Sales | | | 2,008,438 | | | | 2,827,901 | | | | 12,100,886 | | | | 63,227,567 | |
8. Borrowing Arrangements
Committed Line of Credit
The Funds, along with certain other funds managed by the Adviser ("Participating Funds"), have established a 364-day, approximately $2.65 billion standby credit facility with a group of lenders, under which the Participating Funds may borrow for various purposes other than leveraging for investment purposes. Each Participating Fund is allocated a designated proportion of the facility's capacity (and its associated costs, as described below) based upon a multi-factor assessment of the likelihood and frequency of its need to draw on the facility, the size of the Fund and its anticipated draws, and the potential importance of such draws to the operations and well-being of the Fund, relative to those of the other Funds. A Fund may effect draws on the facility in excess of its designated capacity if and to the extent that other Participating Funds have undrawn capacity. The credit facility expires in July 2019 unless extended or renewed.
The credit facility has the following terms: a fee of 0.15% per annum on unused commitment amounts, and interest at a rate equal to the higher of (a) one-month LIBOR (London Inter-Bank Offered Rate) plus 1.00% per annum or (b) the Fed Funds rate plus 1.00% per annum on amounts borrowed. Participating Funds paid administration, legal and arrangement fees, which are recognized as a component of "Other expenses" on the Statement of Operations, and along with commitment fees, have been allocated among such Participating Funds based upon the relative proportions of the facility's aggregate capacity reserved for them and other factors deemed relevant by the Adviser and the Board of each Participating Fund.
During the current fiscal period, the following Funds utilized this facility. The Funds' maximum outstanding balance during the utilization period was as follows:
| | | | | | | | | | |
| | | NYV | | | NAN | | | NRK | |
| Maximum Outstanding Balance | | $ | 59,902 | | | $ | 18,900,000 | | | $ | 6,600,000 | |
During each Fund's utilization period(s) during the current fiscal period, the average daily balance outstanding and average annual interest rate on the Borrowings were as follows:
| | | | | | | | | | |
| | | NYV | | | NAN | | | NRK | |
| Average daily balance outstanding | | $ | 59,902 | | | $ | 7,137,039 | | | $ | 3,892,157 | |
| Average annual interest rate | | | 3.50 | % | | | 3.50 | % | | | 3.21 | % |
Borrowings outstanding as of the end of the reporting period are recognized as "Borrowings" on the Statement of Assets and Liabilities. NNY did not utilize this facility during the current fiscal period.
Inter-Fund Borrowing and Lending
The Securities and Exchange Commission ("SEC") has granted an exemptive order permitting registered open-end and closed-end Nuveen funds to participate in an inter-fund lending facility whereby the Nuveen funds may directly lend to and borrow money from each other for temporary purposes (e.g., to satisfy redemption requests or when a sale of securities "fails," resulting in an unanticipated cash shortfall) (the "Inter-Fund Program"). The closed-end Nuveen funds, including the Funds covered by this shareholder report, will participate only as lenders, and not as borrowers, in the Inter-Fund Program because such closed-end funds rarely, if ever, need to borrow cash to meet redemptions. The Inter-Fund Program is subject to a number of conditions, including, among other things, the requirements that (1) no fund may borrow or lend money through the Inter-Fund Program unless it receives a more favorable interest rate than is typically available from a bank or other financial institution for a comparable transaction; (2) no fund may borrow on an unsecured basis through the Inter-Fund Program unless the fund's outstanding borrowings from all sources immediately after the inter-fund borrowing total 10% or less of its total assets; provided that if the borrowing fund has a secured borrowing outstanding from any other lender, including but not limited to another fund, the inter-fund loan must be secured on at least an equal priority basis with at least an equivalent percentage of collateral to loan value; (3) if a fund's total outstanding borrowings immediately after an inter-fund borrowing would be greater than 10% of its total assets, the fund may borrow through the inter-fund loan on a secured basis only; (4) no fund may lend money if the loan would cause its aggregate outstanding loans through the Inter-Fund Program to exceed 15% of its net assets at the time of the loan; (5) a fund's inter-fund loans to any one fund shall not exceed 5% of the lending fund's net assets; (6) the duration of inter-fund loans will be limited to the time required to receive payment for securities sold, but in no event more than seven days; and (7) each inter-fund loan may be called on one business day's notice by a lending fund and may be repaid on any day by a borrowing fund. In addition, a Nuveen fund may participate in the Inter-Fund Program only if and to the extent that such participation is consistent with the fund's investment objective and investment policies. The Board is responsible for overseeing the Inter-Fund Program.
74
The limitations detailed above and the other conditions of the SEC exemptive order permitting the Inter-Fund Program are designed to minimize the risks associated with Inter-Fund Program for both the lending fund and the borrowing fund. However, no borrowing or lending activity is without risk. When a fund borrows money from another fund, there is a risk that the loan could be called on one day's notice or not renewed, in which case the fund may have to borrow from a bank at a higher rate or take other actions to payoff such loan if an inter-fund loan is not available from another fund. Any delay in repayment to a lending fund could result in a lost investment opportunity or additional borrowing costs.
During the current reporting period, none of the Funds covered by this shareholder report have entered into any inter-fund loan activity.
9. New Accounting Pronouncements
Disclosure Update and Simplification
During August 2018, the SEC issued Final Rule Release No. 33-10532, Disclosure Update and Simplification ("Final Rule Release No. 33-10532"). Final Rule Release No. 33-10532 amends certain financial statement disclosure requirements to conform to U.S. GAAP. The amendments to Rule 6-04.17 of Regulation S-X (balance sheet) remove the requirement to separately state the book basis components of net assets: undistributed (over-distribution of) net investment income ("UNII"), accumulated undistributed net realized gains (losses), and net unrealized appreciation (depreciation) at the balance sheet date. Instead, consistent with U.S. GAAP, funds will be required to disclose total distributable earnings. The amendments to Rule 6-09 of Regulation S-X (statement of changes in net assets) remove the requirement to separately state the sources of distributions paid. Instead, consistent with U.S. GAAP, funds will be required to disclose the total amount of distributions paid, except that any tax return of capital must be separately disclosed. The amendments also remove the requirement to parenthetically state the book basis amount of UNII on the statement of changes in net assets.
The requirements of Final Rule Release No. 33-10532 are effective November 5, 2018, and the Funds' Statement of Assets and Liabilities and Statement of Changes in Net Assets for the current reporting period have been modified accordingly. In addition, certain amounts within each Fund's Statement of Changes in Net Assets for the prior fiscal period have been modified to conform to Final Rule Release No. 33-10532.
For the prior fiscal period, the total amount of distributions paid to shareholders from net investment income and from accumulated net realized gains, if any, are recognized as "Dividends" on the Statement of Changes in Net Assets.
As of February 28, 2018, the Fund's Statement of Changes in Net Assets reflected the following balances.
| | | | | | | | | | | | | |
| | | NNY | | | NYV | | | NAN | | | NRK | |
Distributions to Common Shareholders | | | | | | | | | | | | |
| From net investment income | | $ | (5,733,138 | ) | | $ | (1,392,615 | ) | | $ | (21,695,203 | ) | | $ | (54,016,808 | ) |
| From accumulated net realized gains | | | — | | | | (249,059 | ) | | | — | | | | — | |
| Decrease in net assets applicable to common shares from distributions to common shareholders | | | (5,733,138 | ) | | | (1,641,674 | ) | | | (21,695,203 | ) | | | (54,016,808 | ) |
| UNII at the end of period | | $ | 343,453 | | | $ | 182,040 | | | $ | (479,302 | ) | | $ | (1,813,300 | ) |
FASB Accounting Standards Update ("ASU") 2017-08 ("ASU 2017-08") Premium Amortization on Purchased Callable Debt Securities
The FASB has issued ASU 2017-08, which shortens the premium amortization period for purchased non-contingently callable debt securities. ASU 2017-08 specifies that the premium amortization period ends at the earliest call date, for purchased non-contingently callable debt securities. ASU 2017-08 is effective for fiscal years, and interim periods within those fiscal years, beginning after December 15, 2018. Management is currently evaluating the implications of ASU 2017-08, if any.
Fair Value Measurement: Disclosure Framework
During August 2018, the FASB issued ASU 2018-13 ("ASU 2018-13"), Fair Value Measurement: Disclosure Framework – Changes to the Disclosure Requirements for Fair Value Measurements. ASU 2018-13 modifies the disclosures required by Topic 820, Fair Value Measurements. The amendments in ASU 2018-13 are effective for all entities for fiscal years, and interim periods within those fiscal years, beginning after December 15, 2019. During the current reporting period, management early implemented this guidance. This implementation did not have a material impact on the Funds' financial statements.
75
Additional Fund Information (Unaudited)
| | | | | | |
Board of Directors/Trustees | | | | |
| Margo Cook* | Jack B. Evans | William C. Hunter | Albin F. Moschner | John K. Nelson | Judith M. Stockdale |
| Carole E. Stone | Terence J. Toth | Margaret L. Wolff | Robert C. Young | | |
| |
| * Interested Board Member. |
| |
| |
Fund Manager | Custodian | Legal Counsel | Independent Registered | Transfer Agent and |
| Nuveen Fund Advisors, LLC | State Street Bank | Chapman and Cutler LLP | Public Accounting Firm | Shareholder Services |
| 333 West Wacker Drive | & Trust Company | Chicago, IL 60603 | KPMG LLP | Computershare Trust |
| Chicago, IL 60606 | One Lincoln Street | | 200 East Randolph Street | Company, N.A. |
| | Boston, MA 02111 | | Chicago, IL 60601 | 250 Royall Street |
| | | | | Canton, MA 02021 |
| | | | | (800) 257-8787 |
Portfolio of Investments Information
Each Fund is required to file its complete schedule of portfolio holdings with the Securities and Exchange Commission (SEC) for the first and third quarters of each fiscal year as an exhibit to its report on Form N-PORT. You may obtain this information on the SEC's website at http://www.sec.gov.
Nuveen Funds' Proxy Voting InformationYou may obtain (i) information regarding how each fund voted proxies relating to portfolio securities held during the most recent twelve-month period ended June 30, without charge, upon request, by calling Nuveen toll-free at (800) 257-8787 or on Nuveen's website at www.nuveen.com and (ii) a description of the policies and procedures that each fund used to determine how to vote proxies relating to portfolio securities without charge, upon request, by calling Nuveen toll free at (800) 257-8787. You may also obtain this information directly from the SEC. Visit the SEC on-line at http://www.sec.gov.
CEO Certification DisclosureEach Fund's Chief Executive Officer (CEO) has submitted to the New York Stock Exchange (NYSE) the annual CEO certification as required by Section 303A.12(a) of the NYSE Listed Company Manual. Each Fund has filed with the SEC the certification of its CEO and Chief Financial Officer required by Section 302 of the Sarbanes-Oxley Act.
Common Share RepurchasesEach Fund intends to repurchase, through its open-market share repurchase program, shares of its own common stock at such times and in such amounts as is deemed advisable. During the period covered by this report, each Fund repurchased shares of its common stock as shown in the accompanying table. Any future repurchases will be reported to shareholders in the next annual or semi-annual report.
| | | | | |
| | NNY | NYV | NAN | NRK |
| Common shares repurchased | — | — | 275,214 | 383,200 |
FINRA BrokerCheck
The Financial Industry Regulatory Authority (FINRA) provides information regarding the disciplinary history of FINRA member firms and associated investment professionals. This information as well as an investor brochure describing FINRA BrokerCheck is available to the public by calling the FINRA BrokerCheck Hotline number at (800) 289-9999 or by visiting www.FINRA.org.
76Glossary of Terms Used in this Report (Unaudited)
| ■ | Auction Rate Bond: An auction rate bond is a security whose interest payments are adjusted periodically through an auction process, which process typically also serves as a means for buying and selling the bond. Auctions that fail to attract enough buyers for all the shares offered for sale are deemed to have "failed," with current holders receiving a formula-based interest rate until the next scheduled auction. |
| ■ | Average Annual Total Return: This is a commonly used method to express an investment's performance over a particular, usually multi-year time period. It expresses the return that would have been necessary each year to equal the investment's actual cumulative performance (including change in NAV or market price and reinvested dividends and capital gains distributions, if any) over the time period being considered. |
| ■ | Duration: Duration is a measure of the expected period over which a bond's principal and interest will be paid, and consequently is a measure of the sensitivity of a bond's or bond fund's value to changes when market interest rates change. Generally, the longer a bond's or fund's duration, the more the price of the bond or fund will change as interest rates change. |
| ■ | Effective Leverage: Effective leverage is a fund's effective economic leverage, and includes both regulatory leverage (see leverage) and the leverage effects of certain derivative investments in the fund's portfolio. Currently, the leverage effects of Tender Option Bond (TOB) inverse floater holdings are included in effective leverage values, in addition to any regulatory leverage. |
| ■ | Gross Domestic Product (GDP): The total market value of all final goods and services produced in a country/region in a given year, equal to total consumer, investment and government spending, plus the value of exports, minus the value of imports. |
| ■ | Inverse Floating Rate Securities: Inverse floating rate securities, also known as inverse floaters or tender option bonds (TOBs), are created by depositing a municipal bond, typically with a fixed interest rate, into a special purpose trust. This trust, in turn, (a) issues floating rate certificates typically paying short-term tax-exempt interest rates to third parties in amounts equal to some fraction of the deposited bond's par amount or market value, and (b) issues an inverse floating rate certificate (sometimes referred to as an "inverse floater") to an investor (such as a Fund) interested in gaining investment exposure to a long-term municipal bond. The income received by the holder of the inverse floater varies inversely with the short-term rate paid to the floating rate certificates' holders, and in most circumstances the holder of the inverse floater bears substantially all of the underlying bond's downside investment risk. The holder of the inverse floater typically also benefits disproportionately from any potential appreciation of the underlying bond's value.
Hence, an inverse floater essentially represents an investment in the underlying bond on a leveraged basis. |
| ■ | Leverage: Leverage is created whenever a fund has investment exposure (both reward and/or risk) equivalent to more than 100% of the investment capital. |
| ■ | Net Asset Value (NAV) Per Share: A fund's Net Assets is equal to its total assets (securities, cash, accrued earnings and receivables) less its total liabilities. NAV per share is equal to the fund's Net Assets divided by its number of shares outstanding. |
| ■ | Pre-Refunding: Pre-Refunding, also known as advanced refundings or refinancings, is a procedure used by state and local governments to refinance municipal bonds to lower interest expenses. The issuer sells new bonds with a lower yield and uses the proceeds to buy U.S. Treasury securities, the interest from which is used to make payments on the higher-yielding bonds. Because of this collateral, pre-refunding generally raises a bond's credit rating and thus its value. |
77
Glossary of Terms Used in this Report (Unaudited) (continued)
| ■ | Regulatory Leverage: Regulatory Leverage consists of preferred shares issued by or borrowings of a fund. Both of these are part of a fund's capital structure. Regulatory leverage is subject to asset coverage limits set in the Investment Company Act of 1940. |
| ■ | S&P Municipal Bond Index: An unleveraged, market value-weighted index designed to measure the performance of the tax-exempt, investment-grade U.S. municipal bond market. Index returns assume reinvestment of distributions but do not reflect any applicable sales charges or management fees. |
| ■ | S&P Municipal Bond New York Index: An unleveraged, market value-weighted index designed to measure the performance of the tax-exempt, investment-grade New York municipal bond market. Index returns assume reinvestment of distributions but do not reflect any applicable sales charges or management fees. |
| ■ | Total Investment Exposure: Total investment exposure is a fund's assets managed by the Adviser that are attributable to financial leverage. For these purposes, financial leverage includes a fund's use of preferred stock and borrowings and investments in the residual interest certificates (also called inverse floating rate securities) in tender option bond (TOB) trusts, including the portion of assets held by a TOB trust that has been effectively financed by the trust's issuance of floating rate securities. |
| ■ | Zero Coupon Bond: A zero coupon bond does not pay a regular interest coupon to its holders during the life of the bond. Income to the holder of the bond comes from accretion of the difference between the original purchase price of the bond at issuance and the par value of the bond at maturity and is effectively paid at maturity. The market prices of zero coupon bonds generally are more volatile than the market prices of bonds that pay interest periodically. |
78
Reinvest Automatically, Easily and Conveniently
Nuveen makes reinvesting easy. A phone call is all it takes to set up your reinvestment account.
Nuveen Closed-End Funds Automatic Reinvestment PlanNuveen Closed-End Fund allows you to conveniently reinvest distributions in additional Fund shares. By choosing to reinvest, you'll be able to invest money regularly and automatically, and watch your investment grow through the power of compounding. Just like distributions in cash, there may be times when income or capital gains taxes may be payable on distributions that are reinvested. It is important to note that an automatic reinvestment plan does not ensure a profit, nor does it protect you against loss in a declining market.
Easy and convenient
To make recordkeeping easy and convenient, each month you'll receive a statement showing your total distributions, the date of investment, the shares acquired and the price per share, and the total number of shares you own.
How shares are purchased
The shares you acquire by reinvesting will either be purchased on the open market or newly issued by the Fund. If the shares are trading at or above net asset value at the time of valuation, the Fund will issue new shares at the greater of the net asset value or 95% of the then-current market price. If the shares are trading at less than net asset value, shares for your account will be purchased on the open market. If the Plan Agent begins purchasing Fund shares on the open market while shares are trading below net asset value, but the Fund's shares subsequently trade at or above their net asset value before the Plan Agent is able to complete its purchases, the Plan Agent may cease open-market purchases and may invest the uninvested portion of the distribution in newly-issued Fund shares at a price equal to the greater of the shares' net asset value or 95% of the shares' market value on the last business day immediately prior to the purchase date. Distributions received to purchase shares in the open market will normally be invested shortly after the distribution payment date. No interest will be paid on distributions awaiting reinvestment. Because the market price of the shares may increase before purchases are completed, the average purchase price per share may exceed the market price at the time of valuation, resulting in the acquisition of fewer shares than if the distribution had been paid in shares issued by the Fund. A pro rata portion of any applicable brokerage commissions on open market purchases will be paid by Plan participants. These commissions usually will be lower than those charged on individual transactions.
Flexible
You may change your distribution option or withdraw from the Plan at any time, should your needs or situation change. You can reinvest whether your shares are registered in your name, or in the name of a brokerage firm, bank, or other nominee. Ask your investment advisor if his or her firm will participate on your behalf. Participants whose shares are registered in the name of one firm may not be able to transfer the shares to another firm and continue to participate in the Plan. The Fund reserves the right to amend or terminate the Plan at any time. Although the Fund reserves the right to amend the Plan to include a service charge payable by the participants, there is no direct service charge to participants in the Plan at this time.
Call today to start reinvesting distributions
For more information on the Nuveen Automatic Reinvestment Plan or to enroll in or withdraw from the Plan, speak with your financial advisor or call us at (800) 257-8787.
79
Board Members & Officers (Unaudited)
The management of the Funds, including general supervision of the duties performed for the Funds by the Adviser, is the responsibility of the Board of Trustees of the Funds. The number of trustees of the Funds is set at ten. None of the trustees who are not "interested" persons of the Funds (referred to herein as "independent board members") has ever been a director or employee of, or consultant to, Nuveen or its affiliates. The names and business addresses of the trustees and officers of the Funds, their principal occupations and other affiliations during the past five years, the number of portfolios each oversees and other directorships they hold are set forth below.
| | | | | |
Name, | Position(s) Held | Year First | Principal | Number |
| Year of Birth | with the Funds | Elected or | Occupation(s) | of Portfolios |
& Address | | Appointed | Including other | in Fund Complex |
| | | and Term(1) | Directorships | Overseen by |
| | | | During Past 5 Years | Board Member |
| |
| Independent Board Members: |
| |
■ TERENCE J. TOTH | | | Formerly, a Co-Founding Partner, Promus Capital (2008-2017); Director, | |
| 1959 | | | Fulcrum IT Service LLC (since 2010) and Quality Control Corporation | |
333 W. Wacker Drive | Chairman and | 2008 | (since 2012); member: Catalyst Schools of Chicago Board (since 2008) | 168 |
| Chicago, IL 6o6o6 | Board Member | Class II | and Mather Foundation Board (since 2012), and chair of its Investment | |
| | | | Committee; formerly, Director, Legal & General Investment | |
| | | | Management America, Inc. (2008-2013); formerly, CEO and President, | |
| | | | Northern Trust Global Investments (2004-2007): Executive Vice President, | |
| | | | Quantitative Management & Securities Lending (2000-2004); prior | |
| | | | thereto, various positions with Northern Trust Company (since 1994); | |
| | | | formerly, Member, Northern Trust Mutual Funds Board (2005-2007), | |
| | | | Northern Trust Global Investments Board (2004-2007), Northern Trust | |
| | | | Japan Board (2004-2007), Northern Trust Securities Inc. Board | |
| | | | (2003- 2007) and Northern Trust Hong Kong Board (1997-2004). | |
| |
■ JACK B. EVANS | | | Chairman (since 2019), formerly, President (1996-2019), The Hall-Perrine | |
| 1948 | | | Foundation, a private philanthropic corporation; Director and Chairman, | |
333 W. Wacker Drive | Board Member | 1999 | United Fire Group, a publicly held company; Director, Public Member, | 168 |
| Chicago, IL 6o6o6 | | Class III | American Board of Orthopaedic Surgery (since 2015); Life Trustee of | |
| | | | Coe College and the Iowa College Foundation; formerly, President | |
| | | | Pro-Tem of the Board of Regents for the State of Iowa University | |
| | | | System; formerly, Director, Alliant Energy and The Gazette Company; | |
| | | | formerly, Director, Federal Reserve Bank of Chicago; formerly, | |
| | | | President and Chief Operating Officer, SCI Financial Group, Inc., a | |
| | | | regional financial services firm. | |
| |
■ WILLIAM C. HUNTER | | | Dean Emeritus, formerly, Dean, Tippie College of Business, University of | |
| 1948 | | | Iowa(2006-2012); Director of Wellmark, Inc. (since 2009); past Director | |
333 W. Wacker Drive | Board Member | 2003 | (2005-2015), and past President (2010-2014) Beta Gamma Sigma, Inc., | 168 |
| Chicago, IL 6o6o6 | | Class I | The International Business Honor Society; formerly, Director (2004-2018) | |
| | | | of Xerox Corporation; Dean and Distinguished Professor of Finance, | |
| | | | School of Business at the University of Connecticut (2003-2006); | |
| | | | previously, Senior Vice President and Director of Research at the Federal | |
| | | | Reserve Bank of Chicago (1995-2003); formerly, Director (1997-2007), | |
| | | | Credit Research Center at Georgetown University. | |
| |
■ ALBIN F. MOSCHNER | | | Founder and Chief Executive Officer, Northcroft Partners, LLC, a | |
| 1952 | | | management consulting firm (since 2012); Chairman (since 2019), | |
333 W. Wacker Drive | Board Member | 2016 | and Director (since 2012), USA Technologies, Inc., a provider of solutions | 168 |
| Chicago, IL 6o6o6 | | Class III | and services to facilitate electronic payment transactions (since 2012); | |
| | | | formerly, Director, Wintrust Financial Corporation (1996-2016); previously, | |
| | | | held positions at Leap Wireless International, Inc., including Consultant | |
| | | | (2011-2012), Chief Operating Officer (2008-2011), and Chief Marketing | |
| | | | Officer (2004-2008); formerly, President, Verizon Card Services division of | |
| | | | Verizon Communications, Inc. (2000-2003); formerly, President, One Point | |
| | | | Services at One Point Communications (1999- 2000); formerly, Vice | |
| | | | Chairman of the Board, Diba, Incorporated (1996-1997); formerly, various | |
| | | | executive positions (1991-1996) and Chief Executive Officer (1995-1996) of | |
| | | | Zenith Electronics Corporation. | |
80
| | | | | |
Name, | Position(s) Held | Year First | Principal | Number |
Year of Birth | with the Funds | Elected or | Occupation(s) | of Portfolios |
& Address | | Appointed | Including other | in Fund Complex |
| | | and Term(1) | Directorships | Overseen by |
| | | | During Past 5 Years | Board Member |
| |
Independent Board Members (continued): |
| |
■ JOHN K. NELSON | | | Member of Board of Directors of Core12 LLC (since 2008), a private firm | |
| 1962 | | | which develops branding, marketing and communications strategies for | |
| 333 W. Wacker Drive | Board Member | 2013 | clients; serves on The President’s Council, Fordham University (since | 168 |
| Chicago, IL 6o6o6 | | Class II | 2010); and previously was a Director of The Curran Center for Catholic | |
| | | | American Studies (2009-2018) formerly, senior external advisor to the | |
| | | | financial services practice of Deloitte Consulting LLP (2012-2014): | |
| | | | formerly, Chairman of the Board of Trustees of Marian University (2010 | |
| | | | as trustee, 2011-2014 as Chairman); formerly, Chief Executive Officer of | |
| | | | ABN AMRO N.V. North America, and Global Head of its Financial Markets | |
| | | | Division (2007-2008); prior senior positions held at ABN AMRO include | |
| | | | Corporate Executive Vice President and Head of Global Markets-the | |
| | | | Americas (2006-2007), CEO of Wholesale Banking North America and | |
| | | | Global Head of Foreign Exchange and Futures Markets (2001-2006), and | |
| | | | Regional Commercial Treasurer and Senior Vice President Trading-North | |
| | | | America (1996-2001); formerly, Trustee at St. Edmund Preparatory | |
| | | | School in New York City. | |
| |
■ JUDITH M. STOCKDALE | | | Board Member, Land Trust Alliance (since 2013) and U.S. Endowment for | |
| 1947 | | | Forestry and Communities (since 2013); formerly, Executive Director | |
| 333 W. Wacker Drive | Board Member | 1997 | (1994-2012), Gaylord and Dorothy Donnelley Foundation; prior thereto, | 168 |
| Chicago, IL 6o6o6 | | Class I | Executive Director, Great Lakes Protection Fund (1990-1994). | |
| |
■ CAROLE E. STONE | | | Former Director, Chicago Board Options Exchange, Inc. (2006-2017); | |
| 1947 | | | and C2 Options Exchange, Incorporated (2009-2017); Director, Cboe, | |
| 333 W. Wacker Drive | Board Member | 2007 | L.C. Global Markets, Inc., formerly, CBOE Holdings, Inc. (since 2010); | 168 |
| Chicago, IL 6o6o6 | | Class I | formerly, Commissioner, New York State Commission on Public | |
| | | | Authority Reform (2005-2010). | |
| |
■ MARGARET L. WOLFF | | | Formerly, member of the Board of Directors (2013-2017) of Travelers | |
| 1955 | | | Insurance Company of Canada and The Dominion of Canada General | |
| 333 W. Wacker Drive | Board Member | 2016 | Insurance Company (each, a part of Travelers Canada, the Canadian | 168 |
| Chicago, IL 6o6o6 | | Class I | operation of The Travelers Companies, Inc.); formerly, Of Counsel, | |
| | | | Skadden, Arps, Slate, Meagher & Flom LLP (Mergers & Acquisitions | |
| | | | Group) (2005-2014); Member of the Board of Trustees of New York- | |
| | | | Presbyterian Hospital (since 2005); Member (since 2004) and Chair | |
| | | | (since 2015) of the Board of Trustees of The John A. Hartford Foundation | |
| | | | (a philanthropy dedicated to improving the care of older adults); | |
| | | | formerly, Member (2005-2015) and Vice Chair (2011-2015) of the | |
| | | | Board of Trustees of Mt. Holyoke College. | |
| |
■ ROBERT L. YOUNG(2) | | | Formerly, Chief Operating Officer and Director, J.P.Morgan Investment | |
| 1963 | | | Management Inc. (2010-2016); formerly, President and Principal | |
| 333 W. Wacker Drive | Board Member | 2017 | Executive Officer (2013-2016), and Senior Vice President and Chief | 166 |
| Chicago, IL 6o6o6 | | Class II | Operating Officer (2005-2010), of J.P.Morgan Funds; formerly, Director | |
| | | | and various officer positions for J.P.Morgan Investment Management | |
| | | | Inc. (formerly, JPMorgan Funds Management, Inc. and formerly, One | |
| | | | Group Administrative Services) and JPMorgan Distribution Services, | |
| | | | Inc. (formerly, One Group Dealer Services, Inc.) (1999-2017). | |
81
Board Members & Officers (Unaudited) (continued)
| | | | | |
Name, | Position(s) Held | Year First | Principal | Number |
Year of Birth | with the Funds | Elected or | Occupation(s) | of Portfolios |
& Address | | Appointed | Including other | in Fund Complex |
| | | and Term(1) | Directorships | Overseen by |
| | | | During Past 5 Years | Board Member |
| |
Interested Board Member: |
| |
■ MARGO L. COOK(3) | | | President (since 2017), formerly, Co-Chief Executive Officer and | |
| 1964 | | | Co-President (2016-2017), formerly, Senior Executive Vice President of | |
| 333 W. Wacker Drive | Board Member | 2016 | Nuveen Investments, Inc.; President, Global Products and Solutions | 168 |
| Chicago, IL 6o6o6 | | Class III | (since 2017), and, Co-Chief Executive Officer (since 2015), formerly, | |
| | | | Executive Vice President (2013-2015), of Nuveen Securities, LLC; | |
| | | | Executive Vice President (since 2017) of Nuveen, LLC; President (since | |
| | | | August 2017), formerly Co-President (2016- 2017), formerly, Senior | |
| | | | Executive Vice President of Nuveen Fund Advisors, LLC (Executive Vice | |
| | | | President since 2011); President (since 2017), Nuveen Alternative | |
| | | | Investments, LLC; Chartered Financial Analyst. | |
| |
Name, Year of Birth & Address | Position(s) Held with the Funds | Year First Elected or Appointed(4) | Principal Occupation(s) During Past 5 Years |
| |
Officers of the Funds: |
| |
■ CEDRIC H. ANTOSIEWICZ | | | Senior Managing Director (since 2017), formerly, Managing Director |
| 1962 | Chief | | (2004-2017) of Nuveen Securities, LLC; Senior Managing Director (since |
| 333 W. Wacker Drive | Administrative | 2007 | 2017), formerly, Managing Director (2014-2017) of Nuveen Fund |
| Chicago, IL 6o6o6 | Officer | | Advisors, LLC. |
| |
■ NATHANIEL T. JONES | | | Managing Director (since 2017), formerly, Senior Vice President |
| 1979 | | | (2016-2017), formerly, Vice President (2011-2016) of Nuveen; Managing |
| 333 W. Wacker Drive | Vice President | 2016 | Director of Nuveen Fund Advisors, LLC; Chartered Financial Analyst. |
| Chicago, IL 6o6o6 | and Treasurer | | |
| |
■ WALTER M. KELLY | | | Managing Director (since 2017), formerly, Senior Vice President |
| 1970 | Chief Compliance | | (2008-2017) of Nuveen. |
| 333 W. Wacker Drive | Officer and | 2003 | |
| Chicago, IL 6o6o6 | Vice President | | |
| |
■ DAVID J. LAMB | | | Managing Director (since 2017), formerly, Senior Vice President of |
| 1963 | | | Nuveen (since 2006), Vice President prior to 2006. |
| 333 W. Wacker Drive | Vice President | 2015 | |
| Chicago, IL 6o6o6 | | | |
| |
■ TINA M. LAZAR | | | Managing Director (since 2017), formerly, Senior Vice President |
| 1961 | | | (2014-2017) of Nuveen Securities, LLC. |
| 333 W. Wacker Drive | Vice President | 2002 | |
| Chicago, IL 6o6o6 | | | |
82
Name, Year of Birth & Address | Position(s) Held with the Funds | Year First Elected or Appointed(4) | Principal Occupation(s) During Past 5 Years |
| |
| Officers of the Funds (continued): |
| |
■ KEVIN J. MCCARTHY | | | Senior Managing Director (since 2017) and Secretary and General Counsel |
| 1966 | Vice President | | (since 2016) of Nuveen Investments, Inc., formerly, Executive Vice |
333 W. Wacker Drive | and Assistant | 2007 | President (2016-2017) and Managing Director and Assistant Secretary |
| Chicago, IL 6o6o6 | Secretary | | (2008-2016); Senior Managing Director (since 2017) and Assistant |
| | | | Secretary (since 2008) of Nuveen Securities, LLC, formerly Executive |
| | | | Vice President (2016-2017) and Managing Director (2008-2016); Senior |
| | | | Managing Director (since 2017), Secretary (since 2016) and Co-General |
| | | | Counsel (since 2011) of Nuveen Fund Advisors, LLC, formerly, Executive |
| | | | Vice President (2016-2017), Managing Director (2008-2016) and |
| | | | Assistant Secretary (2007-2016); Senior Managing Director (since 2017), |
| | | | Secretary (since 2016) and Associate General Counsel (since 2011) of |
| | | | Nuveen Asset Management, LLC, formerly Executive Vice President |
| | | | (2016-2017) and Managing Director and Assistant Secretary (2011-2016); |
| | | | Senior Managing Director (since 2017) and Secretary (since 2016) of |
| | | | Nuveen Investments Advisers, LLC, formerly Executive Vice President |
| | | | (2016-2017); Vice President (since 2007) and Secretary (since 2016), |
| | | | formerly, Assistant Secretary, of NWQ Investment Management |
| | | | Company, LLC, Symphony Asset Management LLC, Santa Barbara Asset |
| | | | Management, LLC and Winslow Capital Management, LLC (since 2010). |
| | | | Senior Managing Director (since 2017) and Secretary (since 2016) of |
| | | | Nuveen Alternative Investments, LLC. |
| |
■ WILLIAM T. MEYERS | | | Senior Managing Director (since 2017), formerly, Managing Director |
| 1966 | Vice President | | (2016-2017), Senior Vice President (2010-2016) of Nuveen Securities, LLC; |
333 W. Wacker Drive | | 2018 | and Nuveen Fund Advisors, LLC; Senior Managing Director (since 2017), |
| Chicago, IL 60606 | | | formerly, Managing Director (2016-2017), Senior Vice President |
| | | | (2010-2016) of Nuveen, has held various positions with Nuveen since 1991. |
| |
■ MICHAEL A. PERRY | | | Executive Vice President (since 2017), previously Managing Director |
| 1967 | | | from 2016), of Nuveen Fund Advisors, LLC and Nuveen Alternative |
333 W. Wacker Drive | Vice President | 2017 | Investments, LLC; Executive Vice President (since 2017), formerly, |
| Chicago, IL 6o6o6 | | | Managing Director (2015-2017), of Nuveen Securities, LLC; formerly, |
| | | | Managing Director (2010-2015) of UBS Securities, LLC. |
| |
■ CHRISTOPHER M. ROHRBACHER | | Managing Director (since 2017) and Assistant Secretary of Nuveen |
| 1971 | Vice President | | Securities, LLC; Managing Director (since 2017), formerly, Senior |
333 W. Wacker Drive | and Assistant | 2008 | Vice President (2016-2017) and Assistant Secretary (since 2016) of |
| Chicago, IL 6o6o6 | Secretary | | Nuveen Fund Advisors, LLC. |
| |
■ WILLIAM A. SIFFERMANN | | | Managing Director (since 2017), formerly Senior Vice President |
| 1975 | | | (2016-2017) and Vice President (2011-2016) of Nuveen. |
| 333 W. Wacker Drive | Vice President | 2017 | |
| Chicago, IL 6o6o6 | | | |
| |
■ JOEL T. SLAGER | | | Fund Tax Director for Nuveen Funds (since 2013); previously, |
| 1978 | Vice President | | Vice President of Morgan Stanley Investment Management, Inc., |
333 W. Wacker Drive | and Assistant | 2013 | Assistant Treasurer of the Morgan Stanley Funds (from 2010 to 2013). |
| Chicago, IL 6o6o6 | Secretary | | |
| |
■ E. SCOTT WICKERHAM | | | Senior Managing Director, Head of Fund Administration at Nuveen, LLC |
| 1973 | Vice President | | (since 2019), formerly, Managing Director; Principal Financial Officer, |
| TIAA | and Controller | 2019 | Principal Accounting Officer and Treasurer (since 2017) to the TIAA-CREF |
| 730 Third Avenue | | | Funds, the TIAA-CREF Life Funds, the TIAA Separate Account VA-1 and the |
| New York, NY 10017 | | | Treasurer (since 2017) to the CREF Accounts; Senior Director, TIAA-CREF |
| | | | Fund Administration (2014-2015); has held various positions with TIAA |
| | | | since 2006. |
83
Board Members & Officers (Unaudited) (continued)
Name, Year of Birth & Address | Position(s) Held with the Funds | Year First Elected or Appointed(4) | Principal Occupation(s) During Past 5 Years |
| |
| Officers of the Funds (continued): | | |
| |
■ MARK L. WINGET | | | Vice President and Assistant Secretary of Nuveen Securities, LLC |
| 1968 | Vice President | | (since 2008); Vice President (since 2010) and Associate General |
333 W. Wacker Drive | and Assistant | 2008 | Counsel (since 2008) of Nuveen. |
| Chicago, IL 60606 | Secretary | | |
| |
■ GIFFORD R. ZIMMERMAN | | | Managing Director (since 2002), and Assistant Secretary of Nuveen |
| 1956 | Vice President | | Securities, LLC; Managing Director (since 2004) and Assistant Secretary |
333 W. Wacker Drive | Secretary | 1988 | (since 1994) of Nuveen Investments, Inc.; Managing Director (since |
| Chicago, IL 60606 | | | 2002), Assistant Secretary (since 1997) and Co-General Counsel (since |
| | | | 2011) of Nuveen Fund Advisors, LLC; Managing Director, Assistant |
| | | | Secretary and Associate General Counsel of Nuveen Asset |
| | | | Management, LLC (since 2011); Vice President (since 2017), formerly, |
| | | | Managing Director (2003-2017) and Assistant Secretary (since 2003) of |
| | | | Symphony Asset Management LLC; Managing Director and Assistant |
| | | | Secretary (since 2002) of Nuveen Investments Advisers, LLC; Vice |
| | | | President and Assistant Secretary of NWQ Investment Management |
| | | | Company, LLC (since 2002), Santa Barbara Asset Management, LLC |
| | | | (since 2006), and of Winslow Capital Management, LLC, (since 2010); |
| | | | Chartered Financial Analyst. |
| | |
| (1) | The Board of Trustees is divided into three classes, Class I, Class II, and Class III, with each being elected to serve until the third succeeding annual shareholders’ meeting subsequent to its election or thereafter in each case when its respective successors are duly elected or appointed, except two board members are elected by the holders of Preferred Shares, when applicable, to serve until the next annual shareholders’ meeting subsequent to its election or thereafter in each case when its respective successors are duly elected or appointed. The year first elected or appointed represents the year in which the board member was first elected or appointed to any fund in the Nuveen Complex. |
| (2) | On May 25, 2017, Mr. Young was appointed as a Board Member, effective July 1, 2017. He is a Board Member of each of the Nuveen Funds, except Nuveen Diversified Dividend and Income Fund and Nuveen Real Estate Income Fund. |
| (3) | “Interested person” as defined in the 1940 Act, by reason of her position with Nuveen, LLC. and certain of its subsidiaries, which are affiliates of the Nuveen Funds. |
| (4) | Officers serve one year terms through August of each year. The year first elected or appointed represents the year in which the Officer was first elected or appointed to any fund in the Nuveen Complex. |
84
Notes
85
Notes
86
Notes
87
Nuveen:
Serving Investors for Generations
Since 1898, financial advisors and their clients have relied on Nuveen to provide dependable investment solutions through continued adherence to proven, long-term investing principles. Today, we offer a range of high quality equity and fixed-income solutions designed to be integral components of a well-diversified core portfolio.
Focused on meeting investor needs.
Nuveen is the investment manager of TIAA. We have grown into one of the world's premier global asset managers, with specialist knowledge across all major asset classes and particular strength in solutions that provide income for investors and that draw on our expertise in alternatives and responsible investing. Nuveen is driven not only by the independent investment processes across the firm, but also the insights, risk management, analytics and other tools and resources that a truly world-class platform provides. As a global asset manager, our mission is to work in partnership with our clients to create solutions which help them secure their financial future.
Find out how we can help you.
To learn more about how the products and services of Nuveen may be able to help you meet your financial goals, talk to your financial advisor, or call us at (800) 257-8787. Please read the information provided carefully before you invest. Investors should consider the investment objective and policies, risk considerations, charges and expenses of any investment carefully. Where applicable, be sure to obtain a prospectus, which contains this and other relevant information. To obtain a prospectus, please contact your securities representative or Nuveen, 333 W. Wacker Dr., Chicago, IL 60606. Please read the prospectus carefully before you invest or send money.
Learn more about Nuveen Funds at: www.nuveen.com/closed-end funds
Nuveen Securities, LLC, member FINRA and SIPC | 333 West Wacker Drive Chicago, IL 60606 | www.nuveen.com | | EAN-C-0219D 803991-INV-Y-04/20 |