Use these links to rapidly review the document
TABLE OF CONTENTS
Table of Contents
UNITED STATES
SECURITIES AND EXCHANGE COMMISSION
Washington, D.C. 20549
FORM 10-Q
QUARTERLY REPORT PURSUANT TO SECTION 13 OR 15(d)
OF THE SECURITIES EXCHANGE ACT OF 1934
For the quarterly period ended June 30, 2013
Commission File Number: 000-54671
NORTHSTAR REAL ESTATE INCOME TRUST, INC.
(Exact Name of Registrant as Specified in its Charter)
| | |
Maryland
(State or Other Jurisdiction of
Incorporation or Organization) | | 26-4141646
(IRS Employer
Identification No.) |
399 Park Avenue, 18th Floor, New York, NY 10022
(Address of Principal Executive Offices, Including Zip Code)
(212) 547-2600
(Registrant's Telephone Number, Including Area Code)
Indicate by the check mark whether the registrant (1) has filed all reports required to be filed by Section 13 or 15(d) of the Securities Exchange Act of 1934 during the preceding 12 months (or for such shorter period that the registrant was required to file such reports), and (2) has been subject to such filing requirements for the past 90 days. Yes ý No o
Indicate by check mark whether the registrant has submitted electronically and posted on its corporate Web site, if any, every Interactive Data File required to be submitted and posted pursuant to Rule 405 of Regulation S-T (§232.405 of this chapter) during the preceding 12 months (or for such shorter period that the registrant was required to submit and post such files). Yes ý No o
Indicate by check mark whether the registrant is a large accelerated filer, an accelerated filer, a non-accelerated filer, or a smaller reporting company. See the definitions of "large accelerated filer," "accelerated filer" and "smaller reporting company" in Rule 12b-2 of the Exchange Act. (Check one):
| | | | | | |
| Large accelerated filer o | | Accelerated filer o | | Non-accelerated filer o
(Do not check if a
smaller reporting company) | | Smaller reporting company ý |
Indicate by check mark whether the registrant is a shell company (as defined in Rule 12b-2 of the Exchange Act). Yes o No ý
Indicate the number of shares outstanding of each of the registrant's classes of common stock, as of the latest practicable date:
The Company has one class of common stock, par value $0.01 per share, 113,285,536 shares outstanding as of August 8, 2013.
Table of Contents
NORTHSTAR REAL ESTATE INCOME TRUST, INC.
FORM 10-Q
TABLE OF CONTENTS
| | | | | | |
Index | |
| | Page | |
|---|
Part I. | | Financial Information | | | | |
Item 1. | | Financial Statements | | | | |
| | Consolidated Balance Sheets as of June 30, 2013 (unaudited) and December 31, 2012 | | | 5 | |
| | Consolidated Statements of Operations (unaudited) for the three and six months ended June 30, 2013 and 2012 | | | 6 | |
| | Consolidated Statements of Comprehensive Income (Loss) (unaudited) for the three and six months ended June 30, 2013 and 2012 | | | 7 | |
| | Consolidated Statements of Equity as of June 30, 2013 (unaudited) and December 31, 2012 | | | 8 | |
| | Consolidated Statement of Cash Flows (unaudited) for the six months ended June 30, 2013 and 2012 | | | 9 | |
| | Notes to Consolidated Financial Statements (unaudited) | | | 10 | |
Item 2. | | Management's Discussion and Analysis of Financial Condition and Results of Operations | | | 39 | |
Item 3. | | Quantitative and Qualitative Disclosures About Market Risk | | | 66 | |
Item 4. | | Controls and Procedures | | | 67 | |
Part II. | | Other Information | | | 67 | |
Item 1A. | | Risk Factors | | | 67 | |
Item 2. | | Unregistered Sales of Equity Securities and Use of Proceeds | | | 68 | |
Item 6. | | Exhibits | | | 70 | |
Signatures | | | 71 | |
2
Table of Contents
FORWARD-LOOKING STATEMENTS
This Quarterly Report on Form 10-Q contains certain "forward-looking statements" within the meaning of the Private Securities Litigation Reform Act of 1995, Section 27A of the Securities Act of 1933, as amended, or Securities Act, and Section 21E of the Securities Exchange Act of 1934, as amended, or Exchange Act. Forward-looking statements are generally identifiable by use of forward-looking terminology such as "may," "will," "should," "potential," "intend," "expect," "seek," "anticipate," "estimate," "believe," "could," "predict," "continue," "future" or other similar words or expressions. Forward-looking statements are not guarantees of performance and are based on certain assumptions, discuss future expectations, describe plans and strategies, contain projections of results of operations or of financial condition or state other forward-looking information. Such statements include, but are not limited to, those relating to our ability to pay distributions to our stockholders, our reliance on our advisor and our sponsor, the operating performance of our investments, our financing needs, the effects of our current strategies and investment activities and our ability to effectively deploy capital. Our ability to predict results or the actual effect of plans or strategies is inherently uncertain, particularly given the economic environment. Although we believe that the expectations reflected in such forward-looking statements are based on reasonable assumptions, our actual results and performance could differ materially from those set forth in the forward-looking statements and you should not unduly rely on these statements. These forward-looking statements involve risks, uncertainties and other factors that may cause our actual results in future periods to differ materially from those forward-looking statements. These factors include, but are not limited to:
- •
- adverse economic conditions and the impact on the commercial real estate industry;
- •
- our ability to deploy capital quickly and successfully;
- •
- access to debt capital at rates that will allow us to meet our target returns;
- •
- our liquidity;
- •
- our use of leverage;
- •
- our ability to make distributions to our stockholders;
- •
- the effect of paying distributions to our stockholders from sources other than cash flow from operations;
- •
- the performance of our advisor and our sponsor;
- •
- our dependence on the resources and personnel of our advisor and our sponsor, including our advisor's ability to source and close on investment opportunities on our behalf;
- •
- the lack of a public trading market for our shares;
- •
- the limited operating history of us and our dealer manager;
- •
- the effect of economic conditions on the valuation of our investments;
- •
- performance of our investments relative to our expectations and the impact on our actual return on invested equity, as well as the cash generated from these investments;
- •
- the impact of economic conditions on the borrowers of the commercial real estate debt we originate and acquire and the commercial mortgage loans underlying the commercial mortgage-backed securities in which we invest;
- •
- our ability to complete securitization financing transactions on terms that are acceptable to us, if at all;
- •
- our ability to realize the value of the bonds retained in our securitization financing transaction;
3
Table of Contents
- •
- our ability to realize the current and expected return over the life of our investments;
- •
- any failure in our advisor's due diligence to identify all relevant facts in our underwriting process or otherwise;
- •
- tenant or borrower defaults or bankruptcy;
- •
- illiquidity of properties in our portfolio;
- •
- our ability to successfully complete a liquidity transaction on favorable terms, if at all;
- •
- environmental compliance costs and liabilities;
- •
- effect of regulatory actions, litigation and contractual claims against us and our affiliates, including the potential settlement and litigation of such claims;
- •
- competition for investment opportunities;
- •
- our ability to close the applicable interests in real estate private equity funds described in this Quarterly Report on Form 10-Q, on the terms described, if at all;
- •
- the possibility that the net asset value of interests in certain real estate private equity funds we acquired or propose to acquire do not necessarily reflect the fair value of such interest or that the actual amount of future capital commitments underlying all of those fund interests that will be called and funded by us could vary materially from our expectations;
- •
- regulatory requirements with respect to our business and the related cost of compliance;
- •
- the impact of any conflicts arising among us and our sponsor and its affiliates;
- •
- changes in laws or regulations governing various aspects of our business and non-traded real estate investment trusts, or REITs, generally, including, but not limited to, changes implemented by the Financial Industry Regulatory Authority;
- •
- the loss of our exemption from the definition of an "investment company" under the Investment Company Act of 1940, as amended;
- •
- the effectiveness of our portfolio management systems;
- •
- failure to maintain effective internal controls; and
- •
- compliance with the rules governing REITs.
The foregoing list of factors is not exhaustive. All forward-looking statements included in this Quarterly Report on Form 10-Q are based upon information available to us on the date hereof and we are under no duty to update any of the forward-looking statements after the date of this report to conform these statements to actual results.
Factors that could have a material adverse effect on our operations and future prospects are set forth in our filings with the United States Securities and Exchange Commission, or SEC, including Part I, Item 1A of our Annual Report on Form 10-K for the fiscal year ended December 31, 2012 and in Part II, Item 1A of this Quarterly Report on Form 10-Q under the heading "Risk Factors." The risk factors set forth in our filings with the SEC could cause our actual results to differ significantly from those contained in any forward-looking statement contained in this report.
4
Table of Contents
PART I. Financial Information
Item 1. Financial Statements
NORTHSTAR REAL ESTATE INCOME TRUST, INC. AND SUBSIDIARIES
CONSOLIDATED BALANCE SHEETS
(Dollars in Thousands)
| | | | | | | |
| | June 30, 2013
(Unaudited) | | December 31,
2012 | |
|---|
Assets | | | | | | | |
Cash | | $ | 223,251 | | $ | 213,727 | |
Restricted cash | | | 182,318 | | | 72,265 | |
Real estate debt investments, net (refer to Note 7) | | | 925,896 | | | 514,058 | |
Investments in private equity funds, at fair value (refer to Note 4) | | | 118,593 | | | — | |
Real estate securities, available for sale | | | 55,289 | | | 29,582 | |
Receivables, net | | | 6,286 | | | 4,654 | |
Deferred costs and other assets, net | | | 12,289 | | | 25,652 | |
| | | | | | |
Total assets | | $ | 1,523,922 | | $ | 859,938 | |
| | | | | | |
Liabilities | | | | | | | |
Securitization bonds payable | | $ | 124,610 | | $ | 124,491 | |
Credit facilities | | | 225,871 | | | 126,321 | |
Due to related party | | | 3,636 | | | 15,165 | |
Accounts payable and accrued expenses | | | 2,142 | | | 463 | |
Escrow deposits payable | | | 181,773 | | | 71,847 | |
Distribution payable | | | 6,968 | | | 3,905 | |
| | | | | | |
Total liabilities | | | 545,000 | | | 342,192 | |
Equity | | | | | | | |
NorthStar Real Estate Income Trust, Inc. Stockholders' Equity | | | | | | | |
Preferred stock, $0.01 par value per share; 50,000,000 shares authorized, no shares issued and outstanding as of June 30, 2013 and December 31, 2012 | | | — | | | — | |
Common stock, $0.01 par value per share; 400,000,000 shares authorized, 112,727,255 and 60,204,641 shares issued and outstanding as of June 30, 2013 and December 31, 2012, respectively | | | 1,127 | | | 602 | |
Additional paid-in capital | | | 1,002,731 | | | 532,617 | |
Retained earnings (accumulated deficit) | | | (27,385 | ) | | (15,935 | ) |
Accumulated other comprehensive income (loss) | | | 2,444 | | | 457 | |
| | | | | | |
Total NorthStar Real Estate Income Trust, Inc. stockholders' equity | | | 978,917 | | | 517,741 | |
Non-controlling interests | | | 5 | | | 5 | |
| | | | | | |
Total equity | | | 978,922 | | | 517,746 | |
| | | | | | |
Total liabilities and equity | | $ | 1,523,922 | | $ | 859,938 | |
| | | | | | |
See accompanying notes to consolidated financial statements.
5
Table of Contents
NORTHSTAR REAL ESTATE INCOME TRUST, INC. AND SUBSIDIARIES
CONSOLIDATED STATEMENTS OF OPERATIONS
(Dollars in Thousands, Except Per Share and Distributions Declared Data)
(Unaudited)
| | | | | | | | | | | | | |
| | Three Months Ended
June 30, | | Six Months Ended
June 30, | |
|---|
| | 2013 | | 2012 | | 2013 | | 2012 | |
|---|
Net interest income | | | | | | | | | | | | | |
Interest income | | $ | 16,191 | | $ | 4,708 | | $ | 28,858 | | $ | 7,272 | |
Interest expense | | | 3,263 | | | 363 | | | 5,801 | | | 614 | |
| | | | | | | | | | |
Net interest income | | | 12,928 | | | 4,345 | | | 23,057 | | | 6,658 | |
Expenses | | | | | | | | | | | | | |
Advisory fees—related party | | | 2,765 | | | 511 | | | 6,188 | | | 818 | |
Transaction costs | | | 687 | | | — | | | 994 | | | — | |
General and administrative expenses | | | 2,346 | | | 895 | | | 4,038 | | | 1,394 | |
| | | | | | | | | | |
Total expenses | | | 5,798 | | | 1,406 | | | 11,220 | | | 2,212 | |
| | | | | | | | | | |
Income (loss) from operations | | | 7,130 | | | 2,939 | | | 11,837 | | | 4,446 | |
Equity in earnings (losses) of unconsolidated ventures | | | 5,827 | | | — | | | 9,042 | | | — | |
Realized gain (loss) on investments and other | | | — | | | 3,028 | | | — | | | 3,028 | |
Unrealized gain (loss) on investments and other | | | — | | | (2,959 | ) | | — | | | (2,457 | ) |
| | | | | | | | | | |
Net income (loss) | | | 12,957 | | | 3,008 | | | 20,879 | | | 5,017 | |
Less: net (income) loss attributable to non-controlling interests | | | — | | | — | | | — | | | — | |
| | | | | | | | | | |
Net income (loss) attributable to NorthStar Real Estate Income Trust, Inc. common stockholders | | $ | 12,957 | | $ | 3,008 | | $ | 20,879 | | $ | 5,017 | |
| | | | | | | | | | |
Net income (loss) per share of common stock, basic / diluted | | $ | 0.14 | | $ | 0.11 | | $ | 0.26 | | $ | 0.21 | |
| | | | | | | | | | |
Weighted average number of shares of common stock outstanding, basic / diluted | | | 94,726 | | | 28,285 | | | 81,620 | | | 23,918 | |
| | | | | | | | | | |
Distributions declared per share of common stock | | $ | 0.20 | | $ | 0.20 | | $ | 0.40 | | $ | 0.40 | |
| | | | | | | | | | |
See accompanying notes to consolidated financial statements.
6
Table of Contents
NORTHSTAR REAL ESTATE INCOME TRUST, INC. AND SUBSIDIARIES
CONSOLIDATED STATEMENTS OF COMPREHENSIVE INCOME (LOSS)
(Dollars in Thousands)
(Unaudited)
| | | | | | | | | | | | | |
| | Three Months Ended
June 30, | | Six Months Ended
June 30, | |
|---|
| | 2013 | | 2012 | | 2013 | | 2012 | |
|---|
Net income (loss) | | $ | 12,957 | | $ | 3,008 | | $ | 20,879 | | $ | 5,017 | |
Other comprehensive income (loss): | | | | | | | | | | | | | |
Unrealized gain (loss) on real estate securities, available for sale | | | 1,042 | | | (222 | ) | | 1,987 | | | 224 | |
| | | | | | | | | | |
Total other comprehensive income (loss) | | | 1,042 | | | (222 | ) | | 1,987 | | | 224 | |
Comprehensive income (loss) | | |
13,999 | | |
2,786 | | |
22,866 | | |
5,241 | |
Less: | | | | | | | | | | | | | |
Net (income) loss attributable to non-controlling interests | | | — | | | — | | | — | | | — | |
Other comprehensive (income) loss attributable to non-controlling interests | | | — | | | — | | | — | | | — | |
| | | | | | | | | | |
Comprehensive income (loss) attributable to NorthStar Real Estate Income Trust, Inc. | | $ | 13,999 | | $ | 2,786 | | $ | 22,866 | | $ | 5,241 | |
| | | | | | | | | | |
See accompanying notes to consolidated financial statements.
7
Table of Contents
NORTHSTAR REAL ESTATE INCOME TRUST, INC. AND SUBSIDIARIES
CONSOLIDATED STATEMENTS OF EQUITY
(Dollars and Shares in Thousands)
| | | | | | | | | | | | | | | | | | | | | | | | | |
| |
| |
| |
| |
| | Accumulated
Other
Comprehensive
Income
(Loss) | |
| |
| |
| |
|---|
| | Common Stock | |
| | Retained
Earnings
(Accumulated
Deficit) | | Total
Company's
Stockholders'
Equity | |
| |
| |
|---|
| | Additional
Paid-in
Capital | | Non-
controlling
Interests | | Total
Equity | |
|---|
| | Shares | | Amount | |
|---|
Balance as of December 31, 2011 | | | 15,847 | | $ | 159 | | $ | 138,968 | | $ | (3,317 | ) | $ | 93 | | $ | 135,903 | | $ | 4 | | $ | 135,907 | |
Net proceeds from issuance of common stock | | |
43,407 | | |
433 | | |
384,665 | | |
— | | |
— | | |
385,098 | | |
— | | |
385,098 | |
Proceeds from distribution reinvestment plan | | | 1,085 | | | 11 | | | 10,294 | | | — | | | — | | | 10,305 | | | — | | | 10,305 | |
Shares redeemed for cash | | | (142 | ) | | (1 | ) | | (1,370 | ) | | — | | | — | | | (1,371 | ) | | — | | | (1,371 | ) |
Issuance and amortization of equity-based compensation | | | 8 | | | — | | | 60 | | | — | | | — | | | 60 | | | — | | | 60 | |
Other comprehensive income (loss) | | | — | | | — | | | — | | | — | | | 364 | | | 364 | | | 1 | | | 365 | |
Distributions declared | | | — | | | — | | | — | | | (27,922 | ) | | — | | | (27,922 | ) | | — | | | (27,922 | ) |
Net income (loss) | | | — | | | — | | | — | | | 15,304 | | | — | | | 15,304 | | | — | | | 15,304 | |
| | | | | | | | | | | | | | | | | | |
Balance as of December 31, 2012 | | | 60,205 | | $ | 602 | | $ | 532,617 | | $ | (15,935 | ) | $ | 457 | | $ | 517,741 | | $ | 5 | | $ | 517,746 | |
| | | | | | | | | | | | | | | | | | |
Net proceeds from issuance of common stock | | | 51,475 | | $ | 515 | | $ | 460,254 | | $ | — | | $ | — | | $ | 460,769 | | $ | — | | $ | 460,769 | |
Proceeds from distribution reinvestment plan | | | 1,317 | | | 13 | | | 12,496 | | | — | | | — | | | 12,509 | | | — | | | 12,509 | |
Shares redeemed for cash | | | (281 | ) | | (3 | ) | | (2,672 | ) | | — | | | — | | | (2,675 | ) | | — | | | (2,675 | ) |
Issuance and amortization of equity-based compensation | | | 11 | | | — | | | 36 | | | — | | | — | | | 36 | | | — | | | 36 | |
Other comprehensive income (loss) | | | — | | | — | | | — | | | — | | | 1,987 | | | 1,987 | | | — | | | 1,987 | |
Distributions declared | | | — | | | — | | | — | | | (32,329 | ) | | — | | | (32,329 | ) | | — | | | (32,329 | ) |
Net income (loss) | | | — | | | — | | | — | | | 20,879 | | | — | | | 20,879 | | | — | | | 20,879 | |
| | | | | | | | | | | | | | | | | | |
Balance as of June 30, 2013 (unaudited) | | | 112,727 | | $ | 1,127 | | $ | 1,002,731 | | $ | (27,385 | ) | $ | 2,444 | | $ | 978,917 | | $ | 5 | | $ | 978,922 | |
| | | | | | | | | | | | | | | | | | |
See accompanying notes to consolidated financial statements.
8
Table of Contents
NORTHSTAR REAL ESTATE INCOME TRUST, INC. AND SUBSIDIARIES
CONSOLIDATED STATEMENTS OF CASH FLOWS
(Dollars in Thousands)
(Unaudited)
| | | | | | | |
| | Six Months Ended
June 30, | |
|---|
| | 2013 | | 2012 | |
|---|
Cash flows from operating activities: | | | | | | | |
Net income (loss) | | $ | 20,879 | | $ | 5,017 | |
Adjustments to reconcile net income (loss) to net cash provided by (used in) operating activities: | | | | | | | |
Equity in (earnings) loss of unconsolidated ventures | | | (9,042 | ) | | — | |
Amortization/accretion of premium, discount and fees on investments and borrowings, net | | | 1,948 | | | (1 | ) |
Amortization of deferred financing costs | | | 1,077 | | | 84 | |
Interest accretion on investments | | | 251 | | | (77 | ) |
Distributions from private equity funds | | | 9,223 | | | — | |
Realized (gain) loss on investments and other | | | — | | | (3,028 | ) |
Unrealized (gain) loss on investments and other | | | — | | | 2,457 | |
Amortization of equity-based compensation | | | 36 | | | 26 | |
Loan acquisition costs | | | (1,689 | ) | | — | |
Changes in assets and liabilities: | | | | | | | |
Restricted cash | | | (128 | ) | | — | |
Receivables, net | | | (2,079 | ) | | (1,005 | ) |
Deferred costs and other assets, net | | | — | | | (75 | ) |
Due to related party | | | 3,315 | | | (401 | ) |
Accounts payable and accrued expenses | | | 959 | | | 669 | |
| | | | | | |
Net cash provided by (used in) operating activities | | | 24,750 | | | 3,666 | |
Cash flows from investing activities: | | | | | | | |
Origination of real estate debt investments | | | (411,759 | ) | | (233,491 | ) |
Repayments on real estate debt investments | | | 1,252 | | | — | |
Acquisition of real estate securities, available for sale | | | (23,285 | ) | | — | |
Proceeds from sales of real estate securities, available for sale | | | — | | | 32,379 | |
Investments in private equity funds | | | (134,664 | ) | | — | |
Distributions from private equity funds | | | 13,215 | | | — | |
| | | | | | |
Net cash provided by (used in) investing activities | | | (555,241 | ) | | (201,112 | ) |
Cash flows from financing activities: | | | | | | | |
Net proceeds from issuance of common stock | | | 461,108 | | | 144,843 | |
Proceeds from issuance of common stock, related party | | | — | | | 1,915 | |
Proceeds from distribution reinvestment plan | | | 12,509 | | | 3,304 | |
Shares redeemed for cash | | | (2,675 | ) | | (851 | ) |
Distributions paid on common stock | | | (29,266 | ) | | (8,427 | ) |
Repayment of secured term loans | | | — | | | (24,061 | ) |
Borrowings from credit facilities | | | 99,550 | | | 75,044 | |
Payment of deferred financing costs | | | (1,211 | ) | | (577 | ) |
| | | | | | |
Net cash provided by (used in) financing activities | | | 540,015 | | | 191,190 | |
Net increase (decrease) in cash | | |
9,524 | | |
(6,256 |
) |
Cash—beginning of period | | | 213,727 | | | 53,859 | |
| | | | | | |
Cash—end of period | | $ | 223,251 | | $ | 47,603 | |
| | | | | | |
Supplemental disclosure of non-cash investing and financing activities: | | | | | | | |
Escrow deposits payable related to real estate debt investments | | $ | 109,926 | | $ | 68,603 | |
Distribution payable | | | 6,968 | | | 2,049 | |
Accrued cost of capital (refer to Note 7) | | | 1,124 | | | 130 | |
Subscriptions receivable, gross | | | 719 | | | 1,449 | |
Non-cash related to investments in private equity funds | | | 2,218 | | | — | |
See accompanying notes to consolidated financial statements.
9
Table of Contents
NORTHSTAR REAL ESTATE INCOME TRUST, INC. AND SUBSIDIARIES
NOTES TO CONSOLIDATED FINANCIAL STATEMENTS
(Unaudited)
1. Business and Organization
NorthStar Real Estate Income Trust, Inc. (the "Company") was formed on January 26, 2009 and elected to qualify as a real estate investment trust ("REIT") beginning with the taxable year ended December 31, 2010. The Company was formed to originate, acquire and asset manage a diversified portfolio of commercial real estate ("CRE") debt, securities and other select equity investments. CRE debt investments may include first mortgage loans, subordinate mortgage and mezzanine loans and participations in such loans and preferred equity interests. CRE securities will primarily consist of commercial mortgage-backed securities ("CMBS") and may include unsecured REIT debt, collateralized debt obligation ("CDO") notes and other securities. The Company is externally managed by NS Real Estate Income Trust Advisor, LLC (the "Advisor") and has no employees. The Advisor uses the investment professionals of NorthStar Realty Finance Corp. (the "Sponsor") to manage the business. The Sponsor is a diversified CRE investment and asset management company publicly traded on the New York Stock Exchange and was formed in October 2003.
Substantially all business is conducted through NorthStar Real Estate Income Trust Operating Partnership, LP (the "Operating Partnership"). The Company is the sole general partner of the Operating Partnership. The initial limited partners of the Operating Partnership are the Advisor and NorthStar OP Holdings, LLC (the "Special Unit Holder"). The Advisor invested $1,000 in the Operating Partnership in exchange for common units and the Special Unit Holder invested $1,000 in the Operating Partnership and has been issued a separate class of limited partnership units (the "Special Units"), which are collectively recorded as non-controlling interests on the consolidated balance sheets as of June 30, 2013 and December 31, 2012. As the Company accepted subscriptions for shares, it contributed substantially all of the net proceeds to the Operating Partnership as a capital contribution. As of June 30, 2013, the Company's limited partnership interest in the Operating Partnership was 99.98%.
The Company's charter authorizes the issuance of up to 400,000,000 shares of common stock with a par value of $0.01 per share and up to 50,000,000 shares of preferred stock with a par value of $0.01 per share. The board of directors of the Company is authorized to amend its charter, without the approval of the stockholders, to increase the aggregate number of authorized shares of capital stock or the number of shares of any class or series that the Company has authority to issue.
The Company initially registered to offer up to 100,000,000 shares pursuant to the primary offering (the "Primary Offering") and up to 10,526,315 shares pursuant to the distribution reinvestment plan (the "DRP") and are herein collectively referred to as the Offering. The Offering, including proceeds from the merger with NorthStar Income Opportunity REIT I, Inc. completed on October 18, 2010 as a reverse merger and recapitalization (the "Merger Transaction"), is herein collectively referred to as the Total Offering. In April 2013, the board of directors of the Company authorized the reallocation of shares available from the DRP to the Primary Offering. The Primary Offering (including 7.6 million shares reallocated from the DRP, the "Total Primary Offering") was completed on July 1, 2013 and all of the shares initially registered for the Offering were issued. The Company intends to continue to offer shares pursuant to the DRP beyond the Total Primary Offering. As a result, the board of directors of the Company approved the filing of a registration statement on Form S-3 with the Securities and Exchange Commission (the "SEC") to issue an additional 15.0 million shares pursuant to the DRP, which was declared effective on July 3, 2013.
10
Table of Contents
NORTHSTAR REAL ESTATE INCOME TRUST, INC. AND SUBSIDIARIES
NOTES TO CONSOLIDATED FINANCIAL STATEMENTS (Continued)
(Unaudited)
1. Business and Organization (Continued)
From inception through the completion of the Total Primary Offering, the Company raised Total Primary Offering gross proceeds of $1,072.9 million. The Total Offering raised gross proceeds of $1,128.4 million through such date.
2. Summary of Significant Accounting Policies
Basis of Quarterly Presentation
The accompanying unaudited consolidated financial statements and related notes of the Company have been prepared in accordance with accounting principles generally accepted in the United States ("U.S. GAAP") for interim financial reporting and the instructions to Form 10-Q and Rule 10-01 of Regulation S-X. Accordingly, certain information and note disclosures normally included in the consolidated financial statements prepared under U.S. GAAP have been condensed or omitted. In the opinion of management, all adjustments considered necessary for a fair presentation of the Company's financial position, results of operations and cash flows have been included and are of a normal and recurring nature. The operating results presented for interim periods are not necessarily indicative of the results that may be expected for any other interim period or for the entire year. These consolidated financial statements should be read in conjunction with the Company's consolidated financial statements and notes thereto included in the Company's Annual Report on Form 10-K for the fiscal year ended December 31, 2012, which was filed with the SEC.
Principles of Consolidation
The consolidated financial statements include the accounts of the Company, the Operating Partnership and their consolidated subsidiaries. The Company consolidates variable interest entities ("VIE") where the Company is the primary beneficiary, if any, and voting interest entities which are generally majority owned or otherwise controlled by the Company. All significant intercompany balances are eliminated in consolidation.
Variable Interest Entities
A VIE is an entity that lacks one or more of the characteristics of a voting interest entity. A VIE is defined as an entity in which equity investors do not have the characteristics of a controlling financial interest or do not have sufficient equity at risk for the entity to finance its activities without additional subordinated financial support from other parties. The determination of whether an entity is a VIE includes both a qualitative and quantitative analysis. The Company bases its qualitative analysis on its review of the design of the entity, its organizational structure including decision-making ability and relevant financial agreements and its quantitative analysis on the forecasted cash flow of the entity. The Company reassesses its initial evaluation of an entity as a VIE upon the occurrence of certain reconsideration events.
A VIE must be consolidated only by its primary beneficiary, which is defined as the party who, along with its affiliates and agents has both the: (i) power to direct the activities that most significantly impact the VIE's economic performance; and (ii) obligation to absorb the losses of the VIE or the right to receive the benefits from the VIE, which could be significant to the VIE. The Company determines whether it is the primary beneficiary of a VIE by considering qualitative and quantitative
11
Table of Contents
NORTHSTAR REAL ESTATE INCOME TRUST, INC. AND SUBSIDIARIES
NOTES TO CONSOLIDATED FINANCIAL STATEMENTS (Continued)
(Unaudited)
2. Summary of Significant Accounting Policies (Continued)
factors, including, but not limited to: which activities most significantly impact the VIE's economic performance and which party controls such activities; the amount and characteristics of its investment; the obligation or likelihood for the Company or other interests to provide financial support; consideration of the VIE's purpose and design, including the risks the VIE was designed to create and pass through to its variable interest holders and the similarity with and significance to the business activities of the Company and the other interests. The Company reassesses its determination of whether it is the primary beneficiary of a VIE each reporting period. Significant judgments related to these determinations include estimates about the current and future fair value and performance of investments held by these VIEs and general market conditions.
The Company evaluates its CRE debt and securities, investments in unconsolidated ventures and its securitization financing transaction to determine whether they are a VIE. The Company analyzes new investments and financings, as well as reconsideration events for existing investments and financings, which vary depending on type of investment or financing. As of June 30, 2013, the Company identified one VIE related to its securities investments. The VIE has a carrying value of $25.2 million as of June 30, 2013. The Company's maximum exposure to loss as of June 30, 2013 would not exceed the carrying value of its investment. Based on management's analysis, the Company determined that it does not currently or potentially hold a significant interest in this VIE and, therefore, is not the primary beneficiary. Accordingly, the VIE is not consolidated in the Company's financial statements as of June 30, 2013. The Company did not provide financial support to its unconsolidated VIE during the six months ended June 30, 2013. As of June 30, 2013, there were no explicit arrangements or implicit variable interests that could require the Company to provide financial support to its unconsolidated VIE. An affiliate of the Sponsor is named special servicer of the VIE.
Voting Interest Entities
A voting interest entity is an entity in which the total equity investment at risk is sufficient to enable it to finance its activities independently and the equity holders have the power to direct the activities of the entity that most significantly impact its economic performance, the obligation to absorb the losses of the entity and the right to receive the residual returns of the entity. The usual condition for a controlling financial interest in a voting interest entity is ownership of a majority voting interest. If the Company has a majority voting interest in a voting interest entity, the entity will generally be consolidated. The Company does not consolidate a voting interest entity if there are substantive participating and/or kick-out rights by other parties.
The Company performs on-going reassessments of whether entities previously evaluated under the majority voting-interest framework have become VIEs, based on certain events, and therefore subject to the VIE consolidation framework.
Investments in and Advances to Unconsolidated Ventures
The Company has non-controlling, unconsolidated ownership interests in entities that may be accounted for using the equity method, at fair value or the cost method.
Under the equity method, the investment is adjusted each period for capital contributions and distributions and its share of the entity's net income (loss). Capital contributions, distributions and net
12
Table of Contents
NORTHSTAR REAL ESTATE INCOME TRUST, INC. AND SUBSIDIARIES
NOTES TO CONSOLIDATED FINANCIAL STATEMENTS (Continued)
(Unaudited)
2. Summary of Significant Accounting Policies (Continued)
income (loss) of such entities are recorded in accordance with the terms of the governing documents. Allocations of net income (loss) may differ from the stated ownership percentage interest in such entities as a result of preferred returns and allocation formulas, if any, as described in such governing documents.
The Company may account for an investment in an unconsolidated entity at fair value by electing the fair value option. The Company elected the fair value option for its investments in joint ventures that own limited partnership interests in real estate private equity funds ("PE Investments"). PE Investments are recorded as investments in private equity funds, at fair value on the consolidated balance sheets. The Company records the change in fair value for its share of the projected future cash flow of PE Investments from one period to another in equity in earnings (losses) from unconsolidated ventures in the consolidated statements of operations. Any change in fair value attributed to market related assumptions are considered unrealized gain (loss).
The Company may account for investments that do not qualify for equity method accounting or for which the fair value option was not elected using the cost method if the Company determines the investment in the unconsolidated entity is insignificant. Under the cost method, equity in earnings is recorded as dividends are received to the extent they are not considered a return of capital which is recorded as a reduction of cost of the investment.
The Company evaluates whether disclosure of summarized financial statement information is required for any individually significant investment in unconsolidated ventures. The Company determined there was one significant unconsolidated joint venture with respect to PE Investment I as of June 30, 2013. However, given the Company records equity in earnings (losses) based on the change in fair value for its share of the projected future cash flow from one period to another, the Company determined there is no relevant summarized financial information to disclose.
Estimates
The preparation of consolidated financial statements in conformity with U.S. GAAP requires management to make estimates and assumptions that could affect the amounts reported in the consolidated financial statements and accompanying notes. Actual results could materially differ from those estimates and assumptions.
Reclassifications
Certain prior period amounts have been reclassified in the consolidated financial statements to conform to current period presentation.
Comprehensive Income (Loss)
The Company reports consolidated comprehensive income (loss) in separate statements following the consolidated statements of operations. Comprehensive income (loss) is defined as the change in equity resulting from net income (loss) and other comprehensive income (loss) ("OCI"). The only component of OCI is unrealized gain (loss) on CRE securities for which the fair value option was not elected.
13
Table of Contents
NORTHSTAR REAL ESTATE INCOME TRUST, INC. AND SUBSIDIARIES
NOTES TO CONSOLIDATED FINANCIAL STATEMENTS (Continued)
(Unaudited)
2. Summary of Significant Accounting Policies (Continued)
Fair Value Option
The fair value option provides an election that allows a company to irrevocably elect fair value for certain financial assets and liabilities on an instrument-by-instrument basis at initial recognition. The Company will generally not elect the fair value option for its assets and liabilities. However, the Company may elect to apply the fair value option for certain investments. Any change in fair value for assets and liabilities for which the election is made is recognized in earnings.
Real Estate Debt Investments
CRE debt investments are generally intended to be held to maturity and, accordingly, are carried at cost, net of unamortized loan fees, premium, discount and unfunded commitments. CRE debt investments that are deemed to be impaired are carried at amortized cost less a loan loss reserve, if deemed appropriate, which approximates fair value.
Real Estate Securities
The Company classifies its CRE securities investments as available for sale on the acquisition date, which are carried at fair value. Unrealized gains (losses) are recorded as a component of accumulated OCI in the consolidated statements of equity. However, the Company may elect the fair value option for certain of its available for sale securities, and as a result, any unrealized gains (losses) on such securities are recorded in unrealized gain (loss) on investments and other in the consolidated statements of operations. As of June 30, 2013, the Company did not have any CRE securities investments for which it elected the fair value option.
Revenue Recognition
Real Estate Debt Investments
Interest income is recognized on an accrual basis and any related premium, discount, origination costs and fees are amortized over the life of the investment using the effective interest method. The amortization is reflected as an adjustment to interest income in the consolidated statements of operations. The amortization of a premium or accretion of a discount is discontinued if such loan is reclassified to held for sale.
Real Estate Securities
Interest income is recognized using the effective interest method with any premium or discount amortized or accreted through earnings based on expected cash flow through the expected maturity date of the security. Changes to expected cash flow may result in a change to the yield which is then applied retrospectively (for high-credit quality securities) or prospectively for all other securities to recognize interest income.
14
Table of Contents
NORTHSTAR REAL ESTATE INCOME TRUST, INC. AND SUBSIDIARIES
NOTES TO CONSOLIDATED FINANCIAL STATEMENTS (Continued)
(Unaudited)
2. Summary of Significant Accounting Policies (Continued)
Credit Losses and Impairment on Investments
Real Estate Debt Investments
Loans are considered impaired when based on current information and events it is probable that the Company will not be able to collect principal and interest amounts due according to the contractual terms. The Company assesses the credit quality of the portfolio and adequacy of loan loss reserves on a quarterly basis, or more frequently as necessary. Significant judgment of the Company is required in this analysis. The Company considers the estimated net recoverable value of the loan as well as other factors, including but not limited to the fair value of any collateral, the amount and the status of any senior debt, the quality and financial condition of the borrower and the competitive situation of the area where the underlying collateral is located. Because this determination is based on projections of future economic events, which are inherently subjective, the amount ultimately realized may differ materially from the carrying value as of the balance sheet date. If upon completion of the assessment, the estimated fair value of the underlying collateral is less than the net carrying value of the loan, a loan loss reserve is recorded with a corresponding charge to provision for loan losses. The loan loss reserve for each loan is maintained at a level that is determined to be adequate by management to absorb probable losses. As of June 30, 2013, the Company did not have any impaired CRE debt investments.
Income recognition is suspended for a loan at the earlier of the date at which payments become 90-days past due or when, in the opinion of the Company, a full recovery of income and principal becomes doubtful. When the ultimate collectability of the principal of an impaired loan is in doubt, all payments are applied to principal under the cost recovery method. When the ultimate collectability of the principal of an impaired loan is not in doubt, contractual interest is recorded as interest income when received, under the cash basis method until an accrual is resumed when the loan becomes contractually current and performance is demonstrated to be resumed. A loan is written off when it is no longer realizable and/or legally discharged.
Real Estate Securities
CRE securities for which the fair value option is elected are not evaluated for other-than-temporary impairment ("OTTI") as any change in fair value is recorded in the consolidated statements of operations. Realized losses on such securities are reclassified to realized gain (loss) on investments and other as losses occur.
CRE securities for which the fair value option is not elected are evaluated for OTTI quarterly. When the fair value of CRE securities is less than its amortized cost the security is considered impaired. If the Company either intends to sell an impaired security or it is more-likely-than-not that the Company will be required to sell an impaired security prior to its anticipated recovery, then the Company must recognize OTTI through a charge to the consolidated statements of operations equal to the difference between amortized cost and fair value at the measurement date. If the Company does not intend to sell an impaired security and it is not more-likely-than-not that it would be required to sell an impaired security prior to its recovery, then the Company must evaluate the security for any impairment. The portion of OTTI related to expected credit losses is recognized in the consolidated statements of operations. The remaining OTTI related to the valuation adjustment is recognized as a
15
Table of Contents
NORTHSTAR REAL ESTATE INCOME TRUST, INC. AND SUBSIDIARIES
NOTES TO CONSOLIDATED FINANCIAL STATEMENTS (Continued)
(Unaudited)
2. Summary of Significant Accounting Policies (Continued)
component of accumulated OCI in the consolidated statements of equity. The portion of OTTI recognized through earnings is accreted back to the amortized cost basis of the security through interest income, while amounts recognized through OCI are amortized over the life of the security with no impact on earnings.
Derivatives
Derivatives are used to manage exposure to interest rate risk. All cash settlements and any change in fair value are recorded in interest income in the consolidated statements of operations. As of June 30, 2013, the Company had one interest rate floor as a hedge related to its floating-rate investments, maturing in October 2015 with a fair value of $7.1 million and a notional amount of $225.0 million. Derivatives are generally valued using a third-party pricing service. These quotations are not adjusted and are based on observable inputs that can be validated, and as such, are classified as Level 2 of the fair value hierarchy (refer to Note 11). The interest rate floor is included in deferred costs and other assets, net on the consolidated balance sheet as of June 30, 2013.
Other
Refer to the Company's Annual Report on Form 10-K for the fiscal year ended December 31, 2012 for a complete discussion of the Company's significant accounting policies.
Recent Accounting Pronouncements
In February 2013, the Financial Accounting Standards Board issued an accounting update to present the reclassification adjustments to OCI by component on the face of the statement of operations or in the notes to the consolidated financial statements. For other amounts that are not required under U.S. GAAP to be reclassified in their entirety into earnings, an entity is required to cross-reference to other disclosures required under U.S. GAAP to provide additional detail about those amounts. The Company adopted the provisions of the update and it did not have a material impact on the consolidated financial statements.
16
Table of Contents
NORTHSTAR REAL ESTATE INCOME TRUST, INC. AND SUBSIDIARIES
NOTES TO CONSOLIDATED FINANCIAL STATEMENTS (Continued)
(Unaudited)
3. Real Estate Debt Investments
The following table presents CRE debt investments, all of which have been directly originated by the Company, as of June 30, 2013 (dollars in thousands):
| | | | | | | | | | | | | | | | | | | | | | |
| |
| |
| |
| | Weighted Average | | Floating
Rate as
% of
Principal
Amount | |
|---|
Asset Type: | | Number | | Principal
Amount(1) | | Carrying
Value(2) | | Fixed
Rate | | Spread
over
LIBOR(3) | | Unleveraged
Current
Yield | |
|---|
First mortgage loans | | | 26 | | $ | 856,160 | | $ | 836,146 | | | 9.31 | % | | 6.66 | % | | 8.24 | % | | 87.2 | % |
Mezzanine loans | | | 2 | | | 56,500 | | | 56,500 | | | 11.50 | % | | 10.00 | % | | 11.90 | % | | 8.0 | % |
Subordinate mortgage interests | | | 1 | | | 33,250 | | | 33,250 | | | 13.11 | % | | 0.00 | % | | 13.24 | % | | 0.0 | % |
| | | | | | | | | | | | | | | | |
Total/Weighted average | | | 29 | | $ | 945,910 | | $ | 925,896 | | | 10.56 | % | | 6.68 | % | | 8.64 | % | | 79.2 | % |
| | | | | | | | | | | | | | | | |
- (1)
- Includes interest accretion, to the extent applicable, and future funding commitments of $21.8 million.
- (2)
- Certain CRE debt investments serve as collateral for financing transactions including carrying value of $194.5 million for Securitization 2012-1 and $361.0 million for Term Loan Facilities (refer to Note 6). The remainder is unleveraged.
- (3)
- All floating-rate loans are subject to a fixed minimum LIBOR rate ("LIBOR floor"). As of June 30, 2013, the weighted average LIBOR floor was 1.35%.
In April 2013, the Company, together with the Sponsor, originated a $255.0 million loan secured by a leasehold mortgage in the recently renovated, 1,331 room Milford Plaza Hotel ("Milford") located in the epicenter of Times Square, New York City. In addition, the investment includes an aggregate 35.0% interest in the Milford hotel and retail component of the hotel (refer to Note 4). The Company funded $89.3 million of the investment and the Sponsor funded the remaining $165.7 million. The loan is comprised of a $56.0 million first mortgage loan and a $33.3 million subordinate mortgage interest, which is financed with $45.5 million from one of the term loan facilities.
The loan is held by a general partnership of which both the Company and the Sponsor are the general partners ("Milford Loan JV"). The Sponsor is the designated partner. The Milford Loan JV is considered a voting interest entity and is not consolidated due to the substantive kick-out rights held by the Company. The Company and the Sponsor each control their proportionate interest in the Milford Loan JV and have pledged their proportionate interest to their respective loan facilities. Accordingly, the Company records its respective CRE debt investment on its consolidated balance sheets.
17
Table of Contents
NORTHSTAR REAL ESTATE INCOME TRUST, INC. AND SUBSIDIARIES
NOTES TO CONSOLIDATED FINANCIAL STATEMENTS (Continued)
(Unaudited)
3. Real Estate Debt Investments (Continued)
The following table presents CRE debt investments, all of which have been directly originated by the Company, as of December 31, 2012 (dollars in thousands):
| | | | | | | | | | | | | | | | | | | | | | |
| |
| |
| |
| | Weighted Average | | Floating
Rate as
% of
Principal
Amount | |
|---|
Asset Type: | | Number | | Principal
Amount(1) | | Carrying
Value(2) | | Fixed
Rate | | Spread
over
LIBOR(3) | | Unleveraged
Current
Yield | |
|---|
First mortgage loans | | | 18 | | $ | 486,992 | | $ | 476,717 | | | 13.25 | % | | 6.14 | % | | 8.22 | % | | 89.5 | % |
Mezzanine loans | | | 2 | | | 56,627 | | | 37,341 | | | 11.50 | % | | 10.00 | % | | 12.12 | % | | 8.2 | % |
| | | | | | | | | | | | | | | | |
Total/Weighted average | | | 20 | | $ | 543,619 | | $ | 514,058 | | | 12.47 | % | | 6.18 | % | | 8.50 | % | | 81.0 | % |
| | | | | | | | | | | | | | | | |
- (1)
- Includes interest accretion, to the extent applicable, and future funding commitments of $29.8 million.
- (2)
- Certain CRE debt investments serve as collateral for financing transactions including carrying value of $194.5 million for Securitization 2012-1 and $197.6 million for Term Loan Facilities (refer to Note 6). The remainder is unleveraged.
- (3)
- All floating-rate loans are subject to a LIBOR floor. As of December 31, 2012, the weighted average LIBOR floor was 1.61%.
The following table presents maturities of CRE debt investments based on principal amount as of June 30, 2013 (dollars in thousands):
| | | | | | | |
| | Initial
Maturity | | Maturity
Including
Extensions(1) | |
|---|
July 1 - December 31, 2013 | | $ | 64,480 | | $ | — | |
Years Ending December 31: | | | | | | | |
2014 | | | 114,310 | | | 52,000 | |
2015 | | | 418,070 | | | 12,480 | |
2016 | | | 259,800 | | | 179,512 | |
2017 | | | — | | | 352,868 | |
Thereafter | | | 89,250 | | | 349,050 | |
| | | | | | |
Total | | $ | 945,910 | | $ | 945,910 | |
| | | | | | |
- (1)
- Assumes that all debt with extension options will qualify for extension at such maturity according to the conditions stipulated in the related debt agreements.
Credit Quality Monitoring
CRE debt investments are typically loans secured by direct senior priority liens on real estate properties or by interests in entities that directly own real estate properties, which serve as the primary source of cash for the payment of principal and interest. The Company evaluates its debt investments at least quarterly and differentiates the relative credit quality principally based upon: (i) whether the
18
Table of Contents
NORTHSTAR REAL ESTATE INCOME TRUST, INC. AND SUBSIDIARIES
NOTES TO CONSOLIDATED FINANCIAL STATEMENTS (Continued)
(Unaudited)
3. Real Estate Debt Investments (Continued)
borrower is currently paying contractual debt service in accordance with its contractual terms; and (ii) whether the Company believes the borrower will be able to perform under its contractual terms in the future, as well as the Company's expectations as to the ultimate recovery of principal at maturity.
The Company categorizes a debt investment for which it expects to receive full payment of contractual principal and interest payments as "performing." The Company will categorize a weaker credit quality debt investment that is currently performing, but for which it believes future collection of all or some portion of principal and interest is in doubt, into a category called "performing with a loan loss reserve." The Company will categorize a weaker credit quality debt investment that is not performing, which the Company defines as a loan in maturity default and/or past due at least 90 days on its contractual debt service payments, as a non-performing loan ("NPL"). The Company's definition of an NPL may differ from that of other companies that track NPLs.
As of June 30, 2013, all CRE debt investments were performing in accordance with the contractual terms of their governing documents and were categorized as performing loans. For the six months ended June 30, 2013, no CRE debt investment contributed more than 10% of interest income.
4. Investments in and Advances to Unconsolidated Ventures
Investments in Private Equity Funds
PE Investments are considered voting interest entities. They are not consolidated by the Company due to the substantive participating rights of the partners in the joint venture that owns the interests in the real estate private equity funds. The Company elected the fair value option for PE Investments. As a result, the Company records equity in earnings (losses) based on the change in fair value for its share of the projected future cash flow from one period to another.
PE Investment I
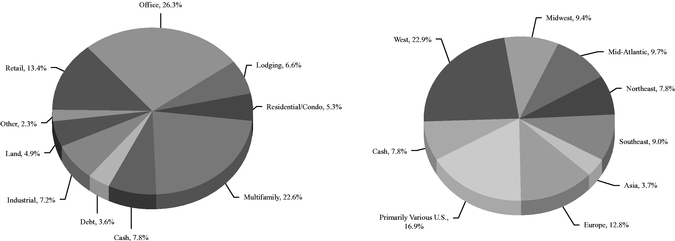
In February 2013, the Company completed the initial closing ("Initial Closing") of its investment in joint ventures ("PE Investment I"), which through a preferred investment, owns a portfolio of limited partnership interests in real estate private equity funds managed by institutional-quality sponsors. Pursuant to the terms of the agreement, at the Initial Closing, the full purchase price was funded, excluding future capital commitments. Accordingly, the Company funded $118.0 million and the Sponsor (together with the Company, the "NorthStar Entities") funded $282.1 million. The NorthStar Entities have an aggregate ownership interest in PE Investment I of 51.0%, of which the Company owns 29.5% and the Sponsor owns 70.5%. Teachers Insurance and Annuity Association of America (the "Class B Partner") contributed its interests in 47 funds subject to the transaction in exchange for all of the Class B partnership interests in PE Investment I.
PE Investment I provides for all cash distributions on a priority basis to the NorthStar Entities as follows: (i) first, 85.0% to the NorthStar Entities and 15.0% to the Class B Partner until the NorthStar Entities receive a 1.5x multiple on all of their invested capital, including amounts funded in connection with future capital commitments; (ii) second, 15.0% to the NorthStar Entities and 85.0% to the Class B Partner until the Class B Partner receives a return of its then remaining June 30, 2012 capital; and (iii) third, 51.0% to the NorthStar Entities and 49.0% to the Class B Partner. All amounts paid to and received by the NorthStar Entities will be based on each partner's proportionate interest.
19
Table of Contents
NORTHSTAR REAL ESTATE INCOME TRUST, INC. AND SUBSIDIARIES
NOTES TO CONSOLIDATED FINANCIAL STATEMENTS (Continued)
(Unaudited)
4. Investments in and Advances to Unconsolidated Ventures (Continued)
Since the Company was contractually entitled to its proportional share of all distributions derived from the fund interests since June 30, 2012 regardless of the date fund interests were transferred to PE Investment I, at the Initial Closing the Company recorded its proportional share of all distributions received since June 30, 2012. As of June 30, 2013, the carrying value of the investment in PE Investment I was $111.1 million. For the three and six months ended June 30, 2013, the Company recognized $6.0 million and $9.2 million, respectively, of equity in earnings. For the six months ended June 30, 2013, the Company received $23.7 million of net distributions and made $7.5 million of contributions related to PE Investment I. As of June 30, 2013, the Company's estimated future capital commitments to the fund interests in PE Investment I would be approximately $11.1 million.
PE Investment II
In June 2013, the Company, the Sponsor and funds managed by Goldman Sachs Asset Management ("Vintage Funds") (each a "Partner") formed joint ventures ("PE Investment II") and entered into an agreement with Common Pension Fund E, a common trust fund created under New Jersey law (the "Seller"), to acquire a portfolio of limited partnership interests in up to 25 real estate private equity funds managed by institutional-quality sponsors with an aggregate reported net asset value ("NAV") of approximately $925.4 million as of September 30, 2012. The Company, the Sponsor and the Vintage Funds each have an ownership interest in PE Investment II of 15.0%, 70.0% and 15.0%, respectively. All amounts paid and received will be based on each Partner's proportionate interest.
PE Investment II will pay $509.9 million to the Seller for all of the fund interests, or 55.0% of the September 30, 2012 NAV (the "Initial Amount"), and will pay the remaining $415.5 million, or 45.0% of the September 30, 2012 NAV (the "Deferred Amount"), by the fourth year after the first day of the fiscal quarter following the closing date of each fund interest. The Company's share of the Initial Amount and the Deferred Amount represents $76.5 million and $62.3 million, respectively. The Company funded all of its proportionate share of the Initial Amount at the initial closing on July 3, 2013. Refer to Note 13—"Subsequent Events" for further disclosure. The Deferred Amount is a liability of PE Investment II. Each Partner, directly or indirectly, guaranteed its proportionate interest of the Deferred Amount.
PE Investment II is entitled to receive all cash distributions from September 30, 2012 through the closing of each fund interest and is obligated to fund all capital contributions from September 30, 2012. At each closing, there will be a "true up" for any distributions received and any contributions made by the Seller from the contributed funds since September 30, 2012. As of June 30, 2013, the Company's estimated future capital commitments to the fund interests in PE Investment II would be approximately $8.8 million.
Beginning on the first day of the fiscal quarter following the closing date of each fund interest and for a period of three years thereafter, distributions will be made to PE Investment II on a priority basis as follows: 85.0% to PE Investment II and 15.0% to the Seller, provided that at the end of each such fiscal year, PE Investment II will pay amounts, if any, necessary to reduce the Deferred Amount by 15.0% of the then outstanding Deferred Amount (the "Amortization Amount") to the extent distributions to the Seller during each such year were less than the Amortization Amount for such year.
20
Table of Contents
NORTHSTAR REAL ESTATE INCOME TRUST, INC. AND SUBSIDIARIES
NOTES TO CONSOLIDATED FINANCIAL STATEMENTS (Continued)
(Unaudited)
4. Investments in and Advances to Unconsolidated Ventures (Continued)
In the fourth year following the applicable closing date, distributions will be split equally between PE Investment II and the Seller. At the conclusion of that four-year period, PE Investment II will be required to pay to the Seller the Deferred Amount less: (i) any distributions received by the Seller during such four-year period; and (ii) any Amortization Amounts received by the Seller during such four-year period. PE Investment II will receive 100% of all distributions following the payment of the Deferred Amount.
PE Investment II deposited an aggregate of $50.0 million in connection with the transaction. The deposit is generally non-refundable unless the transaction contemplated by the agreement is not consummated as a result of a material breach by the Seller. The Company anticipates closing the fund interests by the end of 2013, subject to customary closing conditions, including third-party consents. As of June 30, 2013, the carrying value of the investment in PE Investment II was $7.5 million.
Other
In connection with the Milford loan, the Company and the Sponsor have an aggregate 35.0% interest in the Milford hotel and retail component at the hotel. As of June 30, 2013, the carrying value of the investment was $0.5 million, which is included in deferred costs and other assets, net on the consolidated balance sheets. For the three and six months ended June 30, 2013, the Company recognized $0.2 million of equity in losses.
5. Real Estate Securities, Available for Sale
CRE securities are comprised of CMBS backed by a pool of CRE loans which are typically well-diversified by type and geography. The following table presents CRE securities (dollars in thousands):
| | | | | | | | | | | | | | | | | | | | | | | | | |
| |
| |
| |
| | Cumulative Unrealized
on Investments | |
| | Weighted Average | |
|---|
| |
| | Principal
Amount(1) | | Amortized
Cost | | Fair
Value | |
| | Unleveraged
Current
Yield | |
|---|
CMBS: | | Number | | Gain | | (Loss) | | Coupon(2) | |
|---|
June 30, 2013 | | | 8 | | $ | 104,542 | | $ | 52,844 | | $ | 2,838 | | $ | (393 | ) | $ | 55,289 | | | 4.53 | % | | 9.11 | % |
December 31, 2012 | | | 4 | | $ | 30,575 | | $ | 29,124 | | $ | 458 | | $ | — | | $ | 29,582 | | | 5.39 | % | | 5.71 | % |
- (1)
- Certain CRE securities serve as collateral for financing transactions including carrying value of $17.8 million for the CMBS Facilities (refer to Note 6). The remainder is unleveraged.
- (2)
- All CMBS are fixed rate.
The Company recorded unrealized gains in OCI for the three and six months ended June 30, 2013 of $1.0 million and $2.0 million, respectively. The Company recorded unrealized gains (losses) in OCI for the three and six months ended June 30, 2012 of ($0.2) million and $0.2 million, respectively.
As of June 30, 2013, the weighted average contractual maturity of CRE securities was 34 years with an expected maturity of 8.1 years.
21
Table of Contents
NORTHSTAR REAL ESTATE INCOME TRUST, INC. AND SUBSIDIARIES
NOTES TO CONSOLIDATED FINANCIAL STATEMENTS (Continued)
(Unaudited)
6. Borrowings
The following table presents borrowings as of June 30, 2013 and December 31, 2012 (dollars in thousands):
| | | | | | | | | | | | | | | | | | | |
| |
| |
| |
| | June 30, 2013 | | December 31, 2012 | |
|---|
| | Type | | Final
Maturity | | Contractual
Interest Rate(1) | | Principal
Amount | | Carrying
Value | | Principal
Amount | | Carrying
Value | |
|---|
Securitization bonds payable | | | | | | | | | | | | | | | | | | | |
Securitization 2012-1 | | Non-recourse | | Aug-29 | | LIBOR plus 1.66% | | $ | 124,659 | | $ | 124,610 | | $ | 124,659 | | $ | 124,491 | |
| | | | | | | | | | | | | | | | |
Subtotal securitization bonds payable | | | | | | | | | 124,659 | | | 124,610 | | | 124,659 | | | 124,491 | |
Credit facilities | | | | | | | | | | | | | | | | | | | |
Loan Facility 1 | | Partial Recourse(2) | | Feb-16(3) | | 2.95%(4) | | | 32,836 | | | 32,836 | | | 32,836 | | | 32,836 | |
Loan Facility 2 | | Partial Recourse(5) | | Jul-17(6) | | 3.44%(7) | | | 100,000 | | | 100,000 | | | 54,950 | | | 54,950 | |
Loan Facility 3 | | Non-recourse | | Jul-18(8) | | 4.90%(9) | | | 35,850 | | | 35,850 | | | 26,850 | | | 26,850 | |
Loan Facility 4 | | Partial Recourse(10) | | Mar-18(11) | | 5.20%(12) | | | 45,500 | | | 45,500 | | | — | | | — | |
CMBS Facilities | | Recourse | | (13) | | 1.45% | | | 11,685 | | | 11,685 | | | 11,685 | | | 11,685 | |
| | | | | | | | | | | | | | | | |
Subtotal credit facilities | | | | | | | | | 225,871 | | | 225,871 | | | 126,321 | | | 126,321 | |
| | | | | | | | | | | | | | | | |
Grand Total | | | | | | | | $ | 350,530 | | $ | 350,481 | | $ | 250,980 | | $ | 250,812 | |
| | | | | | | | | | | | | | | | |
- (1)
- Represents the weighted average as of June 30, 2013.
- (2)
- Recourse solely with respect to 25.0% of "core" assets and 100% of "flex" assets, which may only represent 25.0% of the total credit facility, as such terms are defined in the governing documents.
- (3)
- The initial maturity date is February 28, 2014, with two, one-year extensions available at the option of the Company, which may be exercised upon the satisfaction of certain customary conditions set forth in the governing documents.
- (4)
- The contractual interest rate depends upon asset type, subject to adjustment, and ranges from one-month LIBOR plus 2.5% to 3.0%.
- (5)
- Recourse solely with respect to 25.0% of the repurchase price for purchased assets with a lender debt yield equal to or greater than 10% at the time of financing plus 100% of the repurchase price for purchased assets with a lender debt yield less than 10% at the time of financing.
- (6)
- The initial maturity date is July 18, 2014, with three, one-year extensions available at the option of the Company, which may be exercised upon the satisfaction of certain customary conditions set forth in the governing documents.
- (7)
- The contractual interest rate depends upon asset type and characteristic and ranges from one-month LIBOR plus 2.0% to 4.0%.
- (8)
- The initial maturity date is July 30, 2015, with three, one-year extensions available at the option of the Company, which may be exercised upon the satisfaction of certain customary conditions set forth in the governing documents.
- (9)
- The contractual interest rate depends upon asset type and characteristic and ranges from one-month LIBOR plus 3.95% to 5.95%.
- (10)
- Recourse solely with respect to the greater of: (i) 25.0% of the financed amount of stabilized loans plus the financed amount of transitional loans; or (ii) the lesser of $25.0 million or the aggregate financed amount of all loans.
- (11)
- The initial maturity date is March 11, 2014, with four, one-year extensions available at the option of the Company, which may be exercised upon the satisfaction of certain customary conditions set forth in the governing documents.
- (12)
- The contractual interest rate depends upon asset type and characteristics and ranges from one-month LIBOR plus 2.5% to 3.0%.
22
Table of Contents
NORTHSTAR REAL ESTATE INCOME TRUST, INC. AND SUBSIDIARIES
NOTES TO CONSOLIDATED FINANCIAL STATEMENTS (Continued)
(Unaudited)
6. Borrowings (Continued)
- (13)
- The maturity dates on the CMBS Facilities are dependent upon asset type and will typically range from two to three months.
The following table presents scheduled principal on borrowings, based on final maturity as of June 30, 2013 (dollars in thousands):
| | | | | | | | | | |
| | Total | | Securitization
Bonds Payable | | Credit
Facilities | |
|---|
July 1 - December 31, 2013 | | $ | 11,685 | | $ | — | | $ | 11,685 | |
Years Ending December 31: | | | | | | | | | | |
2014 | | | — | | | — | | | — | |
2015 | | | — | | | — | | | — | |
2016 | | | 32,836 | | | — | | | 32,836 | |
2017 | | | 100,000 | | | — | | | 100,000 | |
Thereafter | | | 206,009 | | | 124,659 | | | 81,350 | |
| | | | | | | | |
Total | | $ | 350,530 | | $ | 124,659 | | $ | 225,871 | |
| | | | | | | | |
Securitization Financing Transaction
Securitization 2012-1
In November 2012, the Company entered into a $351.4 million securitization financing transaction ("Securitization 2012-1") collateralized by CRE debt investments originated by the Company and the Sponsor. The Company contributed nine CRE debt investments with a $199.2 million aggregate principal amount and retained an equity interest of $70.0 million. A total of $227.5 million of permanent, non-recourse, non-mark-to-market bonds were issued, of which $129.5 million financed the CRE debt investments contributed by the Company, representing an advance rate of 65.0% and a weighted average coupon of LIBOR plus 1.63%. The Company used the proceeds to repay $117.7 million of borrowings on its loan facilities.
The retained equity interests of the Company and the Sponsor are held by a general partnership and both the Company and the Sponsor are the general partners ("Financing JV"). Both Securitization 2012-1 and the Financing JV are considered voting interest entities. The Sponsor was appointed special servicer of Securitization 2012-1 and is the designated member of the Financing JV. The entities are not consolidated due to the substantive kick-out rights of the Company. The transferred debt investments failed sale treatment under U.S. GAAP as the Company maintains effective control of its contributed assets. The Company records its respective CRE debt investments and securitization bonds payable on its consolidated balance sheets.
Term Loan Facilities
In February 2012, a subsidiary of the Company entered into a master repurchase and securities contract ("Loan Facility 1") of $100.0 million to finance the origination of CRE first mortgage loans. In connection with Loan Facility 1, the Company, together with the Operating Partnership, entered into a guaranty agreement, under which the Company and the Operating Partnership guarantee certain of the obligations under Loan Facility 1. Additionally, in connection with Loan Facility 1, the Operating
23
Table of Contents
NORTHSTAR REAL ESTATE INCOME TRUST, INC. AND SUBSIDIARIES
NOTES TO CONSOLIDATED FINANCIAL STATEMENTS (Continued)
(Unaudited)
6. Borrowings (Continued)
Partnership provided a pledge and security agreement over its interests in the borrowing subsidiary of the Company. Loan Facility 1 and related agreements contain representations, warranties, covenants, conditions precedent to funding, events of default and indemnities that are customary for agreements of these types. The Company has agreed to guarantee certain customary obligations under Loan Facility 1 if the Company or an affiliate of the Company engage in certain customary bad acts. Loan Facility 1 contains a liquidity covenant that requires the borrowing subsidiary of the Company to maintain at least $5.0 million and a maximum of $15.0 million in unrestricted cash or cash equivalents at all times during the term of Loan Facility 1.
In July 2012, a subsidiary of the Company entered into a master repurchase agreement ("Loan Facility 2") of $50.0 million to finance first mortgage loans and senior loan participations secured by commercial real estate. Loan Facility 2 was increased to $100.0 million in November 2012 and to $150.0 million in April 2013. In connection with Loan Facility 2, the Company agreed to guarantee certain obligations under Loan Facility 2 if the Company or an affiliate of the Company engage in certain customary bad acts. Loan Facility 2 and related agreements contain representations, warranties, covenants, conditions precedent to funding, events of default and indemnities that are customary for agreements of these types. More specifically, the borrowing subsidiary of the Company must maintain at least $3.8 million and a maximum of $22.5 million in unrestricted cash at all times during the term of Loan Facility 2.
In July 2012, a subsidiary of the Company entered into a credit and security agreement ("Loan Facility 3") of $40.0 million on a non-recourse basis, subject to certain exceptions, to finance first mortgage loans and senior loan participations secured by commercial real estate. In connection with Loan Facility 3, the Operating Partnership agreed to guarantee interest payments and the customary obligations under Loan Facility 3 if either the Company or its affiliates engage in certain customary bad acts. In addition, the Operating Partnership pledged its interests in the Company's borrowing subsidiary as collateral. Loan Facility 3 and related agreements contain representations, warranties, covenants, conditions precedent to funding, events of default and indemnities that are customary for agreements of these types. More specifically, the Operating Partnership must maintain at least $3.8 million and as much as $7.5 million in unrestricted cash or other eligible investments, at all times during the term of Loan Facility 3.
In March 2013, a subsidiary of the Company entered into a master repurchase agreement ("Loan Facility 4") of $200.0 million to finance first mortgage loans and senior interests secured by commercial real estate. In connection with Loan Facility 4, the Company and the Operating Partnership entered into a guaranty agreement, under which the Company and the Operating Partnership guaranty certain of the obligations under Loan Facility 4. Loan Facility 4 and related agreements contain representations, warranties, covenants, conditions precedent to funding, events of default and indemnities that are customary for agreements of these types. More specifically, the Company must maintain at least $20.0 million in unrestricted cash or cash equivalents at all times during the term of Loan Facility 4. In addition, the Company has agreed to guarantee certain customary obligations under Loan Facility 4 if the Company or an affiliate of the Company engage in certain customary bad acts.
As of June 30, 2013, the Company had $360.3 million principal amount of CRE debt investments, financed with $214.2 million under four term loan facilities ("Term Loan Facilities").
24
Table of Contents
NORTHSTAR REAL ESTATE INCOME TRUST, INC. AND SUBSIDIARIES
NOTES TO CONSOLIDATED FINANCIAL STATEMENTS (Continued)
(Unaudited)
6. Borrowings (Continued)
During the initial term, all of the Term Loan Facilities act as revolving credit facilities that can be paid down as assets payoff and re-drawn upon for new investments. As of June 30, 2013, the Company was in compliance with all of its financial covenants.
CMBS Facilities
In September 2012, the Company entered into two master repurchase agreements ("CMBS Facilities") to finance CMBS investments. The CMBS Facilities contain representations, warranties, covenants, conditions precedent to funding, events of default and indemnities that are customary for agreements of this type. As of June 30, 2013, the Company had $16.6 million principal amount of CRE securities, financed with $11.7 million under its CMBS Facilities.
7. Related Party Arrangements
NS Real Estate Income Trust Advisor, LLC
Subject to certain restrictions and limitations, the Advisor is responsible for managing the Company's affairs on a day-to-day basis and for identifying, originating, acquiring and asset managing investments on behalf of the Company. For such services, to the extent permitted by law and regulations, the Advisor receives fees and reimbursements from the Company. Below is a description and table of the fees and reimbursements incurred to the Advisor.
Organization and Offering Costs
The Advisor, or its affiliates, is entitled to receive reimbursement for organization and offering costs paid on behalf of the Company in connection with the Offering. The Company is obligated to reimburse the Advisor, or its affiliates, as applicable, for organization and offering costs to the extent the aggregate of selling commissions, dealer manager fees and other organization and offering costs do not exceed 15.0% of gross proceeds from the Total Primary Offering. The Advisor initially expected cumulative organization and offering costs, excluding selling commissions and dealer manager fees, would not exceed $15.0 million, or 1.5% of the proceeds expected to be raised from the Total Primary Offering. Based on gross proceeds raised of $1,072.9 million from the Total Primary Offering, the Company estimates reimbursable organization and offering costs, excluding selling commissions and dealer manager fees, of $10.5 million, or 1.0%, which is less than the 1.5% threshold. The Company expects to continue to incur organization and offering costs in connection with the DRP beyond the Total Primary Offering. The Company shall not reimburse the Advisor for any organization and offering costs that the Company's independent directors determine are not fair and commercially reasonable to the Company. The Company records organization and offering costs each period based on an allocation of expected total organization and offering costs to be reimbursed. Organization costs are recorded in general and administrative expenses in the consolidated statements of operations and offering costs are recorded as a reduction to equity. In addition, total underwriting compensation through the completion of the Total Primary Offering, including selling commissions, the dealer manager fee and amounts reimbursed to participating broker dealers and investment advisors, did not exceed the 10.0% of gross Total Primary Offering proceeds limitation prescribed by the Financial Industry Regulatory Authority.
25
Table of Contents
NORTHSTAR REAL ESTATE INCOME TRUST, INC. AND SUBSIDIARIES
NOTES TO CONSOLIDATED FINANCIAL STATEMENTS (Continued)
(Unaudited)
7. Related Party Arrangements (Continued)
Operating Costs
The Advisor, or its affiliates, is entitled to receive reimbursement for direct and indirect operating costs incurred by the Advisor in connection with administrative services provided to the Company. Indirect operating costs include the Company's allocable share of costs incurred by the Advisor for personnel and other overhead such as rent, technology and utilities. However, there is no reimbursement for personnel costs related to executive officers and other personnel involved in activities for which the Advisor receives an acquisition fee or disposition fee. The Company reimburses the Advisor quarterly for operating costs (including the asset management fee) based on a calculation for the four preceding fiscal quarters not to exceed the greater of: (i) 2.0% of its average invested assets; or (ii) 25.0% of its net income determined without reduction for any additions to reserves for depreciation, loan losses or other similar non-cash reserves and excluding any gain from the sale of assets for that period (the "2%/25% Guidelines"). Notwithstanding the above, the Company may reimburse the Advisor for expenses in excess of this limitation if a majority of the Company's independent directors determines that such excess expenses are justified based on unusual and non-recurring factors. The Company calculates the expense reimbursement quarterly based upon the trailing twelve-month period.
Advisory Fees
Asset Management Fee
The Advisor, or its affiliates, receives a monthly asset management fee equal to one-twelfth of 1.25% of the sum of the amount funded or allocated for CRE investments including expenses and any financing attributable to such investments, less any principal received on debt and securities investments (or the proportionate share thereof in the case of an investment made through a joint venture).
Acquisition Fee
The Advisor, or its affiliates, also receives an acquisition fee equal to 1.0% of the amount funded or allocated by the Company to originate or acquire investments, including acquisition expenses and any financing attributable to such investments. Acquisition fees paid to the Advisor related to the origination or acquisition of CRE debt investments are included in CRE debt investments, net on the consolidated balance sheets and are amortized to interest income over the life of the investment using the effective interest method.
Disposition Fee
For substantial assistance in connection with the sale of investments and based on the services provided, the Advisor, or its affiliates, receives disposition fees equal to 1.0% of the contract sales price of each CRE investment sold. The Company does not pay a disposition fee upon the maturity, prepayment, workout modification or extension of a CRE debt investment unless there is a corresponding fee paid by the borrower, in which case the disposition fee is the lesser of: (i) 1.0% of the principal amount of the CRE debt investment prior to such transaction; or (ii) the amount of the fee paid by the borrower in connection with such transaction. If the Company takes ownership of a property as a result of a workout or foreclosure of a CRE debt investment, the Company will pay a
26
Table of Contents
NORTHSTAR REAL ESTATE INCOME TRUST, INC. AND SUBSIDIARIES
NOTES TO CONSOLIDATED FINANCIAL STATEMENTS (Continued)
(Unaudited)
7. Related Party Arrangements (Continued)
disposition fee upon the sale of such property. Disposition fees incurred to the Advisor on CRE debt investments are included in CRE debt investments, net on the consolidated balance sheets and are amortized to interest income over the life of the investment using the effective interest method.
NorthStar Realty Securities, LLC
Selling Commissions and Dealer Manager Fees
Pursuant to a dealer manager agreement, the Company paid the Dealer Manager selling commissions of up to 7.0% of gross proceeds from the Total Primary Offering, all of which were reallowed to participating broker-dealers. In addition, the Company paid the Dealer Manager a dealer manager fee of up to 3.0% of gross proceeds from the Total Primary Offering, a portion of which was reallowed to participating broker-dealers. No selling commissions or dealer manager fees are paid for sales pursuant to the DRP.
Summary of Fees and Reimbursements
The following table presents the fees and reimbursements incurred to the Advisor for the three and six months ended June 30, 2013 and 2012 and the due to related party as of June 30, 2013 and December 31, 2012 (dollars in thousands):
| | | | | | | | | | | | | | | | | | | | | |
| |
| |
| |
| |
| |
| | Due to
related party as of | |
|---|
| |
| | Three Months
Ended June 30, | | Six Months
Ended June 30, | |
|---|
| | Financial Statement Location | | June 30,
2013 | | December 31,
2012 | |
|---|
Type of Fee or Reimbursement | | 2013 | | 2012 | | 2013 | | 2012 | |
|---|
Organization and offering costs | | | | | | | | | | | | | | | | | | | | | |
Organization | | General and administrative expenses | | $ | 9 | | $ | 118 | | $ | 62 | | $ | 270 | | $ | — | | $ | 113 | |
Offering | | Cost of capital(1) | | | 1,502 | | | 768 | | | 2,505 | | | 1,755 | | | 1,124 | | | 2,151 | |
Operating costs(2) | | General and administrative expenses | | |
2,218 | | |
763 | | |
3,754 | | |
1,098 | | |
2,148 | | |
523 | |
Advisory fees | | | | | | | | | | | | | | | | | | | | | |
Asset management | | Advisory fees—related party | | | 2,761 | | | 511 | | | 4,903 | | | 818 | | | 981 | | | 559 | |
Acquisition(3) | | Real estate debt investments, net / Advisory fees—related party | | | 2,981 | | | 2,321 | | | 5,323 | | | 2,577 | | | 1,404 | | | — | |
Disposition(3) | | Real estate debt investments, net | | | 15 | | | — | | | 15 | | | — | | | — | | | 24 | |
Selling commissions /Dealer manager fees | | Cost of capital(1) | | |
32,577 | | |
8,678 | | |
49,511 | | |
16,078 | | |
— | | |
— | |
| | | | | | | | | | | | | | | | | | | | |
Total(4) | | | | | | | | | | | | | | | | $ | 5,657 | | $ | 3,370 | |
| | | | | | | | | | | | | | | | | | | | |
- (1)
- Cost of capital is included in net proceeds from issuance of common stock in the consolidated statements of equity.
- (2)
- As of June 30, 2013, the Advisor incurred unreimbursed operating costs on behalf of the Company and $5.2 million is still allocable.
- (3)
- Acquisition/disposition fees incurred to the Advisor related to CRE debt investments are generally offset by origination/exit fees paid to the Company by borrowers if such fees are required from the borrower. Acquisition fees
27
Table of Contents
NORTHSTAR REAL ESTATE INCOME TRUST, INC. AND SUBSIDIARIES
NOTES TO CONSOLIDATED FINANCIAL STATEMENTS (Continued)
(Unaudited)
7. Related Party Arrangements (Continued)
related to PE Investments are included in advisory fees—related party in the consolidated statements of operations. The Advisor may determine to defer fees or seek reimbursement, subject to compliance with applicable policies. From inception through June 30, 2013, the Advisor deferred $0.5 million of acquisition fees and $0.3 million of disposition fees related to CRE securities.
- (4)
- Due to related party includes a $2.0 million receivable and $11.8 million payable as of June 30, 2013 and December 31, 2012, respectively, related to PE Investment I.
Sponsor Purchase of Common Stock
The Company was party to a Second Amended and Restated Distribution Support Agreement, as amended (the "Distribution Support Agreement"), with the Sponsor pursuant to which the Sponsor committed to purchase up to an aggregate of $10.0 million in shares of the Company's common stock at a price of $9.00 per share if cash distributions exceed modified funds from operations (as defined in accordance with the current practice guidelines issued by the Investment Program Association) to provide additional funds to support distributions to stockholders. In April 2012, the Distribution Support Agreement was extended until July 2013. For the three and six months ended June 30, 2013, the Sponsor was not required to purchase shares in connection with the Distribution Support Agreement. For the three and six months ended June 30, 2012, the Sponsor purchased 0.1 million and 0.2 million shares, respectively, of the Company's common stock for $0.9 million and $1.9 million, respectively. From inception through the expiration of the Distribution Support Agreement, the Sponsor purchased 0.5 million shares for $4.6 million (refer to Note 13).
Securitization 2012-1
The Company entered into an agreement with the Sponsor that provides that both the Company and the Sponsor receive the economic benefit and bear the economic risk associated with the investments we each contributed into Securitization 2012-1. In both cases, the respective retained equity interest of the Company and the Sponsor is subordinate to interests of the senior bondholders of Securitization 2012-1 and the senior bondholders have no recourse to the general credit of the Company or the Sponsor. In the event that either the Company or the Sponsor suffer a complete loss of the retained equity interests in Securitization 2012-1, any additional losses would be borne by the remaining retained equity interests held by the Company or the Sponsor, as the case may be, prior to the senior bondholders. An affiliate of the Sponsor was named special servicer for Securitization 2012-1.
PE Investments
In connection with PE Investments, the Company guaranteed all of its funding obligations that may be due and owed under the governing documents indirectly through an indemnification with the Sponsor, which in turn guaranteed the obligations directly to PE Investment JV entities. The Company and the Sponsor each agreed to indemnify the other proportionately for any losses that may arise in connection with the funding and other obligations as set forth in the governing documents in the case of a joint default by the Company and the Sponsor. The Company and the Sponsor further agreed to indemnify each other for all of the losses that may arise as a result of a default that was solely caused by the Company or the Sponsor, as the case may be.
28
Table of Contents
NORTHSTAR REAL ESTATE INCOME TRUST, INC. AND SUBSIDIARIES
NOTES TO CONSOLIDATED FINANCIAL STATEMENTS (Continued)
(Unaudited)
7. Related Party Arrangements (Continued)
PE Investment I
In connection with PE Investment I, the Company assumed the rights to subscribe to 29.5% of PE Investment I from the Sponsor. The Company and the Sponsor contributed cash of $400.1 million, of which the Company and the Sponsor contributed $118.0 million and $282.1 million, respectively.
In December 2012, the Sponsor deposited an aggregate of $40.0 million in connection with this transaction, which included $11.8 million on behalf of the Company, in the proportion of the respective capital contributions. This amount was settled by the Company in the first quarter 2013.
PE Investment II
In connection with the transaction, PE Investment II deposited an aggregate of $50.0 million, of which the Company deposited $7.5 million. The deposit is generally non-refundable unless the transaction contemplated by the agreement is not consummated as a result of a material breach by the Seller.
8. Stockholders' Equity
Common Stock
For the six months ended June 30, 2013, the Company issued 51.5 million shares of common stock in connection with the Total Primary Offering, generating gross proceeds of $512.8 million. For the year ended December 31, 2012, the Company issued 43.4 million shares of common stock pursuant to its Total Primary Offering, generating gross proceeds of $433.0 million. From inception through the completion of the Total Primary Offering on July 1, 2013, the Company issued 107.6 million shares of common stock, generating gross proceeds from the Total Primary Offering of $1,072.9 million.
Distribution Reinvestment Plan
The Company adopted a DRP through which common stockholders may elect to reinvest an amount equal to the distributions declared on their shares in additional shares of the Company's common stock in lieu of receiving cash distributions. The initial purchase price per share pursuant to the DRP is $9.50. Once the Company establishes an estimated value per share, shares issued pursuant to the DRP will be priced at 95.0% of the estimated value per share of the Company's common stock, as determined by the Advisor or another firm chosen for that purpose. The Company expects to establish an estimated value per share within 18 months after the completion of its offering stage which ended on July 1, 2013. No selling commissions or dealer manager fees are paid on shares issued pursuant to the DRP. The board of directors of the Company may amend or terminate the DRP for any reason upon ten-days' notice to participants.
For the six months ended June 30, 2013, the Company issued 1.3 million shares totaling $12.5 million of proceeds pursuant to the DRP. For the year ended December 31, 2012, the Company issued 1.1 million shares totaling $10.3 million of proceeds pursuant to the DRP. From inception through the completion of the Total Primary Offering, the Company issued 2.9 million shares totaling $27.4 million of proceeds pursuant to the DRP. In April 2013, the board of directors of the Company authorized the reallocation of shares available pursuant to the DRP to the Primary Offering. On July 1,
29
Table of Contents
NORTHSTAR REAL ESTATE INCOME TRUST, INC. AND SUBSIDIARIES
NOTES TO CONSOLIDATED FINANCIAL STATEMENTS (Continued)
(Unaudited)
8. Stockholders' Equity (Continued)
2013, the Company completed the Total Primary Offering and all of the shares initially registered were issued. The Company intends to continue to offer shares pursuant to the DRP beyond the Total Primary Offering. As a result, the Company filed a registration statement with the SEC to issue an additional 15.0 million shares pursuant to the DRP, which was declared effective on July 3, 2013 (refer to Note 13).
Distributions
Distributions to stockholders are declared quarterly by the board of directors of the Company and are paid monthly based on a daily amount of $0.002185792 per share, which is equivalent to an annual distribution rate of 8.0%. The following table presents distributions declared for the six months ended June 30, 2013 (dollars in thousands):
| | | | | | | | | | |
| | Distributions(1) | |
|---|
Period | | Cash | | DRP | | Total | |
|---|
January | | $ | 2,441 | | $ | 1,795 | | $ | 4,236 | |
February | | | 2,378 | | | 1,778 | | | 4,156 | |
March | | | 2,909 | | | 2,163 | | | 5,072 | |
April | | | 3,173 | | | 2,352 | | | 5,525 | |
May | | | 3,620 | | | 2,751 | | | 6,371 | |
June | | | 3,901 | | | 3,067 | | | 6,968 | |
- (1)
- Represents distributions declared for such period, even though such distributions are actually paid to stockholders the month following such period.
Share Repurchase Program
The Company adopted a share repurchase program that may enable stockholders to sell their shares to the Company in limited circumstances (the "Share Repurchase Program"). The Company may not repurchase shares unless a stockholder has held shares for one year. However, the Company may repurchase shares held less than one year in connection with a stockholder's death or qualifying disability, if the disability is deemed qualifying by the board of directors of the Company, in its sole discretion, and after receiving written notice from the stockholder or the stockholder's estate. The Company is not obligated to repurchase shares under the Share Repurchase Program. For the six months ended June 30, 2013, the Company repurchased 0.3 million shares of common stock for a total of $2.7 million at an average price of $9.50 per share. For the year ended December 31, 2012, the Company repurchased 0.1 million shares of common stock for a total of $1.4 million at an average price of $9.69 per share. The Company may amend or terminate the Share Repurchase Program at its discretion at any time, subject to certain notice requirements.
9. Equity-Based Compensation
Each of the Company's three independent directors received 5,000 shares of restricted stock in connection with the commencement of the Offering. Then in connection with their re-election to the board of directors, each of the Company's independent directors received: (i) 2,500 shares in June 2010
30
Table of Contents
NORTHSTAR REAL ESTATE INCOME TRUST, INC. AND SUBSIDIARIES
NOTES TO CONSOLIDATED FINANCIAL STATEMENTS (Continued)
(Unaudited)
9. Equity-Based Compensation (Continued)
and 2011; and (ii) 3,500 shares in June 2013. The restricted stock granted prior to 2013 generally vests over four years and the restricted stock granted in 2013 generally vests over two years; provided, however, that the restricted stock will become fully vested on the earlier occurrence of: (i) the termination of the independent director's service as a director due to his or her death or disability; or (ii) a change in control of the Company. Total equity-based compensation cost recognized in connection with the granting of the restricted stock is $0.4 million, which is recorded in general and administrative expenses ratably over the applicable vesting period.
For the three and six months ended June 30, 2013, the Company recognized $19,368 and $36,243 of equity-based compensation expense, respectively, related to the issuance of restricted stock, which was recorded in general and administrative expenses in the consolidated statements of operations. For the three and six months ended June 30, 2012, the Company recognized $13,734 and $26,390 of equity-based compensation expense, respectively, which was recorded in general and administrative expenses in the consolidated statements of operations.
10. Non-controlling Interests
Operating Partnership
Non-controlling interests represent the aggregate limited partnership interests in the Operating Partnership held by limited partners, other than the Company. Income (loss) allocated to the non-controlling interests is based on the limited partners' ownership percentage of the Operating Partnership. Income (loss) allocated to the Operating Partnership non-controlling interests for the three and six months ended June 30, 2013 and 2012 was an immaterial amount.
11. Fair Value
Fair Value Measurement
The fair value of financial instruments is based on the priority of the inputs to the valuation technique and categorized into a three-level fair value hierarchy. The fair value hierarchy gives the highest priority to quoted prices in active markets for identical assets or liabilities (Level 1) and the lowest priority to unobservable inputs (Level 3). If the inputs used to measure the financial instruments fall within different levels of the hierarchy, the categorization is based on the lowest level input that is significant to the fair value measurement of the instrument.
31
Table of Contents
NORTHSTAR REAL ESTATE INCOME TRUST, INC. AND SUBSIDIARIES
NOTES TO CONSOLIDATED FINANCIAL STATEMENTS (Continued)
(Unaudited)
11. Fair Value (Continued)
Financial assets and liabilities recorded at fair value on the consolidated balance sheets are categorized based on the inputs to the valuation techniques as follows:
| | | | |
| Level 1. | | Quoted prices for identical assets or liabilities in an active market. |
Level 2. |
|
Financial assets and liabilities whose values are based on the following: |
|
|
a) |
|
Quoted prices for similar assets or liabilities in active markets. |
|
|
b) |
|
Quoted prices for identical or similar assets or liabilities in non-active markets. |
|
|
c) |
|
Pricing models whose inputs are observable for substantially the full term of the asset or liability. |
|
|
d) |
|
Pricing models whose inputs are derived principally from or corroborated by observable market data for substantially the full term of the asset or liability. |
Level 3. |
|
Prices or valuation techniques based on inputs that are both unobservable and significant to the overall fair value measurement. |
Determination of Fair Value
The following is a description of the valuation techniques used to measure fair value and the general classification of these instruments pursuant to the fair value hierarchy.
Investments in Private Equity Funds
The Company accounts for PE Investments at fair value which is determined based on a valuation model using assumptions for the timing and amount of current and expected future cash flow for income and realization events for the underlying assets in the funds. This fair value measurement is generally based on unobservable inputs and, as such, is classified as Level 3 of the fair value hierarchy. The Company is not using the NAV (practical expedient) of the underlying funds for purposes of determining fair value.
Real Estate Securities
CRE securities are generally valued using a third-party pricing service or broker quotations. These quotations are not adjusted and are based on observable inputs that can be validated, and as such, are classified as Level 2 of the fair value hierarchy. Certain CRE securities may be valued based on a single broker quote or an internal price which may have less observable pricing, and as such, would be classified as Level 3 of the fair value hierarchy. Management determines the prices are representative of fair value through a review of available data, including observable inputs, recent transactions as well as its knowledge of and experience in the market.
32
Table of Contents
NORTHSTAR REAL ESTATE INCOME TRUST, INC. AND SUBSIDIARIES
NOTES TO CONSOLIDATED FINANCIAL STATEMENTS (Continued)
(Unaudited)
11. Fair Value (Continued)
Fair Value Hierarchy
Financial assets recorded at fair value on a recurring basis are classified in their entirety based on the lowest level of input that is significant to the fair value measurement. The following table presents financial assets that were accounted for at fair value on a recurring basis as of June 30, 2013 and December 31, 2012 by level within the fair value hierarchy (dollars in thousands):
| | | | | | | | | | | | | | | | | | | | | | | | | |
| | June 30, 2013 | | December 31, 2012 | |
|---|
| | Level 1 | | Level 2 | | Level 3 | | Total | | Level 1 | | Level 2 | | Level 3 | | Total | |
|---|
Asset type: | | | | | | | | | | | | | | | | | | | | | | | | | |
Investments in private equity funds | | $ | 7,500 | (1) | $ | — | | $ | 111,093 | | $ | 118,593 | | $ | — | | $ | — | | $ | — | | $ | — | |
Real estate securities, available for sale | | | — | | | 55,289 | | | — | | | 55,289 | | | — | | | 29,582 | | | — | | | 29,582 | |
- (1)
- Represents the Company's deposit related to PE Investment II (refer to Note 4).
The following table presents additional information about financial assets which are measured at fair value on a recurring basis as of June 30, 2013 for which the Company has utilized Level 3 inputs to determine fair value (dollars in thousands):
| | | | |
| | Investments in
Private Equity Funds | |
|---|
Beginning balance | | $ | — | |
Purchases/contributions | | | 125,534 | |
Distributions | | | (23,664 | ) |
Equity in earnings | | | 9,223 | |
Unrealized gains (losses) | | | — | |
| | | | |
Ending balance | | $ | 111,093 | |
| | | | |
As of June 30, 2013 and December 31, 2012, the Company had no financial assets or liabilities that were accounted for at fair value on a non-recurring basis.
For the three and six months ended June 30, 2013, the Company did not recognize any unrealized gains (losses) for financial assets for which the fair value option was elected. For the three and six months ended June 30, 2012, the Company recognized unrealized gains (losses) of ($3.0) million and ($2.5) million, respectively, for financial assets for which the fair value option was elected. These amounts are recorded as unrealized gain (loss) on investments and other in the consolidated statements of operations.
Fair Value Option
The Company has historically elected not to apply the fair value option for the financial assets and liabilities existing at the time of adoption or at the time the Company recognizes the eligible item for the purpose of consistent accounting application. The Company may elect the fair value option for
33
Table of Contents
NORTHSTAR REAL ESTATE INCOME TRUST, INC. AND SUBSIDIARIES
NOTES TO CONSOLIDATED FINANCIAL STATEMENTS (Continued)
(Unaudited)
11. Fair Value (Continued)
certain of its financial assets or liabilities due to the nature of the instrument. In the case of PE Investments, the Company elected the fair value option because management believes it is a more useful presentation for such investments, as the Company determined recording equity in earnings (losses) from PE Investments based on the change in fair value of projected future cash flow from one period to another better represents the underlying economics of PE Investments.
Fair Value of Financial Instruments
In addition to the above disclosures regarding financial assets or liabilities which are recorded at fair value, U.S. GAAP requires disclosure of fair value about all financial instruments. The following disclosure of estimated fair value of financial instruments was determined by the Company, using available market information and appropriate valuation methodologies. Considerable judgment is necessary to interpret market data and develop estimated fair value. Accordingly, the estimates presented herein are not necessarily indicative of the amounts the Company could realize on disposition of the financial instruments. The use of different market assumptions and/or estimation methodologies may have a material effect on estimated fair value.
The following table presents the principal amount, carrying value and fair value of certain financial assets and liabilities as of June 30, 2013 and December 31, 2012 (dollars in thousands):
| | | | | | | | | | | | | | | | | | | |
| | June 30, 2013 | | December 31, 2012 | |
|---|
| | Principal
Amount | | Carrying
Value | | Fair
Value | | Principal
Amount | | Carrying
Value | | Fair
Value | |
|---|
Financial assets:(1) | | | | | | | | | | | | | | | | | | | |
Real estate debt investments, net | | $ | 924,089 | (2) | $ | 925,896 | | $ | 924,089 | | $ | 513,833 | | $ | 514,058 | | $ | 513,833 | |
Real estate securities, available for sale(3) | | | 104,542 | | | 55,289 | | | 55,289 | | | 30,575 | | | 29,582 | | | 29,582 | |
Financial liabilities:(1) | | | | | | | | | | | | | | | | | | | |
Securitization bonds payable | | $ | 124,659 | | $ | 124,610 | | $ | 124,850 | | $ | 124,659 | | $ | 124,491 | | $ | 124,862 | |
Credit facilities | | | 225,871 | | | 225,871 | | | 225,871 | | | 126,321 | | | 126,321 | | | 126,321 | |
- (1)
- The fair value of other financial instruments not included in this table is estimated to approximate their carrying amounts.
- (2)
- Excludes future funding commitments of $21.8 million.
- (3)
- Refer to the "Determination of Fair Value" above for a discussion of methodologies used to determine fair value.
Disclosure about fair value of financial instruments is based on pertinent information available to management as of the reporting date. Although management is not aware of any factors that would significantly affect fair value, such amounts have not been comprehensively revalued for purposes of these consolidated financial statements since that date and current estimates of fair value may differ significantly from the amounts presented herein.
34
Table of Contents
NORTHSTAR REAL ESTATE INCOME TRUST, INC. AND SUBSIDIARIES
NOTES TO CONSOLIDATED FINANCIAL STATEMENTS (Continued)
(Unaudited)
11. Fair Value (Continued)
Real Estate Debt Investments
For CRE debt investments, fair value was approximated by comparing the current yield to the estimated yield for newly originated loans with similar credit risk or the market yield at which a third party might expect to purchase such investment but not to exceed principal amount. Prices were calculated assuming fully-extended maturities regardless of structural or economic tests required to achieve such extended maturities. These fair value measurements of CRE debt are generally based on unobservable inputs and, as such, are classified as Level 3 of the fair value hierarchy.
Securitization Bonds Payable
Securitization bonds payable are valued using quotations from nationally recognized financial institutions that generally acted as underwriter for the transactions. These quotations are not adjusted and are generally based on observable inputs that can be validated, and as such, are classified as Level 2 of the fair value hierarchy.
Credit Facilities
The Company has amounts outstanding under six credit facilities all of which bear floating rates of interest. As of the reporting date, the Company believes the carrying value approximates fair value. These fair value measurements are based on observable inputs and, as such, are classified as Level 2 of the fair value hierarchy.
12. Segment Reporting
The Company conducts its business through the following segments:
- •
- The CRE debt business is focused on originating, acquiring and asset managing CRE debt investments including first mortgage loans, subordinate mortgage and mezzanine loans and participations in such loans and preferred equity interests.
- •
- The CRE equity business includes other select equity investments, including indirect investments in real estate through joint ventures owning limited partnership interests in real estate private equity funds managed by institutional-quality sponsors, diversified by property type and geography. Since the underlying collateral in the funds is primarily real estate, the Company categorizes PE Investments as equity investments.
- •
- The CRE securities business is focused on investing in and asset managing CRE securities primarily consisting of CMBS and may include unsecured REIT debt, CDO notes and other securities.
The Company primarily generates revenue from net interest income on the CRE debt and securities portfolios and from equity in earnings of unconsolidated ventures, including from PE Investments. The Company's income is primarily derived through the difference between revenue and the cost at which the Company is able to finance its assets. The Company may also invest in assets that generate attractive returns without any leverage.
35
Table of Contents
NORTHSTAR REAL ESTATE INCOME TRUST, INC. AND SUBSIDIARIES
NOTES TO CONSOLIDATED FINANCIAL STATEMENTS (Continued)
(Unaudited)
12. Segment Reporting (Continued)
The following tables present segment reporting for the three and six months ended June 30, 2013 and 2012 (dollars in thousands):
| | | | | | | | | | | | | | | | |
Three Months Ended June 30, 2013 | | Real Estate
Debt | | Equity
Interests | | Real Estate
Securities | | Corporate(1) | | Total | |
|---|
Net interest income | | | | | | | | | | | | | | | | |
Interest income | | $ | 14,737 | | $ | — | | $ | 1,454 | | $ | — | | $ | 16,191 | |
Interest expense | | | 3,222 | | | — | | | 41 | | | — | | | 3,263 | |
| | | | | | | | | | | | |
Net interest income | | | 11,515 | | | — | | | 1,413 | | | — | | | 12,928 | |
Expenses | | | 81 | | | 691 | | | 7 | | | 5,019 | | | 5,798 | |
| | | | | | | | | | | | |
Income (loss) from operations | | | 11,434 | | | (691 | ) | | 1,406 | | | (5,019 | ) | | 7,130 | |
Equity in earnings (losses) of unconsolidated ventures | | | (181 | ) | | 6,008 | | | — | | | — | | | 5,827 | |
| | | | | | | | | | | | |
Net income (loss) | | $ | 11,253 | | $ | 5,317 | | $ | 1,406 | | $ | (5,019 | ) | $ | 12,957 | |
| | | | | | | | | | | | |
| | | | | | | | | | | | | |
Three Months Ended June 30, 2012 | | Real Estate
Debt | | Real Estate
Securities | | Corporate(1) | | Total | |
|---|
Net interest income | | | | | | | | | | | | | |
Interest income | | $ | 4,293 | | $ | 415 | | $ | — | | $ | 4,708 | |
Interest expense | | | 150 | | | 213 | | | — | | | 363 | |
| | | | | | | | | | |
Net interest income | | | 4,143 | | | 202 | | | — | | | 4,345 | |
Expenses | | | 14 | | | — | | | 1,392 | | | 1,406 | |
| | | | | | | | | | |
Income (loss) from operations | | | 4,129 | | | 202 | | | (1,392 | ) | | 2,939 | |
Realized gain (loss) on investments and other | | | — | | | 3,028 | | | — | | | 3,028 | |
Unrealized gain (loss) on investments and other | | | — | | | (2,959 | ) | | — | | | (2,959 | ) |
| | | | | | | | | | |
Net income (loss) | | $ | 4,129 | | $ | 271 | | $ | (1,392 | ) | $ | 3,008 | |
| | | | | | | | | | |
| | | | | | | | | | | | | | | | |
Six Months Ended June 30, 2013 | | Real Estate
Debt | | Equity
Interests | | Real Estate
Securities | | Corporate(1) | | Total | |
|---|
Net interest income | | | | | | | | | | | | | | | | |
Interest income | | $ | 26,462 | | $ | — | | $ | 2,396 | | $ | — | | $ | 28,858 | |
Interest expense | | | 5,712 | | | — | | | 89 | | | — | | | 5,801 | |
| | | | | | | | | | | | |
Net interest income | | | 20,750 | | | — | | | 2,307 | | | — | | | 23,057 | |
Expenses | | | 150 | | | 2,279 | | | 14 | | | 8,777 | | | 11,220 | |
| | | | | | | | | | | | |
Income (loss) from operations | | | 20,600 | | | (2,279 | ) | | 2,293 | | | (8,777 | ) | | 11,837 | |
Equity in earnings (losses) of unconsolidated ventures | | | (181 | ) | | 9,223 | | | — | | | — | | | 9,042 | |
| | | | | | | | | | | | |
Net income (loss) | | $ | 20,419 | | $ | 6,944 | | $ | 2,293 | | $ | (8,777 | ) | $ | 20,879 | |
| | | | | | | | | | | | |
36
Table of Contents
NORTHSTAR REAL ESTATE INCOME TRUST, INC. AND SUBSIDIARIES
NOTES TO CONSOLIDATED FINANCIAL STATEMENTS (Continued)
(Unaudited)
12. Segment Reporting (Continued)
| | | | | | | | | | | | | |
Six Months Ended June 30, 2012 | | Real Estate
Debt | | Real Estate
Securities | | Corporate(1) | | Total | |
|---|
Net interest income | | | | | | | | | | | | | |
Interest income | | $ | 6,390 | | $ | 882 | | $ | — | | $ | 7,272 | |
Interest expense | | | 175 | | | 439 | | | — | | | 614 | |
| | | | | | | | | | |
Net interest income | | | 6,215 | | | 443 | | | — | | | 6,658 | |
Expenses | | | 23 | | | — | | | 2,189 | | | 2,212 | |
| | | | | | | | | | |
Income (loss) from operations | | | 6,192 | | | 443 | | | (2,189 | ) | | 4,446 | |
Realized gain (loss) on investments and other | | | — | | | 3,028 | | | — | | | 3,028 | |
Unrealized gains (losses) on investments and other | | | — | | | (2,457 | ) | | — | | | (2,457 | ) |
| | | | | | | | | | |
Net income (loss) | | $ | 6,192 | | $ | 1,014 | | $ | (2,189 | ) | $ | 5,017 | |
| | | | | | | | | | |
- (1)
- Includes unallocated advisory fees—related party and general and administrative expenses.
The following table presents total assets by segment as of June 30, 2013 and December 31, 2012 (dollars in thousands):
| | | | | | | | | | | | | | | | |
Total Assets | | Real Estate
Debt | | Equity
Interests | | Real Estate
Securities | | Corporate(1) | | Total | |
|---|
June 30, 2013 | | $ | 1,154,491 | | $ | 119,511 | | $ | 55,676 | | $ | 194,244 | | $ | 1,523,922 | |
| | | | | | | | | | | | |
December 31, 2012 | | $ | 617,705 | | $ | — | | $ | 29,712 | | $ | 212,521 | | $ | 859,938 | |
| | | | | | | | | | | | |
- (1)
- Includes cash, unallocated receivables and deferred costs and other assets, net.
13. Subsequent Events
Status of the Offering
On July 1, 2013, the Company completed its Total Primary Offering. For the period from inception through the completion of the Total Primary Offering, the Company raised gross proceeds from the Total Offering of $1,128.4 million.
Distribution Reinvestment Plan
On July 1, 2013, the Company issued 0.3 million shares representing all remaining shares available pursuant to the DRP. The Company intends to continue to offer shares pursuant to the DRP beyond the Total Primary Offering. As a result, the Company filed a registration statement on Form S-3 with the SEC to issue an additional 15.0 million shares pursuant to the DRP, which was declared effective on July 3, 2013.
Distributions
On August 6, 2013, the board of directors of the Company approved a daily cash distribution of $0.002191781 per share of common stock, which is equivalent to an annual distribution rate of 8.0%,
37
Table of Contents
NORTHSTAR REAL ESTATE INCOME TRUST, INC. AND SUBSIDIARIES
NOTES TO CONSOLIDATED FINANCIAL STATEMENTS (Continued)
(Unaudited)
13. Subsequent Events (Continued)
for each of the three months ended December 31, 2013. The distribution will be paid in cumulative amounts to the stockholders of record entitled to receive such distribution on November 1, 2013, December 2, 2013 and January 2, 2014.
Share Repurchases
In July 2013, the Company repurchased 0.1 million shares for a total of $1.2 million or a weighted average price of $9.80 per share under the Share Repurchase Program.
Sponsor Purchase of Common Stock
In August 2013, the Company determined that the Sponsor was not required to purchase shares pursuant to the Distribution Support Agreement for the three months ended June 30, 2013. The Distribution Support Agreement expired on July 19, 2013.
PE Investment II
On July 3, 2013, PE Investment II completed the initial closing and the Company funded $76.5 million (including its proportionate interest of the $50.0 million deposit made in June 2013), excluding adjustments for distributions and contributions since September 30, 2012. The Company is entitled to its proportionate share of distributions and obligated to make its proportionate share of contributions from September 30, 2012 until the closing of each fund interest.
New Investments
Subsequent to quarter end, the Company originated one first mortgage loan with a principal amount of $27.8 million and one mezzanine loan with a principal amount of $66.5 million.
Advisory Agreement
Effective July 19, 2013, the advisory agreement among the Company, the Operating Partnership, the Advisor and the Sponsor was renewed through July 18, 2014 upon terms identical to those in effect through July 18, 2013. Pursuant to the agreement, the Advisor will continue to perform day-to-day operational and administrative services for the Company, including services relating to asset management, acquisitions and investor relations.
38
Table of Contents
Item 2. Management's Discussion and Analysis of Financial Condition and Results of Operations
The following discussion should be read in conjunction with the unaudited consolidated financial statements and notes thereto included in Item 1. "Financial Statements" of this report. References to "we," "us," or "our" refer to NorthStar Real Estate Income Trust, Inc. and its subsidiaries unless the context specifically requires otherwise.
Introduction
We are an externally managed commercial real estate, or CRE, finance and investment company that was formed to originate, acquire and asset manage a diversified portfolio of CRE debt, securities and other select equity investments. We commenced our operations in October 2010. We conduct substantially all of our operations and make investments through NorthStar Real Estate Income Trust Operating Partnership, LP, of which we are the sole general partner. NS Real Estate Income Trust Advisor, LLC, or our Advisor, is our external manager and is an affiliate of NorthStar Realty Finance Corp., or our Sponsor. Our Sponsor is a diversified CRE investment and asset management company publicly traded on the New York Stock Exchange and was formed in October 2003. Our primary business lines are as follows:
- •
- Commercial Real Estate Debt—Our CRE debt business is focused on originating, acquiring and asset managing CRE debt investments including first mortgage loans, subordinate mortgage and mezzanine loans and participations in such loans and preferred equity interests.
- •
- Other Select Commercial Real Estate Equity Investments—Our CRE equity business includes our indirect investments in real estate through joint ventures owning limited partnership interests in real estate private equity funds managed by institutional-quality sponsors, or PE Investments, diversified by property type and geography. Since the underlying collateral in the funds is primarily real estate, we categorize PE Investments as equity investments.
- •
- Commercial Real Estate Securities—Our CRE securities business is focused on investing in and asset managing CRE securities primarily consisting of commercial mortgage-backed securities, or CMBS, and may include unsecured real estate investment trust, or REIT debt, collateralized debt obligation, or CDO notes and other securities.
Our ability to invest across the CRE market creates complementary and overlapping sources of investment opportunities based upon common reliance on real estate fundamentals and application of similar portfolio management skills to maximize value and to protect capital.
We initially registered to offer up to 100,000,000 shares pursuant to the primary offering, or our Primary Offering, and up to 10,526,315 shares pursuant to the distribution reinvestment plan, or our DRP, and are herein collectively referred to as our Offering. Our Offering, including proceeds from our merger with NorthStar Income Opportunity REIT I, Inc. completed on October 18, 2010 as a reverse merger and recapitalization, or the Merger Transaction, is herein collectively referred to as the Total Offering. In April 2013, our board of directors authorized the reallocation of shares available under our DRP to our Primary Offering. Our Primary Offering (including 7.6 million shares reallocated from our DRP, or our Total Primary Offering) was completed on July 1, 2013 and all of the shares initially registered for our Offering were issued. We plan to continue to offer shares under our DRP beyond our Total Primary Offering. As a result, we filed a registration statement on Form S-3 with the Securities and Exchange Commission, or the SEC, to issue an additional 15.0 million shares pursuant to our DRP, which was declared effective on July 3, 2013.
From inception through the completion of our Total Primary Offering, the Company raised Total Primary Offering gross proceeds of $1,072.9 million. The Total Offering raised gross proceeds of $1,128.4 million through such date.
39
Table of Contents
We conduct our operations so as to continue to qualify as a REIT for federal income tax purposes.
Our Investments
The following table presents our investments as of June 30, 2013, adjusted for our acquisition of PE Investment II, which completed its initial closing in July 2013 (dollars in thousands):
| | | | | | | | | | | | | |
Asset Type: | | Number | | Principal
Amount | | Carrying
Value | | % of
Principal Amount | |
|---|
CRE Debt | | | | | | | | | | | | | |
First mortgage loans | | | 26 | | $ | 856,160 | | $ | 836,146 | | | 65.9 | % |
Mezzanine loans | | | 2 | | | 56,500 | | | 56,500 | | | 4.3 | % |
Subordinate mortgage interests | | | 1 | | | 33,250 | | | 33,250 | | | 2.6 | % |
| | | | | | | | | | |
Total CRE Debt | | | 29 | | | 945,910 | | | 925,896 | | | 72.8 | % |
Equity Interests | | | | | | | | | | | | | |
PE Investment I | | | 1 | | | 111,093 | | | 111,093 | | | 8.5 | % |
PE Investment II(1) | | | 1 | | | 138,750 | | | 138,750 | | | 10.7 | % |
| | | | | | | | | | |
Total Equity Interests | | | 2 | | | 249,843 | | | 249,843 | | | 19.2 | % |
CRE Securities | | | | | | | | | | | | | |
CMBS | | | 8 | | | 104,542 | | | 55,289 | | | 8.0 | % |
| | | | | | | | | | |
Total CRE Securities | | | 8 | | | 104,542 | | | 55,289 | | | 8.0 | % |
| | | | | | | | | | |
Total/Weighted average | | | 39 | | $ | 1,300,295 | | $ | 1,231,028 | | | 100.0 | % |
| | | | | | | | | | |
- (1)
- Includes the initial and deferred amount of PE Investment II.
For financial information regarding our reportable segments, refer to "Note 12. Segment Reporting," in our accompanying Consolidated Financial Statements included in Item 1. "Financial Statements."
Real Estate Debt
As of June 30, 2013, $945.9 million, or 72.8%, of our assets were invested in CRE debt. As of June 30, 2013, our $945.9 million in CRE debt investments consisted of 29 loans. Our CRE debt investments had an average investment size of $32.6 million. The weighted average extended maturity of our CRE debt portfolio is 4.4 years.
Our CRE debt business is focused on originating, acquiring and asset managing CRE debt investments including first mortgage loans, subordinate mortgage and mezzanine loans and participations in such loans and preferred equity interests. We emphasize direct origination of our debt investments as this allows us a greater degree of control over how they are underwritten and structured and it provides us the opportunity to syndicate senior or subordinate interests in the loan, if desired. Further, it allows us to maintain a more direct relationship with our borrowers which helps us maintain a robust pipeline and provides an opportunity to earn origination and other fees.
40
Table of Contents
The following table presents our CRE debt investments (dollars in thousands):
| | | | | | | | | | | | | | | | | | | | | | | | | |
| |
| |
| |
| |
| | Weighted Average | |
| |
|---|
| |
| |
| |
| |
| | Floating Rate
as % of
Principal
Amount | |
|---|
Asset Type: | | Number | | Principal
Amount(1) | | Carrying
Value(2) | | Allocation by
Investment
Type(3) | | Fixed
Rate | | Spread
over
LIBOR(4) | | Unleveraged
Current
Yield | |
|---|
First mortgage loans | | | 26 | | $ | 856,160 | | $ | 836,146 | | | 90.51 | % | | 9.31 | % | | 6.66 | % | | 8.24 | % | | 87.2 | % |
Mezzanine loans | | | 2 | | | 56,500 | | | 56,500 | | | 5.97 | % | | 11.50 | % | | 10.00 | % | | 11.90 | % | | 8.0 | % |
Subordinate mortgage interests | | | 1 | | | 33,250 | | | 33,250 | | | 3.52 | % | | 13.11 | % | | 0.00 | % | | 13.24 | % | | 0.0 | % |
| | | | | | | | | | | | | | | | | | |
Total/Weighted average | | | 29 | | $ | 945,910 | | $ | 925,896 | | | 100.00 | % | | 10.56 | % | | 6.68 | % | | 8.64 | % | | 79.2 | % |
| | | | | | | | | | | | | | | | | | |
- (1)
- Includes interest accretion, to the extent applicable, and future funding commitments of $21.8 million.
- (2)
- Certain CRE debt investments serve as collateral for financing transactions including carrying value of $194.5 million for Securitization 2012-1 and $361.0 million for Term Loan Facilities (refer to "Liquidity and Capital Resources"). The remainder is unleveraged.
- (3)
- Based on principal amount.
- (4)
- All floating-rate loans are subject to a fixed minimum LIBOR rate, or LIBOR floor. As of June 30, 2013, the weighted average LIBOR floor was 1.35%.
The following presents our CRE debt portfolio's diversity across property type and geographic location based on principal amount:
| | |
Loan Portfolio by Property Type | | Loan Portfolio by Geographic Location |
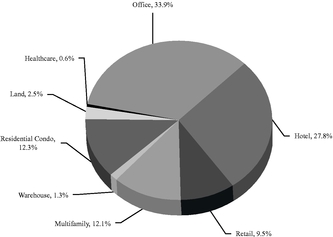
| |
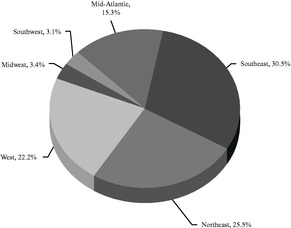
|
PE Investments
Currently, $249.8 million, or 19.2%, of our assets were invested in PE Investments, including PE Investment II, which completed its initial closing on July 3, 2013. We elected the fair value option for PE Investments. As a result, we expect to record equity in earnings that approximates a level yield based on the change in fair value for our share of the projected future cash flow from one period to another.
41
Table of Contents
PE Investment I
In February 2013, we completed the initial closing of our first joint venture owning limited partnership interests in real estate funds managed by top institutional-quality sponsors, or PE Investment I. We, together with our Sponsor, have an ownership interest in PE Investment I of 51.0%, of which we own 29.5% and our Sponsor owns 70.5%.
Since we were contractually entitled to our proportional share of all distributions derived from the fund interests since June 30, 2012 regardless of the date such fund interests were transferred to PE Investment I, at the initial closing, we recorded our proportional share of all distributions received since June 30, 2012.
The following tables present a summary of PE Investment I (dollars in millions):
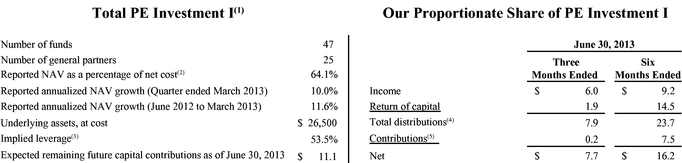
- (1)
- Based on financial data reported by the underlying funds as of March 31, 2013, except as otherwise noted.
- (2)
- Net cost represents total funded capital less distributions received, excluding any distributions in excess of contributions for funds representing 3.0% of reported NAV.
- (3)
- Represents implied leverage for funds with investment-level financing, calculated as debt divided by assets at fair value.
- (4)
- Net of a $0.7 million reserve for taxes.
- (5)
- Due to the timing of the closing of fund interests, contributions are recorded based on the period of settlement and may not represent the period such contributions were made. Amounts presented are based on the applicable period, not the period of settlement.
42
Table of Contents
The following presents the underlying fund interests in PE Investment I by investment type and geographic location based on NAV as of March 31, 2013:
| | |
PE Investment I by Underlying Investment
Type(1) | | PE Investment I by Underlying Geographic
Location(1) |
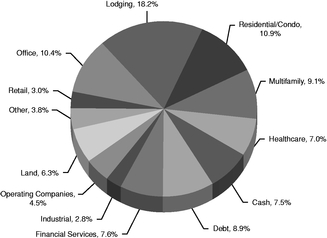 |
|
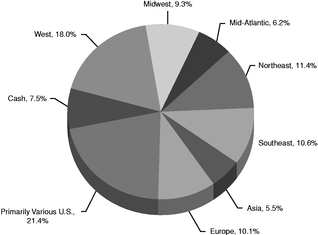 |
- (1)
- Based on individual fund financial statements.
PE Investment II
On July 3, 2013, we completed the initial closing of our second joint venture owning limited partnership interests in real estate private equity funds, or PE Investment II. We, together with our Sponsor and funds managed by Goldman Sachs Asset Management, or the Vintage Funds, entered into an agreement with Common Pension Fund E, a common trust fund created under New Jersey law to acquire limited partnership interests in up to 25 real estate private equity funds with an aggregate reported NAV of approximately $925.4 million as of September 30, 2012. We, our Sponsor and the Vintage Funds each have an ownership interest in PE Investment II of 15.0%, 70.0% and 15.0%, respectively. The fund interests are expected to be acquired by PE Investment II in the remainder of 2013. The closing of the funds is subject to customary closing conditions, including third-party consents.
PE Investment II will pay $509.9 million to the seller for all of the fund interests, or 55.0% of the September 30, 2012 NAV, or the Initial Amount, and will pay the remaining $415.5 million, or 45.0% of the September 30, 2012 NAV, or the Deferred Amount, by the fourth year after the first day of the fiscal quarter following the closing date. We funded all of our proportionate share of the Initial Amount at the initial closing on July 3, 2013. Our share of the Initial Amount and the Deferred Amount represents $76.5 million and $62.3 million, respectively.
PE Investment II is entitled to receive all cash distributions from September 30, 2012 through the closing of each fund interest and is obligated to fund all capital contributions from September 30, 2012.
43
Table of Contents
The following table presents the expected fund interests in PE Investment II (dollars in millions):
Total PE Investment II(1)
| | | | |
Number of funds | | | 25 | |
Number of general partners | | | 16 | |
Reported NAV as a percentage of net cost(2) | | | 72.0 | % |
Reported annualized NAV growth (Quarter ended December 31, 2012) | | | 14.0 | % |
Underlying assets, at cost | | $ | 28,500 | |
Implied leverage(3) | | | 39.7 | % |
Expected remaining future capital contributions as of June 30, 2013 | | $ | 8.8 | |
- (1)
- Based on financial data reported by the underlying funds as of December 31, 2012, except as otherwise noted.
- (2)
- Net cost represents total funded capital less distributions received.
- (3)
- Represents implied leverage for funds with investment-level financing, calculated as debt divided by assets at fair value.
The following presents the underlying fund interests in PE Investment II by investment type and geographic location based on NAV as of December 31, 2012:
- (1)
- Based on individual fund financial statements.
Real Estate Securities
As of June 30, 2013, $104.5 million, or 8.0%, of our assets were invested in CRE securities. As of June 30, 2013, our $104.5 million CRE securities consisted of eight CMBS investments and our average investment size was $13.1 million.
Our CRE securities business is focused on investing in and asset managing a wide range of CRE securities, including CMBS, unsecured REIT debt, CDO notes backed primarily by CRE securities and debt. Substantially all of our CRE securities have explicit credit ratings assigned by at least one of the major rating agencies (Moody's Investors Services, Standard & Poor's, Fitch Ratings, Morningstar, DBRS and/or Kroll).
44
Table of Contents
Sources of Operating Revenues and Cash Flows
We generate revenue from net interest income on our CRE debt and securities investments. Additionally, we record equity in earnings from unconsolidated ventures, including from PE Investments. Our income is primarily derived through the difference between revenue and the cost at which we are able to finance our investments. We may also acquire investments which generate attractive returns without any leverage.
Profitability and Performance Metrics
We calculate Funds from Operations, or FFO, and Modified Funds from Operations, or MFFO (see "Non-GAAP Financial Measures—Funds from Operations and Modified Funds from Operations" for a description of these metrics), to evaluate the profitability and performance of our business.
Outlook and Recent Trends
Liquidity and capital started to become more available in the commercial real estate markets to stronger sponsors in 2012 and 2013 and Wall Street and commercial banks began to more actively provide credit to real estate borrowers. A proxy of the easing of credit and restarting of the capital markets for CRE debt is the approximately $45.0 billion and $40.0 billion in non-agency CMBS issuance that was completed in 2012 and the first half of 2013, respectively. Credit contracted in mid-2011 as the European debt woes began to unfold resulting in heightened market volatility and global financial markets continued to be strained in 2012. To stimulate growth, several of the world's largest central banks acted in a coordinated effort through massive injections of stimulus in the financial markets in late 2012, which had the effect of keeping interest rates low. More recently, the Federal Reserve signaled it may begin to taper its stimulus efforts in late 2013 which has resulted in, and may continue in the future result in, an increase in interest rates on U.S. government bonds and interest rates more generally.
We expect the commercial real estate markets will continue to improve in 2013, but headwinds still remain due to the uncertainty of the political climate, including budget deficits, tax policy, gridlock, Federal Reserve policy on stimulus and other matters and their impact to the U.S. economy. We would expect that this dynamic along with global market instability and the risk of maturing CRE debt that may have difficulties being refinanced to continue to cause periodic volatility in the market for some time. It is currently estimated that approximately $1.0 trillion of CRE debt will mature in the next three years and $1.9 trillion will mature through 2017. While there is an increased supply of lenders to provide such financing, we still anticipate that certain of these loans will not be able to be refinanced, potentially inhibiting growth and contracting credit.
The capital markets began opening up in 2012 and we began to access the capital markets as evidenced by our securitization financing transaction in November 2012, or Securitization 2012-1. Refer to "Financing Strategy" for additional details. The stimulus in the United States helped to increase demand for new CMBS, even though current new issue is still well below historic levels. Industry experts are predicting approximately $70.0 billion of non-agency CMBS issuance in 2013 (although recent volatility in the credit markets may impact this).
Virtually all commercial real estate property types were adversely impacted by the credit crisis, while others such as land, condominium and other commercial property types were more severely impacted. Investor interest is returning to commercial real estate especially in urban areas having high concentrations of institutional quality real estate, and especially in certain asset types such as apartments. The degree to which commercial real estate values improve in 2013 and going forward, companies such as ours, with no pre-recession asset issues, should have a competitive advantage in the market because we will not be otherwise distracted dealing with legacy portfolio issues and our originations and acquisitions of CRE debt, securities and other select equity investments will reflect
45
Table of Contents
valuations that have already adjusted to post-recession pricing. Rising interest rates should be a leading indicator that the economy is improving and in turn support continued improvement in commercial real estate fundamentals.
Due to these market dynamics and our Advisor's expertise and industry relationships, we continue to see a robust pipeline of investment opportunities that have credit qualities and yield profiles that are consistent with our underwriting standards and that we believe offer the opportunity to meet or exceed our targeted returns. While we remain optimistic that we will continue to be able to generate and capitalize on an attractive pipeline, there is no assurance that will be the case.
Our CRE debt business generally lends and borrows based on a spread to LIBOR. As a result, increasing LIBOR should increase the net interest earned from our CRE debt investments. However, all our CRE debt originations have LIBOR floors that are in excess of current LIBOR. We will not benefit from an increase in LIBOR until it is in excess of the LIBOR floors. The degree in which rates will increase is driven in a significant part by the actions of the Federal Reserve.
Our Strategy
Our primary business objectives are to originate and acquire real estate-related investments, with a focus on CRE debt that we expect will generate attractive risk-adjusted returns, stable cash flow for distribution and provide downside protection to our stockholders. Many of our CRE debt investments are considered transitional in nature because the borrower has a business plan to improve the collateral and as a result we generally require the borrower to fund interest or other reserves, whether through proceeds from our loan or otherwise, to support debt service payments and capital expenditures. We will also require the borrower, and possibly a guarantor, to refill these reserves should they become deficient during the applicable period for any reason. We believe that our Advisor has a platform that derives a competitive advantage from the combination of deep industry relationships and market leading CRE credit underwriting and capital markets expertise which enables us to manage credit risk across our business lines as well as to structure and finance our assets efficiently. We believe that our business lines are complementary to each other due to their overlapping sources of investment opportunities, common reliance on CRE fundamentals and ability to apply similar asset management skills to maximize value and to protect capital.
We use the net proceeds from our Total Offering and other financing sources to carry out our primary business objectives of originating and acquiring real estate-related investments.
We began raising capital in late 2010 and completed our Total Primary Offering on July 1, 2013. From inception through the completion of our Total Primary Offering, we raised gross proceeds from the Total Offering of $1,128.4 million. We also entered into four term loan facilities with an aggregate of $490.0 million to finance the origination of CRE first mortgage loans, or our Term Loan Facilities, and two CMBS facilities to make new investments in CMBS, or our CMBS Facilities. In November 2012, we closed Securitization 2012-1 to finance debt investments on a permanent, non-recourse, non-mark-to-market basis. The debt investments had previously been financed on our Term Loan Facilities.
From inception through August 9, 2013, we originated 32 loans with an aggregate principal amount of $1,046.2 million, invested $194.5 million of equity in PE Investments and acquired ten CMBS for $83.8 million, including CMBS acquired from our Merger Transaction. Based on our portfolio as of August 8, 2013, the current yield on invested equity was 13.4%. There is no assurance we will realize the expected returns on invested equity over the term of these investments. Our actual return on invested equity could vary significantly from our expectations.
46
Table of Contents
Financing Strategy
We use investment-level financing as part of our strategy and we seek to match fund our assets and liabilities by having similar maturities and like-kind interest rate benchmarks (fixed or floating) to manage refinancing and interest rate risk. Our Advisor is responsible for managing such refinancing and interest rate risk on our behalf. We pursue a variety of financing arrangements such as securitization financing transactions, credit facilities and other term borrowings.
Although we have a limitation on the maximum leverage for our portfolio, we do not have a targeted debt-to-equity ratio on an asset-by-asset basis, as we believe the appropriate leverage for the particular assets we finance depends on the specific credit characteristics of those assets. We utilize leverage for the sole purpose of financing our investments and diversifying our equity and we do not employ leverage to speculate on changes in interest rates.
In February 2012, we began using credit facilities provided by major financial institutions to partially finance new investments. Our credit facilities currently include four secured Term Loan Facilities that provide for an aggregate of up to $490.0 million to finance first mortgage loans and senior loan participations secured by commercial real estate and two CMBS Facilities to finance the acquisition of CMBS, collectively our Credit Facilities. In November 2012, we closed our first securitization financing transaction, which provides permanent, non-recourse, non-mark-to-market financing for our debt investments that were previously financed on our Term Loan Facilities. As of August 8, 2013, we had $124.7 million issued as part of Securitization 2012-1, $239.4 million outstanding under our Term Loan Facilities and $11.7 million outstanding under our CMBS Facilities. Refer to "Liquidity and Capital Resources" for further disclosure regarding Securitization 2012-1.
Portfolio Management
Credit risk management is the ability of our Advisor to manage our assets in a manner that preserves principal and income and minimizes credit losses that would decrease income. Our Advisor maintains a comprehensive portfolio management process that generally includes day-to-day oversight by its portfolio management team, weekly management meetings and an exhaustive quarterly credit review process. These processes are designed to enable management to evaluate and proactively manage asset-specific credit issues and identify credit trends on a portfolio-wide basis. Nevertheless, we cannot be certain that our Advisor's review will identify all issues within our portfolio due to, among other things, adverse economic conditions or events adversely affecting specific assets; therefore, potential future losses may also stem from investments that are not identified by these credit reviews. During the quarterly credit review, or more frequently as necessary, investments may be put on highly-monitored status and identified for possible loan loss reserves based upon several factors, including missed or late contractual payments, significant declines in collateral performance and other data which may indicate a potential issue in our ability to recover our capital from the investment. Our Advisor utilizes an experienced portfolio management team that monitors those factors on our behalf.
Each of our debt investments, while primarily backed by CRE collateral, is unique and requires customized portfolio management strategies for dealing with potential credit situations. The complexity of each situation depends on many factors, including the number of collateral properties, the type of property, macro and local market conditions impacting supply/demand, cash flow and collateral, and the financial condition of our borrowers and their willingness to support our collateral. Further, many of our debt investments are considered transitional in nature because the borrower has a business plan to re-position, re-develop or otherwise lease-up the property in order to improve the collateral. At the time of origination, the underlying property may not be sufficient to support current debt service payments. As a result, we will generally require the borrower to fund interest or other reserves, whether through proceeds from our loan or otherwise, to support debt service payments and capital expenditures during the period that the borrower is implementing the approved business plan. We will
47
Table of Contents
also require the borrower, and possibly a guarantor, to refill these reserves should they become deficient during the applicable period for any reason.
As of June 30, 2013, all of our CRE debt investments were performing in accordance with the contractual terms of their governing documents. However, there can be no assurance that these loans will continue to perform in accordance with the contractual terms of the governing documents and may, in the future, record loan loss reserves if required for these loans.
Critical Accounting Policies
Principles of Consolidation
Our consolidated financial statements include the accounts of us and our subsidiaries, variable interest entities, or VIEs, where we are the primary beneficiary, if any, and voting interest entities which are generally majority or wholly-owned and controlled by us. All significant intercompany balances are eliminated in consolidation.
Variable Interest Entities
A VIE is an entity that lacks one or more of the characteristics of a voting interest entity. A VIE is defined as an entity in which equity investors do not have the characteristics of a controlling financial interest or do not have sufficient equity at risk for the entity to finance its activities without additional subordinated financial support from other parties. The determination of whether an entity is a VIE includes both a qualitative and quantitative analysis. We base the qualitative analysis on our review of the design of the entity, its organizational structure including decision-making ability and relevant financial agreements and the quantitative analysis on the forecasted cash flow of the entity. We reassess the initial evaluation of an entity as a VIE upon the occurrence of certain reconsideration events.
A VIE must be consolidated only by its primary beneficiary, which is defined as the party who, along with its affiliates and agents has both the: (i) power to direct the activities that most significantly impact the VIE's economic performance; and (ii) obligation to absorb the losses of the VIE or the right to receive the benefits from the VIE, which could be significant to the VIE. We determine whether we are the primary beneficiary of a VIE by considering qualitative and quantitative factors, including, but not limited to: which activities most significantly impact the VIE's economic performance and which party controls such activities; the amount and characteristics of its investment; the obligation or likelihood for us or other interests to provide financial support; consideration of the VIE's purpose and design, including the risks the VIE was designed to create and pass through to its variable interest holders and the similarity with and significance to our business activities and the other interests. We reassess the determination of whether we are the primary beneficiary of a VIE each reporting period. Significant judgments related to these determinations include estimates about the current and future fair value and performance of investments held by these VIEs and general market conditions.
We evaluate our CRE debt and securities, investments in unconsolidated ventures and securitization financing transaction to determine whether they are a VIE. We analyze new investments and financings, as well as reconsideration events for existing investments and financings, which vary depending on type of investment or financing.
Voting Interest Entities
A voting interest entity is an entity in which the total equity investment at risk is sufficient to enable it to finance its activities independently and the equity holders have the power to direct the activities of the entity that most significantly impact its economic performance, the obligation to absorb the losses of the entity and the right to receive the residual returns of the entity. The usual condition for a controlling financial interest in a voting interest entity is ownership of a majority voting interest.
48
Table of Contents
If we have a majority voting interest in a voting interest entity, the entity will generally be consolidated. We do not consolidate a voting interest entity if there are substantive participating and/or kick-out rights by other parties.
We perform on-going reassessments of whether entities previously evaluated under the majority voting interest framework have become VIEs, based on certain events, and therefore subject to the VIE consolidation framework.
Investments in and Advances to Unconsolidated Ventures
We have non-controlling, unconsolidated ownership interests in entities that may be accounted for using the equity method, at fair value or the cost method.
Under the equity method, the investment is adjusted each period for capital contributions and distributions and our share of the entity's net income (loss). Capital contributions, distributions and net income (loss) of such entities are recorded in accordance with the terms of the governing documents. Allocations of net income (loss) may differ from the stated ownership percentage interest in such entities as a result of preferred returns and allocation formulas, if any, as described in such governing documents.
We may account for an investment in an unconsolidated entity at fair value by electing the fair value option. We elected the fair value option for PE Investments. PE Investments are recorded as investments in private equity funds, at fair value on the consolidated balance sheets. We record the change in fair value for our share of the projected future cash flow of PE Investments from one period to another in equity in earnings (losses) from unconsolidated ventures in the consolidated statements of operations. Any change in fair value attributed to market related assumptions are considered unrealized gain (loss).
We may account for investments that do not qualify for equity method accounting or for which the fair value option was not elected using the cost method if we determine the investment in the unconsolidated entity is insignificant. Under the cost method, equity in earnings is recorded as dividends are received to the extent they are not considered a return of capital which is recorded as a reduction of cost of the investment.
Fair Value Option
The fair value option provides an election that allows a company to irrevocably elect fair value for certain financial assets and liabilities on an instrument-by-instrument basis at initial recognition. We will generally not elect the fair value option for our assets and liabilities. However, we may elect to apply the fair value option for certain investments. Any change in fair value for assets and liabilities for which the election is made is recognized in earnings.
Real Estate Debt Investments
CRE debt investments are generally intended to be held to maturity and, accordingly, are carried at cost, net of unamortized loan fees, premium, discount and unfunded commitments. CRE debt investments that are deemed to be impaired are carried at amortized cost less a loan loss reserve, if deemed appropriate, which approximates fair value.
Real Estate Securities
We classify our CRE securities investments as available for sale on the acquisition date, which are carried at fair value. Unrealized gains (losses) are recorded as a component of accumulated other comprehensive income (loss), or OCI, in our consolidated statements of equity. However, we may elect the fair value option for certain of our available for sale securities, and as a result, any unrealized gains
49
Table of Contents
(losses) on such securities are recorded in unrealized gain (loss) on investments and other in our consolidated statements of operations. As of June 30, 2013, we did not have any CRE securities investments for which we elected the fair value option.
Revenue Recognition
Real Estate Debt Investments
Interest income is recognized on an accrual basis and any related premium, discount, origination costs and fees are amortized over the life of the investment using the effective interest method. The amortization is reflected as an adjustment to interest income in our consolidated statements of operations. The amortization of a premium or accretion of a discount is discontinued if such loan is reclassified to held for sale.
Real Estate Securities
Interest income is recognized using the effective interest method with any premium or discount amortized or accreted through earnings based on expected cash flow through the expected maturity date of the security. Changes to expected cash flow may result in a change to the yield which is then applied retrospectively (for high-credit quality securities) or prospectively for all other securities to recognize interest income.
Credit Losses and Impairment on Investments
Real Estate Debt Investments
Loans are considered impaired when based on current information and events it is probable that we will not be able to collect principal and interest amounts due according to the contractual terms. We assess the credit quality of the portfolio and adequacy of loan loss reserves on a quarterly basis, or more frequently as necessary. Significant judgment of management is required in this analysis. We consider the estimated net recoverable value of the loan as well as other factors, including but not limited to the fair value of any collateral, the amount and the status of any senior debt, the quality and financial condition of the borrower and the competitive situation of the area where the underlying collateral is located. Because this determination is based on projections of future economic events, which are inherently subjective, the amount ultimately realized may differ materially from the carrying value as of the balance sheet date. If upon completion of the assessment, the estimated fair value of the underlying collateral is less than the net carrying value of the loan, a loan loss reserve is recorded with a corresponding charge to provision for loan losses. The loan loss reserve for each loan is maintained at a level that is determined to be adequate by management to absorb probable losses. As of June 30, 2013, we did not have any impaired CRE debt investments.
Income recognition is suspended for a loan at the earlier of the date at which payments become 90-days past due or when, in the opinion of management, a full recovery of income and principal becomes doubtful. When the ultimate collectability of the principal of an impaired loan is in doubt, all payments are applied to principal under the cost recovery method. When the ultimate collectability of the principal of an impaired loan is not in doubt, contractual interest is recorded as interest income when received, under the cash basis method until an accrual is resumed when the loan becomes contractually current and performance is demonstrated to be resumed. A loan is written off when it is no longer realizable and/or legally discharged.
Real Estate Securities
CRE securities for which the fair value option is elected are not evaluated for other-than-temporary impairment, or OTTI, as any change in fair value is recorded in our consolidated statements
50
Table of Contents
of operations. Realized losses on such securities are reclassified to realized gain (loss) on investments and other as losses occur.
CRE securities for which the fair value option is not elected are evaluated for OTTI quarterly. When the fair value of CRE securities is less than its amortized cost, the security is considered impaired. If we either intend to sell an impaired security, or it is more-likely-than-not that we will be required to sell an impaired security prior to its anticipated recovery, then we must recognize OTTI through a charge to our consolidated statements of operations equal to the difference between amortized cost and fair value at the measurement date. If we do not intend to sell an impaired security and it is not more-likely-than-not that we would be required to sell an impaired security prior to its recovery, then we must evaluate the security for any impairment. The portion of OTTI related to expected credit losses is recognized in our consolidated statements of operations. The remaining OTTI related to the valuation adjustment is recognized as a component of accumulated OCI in our consolidated statements of equity. The portion of OTTI recognized through earnings is accreted back to the amortized cost basis of the security through interest income, while amounts recognized through OCI are amortized over the life of the security with no impact on earnings.
Other
Refer to our Annual Report on Form 10-K for the fiscal year ended December 31, 2012 for a complete discussion of our critical accounting policies.
Recent Accounting Pronouncements
In February 2013, the Financial Accounting Standards Board issued an accounting update to present the reclassification adjustments to OCI by component on the face of the statement of operations or in the notes to the consolidated financial statements. For other amounts that are not required under U.S. GAAP to be reclassified in their entirety into earnings, an entity is required to cross-reference to other disclosures required under U.S. GAAP to provide additional detail about those amounts. We adopted the provisions of the update and it did not have a material impact on our consolidated financial statements.
51
Table of Contents
Results of Operations
Comparison of the Three Months Ended June 30, 2013 to June 30, 2012 (Dollars in Thousands):
| | | | | | | | | | | | | |
| | Three Months Ended
June 30, | | Increase (decrease) | |
|---|
| | 2013 | | 2012 | | Amount | | % | |
|---|
Net interest income | | | | | | | | | | | | | |
Interest income | | $ | 16,191 | | $ | 4,708 | | $ | 11,483 | | | 243.9 | % |
Interest expense | | | 3,263 | | | 363 | | | 2,900 | | | 798.9 | % |
| | | | | | | | | | |
Net interest income | | | 12,928 | | | 4,345 | | | 8,583 | | | 197.5 | % |
Expenses | | | | | | | | | | | | | |
Advisory fees—related party | | | 2,765 | | | 511 | | | 2,254 | | | 441.1 | % |
Transaction costs | | | 687 | | | — | | | 687 | | | 100.0 | % |
General and administrative expenses | | | 2,346 | | | 895 | | | 1,451 | | | 162.1 | % |
| | | | | | | | | | |
Total expenses | | | 5,798 | | | 1,406 | | | 4,392 | | | 312.4 | % |
Income (loss) from operations | | | 7,130 | | | 2,939 | | | 4,191 | | | 142.6 | % |
Equity in earnings (losses) of unconsolidated ventures | | | 5,827 | | | — | | | 5,827 | | | 100.0 | % |
Realized gain (loss) on investments and other | | | — | | | 3,028 | | | (3,028 | ) | | (100.0 | )% |
Unrealized gain (loss) on investments and other | | | — | | | (2,959 | ) | | 2,959 | | | (100.0 | )% |
| | | | | | | | | | |
Net income (loss) | | $ | 12,957 | | $ | 3,008 | | $ | 9,949 | | | 330.8 | % |
| | | | | | | | | | |
Net Interest Income
Net interest income is generated on our interest-earning assets and related interest-bearing liabilities. The following table presents the average balance of interest-earning assets and related interest-bearing liabilities, associated interest income and expense and corresponding yield earned and incurred for the three months ended June 30, 2013 and 2012. Amounts presented have been impacted by the timing of new investments and repayments during the period (dollars in thousands):
| | | | | | | | | | | | | | | | | | | |
| | Three Months Ended June 30, | |
|---|
| | 2013 | | 2012 | |
|---|
| | Average
Carrying
Value(1) | | Interest
Income/
Expense(2) | | WA Yield /
Financing
Cost(3) | | Average
Carrying
Value(1) | | Interest
Income/
Expense(2) | | WA Yield /
Financing
Cost(3) | |
|---|
Interest-earning assets: | | | | | | | | | | | | | | | | | | | |
CRE debt investments | | $ | 775,137 | | $ | 14,737 | | | 7.60 | % | $ | 202,480 | | $ | 4,293 | | | 8.48 | % |
CRE securities | | | 52,720 | | | 1,454 | | | 11.03 | % | | 17,538 | | | 415 | | | 9.47 | % |
| | | | | | | | | | | | | | |
| | $ | 827,857 | | $ | 16,191 | | | 7.82 | % | $ | 220,018 | | $ | 4,708 | | | 8.56 | % |
| | | | | | | | | | | | | | |
Interest-bearing liabilities: | | | | | | | | | | | | | | | | | | | |
Credit facilities | | $ | 203,121 | | $ | 2,243 | | | 4.42 | % | $ | 37,522 | | $ | 150 | | | 1.60 | % |
Securitization bonds payable | | | 124,659 | | | 1,020 | | | 3.27 | % | | — | | | — | | | — | |
Secured term loans | | | — | | | — | | | — | | | 12,031 | | | 213 | | | 7.08 | % |
| | | | | | | | | | | | | | |
| | $ | 327,780 | | $ | 3,263 | | | 3.98 | % | $ | 49,553 | | $ | 363 | | | 2.93 | % |
| | | | | | | | | | | | | | |
Net interest income | | | | | $ | 12,928 | | | | | | | | $ | 4,345 | | | | |
| | | | | | | | | | | | | | | | | | |
- (1)
- Based on amortized cost for CRE debt and securities investments and principal amount for securitization bonds payable, credit facilities and secured term loans. All amounts are calculated based on quarterly averages.
52
Table of Contents
- (2)
- Includes the effect of amortization of premium or discount and deferred fees.
- (3)
- Calculated based on annualized interest income or expense divided by average carrying value.
Interest income increased $11.5 million, primarily attributable to increased investment activity.
Interest expense increased $2.9 million, primarily attributable to Securitization 2012-1 entered into in 2012 and borrowings on our Credit Facilities.
Expenses
Advisory Fees—Related Party
Advisory fees—related party increased $2.3 million related to increased capital raising and investment activity.
Transaction Costs
Transaction costs represent costs such as professional fees associated with new investments. For the three months ended June 30, 2013, transaction costs of $0.7 million related to PE Investment II.
General and Administrative
General and administrative expenses include auditing and professional fees, director fees, organization and other costs associated with operating our business. The increase was primarily attributable to an increase in capital raising and investment activity.
Equity in Earnings (Losses) of Unconsolidated Ventures
Equity in earnings is related to PE Investment I and our equity investment in the Milford hotel and retail component at the hotel.
Realized Gain (Loss) on Investments and Other
The realized gains recorded in the second quarter 2012 related to the sale of two CRE securities.
Unrealized Gain (Loss) on Investments and Other
Unrealized gain in 2012 related to the change in fair value on two CRE securities for which the fair value option was elected.
53
Table of Contents
Comparison of the Six Months Ended June 30, 2013 to June 30, 2012 (Dollars in Thousands):
| | | | | | | | | | | | | |
| | Six Months Ended
June 30, | | Increase (decrease) | |
|---|
| | 2013 | | 2012 | | Amount | | % | |
|---|
Net interest income | | | | | | | | | | | | | |
Interest income | | $ | 28,858 | | $ | 7,272 | | $ | 21,586 | | | 296.8 | % |
Interest expense | | | 5,801 | | | 614 | | | 5,187 | | | 844.8 | % |
| | | | | | | | | | |
Net interest income | | | 23,057 | | | 6,658 | | | 16,399 | | | 246.3 | % |
Expenses | | | | | | | | | | | | | |
Advisory fees—related party | | | 6,188 | | | 818 | | | 5,370 | | | 656.5 | % |
Transaction costs | | | 994 | | | — | | | 994 | | | 100.0 | % |
General and administrative expenses | | | 4,038 | | | 1,394 | | | 2,644 | | | 189.7 | % |
| | | | | | | | | | |
Total expenses | | | 11,220 | | | 2,212 | | | 9,008 | | | 407.2 | % |
Income (loss) from operations | | | 11,837 | | | 4,446 | | | 7,391 | | | 166.2 | % |
Equity in earnings (losses) of unconsolidated ventures | | | 9,042 | | | — | | | 9,042 | | | 100.0 | % |
Realized gain (loss) on investments and other | | | — | | | 3,028 | | | (3,028 | ) | | (100.0 | )% |
Unrealized gain (loss) on investments and other | | | — | | | (2,457 | ) | | 2,457 | | | (100.0 | )% |
| | | | | | | | | | |
Net income (loss) | | $ | 20,879 | | $ | 5,017 | | $ | 15,862 | | | 316.2 | % |
| | | | | | | | | | |
Net Interest Income
Net interest income is generated on our interest-earning assets and related interest-bearing liabilities. The following table presents the average balance of interest-earning assets and related interest-bearing liabilities, associated interest income and expense and corresponding yield earned and incurred for the six months ended June 30, 2013 and 2012. Amounts presented have been impacted by the timing of new investments and repayments during the period (dollars in thousands):
| | | | | | | | | | | | | | | | | | | |
| | Six Months Ended June 30, | |
|---|
| | 2013 | | 2012 | |
|---|
| | Average
Carrying
Value(1) | | Interest
Income/
Expense(2) | | WA Yield /
Financing
Cost(3) | | Average
Carrying
Value(1) | | Interest
Income/
Expense(2) | | WA Yield /
Financing
Cost(3) | |
|---|
Interest-earning assets: | | | | | | | | | | | | | | | | | | | |
CRE debt investments | | $ | 688,110 | | $ | 26,462 | | | 7.69 | % | $ | 159,299 | | $ | 6,390 | | | 8.02 | % |
CRE securities | | | 44,855 | | | 2,396 | | | 10.68 | % | | 22,424 | | | 882 | | | 7.87 | % |
| | | | | | | | | | | | | | |
| | $ | 732,965 | | $ | 28,858 | | | 7.87 | % | $ | 181,723 | | $ | 7,272 | | | 8.00 | % |
| | | | | | | | | | | | | | |
Interest-bearing liabilities: | | | | | | | | | | | | | | | | | | | |
Credit facilities | | $ | 177,521 | | $ | 3,735 | | | 4.21 | % | $ | 25,015 | | $ | 175 | | | 1.40 | % |
Securitization bonds payable | | | 124,659 | | | 2,066 | | | 3.31 | % | | — | | | — | | | — | |
Secured term loans | | | — | | | — | | | — | | | 16,041 | | | 439 | | | 5.47 | % |
| | | | | | | | | | | | | | |
| | $ | 302,180 | | $ | 5,801 | | | 3.84 | % | $ | 41,056 | | $ | 614 | | | 2.99 | % |
| | | | | | | | | | | | | | |
Net interest income | | | | | $ | 23,057 | | | | | | | | $ | 6,658 | | | | |
| | | | | | | | | | | | | | | | | | |
- (1)
- Based on amortized cost for CRE debt and securities investments and principal amount for securitization bonds payable, credit facilities and secured term loans. All amounts are calculated based on quarterly averages.
- (2)
- Includes the effect of amortization of premium or discount and deferred fees.
- (3)
- Calculated based on annualized interest income or expense divided by average carrying value.
54
Table of Contents
Interest income increased $21.6 million, primarily attributable to increased investment activity.
Interest expense increased $5.2 million, primarily attributable to Securitization 2012-1 entered into in 2012 and borrowings on our Credit Facilities.
Expenses
Advisory Fees—Related Party
Advisory fees—related party increased $5.4 million related to increased capital raising and investment activity.
Transaction Costs
Transaction costs represent costs such as professional fees associated with new investments. For the six months ended June 30, 2013, transaction costs of $1.0 million related to PE Investments.
General and Administrative
General and administrative expenses include auditing and professional fees, director fees, organization and other costs associated with operating our business. The increase was primarily attributable to an increase in capital raising and investment activity.
Equity in Earnings (Losses) of Unconsolidated Ventures
Equity in earnings is related to PE Investment I and our equity investment in the Milford hotel and retail component at the hotel.
Realized Gain (Loss) on Investments and Other
The realized gains recorded in the six months ended June 30, 2012 related to the sale of two CRE securities.
Unrealized Gain (Loss) on Investments and Other
Unrealized gain in 2012 related to the change in fair value on two CRE securities for which the fair value option was elected.
Liquidity and Capital Resources
We require capital to fund our investment activities and operating expenses. Subsequent to the completion of our Primary Offering, our capital sources may include cash flow from operations, net proceeds from asset repayments and sales, securitization financing transactions, borrowings under our Credit Facilities and other term borrowings and proceeds from our DRP.
Securitization Financing Transaction
Securitization 2012-1
In November 2012, we closed our Securitization 2012-1 which was collateralized by $351.4 million of directly originated CRE debt by us and our Sponsor. We, through our subsidiaries, contributed nine CRE debt investments with a $199.2 million aggregate principal amount to our Securitization 2012-1 and our Sponsor, through its subsidiaries, contributed five CRE debt investments with a $152.2 million aggregate principal amount. This transaction involved the issuance and sale of a total of $227.5 million of investment-grade bonds.
55
Table of Contents
Credit Facilities
We have six Credit Facilities including four Term Loan Facilities that provide up to an aggregate of $490.0 million to finance the origination of first mortgage loans and senior loan participations secured by commercial real estate and two CMBS Facilities. The interest rate and advance rate depend on asset type and characteristic. Initial maturity dates of our Term Loan Facilities range from February 2014 to July 2015 and all have extensions available at our option, subject to the satisfaction of certain customary conditions, with maturity dates extending through July 2018. The advance rates and maturity dates of our CMBS Facilities depend upon asset type. Our Credit Facilities contain representations, warranties, covenants, conditions precedent to funding, events of default and indemnities that are customary for agreements of these types. We are currently in compliance with all of our financial covenants under our Credit Facilities.
Offering
From inception through the completion of our Total Primary Offering on July 1, 2013, we raised gross proceeds from the Total Offering of $1,128.4 million. As of August 8, 2013, we held $92.9 million of unrestricted cash.
We are no longer raising capital from our Primary Offering. If we are unable to raise new funds from borrowings, asset sales or our DRP, we will be unable to make new investments once we utilize our currently available capital. However, as investments are repaid or sold, we expect that proceeds will be reinvested. Our inability to invest these proceeds could reduce our net income and limit our ability to make distributions. Further, we have certain fixed direct and indirect operating expenses, including certain expenses as a publicly-registered REIT. We expect our net income from operations will be sufficient to cover such expenses.
Once we have fully invested the proceeds of our Offering, we expect that our financing will not exceed 50.0% of the greater of the cost or fair value of our investments. Our charter limits us from incurring borrowings that would exceed 300% of our net assets. We cannot exceed this limit unless any excess in borrowing over such level is approved by our stockholders. An approximation of this leverage calculation is 75.0% of the cost of our investments. As of June 30, 2013, our leverage as a percentage of our cost of investments was 32.0% and is well below the maximum allowed by our charter.
In addition to making investments in accordance with our investment objectives, we use or have used our capital resources to make certain payments to our Advisor and NorthStar Realty Securities, LLC, or our Dealer Manager. During our organization and offering stage, these payments included payments to our Dealer Manager for selling commissions and dealer manager fees and payments to our Advisor for reimbursement of certain organization and offering costs. Total selling commissions, dealer manager fees and reimbursable organization and offering expenses through the completion of our Total Primary Offering was approximately 10.7% of total proceeds raised from our Total Primary Offering, below the 15.0% maximum allowed. During our acquisition and development stage, we expect to make payments to our Advisor in connection with the selection and origination or acquisition of investments, the management of our assets and costs incurred by our Advisor in providing services to us. We entered into an advisory agreement with our Advisor, which has a one-year term but may be renewed for an unlimited number of successive one-year periods upon the mutual consent of our Advisor and our board of directors including a majority of our independent directors. Effective July 19, 2013, the advisory agreement was renewed for one year to July 18, 2014.
56
Table of Contents
Cash Flows
Six Months Ended June 30, 2013 Compared to June 30, 2012
Net cash provided by operating activities for the six months ended June 30, 2013 was $24.8 million compared to $3.7 million for the six months ended June 30, 2012. The increase in net cash provided by operating activities related to an increase in net interest income generated from our investments due to increased investment activity and distributions from PE Investment I offset by fees paid to our Advisor for the acquisition and management of our investments and other general and administrative expenses related to our business.
Net cash used in investing activities for the six months ended June 30, 2013 was $555.2 million compared to $201.1 million for the six months ended June 30, 2012. Net cash used in investing activities for the six months ended June 30, 2013 related to the origination of nine CRE debt investments, the acquisition of four CRE securities and the investment in PE Investments. Net cash used in investing activities for the six months ended June 30, 2012 related to the origination of nine CRE debt investments offset by the sale of two CRE securities.
Net cash provided by financing activities for the six months ended June 30, 2013 was $540.0 million compared to $191.2 million for the six months ended June 30, 2012. Net cash provided by financing activities in 2013 related to the net proceeds from the issuance of common stock through our Offering, borrowings under our Credit Facilities, offset by the distributions paid on our common stock, share repurchases and the payment of deferred financing costs. Net cash provided by financing activities in 2012 related to the net proceeds from the issuance of common stock through our Offering and borrowings under our Credit Facilities offset by distributions paid on our common stock, repayment of secured term loans, share repurchases and the payment of deferred financing costs.
Off Balance Sheet Arrangements
We have certain arrangements which do not meet the definition of off-balance sheet arrangements, but do have some of the characteristics of off-balance sheet arrangements. We have made investments in unconsolidated ventures. Refer to "Note 4. Investments in and Advances to Unconsolidated Ventures" in Item 1. "Financial Statements" for a discussion of such unconsolidated ventures in our consolidated financial statements. In each case, our exposure to loss is limited to the carrying value of our investment.
Related Party Arrangements
NS Real Estate Income Trust Advisor, LLC
Subject to certain restrictions and limitations, our Advisor is responsible for managing our affairs on a day-to-day basis and for identifying, originating, acquiring and asset managing investments on our behalf. For such services, to the extent permitted by law and regulations, our Advisor receives fees and reimbursements from us. Below is a description and table of the fees and reimbursements incurred to our Advisor.
Organization and Offering Costs
Our Advisor, or its affiliates, is entitled to receive reimbursement for organization and offering costs paid on behalf of us in connection with our Offering. We are obligated to reimburse our Advisor, or its affiliates, as applicable, for organization and offering costs to the extent the aggregate of selling commissions, dealer manager fees and other organization and offering costs do not exceed 15.0% of gross proceeds from our Total Primary Offering. Our Advisor initially expected cumulative organization and offering costs, excluding selling commissions and dealer manager fees, would not exceed $15.0 million, or 1.5% of the proceeds expected to be raised from our Total Primary Offering. Based on
57
Table of Contents
gross proceeds raised of $1,072.9 million from our Total Primary Offering, we currently estimate reimbursable organization and offering costs, excluding selling commissions and dealer manager fees, of $10.5 million, or 1.0%, which is less than the 1.5% threshold. We expect to continue to incur organization and offering costs in connection with our DRP beyond our Total Primary Offering. We shall not reimburse our Advisor for any organization and offering costs that our independent directors determine are not fair and commercially reasonable to us. We record organization and offering costs each period based on an allocation of expected total organization and offering costs to be reimbursed. Organization costs are recorded in general and administrative expenses in the consolidated statements of operations and offering costs are recorded as a reduction to equity. In addition, total underwriting compensation through the completion of our Total Primary Offering, including selling commissions, the dealer manager fee and amounts reimbursed to participating broker dealers and investment advisors, did not exceed the 10% of gross Total Primary Offering proceeds limitation prescribed by the Financial Industry Regulatory Authority.
Operating Costs
Our Advisor, or its affiliates, is entitled to receive reimbursement for direct and indirect operating costs incurred by our Advisor in connection with administrative services provided to us. Indirect operating costs include our allocable share of costs incurred by our Advisor for personnel and other overhead such as rent, technology and utilities. However, there is no reimbursement for personnel costs related to executive officers and other personnel involved in activities for which our Advisor receives an acquisition fee or disposition fee. We reimburse our Advisor quarterly for operating costs (including the asset management fee) based on a calculation for the four preceding fiscal quarters not to exceed the greater of: (i) 2.0% of our average invested assets; or (ii) 25.0% of our net income determined without reduction for any additions to reserves for depreciation, loan losses or other similar non-cash reserves and excluding any gain from the sale of assets for that period, or the 2%/25% Guidelines. Notwithstanding the above, we may reimburse our Advisor for expenses in excess of this limitation if a majority of our independent directors determines that such excess expenses are justified based on unusual and non-recurring factors. We calculate the expense reimbursement quarterly based upon the trailing twelve-month period.
Advisory Fees
Asset Management Fee
Our Advisor, or its affiliates, receives a monthly asset management fee equal to one-twelfth of 1.25% of the sum of the amount funded or allocated for CRE investments including expenses and any financing attributable to such investments, less any principal received on debt and securities investments (or our proportionate share thereof in the case of an investment made through a joint venture).
Acquisition Fee
Our Advisor, or its affiliates, also receives an acquisition fee equal to 1.0% of the amount funded or allocated by us to originate or acquire investments, including acquisition expenses and any financing attributable to such investments. Acquisition fees paid to our Advisor related to the origination or acquisition of CRE debt investments are included in CRE debt investments, net on our consolidated balance sheets and are amortized to interest income over the life of the investment using the effective interest method.
Disposition Fee
For substantial assistance in connection with the sale of investments and based on the services provided, our Advisor, or its affiliates, receives disposition fees equal to 1.0% of the contract sales price
58
Table of Contents
of each CRE investment sold. We do not pay a disposition fee upon the maturity, prepayment, workout modification or extension of a CRE debt investment unless there is a corresponding fee paid by our borrower, in which case the disposition fee is the lesser of: (i) 1.0% of the principal amount of the CRE debt investment prior to such transaction; or (ii) the amount of the fee paid by our borrower in connection with such transaction. If we take ownership of a property as a result of a workout or foreclosure of a CRE debt investment, we will pay a disposition fee upon the sale of such property. Disposition fees incurred to our Advisor on CRE debt investments are included in CRE debt investments, net on our consolidated balance sheets and are amortized to interest income over the life of the investment using the effective interest method.
NorthStar Realty Securities, LLC
Selling Commissions and Dealer Manager Fees
Pursuant to a dealer manager agreement, we paid our Dealer Manager selling commissions of up to 7.0% of gross proceeds from our Total Primary Offering, all of which were reallowed to participating broker-dealers. In addition, we paid our Dealer Manager a dealer manager fee of up to 3.0% of gross proceeds from our Total Primary Offering, a portion of which was reallowed to participating broker-dealers. No selling commissions or dealer manager fees are paid for sales pursuant to our DRP.
Summary of Fees and Reimbursements
The following table presents the fees and reimbursements incurred to our Advisor for the three and six months ended June 30, 2013 and 2012 and the due to related party as of June 30, 2013 and December 31, 2012 (dollars in thousands):
| | | | | | | | | | | | | | | | | | | | | |
| |
| | Three Months
Ended
June 30, | | Six Months
Ended June 30, | | Due to related party as of | |
|---|
| |
| | June 30,
2013 | | December 31,
2012 | |
|---|
Type of Fee or Reimbursement | | Financial Statement Location | | 2013 | | 2012 | | 2013 | | 2012 | |
|---|
Organization and offering costs | | | | | | | | | | | | | | | | | | | | | |
Organization | | General and administrative expenses | | $ | 9 | | $ | 118 | | $ | 62 | | $ | 270 | | $ | — | | $ | 113 | |
Offering | | Cost of capital(1) | | | 1,502 | | | 768 | | | 2,505 | | | 1,755 | | | 1,124 | | | 2,151 | |
Operating costs(2) | | General and administrative expenses | | |
2,218 | | |
763 | | |
3,754 | | |
1,098 | | |
2,148 | | |
523 | |
Advisory fees | | | | | | | | | | | | | | | | | | | | | |
Asset management | | Advisory fees—related party | | | 2,761 | | | 511 | | | 4,903 | | | 818 | | | 981 | | | 559 | |
Acquisition(3) | | Real estate debt investments, net / Advisory fees—related party | | | 2,981 | | | 2,321 | | | 5,323 | | | 2,577 | | | 1,404 | | | — | |
Disposition(3) | | Real estate debt investments, net | | | 15 | | | — | | | 15 | | | — | | | — | | | 24 | |
Selling commissions / Dealer manager fees | | Cost of capital(1) | | |
32,577 | | |
8,678 | | |
49,511 | | |
16,078 | | |
— | | |
— | |
| | | | | | | | | | | | | | | | | | | | |
Total(4) | | | | | | | | | | | | | | | | $ | 5,657 | | $ | 3,370 | |
| | | | | | | | | | | | | | | | | | | | |
- (1)
- Cost of capital is included in net proceeds from issuance of common stock in our consolidated statements of equity.
- (2)
- As of June 30, 2013, our Advisor incurred unreimbursed operating costs on behalf of us and $5.2 million is still allocable.
- (3)
- Acquisition/disposition fees incurred to our Advisor related to CRE debt investments are generally offset by origination/exit fees paid to us by borrowers if such fees are required from the borrower. Acquisition fees related to PE Investments are included in advisory fees—related party in our consolidated statements of operations. Our Advisor may determine to defer fees or seek reimbursement, subject to compliance with applicable policies. From inception through June 30, 2013, our Advisor deferred $0.5 million of acquisition fees and $0.3 million of disposition fees related to CRE securities.
- (4)
- Due to related party includes a $2.0 million receivable and $11.8 million payable as of June 30, 2013 and December 31, 2012, respectively, related to PE Investment I.
59
Table of Contents
Sponsor Purchase of Common Stock
We were party to a Second Amended and Restated Distribution Support Agreement, as amended, or our Distribution Support Agreement, with our Sponsor pursuant to which our Sponsor committed to purchase up to an aggregate of $10.0 million in shares of our common stock at a price of $9.00 per share if cash distributions exceed MFFO to provide additional funds to support distributions to our stockholders. In April 2012, our Distribution Support Agreement was extended until July 2013. For the three and six months ended June 30, 2013, our Sponsor was not required to purchase shares in connection with our Distribution Support Agreement. For the three and six months ended June 30, 2012, our Sponsor purchased 0.1 million and 0.2 million shares, respectively, of our common stock for $0.9 million and $1.9 million, respectively. From inception through the expiration of our Distribution Support Agreement, our Sponsor purchased 0.5 million shares for $4.6 million.
Securitization 2012-1
We entered into an agreement with our Sponsor that provides that both we and our Sponsor receive the economic benefit and bear the economic risk associated with the investments each contributed into Securitization 2012-1. In both cases, the respective retained equity interest of us and our Sponsor is subordinate to interests of the senior bondholders of Securitization 2012-1 and the senior bondholders have no recourse to the general credit of us or our Sponsor. In the event that either we or our Sponsor suffer a complete loss of the retained equity interests in Securitization 2012-1, any additional losses would be borne by the remaining retained equity interests held by us or our Sponsor, as the case may be, prior to the senior bondholders. An affiliate of our Sponsor was named special servicer for Securitization 2012-1.
PE Investments
In connection with PE Investments, we guaranteed all of our funding obligations that may be due and owed under the governing documents indirectly through an indemnification with our Sponsor, which in turn guaranteed the obligations directly to PE Investment JV entities. We and our Sponsor each agreed to indemnify the other proportionately for any losses that may arise in connection with the funding and other obligations as set forth in the governing documents in the case of a joint default by us and our Sponsor. We and our Sponsor further agreed to indemnify each other for all of the losses that may arise as a result of a default that was solely caused by us or our Sponsor, as the case may be.
PE Investment I
In connection with PE Investment I, we assumed the rights to subscribe to 29.5% of PE Investment I from our Sponsor. We and our Sponsor contributed cash of $400.1 million, of which we and our Sponsor contributed $118.0 million and $282.1 million, respectively.
In December 2012, our Sponsor deposited an aggregate of $40.0 million in connection with this transaction, which included $11.8 million on behalf of us, in the proportion of the respective capital contributions. This amount was settled by us in the first quarter 2013.
PE Investment II
In connection with the transaction, PE Investment II deposited an aggregate of $50.0 million, of which we deposited $7.5 million. The deposit is generally non-refundable unless the transaction contemplated by the agreement is not consummated as a result of a material breach by the seller.
60
Table of Contents
Recent Developments
Status of the Offering
On July 1, 2013, we completed our Total Primary Offering. For the period from inception through the completion of our Total Primary Offering, we raised gross proceeds from the Total Offering of $1,128.4 million.
Distribution Reinvestment Plan
On July 1, 2013, we issued 0.3 million shares representing all remaining shares available pursuant to our DRP. We intend to continue to offer shares pursuant to our DRP beyond our Total Primary Offering. As a result, we filed a registration statement on Form S-3 with the SEC to issue an additional 15.0 million shares pursuant to our DRP, which was declared effective on July 3, 2013.
Distributions
On August 6, 2013, our board of directors approved a daily cash distribution of $0.002191781 per share of common stock, which is equivalent to an annual distribution rate of 8.0%, for each of the three months ended December 31, 2013. The distribution will be paid in cumulative amounts to the stockholders of record entitled to receive such distribution on November 1, 2013, December 2, 2013 and January 2, 2014.
Share Repurchases
In July 2013, we repurchased 0.1 million shares for a total of $1.2 million or a weighted average price of $9.80 per share under a share repurchase program that may enable stockholders to sell their shares to us in limited circumstances, or our Share Repurchase Program.
Sponsor Purchase of Common Stock
In August 2013, we determined that our Sponsor was not required to purchase shares pursuant to our Distribution Support Agreement for the three months ended June 30, 2013. Our Distribution Support Agreement expired on July 19, 2013.
PE Investment II
On July 3, 2013, PE Investment II completed the initial closing and we funded $76.5 million (including our proportionate interest of the $50.0 million deposit made in June 2013), excluding adjustments for distributions and contributions since September 30, 2012. We are entitled to our proportionate share of distributions and obligated to make our proportionate share of contributions from September 30, 2012 until the closing of each fund interest.
New Investments
Subsequent to quarter end, we originated one first mortgage loan with a principal amount of $27.8 million and one mezzanine loan with a principal amount of $66.5 million.
We generally target investments that will allow us to pay distributions at an annualized rate of return of 8.0%. However, we are not required to pay distributions to our stockholders at a rate of 8.0% per annum or at all. As of July 19, 2013, the date of our last investment, our portfolio produced a current yield on invested equity of 8.8%, excluding expenses and unrestricted cash.
61
Table of Contents
Advisory Agreement
Effective July 19, 2013, the advisory agreement among us, our Operating Partnership, our Advisor and our Sponsor was renewed through July 18, 2014 upon terms identical to those in effect through July 18, 2013. Pursuant to the agreement, our Advisor will continue to perform day-to-day operational and administrative services for us, including services relating to asset management, acquisitions and investor relations.
Amendment to Bylaws
On August 6, 2013, our board of directors amended and restated our Bylaws to add a provision designating the Circuit Court for Baltimore City, Maryland, as the exclusive forum for derivative lawsuits brought on our behalf, actions for breach of fiduciary duty, actions pursuant to the general corporation law of the State of Maryland and actions asserting claims governed by the internal affairs doctrine, unless we consent to the selection of an alternative forum. The Amended and Restated Bylaws are filed as Exhibit 3.2 to this report and this summary is qualified in its entirety by reference to the Amended and Restated Bylaws.
Inflation
Virtually all of our assets and liabilities are interest rate sensitive in nature. As a result, interest rates and other factors influence our performance significantly more than inflation does. Changes in interest rates may correlate with inflation rates and/or changes in inflation rates.
Refer to Item 3. "Quantitative and Qualitative Disclosures About Market Risk" for additional details.
Non-GAAP Financial Measures
Funds from Operations and Modified Funds from Operations
We believe that FFO and MFFO, both of which are non-GAAP measures, are additional appropriate measures of the operating performance of a REIT and of us in particular. We compute FFO in accordance with the standards established by the National Association of Real Estate Investment Trusts, or NAREIT, as net income (loss) (calculated in accordance with U.S. GAAP), excluding gains (losses) from sales of depreciable property, the cumulative effect of changes in accounting principles, real estate-related depreciation and amortization, impairment on depreciable property owned directly or indirectly and after adjustments for unconsolidated/uncombined partnerships and joint ventures. We believe FFO, a non-GAAP measure, is an appropriate measure of the operating performance of a REIT and of us in particular.
Changes in the accounting and reporting rules under U.S. GAAP that have been put into effect since the establishment of NAREIT's definition of FFO have prompted an increase in the non-cash and non-operating items included in FFO. For instance, the accounting treatment for acquisition fees related to business combinations has changed from being capitalized to being expensed. Additionally, publicly registered, non-traded REITs are typically different from traded REITs because they generally have a limited life followed by a liquidity event or other targeted exit strategy. Non-traded REITs typically have a significant amount of acquisition activity and are substantially more dynamic during their initial years of investment and operation as compared to later years when the proceeds from their initial public offering have been fully invested and when we seek to implement a liquidity event or other exit strategy. However, it is likely that we will make investments past the acquisition and development stage, albeit at a substantially lower pace.
Acquisition fees paid to our Advisor in connection with the origination and acquisition of debt investments are amortized over the life of the investment as an adjustment to interest income under
62
Table of Contents
U.S. GAAP and are therefore, included in the computation of net income (loss) and income (loss) from operations, both of which are performance measures under U.S. GAAP. Such acquisition fees are paid in cash that would otherwise be available to distribute to our stockholders. In the event that proceeds from our Offering are not sufficient to fund the payment or reimbursement of acquisition fees and expenses to our Advisor, such fees would be paid from other sources, including new financing, operating cash flow, net proceeds from the sale of investments or from other cash flow. We believe that acquisition fees incurred by us negatively impact our operating performance during the period in which such investments are originated or acquired by reducing cash flow and therefore the potential distributions to our stockholders. However, almost always, we earn origination fees from our borrowers in an amount equal to the acquisition fees paid to our Advisor, and as a result, the impact of acquisition fees to our operating performance and cash flow would be minimal.
Due to certain of the unique features of publicly-registered, non-traded REITs, the Investment Program Association, or the IPA, an industry trade group, standardized a performance measure known as MFFO and recommends the use of MFFO for such REITs. Management believes MFFO is a useful performance measure to evaluate our business and further believes it is important to disclose MFFO in order to be consistent with the IPA recommendation and other non-traded REITs. MFFO that adjusts for items such as acquisition fees would only be comparable to non-traded REITs that have completed the majority of their acquisition activity and have other similar operating characteristics as us.
The origination and acquisition of debt investments and the corresponding acquisition fees paid to our Advisor (and any offsetting origination fees received from our borrowers) associated with such activity is a key operating feature of our business plan that results in generating income and cash flow in order to make distributions to our stockholders. Therefore, the exclusion for acquisition fees may be of limited value in calculating operating performance because acquisition fees affect our overall long-term operating performance and may be recurring in nature as part of net income (loss) and income (loss) from operations over our life.
MFFO is a metric used by management to evaluate our future operating performance once our organization and offering and acquisition and development stages are complete and is not intended to be used as a liquidity measure. Although management uses the MFFO metric to evaluate future operating performance, this metric excludes certain key operating items and other adjustments that may affect our overall operating performance. MFFO is not equivalent to net income (loss) as determined under U.S. GAAP.
We compute MFFO in accordance with the definition established by the IPA. Our computation of MFFO may not be comparable to other REITs that do not calculate MFFO using the current IPA definition. MFFO excludes from FFO the following items:
- •
- acquisition fees and expenses;
- •
- non-cash amounts related to straight-line rent and the amortization of above or below market and in-place intangible lease assets and liabilities (which are adjusted in order to reflect such payments from an accrual basis of accounting under U.S. GAAP to a cash basis of accounting);
- •
- amortization of a premium and accretion of a discount on debt investments;
- •
- non-recurring impairment of real estate-related investments;
- •
- realized gains (losses) from the early extinguishment of debt;
- •
- realized gains (losses) on the extinguishment or sales of hedges, foreign exchange, securities and other derivative holdings except where the trading of such instruments is a fundamental attribute of our business;
63
Table of Contents
- •
- unrealized gains (losses) from fair value adjustments on real estate securities, including commercial mortgage-backed securities and other securities, interest rate swaps and other derivatives not deemed hedges and foreign exchange holdings;
- •
- unrealized gains (losses) from the consolidation from, or deconsolidation to, equity accounting;
- •
- adjustments related to contingent purchase price obligations; and
- •
- adjustments for consolidated and unconsolidated partnerships and joint ventures calculated to reflect MFFO on the same basis as above.
Certain of the above adjustments are also made to reconcile net income (loss) to net cash provided by (used in) operating activities, such as for the amortization of a premium and accretion of a discount on debt and securities investments, amortization of fees, any unrealized gains (losses) on derivatives, securities or other investments, as well as other adjustments.
MFFO excludes non-recurring impairment of real estate-related investments. We assess the credit quality of our investments and adequacy of reserves on a quarterly basis, or more frequently as necessary. Significant judgment is required in this analysis. We consider the estimated net recoverable value of the loan as well as other factors, including but not limited to the fair value of any collateral, the amount and the status of any senior debt, the prospects for the borrower and the competitive situation of the region where the borrower does business. Fair value is typically estimated based on discounting the expected future cash flow of the underlying collateral taking into consideration the discount rate, capitalization rate, occupancy, creditworthiness of major tenants and many other factors. This requires significant judgment and because it is based on projections of future economic events, which are inherently subjective, the amounts ultimately realized may differ materially from the carrying value as of the balance sheet date. If upon completion of the assessment, the estimated fair value of the underlying collateral is less than the net carrying value of the loan, a loan loss reserve is recorded with a corresponding charge to provision for loan losses. Due to our limited life, any loan loss reserves recorded may be difficult to recover.
We believe that MFFO is a useful non-GAAP measure for non-traded REITs. It is helpful to management and investors in assessing our future operating performance once our organization and offering, and acquisition and development stages are complete, because it eliminates from net income non-cash fair value adjustments on our real estate securities and acquisition fees and expenses that are incurred as part of our investment activities. However, MFFO may not be a useful measure of our operating performance or as a comparable measure to other typical non-traded REITs if we do not continue to operate in a similar manner to other non-traded REITs, including if we were to extend our acquisition and development stage or if we determined not to pursue an exit strategy.
However, MFFO does have certain limitations. For instance, the effect of any amortization or accretion on investments originated or acquired at a premium or discount, respectively, are not reported in MFFO. In addition, realized gains (losses) from acquisitions and dispositions are not reported in MFFO, even though such realized gains (losses) could affect our operating performance and cash available for distribution. Investors should note that any cash gains generated from the sale of investments would generally be used to fund new investments.
Neither FFO nor MFFO is equivalent to net income (loss) or cash generated from operating activities determined in accordance with U.S. GAAP and should not be construed to be more relevant or accurate than the U.S. GAAP methodology in evaluating our operating performance. Neither FFO nor MFFO are necessarily indicative of cash flow available to fund our cash needs including our ability to make distributions to our stockholders. FFO and MFFO do not represent amounts available for management's discretionary use because of needed capital replacement or expansion, debt service obligations or other commitments or uncertainties. Furthermore, neither FFO nor MFFO should be considered as an alternative to net income (loss) as an indicator of our operating performance or as an alternative to cash flow from operating activities as a measure of our liquidity.
64
Table of Contents
The following table presents a reconciliation of FFO and MFFO to net income (loss) attributable to our common stockholders (dollars in thousands):
| | | | | | | | | | | | | |
| | Three Months Ended
June 30, | | Six Months Ended
June 30, | |
|---|
| | 2013 | | 2012 | | 2013 | | 2012 | |
|---|
Funds from Operations: | | | | | | | | | | | | | |
Net income (loss) attributable to NorthStar Real Estate Income Trust, Inc. common stockholders | | $ | 12,957 | | $ | 3,008 | | $ | 20,879 | | $ | 5,017 | |
Adjustments: | | | | | | | | | | | | | |
Real estate depreciation and amortization, unconsolidated ventures | | | 219 | | | — | | | 219 | | | — | |
| | | | | | | | | | |
Funds from Operations | | $ | 13,176 | | $ | 3,008 | | $ | 21,098 | | $ | 5,017 | |
| | | | | | | | | | |
Modified Funds from Operations: | | | | | | | | | | | | | |
Funds from Operations | | $ | 13,176 | | $ | 3,008 | | $ | 21,098 | | $ | 5,017 | |
Amortization of premiums, discounts and fees on investments and borrowings, net | | | 2,234 | | | (10 | ) | | 3,025 | | | (1 | ) |
Acquisition fees on investments | | | 691 | | | — | | | 2,279 | | | — | |
Realized (gain) loss on investments and other | | | — | | | (3,028 | ) | | — | | | (3,028 | ) |
Unrealized (gains) losses from fair value adjustments | | | — | | | 2,959 | | | — | | | 2,457 | |
| | | | | | | | | | |
Modified Funds from Operations | | $ | 16,101 | | $ | 2,929 | | $ | 26,402 | | $ | 4,445 | |
| | | | | | | | | | |
Distributions Declared and Paid
We generally pay distributions on a monthly basis based on daily record dates. Since the commencement of our operations on October 18, 2010 through June 30, 2013, we have paid distributions at an annualized distribution rate of 8.0% based on a purchase price of $10.00 per share of our common stock.
The following table presents distributions declared for the six months ended June 30, 2013, the year ended December 31, 2012 and the period from inception through June 30, 2013 (dollars in thousands):
| | | | | | | | | | | | | | | | |
| | Distributions(1) | |
| |
| |
|---|
| | Cash Flow from
Operations(2) | | Funds from
Operations(2) | |
|---|
Period | | Cash | | DRP | | Total | |
|---|
Six months ended June 30, 2013 | | $ | 18,422 | | $ | 13,907 | | $ | 32,329 | | $ | 24,750 | | $ | 21,098 | |
Year ended December 31, 2012 | | | 16,308 | | | 11,614 | | | 27,922 | | | 13,212 | | | 15,304 | |
Inception through June 30, 2013(2) | | | 40,007 | | | 27,468 | | | 67,475 | | | 39,085 | | | 40,310 | |
- (1)
- Represents distributions declared for such period, even though such distributions are actually paid to stockholders the month following such period.
- (2)
- Includes the results of NorthStar Income Opportunity REIT I, Inc. prior to our Merger Transaction. From inception through June 30, 2013, the difference between total distributions paid (including cash distributions and shares issued in connection with our DRP) and cash flow from operations was $21.4 million, of which $4.6 million related to shares purchased by our Sponsor pursuant to our Distribution Support Agreement and the remainder related to shares issued pursuant to our DRP.
The distributions in excess of our cash flow from operations were paid using Offering proceeds, including from the purchase of additional shares by our Sponsor. Over the long-term, however, we expect that our distributions will be paid entirely from cash flow from operations. However, our operating performance cannot be accurately predicted and may deteriorate in the future due to numerous factors, including our ability to raise and invest capital at favorable yields, the financial performance of our investments in the current real estate and financial environment, the type and mix of our investments and accounting of our investments in accordance with U.S. GAAP. As a result, future distributions declared and paid may exceed cash flow from operations.
65
Table of Contents
Item 3. Quantitative and Qualitative Disclosures About Market Risk
We are primarily subject to interest rate risk and credit risk. These risks are dependent on various factors beyond our control, including monetary and fiscal policies, domestic and international economic conditions and political considerations. Our market risk sensitive assets, liabilities and related derivative positions are held for investment and not for trading purposes.
Interest Rate Risk
Changes in interest rates affect our net interest income, which is the difference between the income earned on our investments and the interest expense incurred in connection with our borrowings and derivatives.
Our CRE debt and securities investments bear interest at either a floating or fixed-rate. The interest rate on our floating-rate assets is a fixed spread over an index such as LIBOR and typically reprice every 30 days based on LIBOR in effect at the time. Currently, all of our floating-rate CRE debt investments have a fixed minimum LIBOR rate that is in excess of current LIBOR. We will not benefit from an increase in LIBOR until it is in excess of the LIBOR floors. Given the frequent and periodic repricing of our floating-rate assets, changes in benchmark interest rates are unlikely to materially affect the value of our floating-rate portfolio. Changes in short-term rates will, however, affect income from our investments.
Changes in interest rates could affect the value of our fixed-rate CRE debt and securities investments. For example, increasing interest rates would result in a higher required yield on investments, which would decrease the value on existing fixed-rate investments in order to adjust their yields to current market levels.
Our general financing strategy has focused on the use of "match-funded" structures. This means that we seek to align the maturities of our liabilities with the maturities on our assets as closely as possible in order to manage the risks of being forced to refinance our liabilities prior to the maturities of our assets. In addition, we seek to match interest rates on our assets with like-kind borrowings, so fixed-rate investments are financed with fixed-rate borrowings and floating-rate assets are financed with floating-rate borrowings, directly or indirectly, through the use of interest rate swaps, caps and other financial instruments or through a combination of these strategies. We are subject to interest rate risk because on certain investments, we maintain a net floating-rate asset position, and, therefore, our income will increase with increases in interest rates and decrease with declines in interest rates. As of June 30, 2013, all of our floating-rate investments had LIBOR floors in excess of the current LIBOR rate and our CRE securities were fixed rate, so a hypothetical 100 basis point increase in interest rates (including the effect of the interest rate floor) would decrease net income by $2.3 million.
Credit Spread Risk
The value of our fixed and floating-rate investments also change with market credit spreads. This means that when market-demanded risk premium, or credit spread, increases, the value of our fixed and floating-rate assets decrease and vice versa. Fixed-rate assets are valued based on a market credit spread over the rate payable on fixed-rate U.S. Treasury of like maturity. This means that their value is dependent on the yield demanded on such assets by the market, based on their credit relative to U.S. Treasuries. The floating-rate CRE debt and securities investments are valued based on a market credit spread over the applicable LIBOR. Demand for a higher yield on investments results in higher or "wider" spread over the benchmark rate (usually the applicable U.S. Treasury yield) to value these assets. Under these conditions, the value of our portfolio should decrease. Conversely, if the spread used to value these assets were to decrease or "tighten," the value of these assets should increase.
66
Table of Contents
Credit Risk
Credit risk in our CRE debt and securities investments relates to each individual borrower's ability to make required interest and principal payments on scheduled due dates. We seek to manage credit risk through our Advisor's comprehensive credit analysis prior to making an investment, actively monitoring our portfolio and the underlying credit quality, including subordination and diversification of our portfolio. Our analysis is based on a broad range of real estate, financial, economic and borrower-related factors which we believe are critical to the evaluation of credit risk inherent in a transaction. For the six months ended June 30, 2013, no CRE debt investment contributed more than 10% of interest income.
Item 4. Controls and Procedures
Disclosure Controls and Procedures
As of the end of the period covered by this report, our management conducted an evaluation as required under Rules 13a-15(b) and 15d-15(b) under the Securities Exchange Act of 1934, as amended, or Exchange Act, under the supervision and with the participation of our Chief Executive Officer and Chief Financial Officer, of the effectiveness of our disclosure controls and procedures (as defined in Rules 13a-15(e) and 15d-15(e) under the Exchange Act). Based on this evaluation, our Chief Executive Officer and Chief Financial Officer concluded that, as of the end of the period covered by this report, our disclosure controls and procedures are effective. Notwithstanding the foregoing, a control system, no matter how well designed and operated, can provide only reasonable, not absolute, assurance that it will detect or uncover failures to disclose material information otherwise required to be set forth in our periodic reports.
Internal Control over Financial Reporting
Changes in internal control over financial reporting
There have not been any changes in the Company's internal control over financial reporting (as defined in Rules 13a-15(f) and 15d-15(f) under the Exchange Act) during the most recent fiscal quarter that materially affected, or are reasonably likely to materially affect, the Company's internal control over financial reporting.
Part II. Other Information
Item 1A. Risk Factors
There are no other material changes from the risk factors previously disclosed in our Annual Report on Form 10-K for the fiscal year ended December 31, 2012, as filed with the SEC on March 5, 2013, except as noted below.
If we pay distributions from sources other than our cash flow from operations, we will have less cash available for investments and your overall return may be reduced.
Our organizational documents permit us to pay distributions from any source, including Offering proceeds, borrowings or sales of assets. We have not established a limit on the amount of proceeds we may use to fund distributions. While we anticipate over the long-term being able to generate sufficient cash flow from operations to fully cover our distributions until the proceeds from our Offering are fully invested and otherwise during the course of our existence, we may not generate sufficient cash flow from operations to fund distributions. For the six months ended June 30, 2013, we declared distributions of $32.3 million compared to cash flow from operations of $24.8 million. The remaining $7.5 million, or 23%, was paid using proceeds from our Offering. In addition, for the fiscal year ended December 31, 2012, we declared distributions of $27.9 million compared to cash flow from operations
67
Table of Contents
of $13.2 million. The remaining $14.7 million, or 53.0%, was paid using proceeds from our Offering, including $1.2 million from the purchase of shares by our Sponsor. Pursuant to a Distribution Support Agreement, in certain circumstances where our cash distributions exceed our MFFO, our Sponsor committed to purchase up to $10.0 million in shares of our common stock at $9.00 per share to provide additional cash to support distributions to our stockholders and has, in fact, purchased $4.6 million of shares of our common stock as of June 30, 2013. The sale of these shares results in the dilution of the ownership interests of our public stockholders. Following the expiration of our Distribution Support Agreement on July 19, 2013, we may not have sufficient cash available to pay distributions at the rate we had paid during preceding periods or at all. If we pay distributions from sources other than our cash flow from operations, we will have less cash available for investments and your overall return may be reduced.
Item 2. Unregistered Sales of Equity Securities and Use of Proceeds
Use of Proceeds from Registered Securities
On July 19, 2010, our registration statement on Form S-11 (File No. 333-157688) was declared effective under the Securities Act. We completed our Total Primary Offering (including 7.6 million shares reallocated from our DRP) on July 1, 2013 and all of the shares initially registered were issued. We plan to continue to offer shares under our DRP. As a result, we filed a registration statement on Form S-3 with the SEC to issue an additional 15.0 million shares pursuant to our DRP, which was declared effective on July 3, 2013.
We issued the following shares of common stock and raised the following proceeds in connection with our Offering as of June 30, 2013 and July 1, 2013 (dollars and shares in thousands):
| | | | | | | | | | | | | |
| | June 30, 2013 | | July 1, 2013(1) | |
|---|
| | Shares | | Proceeds | | Shares | | Proceeds | |
|---|
Total Primary Offering | | | 107,642 | | $ | 1,072,912 | | | 107,642 | | $ | 1,072,912 | |
DRP | | | 2,561 | | | 24,328 | | | 2,884 | | | 27,395 | |
| | | | | | | | | | |
Total | | | 110,203 | | $ | 1,097,240 | | | 110,526 | | $ | 1,100,307 | |
| | | | | | | | | | |
- (1)
- Our Total Primary Offering was completed on July 1, 2013.
As of June 30, 2013, we incurred $72.1 million in selling commissions, $32.1 million in dealer manager fees and $9.7 million in other offering costs in connection with the issuance and distribution of our registered securities and $81.2 million of these costs have been reallowed to third parties.
For the six months ended June 30, 2013 and the year ended December 31, 2012, there were no unfulfilled repurchase requests.
The following table presents proceeds to us (dollars in thousands):
| | | | |
| | As of
June 30, 2013 | |
|---|
Net proceeds to us from our Total Primary Offering | | $ | 959,063 | |
Net proceeds used to orginate CRE debt investments | | | 585,387 | |
Net proceeds used to purchase PE Investments | | | 121,449 | |
Net proceeds used to purchase CRE securities | | | 40,465 | |
Proceeds used to pay our Advisor acquisition fees | | | 10,804 | |
68
Table of Contents
Purchases of Equity Securities by the Issuer and Affiliated Purchasers
For the three months ended June 30, 2013, we repurchased shares of our common stock as follows:
| | | | | | | | | | |
Period | | Number of
Shares Purchased | | Average Price
Paid Per Share | | Maximum Approximate
Dollar Value of Shares
that May Yet Be Purchased
Under the Plan or Program | |
|---|
April 1 to April 30 | | | 176,833 | | $ | 9.36 | | | | (1) |
May 1 to May 31 | | | — | | | — | | | | (1) |
June 1 to June 30 | | | — | | | — | | | | (1) |
| | | | | | | | | |
Total | | | 176,833 | | $ | 9.36 | | | | |
- (1)
- We adopted our Share Repurchase Program effective July 19, 2010, which may enable stockholders to sell their shares to us in limited circumstances. We may not repurchase shares unless a stockholder has held shares for one year. However, we may repurchase shares held less than one year in connection with a stockholder's death or qualifying disability, if the disability is deemed qualifying by our board of directors, in their sole discretion, and after receiving written notice from the stockholder or the stockholder's estate. We are not obligated to repurchase shares under our Share Repurchase Program. We fund repurchase requests received during a quarter with proceeds set aside for that purpose which are not expected to exceed proceeds received from our DRP. However, to the extent that the aggregate DRP proceeds are not sufficient to fund repurchase requests, our board of directors may, in its sole discretion, choose to use other sources of funds. Subject to funds being available, we will limit the number of shares redeemed pursuant to our Share Repurchase Program to: (i) 5.0% of the weighted average number of shares of our common stock outstanding during the prior calendar year; and (ii) those that could be funded from the net DRP proceeds in the prior calendar year plus such additional funds as may be reserved for that purpose by our board of directors; provided, however, that the above volume limitations shall not apply to repurchases requested within two years after the death or qualifying disability of a stockholder. Our board of directors may, in its sole discretion, amend, suspend or terminate our Share Repurchase Program at any time upon ten days' notice except that changes in the number of shares that can be repurchased during any calendar year will take effect only upon ten business days' prior written notice. In addition, our Share Repurchase Program will terminate in the event a secondary market develops for our shares or until our shares are listed on a national exchange or included for quotation in a national securities market.
69
Table of Contents
Item 6. Exhibits
| | | |
Exhibit
Number | | Description of Exhibit |
|---|
| | 3.1 | | Second Articles of Amendment and Restatement of NorthStar Real Estate Income Trust, Inc. (filed as Exhibit 3.1 to the Company's Current Report on Form 8-K filed on August 26, 2010 and incorporated herein by reference) |
| | | | |
| | 3.2 | * | Amended and Restated Bylaws of NorthStar Real Estate Income Trust, Inc. |
| | | | |
| | 4.1 | | Form of Subscription Agreement (filed as Exhibit 4.1 to Post-Effective Amendment No. 13 to the Company's Registration Statement on Form S-11 (File No. 333-157688) and incorporated herein by reference) |
| | | | |
| | 4.2 | | Amended and Restated Distribution Reinvestment Plan (filed as Exhibit 4.2 to Post-Effective Amendment No. 13 to the Company's Registration Statement on Form S-11 (File No. 333-157688) and incorporated herein by reference) |
| | | | |
| | 10.1 | * | Agreement of Purchase and Sale, dated as of June 12, 2013 by and between Project Shore JV I, LLC and Project Shore JV II, LLC, as Buyers, and Common Pension Fund E, as Seller |
| | | | |
| | 31.1 | * | Certification by the Chief Executive Officer pursuant to 17 CFR 240.13a-14(a)/15(d)-14(a), as adopted pursuant to Section 302 of the Sarbanes-Oxley Act of 2002 |
| | | | |
| | 31.2 | * | Certification by the Chief Financial Officer pursuant to 17 CFR 240.13a-14(a)/15(d)-14(a), as adopted pursuant to Section 302 of the Sarbanes-Oxley Act of 2002 |
| | | | |
| | 32.1 | * | Certification by the Chief Executive Officer pursuant to Rule 13a-14(b) under the Securities Exchange Act of 1934 and 18 U.S.C. Section 1350, as adopted pursuant to Section 906 of the Sarbanes-Oxley Act of 2002 |
| | | | |
| | 32.2 | * | Certification by the Chief Financial Officer pursuant to Rule 13a-14(b) under the Securities Exchange Act of 1934 and 18 U.S.C. Section 1350, as adopted pursuant to Section 906 of the Sarbanes-Oxley Act of 2002 |
| | | | |
| | 101 | | The following materials from the NorthStar Real Estate Income Trust, Inc. Quarterly Report on Form 10-Q for the quarterly period ended June 30, 2013, formatted in XBRL (eXtensible Business Reporting Language): (i) Consolidated Balance Sheets as of June 30, 2013 (unaudited) and December 31, 2012; (ii) Consolidated Statements of Operations (unaudited) for the three and six months ended June 30, 2013 and 2012; (iii) Consolidated Statements of Comprehensive Income (Loss) (unaudited) for the three and six months ended June 30, 2013 and 2012; (iv) Consolidated Statements of Equity (unaudited) as of June 30, 2013 and December 31, 2012; (v) Consolidated Statements of Cash Flows (unaudited) for the six months ended June 30, 2013 and 2012; and (vi) Notes to Consolidated Financial Statements (unaudited). |
70
Table of Contents
SIGNATURES
Pursuant to the requirements of the Securities Exchange Act of 1934, the Registrant has duly caused this report to be signed on its behalf by the undersigned thereunto duly authorized.
| | | | | | |
| | | NorthStar Real Estate Income Trust, Inc. |
Date: August 9, 2013 |
|
By: |
|
/s/ DANIEL R. GILBERT
|
| | | | | Name: | | Daniel R. Gilbert |
| | | | | Title: | | Chief Executive Officer |
|
|
By: |
|
/s/ DEBRA A. HESS
|
| | | | | Name: | | Debra A. Hess |
| | | | | Title: | | Chief Financial Officer |
71