EXHIBIT 99.2

Q2 2017 Earnings Call August 8, 2017

August 8 , 2017 2 Legal Disclaimer This presentation contains forward - looking statements within the meaning of the federal securities laws . All statements other than statements of historical facts contained in this presentation, including statements regarding our future results of operations and financial position, business strategy and plans and objectives of management for future operations, are forward - looking statements . In many cases, you can identify forward - looking statements by terms such as “may,” “should,” “expects,” “plans,” “anticipates,” “could,” “intends,” “target,” “projects,” “contemplates,” “believes,” “estimates,” “predicts,” “potential” or “continue” or the negative of these terms or other similar words . Forward - looking statements contained in this presentation include, but are not limited to, statements about (i) growth of the wind energy market and our addressable market ; (ii) the potential impact of GE’s acquisition of LM Wind Power upon our business ; (iii) our future financial performance, including our net sales, cost of goods sold, gross profit or gross margin, operating expenses, ability to generate positive cash flow, and ability to achieve or maintain profitability ; (iv) the sufficiency of our cash and cash equivalents to meet our liquidity needs ; (v) our ability to attract and retain customers for our products, and to optimize product pricing ; (vi) competition from other wind blade manufacturers ; (vii) the discovery of defects in our products ; (viii) our ability to successfully expand in our existing markets and into new international markets ; (ix) worldwide economic conditions and their impact on customer demand ; (x) our ability to effectively manage our growth strategy and future expenses ; (xi) our ability to maintain, protect and enhance our intellectual property ; (xii) our ability to comply with existing, modified or new laws and regulations applying to our business ; and (xiii) the attraction and retention of qualified employees and key personnel . These forward - looking statements are only predictions . These statements relate to future events or our future financial performance and involve known and unknown risks, uncertainties and other important factors that may cause our actual results, levels of activity, performance or achievements to materially differ from any future results, levels of activity, performance or achievements expressed or implied by these forward - looking statements . Because forward - looking statements are inherently subject to risks and uncertainties, some of which cannot be predicted or quantified, you should not rely on these forward - looking statements as guarantees of future events . Further information on the factors, risks and uncertainties that could affect our financial results and the forward - looking statements in this presentation are included in our filings with the Securities and Exchange Commission and will be included in subsequent periodic and current reports we make with the Securities and Exchange Commission from time to time, including in our Annual Report on Form 10 - K for the year ended December 31 , 2016 . The forward - looking statements in this presentation represent our views as of the date of this presentation . We anticipate that subsequent events and developments will cause our views to change . However, while we may elect to update these forward - looking statements at some point in the future, we undertake no obligation to update any forward - looking statement to reflect events or developments after the date on which the statement is made or to reflect the occurrence of unanticipated events except to the extent required by applicable law . You should, therefore, not rely on these forward - looking statements as representing our views as of any date after the date of this presentation . Our forward - looking statements do not reflect the potential impact of any future acquisitions, mergers, dispositions, joint ventures, or investments we may make . This presentation includes unaudited non - GAAP financial measures including total billings , EBITDA, adjusted EBITDA , net debt and free cash flow . We define total billings as the total amounts we have invoiced our customers for products and services for which we are entitled to payment under the terms of our long term supply agreements or other contractual agreements . We define EBITDA as net income (loss) attributable to the Company plus interest expense ( including losses on the extinguishment of debt and net of interest income), income taxes and depreciation and amortization . We define Adjusted EBITDA as EBITDA plus any share - based compensation expense, plus or minus any gains or losses from foreign currency remeasurement . We define net debt as the total principal amount of debt outstanding less unrestricted cash and equivalents . We define free cash flow as net cash flow generated from operating activities less capital expenditures . We present non - GAAP measures when we believe that the additional information is useful and meaningful to investors . Non - GAAP financial measures do not have any standardized meaning and are therefore unlikely to be comparable to similar measures presented by other companies . The presentation of non - GAAP financial measures is not intended to be a substitute for, and should not be considered in isolation from, the financial measures reported in accordance with GAAP . See the appendix for the reconciliations of certain non - GAAP financial measures to the comparable GAAP measures . This presentation also contains estimates and other information concerning our industry that are based on industry publications, surveys and forecasts . This information involves a number of assumptions and limitations, and we have not independently verified the accuracy or completeness of the information .

August 8 , 2017 3 Agenda • Q2 2017 Highlights • Industry Update • Q2 and Year to Date 2017 Financial Highlights • Guidance for 2017 • Q&A • Appendix - Non - GAAP Information

August 8 , 2017 4 Q2 2017 Highlights

August 8 , 2017 5 Q2 2017 Highligh ts Q2 2017 Highlights and Recent Company News 586 755 194 248 $0 $200 $400 $600 $800 2015 2016 Q2'16 Q2 '17 GAAP Net Sales ($ in millions) Sets 1,609 2,154 551 692 Est. MW 3,595 4,920 1,252 1, 620 Dedicated lines (1) 34 44 38 46 Lines installed (2) 30 33 30 39 (1) Number of manufacturing lines dedicated to our customers under long - term supply agreements (2) Number of manufacturing lines installed that are either in operation , startup or transition Operating results and year - over - year increases compared to the second quarter 201 6 • Net sales were up 27.8 % • Total billings were up 17.8 % to $ 231.1 million for the quarter – in line with our 2017 plan • Net income for the quarter increased to $ 13.9 million versus $ 11.6 million in Q2 2016 • Adjusted EBITDA for the quarter increased by 47.9% to $ 30.8 million and beat our plan • Adjusted EBITDA margin for the quarter was up 170 bps to 12.4 % and beat our plan Signed a multiyear supply agreement with a customer for two manufacturing lines in Taicang, China Signed a multiyear supply agreement with Vestas for two manufacturing lines plus and option for additional lines in a new manufacturing facility to be built in Matamoros, Mexico to serve the Latin American market Completed a secondary offering of 5.075 million shares Hired a seasoned energy industry Chief Commercial Officer to lead our diversified growth strategy
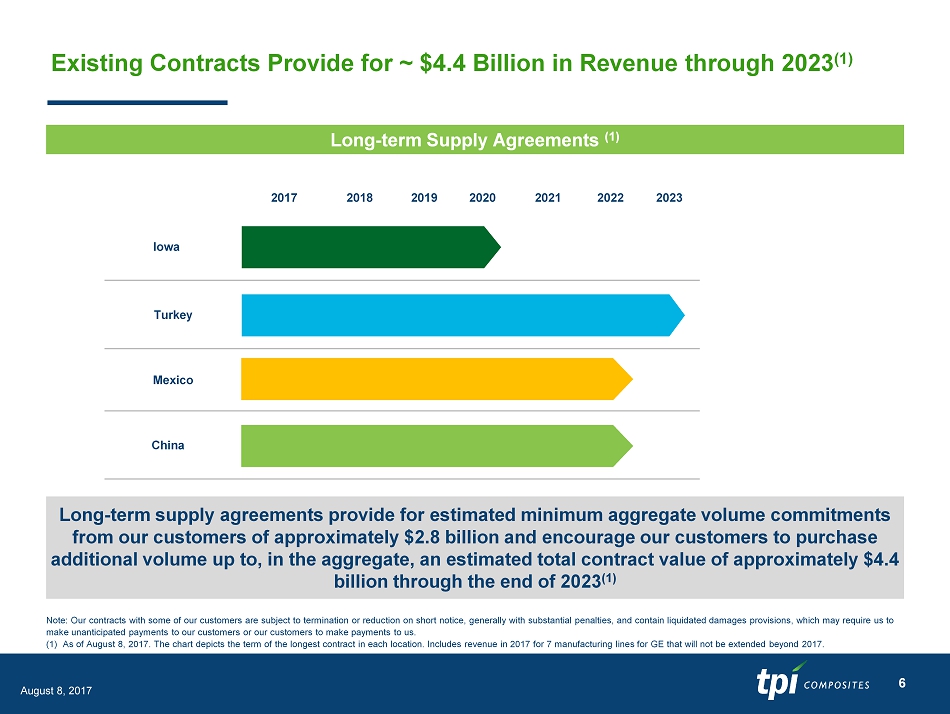
August 8 , 2017 2017 2018 2019 2020 2021 2022 2023 Iowa Turkey Mexico China 6 Existing Contracts Provide for ~ $ 4.4 Billion in Revenue through 2023 (1) Note: Our contracts with some of our customers are subject to termination or reduction on short notice, generally with substantial penalties, and contain liquidated damages pr ovisions, which may require us to make unanticipated payments to our customers or our customers to make payments to us. (1) As of August 8, 2017 . The chart depicts the term of the longest contract in each location. Includes revenue in 2017 for 7 manufacturing lines for GE that will not be extended beyond 2017. Long - term supply agreements provide for estimated minimum aggregate volume commitments from our customers of approximately $2. 8 billion and encourage our customers to purchase additional volume up to, in the aggregate, an estimated total contract value of approximately $4.4 billion through the end of 2023 (1) Long - term Supply Agreements (1)

August 8 , 2017 42.5 44.4 7.6 17.6 2016 2026E Mature wind markets Developing wind markets Onshore Global Market Growth Source: MAKE Q1 2017 Global Wind Power Market Outlook Update and Bloomberg New Energy Finance Note: Developing wind markets defined as fewer than 6 GW of 2016 installed capacity Annual installed global wind capacity (GW): 2016 – 2026E Annual installed wind capacity growth is propelled by an uptick in developing wind markets , including Turkey and Mexico where TPI Composites is well positioned to succeed 50.1 CAGR 0.4% CAGR 8.8% Mature wind markets share Developing market markets share 15.2% 84.8% 28.4% 71.6% 62.0 7

August 8 , 2017 U.S. Onshore Market Growth: 2011 – 2020E The U.S. wind market is expected to experience consistent near - term growth in light of recently enacted PTC phase out Source: MAKE Q1 2017 Global Wind Power Market Outlook Update (GW) U.S. Onshore Wind Market Growth - Capacity (2011 – 2015) 6.2 12.5 1.1 4.8 8.6 0 3 6 9 12 15 2011 2012 2013 2014 2015 8.9 7.3 10.0 10.2 12.3 2016 2017E 2018E 2019E 2020E U.S. Onshore Wind Market Growth – Capacity (2016 – 2020E) Average annual installation: 9.7 GW Total U.S. wind installations: 48.7 GW Average annual installation: 6.6 GW Total U.S. wind installations: 33.2 GW 8

August 8 , 2017 Market Demand Drivers 9 • Overall competitiveness of wind energy • Commercial and industrial demand • Utilities being driven by consumer demand and sheer economics • Repowering - globally • Offshore economics • Decarbonization • Vehicle electrification • Energy access in developing and emerging economies

August 8 , 2017 10 Q 2 and Year to Date 2017 F inancial Highlights

August 8 , 2017 11 Q2 and Year to Date 2017 Financial Highlights (unaudited) (1) See pages 19 – 21 for reconciliations of non - GAAP financial data (2) Based on n et income attributable to common shareholders ($ in millions, except per share data) Q2 ’17 Q2 ’16 ∆ YTD ’17 YTD ’16 ∆ Select Financial Data Net Sales $ 248.2 $ 194.3 27.8% $ 439.8 $ 370.4 18.7% Total Billings (1) $ 231.1 $ 196.1 17.8% $ 442.4 $ 370.7 19.4% Net Income $ 13.9 $ 11.6 19.9% $ 17.4 $ 13.3 30.8% Adjusted EBITDA (1) $ 30.8 $ 20.8 47.9% $ 46.3 $ 32.2 43.9% Adjusted EBITDA Margin 12.4% 10.7% 170 bps 10.5% 8.7% 180 bps Diluted Earnings per Share (2) $ 0.41 $ 2.15 $ (1.74) $ 0.51 $ 1.99 $ (1.48) Net Debt (1) $ (0.5) $ 93.5 $ 94.0 $ (0.5) $ 93.5 $ 94.0 Free Cash Flow (1) $ 8.2 $ 8.0 $ 0.2 $ 7.2 $ (4.1) $ 11.3 Capital Expenditures $ 9.8 $ 3.4 $ 6.4 $ 26.7 $ 14.2 $ 12.5 Key Performance Indicators Sets 692 551 141 1,328 1,037 291 Estimated Megawatts 1,620 1,252 368 3,080 2,365 715 Dedicated Manufacturing Lines 46 38 8 lines 46 38 8 lines Lines Installed 39 30 9 lines 39 30 9 lines Lines in Startup 9 — 9 lines 9 — 9 lines Lines in Transition — 3 3 lines — 3 3 lines

August 8 , 2017 12 Income Statement Summary (unaudited) (1) See pages 1 9 - 21 for reconciliations of Non - GAAP financial data 2017 2016 $ % 2017 2016 $ % ($ in thousands, except per share amounts) Net sales 248,186$ 194,255$ 53,931$ 27.8% 439,788$ 370,365$ 69,423$ 18.7% Cost of sales 203,095$ 168,382$ 34,713$ 20.6% 370,518$ 328,248$ 42,270$ 12.9% Startup and transition costs 10,540$ 3,055$ 7,485$ NM 16,699$ 6,361$ 10,338$ 162.5% Total cost of goods sold 213,635$ 171,437$ 42,198$ 24.6% 387,217$ 334,609$ 52,608$ 15.7% Cost of goods sold % 86.1% 88.3% -220 bps 88.0% 90.3% -230 bps Gross profit 34,551$ 22,818$ 11,733$ 51.4% 52,571$ 35,756$ 16,815$ 47.0% Gross profit % 13.9% 11.7% 220 bps 12.0% 9.7% 230 bps General and administrative expenses 10,752$ 5,340$ 5,412$ 101.3% 19,058$ 10,089$ 8,969$ 88.9% General and administrative expenses % 4.3% 2.7% 160 bps 4.3% 2.7% 160 bps Income from operations 23,799$ 17,478$ 6,321$ 36.2% 33,513$ 25,667$ 7,846$ 30.6% Income before income taxes 19,900$ 13,508$ 6,392$ 47.3% 25,546$ 17,557$ 7,989$ 45.5% Net income 13,858$ 11,555$ 2,303$ 19.9% 17,403$ 13,301$ 4,102$ 30.8% Net income attributable to preferred shareholders -$ 2,438$ (2,438)$ -100.0% -$ 4,875$ (4,875)$ -100.0% Net income attributable to common shareholders 13,858$ 9,117$ 4,741$ 52.0% 17,403$ 8,426$ 8,977$ 106.5% Weighted-average common shares outstanding: Basic 33,737 4,238 33,737 4,238 Diluted 33,828 4,244 33,827 4,244 Net income per common share: Basic 0.41$ 2.15$ (1.74)$ 0.52$ 1.99$ (1.47)$ Diluted 0.41$ 2.15$ (1.74)$ 0.51$ 1.99$ (1.48)$ Non-GAAP Metrics Total billings (1) 231,069$ 196,146$ 34,923$ 17.8% 442,429$ 370,684$ 71,745$ 19.4% EBITDA (1) 27,478$ 20,776$ 6,702$ 32.3% 39,960$ 31,727$ 8,233$ 25.9% EBITDA margin 11.1% 10.7% 40 bps 9.1% 8.6% 50 bps Adjusted EBITDA (1) 30,755$ 20,794$ 9,961$ 47.9% 46,325$ 32,184$ 14,141$ 43.9% Adjusted EBITDA margin 12.4% 10.7% 170 bps 10.5% 8.7% 180 bps Three Months Ended June 30, Change Six Months Ended June 30, Change
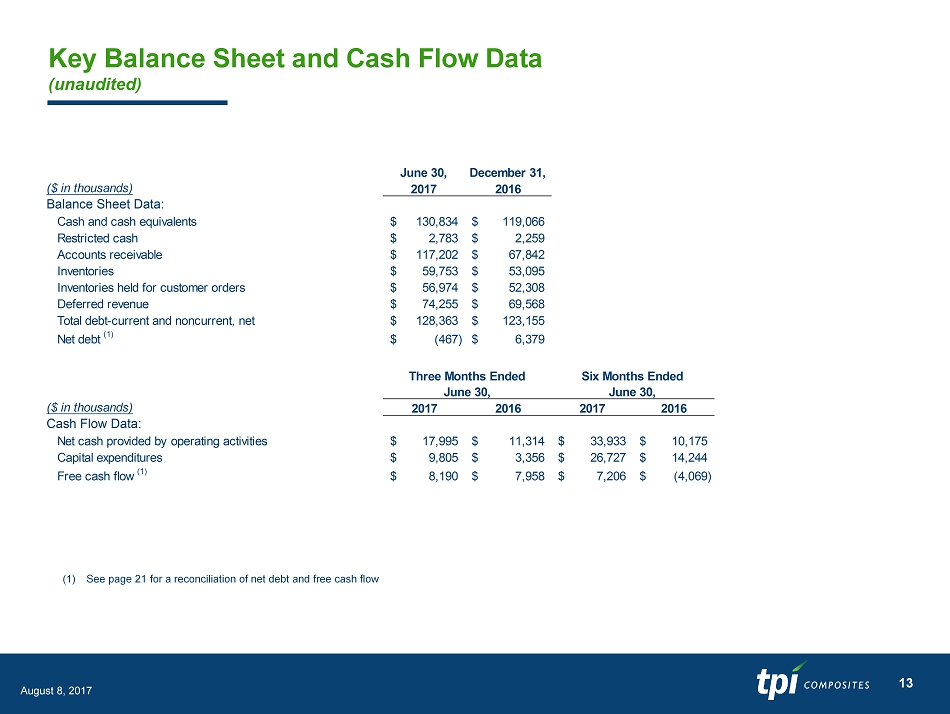
August 8 , 2017 13 Key Balance Sheet and Cash Flow Data (unaudited) (1) See page 21 for a reconciliation of net debt and free cash flow June 30, December 31, ($ in thousands) 2017 2016 Balance Sheet Data: Cash and cash equivalents 130,834$ 119,066$ Restricted cash 2,783$ 2,259$ Accounts receivable 117,202$ 67,842$ Inventories 59,753$ 53,095$ Inventories held for customer orders 56,974$ 52,308$ Deferred revenue 74,255$ 69,568$ Total debt-current and noncurrent, net 128,363$ 123,155$ Net debt (1) (467)$ 6,379$ ($ in thousands) 2017 2016 2017 2016 Cash Flow Data: Net cash provided by operating activities 17,995$ 11,314$ 33,933$ 10,175$ Capital expenditures 9,805$ 3,356$ 26,727$ 14,244$ Free cash flow (1) 8,190$ 7,958$ 7,206$ (4,069)$ Three Months Ended June 30, Six Months Ended June 30,

August 8 , 2017 14 2017 Guidance
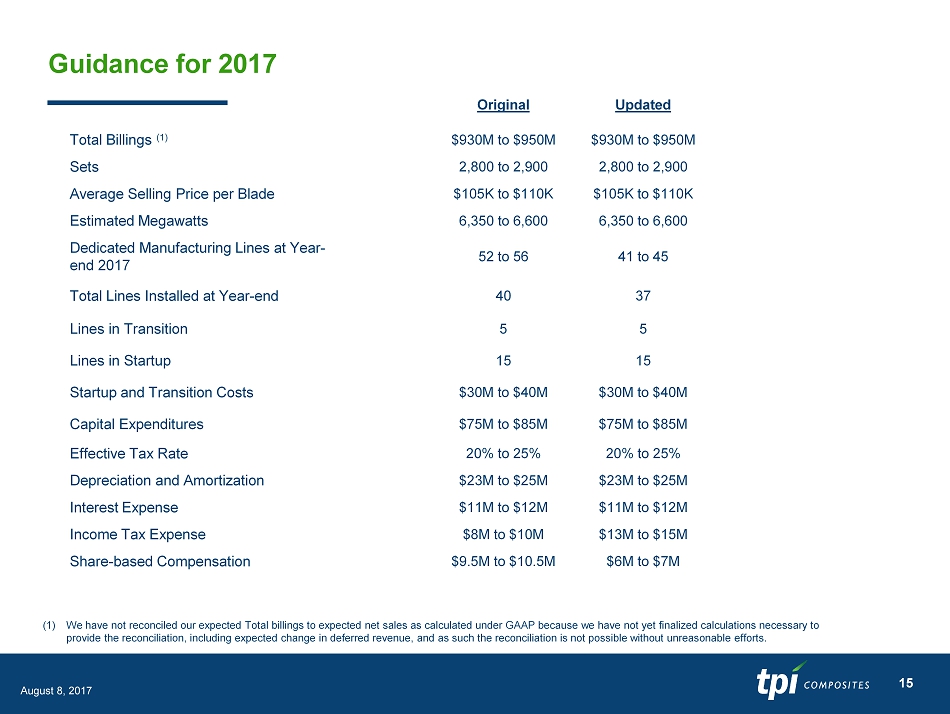
August 8 , 2017 15 Guidance for 2017 (1) We have not reconciled our expected Total billings to expected net sales as calculated under GAAP because we have not yet finalized calculations necessary to provide the reconciliation, including expected change in deferred revenue, and as such the reconciliation is not possible wit hou t unreasonable efforts. Original Updated Total Billings (1) $ 9 30 M to $ 9 5 0M $ 9 30 M to $ 9 5 0M Sets 2,800 to 2,900 2,800 to 2,900 Average Selling Price per Blade $ 10 5 K to $110K $ 10 5 K to $110K Estimated Megawatts 6,350 to 6,600 6,350 to 6,600 Dedicated Manufacturing Lines at Year - end 2017 52 to 56 41 to 45 Total Lines Installed at Year - end 40 37 Lines in Transition 5 5 Lines in Startup 15 15 Startup and Transition Costs $ 30 M to $ 40 M $30M to $40M Capital Expenditures $ 7 5 M to $ 85M $75M to $85M Effective Tax Rate 20% to 25% 20% to 25% Depreciation and Amortization $ 23M to $ 25M $23M to $25M Interest Expense $ 11M to $ 12M $11M to $12M Income Tax Expense $ 8M to $ 10M $13M to $15M Share - based Compensation $9.5M to $10.5M $6M to $7M

August 8 , 2017 16 Q&A

August 8 , 2017 17 Save the Date TPI Composites Analyst Day Friday, November 17, 2017 The Roosevelt Hotel of New York 45 E 45 th Street New York, NY If you have any questions, please contact arozmus@soleburyir.com or mlycouris@soleburyir.com. If you have any questions, please contact arozmus@soleburyir.com or mlycouris@soleburyir.com.

August 8 , 2017 18 Appendix - Non - GAAP Information This presentation includes unaudited non - GAAP financial measures including total billings, EBITDA, adjusted EBITDA, net debt and free cash flow . We define total billings as the total amounts we have invoiced our customers for products and services for which we are entitled to payment under the terms of our long - term supply agreements or other contractual agreements . We define EBITDA as net income (loss) attributable to the Company plus interest expense ( including losses on the extinguishment of debt and net of interest income ), income taxes, and depreciation and amortization . We define adjusted EBITDA as EBITDA plus any share - based compensation expense, plus or minus any gains or losses from foreign currency remeasurement . We define net debt as the total principal amount of debt outstanding less unrestricted cash and equivalents . We define free cash flow as net cash flow generated from operating activities less capital expenditures . We present non - GAAP measures when we believe that the additional information is useful and meaningful to investors . Non - GAAP financial measures do not have any standardized meaning and are therefore unlikely to be comparable to similar measures presented by other companies . The presentation of non - GAAP financial measures is not intended to be a substitute for, and should not be considered in isolation from, the financial measures reported in accordance with GAAP . See below for a reconciliation of certain non - GAAP financial measures to the comparable GAAP measures .
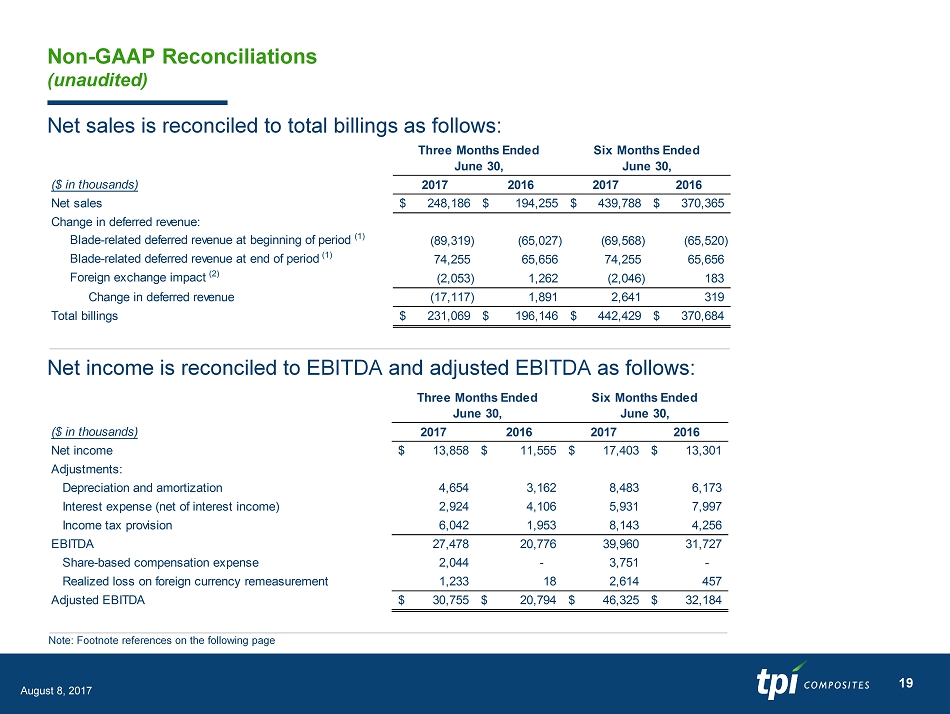
August 8 , 2017 19 Non - GAAP Reconciliations (unaudited) Note: Footnote references on the following page Net sales is reconciled to total billings as follows: Net income is reconciled to EBITDA and adjusted EBITDA as follows: ($ in thousands) 2017 2016 2017 2016 Net sales 248,186$ 194,255$ 439,788$ 370,365$ Change in deferred revenue: Blade-related deferred revenue at beginning of period (1) (89,319) (65,027) (69,568) (65,520) Blade-related deferred revenue at end of period (1) 74,255 65,656 74,255 65,656 Foreign exchange impact (2) (2,053) 1,262 (2,046) 183 Change in deferred revenue (17,117) 1,891 2,641 319 Total billings 231,069$ 196,146$ 442,429$ 370,684$ Six Months Ended June 30, Three Months Ended June 30, ($ in thousands) 2017 2016 2017 2016 Net income 13,858$ 11,555$ 17,403$ 13,301$ Adjustments: Depreciation and amortization 4,654 3,162 8,483 6,173 Interest expense (net of interest income) 2,924 4,106 5,931 7,997 Income tax provision 6,042 1,953 8,143 4,256 EBITDA 27,478 20,776 39,960 31,727 Share-based compensation expense 2,044 - 3,751 - Realized loss on foreign currency remeasurement 1,233 18 2,614 457 Adjusted EBITDA 30,755$ 20,794$ 46,325$ 32,184$ Six Months Ended June 30, Three Months Ended June 30,

August 8 , 2017 20 Non - GAAP Reconciliations (continued ) (unaudited ) (1) Total billings is reconciled using the blade - related deferred revenue amounts at the beginning and the end of the period as follows : (2) Represents the effect of the difference in the exchange rate used by our various foreign subsidiaries on the invoice date versus the exchange rate used at the period - end balance sheet date. ($ in thousands) 2017 2016 2017 2016 Blade-related deferred revenue at beginning of period 89,319$ 65,027$ 69,568$ 65,520$ Non-blade related deferred revenue at beginning of period - - - - Total current and noncurrent deferred revenue at beginning of period 89,319$ 65,027$ 69,568$ 65,520$ Blade-related deferred revenue at end of period 74,255$ 65,656$ 74,255$ 65,656$ Non-blade related deferred revenue at end of period - - - - Total current and noncurrent deferred revenue at end of period 74,255$ 65,656$ 74,255$ 65,656$ Six Months Ended June 30, Three Months Ended June 30,

August 8 , 2017 21 Non - GAAP Reconciliations (continued ) (unaudited) Net debt is reconciled as follows: Free cash flow is reconciled as follows: June 30, December 31, June 30, ($ in thousands) 2017 2016 2016 Total debt, net of debt issuance costs and discount 128,363$ 123,155$ 119,692$ Add debt issuance costs 2,004 2,290 3,390 Add debt discount - - 1,509 Less cash and cash equivalents (130,834) (119,066) (31,057) Net debt (467)$ 6,379$ 93,534$ ($ in thousands) 2017 2016 2017 2016 Net cash provided by operating activities 17,995$ 11,314$ 33,933$ 10,175$ Less capital expenditures (9,805) (3,356) (26,727) (14,244) Free cash flow 8,190$ 7,958$ 7,206$ (4,069)$ Six Months Ended June 30, Three Months Ended June 30,

22