EXHIBIT 99.2

Q2 2019 Earnings Call
Q2 2019 Earnings Call Legal Disclaimer This presentation contains forward - looking statements within the meaning of the federal securities law. All statements other tha n statements of historical facts contained in this presentation, including statements regarding our future results of operations and financial position, business strategy and p lan s and objectives of management for future operations, are forward - looking statements. In many cases, you can identify forward - looking statements by terms such as “may,” “should,” “ex pects,” “plans,” “anticipates,” “could,” “intends,” “target,” “projects,” “contemplates,” “believes,” “estimates,” “predicts,” “potential” or “continue” or the negative of these te rms or other similar words. Forward - looking statements contained in this presentation include, but are not limited to, statements about: (i) growth of the wind energy market and ou r a ddressable market; (ii) the potential impact of the increasing prevalence of auction - based tenders in the wind energy market and increased competition from solar energy on our gros s margins and overall financial performance; (iii) our future financial performance, including our net sales, cost of goods sold, gross profit or gross margin, operating expens es, ability to generate positive cash flow, and ability to achieve or maintain profitability; (iv) changes in domestic or international government or regulatory policy, including witho ut limitation, changes in trade policy; (v) the sufficiency of our cash and cash equivalents to meet our liquidity needs; (vi) our ability to attract and retain customers for our products, and to optimize product pricing; (vii) our ability to effectively manage our growth strategy and future expenses, including our startup and transition costs; (viii) competition from other win d b lade and wind blade turbine manufacturers; (ix) the discovery of defects in our products; (x) our ability to successfully expand in our existing wind energy markets and into new in ternational wind energy markets; (xi) our ability to successfully open new manufacturing facilities and expand existing facilities on time and on budget; (xii) the impact of the acc elerated pace of new product and wind blade model introductions on our business and our results of operations; (xiii) our ability to successfully expand our transportation bus ine ss and execute upon our strategy of entering new markets outside of wind energy; (xiv) worldwide economic conditions and their impact on customer demand; (xv) our ability to maintain , p rotect and enhance our intellectual property; (xvi) our ability to comply with existing, modified or new laws and regulations applying to our business, including the imposition of n ew taxes, duties or similar assessments on our products; (xvii) the attraction and retention of qualified employees and key personnel; (xviii) our ability to maintain good working r ela tionships with our employees, and avoid labor disruptions, strikes and other disputes with labor unions that represent certain of our employees; (xix) our ability to procure adequate s upp lies of raw materials and components to fulfill our wind blade volume commitments to our customers and (xx) the potential impact of one or more of our customers becoming bankrupt or ins olvent, or experiencing other financial problems. These forward - looking statements are only predictions. These statements relate to future events or our future financial performa nce and involve known and unknown risks, uncertainties and other important factors that may cause our actual results, levels of activity, performance or achievements to materially differ from any future results, levels of activity, performance or achievements expressed or implied by these forward - looking statements. Because forward - looking statements are inh erently subject to risks and uncertainties, some of which cannot be predicted or quantified, you should not rely on these forward - looking statements as guarantees of future even ts. Further information on the factors, risks and uncertainties that could affect our financial results and the forward - looking statements in this presentation are included in ou r filings with the Securities and Exchange Commission and will be included in subsequent periodic and current reports we make with the Securities and Exchange Commission from time to time, including in our Annual Report on Form 10 - K for the year ended December 31, 2018. The forward - looking statements in this presentation represent our views as of the date of this presentation. We anticipate that subsequent events and developments will cause our views to change. However, while we may elect to update these forward - looking statements at some point in the future, we undertak e no obligation to update any forward - looking statement to reflect events or developments after the date on which the statement is made or to reflect the occurrence of una nti cipated events except to the extent required by applicable law. You should, therefore, not rely on these forward - looking statements as representing our views as of any date aft er the date of this presentation. Our forward - looking statements do not reflect the potential impact of any future acquisitions, mergers, dispositions, joint ventures, or investme nts we may make. This presentation includes unaudited non - GAAP financial measures including total billings, EBITDA, adjusted EBITDA, net cash (de bt) and free cash flow. We define total billings as the total amounts we have invoiced our customers for products and services for which we are entitled to payment under the ter ms of our long - term supply agreements or other contractual agreements. We define EBITDA as net income (loss) plus interest expense (including losses on the extinguishment o f d ebt and net of interest income), income taxes and depreciation and amortization. We define Adjusted EBITDA as EBITDA plus any share - based compensation expense, plus or minus any gains or losses from foreign currency remeasurement and any gains or losses on the sale of assets. We define net cash (debt) as the total principal amount of debt out standing less unrestricted cash and cash equivalents. We define free cash flow as net cash flow generated from operating activities less capital expenditures. We pres ent non - GAAP measures when we believe that the additional information is useful and meaningful to investors. Non - GAAP financial measures do not have any standardized meaning a nd are therefore unlikely to be comparable to similar measures presented by other companies. The presentation of non - GAAP financial measures is not intended to be a substitut e for, and should not be considered in isolation from, the financial measures reported in accordance with GAAP. See the appendix for the reconciliations of certain non - GAAP fina ncial measures to the comparable GAAP measures. This presentation also contains estimates and other information concerning our industry that are based on industry publicatio ns, surveys and forecasts. This information involves a number of assumptions and limitations, and we have not independently verified the accuracy or completeness of the information . August 7, 2019 2
Q2 2019 Earnings Call Agenda • Q2 2019 Highlights • Q2 2019 Financial Highlights • Guidance for 2019 and 2020 Targets • Q&A • Appendix – Non - GAAP Information August 7, 2019 3

Q2 2019 Highlights
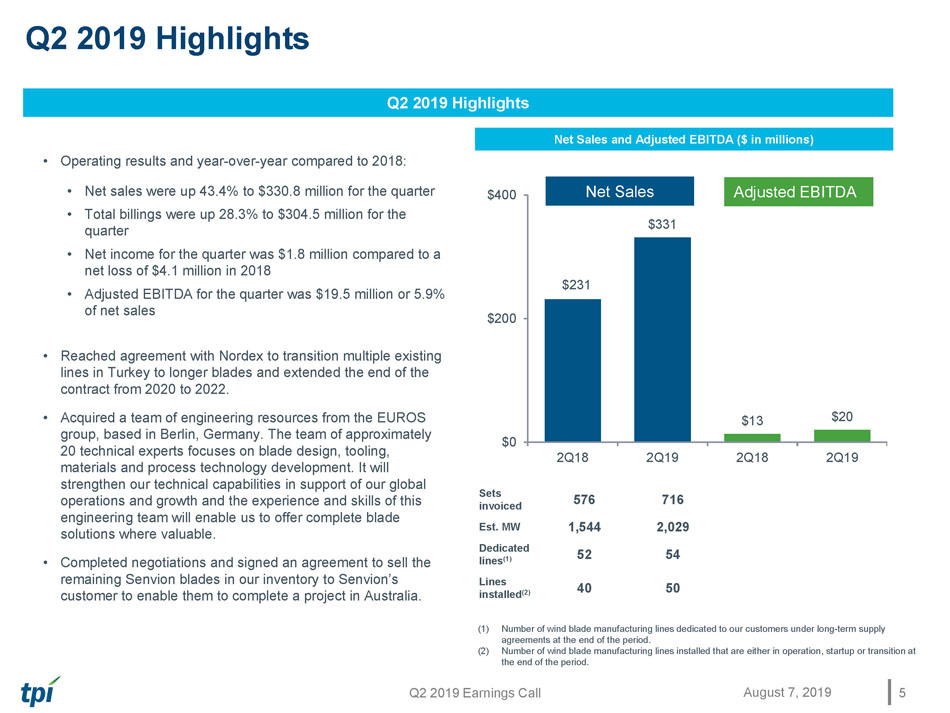
Q2 2019 Earnings Call Q2 2019 Highlights Q2 2019 Highlights • Operating results and year - over - year compared to 201 8: • Net sales were up 43.4% to $330.8 million for the quarter • Total billings were up 28.3% to $304.5 million for the quarter • N et income for the quarter was $ 1.8 million compared to a net loss of $4.1 million in 2018 • Adjusted EBITDA for the quarter was $19.5 million or 5.9% of net sales • Reached agreement with Nordex to transition multiple existing lines in Turkey to longer blades and extended the end of the contract from 2020 to 2022. • Acquired a team of engineering resources from the EUROS group, based in Berlin, Germany. The team of approximately 20 technical experts focuses on blade design, tooling, materials and process technology development. It will strengthen our technical capabilities in support of our global operations and growth and the experience and skills of this engineering team will enable us to offer complete blade solutions where valuable. • Completed negotiations and signed an agreement to sell the remaining Senvion blades in our inventory to Senvion’s customer to enable them to complete a project in Australia. Net Sales and Adjusted EBITDA ($ in millions) Sets invoiced 576 716 Est. MW 1,544 2,029 Dedicated lines (1) 52 54 Lines installed (2) 40 50 (1) Number of wind blade manufacturing lines dedicated to our customers under long - term supply agreement s at the end of the period. (2) Number of wind blade manufacturing lines installed that are either in operation, startup or transition at the end of the period. $231 $331 $13 $20 $0 $200 $400 2Q18 2Q19 2Q18 2Q19 Net Sales Adjusted EBITDA August 7, 2019 5
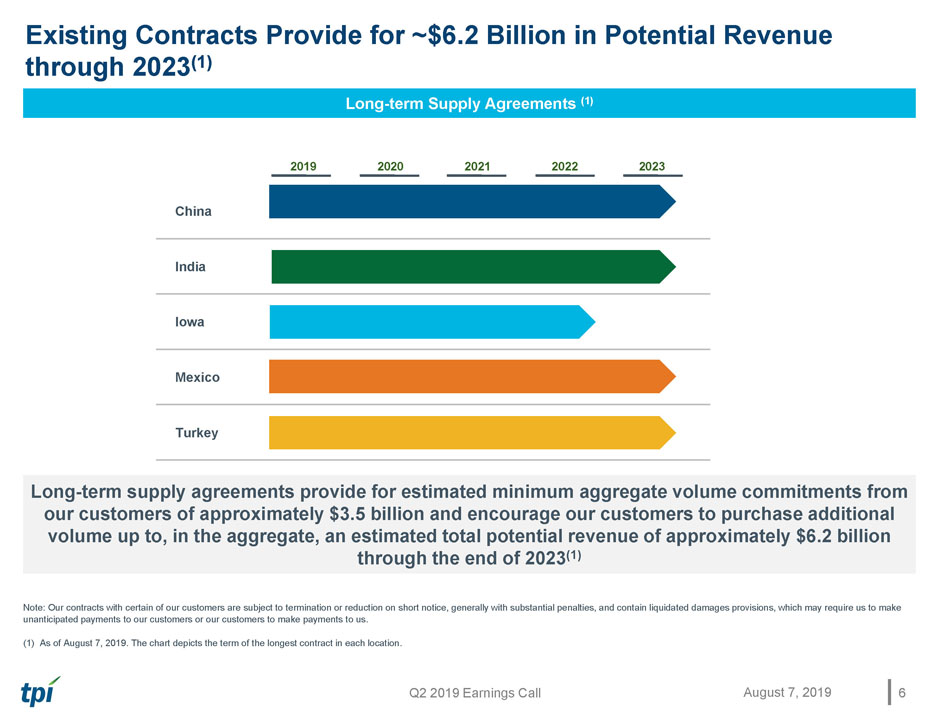
Q2 2019 Earnings Call Existing Contracts Provide for ~$6.2 Billion in Potential Revenue through 2023 (1) Long - term Supply Agreements (1) Long - term supply agreements provide for estimated minimum aggregate volume commitments from our customers of approximately $ 3.5 billion and encourage our customers to purchase additional volume up to, in the aggregate, an estimated total potential revenue of approximately $6.2 billion through the end of 2023 (1) Note: Our contracts with certain of our customers are subject to termination or reduction on short notice, generally with substantial penalties, and contain l iqu idated damages provisions, which may require us to make unanticipated payments to our customers or our customers to make payments to us. (1) As of August 7, 2019. The chart depicts the term of the longest contract in each location . 2019 2020 2021 2022 2023 China India Iowa Mexico Turkey August 7, 2019 6

Q2 2019 Financial Highlights
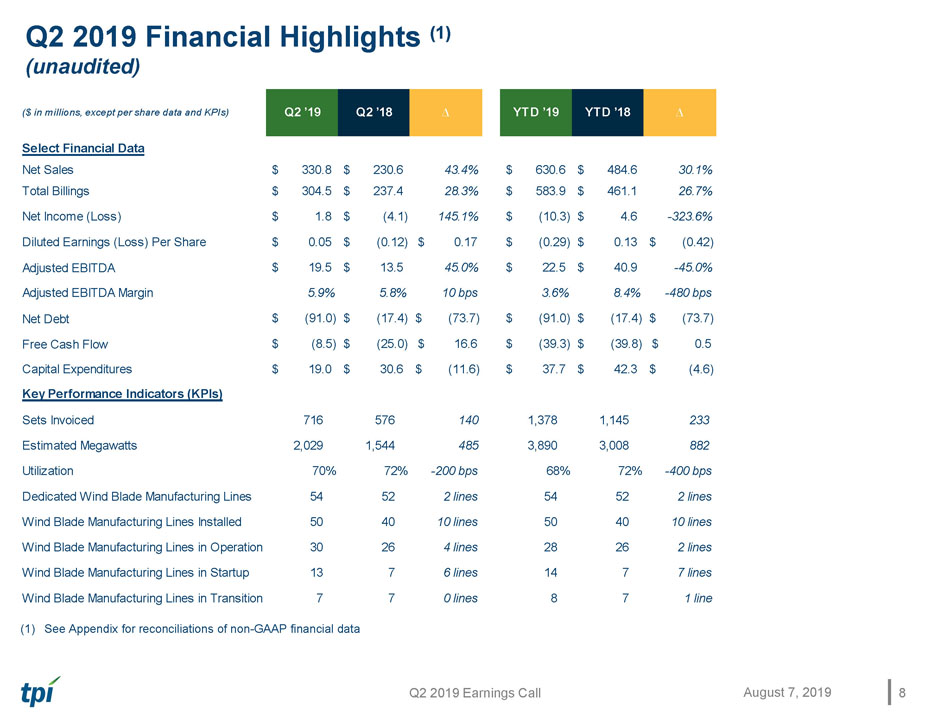
Q2 2019 Earnings Call ($ in millions, except per share data and KPIs) Q2 ’19 Q2 ’18 ∆ YTD ’19 YTD ’18 ∆ Select Financial Data Net Sales $ 330.8 $ 230.6 43.4% $ 630.6 $ 484.6 30.1% Total Billings $ 304.5 $ 237.4 28.3% $ 583.9 $ 461.1 26.7% Net Income (Loss) $ 1.8 $ (4.1) 145.1% $ (10.3) $ 4.6 -323.6% Diluted Earnings (Loss) Per Share $ 0.05 $ (0.12) $ 0.17 $ (0.29) $ 0.13 $ (0.42) Adjusted EBITDA (1) $ 19.5 $ 13.5 45.0% $ 22.5 $ 40.9 -45.0% Adjusted EBITDA Margin 5.9% 5.8% 10 bps 3.6% 8.4% -480 bps Net Debt (1) $ (91.0) $ (17.4) $ (73.7) $ (91.0) $ (17.4) $ (73.7) Free Cash Flow (1) $ (8.5) $ (25.0) $ 16.6 $ (39.3) $ (39.8) $ 0.5 Capital Expenditures $ 19.0 $ 30.6 $ (11.6) $ 37.7 $ 42.3 $ (4.6) Key Performance Indicators (KPIs) Sets Invoiced 716 576 140 1,378 1,145 233 Estimated Megawatts 2,029 1,544 485 3,890 3,008 882 Utilization 70% 72% -200 bps 68% 72% -400 bps Dedicated Wind Blade Manufacturing Lines 54 52 2 lines 54 52 2 lines Wind Blade Manufacturing Lines Installed 50 40 10 lines 50 40 10 lines Wind Blade Manufacturing Lines in Operation 30 26 4 lines 28 26 2 lines Wind Blade Manufacturing Lines in Startup 13 7 6 lines 14 7 7 lines Wind Blade Manufacturing Lines in Transition 7 7 0 lines 8 7 1 line Q2 2019 Financial Highlights (1) (unaudited) (1) See Appendix for reconciliations of non - GAAP financial data August 7, 2019 8
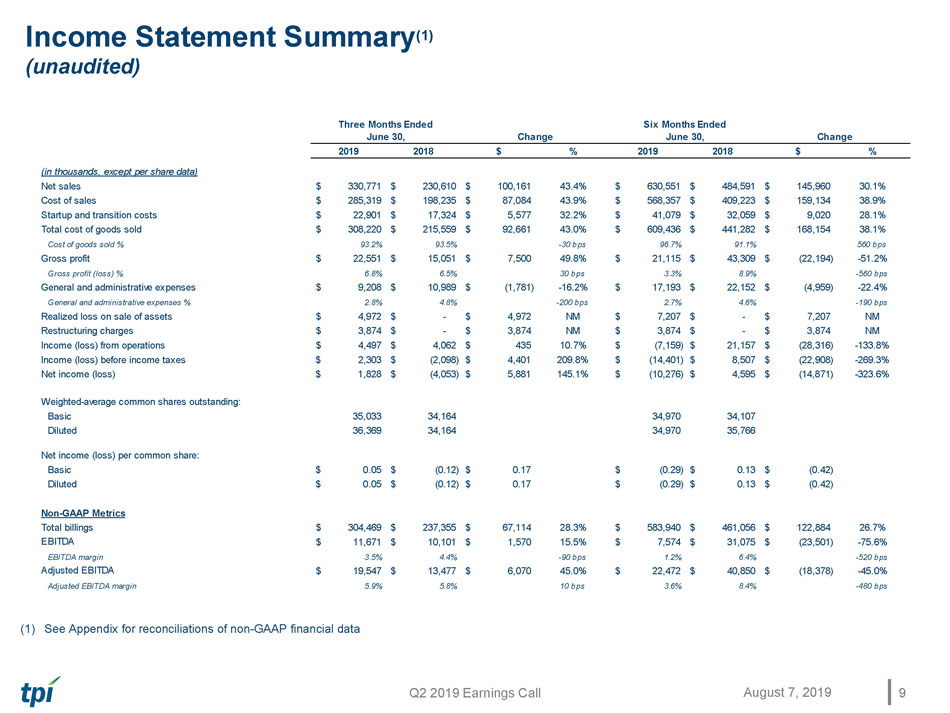
Q2 2019 Earnings Call Income Statement Summary (1) (unaudited) (1) See Appendix for reconciliations of non - GAAP financial data August 7, 2019 9 2019 2018 $ % 2019 2018 $ % (in thousands, except per share data) Net sales 330,771$ 230,610$ 100,161$ 43.4% 630,551$ 484,591$ 145,960$ 30.1% Cost of sales 285,319$ 198,235$ 87,084$ 43.9% 568,357$ 409,223$ 159,134$ 38.9% Startup and transition costs 22,901$ 17,324$ 5,577$ 32.2% 41,079$ 32,059$ 9,020$ 28.1% Total cost of goods sold 308,220$ 215,559$ 92,661$ 43.0% 609,436$ 441,282$ 168,154$ 38.1% Cost of goods sold % 93.2% 93.5% -30 bps 96.7% 91.1% 560 bps Gross profit 22,551$ 15,051$ 7,500$ 49.8% 21,115$ 43,309$ (22,194)$ -51.2% Gross profit (loss) % 6.8% 6.5% 30 bps 3.3% 8.9% -560 bps General and administrative expenses 9,208$ 10,989$ (1,781)$ -16.2% 17,193$ 22,152$ (4,959)$ -22.4% General and administrative expenses % 2.8% 4.8% -200 bps 2.7% 4.6% -190 bps Realized loss on sale of assets 4,972$ -$ 4,972$ NM 7,207$ -$ 7,207$ NM Restructuring charges 3,874$ -$ 3,874$ NM 3,874$ -$ 3,874$ NM Income (loss) from operations 4,497$ 4,062$ 435$ 10.7% (7,159)$ 21,157$ (28,316)$ -133.8% Income (loss) before income taxes 2,303$ (2,098)$ 4,401$ 209.8% (14,401)$ 8,507$ (22,908)$ -269.3% Net income (loss) 1,828$ (4,053)$ 5,881$ 145.1% (10,276)$ 4,595$ (14,871)$ -323.6% Weighted-average common shares outstanding: Basic 35,033 34,164 34,970 34,107 Diluted 36,369 34,164 34,970 35,766 Net income (loss) per common share: Basic 0.05$ (0.12)$ 0.17$ (0.29)$ 0.13$ (0.42)$ Diluted 0.05$ (0.12)$ 0.17$ (0.29)$ 0.13$ (0.42)$ Non-GAAP Metrics Total billings 304,469$ 237,355$ 67,114$ 28.3% 583,940$ 461,056$ 122,884$ 26.7% EBITDA (1) 11,671$ 10,101$ 1,570$ 15.5% 7,574$ 31,075$ (23,501)$ -75.6% EBITDA margin 3.5% 4.4% -90 bps 1.2% 6.4% -520 bps Adjusted EBITDA (1) 19,547$ 13,477$ 6,070$ 45.0% 22,472$ 40,850$ (18,378)$ -45.0% Adjusted EBITDA margin 5.9% 5.8% 10 bps 3.6% 8.4% -480 bps Three Months Ended June 30, Change Six Months Ended June 30, Change
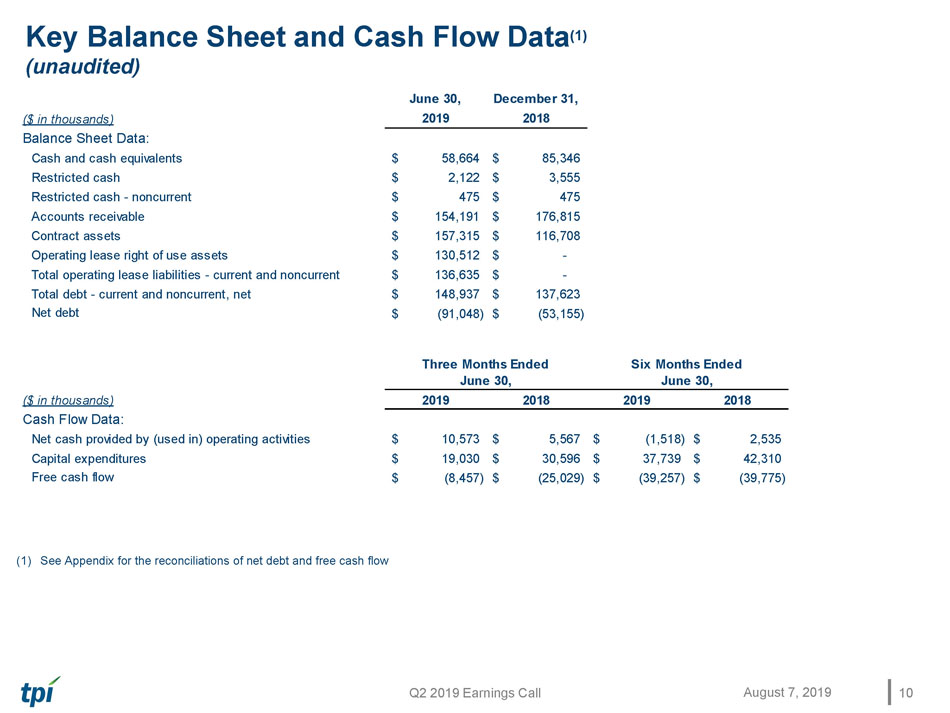
Q2 2019 Earnings Call Key Balance Sheet and Cash Flow Data (1) (unaudited) (1) See Appendix for the reconciliation s of net debt and free cash flow August 7, 2019 10 June 30, December 31, ($ in thousands) 2019 2018 Balance Sheet Data: Cash and cash equivalents 58,664$ 85,346$ Restricted cash 2,122$ 3,555$ Restricted cash - noncurrent 475$ 475$ Accounts receivable 154,191$ 176,815$ Contract assets 157,315$ 116,708$ Operating lease right of use assets 130,512$ -$ Total operating lease liabilities - current and noncurrent 136,635$ -$ Total debt - current and noncurrent, net 148,937$ 137,623$ Net debt (1) (91,048)$ (53,155)$ ($ in thousands) 2019 2018 2019 2018 Cash Flow Data: Net cash provided by (used in) operating activities 10,573$ 5,567$ (1,518)$ 2,535$ Capital expenditures 19,030$ 30,596$ 37,739$ 42,310$ Free cash flow (1) (8,457)$ (25,029)$ (39,257)$ (39,775)$ Three Months Ended June 30, Six Months Ended June 30,
Guidance for 2019 and Targets for 2020
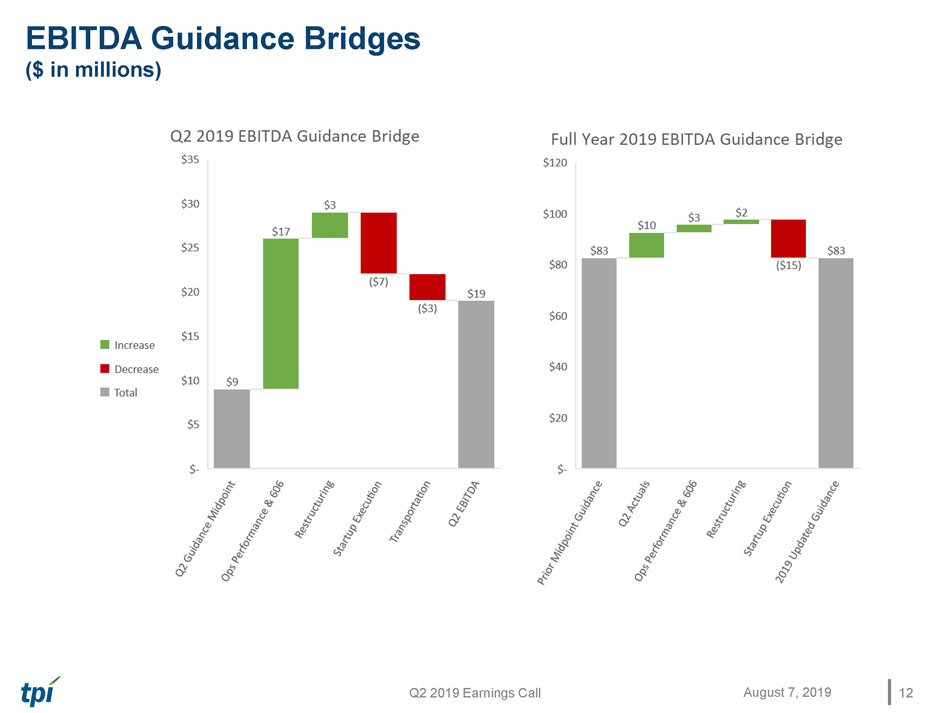
Q2 2019 Earnings Call EBITDA Guidance Bridges ($ in millions) 12 August 7, 2019
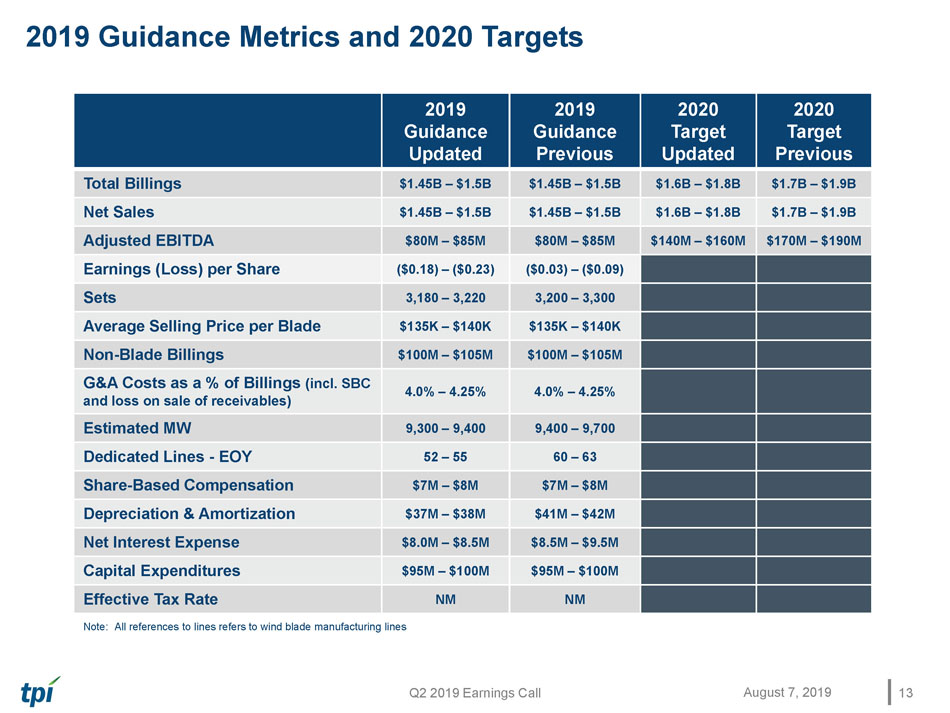
Q2 2019 Earnings Call 2019 Guidance Metrics and 2020 Targets Note: All references to lines refers to wind blade manufacturing lines 2019 Guidance Updated 2019 Guidance Previous 2020 Target Updated 2020 Target Previous Total Billings $1.45B – $1.5B $1.45B – $1.5B $1.6B – $1.8B $1.7B – $1.9B Net Sales $1.45B – $1.5B $1.45B – $1.5B $1.6B – $1.8B $1.7B – $1.9B Adjusted EBITDA $80M – $85M $80M – $85M $140M – $160M $170M – $190M Earnings (Loss) per Share ($0.18) – ($0.23) ($0.03) – ($0.09) Sets 3,180 – 3,220 3,200 – 3,300 Average Selling Price per Blade $135K – $140K $135K – $140K Non - Blade Billings $100M – $105M $100M – $105M G&A Costs as a % of Billings (incl. SBC and loss on sale of receivables) 4.0% – 4.25% 4.0% – 4.25% Estimated MW 9,300 – 9,400 9,400 – 9,700 Dedicated Lines - EOY 52 – 55 60 – 63 Share - Based Compensation $7M – $8M $7M – $8M Depreciation & Amortization $37M – $38M $41M – $42M Net Interest Expense $8.0M – $8.5M $8.5M – $9.5M Capital Expenditures $95M – $100M $95M – $100M Effective Tax Rate NM NM August 7, 2019 13
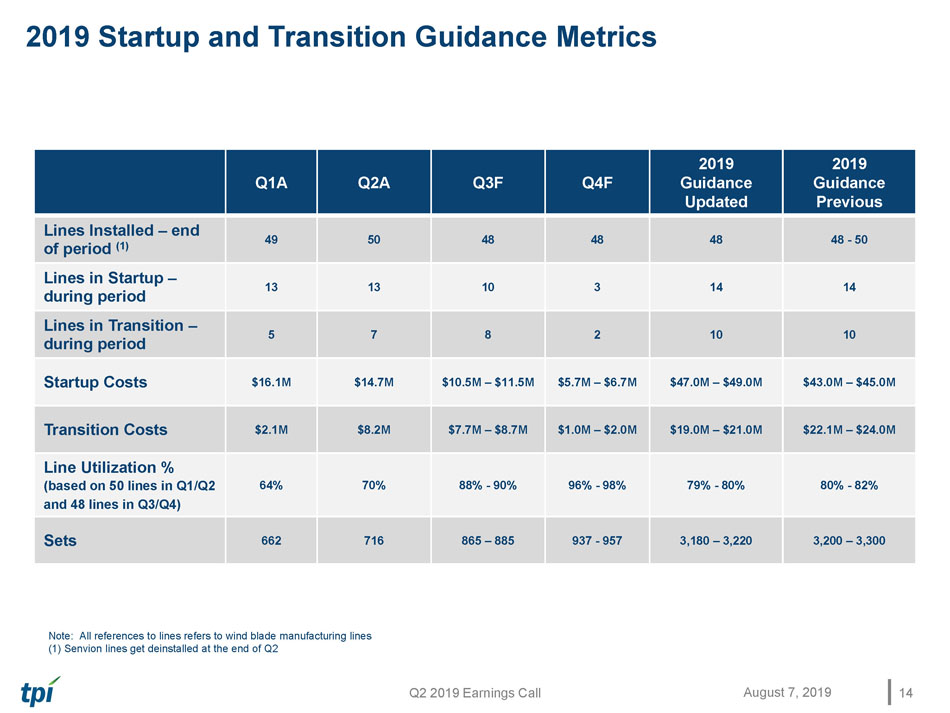
Q2 2019 Earnings Call 2019 Startup and Transition Guidance Metrics Q1A Q2A Q3F Q4F 2019 Guidance Updated 2019 Guidance Previous Lines Installed – end of period (1) 49 50 48 48 48 48 - 50 Lines in Startup – during period 13 13 10 3 14 14 Lines in Transition – during period 5 7 8 2 10 10 Startup Costs $16.1M $14.7M $10.5M – $11.5M $5.7M – $6.7M $47.0M – $49.0M $43.0M – $45.0M Transition Costs $2.1M $8.2M $7.7M – $8.7M $1.0M – $2.0M $19.0M – $21.0M $22.1M – $24.0M Line Utilization % (based on 50 lines in Q1/Q2 and 48 lines in Q3/Q4) 64% 70% 88% - 90% 96% - 98% 79% - 80% 80% - 82% Sets 662 716 865 – 885 937 - 957 3,180 – 3,220 3,200 – 3,300 Note: All references to lines refers to wind blade manufacturing lines (1) Senvion lines get deinstalled at the end of Q2 August 7, 2019 14

Q&A
Appendix – Non - GAAP Information This presentation includes unaudited non - GAAP financial measures including total billings, EBITDA, adjusted EBITDA, net cash (de bt) and free cash flow. We define total billings as the total amounts we have invoiced our customers for products and services fo r w hich we are entitled to payment under the terms of our long - term supply agreements or other contractual agreements. We define EBITDA as net income (loss) plus interest expense (including losses on the extinguishment of debt and net of interest income), income taxes an d depreciation and amortization. We define Adjusted EBITDA as EBITDA plus any share - based compensation expense, plus or minus any gains or losses from foreign currency remeasurement and any gains or losses on the sale of assets. We define net cash (de bt) as the total principal amount of debt outstanding less unrestricted cash and cash equivalents. We define free cash flow as net c ash flow generated from operating activities less capital expenditures. We present non - GAAP measures when we believe that the additional information is useful and meaningful to investors. Non - GAAP financial measures do not have any standardized meaning and are therefore unlikely to be comparable to similar measures presented by other companies. The presentation of non - GAAP financial measures is not intended to be a substitute for, and should not be considered in isolation from, the financial measures repor ted in accordance with GAAP. See below for a reconciliation of certain non - GAAP financial measures to the comparable GAAP measures.
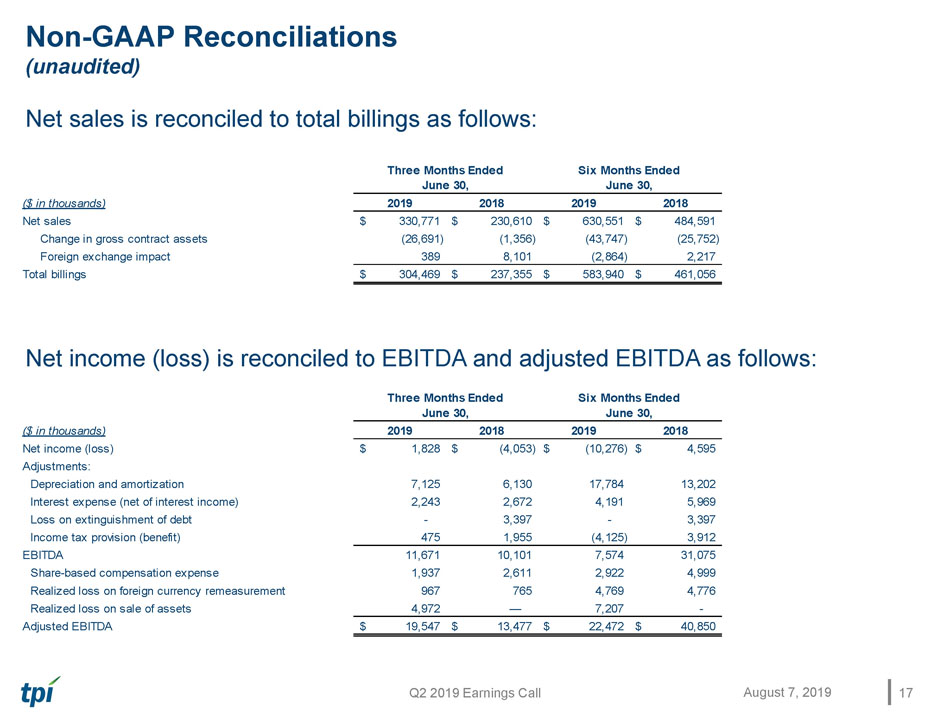
Q2 2019 Earnings Call Non - GAAP Reconciliations (unaudited) Net sales is reconciled to total billings as follows: Net income (loss) is reconciled to EBITDA and adjusted EBITDA as follows: August 7, 2019 17 ($ in thousands) 2019 2018 2019 2018 Net income (loss) 1,828$ (4,053)$ (10,276)$ 4,595$ Adjustments: Depreciation and amortization 7,125 6,130 17,784 13,202 Interest expense (net of interest income) 2,243 2,672 4,191 5,969 Loss on extinguishment of debt - 3,397 - 3,397 Income tax provision (benefit) 475 1,955 (4,125) 3,912 EBITDA 11,671 10,101 7,574 31,075 Share-based compensation expense 1,937 2,611 2,922 4,999 Realized loss on foreign currency remeasurement 967 765 4,769 4,776 Realized loss on sale of assets 4,972 — 7,207 - Adjusted EBITDA 19,547$ 13,477$ 22,472$ 40,850$ Three Months Ended June 30, Six Months Ended June 30, ($ in thousands) 2019 2018 2019 2018 Net sales 330,771$ 230,610$ 630,551$ 484,591$ Change in gross contract assets (26,691) (1,356) (43,747) (25,752) Foreign exchange impact 389 8,101 (2,864) 2,217 Total billings 304,469$ 237,355$ 583,940$ 461,056$ Three Months Ended June 30, Six Months Ended June 30,
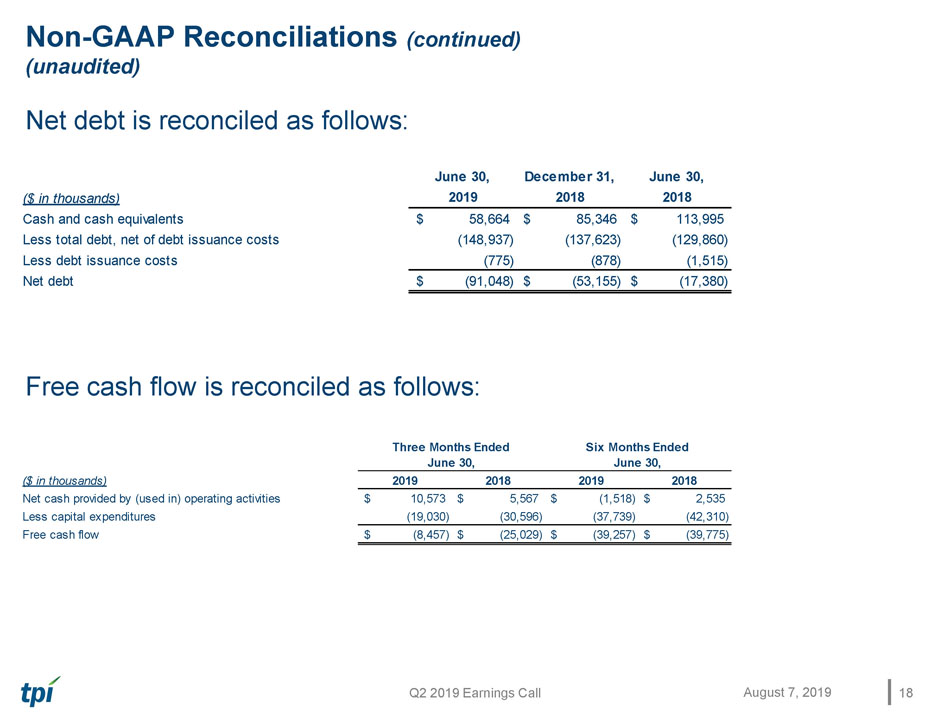
Q2 2019 Earnings Call Non - GAAP Reconciliations (continued) (unaudited) Net debt is reconciled as follows: Free cash flow is reconciled as follows: August 7, 2019 18 June 30, December 31, June 30, ($ in thousands) 2019 2018 2018 Cash and cash equivalents 58,664$ 85,346$ 113,995$ Less total debt, net of debt issuance costs (148,937) (137,623) (129,860) Less debt issuance costs (775) (878) (1,515) Net debt (91,048)$ (53,155)$ (17,380)$ ($ in thousands) 2019 2018 2019 2018 Net cash provided by (used in) operating activities 10,573$ 5,567$ (1,518)$ 2,535$ Less capital expenditures (19,030) (30,596) (37,739) (42,310) Free cash flow (8,457)$ (25,029)$ (39,257)$ (39,775)$ Six Months Ended June 30, Three Months Ended June 30,
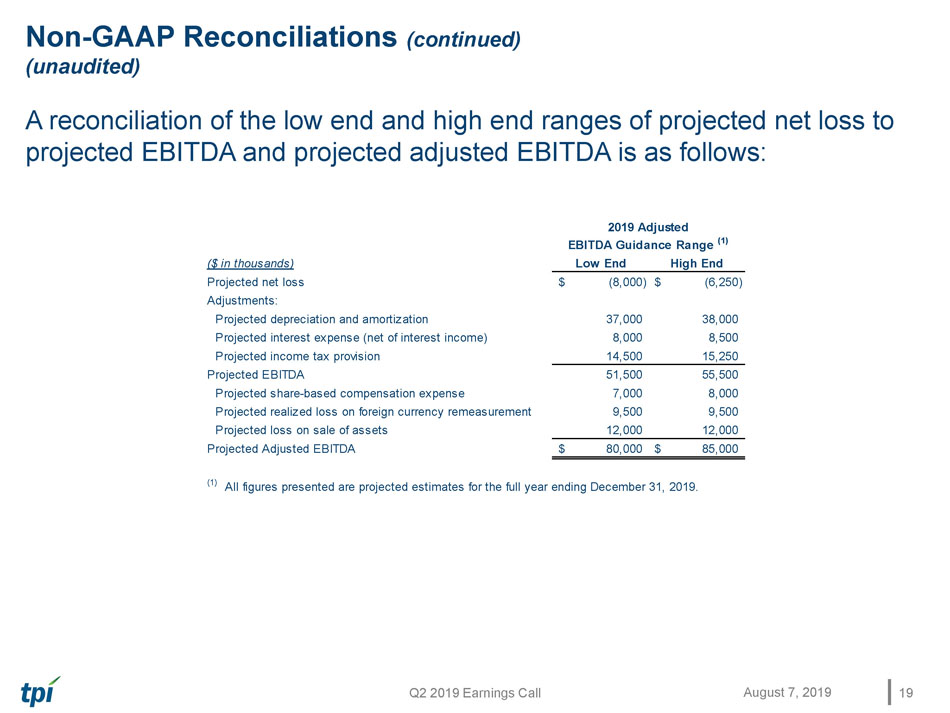
Q2 2019 Earnings Call Non - GAAP Reconciliations (continued) (unaudited) A reconciliation of the low end and high end ranges of projected net loss to projected EBITDA and projected adjusted EBITDA is as follows: August 7, 2019 19 ($ in thousands) Low End High End Projected net loss (8,000)$ (6,250)$ Adjustments: Projected depreciation and amortization 37,000 38,000 Projected interest expense (net of interest income) 8,000 8,500 Projected income tax provision 14,500 15,250 Projected EBITDA 51,500 55,500 Projected share-based compensation expense 7,000 8,000 Projected realized loss on foreign currency remeasurement 9,500 9,500 Projected loss on sale of assets 12,000 12,000 Projected Adjusted EBITDA 80,000$ 85,000$ (1) All figures presented are projected estimates for the full year ending December 31, 2019. 2019 Adjusted EBITDA Guidance Range (1)