EXHIBIT 99.2
Q4 2020 Earnings Call February 25, 2021

Q4 2020 Earnings Call February 25, 2021 Legal Disclaimer This presentation contains forward - looking statements within the meaning of the federal securities law. All statements other tha n statements of historical facts contained in this presentation, including statements regarding our future results of operations and financial position, business strategy and plans and objectives of m ana gement for future operations, are forward - looking statements. In many cases, you can identify forward - looking statements by terms such as “may,” “should,” “expects,” “plans,” “anticipates,” “could,” “inten ds,” “target,” “projects,” “contemplates,” “believes,” “estimates,” “predicts,” “potential” or “continue” or the negative of these terms or other similar words. Forward - looking statements contained in this pr esentation include, but are not limited to, statements about: (i) the potential impact of the COVID - 19 pandemic on our business and results of operations; (ii) competition from other wind blade and wind blade turbine manufacturers; (iii) the discovery of defects in our products and our ability to estimate the future cost of warranty campaigns; (iv) growth of the wind energy market and our addressable market; (v) the potential impact of the increasing prevalence of auction - based tenders in the wind energy market and increased competition from solar energy on our gross margins and overall financial performance; (v i) our future financial performance, including our net sales, cost of goods sold, gross profit or gross margin, operating expenses, ability to generate positive cash flow, and ability to achieve or maintain pro fitability; (vii) changes in domestic or international government or regulatory policy, including without limitation, changes in trade policy; (viii) the sufficiency of our cash and cash equivalents to meet our li qui dity needs; (ix) our ability to attract and retain customers for our products, and to optimize product pricing; (x) our ability to effectively manage our growth strategy and future expenses, including our startu p a nd transition costs; (xi) our ability to successfully expand in our existing wind energy markets and into new international wind energy markets, including our ability to expand our field service inspection a nd repair services business and manufacture wind blades for offshore wind energy projects; (xii) our ability to successfully open new manufacturing facilities and expand existing facilities on time and on b udg et; (xiii) the impact of the accelerated pace of new product and wind blade model introductions on our business and our results of operations; (xiv) our ability to successfully expand our transportation busi nes s and execute upon our strategy of entering new markets outside of wind energy; (xv) worldwide economic conditions and their impact on customer demand; (xvi) our ability to maintain, protect and enhance ou r i ntellectual property; (xvii) our ability to comply with existing, modified or new laws and regulations applying to our business, including the imposition of new taxes, duties or similar assessments on our pr odu cts; (xviii) the attraction and retention of qualified employees and key personnel; (xix) our ability to maintain good working relationships with our employees, and avoid labor disruptions, strikes and other disputes with labor unions that represent certain of our employees; (xx) our ability to procure adequate supplies of raw materials and components to fulfill our wind blade volume commitments to our cust ome rs; and (xxi) the potential impact of one or more of our customers becoming bankrupt or insolvent, or experiencing other financial problems. These forward - looking statements are only predictions. These statements relate to future events or our future financial performa nce and involve known and unknown risks, uncertainties and other important factors that may cause our actual results, levels of activity, performance or achievements to materially differ from any futu re results, levels of activity, performance or achievements expressed or implied by these forward - looking statements. Because forward - looking statements are inherently subject to risks and uncertainties, some of which cannot be predicted or quantified, you should not rely on these forward - looking statements as guarantees of future events. Further information on the factors, risks and uncertainties that could aff ect our financial results and the forward - looking statements in this presentation are included in our filings with the Securities and Exchange Commission and will be included in subsequent periodic and current r epo rts we make with the Securities and Exchange Commission from time to time, including in our Annual Report on Form 10 - K for the year ended December 31, 2020. The forward - looking statements in this presentation represent our views as of the date of this presentation. We anticipate that subsequent events and developments will cause our views to change. However, while we may elect to update these forward - looking statements at some point in the future, we undertake no obligation to update any forward - looking statement to reflect events or developments after the date on which the statement is made or to reflect the occurrence of unanticipated events except to the extent required by applicab le law. You should, therefore, not rely on these forward - looking statements as representing our views as of any date after the date of this presentation. Our forward - looking statements do not reflect the pot ential impact of any future acquisitions, mergers, dispositions, joint ventures, or investments we may make. This presentation includes unaudited non - GAAP financial measures including EBITDA, adjusted EBITDA, net cash (debt) and free cas h flow. We define EBITDA as net income (loss) plus interest expense (including losses on the extinguishment of debt and net of interest income), income taxes and depreciation and amortization. We define Adjusted EBITDA as EBITDA plus any share - based compensation expense, any foreign currency income or losses, any gains or losses on the sale of assets and asset impairments and any restructuring charges. We define net c ash (debt) as total unrestricted cash and cash equivalents less the total principal amount of debt outstanding. We define free cash flow as net cash flow from operating activities less capital expenditures. We present non - GAAP measures when we believe that the additional information is useful and meaningful to investors. Non - GAAP financial measures do not have any standardized meaning and are therefore unlikely to be comparable to similar measures presented by other companies. The presentation of non - GAAP financial measures is not intended to be a substitute for, and should not be considered in isolation from, the financial measures reported in accordance with GAAP. See the Appendix for the reconciliations of certain non - GAAP financial measures to the comparable GAAP mea sures. This presentation also contains estimates and other information concerning our industry that are based on industry publicatio ns, surveys and forecasts. This information involves a number of assumptions and limitations, and we have not independently verified the accuracy or completeness of the information. 2
Q4 2020 Earnings Call February 25, 2021 Agenda 3 • Full Year 2020 Highlights • Q4 and Full Year 2020 Financial Highlights and 2021 Guidance • Wrap Up • Q&A • Appendix – Non - GAAP Financial Information
February 25, 2021 Full Year 2020 Highlights

Q4 2020 Earnings Call February 25, 2021 • Operating results and year - over - year comparisons to 2019: – Net sales were up 16.3% to $1.67 billion for the year – Net loss for the year was $19.0 million compared to a net loss of $15.7 million – Adjusted EBITDA for the year was $94.5 million or 5.7% of net sales • Double digit growth in both net sales and Adjusted EBITDA notwithstanding the disruption and impact of COVID - 19 • Started blade production at our Chennai, India facility and signed a multi - year agreement with Nordex for India production • We extended contracts with GE and Vestas, and in the fourth quarter we extended a contract with Nordex in Turkey • Continued progress on commercial delivery vehicles and produced parts for multiple passenger EV platforms • Continued to refresh our Board of Directors adding global operations and finance experience, independence, and diversity • Published our first ESG report Full Year 2020 Highlights 5 Net Sales and Adjusted EBITDA ($ in millions) Est. MW 9,598 12,080 $1,437 $1,670 $1,000 $1,250 $1,500 $1,750 2019 2020 Net Sales $86 $94 $50 $75 $100 2019 2020 Adjusted EBITDA

Q4 2020 Earnings Call February 25, 2021 • Global Operations Update • Global Service • Transportation • Supply Chain Business Update 6
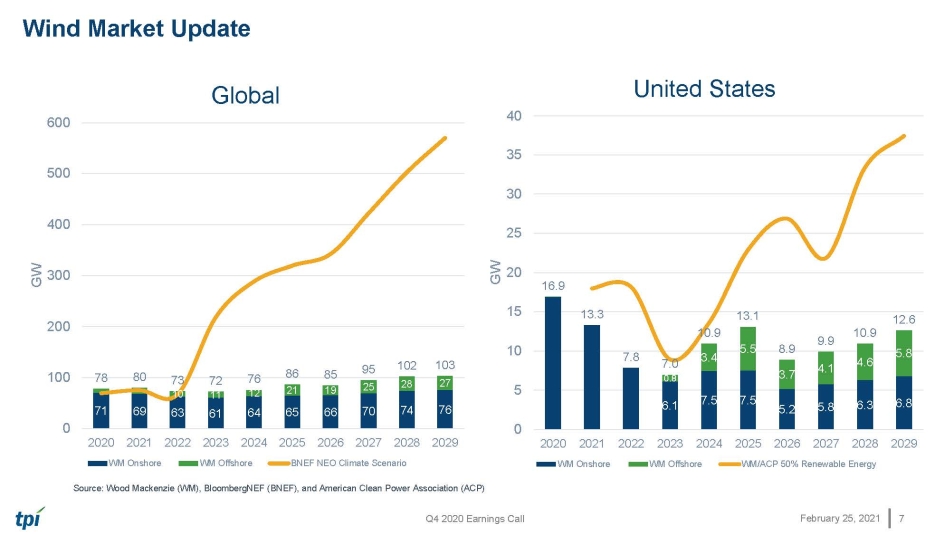
Q4 2020 Earnings Call February 25, 2021 Wind Market Update 7 Source: Wood Mackenzie (WM), BloombergNEF (BNEF), and American Clean Power Association (ACP) 6.1 7.5 7.5 5.2 5.8 6.3 6.8 0.8 3.4 5.5 3.7 4.1 4.6 5.8 16.9 13.3 7.8 7.0 10.9 13.1 8.9 9.9 10.9 12.6 0 5 10 15 20 25 30 35 40 2020 2021 2022 2023 2024 2025 2026 2027 2028 2029 GW United States WM Onshore WM Offshore WM/ACP 50% Renewable Energy 71 69 63 61 64 65 66 70 74 76 10 11 12 21 19 25 28 27 78 80 73 72 76 86 85 95 102 103 0 100 200 300 400 500 600 2020 2021 2022 2023 2024 2025 2026 2027 2028 2029 GW Global WM Onshore WM Offshore BNEF NEO Climate Scenario
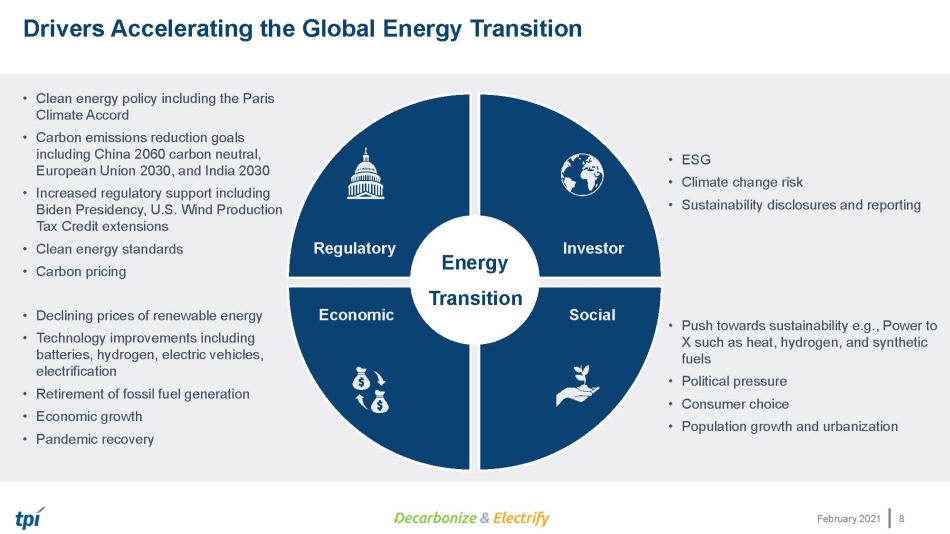
February 2021 Drivers Accelerating the Global Energy Transition 8 • Clean energy policy including the Paris Climate Accord • Carbon emissions reduction goals including China 2060 carbon neutral, European Union 2030, and India 2030 • Increased regulatory support including Biden Presidency, U.S. Wind Production Tax Credit extensions • Clean energy standards • Carbon pricing • Declining prices of renewable energy • Technology improvements including batteries, hydrogen, electric vehicles, electrification • Retirement of fossil fuel generation • Economic growth • Pandemic recovery • ESG • Climate change risk • Sustainability disclosures and reporting • Push towards sustainability e.g., Power to X such as heat, hydrogen, and synthetic fuels • Political pressure • Consumer choice • Population growth and urbanization Energy Transition Investor Social Regulatory Economic
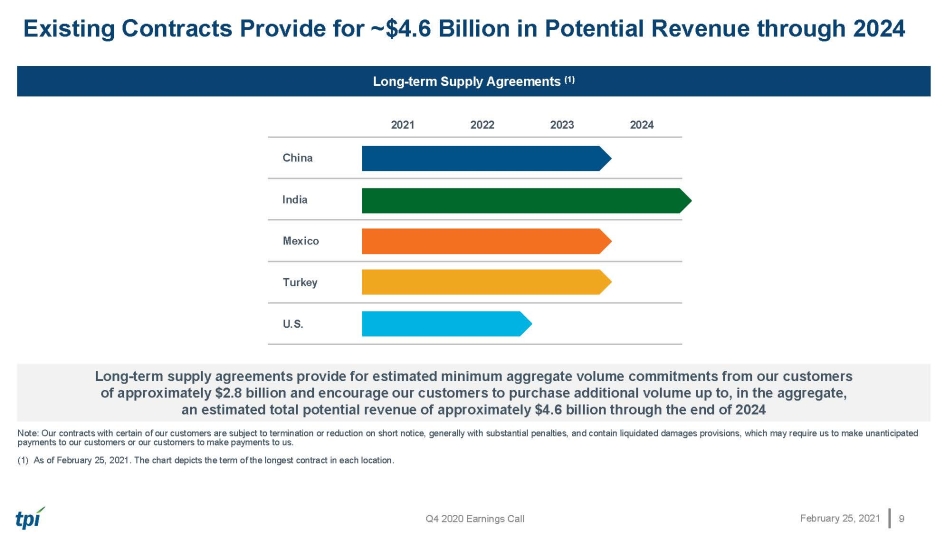
Q4 2020 Earnings Call February 25, 2021 Existing Contracts Provide for ~$4.6 Billion in Potential Revenue through 2024 9 Long - term Supply Agreements (1) Long - term supply agreements provide for estimated minimum aggregate volume commitments from our customers of approximately $ 2.8 billion and encourage our customers to purchase additional volume up to, in the aggregate, an e stimated total potential revenue of approximately $4.6 billion through the end of 202 4 Note: Our contracts with certain of our customers are subject to termination or reduction on short notice, generally with substantial penalties, and contain l iqu idated damages provisions, which may require us to make unanticipated payments to our customers or our customers to make payments to us. (1) As of February 25, 2021. The chart depicts the term of the longest contract in each location . 2021 2022 2023 2024 China India Mexico Turkey U.S.
February 25, 2021 Q4 and Full Year 2020 Financial Highlights and 2021 Guidance
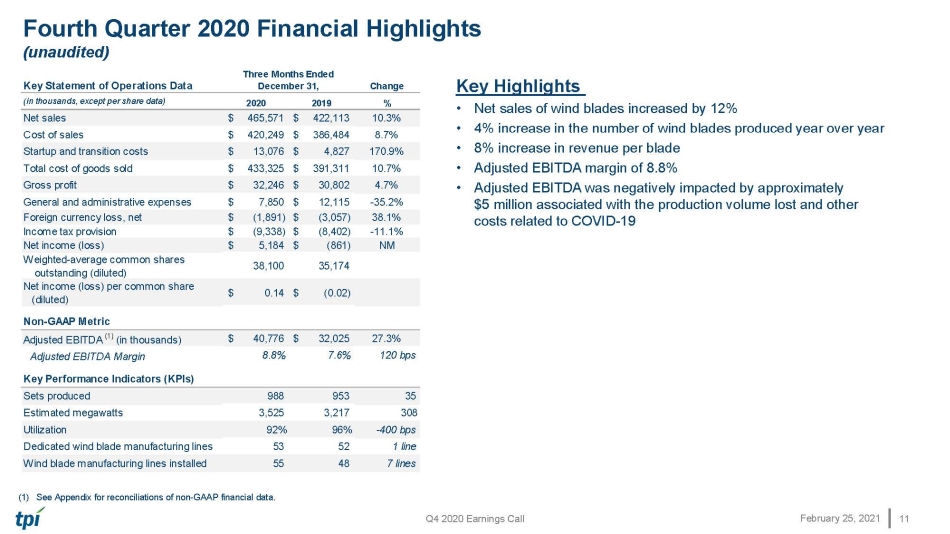
Q4 2020 Earnings Call February 25, 2021 Fourth Quarter 2020 Financial Highlights (unaudited) 11 Key Highlights • Net sales of wind blades increased by 12% • 4% increase in the number of wind blades produced year over year • 8% increase in revenue per blade • Adjusted EBITDA margin of 8.8% • Adjusted EBITDA was negatively impacted by approximately $5 million associated with the production volume lost and other costs related to COVID - 19 (1) See Appendix for reconciliations of non - GAAP financial data. Key Statement of Operations Data Change (in thousands, except per share data) 2020 2019 % Net sales $ 465,571 $ 422,113 10.3% Cost of sales $ 420,249 $ 386,484 8.7% Startup and transition costs $ 13,076 $ 4,827 170.9% Total cost of goods sold $ 433,325 $ 391,311 10.7% Gross profit $ 32,246 $ 30,802 4.7% General and administrative expenses $ 7,850 $ 12,115 -35.2% Foreign currency loss, net $ (1,891) $ (3,057) 38.1% Income tax provision $ (9,338) $ (8,402) -11.1% Net income (loss) $ 5,184 $ (861) NM Weighted-average common shares outstanding (diluted) 38,100 35,174 Net income (loss) per common share (diluted) $ 0.14 $ (0.02) Non-GAAP Metric Adjusted EBITDA (1) (in thousands) $ 40,776 $ 32,025 27.3% Adjusted EBITDA Margin 8.8% 7.6% 120 bps Key Performance Indicators (KPIs) Sets produced 988 953 35 Estimated megawatts 3,525 3,217 308 Utilization 92% 96% -400 bps Dedicated wind blade manufacturing lines 53 52 1 line Wind blade manufacturing lines installed 55 48 7 lines Three Months Ended December 31,

Q4 2020 Earnings Call February 25, 2021 Full Year 2020 Financial Highlights (unaudited) 12 Key Highlights • Net sales of wind blades increased by 18.9% • 11% increase in the number of wind blades produced year over year • 26% increase in estimated megawatts produced • Foreign currency loss of $20 million primarily due to net Euro liability exposure against the Turkish Lira • 10.1% increase in Adjusted EBITDA in a year that was significantly impacted by COVID - 19 (1) See Appendix for reconciliations of non - GAAP financial data. Key Statement of Operations Data Change (in thousands, except per share data) 2020 2019 % Net sales $ 1,670,137 $ 1,436,500 16.3% Cost of sales $ 1,561,432 $ 1,290,619 21.0% Startup and transition costs $ 44,606 $ 68,033 -34.4% Total cost of goods sold $ 1,606,038 $ 1,358,652 18.2% Gross profit $ 64,099 $ 77,848 -17.7% General and administrative expenses $ 33,496 $ 39,916 -16.1% Foreign currency loss, net $ (19,986) $ (4,107) NM Income tax provision $ (11,284) $ (23,115) 51.2% Net income (loss) $ (19,027) $ (15,708) -21.1% Weighted-average common shares outstanding (diluted) 35,532 35,062 Net income (loss) per common share (diluted) $ (0.54) $ (0.45) Non-GAAP Metric Adjusted EBITDA (1) (in thousands) $ 94,498 $ 85,841 10.1% Adjusted EBITDA Margin 5.7% 6.0% -30 bps Key Performance Indicators (KPIs) Sets produced 3,544 3,189 355 Estimated megawatts 12,080 9,598 2,482 Utilization 81% 79% 200 bps Dedicated wind blade manufacturing lines 53 52 1 line Wind blade manufacturing lines installed 55 48 7 lines Year Ended December 31,

Q4 2020 Earnings Call February 25, 2021 Key Balance Sheet and Cash Flow Data (unaudited) 13 Key Highlights • Strong cash position • Significant cushion on debt covenants • Continued focus on cash conversion cycle • Minimal net debt increase in a year that was significantly impacted by COVID - 19 and we invested $65.7 million in capital expenditures (1) See Appendix for reconciliations of non - GAAP financial data. Key Balance Sheet Data (in thousands) 2020 2019 Cash and cash equivalents $ 129,857 $ 70,282 Accounts receivable $ 132,768 $ 184,012 Contract assets $ 216,928 $ 166,515 Operating lease right of use assets $ 158,827 $ 122,351 Total operating lease liabilities - current and noncurrent $ 182,024 $ 130,512 Accounts payable and accrued expenses $ 295,992 $ 293,104 Total debt - current and noncurrent, net $ 216,867 $ 141,389 Net debt (1) $ (88,061) $ (71,779) Key Cash Flow Data (in thousands) 2020 2019 Net cash provided by operating activities $ 37,570 $ 57,084 Capital expenditures $ 65,666 $ 74,408 Free cash flow (1) $ (28,096) $ (17,324) Year Ended December 31, December 31,

Q4 2020 Earnings Call February 25, 2021 2021 Guidance (1) 14 (1) These numbers could be significantly impacted by COVID - 19. (2) See Appendix for reconciliations of non - GAAP financial data. 2021 Guidance Net Sales $1.75 billion to $1.85 billion Adjusted EBITDA (2) $110 million to $135 million Dedicated Manufacturing Lines 50 Utilization % 80% to 85% Wind Blade Set Capacity 4,090 Average Selling Price per Blade $160,000 to $165,000 Non - Blade Sales $100 million to $125 million Capital Expenditures $55 million to $65 million Startup Costs $8 million to $11 million

Q4 2020 Earnings Call February 25, 2021 (1) 2021 amounts reflects guidance at the midpoint. (2) Margin as percent of net sales. (3) See Appendix for reconciliations of the non - GAAP financial data. Adjusted EBITDA Walk 2020 to 2021 (1)(2)(3) 15 5.7% margin 6.8% margin 5.7% margin 6.8% margin

February 25, 2021 Wrap Up
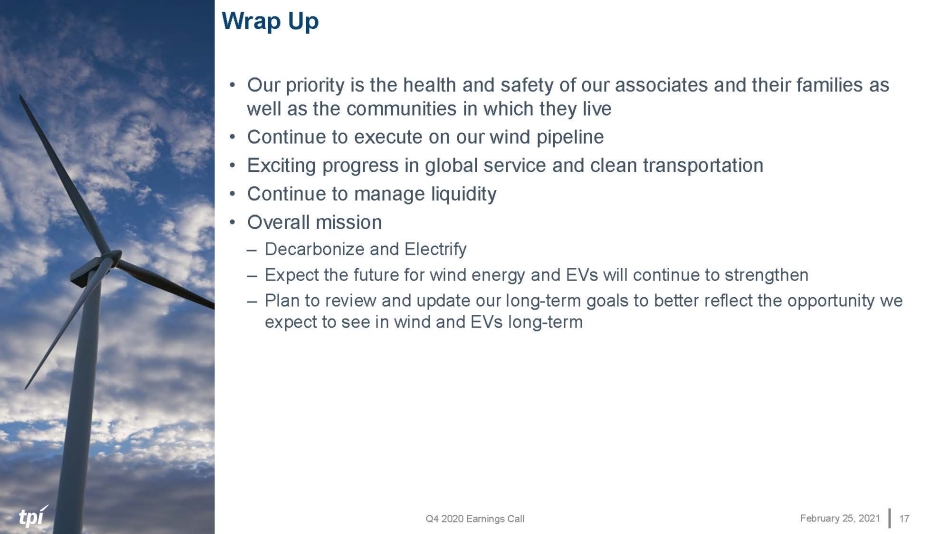
Q4 2020 Earnings Call February 25, 2021 Wrap Up 17 • Our priority is the health and safety of our associates and their families as well as the communities in which they live • Continue to execute on our wind pipeline • Exciting progress in global service and clean transportation • Continue to manage liquidity • Overall mission – Decarbonize and Electrify – Expect the future for wind energy and EVs will continue to strengthen – Plan to review and update our long - term goals to better reflect the opportunity we expect to see in wind and EVs long - term
February 25, 2021 Q&A

February 25, 2021 Appendix – Non - GAAP Financial Information This presentation includes unaudited non - GAAP financial measures including EBITDA, adjusted EBITDA, net cash (debt) and free cash flow. We define EBITDA as net income (loss) plus interest expense (including losses on the extinguishment of debt and net of interest income), income taxes and depreciation and amortization. We define Adjusted EBITDA as EBITDA plus any share - based compensation expense, any foreign currency income or losses, any gains or losses on the sale of assets and asset impairments and any restructuring charges. We define net cash (debt) as total unrestricted cash and cash equivalents less the total principal amount of debt outstanding. We define free cash flow as net cash flow from operating activities less capital expenditures. We present non - GAAP measures when we believe that the additional information is useful and meaningful to investors. Non - GAAP financial measures do not have any standardized meaning and are therefore unlikely to be comparable to similar measures presented by other companies. The presentation of non - GAAP financial measures is not intended to be a substitute for, and should not be considered in isolation from, the financial measures reported in accordance with GAAP. See below for a reconciliation of certain non - GAAP financial measures to the comparable GAAP measures.

Q4 2020 Earnings Call February 25, 2021 (in thousands) 2020 2019 2020 2019 Net income (loss) 5,184$ (861)$ (19,027)$ (15,708)$ Adjustments: Depreciation and amortization 12,992 10,848 49,667 38,580 Interest expense (net of interest income) 2,990 1,744 10,399 8,022 Income tax provision 9,338 8,402 11,284 23,115 EBITDA 30,504 20,133 52,323 54,009 Share-based compensation expense 2,405 1,077 10,352 5,681 Foreign currency loss, net 1,891 3,057 19,986 4,107 Loss on sale of assets and asset impairments 2,230 7,556 7,748 18,117 Restructuring charges, net 3,746 202 4,089 3,927 Adjusted EBITDA 40,776$ 32,025$ 94,498$ 85,841$ Three Months Ended December 31, Year Ended December 31, Non - GAAP Reconciliations (unaudited) 20 (in thousands) 2020 2019 Cash and cash equivalents 129,857$ 70,282$ Less total debt, net of debt issuance costs (216,867) (141,389) Less debt issuance costs (1,051) (672) Net debt (88,061)$ (71,779)$ December 31, (in thousands) 2020 2019 2020 2019 Net cash provided by (used in) operating activities 3,705$ (5,651)$ 37,570$ 57,084$ Less capital expenditures (12,238) (15,316) (65,666) (74,408) Free cash flow (8,533)$ (20,967)$ (28,096)$ (17,324)$ Three Months Ended December 31, Year Ended December 31, Net income (loss) is reconciled to EBITDA and adjusted EBITDA as follows: Net debt is reconciled as follows: Free cash flow is reconciled as follows:
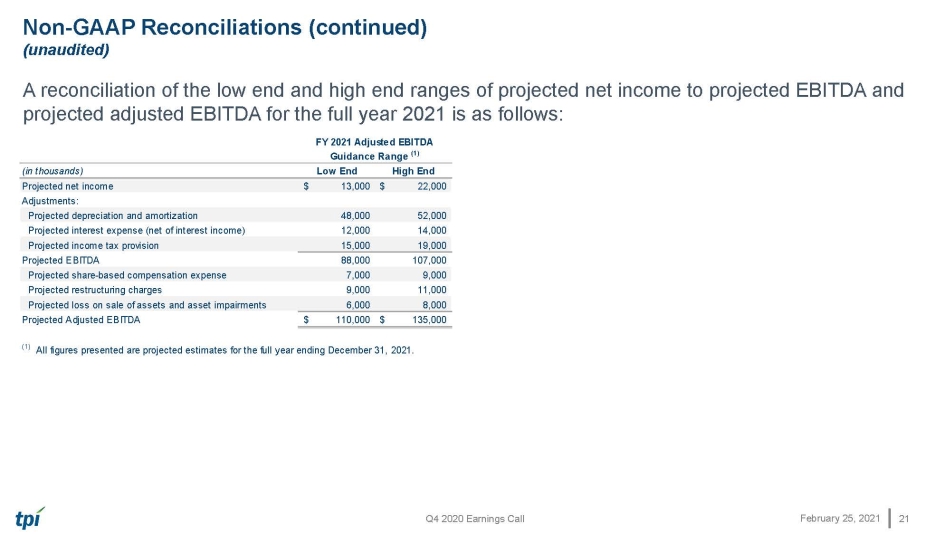
Q4 2020 Earnings Call February 25, 2021 Non - GAAP Reconciliations (continued) (unaudited) A reconciliation of the low end and high end ranges of projected net income to projected EBITDA and projected adjusted EBITDA for the full year 2021 is as follows: 21 (in thousands) Low End High End Projected net income 13,000$ 22,000$ Adjustments: Projected depreciation and amortization 48,000 52,000 Projected interest expense (net of interest income) 12,000 14,000 Projected income tax provision 15,000 19,000 Projected EBITDA 88,000 107,000 Projected share-based compensation expense 7,000 9,000 Projected restructuring charges 9,000 11,000 Projected loss on sale of assets and asset impairments 6,000 8,000 Projected Adjusted EBITDA 110,000$ 135,000$ (1) All figures presented are projected estimates for the full year ending December 31, 2021. FY 2021 Adjusted EBITDA Guidance Range (1)
