Exhibit 99.2

Q2 2021 Earnings Call August 5, 2021
Q2 2021 Earnings Call August 5, 2021 Legal Disclaimer This presentation contains forward - looking statements within the meaning of the federal securities law. All statements other tha n statements of historical facts contained in this presentation, including statements regarding our future results of operations and financial position, business strategy and plans and objectives of m ana gement for future operations, are forward - looking statements. In many cases, you can identify forward - looking statements by terms such as “may,” “should,” “expects,” “plans,” “anticipates,” “could,” “inten ds,” “target,” “projects,” “contemplates,” “believes,” “estimates,” “predicts,” “potential” or “continue” or the negative of these terms or other similar words. Forward - looking statements contained in this pr esentation include, but are not limited to, statements about: ( i ) the potential impact of the COVID - 19 pandemic on our business and results of operations; (ii) competition from other wind blade and wind blade turbine manufacturers; (iii) our ability to procure adequate supplies of raw materials and components in a cost - effective manner to fulfill our volume commitments to our customers; (iv) the discovery of de fects in our products and our ability to estimate the future cost of warranty campaigns; (v) growth of the wind energy and electric vehicle markets and our addressable markets for our products and servic es; (vi) the potential impact of the increasing prevalence of auction - based tenders in the wind energy market and increased competition from solar energy on our gross margins and overall financial perf orm ance; (vii) our future financial performance, including our net sales, cost of goods sold, gross profit or gross margin, operating expenses, ability to generate positive cash flow, and ability to achieve or maintain profitability; (viii) changes in domestic or international government or regulatory policy, including without limitation, changes in trade policy and a potential extension of the Production Tax Cred it in the United States; (ix) the sufficiency of our cash and cash equivalents to meet our liquidity needs; (x) our ability to attract and retain customers for our products, and to optimize product pricing; (xi) our ability to effectively manage our growth strategy and future expenses, including our startup and transition costs; (xii) our ability to successfully expand in our existing wind energy markets and into new inter nat ional wind energy markets, including our ability to expand our field service inspection and repair services business and manufacture wind blades for offshore wind energy projects; (xiii) our ability to suc cessfully open new manufacturing facilities, take over existing facilities of our customers and expand our existing facilities on time and on budget; (xiv) the impact of the accelerated pace of new product a nd wind blade model introductions on our business and our results of operations; (xv) our ability to successfully expand our transportation business and execute upon our strategy of entering new markets out sid e of wind energy; (xvi) worldwide economic conditions and their impact on customer demand; (xvii) our ability to maintain, protect and enhance our intellectual property; (xviii) our ability to comply wi th existing, modified or new laws and regulations applying to our business, including the imposition of new taxes, duties or similar assessments on our products; (xix) the attraction and retention of qualified e mpl oyees and key personnel; (xx) our ability to maintain good working relationships with our employees, and avoid labor disruptions, strikes and other disputes with labor unions that represent certain of our e mpl oyees; and (xxi) the potential impact of one or more of our customers becoming bankrupt or insolvent, or experiencing other financial problems. These forward - looking statements are only predictions. These statements relate to future events or our future financial performa nce and involve known and unknown risks, uncertainties and other important factors that may cause our actual results, levels of activity, performance or achievements to materially differ from any futu re results, levels of activity, performance or achievements expressed or implied by these forward - looking statements. Because forward - looking statements are inherently subject to risks and uncertainties, some of which cannot be predicted or quantified, you should not rely on these forward - looking statements as guarantees of future events. Further information on the factors, risks and uncertainties that could aff ect our financial results and the forward - looking statements in this presentation are included in our filings with the Securities and Exchange Commission and will be included in subsequent periodic and current r epo rts we make with the Securities and Exchange Commission from time to time, including in our Annual Report on Form 10 - K for the year ended December 31, 2020. The forward - looking statements in this presentation represent our views as of the date of this presentation. We anticipate that subsequent events and developments will cause our views to change. However, while we may elect to update these forward - looking statements at some point in the future, we undertake no obligation to update any forward - looking statement to reflect events or developments after the date on which the statement is made or to reflect the occurrence of unanticipated events except to the extent required by applicab le law. You should, therefore, not rely on these forward - looking statements as representing our views as of any date after the date of this presentation. Our forward - looking statements do not reflect the pot ential impact of any future acquisitions, mergers, dispositions, joint ventures, or investments we may make. This presentation includes unaudited non - GAAP financial measures including EBITDA, adjusted EBITDA, net cash (debt) and free cas h flow. We define EBITDA as net income (loss) plus interest expense (including losses on the extinguishment of debt and net of interest income), income taxes and depreciation and amortization. We define Adjusted EBITDA as EBITDA plus any share - based compensation expense, any foreign currency income or losses, any gains or losses on the sale of assets and asset impairments and any restructuring charges. We define net c ash (debt) as total unrestricted cash and cash equivalents less the total principal amount of debt outstanding. We define free cash flow as net cash flow from operating activities less capital expenditures. We present non - GAAP measures when we believe that the additional information is useful and meaningful to investors. Non - GAAP financial measures do not have any standardized meaning and are therefore unlikely to be comparable to similar measures presented by other companies. The presentation of non - GAAP financial measures is not intended to be a substitute for, and should not be considered in isolation from, the financial measures reported in accordance with GAAP. See the Appendix for the reconciliations of certain non - GAAP financial measures to the comparable GAAP mea sures. This presentation also contains estimates and other information concerning our industry that are based on industry publicatio ns, surveys and forecasts. This information involves a number of assumptions and limitations, and we have not independently verified the accuracy or completeness of the information. 2
Q2 2021 Earnings Call August 5, 2021 Agenda 3 • Q2 2021 Highlights • Q2 2021 Financial Highlights and 2021 Guidance • Wrap Up • Q&A • Appendix – Non - GAAP Financial Information
August 5, 2021 Q2 2021 Highlights
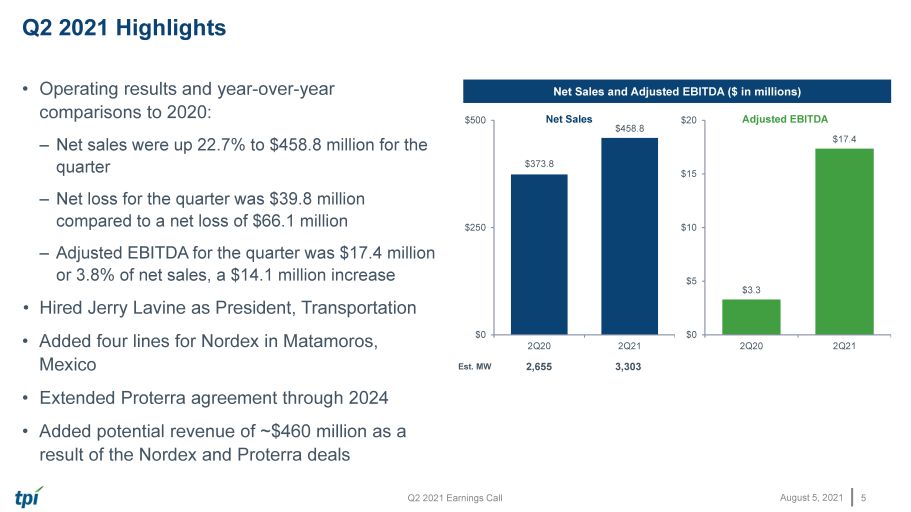
Q2 2021 Earnings Call August 5, 2021 • Operating results and year - over - year comparisons to 2020: – Net sales were up 22.7% to $458.8 million for the quarter – Net loss for the quarter was $39.8 million compared to a net loss of $66.1 million – Adjusted EBITDA for the quarter was $17.4 million or 3.8% of net sales, a $14.1 million increase • Hired Jerry Lavine as President, Transportation • Added four lines for Nordex in Matamoros, Mexico • Extended Proterra agreement through 2024 • Added potential revenue of ~$460 million as a result of the Nordex and Proterra deals Q2 2021 Highlights 5 Net Sales and Adjusted EBITDA ($ in millions) Est. MW 2,655 3,303 $373.8 $458.8 $0 $250 $500 2Q20 2Q21 Net Sales $3.3 $17.4 $0 $5 $10 $15 $20 2Q20 2Q21 Adjusted EBITDA
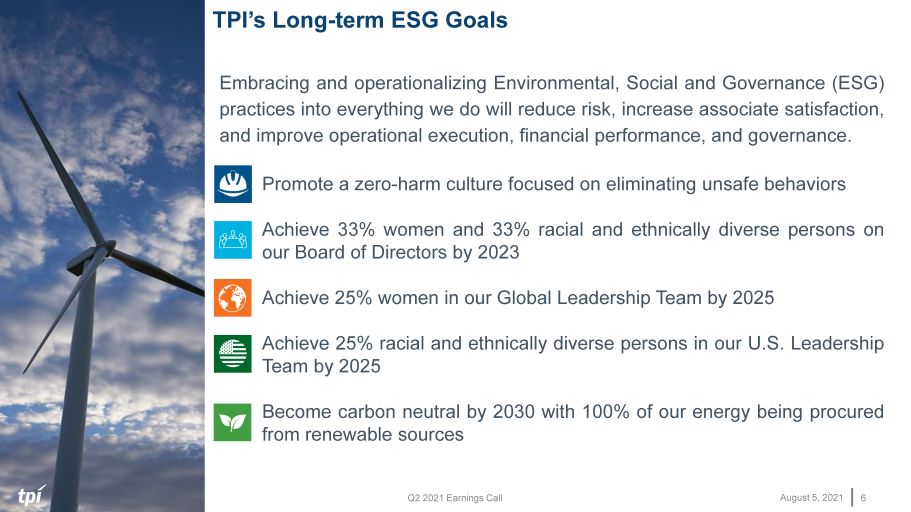
Q2 2021 Earnings Call August 5, 2021 6 Embracing and operationalizing Environmental, Social and Governance (ESG) practices into everything we do will reduce risk, increase associate satisfaction, and improve operational execution, financial performance, and governance . Promote a zero - harm culture focused on eliminating unsafe behaviors Achieve 33 % women and 33 % racial and ethnically diverse persons on our Board of Directors by 2023 Achieve 25 % women in our Global Leadership Team by 2025 Achieve 25 % racial and ethnically diverse persons in our U . S . Leadership Team by 2025 Become carbon neutral by 2030 with 100 % of our energy being procured from renewable sources TPI’s Long - term ESG Goals
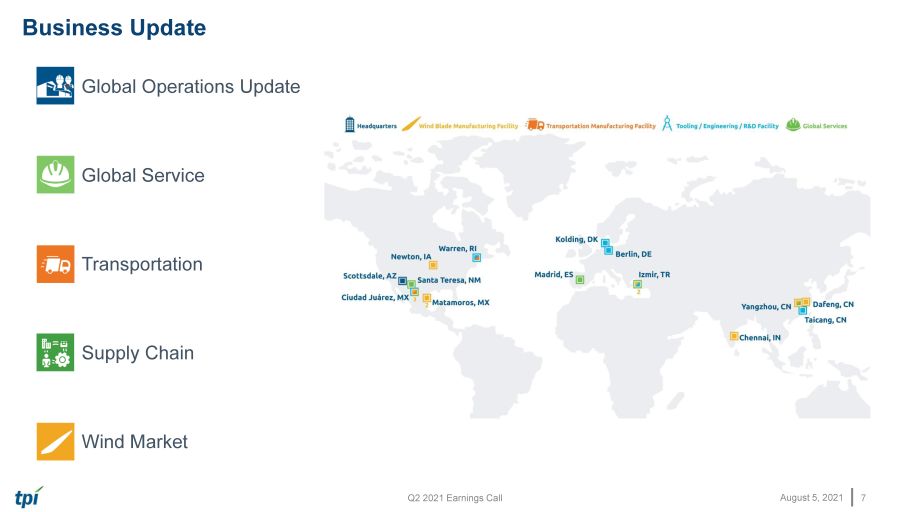
Q2 2021 Earnings Call August 5, 2021 • Global Operations Update • Global Service • Transportation • Supply Chain • Wind Market Business Update 7
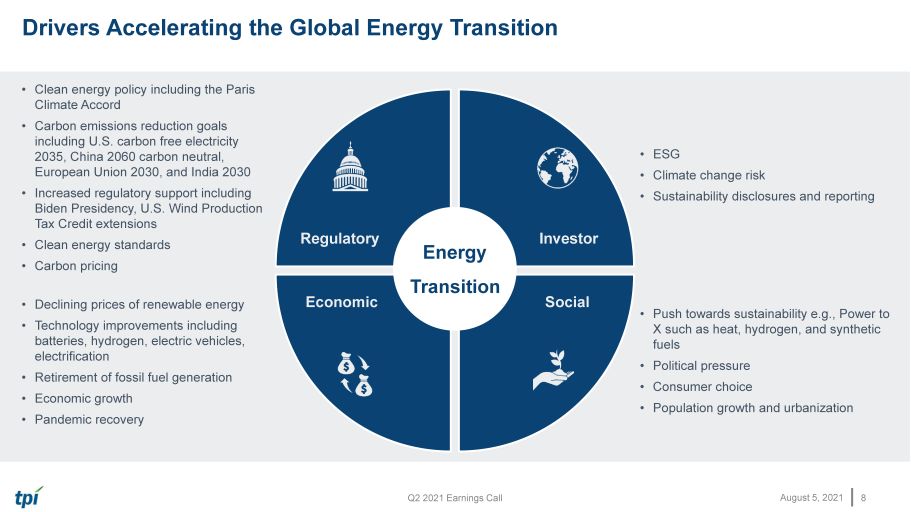
Q2 2021 Earnings Call August 5, 2021 Drivers Accelerating the Global Energy Transition 8 • Clean energy policy including the Paris Climate Accord • Carbon emissions reduction goals including U.S. carbon free electricity 2035, China 2060 carbon neutral, European Union 2030, and India 2030 • Increased regulatory support including Biden Presidency, U.S. Wind Production Tax Credit extensions • Clean energy standards • Carbon pricing • Declining prices of renewable energy • Technology improvements including batteries, hydrogen, electric vehicles, electrification • Retirement of fossil fuel generation • Economic growth • Pandemic recovery • ESG • Climate change risk • Sustainability disclosures and reporting • Push towards sustainability e.g., Power to X such as heat, hydrogen, and synthetic fuels • Political pressure • Consumer choice • Population growth and urbanization Energy Transition Investor Social Regulatory Economic
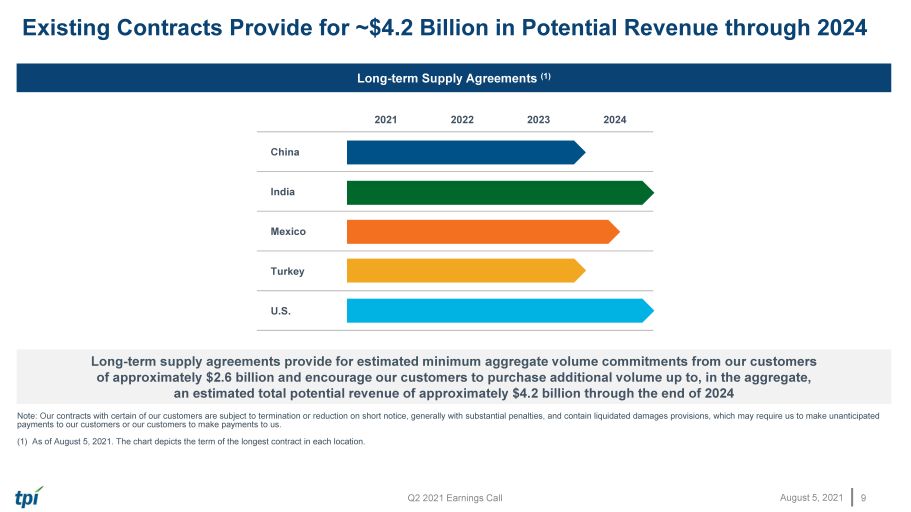
Q2 2021 Earnings Call August 5, 2021 Existing Contracts Provide for ~$4.2 Billion in Potential Revenue through 2024 9 Long - term Supply Agreements (1) Long - term supply agreements provide for estimated minimum aggregate volume commitments from our customers of approximately $ 2.6 billion and encourage our customers to purchase additional volume up to, in the aggregate, an estimated total potential revenue of approximately $4.2 billion through the end of 202 4 Note: Our contracts with certain of our customers are subject to termination or reduction on short notice, generally with substantial penalties, and contain l iqu idated damages provisions, which may require us to make unanticipated payments to our customers or our customers to make payments to us. (1) As of August 5, 2021. The chart depicts the term of the longest contract in each location . 2021 2022 2023 2024 China India Mexico Turkey U.S.
August 5, 2021 Q2 2021 Financial Highlights and 2021 Guidance
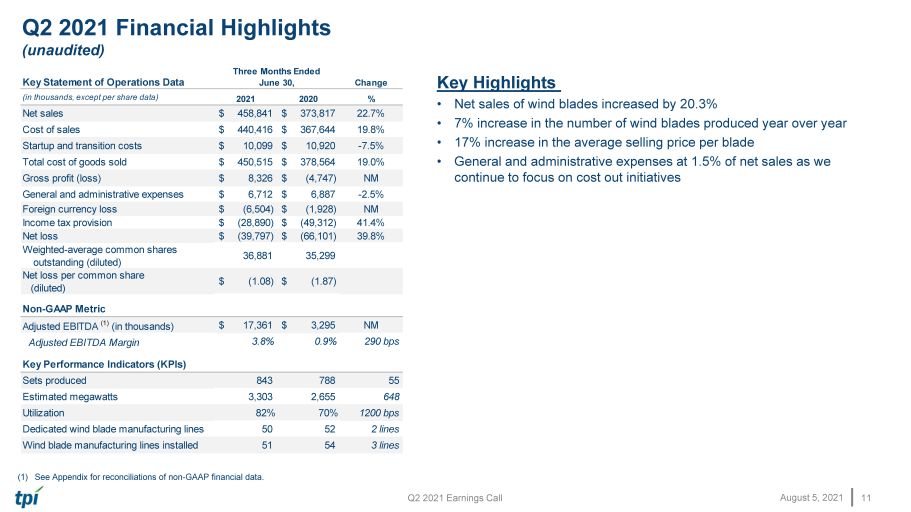
Q2 2021 Earnings Call August 5, 2021 Q2 2021 Financial Highlights (unaudited) 11 Key Highlights • Net sales of wind blades increased by 20.3% • 7% increase in the number of wind blades produced year over year • 17% increase in the average selling price per blade • General and administrative expenses at 1.5% of net sales as we continue to focus on cost out initiatives (1) See Appendix for reconciliations of non - GAAP financial data. Key Statement of Operations Data Change (in thousands, except per share data) 2021 2020 % Net sales $ 458,841 $ 373,817 22.7% Cost of sales $ 440,416 $ 367,644 19.8% Startup and transition costs $ 10,099 $ 10,920 -7.5% Total cost of goods sold $ 450,515 $ 378,564 19.0% Gross profit (loss) $ 8,326 $ (4,747) NM General and administrative expenses $ 6,712 $ 6,887 -2.5% Foreign currency loss $ (6,504) $ (1,928) NM Income tax provision $ (28,890) $ (49,312) 41.4% Net loss $ (39,797) $ (66,101) 39.8% Weighted-average common shares outstanding (diluted) 36,881 35,299 Net loss per common share (diluted) $ (1.08) $ (1.87) Non-GAAP Metric Adjusted EBITDA (1) (in thousands) $ 17,361 $ 3,295 NM Adjusted EBITDA Margin 3.8% 0.9% 290 bps Key Performance Indicators (KPIs) Sets produced 843 788 55 Estimated megawatts 3,303 2,655 648 Utilization 82% 70% 1200 bps Dedicated wind blade manufacturing lines 50 52 2 lines Wind blade manufacturing lines installed 51 54 3 lines Three Months Ended June 30,
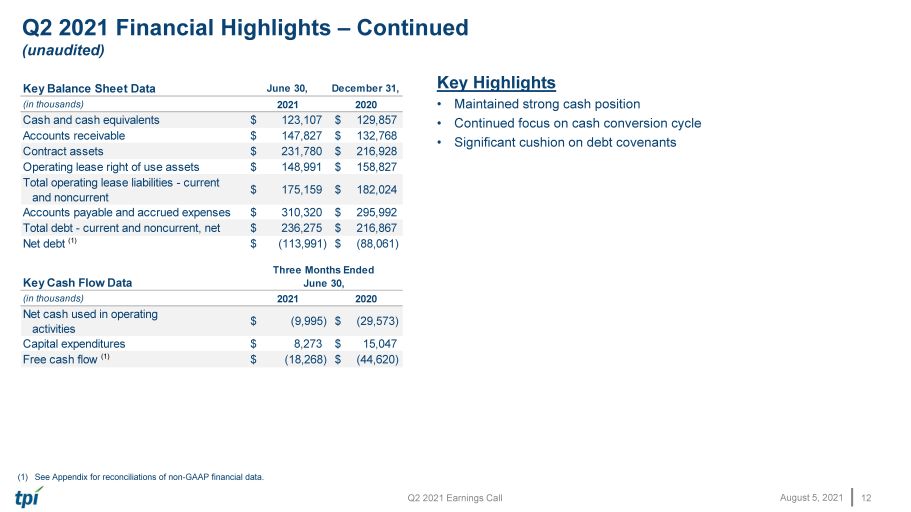
Q2 2021 Earnings Call August 5, 2021 Q2 2021 Financial Highlights – Continued (unaudited) 12 Key Highlights • Maintained strong cash position • Continued focus on cash conversion cycle • Significant cushion on debt covenants (1) See Appendix for reconciliations of non - GAAP financial data. Key Balance Sheet Data June 30, December 31, (in thousands) 2021 2020 Cash and cash equivalents $ 123,107 $ 129,857 Accounts receivable $ 147,827 $ 132,768 Contract assets $ 231,780 $ 216,928 Operating lease right of use assets $ 148,991 $ 158,827 Total operating lease liabilities - current and noncurrent $ 175,159 $ 182,024 Accounts payable and accrued expenses $ 310,320 $ 295,992 Total debt - current and noncurrent, net $ 236,275 $ 216,867 Net debt (1) $ (113,991) $ (88,061) Key Cash Flow Data (in thousands) 2021 2020 Net cash used in operating activities $ (9,995) $ (29,573) Capital expenditures $ 8,273 $ 15,047 Free cash flow (1) $ (18,268) $ (44,620) Three Months Ended June 30,
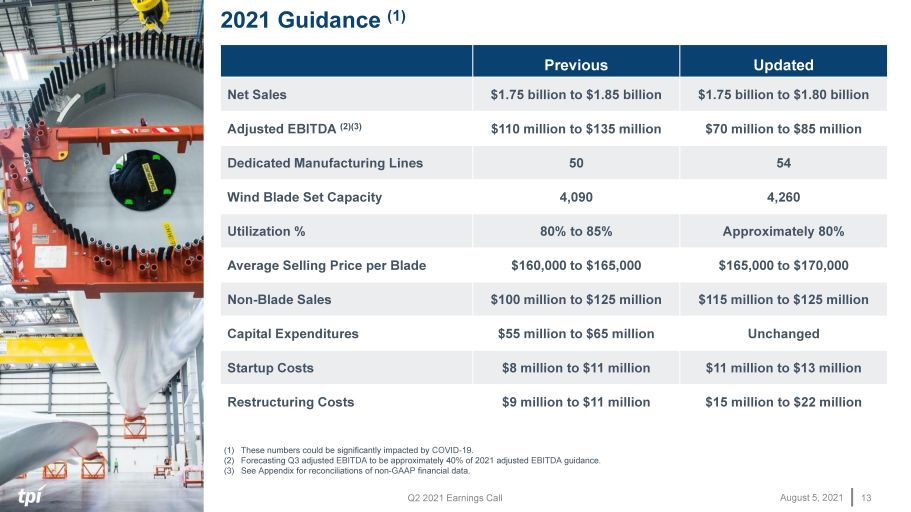
Q2 2021 Earnings Call August 5, 2021 2021 Guidance (1) 13 (1) These numbers could be significantly impacted by COVID - 19. (2) Forecasting Q3 adjusted EBITDA to be approximately 40% of 2021 adjusted EBITDA guidance. (3) See Appendix for reconciliations of non - GAAP financial data. Previous Updated Net Sales $1.75 billion to $1.85 billion $1.75 billion to $1.80 billion Adjusted EBITDA (2)(3) $110 million to $135 million $70 million to $85 million Dedicated Manufacturing Lines 50 54 Wind Blade Set Capacity 4,090 4,260 Utilization % 80% to 85% Approximately 80% Average Selling Price per Blade $160,000 to $165,000 $165,000 to $170,000 Non - Blade Sales $100 million to $125 million $115 million to $125 million Capital Expenditures $55 million to $65 million Unchanged Startup Costs $8 million to $11 million $11 million to $13 million Restructuring Costs $9 million to $11 million $15 million to $22 million

August 5, 2021 Wrap Up
Q2 2021 Earnings Call August 5, 2021 Wrap Up 15 • Our priority is the health and safety of our associates and their families including helping them to get access vaccines • Continue to execute on our wind strategy and pipeline, and grow our global service team • Build on our momentum in transportation • Focus on managing working capital and liquidity • Evaluating multiple opportunities to build on our technologies and capabilities to support the growth, breadth and strength of our business • Overall mission and outlook – Decarbonize and Electrify – Expect the future for wind energy and EVs will continue to strengthen
August 5, 2021 Q&A
August 5, 2021 Appendix – Non - GAAP Financial Information This presentation includes unaudited non - GAAP financial measures including EBITDA, adjusted EBITDA, net cash (debt) and free cash flow. We define EBITDA as net income (loss) plus interest expense (including losses on the extinguishment of debt and net of interest income), income taxes and depreciation and amortization. We define Adjusted EBITDA as EBITDA plus any share - based compensation expense, any foreign currency income or losses, any gains or losses on the sale of assets and asset impairments and any restructuring charges. We define net cash (debt) as total unrestricted cash and cash equivalents less the total principal amount of debt outstanding. We define free cash flow as net cash flow from operating activities less capital expenditures. We present non - GAAP measures when we believe that the additional information is useful and meaningful to investors. Non - GAAP financial measures do not have any standardized meaning and are therefore unlikely to be comparable to similar measures presented by other companies. The presentation of non - GAAP financial measures is not intended to be a substitute for, and should not be considered in isolation from, the financial measures reported in accordance with GAAP. See below for a reconciliation of certain non - GAAP financial measures to the comparable GAAP measures.
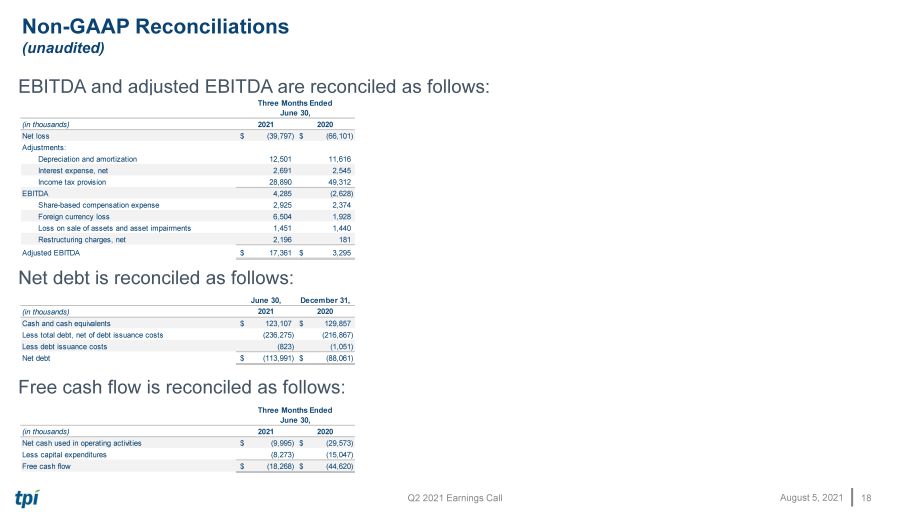
Q2 2021 Earnings Call August 5, 2021 EBITDA and adjusted EBITDA are reconciled as follows: Net debt is reconciled as follows: Free cash flow is reconciled as follows: (in thousands) 2021 2020 Net cash used in operating activities (9,995)$ (29,573)$ Less capital expenditures (8,273) (15,047) Free cash flow (18,268)$ (44,620)$ Three Months Ended June 30, June 30, December 31, (in thousands) 2021 2020 Cash and cash equivalents 123,107$ 129,857$ Less total debt, net of debt issuance costs (236,275) (216,867) Less debt issuance costs (823) (1,051) Net debt (113,991)$ (88,061)$ Non - GAAP Reconciliations (unaudited) 18 (in thousands) 2021 2020 Net loss (39,797)$ (66,101)$ Adjustments: Depreciation and amortization 12,501 11,616 Interest expense, net 2,691 2,545 Income tax provision 28,890 49,312 EBITDA 4,285 (2,628) Share-based compensation expense 2,925 2,374 Foreign currency loss 6,504 1,928 Loss on sale of assets and asset impairments 1,451 1,440 Restructuring charges, net 2,196 181 Adjusted EBITDA 17,361$ 3,295$ Three Months Ended June 30,
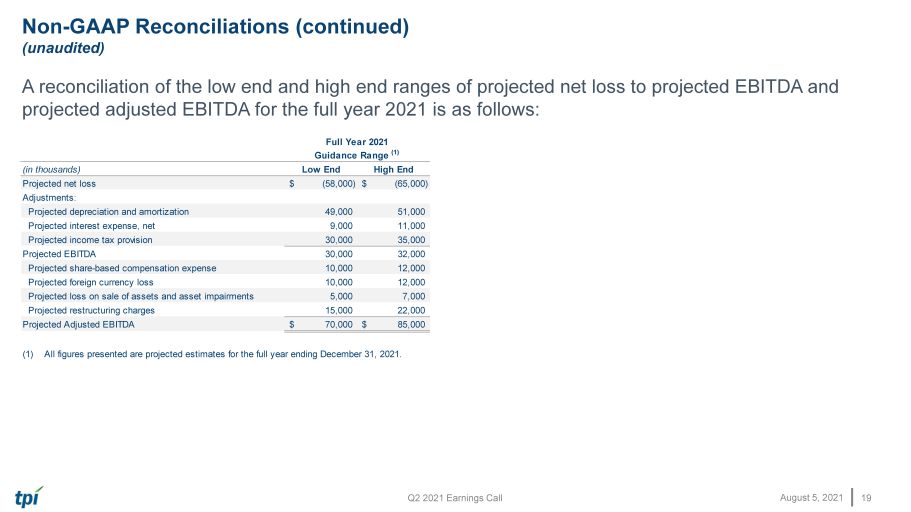
Q2 2021 Earnings Call August 5, 2021 Non - GAAP Reconciliations (continued) (unaudited) A reconciliation of the low end and high end ranges of projected net loss to projected EBITDA and projected adjusted EBITDA for the full year 2021 is as follows: 19 (in thousands) Low End High End Projected net loss (58,000)$ (65,000)$ Adjustments: Projected depreciation and amortization 49,000 51,000 Projected interest expense, net 9,000 11,000 Projected income tax provision 30,000 35,000 Projected EBITDA 30,000 32,000 Projected share-based compensation expense 10,000 12,000 Projected foreign currency loss 10,000 12,000 Projected loss on sale of assets and asset impairments 5,000 7,000 Projected restructuring charges 15,000 22,000 Projected Adjusted EBITDA 70,000$ 85,000$ (1) All figures presented are projected estimates for the full year ending December 31, 2021. Full Year 2021 Guidance Range (1)