Exhibit 99.2
Q4 2021 Earnings Call February 24, 2022
Q4 2021 Earnings Call February 24, 2022 Legal Disclaimer This presentation contains forward - looking statements within the meaning of the federal securities law. All statements other tha n statements of historical facts contained in this presentation, including statements regarding our future results of operations and financial position, business strategy and plans and objectives of m ana gement for future operations, are forward - looking statements. In many cases, you can identify forward - looking statements by terms such as “may,” “should,” “expects,” “plans,” “anticipates,” “could,” “inten ds,” “target,” “projects,” “contemplates,” “believes,” “estimates,” “predicts,” “potential” or “continue” or the negative of these terms or other similar words. Forward - looking statements contained in this pr esentation include, but are not limited to, statements about: (i) the potential impact of the COVID - 19 pandemic on our business and results of operations; (ii) competition from other wind blade and wind blade turbine manufacturers; (iii) the discovery of defects in our products and our ability to estimate the future cost of warranty campaigns; (iv) growth of the wind energy market and our addressable market; (v) our ability to absorb or mitigate the impact of price increases in resin, carbon reinforcements (or fiber), other raw materials and related logistics costs, that we use to produce our products; (vi) the pot ent ial impact of the increasing prevalence of auction - based tenders in the wind energy market and increased competition from solar energy on our gross margins and overall financial performance; (vii) our future f ina ncial performance, including our net sales, cost of goods sold, gross profit or gross margin, operating expenses, ability to generate positive cash flow, and ability to achieve or maintain profitability; ( vii i) changes in domestic or international government or regulatory policy, including without limitation, changes in trade policy; (ix) changes in global economic trends and uncertainty, geopolitical risks, and dem and or supply disruptions from global events (such as COVID - 19); (x) the sufficiency of our cash and cash equivalents to meet our liquidity needs; (xi) our ability to attract and retain customers fo r o ur products, and to optimize product pricing; (xii) our ability to effectively manage our growth strategy and future expenses, including our startup and transition costs; (xiii) our ability to successfully expand in ou r existing wind energy markets and into new international wind energy markets, including our ability to expand our field service inspection and repair services business and manufacture wind blades for off sho re wind energy projects; (xiv) our ability to successfully open new manufacturing facilities and expand existing facilities on time and on budget; (xv) the impact of the accelerated pace of new product and w ind blade model introductions on our business and our results of operations; (xvi) our ability to successfully expand our transportation business and execute upon our strategy of entering new markets outside of wind energy; (xvii) our ability to maintain, protect and enhance our intellectual property; (xviii) our ability to comply with existing, modified or new laws and regulations applying to our business, includi ng the imposition of new taxes, duties or similar assessments on our products; (xix) the attraction and retention of qualified employees and key personnel; (xx) our ability to maintain good working relationships wi th our employees, and avoid labor disruptions, strikes and other disputes with labor unions that represent certain of our employees; (xxi) our ability to procure adequate supplies of raw materials and component s t o fulfill our wind blade volume commitments to our customers; and (xxii) the potential impact of one or more of our customers becoming bankrupt or insolvent, or experiencing other financial problems. These forward - looking statements are only predictions. These statements relate to future events or our future financial performa nce and involve known and unknown risks, uncertainties and other important factors that may cause our actual results, levels of activity, performance or achievements to materially differ from any futu re results, levels of activity, performance or achievements expressed or implied by these forward - looking statements. Because forward - looking statements are inherently subject to risks and uncertainties, some of which cannot be predicted or quantified, you should not rely on these forward - looking statements as guarantees of future events. Further information on the factors, risks and uncertainties that could aff ect our financial results and the forward - looking statements in this presentation are included in our filings with the Securities and Exchange Commission and will be included in subsequent periodic and current r epo rts we make with the Securities and Exchange Commission from time to time, including in our Annual Report on Form 10 - K for the year ended December 31, 2020. The forward - looking statements in this presentation represent our views as of the date of this presentation. We anticipate that subsequent events and developments will cause our views to change. However, while we may elect to update these forward - looking statements at some point in the future, we undertake no obligation to update any forward - looking statement to reflect events or developments after the date on which the statement is made or to reflect the occurrence of unanticipated events except to the extent required by applicab le law. You should, therefore, not rely on these forward - looking statements as representing our views as of any date after the date of this presentation. Our forward - looking statements do not reflect the pot ential impact of any future acquisitions, mergers, dispositions, joint ventures, or investments we may make. This presentation includes unaudited non - GAAP financial measures including EBITDA, adjusted EBITDA, net cash (debt) and free cas h flow. We define EBITDA as net income (loss) plus interest expense (including losses on the extinguishment of debt and net of interest income), income taxes and depreciation and amortization. We define Adjusted EBITDA as EBITDA plus any share - based compensation expense, any foreign currency income or losses, any gains or losses on the sale of assets and asset impairments and any restructuring charges. We define net c ash (debt) as total unrestricted cash and cash equivalents less the total principal amount of debt outstanding. We define free cash flow as net cash flow from operating activities less capital expenditures. We present non - GAAP measures when we believe that the additional information is useful and meaningful to investors. Non - GAAP financial measures do not have any standardized meaning and are therefore unlikely to be comparable to similar measures presented by other companies. The presentation of non - GAAP financial measures is not intended to be a substitute for, and should not be considered in isolation from, the financial measures reported in accordance with GAAP. See the Appendix for the reconciliations of certain non - GAAP financial measures to the comparable GAAP mea sures. This presentation also contains estimates and other information concerning our industry that are based on industry publicatio ns, surveys and forecasts. This information involves a number of assumptions and limitations, and we have not independently verified the accuracy or completeness of the information. 2

Q4 2021 Earnings Call February 24, 2022 Agenda 3 • 2021 Highlights and Business Update • Q4 and Full Year 2021 Financial Highlights and 2022 Guidance • Q&A • Wrap Up • Appendix – Non - GAAP Financial Information

February 24, 2022 2021 Highlights and Business Update
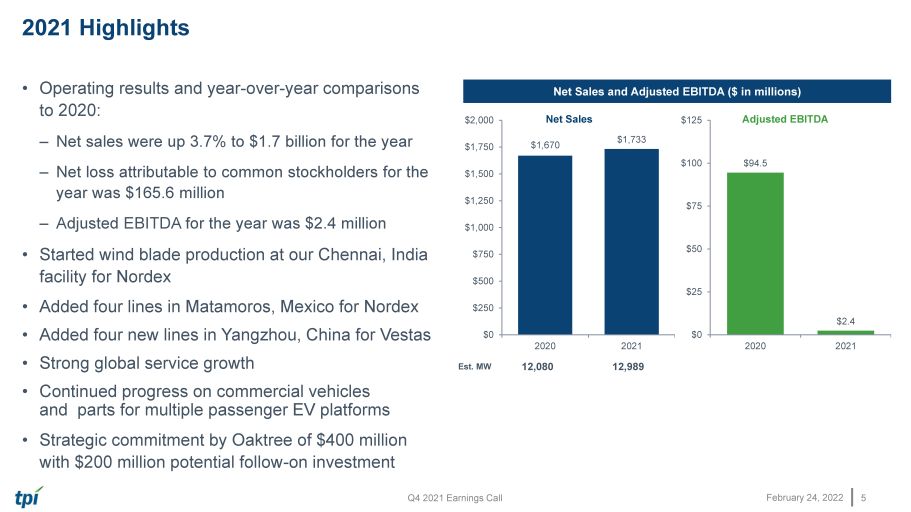
Q4 2021 Earnings Call February 24, 2022 • Operating results and year - over - year comparisons to 2020: – Net sales were up 3.7% to $1.7 billion for the year – Net loss attributable to common stockholders for the year was $165.6 million – Adjusted EBITDA for the year was $2.4 million • Started wind blade production at our Chennai, India facility for Nordex • Added four lines in Matamoros, Mexico for Nordex • Added four new lines in Yangzhou, China for Vestas • Strong global service growth • Continued progress on commercial vehicles and parts for multiple passenger EV platforms • Strategic commitment by Oaktree of $400 million with $200 million potential follow - on investment 2021 Highlights 5 Net Sales and Adjusted EBITDA ($ in millions) Est. MW 12,080 12,989 $1,670 $1,733 $0 $250 $500 $750 $1,000 $1,250 $1,500 $1,750 $2,000 2020 2021 Net Sales $94.5 $2.4 $0 $25 $50 $75 $100 $125 2020 2021 Adjusted EBITDA
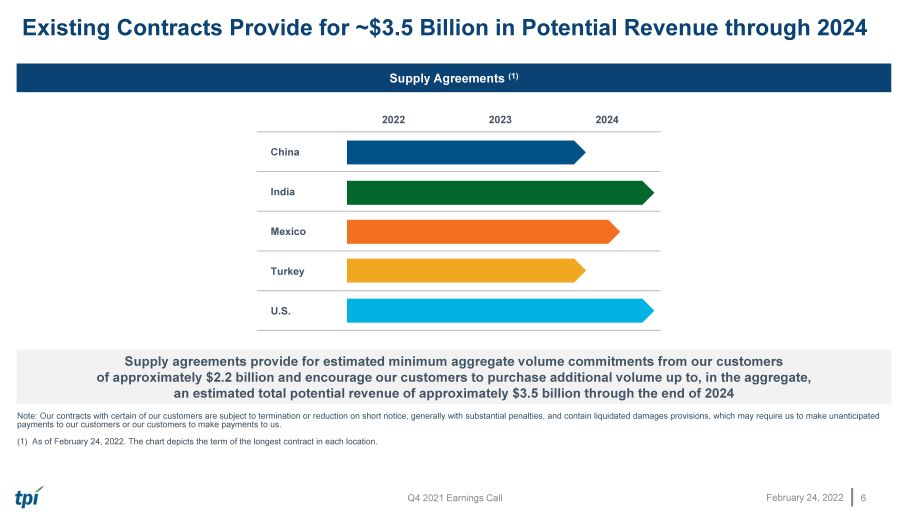
Q4 2021 Earnings Call February 24, 2022 Existing Contracts Provide for ~$3.5 Billion in Potential Revenue through 2024 6 Supply Agreements (1) S upply agreements provide for estimated minimum aggregate volume commitments from our customers of approximately $ 2.2 billion and encourage our customers to purchase additional volume up to, in the aggregate, an estimated total potential revenue of approximately $3.5 billion through the end of 202 4 Note: Our contracts with certain of our customers are subject to termination or reduction on short notice, generally with substantial penalties, and contain l iqu idated damages provisions, which may require us to make unanticipated payments to our customers or our customers to make payments to us. (1) As of February 24, 2022. The chart depicts the term of the longest contract in each location . 2022 2023 2024 China India Mexico Turkey U.S.

February 24, 2022 Q4 2021 Earnings Call • Global Operations • Supply Chain • Wind Market Business Update 7
February 24, 2022 Q4 2021 and Full Year Financial Highlights and 2022 Guidance
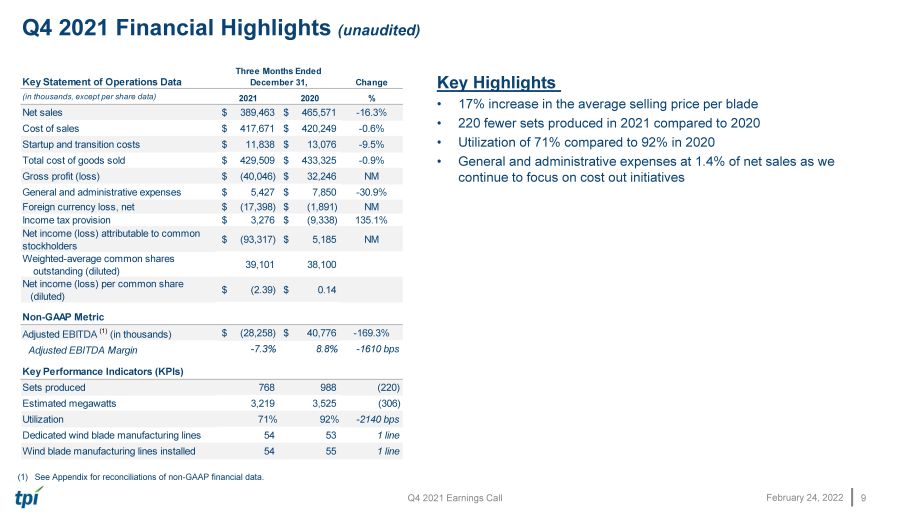
Q4 2021 Earnings Call February 24, 2022 Q4 2021 Financial Highlights (unaudited) 9 Key Highlights • 17% increase in the average selling price per blade • 220 fewer sets produced in 2021 compared to 2020 • Utilization of 71% compared to 92% in 2020 • General and administrative expenses at 1.4% of net sales as we continue to focus on cost out initiatives (1) See Appendix for reconciliations of non - GAAP financial data. Key Statement of Operations Data Change (in thousands, except per share data) 2021 2020 % Net sales $ 389,463 $ 465,571 -16.3% Cost of sales $ 417,671 $ 420,249 -0.6% Startup and transition costs $ 11,838 $ 13,076 -9.5% Total cost of goods sold $ 429,509 $ 433,325 -0.9% Gross profit (loss) $ (40,046) $ 32,246 NM General and administrative expenses $ 5,427 $ 7,850 -30.9% Foreign currency loss, net $ (17,398) $ (1,891) NM Income tax provision $ 3,276 $ (9,338) 135.1% Net income (loss) attributable to common stockholders $ (93,317) $ 5,185 NM Weighted-average common shares outstanding (diluted) 39,101 38,100 Net income (loss) per common share (diluted) $ (2.39) $ 0.14 Non-GAAP Metric Adjusted EBITDA (1) (in thousands) $ (28,258) $ 40,776 -169.3% Adjusted EBITDA Margin -7.3% 8.8% -1610 bps Key Performance Indicators (KPIs) Sets produced 768 988 (220) Estimated megawatts 3,219 3,525 (306) Utilization 71% 92% -2140 bps Dedicated wind blade manufacturing lines 54 53 1 line Wind blade manufacturing lines installed 54 55 1 line Three Months Ended December 31,
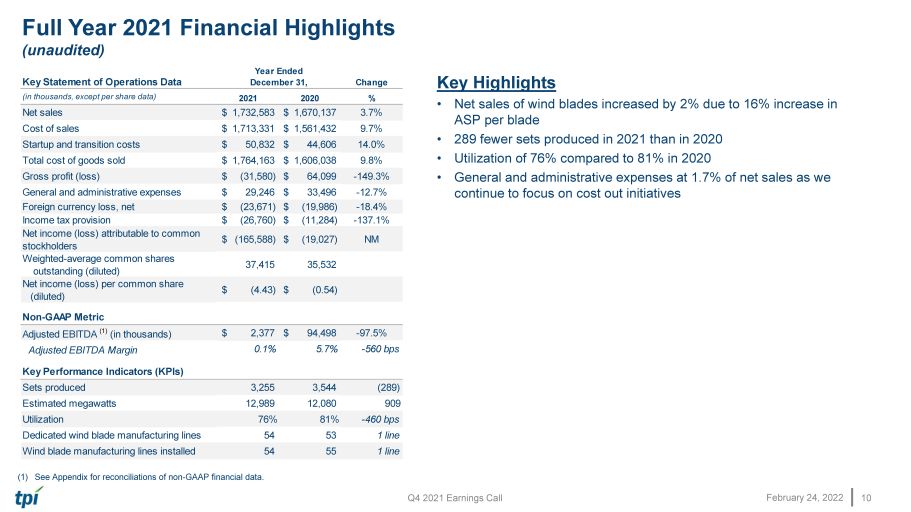
Q4 2021 Earnings Call February 24, 2022 Full Year 2021 Financial Highlights (unaudited) 10 Key Highlights • Net sales of wind blades increased by 2% due to 16% increase in ASP per blade • 289 fewer sets produced in 2021 than in 2020 • Utilization of 76% compared to 81% in 2020 • General and administrative expenses at 1.7% of net sales as we continue to focus on cost out initiatives (1) See Appendix for reconciliations of non - GAAP financial data. Key Statement of Operations Data Change (in thousands, except per share data) 2021 2020 % Net sales $ 1,732,583 $ 1,670,137 3.7% Cost of sales $ 1,713,331 $ 1,561,432 9.7% Startup and transition costs $ 50,832 $ 44,606 14.0% Total cost of goods sold $ 1,764,163 $ 1,606,038 9.8% Gross profit (loss) $ (31,580) $ 64,099 -149.3% General and administrative expenses $ 29,246 $ 33,496 -12.7% Foreign currency loss, net $ (23,671) $ (19,986) -18.4% Income tax provision $ (26,760) $ (11,284) -137.1% Net income (loss) attributable to common stockholders $ (165,588) $ (19,027) NM Weighted-average common shares outstanding (diluted) 37,415 35,532 Net income (loss) per common share (diluted) $ (4.43) $ (0.54) Non-GAAP Metric Adjusted EBITDA (1) (in thousands) $ 2,377 $ 94,498 -97.5% Adjusted EBITDA Margin 0.1% 5.7% -560 bps Key Performance Indicators (KPIs) Sets produced 3,255 3,544 (289) Estimated megawatts 12,989 12,080 909 Utilization 76% 81% -460 bps Dedicated wind blade manufacturing lines 54 53 1 line Wind blade manufacturing lines installed 54 55 1 line Year Ended December 31,
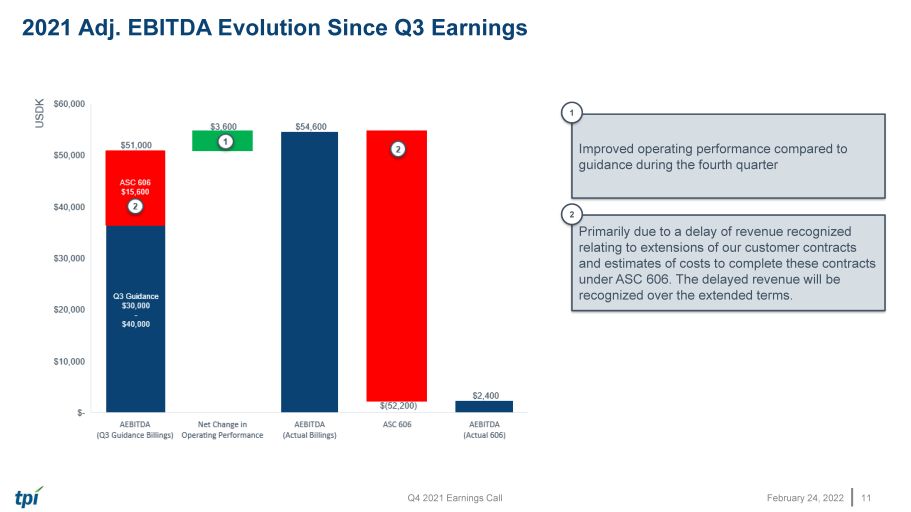
February 24, 2022 Q4 2021 Earnings Call 2021 Adj. EBITDA Evolution Since Q3 Earnings 11 Improved operating performance compared to guidance during the fourth quarter 1 Primarily due to a delay of revenue recognized relating to extensions of our customer contracts and estimates of costs to complete these contracts under ASC 606. The delayed revenue will be recognized over the extended terms. 2

Q4 2021 Earnings Call February 24, 2022 Full Year 2021 Financial Highlights – Continued (unaudited) 12 Key Highlights • Net cash position is strong after the Oaktree financing and working capital management (1) See Appendix for reconciliations of non - GAAP financial data. Key Balance Sheet Data (in thousands) 2021 2020 Cash and cash equivalents $ 242,165 $ 129,857 Accounts receivable $ 157,804 $ 132,768 Contract assets $ 188,323 $ 216,928 Operating lease right of use assets $ 137,192 $ 158,827 Total operating lease liabilities - current and noncurrent $ 169,160 $ 182,024 Accounts payable and accrued expenses $ 336,697 $ 295,992 Total debt - current and noncurrent, net $ 74,646 $ 216,867 Net cash (debt) (1) $ 167,519 $ (88,061) Key Cash Flow Data (in thousands) 2021 2020 Net cash provided by (used in) operating activities $ (25,525) $ 37,570 Capital expenditures $ 37,119 $ 65,666 Free cash flow (1) $ (62,644) $ (28,096) Year Ended December 31, December 31,
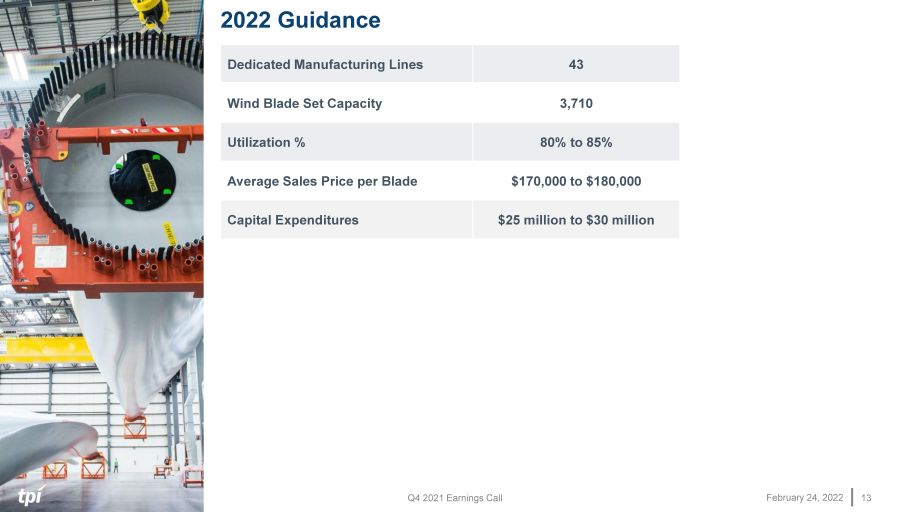
Q4 2021 Earnings Call February 24, 2022 2022 Guidance 13 Dedicated Manufacturing Lines 43 Wind Blade Set Capacity 3,710 Utilization % 80% to 85% Average Sales Price per Blade $170,000 to $180,000 Capital Expenditures $25 million to $30 million
February 24, 2022 Q&A

February 24, 2022 Wrap Up
Q4 2021 Earnings Call February 24, 2022 Wrap Up 16 • Manage business through near - term challenges facing the industry • Position TPI as the preferred global solution provider to our customers • Thanks to our associates for their commitment and dedication to TPI and our mission to decarbonize and electrify

February 24, 2022 Appendix – Non - GAAP Financial Information This presentation includes unaudited non - GAAP financial measures including EBITDA, adjusted EBITDA, net cash (debt) and free cash flow. We define EBITDA as net income (loss) plus interest expense (including losses on the extinguishment of debt and net of interest income), income taxes and depreciation and amortization. We define Adjusted EBITDA as EBITDA plus any share - based compensation expense, any foreign currency income or losses, any gains or losses on the sale of assets and asset impairments and any restructuring charges. We define net cash (debt) as total unrestricted cash and cash equivalents less the total principal amount of debt outstanding. We define free cash flow as net cash flow from operating activities less capital expenditures. We present non - GAAP measures when we believe that the additional information is useful and meaningful to investors. Non - GAAP financial measures do not have any standardized meaning and are therefore unlikely to be comparable to similar measures presented by other companies. The presentation of non - GAAP financial measures is not intended to be a substitute for, and should not be considered in isolation from, the financial measures reported in accordance with GAAP. See below for a reconciliation of certain non - GAAP financial measures to the comparable GAAP measures.
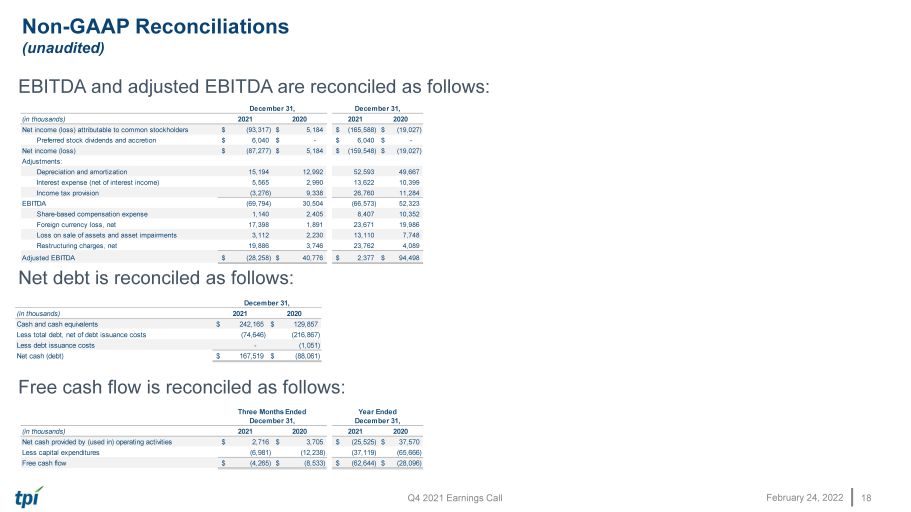
Q4 2021 Earnings Call February 24, 2022 EBITDA and adjusted EBITDA are reconciled as follows: Net debt is reconciled as follows: Free cash flow is reconciled as follows: Non - GAAP Reconciliations (unaudited) 18 (in thousands) 2021 2020 Cash and cash equivalents 242,165$ 129,857$ Less total debt, net of debt issuance costs (74,646) (216,867) Less debt issuance costs - (1,051) Net cash (debt) 167,519$ (88,061)$ December 31, (in thousands) 2021 2020 2021 2020 Net cash provided by (used in) operating activities 2,716$ 3,705$ (25,525)$ 37,570$ Less capital expenditures (6,981) (12,238) (37,119) (65,666) Free cash flow (4,265)$ (8,533)$ (62,644)$ (28,096)$ Three Months Ended December 31, Year Ended December 31, (in thousands) 2021 2020 2021 2020 Net income (loss) attributable to common stockholders (93,317)$ 5,184$ (165,588)$ (19,027)$ Preferred stock dividends and accretion 6,040$ -$ 6,040$ -$ Net income (loss) (87,277)$ 5,184$ (159,548)$ (19,027)$ Adjustments: Depreciation and amortization 15,194 12,992 52,593 49,667 Interest expense (net of interest income) 5,565 2,990 13,622 10,399 Income tax provision (3,276) 9,338 26,760 11,284 EBITDA (69,794) 30,504 (66,573) 52,323 Share-based compensation expense 1,140 2,405 8,407 10,352 Foreign currency loss, net 17,398 1,891 23,671 19,986 Loss on sale of assets and asset impairments 3,112 2,230 13,110 7,748 Restructuring charges, net 19,886 3,746 23,762 4,089 Adjusted EBITDA (28,258)$ 40,776$ 2,377$ 94,498$ Three Months Ended December 31, Year Ended December 31,