Exhibit 99.2

Q1 2022 Earnings Call May 5, 2022
Q1 2022 Earnings Call May 5, 2022 Legal Disclaimer This presentation contains forward - looking statements within the meaning of the federal securities law. All statements other tha n statements of historical facts contained in this presentation, including statements regarding our future results of operations and financial position, business strategy and plans and objectives of m ana gement for future operations, are forward - looking statements. In many cases, you can identify forward - looking statements by terms such as “may,” “should,” “expects,” “plans,” “anticipates,” “could,” “inten ds,” “target,” “projects,” “contemplates,” “believes,” “estimates,” “predicts,” “potential” or “continue” or the negative of these terms or other similar words. Forward - looking statements contained in this pr esentation include, but are not limited to, statements about: i. the potential impact of the COVID - 19 pandemic on our business and results of operations; ii. competition from other wind blade and wind blade turbine manufacturers; iii the discovery of defects in our products and our ability to estimate the future cost of warranty campaigns; iv. growth of the wind energy market and our addressable market; v. our abili ty to absorb or mitigate the impact of price increases in resin, carbon reinforcements (or fiber), other raw materials and related logistics costs that we use to produce our products; vi. our abili ty to procure adequate supplies of raw materials and components in a cost - effective manner to fulfill our volume commitments to our customers; vii. the potential impact of the increasing prevalence of auction - bas ed tenders in the wind energy market and increased competition from solar energy on our gross margins and overall financial performance; viii. our future financial performance, including our net sale s, cost of goods sold, gross profit or gross margin, operating expenses, ability to generate positive cash flow, and ability to achieve or maintain profitability; ix. changes in domestic or international gover nme nt or regulatory policy, including without limitation, changes in trade policy; x. changes in global economic trends and uncertainty, geopolitical risks, and demand or supply disruptions from global events; x i. the sufficiency of our cash and cash equivalents to meet our liquidity needs; xii. our ability to attract and retain customers for our products, and to optimize product pricing; xiii. our ability to effective ly manage our growth strategy and future expenses, including our startup and transition costs; xiv. our ability to successfully expand in our existing wind energy markets and into new international wind energy mar ket s, including our ability to expand our field service inspection and repair services business and manufacture wind blades for offshore wind energy projects; xv. our ability to successfully open new manufacturin g f acilities and expand existing facilities on time and on budget; xvi. the impact of the accelerated pace of new product and wind blade model introductions on our business and our results of operations; xvii . o ur ability to successfully expand our transportation business and execute upon our strategy of entering new markets outside of wind energy; xviii. our ability to maintain, protect and enhance our intellec tua l property; xix. our ability to comply with existing, modified or new laws and regulations applying to our business, including the imposition of new taxes, duties or similar assessments on our products; x x. the attraction and retention of qualified employees and key personnel; xxi. our ability to maintain good working relationships with our employees, and avoid labor disruptions, strikes and other disputes wi th labor unions that represent certain of our employees; and xxii. the potential impact of one or more of our customers becoming bankrupt or insolvent, or experiencing other financial problems. These forward - looking statements are only predictions. These statements relate to future events or our future financial performa nce and involve known and unknown risks, uncertainties and other important factors that may cause our actual results, levels of activity, performance or achievements to materially differ from any futu re results, levels of activity, performance or achievements expressed or implied by these forward - looking statements. Because forward - looking statements are inherently subject to risks and uncertainties, some of which cannot be predicted or quantified, you should not rely on these forward - looking statements as guarantees of future events. Further information on the factors, risks and uncertainties that could aff ect our financial results and the forward - looking statements in this presentation are included in our filings with the Securities and Exchange Commission and will be included in subsequent periodic and current r epo rts we make with the Securities and Exchange Commission from time to time, including in our Annual Report on Form 10 - K for the year ended December 31, 2021. The forward - looking statements in this presentation represent our views as of the date of this presentation. We anticipate that subsequent events and developments will cause our views to change. However, while we may elect to update these forward - looking statements at some point in the future, we undertake no obligation to update any forward - looking statement to reflect events or developments after the date on which the statement is made or to reflect the occurrence of unanticipated events except to the extent required by applicab le law. You should, therefore, not rely on these forward - looking statements as representing our views as of any date after the date of this presentation. Our forward - looking statements do not reflect the pot ential impact of any future acquisitions, mergers, dispositions, joint ventures, or investments we may make. This presentation includes unaudited non - GAAP financial measures including EBITDA, adjusted EBITDA, net cash (debt) and free cas h flow. We define EBITDA as net income (loss) plus interest expense (including losses on the extinguishment of debt and net of interest income), income taxes and depreciation and amortization. We define Adjusted EBITDA as EBITDA plus any share - based compensation expense, any foreign currency income or losses, any gains or losses on the sale of assets and asset impairments and any restructuring charges. We define net c ash (debt) as total unrestricted cash and cash equivalents less the total principal amount of debt outstanding. We define free cash flow as net cash flow from operating activities less capital expenditures. We present non - GAAP measures when we believe that the additional information is useful and meaningful to investors. Non - GAAP financial measures do not have any standardized meaning and are therefore unlikely to be comparable to similar measures presented by other companies. The presentation of non - GAAP financial measures is not intended to be a substitute for, and should not be considered in isolation from, the financial measures reported in accordance with GAAP. See the Appendix for the reconciliations of certain non - GAAP financial measures to the comparable GAAP mea sures. This presentation also contains estimates and other information concerning our industry that are based on industry publicatio ns, surveys and forecasts. This information involves a number of assumptions and limitations, and we have not independently verified the accuracy or completeness of the information. 2
May 5, 2022 Q1 2022 Earnings Call Agenda • Q1 2022 Highlights and Business Update • Q1 2022 Financial Highlights and 2022 Guidance • Wrap Up • Q&A • Appendix – Non - GAAP Financial Information 3
May 5, 2022 2022 Highlights and Business Update
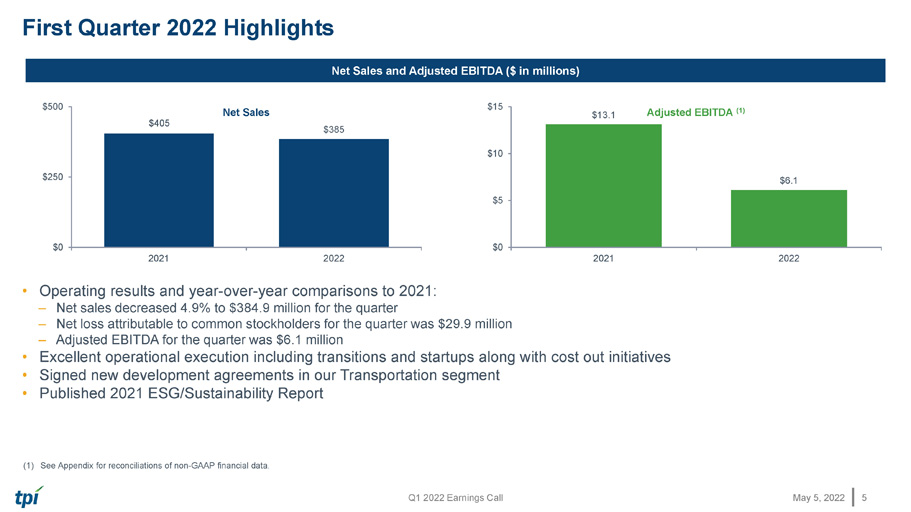
May 5, 2022 Q1 2022 Earnings Call First Quarter 2022 Highlights 5 Net Sales and Adjusted EBITDA ($ in millions) • Operating results and year - over - year comparisons to 2021: – Net sales decreased 4.9% to $384.9 million for the quarter – Net loss attributable to common stockholders for the quarter was $29.9 million – Adjusted EBITDA for the quarter was $6.1 million • Excellent operational execution including transitions and startups along with cost out initiatives • Signed new development agreements in our Transportation segment • Published 2021 ESG/Sustainability Report (1) See Appendix for reconciliations of non - GAAP financial data. $405 $385 $0 $250 $500 2021 2022 Net Sales $13.1 $6.1 $0 $5 $10 $15 2021 2022 Adjusted EBITDA (1)
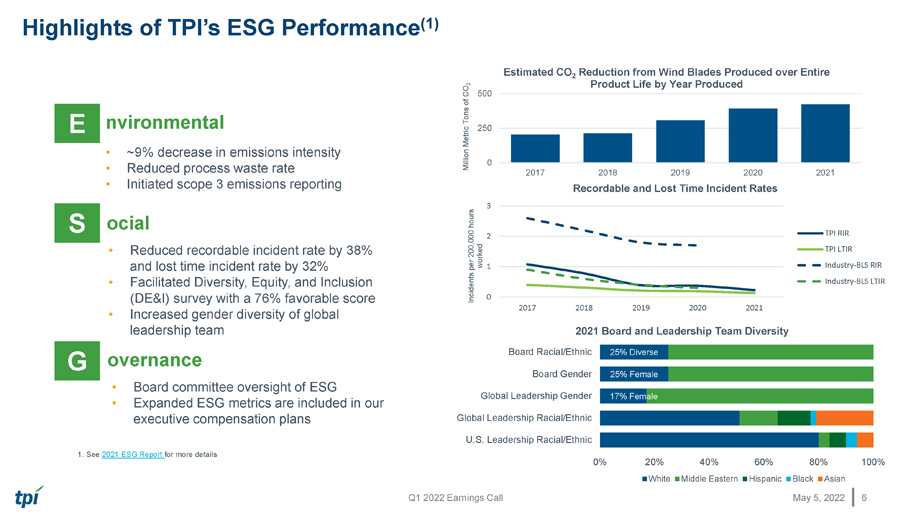
May 5, 2022 Q1 2022 Earnings Call Highlights of TPI’s ESG Performance (1) 6 0 250 500 2017 2018 2019 2020 2021 Million Metric Tons of CO 2 Estimated CO 2 Reduction from Wind Blades Produced over Entire Product Life by Year Produced 25% Female 25% Diverse 0% 20% 40% 60% 80% 100% U.S. Leadership Racial/Ethnic Global Leadership Racial/Ethnic Global Leadership Gender Board Gender Board Racial/Ethnic 2021 Board and Leadership Team Diversity White Middle Eastern Hispanic Black Asian 17% Female 0 1 2 3 2017 2018 2019 2020 2021 Incidents per 200,000 hours worked Recordable and Lost Time Incident Rates TPI RIR TPI LTIR Industry-BLS RIR Industry-BLS LTIR nvironmental • ~9% decrease in emissions intensity • Reduced process waste rate • Initiated scope 3 emissions reporting E S ocial • Reduced recordable incident rate by 38% and lost time incident rate by 32% • Facilitated Diversity, Equity, and Inclusion (DE&I) survey with a 76% favorable score • Increased gender diversity of global leadership team overnance G • Board committee oversight of ESG • Expanded ESG metrics are included in our executive compensation plans 1. See 2021 ESG Report for more details
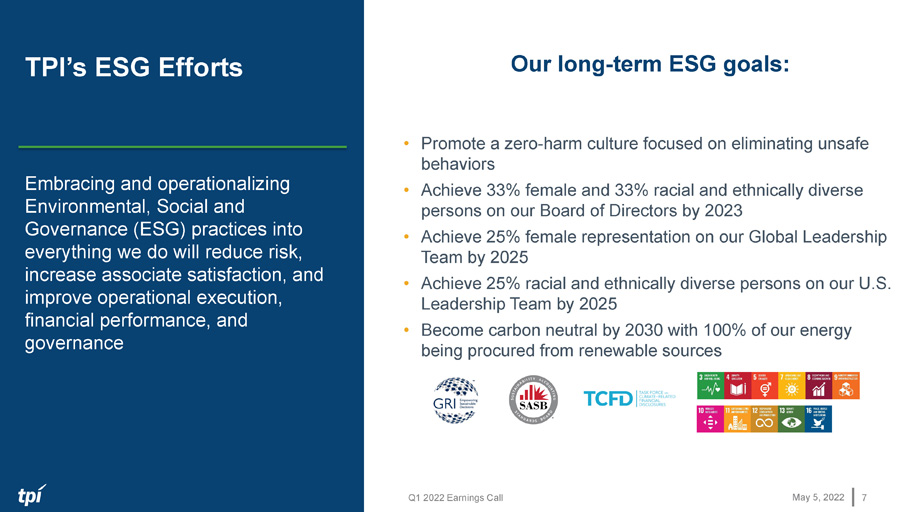
Q1 2022 Earnings Call May 5, 2022 TPI’s ESG Efforts Our long - term ESG goals: Embracing and operationalizing Environmental, Social and Governance (ESG) practices into everything we do will reduce risk, increase associate satisfaction, and improve operational execution, financial performance, and governance • Promote a zero - harm culture focused on eliminating unsafe behaviors • Achieve 33% female and 33% racial and ethnically diverse persons on our Board of Directors by 2023 • Achieve 25% female representation on our Global Leadership Team by 2025 • Achieve 25% racial and ethnically diverse persons on our U.S. Leadership Team by 2025 • Become carbon neutral by 2030 with 100% of our energy being procured from renewable sources 7
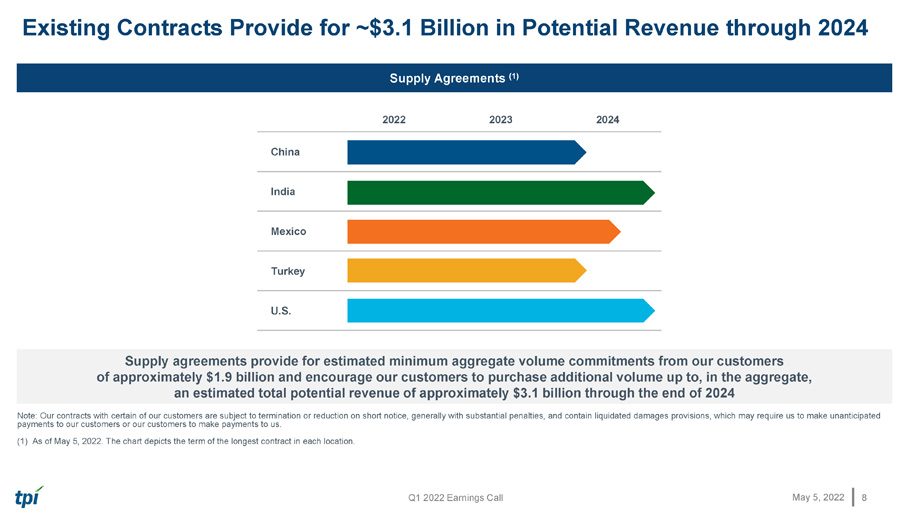
Q1 2022 Earnings Call May 5, 2022 Existing Contracts Provide for ~$3.1 Billion in Potential Revenue through 2024 8 Supply Agreements (1) S upply agreements provide for estimated minimum aggregate volume commitments from our customers of approximately $ 1.9 billion and encourage our customers to purchase additional volume up to, in the aggregate, an estimated total potential revenue of approximately $3.1 billion through the end of 202 4 Note: Our contracts with certain of our customers are subject to termination or reduction on short notice, generally with substantial penalties, and contain l iqu idated damages provisions, which may require us to make unanticipated payments to our customers or our customers to make payments to us. (1) As of May 5, 2022. The chart depicts the term of the longest contract in each location . 2022 2023 2024 China India Mexico Turkey U.S.
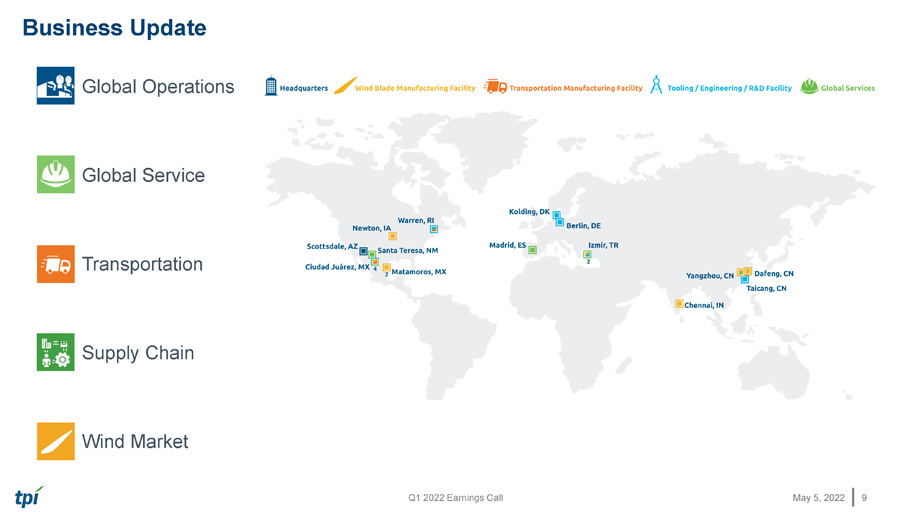
May 5, 2022 Q1 2022 Earnings Call • Global Operations • Global Service • Transportation • Supply Chain • Wind Market Business Update 9
May 5, 2022 Q1 2022 Financial Highlights and 2022 Guidance
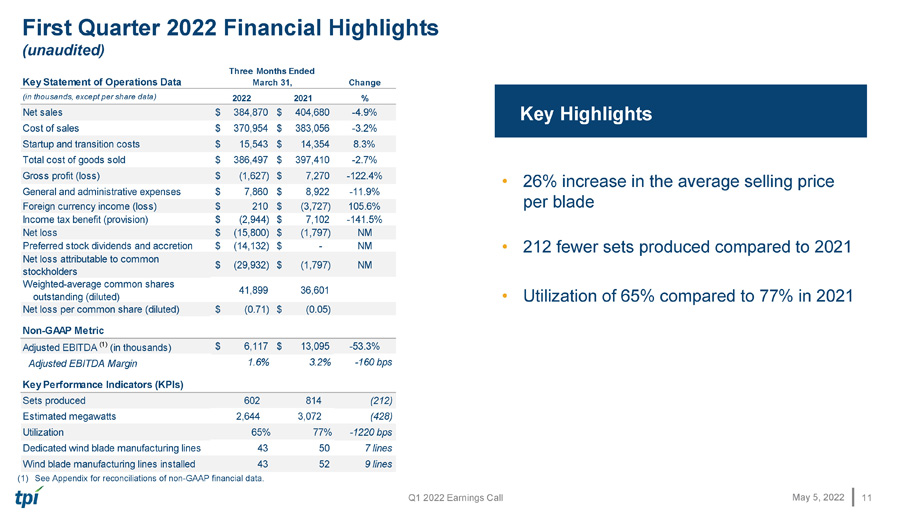
Q1 2022 Earnings Call May 5, 2022 First Quarter 2022 Financial Highlights (unaudited) 11 (1) See Appendix for reconciliations of non - GAAP financial data. Key Highlights • 26% increase in the average selling price per blade • 212 fewer sets produced compared to 2021 • Utilization of 65% compared to 77% in 2021 Key Statement of Operations Data Change (in thousands, except per share data) 2022 2021 % Net sales $ 384,870 $ 404,680 -4.9% Cost of sales $ 370,954 $ 383,056 -3.2% Startup and transition costs $ 15,543 $ 14,354 8.3% Total cost of goods sold $ 386,497 $ 397,410 -2.7% Gross profit (loss) $ (1,627) $ 7,270 -122.4% General and administrative expenses $ 7,860 $ 8,922 -11.9% Foreign currency income (loss) $ 210 $ (3,727) 105.6% Income tax benefit (provision) $ (2,944) $ 7,102 -141.5% Net loss $ (15,800) $ (1,797) NM Preferred stock dividends and accretion $ (14,132) $ - NM Net loss attributable to common stockholders $ (29,932) $ (1,797) NM Weighted-average common shares outstanding (diluted) 41,899 36,601 Net loss per common share (diluted) $ (0.71) $ (0.05) Non-GAAP Metric Adjusted EBITDA (1) (in thousands) $ 6,117 $ 13,095 -53.3% Adjusted EBITDA Margin 1.6% 3.2% -160 bps Key Performance Indicators (KPIs) Sets produced 602 814 (212) Estimated megawatts 2,644 3,072 (428) Utilization 65% 77% -1220 bps Dedicated wind blade manufacturing lines 43 50 7 lines Wind blade manufacturing lines installed 43 52 9 lines Three Months Ended March 31,
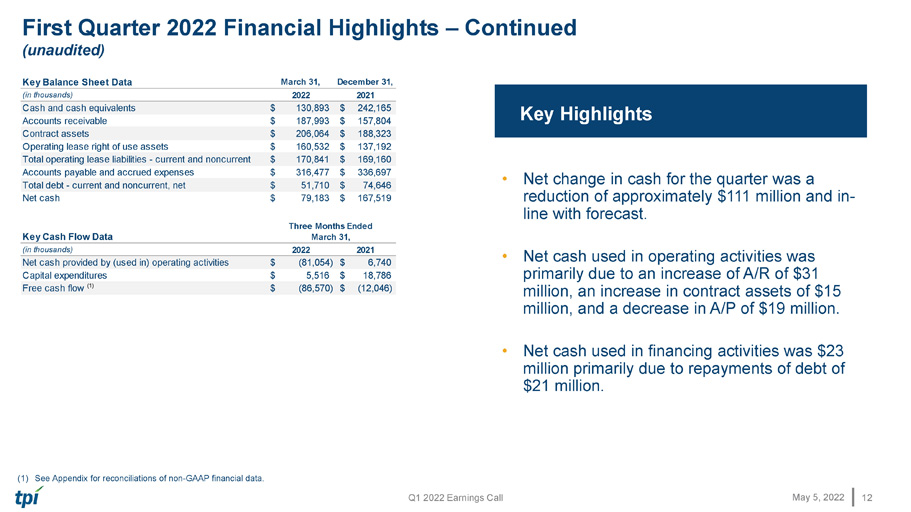
Q1 2022 Earnings Call May 5, 2022 First Quarter 2022 Financial Highlights – Continued (unaudited) 12 (1) See Appendix for reconciliations of non - GAAP financial data. Key Highlights • Net change in cash for the quarter was a reduction of approximately $111 million and in - line with forecast. • Net cash used in operating activities was primarily due to an increase of A/R of $31 million, an increase in contract assets of $15 million, and a decrease in A/P of $19 million. • Net cash used in financing activities was $23 million primarily due to repayments of debt of $21 million. Key Balance Sheet Data March 31, December 31, (in thousands) 2022 2021 Cash and cash equivalents $ 130,893 $ 242,165 Accounts receivable $ 187,993 $ 157,804 Contract assets $ 206,064 $ 188,323 Operating lease right of use assets $ 160,532 $ 137,192 Total operating lease liabilities - current and noncurrent $ 170,841 $ 169,160 Accounts payable and accrued expenses $ 316,477 $ 336,697 Total debt - current and noncurrent, net $ 51,710 $ 74,646 Net cash $ 79,183 $ 167,519 Key Cash Flow Data (in thousands) 2022 2021 Net cash provided by (used in) operating activities $ (81,054) $ 6,740 Capital expenditures $ 5,516 $ 18,786 Free cash flow (1) $ (86,570) $ (12,046) Three Months Ended March 31,

May 5, 2022 Q1 2022 Earnings Call 13 2022 Guidance Dedicated Manufacturing Lines Wind Blade Set Capacity Utilization % Average Sales per Blade Capital Expenditures 43 3,710 80% to 85% $170,000 to $180,000 $25 million to $30 million

May 5, 2022 Wrap Up
Q1 2022 Earnings Call May 5, 2022 Wrap Up 15 • Manage business through near - term challenges facing the industry • Position TPI as the preferred global solution provider to our customers • Thanks to our associates for their commitment and dedication to TPI and our mission to decarbonize and electrify

May 5, 2022 Q&A
May 5, 2022 Appendix – Non - GAAP Financial Information This presentation includes unaudited non - GAAP financial measures including EBITDA, adjusted EBITDA, net cash (debt) and free cash flow. We define EBITDA as net income (loss) plus interest expense (including losses on the extinguishment of debt and net of interest income), income taxes and depreciation and amortization. We define Adjusted EBITDA as EBITDA plus any share - based compensation expense, any foreign currency income or losses, any gains or losses on the sale of assets and asset impairments and any restructuring charges. We define net cash (debt) as total unrestricted cash and cash equivalents less the total principal amount of debt outstanding. We define free cash flow as net cash flow from operating activities less capital expenditures. We present non - GAAP measures when we believe that the additional information is useful and meaningful to investors. Non - GAAP financial measures do not have any standardized meaning and are therefore unlikely to be comparable to similar measures presented by other companies. The presentation of non - GAAP financial measures is not intended to be a substitute for, and should not be considered in isolation from, the financial measures reported in accordance with GAAP. See below for a reconciliation of certain non - GAAP financial measures to the comparable GAAP measures.

Q1 2022 Earnings Call May 5, 2022 (in thousands) 2022 2021 Net loss attributable to common stockholders (29,932)$ (1,797)$ Preferred stock dividends and accretion 14,132 - Net loss (15,800) (1,797) Adjustments: Depreciation and amortization 11,753 11,609 Interest expense, net 769 2,704 Income tax provision (benefit) 2,944 (7,102) EBITDA (334) 5,414 Share-based compensation expense 3,309 2,399 Foreign currency loss (income) (210) 3,727 Loss on sale of assets and asset impairments 959 1,297 Restructuring charges, net 2,393 258 Adjusted EBITDA 6,117$ 13,095$ Three Months Ended March 31, EBITDA and adjusted EBITDA are reconciled as follows: Net cash (debt) is reconciled as follows: Free cash flow is reconciled as follows: Non - GAAP Reconciliations (unaudited) 18 March 31, December 31, (in thousands) 2022 2021 Cash and cash equivalents 130,893$ 242,165$ Less total debt (51,710) (74,646) Net cash (debt) 79,183$ 167,519$ (in thousands) 2022 2021 Net cash provided by (used in) operating activities (81,054)$ 6,740$ Less capital expenditures (5,516) (18,786) Free cash flow (86,570)$ (12,046)$ Three Months Ended March 31,
