Exhibit 99.2

Q3 2022 Earnings Call November 3, 2022
Legal Disclaimer Q3 2022 Earnings Call November 3, 2022 2 This presentation contains forw ard - looking statements w ithin the meaning of the federal securities law . All statements other than statements of historical facts contained in this presentation, including statements regarding our future results of operations and financial position, business strategy and plans and objectives of management for future oper ations, are forw ard - looking statements. In many cases, you can identify forw ard - looking statements by terms such as “may,” “should,” “expects,” “plans,” “anticipates,” “could,” “intends,” “target,” “projects,” “contemplates,” “ believes,” “estimates,” “predicts,” “potential” or “continue” or the negative of these terms or other similar w ords. Forw ard - looking statements contained in this presentation include, but are not limited to, statements about: i. competition from other w ind blade and w ind blade turbine manufacturers; ii the discovery of defects in our products and our ability to estimate the future cost of w arranty campaigns; iii. the current state of the w ind energy market and our addressable market; iv. our ability to absorb or mitigate of inflation, including rising labor w ages, as w ell as the impact of price increases in resin, carbon reinforcements (or fiber), other raw materials and related logistics costs that w e use to produce our products; v. our ability to procure adequate supplies of raw materials and components in a cost - effective manner to fulfill our volume commitments to our customers; vi. the potential impact of the increasing prevalence of auction - based tenders in the w ind energy market and increased competition from solar energy on our gross margins and overall financial performance; vii. our future financial performance, including our net sales, cost of goods sold, gross profit or gross margin, operating expenses, ability to generate positive cash flow , and ability to achieve or maintain profitability; viii. changes in domestic or international government or regulatory policy, including w ithout limitation, changes in trade policy; ix. changes in global economic trends and uncertainty, geopolitical risks, and demand or supply disruptions from global events; x. the potential impact of the COVID - 19 pandemic on our business and results of operations; xi. the sufficiency of our cash and cash equivalents to meet our liquidity needs; xii. our ability to attract and retain customers for our products, and to optimize product pricing; xiii. our ability to effectively manage our strategy and future expenses, including our startup and transition costs; xiv. our ability to successfully expand in our existing w ind energy markets and into new international w ind energy markets, including our ability to expand our field service inspection and repair services business and manufacture w ind blades for offshore w ind energy projects; xv. our ability to successfully open new manufacturing facilities and expand existing facilities on time and on budget; xvi. the impact of the pace of new product and w ind blade model introductions on our business and our results of operations; xvii. our ability to successfully expand our transportation business and execute upon our strategy of entering new markets outside of w ind energy; xviii. our ability to maintain, protect and enhance our intellectual property; xix. our ability to comply w ith existing, modified or new law s and r egulations applying to our business, including the imposition of new taxes, duties or similar assessments on our products; xx. the attraction and retention of qualified employees and key personnel; xxi. our ability to maintain good w orking relationships w ith our employees, and avoid labor disruptions, strikes and other disputes w ith labor unions that represent certain of our employees; and xxii. the potential impact of one or more of our customers becoming bankrupt or insolvent, or experiencing other financial problems. These forward - looking statements are only predictions. These statements relate to future events or our future financial performance and involve know n and unknow n risks, uncertainties and other important factors that may cause our actual results, levels of activity, performance or achievements to materially differ fromany future results, levels of activity, performance or achievements expressed or implied by these forward - looking statements. Because forward - looking statements are inherently subject to risks and uncertainties, some of w hich cannot be predicted or quantified, you should not rely on these forward - looking statements as guarantees of future events. Further information on the factors, risks and uncertainties that could affect our financial results and the forward - looking statements in this presentation are included in our filings w ith the Securities and Exchange Commission and w ill be included in subsequent periodic and current reports w e make w ith the Securities and Exchange Commission fromtime to time, including in our Annual Report on Form 10 - K for the year ended December 31, 2021, filed w ith the Securities and Exchange Commission. The forw ard - looking statements in this presentation represent our view s as of the date of this presentation. We anticipate that subsequent events and developments w ill cause our view s to change. How ever, while we may elect to update these forward - looking statements at some point in the future, w e undertake no obligation to update any forward - looking statement to reflect events or developments after the date on w hich the statement is made or to reflect the occurrence of unanticipated events except to the extent required by applicable law . You should, therefore, not rely on these forward - looking statements as representing our views as of any date after the date of this presentation. Our forw ard - looking statements do not reflect the potential impact of any future acquisitions, mergers, dispositions, joint ventures, or investments w e may make. This presentation includes unaudited non - GAAPfinancial measures including EBITDA, adjusted EBITDA, net cash (debt) and free cash flow. We define EBITDA as net income (loss) plus interest expense (including losses on the extinguishment of debt and net of interest income), income taxes and depreciation and amortization. We define adjusted EBITDA as EBITDA plus any share - based compensation expense, any foreign currency income or losses, any gains or losses on the sale of assets and asset impairments and any restructuring charges. We define net cash (debt) as total unrestricted cash and cash equivalents less the total principal amount of debt outstanding. We define free cash flow as net cash flow fromoperating activities less capital expenditures. We present non - GAAPmeasures when we believe that the additional information is useful and meaningful to investors. Non - GAAPfinancial measures do not have any standardized meaning and are therefore unlikely to be comparable to similar measures presented by other companies. The presentation of non - GAAPfinancial measures is not intended to be a substitute for, and should not be considered in isolation from, the financial measures reported in accordance with GAAP. See the Appendix for the reconciliations of certain non - GAAPfinancial measures to the comparable GAAPmeasures. This presentation also contains estimates and other information concerning our industry that are based on industry publications, surveys and forecasts. This information involves a number of assumptions and limitations, and w e have not independently verified the accuracy or completeness of the information.
Agenda Q3 2022 Earnings Call November 3, 2022 3 • Q3 2022 Highlights and Business Update • Q3 2022 Financial Highlights and 2022 Guidance • Wrap Up • Q&A • Appendix – Non - GAAP Financial Information
Q3 2022 Highlights and Business Update November 3, 2022 4
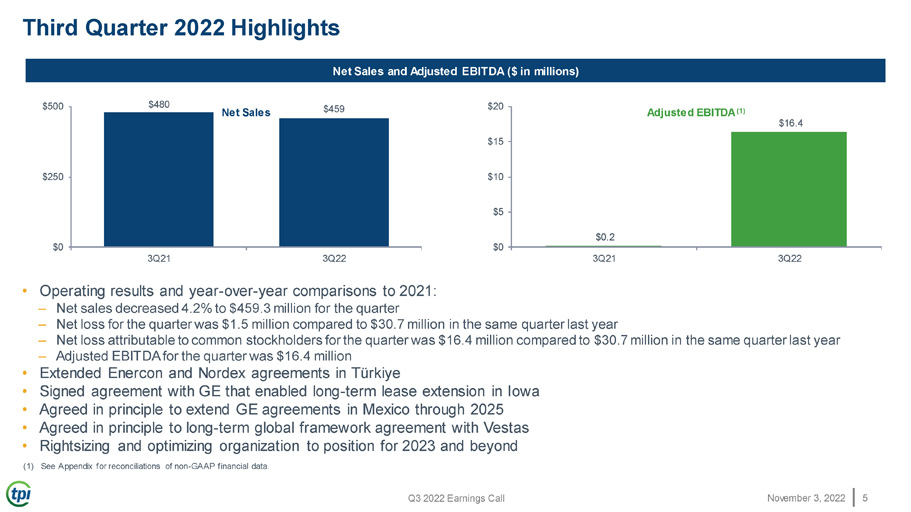
Third Quarter 2022 Highlights Net Sales and Adjusted EBITDA ($ in millions) • Operating results and year - over - year comparisons to 2021: – Net sales decreased 4.2% to $459.3 million for the quarter – Net loss for the quarter was $1.5 million compared to $30.7 million in the same quarter last year – Net loss attributable to common stockholders for the quarter was $16.4 million compared to $30.7 million in the same quarter last year – Adjusted EBITDA for the quarter was $16.4 million • Extended Enercon and Nordex agreements in Türkiye • Signed agreement with GE that enabled long - term lease extension in Iowa • Agreed in principle to extend GE agreements in Mexico through 2025 • Agreed in principle to long - term global framework agreement with Vestas • Rightsizing and optimizing organization to position for 2023 and beyond (1) See Appendix for reconciliations of non - GAAP financial data. $480 $459 $0 $250 $500 Net Sales $0.2 Q3 2022 Earnings Call November 3, 2022 5 $16.4 $0 3Q21 3Q22 3Q21 3Q22 $5 $10 $15 $20 Adjusted EBITDA (1)
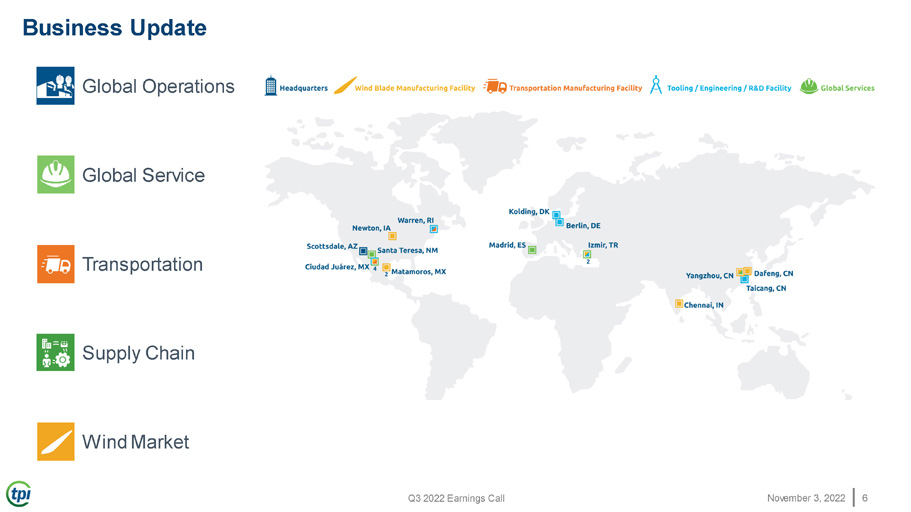
• Global Operations • Global Service • Transportation • Supply Chain • Wind Market Business Update Q3 2022 Earnings Call November 3, 2022 6
Q3 2022 Financial Highlights and 2022 Guidance November 3, 2022 7
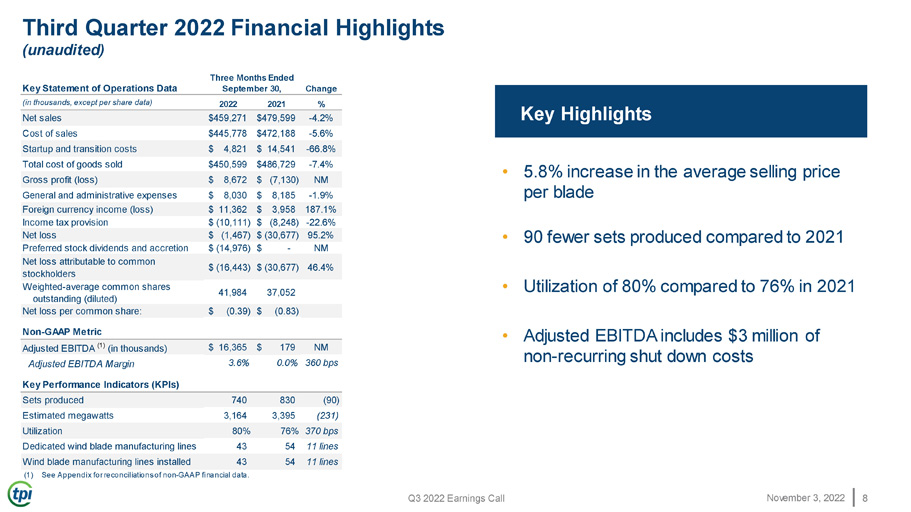
Third Quarter 2022 Financial Highlights (unaudited) Key Highlights • 5.8% increase in the average selling price per blade • 90 fewer sets produced compared to 2021 • Utilization of 80% compared to 76% in 2021 • Adjusted EBITDA includes $3 million of non - recurring shut down costs (in thousands, except per share data) 2022 2021 % Net sales $459,271 $479,599 - 4.2% Cost of sales $445,778 $472,188 - 5.6% Startup and transition costs $ 4,821 $ 14,541 - 66.8% Total cost of goods sold $450,599 $486,729 - 7.4% Gross profit (loss) $ 8,672 $ (7,130) NM General and administrative expenses $ 8,030 $ 8,185 - 1.9% Foreign currency income (loss) $ 11,362 $ 3,958 187.1% Income tax provision $ (10,111) $ (8,248) - 22.6% Net loss $ (1,467) $ (30,677) 95.2% Key Statement of Operations Data (1) See Appendix for reconciliations of non - GAAP financial data. Q3 2022 Earnings Call November 3, 2022 8 Change Preferred stock dividends and accretion Net loss attributable to common stockholders Weighted - average common shares outstanding (diluted) $ (14,976) $ - NM $ (16,443) $ (30,677) 46.4% 41,984 37,052 Net loss per common share: $ (0.39) $ (0.83) Non - GAAP Metric Adjusted EBITDA (1) (in thousands) $ 16,365 $ 179 NM Adjusted EBITDA Margin Key Performance Indicators (KPIs) 3.6% 0.0% 360 bps Sets produced 740 830 (90) Estimated megawatts 3,164 3,395 (231) Utilization 80% 76% 370 bps Dedicated wind blade manufacturing lines 43 54 11 lines Wind blade manufacturing lines installed 43 54 11 lines Three Months Ended September 30,
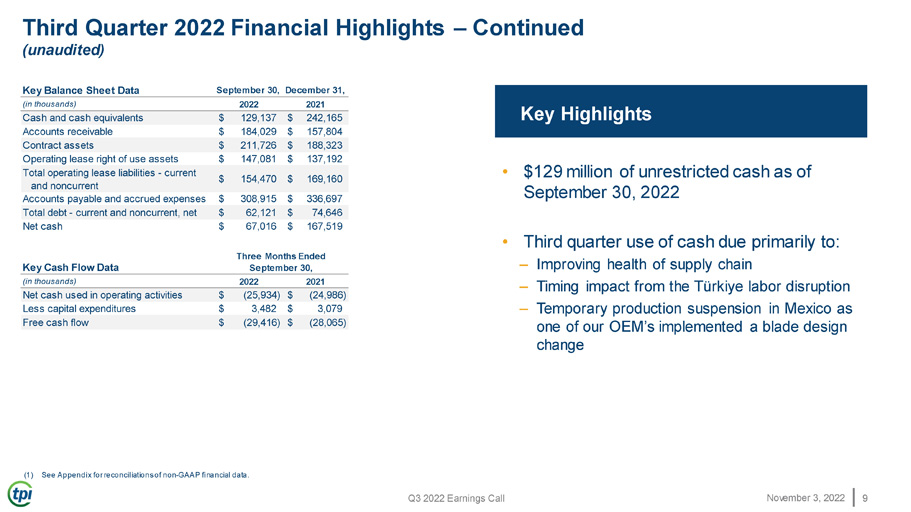
Third Quarter 2022 Financial Highlights – Continued (unaudited) Key Highlights • $129 million of unrestricted cash as of – Timing impact from the Türkiye labor disruption Temporary production suspension in Mexico as one of our OEM’s implemented a blade design change Key Balance Sheet Data September 30, December 31, (in thousands) 2022 2021 Cash and cash equivalents $ 129,137 $ 242,165 Accounts receivable $ 184,029 $ 157,804 Contract assets $ 211,726 $ 188,323 Operating lease right of use assets $ 147,081 $ 137,192 Total operating lease liabilities - current Net cash used in operating activities $ (25,934) $ (24,986) Less capital expenditures $ 3,482 $ 3,079 – Free cash flow $ (29,416) $ (28,065) and noncurrent Accounts payable and accrued expenses $ 154,470 $ 308,915 $ 169,160 $ 336,697 September 30, 2022 Total debt - current and noncurrent, net $ 62,121 $ 74,646 Net cash $ 67,016 $ 167,519 • Third quarter use of cash due primarily to: Three Months Ended Key Cash Flow Data September 30, – Improving health of supply chain (in thousands) 2022 2021 (1) See Appendix for reconciliations of non - GAAP financial data. Q3 2022 Earnings Call November 3, 2022 9
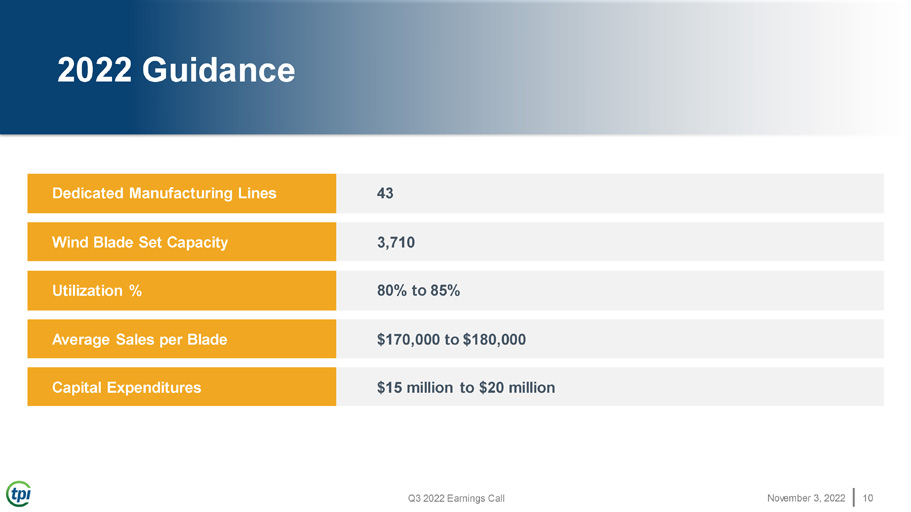
2022 Guidance Dedicated Manufacturing Lines Wind Blade Set Capacity Utilization % Q3 2022 Earnings Call November 3, 2022 10 Average Sales per Blade Capital Expenditures 43 3,710 80% to 85% $170,000 to $180,000 $15 million to $20 million

Wrap up November 3, 2022 11
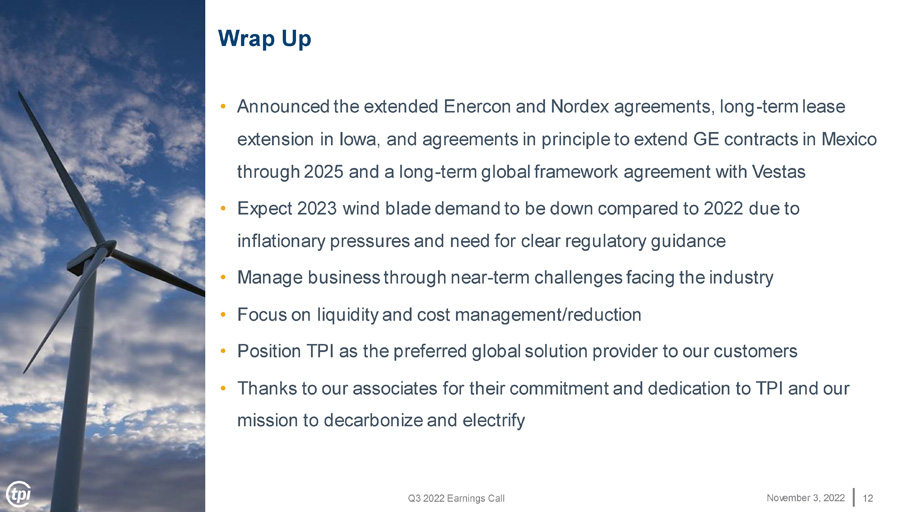
Q3 2022 Earnings Call November 3, 2022 12 Wrap Up • Announced the extended Enercon and Nordex agreements, long - term lease extension in Iowa, and agreements in principle to extend GE contracts in Mexico through 2025 and a long - term global framework agreement with Vestas • Expect 2023 wind blade demand to be down compared to 2022 due to inflationary pressures and need for clear regulatory guidance • Manage business through near - term challenges facing the industry • Focus on liquidity and cost management/reduction • Position TPI as the preferred global solution provider to our customers • Thanks to our associates for their commitment and dedication to TPI and our mission to decarbonize and electrify

Q&A November 3, 2022 13
Appendix – Non - GAAP Financial Information November 3, 2022 14 This presentation includes unaudited non - GAAP financial measures including EBITDA, adjusted EBITDA, net cash (debt) and free cash flow . We define EBITDA as net income (loss) plus interest expense (including losses on the extinguishment of debt and net of interest income), income taxes and depreciation and amortization. We define Adjusted EBITDA as EBITDA plus any share - based compensation expense, any foreign currency income or losses, any gains or losses on the sale of assets and asset impairments and any restructuring charges. We define net cash (debt) as total unrestricted cash and cash equivalents less the total principal amount of debt outstanding. We define free cash flow as net cash flow from operating activities less capital expenditures. We present non - GAAP measures when w e believe that the additional information is useful and meaningful to investors. Non - GAAP financial measures do not have any standardized meaning and are therefore unlikely to be comparable to similar measures presented by other companies. The presentation of non - GAAP financial measures is not intended to be a substitute for, and should not be considered in isolation from, the financial measures reported in accordance w ith GAAP. See below for a reconciliation of certain non - GAAP financial measures to the comparable GAAP measures.
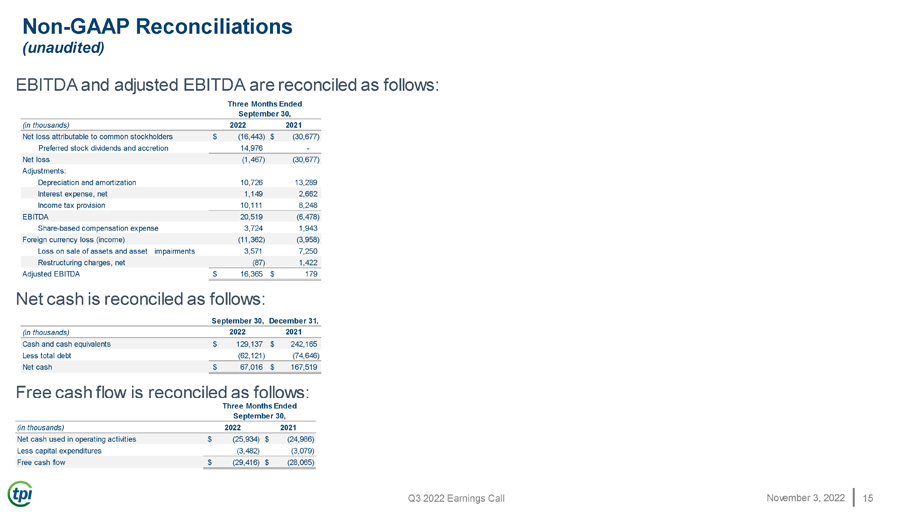
Q3 2022 Earnings Call November 3, 2022 15 Net cash is reconciled as follows: Free cash flow is reconciled as follows: (in thousands) 2022 2021 Net cash used in operating activities $ (25,934) $ (24,986) Less capital expenditures (3,482) (3,079) Free cash flow $ (29,416) $ (28,065) Three Months Ended September 30, September 30, December 31, (in thousands) 2022 2021 Cash and cash equivalents $ 129,137 $ 242,165 Less total debt (62,121) (74,646) Net cash $ 67,016 $ 167,519 (in thousands) 2022 2021 Net loss attributable to common stockholders $ (16,443) $ (30,677) Preferred stock dividends and accretion 14,976 - Net loss (1,467) (30,677) Adjustments: Depreciation and amortization 10,726 13,289 Interest expense, net 1,149 2,662 Income tax provision 10,111 8,248 EBITDA 20,519 (6,478) Share - based compensation expense 3,724 1,943 Foreign currency loss (income) (11,362) (3,958) Loss on sale of assets and asset impairments 3,571 7,250 Restructuring charges, net (87) 1,422 Adjusted EBITDA $ 16,365 $ 179 Non - GAAP Reconciliations (unaudited) EBITDA and adjusted EBITDA are reconciled as follows: Three Months Ended September 30,