
Exhibit 99.1 INVESTOR PRESENTATION Spring 2020Exhibit 99.1 INVESTOR PRESENTATION Spring 2020
Disclaimer This presentation contains statements about future events and expectations that constitute forward-looking statements. Forward-looking statements are based on our beliefs, assumptions and expectations of our future financial and operating performance and growth plans, taking into account the information currently available to us. These statements are not statements of historical fact. Forward-looking statements involve risks and uncertainties that may cause our actual results to differ materially from the expectations of future results we express or imply in any forward-looking statements, and you should not place undue reliance on such statements. Factors that could contribute to these differences include adverse economic or real estate developments in our geographic markets or the temperature-controlled warehouse industry; general economic conditions; risks associated with the ownership of real estate and temperature-controlled warehouses in particular; defaults or non-renewals of contracts with customers; potential bankruptcy or insolvency of our customers; uncertainty of revenues, given the nature of our customer contracts; increased interest rates and operating costs; our failure to obtain necessary outside financing; risks related to, or restrictions contained in, our debt financing; decreased storage rates or increased vacancy rates; risks related to current and potential international operations and properties; our failure to realize the intended benefits from our recent acquisitions, including synergies, or disruptions to our plans and operations or unknown or contingent liabilities related to our recent acquisitions; our failure to successfully integrate and operate acquired or developed properties or businesses, including but not limited to: Cloverleaf Cold Storage, Lanier Cold Storage, MHW Group Inc., Nova Cold Logistics, Newport Cold Storage and PortFresh Holdings, LLC; acquisition risks, including the failure of such acquisitions to perform in accordance with projections; risks related to expansions of existing properties and developments of new properties, including failure to meet budgeted or stabilized returns in respect thereof; difficulties in expanding our operations into new markets, including international markets; our failure to maintain our status as a REIT; our operating partnership’s failure to qualify as a partnership for federal income tax purposes; uncertainties and risks related to natural disasters and global climate change; possible environmental liabilities, including costs, fines or penalties that may be incurred due to necessary remediation of contamination of properties presently or previously owned by us; financial market fluctuations; actions by our competitors and their increasing ability to compete with us; labor and power costs; changes in real estate and zoning laws and increases in real property tax rates; the competitive environment in which we operate; our relationship with our employees, including the occurrence of any work stoppages or any disputes under our collective bargaining agreements; liabilities as a result of our participation in multi-employer pension plans; losses in excess of our insurance coverage; the cost and time requirements as a result of our operation as a publicly traded REIT; changes in foreign currency exchange rates; the impact of anti-takeover provisions in our constituent documents and under Maryland law, which could make an acquisition of us more difficult, limit attempts by our shareholders to replace our trustees and affect the price of our common shares; the potential dilutive effect of our common share offerings; and risks related to our forward sale agreement, including substantial dilution to our earnings per share or substantial cash payment obligations. Words such as “anticipates,” “believes,” “continues,” “estimates,” “expects,” “goal,” “objectives,” “intends,” “may,” “opportunity,” “plans,” “potential,” “near-term,” “long-term,” “projections,” “assumptions,” “projects,” “guidance,” “forecasts,” “outlook,” “target,” “trends,” “should,” “could,” “would,” “will” and similar expressions are intended to identify such forward-looking statements. Examples of forward-looking statements included in this presentation include, among others, statements about our expected expansion and development pipeline and our targeted return on invested capital on expansion and development opportunities. We qualify any forward-looking statements entirely by these cautionary factors. Other risks, uncertainties and factors, including those discussed under “Risk Factors” in our Annual Report on Form 10-K for the year ended December 31, 2019 and our other reports filed with the Securities and Exchange Commission, could cause our actual results to differ materially from those projected in any forward-looking statements we make. We assume no obligation to update or revise these forward-looking statements for any reason, or to update the reasons actual results could differ materially from those anticipated in these forward-looking statements, even if new information becomes available in the future.Disclaimer This presentation contains statements about future events and expectations that constitute forward-looking statements. Forward-looking statements are based on our beliefs, assumptions and expectations of our future financial and operating performance and growth plans, taking into account the information currently available to us. These statements are not statements of historical fact. Forward-looking statements involve risks and uncertainties that may cause our actual results to differ materially from the expectations of future results we express or imply in any forward-looking statements, and you should not place undue reliance on such statements. Factors that could contribute to these differences include adverse economic or real estate developments in our geographic markets or the temperature-controlled warehouse industry; general economic conditions; risks associated with the ownership of real estate and temperature-controlled warehouses in particular; defaults or non-renewals of contracts with customers; potential bankruptcy or insolvency of our customers; uncertainty of revenues, given the nature of our customer contracts; increased interest rates and operating costs; our failure to obtain necessary outside financing; risks related to, or restrictions contained in, our debt financing; decreased storage rates or increased vacancy rates; risks related to current and potential international operations and properties; our failure to realize the intended benefits from our recent acquisitions, including synergies, or disruptions to our plans and operations or unknown or contingent liabilities related to our recent acquisitions; our failure to successfully integrate and operate acquired or developed properties or businesses, including but not limited to: Cloverleaf Cold Storage, Lanier Cold Storage, MHW Group Inc., Nova Cold Logistics, Newport Cold Storage and PortFresh Holdings, LLC; acquisition risks, including the failure of such acquisitions to perform in accordance with projections; risks related to expansions of existing properties and developments of new properties, including failure to meet budgeted or stabilized returns in respect thereof; difficulties in expanding our operations into new markets, including international markets; our failure to maintain our status as a REIT; our operating partnership’s failure to qualify as a partnership for federal income tax purposes; uncertainties and risks related to natural disasters and global climate change; possible environmental liabilities, including costs, fines or penalties that may be incurred due to necessary remediation of contamination of properties presently or previously owned by us; financial market fluctuations; actions by our competitors and their increasing ability to compete with us; labor and power costs; changes in real estate and zoning laws and increases in real property tax rates; the competitive environment in which we operate; our relationship with our employees, including the occurrence of any work stoppages or any disputes under our collective bargaining agreements; liabilities as a result of our participation in multi-employer pension plans; losses in excess of our insurance coverage; the cost and time requirements as a result of our operation as a publicly traded REIT; changes in foreign currency exchange rates; the impact of anti-takeover provisions in our constituent documents and under Maryland law, which could make an acquisition of us more difficult, limit attempts by our shareholders to replace our trustees and affect the price of our common shares; the potential dilutive effect of our common share offerings; and risks related to our forward sale agreement, including substantial dilution to our earnings per share or substantial cash payment obligations. Words such as “anticipates,” “believes,” “continues,” “estimates,” “expects,” “goal,” “objectives,” “intends,” “may,” “opportunity,” “plans,” “potential,” “near-term,” “long-term,” “projections,” “assumptions,” “projects,” “guidance,” “forecasts,” “outlook,” “target,” “trends,” “should,” “could,” “would,” “will” and similar expressions are intended to identify such forward-looking statements. Examples of forward-looking statements included in this presentation include, among others, statements about our expected expansion and development pipeline and our targeted return on invested capital on expansion and development opportunities. We qualify any forward-looking statements entirely by these cautionary factors. Other risks, uncertainties and factors, including those discussed under “Risk Factors” in our Annual Report on Form 10-K for the year ended December 31, 2019 and our other reports filed with the Securities and Exchange Commission, could cause our actual results to differ materially from those projected in any forward-looking statements we make. We assume no obligation to update or revise these forward-looking statements for any reason, or to update the reasons actual results could differ materially from those anticipated in these forward-looking statements, even if new information becomes available in the future.

Key Investment Highlights Important First Mover Global Market Leader Infrastructure Supported Strong and Stable Food Advantage as the Only with Integrated Network by Best-in-Class IT and Industry Fundamentals Publicly Traded REIT of Strategically-Located, Operating Platforms Drive Growing Demand Focused on Temperature- High-Quality, “Mission- Provides a Significant for Our Business Controlled Warehouses Critical” Warehouses Competitive Advantage Experienced Substantial Internal and Management Team, External Growth Investment Grade, Alignment of Interest and Opportunities Expected Flexible Balance Sheet to Drive Attractive Best-In-Class Corporate Positioned for Growth Risk-Adjusted Returns Governance 1Key Investment Highlights Important First Mover Global Market Leader Infrastructure Supported Strong and Stable Food Advantage as the Only with Integrated Network by Best-in-Class IT and Industry Fundamentals Publicly Traded REIT of Strategically-Located, Operating Platforms Drive Growing Demand Focused on Temperature- High-Quality, “Mission- Provides a Significant for Our Business Controlled Warehouses Critical” Warehouses Competitive Advantage Experienced Substantial Internal and Management Team, External Growth Investment Grade, Alignment of Interest and Opportunities Expected Flexible Balance Sheet to Drive Attractive Best-In-Class Corporate Positioned for Growth Risk-Adjusted Returns Governance 1

Company Snapshot World’s largest publicly traded REIT focused on the ownership, operation, development and acquisition of temperature-controlled warehouses Portfolio Overview Warehouses Ownership Total Average Countries of Estimate of U.S. Number of Number of Type Capacity Facility Size Operation Market Share Customers Pallet Positions (1) (2) 178 143 owned , 1.1bn cubic feet 6mm cubic feet U.S., Australia, 27% ~2,500 ~3.6mm 24 capital / / 45mm square / 253K square New Zealand, operating leased, 11 feet feet Argentina and managed Canada (5) Financial Highlights FY 2019 Segment Breakdown (3) Total Enterprise Value $8.5bn (6) Revenue Contribution / NOI Warehouse Warehouse (3) Equity Market Cap $6.8bn 94% FY 2019 2019 AFFO per Share FY 2019 78% $1.17 TOTAL TOTAL CONTRIBUTION REVENUE Third-Party 14% (NOI) Managed $1,775mm $477mm 2019 Annualized Dividend per Share $0.80 2% 8% 4% Third-Party Transportation Managed (4) 2019 SS Revenue / NOI Growth Rate 3.5% / 5.1% Transportation Note: Figures as of December 31, 2019, unless otherwise indicated (1) Includes seven ground leased assets (2) IARW Top Companies in USA and North America, February 2020 and USDA Capacity of Refrigerated Warehouses, January 2020 2 (3) Based on COLD share price as of February 25, 2020 (4) Same store revenue and NOI growth rates on a constant currency basis (5) Excludes quarry business (6) Segment contribution refers to segment’s revenues less segment specific operating expenses (excludes any depreciation, depletion and amortization, impairment charges and corporate level SG&A). Contribution for our warehouse segment equates to net operating income (“NOI”)Company Snapshot World’s largest publicly traded REIT focused on the ownership, operation, development and acquisition of temperature-controlled warehouses Portfolio Overview Warehouses Ownership Total Average Countries of Estimate of U.S. Number of Number of Type Capacity Facility Size Operation Market Share Customers Pallet Positions (1) (2) 178 143 owned , 1.1bn cubic feet 6mm cubic feet U.S., Australia, 27% ~2,500 ~3.6mm 24 capital / / 45mm square / 253K square New Zealand, operating leased, 11 feet feet Argentina and managed Canada (5) Financial Highlights FY 2019 Segment Breakdown (3) Total Enterprise Value $8.5bn (6) Revenue Contribution / NOI Warehouse Warehouse (3) Equity Market Cap $6.8bn 94% FY 2019 2019 AFFO per Share FY 2019 78% $1.17 TOTAL TOTAL CONTRIBUTION REVENUE Third-Party 14% (NOI) Managed $1,775mm $477mm 2019 Annualized Dividend per Share $0.80 2% 8% 4% Third-Party Transportation Managed (4) 2019 SS Revenue / NOI Growth Rate 3.5% / 5.1% Transportation Note: Figures as of December 31, 2019, unless otherwise indicated (1) Includes seven ground leased assets (2) IARW Top Companies in USA and North America, February 2020 and USDA Capacity of Refrigerated Warehouses, January 2020 2 (3) Based on COLD share price as of February 25, 2020 (4) Same store revenue and NOI growth rates on a constant currency basis (5) Excludes quarry business (6) Segment contribution refers to segment’s revenues less segment specific operating expenses (excludes any depreciation, depletion and amortization, impairment charges and corporate level SG&A). Contribution for our warehouse segment equates to net operating income (“NOI”)
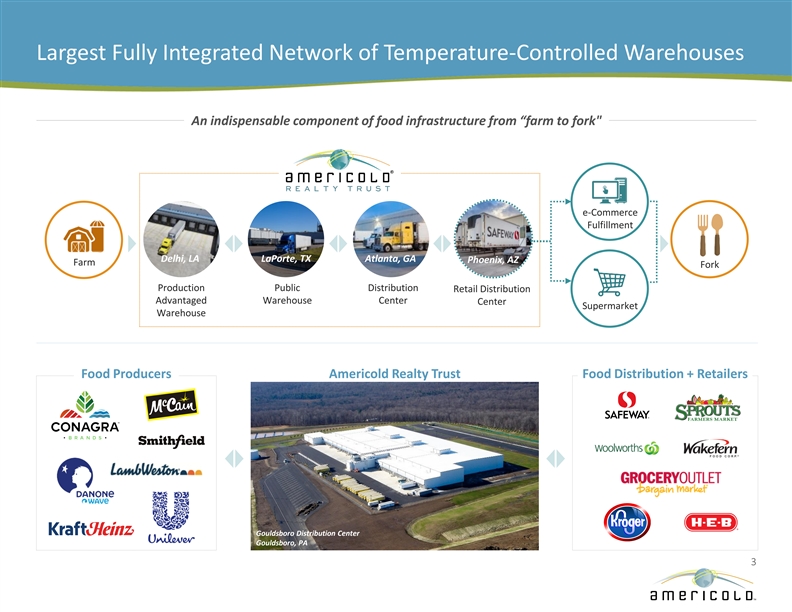
Largest Fully Integrated Network of Temperature-Controlled Warehouses An indispensable component of food infrastructure from “farm to fork e-Commerce Fulfillment Delhi, LA LaPorte, TX Atlanta, GA Phoenix, AZ Farm Fork Production Public Distribution Retail Distribution Advantaged Warehouse Center Center Supermarket Warehouse Food Producers Americold Realty Trust Food Distribution + Retailers Gouldsboro Distribution Center Gouldsboro, PA 3Largest Fully Integrated Network of Temperature-Controlled Warehouses An indispensable component of food infrastructure from “farm to fork e-Commerce Fulfillment Delhi, LA LaPorte, TX Atlanta, GA Phoenix, AZ Farm Fork Production Public Distribution Retail Distribution Advantaged Warehouse Center Center Supermarket Warehouse Food Producers Americold Realty Trust Food Distribution + Retailers Gouldsboro Distribution Center Gouldsboro, PA 3
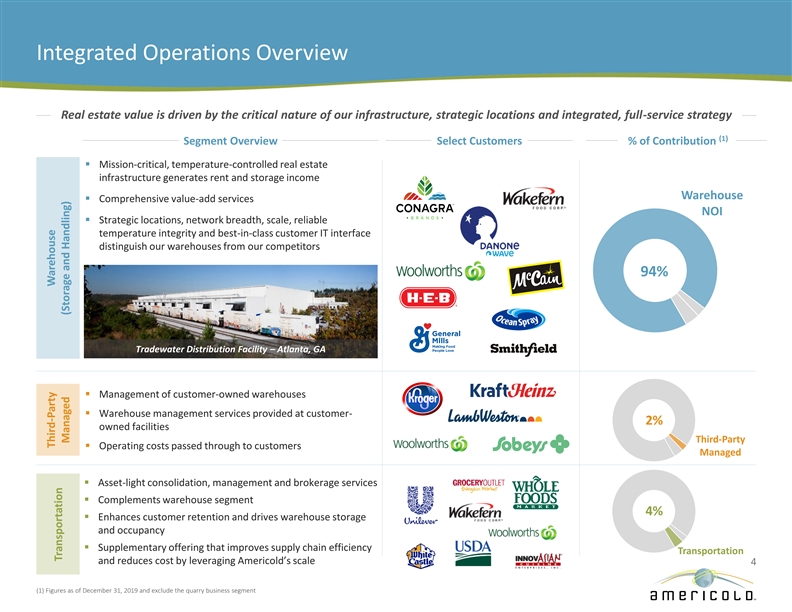
Integrated Operations Overview Real estate value is driven by the critical nature of our infrastructure, strategic locations and integrated, full-service strategy (1) Segment Overview Select Customers % of Contribution § Mission-critical, temperature-controlled real estate infrastructure generates rent and storage income Warehouse § Comprehensive value-add services NOI § Strategic locations, network breadth, scale, reliable temperature integrity and best-in-class customer IT interface distinguish our warehouses from our competitors 94% Third-Party Managed Transportation Tradewater Distribution Facility – Atlanta, GA Warehouse § Management of customer-owned warehouses § Warehouse management services provided at customer- 2% owned facilities Third-Party § Operating costs passed through to customers Managed § Asset-light consolidation, management and brokerage services § Complements warehouse segment 4% § Enhances customer retention and drives warehouse storage and occupancy § Supplementary offering that improves supply chain efficiency Transportation and reduces cost by leveraging Americold’s scale 4 (1) Figures as of December 31, 2019 and exclude the quarry business segment Third-Party Warehouse Transportation Managed (Storage and Handling)Integrated Operations Overview Real estate value is driven by the critical nature of our infrastructure, strategic locations and integrated, full-service strategy (1) Segment Overview Select Customers % of Contribution § Mission-critical, temperature-controlled real estate infrastructure generates rent and storage income Warehouse § Comprehensive value-add services NOI § Strategic locations, network breadth, scale, reliable temperature integrity and best-in-class customer IT interface distinguish our warehouses from our competitors 94% Third-Party Managed Transportation Tradewater Distribution Facility – Atlanta, GA Warehouse § Management of customer-owned warehouses § Warehouse management services provided at customer- 2% owned facilities Third-Party § Operating costs passed through to customers Managed § Asset-light consolidation, management and brokerage services § Complements warehouse segment 4% § Enhances customer retention and drives warehouse storage and occupancy § Supplementary offering that improves supply chain efficiency Transportation and reduces cost by leveraging Americold’s scale 4 (1) Figures as of December 31, 2019 and exclude the quarry business segment Third-Party Warehouse Transportation Managed (Storage and Handling)
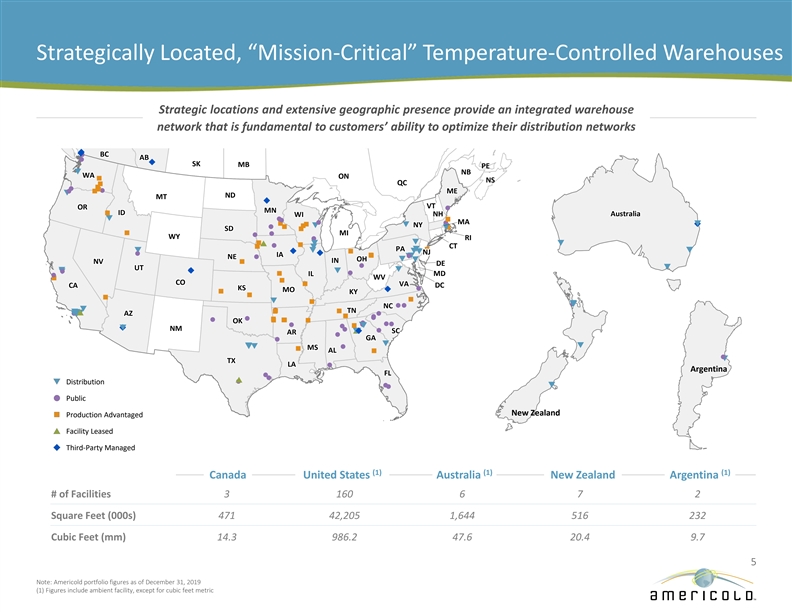
AK AK AK AK AK AK AK AK AK AK AK AK AK AK AK AK AK AK AK AK AK AK AK AK AK AK AK AK AK AK AK AK AK AK AK AK AK AK AK AK AK AK AK AK AK AK AK AK AK Strategically Located, “Mission-Critical” Temperature-Controlled Warehouses Strategic locations and extensive geographic presence provide an integrated warehouse network that is fundamental to customers’ ability to optimize their distribution networks u u BC BC BC BC BC BC BC BC BC BC BC BC BC BC BC BC BC BC BC BC BC BC BC BC BC BC BC BC BC BC BC BC BC BC BC BC BC BC BC BC BC BC l BC BC BC BC BC BC BC AB AB AB AB AB AB AB AB AB AB AB AB AB AB AB AB AB AB AB AB AB AB AB AB AB AB AB AB AB AB AB AB AB AB AB AB AB AB AB AB AB AB AB AB AB AB AB AB AB l u SK MB PE q NB WA WA WA WA WA WA WA WA WA WA WA WA WA WA WA WA WA WA WA WA WA WA WA WA WA WA WA WA WA WA WA WA WA WA WA WA WA WA WA WA WA WA WA WA WA WA WA WA WA ON n NS QC n n ln l ME ME ME ME ME ME ME ME ME ME ME ME ME ME ME ME ME ME ME ME ME ME ME ME ME ME ME ME ln ME ME ME ME ME ME ME ME ME ME ME ME ME ME ME ME ME ME ME ME ME q ND ND ND ND ND ND ND ND ND ND ND ND ND ND ND ND ND ND ND ND ND ND ND ND ND ND ND ND ND ND ND ND ND ND ND ND ND ND ND ND ND ND MT MT MT MT MT MT MT MT MT MT MT MT MT MT MT MT MT MT MT MT MT MT MT MT MT MT MT MT MT MT MT MT MT MT MT ND ND ND ND ND ND ND MT MT MT MT MT MT MT MT MT MT MT MT MT MT u VT VT VT VT VT VT VT VT VT VT VT VT VT VT VT VT VT VT VT VT VT VT VT VT VT VT VT VT OR OR OR OR OR OR OR OR OR OR OR OR OR OR OR OR OR OR OR OR OR VT VT VT VT VT VT VT VT VT VT VT VT VT VT VT VT VT VT VT VT VT OR OR OR OR OR OR OR OR OR OR OR OR OR OR OR OR OR OR OR OR OR OR OR OR OR OR OR OR l MN MN MN MN MN MN MN MN MN MN MN MN MN MN MN MN MN MN MN MN MN MN MN MN MN MN MN MN MN MN MN MN MN MN MN MN MN MN MN MN MN MN MN MN MN MN MN MN MN ID ID ID ID ID ID ID ID ID ID ID ID ID ID ID ID ID ID ID ID ID ID ID ID ID ID ID ID ID ID ID ID ID ID ID A A A A A A Aus us us us us us ust t t t t t tr r r r r r ral al al al al al aliiiiiiia a a a a a a n ID ID ID ID ID ID ID ID ID ID ID ID ID ID WI WI WI WI WI WI WI NH NH NH NH NH NH NH NH NH NH NH NH NH NH NH NH NH NH NH NH NH NH NH NH NH NH NH NH A A A A A A A A A A A A A A A A A A A A A A A A A A A Aus us us us us us us us us us us us us us us us us us us us us us us us us us us ust t t t t t t t t t t t t t t t t t t t t t t t t t t tr r r r r r r r r r r r r r r r r r r r r r r r r r r ral al al al al al al al al al al al al al al al al al al al al al al al al al al ali i i ii i i ii i i ii i i ii i i ii i i ii i i ia a a a a a a a a a a a a a a a a a a a a a a a a a a a WI WI WI WI WI WI WI WI WI WI WI WI WI WI WI WI WI WI WI WI WI WI WI WI WI WI WI WI NH NH NH NH NH NH NH NH NH NH NH NH NH NH NH NH NH NH NH NH NH A A A A A A A A A A A A A Aus us us us us us us us us us us us us ust t t t t t t t t t t t t tr r r r r r r r r r r r r ral al al al al al al al al al al al al ali ii ii ii ii ii ii ia a a a a a a a a a a a a a WI WI WI WI WI WI WI WI WI WI WI WI WI WI q lnn l l MA MA MA MA MA MA MA MA MA MA MA MA MA MA MA MA MA MA MA MA MA MA MA MA MA MA MA MA MA MA MA MA MA MA MA MA MA MA MA MA MA MA MA MA MA MA MA MA MA nllq nq NY NY NY NY NY NY NY NY NY NY NY NY NY NY NY NY NY NY NY NY NY NY NY NY NY NY NY NYu q NY NY NY NY NY NY NY NY NY NY NY NY NY NY NY NY NY NY NY NY NY n SD SD SD SD SD SD SDllnqn SD SD SD SD SD SD SD SD SD SD SD SD SD SD SD SD SD SD SD SD SD SD SD SD SD SD SD SD SD SD SD SD SD SD SD SD SD SD SD SD SD SDn MI MI MI MI MI MI MI MI MI MI MI MI MI MI MI MI MI MI MI MI MI MI MI MI MI MI MI MI n MI MI MI MI MI MI MI MI MI MI MI MI MI MI MI MI MI MI MI MI MI l WY WY WY WY WY WY WYl WY WY WY WY WY WY WY WY WY WY WY WY WY WY WY WY WY WY WY WY WY WY WY WY WY WY WY WY WY WY WY WY WY WY WY WY WY WY WY WY WY WY RI RI RI RI RI RI RI RI RI RI RI RI RI RI RI RI RI RI RI RI RI RI RI RI RI RI RI RI RI RI RI RI RI RI RI RI RI RI RI RI RI RI RI RI RI RI RI RI RI l q npqq n CT CT CT CT CT CT CT CT CT CT CT CT CT CT CT CT CT CT CT CT CT nnlqq CT CT CT CT CT CT CT CT CT CT CT CT CT CT CT CT CT CT CT CT CT CT CT CT CT CT CT CT PA PA PA PA PA PA PA PA PA PA PA PA PA PA PA PA PA PA PA PA PA PA PA PA PA PA PA PA PA PA PA PA PA PA PA PA PA PA PA PA PA PA PA PA PA PA PA PA PAqqn qqqqqq unqqNJ NJ NJ NJ NJ NJ NJ NJ NJ NJ NJ NJ NJ NJ NJ NJ NJ NJ NJ NJ NJ NJ NJ NJ NJ NJ NJ NJ NJ NJ NJ NJ NJ NJ NJ NJ NJ NJ NJ NJ NJ NJ NJ NJ NJ NJ NJ NJ NJ IA IA IA IA IA IA IAu l IA IA IA IA IA IA IA IA IA IA IA IA IA IA IA IA IA IA IA IA IA IA IA IA IA IA IA IA NE NE NE NE NE NE NE IA IA IA IA IA IA IA IA IA IA IA IA IA IAnnq NE NE NE NE NE NE NE NE NE NE NE NE NE NE NE NE NE NE NE NE NE NE NE NE NE NE NE NEql NE NE NE NE NE NE NE NE NE NE NE NE NE NEl OH OH OH OH OH OH OH OH OH OH OH OH OH OH OH OH OH OH OH OH OH OH OH OH OH OH OH OH IN IN IN IN IN IN IN IN IN IN IN IN IN IN OH OH OH OH OH OH OH OH OH OH OH OH OH OH OH OH OH OH OH OH OHqq NV NV NV NV NV NV NV NV NV NV NV NV NV NV IN IN IN IN IN IN IN IN IN IN IN IN IN IN IN IN IN IN IN IN IN IN IN IN IN IN IN IN NV NV NV NV NV NV NV NV NV NV NV NV NV NV NV NV NV NV NV NV NV NV NV NV NV NV NV NV IN IN IN IN IN IN IN NV NV NV NV NV NV NVn DE DE DE DE DE DE DE DE DE DE DE DE DE DE DE DE DE DE DE DE DE DE DE DE DE DE DE DE DE DE DE DE DE DE DE DE DE DE DE DE DE DE DE DE DE DE DE DE DE l UT UT UT UT UT UT UT UT UT UT UT UT UT UT UT UT UT UT UT UT UT UT UT UT UT UT UT UTq UT UT UT UT UT UT UT UT UT UT UT UT UT UT UT UT UT UT UT UT UT q qulq ql IL IL IL IL IL IL IL MD MD MD MD MD MD MD IL IL IL IL IL IL IL IL IL IL IL IL IL IL IL IL IL IL IL IL IL IL IL IL IL IL IL ILl MD MD MD MD MD MD MD MD MD MD MD MD MD MD MD MD MD MD MD MD MD MD MD MD MD MD MD MD n IL IL IL IL IL IL IL IL IL IL IL IL IL IL MD MD MD MD MD MD MD MD MD MD MD MD MD MD l WV WV WV WV WV WV WV WV WV WV WV WV WV WV WV WV WV WV WV WV WV WV WV WV WV WV WV WV WV WV WV WV WV WV WV WV WV WV WV WV WV WV WV WV WV WV WV WV WV n n CO CO CO CO CO CO CO CO CO CO CO CO CO CO CO CO CO CO CO CO CO CO CO CO CO CO CO CO CO CO CO CO CO CO CO CO CO CO CO CO CO CO CO CO CO CO CO CO CO VA VA VA VA VA VA VA VA VA VA VA VA VA VA VA VA VA VA VA VA VA VA VA VA VA VA VA VA CA CA CA CA CA CA CA CA CA CA CA CA CA CAn VA VA VA VA VA VA VA VA VA VA VA VA VA VA VA VA VA VA VA VA VA DC DC DC DC DC DC DC DC DC DC DC DC DC DC CA CA CA CA CA CA CA CA CA CA CA CA CA CA CA CA CA CA CA CA CA CA CA CA CA CA CA CA DC DC DC DC DC DC DC DC DC DC DC DC DC DC DC DC DC DC DC DC DC DC DC DC DC DC DC DC CA CA CA CA CA CA CA DC DC DC DC DC DC DC KS KS KS KS KS KS KS KS KS KS KS KS KS KS KS KS KS KS KS KS KS KS KS KS KS KS KS KS KS KS KS KS KS KS KS KS KS KS KS KS KS KS KS KS KS KS KS KS KS MO MO MO MO MO MO MOl MO MO MO MO MO MO MO MO MO MO MO MO MO MO MO MO MO MO MO MO MO MO MO MO MO MO MO MOu MO MO MO MO MO MO MO MO MO MO MO MO MO MO n KY KY KY KY KY KY KY KY KY KY KY KY KY KY KY KY KY KY KY KY KY KY KY KY KY KY KY KY KY KY KY KY KY KY KY KY KY KY KY KY KY KY KY KY KY KY KY KY KY n 8YX 8YX 8YX 8YX 8YX 8YX 8YX 8YX 8YX 8YX 8YX 8YX 8YX 8YX 8YX 8YX 8YX 8YX 8YX 8YX 8YXZ: Z: Z: Z: Z: Z: Z: Z: Z: Z: Z: Z: Z: Z: Z: Z: Z: Z: Z: Z: Z: 1287112_ 1287112_ 1287112_ 1287112_ 1287112_ 1287112_ 1287112_ 1287112_ 1287112_ 1287112_ 1287112_ 1287112_ 1287112_ 1287112_ 1287112_ 1287112_ 1287112_ 1287112_ 1287112_ 1287112_ 1287112_1.w 1.w 1.w 1.w 1.w 1.w 1.w 1.w 1.w 1.w 1.w 1.w 1.w 1.w 1.w 1.w 1.w 1.w 1.w 1.w 1.wor or or or or or or or or or or or or or or or or or or or or n 8YX 8YX 8YX 8YX 8YX 8YX 8YX 8YX 8YX 8YX 8YX 8YX 8YX 8YX 8YX 8YX 8YX 8YX 8YX 8YX 8YX 8YX 8YX 8YX 8YX 8YX 8YX 8YXZ: Z: Z: Z: Z: Z: Z: Z: Z: Z: Z: Z: Z: Z: Z: Z: Z: Z: Z: Z: Z: Z: Z: Z: Z: Z: Z: Z: 1287112_ 1287112_ 1287112_ 1287112_ 1287112_ 1287112_ 1287112_ 1287112_ 1287112_ 1287112_ 1287112_ 1287112_ 1287112_ 1287112_ 1287112_ 1287112_ 1287112_ 1287112_ 1287112_ 1287112_ 1287112_ 1287112_ 1287112_ 1287112_ 1287112_ 1287112_ 1287112_ 1287112_1.w 1.w 1.w 1.w 1.w 1.w 1.w 1.w 1.w 1.w 1.w 1.w 1.w 1.w 1.w 1.w 1.w 1.w 1.w 1.w 1.w 1.w 1.w 1.w 1.w 1.w 1.w 1.wor or or or or or or or or or or or or or or or or or or or or or or or or or or or n q n q qql NC NC NC NC NC NC NC NC NC NC NC NC NC NC NC NC NC NC NC NC NC NC NC NC NC NC NC NCll NC NC NC NC NC NC NC NC NC NC NC NC NC NC NC NC NC NC NC NC NC q TN TN TN TN TN TN TN TN TN TN TN TN TN TN l TN TN TN TN TN TN TN TN TN TN TN TN TN TN TN TN TN TN TN TN TN TN TN TN TN TN TN TN nnn TN TN TN TN TN TN TN qqqpqp AZ AZ AZ AZ AZ AZ AZ AZ AZ AZ AZ AZ AZ AZ qlq AZ AZ AZ AZ AZ AZ AZ AZ AZ AZ AZ AZ AZ AZ AZ AZ AZ AZ AZ AZ AZ AZ AZ AZ AZ AZ AZ AZ q AZ AZ AZ AZ AZ AZ AZl n l ll n l OK OK OK OK OK OK OK OK OK OK OK OK OK OK OK OK OK OK OK OK OK OK OK OK OK OK OK OKnnnnn OK OK OK OK OK OK OK OK OK OK OK OK OK OK OK OK OK OK OK OK OK l qlll lnq l uq NM NM NM NM NM NM NM NM NM NM NM NM NM NM NM NM NM NM NM NM NM NM NM NM NM NM NM NM NM NM NM NM NM NM NM NM NM NM NM NM NM NM NM NM NM NM NM NM NMl l SC SC SC SC SC SC SC SC SC SC SC SC SC SC SC SC SC SC SC SC SC SC SC SC SC SC SC SC AR AR AR AR AR AR AR AR AR AR AR AR AR AR AR AR AR AR AR AR ARqqqqpqul SC SC SC SC SC SC SC SC SC SC SC SC SC SC SC SC SC SC SC SC SC AR AR AR AR AR AR AR AR AR AR AR AR AR AR AR AR AR AR AR AR AR AR AR AR AR AR AR AR l GA GA GA GA GA GA GA GA GA GA GA GA GA GA GA GA GA GA GA GA GA GA GA GA GA GA GA GA GA GA GA GA GA GA GA GA GA GA GA GA GA GA GA GA GA GA GA GA GA l q q qqqqq MS MS MS MS MS MS MS MS MS MS MS MS MS MS MS MS MS MS MS MS MS MS MS MS MS MS MS MS MS MS MS MS MS MS MS MS MS MS MS MS MS MSl n MS MS MS MS MS MS MS AL AL AL AL AL AL AL AL AL AL AL AL AL AL AL AL AL AL AL AL AL AL AL AL AL AL AL AL AL AL AL AL AL AL AL AL AL AL AL AL AL AL AL AL AL AL AL AL ALn l q TX TX TX TX TX TX TX TX TX TX TX TX TX TX TX TX TX TX TX TX TX TX TX TX TX TX TX TX TX TX TX TX TX TX TX TX TX TX TX TX TX TX TX TX TX TX TX TX TX LA LA LA LA LA LA LA LA LA LA LA LA LA LA LA LA LA LA LA LA LA LA LA LA LA LA LA LA LA LA LA LA LA LA LA LA LA LA LA LA LA LA LA LA LA LA LA LA LAl Argentina FL FL FL FL FL FL FL FL FL FL FL FL FL FL FL FL FL FL FL FL FL FL FL FL FL FL FL FL FL FL FL FL FL FL FL FL FL FL FL FL FL FL FL FL FL FL FL FL FL l l p Distributionl lqq l Public New Zealand Production Advantaged Facility Leased 8YX 8YX 8YX 8YX 8YX 8YX 8YX 8YX 8YX 8YX 8YX 8YX 8YX 8YX 8YX 8YX 8YX 8YX 8YX 8YX 8YX 8YX 8YX 8YX 8YX 8YX 8YX 8YX 8YX 8YX 8YX 8YX 8YX 8YX 8YXZ: Z: Z: Z: Z: Z: Z: Z: Z: Z: Z: Z: Z: Z: Z: Z: Z: Z: Z: Z: Z: Z: Z: Z: Z: Z: Z: Z: Z: Z: Z: Z: Z: Z: Z: 1287112_ 1287112_ 1287112_ 1287112_ 1287112_ 1287112_ 1287112_ 1287112_ 1287112_ 1287112_ 1287112_ 1287112_ 1287112_ 1287112_ 1287112_ 1287112_ 1287112_ 1287112_ 1287112_ 1287112_ 1287112_ 1287112_ 1287112_ 1287112_ 1287112_ 1287112_ 1287112_ 1287112_ 1287112_ 1287112_ 1287112_ 1287112_ 1287112_ 1287112_ 1287112_1.wo 1.wo 1.wo 1.wo 1.wo 1.wo 1.wo 1.wo 1.wo 1.wo 1.wo 1.wo 1.wo 1.wo 1.wo 1.wo 1.wo 1.wo 1.wo 1.wo 1.wo 1.wo 1.wo 1.wo 1.wo 1.wo 1.wo 1.wo 1.wo 1.wo 1.wo 1.wo 1.wo 1.wo 1.wor r r r r r r r r r r r r r r r r r r r r r r r r r r r r r r r r r r 8YX 8YX 8YX 8YX 8YX 8YX 8YX 8YX 8YX 8YX 8YX 8YX 8YX 8YXZ: Z: Z: Z: Z: Z: Z: Z: Z: Z: Z: Z: Z: Z: 1287112_ 1287112_ 1287112_ 1287112_ 1287112_ 1287112_ 1287112_ 1287112_ 1287112_ 1287112_ 1287112_ 1287112_ 1287112_ 1287112_1.wo 1.wo 1.wo 1.wo 1.wo 1.wo 1.wo 1.wo 1.wo 1.wo 1.wo 1.wo 1.wo 1.wor r r r r r r r r r r r r r 8YX 8YX 8YX 8YX 8YX 8YX 8YX 8YX 8YX 8YX 8YX 8YX 8YX 8YX 8YX 8YX 8YX 8YX 8YX 8YX 8YXZ: Z: Z: Z: Z: Z: Z: Z: Z: Z: Z: Z: Z: Z: Z: Z: Z: Z: Z: Z: Z: 1287112_ 1287112_ 1287112_ 1287112_ 1287112_ 1287112_ 1287112_ 1287112_ 1287112_ 1287112_ 1287112_ 1287112_ 1287112_ 1287112_ 1287112_ 1287112_ 1287112_ 1287112_ 1287112_ 1287112_ 1287112_1.w 1.w 1.w 1.w 1.w 1.w 1.w 1.w 1.w 1.w 1.w 1.w 1.w 1.w 1.w 1.w 1.w 1.w 1.w 1.w 1.wor or or or or or or or or or or or or or or or or or or or or 8YX 8YX 8YX 8YX 8YX 8YX 8YX 8YX 8YX 8YX 8YX 8YX 8YX 8YX 8YX 8YX 8YX 8YX 8YX 8YX 8YX 8YX 8YX 8YX 8YX 8YX 8YX 8YXZ: Z: Z: Z: Z: Z: Z: Z: Z: Z: Z: Z: Z: Z: Z: Z: Z: Z: Z: Z: Z: Z: Z: Z: Z: Z: Z: Z: 1287112_ 1287112_ 1287112_ 1287112_ 1287112_ 1287112_ 1287112_ 1287112_ 1287112_ 1287112_ 1287112_ 1287112_ 1287112_ 1287112_ 1287112_ 1287112_ 1287112_ 1287112_ 1287112_ 1287112_ 1287112_ 1287112_ 1287112_ 1287112_ 1287112_ 1287112_ 1287112_ 1287112_1.w 1.w 1.w 1.w 1.w 1.w 1.w 1.w 1.w 1.w 1.w 1.w 1.w 1.w 1.w 1.w 1.w 1.w 1.w 1.w 1.w 1.w 1.w 1.w 1.w 1.w 1.w 1.wor or or or or or or or or or or or or or or or or or or or or or or or or or or or Third-Party Managed 8Y 8Y 8Y 8Y 8Y 8Y 8YXZ: XZ: XZ: XZ: XZ: XZ: XZ: 128711 128711 128711 128711 128711 128711 1287112_ 2_ 2_ 2_ 2_ 2_ 2_1.w 1.w 1.w 1.w 1.w 1.w 1.wor or or or or or or 8Y 8Y 8Y 8Y 8Y 8Y 8Y 8Y 8Y 8Y 8Y 8Y 8Y 8Y 8Y 8Y 8Y 8Y 8Y 8Y 8Y 8Y 8Y 8Y 8Y 8Y 8Y 8YXZ: XZ: XZ: XZ: XZ: XZ: XZ: XZ: XZ: XZ: XZ: XZ: XZ: XZ: XZ: XZ: XZ: XZ: XZ: XZ: XZ: XZ: XZ: XZ: XZ: XZ: XZ: XZ: 128711 128711 128711 128711 128711 128711 128711 128711 128711 128711 128711 128711 128711 128711 128711 128711 128711 128711 128711 128711 128711 128711 128711 128711 128711 128711 128711 1287112_ 2_ 2_ 2_ 2_ 2_ 2_ 2_ 2_ 2_ 2_ 2_ 2_ 2_ 2_ 2_ 2_ 2_ 2_ 2_ 2_ 2_ 2_ 2_ 2_ 2_ 2_ 2_1.w 1.w 1.w 1.w 1.w 1.w 1.w 1.w 1.w 1.w 1.w 1.w 1.w 1.w 1.w 1.w 1.w 1.w 1.w 1.w 1.w 1.w 1.w 1.w 1.w 1.w 1.w 1.wor or or or or or or or or or or or or or or or or or or or or or or or or or or or 8Y 8Y 8Y 8Y 8Y 8Y 8Y 8Y 8Y 8Y 8Y 8Y 8Y 8YXZ: XZ: XZ: XZ: XZ: XZ: XZ: XZ: XZ: XZ: XZ: XZ: XZ: XZ: 128711 128711 128711 128711 128711 128711 128711 128711 128711 128711 128711 128711 128711 1287112_ 2_ 2_ 2_ 2_ 2_ 2_ 2_ 2_ 2_ 2_ 2_ 2_ 2_1.w 1.w 1.w 1.w 1.w 1.w 1.w 1.w 1.w 1.w 1.w 1.w 1.w 1.wor or or or or or or or or or or or or or (1) (1) (1) Canada United States Australia New Zealand Argentina # of Facilities 3 160 6 7 2 Square Feet (000s) 471 42,205 1,644 516 232 Cubic Feet (mm) 14.3 986.2 47.6 20.4 9.7 5 Note: Americold portfolio figures as of December 31, 2019 (1) Figures include ambient facility, except for cubic feet metric AK AK AK AK AK AK AK AK AK AK AK AK AK AK AK AK AK AK AK AK AK AK AK AK AK AK AK AK AK AK AK AK AK AK AK AK AK AK AK AK AK AK AK AK AK AK AK AK AK Strategically Located, “Mission-Critical” Temperature-Controlled Warehouses Strategic locations and extensive geographic presence provide an integrated warehouse network that is fundamental to customers’ ability to optimize their distribution networks u u BC BC BC BC BC BC BC BC BC BC BC BC BC BC BC BC BC BC BC BC BC BC BC BC BC BC BC BC BC BC BC BC BC BC BC BC BC BC BC BC BC BC l BC BC BC BC BC BC BC AB AB AB AB AB AB AB AB AB AB AB AB AB AB AB AB AB AB AB AB AB AB AB AB AB AB AB AB AB AB AB AB AB AB AB AB AB AB AB AB AB AB AB AB AB AB AB AB AB l u SK MB PE q NB WA WA WA WA WA WA WA WA WA WA WA WA WA WA WA WA WA WA WA WA WA WA WA WA WA WA WA WA WA WA WA WA WA WA WA WA WA WA WA WA WA WA WA WA WA WA WA WA WA ON n NS QC n n ln l ME ME ME ME ME ME ME ME ME ME ME ME ME ME ME ME ME ME ME ME ME ME ME ME ME ME ME ME ln ME ME ME ME ME ME ME ME ME ME ME ME ME ME ME ME ME ME ME ME ME q ND ND ND ND ND ND ND ND ND ND ND ND ND ND ND ND ND ND ND ND ND ND ND ND ND ND ND ND ND ND ND ND ND ND ND ND ND ND ND ND ND ND MT MT MT MT MT MT MT MT MT MT MT MT MT MT MT MT MT MT MT MT MT MT MT MT MT MT MT MT MT MT MT MT MT MT MT ND ND ND ND ND ND ND MT MT MT MT MT MT MT MT MT MT MT MT MT MT u VT VT VT VT VT VT VT VT VT VT VT VT VT VT VT VT VT VT VT VT VT VT VT VT VT VT VT VT OR OR OR OR OR OR OR OR OR OR OR OR OR OR OR OR OR OR OR OR OR VT VT VT VT VT VT VT VT VT VT VT VT VT VT VT VT VT VT VT VT VT OR OR OR OR OR OR OR OR OR OR OR OR OR OR OR OR OR OR OR OR OR OR OR OR OR OR OR OR l MN MN MN MN MN MN MN MN MN MN MN MN MN MN MN MN MN MN MN MN MN MN MN MN MN MN MN MN MN MN MN MN MN MN MN MN MN MN MN MN MN MN MN MN MN MN MN MN MN ID ID ID ID ID ID ID ID ID ID ID ID ID ID ID ID ID ID ID ID ID ID ID ID ID ID ID ID ID ID ID ID ID ID ID A A A A A A Aus us us us us us ust t t t t t tr r r r r r ral al al al al al aliiiiiiia a a a a a a n ID ID ID ID ID ID ID ID ID ID ID ID ID ID WI WI WI WI WI WI WI NH NH NH NH NH NH NH NH NH NH NH NH NH NH NH NH NH NH NH NH NH NH NH NH NH NH NH NH A A A A A A A A A A A A A A A A A A A A A A A A A A A Aus us us us us us us us us us us us us us us us us us us us us us us us us us us ust t t t t t t t t t t t t t t t t t t t t t t t t t t tr r r r r r r r r r r r r r r r r r r r r r r r r r r ral al al al al al al al al al al al al al al al al al al al al al al al al al al ali i i ii i i ii i i ii i i ii i i ii i i ii i i ia a a a a a a a a a a a a a a a a a a a a a a a a a a a WI WI WI WI WI WI WI WI WI WI WI WI WI WI WI WI WI WI WI WI WI WI WI WI WI WI WI WI NH NH NH NH NH NH NH NH NH NH NH NH NH NH NH NH NH NH NH NH NH A A A A A A A A A A A A A Aus us us us us us us us us us us us us ust t t t t t t t t t t t t tr r r r r r r r r r r r r ral al al al al al al al al al al al al ali ii ii ii ii ii ii ia a a a a a a a a a a a a a WI WI WI WI WI WI WI WI WI WI WI WI WI WI q lnn l l MA MA MA MA MA MA MA MA MA MA MA MA MA MA MA MA MA MA MA MA MA MA MA MA MA MA MA MA MA MA MA MA MA MA MA MA MA MA MA MA MA MA MA MA MA MA MA MA MA nllq nq NY NY NY NY NY NY NY NY NY NY NY NY NY NY NY NY NY NY NY NY NY NY NY NY NY NY NY NYu q NY NY NY NY NY NY NY NY NY NY NY NY NY NY NY NY NY NY NY NY NY n SD SD SD SD SD SD SDllnqn SD SD SD SD SD SD SD SD SD SD SD SD SD SD SD SD SD SD SD SD SD SD SD SD SD SD SD SD SD SD SD SD SD SD SD SD SD SD SD SD SD SDn MI MI MI MI MI MI MI MI MI MI MI MI MI MI MI MI MI MI MI MI MI MI MI MI MI MI MI MI n MI MI MI MI MI MI MI MI MI MI MI MI MI MI MI MI MI MI MI MI MI l WY WY WY WY WY WY WYl WY WY WY WY WY WY WY WY WY WY WY WY WY WY WY WY WY WY WY WY WY WY WY WY WY WY WY WY WY WY WY WY WY WY WY WY WY WY WY WY WY WY RI RI RI RI RI RI RI RI RI RI RI RI RI RI RI RI RI RI RI RI RI RI RI RI RI RI RI RI RI RI RI RI RI RI RI RI RI RI RI RI RI RI RI RI RI RI RI RI RI l q npqq n CT CT CT CT CT CT CT CT CT CT CT CT CT CT CT CT CT CT CT CT CT nnlqq CT CT CT CT CT CT CT CT CT CT CT CT CT CT CT CT CT CT CT CT CT CT CT CT CT CT CT CT PA PA PA PA PA PA PA PA PA PA PA PA PA PA PA PA PA PA PA PA PA PA PA PA PA PA PA PA PA PA PA PA PA PA PA PA PA PA PA PA PA PA PA PA PA PA PA PA PAqqn qqqqqq unqqNJ NJ NJ NJ NJ NJ NJ NJ NJ NJ NJ NJ NJ NJ NJ NJ NJ NJ NJ NJ NJ NJ NJ NJ NJ NJ NJ NJ NJ NJ NJ NJ NJ NJ NJ NJ NJ NJ NJ NJ NJ NJ NJ NJ NJ NJ NJ NJ NJ IA IA IA IA IA IA IAu l IA IA IA IA IA IA IA IA IA IA IA IA IA IA IA IA IA IA IA IA IA IA IA IA IA IA IA IA NE NE NE NE NE NE NE IA IA IA IA IA IA IA IA IA IA IA IA IA IAnnq NE NE NE NE NE NE NE NE NE NE NE NE NE NE NE NE NE NE NE NE NE NE NE NE NE NE NE NEql NE NE NE NE NE NE NE NE NE NE NE NE NE NEl OH OH OH OH OH OH OH OH OH OH OH OH OH OH OH OH OH OH OH OH OH OH OH OH OH OH OH OH IN IN IN IN IN IN IN IN IN IN IN IN IN IN OH OH OH OH OH OH OH OH OH OH OH OH OH OH OH OH OH OH OH OH OHqq NV NV NV NV NV NV NV NV NV NV NV NV NV NV IN IN IN IN IN IN IN IN IN IN IN IN IN IN IN IN IN IN IN IN IN IN IN IN IN IN IN IN NV NV NV NV NV NV NV NV NV NV NV NV NV NV NV NV NV NV NV NV NV NV NV NV NV NV NV NV IN IN IN IN IN IN IN NV NV NV NV NV NV NVn DE DE DE DE DE DE DE DE DE DE DE DE DE DE DE DE DE DE DE DE DE DE DE DE DE DE DE DE DE DE DE DE DE DE DE DE DE DE DE DE DE DE DE DE DE DE DE DE DE l UT UT UT UT UT UT UT UT UT UT UT UT UT UT UT UT UT UT UT UT UT UT UT UT UT UT UT UTq UT UT UT UT UT UT UT UT UT UT UT UT UT UT UT UT UT UT UT UT UT q qulq ql IL IL IL IL IL IL IL MD MD MD MD MD MD MD IL IL IL IL IL IL IL IL IL IL IL IL IL IL IL IL IL IL IL IL IL IL IL IL IL IL IL ILl MD MD MD MD MD MD MD MD MD MD MD MD MD MD MD MD MD MD MD MD MD MD MD MD MD MD MD MD n IL IL IL IL IL IL IL IL IL IL IL IL IL IL MD MD MD MD MD MD MD MD MD MD MD MD MD MD l WV WV WV WV WV WV WV WV WV WV WV WV WV WV WV WV WV WV WV WV WV WV WV WV WV WV WV WV WV WV WV WV WV WV WV WV WV WV WV WV WV WV WV WV WV WV WV WV WV n n CO CO CO CO CO CO CO CO CO CO CO CO CO CO CO CO CO CO CO CO CO CO CO CO CO CO CO CO CO CO CO CO CO CO CO CO CO CO CO CO CO CO CO CO CO CO CO CO CO VA VA VA VA VA VA VA VA VA VA VA VA VA VA VA VA VA VA VA VA VA VA VA VA VA VA VA VA CA CA CA CA CA CA CA CA CA CA CA CA CA CAn VA VA VA VA VA VA VA VA VA VA VA VA VA VA VA VA VA VA VA VA VA DC DC DC DC DC DC DC DC DC DC DC DC DC DC CA CA CA CA CA CA CA CA CA CA CA CA CA CA CA CA CA CA CA CA CA CA CA CA CA CA CA CA DC DC DC DC DC DC DC DC DC DC DC DC DC DC DC DC DC DC DC DC DC DC DC DC DC DC DC DC CA CA CA CA CA CA CA DC DC DC DC DC DC DC KS KS KS KS KS KS KS KS KS KS KS KS KS KS KS KS KS KS KS KS KS KS KS KS KS KS KS KS KS KS KS KS KS KS KS KS KS KS KS KS KS KS KS KS KS KS KS KS KS MO MO MO MO MO MO MOl MO MO MO MO MO MO MO MO MO MO MO MO MO MO MO MO MO MO MO MO MO MO MO MO MO MO MO MOu MO MO MO MO MO MO MO MO MO MO MO MO MO MO n KY KY KY KY KY KY KY KY KY KY KY KY KY KY KY KY KY KY KY KY KY KY KY KY KY KY KY KY KY KY KY KY KY KY KY KY KY KY KY KY KY KY KY KY KY KY KY KY KY n 8YX 8YX 8YX 8YX 8YX 8YX 8YX 8YX 8YX 8YX 8YX 8YX 8YX 8YX 8YX 8YX 8YX 8YX 8YX 8YX 8YXZ: Z: Z: Z: Z: Z: Z: Z: Z: Z: Z: Z: Z: Z: Z: Z: Z: Z: Z: Z: Z: 1287112_ 1287112_ 1287112_ 1287112_ 1287112_ 1287112_ 1287112_ 1287112_ 1287112_ 1287112_ 1287112_ 1287112_ 1287112_ 1287112_ 1287112_ 1287112_ 1287112_ 1287112_ 1287112_ 1287112_ 1287112_1.w 1.w 1.w 1.w 1.w 1.w 1.w 1.w 1.w 1.w 1.w 1.w 1.w 1.w 1.w 1.w 1.w 1.w 1.w 1.w 1.wor or or or or or or or or or or or or or or or or or or or or n 8YX 8YX 8YX 8YX 8YX 8YX 8YX 8YX 8YX 8YX 8YX 8YX 8YX 8YX 8YX 8YX 8YX 8YX 8YX 8YX 8YX 8YX 8YX 8YX 8YX 8YX 8YX 8YXZ: Z: Z: Z: Z: Z: Z: Z: Z: Z: Z: Z: Z: Z: Z: Z: Z: Z: Z: Z: Z: Z: Z: Z: Z: Z: Z: Z: 1287112_ 1287112_ 1287112_ 1287112_ 1287112_ 1287112_ 1287112_ 1287112_ 1287112_ 1287112_ 1287112_ 1287112_ 1287112_ 1287112_ 1287112_ 1287112_ 1287112_ 1287112_ 1287112_ 1287112_ 1287112_ 1287112_ 1287112_ 1287112_ 1287112_ 1287112_ 1287112_ 1287112_1.w 1.w 1.w 1.w 1.w 1.w 1.w 1.w 1.w 1.w 1.w 1.w 1.w 1.w 1.w 1.w 1.w 1.w 1.w 1.w 1.w 1.w 1.w 1.w 1.w 1.w 1.w 1.wor or or or or or or or or or or or or or or or or or or or or or or or or or or or n q n q qql NC NC NC NC NC NC NC NC NC NC NC NC NC NC NC NC NC NC NC NC NC NC NC NC NC NC NC NCll NC NC NC NC NC NC NC NC NC NC NC NC NC NC NC NC NC NC NC NC NC q TN TN TN TN TN TN TN TN TN TN TN TN TN TN l TN TN TN TN TN TN TN TN TN TN TN TN TN TN TN TN TN TN TN TN TN TN TN TN TN TN TN TN nnn TN TN TN TN TN TN TN qqqpqp AZ AZ AZ AZ AZ AZ AZ AZ AZ AZ AZ AZ AZ AZ qlq AZ AZ AZ AZ AZ AZ AZ AZ AZ AZ AZ AZ AZ AZ AZ AZ AZ AZ AZ AZ AZ AZ AZ AZ AZ AZ AZ AZ q AZ AZ AZ AZ AZ AZ AZl n l ll n l OK OK OK OK OK OK OK OK OK OK OK OK OK OK OK OK OK OK OK OK OK OK OK OK OK OK OK OKnnnnn OK OK OK OK OK OK OK OK OK OK OK OK OK OK OK OK OK OK OK OK OK l qlll lnq l uq NM NM NM NM NM NM NM NM NM NM NM NM NM NM NM NM NM NM NM NM NM NM NM NM NM NM NM NM NM NM NM NM NM NM NM NM NM NM NM NM NM NM NM NM NM NM NM NM NMl l SC SC SC SC SC SC SC SC SC SC SC SC SC SC SC SC SC SC SC SC SC SC SC SC SC SC SC SC AR AR AR AR AR AR AR AR AR AR AR AR AR AR AR AR AR AR AR AR ARqqqqpqul SC SC SC SC SC SC SC SC SC SC SC SC SC SC SC SC SC SC SC SC SC AR AR AR AR AR AR AR AR AR AR AR AR AR AR AR AR AR AR AR AR AR AR AR AR AR AR AR AR l GA GA GA GA GA GA GA GA GA GA GA GA GA GA GA GA GA GA GA GA GA GA GA GA GA GA GA GA GA GA GA GA GA GA GA GA GA GA GA GA GA GA GA GA GA GA GA GA GA l q q qqqqq MS MS MS MS MS MS MS MS MS MS MS MS MS MS MS MS MS MS MS MS MS MS MS MS MS MS MS MS MS MS MS MS MS MS MS MS MS MS MS MS MS MSl n MS MS MS MS MS MS MS AL AL AL AL AL AL AL AL AL AL AL AL AL AL AL AL AL AL AL AL AL AL AL AL AL AL AL AL AL AL AL AL AL AL AL AL AL AL AL AL AL AL AL AL AL AL AL AL ALn l q TX TX TX TX TX TX TX TX TX TX TX TX TX TX TX TX TX TX TX TX TX TX TX TX TX TX TX TX TX TX TX TX TX TX TX TX TX TX TX TX TX TX TX TX TX TX TX TX TX LA LA LA LA LA LA LA LA LA LA LA LA LA LA LA LA LA LA LA LA LA LA LA LA LA LA LA LA LA LA LA LA LA LA LA LA LA LA LA LA LA LA LA LA LA LA LA LA LAl Argentina FL FL FL FL FL FL FL FL FL FL FL FL FL FL FL FL FL FL FL FL FL FL FL FL FL FL FL FL FL FL FL FL FL FL FL FL FL FL FL FL FL FL FL FL FL FL FL FL FL l l p Distributionl lqq l Public New Zealand Production Advantaged Facility Leased 8YX 8YX 8YX 8YX 8YX 8YX 8YX 8YX 8YX 8YX 8YX 8YX 8YX 8YX 8YX 8YX 8YX 8YX 8YX 8YX 8YX 8YX 8YX 8YX 8YX 8YX 8YX 8YX 8YX 8YX 8YX 8YX 8YX 8YX 8YXZ: Z: Z: Z: Z: Z: Z: Z: Z: Z: Z: Z: Z: Z: Z: Z: Z: Z: Z: Z: Z: Z: Z: Z: Z: Z: Z: Z: Z: Z: Z: Z: Z: Z: Z: 1287112_ 1287112_ 1287112_ 1287112_ 1287112_ 1287112_ 1287112_ 1287112_ 1287112_ 1287112_ 1287112_ 1287112_ 1287112_ 1287112_ 1287112_ 1287112_ 1287112_ 1287112_ 1287112_ 1287112_ 1287112_ 1287112_ 1287112_ 1287112_ 1287112_ 1287112_ 1287112_ 1287112_ 1287112_ 1287112_ 1287112_ 1287112_ 1287112_ 1287112_ 1287112_1.wo 1.wo 1.wo 1.wo 1.wo 1.wo 1.wo 1.wo 1.wo 1.wo 1.wo 1.wo 1.wo 1.wo 1.wo 1.wo 1.wo 1.wo 1.wo 1.wo 1.wo 1.wo 1.wo 1.wo 1.wo 1.wo 1.wo 1.wo 1.wo 1.wo 1.wo 1.wo 1.wo 1.wo 1.wor r r r r r r r r r r r r r r r r r r r r r r r r r r r r r r r r r r 8YX 8YX 8YX 8YX 8YX 8YX 8YX 8YX 8YX 8YX 8YX 8YX 8YX 8YXZ: Z: Z: Z: Z: Z: Z: Z: Z: Z: Z: Z: Z: Z: 1287112_ 1287112_ 1287112_ 1287112_ 1287112_ 1287112_ 1287112_ 1287112_ 1287112_ 1287112_ 1287112_ 1287112_ 1287112_ 1287112_1.wo 1.wo 1.wo 1.wo 1.wo 1.wo 1.wo 1.wo 1.wo 1.wo 1.wo 1.wo 1.wo 1.wor r r r r r r r r r r r r r 8YX 8YX 8YX 8YX 8YX 8YX 8YX 8YX 8YX 8YX 8YX 8YX 8YX 8YX 8YX 8YX 8YX 8YX 8YX 8YX 8YXZ: Z: Z: Z: Z: Z: Z: Z: Z: Z: Z: Z: Z: Z: Z: Z: Z: Z: Z: Z: Z: 1287112_ 1287112_ 1287112_ 1287112_ 1287112_ 1287112_ 1287112_ 1287112_ 1287112_ 1287112_ 1287112_ 1287112_ 1287112_ 1287112_ 1287112_ 1287112_ 1287112_ 1287112_ 1287112_ 1287112_ 1287112_1.w 1.w 1.w 1.w 1.w 1.w 1.w 1.w 1.w 1.w 1.w 1.w 1.w 1.w 1.w 1.w 1.w 1.w 1.w 1.w 1.wor or or or or or or or or or or or or or or or or or or or or 8YX 8YX 8YX 8YX 8YX 8YX 8YX 8YX 8YX 8YX 8YX 8YX 8YX 8YX 8YX 8YX 8YX 8YX 8YX 8YX 8YX 8YX 8YX 8YX 8YX 8YX 8YX 8YXZ: Z: Z: Z: Z: Z: Z: Z: Z: Z: Z: Z: Z: Z: Z: Z: Z: Z: Z: Z: Z: Z: Z: Z: Z: Z: Z: Z: 1287112_ 1287112_ 1287112_ 1287112_ 1287112_ 1287112_ 1287112_ 1287112_ 1287112_ 1287112_ 1287112_ 1287112_ 1287112_ 1287112_ 1287112_ 1287112_ 1287112_ 1287112_ 1287112_ 1287112_ 1287112_ 1287112_ 1287112_ 1287112_ 1287112_ 1287112_ 1287112_ 1287112_1.w 1.w 1.w 1.w 1.w 1.w 1.w 1.w 1.w 1.w 1.w 1.w 1.w 1.w 1.w 1.w 1.w 1.w 1.w 1.w 1.w 1.w 1.w 1.w 1.w 1.w 1.w 1.wor or or or or or or or or or or or or or or or or or or or or or or or or or or or Third-Party Managed 8Y 8Y 8Y 8Y 8Y 8Y 8YXZ: XZ: XZ: XZ: XZ: XZ: XZ: 128711 128711 128711 128711 128711 128711 1287112_ 2_ 2_ 2_ 2_ 2_ 2_1.w 1.w 1.w 1.w 1.w 1.w 1.wor or or or or or or 8Y 8Y 8Y 8Y 8Y 8Y 8Y 8Y 8Y 8Y 8Y 8Y 8Y 8Y 8Y 8Y 8Y 8Y 8Y 8Y 8Y 8Y 8Y 8Y 8Y 8Y 8Y 8YXZ: XZ: XZ: XZ: XZ: XZ: XZ: XZ: XZ: XZ: XZ: XZ: XZ: XZ: XZ: XZ: XZ: XZ: XZ: XZ: XZ: XZ: XZ: XZ: XZ: XZ: XZ: XZ: 128711 128711 128711 128711 128711 128711 128711 128711 128711 128711 128711 128711 128711 128711 128711 128711 128711 128711 128711 128711 128711 128711 128711 128711 128711 128711 128711 1287112_ 2_ 2_ 2_ 2_ 2_ 2_ 2_ 2_ 2_ 2_ 2_ 2_ 2_ 2_ 2_ 2_ 2_ 2_ 2_ 2_ 2_ 2_ 2_ 2_ 2_ 2_ 2_1.w 1.w 1.w 1.w 1.w 1.w 1.w 1.w 1.w 1.w 1.w 1.w 1.w 1.w 1.w 1.w 1.w 1.w 1.w 1.w 1.w 1.w 1.w 1.w 1.w 1.w 1.w 1.wor or or or or or or or or or or or or or or or or or or or or or or or or or or or 8Y 8Y 8Y 8Y 8Y 8Y 8Y 8Y 8Y 8Y 8Y 8Y 8Y 8YXZ: XZ: XZ: XZ: XZ: XZ: XZ: XZ: XZ: XZ: XZ: XZ: XZ: XZ: 128711 128711 128711 128711 128711 128711 128711 128711 128711 128711 128711 128711 128711 1287112_ 2_ 2_ 2_ 2_ 2_ 2_ 2_ 2_ 2_ 2_ 2_ 2_ 2_1.w 1.w 1.w 1.w 1.w 1.w 1.w 1.w 1.w 1.w 1.w 1.w 1.w 1.wor or or or or or or or or or or or or or (1) (1) (1) Canada United States Australia New Zealand Argentina # of Facilities 3 160 6 7 2 Square Feet (000s) 471 42,205 1,644 516 232 Cubic Feet (mm) 14.3 986.2 47.6 20.4 9.7 5 Note: Americold portfolio figures as of December 31, 2019 (1) Figures include ambient facility, except for cubic feet metric
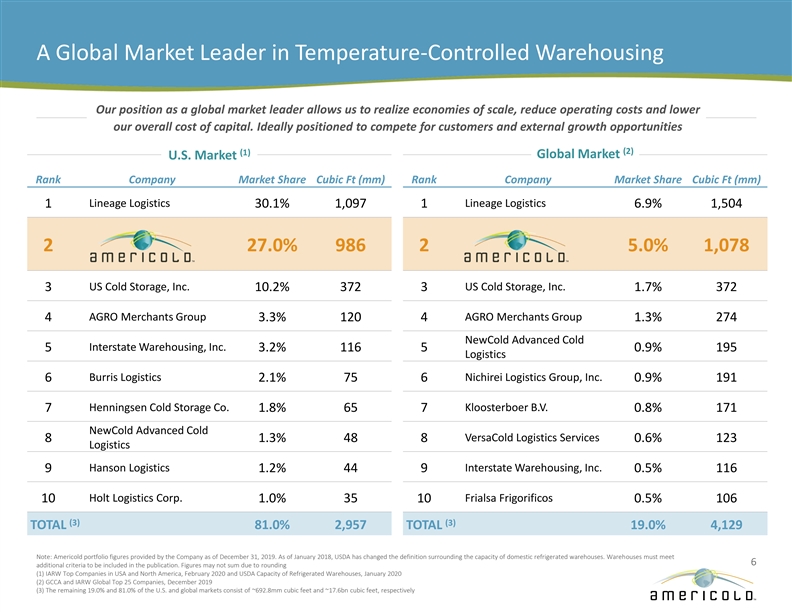
A Global Market Leader in Temperature-Controlled Warehousing Our position as a global market leader allows us to realize economies of scale, reduce operating costs and lower our overall cost of capital. Ideally positioned to compete for customers and external growth opportunities (2) (1) Global Market U.S. Market Rank Company Market Share Cubic Ft (mm) Rank Company Market Share Cubic Ft (mm) Lineage Logistics Lineage Logistics 1 30.1% 1,097 1 6.9% 1,504 2 27.0% 986 2 5.0% 1,078 US Cold Storage, Inc. US Cold Storage, Inc. 3 10.2% 372 3 1.7% 372 4 AGRO Merchants Group 3.3% 120 4 AGRO Merchants Group 1.3% 274 NewCold Advanced Cold Interstate Warehousing, Inc. 5 3.2% 116 5 0.9% 195 Logistics Burris Logistics Nichirei Logistics Group, Inc. 6 2.1% 75 6 0.9% 191 Henningsen Cold Storage Co. Kloosterboer B.V. 7 1.8% 65 7 0.8% 171 NewCold Advanced Cold VersaCold Logistics Services 8 1.3% 48 8 0.6% 123 Logistics 9 Hanson Logistics 1.2% 44 9 Interstate Warehousing, Inc. 0.5% 116 10 Holt Logistics Corp. 1.0% 35 Frialsa Frigorificos 10 0.5% 106 (3) (3) TOTAL 81.0% 2,957 TOTAL 19.0% 4,129 Note: Americold portfolio figures provided by the Company as of December 31, 2019. As of January 2018, USDA has changed the definition surrounding the capacity of domestic refrigerated warehouses. Warehouses must meet 6 additional criteria to be included in the publication. Figures may not sum due to rounding (1) IARW Top Companies in USA and North America, February 2020 and USDA Capacity of Refrigerated Warehouses, January 2020 (2) GCCA and IARW Global Top 25 Companies, December 2019 (3) The remaining 19.0% and 81.0% of the U.S. and global markets consist of ~692.8mm cubic feet and ~17.6bn cubic feet, respectivelyA Global Market Leader in Temperature-Controlled Warehousing Our position as a global market leader allows us to realize economies of scale, reduce operating costs and lower our overall cost of capital. Ideally positioned to compete for customers and external growth opportunities (2) (1) Global Market U.S. Market Rank Company Market Share Cubic Ft (mm) Rank Company Market Share Cubic Ft (mm) Lineage Logistics Lineage Logistics 1 30.1% 1,097 1 6.9% 1,504 2 27.0% 986 2 5.0% 1,078 US Cold Storage, Inc. US Cold Storage, Inc. 3 10.2% 372 3 1.7% 372 4 AGRO Merchants Group 3.3% 120 4 AGRO Merchants Group 1.3% 274 NewCold Advanced Cold Interstate Warehousing, Inc. 5 3.2% 116 5 0.9% 195 Logistics Burris Logistics Nichirei Logistics Group, Inc. 6 2.1% 75 6 0.9% 191 Henningsen Cold Storage Co. Kloosterboer B.V. 7 1.8% 65 7 0.8% 171 NewCold Advanced Cold VersaCold Logistics Services 8 1.3% 48 8 0.6% 123 Logistics 9 Hanson Logistics 1.2% 44 9 Interstate Warehousing, Inc. 0.5% 116 10 Holt Logistics Corp. 1.0% 35 Frialsa Frigorificos 10 0.5% 106 (3) (3) TOTAL 81.0% 2,957 TOTAL 19.0% 4,129 Note: Americold portfolio figures provided by the Company as of December 31, 2019. As of January 2018, USDA has changed the definition surrounding the capacity of domestic refrigerated warehouses. Warehouses must meet 6 additional criteria to be included in the publication. Figures may not sum due to rounding (1) IARW Top Companies in USA and North America, February 2020 and USDA Capacity of Refrigerated Warehouses, January 2020 (2) GCCA and IARW Global Top 25 Companies, December 2019 (3) The remaining 19.0% and 81.0% of the U.S. and global markets consist of ~692.8mm cubic feet and ~17.6bn cubic feet, respectively
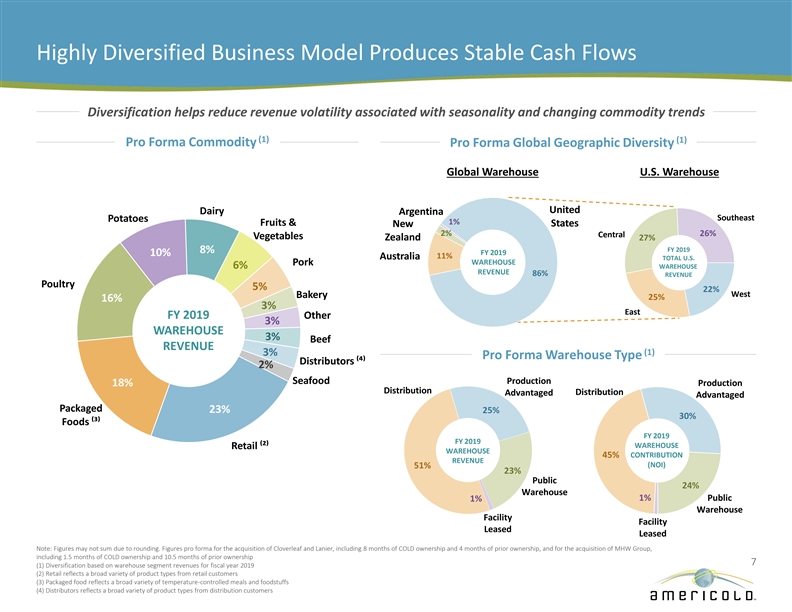
Highly Diversified Business Model Produces Stable Cash Flows Diversification helps reduce revenue volatility associated with seasonality and changing commodity trends (1) (1) Pro Forma Commodity Pro Forma Global Geographic Diversity Global Warehouse U.S. Warehouse United Dairy Argentina Southeast Potatoes 1% Fruits & New States 2% 26% Central Vegetables Zealand 27% FY 2019 8% FY 2019 10% 11% Australia TOTAL U.S. WAREHOUSE Pork 6% WAREHOUSE REVENUE 86% REVENUE Poultry 5% 22% West Bakery 25% 16% 3% East FY 2019 Other 3% WAREHOUSE 3% Beef REVENUE (1) 3% Pro Forma Warehouse Type Distributors ⁽⁴⁾ 2% Seafood Production 18% Production Distribution Distribution Advantaged Advantaged Packaged 23% 25% 30% Foods ⁽³⁾ FY 2019 FY 2019 WAREHOUSE Retail ⁽²⁾ WAREHOUSE 45% CONTRIBUTION REVENUE (NOI) 51% 23% Public 24% Warehouse 1% Public 1% Warehouse Facility Facility Leased Leased Note: Figures may not sum due to rounding. Figures pro forma for the acquisition of Cloverleaf and Lanier, including 8 months of COLD ownership and 4 months of prior ownership, and for the acquisition of MHW Group, including 1.5 months of COLD ownership and 10.5 months of prior ownership 7 (1) Diversification based on warehouse segment revenues for fiscal year 2019 (2) Retail reflects a broad variety of product types from retail customers (3) Packaged food reflects a broad variety of temperature-controlled meals and foodstuffs (4) Distributors reflects a broad variety of product types from distribution customersHighly Diversified Business Model Produces Stable Cash Flows Diversification helps reduce revenue volatility associated with seasonality and changing commodity trends (1) (1) Pro Forma Commodity Pro Forma Global Geographic Diversity Global Warehouse U.S. Warehouse United Dairy Argentina Southeast Potatoes 1% Fruits & New States 2% 26% Central Vegetables Zealand 27% FY 2019 8% FY 2019 10% 11% Australia TOTAL U.S. WAREHOUSE Pork 6% WAREHOUSE REVENUE 86% REVENUE Poultry 5% 22% West Bakery 25% 16% 3% East FY 2019 Other 3% WAREHOUSE 3% Beef REVENUE (1) 3% Pro Forma Warehouse Type Distributors ⁽⁴⁾ 2% Seafood Production 18% Production Distribution Distribution Advantaged Advantaged Packaged 23% 25% 30% Foods ⁽³⁾ FY 2019 FY 2019 WAREHOUSE Retail ⁽²⁾ WAREHOUSE 45% CONTRIBUTION REVENUE (NOI) 51% 23% Public 24% Warehouse 1% Public 1% Warehouse Facility Facility Leased Leased Note: Figures may not sum due to rounding. Figures pro forma for the acquisition of Cloverleaf and Lanier, including 8 months of COLD ownership and 4 months of prior ownership, and for the acquisition of MHW Group, including 1.5 months of COLD ownership and 10.5 months of prior ownership 7 (1) Diversification based on warehouse segment revenues for fiscal year 2019 (2) Retail reflects a broad variety of product types from retail customers (3) Packaged food reflects a broad variety of temperature-controlled meals and foodstuffs (4) Distributors reflects a broad variety of product types from distribution customers

Long Standing Relationships with Top 25 Customers Scope and scale of network coupled with long-standing relationships position us to grow market share organically and through acquisitions Representative Food Producers / CPG Companies Top 25 Customers Have been with Americold for an average of 30+ years (1) 14 customers are investment grade 100% utilize multiple facilities 100% utilize technology integration 92% utilize value-add services Representative Retailers / Distributors 84% utilize committed contracts or leases 60% are in fully dedicated sites 44% utilize transportation and consolidation services (2) 25 largest customers account for approximately 60% of warehouse (2) revenues, with no customer generating more than 8% of revenues 8 (1) Represents long-term issuer ratings as of 4Q19 (2) Based on fiscal year 2019 warehouse revenues as of December 31, 2019. Figures pro forma for the acquisition of Cloverleaf and Lanier, including 8 months of COLD ownership and 4 months of prior ownership, and for the acquisition of MHW Group, including 1.5 months of COLD ownership and 10.5 months of prior ownershipLong Standing Relationships with Top 25 Customers Scope and scale of network coupled with long-standing relationships position us to grow market share organically and through acquisitions Representative Food Producers / CPG Companies Top 25 Customers Have been with Americold for an average of 30+ years (1) 14 customers are investment grade 100% utilize multiple facilities 100% utilize technology integration 92% utilize value-add services Representative Retailers / Distributors 84% utilize committed contracts or leases 60% are in fully dedicated sites 44% utilize transportation and consolidation services (2) 25 largest customers account for approximately 60% of warehouse (2) revenues, with no customer generating more than 8% of revenues 8 (1) Represents long-term issuer ratings as of 4Q19 (2) Based on fiscal year 2019 warehouse revenues as of December 31, 2019. Figures pro forma for the acquisition of Cloverleaf and Lanier, including 8 months of COLD ownership and 4 months of prior ownership, and for the acquisition of MHW Group, including 1.5 months of COLD ownership and 10.5 months of prior ownership

Economic Occupancy Driving Improved Returns Implementation of our standard underwriting procedures has contributed to consistent occupancy growth over the last three years Economic Occupancy Network Average Economic & Physical Occupancy Trend § Significantly increased fixed commitment contracts in our portfolio 1Q 2Q 3Q 4Q Annual § Economic occupancy reflects the aggregate number of physically 84% 83% 81% 80% 80% 80% 79% 79% 77% occupied pallets and any additional pallets otherwise contractually 77% 82% 81% 81% 80% committed for a given period, without duplication 78% 77% 78% 77% 77% 76% 77% 76% 75% 76% 75% 76% 75% 74% 74% 73% Physical Occupancy § Typical optimal physical occupancy is ~85% to maximize four-wall cash flow / NOI o Varies based on several factors, including intended customer base, throughput maximization, seasonality and leased but '16 '17 '18 '19 '16 '17 '18 '19 '16 '17 '18 '19 '16 '17 '18 '19 '16 '17 '18 '19 unoccupied pallets Note: Dotted lines represent incremental average economic occupancy percentage (1) Illustrative Economic Occupancy 10,000 Warehouse Pallets 9,000 8,800 9,000 X Currently Economic Occupancy: 8,500 8,500 X X X X 8,300 8,300 Occupied 7,850 Contractually 8,000 7,600 Reserved Pallets X X 7,350 7,100 7,000 7,000 6,800 7,000 X X Physical Occupancy 6,000 X X X X 5,000 January February March April May June July August September October November December 9 (1) Example assumes 10,000 pallet positions and is for illustrative purposes onlyEconomic Occupancy Driving Improved Returns Implementation of our standard underwriting procedures has contributed to consistent occupancy growth over the last three years Economic Occupancy Network Average Economic & Physical Occupancy Trend § Significantly increased fixed commitment contracts in our portfolio 1Q 2Q 3Q 4Q Annual § Economic occupancy reflects the aggregate number of physically 84% 83% 81% 80% 80% 80% 79% 79% 77% occupied pallets and any additional pallets otherwise contractually 77% 82% 81% 81% 80% committed for a given period, without duplication 78% 77% 78% 77% 77% 76% 77% 76% 75% 76% 75% 76% 75% 74% 74% 73% Physical Occupancy § Typical optimal physical occupancy is ~85% to maximize four-wall cash flow / NOI o Varies based on several factors, including intended customer base, throughput maximization, seasonality and leased but '16 '17 '18 '19 '16 '17 '18 '19 '16 '17 '18 '19 '16 '17 '18 '19 '16 '17 '18 '19 unoccupied pallets Note: Dotted lines represent incremental average economic occupancy percentage (1) Illustrative Economic Occupancy 10,000 Warehouse Pallets 9,000 8,800 9,000 X Currently Economic Occupancy: 8,500 8,500 X X X X 8,300 8,300 Occupied 7,850 Contractually 8,000 7,600 Reserved Pallets X X 7,350 7,100 7,000 7,000 6,800 7,000 X X Physical Occupancy 6,000 X X X X 5,000 January February March April May June July August September October November December 9 (1) Example assumes 10,000 pallet positions and is for illustrative purposes only
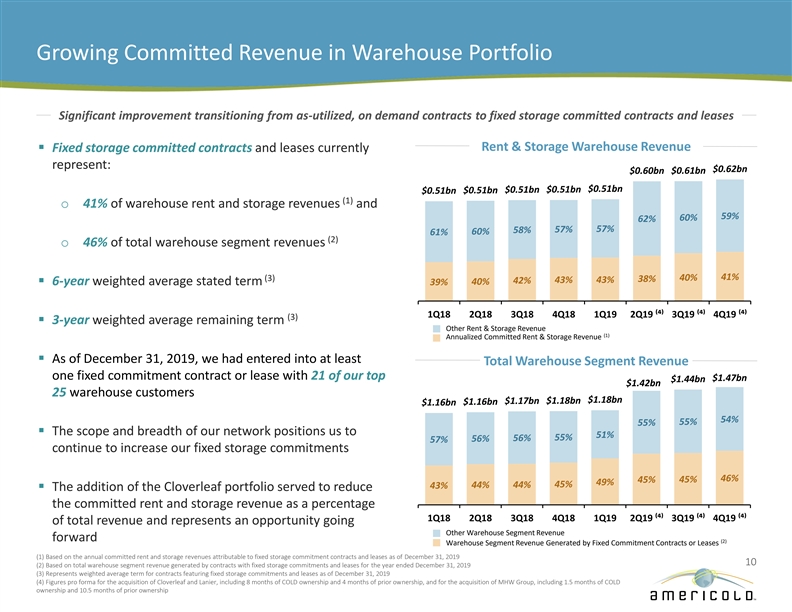
Growing Committed Revenue in Warehouse Portfolio Significant improvement transitioning from as-utilized, on demand contracts to fixed storage committed contracts and leases Rent & Storage Warehouse Revenue § Fixed storage committed contracts and leases currently represent: $0.62bn $0.60bn $0.61bn $0.51bn $0.51bn $0.51bn $0.51bn $0.51bn (1) o 41% of warehouse rent and storage revenues and 59% 60% 62% 57% 58% 57% 61% 60% (2) o 46% of total warehouse segment revenues 41% (3) 40% 38% 43% 43% 42% § 6-year weighted average stated term 39% 40% 1Q18 2Q18 3Q18 4Q18 1Q19 2Q19 ⁽⁴⁾ 3Q19 ⁽⁴⁾ 4Q19 ⁽⁴⁾ (3) § 3-year weighted average remaining term Other Rent & Storage Revenue (1) Annualized Committed Rent & Storage Revenue § As of December 31, 2019, we had entered into at least Total Warehouse Segment Revenue one fixed commitment contract or lease with 21 of our top $1.47bn $1.44bn $1.42bn 25 warehouse customers $1.18bn $1.17bn $1.18bn $1.16bn $1.16bn 54% 55% 55% § The scope and breadth of our network positions us to 51% 56% 55% 56% 57% continue to increase our fixed storage commitments 46% 45% 45% 49% 45% 44% 44% 43% § The addition of the Cloverleaf portfolio served to reduce the committed rent and storage revenue as a percentage 1Q18 2Q18 3Q18 4Q18 1Q19 2Q19 ⁽⁴⁾ 3Q19 ⁽⁴⁾ 4Q19 ⁽⁴⁾ of total revenue and represents an opportunity going Other Warehouse Segment Revenue forward (2) Warehouse Segment Revenue Generated by Fixed Commitment Contracts or Leases (1) Based on the annual committed rent and storage revenues attributable to fixed storage commitment contracts and leases as of December 31, 2019 10 (2) Based on total warehouse segment revenue generated by contracts with fixed storage commitments and leases for the year ended December 31, 2019 (3) Represents weighted average term for contracts featuring fixed storage commitments and leases as of December 31, 2019 (4) Figures pro forma for the acquisition of Cloverleaf and Lanier, including 8 months of COLD ownership and 4 months of prior ownership, and for the acquisition of MHW Group, including 1.5 months of COLD ownership and 10.5 months of prior ownershipGrowing Committed Revenue in Warehouse Portfolio Significant improvement transitioning from as-utilized, on demand contracts to fixed storage committed contracts and leases Rent & Storage Warehouse Revenue § Fixed storage committed contracts and leases currently represent: $0.62bn $0.60bn $0.61bn $0.51bn $0.51bn $0.51bn $0.51bn $0.51bn (1) o 41% of warehouse rent and storage revenues and 59% 60% 62% 57% 58% 57% 61% 60% (2) o 46% of total warehouse segment revenues 41% (3) 40% 38% 43% 43% 42% § 6-year weighted average stated term 39% 40% 1Q18 2Q18 3Q18 4Q18 1Q19 2Q19 ⁽⁴⁾ 3Q19 ⁽⁴⁾ 4Q19 ⁽⁴⁾ (3) § 3-year weighted average remaining term Other Rent & Storage Revenue (1) Annualized Committed Rent & Storage Revenue § As of December 31, 2019, we had entered into at least Total Warehouse Segment Revenue one fixed commitment contract or lease with 21 of our top $1.47bn $1.44bn $1.42bn 25 warehouse customers $1.18bn $1.17bn $1.18bn $1.16bn $1.16bn 54% 55% 55% § The scope and breadth of our network positions us to 51% 56% 55% 56% 57% continue to increase our fixed storage commitments 46% 45% 45% 49% 45% 44% 44% 43% § The addition of the Cloverleaf portfolio served to reduce the committed rent and storage revenue as a percentage 1Q18 2Q18 3Q18 4Q18 1Q19 2Q19 ⁽⁴⁾ 3Q19 ⁽⁴⁾ 4Q19 ⁽⁴⁾ of total revenue and represents an opportunity going Other Warehouse Segment Revenue forward (2) Warehouse Segment Revenue Generated by Fixed Commitment Contracts or Leases (1) Based on the annual committed rent and storage revenues attributable to fixed storage commitment contracts and leases as of December 31, 2019 10 (2) Based on total warehouse segment revenue generated by contracts with fixed storage commitments and leases for the year ended December 31, 2019 (3) Represents weighted average term for contracts featuring fixed storage commitments and leases as of December 31, 2019 (4) Figures pro forma for the acquisition of Cloverleaf and Lanier, including 8 months of COLD ownership and 4 months of prior ownership, and for the acquisition of MHW Group, including 1.5 months of COLD ownership and 10.5 months of prior ownership
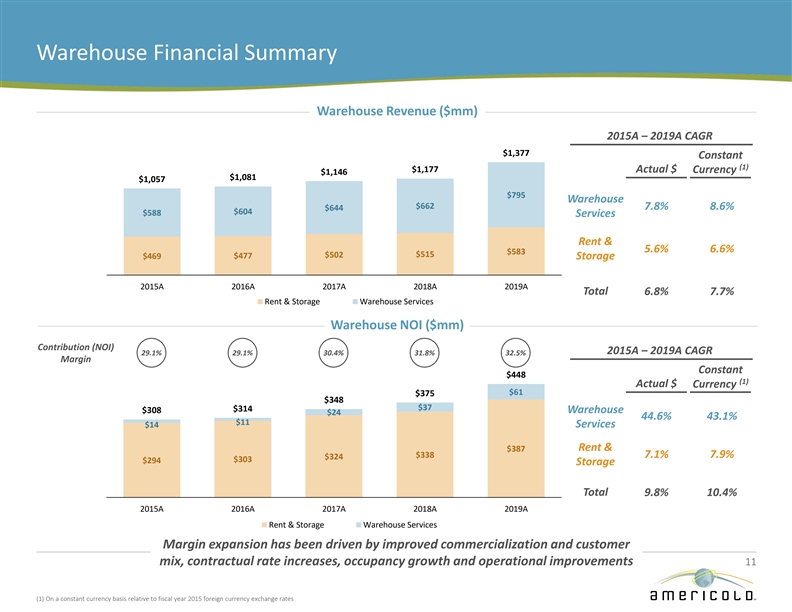
Warehouse Financial Summary Warehouse Revenue ($mm) 2015A – 2019A CAGR $1,377 Constant (1) $1,177 Actual $ Currency $1,146 $1,081 $1,057 $795 Warehouse $662 7.8% 8.6% $644 $604 $588 Services Rent & 5.6% 6.6% $583 $515 $502 $469 $477 Storage 2015A 2016A 2017A 2018A 2019A Total 6.8% 7.7% Rent & Storage Warehouse Services Warehouse NOI ($mm) Contribution (NOI) 2015A – 2019A CAGR 29.1% 29.1% 30.4% 31.8% 32.5% Margin Constant $448 (1) Actual $ Currency $61 $375 $348 $37 $314 $308 Warehouse $24 44.6% 43.1% $11 $14 Services Rent & $387 $338 7.1% 7.9% $324 $303 $294 Storage Total 9.8% 10.4% 2015A 2016A 2017A 2018A 2019A Rent & Storage Warehouse Services Margin expansion has been driven by improved commercialization and customer mix, contractual rate increases, occupancy growth and operational improvements 11 (1) On a constant currency basis relative to fiscal year 2015 foreign currency exchange rates Warehouse Financial Summary Warehouse Revenue ($mm) 2015A – 2019A CAGR $1,377 Constant (1) $1,177 Actual $ Currency $1,146 $1,081 $1,057 $795 Warehouse $662 7.8% 8.6% $644 $604 $588 Services Rent & 5.6% 6.6% $583 $515 $502 $469 $477 Storage 2015A 2016A 2017A 2018A 2019A Total 6.8% 7.7% Rent & Storage Warehouse Services Warehouse NOI ($mm) Contribution (NOI) 2015A – 2019A CAGR 29.1% 29.1% 30.4% 31.8% 32.5% Margin Constant $448 (1) Actual $ Currency $61 $375 $348 $37 $314 $308 Warehouse $24 44.6% 43.1% $11 $14 Services Rent & $387 $338 7.1% 7.9% $324 $303 $294 Storage Total 9.8% 10.4% 2015A 2016A 2017A 2018A 2019A Rent & Storage Warehouse Services Margin expansion has been driven by improved commercialization and customer mix, contractual rate increases, occupancy growth and operational improvements 11 (1) On a constant currency basis relative to fiscal year 2015 foreign currency exchange rates
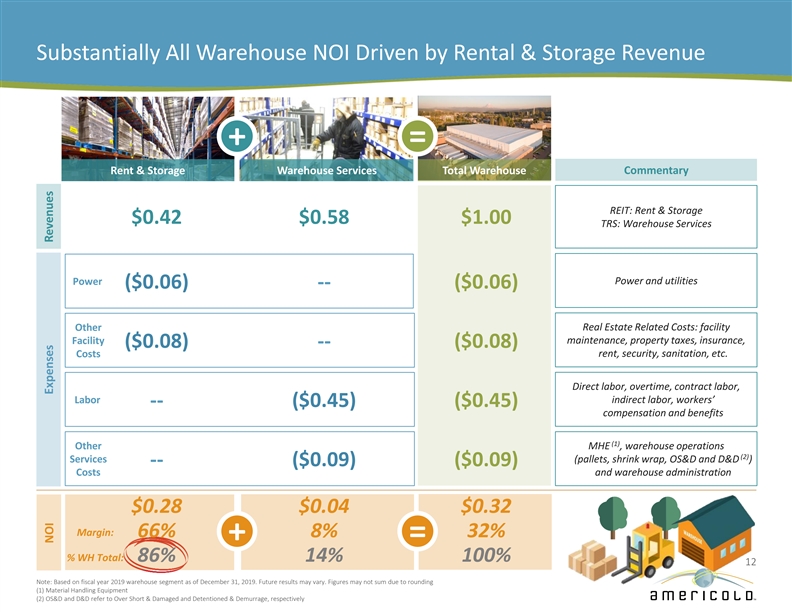
Substantially All Warehouse NOI Driven by Rental & Storage Revenue + = Rent & Storage Warehouse Services Total Warehouse Commentary REIT: Rent & Storage $0.42 $0.58 $1.00 TRS: Warehouse Services Power and utilities Power ($0.06) -- ($0.06) Other Real Estate Related Costs: facility Facility maintenance, property taxes, insurance, ($0.08) -- ($0.08) Costs rent, security, sanitation, etc. Direct labor, overtime, contract labor, Labor indirect labor, workers’ -- ($0.45) ($0.45) compensation and benefits (1) Other MHE , warehouse operations (2) Services (pallets, shrink wrap, OS&D and D&D ) -- ($0.09) ($0.09) Costs and warehouse administration $0.28 $0.04 $0.32 Margin: 66% 8% 32% + = % WH Total: 86% 14% 100% 12 Note: Based on fiscal year 2019 warehouse segment as of December 31, 2019. Future results may vary. Figures may not sum due to rounding (1) Material Handling Equipment (2) OS&D and D&D refer to Over Short & Damaged and Detentioned & Demurrage, respectively NOI Expenses RevenuesSubstantially All Warehouse NOI Driven by Rental & Storage Revenue + = Rent & Storage Warehouse Services Total Warehouse Commentary REIT: Rent & Storage $0.42 $0.58 $1.00 TRS: Warehouse Services Power and utilities Power ($0.06) -- ($0.06) Other Real Estate Related Costs: facility Facility maintenance, property taxes, insurance, ($0.08) -- ($0.08) Costs rent, security, sanitation, etc. Direct labor, overtime, contract labor, Labor indirect labor, workers’ -- ($0.45) ($0.45) compensation and benefits (1) Other MHE , warehouse operations (2) Services (pallets, shrink wrap, OS&D and D&D ) -- ($0.09) ($0.09) Costs and warehouse administration $0.28 $0.04 $0.32 Margin: 66% 8% 32% + = % WH Total: 86% 14% 100% 12 Note: Based on fiscal year 2019 warehouse segment as of December 31, 2019. Future results may vary. Figures may not sum due to rounding (1) Material Handling Equipment (2) OS&D and D&D refer to Over Short & Damaged and Detentioned & Demurrage, respectively NOI Expenses Revenues
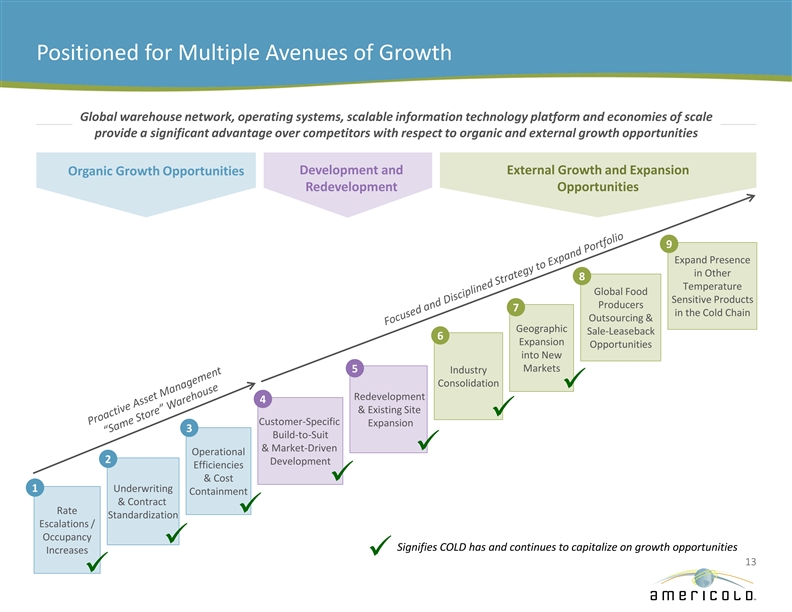
Positioned for Multiple Avenues of Growth Global warehouse network, operating systems, scalable information technology platform and economies of scale provide a significant advantage over competitors with respect to organic and external growth opportunities Development and External Growth and Expansion Organic Growth Opportunities Redevelopment Opportunities 9 Expand Presence in Other 8 Temperature Global Food Sensitive Products Producers 7 in the Cold Chain Outsourcing & Geographic Sale-Leaseback 6 Expansion Opportunities into New 5 Markets Industry Consolidation ü Redevelopment 4 & Existing Site ü Customer-Specific Expansion 3 Build-to-Suit & Market-Driven ü Operational 2 Development Efficiencies & Cost ü 1 Underwriting Containment & Contract Rate ü Standardization Escalations / Occupancy ü Signifies COLD has and continues to capitalize on growth opportunities Increases ü 13 üPositioned for Multiple Avenues of Growth Global warehouse network, operating systems, scalable information technology platform and economies of scale provide a significant advantage over competitors with respect to organic and external growth opportunities Development and External Growth and Expansion Organic Growth Opportunities Redevelopment Opportunities 9 Expand Presence in Other 8 Temperature Global Food Sensitive Products Producers 7 in the Cold Chain Outsourcing & Geographic Sale-Leaseback 6 Expansion Opportunities into New 5 Markets Industry Consolidation ü Redevelopment 4 & Existing Site ü Customer-Specific Expansion 3 Build-to-Suit & Market-Driven ü Operational 2 Development Efficiencies & Cost ü 1 Underwriting Containment & Contract Rate ü Standardization Escalations / Occupancy ü Signifies COLD has and continues to capitalize on growth opportunities Increases ü 13 ü
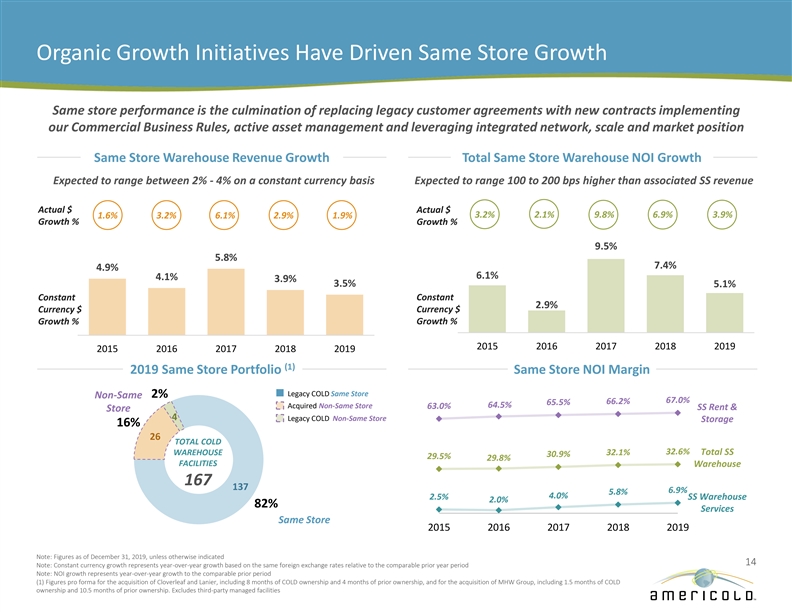
Organic Growth Initiatives Have Driven Same Store Growth Same store performance is the culmination of replacing legacy customer agreements with new contracts implementing our Commercial Business Rules, active asset management and leveraging integrated network, scale and market position Same Store Warehouse Revenue Growth Total Same Store Warehouse NOI Growth Expected to range between 2% - 4% on a constant currency basis Expected to range 100 to 200 bps higher than associated SS revenue Actual $ Actual $ 3.2% 2.1% 9.8% 6.9% 3.9% 1.6% 3.2% 6.1% 2.9% 1.9% Growth % Growth % 9.5% 5.8% 7.4% 4.9% 6.1% 4.1% 3.9% 3.5% 5.1% Constant Constant 2.9% Currency $ Currency $ Growth % Growth % 2015 2016 2017 2018 2019 2015 2016 2017 2018 2019 (1) 2019 Same Store Portfolio Same Store NOI Margin Legacy COLD Same Store Non-Same 2% 67.0% 66.2% 65.5% Acquired Non-Same Store 64.5% 63.0% SS Rent & Store 4 Legacy COLD Non-Same Store Storage 16% 26 TOTAL COLD WAREHOUSE 32.1% 32.6% Total SS 30.9% 29.5% 29.8% FACILITIES Warehouse 167 137 6.9% 5.8% 4.0% 2.5% SS Warehouse 2.0% 82% Services Same Store 2015 2016 2017 2018 2019 Note: Figures as of December 31, 2019, unless otherwise indicated 14 Note: Constant currency growth represents year-over-year growth based on the same foreign exchange rates relative to the comparable prior year period Note: NOI growth represents year-over-year growth to the comparable prior period (1) Figures pro forma for the acquisition of Cloverleaf and Lanier, including 8 months of COLD ownership and 4 months of prior ownership, and for the acquisition of MHW Group, including 1.5 months of COLD ownership and 10.5 months of prior ownership. Excludes third-party managed facilitiesOrganic Growth Initiatives Have Driven Same Store Growth Same store performance is the culmination of replacing legacy customer agreements with new contracts implementing our Commercial Business Rules, active asset management and leveraging integrated network, scale and market position Same Store Warehouse Revenue Growth Total Same Store Warehouse NOI Growth Expected to range between 2% - 4% on a constant currency basis Expected to range 100 to 200 bps higher than associated SS revenue Actual $ Actual $ 3.2% 2.1% 9.8% 6.9% 3.9% 1.6% 3.2% 6.1% 2.9% 1.9% Growth % Growth % 9.5% 5.8% 7.4% 4.9% 6.1% 4.1% 3.9% 3.5% 5.1% Constant Constant 2.9% Currency $ Currency $ Growth % Growth % 2015 2016 2017 2018 2019 2015 2016 2017 2018 2019 (1) 2019 Same Store Portfolio Same Store NOI Margin Legacy COLD Same Store Non-Same 2% 67.0% 66.2% 65.5% Acquired Non-Same Store 64.5% 63.0% SS Rent & Store 4 Legacy COLD Non-Same Store Storage 16% 26 TOTAL COLD WAREHOUSE 32.1% 32.6% Total SS 30.9% 29.5% 29.8% FACILITIES Warehouse 167 137 6.9% 5.8% 4.0% 2.5% SS Warehouse 2.0% 82% Services Same Store 2015 2016 2017 2018 2019 Note: Figures as of December 31, 2019, unless otherwise indicated 14 Note: Constant currency growth represents year-over-year growth based on the same foreign exchange rates relative to the comparable prior year period Note: NOI growth represents year-over-year growth to the comparable prior period (1) Figures pro forma for the acquisition of Cloverleaf and Lanier, including 8 months of COLD ownership and 4 months of prior ownership, and for the acquisition of MHW Group, including 1.5 months of COLD ownership and 10.5 months of prior ownership. Excludes third-party managed facilities
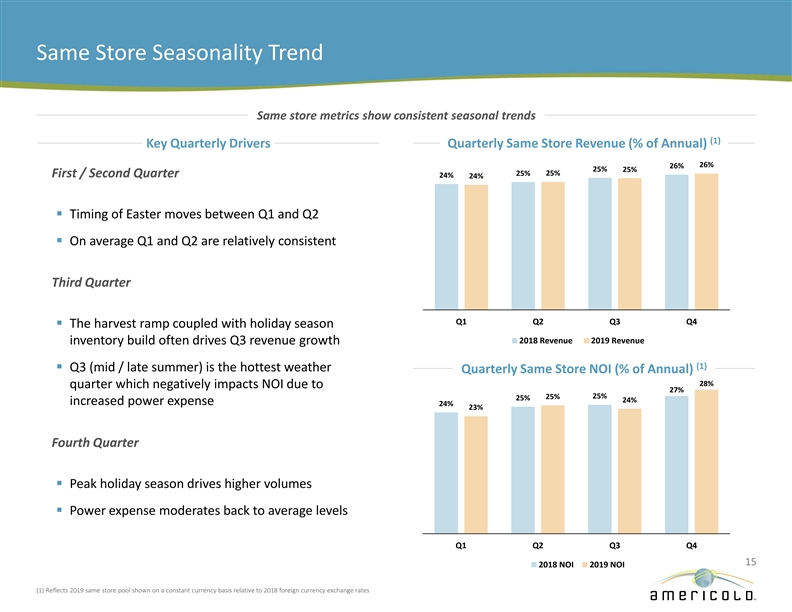
Same Store Seasonality Trend Same store metrics show consistent seasonal trends (1) Key Quarterly Drivers Quarterly Same Store Revenue (% of Annual) 26% 26% 25% 25% 25% 25% First / Second Quarter 24% 24% § Timing of Easter moves between Q1 and Q2 § On average Q1 and Q2 are relatively consistent Third Quarter Q1 Q2 Q3 Q4 § The harvest ramp coupled with holiday season 2018 Revenue 2019 Revenue inventory build often drives Q3 revenue growth (1) § Q3 (mid / late summer) is the hottest weather Quarterly Same Store NOI (% of Annual) 28% quarter which negatively impacts NOI due to 27% 25% 25% 25% 24% increased power expense 24% 23% Fourth Quarter § Peak holiday season drives higher volumes § Power expense moderates back to average levels Q1 Q2 Q3 Q4 15 2018 NOI 2019 NOI (1) Reflects 2019 same store pool shown on a constant currency basis relative to 2018 foreign currency exchange rates Same Store Seasonality Trend Same store metrics show consistent seasonal trends (1) Key Quarterly Drivers Quarterly Same Store Revenue (% of Annual) 26% 26% 25% 25% 25% 25% First / Second Quarter 24% 24% § Timing of Easter moves between Q1 and Q2 § On average Q1 and Q2 are relatively consistent Third Quarter Q1 Q2 Q3 Q4 § The harvest ramp coupled with holiday season 2018 Revenue 2019 Revenue inventory build often drives Q3 revenue growth (1) § Q3 (mid / late summer) is the hottest weather Quarterly Same Store NOI (% of Annual) 28% quarter which negatively impacts NOI due to 27% 25% 25% 25% 24% increased power expense 24% 23% Fourth Quarter § Peak holiday season drives higher volumes § Power expense moderates back to average levels Q1 Q2 Q3 Q4 15 2018 NOI 2019 NOI (1) Reflects 2019 same store pool shown on a constant currency basis relative to 2018 foreign currency exchange rates
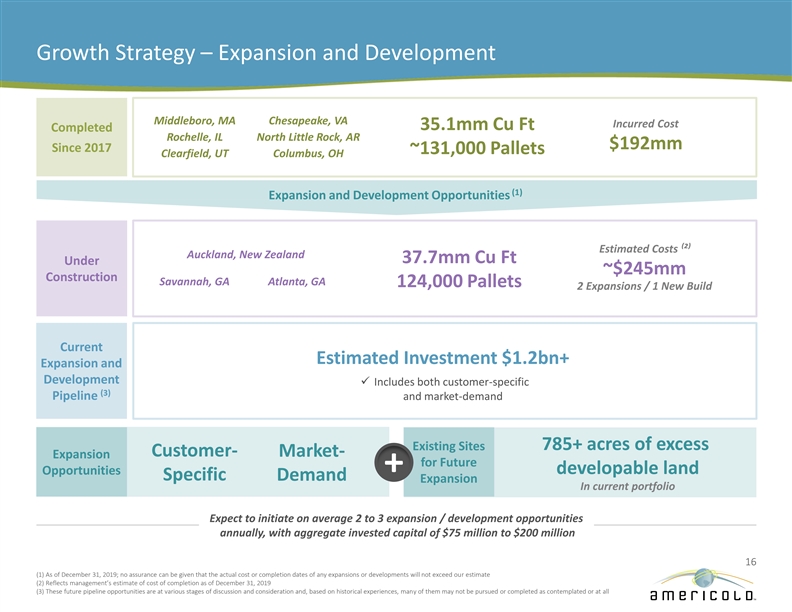
Growth Strategy – Expansion and Development Middleboro, MA Chesapeake, VA Incurred Cost 35.1mm Cu Ft Completed Rochelle, IL North Little Rock, AR $192mm Since 2017 ~131,000 Pallets Clearfield, UT Columbus, OH (1) Expansion and Development Opportunities Estimated Costs ⁽²⁾ Auckland, New Zealand 37.7mm Cu Ft Under ~$245mm Construction Savannah, GA Atlanta, GA 124,000 Pallets 2 Expansions / 1 New Build Current Estimated Investment $1.2bn+ Expansion and Development ü Includes both customer-specific (3) Pipeline and market-demand Existing Sites 785+ acres of excess Customer- Market- Expansion for Future + developable land Opportunities Specific Demand Expansion In current portfolio Expect to initiate on average 2 to 3 expansion / development opportunities annually, with aggregate invested capital of $75 million to $200 million 16 (1) As of December 31, 2019; no assurance can be given that the actual cost or completion dates of any expansions or developments will not exceed our estimate (2) Reflects management’s estimate of cost of completion as of December 31, 2019 (3) These future pipeline opportunities are at various stages of discussion and consideration and, based on historical experiences, many of them may not be pursued or completed as contemplated or at allGrowth Strategy – Expansion and Development Middleboro, MA Chesapeake, VA Incurred Cost 35.1mm Cu Ft Completed Rochelle, IL North Little Rock, AR $192mm Since 2017 ~131,000 Pallets Clearfield, UT Columbus, OH (1) Expansion and Development Opportunities Estimated Costs ⁽²⁾ Auckland, New Zealand 37.7mm Cu Ft Under ~$245mm Construction Savannah, GA Atlanta, GA 124,000 Pallets 2 Expansions / 1 New Build Current Estimated Investment $1.2bn+ Expansion and Development ü Includes both customer-specific (3) Pipeline and market-demand Existing Sites 785+ acres of excess Customer- Market- Expansion for Future + developable land Opportunities Specific Demand Expansion In current portfolio Expect to initiate on average 2 to 3 expansion / development opportunities annually, with aggregate invested capital of $75 million to $200 million 16 (1) As of December 31, 2019; no assurance can be given that the actual cost or completion dates of any expansions or developments will not exceed our estimate (2) Reflects management’s estimate of cost of completion as of December 31, 2019 (3) These future pipeline opportunities are at various stages of discussion and consideration and, based on historical experiences, many of them may not be pursued or completed as contemplated or at all
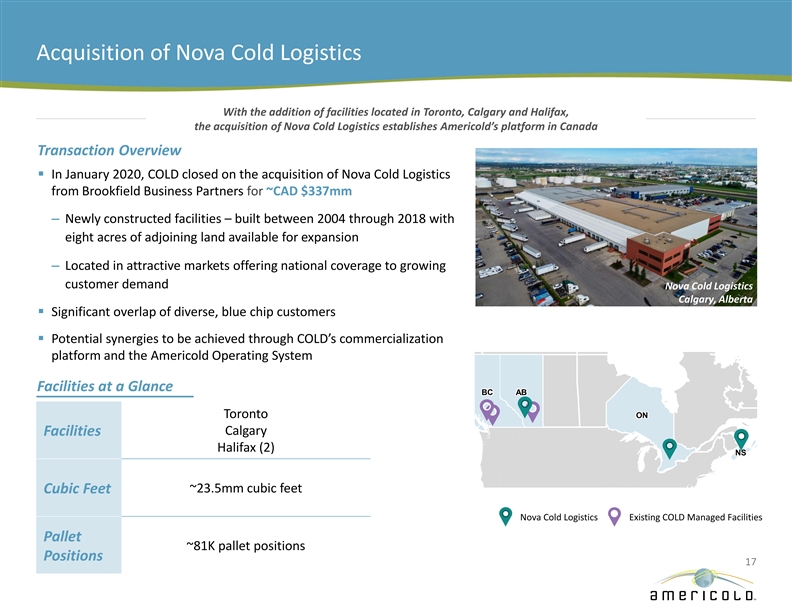
Acquisition of Nova Cold Logistics With the addition of facilities located in Toronto, Calgary and Halifax, the acquisition of Nova Cold Logistics establishes Americold’s platform in Canada Transaction Overview § In January 2020, COLD closed on the acquisition of Nova Cold Logistics from Brookfield Business Partners for ~CAD $337mm – Newly constructed facilities – built between 2004 through 2018 with eight acres of adjoining land available for expansion – Located in attractive markets offering national coverage to growing customer demand Nova Cold Logistics Calgary, Alberta § Significant overlap of diverse, blue chip customers § Potential synergies to be achieved through COLD’s commercialization platform and the Americold Operating System Facilities at a Glance BC BC BC BC BC BC BC AB AB AB AB AB AB AB BC BC BC BC BC BC BC BC BC BC BC BC BC BC BC BC BC BC BC BC BC BC BC BC BC BC BC BC AB AB AB AB AB AB AB AB AB AB AB AB AB AB AB AB AB AB AB AB AB AB AB AB AB AB AB AB BC BC BC BC BC BC BC BC BC BC BC BC BC BC AB AB AB AB AB AB AB AB AB AB AB AB AB AB ON ON ON ON ON ON ON Toronto ON ON ON ON ON ON ON ON ON ON ON ON ON ON ON ON ON ON ON ON ON ON ON ON ON ON ON ON ON ON ON ON ON ON ON ON ON ON ON ON ON ON Calgary Facilities Halifax (2) NS NS NS NS NS NS NS NS NS NS NS NS NS NS NS NS NS NS NS NS NS NS NS NS NS NS NS NS NS NS NS NS NS NS NS NS NS NS NS NS NS NS NS NS NS NS NS NS NS Cubic Feet ~23.5mm cubic feet 1288310_1.WOR [NY008YXZ] Nova Cold Logistics Existing COLD Managed Facilities Pallet ~81K pallet positions Positions 17Acquisition of Nova Cold Logistics With the addition of facilities located in Toronto, Calgary and Halifax, the acquisition of Nova Cold Logistics establishes Americold’s platform in Canada Transaction Overview § In January 2020, COLD closed on the acquisition of Nova Cold Logistics from Brookfield Business Partners for ~CAD $337mm – Newly constructed facilities – built between 2004 through 2018 with eight acres of adjoining land available for expansion – Located in attractive markets offering national coverage to growing customer demand Nova Cold Logistics Calgary, Alberta § Significant overlap of diverse, blue chip customers § Potential synergies to be achieved through COLD’s commercialization platform and the Americold Operating System Facilities at a Glance BC BC BC BC BC BC BC AB AB AB AB AB AB AB BC BC BC BC BC BC BC BC BC BC BC BC BC BC BC BC BC BC BC BC BC BC BC BC BC BC BC BC AB AB AB AB AB AB AB AB AB AB AB AB AB AB AB AB AB AB AB AB AB AB AB AB AB AB AB AB BC BC BC BC BC BC BC BC BC BC BC BC BC BC AB AB AB AB AB AB AB AB AB AB AB AB AB AB ON ON ON ON ON ON ON Toronto ON ON ON ON ON ON ON ON ON ON ON ON ON ON ON ON ON ON ON ON ON ON ON ON ON ON ON ON ON ON ON ON ON ON ON ON ON ON ON ON ON ON Calgary Facilities Halifax (2) NS NS NS NS NS NS NS NS NS NS NS NS NS NS NS NS NS NS NS NS NS NS NS NS NS NS NS NS NS NS NS NS NS NS NS NS NS NS NS NS NS NS NS NS NS NS NS NS NS Cubic Feet ~23.5mm cubic feet 1288310_1.WOR [NY008YXZ] Nova Cold Logistics Existing COLD Managed Facilities Pallet ~81K pallet positions Positions 17
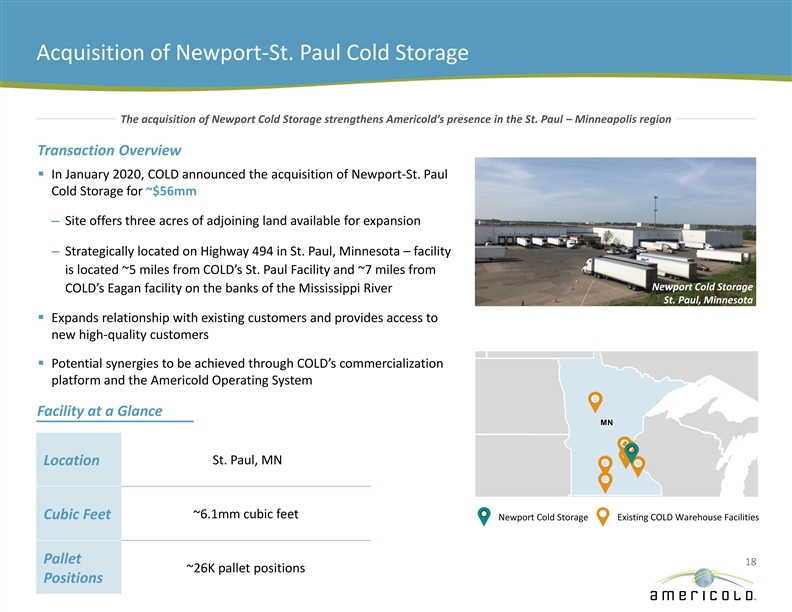
Acquisition of Newport-St. Paul Cold Storage The acquisition of Newport Cold Storage strengthens Americold’s presence in the St. Paul – Minneapolis region Transaction Overview § In January 2020, COLD announced the acquisition of Newport-St. Paul Cold Storage for ~$56mm – Site offers three acres of adjoining land available for expansion – Strategically located on Highway 494 in St. Paul, Minnesota – facility is located ~5 miles from COLD’s St. Paul Facility and ~7 miles from Newport Cold Storage COLD’s Eagan facility on the banks of the Mississippi River St. Paul, Minnesota § Expands relationship with existing customers and provides access to new high-quality customers § Potential synergies to be achieved through COLD’s commercialization platform and the Americold Operating System Facility at a Glance MN MN MN MN MN MN MN MN MN MN MN MN MN MN MN MN MN MN MN MN MN MN MN MN MN MN MN MN MN MN MN MN MN MN MN MN MN MN MN MN MN MN MN MN MN MN MN MN MN St. Paul, MN Location 1288310_1.WOR [NY008YXZ] ~6.1mm cubic feet Cubic Feet Newport Cold Storage Existing COLD Warehouse Facilities Pallet 18 ~26K pallet positions PositionsAcquisition of Newport-St. Paul Cold Storage The acquisition of Newport Cold Storage strengthens Americold’s presence in the St. Paul – Minneapolis region Transaction Overview § In January 2020, COLD announced the acquisition of Newport-St. Paul Cold Storage for ~$56mm – Site offers three acres of adjoining land available for expansion – Strategically located on Highway 494 in St. Paul, Minnesota – facility is located ~5 miles from COLD’s St. Paul Facility and ~7 miles from Newport Cold Storage COLD’s Eagan facility on the banks of the Mississippi River St. Paul, Minnesota § Expands relationship with existing customers and provides access to new high-quality customers § Potential synergies to be achieved through COLD’s commercialization platform and the Americold Operating System Facility at a Glance MN MN MN MN MN MN MN MN MN MN MN MN MN MN MN MN MN MN MN MN MN MN MN MN MN MN MN MN MN MN MN MN MN MN MN MN MN MN MN MN MN MN MN MN MN MN MN MN MN St. Paul, MN Location 1288310_1.WOR [NY008YXZ] ~6.1mm cubic feet Cubic Feet Newport Cold Storage Existing COLD Warehouse Facilities Pallet 18 ~26K pallet positions Positions
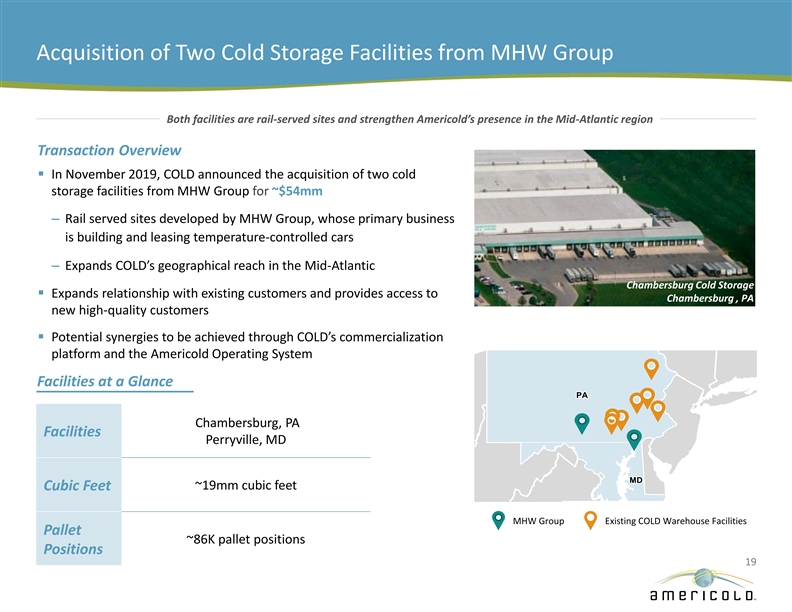
Acquisition of Two Cold Storage Facilities from MHW Group Both facilities are rail-served sites and strengthen Americold’s presence in the Mid-Atlantic region Transaction Overview § In November 2019, COLD announced the acquisition of two cold storage facilities from MHW Group for ~$54mm – Rail served sites developed by MHW Group, whose primary business is building and leasing temperature-controlled cars – Expands COLD’s geographical reach in the Mid-Atlantic Chambersburg Cold Storage § Expands relationship with existing customers and provides access to Chambersburg , PA new high-quality customers § Potential synergies to be achieved through COLD’s commercialization platform and the Americold Operating System Facilities at a Glance PA PA PA PA PA PA PA PA PA PA PA PA PA PA PA PA PA PA PA PA PA PA PA PA PA PA PA PA PA PA PA PA PA PA PA PA PA PA PA PA PA PA PA PA PA PA PA PA PA Chambersburg, PA Facilities Perryville, MD MD MD MD MD MD MD MD MD MD MD MD MD MD MD MD MD MD MD MD MD MD MD MD MD MD MD MD MD MD MD MD MD MD MD MD MD MD MD MD MD MD MD MD MD MD MD MD MD MD Cubic Feet ~19mm cubic feet 1288310_1.WOR [NY008YXZ] MHW Group Existing COLD Warehouse Facilities Pallet ~86K pallet positions Positions 19Acquisition of Two Cold Storage Facilities from MHW Group Both facilities are rail-served sites and strengthen Americold’s presence in the Mid-Atlantic region Transaction Overview § In November 2019, COLD announced the acquisition of two cold storage facilities from MHW Group for ~$54mm – Rail served sites developed by MHW Group, whose primary business is building and leasing temperature-controlled cars – Expands COLD’s geographical reach in the Mid-Atlantic Chambersburg Cold Storage § Expands relationship with existing customers and provides access to Chambersburg , PA new high-quality customers § Potential synergies to be achieved through COLD’s commercialization platform and the Americold Operating System Facilities at a Glance PA PA PA PA PA PA PA PA PA PA PA PA PA PA PA PA PA PA PA PA PA PA PA PA PA PA PA PA PA PA PA PA PA PA PA PA PA PA PA PA PA PA PA PA PA PA PA PA PA Chambersburg, PA Facilities Perryville, MD MD MD MD MD MD MD MD MD MD MD MD MD MD MD MD MD MD MD MD MD MD MD MD MD MD MD MD MD MD MD MD MD MD MD MD MD MD MD MD MD MD MD MD MD MD MD MD MD MD Cubic Feet ~19mm cubic feet 1288310_1.WOR [NY008YXZ] MHW Group Existing COLD Warehouse Facilities Pallet ~86K pallet positions Positions 19
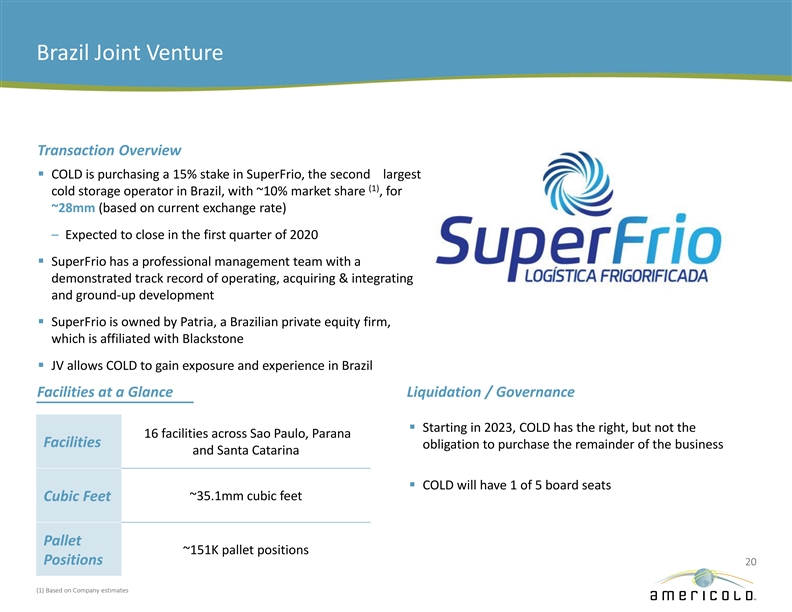
Brazil Joint Venture Transaction Overview § COLD is purchasing a 15% stake in SuperFrio, the second largest (1) cold storage operator in Brazil, with ~10% market share , for ~28mm (based on current exchange rate) – Expected to close in the first quarter of 2020 § SuperFrio has a professional management team with a demonstrated track record of operating, acquiring & integrating and ground-up development § SuperFrio is owned by Patria, a Brazilian private equity firm, which is affiliated with Blackstone § JV allows COLD to gain exposure and experience in Brazil Facilities at a Glance Liquidation / Governance § Starting in 2023, COLD has the right, but not the 16 facilities across Sao Paulo, Parana Facilities obligation to purchase the remainder of the business and Santa Catarina § COLD will have 1 of 5 board seats ~35.1mm cubic feet Cubic Feet Pallet ~151K pallet positions Positions 20 (1) Based on Company estimatesBrazil Joint Venture Transaction Overview § COLD is purchasing a 15% stake in SuperFrio, the second largest (1) cold storage operator in Brazil, with ~10% market share , for ~28mm (based on current exchange rate) – Expected to close in the first quarter of 2020 § SuperFrio has a professional management team with a demonstrated track record of operating, acquiring & integrating and ground-up development § SuperFrio is owned by Patria, a Brazilian private equity firm, which is affiliated with Blackstone § JV allows COLD to gain exposure and experience in Brazil Facilities at a Glance Liquidation / Governance § Starting in 2023, COLD has the right, but not the 16 facilities across Sao Paulo, Parana Facilities obligation to purchase the remainder of the business and Santa Catarina § COLD will have 1 of 5 board seats ~35.1mm cubic feet Cubic Feet Pallet ~151K pallet positions Positions 20 (1) Based on Company estimates
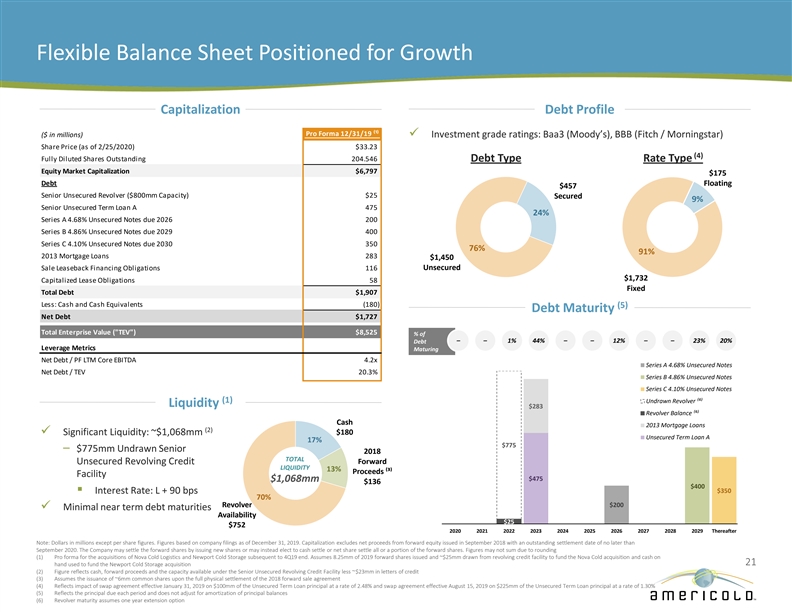
Flexible Balance Sheet Positioned for Growth Capitalization Debt Profile Pro Forma 12/31/19 ⁽¹⁾ ($ in millions) ü Investment grade ratings: Baa3 (Moody’s), BBB (Fitch / Morningstar) Share Price (as of 2/25/2020) $33.23 (4) Fully Diluted Shares Outstanding 204.546 Debt Type Rate Type Equity Market Capitalization $6,797 $175 Debt RSUs OUTSTANDING Floating $457 Senior Unsecured Revolver ($800mm Capacity) $25 Secured 9% Senior Unsecured Term Loan A 475 24% Series A 4.68% Unsecured Notes due 2026 200 Series B 4.86% Unsecured Notes due 2029 400 Series C 4.10% Unsecured Notes due 2030 350 76% 91% 2013 Mortgage Loans 283 $1,450 Unsecured Sale Leaseback Financing Obligations 116 $1,732 Capitalized Lease Obligations 58 Fixed Total Debt $1,907 Less: Cash and Cash Equivalents (180) (5) Debt Maturity Net Debt $1,727 Total Enterprise Value ( TEV ) $8,525 % of – – 1% 44% – – 12% – – 23% 20% Debt Leverage Metrics Maturing Net Debt / PF LTM Core EBITDA 4.2x Series A 4.68% Unsecured Notes Net Debt / TEV 20.3% Series B 4.86% Unsecured Notes Series C 4.10% Unsecured Notes (1) Undrawn Revolver ⁽⁶⁾ Liquidity $283 Revolver Balance ⁽⁶⁾ Cash 2013 Mortgage Loans (2) ü Significant Liquidity: ~$1,068mm $180 Unsecured Term Loan A 17% $775 – $775mm Undrawn Senior 2018 TOTAL Unsecured Revolving Credit Forward LIQUIDITY 13% Proceeds ⁽³⁾ Facility $475 $1,068mm $136 $400 $350 § Interest Rate: L + 90 bps 70% Revolver $200 ü Minimal near term debt maturities Availability $25 $752 2020 2021 2022 2023 2024 2025 2026 2027 2028 2029 Thereafter Note: Dollars in millions except per share figures. Figures based on company filings as of December 31, 2019. Capitalization excludes net proceeds from forward equity issued in September 2018 with an outstanding settlement date of no later than September 2020. The Company may settle the forward shares by issuing new shares or may instead elect to cash settle or net share settle all or a portion of the forward shares. Figures may not sum due to rounding (1) Pro forma for the acquisitions of Nova Cold Logistics and Newport Cold Storage subsequent to 4Q19 end. Assumes 8.25mm of 2019 forward shares issued and ~$25mm drawn from revolving credit facility to fund the Nova Cold acquisition and cash on 21 hand used to fund the Newport Cold Storage acquisition (2) Figure reflects cash, forward proceeds and the capacity available under the Senior Unsecured Revolving Credit Facility less ~$23mm in letters of credit (3) Assumes the issuance of ~6mm common shares upon the full physical settlement of the 2018 forward sale agreement (4) Reflects impact of swap agreement effective January 31, 2019 on $100mm of the Unsecured Term Loan principal at a rate of 2.48% and swap agreement effective August 15, 2019 on $225mm of the Unsecured Term Loan principal at a rate of 1.30% (5) Reflects the principal due each period and does not adjust for amortization of principal balances (6) Revolver maturity assumes one year extension optionFlexible Balance Sheet Positioned for Growth Capitalization Debt Profile Pro Forma 12/31/19 ⁽¹⁾ ($ in millions) ü Investment grade ratings: Baa3 (Moody’s), BBB (Fitch / Morningstar) Share Price (as of 2/25/2020) $33.23 (4) Fully Diluted Shares Outstanding 204.546 Debt Type Rate Type Equity Market Capitalization $6,797 $175 Debt RSUs OUTSTANDING Floating $457 Senior Unsecured Revolver ($800mm Capacity) $25 Secured 9% Senior Unsecured Term Loan A 475 24% Series A 4.68% Unsecured Notes due 2026 200 Series B 4.86% Unsecured Notes due 2029 400 Series C 4.10% Unsecured Notes due 2030 350 76% 91% 2013 Mortgage Loans 283 $1,450 Unsecured Sale Leaseback Financing Obligations 116 $1,732 Capitalized Lease Obligations 58 Fixed Total Debt $1,907 Less: Cash and Cash Equivalents (180) (5) Debt Maturity Net Debt $1,727 Total Enterprise Value ( TEV ) $8,525 % of – – 1% 44% – – 12% – – 23% 20% Debt Leverage Metrics Maturing Net Debt / PF LTM Core EBITDA 4.2x Series A 4.68% Unsecured Notes Net Debt / TEV 20.3% Series B 4.86% Unsecured Notes Series C 4.10% Unsecured Notes (1) Undrawn Revolver ⁽⁶⁾ Liquidity $283 Revolver Balance ⁽⁶⁾ Cash 2013 Mortgage Loans (2) ü Significant Liquidity: ~$1,068mm $180 Unsecured Term Loan A 17% $775 – $775mm Undrawn Senior 2018 TOTAL Unsecured Revolving Credit Forward LIQUIDITY 13% Proceeds ⁽³⁾ Facility $475 $1,068mm $136 $400 $350 § Interest Rate: L + 90 bps 70% Revolver $200 ü Minimal near term debt maturities Availability $25 $752 2020 2021 2022 2023 2024 2025 2026 2027 2028 2029 Thereafter Note: Dollars in millions except per share figures. Figures based on company filings as of December 31, 2019. Capitalization excludes net proceeds from forward equity issued in September 2018 with an outstanding settlement date of no later than September 2020. The Company may settle the forward shares by issuing new shares or may instead elect to cash settle or net share settle all or a portion of the forward shares. Figures may not sum due to rounding (1) Pro forma for the acquisitions of Nova Cold Logistics and Newport Cold Storage subsequent to 4Q19 end. Assumes 8.25mm of 2019 forward shares issued and ~$25mm drawn from revolving credit facility to fund the Nova Cold acquisition and cash on 21 hand used to fund the Newport Cold Storage acquisition (2) Figure reflects cash, forward proceeds and the capacity available under the Senior Unsecured Revolving Credit Facility less ~$23mm in letters of credit (3) Assumes the issuance of ~6mm common shares upon the full physical settlement of the 2018 forward sale agreement (4) Reflects impact of swap agreement effective January 31, 2019 on $100mm of the Unsecured Term Loan principal at a rate of 2.48% and swap agreement effective August 15, 2019 on $225mm of the Unsecured Term Loan principal at a rate of 1.30% (5) Reflects the principal due each period and does not adjust for amortization of principal balances (6) Revolver maturity assumes one year extension option
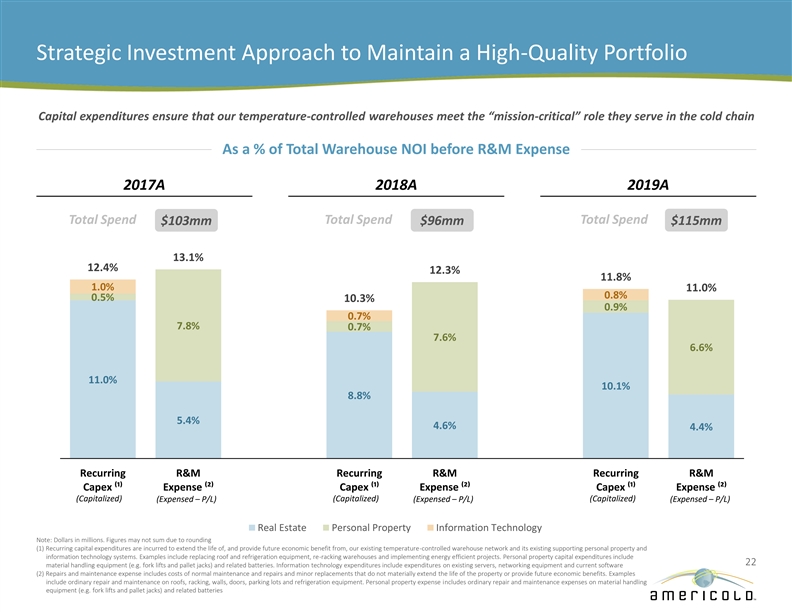
Strategic Investment Approach to Maintain a High-Quality Portfolio Capital expenditures ensure that our temperature-controlled warehouses meet the “mission-critical” role they serve in the cold chain As a % of Total Warehouse NOI before R&M Expense 2017A 2018A 2019A Total Spend Total Spend Total Spend $103mm $96mm $115mm 13.1% 12.4% 12.3% 11.8% 1.0% 11.0% 0.8% 0.5% 10.3% 0.9% 0.7% 7.8% 0.7% 7.6% 6.6% 11.0% 10.1% 8.8% 5.4% 4.6% 4.4% Recurring R&M Recurring R&M Recurring R&M Capex ⁽¹⁾ Expense ⁽²⁾ Capex ⁽¹⁾ Expense ⁽²⁾ Capex ⁽¹⁾ Expense ⁽²⁾ (Capitalized) (Capitalized) (Capitalized) (Expensed – P/L) (Expensed – P/L) (Expensed – P/L) Real Estate Personal Property Information Technology Note: Dollars in millions. Figures may not sum due to rounding (1) Recurring capital expenditures are incurred to extend the life of, and provide future economic benefit from, our existing temperature-controlled warehouse network and its existing supporting personal property and information technology systems. Examples include replacing roof and refrigeration equipment, re-racking warehouses and implementing energy efficient projects. Personal property capital expenditures include 22 material handling equipment (e.g. fork lifts and pallet jacks) and related batteries. Information technology expenditures include expenditures on existing servers, networking equipment and current software (2) Repairs and maintenance expense includes costs of normal maintenance and repairs and minor replacements that do not materially extend the life of the property or provide future economic benefits. Examples include ordinary repair and maintenance on roofs, racking, walls, doors, parking lots and refrigeration equipment. Personal property expense includes ordinary repair and maintenance expenses on material handling equipment (e.g. fork lifts and pallet jacks) and related batteriesStrategic Investment Approach to Maintain a High-Quality Portfolio Capital expenditures ensure that our temperature-controlled warehouses meet the “mission-critical” role they serve in the cold chain As a % of Total Warehouse NOI before R&M Expense 2017A 2018A 2019A Total Spend Total Spend Total Spend $103mm $96mm $115mm 13.1% 12.4% 12.3% 11.8% 1.0% 11.0% 0.8% 0.5% 10.3% 0.9% 0.7% 7.8% 0.7% 7.6% 6.6% 11.0% 10.1% 8.8% 5.4% 4.6% 4.4% Recurring R&M Recurring R&M Recurring R&M Capex ⁽¹⁾ Expense ⁽²⁾ Capex ⁽¹⁾ Expense ⁽²⁾ Capex ⁽¹⁾ Expense ⁽²⁾ (Capitalized) (Capitalized) (Capitalized) (Expensed – P/L) (Expensed – P/L) (Expensed – P/L) Real Estate Personal Property Information Technology Note: Dollars in millions. Figures may not sum due to rounding (1) Recurring capital expenditures are incurred to extend the life of, and provide future economic benefit from, our existing temperature-controlled warehouse network and its existing supporting personal property and information technology systems. Examples include replacing roof and refrigeration equipment, re-racking warehouses and implementing energy efficient projects. Personal property capital expenditures include 22 material handling equipment (e.g. fork lifts and pallet jacks) and related batteries. Information technology expenditures include expenditures on existing servers, networking equipment and current software (2) Repairs and maintenance expense includes costs of normal maintenance and repairs and minor replacements that do not materially extend the life of the property or provide future economic benefits. Examples include ordinary repair and maintenance on roofs, racking, walls, doors, parking lots and refrigeration equipment. Personal property expense includes ordinary repair and maintenance expenses on material handling equipment (e.g. fork lifts and pallet jacks) and related batteries
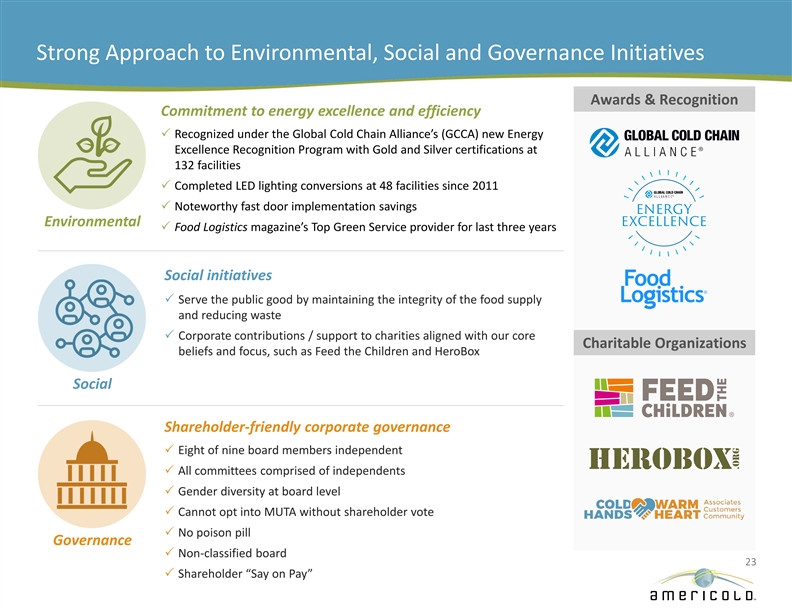
Strong Approach to Environmental, Social and Governance Initiatives Awards & Recognition Commitment to energy excellence and efficiency P Recognized under the Global Cold Chain Alliance’s (GCCA) new Energy Excellence Recognition Program with Gold and Silver certifications at 132 facilities P Completed LED lighting conversions at 48 facilities since 2011 P Noteworthy fast door implementation savings Environmental P Food Logistics magazine’s Top Green Service provider for last three years Social initiatives P Serve the public good by maintaining the integrity of the food supply and reducing waste P Corporate contributions / support to charities aligned with our core Charitable Organizations beliefs and focus, such as Feed the Children and HeroBox Social Shareholder-friendly corporate governance P Eight of nine board members independent P All committees comprised of independents P Gender diversity at board level P Cannot opt into MUTA without shareholder vote P No poison pill Governance P Non-classified board 23 P Shareholder “Say on Pay”Strong Approach to Environmental, Social and Governance Initiatives Awards & Recognition Commitment to energy excellence and efficiency P Recognized under the Global Cold Chain Alliance’s (GCCA) new Energy Excellence Recognition Program with Gold and Silver certifications at 132 facilities P Completed LED lighting conversions at 48 facilities since 2011 P Noteworthy fast door implementation savings Environmental P Food Logistics magazine’s Top Green Service provider for last three years Social initiatives P Serve the public good by maintaining the integrity of the food supply and reducing waste P Corporate contributions / support to charities aligned with our core Charitable Organizations beliefs and focus, such as Feed the Children and HeroBox Social Shareholder-friendly corporate governance P Eight of nine board members independent P All committees comprised of independents P Gender diversity at board level P Cannot opt into MUTA without shareholder vote P No poison pill Governance P Non-classified board 23 P Shareholder “Say on Pay”
Conclusion Important First Mover Global Market Leader Infrastructure Supported Strong and Stable Food Advantage as the Only with Integrated Network by Best-in-Class IT and Industry Fundamentals Publicly Traded REIT of Strategically-Located, Operating Platforms Drive Growing Demand Focused on Temperature- High-Quality, “Mission- Provides a Significant for Our Business Controlled Warehouses Critical” Warehouses Competitive Advantage Experienced Substantial Internal and Management Team, External Growth Investment Grade, Alignment of Interest and Opportunities Expected Flexible Balance Sheet to Drive Attractive Best-In-Class Corporate Positioned for Growth Risk-Adjusted Returns Governance 24Conclusion Important First Mover Global Market Leader Infrastructure Supported Strong and Stable Food Advantage as the Only with Integrated Network by Best-in-Class IT and Industry Fundamentals Publicly Traded REIT of Strategically-Located, Operating Platforms Drive Growing Demand Focused on Temperature- High-Quality, “Mission- Provides a Significant for Our Business Controlled Warehouses Critical” Warehouses Competitive Advantage Experienced Substantial Internal and Management Team, External Growth Investment Grade, Alignment of Interest and Opportunities Expected Flexible Balance Sheet to Drive Attractive Best-In-Class Corporate Positioned for Growth Risk-Adjusted Returns Governance 24

Appendix 25Appendix 25
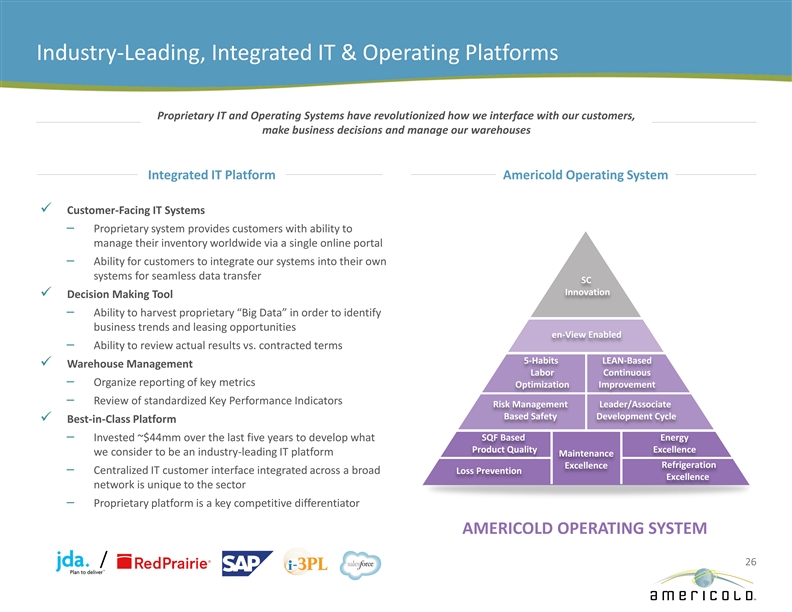
Industry-Leading, Integrated IT & Operating Platforms Proprietary IT and Operating Systems have revolutionized how we interface with our customers, make business decisions and manage our warehouses Integrated IT Platform Americold Operating System ü Customer-Facing IT Systems – Proprietary system provides customers with ability to manage their inventory worldwide via a single online portal – Ability for customers to integrate our systems into their own systems for seamless data transfer SC Innovation ü Decision Making Tool – Ability to harvest proprietary “Big Data” in order to identify business trends and leasing opportunities en-View Enabled – Ability to review actual results vs. contracted terms 5-Habits LEAN-Based ü Warehouse Management Labor Continuous – Organize reporting of key metrics Optimization Improvement – Review of standardized Key Performance Indicators Risk Management Leader/Associate Based Safety Development Cycle ü Best-in-Class Platform – Invested ~$44mm over the last five years to develop what SQF Based Energy Product Quality Excellence we consider to be an industry-leading IT platform Maintenance Refrigeration Excellence – Centralized IT customer interface integrated across a broad Loss Prevention Excellence network is unique to the sector – Proprietary platform is a key competitive differentiator AMERICOLD OPERATING SYSTEM / 26Industry-Leading, Integrated IT & Operating Platforms Proprietary IT and Operating Systems have revolutionized how we interface with our customers, make business decisions and manage our warehouses Integrated IT Platform Americold Operating System ü Customer-Facing IT Systems – Proprietary system provides customers with ability to manage their inventory worldwide via a single online portal – Ability for customers to integrate our systems into their own systems for seamless data transfer SC Innovation ü Decision Making Tool – Ability to harvest proprietary “Big Data” in order to identify business trends and leasing opportunities en-View Enabled – Ability to review actual results vs. contracted terms 5-Habits LEAN-Based ü Warehouse Management Labor Continuous – Organize reporting of key metrics Optimization Improvement – Review of standardized Key Performance Indicators Risk Management Leader/Associate Based Safety Development Cycle ü Best-in-Class Platform – Invested ~$44mm over the last five years to develop what SQF Based Energy Product Quality Excellence we consider to be an industry-leading IT platform Maintenance Refrigeration Excellence – Centralized IT customer interface integrated across a broad Loss Prevention Excellence network is unique to the sector – Proprietary platform is a key competitive differentiator AMERICOLD OPERATING SYSTEM / 26
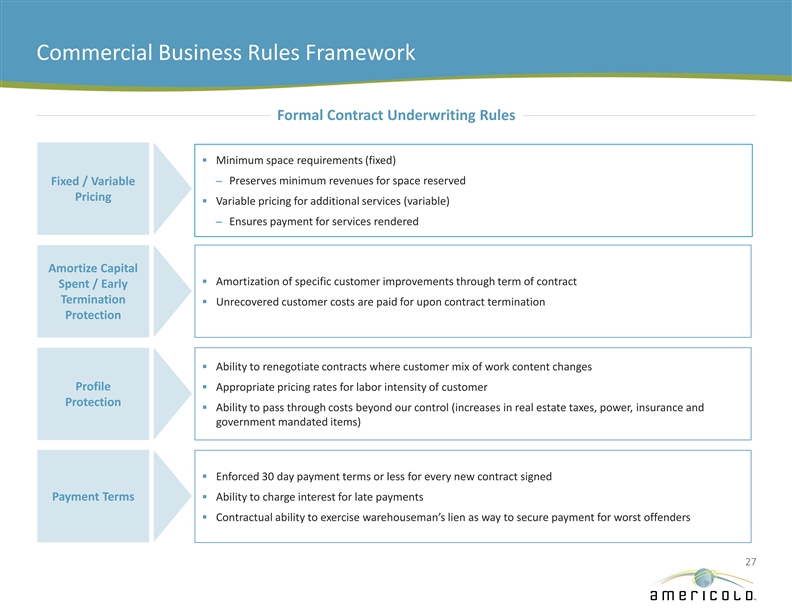
Commercial Business Rules Framework Formal Contract Underwriting Rules § Minimum space requirements (fixed) – Preserves minimum revenues for space reserved Fixed / Variable Pricing § Variable pricing for additional services (variable) – Ensures payment for services rendered Amortize Capital § Amortization of specific customer improvements through term of contract Spent / Early Termination § Unrecovered customer costs are paid for upon contract termination Protection § Ability to renegotiate contracts where customer mix of work content changes Profile§ Appropriate pricing rates for labor intensity of customer Protection § Ability to pass through costs beyond our control (increases in real estate taxes, power, insurance and government mandated items) § Enforced 30 day payment terms or less for every new contract signed Payment Terms§ Ability to charge interest for late payments § Contractual ability to exercise warehouseman’s lien as way to secure payment for worst offenders 27Commercial Business Rules Framework Formal Contract Underwriting Rules § Minimum space requirements (fixed) – Preserves minimum revenues for space reserved Fixed / Variable Pricing § Variable pricing for additional services (variable) – Ensures payment for services rendered Amortize Capital § Amortization of specific customer improvements through term of contract Spent / Early Termination § Unrecovered customer costs are paid for upon contract termination Protection § Ability to renegotiate contracts where customer mix of work content changes Profile§ Appropriate pricing rates for labor intensity of customer Protection § Ability to pass through costs beyond our control (increases in real estate taxes, power, insurance and government mandated items) § Enforced 30 day payment terms or less for every new contract signed Payment Terms§ Ability to charge interest for late payments § Contractual ability to exercise warehouseman’s lien as way to secure payment for worst offenders 27
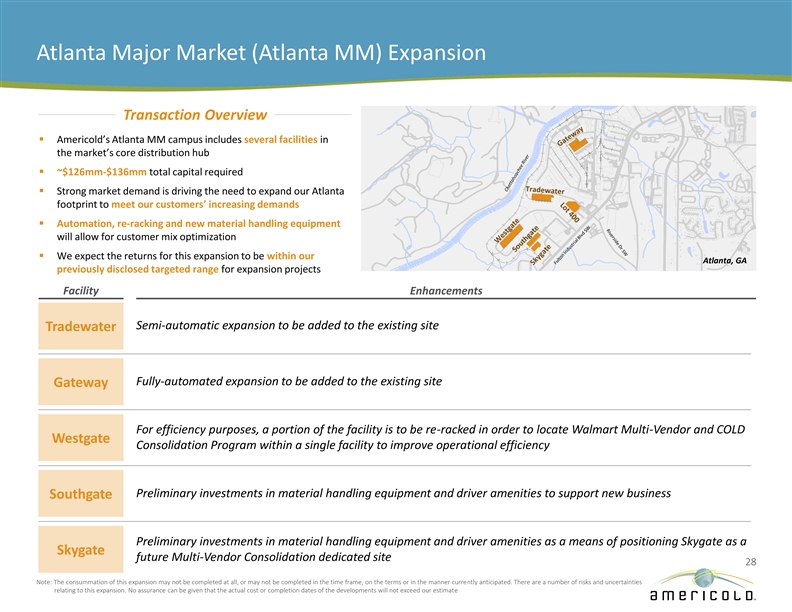
Atlanta Major Market (Atlanta MM) Expansion Transaction Overview § Americold’s Atlanta MM campus includes several facilities in the market’s core distribution hub § ~$126mm-$136mm total capital required § Strong market demand is driving the need to expand our Atlanta footprint to meet our customers’ increasing demands § Automation, re-racking and new material handling equipment will allow for customer mix optimization § We expect the returns for this expansion to be within our Atlanta, GA previously disclosed targeted range for expansion projects 1173037_1.wor (NY008V6E) Facility Enhancements Semi-automatic expansion to be added to the existing site Tradewater Fully-automated expansion to be added to the existing site Gateway For efficiency purposes, a portion of the facility is to be re-racked in order to locate Walmart Multi-Vendor and COLD Westgate Consolidation Program within a single facility to improve operational efficiency Preliminary investments in material handling equipment and driver amenities to support new business Southgate Preliminary investments in material handling equipment and driver amenities as a means of positioning Skygate as a Skygate future Multi-Vendor Consolidation dedicated site 28 Note: The consummation of this expansion may not be completed at all, or may not be completed in the time frame, on the terms or in the manner currently anticipated. There are a number of risks and uncertainties relating to this expansion. No assurance can be given that the actual cost or completion dates of the developments will not exceed our estimateAtlanta Major Market (Atlanta MM) Expansion Transaction Overview § Americold’s Atlanta MM campus includes several facilities in the market’s core distribution hub § ~$126mm-$136mm total capital required § Strong market demand is driving the need to expand our Atlanta footprint to meet our customers’ increasing demands § Automation, re-racking and new material handling equipment will allow for customer mix optimization § We expect the returns for this expansion to be within our Atlanta, GA previously disclosed targeted range for expansion projects 1173037_1.wor (NY008V6E) Facility Enhancements Semi-automatic expansion to be added to the existing site Tradewater Fully-automated expansion to be added to the existing site Gateway For efficiency purposes, a portion of the facility is to be re-racked in order to locate Walmart Multi-Vendor and COLD Westgate Consolidation Program within a single facility to improve operational efficiency Preliminary investments in material handling equipment and driver amenities to support new business Southgate Preliminary investments in material handling equipment and driver amenities as a means of positioning Skygate as a Skygate future Multi-Vendor Consolidation dedicated site 28 Note: The consummation of this expansion may not be completed at all, or may not be completed in the time frame, on the terms or in the manner currently anticipated. There are a number of risks and uncertainties relating to this expansion. No assurance can be given that the actual cost or completion dates of the developments will not exceed our estimate
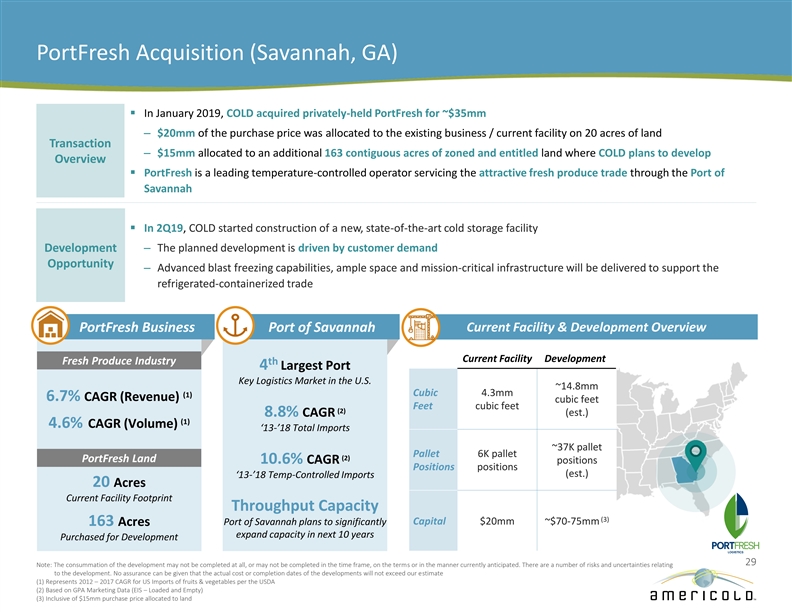
PortFresh Acquisition (Savannah, GA) § In January 2019, COLD acquired privately-held PortFresh for ~$35mm – $20mm of the purchase price was allocated to the existing business / current facility on 20 acres of land Transaction – $15mm allocated to an additional 163 contiguous acres of zoned and entitled land where COLD plans to develop Overview § PortFresh is a leading temperature-controlled operator servicing the attractive fresh produce trade through the Port of Savannah § In 2Q19, COLD started construction of a new, state-of-the-art cold storage facility Development – The planned development is driven by customer demand Opportunity – Advanced blast freezing capabilities, ample space and mission-critical infrastructure will be delivered to support the refrigerated-containerized trade PortFresh Business Port of Savannah Current Facility & Development Overview Current Facility Development Fresh Produce Industry th 4 Largest Port Key Logistics Market in the U.S. ~14.8mm Cubic 4.3mm (1) 6.7% CAGR (Revenue) cubic feet Feet cubic feet (2) (est.) 8.8% CAGR (1) 4.6% CAGR (Volume) ‘13-’18 Total Imports ~37K pallet Pallet 6K pallet (2) PortFresh Land 10.6% CAGR positions Positions positions (est.) ‘13-’18 Temp-Controlled Imports 20 Acres Current Facility Footprint Throughput Capacity (3) Port of Savannah plans to significantly Capital $20mm ~$70-75mm 163 Acres expand capacity in next 10 years Purchased for Development 29 Note: The consummation of the development may not be completed at all, or may not be completed in the time frame, on the terms or in the manner currently anticipated. There are a number of risks and uncertainties relating to the development. No assurance can be given that the actual cost or completion dates of the developments will not exceed our estimate (1) Represents 2012 – 2017 CAGR for US Imports of fruits & vegetables per the USDA (2) Based on GPA Marketing Data (EIS – Loaded and Empty) (3) Inclusive of $15mm purchase price allocated to landPortFresh Acquisition (Savannah, GA) § In January 2019, COLD acquired privately-held PortFresh for ~$35mm – $20mm of the purchase price was allocated to the existing business / current facility on 20 acres of land Transaction – $15mm allocated to an additional 163 contiguous acres of zoned and entitled land where COLD plans to develop Overview § PortFresh is a leading temperature-controlled operator servicing the attractive fresh produce trade through the Port of Savannah § In 2Q19, COLD started construction of a new, state-of-the-art cold storage facility Development – The planned development is driven by customer demand Opportunity – Advanced blast freezing capabilities, ample space and mission-critical infrastructure will be delivered to support the refrigerated-containerized trade PortFresh Business Port of Savannah Current Facility & Development Overview Current Facility Development Fresh Produce Industry th 4 Largest Port Key Logistics Market in the U.S. ~14.8mm Cubic 4.3mm (1) 6.7% CAGR (Revenue) cubic feet Feet cubic feet (2) (est.) 8.8% CAGR (1) 4.6% CAGR (Volume) ‘13-’18 Total Imports ~37K pallet Pallet 6K pallet (2) PortFresh Land 10.6% CAGR positions Positions positions (est.) ‘13-’18 Temp-Controlled Imports 20 Acres Current Facility Footprint Throughput Capacity (3) Port of Savannah plans to significantly Capital $20mm ~$70-75mm 163 Acres expand capacity in next 10 years Purchased for Development 29 Note: The consummation of the development may not be completed at all, or may not be completed in the time frame, on the terms or in the manner currently anticipated. There are a number of risks and uncertainties relating to the development. No assurance can be given that the actual cost or completion dates of the developments will not exceed our estimate (1) Represents 2012 – 2017 CAGR for US Imports of fruits & vegetables per the USDA (2) Based on GPA Marketing Data (EIS – Loaded and Empty) (3) Inclusive of $15mm purchase price allocated to land
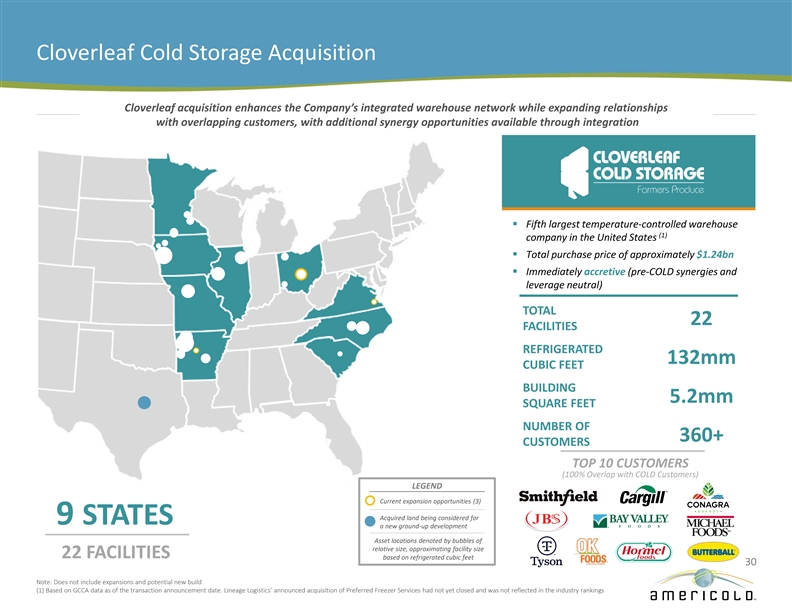
Cloverleaf Cold Storage Acquisition Cloverleaf acquisition enhances the Company’s integrated warehouse network while expanding relationships with overlapping customers, with additional synergy opportunities available through integration § Fifth largest temperature-controlled warehouse (1) company in the United States § Total purchase price of approximately $1.24bn § Immediately accretive (pre-COLD synergies and leverage neutral) TOTAL 22 FACILITIES REFRIGERATED 132mm CUBIC FEET BUILDING 5.2mm SQUARE FEET NUMBER OF 360+ CUSTOMERS TOP 10 CUSTOMERS (100% Overlap with COLD Customers) LEGEND Current expansion opportunities (3) Acquired land being considered for 9 STATES a new ground-up development Asset locations denoted by bubbles of relative size, approximating facility size 22 FACILITIES based on refrigerated cubic feet 30 Note: Does not include expansions and potential new build (1) Based on GCCA data as of the transaction announcement date. Lineage Logistics’ announced acquisition of Preferred Freezer Services had not yet closed and was not reflected in the industry rankingsCloverleaf Cold Storage Acquisition Cloverleaf acquisition enhances the Company’s integrated warehouse network while expanding relationships with overlapping customers, with additional synergy opportunities available through integration § Fifth largest temperature-controlled warehouse (1) company in the United States § Total purchase price of approximately $1.24bn § Immediately accretive (pre-COLD synergies and leverage neutral) TOTAL 22 FACILITIES REFRIGERATED 132mm CUBIC FEET BUILDING 5.2mm SQUARE FEET NUMBER OF 360+ CUSTOMERS TOP 10 CUSTOMERS (100% Overlap with COLD Customers) LEGEND Current expansion opportunities (3) Acquired land being considered for 9 STATES a new ground-up development Asset locations denoted by bubbles of relative size, approximating facility size 22 FACILITIES based on refrigerated cubic feet 30 Note: Does not include expansions and potential new build (1) Based on GCCA data as of the transaction announcement date. Lineage Logistics’ announced acquisition of Preferred Freezer Services had not yet closed and was not reflected in the industry rankings
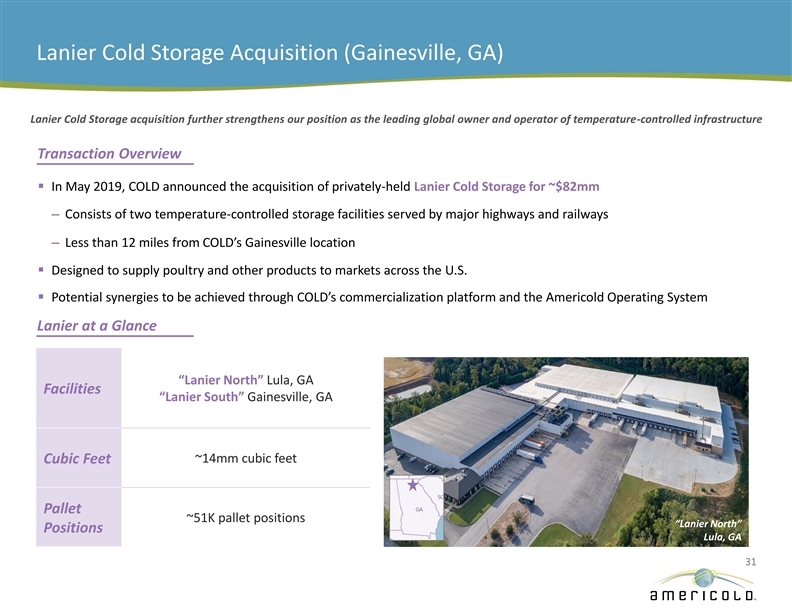
Lanier Cold Storage Acquisition (Gainesville, GA) Lanier Cold Storage acquisition further strengthens our position as the leading global owner and operator of temperature-controlled infrastructure Transaction Overview § In May 2019, COLD announced the acquisition of privately-held Lanier Cold Storage for ~$82mm – Consists of two temperature-controlled storage facilities served by major highways and railways – Less than 12 miles from COLD’s Gainesville location § Designed to supply poultry and other products to markets across the U.S. § Potential synergies to be achieved through COLD’s commercialization platform and the Americold Operating System Lanier at a Glance “Lanier North” Lula, GA Facilities “Lanier South” Gainesville, GA ~14mm cubic feet Cubic Feet Pallet ~51K pallet positions “Lanier North” Positions Lula, GA 31Lanier Cold Storage Acquisition (Gainesville, GA) Lanier Cold Storage acquisition further strengthens our position as the leading global owner and operator of temperature-controlled infrastructure Transaction Overview § In May 2019, COLD announced the acquisition of privately-held Lanier Cold Storage for ~$82mm – Consists of two temperature-controlled storage facilities served by major highways and railways – Less than 12 miles from COLD’s Gainesville location § Designed to supply poultry and other products to markets across the U.S. § Potential synergies to be achieved through COLD’s commercialization platform and the Americold Operating System Lanier at a Glance “Lanier North” Lula, GA Facilities “Lanier South” Gainesville, GA ~14mm cubic feet Cubic Feet Pallet ~51K pallet positions “Lanier North” Positions Lula, GA 31