Exhibit 99.1
TABLE OF CONTENTS
| Page |
|
|
GENERAL MATTERS | 1 |
FORWARD LOOKING STATEMENTS | 1 |
NON-IFRS MEASURES | 3 |
EXCHANGE RATE INFORMATION | 4 |
COMMODITY PRICE INFORMATION | 4 |
THE CORPORATION | 4 |
GENERAL DEVELOPMENT OF FRANCO-NEVADA’S BUSINESS | 5 |
EXPLANATION OF ROYALTIES, STREAMS AND OTHER INTERESTS | 10 |
TECHNICAL AND THIRD PARTY INFORMATION | 12 |
FRANCO-NEVADA’S ASSETS | 13 |
Asset Revenue and Descriptions | 14 |
Summary of Mineral Reserves and Mineral Resources | 17 |
Gold Assets | 22 |
United States | 22 |
Canada | 25 |
Australia | 28 |
International | 30 |
PGM Assets | 35 |
Other Minerals Assets | 37 |
Exploration Assets | 38 |
Oil & Gas Assets | 41 |
TECHNICAL REPORTS | 45 |
Goldstrike Mining and Technical Information | 45 |
Palmarejo Mining and Technical Information | 59 |
RESERVES DATA AND OTHER OIL AND GAS INFORMATION | 71 |
RISK FACTORS | 82 |
DIVIDENDS | 95 |
CAPITAL STRUCTURE | 95 |
MARKET FOR SECURITIES | 96 |
DIRECTORS AND OFFICERS | 98 |
LEGAL PROCEEDINGS AND REGULATORY ACTIONS | 101 |
INTERESTS OF MANAGEMENT AND OTHERS IN MATERIAL TRANSACTIONS | 101 |
REGISTRAR AND TRANSFER AGENT | 101 |
MATERIAL CONTRACTS | 102 |
EXPERTS | 102 |
ADDITIONAL INFORMATION | 103 |
AUDIT AND RISK COMMITTEE INFORMATION | 103 |
APPENDIX A FORM 51-101F2 | A-1 |
APPENDIX B FORM 51-101F3 | B-1 |
APPENDIX C FRANCO-NEVADA CORPORATION AUDIT AND RISK COMMITTEE CHARTER | C-1 |
GENERAL MATTERS
Unless otherwise noted or the context otherwise indicates, the terms “Franco-Nevada”, “Company”, “Corporation”, “our” and “we” refer to Franco-Nevada Corporation and its subsidiaries. For reporting purposes, the Corporation prepares its financial statements in United States dollars and, for the periods prior to January 1, 2010, in conformity with accounting principles generally accepted in Canada or Canadian GAAP and, for the periods on or after January 1, 2010, in conformity with International Financial Reporting Standards (“IFRS”). All dollar amounts in this Annual Information Form (“AIF”) are expressed in United States dollars, except as otherwise indicated. References to “$” or “dollars” are to United States dollars, references to “C$” are to Canadian dollars, references to “A$” are to Australian dollars and references to “ZAR” are to South African rand.
The information contained in this AIF is as of December 31, 2011, unless otherwise indicated. More current information may be available on our public website at www.franco-nevada.com or on the System for Electronic Document Analysis and Retrieval (“SEDAR”) at www.sedar.com. In addition, we generally maintain supporting materials on our website which may assist in reviewing (but are not to be considered part of) this AIF including a Glossary of Non-Technical Terms, Glossary of Technical Terms, Certain Oil and Natural Gas Terms and a Metric Conversion Table.
FORWARD LOOKING STATEMENTS
This AIF contains certain “forward looking information” and “forward looking statements” within the meaning of applicable Canadian securities laws and United States Private Litigation Reform Act 1995, respectively, which may include, but are not limited to, statements with respect to future events or future performance, management’s expectations regarding Franco-Nevada’s growth, results of operations, estimated future revenues, requirements for additional capital, mineral reserve and mineral resource estimates, production estimates, production costs and revenue, future demand for and prices of commodities, expected mining sequences, business prospects and opportunities. In addition, statements (including data in tables) relating to reserves and resources are forward looking statements, as they involve implied assessment, based on certain estimates and assumptions, and no assurance can be given that the estimates will be realized. Such forward looking statements reflect management’s current beliefs and are based on information currently available to management. Often, but not always, forward looking statements can be identified by the use of words such as “plans”, “expects”, “is expected”, “budget”, “scheduled”, “estimates”, “forecasts”, “predicts”, “projects”, “intends”, “targets”, “aims”, “anticipates” or “believes” or variations (including negative variations) of such words and phrases or may be identified by statements to the effect that certain actions “may”, “could”, “should”, “would”, “might” or “will” be taken, occur or be achieved. Forward looking statements involve known and unknown risks, uncertainties and other factors, which may cause the actual results, performance or achievements of Franco-Nevada to be materially different from any future results, performance or achievements expressed or implied by the forward looking statements. A number of factors could cause actual events or results to differ materially from any forward looking statement, including, without limitation, uncertainties relating to the closing of the First Uranium transactions referred to herein, fluctuations in the prices of the primary commodities that drive royalty and stream revenue (gold, platinum group metals, copper, nickel, uranium, silver and oil & gas), fluctuations in the value of the Canadian and Australian dollar, Mexican peso, and any other currency in which revenue is generated, relative to the US dollar, changes in national and local government legislation, including permitting and licensing regimes and taxation policies, regulations and political or economic developments in any of the countries where properties in which Franco-Nevada holds a royalty, stream or other interest are located, influence of macroeconomic developments, business opportunities that become available to, or are pursued by Franco-Nevada, reduced access to debt and equity capital, litigation, title, permit or license disputes related to interests or any of the properties in which Franco-Nevada holds a royalty, stream or other interest, the Company’s PFIC status, excessive cost escalation as well as development, permitting, infrastructure, operating or technical difficulties on any of the properties in which Franco-Nevada holds a royalty, stream or other interest, rate and timing of production differences from resource estimates, risks and hazards associated with the business of development and mining on any of the properties in which Franco-Nevada holds a royalty, stream or other interest, including, but not limited to unusual or unexpected geological and metallurgical conditions, slope failures or cave-ins, flooding and other natural disasters or civil unrest, and the integration of acquired assets. The forward looking statements contained in this AIF are based upon assumptions management believes to be reasonable, including, without limitation, the closing of the First Uranium transactions referred to herein, the ongoing operation of the properties in which Franco-Nevada holds a royalty, stream or other interest by the owners or operators of such
properties in a manner consistent with past practice, the accuracy of public statements and disclosures made by the owners or operators of such underlying properties, no material adverse change in the market price of the commodities that underlie the asset portfolio, the Company’s ongoing income and assets relating to determination of its PFIC status, no adverse development in respect of any significant property in which Franco-Nevada holds a royalty, stream or other interest, accuracy of publicly disclosed expectations for the development of underlying properties that are not yet in production, integration of acquired assets and the absence of any other factors that could cause actions, events or results to differ from those anticipated, estimated or intended. However, there can be no assurance that forward looking statements will prove to be accurate, as actual results and future events could differ materially from those anticipated in such statements and readers are cautioned that forward-looking statements are not guarantees of future performance. Franco-Nevada cannot assure investors that actual results will be consistent with these forward looking statements. Accordingly, readers should not place undue reliance on forward looking statements due to the inherent uncertainty therein. For additional information with respect to risks, uncertainties and assumptions, please refer to the “Risk Factors” section of this AIF, as well as Franco-Nevada’s most recent Management’s Discussion and Analysis filed with the Canadian securities regulatory authorities on www.sedar.com and the U.S. Securities and Exchange Commission on www.sec.gov. The forward looking statements herein are made as of the date of this AIF only and Franco-Nevada does not assume any obligation to update or revise them to reflect new information, estimates or opinions, future events or results or otherwise, except as required by applicable law.
Cautionary Note to US Investors Regarding Reserve and Resource Reporting Standards
The disclosure in this AIF has been prepared in accordance with the requirements of Canadian securities laws, which differ from the requirements of United States securities laws. Disclosure, including scientific or technical information, has been made in accordance with Canadian National Instrument 43-101 — Standards of Disclosure for Mineral Projects (“NI 43-101”). NI 43-101 is a rule developed by the Canadian Securities Administrators that establishes standards for all public disclosure an issuer makes of scientific and technical information concerning mineral projects. For example, the terms “measured mineral resources”, “indicated mineral resources”, “inferred mineral resources”, “proven mineral reserves” and “probable mineral reserves” are used in this AIF and documents incorporated herein by reference to comply with the reporting standards in Canada. While those terms are recognized and required by Canadian regulations, the United States Securities and Exchange Commission (the “SEC”) does not recognize them. Under United States standards, mineralization may not be classified as a “reserve” unless the determination has been made that the mineralization could be economically and legally produced or extracted at the time the reserve determination is made. Investors are cautioned not to assume that all or any part of the mineral deposits in these categories will ever be converted into mineral reserves. These terms have a great amount of uncertainty as to their existence, and great uncertainty as to their economic and legal feasibility. It cannot be assumed that all or any part of measured mineral resources, indicated mineral resources, inferred mineral resources, proven mineral reserves or probable mineral reserves will ever be upgraded or mined. In accordance with Canadian rules, estimates of inferred mineral resources cannot form the basis of feasibility or other economic studies. Investors are cautioned not to assume that any part of the reported measured mineral resources, indicated mineral resources or inferred mineral resources in this AIF is economically or legally mineable and will ever be classified as a reserve. In addition, the definitions of proven and probable mineral reserves used in NI 43-101 differ from the definitions in the SEC Industry Guide 7. Disclosure of “contained ounces” is permitted disclosure under Canadian regulations; however, the SEC normally only permits issuers to report mineralization that does not constitute reserves as in place tonnage and grade without reference to unit measures. Accordingly, information contained in this AIF containing descriptions of the Company’s mineral properties may not be comparable to similar information made public by U.S. companies subject to the reporting and disclosure requirements under the United States federal securities laws and the rules and regulations thereunder.
As noted under “Reserves Data and Other Oil and Gas Information”, Franco-Nevada is providing in this AIF disclosure relating to reserves and other oil and gas information prepared in accordance with Canadian disclosure requirements.
The primary differences between the Canadian requirements and the US standards are that:
· National Instrument 51-101 — Standards of Disclosure for Oil and Gas Activities (“NI 51-101”) requires disclosure of gross and net reserves using forecast prices, whereas the SEC rules require the disclosure of net reserves estimated using a historical 12-month average price;
· NI 51-101 requires the disclosure of the net present value of future net revenue attributable to all of the disclosed reserves categories, estimated using forecast prices and costs, before and after deducting future income tax expenses, calculated without discount and using discount rates of 5%, 10%, 15% and 20%, whereas the SEC rules require disclosure of the present value of future net cash flows attributable to proved reserves only, estimated using a constant price (the historical 12-month average price) and a 10% discount rate;
· NI 51-101 requires a one-year reconciliation of gross proved reserves, gross probable reserves and gross proved plus probable reserves, based on forecast prices and costs, for various product types, whereas the SEC rules require a three-year reconciliation of net proved reserves, based on constant prices and costs, for less specific product types; and
· NI 51-101 requires reserves to show a hurdle rate of return, whereas the SEC rules require reserves to be cash flow positive on an undiscounted basis.
NON-IFRS MEASURES
2010 and Prior
Franco-Nevada included in its 2010 and prior Non-IFRS Measures the following:
“Royalty Revenue” was defined by Franco-Nevada as cash received or receivable from operating royalty assets.
“Free Cash Flow” was defined by Franco-Nevada as operating income plus depletion and depreciation, non-cash charges, and any impairment of investments and royalty interests.
“Margin” was defined as Free Cash Flow as a percentage of Net Revenue.
“Adjusted Net Income” was defined by Franco-Nevada as net income excluding impairment charges related to royalties, working interests and investments; fair value changes for royalties accounted for as derivative assets; foreign currency gains and losses; gains and losses on sale of investments; and the impact of taxes on all these items.
2011 and Beyond
Franco-Nevada did not replace Royalty Revenue with Net Revenue as previously planned but instead included in its 2011 Non-IFRS Measures the following:
“EBITDA” is defined by the Corporation as net income (loss) excluding income tax expense, finance income and costs and depletion and depreciation.
“Adjusted EDITDA” is defined by the Corporation as net income (loss) excluding income tax expense, finance income and costs, foreign exchange gains and losses, gains and losses on sale of investments, income and losses from equity investees, depletion and depreciation and impairment charges related to royalties, streams, working interests and investments.
“Adjusted Net Income” is defined by the Corporation as net income (loss) excluding foreign exchange gains and losses, gains and losses on sale of investments, impairment charges related to royalties, streams, working interests and investments, unusual non-recurring items, and the impact of taxes on these items.
Franco-Nevada plans to continue using these methods.
EXCHANGE RATE INFORMATION
The following table sets out the high and low rates of exchange for one U.S. dollar expressed in Canadian dollars in effect at the end of each of the following periods; the average rate of exchange for those periods; and the rate of exchange in effect at the end of each of those periods, each based on the noon rate published by the Bank of Canada.
|
| Years ended December 31, |
| |||||||
|
| 2011 |
| 2010 |
| 2009 |
| |||
High |
| $ | 1.0604 |
| $ | 1.0778 |
| $ | 1.3000 |
|
Low |
| $ | 0.9449 |
| $ | 0.9946 |
| $ | 1.0292 |
|
Average for the Period |
| $ | 0.9891 |
| $ | 1.0299 |
| $ | 1.1420 |
|
End of Period |
| $ | 0.9833 |
| $ | 0.9946 |
| $ | 1.0466 |
|
On March 26, 2012 the noon rate was U.S.$1.00 = C$0.9922 as published by the Bank of Canada.
COMMODITY PRICE INFORMATION
|
| Spot Commodity Prices |
| |||||||||||||
|
| Gold /oz |
| Platinum /oz |
| Palladium /oz |
| Oil / C$ bbl |
| Gas / C$ mcf |
| |||||
|
|
|
|
|
|
|
|
|
|
|
| |||||
Average for 2009 |
| $ | 972 |
| $ | 1,203 |
| $ | 263 |
| $ | 66 |
| $ | 3.79 |
|
Average for 2010 |
| $ | 1,225 |
| $ | 1,610 |
| $ | 526 |
| $ | 78 |
| $ | 3.81 |
|
Average for 2011 |
| $ | 1,569 |
| $ | 1,720 |
| $ | 733 |
| $ | 95 |
| $ | 3.44 |
|
THE CORPORATION
Name, Address and Incorporation
Franco-Nevada was incorporated under the Canada Business Corporations Act on October 17, 2007 and was amalgamated with Franco-Nevada Canada Corporation (“FN Canada Subco”), its wholly-owned subsidiary, on January 1, 2008. Franco-Nevada’s head office and registered office is located at Suite 740, Exchange Tower, 130 King Street West, Toronto, Ontario M5X 1E4. Franco-Nevada has additional offices in Denver, Colorado, Perth, Australia and Bridgetown, Barbados, all of which are used to manage its asset portfolio and pursue new investment opportunities.
Intercorporate Relationships
Franco-Nevada has twelve wholly-owned subsidiaries: Franco-Nevada U.S. Corporation (“FN U.S.”), a Delaware company, Franco-Nevada Australia Pty Ltd. (“FN Australia”), an Australia company, Franco-Nevada Mexico Corporation, S.A. de C.V. (“FN Mexico”), a Mexico company, FN Subco Inc., a British Columbia company, Franco-Nevada Alberta Corporation, an Alberta company, Franco-Nevada GLW Holdings Corp. (“FN GLW”), a British Columbia company, Franco-Nevada (Barbados) Corporation, a Barbados corporation, Franco-Nevada Canada Holdings Corp., a Canada company, Franco-Nevada LRC Holdings Corp., a British Columbia company, Minera Global Copper Chile S.A., a Chile company, Franco-Nevada Alberta Holdings ULC, an Alberta company, and Franco-Nevada U.S. Holding Corp., a Delaware company. All subsidiaries are wholly-owned by Franco-Nevada either directly or indirectly.

GENERAL DEVELOPMENT OF FRANCO-NEVADA’S BUSINESS
Overview
Franco-Nevada is a gold-focused royalty and stream company with additional interests in platinum group metals (“PGMs”), oil & gas and other resource assets. Franco-Nevada is the leading gold royalty and stream company by both gold revenues and number of gold assets. The majority of revenues are generated from a diversified portfolio of properties in the United States, Canada, Mexico and South Africa. The portfolio includes over 300 assets covering properties at various stages from production to early stage exploration. Royalties and streams are mostly revenue or production based. The portfolio also includes profit-based royalties and other forms of periodic future payments. Streams differ from royalties and are generally contracts for the forward purchase of a portion of future gold metal from a mining property.
Franco-Nevada’s assets are mostly mineral and oil & gas royalties or streams but also include some working and equity interests, undeveloped properties, options to acquire royalties and streams and other assets. The mineral royalties and streams are further characterized by commodity as being in the gold, PGMs or base metals categories and these in turn are further subdivided by their project status as being either producing, advanced or exploration assets. A majority of the mineral royalties and streams are characterized as being gold and the majority of revenues are from gold assets. Franco-Nevada considers its stream/royalty interest in the Palmarejo and Goldstrike projects to be its only material mineral projects for the purposes of NI 43-101. The oil & gas assets are located primarily in the Western Canadian sedimentary basin with a larger amount of revenue generated from conventional oil than from natural gas properties in 2011. The oil & gas assets also include mineral rights to approximately 100,000 gross acres of unproved land in Canada primarily related to oil and natural gas rights as well as working interests in Arctic gas resources.
Mineral royalties and streams are an alternative to other more conventional forms of financing, including equity, convertible securities and debt financings which can be used to finance mineral projects. Franco-Nevada competes directly against these other sources of capital to provide financing for mining and oil & gas projects.
Franco-Nevada currently operates a small organization. As of March 26, 2012, Franco-Nevada has 19 full-time employees and approximately 5 part-time contractors. As such, Franco-Nevada is dependent upon the continued availability and commitment of its key management, whose contributions to the immediate and future operations of Franco-Nevada are of significant importance. From time to time, Franco-Nevada may also need to identify and retain additional skilled management and specialized technical personnel to efficiently operate its business. For additional information, see “Risk Factors”.
Franco-Nevada has several foreign subsidiaries and holds royalties, streams or other interests in numerous jurisdictions around the world. For additional information on risks related to these interests in foreign jurisdictions, see “Risk Factors”.
Corporate Policies
Franco-Nevada currently does not operate any of the mineral or oil & gas assets in which it has royalty/stream interests. However, Franco-Nevada recognizes its business model is dependent on the industry operating in a responsible fashion and actively supports the industry in its efforts and initiatives. Franco-Nevada may from time to time engage in exploration efforts as part of advancing a property or to conduct due diligence in advance of undertaking an investment. When doing so, Franco-Nevada undertakes to be guided by the Principles and Guidance for a Framework of Responsible Exploration as set forth by the e3Plus program of the Prospectors and Developers Association of Canada.
Franco-Nevada has adopted policies relating to its business conduct, including a code of business conduct and ethics, an environmental and corporate social responsibility policy and a health and safety policy. Additional information relating to these and other policies are contained in Franco-Nevada’s information circular for its annual and special meeting of shareholders held on May 18, 2011 and will also be contained in Franco-Nevada’s information circular for its annual and special meeting of shareholders scheduled to be held on May 8, 2012. See “Statement of Governance Practices” in such circulars.
Background of Franco-Nevada
Many of Franco-Nevada’s assets were originally acquired and developed by Franco-Nevada Mining Corporation Limited (“Old Franco-Nevada”), Normandy Mining Limited (“Normandy”) and Newmont Mining Corporation (“Newmont”). Old Franco-Nevada was a publicly-listed company on the Toronto Stock Exchange (the “TSX”) from 1983 to 2002 and had originally acquired royalties at the Goldstrike complex along with many other royalties. In February 2002, Newmont acquired Old Franco-Nevada along with Normandy. Old Franco-Nevada’s assets and part of its management team were incorporated into a new division of Newmont called Newmont Capital Limited (“Newmont Capital”). Newmont Capital’s activities included the management of royalty, investment and project portfolios as well as corporate development. Pursuant to an acquisition agreement dated November 30, 2007 (the “Newmont Acquisition Agreement”), Franco-Nevada acquired (i) all of the outstanding common shares in the capital of FN Canada Subco, FN U.S. and FN Australia, and (ii) the sellers’ (being subsidiaries of Newmont) rights, titles and interests in and to the assets included in the royalty assets transferred directly to Franco-Nevada by such sellers. In addition, Franco-Nevada assumed certain liabilities, including all environmental liabilities, in connection with the royalty assets, the obligations and liabilities relating to the royalty assets after the closing date, certain transaction costs, all currently outstanding authorizations for expenditures created on or prior to the closing date, and all other liabilities and obligations arising out of ownership or operation of the royalty assets following the closing date.
Three-Year History
2009
Acquisition of the Palmarejo Gold Stream
Pursuant to an agreement between Franco-Nevada and Coeur d’Alene Mines Corporation (“Coeur”) (the “Palmarejo Acquisition Agreement”), on January 21, 2009 Franco-Nevada acquired, through FN Mexico, a 50% gold stream in the Palmarejo silver and gold project (the “Palmarejo project”) in Mexico for a total consideration of $86.2 million, consisting of cash and special warrants. The Corporation acquired an interest in 50% of the gold produced from the Palmarejo project to be paid on the difference between the spot gold price and $400/ounce (“oz”), increasing by 1% per annum after the fourth anniversary following closing. The attributable gold ounces are the greater of actual production and a minimum amount. The minimum amount is 50,000 ounces per annum until payments have been made on 400,000 ounces. On September 22, 2010, 316,436 special warrants, which were granted in connection with the Palmarejo Acquisition Agreement were exercised. For additional information, see “Gold Assets — International — Palmarejo, Mexico”.
2009 Public Offering
On June 16, 2009, Franco-Nevada issued 11,500,000 units (including the full exercise of an over-allotment option) each unit consisting of one common share of Franco-Nevada (a “Common Share”) and one-half of one Common Share purchase warrant, for aggregate gross proceeds of C$370.3 million pursuant to a short form prospectus dated June 9, 2009. Each whole Common Share purchase warrant (a “2017 Warrant”) entitles the
holder to purchase one Common Share at a price of C$75.00 per share until June 16, 2017. The units were sold pursuant to an underwriting agreement dated June 2, 2009 (the “2009 Underwriting Agreement”) between Franco-Nevada and a syndicate of investment dealers led by BMO Nesbitt Burns Inc., GMP Securities L.P. and CIBC World Markets Inc.
Acquisition of the Subika Royalty Interest
On November 20, 2009, pursuant to an agreement between Franco-Nevada and Moydow Mines International Inc. (“Moydow”), Franco-Nevada acquired for a total consideration of $13.3 million in cash, a 20% undivided interest in Moydow’s 2% net smelter return royalty on a portion of Newmont’s Ahafo property in Ghana, known as Subika. Pursuant to an agreement dated November 20, 2009 between Franco-Nevada, FN Subco Inc. and Moydow, on January 22, 2010, FN Subco Inc. and Moydow amalgamated (with the name of the amalgamated corporation being FN Subco Inc.) by way of a plan of arrangement and the Corporation acquired all of the outstanding shares of Moydow. The remaining 80% undivided interest in the Subika royalty property was acquired pursuant to this plan of arrangement. The Corporation issued 1,733,993 Common Shares as part of the plan of arrangement and reserved 94,470 Common Shares for issuance to former Moydow directors, officers, employees and consultants upon exercise of outstanding options granted under Moydow’s stock option plan. For additional information, see “Gold Assets — International — Subika, Ghana”.
2010
Acquisition of the Prosperity Gold Stream
On May 12, 2010, Franco-Nevada announced that it had entered into an agreement to acquire from Taseko Mines Limited (“Taseko”) a gold stream on its Prosperity copper-gold project located in British Columbia (the “Taseko Agreement”). Franco-Nevada agreed to provide a $350 million deposit and certain warrant consideration for the construction of Prosperity when the project was fully permitted and financed. In consideration for the deposit, Franco-Nevada would acquire from Taseko gold equivalent to 22% of the gold produced at Prosperity. In addition, Franco-Nevada would pay Taseko the lower of $400/oz (subject to an inflation adjustment) or the prevailing market price for each ounce of gold delivered under the Taseko Agreement. On November 2, 2010, the Federal Minister of the Environment announced that Taseko had not been granted federal authorizations to proceed “as proposed” with the Prosperity mine project. On February 21, 2011, Taseko submitted a new project description for Prosperity with the Government of Canada that preserves Fish Lake, addressing a key concern identified during the federal review process. The Minister of the Environment has indicated the further review will be concluded by November 2012. Franco-Nevada’s financing commitment remains available to Taseko provided the project is fully permitted and financed prior to May 12, 2012 although the Taseko Agreement will remain in force unless it is terminated by Franco-Nevada. The Prosperity gold stream is currently classified as an advanced asset of Franco-Nevada.
2011
Acquisition of Gold Wheaton
On March 14, 2011, pursuant to an arrangement agreement dated as of January 5, 2011 (the “Arrangement Agreement”) between Franco-Nevada and Gold Wheaton Gold Corp. (“Gold Wheaton”), Franco-Nevada acquired all of the outstanding common shares of Gold Wheaton that it did not already own and Gold Wheaton amalgamated with a wholly-owned subsidiary of Franco-Nevada to form FN GLW. Franco-Nevada had previously acquired a 34.5% interest in Gold Wheaton from Quadra FNX Mining Ltd. (“Quadra FNX”) for C$4.65 per share in cash (approximately C$262,558,186 million). Following the acquisition of Gold Wheaton, the Corporation topped up Quadra FNX’s total consideration to C$5.20 per share in cash (an additional C$31,055,269) on March 21, 2011, which was the same consideration received by Gold Wheaton shareholders. The total aggregate purchase price was C$293,613,455 for the 34.5% interest.
The Arrangement Agreement provided Gold Wheaton shareholders (other than Franco-Nevada) with the option to elect to receive either (i) 0.1556 of a Common Share or (ii) C$5.20 in cash, for each Gold Wheaton common share, subject to caps and pro-ration. In accordance with the Arrangement Agreement, Gold Wheaton shareholders (other than Franco-Nevada) received in the aggregate cash consideration of approximately C$259.5 million and approximately 11.65 million Common Shares. In accordance with the maximum cash and share caps and pro-rationing mechanism under the Arrangement Agreement and as a result of Gold Wheaton shareholder elections, Gold Wheaton shareholders who elected or were deemed to have elected all cash received C$5.20 in cash, for each Gold Wheaton common share. Gold Wheaton shareholders who elected all
shares received approximately 0.1262 of a Common Share and approximately C$0.99, for each Gold Wheaton common share.
Gold Wheaton warrants that were outstanding as of 12:01 a.m. (Vancouver time) on March 14, 2011 (the “Effective Time”) became warrants of FN GLW that upon exercise will entitle each holder thereof, at its election, to receive either (i) 0.1556 of a Common Share or (ii) C$5.20 in cash. The FN GLW warrants that are due to expire on July 8, 2013 (the “2013 GLW Warrants”), which were listed on the TSX under the symbol GLW.WT, are now listed on the TSX under the symbol FNV.WT.B.
Gold Wheaton options that were outstanding at the Effective Time became options of FN GLW that upon exercise will entitle each holder thereof to receive 0.1556 of a Franco-Nevada Common Share.
In addition, on December 31, 2010, Franco-Nevada acquired 10% secured notes of Gold Wheaton from third parties having an aggregate face value of C$100 million. Franco-Nevada purchased the notes for approximately C$111 million plus accrued interest. The purchase price was equal to the price at which the holder had the right to call the notes in the event of a change of control of Gold Wheaton. Notes with a face value of C$7 million remained outstanding following the closing of the acquisition and were repaid on March 20, 2011.
A business acquisition report dated March 22, 2011 in respect of the acquisition of Gold Wheaton was filed by Franco-Nevada on SEDAR at www.sedar.com. For a description of the assets acquired as a result of the acquisition of Gold Wheaton, see “Gold Assets — International — MWS, South Africa and Ezulwini, South Africa” and “Gold Assets — Sudbury (Gold), Ontario” and “PGM Assets — Sudbury (PGM), Ontario”.
Acquisition of the Edikan Royalty Interest
On June 30, 2011, Franco-Nevada acquired for $35 million an effective 1.5% net smelter return royalty on all production from the Ayanfuri concession in Ghana from AngloGold Ashanti (Ghana) Limited (“AngloGold Ashanti”). Perseus Mining Limited (“Perseus”) is the operator of this property.
Acquisition of the Canadian Malartic Royalty Interest
On July 12, 2011, Franco-Nevada acquired a 1.5% gross overriding metal royalty encompassing seven mining claims which comprise a portion of Osisko Mining Corporation’s Malartic project in Canada. The purchase price was C$9.7 million payable by the issuance of 267,000 Common Shares.
Acquisition of the Phoenix Royalty Interest
On August 31, 2011, Franco-Nevada acquired a 2% net smelter return royalty payable on part of Rubicon Minerals Corporation’s Phoenix gold project in Red Lake, Ontario lying primarily beneath the waters of Red Lake. Rubicon has an option to repurchase a 0.5% net smelter return royalty from Franco-Nevada. The purchase price was approximately $23.7 million payable by the issuance of 550,000 Common Shares.
New York Stock Exchange (“NYSE”) Listing
On September 8, 2011, the Common Shares began trading on the NYSE under the symbol “FNV”.
Acquisition of Lumina Royalty Corp.
On September 21, 2011, Franco-Nevada and Lumina Royalty Corp. (“Lumina”) entered into an arrangement agreement pursuant to which Franco-Nevada agreed to acquire all of the outstanding common shares of Lumina by way of a statutory plan of arrangement for consideration payable in Common Shares and 2017 Warrants. The transaction closed on December 1, 2011 and Lumina shareholders received an aggregate of 1,383,850 Common Shares and an aggregate 760,769 2017 Warrants.
With this acquisition, Franco-Nevada acquired the following royalty interests:
· a 1.5% net smelter return royalty on Teck Resources Ltd.’s Relincho copper/molybdenum project located in Region III, Chile;
· a 1.08% net smelter return royalty on Lumina Copper Corp.’s Taca Taca copper/gold/molybdenum project located in Salta Province, Argentina;
· certain royalties on Coro Mining Corp.’s San Jorge copper/gold/molybdenum project located in Mendoza Province, Argentina (which royalties Franco-Nevada and Coro Mining Corp. have subsequently agreed to
restructure; pursuant to an agreement in principle, Franco-Nevada is to receive, among other things, a 7.5% net smelter return royalty on gold produced from the property); and
· a 2% net smelter return royalty on open pit mining and a 1% net smelter return royalty on underground mining on a portion of Los Andes Copper Limited’s Vizcachitas copper/molybdenum project located in Region V, Chile.
2011 Public Offering
On September 15, 2011, Franco-Nevada filed a short form base shelf prospectus (the “Base Shelf Prospectus”) in Canada and the U.S. which allows the Corporation to offer and issue from time to time Common Shares, preferred shares, debt securities, warrants to purchase Common Shares, preferred shares or debt securities and subscription receipts or any combination thereof for an aggregate initial offering price of up to C$1 billion (or the equivalent thereof in other currencies) during the 25-month period that the Base Shelf Prospectus, including any amendments thereto, remains effective.
On November 30, 2011, Franco-Nevada issued 9,200,000 Common Shares (including the full exercise of an over-allotment option) at a price of C$42.50 per share for aggregate gross proceeds of C$391 million. This public offering was made by way of a prospectus supplement to the Base Shelf Prospectus. The Common Shares were sold on a bought-deal basis pursuant to an underwriting agreement dated November 23, 2011 (the “2011 Underwriting Agreement”) between Franco-Nevada and a syndicate of investment dealers led by BMO Capital Markets.
2012
Acquisition of Additional Royalty in Bronzewing
On January 11, 2012, Franco-Nevada increased its net smelter return royalty on Navigator Resources Limited’s (“Navigator”) Bronzewing mine in Western Australia from 1% to 2% for A$4.5 million.
Acquisition of Working Interest in Weyburn Unit
On February 23, 2012, Franco-Nevada acquired an additional 1.15% working interest in the Weyburn Unit in southeast Saskatchewan, increasing its total working interest in the Weyburn Unit to 2.26%, for approximately C$55 million.
Acquisition of Timmins West Royalty Interest
On February 29, 2012, Franco-Nevada acquired a 2.25% net smelter return royalty from Lake Shore Gold Corp. on the Timmins West Complex located in Ontario for $35 million. In addition to the royalty, Franco-Nevada acquired 10,050,591 common shares of Lake Shore Gold Corp. for C$15 million.
Current Year Changes to the Business
The following contains forward-looking statements about Franco-Nevada’s outlook for 2012. Reference should be made to the “Forward-Looking Statements” section at the beginning of this AIF. For a description of material factors that could cause our actual results to differ materially from the forward-looking statements in the following, please see the “Forward-Looking Statements” and the “Risk Factors” sections of this AIF.
With respect to our existing portfolio, Franco-Nevada has the following expectations related to some of our key assets for 2012:
· Palmarejo is expected to continue to be a significant component of revenue for the Company in 2012. Coeur, the operator of Palmarejo, has announced estimated production of between 98,000 to 108,000 ounces of gold at Palmarejo for 2012. The Company has a 50% gold stream at Palmarejo which includes an annual minimum production provision of 50,000 ounces.
· The Sudbury stream assets are operated by KGHM International Ltd. (“KGHM”) following its acquisition of Quadra FNX. The operator has announced plans to put Podolsky on care and maintenance once existing mineral reserves at the 2000 deposit are mined, which is expected to be by the end of 2012, and it is expected that KGHM will continue to focus on mining nickel ore at McCreedy in 2012 which does not generate payable PGMs attributable to Franco-Nevada. The Company expects to earn revenue in 2012 comparable to 2011 levels from the three streams.
· Goldstrike revenue is expected to be higher in 2012 than 2011 as the operator, Barrick Gold Corporation (“Barrick”), has announced that it expects increased production from Goldstrike in 2012 as the mine completed a stripping phase towards the end of 2011.
· The Company expects increased revenues from Mine Waste Solutions (“MWS”) in 2012 compared to 2011. MWS experienced certain mining interruptions in 2011. First Uranium Corporation (“FIU”) has announced that the acquisition of MWS by AngloGold Ashanti is expected to close in mid 2012.
· Franco-Nevada’s oil assets are expected to deliver increased revenues in 2012 due to the acquisition of an additional Weyburn Unit working interest at the beginning of 2012. The effective date of the transaction was January 1, 2012 and more than doubles the Company’s working interest in the Weyburn Unit to 2.26%.
· Stillwater revenues are expected to be in line with 2011 with Stillwater Mining Company (“Stillwater”) announcing 2012 production guidance to be consistent with 2011 levels.
· The Company expects to be paid 11,250 ounces of gold in 2012 from its Gold Quarry royalty based on the minimum royalty provision.
· The Tasiast royalty, operated by Kinross Gold Corporation (“Kinross”), began royalty payments in the third quarter of 2011. Kinross has completed the first expansion phase at Tasiast and the Company expects to earn higher revenues from Tasiast as it will be paid for a full year of production in 2012 which is expected to be approximately 200,000 ounces. The royalty is a 2% net smelter return which covers all of the tenements encompassing the operation.
· The Company also expects to benefit from new sources of revenue from recent acquisitions, such as Timmins West, Edikan and Canadian Malartic, and organic growth from existing assets as projects move into production, such as Garden Well, or thresholds are surpassed, such as the Musselwhite, Macassa and Hemlo net profit interests.
EXPLANATION OF ROYALTIES, STREAMS AND OTHER INTERESTS
A royalty is a payment to a royalty holder by a property owner or an operator of a property and is typically based on a percentage of the minerals or other products produced or the revenues or profits generated from the property. The granting of a royalty to a person usually arises as a result of: (i) paying part of the consideration payable to land owners, prospectors or junior mining companies for the purchase of their property interests; (ii) providing capital in exchange for granting a royalty; or (iii) converting a participating interest in a joint venture relationship into a royalty.
Royalties are not typically working interests in a property. Therefore, depending on the nature of the royalty interest and the laws applicable to the royalty and project, the royalty holder is generally not responsible for, and has no obligation to contribute, additional funds for any purpose, including, but not limited to, operating or capital costs, or environmental or reclamation liabilities. Typically, royalty interests are established through a contract between the royalty holder and the property owner, although many jurisdictions permit the holder to also register or otherwise record evidence of a royalty interest in applicable mineral title or land registries. The unique characteristics of royalties may provide royalty holders with special commercial benefits not available to the property owner because the royalty holder may enjoy the upside potential of the property with reduced risk.
Revenue-based Royalties: The majority of royalty revenues that Franco-Nevada receives are royalties based on revenues from the value of production. The key types of revenue-based royalties are described in general terms below:
Net Smelter Return (“NSR”) royalties are based on the value of production or net proceeds received by the operator from a smelter or refinery. These proceeds are usually subject to deductions or charges for transportation, insurance, smelting and refining costs as set out in the royalty agreement. For gold royalties, the deductions are generally minimal, while for base metal projects the deductions can be much more substantial. This type of royalty generally provides cash flow that is free of any operating or capital costs and environmental liabilities. A smaller percentage NSR in a project can effectively equate to the economic value of a larger percentage profit or working interest in the same project.
Gross Royalties (“GR”) or Gross Overriding Royalties (“GOR”) are based on the total revenue stream from the sale of production from the property with few, if any, deductions. Some contracts refer to
Gross Proceeds (“GP”) which have been characterized as comparable to Gross Royalties in this document.
Overriding Royalties (“ORR”) and Lessor or Freehold Royalties (“FH”) are based on the proceeds from gross production and are usually free of any operating, capital and environmental costs. These terms are usually applied in the oil and gas industry.
Profit-based Royalties: Franco-Nevada also receives a portion of its revenues from royalties that are calculated based on profits, as described below:
Net Profit Interest (“NPI”) is based on the profit realized after deducting costs related to production as set out in the royalty agreement. NPI payments generally begin after payback of capital costs. Although the royalty holder is generally not responsible for providing capital, covering operating losses or environmental liabilities, increases in production costs will affect net profits and royalties payable.
Franco-Nevada has a small number of fixed royalties. These are royalties that are paid based on a set rate per tonne mined, produced or processed basis or even a minimum for a period of time rather than as a percentage of revenue or profits. These types of royalties are more common for iron ore, coal and industrial minerals and usually do not have exposure to changes in the underlying commodity price.
The royalty types listed above can include additional provisions that allow them to change character in different circumstances or have varying rates. Some examples are as follows:
Minimum Royalty (“MR”) is a provision included in some royalties that requires fixed payments at a certain level even if the project is not producing, or the project is producing at too low a rate to achieve the minimum.
Advance Minimum Royalty (“AMR”) is similar to an MR except that, once production begins, the minimum payments already paid are often credited against subsequent royalty payments from production that exceeds the minimum.
Sliding Scale Royalty (“Sliding Scale” or “ss”) refers to royalties where the royalty percentage is variable. Generally this royalty percentage is indexed to metal prices or a production threshold. Generally, a minimum or maximum percentage would be applied to such a royalty.
Capped Royalty (“Capped”) refers to royalties that expire or cease payment after a particular cumulative royalty amount has been paid or a set production volume threshold or time period has been reached.
Royalties can be commodity specific and, for instance, apply only to gold or hydrocarbons or have varying royalty structures for different commodities from the same property. Royalties can be restricted or varied by metallurgy, ore type or even by stratigraphic horizon. Generally, the contract terms for royalties in the oil and gas business are more standardized than those found in the mineral business.
Streams: Streams are distinct from royalties. They are metal purchase agreements where, in exchange for an upfront deposit and ongoing payments for metal delivered, the holder purchases all or a portion of one or more metals produced from a mine, at a preset price. In the case of gold, the agreements typically provide for the purchase price to be the spot price at the time of delivery with a fixed price per ounce ($400 for gold in the contracts which Franco-Nevada currently has) (with a small inflationary adjustment) payable in cash and the balance paid by applying the upfront deposit. Once the upfront deposit is fully applied, the purchase price is the fixed price per ounce payable in cash (with a small inflationary adjustment). Gold streams are well suited to co-product production providing incentive to the operator to produce the gold. The stream structure also helps maintain the borrowing capacity for the project. Streams can provide higher leverage to commodity price changes as a result of the fixed purchase price per ounce.
Working Interests (“WI”): A working interest is significantly different than a royalty or stream in that a holder of a WI owns an undivided possessory interest in the land or leasehold itself, and is liable for its share of capital, operating and environmental costs, usually in proportion to its ownership percentage, and it receives its pro rata share of revenue. Minority working or equity interests are not considered to be royalties because of the ongoing funding commitments, although they can be similar in their calculations to NPIs.
Example of a Royalty (NSR or NPI) versus a Stream
Assume for one ounce of gold, a sales price of $1,600 and an “all-in” operating cost of $780 per ounce excluding depreciation or $975 per ounce including depreciation(1). Also assume that Franco-Nevada has a 4% NSR, a 4% NPI or WI or a 4% stream with a pre-determined $400 per ounce purchase cost.
|
| NSR |
| Stream |
| Developed |
| Undeveloped |
| ||||
One ounce sold at |
| $ | 1,600 |
| $ | 1,600 |
| $ | 1,600 |
| $ | 1,600 |
|
Applicable cost |
| — |
| $ | 400 |
| $ | 780 | (1) | $ | 975 | (1) | |
Margin for calculation |
| $ | 1,600 |
| $ | 1,200 |
| $ | 820 |
| $ | 625 |
|
|
|
|
|
|
|
|
|
|
| ||||
NSR, Stream or NPI % |
| 4 | % | 4 | % | 4 | % | 4 | % | ||||
Revenue per ounce to FNV |
| $ | 64 |
| $ | 48 |
| $ | 33 |
| $ | 25 |
|
(1) Source: TD Securities estimates for 2012
Based on the above economics, a comparable percentage NSR is two to three times more valuable than an equivalent NPI or WI and 33% more valuable than a stream interest. With changes to the gold price, the NPI or WI would demonstrate the most leverage while the NSR would provide the most down side protection. The stream provides commodity price leverage similar to a low cost operating company with more certainty as to future costs.
TECHNICAL AND THIRD PARTY INFORMATION
Except where otherwise stated, the disclosure in this AIF relating to properties and operations on the properties on which Franco-Nevada holds royalty or stream interests is based on information publicly disclosed by the owners or operators of these properties and information/data available in the public domain as at March 26, 2012 (except where stated otherwise), and none of this information has been independently verified by Franco-Nevada. Specifically, as a royalty or stream holder, Franco-Nevada has limited, if any, access to properties included in its asset portfolio. Additionally, Franco-Nevada may from time to time receive operating information from the owners and operators of the properties, which it is not permitted to disclose to the public. Franco-Nevada is dependent on the operators of the properties and their qualified persons to provide information to Franco-Nevada (such as the Goldstrike Report and Palmarejo Report (as defined below) or on publicly available information to prepare required disclosure pertaining to properties and operations on the properties on which Franco-Nevada holds royalty or stream interests and generally has limited or no ability to independently verify such information. Although Franco-Nevada does not have any knowledge that such information may not be accurate, there can be no assurance that such third party information is complete or accurate. Some information publicly reported by operators may relate to a larger property than the area covered by Franco-Nevada’s royalty or stream interest. Franco-Nevada’s royalty or stream interests often cover less than 100% and sometimes only a portion of the publicly reported mineral reserves, mineral resources and production of the property.
Except where otherwise noted, the disclosure in this AIF relating to mineral reserve and mineral resource statements for individual properties is made as at December 31, 2011. In addition, numerical information presented in this AIF which has been derived from information publicly disclosed by owners or operators may have been rounded by Franco-Nevada and, therefore, there may be some inconsistencies within this AIF with respect to significant digits presented.
The disclosure in this AIF of a scientific or technical nature for the Goldstrike complex (as defined below) is based on a technical report dated March 16, 2012 prepared by Roscoe Postle Associates Inc. (“RPA”) for Barrick and Franco-Nevada in accordance with NI 43-101. The technical report for the Goldstrike complex (the “Goldstrike Report”) is entitled “Technical Report on the Goldstrike Mine, Eureka & Elko Counties, State of Nevada, USA” and was prepared by RPA under the supervision of and endorsed by Chester M. Moore, P. Eng., R. Dennis Bergen, P.Eng., Wayne W. Valliant, P.Geo., Stuart E. Collins, P.E. and Kathleen Ann Altman, Ph.D., P.E. who are each a “qualified person” for the purposes of NI 43-101 and who also reviewed the disclosure of scientific and technical information in this AIF regarding the Goldstrike complex. The Goldstrike Report has been filed on SEDAR under Franco-Nevada’s profile at www.sedar.com.
The disclosure in this AIF of a scientific or technical nature for the Palmarejo project is based on a technical report dated January 1, 2012 prepared for Coeur and Franco-Nevada in accordance with NI 43-101. The technical report for the Palmarejo project (the “Palmarejo Report”) is entitled “Palmarejo Project SW Chihuahua State, Mexico Technical Report” and was prepared by or under the supervision of Mr. Donald J. Birak, Senior Vice President - Exploration, Coeur d’Alene Mines Corporation and Mr. Keith Blair, Manager, Applied Geoscience LLC, each of whom is a “qualified person” for the purposes of NI 43-101 and who also reviewed the disclosure of scientific and technical information in this AIF regarding the Palmarejo project. The Palmarejo Report has been filed on SEDAR under Franco-Nevada’s profile at www.sedar.com.
The disclosure in this AIF for the reserve assessment and evaluation of the oil & gas reserves including the Weyburn Unit, Midale Unit and Edson Property (each as defined below), was prepared by GLJ Petroleum Consultants Ltd. (“GLJ”) for Franco-Nevada and was dated February 28, 2012, with an effective date of December 31, 2011, in accordance with NI 51-101.
Reconciliation to CIM Definitions
In this AIF, Franco-Nevada has disclosed a number of resource and reserve estimates covering properties related to the mineral assets that are not based on Canadian Institute of Mining, Metallurgy and Petroleum (“CIM”) definitions, but instead have been prepared in reliance upon JORC, SAMREC and Guide 7 (collectively, the “Foreign Codes”). Estimates based on Foreign Codes are acceptable under NI 43-101 in certain circumstances.
In each case, the mineral resources and mineral reserves reported in this AIF are based on estimates previously disclosed by the relevant property owner or operator, without reference to the underlying data used to calculate the estimates. Accordingly, Franco-Nevada is not able to reconcile the resource and reserve estimates prepared in reliance on a Foreign Code with that of CIM definitions. Franco-Nevada previously sought confirmation from one of its technical advisors, that are engineers experienced in the preparation of resource and reserve estimates using CIM and each of the Foreign Codes, of the extent to which an estimate prepared under a Foreign Code would differ from that prepared under CIM definitions. Franco-Nevada was advised that, while the CIM definitions are not identical to those of the Foreign Codes, the guidelines are substantively similar to those of CIM and will generally result in reporting of substantially similar reserve and resource estimates. Such advisors further confirmed, without reference to the procedures in which the estimates prepared using Foreign Codes that are reproduced in this AIF were conducted, that in the course of their preparation of a resource or reserve estimate they would effectively use the same procedures to prepare and report the resource or reserve estimate regardless of the reliance on CIM or any of the Foreign Codes. Such advisors noted two provisos to this confirmation, being (i) Guide 7 prohibits the reporting of resources, and will only permit reporting of reserves, and (ii) it is now generally accepted practice that staff at the U.S. Securities and Exchange Commission expect to see metals prices based on historic three year average prices, while each of CIM and the other Foreign Codes permits the author of a resource or reserve estimate to use his or her discretion to establish a reasonable assumed metal price in such calculations.
FRANCO-NEVADA’S ASSETS
Franco-Nevada’s assets are categorized by commodity and stage of development. By commodity, assets are either “Gold”, “PGM”, “Other Minerals” or “Oil & Gas”. The categories of Gold and PGM are together referred to as “Precious Metals”. The categories other than Oil & Gas are collectively referred to as “Mineral Assets”. For presentation purposes, “Gold” encompasses some silver assets and polymetallic exploration prospects. “PGM” encompasses the platinum group metals including palladium. “Other Minerals” includes base metals, iron ore, coal, industrial and miscellaneous minerals. “Producing” assets are those that have generated revenue from steady-state operations to Franco-Nevada or are expected to in the next year. “Advanced” are assets on projects that in management’s view have a reasonable possibility of generating steady-state revenue to Franco-Nevada in the next five years or includes properties under development, permitting, feasibility or advanced exploration. “Exploration” represents assets on early stage exploration properties that are speculative and are expected to require more than five years to generate revenue, if ever, or are currently not active.
The number of assets has been counted in different manners depending on the category. Royalties on a producing or advanced property are generally counted as a single asset even if Franco-Nevada has multiple different royalties on the property, such as at the Goldstrike complex. Streams covering a group of mines in close proximity and operated by a common operator such as the Sudbury streams have also been counted as one asset. However, royalties and streams on producing properties that have significant co-products have
been counted twice, such as the Robinson royalties for gold and copper or the Sudbury streams for gold and PGMs. Exploration royalties are simply counted by the number of royalty contracts and no effort has been made to consolidate royalties on the same property. Franco-Nevada’s wholly-owned undeveloped oil & gas land positions and its working interests in Arctic gas resources are additional assets of the Corporation. However, for the purposes of tabulating an indicative number of assets, the undeveloped oil & gas land positions and certain working interests are not counted. More detail on Franco-Nevada’s oil & gas land positions can be found in the section entitled “Oil & Gas Assets”.
As of March 26, 2012, Franco-Nevada estimates that it holds 207 Mineral Assets and 135 Oil & Gas Assets for a total of 342 assets and another 157 undeveloped Oil & Gas agreements.
Franco-Nevada Asset Tabulation at March 26, 2012
|
| Gold |
| PGM |
| Other |
| Total |
| Oil & |
| TOTAL |
|
Producing |
| 33 |
| 3 |
| 7 |
| 43 |
| 135 |
| 178 |
|
Advanced |
| 20 |
| 0 |
| 5 |
| 25 |
| — |
| 25 |
|
Exploration |
| 117 |
| 2 |
| 20 |
| 139 |
| # | (1) | 139 |
|
TOTAL |
| 170 |
| 5 |
| 32 |
| 207 |
| 135 |
| 342 |
|
(1) 157 undeveloped Oil & Gas agreements not included in asset counts.
Asset Revenue and Descriptions
The following table sets forth Franco-Nevada’s principal assets and revenue related to each. The table and following asset descriptions should be read with the following considerations:
· For presentation purposes, the table has simplified the details of some royalties and streams and should be read in conjunction with the more detailed descriptions of the assets that follow.
· The terminology and ranges of some of our interests have also been simplified for presentation purposes.
· Except where otherwise stated, information of a technical nature in the asset descriptions, including all of the mine information, is based solely on information publicly disclosed by the owners or operators of these properties and information/data available in the public domain as of March 26, 2012. None of this information has been independently verified by Franco-Nevada or its consultants. See “Technical and Third Party Information”.
· Each asset is described in a comparable manner as reported by the property owners or operators, unless otherwise noted. As a result, units of measurement and numbers of significant digits are not consistent between asset descriptions.
· Except where otherwise stated, reserve and resource figures are for the calendar year ends.
· Some information publicly reported by owners or operators may relate to a larger property than the area covered by Franco-Nevada’s royalty or stream interest.
· Schematic representations of the properties are meant to be indicative of Franco-Nevada’s understanding of what it is permitted to publicly disclose of the positioning of its royalty or stream interests relative to current operations and should not be treated as fully scaled or complete representations from the operators of those projects.
The subsequent tables characterize the Revenue and Adjusted EBITDA from the Company’s assets by commodity, geography and type. The Company uses Revenue and Adjusted EBITDA as core financial metrics when evaluating performance. These tables set forth how the Company performed against these measures.
|
|
|
|
|
|
|
| Revenue ($ millions) |
|
|
| |||||||
|
| Asset |
| Operator |
| Interest and % |
| 2011 |
| 2010 |
| 2009 |
| Notes |
| |||
G O L D |
|
|
|
|
|
|
|
|
|
|
|
|
|
|
| |||
UNITED STATES |
| Goldstrike |
| Barrick Gold Corporation |
| NSR/NPI 2-4%/2.4-6% |
| $ | 45.0 |
| $ | 49.2 |
| $ | 41.9 |
| 1, 2, P |
|
|
| Gold Quarry |
| Newmont Mining Corporation |
| NSR 7.29% |
| 17.9 |
| 20.4 |
| 13.8 |
| 1, 3, P |
| |||
|
| Marigold |
| Goldcorp/Barrick |
| NSR/GR 1.75-5%/0.5-4% |
| 10.3 |
| 9.1 |
| 7.3 |
| 1, 2, 3, 5, P |
| |||
|
| Bald Mountain |
| Barrick Gold Corporation |
| NSR/GR 0.875-5% |
| 3.9 |
| 1.6 |
| 2.1 |
| 1, 2, 3, 5, P |
| |||
|
| Mesquite |
| New Gold Inc. |
| NSR 0.5-2% |
| 4.8 |
| 4.2 |
| 2.8 |
| 2, P |
| |||
|
| Hollister |
| Great Basin Gold Limited |
| NSR 3-5% |
| 5.0 |
| 1.1 |
| 1.6 |
| 1, 2, P |
| |||
|
| Other (5 mines) |
|
|
|
|
| 0.5 |
| 1.8 |
| 3.1 |
| 10 |
| |||
CANADA |
| Detour |
| Detour Gold Corporation |
| NSR 2% |
| — |
| — |
| — |
| A |
| |||
|
| Sudbury (3 mines) |
| KGHM International Ltd. |
| Stream 50% |
| 14.3 |
| — |
| — |
| 1, 8, 9, P |
| |||
|
| Golden Highway (3 mines) |
| St Andrew Goldfields Ltd. |
| NSR 2-15% |
| 10.8 |
| 6.3 |
| 1.1 |
| 3, 5, P |
| |||
|
| Musselwhite |
| Goldcorp Inc. |
| NPI 5% |
| 5.1 |
| — |
| — |
| 7, P |
| |||
|
| Hemlo |
| Barrick Gold Corporation |
| NSR/NPI 3%/50% |
| 1.4 |
| 0.1 |
| — |
| 1, 7, P |
| |||
|
| Timmins West |
| Lake Shore Gold Corp. |
| NSR 2.25% |
| — |
| — |
| — |
| P |
| |||
|
| Other (7 mines) |
|
|
|
|
| 1.0 |
| 0.8 |
| 1.0 |
|
|
| |||
AUSTRALIA |
| Duketon |
| Regis Resources Ltd. |
| NSR 2% |
| 3.1 |
| 0.6 |
| — |
| 1, P |
| |||
|
| Henty |
| Unity Mining Limited |
| GR 1%/10% |
| 4.5 |
| 2.4 |
| 1.1 |
| 2, P |
| |||
|
| South Kalgoorlie (2 mines) |
| Alacer Gold Corp. |
| NSR/GR 1-1.75% |
| 0.9 |
| 1.0 |
| 0.5 |
| 1, 2, P |
| |||
|
| Bronzewing |
| Navigator Resources Limited |
| NSR 2% |
| 0.9 |
| 0.6 |
| — |
| P |
| |||
|
| Other (6 mines) |
|
|
|
|
| 0.1 |
| 0.3 |
| — |
|
|
| |||
INTERNATIONAL |
| Tasiast |
| Kinross Gold Corporation |
| NSR 2% |
| 2.8 |
| — |
| — |
| P |
| |||
|
| Palmarejo |
| Coeur d’Alene Mines Corporation |
| Stream 50% |
| 101.9 |
| 66.1 |
| 31.1 |
| 3, 8, P |
| |||
|
| MWS |
| First Uranium Corporation |
| Stream 25% |
| 32.3 |
| — |
| — |
| 8, 9, P |
| |||
|
| Ezulwini |
| First Uranium Corporation |
| Stream 7% |
| 27.3 |
| — |
| — |
| 3, 8, 9, P |
| |||
|
| Subika |
| Newmont Mining Corporation |
| NSR 2% |
| — |
| — |
| — |
| 1, 4, A |
| |||
|
| Cerro San Pedro |
| New Gold Inc. |
| GR 1.95% |
| 5.9 |
| 3.8 |
| 2.2 |
| 1, P |
| |||
|
| Edikan |
| Perseus Mining Limited |
| NSR 1.5% |
| 1.5 |
| — |
| — |
| P |
| |||
|
| North Lanut |
| PT Bara Kutai Energi |
| NSR 4% |
| 2.8 |
| 2.3 |
| 1.8 |
| 6, P |
| |||
|
| Other (8 mines) |
|
|
|
|
| 2.8 |
| 0.9 |
| 2.2 |
|
|
| |||
|
| 117 Exploration Assets |
|
|
|
|
|
|
|
|
|
|
| E |
| |||
|
|
|
|
|
|
|
| $ | 306.8 |
| $ | 172.6 |
| $ | 113.6 |
|
|
|
P L A T I N U M G R O U P M E T A L S |
|
|
|
|
|
|
|
|
|
|
|
|
| |||||
|
| Stillwater |
| Stillwater Mining Company |
| NSR 5% |
| $ | 23.1 |
| $ | 13.1 |
| $ | 10.1 |
| 1, P |
|
|
| Sudbury (3 mines) |
| KGHM International Ltd. |
| Stream 50% |
| 40.4 |
| — |
| — |
| 1, 8, 9, P |
| |||
|
| Pandora |
| Angloplat/Lonmin plc |
| NPI 5% |
| 0.4 |
| 1.0 |
| 1.7 |
| 3, P |
| |||
|
| 2 Exploration Assets |
|
|
|
|
|
|
|
|
|
|
| E |
| |||
|
|
|
|
|
|
|
| $ | 63.9 |
| $ | 14.1 |
| $ | 11.8 |
|
|
|
O T H E R M I N E R A L S |
|
|
|
|
|
|
|
|
|
|
|
|
|
|
| |||
|
| Mt Keith (Ni) |
| BHP Billiton Limited |
| NPI/GR 0.25%/0.375% |
| $ | 3.8 |
| $ | 3.1 |
| $ | 0.7 |
| P |
|
|
| Other (11 mines) |
|
|
|
|
| 1.8 |
| 1.6 |
| 2.0 |
|
|
| |||
|
| 20 Exploration Assets |
|
|
|
|
|
|
|
|
|
|
| E |
| |||
|
|
|
|
|
|
|
| $ | 5.6 |
| $ | 4.7 |
| $ | 2.7 |
|
|
|
O I L & G A S |
|
|
|
|
|
|
|
|
|
|
|
|
|
|
| |||
CANADA |
| Weyburn Unit |
| Cenovus Energy Inc. |
| ORR 0.44%, WI 2.26% |
| $ | 12.3 |
| $ | 10.4 |
| $ | 8.3 |
| 11, P |
|
|
| Midale Unit |
| Apache Canada Ltd. |
| ORR 1.18%, WI 1.59% |
| 4.1 |
| 3.6 |
| 3.5 |
| P |
| |||
|
| Edson |
| Canadian Natural Resources |
| ORR 15% |
| 7.7 |
| 12.1 |
| 8.2 |
| P |
| |||
|
| Other |
| Various |
|
|
| 10.8 |
| 9.7 |
| 7.7 |
| P |
| |||
|
| Arctic Gas |
|
|
| WI 3-15% |
| — |
| — |
| — |
| E |
| |||
|
| 156 agreements |
|
|
| ORR/FH 0.5%-100% |
| — |
| — |
| — |
| E |
| |||
|
|
|
|
|
|
|
| $ | 34.9 |
| $ | 35.8 |
| $ | 27.7 |
|
|
|
R E V E N U E |
|
|
|
|
|
|
| $ | 411.2 |
| $ | 227.2 |
| $ | 155.8 |
|
|
|
“NSR” | Net Smelter Return Royalty |
“GR” | Gross Royalty |
“ORR” | Overriding Royalty |
“FH” | Freehold or Lessor Royalty |
“NPI” | Net Profits Interest |
“WI” | Working Interest |
“P” | “Producing” assets are those that have generated revenue from steady-state operations to Franco-Nevada or are expected to in the next year. |
“A” | “Advanced” are assets on projects that in management’s view have a reasonable possibility of generating steady-state revenue to Franco-Nevada in the next five years or includes properties under development, permitting, feasibility or advanced exploration. |
“E” | “Exploration” represents assets on early stage exploration properties that are speculative and are expected to require more than five years to generate revenue, if ever, or are currently not active. |
1 | Does not cover all the reserves or resources reported for the property by the operator. |
2 | Percentage varies depending on the claim block of the property. |
3 | Provides for minimum or advance payments. |
4 | Payments pending achievement of a minimum production hurdle or time threshold. |
5 | Percentage varies depending on the commodity price or value of ore. |
6 | Capped at a cumulative production or payout level. |
7 | Payable after operator recovers defined exploration and development expenses. |
8 | These revenue numbers are before the deduction of the purchase cost per ounce. |
9 | Acquired with Gold Wheaton acquisition effective March 14, 2011. |
10 | Includes dividends in the amounts of $0.1, $0.3 and $0.8 for 2011, 2010 and 2009. |
11 | WI in 2011 of 1.11%. Increased to 2.26% January 1, 2012. |
REVENUE(1)
|
| 2011 |
| 2010 |
| 2009 |
| |||||||||
|
| $ millions |
| % |
| $ millions |
| % |
| $ millions |
| % |
| |||
Commodity |
|
|
|
|
|
|
|
|
|
|
|
|
| |||
Gold |
| $ | 306.8 |
| 75 | % | $ | 172.6 |
| 76 | % | $ | 113.6 |
| 73 | % |
PGM |
| 63.9 |
| 16 | % | 14.1 |
| 6 | % | 11.8 |
| 8 | % | |||
Other Minerals |
| 5.6 |
| 1 | % | 4.7 |
| 2 | % | 2.7 |
| 1 | % | |||
Oil & Gas |
| 34.9 |
| 8 | % | 35.8 |
| 16 | % | 27.7 |
| 18 | % | |||
|
| $ | 411.2 |
| 100 | % | $ | 227.2 |
| 100 | % | $ | 155.8 |
| 100 | % |
|
|
|
|
|
|
|
|
|
|
|
|
|
| |||
Geography |
|
|
|
|
|
|
|
|
|
|
|
|
| |||
United States |
| $ | 111.5 |
| 28 | % | $ | 101.3 |
| 45 | % | $ | 83.5 |
| 53 | % |
Canada |
| 107.9 |
| 26 | % | 43.2 |
| 19 | % | 29.9 |
| 19 | % | |||
Australia |
| 13.8 |
| 3 | % | 8.2 |
| 3 | % | 2.7 |
| 2 | % | |||
International — Mexico |
| 107.8 |
| 26 | % | 69.9 |
| 31 | % | 33.3 |
| 21 | % | |||
International — Other |
| 70.2 |
| 17 | % | 4.6 |
| 2 | % | 6.4 |
| 5 | % | |||
|
| $ | 411.2 |
| 100 | % | $ | 227.2 |
| 100 | % | $ | 155.8 |
| 100 | % |
|
|
|
|
|
|
|
|
|
|
|
|
|
| |||
Type |
|
|
|
|
|
|
|
|
|
|
|
|
| |||
Revenue-based royalties |
| $ | 152.3 |
| 37 | % | $ | 111.5 |
| 50 | % | $ | 91.3 |
| 59 | % |
Stream-based |
| 216.1 |
| 53 | % | 66.1 |
| 29 | % | 31.1 |
| 20 | % | |||
Profit-based royalties |
| 30.8 |
| 7 | % | 37.3 |
| 16 | % | 22.9 |
| 15 | % | |||
Working interests and other |
| 12.0 |
| 3 | % | 12.3 |
| 5 | % | 10.5 |
| 6 | % | |||
|
| $ | 411.2 |
| 100 | % | $ | 227.2 |
| 100 | % | $ | 155.8 |
| 100 | % |
ADJUSTED EBITDA(1)(2)
|
| 2011 |
| 2010 |
| 2009 |
| |||||||||
|
| $ millions |
| % |
| $ millions |
| % |
| $ millions |
| % |
| |||
Commodity |
|
|
|
|
|
|
|
|
|
|
|
|
| |||
Gold |
| $ | 238.1 |
| 73 | % | $ | 133.5 |
| 74 | % | $ | 85.7 |
| 72 | % |
PGM |
| 55.0 |
| 16 | % | 12.4 |
| 7 | % | 9.9 |
| 8 | % | |||
Other Minerals |
| 5.3 |
| 2 | % | 4.3 |
| 2 | % | 2.4 |
| 2 | % | |||
Oil & Gas |
| 28.9 |
| 9 | % | 29.8 |
| 17 | % | 22.2 |
| 18 | % | |||
|
| $ | 327.3 |
| 100 | % | $ | 180.0 |
| 100 | % | $ | 120.2 |
| 100 | % |
|
|
|
|
|
|
|
|
|
|
|
|
|
| |||
Geography |
|
|
|
|
|
|
|
|
|
|
|
|
| |||
United States |
| $ | 100.5 |
| 31 | % | $ | 88.8 |
| 50 | % | $ | 70.1 |
| 58 | % |
Canada |
| 86.3 |
| 26 | % | 36.5 |
| 20 | % | 24.2 |
| 20 | % | |||
Australia |
| 13.1 |
| 4 | % | 7.6 |
| 4 | % | 2.4 |
| 2 | % | |||
International — Mexico |
| 75.5 |
| 23 | % | 42.9 |
| 24 | % | 17.8 |
| 15 | % | |||
International — Other |
| 51.9 |
| 16 | % | 4.2 |
| 2 | % | 5.7 |
| 5 | % | |||
|
| $ | 327.3 |
| 100 | % | $ | 180.0 |
| 100 | % | $ | 120.2 |
| 100 | % |
|
|
|
|
|
|
|
|
|
|
|
|
|
| |||
Type |
|
|
|
|
|
|
|
|
|
|
|
|
| |||
Revenue-based royalties |
| $ | 138.9 |
| 42 | % | $ | 98.0 |
| 54 | % | $ | 76.9 |
| 64 | % |
Stream-based |
| 151.8 |
| 46 | % | 39.4 |
| 22 | % | 15.9 |
| 13 | % | |||
Profit-based royalties |
| 27.9 |
| 9 | % | 33.6 |
| 19 | % | 19.1 |
| 16 | % | |||
Working interests and other |
| 8.7 |
| 3 | % | 9.0 |
| 5 | % | 8.3 |
| 7 | % | |||
|
| $ | 327.3 |
| 100 | % | $ | 180.0 |
| 100 | % | $ | 120.2 |
| 100 | % |
(1) Dividends have been included in “Gold”, “United States” and “Working interests and other” categories.
(2) As defined on page 2 of this AIF. Adjusted EBITDA is a non-IFRS financial measure, which excludes the following from net income: income tax expense; finance costs; finance income; foreign exchange gains and losses; gains and losses on the sale of investments; income and losses from equity investees; impairment charges related to royalty, stream and working interests and investments; and depletion and depreciation. Management believes that Adjusted EBITDA is a valuable indicator of the Company’s ability to generate liquidity by producing operating cash flow to (i) fund working capital needs; (ii) service working interest capital requirements; (iii) fund acquisitions; and (iv) fund dividend payments. Management uses Adjusted EBITDA for this purpose. Adjusted EBITDA is used by investors and analysts for valuation purposes whereby Adjusted EBITDA is multiplied by a factor of an “EBITDA multiple” that is based on observed or an inferred relationship between Adjusted EBITDA and market valuations to determine the approximate total enterprise value of a company. The Company uses this measure for its own internal purposes. Management’s internal budgets and forecasts do not reflect potential impairment charges, fair value changes or foreign currency translation gains or losses. Consequently, the presentation of this non-IFRS financial measure enables investors and analysts to better understand the underlying operating performance of our business through the eyes of management. Management periodically evaluates the components of this non-IFRS financial measure based on an internal assessment of performance metrics that it believes are useful for evaluating the operating performance of our business and a review of the non-IFRS measures used by analysts and other royalty/stream companies. Adjusted EBITDA is intended to provide additional information to investors and analysts, does not have any standardized meaning under IFRS and should not be considered in isolation or as a substitute for measures of performance prepared in accordance with IFRS. Adjusted EBITDA excludes the impact of cash costs of financing activities and taxes, and the effects of changes in operating working capital balances, and therefore is not necessarily indicative of operating profit or cash flow from operations as determined under IFRS. Other companies may calculate Adjusted EBITDA differently. See “Non-IFRS Financial Measures - Reconciliation” in our Annual MD&A for additional information.
Summary of Mineral Reserves and Mineral Resources
The mineral reserves and mineral resources tabulated in this AIF reflect the most recent publicly disclosed figures by the operators of the assets which Franco-Nevada has interests. However, Franco-Nevada’s interests often do not cover the entire mineral reserve and mineral resource that is publicly reported by the operator.
|
|
|
| Mineral Reserves |
| ||||||||||||||||
|
|
|
| Proven |
| Probable |
| Proven & Probable |
| ||||||||||||
|
|
|
| Tonnes |
| Grade |
| Contained |
| Tonnes |
| Grade |
| Contained |
| Tonnes |
| Grade |
| Contained |
|
|
| Notes |
| 000s |
| g/t |
| 000 oz |
| 000s |
| g/t |
| 000 oz |
| 000s |
| g/t |
| 000 oz |
|
GOLD - UNITED STATES |
|
|
|
|
|
|
|
|
|
|
|
|
|
|
|
|
|
|
|
|
|
Goldstrike |
| 1,3,4,112 |
| 57,112 |
| 3.69 |
| 6,771 |
| 41,970 |
| 4.15 |
| 5,606 |
| 99,082 |
| 3.89 |
| 12,377 |
|
Gold Quarry |
| 1,100 |
| not available |
| not available |
| not available |
| ||||||||||||
Marigold |
| 1,4,98 |
| 30,658 |
| 0.62 |
| 615 |
| 172,911 |
| 0.52 |
| 2,865 |
| 203,570 |
| 0.53 |
| 3,480 |
|
Bald Mountain |
| 1,3,4 |
| 78,847 |
| 0.64 |
| 1,614 |
| 199,805 |
| 0.54 |
| 3,488 |
| 278,651 |
| 0.57 |
| 5,102 |
|
Mesquite |
| 4,9 |
| 14,548 |
| 0.67 |
| 313 |
| 138,796 |
| 0.55 |
| 2,448 |
| 153,345 |
| 0.56 |
| 2,762 |
|
Hollister |
| 6,10 |
| 315 |
| 45.43 |
| 460 |
| 637 |
| 18.16 |
| 372 |
| 952 |
| 27.20 |
| 832 |
|
Dee (South Arturo) |
| 1,3,4,11 |
| — |
| — |
| — |
| 42,693 |
| 1.70 |
| 2,330 |
| 42,391 |
| 1.71 |
| 2,330 |
|
Sandman |
|
|
| — |
| — |
| — |
| — |
| — |
| — |
| — |
| — |
| — |
|
Pinson |
|
|
| — |
| — |
| — |
| — |
| — |
| — |
| — |
| — |
| — |
|
Robinson |
| 16,17 |
| 105,490 |
| 0.18 |
| 620 |
| 4,530 |
| 0.15 |
| 20 |
| 110,020 |
| 0.18 |
| 640 |
|
|
|
|
|
|
|
|
|
|
|
|
|
|
|
|
|
|
|
|
|
|
|
GOLD - CANADA |
|
|
|
|
|
|
|
|
|
|
|
|
|
|
|
|
|
|
|
|
|
Detour Lake |
| 21 |
| 101,635 |
| 1.29 |
| 4,222 |
| 368,407 |
| 0.96 |
| 11,351 |
| 470,042 |
| 1.03 |
| 15,573 |
|
Detour Block A |
|
|
| — |
| — |
| — |
| — |
| — |
| — |
| — |
| — |
| — |
|
Sudbury Au |
| 1,17,90,91 |
| — |
| — |
| — |
| 1,670 |
| 0.74 |
| 40 |
| 1,670 |
| 0.74 |
| 40 |
|
Hislop |
| 23 |
| 37 |
| 1.43 |
| 2 |
| 1,498 |
| 1.89 |
| 91 |
| 1,534 |
| 1.88 |
| 93 |
|
Holloway |
| 25 |
| 153 |
| 4.26 |
| 21 |
| 70 |
| 4.35 |
| 10 |
| 224 |
| 4.29 |
| 31 |
|
Holt |
| 25 |
| 860 |
| 4.92 |
| 136 |
| 1,548 |
| 5.61 |
| 279 |
| 2,408 |
| 5.36 |
| 415 |
|
Taylor |
| 93 |
| — |
| — |
| — |
| 985 |
| 5.45 |
| 173 |
| 985 |
| 5.45 |
| 173 |
|
Musselwhite |
| 4 |
| 3,390 |
| 5.78 |
| 630 |
| 7,900 |
| 6.50 |
| 1,650 |
| 11,290 |
| 6.28 |
| 2,280 |
|
Hemlo |
| 1,3,4 |
| 3,321 |
| 3.51 |
| 375 |
| 11,756 |
| 2.02 |
| 764 |
| 15,077 |
| 2.35 |
| 1,139 |
|
Timmins West |
| 30,31 |
| — |
| — |
| — |
| 3,360 |
| 7.52 |
| 812 |
| 3,360 |
| 7.52 |
| 812 |
|
Canadian Malartic |
| 1,2,4,32,101 |
| 48,000 |
| 0.89 |
| 1,380 |
| 289,700 |
| 1.00 |
| 9,330 |
| 337,700 |
| 0.99 |
| 10,720 |
|
Phoenix |
|
|
| — |
| — |
| — |
| — |
| — |
| — |
| — |
| — |
| — |
|
Kirkland Lake |
|
|
| — |
| — |
| — |
| — |
| — |
| — |
| — |
| — |
| — |
|
Mouska (Doyon Division) |
| 1,4 |
| 59 |
| 12.30 |
| 23 |
| 104 |
| 12.40 |
| 42 |
| 163 |
| 12.40 |
| 65 |
|
Prosperity* |
| 38,39,99 |
| 481,000 |
| 0.46 |
| 7,114 |
| 350,000 |
| 0.35 |
| 3,938 |
| 831,000 |
| 0.41 |
| 11,052 |
|
Goldfields (Box/Athona) |
| 104 |
| 1,228 |
| 1.90 |
| 75 |
| 21,105 |
| 1.39 |
| 945 |
| 22,333 |
| 1.42 |
| 1,020 |
|
Courageous Lake |
|
|
| — |
| — |
| — |
| — |
| — |
| — |
| — |
| — |
| — |
|
|
|
|
|
|
|
|
|
|
|
|
|
|
|
|
|
|
|
|
|
|
|
GOLD - AUSTRALIA |
|
|
|
|
|
|
|
|
|
|
|
|
|
|
|
|
|
|
|
|
|
Duketon |
| 1,42,44 |
| 10,457 |
| 1.50 |
| 505 |
| 47,600 |
| 1.22 |
| 1,865 |
| 57,800 |
| 1.54 |
| 2,870 |
|
Henty |
| 46 |
| 380 |
| 4.90 |
| 60 |
| 390 |
| 4.90 |
| 61 |
| 770 |
| 4.90 |
| 121 |
|
South Kalgoorlie |
| 1,50 |
| — |
| — |
| — |
| 11,578 |
| 1.40 |
| 515 |
| 11,578 |
| 1.40 |
| 515 |
|
Bronzewing |
| 52,53,54 |
| — |
| — |
| — |
| 10,624 |
| 1.58 |
| 540 |
| 10,624 |
| 1.58 |
| 540 |
|
Red October |
|
|
| — |
| — |
| — |
| — |
| — |
| — |
| — |
| — |
| — |
|
Admiral Hill |
|
|
| — |
| — |
| — |
| — |
| — |
| — |
| — |
| — |
| — |
|
Bullabulling |
|
|
| — |
| — |
| — |
| — |
| — |
| — |
| — |
| — |
| — |
|
Glenburgh |
|
|
| — |
| — |
| — |
| — |
| — |
| — |
| — |
| — |
| — |
|
White Dam |
|
|
| — |
| — |
| — |
| — |
| — |
| — |
| — |
| — |
| — |
|
Wiluna |
| 63 |
| — |
| — |
| — |
| 1,614 |
| 5.50 |
| 286 |
| 1,614 |
| 5.51 |
| 286 |
|
|
|
|
|
|
|
|
|
|
|
|
|
|
|
|
|
|
|
|
|
|
|
GOLD - INTERNATIONAL |
|
|
|
|
|
|
|
|
|
|
|
|
|
|
|
|
|
|
|
|
|
Tasiast |
| 4 |
| 88,808 |
| 1.75 |
| 4,990 |
| 40,075 |
| 1.92 |
| 2,467 |
| 128,883 |
| 1.80 |
| 7,457 |
|
Palmarejo |
| 65,112 |
| 4,460 |
| 2.30 |
| 330 |
| 6,878 |
| 1.62 |
| 358 |
| 11,337 |
| 1.89 |
| 688 |
|
MWS |
| 67 |
| 187,951 |
| 0.25 |
| 1,493 |
| 143,591 |
| 0.26 |
| 1,195 |
| 331,542 |
| 0.25 |
| 2,688 |
|
Ezulwini |
|
|
| — |
| — |
| — |
| — |
| — |
| — |
| — |
| — |
| — |
|
Subika |
| 1,3,4 |
| 19,051 |
| 1.03 |
| 630 |
| 181,980 |
| 1.96 |
| 11,450 |
| 201,031 |
| 1.87 |
| 12,080 |
|
Cerro San Pedro |
| 1,73,74 |
| 23,972 |
| 0.58 |
| 447 |
| 35,267 |
| 0.49 |
| 559 |
| 59,239 |
| 0.53 |
| 1,006 |
|
Edikan |
| 77,106 |
| 47,700 |
| 1.30 |
| 1,974 |
| 39,200 |
| 1.00 |
| 1,300 |
| 86,900 |
| 1.20 |
| 3,273 |
|
North Lanut |
| 17,108 |
| 2,074 |
| 1.60 |
| 107 |
| 298 |
| 1.27 |
| 12 |
| 2,372 |
| 1.56 |
| 119 |
|
Ity |
| 17,78 |
| 1,655 |
| 5.66 |
| 301 |
| 34 |
| 6.18 |
| 7 |
| 1,689 |
| 5.67 |
| 308 |
|
Agi Dagi |
|
|
| — |
| — |
| — |
| — |
| — |
| — |
| — |
| — |
| — |
|
Perama Hill |
| 109 |
| 2,477 |
| 4.44 |
| 354 |
| 7,220 |
| 2.68 |
| 621 |
| 9,697 |
| 3.13 |
| 975 |
|
San Jorge |
|
|
| — |
| — |
| — |
| — |
| — |
| — |
| — |
| — |
| — |
|
Taca Taca |
|
|
| — |
| — |
| — |
| — |
| — |
| — |
| — |
| — |
| — |
|
Gurupi |
| 83,85 |
| — |
| — |
| — |
| 63,757 |
| 1.14 |
| 2,328 |
| 63,757 |
| 1.14 |
| 2,328 |
|
Kiziltepe |
|
|
| — |
| — |
| — |
| — |
| — |
| — |
| — |
| — |
| — |
|
Mt Muro |
| 110,111 |
| — |
| — |
| — |
| 5,930 |
| 2.50 |
| 438 |
| 5,930 |
| 2.50 |
| 438 |
|
|
|
|
|
|
|
|
|
|
|
|
|
|
|
|
|
|
|
|
|
|
|
TOTAL GOLD MINERAL RESERVES* |
|
|
|
|
|
|
| 28,447 |
|
|
|
|
| 66,618 |
|
|
|
|
| 95,565 |
|
* Total excludes Prosperity
|
|
|
| Mineral Resources - Inclusive of Reserves |
| Mineral Resources |
| ||||||||||||||||
|
|
|
| Measured (M) |
| Indicated (I) |
| (M)+(I) |
| Inferred |
| ||||||||||||
|
|
|
| Tonnes |
| Grade |
| Contained |
| Tonnes |
| Grade |
| Contained |
| Contained |
| Tonnage |
| Grade |
| Contained |
|
|
| Notes |
| 000s |
| g/t |
| 000 oz |
| 000s |
| g/t |
| 000 oz |
| 000 oz |
| 000s |
| g/t |
| 000 oz |
|
GOLD - UNITED STATES |
|
|
|
|
|
|
|
|
|
|
|
|
|
|
|
|
|
|
|
|
|
|
|
Goldstrike |
| 1,2,3 |
| 58,810 |
| 3.77 |
| 7,135 |
| 49,969 |
| 4.49 |
| 7,217 |
| 14,352 |
| 2,959 |
| 8.79 |
| 836 |
|
Gold Quarry |
| 1,100 |
| not available |
| not available |
|
|
| not available |
| ||||||||||||
Marigold |
| 1,2,4,26,98 |
| 32,518 |
| 0.62 |
| 645 |
| 200,930 |
| 0.50 |
| 3,240 |
| 3,885 |
| 10,019 |
| 0.47 |
| 150 |
|
Bald Mountain |
| 1,2,3 |
| 110,079 |
| 0.59 |
| 2,094 |
| 280,329 |
| 0.51 |
| 4,631 |
| 6,725 |
| 65,762 |
| 0.37 |
| 787 |
|
Mesquite |
| 5,8 |
| 23,870 |
| 0.59 |
| 453 |
| 349,723 |
| 0.45 |
| 5,081 |
| 5,534 |
| 38,633 |
| 0.41 |
| 512 |
|
Hollister |
| 7,10 |
| 337 |
| 74.05 |
| 803 |
| 680 |
| 30.21 |
| 661 |
| 1,463 |
| 1,349 |
| 23.67 |
| 1,027 |
|
Dee (South Arturo) |
| 1,2,3,11 |
| — |
| — |
| — |
| 75,173 |
| 1.54 |
| 3,710 |
| 3,710 |
| 15,812 |
| 0.77 |
| 393 |
|
Sandman |
| 1,2,12 |
| — |
| — |
| — |
| 544 |
| 1.71 |
| 30 |
| 30 |
| 1,905 |
| 1.65 |
| 101 |
|
Pinson |
| 1,12,13,14 |
| 20,664 |
| 1.97 |
| 1,307 |
| 5,088 |
| 4.57 |
| 748 |
| 2,055 |
| 2,777 |
| 9.79 |
| 874 |
|
Robinson |
| 15,17 |
| 510,270 |
| 0.15 |
| 2,460 |
| 139,380 |
| 0.14 |
| 620 |
| 3,080 |
| 139,610 |
| 0.14 |
| 620 |
|
|
|
|
|
|
|
|
|
|
|
|
|
|
|
|
|
|
|
|
|
|
|
|
|
GOLD - CANADA |
|
|
|
|
|
|
|
|
|
|
|
|
|
|
|
|
|
|
|
|
|
|
|
Detour Lake |
| 20 |
| 124,500 |
| 1.36 |
| 5,424 |
| 554,300 |
| 1.00 |
| 17,836 |
| 23,261 |
| 208,500 |
| 0.86 |
| 5,785 |
|
Detour Block A |
| 18,19,20 |
| — |
| — |
| — |
| 90,510 |
| 0.84 |
| 2,448 |
| 2,448 |
| 73,693 |
| 0.83 |
| 1,967 |
|
Sudbury Au |
| 1,17,90 |
| 420 |
| 0.74 |
| 10 |
| 2,230 |
| 0.98 |
| 70 |
| 70 |
| 750 |
| 0.83 |
| 20 |
|
Hislop |
| 22 |
| 37 |
| 1.43 |
| 2 |
| 5,686 |
| 1.95 |
| 357 |
| 359 |
| 5,338 |
| 1.80 |
| 309 |
|
Holloway |
| 24 |
| 396 |
| 4.53 |
| 58 |
| 352 |
| 4.60 |
| 52 |
| 110 |
| 3,024 |
| 5.10 |
| 496 |
|
Holt |
| 24 |
| 2,981 |
| 5.45 |
| 522 |
| 2,801 |
| 6.29 |
| 567 |
| 1,089 |
| 4,836 |
| 5.75 |
| 894 |
|
Taylor |
| 92 |
| — |
| — |
| — |
| 2,625 |
| 5.42 |
| 457 |
| 457 |
| 1,929 |
| 3.96 |
| 246 |
|
Musselwhite |
| 2,26 |
| 3,540 |
| 5.71 |
| 650 |
| 8,600 |
| 6.40 |
| 1,770 |
| 2,430 |
| 4,990 |
| 5.73 |
| 920 |
|
Hemlo |
| 1,2,3 |
| 5,136 |
| 3.60 |
| 595 |
| 14,237 |
| 2.08 |
| 954 |
| 1,549 |
| 2,664 |
| 4.37 |
| 374 |
|
Timmins West |
| 27,28,29 |
| — |
| — |
| — |
| 6,515 |
| 5.92 |
| 1,240 |
| 1,240 |
| 9,545 |
| 5.93 |
| 1,819 |
|
Canadian Malartic |
| 1,2,4,32,101 |
| 48,000 |
| 0.89 |
| 1,380 |
| 341,800 |
| 0.99 |
| 10,850 |
| 12,230 |
| 50,400 |
| 0.72 |
| 1,160 |
|
Phoenix |
| 33 |
| — |
| — |
| — |
| 1,030 |
| 14.40 |
| 477 |
| 477 |
| 4,230 |
| 17.04 |
| 2,317 |
|
Kirkland Lake |
| 1,34,35,36,103 |
| — |
| — |
| — |
| 4,540 |
| 3.55 |
| 518 |
| 518 |
| 7,983 |
| 4.20 |
| 1,077 |
|
Mouska (Doyon Division) |
| 1,12 |
| 375 |
| 5.40 |
| 65 |
| 925 |
| 5.90 |
| 175 |
| 240 |
| 1,597 |
| 5.70 |
| 291 |
|
Prosperity* |
| 37,38,99 |
| 547,100 |
| 0.46 |
| 8,091 |
| 463,400 |
| 0.34 |
| 5,066 |
| 13,320 |
| — |
| — |
| — |
|
Goldfields (Box/Athona) |
| 40 |
| 858 |
| 2.04 |
| 56 |
| 20,002 |
| 1.51 |
| 971 |
| 1,027 |
| 4,564 |
| 1.54 |
| 226 |
|
Courageous Lake |
| 41 |
| 13,401 |
| 2.53 |
| 1,090 |
| 93,914 |
| 2.28 |
| 6,884 |
| 7,974 |
| 48,963 |
| 2.18 |
| 3,432 |
|
|
|
|
|
|
|
|
|
|
|
|
|
|
|
|
|
|
|
|
|
|
|
|
|
GOLD - AUSTRALIA |
|
|
|
|
|
|
|
|
|
|
|
|
|
|
|
|
|
|
|
|
|
|
|
Duketon |
| 1,42,43 |
| 17,300 |
| 1.31 |
| 727 |
| 81,200 |
| 1.28 |
| 3,336 |
| 4,063 |
| 85,100 |
| 0.89 |
| 2,432 |
|
Henty |
| 45 |
| 1,415 |
| 4.90 |
| 223 |
| 625 |
| 4.80 |
| 96 |
| 319 |
| 41 |
| 5.30 |
| 7 |
|
South Kalgoorlie |
| 1,47,48,49,105 |
| 1,703 |
| 2.20 |
| 119 |
| 39,211 |
| 2.13 |
| 2,689 |
| 2,808 |
| 32,608 |
| 1.95 |
| 2,047 |
|
Bronzewing |
| 51 |
| — |
| — |
| — |
| 13,720 |
| 1.67 |
| 738 |
| 738 |
| 5,600 |
| 1.83 |
| 329 |
|
Red October |
| 55,56 |
| — |
| — |
| — |
| 5,093 |
| 2.38 |
| 389 |
| 389 |
| 2,528 |
| 1.47 |
| 119 |
|
Admiral Hill |
| 51 |
| — |
| — |
| — |
| 907 |
| 1.40 |
| 42 |
| 42 |
| 1,338 |
| 1.10 |
| 48 |
|
Bullabulling |
| 1,57,58 |
| — |
| — |
| — |
| 72,100 |
| 0.92 |
| 2,132 |
| 2,132 |
| 30,700 |
| 1.09 |
| 1,072 |
|
Glenburgh |
| 94 |
| — |
| — |
| — |
| 1,600 |
| 2.00 |
| 104 |
| 104 |
| 15,800 |
| 1.20 |
| 600 |
|
White Dam |
| 59,60 |
| — |
| — |
| — |
| 2,728 |
| 1.08 |
| 95 |
| 95 |
| 3,282 |
| 0.89 |
| 94 |
|
Wiluna |
| 61,62 |
| — |
| — |
| — |
| 5,384 |
| 5.90 |
| 1,017 |
| 1,017 |
| 7,332 |
| 5.10 |
| 1,203 |
|
|
|
|
|
|
|
|
|
|
|
|
|
|
|
|
|
|
|
|
|
|
|
|
|
GOLD - INTERNATIONAL |
|
|
|
|
|
|
|
|
|
|
|
|
|
|
|
|
|
|
|
|
|
|
|
Tasiast |
| 2,12 |
| 208,115 |
| 1.10 |
| 7,357 |
| 323,984 |
| 1.08 |
| 11,205 |
| 18,562 |
| 78,217 |
| 0.74 |
| 1,860 |
|
Palmarejo |
| 64 |
| 6,024 |
| 2.19 |
| 423 |
| 8,936 |
| 1.63 |
| 469 |
| 893 |
| 10,994 |
| 1.74 |
| 615 |
|
MWS |
| 66 |
| 190,395 |
| 0.24 |
| 1,472 |
| 146,820 |
| 0.25 |
| 1,163 |
| 2,628 |
| 15,172 |
| 0.30 |
| 145 |
|
Ezulwini |
| 69,70 |
| 2,863 |
| 7.46 |
| 687 |
| 10,372 |
| 5.90 |
| 1,968 |
| 2,655 |
| 158,681 |
| 5.00 |
| 25,511 |
|
Subika |
| 1,2,3,12 |
| 19,051 |
| 1.03 |
| 630 |
| 264,715 |
| 1.74 |
| 14,824 |
| 15,454 |
| 53,342 |
| 2.07 |
| 3,543 |
|
Cerro San Pedro |
| 1,71,72 |
| 39,039 |
| 0.48 |
| 599 |
| 102,344 |
| 0.37 |
| 1,213 |
| 1,812 |
| 71,361 |
| 0.42 |
| 956 |
|
Edikan |
| 75,76 |
| 66,500 |
| 1.22 |
| 2,598 |
| 77,400 |
| 1.07 |
| 2,675 |
| 5,273 |
| 53,600 |
| 1.02 |
| 1,758 |
|
North Lanut |
| 17,107 |
| 7,271 |
| 1.12 |
| 262 |
| 1,866 |
| 1.04 |
| 62 |
| 324 |
| 1,760 |
| 2.08 |
| 118 |
|
Ity |
| 17,78 |
| 267 |
| 8.15 |
| 70 |
| 3,328 |
| 2.65 |
| 284 |
| 354 |
| 9,051 |
| 1.53 |
| 445 |
|
Agi Dagi |
| 1,79,80 |
| — |
| — |
| — |
| 66,323 |
| 0.61 |
| 1,299 |
| 1,299 |
| 22,341 |
| 0.53 |
| 383 |
|
Perama Hill |
| 81 |
| 3,064 |
| 4.30 |
| 424 |
| 9,375 |
| 3.18 |
| 958 |
| 1,382 |
| 8,766 |
| 1.96 |
| 554 |
|
San Jorge |
| 82 |
| 80 |
| 0.22 |
| 586 |
| 115 |
| 0.18 |
| 672 |
| 1,257 |
| 73 |
| 0.14 |
| 337 |
|
Taca Taca |
| 88,89 |
| — |
| — |
| — |
| 516,000 |
| 0.12 |
| 2,060 |
| 2,060 |
| 1,070,000 |
| 0.11 |
| 3,820 |
|
Gurupi |
| 83,84 |
| — |
| — |
| — |
| 6,131 |
| 0.97 |
| 190 |
| 190 |
| 18,677 |
| 1.03 |
| 617 |
|
Kiziltepe |
| 86 |
| 783 |
| 4.10 |
| 103 |
| 972 |
| 2.08 |
| 65 |
| 168 |
| 357 |
| 1.64 |
| 19 |
|
Mt Muro |
| 51,95 |
| — |
| — |
| — |
| 13,130 |
| 0.99 |
| 420 |
| 420 |
| 8,540 |
| 1.60 |
| 439 |
|
|
|
|
|
|
|
|
|
|
|
|
|
|
|
|
|
|
|
|
|
|
|
|
|
TOTAL GOLD MINERAL RESOURCES* |
|
|
| 41,030 |
|
|
|
|
| 121,728 |
| 162,757 |
|
|
|
|
| 75,704 |
| ||||
* Total excludes Prosperity
|
|
|
| PGM Mineral Reserves |
| ||||||||||||||||
|
|
|
| Proven |
| Probable |
| Proven & Probable |
| ||||||||||||
|
|
|
| Tonnes |
| Grade |
| Contained |
| Tonnes |
| Grade |
| Contained |
| Tonnes |
| Grade |
| Contained |
|
|
| Notes |
| 000s |
| g/t |
| 000 oz |
| 000s |
| g/t |
| 000 oz |
| 000s |
| g/t |
| 000 oz |
|
PGM |
|
|
|
|
|
|
|
|
|
|
|
|
|
|
|
|
|
|
|
|
|
Stillwater |
| 1,87 |
| 4,545 |
| 17.9 |
| 2,618 |
| 33,991 |
| 15.9 |
| 17,362 |
| 38,536 |
| 16.1 |
| 19,979 |
|
Sudbury PGM |
| 1,17,90,91 |
| — |
| — |
| — |
| 1,670 |
| 5.4 |
| 290 |
| 1,670 |
| 5.4 |
| 290 |
|
Pandora |
| 1,96,97 |
| 941 |
| 4.4 |
| 133 |
| 13,412 |
| 4.1 |
| 1,777 |
| 14,824 |
| 4.0 |
| 1,882 |
|
|
|
|
|
|
|
|
|
|
|
|
|
|
|
|
|
|
|
|
|
|
|
TOTAL PGM MINERAL RESERVES |
|
|
| 2,751 |
|
|
|
|
| 19,429 |
|
|
|
|
| 22,151 |
| ||||
|
|
|
| PGM Mineral Resources - Inclusive of Reserves |
|
|
| ||||||||||||||||
|
|
|
| Measured (M) |
| Indicated (I) |
| (M)+(I) |
| PGM Inferred Mineral Resources |
| ||||||||||||
|
|
|
| Tonnes |
| Grade |
| Contained |
| Tonnes |
| Grade |
| Contained |
| Contained |
| Tonnage |
| Grade |
| Contained |
|
|
| Notes |
| 000s |
| g/t |
| 000 oz |
| 000s |
| g/t |
| 000 oz |
| 000 oz |
| 000s |
| g/t |
| 000 oz |
|
PGM |
|
|
|
|
|
|
|
|
|
|
|
|
|
|
|
|
|
|
|
|
|
|
|
Stillwater |
| 1,87 |
| 4,545 |
| 17.9 |
| 2,618 |
| 33,991 |
| 15.9 |
| 17,362 |
| 19,979 |
| — |
| — |
| — |
|
Sudbury PGM |
| 1,68,90 |
| 420 |
| 3.4 |
| 50 |
| 2,230 |
| 6.0 |
| 430 |
| 480 |
| 750 |
| 2.5 |
| 60 |
|
Pandora |
| 1,2,96,97 |
| 8,235 |
| 4.9 |
| 1,309 |
| 46,588 |
| 4.3 |
| 6,482 |
| 7,765 |
| 99,059 |
| 4.1 |
| 13,176 |
|
|
|
|
|
|
|
|
|
|
|
|
|
|
|
|
|
|
|
|
|
|
|
|
|
TOTAL PGM MINERAL RESOURCES |
|
|
| 3,977 |
|
|
|
|
| 24,274 |
| 28,224 |
|
|
|
|
| 13,236 |
| ||||
|
|
|
| Copper Mineral Reserves |
| ||||||||||||||||
|
|
|
| Proven |
| Probable |
| Proven & Probable |
| ||||||||||||
|
|
|
| Tonnes |
| Grade |
| Contained |
| Tonnes |
| Grade |
| Contained |
| Tonnes |
| Grade |
| Contained |
|
|
| Notes |
| 000s |
| % |
| Mlbs |
| 000s |
| % |
| Mlbs |
| 000s |
| % |
| Mlbs |
|
Copper |
|
|
|
|
|
|
|
|
|
|
|
|
|
|
|
|
|
|
|
|
|
Rosemont |
| 3,118,119,120 |
| 143,560 |
| 0.45 | % | 1,422 |
| 415,546 |
| 0.42 | % | 3,822 |
| 559,106 |
| 0.43 | % | 5,243 |
|
Vizcachitas |
|
|
| — |
| — |
| — |
| — |
| — |
| — |
| — |
| — |
| — |
|
Relincho |
| 2,126,127 |
| 149,300 |
| 0.49 | % | 1,613 |
| 955,200 |
| 0.39 | % | 8,213 |
| 1,104,500 |
| 0.40 | % | 9,826 |
|
Taca Taca |
| 128,129 |
| — |
| — |
| — |
| — |
| — |
| — |
| — |
| — |
| — |
|
|
|
|
|
|
|
|
|
|
|
|
|
|
|
|
|
|
|
|
|
|
|
TOTAL COPPER MINERAL RESERVES |
|
|
| 3,035 |
|
|
|
|
| 12,034 |
|
|
|
|
| 15,069 |
| ||||
|
|
|
| Copper Mineral Resources - Inclusive of Reserves |
|
|
| ||||||||||||||||
|
|
|
| Measured (M) |
| Indicated (I) |
| (M)+(I) |
| Copper Inferred Mineral Resources |
| ||||||||||||
|
|
|
| Tonnes |
| Grade |
| Contained |
| Tonnes |
| Grade |
| Contained |
| Contained |
| Tonnage |
| Grade |
| Contained |
|
|
| Notes |
| 000s |
| % |
| Mlbs |
| 000s |
| % |
| Mlbs |
| Mlbs |
| 000s |
| % |
| Mlbs |
|
Copper |
|
|
|
|
|
|
|
|
|
|
|
|
|
|
|
|
|
|
|
|
|
|
|
Rosemont |
| 3,118,119,121 |
| 131,995 |
| 0.49 | % | 1,429 |
| 471,643 |
| 0.44 | % | 4,574 |
| 6,003 |
| 190,599 |
| 0.41 | % | 1,728 |
|
Vizcachitas |
| 122,123,124,125 |
| — |
| — |
| — |
| 570,000 |
| 0.39 | % | 4,887 |
| 4,887 |
| 605,000 |
| 0.34 | % | 4,490 |
|
Relincho |
| 2,126,127 |
| 178,100 |
| 0.47 | % | 1,829 |
| 1,572,500 |
| 0.36 | % | 12,568 |
| 14,396 |
| 746,900 |
| 0.30 | % | 4,940 |
|
Taca Taca |
| 128,129 |
| — |
| — |
| — |
| 516,000 |
| 0.58 | % | 6,590 |
| 6,590 |
| 880,000 |
| 0.43 | % | 8,280 |
|
|
|
|
|
|
|
|
|
|
|
|
|
|
|
|
|
|
|
|
|
|
|
|
|
TOTAL COPPER MINERAL RESOURCES |
|
|
| 3,258 |
|
|
|
|
| 28,619 |
| 31,877 |
|
|
|
|
| 19,438 |
| ||||
|
|
|
| Nickel Mineral Reserves |
| ||||||||||||||||
|
|
|
| Proven |
| Probable |
| Proven & Probable |
| ||||||||||||
|
|
|
| Tonnes |
| Grade |
| Contained |
| Tonnes |
| Grade |
| Contained |
| Tonnes |
| Grade |
| Contained |
|
|
| Notes |
| 000s |
| % |
| Mlbs |
| 000s |
| % |
| Mlbs |
| 000s |
| % |
| Mlbs |
|
Nickel |
|
|
|
|
|
|
|
|
|
|
|
|
|
|
|
|
|
|
|
|
|
Mt Keith |
| 116,117 |
| 132,000 |
| 0.55 | % | 1,604 |
| 5,200 |
| 0.53 | % | 61 |
| 137,200 |
| 0.55 | % | 1,665 |
|
Falcondo |
| 113,114 |
| 44,000 |
| 1.28 | % | 1,242 |
| 29,700 |
| 1.36 | % | 890 |
| 73,700 |
| 1.31 | % | 2,132 |
|
|
|
|
|
|
|
|
|
|
|
|
|
|
|
|
|
|
|
|
|
|
|
TOTAL NICKEL MINERAL RESERVES |
|
|
| 2,846 |
|
|
|
|
| 951 |
|
|
|
|
| 3,797 |
| ||||
|
|
|
| Nickel Mineral Resources - Inclusive of Reserves |
|
|
|
|
|
|
| ||||||||||||
|
|
|
| Measured (M) |
| Indicated (I) |
| (M)+(I) |
| Nickel Inferred Mineral Resources |
| ||||||||||||
|
|
|
| Tonnes |
| Grade |
| Contained |
| Tonnes |
| Grade |
| Contained |
| Contained |
| Tonnage |
| Grade |
| Contained |
|
|
| Notes |
| 000s |
| % |
| Mlbs |
| 000s |
| % |
| Mlbs |
| Mlbs |
| 000s |
| % |
| Mlbs |
|
Nickel |
|
|
|
|
|
|
|
|
|
|
|
|
|
|
|
|
|
|
|
|
|
|
|
Mt Keith |
| 116,117 |
| 215,000 |
| 0.55 | % | 2,592 |
| 100,000 |
| 0.48 | % | 1,058 |
| 315,000 |
| 32,000 |
| 0.48 | % | 339 |
|
Falcondo |
| 114,115 |
| 40,200 |
| 1.45 | % | 1,285 |
| 34,500 |
| 1.56 | % | 1,187 |
| 74,700 |
| 4,900 |
| 1.40 | % | 151 |
|
|
|
|
|
|
|
|
|
|
|
|
|
|
|
|
|
|
|
|
|
|
|
|
|
TOTAL NICKEL MINERAL RESOURCES |
|
|
| 3,877 |
|
|
|
|
| 2,245 |
| 389,700 |
|
|
|
|
| 490 |
| ||||
|
| Notes |
|
| All Mineral Reserves and Resources have been calculated in accordance with CIM, SEC, JORC or SAMREC guidelines |
|
| Mineral Resources which are not Mineral Reserves do not have demonstrated economic viability |
|
| Unless otherwise noted, Mineral Reserves and Resources are reported as of 31 December 2011 |
|
| Unless otherwise noted, Mineral Resources were reported by the operator inclusive of Mineral Reserves |
|
| Contained ounces do not take into account recovery losses |
|
| Mineral Reserves and Resource based on publically-disclosed information as of 26 March 2012 |
|
| Rows and columns may not add up due to rounding |
|
|
|
1 |
| Royalty does not cover entire property or cover all known Reserves and Resources |
2 |
| Mineral Resources shown by operator as exclusive of Mineral Reserves. The company’s QP has made the Inclusive Mineral Resources by adding the exclusive Measured and Indicated Mineral Resources to the Proven and Probable Reserves |
3 |
| Mineral Reserves and Resources are reported by the operator in non-metric units. The Company’s QP has made the metric conversion using 1opt=34.286 g/tonne, 1 short ton = 0.9018 metric tonnes, 1 oz = 31.1035 g |
4 |
| Mineral Reserves are calculated using long term gold price of $1,200/oz |
5 |
| Mineral Resources are calculated using long term gold price of $1,300/oz |
6 |
| Mineral Reserves reported as of January 2011 |
7 |
| Mineral Resources reported as of September 2010 |
8 |
| Mineral Resources reported at cut-off of 0.11 g/t (oxide), 0.22 g/t (non-oxide) |
9 |
| Mineral Reserves reported at a cut-off of 0.21 g/t (oxide), 0.41 g/t (non-oxide) |
10 |
| Mineral Reserves and Resources reported at an 0.25 oz/ton cut-off |
11 |
| Mineral Reserves and Resources calculated from Barrick’s 60% attributable share |
12 |
| Mineral Resources reported at gold price of US$1,400/oz |
13 |
| Mineral Resources reported as of 06 February 2012 |
14 |
| Mineral Resources calculated at cut-off of 6.34 g/t (underground) and 0.34 g/t (open pit) |
15 |
| Mineral Resources reported above a cut-off of 1.24 recoverable lbs Cu per ton and a long term gold price of $1,000/oz and a long term copper price of $2.50/lb |
16 |
| Mineral Reserves reported above a cut-off of 2.93 recoverable lbs Cu per ton and a long term gold price of $1,000/oz and a long term copper price of $2.50/lb |
17 |
| Mineral Reserves and Resources reported as of 31 December 2010 |
18 |
| Mineral Resources are reported as of 14 February 2011 |
19 |
| Mineral Resources calculated at a cut-off of 0.4 g/t |
20 |
| Global Resources Reported |
21 |
| Mineral Reserves calculated using long-term gold price of $850/oz gold and a cut-off grade of 0.5 g/t |
22 |
| Mineral Resources estimated using an average long-term gold price of US$950/oz and a cut-off grade of 0.94 g/t |
23 |
| Mineral Reserves estimated using an average long-term gold price of US$1,000/oz and a cut-off grade of 1.7 g/t |
24 |
| Mineral Resources estimated using an average long-term gold price of US$1,200/oz and a cut-off grade of 3.0 g/t |
25 |
| Mineral Reserves estimated using an average long-term gold price of US$1,100/oz and a cut-off grade of 3.5 g/t |
26 |
| Mineral Resources are estimated using $1,350/oz gold |
27 |
| Timmins West & Thunder Creek Mineral Resources reported as of 15 February 2012, Gold River Trend Mineral Resources reported as of 22 February 2012 |
28 |
| Mineral Resources for Gold River Calculated at long term gold price of $1,200/oz and cut-off grade of 2.0 g/t |
29 |
| Mineral Resources for Timmins West Mine (Including Thunder Creek) calculated at long term gold price of $1,200/oz and cut-off grade of 1.5 g/t |
30 |
| Mineral Reserves for Timmins West reported as of 28 August 2009 |
31 |
| Mineral Reserves calculated using long term gold price of $500/oz gold and a cut-off grade of 3.0 g/t |
32 |
| Cut-off grade of 0.286 to 0.312 g/t Au |
33 |
| Mineral Resources reported as of 29 June 2011 at cut-off grade of 5.0 g/t |
34 |
| Upper Canada Mineral Resources calculated at gold price of $1,200/oz and cut-off grades of 0.44 g/t (open pit), 2.4 g/t (underground) |
35 |
| McBean Mineral Resources calculated at gold price of $900/oz and 2.5 g/t cut-off |
36 |
| Upper Canada Mineral Resources reported as of 17 June 2011 |
37 |
| Mineral Resources are estimated at a 0.14% Cu cut-off |
38 |
| Mineral Reserves and Mineral Resources are reported as of 02 November 2009 |
39 |
| Mineral Reserves are based on copper and gold prices of US$1.65/lb and US$650/oz respectively, and $5.50 NSR/t pit rim cut-off |
40 |
| Mineral Resources are reported as of 06 October 2011 at a 0.5 g/t cut-off |
41 |
| Mineral Resources are reported as of 09 January 2012 at a 0.83 g/t cut-off |
42 |
| Mineral Reserves and Resources reported as of 25 November 2011 for Garden Well, Erlistoun and Rosemont and as of 30 June 30 2011 for all other deposits |
43 |
| Mineral Resources reported at the following cut-offs: 0.5 g/t for Garden Well, 0.3-1.0 g/t for Moolart Well, 0.5 g/t for Erlistoun, and 0.50-2.0 g/t for Satellite deposits |
44 |
| Mineral Reserves reported at the following cut-offs: 0.6 g/t for Garden Well, 0.5 g/t for Moolart Well, 0.7 g/t for Erlistoun, and 0.50 g/t for Rosemont |
45 |
| Mineral Resources are reported at gold price of A$1,450/oz and a 2.0 g/t cut-off |
46 |
| Mineral Reserves are reported at a gold price of A$1,450/oz and a 3.8 g/t cut-off |
47 |
| Mineral Resources for Mt Martin and Swift reported as of 30 June 2011, other Resources are reported as of 15 July 2010 |
48 |
| The HBJ Mineral Resources are reported at a cut-off of 0.5 g/t within a A$1,500 shell. Mineral Resources below this shell have been reported at a 1.0 g/t cut-off |
49 |
| Mt Marion Mineral Resources are reported at a cut-off of 1.0 g/t |
50 |
| Mineral Reserves are reported as of 31 August 2011 at a gold price of A$1,250/oz |
51 |
| Mineral Resources reported as of 30 June 2011 |
52 |
| Cockbourne Mineral Reserve based on A$1,700/oz gold optimisation |
53 |
| Corboys Mineral Reserve estimate reported as of 2010, based on A$1,300/oz gold |
54 |
| Challenger Mineral Reserve estimate reported as of 2011 based on A$1,250/oz gold |
55 |
| Mineral Resources reported as of 06 September 2011 for Red October, Thin Lizzie, Crimson Belle and Butcher Well deposits |
56 |
| Mineral Resources reported at a cut-off of 0.8 g/t (open pit) and 2.3 g/t (underground) |
57 |
| Mineral Resources are reported as of 29 February 2012 |
58 |
| Mineral Resource is quoted for blocks with a grade greater than 0.5 g/t |
59 |
| White Dam Mineral Resource (which is depleted to June 2011) was re-estimated in October 2010 at cut-off of 0.3 g/t |
60 |
| Vertigo Mineral Resource re-estimated January 2011 at a cut-off of 0.4 g/t |
61 |
| Mineral Resources reported as of October 2010 |
62 |
| Mineral Resource cut-off grades vary from 0.5 g/t for reporting Indicated & Inferred oxide material, to 2.0 g/t for reporting indicated transition and fresh material |
63 |
| Mineral Reserve estimate accounts for all mining depletion up until 01 October 2010 |
64 |
| Mineral Resources are calculated at the following cut-off grades: Palmarejo 1.03g/t Aueq (open pit), 1.92 g/t Aueq (underground); Guadalupe 1.98 g/t Aueq; La Patria 1.12 g/t Aueq using $1500/0z Au & $30/oz Ag |
65 |
| Mineral Reserves are calculated using a long term average gold price of US$1,220/oz Au & $23/oz Ag and are the sum of reserves at Palmarejo and Guadalupe |
66 |
| Mineral Resources are reported as of 01 April 2011. No cut-off grades are used |
67 |
| Mineral Reserves are reported as of 01 April 2011 at a gold price of $1,062/oz. Mineral Reserve gold ounces exceed Mineral Resource gold ounces as a result of an average block factor of 104.1% being applied by the operator. |
68 |
| Mineral Resource cut-off is based on direct cost of mining |
69 |
| Mineral Resources are reported as of 31 December 2010 using an average long term gold price of $775/oz and uranium price of $56/lb U3O8 |
70 |
| Mineral Resources reported as of 31 December 2010 at a cut-off grade of 4.0g/t for Upper Elsberg reef horizon and 3.0g/t for the Middle Elsberg reef horizon |
71 |
| Mineral Resources are calculated using $1,300/oz gold and $24.00/oz silver |
72 |
| Mineral Resources are reported using the following cut-offs: 0.1 g/t AuEq (open pit oxide), 0.4 g/t AuEq (open pit sulphide), 2.5 g/t Au Eq (underground manto) |
73 |
| Mineral Reserves are calculated using long term gold price of $1,200 /oz and silver price of $20.00 /oz |
74 |
| Mineral Reserves are reported at a cut-off of US$ 3.49/t NSR |
75 |
| Mineral Resources reported as of 22 December 2011 |
76 |
| Mineral Resources are reported using the following cut-off grades: Primary ore above a 0.4 g/t cut-off, oxide/transition ore above a 0.2 g/t cut-off |
77 |
| Mineral Reserves are reported using the following cut-offs: Abnabna-Fobinso 0.4 g/t cut-off, >0.5 g/t for all other deposits |
78 |
| Mineral Reserves and Resources calculated from La Manca’s 45.9% attributable interest |
79 |
| Mineral Resource Pit reported at a 0.2 g/t cut off based on a $1,150/oz Au and $22.50/oz Ag and a June 2011 Resource model |
80 |
| Mineral Resources stated in Alamos Gold Inc’s news release of 16 November 2011; no distinction is made between Measured and Indicated Mineral Resources. Mineral Resources are assumed to be Indicated Mineral Resources for the purpose of this disclosure |
81 |
| Mineral Resources are reported at a cut-off of 0.5 g/t Au |
82 |
| Mineral Resources (oxide plus sulphide) reported as of 16 January 2008 at a 0.3% CuT cut-off |
83 |
| Mineral Reserves and Resources reported as of 31 January 2011 |
84 |
| Mineral Resources reported at the following cut-offs: Cipoeiro 0.33 g/t Au, Chega Tuda 0.31 g/t Au |
85 |
| Mineral Reserves reported using $1,066/oz Au |
86 |
| Mineral Resources reported as of October 2010 at a cut-off of 1 g/t Au |
87 |
| Mineral Reserves based upon the 12 quarter average palladium price of $507/oz and 12 quarter average platinum price of $1,512/oz; combined average PGM market price of $733/oz |
88 |
| Mineral Resources estimated using the following cut-offs: 0.4% Cu Eq (sulphides), 0.2 g/t (oxides) as of 15 November 2011 |
89 |
| Mineral Resources reported at a copper equivalent cut-off of 0.4% Cu calculated using US$2.00/lb Cu, US$900/oz Au, US$12.00/lb Mo |
90 |
| Mineral Resources and Reserves estimated using US$2.50/lb Cu, US$7.00/lb Ni, US$1,500/oz Pt, US$400/oz Pd and US$1,000/oz Au |
91 |
| Mineral Reserve cut-off is based on direct cost, indirect cost, sustaining capital and impact of Gold Wheaton agreement |
92 |
| Mineral Resources estimated using an average long-term gold price of US$1,200 / oz, cut-off grade of 2.5 g/t |
93 |
| Mineral Reserves estimated using an average long-term gold price of US$1,319 / oz, cut-off grade of 3.5 g/t |
94 |
| Mineral Resources reported as of 08 February 2012 at a cut off of 0.5 g/t Au |
95 |
| Mineral Resources reported with variable Au-equivalent cut-offs (0.3 g/t - 1.0 g/t). Gold equivalent ratio is based on $1,300/oz Au and $28/oz Ag |
96 |
| Mineral Reserves and Resources reported as of September 2011 |
97 |
| Mineral Reserves and Resources calculated from Anglo Platinum’s 42.5% attributable interest |
98 |
| Mineral Reserves and Resources calculated from Goldcorp’s 66.67% attributable interest |
99 |
| Permits pending - Franco has committed to provide a $350 million deposit and certain warrant considerations for the construction of the project when it is fully permitted and financed |
100 |
| In accordance with certain provisions of the royalty agreement, Franco is not able to disclose Reserves and Resources for Gold Quarry |
101 |
| Mineral Reserves and Resources as of 01 January 2012 |
102 |
| Mineral Resources based on cut-off of 0.3 g/t |
103 |
| Amalgamated Kirkland Mineral Resources reported as of October 2011 based on $1,200/oz Au and 2.0 g/t cut-off |
104 |
| Mineral Reserves are reported as of 06 October 2011 at a 0.72 g/t cut-off with a marginal cut-off of 0.33 g/t |
105 |
| Mt Martin Mineral Resources are reported at a cut-off grade of 0.6 g/t |
106 |
| Mineral Reserves reported as of December 2010 |
107 |
| Mineral Resources are reported at a cut-off of 0.3 g/t Au |
108 |
| Mineral Reserve cut-off varies as a function of ore type |
109 |
| Mineral Reserves reported at a 0.8 g/t cut-off and $1,250/oz Au price |
110 |
| Au-equivalent cut-off gold to silver ratio is based on US$1,300 gold and US$28 for silver for Serujan and Bantian deposits |
111 |
| Au-equivalent cut-off gold to silver ratio is based on US$1,000 gold and US$15 for silver for all other deposits |
112 |
| Franco-Nevada has filed a technical report in respect of each of its mineral projects considered material to the Company (Palmarejo and Goldstrike) and are available on SEDAR at www.sedar.com |
113 |
| Mineral Reserves estimated at a cut-off grade of 1.2% Ni |
114 |
| Contained metal calculated based on grade and tons |
115 |
| Mineral Resources estimated at a cut-off grade of 1.2% Ni |
116 |
| Mineral Reserves and Resources reported as of 30 June 2011 |
117 |
| Contained metal calculated based on grade and tons |
118 |
| Mineral Reserves and Resources reported as of January 2009 |
119 |
| Contained metal calculated based on grade and tons |
120 |
| Mineral Reserve estimate assumes $1.75/lb Cu, $15.00/lb Mo and $10/oz Ag |
121 |
| Oxides cut-off of 0.10% Cu; Sulfide cutoff of 0.2% Cu and mixed cutoff of 0.2% |
122 |
| Resources reported as of 09 June 2008 |
123 |
| Mineral Resources estimated using a cutoff of 0.2% Cu (oxides) and 0.3% Cu (sulphides) |
124 |
| Mineral Resource limited within a pit shell constrained by US$2.0/lb Cu |
125 |
| Contained metal calculated based on grade and tons |
126 |
| Mineral Reserves and Resource estimates assume US$2.62/lb copper, US$12.50/lb molybdenum and US$15.00/oz silver |
127 |
| Contained metal calculated based on grade and tons |
128 |
| Mineral Resources reported as of 15 November 2011 |
129 |
| Mineral Resources reported at a Copper cutoff of 0.4% Cu |
Gold Assets
Gold — United States
Goldstrike, Nevada
Franco-Nevada holds royalties covering the majority of the Goldstrike complex operated by Barrick. The Goldstrike complex is located on the Carlin Trend, about 60 kilometres northwest of the town of Elko, Nevada. The Goldstrike complex includes the open-pit Betze-Post mine (“Betze-Post mine”) as well as the underground operations of Meikle (“Meikle”) and Rodeo (“Rodeo”) immediately to the north. Mining activity commenced on the property in 1976 and since 1986 has been operated by Barrick. Barrick reported that the Goldstrike complex produced 1,088 thousand ounces (“k oz”) of gold in 2011.
The Betze-Post mine is an open-pit operation using large electric shovels and trucks. Meikle is a high-grade ore body which is mined by transverse longhole stoping and underhand drift and fill methods. Rodeo is a further extension of the mineralization and is a trackless operation. The processing facilities include an autoclave circuit to treat sulphide ore and a roaster for treating carbonaceous ore.
Franco-Nevada holds NSR (2-4%) and NPI (2.4-6%) royalties at Goldstrike covering the majority but not all of the reported mineral reserves and mineral resources. The mineral reserves and mineral resources also include low grade ore that has been stockpiled for later processing. The royalties vary depending on the claim blocks as shown in the figure. As a result, royalty payments can vary substantially on a quarterly basis depending on mine sequencing and waste stripping. The timing of capital investments can also impact the timing of the payment of profit royalties.
Goldstrike is a mature mining operation for which the majority of capital has already been spent and recovered. Franco-Nevada does not have the obligation to fund any portion of the costs associated with the operations at the Goldstrike complex. Overall production rates have been declining and, as a result, Franco-Nevada’s revenue royalties (NSR) have also declined despite higher gold prices. At the same time, higher gold prices have been contributing to higher profit royalties (NPI) substantially compensating for the decline in production. The Goldstrike royalties are expected to have a long life with mining likely to continue for the foreseeable future followed by a long period of processing of accumulated stockpiles.
Please see the section headed “Goldstrike Mining and Technical Information” for further information in respect of the Goldstrike project.
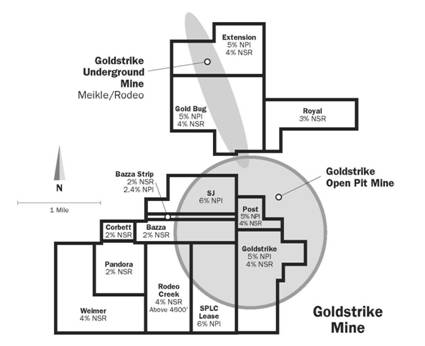
Gold Quarry, Nevada
The Gold Quarry operation is part of Newmont’s Carlin operations in north-central Nevada. It is a large open pit mine that has been in production since 1985 supplying ore as part of an integrated mining complex with different mines supplying variable ore types and grades to a variety of processing facilities situated throughout the complex. Newmont has significant milling and roasting processing infrastruture immediately east of the Gold Quarry pit. Newmont currently reports mineral reserves and production numbers by area and does not publicly quote separate Gold Quarry numbers.
Franco-Nevada acquired its royalty interest on a portion of the Gold Quarry property on December 29, 2008 as shown in the schematic. The Gold Quarry royalty is a 7.29% NSR based on production or a minimum annual royalty payment obligation tied to unpaid mineral reserves and stockpiles on the Gold Quarry royalty property. Based on the minimum royalty provision, Franco-Nevada expects to receive on average at least 11,250 gold royalty ounces per annum.
In December 2009, a slope failure limited mine access and the royalty was paid based on the minimum annual royalty obligation in 2010 and 2011. Newmont has announced the potential for a West Wall layback that will provide access to deeper ore in the centre of the pit underlying the royalty property. Newmont has also reported that it is considering an even larger Greater Gold Quarry layback. As shown in the schematic, this would involve additional mining on the royalty property. Franco-Nevada expects its Gold Quarry royalty will have a very long life.

Marigold, Nevada
The Marigold mine is located approximately 64 kilometres southeast of Winnemucca, Nevada. It is a conventional open pit heap leach operation and is operated by a joint venture between Goldcorp Inc. (“Goldcorp”) (66.7%) and Barrick (33.3%). Franco-Nevada has various royalties on the operation (1.75-5% NSR and 0.5-4% GR), as shown in the schematic, together covering almost all of the current mineral reserve base. Franco-Nevada’s original royalties were acquired in connection with the Newmont Acquisition Agreement and, in November 2009, additional royalties covering alternate sections were added.
The operators reported that production increased by 12% to 153 k oz of gold in 2011 compared to 2010. Marigold focused on a stripping campaign during the year as mining transitioned from the Basalt pit to the Target II pit. The ore will predominately be sourced from the Target II pit during 2012.
The operators reported that exploration activity for 2011 focused on development drilling in the Target II, Target III and the Red Dot deposits where positive results resulted in additional mineral reserves. The increase in the mineral reserves is largely attributable to the conversion of mineral resources to mineral reserves in the Red Dot deposit.

Bald Mountain, Nevada
The Bald Mountain mine lies within the Southern Ruby Mountains of northeastern Nevada, approximately 110 kilometres southeast of Elko. Bald Mountain is operated by Barrick and ore is sourced from multiple open pits over an estimated 150,000 acre property. Processing is done at multiple conventional heap leaching facilities using carbon absorption for gold recovery. In February 2010, the Federal Bureau of Land Management (the “BLM”) approved a planned expansion designed to significantly increase production and extend the mine life at Bald Mountain.
Franco-Nevada’s Bald Mountain royalties cover a significant portion, but not all, of the Bald Mountain property. Franco-Nevada holds various revenue royalties on the property depending on the claim groups ranging from a 0.875% to 5% NSR/GR. A detailed map of our royalties is shown in the schematic.
Barrick reported that production at Bald Mountain increased by 58% to 93 k oz of gold in 2011 mainly due to increased tons mined and processed as a result of an ongoing mine expansion. According to Barrick, production in 2012 is expected to increase further with the completion of the mine expansion.
In late 2011, Barrick announced that it had filed a new revised plan of operations with the BLM for yet a further potential expansion of the property. Bald Mountain is expected to be a long-term stable producer for Franco-Nevada.

Mesquite, California
Mesquite is a gold operation located in south-east California approximately 70 kilometres northwest of Yuma, Arizona and 230 kilometres east of San Diego, California. The mine is an open pit, run-of-mine, heap leach operation. It was originally started in 1986 and then re-started in January 2008 by Western Goldfields Inc. (“Western Goldfields”), a predecessor company of New Gold Inc. (“New Gold”).
Franco-Nevada holds royalties on the entire Mesquite mine property that range from a 0.5% to 2% NSR depending on the claim block as shown by the schematic.
New Gold reported that production at Mesquite was 158 k oz of gold in 2011. Production was primarily from the Rainbow area on which Franco-Nevada holds a 2% NSR royalty. When mining shifts to the Big Chief pit, which is anticipated by New Gold to be in early 2012, a portion of the production will be from claims on which Franco-Nevada holds a 0.5% NSR royalty.
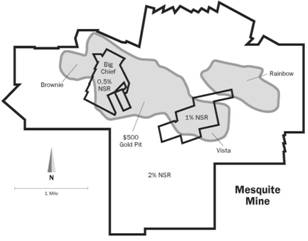
Hollister, Nevada
Hollister is an underground mine located at the northern end of the Carlin Trend in the Ivanhoe Mining District, Elko County, Nevada, approximately 121 kilometres east-northeast of Winnemucca, Nevada. Great Basin Gold Limited (“GBG”) owns and operates the Hollister project.
Franco-Nevada holds a 5% NSR royalty on approximately 7,000 acres of the Hollister project. However, the NSR royalty is reduced by 2% on 45 claims known as the Hillcrest-Finley River Block, effectively giving Franco-Nevada a 3% NSR royalty on production from that area.
GBG reported that it sold 92,239 gold equivalent ounces in 2011. Currently, ore extracted from the Hollister Mine is trucked some 470 kilometres to GBG’s Esmeralda Mill in western Nevada. In 2011, GBG announced that it is currently awaiting completion of the environmental impact study process and receipt of the BLM’s approval allowing mine production to exceed the current 275,000 tons per year permitted maximum.
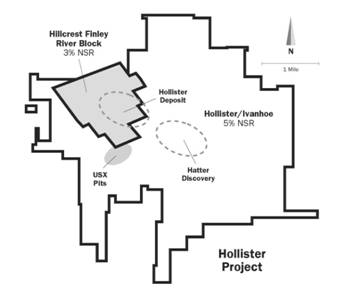
Gold — Canada
Detour, Ontario
Franco-Nevada has a 2% NSR royalty that covers all reported mineral resources at the Detour Gold project as well as the Trade Winds Ventures (“TWD”) project to the immediate west in Ontario. In October 2011, Detour Gold Corporation (“Detour Gold”) acquired TWD and with that acquisition TWD’s 50% interest in Block A (shown in the schematic below). Placer Dome operated a mine on the property from 1983 through 1999 and has reported that it produced approximately 1.8 million ounces of gold.
Detour Gold reported that it has raised over $1.2 billion to fully finance mine construction and that the project is 48% complete as of December 31, 2011. It also announced that mine construction is expected to be largely completed by the 2012 year end with most of the capital already committed. Detour Gold has estimated that production will begin in early 2013 with an initial average production of 660 k oz of gold per year once the project reaches full capacity. It forecasts operating costs to be below $600/oz once the mine becomes operational. The mine is located in a politically safe jurisdiction and Detour Gold has reported that it has received Federal environmental approval. Following the acquisition of TWD, Detour Gold announced that it is planning additional drilling in 2012 and may incorporate that property into its long-term mine plan.
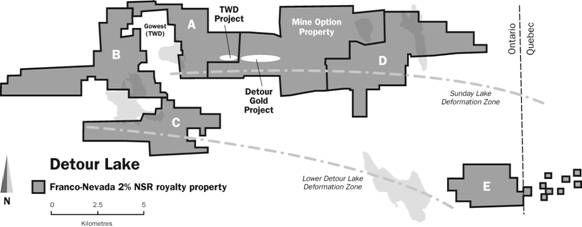
Sudbury (Gold), Ontario
Please refer to “PGM Assets — Sudbury (PGM), Ontario” for an asset description.
Golden Highway, Ontario
Franco-Nevada has multiple NSR royalties ranging from 2-15% over the Destor-Porcupine mineral trend just east of Timmins, Ontario spread over more than 90 kilometres. Highway 101 that parallels this trend is referred to as the “Golden Highway” so Franco-Nevada has grouped together several producing royalties and development projects under this one title. Most of the properties are owned and operated by St Andrew Goldfields Ltd. (“St Andrew”) and ore is processed through a central milling complex. St Andrew reported that total production in 2011 was 74 k oz of gold.
Holloway: Franco-Nevada has a sliding scale NSR royalty of 2% if the price of gold is $800/oz or less, increasing by 1% for every $100/oz increase in the price of gold, up to a maximum of 15%. St Andrew re-started production at the Holloway mine in 2009 and reported that it expects to produce approximately 30 k oz of gold from the operation in 2012.
Holt: The Holt property is immediately south of the Holloway mine and hosts the Holt mill complex and the Holt mine. Franco-Nevada has a sliding scale NSR royalty beginning at 2% when the gold price is less than or equal to $500/oz and increasing in 1% increments for each $100/oz increase in the gold price, to a maximum of 10%. St Andrew re-started operations at the Holt mine in 2011 and reported that it expects to produce approximately 50 k oz of gold from Holt in 2012.
Hislop: The Hislop property is located approximately 50 kilometres to the west of the Holt mill where ore is trucked for processing. Franco-Nevada has a 4% NSR royalty on the Hislop property which includes minimum royalty payment commitments. St Andrew brought the Hislop open pit mine into production in the third quarter of 2010 and the company reported that it expects to produce approximately 20 k oz of gold from Hislop in 2012.
Other St Andrew projects that have NSR royalties with mineral reserves held by Franco-Nevada include the Taylor project (1% NSR) and the Aquarius deposit (1-2% NSR).
Musselwhite, Ontario
Musselwhite is located in northwestern Ontario and is operated by Goldcorp. The mine is a fly-in/fly-out underground operation which began operating in April 1997. Goldcorp has reported that the mine has produced in excess of 3 million ounces of gold. Goldcorp reported that production in 2011 was 243 k oz of gold.
Franco-Nevada has a 5% NPI royalty that covers all of the original leased lands at the Musselwhite property. The royalty also covers an area of interest surrounding the property as shown in the schematic. Franco-Nevada received its first payment under the NPI royalty in 2011 as the mine has now recovered all historical capital and operational costs.
In 2010, Goldcorp announced that it had discovered the Lynx zone, a zone of higher grade ore above the cornerstone PQ Deeps underground operation. This has the potential to significantly enhance the economics and extend the mine life.
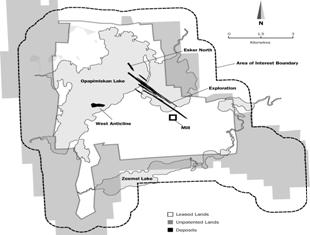
Hemlo, Ontario
The Hemlo gold camp has been producing gold for over 25 years and is located just off the Trans-Canada highway near Marathon, Ontario. Williams Operating Corporation (“WOC”), a wholly owned subsidiary of Barrick, is the operator and manages both the open-pit and underground operations. Franco-Nevada has both a 3% NSR royalty and a 50% NPI royalty on a portion of the western down-dip underground extension of the Hemlo ore-body as shown in the longitudinal schematic.
Initial mining on the royalty property began in late 2008. Royalty revenues to date have been limited to the 3% NSR royalty at the Williams mine. Barrick reported that production in 2011 was 227 k oz of gold from the entire operation.
Franco-Nevada’s 50% NPI royalty is payable once WOC has recovered its related costs. The NPI royalty is expected to become payable in 2012. In February 2012, Barrick announced that it is studying the feasibility to extend the mine life to 10 years.
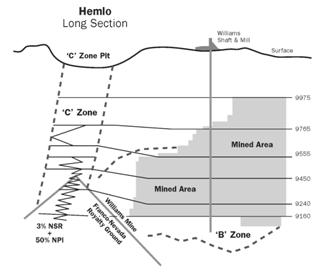
Timmins West, Ontario
Franco-Nevada acquired a 2.25% NSR royalty on Lake Shore Gold Corp.’s (“Lake Shore”) Timmins West property in February 2012. The royalty covers a large land package to the west of the City of Timmins, Ontario which hosts the Timmins and Thunder Creek deposits as well as the Gold River Trend and 144 exploration zones to the south.
Lake Shore announced that it had achieved commercial production at the Timmins mine in January 2011 and is in the process of implementing an expansion of its milling facilities to 3,000 tonnes per day from the current capacity of 2,000 tonnes per day to accommodate expected increased production coming from the Thunder Creek deposit. It announced that it expects the expansion to achieve commercial production during 2012. Lake Shore reported that it is targeting 85-100 k oz of production in 2012 and, on February 28, 2012, provided guidance to higher production in 2013 with the contribution of a full year of mining from Thunder Creek. A small amount of total production is expected to come from the Bell Creek property which is not subject to the royalty.

Gold — Australia
Duketon, Western Australia
Franco-Nevada has a 2% NSR royalty that covers 267,819 hectares of the Duketon gold project in Western Australia. The project is operated by Regis Resources Ltd. (“Regis”) and includes ten deposits at various stages of development. Franco-Nevada’s royalty covers all known mineral reserves and mineral resources, except for a portion of the Erliston Deposit. Regis has estimated that 89% of Erliston mineral reserves are covered by Franco-Nevada’s royalty.
Moolart Well: This deposit has been in production since August 2010. Moolart Well has a 2 million tonnes per annum (“tpa”) plant and Regis has forecasted average annual production of approximately 90 k oz over its total 6 year mine life. Regis reported that in 2011, production was 101 k oz of gold.
Garden Well: This deposit is under development. Regis has reported that Garden Well’s production is scheduled to commence early in Q3 2012. According to Regis, Garden Well will have a 4 million tpa plant, 9 year mine life, with an average annual gold production of 180 k oz, and a first year gold production of 247 k oz.
Rosemont: Regis has announced that development options are being assessed as part of a detailed feasibility study which include trucking of ore, overland conveyor or stand-alone processing.
Erliston: Regis has announced that it was able to re-optimise the reserve study at Erliston to reflect the shorter haulage distance to Garden Well which is 7 kilometres away, rather than trucking the ore to Moolart Well which is 45 kilometres away.
Henty, Tasmania
Franco-Nevada holds a 10% gross royalty on certain claims and a 1% gross royalty on the balance of the claims at the Henty Gold Mine located in northwest Tasmania operated by Unity Mining Limited (“Unity”). All current production, mineral reserves and mineral resources are on property subject to Franco-Nevada’s royalties which covers 1,458 hectares.
Henty is a small underground gold mine that has been in continuous production since 1996. Unity has reported that the mine has historically produced 1.2 million ounces of gold. Ownership has changed multiple times during this period. Royalty revenues have increased in recent years due to the increased share of production from 10% royalty ground. Unity reported that in 2011, Henty produced 46 k oz of gold. While Unity has reported that it is confident the production rate will increase in the future, Franco-Nevada expects its royalty revenue to decline as a higher share of production is sourced from the 1% royalty area. The largest contributor to mineral resource additions in recent years is the Newton Zone, which is on the 1% royalty area.
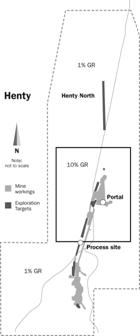
South Kalgoorlie, Western Australia
Franco-Nevada holds a 1.75% NSR royalty for gold and a 1% NSR royalty for other minerals on portions of Alacer Gold Corp.’s (“Alacer”) South Kalgoorlie operation. South Kalgoorlie is located 15 kilometres south of Kalgoorlie in Western Australia. Franco-Nevada’s royalty interest covers 46,752 hectares of the South Kagoorlie area and includes the northern and central sections of the HBJ deposit and all of the Mt Marion and Mt Martin deposits as shown in the schematic. The northern and central section of the HBJ deposit lies within the Location 50 freehold land area which is owned by Franco-Nevada with the mineral rights leased to Alacer.
During 2011, Alacer purchased the Mt Martin deposit and incorporated it into its South Kalgoorlie operation. Mt Martin is a small open pit gold deposit located 10 kilometres east of Alacer’s Jubilee mill. Prior to this acquisition, Alacer had mined Mt Martin under a sub-lease arrangement that expired in 2010. Franco-Nevada also holds a 1.75% NSR royalty for gold and a 1% NSR royalty for other minerals on Mt Martin. Alacer resumed mining activities at Mt Martin in February 2012. The Mt Martin deposit lies within the Location 45 freehold land area which is owned by Franco-Nevada with the mineral rights leased to Alacer.
South Kalgoorlie ore is processed at the 1.2 million tpa Jubilee mill, which also processes Alacer’s share of ore mined from the Frogs Leg joint venture located to the northwest. Alacer announced that it is considering expansion of the South Kalgoorlie operations. On October 24, 2011, Alacer approved a A$25 million budget to fund feasibility work, ordering long lead time items for a new 2.5 million tpa treatment plant,

and is proceeding with cutbacks to the HBJ North and Mt Martin open pits. It stated that it plans to advance the expansion project in 2012 and is targeting commissioning and production in 2013. Alacer reported that production in 2011 was 89 k oz of gold and guidance for 2012 is between 90-95 k oz of gold production.
Franco-Nevada also holds the same royalties on the Hampton property shown in the schematic. This is classified as an exploration asset. It was part of the original royalty property but operatorship on this property has since been acquired by BHP Billiton Limited.
Bronzewing, Western Australia
The Bronzewing Gold Project is located 80 kilometres northeast of Leinster in Western Australia and comprises the Bronzewing and McClure group of mines within a semi-contiguous landholding. Bronzewing commenced production in 1994 and the project has had several operators. Mining operations were suspended in February 2008 when the previous operator went into administration. Navigator purchased the project assets in September 2009, and recommenced gold production in April 2010. Historic mining has been from a number of open pit and underground deposits. Navigator commenced mining the Cockburn open pit in 2011. The Cockburn pit is currently the sole ore source for the 2.5 million tpa Bronzewing mill and Navigator has stated that it is expected be the focus of its mining activity for several years. Navigator reported that production in 2011 was 60 k oz of gold.
Franco-Nevada has a 2% NSR royalty on the Bronzewing Gold Project. In January 2012, Franco-Nevada invested A$4.5 million to increase its royalty rate from 1% to 2%, and to expand the royalty area to include all mineral reserves and mineral resources. In addition, Franco-Nevada’s royalty will apply to all production through the Bronzewing mill, regardless of where the ore originated. Franco-Nevada’s royalty is estimated to cover 56,280 hectares of the Bronzewing Gold Project incorporating all known mineral reserves and mineral resources.

Gold - International
Tasiast, Mauritania
Franco-Nevada has a 2% NSR royalty on the Tasiast project operated by Kinross. The royalty originally covered three large permit areas in Mauritania, West Africa of which the most prominent is Tasiast with a currently reported mining license area of 312 km2 and a total exploration license area of 3,118 km2. Franco-Nevada’s royalty became payable once cumulative production exceeded 600 k oz of gold and this threshold was crossed in the third quarter of 2011. 2012 will be the first full year of Tasiast royalty revenue for Franco-Nevada.
Kinross acquired control of Tasiast in September 2010 pursuant to its acquisition of Red Back Mining Inc. Kinross reported that in 2011 it produced just over 200 k oz of gold from Tasiast. Kinross announced that an initial phase of expansion was completed in 2011 with

construction of dump leach and adsorption, de-sorption and recovery (ADR) facilities. Ongoing is the expansion of the mining fleet and camp facilities. Kinross has announced that it collectively expects that these expansions will have a positive impact on 2012 production.
Kinross has stated that it is exploring processing alternatives between milling, dump leach and heap leaching. Kinross also reported that it expects a preliminary selection of processing options in the second quarter of 2012 and is targeting commencement of construction in mid-2013 with a ramp up of a new facility in 2015. Kinross has stated that Tasiast is its immediate strategic priority and 2012 capital expenditures for the project are forecast at $765 million.
Palmarejo, Mexico
Palmarejo is a gold and silver mine owned and operated by Coeur located in Chihuahua Province, Mexico. The project includes open pits, an underground mine and processing facilities. Production began in 2009 and to date has been limited to the Palmarejo deposits. Coeur has reported that it is also advancing the nearby Guadalupe deposit as a possible underground mine with initial production potentially as soon as 2013.
In January 2009, Franco-Nevada acquired a gold stream interest for 50% of the gold produced from the Palmarejo mine which is paid on the difference between the spot price and $400 per ounce increasing by 1% per year after the fourth anniversary following closing. The attributable ounces are the greater of actual production and a minimum amount of 50 k oz per year until payments have been made on 400 k oz.
Coeur holds an extensive land position and exploration is being conducted on a number of targets. In 2011, Coeur reported that it had completed 12,800 m of drilling on the La Patria deposit which is about 6 kilometres from the Palmarejo mine. Coeur has reported that production in 2011 was 125 k oz of gold and guidance for 2012 is for 98-108 k oz of gold production. The mine is expected by Coeur to operate for approximately nine more years.
Please see the section headed “Palmarejo Mining and Technical Information” for further information in respect of the Palmarejo project.

Mine Waste Solutions, South Africa
MWS is a gold and uranium tailings recovery operation located near Stilfontein, approximately 160 kilometres west of Johannesburg, South Africa. The operation processes multiple tailings dumps in the area through three production modules, the last of which was commissioned in 2011. It also includes a modern tailings storage facility approximately 15 kilometres from the gold plant modules where residues from the treatment plants are deposited.
Franco-Nevada has the right to purchase 25% of the gold produced from the MWS dumps for ongoing payments equal to the lesser of $400/oz of payable gold (subject to a 1% inflation adjustment starting after 4 years) and the then prevailing market price of gold. Franco-Nevada acquired its interest in MWS as a result of its acquisition of Gold Wheaton in March 2011. In 2011, FIU sold 96.2 k oz of gold.
MWS is currently operated by FIU. On March 2, 2012, FIU announced that it had entered into a definitive agreement to sell the operation to AngloGold Ashanti subject to the fulfillment of a number of conditions. AngloGold Ashanti intends to continue to process the MWS tailings dumps but also intends to start to process its own tailings dumps through the MWS plant. Franco-Nevada and AngloGold Ashanti have agreed that upon completion of this transaction, Franco-Nevada will be entitled to receive 25% of all the gold produced through the MWS plant including treatment of AngloGold Ashanti’s tailings until Franco-Nevada has received 312,500 ounces of gold, starting on January 1, 2012.
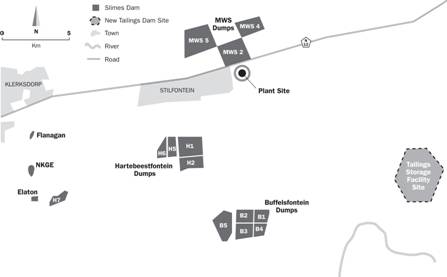
Ezulwini, South Africa
Ezulwini, which was formerly known as the Western Areas Gold Mine, is an underground mine located near the town of Westonaria approximately 40 kilometres west of Johannesburg, South Africa. The mine was re-opened in 2008. Facilities include shafts to access the Upper Elsberg and the Middle Elsberg reef horizons, ancillary infrastructure and surface gold and uranium plants with capacity of 200,000 tonnes per month (“tpm”) and 100,000 tpm respectively.
Franco-Nevada, as a result of its acquisition of Gold Wheaton, has the right to purchase 7% of the gold produced from Ezulwini mine ores for an amount equal to the lesser of $400/oz of payable gold (subject to a 1% inflation adjustment starting after 4 years) and the then prevailing market price of gold. The gold stream agreement was subject to a delivery of a minimum of 19.5 k oz of gold in 2011. The minimum payment terminated at the end of 2011.
Ezulwini is currently operated by FIU. FIU reported that gold sold for calendar year 2011 was 50,767 oz. It announced in December 2011 that it planned to reduce its workforce and focus mining on the higher grade Upper Elsberg horizon. FIU indicated that Ezulwini would not meet its prior guidance of production of 70-80 k oz in the twelve months to March 31, 2012. In February 2012, FIU announced that it had partially written down the carrying value of this asset. On March 2, 2012, FIU announced it had entered into a binding letter agreement to sell the operation to Gold One International Limited (“Gold One”) subject to a number of conditions precedent.
Franco-Nevada expects to continue to receive its 7% gold stream interest on gold produced from the Ezulwini mining lease. Franco-Nevada has been advised that Gold One is exploring the potential to process ore from its nearby Cooke operation at the Ezulwini mill and while this ore will not be subject to the Franco-Nevada gold stream, it could improve the overall economics of the Ezulwini operation.
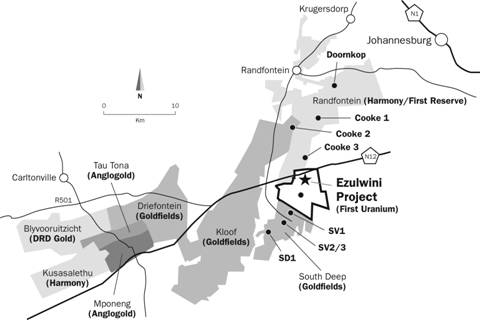
Subika, Ghana
Franco-Nevada has a 2% NSR royalty which covers a 78 square kilometre area over the Subika deposit at the southern end of Newmont’s Ahafo Mine, Ghana (shown in the schematic). The royalty is payable once a total of 1,200 k oz of gold have been produced from the royalty property, with 1,044,353 ounces of gold creditable towards that threshold at the end of 2011. When production began in 2006, much of it was sourced from the Subika open pit. However, Subika has been the focus of exploration and pre-development work, therefore actual mine production was lower in 2011. To date, approximately 37% of all production has taken place on royalty ground. Over the next few years, Franco-Nevada estimates that production on royalty ground will be below the historic figure but then increase significantly once the Subika open pit and underground expansion production begins.
In late 2009, Newmont announced that it was evaluating a potential expansion of the Subika deposit by deepening and expanding the existing open pit and developing a new underground mine. At the 2012 Indaba Conference, Newmont stated that the Ahafo mill expansion study is looking to increase throughput at the plant by up to 50%, while the Subika underground mine study is targeting 250-300 k oz per year of underground production by 2017.
Franco-Nevada’s Ahafo royalty is believed to cover most if not all of the Subika open pit as well a majority of the Subika underground mineralization identified to date. Newmont reported 566 k oz of gold production in 2011 for Ahafo and, in February 2012, provided 2012 production guidance of between 570-600 k oz for Ahafo.
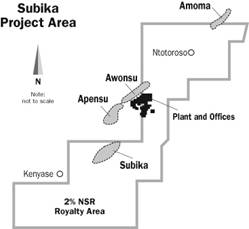
Cerro San Pedro, Mexico
Franco-Nevada has a 1.95% GR royalty that covers most of the known mineralization on the Cerro San Pedro project operated by New Gold. Cerro San Pedro is located near San Luis Potosi in central Mexico. The project property is a gold-silver, open pit, run-of-mine heap leach operation and consists of 36 mining and exploration concessions totaling 78 km2 in the historic Cerro San Pedro mining district. New Gold has stated that its current focus of exploration is on the southern half of a two-plus kilometre San Pedro trend of gold-silver-zinc-lead mineralization that extends south from beneath the current open pit mine operation.
New Gold reported Cerro San Pedro 2011 production of 184 k oz of gold equivalent ounces and provided 2012 guidance for gold equivalent production from Cerro San Pedro to be in the range of 178-192 k oz.

Edikan, Ghana
In 2011, Franco-Nevada acquired an effective 1.5% NSR royalty on Perseus’ Edikan Gold Mine (“Edikan”) in Ghana. Perseus has 650 km² of tenements centered on the Ashanti Gold Belt including two mining leases that are the focus of initial production.
Perseus reported that first gold production was achieved on August 21, 2011 and the mine achieved commercial production on January 1, 2012. After the expected ramp up of production at Edikan in the first half of calendar year 2012, Perseus stated that it expects to be producing gold on target during the second half of calendar year 2012, with production rates expected to be 220-240 k oz for the year. Perseus has announced plans to increase production to 290 k oz by fiscal year 2014.
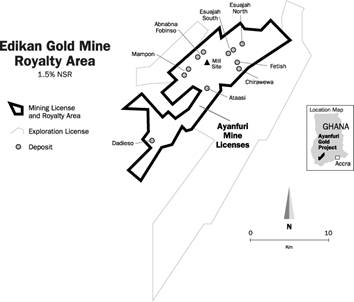
North Lanut, Indonesia
The North Lanut gold mine is located in the central portion of North Sulawesi in the District of Bolaang Mongondow, Indonesia. The property includes the Riska, Effendi, Talugon, Durian, Rasik and Osela deposits. The 6th generation Contract of Work includes exploration and mining rights over approximately 50,000 hectares.
Franco-Nevada has a 5% NSR royalty on 80% of gold production (i.e. a 4% NSR) which will cease after 500,000 ounces of production. North Lanut is operated by PT Bara Kutai Energi (“PT”).
In June 2011, Avocet Mining PLC finalized the sale of its South East Asian assets, including the North Lanut Mine, to J&P Partners for a total consideration of $200 million.
PT reported that production from the property was approximately 43 k oz of gold in 2011, bringing the total life of mine production to date to just under 350 k oz of gold.
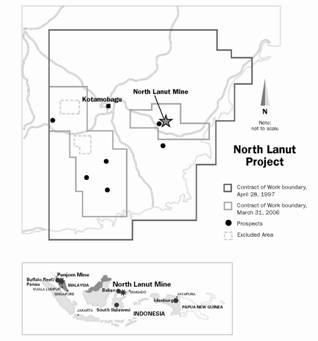
PGM Assets
Stillwater, Montana
Stillwater owns and operates the Stillwater mine and the East Boulder mine in Montana. Production began in 1986 at the Stillwater mine and in 2002 at the East Boulder mine (together, the “Stillwater complex”). Franco-Nevada has a 5% NSR royalty on all commercially recoverable metals produced from 813 of the 995 claims that cover the Stillwater complex. The amount of the royalty is reduced by permissible “onward processing” deductions which have averaged 10-12% of revenue over the last several years.
Based on Franco-Nevada’s estimates, Franco-Nevada’s NSR royalty currently covers 80-85% of the Stillwater mineral reserves and mineral resources and 100% of the East Boulder mineral reserves and mineral resources. Historically, because of reliance on near-shaft stopes in the Stillwater mine, production has been sourced disproportionately from non-Franco royalty ground, however, in recent years the percentage of Stillwater complex production subject to Franco-Nevada’s royalty has increased, averaging approximately 85% since 2005.
Stillwater has reported 2011 mine production of 518 k oz of PGMs. On February 12, 2012, Stillwater gave production guidance for 2012 of approximately 500 k oz of PGMs from the Stillwater complex.
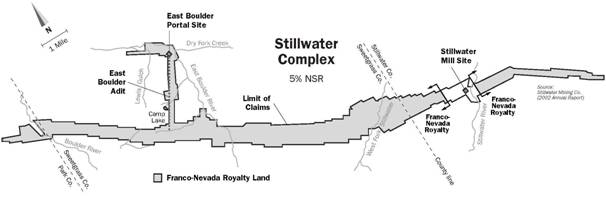
Sudbury (PGM), Ontario
Franco-Nevada acquired three precious metals streams in the Sudbury basin of Ontario with its acquisition of Gold Wheaton on March 14, 2011. Franco-Nevada is entitled to purchase 50% of the precious metals contained in ore produced from the footwall portions of three separate mines in the Sudbury basin of Ontario for $400 per gold equivalent ounce (subject to an annual 1% inflation adjustment). At the time of acquisition by Franco-Nevada, the mines were operated by Quadra FNX which was acquired by KGHM in March 2012.
The three mines are the Levack (Morrison deposit), Podolsky and McCreedy West mines. The footwall deposits are primarily rich in palladium followed by platinum and gold. The PGM revenues are reported separately from the gold revenues. KGHM does not have processing facilities in Sudbury and sells the ore to third parties for processing. The stream is calculated based on contained precious metals in the delivered ore rather than payable metals as is common in many royalty and stream arrangements.
Levack (Morrison deposit): The stream agreement applies to the Morrison deposit (previously Levack Footwall deposit), Rob’s zone and 1900 zone at the Levack complex which has been in production since 2007. Quadra FNX reported that in 2011, it produced 38 million pounds (“Mlbs”) of copper from Morrison and 30 k oz of payable total precious metals (“TPM”). In late 2011, Quadra FNX and Xstrata Nickel entered an agreement which allows Quadra FNX to utilize the underground infrastructure of the Craig Mine. Quadra FNX expects that the use of Xstrata Nickel’s Craig infrastructure will significantly improve the operational flexibility and provide additional mining and drill access in the deeper high grade portions of the Morrison deposit. Quadra FNX expects this to have a positive impact on Morrison’s long- term production outlook.
McCreedy West Mine: The stream agreement applies to the PM and 700 deposits at the McCreedy West mine which has been in production since 2003 and Quadra FNX reported that it produced 5 Mlbs of payable copper and approximately 17 k oz of payable TPMs in 2011. In Q3 2011, McCreedy West changed from mining copper and precious metal-rich ores to mining contact nickel ores.
Podolsky Mine: The stream agreement applies to the 2000 and North deposits at the Podolsky mine which has been in operation since 2008 and Quadra FNX reported that it produced 24 Mlbs of copper and 26 k oz of payable TPMs in 2011. The operator reported that it plans to put Podolsky on care and maintenance once existing mineral reserves at the 2000 deposit are mined which is expected to be by the end of 2012. Exploration is expected to continue on the property.
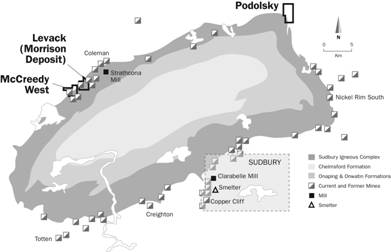
Pandora, South Africa
The Pandora property is a joint venture between Anglo American Platinum Corporation (“Angloplat”), Lonmin Plc (“Lonmin”), Bapo-Ba-Mogale Mining Company and Mvelaphanda Resources and forms part of the Bushveld complex approximately 40 kilometres east of the town of Rustenburg, South Africa.
Franco-Nevada has a 5% NPI royalty on Pandora. The royalty also provides for AMR payments of ZAR 100,000 (approximately $12,200).
The mine is an underground operation and exploits the UG2 reef horizon with access via a declined from surface. Ore is sold to Lonmin for further processing. A shaft deepening project with new deeper production levels is underway and it is expected that the centre of gravity of future mining will shift towards ground covered by Franco-Nevada’s 5% NPI royalty when it is completed. The operators reported production in 2011 to be 97 k oz of PGMs.
Angloplat reported in its 2010 Annual Report that production will be increased once the shaft deepening is completed in mid-2012 and Lonmin reported that the shaft deepening project will extend the life of the shaft to 2029.

Other Minerals Assets
Mt Keith, Western Australia
Franco-Nevada owns both a 0.375% GR royalty and a 0.25% NPI royalty on lands including the Mt Keith nickel operation in Western Australia, located 460 kilometres north of Kalgoorlie. BHP Billiton Limited (“BHP Billiton”) is the operator of Mt Keith. The 0.375% GR royalty was acquired by Franco-Nevada in 2009. Mt Keith is a large, low-grade disseminated nickel sulphide ore body with an open pit mine. Mt Keith has a mining rate of approximately 40 million bank cubic metres (“bcm”) per annum. Concentrator ore throughput is approximately 11.5 million tpa with 68% recoveries. The production capacity is 35-40,000 tpa of nickel in concentrate, at approximately 20% nickel grade. Mining commenced in 1993 with the first nickel concentrate produced in 1994. In its June 30, 2011 Annual Report, BHP Billiton reported that Mt Keith has an estimated mine life of 13 years.
Throughout its operating life, Mt Keith has stockpiled a large volume of high talc ore. In 2009, BHP Billiton approved the Mt Keith Talc Redesign Project with an estimated total investment of $152 million. This project will enable the Mt Keith concentrator to obtain full value from processing talc-bearing ore. BHP Billiton has reported that the Talc Redesign Project was successfully commissioned in December 2011. In February 2012, BHP Billiton announced that the mining rate at Mt Keith would be reduced and that stockpiled ore would be used to produce nickel concentrate, keeping output close to current levels.
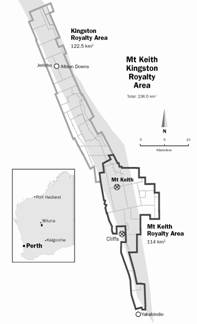
Exploration Assets
Franco-Nevada has interests in 139 exploration stage mineral properties as at March 26, 2012. By commodity, these include 117 gold exploration assets, 2 PGM exploration assets and 20 other minerals exploration assets. Exploration assets are speculative and unlikely to generate revenue to Franco-Nevada in the next five years. While some of these assets are associated with properties that have production, mineral reserves or mineral resources, Franco-Nevada’s exploration stage property interests are estimated to be outside known mineral resources or require mineral reserves or mineral resource additions to become economic. A good portion of the properties are inactive and may not see activity again. Some of the properties are in proximity to producing or advanced projects discussed above. Franco-Nevada has not visited or audited its full list of exploration assets and has relied on operator reports, public disclosures and title searches to determine which properties are in good standing. It is possible some properties may have lapsed or some AMR revenue may be uncollectable.
Exploration assets that have been reclassified as advanced assets in the past year are Calcatreu, in Argentina and Glenburgh, in W. Australia.
The following table is a list of exploration assets of Franco-Nevada as at March 26, 2012. Assets that have had their terms or leases expire and have been written off are not listed. In 2011, Franco-Nevada wrote-off 8 exploration royalty assets and removed them from its asset counts.
Exploration Assets as at March 26, 2012
Asset |
| Operator |
| Interest and %(1) |
CANADA |
|
|
|
|
Eskay Creek, British Columbia |
| Barrick Gold Corporation |
| 1% NSR (Au, Ag, Pb) |
Myrtle Proserpine, British Columbia |
| Barkerville Gold Mines Ltd. |
| 3% NSR (All Minerals) |
Tide, British Columbia |
| Kiska Metals/American Creek |
| 1.5% NSR (All Minerals) |
Trout Lake (MAX Moly Mine), British Columbia |
| Roca Mines Inc. (Forty Two Metals Inc.) |
| 2.5% NSR (All Minerals) |
Monument Bay, Manitoba |
| Mega Precious Metals Inc. |
| 2-3% NSR (Au) |
Oxford Lake, Manitoba |
| Alto Ventures Ltd. |
| 1.5-2.5% NSR (All Minerals) |
Clan Lake (Sito Lake), NWT |
| Tyhee Gold Corp. |
| 2-3% NSR (All Minerals) |
Redstone (Coates Lake), NWT |
| Copper North Mining Corp. |
| 3-4% NSR (Cu, Ag) |
Butler and Sanderson (Diagnos), Ontario |
| MacDonald Mines Exploration Ltd. |
| ROFR on Diagnos Royalty (Diamonds/Base Metals) |
Catharine 1, Ontario |
| Katrine Exploration and Development Inc. |
| 1/3 of a 2-3% NSR (All Minerals) |
Catharine 4, Ontario |
| Katrine Exploration and Development Inc. |
| 2-3% NSR (All Minerals) |
Coldwell PGM (Par Lake), Ontario |
| Stillwater Canada Inc. |
| 2% NSR (Pt, Pd) |
Detour (Mikwam), Ontario & Quebec |
| ESO Uranium Corp. |
| 0.4824% NSR (All Minerals) |
Golden Highway (Aquarius), Ontario |
| St Andrew Goldfields Ltd. |
| 1-2% NSR (All Minerals) |
Golden Highway (Central Timmins), Ontario |
| St Andrew Goldfields Ltd. |
| 0-1% NSR (All Minerals) |
Golden Highway (Stock), Ontario |
| Brigus Gold Corp. |
| 1% NSR (All Minerals) |
Golden Highway (Stoughton), Ontario |
| Harte Gold Corp. |
| 0.5-2.5% NSR (Au) |
Golden Highway (Taylor), Ontario |
| St Andrew Goldfields Ltd. |
| 1% NSR (All Minerals) |
Hemlo (JOA), Ontario |
| Beaufield Resources Inc. (Jiminex option) |
| 0.5-1% NSR (Au) |
Kerrs Leases, Ontario |
| Sheltered Oak Resources Corp. |
| 1-2% NSR (Au) |
Kirkland Lake (Queenston), Ontario |
| Queenston Mining Inc. |
| 2% NSR (Au) |
Kirkland Lake (West JV), Ontario |
| Queenston Mining/Kirkland Lake Gold |
| 2-3% NSR (Au) |
Newman-Heyson (Madsen), Ontario |
| Sabina Gold & Silver Corp. |
| 1.5-2% NSR (All Minerals) |
Newman-Todd, Ontario |
| Redstar Gold Corp. |
| 1.5-2% NSR (Au) |
Red Lake (Skinner), Ontario |
| Sabina Gold & Silver Corp. |
| 1% NSR (All Minerals) |
Shining Tree (Creso), Ontario |
| Creso Exploration Inc. |
| Option to acquire 2% NSR (All Minerals) |
Shining Tree (Knight), Ontario |
| Bear Paw Resources Inc. |
| 2-3% NSR (Au) |
Timmins (Cripple Creek), Ontario |
| Richmont Mines Inc. |
| 1.05-1.75% NSR (Au) |
Timmins (Project 81), Ontario |
| Noble Mineral Exploration Inc. |
| Option to purchase 2.25% NSR (Au, Other Minerals) |
Timmins (Sewell), Ontario |
| Richmont Mines Inc. |
| 1.5-2.5% NSR (Au) |
Timmins (West Porcupine), Ontario |
| Trillium North Minerals Ltd. |
| 2% NSR (All Minerals) |
Timmins (Whitney 1), Ontario |
| John Prochnau |
| 2.5% NSR (All Minerals) |
Timmins (Whitney 2), Ontario |
| Goldcorp Inc. |
| 2.5% NSR (All Minerals) |
Windarra (East Property), Ontario |
| Wesdome Gold Mines/Windarra Minerals |
| 0.5% NSR (All Minerals) |
Cadillac-Sphinx, Quebec |
| Agnico-Eagle Mines Limited |
| 1.5% NSR (All Minerals) |
Asset |
| Operator |
| Interest and %(1) |
Casa Berardi (Caribou-Estrees), Quebec |
| IAMGOLD/Cogitore Resources |
| 1.275-2.125% NSR (Au) |
Casa Berardi (Dieppe), Quebec |
| Agnico-Eagle Mines Limited |
| 2-3% NSR (Au) |
Destiny (Rochebaucourt), Quebec |
| Alto Ventures Ltd. |
| 3% NSR (All Minerals) |
Galinee, Quebec |
| Nyrstar NV |
| 1.5-2% NSR (Au) |
Radisson, Quebec |
| Eastmain Resources Inc. |
| 2% NSR (All Minerals) |
Brewery Creek, Yukon |
| Alexco Resource/Golden Predator |
| $10-40/oz; capped at $300K (Au) |
Wernecke, Yukon |
| Newmont Mining Corporation |
| 1.2% NSR (All Minerals) |
|
|
|
|
|
UNITED STATES |
|
|
|
|
Zeolites, Arizona |
| Zeox Corporation |
| $1.50/ton plus escalator (Clay) |
Castle Mountain, California |
| Castle Mountain Venture |
| 1%, 4%, 5% NSR (Au) |
Darwin, California |
| Project Darwin LLC |
| 5% NSR plus other (Au, etc.) |
Santa Rosa, California |
| Sungro Minerals Inc. |
| 2% NSR (Au, Ag, Zn, Cu, Pb) |
Shoshone, California |
| Kenneth Henry, Tom Ver Hoef, Amargosa |
| 2% NSR (Au, Ag, Zn) |
Cripple Creek, Colorado |
| Hondo Minerals, Inc. |
| 3% NSR (Au, Ag) |
Corbin Wickes, Montana |
| Elkhorn Goldfields LLC |
| 5% NSR (Au) |
Elkhorn, Montana |
| Elkhorn Goldfields LLC |
| 1.1875% NSR (Au) |
Forest Products (Tuxedo Mine), Montana |
| Beartooth Platinum Corp |
| 2% NSR (All Minerals) |
Bald Mountain (White Pine), Nevada |
| Barrick Gold Corporation |
| 1-5% GR (Au) |
Chukar Claims, Nevada |
| Tesoro Gold Company |
| 1.67% NSR (All Minerals) |
Curtiss-Wright, Nevada |
| South Meadows Property Ltd. |
| 2% NSR (Au) |
EaglePicher Diatomite II, Nevada |
| EP Minerals, LLC |
| $0.25/short ton plus other |
Getchell, Nevada |
| Barrick Gold Corporation |
| 2% NSR (Au) |
Goldstrike (Rodeo Creek), Nevada |
| Barrick Gold Corporation |
| 4% NSR; capped at $500,000 (Au, Ag) |
Limousine Butte, Nevada |
| McEwen Mining Inc. |
| 1.5-2.5% NSR (Au) |
Marigold (SAR), Nevada |
| Glamis Marigold Mining Company |
| 5% NSR (Au) |
Marigold (Trout Creek), Nevada |
| Newmont Mining Corporation |
| 3% NSR (Au) |
NMC/NGC Deeds Barium, Nevada |
| Barium, Inc. |
| 3% GP (All Precious Metals) |
NMC/NGC Deeds Pacific Spar, Nevada |
| Pacific Spar Corp. |
| 3% GP (Au) |
Preble, Nevada |
| Barrick Gold Corporation |
| 10% NP (Au) |
Preble (Pinson Fee), Nevada |
| Barrick Gold Corporation |
| 1.5-7.5% NSR (Au, Ag) |
Sterling, Nevada |
| Imperial Metals Corp. |
| 0.25% NSR (Au) |
Tonkin Springs, Nevada |
| McEwen Mining Inc. |
| 1-2% NSR (Au) |
Malone, New Mexico |
| Evolving Gold Corp. |
| 2% NSR (Metals, Ores, Minerals & Concentrates) |
Boling Dome, Texas |
| Total E&P USA/H&L Newgulf |
| $0.0028225 per long ton (Sulfur) |
Hobson Pearson, Texas |
| Bridge Oil |
| 20% OR (Uranium) |
Texas Sulfur, Texas |
| Pacific Coast Mines, Inc. |
| 4% GR (Sulfur) |
Kings Canyon, Utah |
| Invenio Resources Corp. |
| 4% NSR (Au) |
Silver Bell, Utah |
| Unico, Inc. |
| 5% NSR plus other (Au, Cu, Pb, Zn) |
Tintic, Utah |
| Keystone Surveys |
| 1% NSR (All Minerals) |
Davy Crockett, Wyoming |
| Pathfinder Mines Corp. |
| 4% on FMV (Uranium) |
|
|
|
|
|
AUSTRALIA |
|
|
|
|
Blayney, New South Wales |
| Straits Resources Limited |
| 2.25% NSR (All Minerals) |
Brown’s Creek, New South Wales |
| Australian Native Landscapes/Hargraves |
| 2.25% NSR (All Minerals) |
Chariot Gold/Giants Reef, Northern Territory |
| Emmerson Resources Limited |
| A$17.10 or A$30/oz (Au) |
Legend, Northern Territory |
| Legend International Holdings, Inc |
| 1% Gross Revenue (All Minerals) |
Reynolds Range, Northern Territory |
| ABM Resources NL |
| 1-2.5% NSR (Au) |
Rover, Northern Territory |
| Adelaide Resources Limited |
| 1.5-2.5% NSR (All Minerals) |
Tennant Creek, Northern Territory |
| Emmerson Resources Limited |
| 1.29% NSR (Au) |
Yambarra, Northern Territory |
| North Australian Diamonds Ltd et al |
| 1.25% NPI (All Minerals) |
Crush Creek, Queensland |
| Basin Gold Pty Ltd |
| 2.75% GR (All Minerals) |
Mt Carlton, Queensland |
| Evolution Mining Limited |
| 2.75% GR (All Minerals) |
Power Station, Queensland |
| Millerman Power Partners |
| 8.3% of cashflow; NPV threshold (Coal) |
Tate River, Queensland |
| Sovereign Metals/Paladin Energy |
| 2% NSR (All Minerals) |
Top Camp, Queensland |
| Queensland Gold and Minerals Limited |
| 2.5% Gross Returns (Au)/NPI (Other Mnerals) |
Third Plain, S. Australia |
| Perilya/Minotaur Exploration |
| 0.5% NSR (Zn) |
Asset |
| Operator |
| Interest and %(1) |
Agnew, W. Australia |
| Gold Fields Limited |
| 2.5% GR (All Minerals) |
Agnew-Cox, W. Australia |
| Gold Fields Limited |
| 5% GR (Au) |
Breakaway Dam (12 Mile), W. Australia |
| Norton Gold Fields Limited |
| $1/ton (All Minerals) |
Butcher Well, W. Australia |
| Saracen Mineral Holdings Limited |
| 1% NSR after 50 k oz produced (Au) |
Carbine North (Chadwin’s Dam), W. Australia |
| Blackham Resources/Phoenix Gold |
| 3% NPI (All Minerals) |
Day Dawn (Big Bell Gold), W. Australia |
| Westgold Resources Limited |
| 1% GR (Au) |
Duketon Southwest, W. Australia |
| South Boulder Mines/Independence Group |
| 2% NSR (All Minerals) |
Duketon West, W. Australia |
| South Boulder Mines/Independence Group |
| 2% NSR (All Minerals) |
Flushing Meadow, W. Australia |
| Orex Mining/Maximus Resources |
| 1% NSR (Au, Other Minerals) |
Hampton, W. Australia |
| BHP Billiton Limited |
| 1.75% NSR (Au, Ag); 1% NSR (Other Minerals) |
Heather Bore/Mount Clifford, W. Australia |
| Independence Group NL |
| 1-2% NSR (Cu, Zn, Other Metals) |
Ironstone Well, W. Australia |
| Orex Mining/Maximus Resources |
| 1% NSR (All Minerals) |
Jeffreys Gold, W. Australia |
| Mincor Resources NL |
| 2% GP (Au) |
Karonie (Aldiss), W. Australia |
| Integra Mining Ltd |
| $10-20/oz (Au) |
Lady Jane, W. Australia |
| Phoenix Gold Limited |
| 4.5% GR (Au) |
Lake Maitland, W. Australia |
| Mega Uranium Mining /Jaurd/Itochu |
| 1% NSR (All Minerals) |
Lake Percy, W. Australia |
| Norilsk Nickel |
| 2% NPI (All Minerals) |
Langford’s Find, W. Australia |
| Enterprise Metals Limited |
| 2% NSR (All Minerals) |
Marvel Loch (May Queen), W. Australia |
| St Barbara Limited |
| $0.50-1.00/cubic metre (Au) |
Matilda, W. Australia |
| Blackham Resources Ltd |
| 3-5% NSR (Au); 2% NSR (Ni) |
Matt Dam, W. Australia |
| Norton Gold Fields Limited |
| A$0.60/tonne (A$1.00/t x 60%) (Au) |
Miranda (Ni), W.Australia |
| Breakaway Resources Limited |
| 0.5% of Production (Ni) |
Miranda Gold, W. Australia |
| Gold Fields Limited |
| 3% GR (Au) |
Moyagee, W. Australia |
| Silverlake Resources/La Mancha Resources |
| 1.575-2.1% NSR (Au) |
Munni Munni (Elizabeth Hill), W. Australia |
| Platina Resources Limited |
| One-time payment on production (Au and/or Pt) |
Randwick Gold Hill, W. Australia |
| E Bouverie, Trindal P/L, Lucas Gold P/L et al |
| 1-1.5% GR (Au) |
Red Lake, W. Australia |
| Echo Resources Limited |
| 1.5% NSR (All Minerals) |
Red October District, W. Australia |
| Saracen Mineral Holdings Limited |
| 0.68-1% NSR (Au) |
Sandstone II, W. Australia |
| Panoramic Resources Limited |
| $0.35/dry tonne (All Minerals) |
Tanami, W. Australia |
| Astro Resources NL |
| 1% Gross Revenue (All Minerals) |
Western Lease, W. Australia |
| KCGM Pty Ltd (Newmont/Barrick) |
| 1.25% GR (Au) |
Westonia, W. Australia |
| Catalpa Resources Limited |
| 2% Gross Revenue (Au) |
Windich South, W. Australia |
| Barrick Gold Corporation |
| 1% NSR (All Minerals) |
Wyooda Thangoo (Gidgee), W. Australia |
| Australian Resources/Apex Minerals |
| $0.60/tonne (Au) |
Yerilla, W. Australia |
| Wild Acre Metals Limited |
| 2% NSR (All Minerals) |
|
|
|
|
|
INTERNATIONAL |
|
|
|
|
Mara Rosa, Brazil |
| Amarillo Gold Corporation |
| 1% NSR (Au, Ag) |
La Coipa, Chile |
| Kinross Gold Corporation |
| 3% NSR (Au) |
Vizcachitas, Chile |
| Los Andes Copper Limited |
| 1-2% NSR (All Minerals) |
Hispaniola, Dominican Republic |
| Energold Drilling Corp. |
| 0.6% NSR (All Minerals) |
Camporo (Cacamuya), Honduras |
| First Point Minerals Corp. |
| 0.6% NSR (Au, Ag) |
Charaltyn, Kazakhstan |
| Kazakhymys PLC |
| $10.41/oz plus escalator (Au) |
Magallanes, Mexico |
| Penoles |
| 2-3% NSR (Au, Ag, Base Metals) |
Ayahuanca, Peru |
| Geoandina Exploraciones SAC |
| 1% NSR (Au) |
Choreveco, Peru |
| Minera del Norte S.A./Aruntani S.A.C. |
| 0.1-0.3% NSR (Au) |
Dorato, Peru |
| Dorato Resources Inc. |
| Option to purchase 1-2% NSR (Au) |
Nangali, Peru |
| Compass Resources/Indo Mines |
| 1.5% NSR (Au) |
NPI, Philippines |
| Nickel Asia Corporation |
| Production Payment |
Demirci, Turkey |
| Ariana Resources PLC |
| 2% NSR (Au) |
Hasandagi-Dikmen, Turkey |
| Teck/Koza Altin |
| 2% NSR (Au) |
Karadag, Turkey |
| Koza Altin |
| 2.5% NSR (Au) |
Torul, Turkey |
| Koza Altin |
| 1.5% NSR (Au) |
(1) Royalty terms have been simplified for presentation purposes. Different terms may apply to certain portions of properties or by commodity. Some royalties may have sliding scales tied to commodity price. Others may include participation in sale proceeds of property or gross sales.
Oil & Gas Assets
Franco-Nevada’s Oil & Gas Assets include producing and non-producing lands located in British Columbia, Alberta, Saskatchewan, Manitoba and the Canadian Arctic. Producing lands include Crown, freehold, unitized and non-unitized oil and natural gas production. The properties contain long-life, low-decline reserves, include interests in frontier areas (see “Arctic Gas, NWT and Nunavut”) and are operated by experienced operators, including, among others, Cenovus Energy Inc. (“Cenovus”), Apache Canada Ltd. (“Apache”) and Canadian Natural Resources Ltd. (“CNRL”).
Please see “Reserves Data and Other Oil and Gas Information” for additional information regarding Franco-Nevada’s Oil & Gas Assets presented in accordance with the requirements of NI 51-101. In addition, Oil & Gas abbreviations, conversions, information advisories and cautionary statements can be found in the “Reserves Data and Other Oil and Gas Information” section.
The following table sets forth certain financial and operating information concerning Franco-Nevada’s Oil & Gas Assets for the periods indicated.
|
| 2011 |
| 2010 |
| 2009 |
| |||
Revenue to Franco-Nevada ($000)(1) |
| $ |
|
| $ |
|
| $ |
|
|
Significant Producing Assets |
| 24,145 |
| 26,101 |
| 20,038 |
| |||
Other Producing Assets |
| 10,778 |
| 9,695 |
| 7,692 |
| |||
Total |
| $ | 34,923 |
| $ | 35,796 |
| $ | 27,730 |
|
Operating Costs ($000) |
| $ | 1,771 |
| $ | 1,476 |
| $ | 1,112 |
|
Operating Statistics |
|
|
|
|
|
|
| |||
Production (Boe/d)(2) |
| 1,850 |
| 2,131 |
| 1,925 |
| |||
Production Split Ratio (oil:gas)(3) |
| 51:49 |
| 48:52 |
| 55:45 |
| |||
Revenue Split Ratio (oil:gas) |
| 83:17 |
| 70:30 |
| 73:27 |
| |||
(1) Revenue refers only to payments made to Franco-Nevada.
(2) Net to Franco-Nevada.
(3) Natural gas volumes converted to Boe (conversion rate of six Mcf to one bbl).
Significant Producing Assets
The following describes the significant producing assets, the production from those assets net to Franco-Nevada and the proved reserves of those assets net to Franco-Nevada. The significant producing assets are the Weyburn Unit, Midale Unit and Edson Property which accounted for approximately 70% of Franco-Nevada’s Oil & Gas production revenue for the year ended December 31, 2011 and 75% of proved reserves for the year ended December 31, 2011. As of December 31, 2011 proved reserves for the significant producing assets was 4,197 MMboe using forecast costs and prices.

Weyburn Unit, Saskatchewan
The “Weyburn Unit” is located approximately 129 kilometres southeast of Regina, Saskatchewan and encompasses approximately 53,360 gross (net 824) acres in which the Mississippian Midale beds are unitized. As of December 31, 2011, Franco-Nevada held a 1.11% working interest and a 0.44% royalty interest in the Weyburn Unit. Production commenced from the Midale zone within the unitized area in 1955 under primary depletion (solution gas expansion). Formation of the Weyburn Unit occurred in 1963 for the purpose of implementing an inverted nine-spot waterflood pressure maintenance scheme on 80 acre well spacing. Cenovus is the operator.
Current gross production capability of the Weyburn Unit is approximately 30,000 Bbls/d at an average water cut of 88.5%. Current production is from 627 gross (net 9.7) wells. Produced oil within the Weyburn Unit averages 31 degrees API and contains approximately 2.2% sulphur.
For 2011, revenue received by Franco-Nevada from the Weyburn Unit was $12,314,000 and light/medium oil production net to Franco-Nevada was 400 Bbls/d. Franco-Nevada takes product-in-kind for the working interest portion of this production and markets it through a third party marketer. As of December 31, 2011, Franco-Nevada’s proved reserves for the Weyburn Unit were 2,281 Mbbls.
On February 23, 2012, Franco-Nevada purchased an additional 1.15% working interest in the Weyburn Unit. The effective date of this acquisition was January 1, 2012.
The following table sets forth the revenue and production from the Weyburn Unit for the periods indicated:
|
| 2011 |
| 2010 |
| 2009 |
| |||
Revenue to Franco-Nevada ($000)(1) |
| $ | 12,314 |
| $ | 10,368 |
| $ | 8,317 |
|
Production (Mbbl)(2) |
| 146 |
| 149 |
| 151 |
| |||
(1) Revenue refers only to payments made to Franco-Nevada.
(2) Net to the Oil & Gas Interests.
Midale Unit, Saskatchewan
The “Midale Unit” was discovered in 1953 and the Midale Unit was formed in 1964 for the purpose of implementing a pressure maintenance scheme by water injection. The Midale Unit is located in southeast
Saskatchewan approximately 40 kilometres southeast of the city of Weyburn and encompasses 13,760 gross (net 353) acres with 245 gross (net 6.8) producing wells. Franco-Nevada holds a 1.59% working interest and a 1.18% gross override royalty interest in the Midale Unit. Apache is the operator.
For 2011, revenue received by Franco-Nevada from the Midale Unit was $4,099,000 and light/medium oil production net to Franco-Nevada was 133 Boe/d. Franco-Nevada takes product-in-kind for the working interest portion of this production and markets it through a third party marketer. As of December 31, 2011, Franco-Nevada’s proved reserves for the Midale Unit were 703 Mboe.
The following table sets forth the revenue and production from the Midale Unit for the periods indicated:
|
| 2011 |
| 2010 |
| 2009 |
| |||
Revenue to Franco-Nevada ($000)(1) |
| $ | 4,099 |
| $ | 3,629 |
| $ | 3,513 |
|
Production (MBoe)(2) |
| 48 |
| 52 |
| 53 |
| |||
(1) Revenue refers only to payments made to Franco-Nevada.
(2) Net to Franco-Nevada.
Edson Property, Alberta
The “Edson Property” is located approximately 209 kilometres west of Edmonton, Alberta and encompasses over 25,920 gross (net 3,888) acres, of which 4,480 gross (net 672) acres are currently undeveloped. Franco-Nevada has a 15% overriding royalty in this property. The wells are operated by CNRL. For 2011, revenue received by Franco-Nevada from the Edson Property was $7,732,000. For the same period, the property produced approximately 3.3 MMcf/d of natural gas and 155 Bbls/d of NGLs totalling 708 Boe/d of production net to Franco-Nevada from 137 gross (net 20.5) producing gas wells mainly from the Upper Cretaceous Cardium Formation, with lesser amounts from the Viking, Gething, Cadomin and Bluesky Formations. As of December 31, 2011, Franco-Nevada’s proved reserves for the Edson Property were 1,213 Mboe.
Gas is processed at the CNRL operated Galloway, Edson West and Ansell gas plants which extract natural gas liquids. These plants have a combined processing capacity of 146 MMcf/d. The main reserves bearing formation in the Edson Property area is the Upper Cretaceous Cardium Formation. The Edson Property lies in an area of northwest southeast trending fault traces where the faults ramp up through the Cardium Formation. The faults dip to the west. The best Cardium wells, both vertical and especially horizontal, have targeted the hanging wall of the updip leading edge of Cardium sand cycles. This potentially helps the wells take advantage of the better productivity associated with narrow areas of higher fracture density induced by the higher stresses related to deformation along the leading edges of the faults.

The following table sets forth the revenue and production from the Edson Property for the periods indicated:
|
| 2011 |
| 2010 |
| 2009 |
| |||
Revenue to Franco-Nevada ($000)(1) |
| $ | 7,732 |
| $ | 12,104 |
| $ | 8,208 |
|
Production (MBoe)(2) |
| 256 |
| 360 |
| 274 |
| |||
(1) Revenue refers only to payments made to Franco-Nevada.
(2) Net to Franco-Nevada.
Other Producing Assets, Western Canada
The significant producing assets account for approximately 70% of total oil and natural gas revenues in 2011, while the other producing assets account for approximately 30% of total oil and natural gas revenues. The other producing assets are comprised of over 50 areas which include approximately 519 gross producing wells and 47 unitized oil and gas fields, and encompass a wide variety of royalty agreements and operators and are primarily located in Alberta and Saskatchewan.
The following table sets forth the revenue and production from Franco-Nevada’s other producing Oil & Gas Assets for the periods indicated:
|
| 2011 |
| 2010 |
| 2009 |
| |||
Revenue to Franco-Nevada ($000)(1) |
| $ | 10,778 |
| $ | 9,695 |
| $ | 7,692 |
|
Production (MBoe)(2) |
| 225 |
| 214 |
| 224 |
| |||
(1) Revenue refers only to payments made to Franco-Nevada.
(2) Net to Franco-Nevada.
Arctic Gas, NWT and Nunavut
Franco-Nevada has 428 Bcf of contingent dry natural gas resources, net to Franco-Nevada, in the Drake Point, Hecla, King Christian and Roche Point gas fields located on and offshore Melville Island, approximately 700 miles northeast of the Mackenzie River Delta in the Arctic Ocean. This represents working interests ranging between 3% and 15% in these natural gas resources. The stated resources are an estimate of the contingent resources, net to Franco-Nevada, as evaluated by GLJ, independent reservoir engineers, as at November 2008. Contingent resources are those quantities of oil and gas estimated, as of a given date, to be potentially recoverable from known accumulations using established technology, or technology under development, but which are not currently considered to be commercially recoverable due to one or more contingencies. Contingencies may include factors such as economic, legal, environmental, political, and regulatory matters, or a lack of markets.
The Drake Point field was discovered in 1969 by Panarctic Oils Ltd. Between 1969 and 1986 over 130 wells were drilled at a cost of greater than C$254 million. This drilling led to the discovery of the Hecla field in 1972 as well as other fields in which Franco-Nevada has an interest. Resources are located in the Jurassic Borden Island Formation and the gas zones average 100 ft in thickness. These zones have good porosity, high permeability and the gas has no associated liquids or hydrogen sulphide. Geographic remoteness has prevented their commercialization to date. Suncor has the largest ownership stake in these fields while several other companies, including Exxon Mobil Corporation and Imperial Oil Limited, own smaller stakes. Although no operating agreement is currently in place, management of Franco-Nevada believes that Suncor will be the operator of these fields when and if they are commercialized. In January 2005, the Canadian Energy Research Institute released a report it had prepared for the Department of Indian and Northern Affairs Canada entitled “The Economics of High Arctic Gas Development: Expanded Sensitivity Analysis”. This report considered four development schemes and assumed production of 1,000 MMcf/d over a 20 year production period from the Drake and Hecla fields. The four development schemes considered were Liquefied Natural Gas (“LNG”) delivery to North America’s eastern seaboard, LNG delivery to West Greenland for transhipment to carriers accessing other markets, Compressed Natural Gas delivery to a Mackenzie Corridor pipeline and Gas to Liquids delivery to North America’s eastern seaboard. The capital costs of these schemes ranged between $4.9 billion and $6.3 billion in 2005 Canadian dollars. See “Risk Factors — Risks Related to Mining Operations and Oil and Natural Gas Operations”. There is currently no infrastructure to deliver potential future production from Franco-Nevada’s Arctic natural gas assets to market and currently no plans to develop these resources.
Undeveloped Oil & Gas Interests, Western Canada
Franco-Nevada does not include in its asset tabulations undeveloped oil and gas interests without reportable resources. There are 156 agreements that cover these interests which include over 100,000 acres of undeveloped mineral title, non-producing lands within producing areas and approximately 80,000 gross (net 12,000) acres of unproved non-producing lands under lease. These undeveloped interests are located in Alberta, Saskatchewan and Manitoba.
TECHNICAL REPORTS
Goldstrike Mining and Technical Information
The information set out below is based on the Goldstrike Report dated March 16, 2012, prepared by Roscoe Postle Associates Inc. (“RPA”), an independent consulting firm, in compliance with NI 43-101. The Goldstrike Report was prepared under the supervision of and endorsed by Chester M. Moore, P.Eng., R. Dennis Bergen, P.Eng., Wayne W. Valliant, P.Geo., Stuart E. Collins, P.E. and Kathleen Ann Altman, Ph.D., P.E., “qualified persons” under NI 43-101.
Property Description and Location
The Goldstrike Mine contains both open pit and underground operations plus process plant facilities. The Betze-Post open pit is a large scale operation utilizing a traditional truck and shovel fleet. The underground mine consists of ten separate zones stretching over a length of 12,000 ft and a vertical distance from 600 ft to 1,925 ft below surface.
The Goldstrike Mine property is located within the northern Carlin Trend on the western flank of the Tuscarora Mountains in Eureka and Elko Counties, northeastern Nevada, USA, approximately 38 miles northwest of Elko and 27 miles north-northwest of the town of Carlin.
The Goldstrike Mine area is composed of approximately 10,372 acres of surface rights of which approximately 1,922 acres are public lands administered by the BLM and 8,450 acres are patented and private lands owned by Goldstrike. There are approximately 8,736 acres of mineral rights ownership/control made up of 1,962 acres of public lands and 6,774 acres of private land. These rights are owned or controlled through ownership of various forms of patents issued by the USA and by ownership of unpatented mining and millsite claims held subject to the paramount title of the USA. The figures below show the location and the extent of land ownership of the Goldstrike Mine.


The Goldstrike property has various royalty shareholders with Net Smelter Royalty (NSR) and Net Profit Interest Royalty (NPI) agreements over various parts of the property. Key royalty shareholders are Franco-Nevada Corporation and Royal Gold, Inc.
Royalty interests held by Franco-Nevada cover the majority, but not all the Goldstrike complex. Reference is made to “Gold Assets — United States — Goldstrike, Nevada” for a description of the royalty interests held by Franco-Nevada in the Goldstrike complex. These royalties cover a substantial portion, but not all, of the reserves, resources, production and/or exploration targets reported by Barrick from the Goldstrike complex. In addition to Franco-Nevada’s royalty interests, Royal Gold, Inc. holds a 0.9% NSR (gold) royalty on the SJ claims.
With respect to Environmental management considerations, Goldstrike has environmental groups and management systems to ensure that the necessary permits and licences are obtained and maintained. These groups also carry out the required monitoring and reporting.
Tailings from both the Pressure Oxidation (“POX”) and roaster operations are deposited in the North Block Tailings Disposal Facility (“NBTDF”) located immediately to the east of the roaster facility and the Meikle mine. The NBTDF operates as a zero discharge facility under a Water Pollution Control Permit with the Nevada Division of Environment Protection (NDEP). The NBTDF is expanded approximately every two years and is currently permitted through a Stage 9 expansion in 2011.
The BLM issued the Draft Environmental Impact Statement (EIS) (BLM/NV/EK/PLGI-08/22 + 1793) on August 22, 2008. Subsequently, the BLM issued an abbreviated Final EIS (BLM/NV/EK/ES-GI-09/10 + 1793) on March 27, 2009; it includes comments, responses to comments, and revisions to the Draft EIS. The approval of this EIS ensured the continuance of mining and processing for the Goldstrike operations.
The Goldstrike operation is within compliance, except for one monitor well associated with the AA Heap Leach pad. Monitoring and remediation of this situation has been addressed by the Goldstrike environmental department.
In the Goldstrike Technical Report, RPA stated that in its opinion reclamation estimates are realistic.
The figure below shows the footprint of mineralization and key infrastructure of the Goldstrike Complex.

Accessibility, Climate, Local Resources, Infrastructure and Physiography
Goldstrike is located in the Great Basin of northeastern Nevada, USA, and is accessed from Elko, Nevada, by travelling west approximately 26 miles on U.S. Interstate 80 to Carlin, Nevada, where State Route 766 provides access to the various mining operations, including Goldstrike. Access to the property is provided by access agreements with Newmont that allow for the use of various roads in the area and a right-of-way issued by the BLM. Most of these roads are paved and well maintained.
Annual temperatures range from minus 38ºF to plus 104ºF. Average annual snowfall averages 30 inches, while the annual rainfall averages 8-10 inches. The effect of climate on production is minimal. Approximately 2 shifts per year are lost due to the weather.
The mine is at an elevation of approximately 5,600 ft in the hilly terrain of the Tuscarora Mountains with elevations varying from 5,400 ft to 6,000 ft in the immediate area. Vegetation in the area is dominated by grass and shrubs.
The surface rights secured for Goldstrike are sufficient to provide the necessary space required for all mining and quarrying activities. Enough land area also exists on the property to accommodate all foreseeable processing plants, tailings impoundments, and waste disposal areas.
Goldstrike is located in a major mining region and local resources including labour, water, power, and local infrastructure for transportation of supplies are well established. The majority of the workforce lives in the nearby towns of Elko, Spring Creek, Carlin, and Battle Mountain.
The water for process and mining is delivered from dewatering production wells. The water supply is more than adequate for present and planned requirements. Active dewatering operations are required and a water management group is in place to carry out all dewatering including pumping, distribution, delivery, and disposal.
Barrick built a 115 Mega Watt natural gas-fired power plant that became operational in the fourth quarter of 2005. This allows Goldstrike the flexibility to provide power through a combination of self-generation and market purchases.
There is extensive infrastructure for the underground division. The entire infrastructure for the mine is operational and in place, and, where necessary, there are plans to improve and augment the infrastructure as required for future operations.
History and Production
The first discovery of gold in the Goldstrike property was in 1962 by Atlas Minerals. Soil samples and drilling discovered low-grade gold mineralization. In 1973 to 1974, the Nevada Syndicate (funded by Lac Minerals Ltd.) outlined shallow mineralization in the Long Lac and Winston areas. Polar Resources (“Polar”) in 1975, followed by Pancana Minerals Ltd. (“Pancana”) from 1976 to 1977, delineated the Number 9 deposit and several low grade zones within the Goldstrike intrusion to the east of the Nevada Syndicate property. From 1975 to 1977, Polar and Pancana operated a small open pit and heap leach.
In 1978, Western States Minerals Corporation (“Western States”) entered into a 50/50 joint venture with Pancana, which had consolidated the various claims and leases in the Goldstrike area. The bulk of the production was from oxidized zones, chiefly from the Long Lac, Bazza, and West Bazza deposits, plus some production from deposits within the Goldstrike intrusion. The Post deposit was discovered in 1982. Exploration continued until 1986 when a deep core hole was drilled and the Deep Post deposit was discovered.
American Barrick Resources Corporation acquired the mine and properties from Western States (50%) in December 1986 and subsequently purchased Pancana’s interest (50%) in January 1987 for a total purchase price of $62 million. A deep drilling program outlined the large, high-grade Deep Post deposit, which was subsequently found to continue onto the adjacent property owned by Newmont. Exploration drilling in 1987 to 1988 led to the discovery of a number of other deposits similar to Deep Post. These included Betze and Screamer, which, together with Deep Post, comprise the Betze-Post deposit. Other discoveries in 1987 and 1988 included the Deep Star, Rodeo, Meikle, South Meikle, and Griffin deposits.
Heap leach ore production from the Betze-Post pit continued from the time of purchase to the end of 1998. Oxide mill ore processing started in August 1988 and the autoclave portion of the mill commenced operation in early 1990. The processing of ores by the roaster began in 2000.
An asset exchange agreement with Newmont in 1999 resulted in the acquisition by Barrick of the Goldbug (the southern portion of Rodeo), West Rodeo, Barrel, and North Post deposits. These deposits were in the Newmont land corridor separating the Betze-Post and Meikle mines. The Banshee property north of the Meikle was also part of the exchange.
The following tables set out the production from the Goldstrike Open Pit Mine, the Goldstrike Underground Mine and the Goldstrike Plant Facilities for the years indicated.
Goldstrike Open Pit Mine Past Production
Year |
| Produced |
| Grade |
| Contained Gold |
|
2004 |
| 9,434 |
| 0.156 |
| 1,472 |
|
2005 |
| 9,544 |
| 0.185 |
| 1,766 |
|
2006 |
| 8,519 |
| 0.177 |
| 1,508 |
|
2007 |
| 4,647 |
| 0.157 |
| 730 |
|
2008 |
| 12,952 |
| 0.155 |
| 2,008 |
|
2009 |
| 3,990 |
| 0.188 |
| 750 |
|
2010 |
| 13,734 |
| 0.134 |
| 1,840 |
|
2011 |
| 3,064 |
| 0.097 |
| 297 |
|
Total |
| 65,883 |
| 0.157 |
| 10,370 |
|
Goldstrike Underground Mine Past Production
Year |
| Produced |
| Grade |
| Contained Gold |
|
1996 |
| 161 |
| 0.584 |
| 94 |
|
1997 |
| 775 |
| 0.837 |
| 649 |
|
1998 |
| 877 |
| 1.098 |
| 963 |
|
1999 |
| 998 |
| 1.071 |
| 1,068 |
|
2000 |
| 1,257 |
| 0.724 |
| 909 |
|
2001 |
| 1,372 |
| 0.561 |
| 770 |
|
2002 |
| 1,635 |
| 0.427 |
| 697 |
|
2003 |
| 1,631 |
| 0.383 |
| 625 |
|
2004 |
| 1,573 |
| 0.401 |
| 631 |
|
2005 |
| 1,463 |
| 0.382 |
| 559 |
|
2006 |
| 1,420 |
| 0.373 |
| 530 |
|
2007 |
| 1,300 |
| 0.354 |
| 460 |
|
2008 |
| 1,388 |
| 0.342 |
| 476 |
|
2009 |
| 1,515 |
| 0.366 |
| 458 |
|
2010 |
| 978 |
| 0.307 |
| 300 |
|
2011 |
| 1,154 |
| 0.284 |
| 327 |
|
Total |
| 19,497 |
| 0.488 |
| 9,516 |
|
Mine production at Goldstrike has varied on an annual basis with the largest annual variance in production being the open pit mining where ore production is a function of the ore availability in the pit. The large annual variance is smoothed through the use of stockpiles. The total annual gold production and the total gold mined on an annual basis are shown in the table below. The difference between the contained gold mined and the gold production is a combination of metallurgical recovery, material taken from stockpiles that existed before 2004, and other minor items such as the inclusion of the Storm site in reported Goldstrike production after the first quarter of 2010.
Goldstrike Mine — Plant Facilities Past Production
|
| Gold Mined |
| Gold Produced |
|
Year |
| (000 oz) |
| (000 oz) |
|
2004 |
| 2,103 |
| 1,943 |
|
2005 |
| 2,325 |
| 2,024 |
|
2006 |
| 2,038 |
| 1,865 |
|
2007 |
| 1,190 |
| 1,629 |
|
2008 |
| 2,484 |
| 1,706 |
|
2009 |
| 1,208 |
| 1,419 |
|
2010 |
| 2,140 |
| 1,239 |
|
2011 |
| 624 |
| 1,002 |
|
Total |
| 14,112 |
| 12,827 |
|
Note: In 2011, approximately 86,000 ounces of gold were also recovered at Goldstrike from ore originating at the nearby Storm operation.
The Goldstrike Mine operates on a general production schedule of 24 hours per day, seven days per week. Production blasts are scheduled for five days per week. In 2010, the fleet averaged a production rate of approximately 11.6 million tons per month mined. This production figure is a combination of both ore and waste tons.
Geology and Mineralization
The Goldstrike Mine is located in the eastern Great Basin (Basin and Range Province) within the northern Carlin Trend on the western flank of the Tuscarora Mountains. The Carlin Trend is an alignment of gold mines located in a northwest-southeast belt extending five miles wide and 40 miles long, which accounts for more gold production than any other mining district in the United States. The northern trends account for in excess of twenty gold mines and deposits.
Carlin deposits comprise stratabound disseminated gold mineralization hosted by Silurian-Devonian carbonate rocks that have been metamorphosed to varying extents. The deposits are hydrothermal in origin and are usually structurally controlled. The carbonate host rocks are part of an autochthonous miogeoclinal carbonate sequence exposed as tectonic windows beneath the Roberts Mountains allochthon. The allochthonous rocks are a sequence of lower Paleozoic dominantly siliciclastic eugeoclinal rocks that were displaced eastward along the Roberts Mountains Thrust over younger units during the Upper Paleozoic Antler orogeny.
The western or siliciclastic allochthonous assemblage consists of mudstone, chert, siltstone, and minor limestone and includes imbricate thrust slices of Devonian Slaven, Silurian Elder, and Ordovician Vinini formations. The eastern autochthonous assemblage of carbonate rocks consists of calcareous mudstone, siltstone and sandstone of the Rodeo Creek unit, muddy limestone of the Devonian Popovich Formation, silty limestone to massive fossiliferous limestone of the Silurian-Devonian Roberts Mountains Formation, sandy dolomite of the Ordovician Hanson Creek Formation, quartzite of the Ordovician Eureka Quartzite, and limestone, cherty limestone and dolomite of the Ordovician Pogonip Group.
Jurassic quartz diorite, as plugs, sills, and dikes, has intruded the Paleozoic sedimentary rocks. Dikes and sills of Jurassic monzonite and lamprophyre, and Tertiary dacite and rhyodacites, are mapped in the area.
Gold mineralization was emplaced approximately 39 million years ago along favorable stratigraphy and structural features such as faults and folds, and along contacts between sedimentary rocks and the Goldstrike stock. Faulting provided major conduits for mineralizing fluids and may also have produced clay alteration that can act as a mineralizing barrier. Intense fracturing around the contact zone of the Goldstrike stock caused solution collapse and brecciation of the surrounding sedimentary units. Secondary fracture permeability was generated along the crests of anticlines, creating focal points for collapse breccia and dissolution zone formation. Finally, lithology and alteration contacts act as permeability barriers to fluids causing mineralization to pond along them particularly where feeder structures intersect these contacts. Alteration is characterized by decalcification of limestone, silicification of all rock types, and clay development in structurally disturbed areas.
The gold mineralization is associated with silicification, argillization, and sulfide mineralization. In sulfide ore, the gold is intimately associated with very fine-grained pyrite and marcasite and is refractory. Over time, the pyrite oxidized, freeing the gold and making its extraction relatively easy, as in the historic Post Oxide deposit. Associated sulfide minerals include arsenopyrite, realgar, orpiment, and stibnite. Gangue minerals include quartz, calcite, and barite. Realgar and orpiment are generally low in abundance; however, these minerals are locally common in stockwork veinlets, fracture fillings and breccia matrices.
Exploration and Drilling
To date, surface geological mapping and prospecting has been completed on the property, with pit mapping ongoing. In excess of 14,000 diamond and reverse circulation (“RC”) holes have been drilled on the property to the end of 2010. Geochemical soil and rock sampling was carried out on the property in early exploration. Geophysical surveys include airborne and ground magnetometer; gravity; time domain pole-dipole induced polarization (“IP”); DC resistivity; Controlled Source Audio Magnetotellurics (“CSAMT”) and Magnetotellurics (“MT”); time domain MT/IP using a distributed assay system; electrical logging of drill holes; and downhole IP. Gold mineralization is not directly detectable by geophysical methods; however, surveys map subsurface properties that are useful in interpreting lithology, alteration, and structure as guides to gold mineralization. Aerial photographic surveys are performed every one to two years for open pit survey control.
Open Pit
The current Mineral Reserves at Goldstrike were defined by drilling from 1994 to 2005 with additional in-fill drilling from 2006 to present. Most of the drilling prior to 2003 was diamond drilling and RC drilling has been used since then. The geometry of mineralization can be highly variable, controlled by fracturing related to faulting and folding as well as by favorable stratigraphy and variations in rock chemistry, porosity, permeability, bedding habit, etc. Drilling is done at various angles to structural and stratigraphic controls so as to determine true heights and widths of mineralization. Drill sampling and geological interpretations completed prior to mining are generally effective in predicting the orientation of mineralization.
The in-pit resource area has been explored by drilling on a grid pattern of 100 ft to 175 ft. Drill hole spacing through the Betze, West Betze, and Screamer deposits is approximately 150 ft to 175 ft, and at Post and North Betze is roughly 150 ft. West Barrel is drilled at roughly 130 ft spacing or less and the pattern has been tightened to 100 ft for the North Screamer Zone.
Drilling on a regular spaced grid has under-represented tightly controlled high grade mineralization in many cases (North and South walls) and over-represented high grade mineralization in at least two cases (North Betze area and along the Dillon fault zone near the base of mineralization). Local downhole deviation has the possibility to influence the representivity of samples in deposits. Angled drill holes are used to deliberately drill opposed to the preferred direction of downhole deviation. RC drilling (6¼ in.) accounts for approximately two thirds of the drilling, with one third diamond drilling at HQ to NQ (2½ in. to 17/8 in.) core diameter. The database also contains some underground drilling collared north of the pit. The table below summarizes drill hole database statistics.
Drill Hole Database Statistic — Goldstrike Mine
Count 10,507
Sum 7,003,595 ft
Minimum Length 1 ft
Maximum Length 4,258 ft
Sub Vertical (<80o) |
| Inclined (-20o to -80o) |
| Sub-Horizontal & Uppers (>20o) |
|
8,175 |
| 1,693 |
| 639 |
|
5,135,961 ft |
| 1,575,639 ft |
| 291,995 ft |
|
73% |
| 23% |
| 4% |
|
As-planned drill hole collar locations are set out by the open pit surveyors using Trimble High Precision GPS to determine the location of every hole and to establish foresights for all angle holes. After the holes are drilled, the surveyors again pick up the as-built collars using GPS.
Downhole surveys are performed on all new exploration drill holes except for very shallow (<200 ft) vertical holes. Downhole surveys by gyro instrumentation are performed under contract by International Directional Services LLC (IDS). Most of the diamond drill holes have been surveyed downhole, whereas less than a third of RC holes are surveyed for deviation. Of the 36% of the holes in the database that are surveyed downhole, most measurements have been taken at 25 ft, 10 ft, and 40 ft intervals.
Underground
Both RC and diamond drilling are used underground at Goldstrike. Over 13,400 underground holes have been drilled up to December 31, 2011 with the majority being RC holes.
The table below summarizes the underground drilling undertaken at Goldstrike.
Underground Drilling to EOY2011
Footage
Type |
| Rodeo |
| Meikle |
| North Post |
| Banshee |
| Utility |
| Total |
|
Underground Exploration |
| 160,830 |
| 167,359 |
| 73,722 |
| 71,539 |
|
|
| 473,450 |
|
Underground |
| 671,424 |
| 1,306,300 |
| 80,866 |
| 24,910 |
| 15,855 |
| 2,099,355 |
|
Total |
| 832,254 |
| 1,473,659 |
| 154,588 |
| 96,449 |
| 15,855 |
| 2,572,805 |
|
Number of Holes
Type |
| Rodeo |
| Meikle |
| North Post |
| Banshee |
| Utility |
| Total |
|
Underground Exploration |
| 351 |
| 301 |
| 118 |
| 116 |
|
|
| 886 |
|
Underground |
| 4,005 |
| 8,007 |
| 302 |
| 81 |
| 134 |
| 12,529 |
|
Total |
| 4,356 |
| 8,308 |
| 420 |
| 197 |
| 134 |
| 13,415 |
|
The majority of the stope definition drilling is performed using RC. The holes are drilled in areas where the geology and mineralization are generally well understood and serve the purpose of better defining the ore zones prior to extraction. Drill hole lengths vary from 50 ft to 600 ft.
For programs categorized as Capital Drilling and for exploration/step-out drilling, the holes vary in length from 150 ft to more than 1,200 ft. These holes are usually pre-collared using RC and drilled as far as ground conditions will permit. The holes are then switched over to core drilling.
When drilling is complete, the collars of the exploration holes are surveyed to determine their final elevation, northing, easting, azimuth, and dip.
Drill spacing is initially done at 100 ft and 50 ft section spacing. Follow-up RC definition drilling is done on fans 25 ft apart, depending on the geologist’s specific requirements, and holes are oriented to hit the target at a spacing of 25 ft to 30 ft. Core and RC holes are logged for lithology, stratigraphy, basic structural data, recovery, degrees of alteration, and mineralization. Core is further scrutinized for detailed structural information like faults and bedding angles as well as rock mass rating (“RMR”).
In 2009, underground delineation drilling tested for expansion of the North Post deposit after completion of the 4330 drift. There was 15,300 ft of reserve conversion drilling in North Post. In 2010, reserve conversion drilling consisted of 23,005 ft in Banshee and 55,737 ft in North Post. In 2011, planned reserve conversion drilling includes 24,000 ft in North Post, 36,000 ft in Banshee and 15,000 ft below the water table (3,600 ft elevation) in the rest of the mine. Actual drilling in 2011 included reserve conversion drilling at Rodeo (23,227 ft in 129 holes), at Meikle (24,953 ft in 171 holes), and at North Post (8,994 ft in 38 holes). No reserve conversion drilling was reported at Banshee.
In the Goldstrike Technical Report, RPA stated that, in its opinion, the drilling, core handling, and logging protocols are appropriate and are being carried out to a reasonable standard.
Sampling, Analysis and Sample Security
Diamond drill core is washed and photographed prior to logging, splitting and sampling in five foot intervals. In areas where mineralization was not expected, a 20 ft sample interval may be used by sampling a chip, approximately one inch, per one foot section. These 20 ft intervals may be further subdivided into the standard five foot sample interval if warranted by assay results from the 20 ft chip samples.
Exploration geotechnical logging is carried out in mineralization and 100 ft into the hanging wall and footwall. Underground geotechnical logging is completed for the total length of the hole.
The upper portions of RC drill holes are sampled at lengths of 10 ft where there is no potential for significant mineralization. In mineralization, RC holes are sampled on five foot intervals similar to core holes. RC samples are returned through the cyclone and automated splitter and are collected by the drillers and inserted into marked bags and tagged by a plastic label with a unique barcode that includes the hole number and the sample interval.
For underground sampling where needed and accessible, chip channels are taken along the wall of the stope in five foot intervals and placed in a sample bag. The distance to the chip sample is measured from a known survey point. The samples are sent to surface where they are inventoried by the core-shed geotechnicians before being sent to the laboratory for analysis. Where there is a paucity of diamond drilling, short test holes are drilled underground using a production rig. Chips are collected and sent to the laboratory for gold analysis only. The purpose of this method is to quickly identify ore zone contacts for stope definition.
Open pit blasthole samples and underground blasthole samples are delivered by Goldstrike personnel to the Goldstrike onsite assay laboratory. Occasionally, if the site laboratory is over capacity, samples will be sent to an outside ISO 9000 registered commercial laboratory. These samples are delivered by Goldstrike personnel or are collected by laboratory employees.
In the Goldstrike Technical Report, RPA stated that in its opinion, the sampling methods and practices in the open pit and underground are appropriate and are being carried out in a reasonable fashion and that these samples are representative of the volumes included in the estimates of Mineral Resources and Mineral Reserves.
Open Pit Samples
Samples from the Betze-Post core drilling of 1991 to 1993 and exploration samples from drilling since mid-2003 have been consistently prepared and analyzed by contract assay laboratories. Sample preparation and
analysis from drilling completed at other dates has been performed both on site at the Goldstrike Mine assay laboratory and by contract. Both internal and external check assays have been performed by independent laboratories. The 2003 and later exploration drilling samples have been sent exclusively to the ALS Chemex Assay Laboratories due predominantly to manpower issues.
At the ALS Chemex Elko preparation laboratory, the Goldstrike exploration samples are dried, crushed to less than 70% minus 10 mesh, and riffle split with a 250 g subsample pulverized to greater than 85% minus 200 mesh. ALS Chemex ships the pulp samples to its Vancouver laboratory for assay or occasionally to its Reno laboratory.
Sample preparation at the Goldstrike Mine laboratory is fully automated. It uses three state-of-the-art automated preparation systems. All of the samples are oven dried prior to crushing. Samples are logged in, weighed (prior to crushing), crushed to -10 mesh, and fed to an automated pulverizing/splitting/weighing system. When the samples come out of this unit, they are at +90% passing 100 mesh and they are already weighed for analysis. The system weighs several splits of each sample, five at 15 g and one at 100 g.
At ALS Chemex, fire assay fusion is done on a 30 g aliquot (one assay ton) with an atomic adsorption spectrometry (“AAS”) finish. Samples that exceed the upper detection limits of 7 ppm for AAS are rerun using a gravimetric finish. ALS Chemex laboratories in Nevada are certified to standards within ISO 9001-2008. Internal quality assurance/quality control (QA/QC) batch duplicates showing wide variation are re-assayed using the metallic screen method to improve assay confidence for possible free gold intervals.
In addition to gold assays, all blasthole samples, and specific exploration drill hole intervals identified for process route metallurgical characteristics, are analyzed for sulfide, carbonate, total carbon by LECO furnace, as well as preg-robbing carbon assays, at the Goldstrike Mine laboratory. For RC holes drilled since 2003, Goldstrike Mine personnel have identified intervals for compositing based on gold values. ALS Chemex creates 20 ft composites for these intervals from the five foot samples. The homogenized composites are then returned to the Goldstrike Mine laboratory for analysis of metallurgical characteristics. A program of identifying intervals for process route characteristics in pre-2003 drill holes and reanalyzing archived samples was carried out in the past several years to augment the database. The results are used as ore blending criteria for processing and are 3D computer block modeled.
Drill core is stored in boxes located at the core lay-down yard. Assay pulps are saved and stored inside the core handling facility. Samples from mineralized intervals are selected for storage with the rest disposed at the mine waste dumps. Sample rejects are saved for mineralized intervals and +/-20 ft above and below the ore intervals. Rejects are kept in sealed steel barrels that are stored at the core lay-down yard.
All blasthole samples remain in Goldstrike custody and control generally from the drill rig to the mine assay laboratory. Exploration drill core and RC chip samples sent to ALS Chemex laboratories for analysis are either picked up on site by ALS Chemex personnel or transported to the ALS Chemex facility by exploration personnel.
In the Goldstrike Technical Report, RPA stated that, in its opinion, the sample preparation, security, and analytical procedures used in the open pit operations are appropriate and are being carried out in a reasonable fashion.
Underground Samples
The majority of the samples are prepared at the Goldstrike Mine assay laboratory by Goldstrike employees. Currently, the Barrick laboratory is not certified. If samples are sent to a commercial laboratory for preparation and analysis, they are directed to a laboratory that is ISO 9000 registered. Barrick has dispatched underground samples to American Assay Laboratory, and/or ALS Chemex when higher than normal volumes of samples are received on site. Most sample preparation at the Goldstrike laboratory is fully automated. Underground samples are routinely run for gold, with analysis for LECO (Sulfide sulfur, Total Carbonaceous Material, Total Carbon, Total Sulfur, CO3 and Arsenic) if time permits. Analyses are based on the specific deposit and purpose of sample.
Pulps from exploration and definition drilling are stored for six months. After this time, the pulps are discarded. Samples required from holes older than six months can be constructed from chip trays stored in numbered boxes. Both electronic and hard copy manifests of chip tray contents are maintained. Pulps from channels, mucks, and rush samples are usually discarded once the results have been approved. Underground sample rejects are routinely discarded once results have been confirmed by the Geology department. Any remaining diamond drill core is either kept on site at the core shed or shipped to the exploration lay-down yard.
Underground samples remain in Goldstrike custody and control generally from the source to the mine assay laboratory and the chain of custody is complete.
In the Goldstrike Technical Report, RPA stated that, in its opinion, the sample preparation, security, and analytical procedures used in the underground operations are appropriate and are being carried out in a reasonable fashion.
Quality Assurance and Quality Control
Goldstrike has checks in place to prevent non-compliance with sampling procedures that include daily observation of contractor RC sampling techniques by geologists and drill supervisors. Any mineralized sample that is thought to be unreliable is assigned a no confidence factor and is not utilized in estimating resources.
Ten percent of the samples from the assaying stream are submitted for QA/QC utilizing duplicates, control blanks and reference samples. At least five percent of the intervals from a hole are selected for reassay and submitted to a third party commercial laboratory. At least two percent of the samples in the sample stream are selected for screen checks to ensure that no assaying problems occur with coarse gold.
Goldstrike Assay Laboratory
One or two samples per shift of production sampling and one sample per shift of core are used in the QA/QC program. For each set of 24 samples, there is one blank, two standards, and a repeat assay. For samples that are sent to an external laboratory for QC evaluation, two standards are sent with each batch. The external laboratories for the QC program are Florin Analytical Services (Florin) and Inspectorate America Corporation (IA). Quarterly reviews are conducted comparing results from Florin, Acme, and Goldstrike assay laboratory on samples from both Meikle and Rodeo. Assay results from pulp duplicates are grouped according to broad grade ranges and the mean values of the groups are compared. A t-test for evaluation on paired sample means is conducted to confirm that there is no significant difference between them.
In the Goldstrike Technical Report, RPA stated that, in its opinion, the QA/QC practices are appropriate for the exploration and definition drilling data and are being carried out in a reasonable fashion.
Mineral Resources and Mineral Reserves Estimates
Mineral Resources
The open pit block model has been created using Mintec Inc.’s MineSight® software supplemented by custom programs derived from Geostatistical Software Library software from Stanford University. Three-dimensional solids representing fault traces and lithologic units have been created from drill hole logging, and blasthole and bench mapping information. These solids and the understanding of mineralization controls are used as reference features in guiding the generation of grade contours used in estimating the gold resource model.
The open pit Mineral Resources are presented below.
Goldstrike Open Pit Mine Mineral Resources
(as at December 31, 2011)
Category |
| Tons (000) |
| Grade (oz/st Au) |
| Contained Gold |
|
Measured |
| 886 |
| 0.032 |
| 28 |
|
Indicated |
| 3,726 |
| 0.032 |
| 119 |
|
Measured & Indicated |
| 4,612 |
| 0.032 |
| 147 |
|
Inferred |
| 565 |
| 0.055 |
| 31 |
|
1. CIM Definitions were followed for Mineral Resources.
2. Mineral Resources are estimated using a long-term gold price of $1,400 per ounce.
3. Mineral Resources are exclusive of Mineral Reserves and are contained within and below the reserve pit.
4. Mineral Resources are based on cut-off grades of 0.030 oz/st Au for roaster feed, 0.040 oz/st Au for acid POX, 0.045 oz/st Au for alkaline POX, and 0.040 oz/st Au for Thiosulphate Leach Conversion Process (“CaTs”).
5. Mineral Resources based on tonnage factor of 13.5 ft3 /st.
6. Mineral Resources that are not Mineral Reserves do not have demonstrated economic viability.
7. Totals may not add correctly due to rounding.
8. The majority, but not all of the Goldstrike Open Pit Mineral Resources are covered by the Franco-Nevada royalty
In the Goldstrike Technical Report, it is stated that RPA is not aware of any environmental, permitting, legal, title, taxation, socio-economic, marketing, political, or other relevant factors which could materially affect the open pit Mineral Resource estimates
The underground Mineral Resources are estimated using block models constrained by three-dimensional wireframe models of the mineralized bodies and underground workings. The grade is interpolated into the blocks using Inverse Distance to the Fifth Power weighting. There are four block models which encompass 18 individual mineralized zones at Goldstrike underground. The models are constructed using Maptek Vulcan 3D software, version 7.5.
The underground Mineral Resources are presented below.
Goldstrike Underground Mine Mineral Resources
(as at December 31, 2011)
Category |
| Tons (000) |
| Grade (oz/st Au) |
| Contained Gold |
|
Measured |
| 985 |
| 0.341 |
| 336 |
|
Indicated |
| 5,092 |
| 0.293 |
| 1,492 |
|
Measured & Indicated |
| 6,077 |
| 0.301 |
| 1,828 |
|
Goldstrike Underground Mine Mineral Resources
(as at December 31, 2011)
Category |
| Tons (000) |
| Grade (oz/st Au) |
| Contained Gold |
|
Inferred |
| 2,698 |
| 0.298 |
| 805 |
|
1. CIM Definitions were followed for Mineral Resources.
2. Mineral Resources are reported using a long-term gold price of US$1,400 per ounce.
3. Mineral Resources are reported at an incremental cut-off grade of 0.10 oz/st Au.
4. A minimum mining width of 15 ft was used.
5. Mineral Resources are exclusive of Mineral Reserves.
6. Mineral Resources that are not Mineral Reserves do not have demonstrated economic viability.
7. Totals may not add correctly due to rounding.
8. The Majority, but not all of the Goldstrike Underground Mine Mineral Resources are covered by the Franco-Nevada royalty.
Mineral Reserves
The Mineral Reserves are generated based upon the mine designs applied to the Mineral Resources. The design methodology uses both the cut-off grade estimation and economic assessment to design and validate the mineable reserves. In the Goldstrike Technical report, it is stated that in its opinion, RPA finds the overall Mineral Reserve estimates to be reasonable, acceptable, and compliant with NI 43-101.
Goldstrike maintains a complex system of ore and low grade stockpiles, which have been growing since the late 1980s. There are primarily three major stockpile categories: Autoclave, Roaster, and Barrick Roaster Sub Ore (“BRSO”).
The Proven Reserves located in 34 different stockpiles are estimated to be 49.8 million tons grading 0.084 oz/st Au, containing 4.2 million ounces of gold, as of December 31, 2011. In the Goldstrike Technical Report, it is stated that RPA agrees with the ore control rationale for creating the stockpiles, and the accounting methods used to track the stockpile quantities and grades.
Two separate stockpile reports are maintained, one for the roaster and the other for the autoclaves. The amount of material processed from each stockpile is tracked throughout the month. At the end of the month, the tonnage of material processed from each stockpile is adjusted to reflect the total tons processed through the roaster and/or autoclave. In a similar fashion, the contained ounces are adjusted based on the production from each plant.
The monthly stockpile reports also track the amount of material from each stockpile that is crushed and estimate the number of ounces of gold contained in the crushed material based on the average gold grade in each stockpile. At the end of the month, the tonnage of the crushed material is adjusted to match the tonnage of material processed as reported by the process department. In general, the adjustments are less than one percent.
The following tables set out the Goldstrike Open Pit and Goldstrike Underground Mine mineral reserves as at December 31, 2011.
Goldstrike Open Pit Mineral Reserves
(as at December 31, 2011)
|
| Proven Reserves |
| Probable Reserves |
| Proven and Probable Reserves |
| ||||||||||||
Process Route |
| Tons |
| Grade |
| Contained |
| Tons |
| Grade |
| Contained |
| Tons |
| Grade |
| Contained |
|
Open Pit Total |
| 9,114 |
| 0.133 |
| 1,214 |
| 38,440 |
| 0.102 |
| 3,915 |
| 47,555 |
| 0.108 |
| 5,129 |
|
Stockpiles Total |
| 49,810 |
| 0.084 |
| 4,179 |
|
|
|
|
|
|
| 49,810 |
| 0.084 |
| 4,179 |
|
Total |
| 58,924 |
| 0.092 |
| 5,393 |
| 38,440 |
| 0.102 |
| 3,915 |
| 97,325 |
| 0.096 |
| 9,308 |
|
1. CIM definitions were followed for Mineral Reserves.
2. Mineral Reserves are estimated using an average long-term gold price of US$1,200 per ounce.
3. Numbers may not add due to rounding.
4. CaTs — Thiosulphate Leach Conversion Process; BRSO — Barrick Roaster Sub Ore
5. Open pit CaTs cut-off grade is 0.045 oz/st and the open pit roaster cut-off grade is 0.035 oz/st. The majority of the ore material in stockpile was generated at higher cut-off grades because of lower gold prices.
6. The majority, but not all of the Goldstrike Betze-Post Mineral Reserves are covered by the Franco-Nevada royalty.
Goldstrike Underground Mineral Reserves
(as at December 31, 2011)
|
| Proven Reserves |
| Probable Reserves |
| Proven and Probable Reserves |
| ||||||||||||
Process Route |
| Tons |
| Grade |
| Contained |
| Tons |
| Grade |
| Contained |
| Tons |
| Grade |
| Contained |
|
U/G |
| 4,038 |
| 0.33 |
| 1,334 |
| 7,824 |
| 0.216 |
| 1,691 |
| 11,861 |
| 0.255 |
| 3,026 |
|
Stockpiles |
| 33 |
| 0.293 |
| 10 |
|
|
|
|
|
|
| 33 |
| 0.293 |
| 10 |
|
Total |
| 4,070 |
| 0.33 |
| 1,344 |
| 7,824 |
| 0.216 |
| 1,691 |
| 11,894 |
| 0.255 |
| 3,035 |
|
1. CIM definitions were followed for Mineral Reserves.
2. Mineral Reserves are estimated at $1,200/oz Au.
3. Numbers may not add due to rounding.
4. Underground cut-off grades are between 0.134 oz/st Au and 0.155 oz/st Au.
5. The majority, but not all of the Goldstrike Underground Mineral Reserves are covered by the Franco-Nevada royalty
The process recovery for the roaster ranged between 84% and 90% and the autoclave recovery was between 67% and 86%.
In the Goldstrike Technical Report it is stated that RPA has completed an analysis of historical data and confirmed that the recovery estimates are reasonable.
Mining Operations
Mining and Processing
Barrick’s Betze-Post open pit has seven remaining phases, with the ultimate pit to measure approximately two miles east to west, 1.5 miles north to south, and have an average depth of approximately 1,300 ft. The Bazza Waste Dump is located to the southwest of the open pit. The life of mine plan includes the addition of the Clydesdale Dump to the west and backfilling of the southeast portion of the open pit. Internal to the pit are the Betze Portal, which connects to the Rodeo underground mine, and previously the Post Portal, which connected to Newmont’s Deep Post underground mine but has since been backfilled.
Ultimate pit limits were determined by generating Whittle pit shells based on the net cash generated and the pit slopes recommended by Piteau Associates Engineering Ltd. Haul ramps were designed to be 120 ft wide, including the safety berm for double lane traffic accommodating the 330 ton class haul trucks, and have a maximum grade of 10%. Mining thickness is 40 ft in waste and 20 ft in ore to help minimize dilution. In ore, double and triple benching is utilized creating 40 ft and 60 ft faces between catch benches.
Barrick optimizes mining by using a multi-phased approach which maximizes stripping rates to keep an ore producing face always available. This multi-phase technique consists of a primary ore layback, a primary stripping layback, and a secondary stripping layback. Historically, this approach was put in place to maintain a
consistent mill feed, and keep mine production in the range of 14 to 15 benches per layback per year. There are approximately 135 million tons per year mined.
The poor rock conditions are the key factor in the underground mine design and mining method selection. This has led to two mining methods both of which rely on cemented backfill for support. Where long hole stoping is used, the wall and back exposure is reduced by taking short long hole sections and filling before taking the next section. The underhand drift and fill stoping provides a backfill roof for subsequent lifts in the mining cycle. In the 2012 forecast, 79% of the ore is planned to come from long hole stoping. The proportion of ore to be obtained by long hole stoping drops every year in the current life of mine plan, with an average of 48% of the production from long hole stoping in the complete life of mine plan.
Transverse long hole stoping is used where the mineralized zone has a significant width. Footwall drifts are driven parallel to the strike of the ore to provide access for stoping. Mining with transverse stopes requires a primary, secondary, and sometimes tertiary extraction to completely mine out the area. Longitudinal stopes are utilized in areas of the mine with adequate ground conditions to support a stope rib greater than 15 ft in height but do not have mineralized widths greater than 25 ft. The stopes are accessed from a footwall drive and then driven parallel to the strike of ore. Each section is mined and filled before the next section is mined. If ground conditions are poor, the long hole stope section length can be reduced.
The underhand drift and fill method is utilized in areas of fair to poor ground conditions regardless of the width of the zone. The underhand drifts are nominally designed as 15 ft wide by 15 ft high. The minimum width is 15 ft. The primary drift is driven with increased ground support to hold the ground open, then backfilled with a high strength cemented rock fill (“CRF”). Where the ore width exceeds the nominal drift width, subsequent drifts are developed (parallel or at oblique angles to the primary drift) and then backfilled. This process continues until the entire ore shape at a given elevation has been excavated and filled. Successive lifts are taken beneath the primary workings, utilizing the backfill as an engineered back.
There are two ore processing facilities at Goldstrike. They are:
· The autoclave POX circuit; and
· The roaster circuit.
Depending on various factors, including gold content, carbonate content, carbonaceous carbon reactivity, and sulfide sulfur content, the Betze-Post open pit ore is dispatched to various stockpiles located at either the POX area or the roaster area. Planned distribution of ore from the stockpiles is an extensive exercise which is carried out monthly by the strategic planning department to maintain optimal operations designed to maximize gold recovery. All of the underground ore is processed in the roaster.
Production Schedule
The 2012 open pit life of mine plan is summarised in the table below.
Goldstrike Open Pit Life of Mine Production Summary
Year |
| Ore Tons |
| Grade |
| Contained |
| Waste |
| Total |
| Strip |
|
2012 |
| 11,306 |
| 0.104 |
| 1,179,485 |
| 106,500 |
| 117,806 |
| 9.42 |
|
2013 |
| 6,152 |
| 0.103 |
| 634,101 |
| 106,870 |
| 113,022 |
| 17.37 |
|
2014 |
| 6,702 |
| 0.123 |
| 825,272 |
| 59,366 |
| 66,069 |
| 8.86 |
|
2015 |
| 5,952 |
| 0.104 |
| 618,120 |
| 28,566 |
| 34,518 |
| 4.80 |
|
2016 |
| 4,071 |
| 0.118 |
| 480,098 |
| 32,839 |
| 36,910 |
| 8.07 |
|
2017 |
| 4 |
| 0.040 |
| 168 |
| 99,327 |
| 99,331 |
| 23,833 |
|
2018 |
| 2,887 |
| 0.107 |
| 310,218 |
| 95,369 |
| 98,256 |
| 33.03 |
|
2019 |
| 4,069 |
| 0.085 |
| 344,739 |
| 29,414 |
| 33,483 |
| 7.23 |
|
2020 |
| 4,893 |
| 0.120 |
| 585,213 |
| 6,767 |
| 11,660 |
| 1.38 |
|
2021 |
| 0 |
| — |
| — |
| — |
| — |
| — |
|
2022 |
| 0 |
| — |
| — |
| — |
| — |
| — |
|
2023 |
| 4 |
| 0.035 |
| 130 |
| 14,316 |
| 14,320 |
| 3,865 |
|
2024 |
| 90 |
| 0.103 |
| 9,237 |
| 14,232 |
| 14,322 |
| 158 |
|
2025 |
| 1,383 |
| 0.110 |
| 152,349 |
| 4,630 |
| 6,013 |
| 3.35 |
|
Totals |
| 47,514 |
| 0.108 |
| 5,139,129 |
| 598,196 |
| 645,710 |
| 12.59 |
|
For the Goldstrike Technical Report, RPA compiled a life of mine plan for the Goldstrike underground based solely upon the Proven and Probable Mineral Reserve estimate and that plan is shown in the table below.
Goldstrike Underground Mine Production Schedule — Reserves Only
Year |
| Produced |
| Grade |
| Contained Gold |
|
2012 |
| 1,500 |
| 0.28 |
| 420 |
|
2013 |
| 1,500 |
| 0.29 |
| 435 |
|
2014 |
| 1,500 |
| 0.28 |
| 420 |
|
2015 |
| 1,500 |
| 0.27 |
| 405 |
|
2016 |
| 1,500 |
| 0.24 |
| 360 |
|
2017 |
| 1,300 |
| 0.23 |
| 299 |
|
2018 |
| 1,300 |
| 0.23 |
| 299 |
|
2019 |
| 1,100 |
| 0.22 |
| 242 |
|
2020 |
| 694 |
| 0.22 |
| 155 |
|
Total |
| 11,894 |
| 0.255 |
| 3,035 |
|
RPA is of the opinion that the life of the underground mine will be extended beyond that shown in the table above through the conversion of Mineral Resources to Mineral Reserves and the direct mining of Mineral Resources as they are encountered over the course of development and mining.
Market & Contracts
Gold is the principal commodity at Goldstrike and is freely traded, at prices that are widely known, so that prospects for sale of any production are virtually assured. Prices are usually quoted in US dollars per troy ounce.
Goldstrike is a large modern operation and Barrick is a major international firm with policies and procedures for the letting of contracts. The contracts for smelting and refining are normal contracts for a large producer.
There are numerous contracts at the mine including a mine development contract to provide services to augment Company efforts.
Environmental Studies, Permitting & Social or Community Impact
The Goldstrike operations consist of operating open pit and underground mines plus process plant facilities. Management systems are in place to ensure that the necessary permits and licences are obtained and maintained.
Tailings from both the POX and roaster operations are deposited in the NBTDF located immediately to the east of the roaster facility and the Meikle mine. The NBTDF operates as a zero discharge facility under a Water Pollution Control Permit with the NDEP.
The NBTDF is expanded approximately every two years and is currently permitted through a Stage 9 expansion in 2011. Stage 9 will raise the dam height to 400 ft using rock fill and will provide for additional capacity to 200 million tons of tailings. The NBTDF is lined with a composite liner system consisting of low permeability soil overlain by a geo-synthetic liner. The facility includes a basin underdrain under a portion of the tailings as well as finger drains to promote consolidation of tailings. Tailings supernatant water currently flows from northeast to southwest and water is reclaimed for reuse in the process. The closure plan includes draining the facility with a closure spillway constructed at the southwest corner. Goldstrike has applied to the NDEP to reconfigure the NBTDF to have water flow in the reverse direction with a closure spillway located at the northeast corner on
original ground due to concerns over the structural stability of a closure spillway located on the placed material. This will allow for improved dam stability during operations as well.
The BLM issued the Draft Environmental Impact Statement (EIS) (BLM/NV/EK/PLGI- 08/22 + 1793) on August 22, 2008. Subsequently, the BLM issued an abbreviated Final EIS (BLM/NV/EK/ES-GI-09/10 + 1793) on March 27, 2009; it includes comments, responses to comments, and revisions to the Draft EIS. The approval of this EIS ensured the continuance of mining and processing for the Goldstrike operations.
Total permitted surface disturbance for the Goldstrike Mine has been estimated to be 8,547 acres, or 13.36 square miles (Table 20-2). There is, however, less than one square mile of disturbance on BLM public land, which reduces the amount of time and money that will be needed to reclaim the land after the operation is terminated.
Capital and Operating Cost Estimates
Current life of mine capital costs for the Project are estimated to be $1.793 billion. The major capital cost for the open pit will be the capitalized waste stripping, which is estimated to be $360 million. Expansion of the process facilities is estimated to be $264 million, which consist primarily of replacement capital. Underground mine development is projected to be $122 million.
The total open pit operating cost has been estimated by RPA in the Goldstrike Technical report to be approximately $667 million over the remaining mine life. Over the same time period, the average operating cost per ton is estimated to $1.59 per ton mined, and a projected open pit mining cash cost is estimated to be $91 per ounce of the total gold ounces produced from the Goldstrike open pit and stockpiles.
The total operating costs for the processing and General & Administration departments were estimated to be $4.34 billion and $775 million, respectively. A total of 38.6 million short tons of ore supplied by other Barrick projects and contract ore is planned to be milled by the Goldstrike Project. Goldstrike also acts as the principal mine administration facility for Barrick’s northern Nevada exploration and production projects.
The production costs may include minor amounts of production from areas within the Goldstrike Properties, which are not attributable to the Franco-Nevada Goldstrike properties royalty.
Palmarejo Mining and Technical Information
The information set out below is based on the Palmarejo Report dated January 1, 2012, prepared for Franco-Nevada in compliance with NI 43-101. The Palmarejo Report was prepared by or under the supervision of Mr. Donald J. Birak, Senior Vice President Exploration, Coeur and Mr. Keith Blair, Manager, Applied Geoscience LLC, each a “qualified person” under NI 43-101.
Property Description and Location
The Palmarejo District is located about 420 kilometres (“km”) by road southwest of the city of Chihuahua in the state of Chihuahua in northern Mexico and on the western edge of the Sierra Madre Occidental in the Temoris mining district. The Guadalupe deposit is located about 7km southeast of the Palmarejo mine as shown in the Figure. The La Patria deposit is located southwest of Guadalupe.
The Palmarejo project consists of mining concessions covering approximately 12,253 hectares (“ha”) and include the Palmarejo, Guadalupe and La Patria gold and silver deposits. Coeur Mexicana S.A. de C.V. (“Coeur Mexicana”), a subsidiary of Coeur and formerly Planet Gold S.A. de C.V. (“Planet Gold”), owns a 100% interest in 32 mining concessions covering 12,204.1ha, a 50% interest in one concession covering 43.77ha and a 60% interest in two concessions totalling 5 additional
hectares. The Guadalupe project area is located entirely within this area of mining concessions and is contained within the San Carlos concession which consists of 160ha and is 100% owned by Coeur Mexicana. The mining concessions wholly and partially owned by Coeur currently expire on various dates between 2029 and 2055.
Permits have been granted authorizing mining within the area depicted in the Environmental Impact Assessment (“EIA”) and necessary permits and authorizations required for construction and operation of the Palmarejo mine have been obtained. Guadalupe is fully permitted for land disturbance related to open pit and underground mine activities and related disturbance. This project received its authorization for environmental disturbance on September 24, 2010, and its initial authorization for change of soil use on November 26, 2010. A right of way agreement for the construction of the Guadalupe-Palmarejo haul corridor was signed with the Guazapares ejido on February 27 2011. Environmental disturbance and change of soil use authorizations were awarded by SEMARNAT on May 30, 2011 and July 11, 2011 respectively. Additional approvals will be required for the final sections of the revised roadway which are fully anticipated to be granted within the first half of 2012.
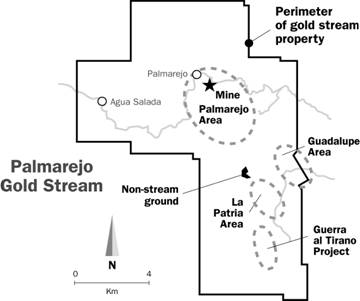
Franco-Nevada holds an interest in 50% of the gold produced from the Palmarejo project (the “Palmarejo Stream”). The Palmarejo Stream agreement provides for a minimum obligation to be paid in monthly payments over a total of 400,000 oz of gold. Each monthly payment is an amount equal to the greater of the minimum of 4,167 oz of gold and 50% of actual gold production per month multiplied by the excess of the monthly average market price of gold above $400/oz (which $400 floor is subject to a 1% annual inflation compounding adjustment beginning on January 21, 2013). After payments have been made on a total of 400,000oz of gold, the obligation is payable in the amount of 50% of actual gold production per month multiplied by the excess of the monthly average market price of gold above $400/oz, adjusted as described above.
The Palmarejo Stream applies to the majority of the Palmarejo project and includes the Palmarejo, Guadalupe and La Patria deposits.
Coeur Mexicana has executed agreements with the Palmarejo, Agua Salada, and Guazapares ejidos (or surface-owner councils) covering surface activities involved with the exploration, exploitation, and processing of mineral deposits, the construction of all necessary mining and processing facilities, and the undertaking of mining operations, in return for annual rental payments. The agreements are effective for 15 years with an option for Coeur Mexicana to extend the terms for an additional 15 years.
These agreements have already been registered with the Mexican Agrarian National Registry, and there are no known title concerns that would affect the development or operation of the mine.
In October 2008, Planet Gold entered into an agreement with the Guazaparez ejido for land use in the Guadalupe/Los Bancos area. In 2009, a mining agreement with the Guazapares ejido was finalized, assuring Coeur Mexicana the surface and land rights sufficient for the planned mining activities at Guadalupe. This mining agreement has a six year term and is renewable. Coeur Mexicana has also obtained complete control of part of the rented area by paying compensation to some land-holding ejidatarios.
On August 16, 2010, Coeur Mexicana signed with the Guerra al Tirano ejido a 4 year exploration agreement on 69.7 hectares covering the La Patria deposit.
In October 2011, Coeur Mexicana acquired the Guerra al Tirano Project from Azteca de Oro y Plata. The agreement transferred 100% of the mining rights in exchange for a cash payment of $1,200,000 on signing plus a 2% NSR royalty. Coeur Mexicana can acquire up to 1.5% of the NSR royalty at a fixed price of $750,000. The acquisition also included a separate agreement in which Azteca de Ora y Plata transferred to Coeur Mexicana an agreement with the ejido originally executed in 2007 for the use of the surface land with the Guerra al Tirano ejido for an annual rent payable to the ejido. There is no expiration date.
The EIA was approved on May 23, 2006. The EIA has a term of 13 years and can be extended by application to the Ministry of Environment and Natural Resources (“SEMARNAT”). The required authorizations from SEMARNAT have also been obtained for Change in Land Use and the Environmental Authorization. The Environmental Authorization for the Palmarejo project requires a restoration program for mining areas that will recover the soil for landscape restitution and restore ecosystem conditions that allow for the area to be inhabitable again for vegetation and animal species that previously lived there. Coeur conducts an annual review of its potential reclamation responsibilities. The year end 2011 preliminary assessment for the life of mine disturbance for final reclamation at the Palmarejo mine is estimated to be $17.8 million and for
Guadalupe is estimated to be $2.6 million. No additional bonds are required to be put in place for implementation of these requirements by the Mexican authorities.
Coeur has adopted a Corporate Environmental Policy, which underpins its commitment to protecting the environment and will adhere to the broad reclamation requirements presented in the SEMARNAT Environmental Authorization and NOM-141-SEMARNAT-2003 (which deals with tailings matters) in developing and implementing the necessary reclamation objectives. Coeur is not aware of any existing environmental liabilities to which the Palmarejo project is subject, other than as stated above.
All mineral and surface rights required to operate the Palmarejo mine have been secured and include rights to property that encompass all Mineral Resources and Reserves and all present and planned mine workings and related facilities, including mine workings, tailings storage facility, water impoundments, mined rock storage facilities, ore processing and tailings storage facilities, and ancillary site facilities for the Palmarejo mine site within the area depicted in the figure above.
Accessibility, Climate, Local Resources, Infrastructure and Physiography
Palmarejo and Guadalupe are about 1,150m and 1,300m above sea level, respectively. The area is hilly to mountainous with densely vegetated, steep-sided slopes with local stands of cacti. Local ranchers and farmers graze cattle and grow corn and other vegetables on small-scale plots.
The climate of the area is moderate and has little impact on operations. Average maximum temperature is about 34°C, and average minimum temperature is about 5°C. Rainfall occurs mainly in the summer months, with an average annual precipitation of about 800mm. The climate imposes no significant impediments to work and operations can be conducted year round.
The Palmarejo District has moderately well developed infrastructure and a local work force familiar with mining operations. Chinipas and Temoris are the two nearest towns, both with an estimated population of approximately 1,600 inhabitants. The small village of Palmarejo lies immediately northwest of the Palmarejo District area and has a population of about 430. Many of the workers are employees at the mine and live in these three, nearby communities.
Access to Palmarejo from Chihuahua is via paved highways to the town of San Rafael. From San Rafael travel is by gravel road to Temoris, and finally to Palmarejo. The Chihuahua-Pacifico railway passes through Temoris and access from the rail station at the town of Temoris to Palmarejo is along 45km of gravel road.Light aircraft airstrips are located in both Temoris and Chinipas, and in 2011 an airstrip was built in Palmarejo to service the mine.
The figure below shows the location of the key deposits, Mineral Reserves and Mineral Resources within the Palmarejo Mine property.
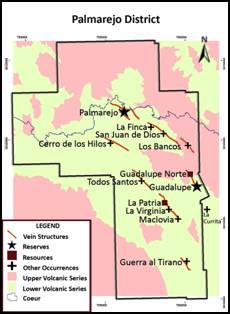
The Palmarejo Mine site was serviced with a 33,000-volt power line supplied by the Comisión Federal Electricidad (“CFE”), the Mexican federal power authority. An additional 115-kV high voltage line was constructed from the Divisadero substation to the Palmarejo Mine site during 2009, and the Palmarejo mine, plant and all other electrical load is now connected to this grid. The same 115-kV high voltage line is within 7 kilometers of the Guadalupe project and excess capacity exists on this line to supply the estimated 2.5 MW of power needed for Guadalupe.
Water for the Palmarejo mine is obtained from a variety of sources. As of 2011 the primary water for milling is recycled from the tailings dam and from the Fresh Water Diversion Dam (“FWDD”). When needed, additional make-up water, is either pumped from the Chinipas river infiltration gallery, from a shallow water well located in Agua Salada, or from the FWDD and piped to site via a 17 km pipeline. Water for domestic use is also obtained from the FWDD and hauled to the camps by truck load (10,000 L tanks on flatbed trucks) Water from the FWDD is also pumped to the underground mine for drilling and dust suppression, or to the plant for make-up water.
Fresh water for the Guadalupe Mine is planned to come from a combination of sources which includes surface water in nearby arroyos and the FWDD. Water will also be collected in sumps constructed in the underground mines and clarified for recycling in the underground system.
Waste rock from the open pit mine is placed beyond the edges of the open pit boundary, with provision to backfill mined out areas of the pit in future years.
Tailings are deposited in an impoundment near the process plant. The first phase of the Palmarejo Final Tailings Dam (“FTD”) was completed in 2010 to the 790 meter elevation and started accepting tailings since the fourth quarter of 2010. The second phase of the Final Tailings Dam was completed in August of 2011 to the 800 meter elevation. Currently, the engineering department is working on the third phase that will go to the 810 meter elevation and is expected to be completed by May of 2012. The FTD crest will be continued to be built up over a three year period to the final design crest elevation 825 meters above sea level in 2014. The construction of the Environmental Control Dam (“ECD”) which is directly below the FTD and the construction of the FWDD were completed in 2009 and are currently in use.
History and Production
The Palmarejo District area lies within the Temoris Mining District. Silver and gold production from the district, though poorly documented, has a long, intermittent history dating from Spanish colonial exploitation in the 1620s. Small-scale local miners subsequently developed many small adits and superficial workings along the district’s main mineralized structural trends.
The Palmarejo mine was purchased by the British company Palmarejo Mining Co. in 1886 (subsequently re-named Palmarejo and Mexican GoldFields, Ltd.) (“PMG”). PMG operated the Palmarejo mine through 1910. Production was resumed by Minas Huruapa, S.A. de C.V. during the period from 1979 to 1992 and high-grade gold-silver shoots were being mined intermittently by local miners until quite recently. On December 21, 2007, Coeur acquired all of the outstanding shares of Bolnisi Gold NL (“BSG”), an Australian company listed on the Australian Stock Exchange, and Palmarejo Silver and Gold Corporation (“PJO”), a Canadian company listed on the TSX Venture Exchange. The principal asset of BSG was its ownership of 72.8% of the outstanding common shares of PJO. PJO, through its operating company Planet Gold, was engaged in the exploration and development of silver and gold properties located in Mexico. Among those was the Palmarejo project.
Open pit mining operations began in 2008 and milling operations and metal recovery commenced in 2009, ramping up to full capacity in 2010. Production from open pit and underground sources since operations commenced in 2008 at Palmarejo is summarized below.
Total Palmarejo Ore Production 2008-2011
Production |
| 2011 |
| 2010 |
| 2009 |
| 2008 |
|
Ore Tonnes Milled |
| 1,563,156 |
| 1,665,082 |
| 966,629 |
| — |
|
Ore grade Ag (g/t) |
| 235.5 |
| 157.6 |
| 147.9 |
| — |
|
Ore grade Au (g/t) |
| 2.70 |
| 2.10 |
| 2.00 |
| — |
|
Recovery Ag (%) |
| 76.4 |
| 69.8 |
| 66.3 |
| — |
|
Recovery Au (%) |
| 92.2 |
| 91.1 |
| 88.2 |
| — |
|
Silver produced (oz.) |
| 9,041,488 |
| 5,887,576 |
| 3,047,843 |
| — |
|
Gold produced (oz.) |
| 125,071 |
| 102,440 |
| 54,740 |
| — |
|
Geology and Mineralization
The Palmarejo District lies near the western edge of the Sierra Madre Occidental. Basement rocks in the Sierra Madre Occidental are obscured by Cenozoic-aged volcanic flows, tuffs, and related intrusions but are inferred to include Proterozoic basement rocks, overlying Paleozoic shelf and eugeosynclinal sedimentary rocks, possibly scattered Triassic-Jurassic clastic rocks, and Mesozoic intrusions.
A gold-silver metallogenic province that hosts low-sulfidation epithermal polymetallic gold silver deposits lies along the western margin of the Sierra Madre Occidental; this province appears to exhibit a regional zonation of silver-rich deposits to the west and gold-rich deposits to the east. Palmarejo, a silver-rich deposit, lies in the western part of this province.
The Palmarejo area ore bodies are hosted in northwest striking and west dipping structures that cut through a volcano-sedimentary sequence of re-sedimented volcaniclastic, coherent and pyroclastic deposits. The volcaniclastic rocks include ash-rich mudstones and sandstones. The coherent rocks include microcrystalline massive basalt, fine grained massive andesite and plagioclase crystal rich massive andesite. The pyroclastic unit includes tuffaceous sandstone, lapillistone tuff and breccias.
At the Palmarejo mine, gold-silver veins and vein/breccias occur within, and at the intersection of, the west-northwest-striking “La Prieta” structure and the north-northwest-striking “La Blanca” structure.
The La Prieta structure extends for at least 2km, has a variable strike that averages about 115°, and dips to the southwest at 35° to 85°. The La Blanca structure strikes about 160°, has an average dip of about 50° to the southwest, and is thought to be a listric normal fault that parallels the trend of the regional faults in the Sierra Madre Occidental.
Steeply plunging, high-grade clavos have been identified in each of the vein structures. Drilling by Planet Gold along the La Prieta vein structure has tested approximately 3.5km of strike length and has penetrated the structure over an elevation range of about 900 to 1,250m. Approximately 2.5km of strike length of the La Blanca vein has been tested, through an elevation range of about 750 to 1,250m.
The Guadalupe project is located along a northeast-plunging structure which can be traced for approximately 3,000m along strike and has an average dip of approximately 55° to the northeast.
The Guadalupe zone, which includes the Guadalupe Norte, Guadalupe, El Salto and Las Animas prospects, comprises silver and gold-bearing quartz-carbonate veins hosted in a volcanic-sedimentary package that is intruded by shallow andesitic porphyries and a felsic dome complex.
Old mines and prospects occur over a 4km strike length of the Guadalupe structure. The silver-gold mineralization at Guadalupe occurs predominantly within northwest-trending quartz-carbonate breccia veins enveloped by variably developed quartz hydrothermal breccias and quartz-stockwork zones.
Prospects at the La Patria zone include the La Patria, La Virginia and Maclovia prospects and are located within the northwest-trending La Patria-Todos Santos structure that can be traced for over 4,000m along strike. Prospects at the La Patria zone have a combined strike length of 1,800m and the mineralization is hosted in a quartz-vein breccia unit with enriched proximal dense stockwork. Typically the structures are characterized by intensely silicified and brecciated colloform banded quartz veins hosted in silicified andesite.
Exploration and Drilling
As of December 2007, Planet Gold had completed 180 trenches, for a total of 3,960m, and 1,135 drillholes, for a total of 246,830.9m, within the Palmarejo-Trogan property. A total of 1,429 samples were collected from the trenches, and 800m of underground channel sampling was completed (365 samples). Drilling includes 27 geotechnical holes (494m) drilled at Palmarejo.
Planet Gold collected almost 2,200 shortwave infrared (“SWIR”) spectral measurements from drill samples from holes on a series of sections across the La Blanca and La Prieta structures using an ASD Terraspec
instrument. An additional 500 SWIR spectra were measured as part of a regional alteration-mapping program on the Trogan project.
Four hundred forty drill samples from Guadalupe were analyzed for a 50-element suite by combination inductively coupled plasma mass spectrometry (“ICP-MS”) and inductively coupled plasma atomic emission spectrometry (“ICP-AES”). One hundred and eighty-six Palmarejo drill samples and 282 trench-sample pulps were analyzed for a 50-element suite by combination ICP-MS and ICP-AES. A further 440 drill samples from Guadalupe were similarly analyzed.
Coeur has continued to conduct exploration drilling and sampling at the Palmarejo property in conjunction with daily operations as detailed in the table below:
Coeur Drilling and Sampling 2008 to 2011
|
|
|
| Channel Sampling |
| RC Drilling |
| Core Drilling |
| ||||||
Year |
| Location |
| Number |
| Meters |
| Number |
| Meters |
| Number |
| Meters |
|
|
|
|
|
|
|
|
|
|
|
|
|
|
|
|
|
2008 |
| Palmarejo Mine |
| 51 |
| 1,473 |
| 137 |
| 2,632 |
| 50 |
| 5,298 |
|
|
| Guadalupe |
|
|
|
|
|
|
|
|
| 53 |
| 19,409 |
|
|
|
|
|
|
|
|
|
|
|
|
|
|
|
|
|
2009 |
| Palmarejo Mine |
| 710 |
| 9,310 |
| 1,887 |
| 35,274 |
| 136 |
| 18,208 |
|
|
| Guadalupe |
|
|
|
|
|
|
|
|
| 54 |
| 16,932 |
|
|
| Other Areas |
|
|
|
|
|
|
|
|
| 32 |
| 8,583 |
|
|
|
|
|
|
|
|
|
|
|
|
|
|
|
|
|
2010 |
| Palmarejo Mine |
| 285 |
| 3,402 |
| 2,004 |
| 36,463 |
| 185 |
| 33,495 |
|
|
| Guadalupe |
|
|
|
|
|
|
|
|
| 61 |
| 20,620 |
|
|
| Other Areas |
|
|
|
|
|
|
|
|
| 19 |
| 4,220 |
|
|
|
|
|
|
|
|
|
|
|
|
|
|
|
|
|
2011 |
| Palmarejo Mine |
| 158 |
| 2,053 |
| 1,486 |
| 31,449 |
| 182 |
| 43,305 |
|
|
| Guadalupe |
|
|
|
|
|
|
|
|
| 55 |
| 20,891 |
|
|
| La Patria* |
| 76 |
| 3,329 |
|
|
|
|
| 65 |
| 13,040 |
|
|
| Other Areas |
|
|
|
|
|
|
|
|
| 12 |
| 3,396 |
|
“Other Areas” were exploration targets drilled in each year
*Channel samples at La Patria were exploration trenches. All other channel sampling was conducted underground.
Reverse Circulation (“RC”) conducted for grade control, verification of short-range mine plans, and some condemnation and in-fill drilling.
Coeur has also relied on the drilling, interpretations, and results conducted by other experts. The authors of the Palmarejo Report state that they have reviewed this information and believe that the methods employed by these experts are sound and that the results and interpretations are accurate and within industry standards.
Palmarejo Drill Data
Planet Gold undertook drilling continuously at Palmarejo from November 2003 until September 2007, which has been continued by Coeur, through Coeur Mexicana. The only drilling known by Coeur to have been completed at Palmarejo prior to Planet Gold, consists of five holes drilled underground by PMG in the early 1900s. Beyond their reported existence, no further documentation of the holes is known to Coeur.
Drilling conducted by Planet Gold through to September 2007 is shown in the table below.
Palmarejo Drilling Summary-Planet Gold
|
| RC |
| Core |
| RC Precollared |
| Total Drill |
|
|
| ||||||
Year |
| No. |
| Meters |
| No. |
| Meters |
| No. |
| Meters |
| holes |
| Total (m) |
|
2003-2007 |
| 545 |
| 92,689 |
| 117 |
| 25,549 |
| 88 |
| 11,089 |
| 750 |
| 129,327 |
|
Guadalupe Drill Data
Planet Gold initiated drilling at Guadalupe in early 2005 and drilling through to early 2007 is shown in the table below.
Guadalupe Drilling Summary-Planet Gold
|
|
|
| RC |
| Core |
|
|
|
|
| ||||
Company |
| Year |
| No. |
| Meters |
| No. |
| Meters |
| Total Drill holes |
| Total (m) |
|
Planet Gold |
| 2005-2007 |
| 96 |
| 21,349 |
| 139 | * | 46,489 |
| 229 |
| 67,838 |
|
*Includes 4 core continuations of RC holes & 2 core (wedge) continuations of core holes.
La Patria Drill Data
Planet Gold drilling at La Patria is shown in the table below:
Planet Gold Drilling at La Patria, 2005-2007
|
|
|
| RC |
| Core |
|
|
|
|
| ||||
Company |
| Year |
| No. |
| Meters |
| No. |
| Meters |
| Total Drill holes |
| Total (m) |
|
Planet Gold |
| 2005-2007 |
| 79 |
| 14,014 |
| 42 |
| 11,852 |
| 121 |
| 25,866 |
|
Coeur Mexicana has relied on the drilling, interpretations, and results conducted by other experts (including AMEC Mining and Metals (“AMEC”) and Mine Development Associates (“MDA”)). Coeur’s Qualified Persons have reviewed this information and believe that the methods employed are sound and that the results and interpretations are accurate and within industry standards.
Drilling Procedures
Drilling contractors, Layne de Mexico S.A. de C.V., Major Drilling S.A. de C.V., Perforaciones Godbe de Mexico S.A. de C.V. and Landdrill International Mexico performed drilling at Palmarejo using several different drill rigs. The core holes that were collared at the surface generally recovered HQ (63.5mm) or PQ (85mm) diameter size core whilst the core tails recovered NQ or HQ diameter size core. Drilling is currently carried out by G4 Forage Drilling.
To define and expand Mineral Resources at Palmarejo, drilling, done by the exploration and mine geology groups of Coeur Mexicana, has been conducted annually between 2008 and 2011. Coeur Mexicana Operations has also continued channel sampling at Palmarejo between 2008 and 2011 in conjunction with daily operations. RC drilling is conducted as part of the open pit ore control program and condemnation drilling.
Diamond-core holes were logged for geotechnical data and geology, including rock type, alteration, mineralization assemblages, vein-quartz percentage, and oxidation. Graphic logs were also created for stratigraphy, vein orientation, and visual identification of mineralized zones. Digital photographs of wetted core were taken and initially archived at the field offices. Holes were re-logged by a second geologist following receipt of assay results to validate data.
The core in the Palmarejo district is being sampled only in the intervals suspected to contain precious metal mineralization. Where the rock displays minor alteration and/or quartz-carbonate veinlets, the standard sample interval is one meter. In a section where the core has intersected a strongly mineralized structure, sampling may be reduced to a nominal 0.5 meter interval but can vary depending on the mineralogical changes. When structure is clearly broken into different veins or domains, it is sampled separately at contacts and sample intervals may be less than 0.5 meters.
From 2008 to 2011, no exploration RC drilling was performed. Previous RC drilling on the project used center-return hammer bits. If dictated by the geologic or groundwater conditions, an interchange hammer, full-bore tricone, or button bit was used. The water table in the project area is variable due to the topographic relief. RC holes were terminated if the sample exiting the cyclone became wet due to ground water, and the holes were completed with a core tail where applicable or twinned by a diamond core rig.
The RC holes used for the Palmarejo mineral resource model were sampled every five feet (1.52 m) down the hole. Holes that were drilled in a new area were sampled along the entire length of the hole. In-fill or close-
spaced holes were sampled at 5 foot intervals through zones of suspected mineralization. As a standard procedure, only material from dry drilling was being sampled and once the water table was intersected the RC hole was stopped and usually continued with core.
The RC drill chips were logged for stratigraphy, alteration, weathering degree, quartz percent, and metallic minerals to aid in geological and sectional interpretation. Representative RC drill chips were collected in chip trays and stored at Palmarejo office or the Arroyo Blanco storage for geologic logging. Holes were re-logged by a second geologist following receipt of assay results to validate the original logged data.
Sampling and Analysis and Security of Samples
Sample preparation and analytical methods use “standard methods” in the industry.
Prior to December 2007, the primary analytical laboratory for the Palmarejo project area and outlying exploration projects was ALS-Chemex with sample preparation in Chihuahua, Chihuahua and Hermosillo, Sonora. The current analytical lab for the exploration projects outside the Palmarejo Mine area is ALS-Chemex with sample preparation in Chihuahua, Chihuahua. A split of the prepared pulp is sent to Vancouver, B.C. for fire assay with gravimetric finish for both gold and silver. ALS-Chemex complies with the international standards ISO 9001:2000 and ISO 17025:1999. ALS-Chemex sample preparation requires that the entire sample is dried and crushed to > 70% passing a 2mm (10 mesh) screen. A split of up to 250g is pulverized to > 85% passing a 75µm (200 mesh) screen. All assays techniques at Palmarejo and Guadalupe utilize an initial 30 gram charge that is digested by the fire assay method. Then the metal content is determined by different finish techniques. The GRA21 technique uses a gravimetric finish or a physical weighing of the gold and or silver bead, detection limits for gold by this finish method is 0.05 to 1,000 parts per million (“ppm”) and 5 to 10,000ppm for silver. Quality assurance/Quality Control (“QA/QC”) analysis over the past year has shown that commercial labs have difficulty reproducing gold values below 1ppm with the gravimetric finish method due to the difficulty of physically weighing the small bead; therefore, a fire digestion followed by an Induction Coupled Plasma (“ICP”) finish is being used for initial gold analyses and when the gold exceeds 10.0ppm the sample is reassayed by a fire digestion and gravimetric finish.
Since 2008, samples collected during infill and definition exploration core drilling and underground development drilling at the Palmarejo Mine site have been sent to SGS Mineral Services Laboratory (“SGS”), Durango, Mexico for preparation and analysis using industry standard methods. SGS Durango is an accredited laboratory conforming with the requirements of CAN-P-1579, CAN-P-4E (ISO/IEC 17025:2005).
SGS sample preparation requires that the entire sample is dried and pulverized to >85% passing a 75 micron screen. A 30 gram charge is used for all analytical methods. Gold is first analyzed by fire assay with atomic absorption finish (“AA”). Gold samples that are above the upper detection limit for this method are re-analyzed by fire assay with gravimetric finish. Silver is analyzed using a 3 acid digestion and atomic absorption metal determination. Silver samples that are greater than the upper detection limit of this method are re-analyzed by fire assay with gravimetric finish. Sample pulps are to be sent to ALS-Chemex, Chihuahua, Mexico for check analysis.
At the end of 2009 the Palmarejo mine completed construction of an on-site assay laboratory. The lab has a sample preparation facility, two fire assay furnaces and two atomic absorption instruments. The laboratory is being managed and run by SGS on a contract basis. The on-site lab is used mainly for ore control and mill sample analysis. One third of the underground development drill samples were analyzed by the on-site laboratory. Assay techniques are 1-assay ton fire assay for gold with gravimetric or AA finish. Silver analysis is by aqua-regia digestion and AA finish for silver and over limit silver samples are re-analyzed by fire assay and gravimetric finish. Mine site personnel are submitting samples with a rigorous QA/QC sample protocol, with the exception of check assaying at a second laboratory. No exploration or definition drilling samples are assayed at the mine laboratory currently.
Coeur has adopted a specific QA/QC protocol that standardizes the procedures for collecting samples and obtaining related information with a goal of providing confidence that the assay results reported by laboratories can be verified and their integrity validated and which includes the use of standards, blanks, duplicates and check assays.
Coeur’s Qualified Persons have reviewed the assay data and the third party reviews of the Palmarejo and Guadalupe databases and QA/QC programs done by AMEC (2008), MDA (2004, 2006) and Keith Blair (2005, 2006, 2007) and are in agreement with the conclusion of these reports that the data collected by Bolnisi and
Palmarejo Silver and Gold is suitable for resource modeling and that there are no known factors that could materially affect the sample results.
Coeur’s Qualified Person has reviewed the summary reports of the assay quality control (“QC”) data for the 2008 to 2010 Palmarejo QA/QC program. The transition from exploration to development and production at the Palmarejo project saw a drop in the rigor of the assay QC program and monitoring for 2008 and most of 2009. Although not ideal, many of the drill holes and all of the channel samples from this period were not used in the resource model update described in this report. Coeur’s Qualified Person considers that the remaining data is suitable for resource modeling. The QC program at Palmarejo has been modified to include more regular reporting and check assaying for a larger proportion of the samples.
Coeur’s Qualified Persons’ review of the 2011 QA/QC data did not encounter significant problems or biases for the period studied, and the Qualified Persons believe the assay data to be of acceptable quality for resource modeling.
Mineral Resources and Reserves
The Proven and Probable Mineral Reserves, effective January 1, 2012, for the Palmarejo Area are based on Measured and Indicated Mineral Resources only. Open pit Mineral Reserves are based on an updated year-end 2011 block model as well as current surface mine designs. Underground Mineral Reserves are based on the year-end 2010 block model as well as updated underground mine designs. Production schedules and economic analyses have been performed which show the economic viability of the Mineral Reserves reported herein.
Open pit Mineral Reserves have been defined by first generating a detailed pit design based on an optimized shell produced in Gemcom Whittle™ software, determining ore and waste by applying a cutoff grade, and then creating a production schedule that supplies ore to the mill. Before generating the optimized shell, the resource model was block diluted to 5m x 5m x 7.5m to incorporate dilution along the edges of the mineralized structures. Ore control practices at Palmarejo allow for reasonable selectivity with relationship to the block size. The block dilution described above is appropriate for a statement of reserves without additional factors. Thus, no additional dilution factors have been used.
Underground stopes were designed in detail to create mineable shapes which would include necessary dilution. These detailed stope designs were used to determine tonnage and diluted grades. Any unclassified or inferred material within the stope solids was treated as internal waste at 0 grams per tonne (“g/t”) Au and Ag grade. No further ore loss or dilution from over break at the walls was taken into account because of the level of detail at which the stopes were designed.
After stope design was complete, sub-economic stopes were eliminated. The nature of eliminating stopes created a loss of potential ore associated with waste on the outer edge of the deposit.
The Mineral Resources and Mineral Reserves for the Palmarejo District shown in the table below are effective January 1, 2012, and include the Palmarejo mine, Guadalupe, and La Patria silver and gold deposits. Due to rounding, there may be some minor variations in tonnes, grades or contained ounces.
Mineral Resources have been estimated using varying cut-off grades depending on the type of mining. Cost and recovery estimates used for gold equivalency calculation and cut-off grade determination for open pit and underground mining have been determined by taking into account metal prices, operating costs and metallurgical recoveries based on operating experience gained at Palmarejo.
The gold equivalent factor used for cut-off grade determination is obtained using the following formula:
[($Price Au)/($Price Ag)] x [(%Recovery Au)/(%Recovery Ag)] x [(%Payable Au)/(%Payable Ag)]
Total Palmarejo District Mineral Resources Inclusive of Mineral Reserves
|
|
|
| Average Grade (g/t) |
| Contained Ounces |
| ||||
Category |
| Tonnes |
| Au |
| Ag |
| Au |
| Ag |
|
Measured |
| 6,023,500 |
| 2.19 |
| 173.9 |
| 423,210 |
| 33,684,690 |
|
Indicated |
| 8,936,300 |
| 1.63 |
| 139.7 |
| 469,450 |
| 40,126,170 |
|
Measured and Indicated |
| 14,959,800 |
| 1.86 |
| 153.5 |
| 892,660 |
| 73,810,860 |
|
Inferred |
| 10,993,800 |
| 1.74 |
| 79.8 |
| 614,710 |
| 28,159,210 |
|
The Total Mineral Resource includes Proven and Probable Mineral Reserves.
Cut-off grade for Palmarejo deposit: open pit 1.03g/tAuEq, underground 1.92g/tAuEq.
Cut-off grade for Guadalupe deposit: underground 1.98g/tAuEq.
Cut-off grade for La Patria deposit 1.12g/tAuEq.
Inferred Resources have a great amount of uncertainty as to their existence and whether they can be mined legally or economically. It cannot be assumed that all or any part of the Inferred Resources will ever be upgraded to a higher category. See “Cautionary Note to US Investors Regarding Reserve and Resource Reporting Standards”.
Mineral Reserves were calculated using metal prices of $1,220/oz Au and $23.00/oz Ag in conjunction with cost and recovery assumptions. All resource cut-off grades were calculated using metal prices of $1,500/oz gold and $30.00/oz silver.
The Proven and Probable Mineral Reserves, effective January 1, 2012, are based on Measured and Indicated Mineral Resources only and are summarized in the table below. Mineral Resources that are not classified as Mineral Reserves have not demonstrated economic viability.
There are no known factors that would adversely affect the planned metallurgical processes other than lower than anticipated silver recoveries that Coeur has publically disclosed. There are no known environmental, permitting, legal, title, socio-economic, marketing, or political issues that could materially affect the Palmarejo Mineral Reserves and Resources.
Total Palmarejo District Mineral Reserves
|
|
|
| Average Grade (g/t) |
| Contained Ounces |
| ||||
Category |
| Tonnes |
| Au |
| Ag |
| Au |
| Ag |
|
Proven |
| 4,459,600 |
| 2.30 |
| 182.0 |
| 329,950 |
| 26,090,800 |
|
Probable |
| 6,877,600 |
| 1.65 |
| 139.0 |
| 358,170 |
| 30,727,260 |
|
Total |
| 11,337,200 |
| 1.89 |
| 155.9 |
| 688,120 |
| 56,818,060 |
|
Metal prices used were $1,220/oz Au, $23.00/oz Ag.
Includes Mineral Reserves for Palmarejo and Guadalupe deposits.
The table below shows the remaining Mineral Resource for the Palmarejo District (including the Palmarejo, Guadalupe and La Patria deposits) exclusive of the Mineral Reserves. The Palmarejo Report emphasises that the following Mineral Resources have not demonstrated economic viability.
Total Palmarejo District Mineral Resources Exclusive of Mineral Reserves
|
|
|
| Average Grade (g/t) |
| Contained Ounces |
| ||||
Category |
| Tonnes |
| Au |
| Ag |
| Au |
| Ag |
|
Measured |
| 1,626,500 |
| 1.78 |
| 145.2 |
| 93,260 |
| 7,593,880 |
|
Indicated |
| 2,965,200 |
| 1.17 |
| 98.6 |
| 111,270 |
| 9,398,900 |
|
Total |
| 4,591,700 |
| 1.39 |
| 115.1 |
| 204,530 |
| 16,992,780 |
|
Inferred |
| 10,571,400 |
| 1.80 |
| 82.2 |
| 611,660 |
| 27,928,190 |
|
Mineral Resources are in addition to Mineral Reserves and have not demonstrated economic viability
Cut-off grade for Palmarejo deposit: open pit 1.03 g/tAuEq, underground 1.92 g/tAuEq
Cut-off grade for Guadalupe deposit: underground only 1.98 g/tAuEq
Cut-off grade for La Patria deposit 1.12 g/tAuEq
Inferred Resources have a great amount of uncertainty as to their existence and whether they can be mined legally or economically. It cannot be assumed that all or any part of the Inferred Resources will ever be upgraded to a higher category. See “Cautionary Note to US Investors Regarding Reserve and Resource Reporting Standards”.
The Mineral Reserve and Resource for Guadalupe, effective January 1, 2012 and are summarized in metric tonne units in the tables below:
Guadalupe Deposit Mineral Reserves
|
|
|
| Average Grade (g/t) |
| Contained Ounces |
| ||||
Category |
| Tonnes |
| Au |
| Ag |
| Au |
| Ag |
|
Proven |
| 688,800 |
| 2.03 |
| 184.7 |
| 44,950 |
| 4,089,090 |
|
Probable |
| 5,325,900 |
| 1.70 |
| 139.2 |
| 290,980 |
| 23,834,010 |
|
Proven and Probable |
| 6,014,700 |
| 1.74 |
| 144.4 |
| 335,930 |
| 27,923,100 |
|
Metals prices used were $1,220/oz Au and $23.00/oz Ag.
Cutoff grade for reserve was 2.43 g/t Au Equivalent [(Au Eq = Au g/t + (Ag g/t / 61.72)]
AuEq factor based on [($Price Au) / ($Price Ag)] x [(%Recovery Au)/(%Recovery Ag)] x [(%Payable Au)/(%Payable Ag)]
Mineral Resources were calculated using metals prices of $1,300/oz Au and $20.00/oz Ag in conjunction with cost and recovery assumptions. The resultant Mineral Resources are summarized in metric tonne units in the tables below. Mineral Resources have not demonstrated economic viability.
Guadalupe Deposit Mineral Resource Inclusive of Mineral Reserves
|
|
|
| Average Grade (g/t) |
| Contained Ounces |
| ||||
Category |
| Tonnes |
| Au |
| Ag |
| Au |
| Ag |
|
Measured |
| 737,400 |
| 2.08 |
| 193.6 |
| 49,430 |
| 4,591,070 |
|
Indicated |
| 6,852,800 |
| 1.76 |
| 144.0 |
| 388,350 |
| 31,720,430 |
|
Measured and Indicated |
| 7,590,200 |
| 1.79 |
| 148.8 |
| 437,780 |
| 36,311,500 |
|
Inferred |
| 5,048,600 |
| 1.63 |
| 115.2 |
| 264,490 |
| 18,706,000 |
|
Total Mineral Resource includes Proven and Probable Reserves
Metals prices used were $1,500/oz Au and $30.00/oz Ag.
Cut-off grade for resource was 1.98 g/t Au Equivalent [(Au Eq = Au g/t + (Ag g/t / 58.18)]
AuEq factor based on [($Price Au) / ($Price Ag)] x [(%Recovery Au)/(%Recovery Ag)] x [(%Payable Au)/(%Payable Ag)]
Inferred Resources have a great amount of uncertainty as to their existence and whether they can be mined legally or economically. It cannot be assumed that all or any part of the Inferred Resources will ever be upgraded to a higher category. See “Cautionary Note to US Investors Regarding Reserve and Resource Reporting Standards”.
Guadalupe Deposit Mineral Resource Exclusive of Mineral Reserves
|
|
|
| Average Grade (g/t) |
| Contained Ounces |
| ||||
Category |
| Tonnes |
| Au |
| Ag |
| Au |
| Ag |
|
Measured |
| 111,300 |
| 1.25 |
| 140.3 |
| 4,480 |
| 501,980 |
|
Indicated |
| 2,263,600 |
| 1.34 |
| 108.4 |
| 97,370 |
| 7,886,410 |
|
Measured and Indicated |
| 2,374,900 |
| 1.33 |
| 109.9 |
| 101,850 |
| 8,388,390 |
|
Inferred |
| 4,796,100 |
| 1.72 |
| 121.3 |
| 264,490 |
| 18,706,000 |
|
Mineral Resources are in addition to Reserves and have not demonstrated economic viability
Metals prices used were $1,500/oz Au and $30.00/oz Ag.
Cut-off grade for resource was 1.98 g/t Au Equivalent [(Au Eq = Au g/t + (Ag g/t / 58.18)]
AuEq factor based on [($Price Au) / ($Price Ag)] x [(%Recovery Au)/(%Recovery Ag)] x [(%Payable Au)/(%Payable Ag)]
Some Inferred material was included in the Mineral Reserve at 0 g/t Au and Ag as internal dilution.
Inferred Resources have a great amount of uncertainty as to their existence and whether they can be mined legally or economically. It cannot be assumed that all or any part of the Inferred Resources will ever be upgraded to a higher category. See “Cautionary Note to US Investors Regarding Reserve and Resource Reporting Standards”.
La Patria has no Mineral Reserve at this time and the Mineral Resources for the La Patria deposit are summarized in metric tonne units in the table below. Mineral Resources have not demonstrated economic viability.
La Patria Deposit Mineral Resources No Reserves
|
|
|
| Average Grade (g/t) |
| Contained Ounces |
| ||||
Category |
| Tonnes |
| Au |
| Ag |
| Au |
| Ag |
|
Measured |
| — |
| — |
| — |
| — |
| — |
|
Indicated |
| — |
| — |
| — |
| — |
| — |
|
Measured and Indicated |
| — |
| — |
| — |
| — |
| — |
|
Inferred |
| 5,177,000 |
| 1.90 |
| 39.6 |
| 316,400 |
| 6,585,800 |
|
Mineral Resources have not demonstrated economic viability
Metals prices used were $1,500/oz Au and $30.00/oz Ag.
Cut-off grade for resource was 1.12 g/t Au Equivalent [(Au Eq = Au g/t + (Ag g/t / 58.18)]
AuEq factor based on [($Price Au) / ($Price Ag)] x [(%Recovery Au)/(%Recovery Ag)] x [(%Payable Au)/(%Payable Ag)]
Cut-off date for drilling included in the resource model was September 19, 2011 La Patria estimate effective September 17, 2007.
Inferred Resources have a great amount of uncertainty as to their existence and whether they can be mined legally or economically. It cannot be assumed that all or any part of the Inferred Resources will ever be upgraded to a higher category. See “Cautionary Note to US Investors Regarding Reserve and Resource Reporting Standards”.
Mining Operations
Palmarejo mine
The Palmarejo mine, process plant, diesel power generating station, and ancillary facilities is operational, with the first doré produced on schedule in late March 2009. Production commenced using an interim tailings storage facility while the final tailings dam is being constructed.
Ore is mined by both conventional open pit techniques and by longhole underground techniques. Open pit mining operations are at full capacity and all stripping requirements have been met or exceeded. Major backbone development of the underground operation is complete and most underground permanent infrastructure construction is complete.
Ore from both underground and open pit operations is hauled to the run of mine stockpile immediately adjacent to the north portal. A loader feeds the primary jaw crusher, blending ores from various sources in the process. A small crushed ore stockpile downstream of the primary crusher is reclaimed by apron feeder to feed the semi autogenous grind and ball mills, with cyclone overflow reporting to rougher-scavenger and cleaner flotation cells. Flotation concentrate is thickened and cyanide leached, and all float tails report to a carbon-in-leach (“CIL”) circuit. The pregnant eluate from the concentrate leach and stripped CIL carbon is treated by electro-winning to produce a powder that is filtered, dried and smelted on site into 150kg ingots. Doré bullion is shipped by contract armored truck to a refinery.
Tailings slurry undergoes thickening for water recovery, cyanide detoxification, and is ultimately discharged to the tailings impoundment located in the east watershed outlet downstream of the open pit waste rock storage area.
The 2011 year end results show a feed grade of 2.49 g/t Au and 240 g/t Ag with an overall recovery of 76.0% Ag and 91.0 % Au.
The final product shipped from Palmarejo consists of doré ingots. The relatively pure precious metals are then sold by the refinery on the open market.
Metallurgical tests indicate recoveries of silver and gold by floatation and leaching from Guadalupe ores is similar to the recoveries experienced at Palmarejo in the full scale process plant with a floatation and leaching circuit. Mineralogical test work shows that the ore minerals at both deposits are also similar. Additional test work at Guadalupe is planned for 2012. No metallurgy testing has yet been performed on La Patria. That work is also planned for 2012.
Coeur has numerous business contracts in place to allow day-to-day mining, crushing and processing functions to operate smoothly. The terms of these contracts, with regard to charges, etc. are all within industry norms.
The stated Mineral Reserves effective January 1, 2012, yield an estimated mine life of approximately 9 years and are estimated to generate a pre-tax net cashflow of $253.3 million based on future capital expenditure of $105.9 million.
Guadalupe
The Guadalupe deposit is located approximately 7 kilometers southeast of the Palmarejo mine site and processing plant and will be operated as a satellite of Palmarejo, which will provide processing, tailings and
administrative support for the Guadalupe Mine. Guadalupe ore will be mined by conventional and transverse longhole underground stoping techniques and trucked to the Palmarejo mill via surface roads.
Underground mining is designed and scheduled based on detailed economic stope designs, dilution and loss assumptions. The vein structure is most amenable to mechanized conventional longhole stoping in the vein sections narrower than 15 meters and transverse longhole stoping in the areas where the vein exceeds 15 meters. The mining will be accomplished using jumbo drills, jackleg drills, bolters, longhole drills, Load-Haul-Dump (“LHD”) loaders and 30-45 tonne trucks. The underground longhole mining will utilize cemented rock fill (“CRF”) from a CRF plant located on the surface for backfilling of primary stopes.
Ventilation is planned according to industry standards for the mining method and planned equipment.
Coeur contracted Golder Associates to complete a geotechnical study for Guadalupe in 2011. The results indicate Guadalupe geotechnical stability to be better overall than at Palmarejo, with some variable conditions encountered in the development areas. Coeur has implemented Golder’s recommendations into the Guadalupe designs, which include mining dimensions and analyzing operational applications such as bolting types, spacing and patterns.
Necessary infrastructure for Guadalupe not supported by the Palmarejo complex is either planned or in place. This includes electrical power via a spur line from the Palmarejo feed, compressed air, office and other buildings, etc. Underground water will be collected in sumps and recycled for use. Excess water will be clarified and sent to the Palmarejo fresh water dam.
Reclamation
Coeur conducts an annual review of its potential reclamation responsibilities company-wide. Its year end 2011 preliminary assessment for the life of mine disturbance for final reclamation at the Palmarejo Mine is estimated to be $17.8 million and for Guadalupe is estimated to be $2.6 million. No additional bonds are required to be put in place for implementation of these requirements by the Mexican authorities.
Taxes and Royalties
The Palmarejo Royalty is subject to 16% Value Added Tax (“VAT”) in Mexico. The monthly payment received from the operator is grossed up for the VAT which Franco-Nevada submits to the tax authorities.
Capital Costs
The capital cost estimate for the Palmarejo project is based on development and construction of a combined open pit and underground mine operation with a supporting plant and infrastructure.
Capital expenditures for Palmarejo and Guadalupe from January 1, 2012 through the end of the mine life are estimated to be an additional $105.9 million. Major budgeted expenditures in 2012 at Palmarejo include $10.0 million for the final tailings dam construction. Expenditures for Guadalupe in 2012 are budgeted at $17.0 million for development and mine equipment.
RESERVES DATA AND OTHER OIL AND GAS INFORMATION
GLJ was engaged by Franco-Nevada to evaluate the crude oil and natural gas reserves of its Oil & Gas Assets’ producing properties and the value of future net revenue attributable to such reserves. GLJ has prepared a report in accordance with the requirements of NI 51-101. The GLJ Report was dated February 28, 2012 with an effective date of December 31, 2011. The GLJ Report was prepared using assumptions and methodology guidelines outlined in the COGE Handbook.
All evaluations of future revenue contained in the GLJ Report are after the deduction of royalties, development costs, production costs and well abandonment costs of all wells to which reserves have been attributed, but before consideration of indirect costs such as general and administrative, overhead recovery and other miscellaneous expenses. The estimated future net revenues contained in the following tables do not necessarily represent the fair market value of the reserves. There is no assurance that the forecast price and cost assumptions contained in the GLJ Report will be attained and variances could be material. Other assumptions and qualifications relating to costs and other matters are included in the notes to the tables. The recovery and reserves estimates described herein are estimates only. The actual reserves may be greater or less than those calculated.
Oil & Gas Abbreviations and Conversions
Oil and Natural Gas Liquids |
| Natural Gas | ||||
bbl |
| barrel |
| Bcf |
| billion cubic feet |
bbls/d |
| barrels per day |
| Mcf |
| thousand cubic feet |
Mbbls/d |
| thousand barrels per day |
| MMcf |
| million cubic feet |
MMbbls |
| million barrels |
| MMcf/d |
| million cubic feet per day |
NGLs |
| natural gas liquids |
| MMBtu |
| million British thermal units |
Boe |
| barrel of oil equivalent |
|
|
|
|
Boe/d |
| barrels of oil equivalent per day |
|
|
|
|
Mboe |
| thousand barrels of oil equivalent |
|
|
|
|
Mboe/d |
| thousand barrels of oil equivalent per day |
|
|
|
|
MMboe |
| million barrels of oil equivalent |
|
|
|
|
WTI |
| West Texas Intermediate |
|
|
|
|
API |
| American Petroleum Institute |
|
|
|
|
Oil & Gas Information Advisory
In this AIF, certain natural gas volumes have been converted to barrels of oil equivalent on the basis of six Mcf to one bbl. Boe and Mboe may be misleading, particularly if used in isolation. A conversion ratio of six Mcf to one bbl is based on an energy equivalency conversion method primarily applicable at the burner tip and does not represent value equivalency at the wellhead. The estimates of reserves and future net revenue for individual properties may not reflect the same confidence level as estimates of reserves and future net revenue for all properties, due to the effects of aggregation.
Reserves Data (Forecast Prices and Costs)
The following table sets forth a summary of the crude oil and natural gas reserves and the value of future net revenue of Franco-Nevada as at December 31, 2011 as evaluated by GLJ in the GLJ Report using forecast prices and costs. The pricing used in the forecast price evaluation is set forth below under the heading “Forecast Prices and Costs”. Some of the tables may not add due to rounding. See, “Cautionary Note to US Investors Regarding Reserve and Resource Reporting Standards.”
|
| Light & |
| Heavy Oil |
| Natural |
| NGLs |
| Total Oil |
| ||||||||||
RESERVES |
| Gross (Mbbl) |
| Net |
| Gross |
| Net |
| Gross |
| Net (MMcf) |
| Gross |
| Net |
| Gross |
| Net |
|
Proved |
|
|
|
|
|
|
|
|
|
|
|
|
|
|
|
|
|
|
|
|
|
Producing |
| 1,507 |
| 2,604 |
| — |
| 121 |
| 3 |
| 9,627 |
| — |
| 259 |
| 1,508 |
| 4,588 |
|
Developed Non-Producing |
| 98 |
| 121 |
| — |
| — |
| — |
| — |
| — |
| — |
| 98 |
| 121 |
|
Undeveloped |
| 429 |
| 550 |
| — |
| — |
| — |
| — |
| — |
| — |
| 429 |
| 550 |
|
Total Proved |
| 2,034 |
| 3,275 |
| — |
| 121 |
| 3 |
| 9,627 |
| — |
| 259 |
| 2,035 |
| 5,259 |
|
Total Probable |
| 814 |
| 1,209 |
| — |
| 25 |
| 1 |
| 3,244 |
| 42 |
| 155 |
| 856 |
| 1,929 |
|
Total Proved Plus Probable |
| 2,848 |
| 4,484 |
| — |
| 146 |
| 4 |
| 12,871 |
| 42 |
| 413 |
| 2,891 |
| 7,188 |
|
The following tables set forth the net present value of future net revenue attributable to the reserves categories referred to above, before and after deducting future income tax expenses, calculated without discount and using a discount rate of 5%, 10%, 15% and 20%:
|
| Net Present Values of Future Net Revenue |
| |||||||||||||
Reserves Category |
| 0% |
| 5% |
| 10% |
| 15% |
| 20% |
| |||||
|
| (C$000) |
| |||||||||||||
|
|
|
|
|
|
|
|
|
|
|
| |||||
Proved Producing |
| $ | 278,064 |
| $ | 191,244 |
| $ | 146,197 |
| $ | 119,081 |
| $ | 101,045 |
|
Developed Non-Producing |
| 10,174 |
| 5,859 |
| 3,837 |
| 2,750 |
| 2,105 |
| |||||
Undeveloped |
| 41,610 |
| 20,815 |
| 11,513 |
| 6,771 |
| 4,130 |
| |||||
|
|
|
|
|
|
|
|
|
|
|
| |||||
Total Proved |
| 329,848 |
| 217,917 |
| 161,547 |
| 128,602 |
| 107,280 |
| |||||
Total Probable |
| 143,201 |
| 70,649 |
| 42,209 |
| 28,292 |
| 20,435 |
| |||||
|
|
|
|
|
|
|
|
|
|
|
| |||||
Total Proved Plus Probable |
| $ | 473,048 |
| $ | 288,566 |
| $ | 203,756 |
| $ | 156,894 |
| $ | 127,714 |
|
|
| Net Present Values of Future Net Revenue |
| |||||||||||||
Reserves Category |
| 0% |
| 5% |
| 10% |
| 15% |
| 20% |
| |||||
|
| (C$000) |
| |||||||||||||
|
|
|
|
|
|
|
|
|
|
|
| |||||
Proved Producing |
| $ | 241,661 |
| $ | 165,866 |
| $ | 126,647 |
| $ | 103,060 |
| $ | 87,379 |
|
Developed Non-Producing |
| 7,772 |
| 4,474 |
| 2,929 |
| 2,099 |
| 1,606 |
| |||||
Undeveloped |
| 31,788 |
| 15,786 |
| 8,621 |
| 4,966 |
| 2,930 |
| |||||
|
|
|
|
|
|
|
|
|
|
|
| |||||
Total Proved |
| 281,221 |
| 186,126 |
| 138,197 |
| 110,124 |
| 91,914 |
| |||||
Total Probable |
| 109,516 |
| 53,908 |
| 32,134 |
| 21,486 |
| 15,479 |
| |||||
|
|
|
|
|
|
|
|
|
|
|
| |||||
Total Proved Plus Probable |
| $ | 390,737 |
| $ | 240,035 |
| $ | 170,331 |
| $ | 131,611 |
| $ | 107,394 |
|
The following table sets forth the undiscounted future net revenue attributable to proved and proved plus probable reserves (in total) as of December 31, 2011 is set forth below:
Reserves Category |
| Revenue |
| Royalties |
| Operating |
| Development |
| Well |
| Future Net |
| Future |
| Future Net |
| ||||||||
Total Proved (C$000) |
| $ | 434,497 |
| $ | 50,936 |
| $ | 35,737 |
| $ | 17,171 |
| $ | 806 |
| $ | 329,848 |
| $ | 48,626 |
| $ | 281,221 |
|
Total Proved Plus Probable (C$000) |
| $ | 620,717 |
| $ | 73,610 |
| $ | 52,797 |
| $ | 20,368 |
| $ | 895 |
| $ | 473,048 |
| $ | 82,311 |
| $ | 390,737 |
|
The following table sets forth the net present value of future net revenue (before deducting future income tax expenses), by production group, estimated using forecast prices and costs and calculated using a discount rate of 10%:
Reserves Category |
| Production group |
| Net present value of future net |
|
Total Proved |
|
|
|
|
|
|
| Light & Medium Oil(2) |
| 119,416 |
|
|
| Heavy Oil(2) |
| 5,005 |
|
|
| Natural Gas(3) |
| 37,126 |
|
|
| Total |
| 161,547 |
|
Total Proved Plus Probable |
|
|
|
|
|
|
| Light & Medium Oil(2) |
| 151,855 |
|
|
| Heavy Oil(2) |
| 5,404 |
|
|
| Natural Gas(3) |
| 46,496 |
|
|
| Total |
| 203,756 |
|
(1) Other company revenue and costs not related to a specific production group have been allocated proportionately to production groups. Unit values are based on the Company’s net reserves.
(2) Including solution gas and other by-products.
(3) Including by-products but excluding solution gas.
Forecast Prices and Costs
The following table sets forth forecast prices and costs pricing assumptions used in the GLJ Report with respect to net present values of future net revenue as well as the inflation rates used for operating and capital costs. GLJ is an independent qualified reserves evaluator appointed pursuant to NI 51-101. The crude oil and natural gas forecast prices are based on the January 1, 2012 posted price as determined by GLJ. The forecast price assumptions assume the continuance of current laws, regulations and operating costs in effect on the date of the GLJ Report.
Year |
| WTI @ |
| Light, |
| Lloyd |
| Canadian |
| NGL |
| NGL |
| NGL |
| Inflation |
| Exchange |
|
2012 |
| 97.00 |
| 97.96 |
| 81.31 |
| 3.49 |
| 58.78 |
| 76.41 |
| 107.76 |
| 2.0 |
| 0.980 |
|
2013 |
| 100.00 |
| 101.02 |
| 82.33 |
| 4.13 |
| 60.61 |
| 78.80 |
| 108.09 |
| 2.0 |
| 0.980 |
|
2014 |
| 100.00 |
| 101.02 |
| 82.33 |
| 4.59 |
| 60.61 |
| 78.80 |
| 105.06 |
| 2.0 |
| 0.980 |
|
2015 |
| 100.00 |
| 101.02 |
| 82.33 |
| 5.05 |
| 60.61 |
| 78.80 |
| 105.06 |
| 2.0 |
| 0.980 |
|
2016 |
| 100.00 |
| 101.02 |
| 82.33 |
| 5.51 |
| 60.61 |
| 78.80 |
| 105.06 |
| 2.0 |
| 0.980 |
|
2017 |
| 100.00 |
| 101.02 |
| 82.33 |
| 5.97 |
| 60.61 |
| 78.80 |
| 105.06 |
| 2.0 |
| 0.980 |
|
2018 |
| 101.35 |
| 102.40 |
| 83.45 |
| 6.21 |
| 61.44 |
| 79.87 |
| 106.49 |
| 2.0 |
| 0.980 |
|
2019 |
| 103.38 |
| 104.47 |
| 85.14 |
| 6.33 |
| 62.68 |
| 81.49 |
| 108.65 |
| 2.0 |
| 0.980 |
|
2020 |
| 105.45 |
| 106.58 |
| 86.86 |
| 6.46 |
| 63.95 |
| 83.13 |
| 110.84 |
| 2.0 |
| 0.980 |
|
2021 |
| 107.56 |
| 108.73 |
| 88.62 |
| 6.58 |
| 65.24 |
| 84.81 |
| 113.08 |
| 2.0 |
| 0.980 |
|
2022+ |
| +2.0%/yr |
| +2.0%/yr |
| +2.0%/yr |
| +2.0%/yr |
| +2.0%/yr |
| +2.0%/yr |
| +2.0%/yr |
| 2.0 |
| 0.980 |
|
Reconciliation of Changes in Reserves
The table below is a reconciliation of gross reserves and is provided to satisfy the requirement of NI 51-101. Under NI 51-101, gross reserves include only working interests before the deduction of royalties payable and do not include any royalties receivable. As a significant percentage of Franco-Nevada’s assets are royalty interests, they are excluded from this table. This hinders an investor’s ability to compare its reserves to others in the industry. Therefore, in addition to presenting the reconciliation using gross reserves, a reconciliation
using the Company’s interest reserves is also presented. The Company’s interest reserves are gross working interest reserves plus net royalty interest reserves.
December 31, 2011
Reconciliation of Company Gross Reserves
by Principal Product Type
Forecast Prices and Costs
|
| Total Oil |
| Residue & Solution Gas |
| Natural Gas Liquids |
| Oil Equivalent |
| ||||||||||||||||
FACTORS |
| Proved |
| Probable |
| Proved + |
| Proved |
| Probable |
| Proved + |
| Proved |
| Probable |
| Proved + |
| Proved |
| Probable |
| Proved + |
|
December 31/2010 |
| 2,089 |
| 828 |
| 2,917 |
| 2 |
| 2 |
| 4 |
| 0 |
| 42 |
| 42 |
| 2,090 |
| 869 |
| 2,959 |
|
Discoveries |
| 0 |
| 0 |
| 0 |
| 0 |
| 0 |
| 0 |
| 0 |
| 0 |
| 0 |
| 0 |
| 0 |
| 0 |
|
Extensions* |
| 0 |
| 0 |
| 0 |
| 0 |
| 0 |
| 0 |
| 0 |
| 0 |
| 0 |
| 0 |
| 0 |
| 0 |
|
Infill Drilling* |
| 14 |
| (9 | ) | 6 |
| 0 |
| 0 |
| 0 |
| 0 |
| 0 |
| 0 |
| 14 |
| (8 | ) | 6 |
|
Improved Recovery* |
| 33 |
| (2 | ) | 31 |
| 0 |
| 0 |
| 0 |
| 0 |
| 0 |
| 0 |
| 33 |
| (2 | ) | 31 |
|
Technical Revisions |
| 30 |
| (3 | ) | 27 |
| 3 |
| (2 | ) | 2 |
| 0 |
| 0 |
| 0 |
| 31 |
| (3 | ) | 28 |
|
Acquisitions |
| 0 |
| 0 |
| 0 |
| 0 |
| 0 |
| 0 |
| 0 |
| 0 |
| 0 |
| 0 |
| 0 |
| 0 |
|
Dispositions |
| 0 |
| 0 |
| 0 |
| 0 |
| 0 |
| 0 |
| 0 |
| 0 |
| 0 |
| 0 |
| 0 |
| 0 |
|
Economic Factors |
| 0 |
| 0 |
| 0 |
| 0 |
| 0 |
| 0 |
| 0 |
| 0 |
| 0 |
| 0 |
| 0 |
| 0 |
|
Production |
| (132 | ) | 0 |
| (132 | ) | (2 | ) | 0 |
| (2 | ) | 0 |
| 0 |
| 0 |
| (133 | ) | 0 |
| (133 | ) |
December 31/2011 |
| 2,034 |
| 814 |
| 2,848 |
| 3 |
| 1 |
| 4 |
| 0 |
| 42 |
| 42 |
| 2,035 |
| 856 |
| 2,891 |
|
* | The above change categories correspond to standards set out in the COGE Handbook. For reporting under NI 51-101, reserves additions under Infill Drilling, Improved Recovery and Extensions should be combined and reported as “Extensions and Improved Recovery”. |
December 31, 2011
Reconciliation of Company Interest Reserves
by Principal Product Type
Forecast Prices and Costs
|
| Total Oil |
| Residue & Solution Gas |
| Natural Gas Liquids |
| Oil Equivalent |
| ||||||||||||||||
FACTORS |
| Proved |
| Probable |
| Proved + |
| Proved |
| Probable |
| Proved + |
| Proved |
| Probable |
| Proved + |
| Proved |
| Probable |
| Proved + |
|
December 31/2010 |
| 3,842 |
| 1,362 |
| 5,204 |
| 10,723 |
| 3,366 |
| 14,089 |
| 294 |
| 164 |
| 458 |
| 5,924 |
| 2,087 |
| 8,011 |
|
Discoveries |
| 0 |
| 0 |
| 0 |
| 0 |
| 0 |
| 0 |
| 0 |
| 0 |
| 0 |
| 0 |
| 0 |
| 0 |
|
Extensions* |
| 8 |
| 2 |
| 10 |
| 164 |
| 58 |
| 222 |
| 7 |
| 3 |
| 10 |
| 42 |
| 15 |
| 57 |
|
Infill Drilling* |
| 21 |
| (13 | ) | 8 |
| 131 |
| 33 |
| 164 |
| 0 |
| 0 |
| 0 |
| 42 |
| (6 | ) | 36 |
|
Improved Recovery* |
| 46 |
| (3 | ) | 43 |
| 0 |
| 0 |
| 0 |
| 0 |
| 0 |
| 0 |
| 46 |
| (3 | ) | 43 |
|
Technical Revisions |
| 85 |
| (8 | ) | 93 |
| 594 |
| (213 | ) | 381 |
| 12 |
| (8 | ) | 4 |
| 195 |
| (34 | ) | 161 |
|
Acquisitions |
| 0 |
| 0 |
| 0 |
| 0 |
| 0 |
| 0 |
| 0 |
| 0 |
| 0 |
| 0 |
| 0 |
| 0 |
|
Dispositions |
| 0 |
| 0 |
| 0 |
| 0 |
| 0 |
| 0 |
| 0 |
| 0 |
| 0 |
| 0 |
| 0 |
| 0 |
|
Economic Factors |
| 0 |
| 0 |
| 0 |
| 0 |
| 0 |
| 0 |
| 0 |
| 0 |
| 0 |
| 0 |
| 0 |
| 0 |
|
Production |
| (292 | ) | 0 |
| (292 | ) | (1,985 | ) | 0 |
| (1,985 | ) | (55 | ) | 0 |
| (55 | ) | (677 | ) | 0 |
| (677 | ) |
December 31/2011 |
| 3,710 |
| 1,357 |
| 5,067 |
| 9,627 |
| 3,244 |
| 12,871 |
| 259 |
| 159 |
| 418 |
| 5,573 |
| 2,058 |
| 7,631 |
|
* The above change categories correspond to standards set out in the COGE Handbook. For reporting under NI 51-101, reserves additions under Infill Drilling, Improved Recovery and Extensions should be combined and reported as “Extensions and Improved Recovery”.
Additional Information Relating to Reserves Data
Undeveloped Reserves
Proved and probable undeveloped reserves on a forecast price and cost basis have been estimated in accordance with procedures and standards contained in the COGE Handbook. Franco-Nevada holds both non-operating working interests and royalty interests in its oil & gas assets and, therefore, does not principally
determine the development schedule of these oil & gas assets. The operators of these assets determine the development of these assets and Franco-Nevada’s role, as a working interest holder, will be limited to paying its working interest share of the expenses associated therewith. For proved undeveloped properties, see the preceding charts under “Reserves Data (Forecast Prices and Costs)” and “Net Present Value of Future Net Revenue (Forecast Prices and Costs)”.
Company Gross Reserves First Attributed by Year
Proved Undeveloped Reserves
|
| Light & Medium Oil |
| Heavy Oil (Mbbl) |
| Natural Gas (MMcf) |
| Natural Gas Liquids |
| Oil Equivalent (Mbbl) |
| ||||||||||
|
| * First |
| Total at |
| First |
| Total at |
| First |
| Total at |
| First |
| Total at |
| First |
| Total at |
|
Prior |
| 537 |
| 537 |
| — |
| — |
| — |
| — |
| — |
| — |
| 537 |
| 537 |
|
2009 |
| — |
| 511 |
| — |
| — |
| — |
| — |
| — |
| — |
| — |
| 511 |
|
2010 |
| 180 |
| 481 |
| — |
| — |
| — |
| — |
| — |
| — |
| 180 |
| 481 |
|
2011 |
| 35 |
| 429 |
| — |
| — |
| — |
| — |
| — |
| — |
| 35 |
| 429 |
|
* “First Attributed” refers to reserves first attributed at year-end of the corresponding fiscal year.
Probable Undeveloped Reserves
|
| Light & Medium Oil |
| Heavy Oil (Mbbl) |
| Natural Gas (MMcf) |
| Natural Gas Liquids |
| Oil Equivalent (Mbbl) |
| ||||||||||
|
| * First |
| Total at |
| First |
| Total at |
| First |
| Total at |
| First |
| Total at |
| First |
| Total at |
|
Prior |
| 623 |
| 623 |
| — |
| — |
| — |
| — |
| 42 |
| 42 |
| 665 |
| 665 |
|
2009 |
| — |
| 490 |
| — |
| — |
| — |
| — |
| — |
| 42 |
| — |
| 532 |
|
2010 |
| 58 |
| 385 |
| — |
| — |
| — |
| — |
| — |
| 42 |
| 58 |
| 427 |
|
2011 |
| 15 |
| 340 |
| — |
| — |
| — |
| — |
| — |
| 42 |
| 15 |
| 383 |
|
* “First Attributed” refers to reserves first attributed at year-end of the corresponding fiscal year.
Significant Factors or Uncertainties
The process of evaluating reserves is inherently complex. It requires significant judgments and decisions based on available geological, geophysical, engineering and economic data. As circumstances change and additional data becomes available, reserve estimates also change. Estimates are reviewed and revised, either upward or downward, as warranted by the new information. Revisions are often required due to changes in well performance, prices, economic conditions and governmental restrictions. Revisions to reserve estimates can arise from changes in year-end prices, reservoir performance and geologic conditions or production. These revisions can be either positive or negative.
The reserve estimates contained herein are based on current production forecasts, prices and economic conditions. These factors and assumptions include among others: (i) historical production in the area compared with production rates from analogous producing areas; (ii) initial production rates; (iii) production decline rates; (iv) ultimate recovery of reserves; (v) success of future development activities; (vi) marketability of production; (vii) effects of government regulations; and (viii) other government levies imposed over the life of the reserves.
The evaluated oil and natural gas assets have no material extraordinary risks or uncertainties beyond those which are inherent in an oil and natural gas producing company. See “Risk Factors — Risks Related to Mining Operations and Oil and Natural Gas Operations”.
Future Development Costs
The table below sets out the development costs deducted in the estimation of future net revenue attributable to Franco-Nevada’s proved reserves reported in the GLJ Report using forecast prices and costs.
|
| Annual Capital Expenditure (C$000) |
| ||||||||||||||||||||||||||||
|
| 2012 |
| 2013 |
| 2014 |
| 2015 |
| 2016 |
| 2017 |
| 2018 |
| 2019 |
| 2020 |
| 2021 |
| 2022 |
| 2023 |
| Remainder |
| Total |
| Total 10% |
|
Total Proved |
| 2,142 |
| 3,251 |
| 2,038 |
| 1,544 |
| 1,576 |
| 891 |
| 789 |
| 634 |
| 576 |
| 408 |
| 333 |
| 282 |
| 2,706 |
| 17,171 |
| 10,937 |
|
Total Proved Plus Probable |
| 2,374 |
| 3,373 |
| 2,703 |
| 2,179 |
| 1,978 |
| 1,123 |
| 994 |
| 660 |
| 615 |
| 484 |
| 453 |
| 470 |
| 2,962 |
| 20,368 |
| 12,974 |
|
Franco-Nevada expects to fund its estimated future development costs from working capital. Franco-Nevada does not anticipate that such costs will make development of any asset uneconomic or will have any material impact on disclosed reserves or future net revenue. All costs are to be incurred in Canada.
Other Oil & Gas Information
Forward Contracts
Franco-Nevada does not have any forward contracts for oil or natural gas.
Additional Information Concerning Abandonment and Reclamation Costs
Franco-Nevada is liable for ongoing environmental obligations and for the ultimate abandonment and reclamation costs for its oil, gas, and NGL assets (including surface leases, wells, facilities and pipelines) upon abandonment only in respect of its working interest in the Weyburn Unit and Midale Unit. There are no ongoing obligations of Franco-Nevada on its royalty interests in oil and natural gas assets. Franco-Nevada identifies obligations related to its oil, gas and NGL assets by estimating the present value of expected future costs to reclaim and abandon these properties and the timing of costs to be incurred in future periods.
The estimates for abandonment are currently based on 16.5 net wells of which Franco-Nevada expects to incur such costs. Franco-Nevada anticipates the total amount of such costs to be approximately C$895,000 on an undiscounted basis (approximately C$120,000 discounted at 10 percent). Of this amount, Franco-Nevada anticipates that approximately C$16,000 (undiscounted) will be incurred in the next three financial years.
Tax Horizon
Franco-Nevada is taxable at an expected rate of approximately 26% on the revenue from the oil and natural gas royalty and working interests.
Costs Incurred
The following table sets out Franco-Nevada’s property acquisition, exploration and development costs for the fiscal year ended December 31, 2011.
|
| Proved |
| Unproved |
| |||||||||||
Location |
| Property |
| Exploration |
| Development |
| Property |
| Total |
| |||||
Canada (C$000) |
| $ | — |
| $ | — |
| $ | 2,583 |
| $ | — |
| $ | 2,469 |
|
Exploration and Development Activities
The following table summarizes the number and type of wells that Franco-Nevada drilled or participated in drilling for the fiscal year ended December 31, 2011. All of Franco-Nevada’s current exploration and development activities are in Canada.
|
|
|
|
|
| Net Wells Drilled |
| ||||||||
|
| Gross |
| Net |
| Oil |
| Gas |
| Service |
| Dry |
| Stratigraphic |
|
Exploratory Wells |
| — |
| — |
| — |
| — |
| — |
| — |
| — |
|
Development Wells |
| 37.0 |
| 0.4 |
| 0.1 |
| — |
| 0.3 |
| — |
| — |
|
|
|
|
|
|
|
|
|
|
|
|
|
|
|
|
|
Total (Canada) |
| 37.0 |
| 0.4 |
| 0.1 |
| — |
| 0.3 |
| — |
| — |
|
Production Estimates
The following tables present GLJ’s and forecasted case for proved and proved plus probable average daily production by product type for 2012. All production is from Canada. The production of natural gas and natural gas liquids from the Edson Property will exceed 35% of Franco-Nevada’s production of natural gas, natural gas liquids and oil for the 12 months ended December 31, 2012. Edson is expected to account for 60% of all natural gas production and 99% of all natural gas liquids production.
2012 Average Daily Production from Total Proved Reserves (Forecast Case)
|
| Light and |
| Heavy Oil |
| Natural Gas |
| Natural Gas |
| ||||||||
|
| Gross |
| Net |
| Gross |
| Net |
| Gross |
| Net |
| Gross |
| Net |
|
Total Proved |
|
|
|
|
|
|
|
|
|
|
|
|
|
|
|
|
|
Edson |
| 0 |
| 0 |
| 0 |
| 0 |
| 0 |
| 2,781 |
| 0 |
| 124 |
|
Other Properties |
| 395 |
| 725 |
| 0 |
| 25 |
| 5 |
| 1,814 |
| 0 |
| 2 |
|
Total: Total Proved |
| 395 |
| 725 |
| 0 |
| 25 |
| 5 |
| 4,595 |
| 0 |
| 125 |
|
2012 Average Daily Production from Total Proved Plus Probable Reserves (Forecast Case)
|
| Light and |
| Heavy Oil |
| Natural Gas |
| Natural Gas |
| ||||||||
|
| Gross |
| Net |
| Gross |
| Net |
| Gross |
| Net |
| Gross |
| Net |
|
Total Proved Plus Probable |
|
|
|
|
|
|
|
|
|
|
|
|
|
|
|
|
|
Edson |
| 0 |
| 0 |
| 0 |
| 0 |
| 0 |
| 2,904 |
| 0 |
| 129 |
|
Other Properties |
| 409 |
| 749 |
| 0 |
| 25 |
| 5 |
| 1,854 |
| 0 |
| 2 |
|
Total: Total Proved Plus Probable |
| 409 |
| 749 |
| 0 |
| 25 |
| 5 |
| 4,759 |
| 0 |
| 131 |
|
Production History
The following table sets forth Franco-Nevada’s Oil & Gas Assets’ average daily production volumes for oil, natural gas and natural gas liquids, before deduction of royalties, for each fiscal quarter in 2011.
|
| Average Daily Production (boe/d) |
| ||||||
2011 |
| Oil |
| Natural Gas |
| Natural Gas |
| Total |
|
First Quarter |
| 789 |
| 990 |
| 171 |
| 1,950 |
|
Second Quarter |
| 720 |
| 919 |
| 151 |
| 1,790 |
|
Third Quarter |
| 714 |
| 951 |
| 153 |
| 1,819 |
|
Fourth Quarter |
| 793 |
| 902 |
| 146 |
| 1,841 |
|
The following table sets forth Franco-Nevada’s Oil & Gas Assets’ average prices received, royalties paid, production costs and resulting netback for oil, natural gas and natural gas liquids for each fiscal quarter in 2011.
Oil ($C/bbl) |
| Q1 |
| Q2 |
| Q3 |
| Q4 |
| ||||
Price received |
| $ | 71.41 |
| $ | 98.06 |
| $ | 86.02 |
| $ | 80.96 |
|
Royalties Paid |
| 5.45 |
| 8.56 |
| 7.58 |
| 6.38 |
| ||||
Production costs |
| 4.17 |
| 5.53 |
| 6.98 |
| 5.98 |
| ||||
|
|
|
|
|
|
|
|
|
| ||||
Netback |
| $ | 61.79 |
| $ | 83.97 |
| $ | 71.46 |
| $ | 68.60 |
|
Natural Gas ($C/Mcf) |
| Q1 |
| Q2 |
| Q3 |
| Q4 |
| ||||
Price received |
| $ | 2.41 |
| $ | 3.52 |
| $ | 3.00 |
| $ | 3.30 |
|
Royalties Paid |
| — |
| — |
| — |
| — |
| ||||
Production costs |
| — |
| — |
| — |
| — |
| ||||
|
|
|
|
|
|
|
|
|
| ||||
Netback |
| $ | 2.41 |
| $ | 3.52 |
| $ | 3.00 |
| $ | 3.30 |
|
NGL($C/bbl) |
| Q1 |
| Q2 |
| Q3 |
| Q4 |
| ||||
Price received |
| $ | 60.72 |
| $ | 89.30 |
| $ | 76.90 |
| $ | 70.16 |
|
Royalties Paid |
| — |
| — |
| — |
| — |
| ||||
Production costs |
| — |
| — |
| — |
| — |
| ||||
|
|
|
|
|
|
|
|
|
| ||||
Netback |
| $ | 60.72 |
| $ | 89.30 |
| $ | 76.90 |
| $ | 70.16 |
|
The following table sets forth Franco-Nevada’s Oil & Gas Assets’ production volumes for oil, natural gas and natural gas liquids, for the twelve months ended December 31, 2011.
Production (Mboe) |
| Oil |
| Natural Gas |
| Natural Gas |
| Total |
|
|
|
|
|
|
|
|
|
|
|
Weyburn Unit |
| 145.8 |
| — |
| — |
| 145.8 |
|
Midale Unit |
| 48.4 |
| — |
| — |
| 48.4 |
|
Edson |
| — |
| 199.3 |
| 56.7 |
| 256.0 |
|
Other |
| 98.2 |
| 126.7 |
| — |
| 224.9 |
|
|
|
|
|
|
|
|
|
|
|
Total |
| 292.4 |
| 325.9 |
| 56.7 |
| 675.1 |
|
Definitions, Notes and Other Cautionary Statements
In the tables set forth above under the subheading “Statement of Reserves Data and Other Oil and Natural Gas Information” and elsewhere in this AIF, unless otherwise indicated, the following definitions and other notes are applicable.
“Gross” means:
(a) in relation to the Corporation’s interest in production or reserves, its “company gross reserves”, which are its working interest (operating or non-operating) share before deduction of royalties and without including any royalty interests of the Corporation;
(b) in relation to wells, the total number of wells in which the Corporation has an interest; and
(c) in relation to properties, the total area of properties in which the Corporation has an interest.
“Net” means:
(a) in relation to the Corporation’s interest in production or reserves its working interest (operating or non-operating) share after deduction of royalty obligations, plus the Corporation’s royalty interests in production or reserves;
(b) in relation to the Corporation’s interest in wells, the number of wells obtained by aggregating the Corporation’s working interest in each of its gross wells; and
(c) in relation to the Corporation’s interest in a property, the total area in which the Corporation has an interest multiplied by the working interest owned by the Corporation.
Definitions of Reserves:
Reserves Categories
Reserves are estimated remaining quantities of oil and natural gas and related substances anticipated to be recoverable from known accumulations, from a given date forward, based on:
(a) analysis of drilling, geological, geophysical and engineering data;
(b) the use of established technology; and
(c) specified economic conditions, which are generally accepted as being reasonable, and shall be disclosed.
Reserves are classified according to the degree of certainty associated with the estimates.
(a) Proved reserves are those reserves that can be estimated with a high degree of certainty to be recoverable. It is likely that the actual remaining quantities recovered will exceed the estimated proved reserves.
(b) Probable reserves are those additional reserves that are less certain to be recovered than proved reserves. It is equally likely that the actual remaining quantities recovered will be greater or less than the sum of the estimated proved plus probable reserves.
(c) Possible reserves are those additional reserves that are less certain to be recovered than probable reserves. It is unlikely that the actual remaining quantities recovered will exceed the sum of the estimated proved plus probable plus possible reserves.
Development and Production Status
Each of the reserves categories (proved, probable and possible) may be divided into developed and undeveloped categories:
(a) Developed reserves are those reserves that are expected to be recovered from existing wells and installed facilities or, if facilities have not been installed, that would involve a low expenditure (for example, when compared to the cost of drilling a well) to put the reserves on production. The developed category may be subdivided into producing and non-producing.
(i) Developed producing reserves are those reserves that are expected to be recovered from completion intervals open at the time of the estimate. These reserves may be currently producing or, if shut-in, they must have previously been on production, and the date of resumption of production must be known with reasonable certainty.
(ii) Developed non-producing reserves are those reserves that either have not been on production, or have previously been on production, but are shut-in, and the date of resumption of production is unknown.
(b) Undeveloped reserves are those reserves expected to be recovered from known accumulations where a significant expenditure (for example, when compared to the cost of drilling a well) is required to render them capable of production. They must fully meet the requirements of the reserves classification (proved, probable, possible) to which they are assigned.
In multi-well pools it may be appropriate to allocate total pool reserves between the developed and undeveloped categories or to subdivide the developed reserves for the pool between developed producing and developed non-producing. This allocation should be based on the estimator’s assessment as to the reserves that will be recovered from specific wells, facilities and completion intervals in the pool and their respective development and production status.
Levels of Certainty for Reported Reserves
The qualitative certainty levels referred to in the definitions above are applicable to “individual reserve entities” (which refers to the lowest level at which reserves calculations are performed) and to “reported reserves” (which refers to the highest level sum of individual entity estimates for which reserves are presented). Reported reserves should target the following levels of certainty under a specific set of economic conditions:
(a) at least a 90% probability that the quantities actually recovered will equal or exceed the estimated proved reserves;
(b) at least a 50% probability that the quantities actually recovered will equal or exceed the sum of the estimated proved plus probable reserves;
(c) at least a 10% probability that the quantities actually recovered will equal or exceed the sum of the estimated proved plus probable plus possible reserves.
A quantitative measure of the certainty levels pertaining to estimates prepared for the various reserves categories is desirable to provide a clearer understanding of the associated risks and uncertainties. However, the majority of reserves estimates will be prepared using deterministic methods that do not provide a mathematically derived quantitative measure of probability. In principle, there should be no difference between estimates prepared using probabilistic or deterministic methods.
Future Income Tax Expense
Future income tax expenses are estimated:
(a) making appropriate allocations of estimated unclaimed costs and losses carried forward for tax purposes between oil and gas activities and other business activities;
(b) without deducting estimated future costs that are not deductible in computing taxable income;
(c) taking into account estimated tax credits and allowances; and
(d) applying to the future pre-tax net cash flows relating to the Corporation’s oil and gas activities the appropriate year-end statutory tax rates, taking into account future tax rates already legislated.
“Development costs” means costs incurred to obtain access to reserves and to provide facilities for extracting, treating, gathering and storing the oil and gas from reserves. More specifically, development costs, including applicable operating costs of support equipment and facilities and other costs of development activities, are costs incurred to:
(a) gain access to and prepare well locations for drilling, including surveying well locations for the purpose of determining specific development drilling sites, clearing ground, draining, road building, and relocating public roads, gas lines and power lines to the extent necessary in developing the reserves;
(b) drill and equip development wells, development type stratigraphic test wells and service wells, including the costs of platforms and of well equipment such as casing, tubing, pumping equipment and wellhead assembly;
(c) acquire, construct and install production facilities such as flow lines, separators, treaters, heaters, manifolds, measuring devices and production storage tanks, natural gas cycling and processing plants, and central utility and waste disposal systems; and
(d) provide improved recovery systems.
“Development well” means a well drilled inside the established limits of an oil and gas reservoir, or in close proximity to the edge of the reservoir, to the depth of a stratigraphic horizon known to be productive.
“Exploration costs” means costs incurred in identifying areas that may warrant examination and in examining specific areas that are considered to have prospects that may contain oil and gas reserves, including costs of drilling exploratory wells and exploratory type stratigraphic test wells. Exploration costs may be incurred both before acquiring the related property and after acquiring the property. Exploration costs, which include applicable operating costs of support equipment and facilities and other costs of exploration activities, are:
(a) costs of topographical, geochemical, geological and geophysical studies, rights of access to properties to conduct those studies, and salaries and other expenses of geologists, geophysical crews and others conducting those studies;
(b) costs of carrying and retaining unproved properties, such as delay rentals, taxes (other than income and capital taxes) on properties, legal costs for title defence, and the maintenance of land and lease records;
(c) dry hole contributions and bottom hole contributions;
(d) costs of drilling and equipping exploratory wells; and
(e) costs of drilling exploratory type stratigraphic test wells.
“Exploration well” means a well that is not a development well, a service well or a stratigraphic test well.
“Service well” means a well drilled or completed for the purpose of supporting production in an existing field. Wells in this class are drilled for the following specific purposes: gas injection (natural gas, propane, butane or flue gas), water injection, steam injection, air injection, salt water disposal, water supply for injection, observation or injection for combustion.
Numbers may not add due to rounding.
The estimates of future net revenue presented do not represent fair market value.
The forecast price and cost assumptions assume the continuance of current laws and regulations.
RISK FACTORS
Investors should carefully consider all of the information disclosed in this AIF prior to investing in the securities of Franco-Nevada. In addition to the other information presented in this AIF, the following risk factors should be given special consideration when evaluating an investment in such securities.
Risks Related to the Business of Franco-Nevada
Changes in the market price of the commodities that underlie the royalty, stream, working and other interests will affect the profitability of Franco-Nevada and the revenue generated therefrom
The revenue derived by Franco-Nevada from its asset portfolio, working interests and investments will be significantly affected by changes in the market price of the commodities underlying the royalties, streams, working interests and investments. Franco-Nevada’s revenue will be particularly sensitive to changes in the price of gold, oil, natural gas, PGMs and copper, as the revenue from these commodities represents the majority of the cash flow derived from the asset portfolio. Commodity prices, including those to which Franco-Nevada is exposed, fluctuate on a daily basis and are affected by numerous factors beyond the control of Franco-Nevada, including levels of supply and demand, industrial development levels, inflation and the level of interest rates, the strength of the U.S. dollar and geopolitical events in significant oil and natural gas producing countries. Such external economic factors are in turn influenced by changes in international investment patterns, monetary systems and political developments.
All commodities, by their nature, are subject to wide price fluctuations and future material price declines will result in a decrease in revenue or, in the case of severe declines that cause a suspension or termination of production by relevant operators, a complete cessation of revenue from royalties, streams or working interests applicable to one or more relevant commodities. Moreover, despite Franco-Nevada’s commodity diversification, the broader commodity market tends to be cyclical, and a general downturn in overall commodity prices could result in a significant decrease in overall revenue. Any such price decline may result in a material and adverse effect on Franco-Nevada’s profitability, results of operation and financial condition.
Gold is produced or will be produced as a by-product metal at some of the assets including the Palmarejo project, Sudbury project, MWS project and Ezulwini project, therefore, production, decisions and the economic cut-off applied to the reporting of gold reserves and resources will be influenced by changes in the commodity prices of other metals at the mines.
For Mineral Assets that are subject to stream agreements, in the event that the price of gold falls below $400, Franco-Nevada would not realize any profits.
The operation of the properties in which Franco-Nevada holds an interest is generally determined by third party property owners and operators, and Franco-Nevada has limited decision making power as to how these properties are operated, and the operators’ failure to perform could affect the revenues generated by Franco-Nevada
Franco-Nevada is not directly involved in the operation of mines. The revenue derived from the asset portfolio is based on production by third party property owners and operators. The owners and operators will generally have the power to determine the manner in which the relevant properties subject to the asset portfolio are exploited, including decisions to expand, continue or reduce, suspend or discontinue production from a property, decisions about the marketing of products extracted from the property and decisions to advance exploration efforts and conduct development of non-producing properties. The interests of third party owners and operators and those of Franco-Nevada on the relevant properties may not always be aligned. As an example, it will usually be in the interest of Franco-Nevada to advance development and production on properties as rapidly as possible in order to maximize near-term cash flow, while third party owners and operators may take a more cautious approach to development as they are at risk on the cost of development and operations. The inability of Franco-Nevada to control the operations for the properties in which it has a royalty, stream or working interest may result in a material and adverse effect on Franco-Nevada’s profitability, results of operation and financial condition. In addition, the owners or operators may take action contrary to Franco-Nevada’s policies or objectives; be unable or unwilling to fulfill their obligations under their agreements with Franco-Nevada; have difficulty obtaining or be unable to obtain the financing necessary to move projects forward; or experience financial, operational or other difficulties, including insolvency which could limit a third party’s ability to perform its obligations under the third party arrangements.
Franco-Nevada may not be entitled to any material compensation if any of the properties in which it holds a royalty, stream or other interest shuts down or discontinues their operations on a temporary or permanent basis. At any time, any of the operators of the properties in which it holds a royalty, stream or other interest or their successors may decide to suspend or discontinue operations.
The owners or operators of the projects in which Franco-Nevada holds an interest may from time to time announce transactions, including the sale or transfer of the projects or of the operator itself, over which Franco-Nevada has little or no control. If such transactions are completed it may result in a new operator controlling the project, who may or may not operate the project in a similar manner to the current operator which may positively or negatively impact Franco-Nevada. In the event any such transaction is announced, such as FIU’s proposed sale of MWS to AngloGold Ashanti and proposed sale of Ezulwini to Gold One, there is no certainty that such transaction will be completed, or completed as announced, and any consequences of such non-completion on Franco-Nevada may be difficult or impossible to predict.
Franco-Nevada will have limited access to data and disclosure regarding the operation of properties, which will affect its ability to assess the royalty’s/stream’s performance
As a royalty/stream holder, Franco-Nevada has varying access to data on the operations or to the actual properties themselves. This could affect its ability to assess the performance of the royalty/stream. This could result in delays in cash flow from that anticipated by Franco-Nevada based on the stage of development of the properties covered by the asset portfolio. In addition, some royalties/streams may be subject to confidentiality arrangements which govern the disclosure of information with regard to royalties/streams and, as such, Franco-Nevada may not be in a position to publicly disclose non-public information with respect to certain royalties/streams. The limited access to data and disclosure regarding the operations of the properties in which Franco-Nevada has an interest, may restrict Franco-Nevada’s ability to enhance its performance which may result in a material and adverse effect on Franco-Nevada’s profitability, results of operation and financial condition. Although when creating new royalty or stream agreements, we attempt to obtain these rights, there is no assurance that our efforts will be successful.
Franco-Nevada depends on its operators for the calculation of royalty/stream payments. It may not be able to detect errors and payment calculations may call for retroactive adjustments
Franco-Nevada’s royalty/stream payments are calculated by the operators of the properties on which Franco-Nevada has royalties/streams based on the reported production. Each operator’s calculation of our royalty/stream payments is subject to and dependent upon the adequacy and accuracy of its production and accounting functions, and errors may occur from time to time in the calculations made by an operator. Certain royalty/stream agreements require the operators to provide Franco-Nevada with production and operating information that may, depending on the completeness and accuracy of such information, enable Franco-Nevada to detect errors in the calculation of royalty/stream payments that it receives. Franco-Nevada does not, however, have the contractual right to receive production information for all of its royalty/stream interests. As a result, Franco-Nevada’s ability to detect royalty/stream payment errors through its royalty/stream monitoring program and its associated internal controls and procedures is limited, and the possibility exists that Franco-Nevada will need to make retroactive royalty/stream revenue adjustments. Some of our royalty/stream contracts provide us the right to audit the operational calculations and production data for the associated royalty/stream payments; however, such audits may occur many months following our recognition of the royalty/stream revenue and may require us to adjust our revenue in later periods.
Several royalties/streams are significant to Franco-Nevada and any adverse development related to these properties will affect the revenue derived from the royalty/stream
The stream on the Palmarejo project and the royalties on the Goldstrike complex are significant to Franco-Nevada. Any adverse development affecting the operation of, production from or recoverability of reserves from the Palmarejo project or the Goldstrike complex, or any other significant property in the asset portfolio from time to time, such as, but not limited to, unusual and unexpected geologic formations, seismic activity, rock bursts, cave-ins, flooding and other conditions involved in the drilling and removal of material, any of which could result in damage to, or destruction of, mines and other producing facilities, damage to life or property, environmental damage, hiring suitable personnel and engineering contractors, or securing supply agreements on commercially suitable terms, may have a material adverse effect on Franco-Nevada’s profitability, financial condition and results of operations. In addition, Franco-Nevada has no control over operational decisions made by the third party owners and operators of these projects. Any adverse decision made by the owners and operators, including for example, alterations to mine plans or production schedules, may impact the timing and amount of revenue that Franco-Nevada receives and may have a material and adverse effect on Franco-Nevada’s profitability, financial condition and results of operation. As mines on which Franco-Nevada has royalties/streams mature, it can expect overall declines in production over the years unless operators are able to replace reserves that are mined through mine expansion or successful new exploration.
Franco-Nevada is dependent on the payment of royalties/streams by the owners and operators of the relevant properties and any delay in or failure of such royalty/stream payments will affect the revenues generated by the asset portfolio
Franco-Nevada is dependent to a large extent upon the financial viability and operational effectiveness of owners and operators of the relevant royalty/stream properties. Payments from production generally flow through the operator and there is a risk of delay and additional expense in receiving such revenues. Payments may be delayed by restrictions imposed by lenders, delays in the sale or delivery of products, the ability or willingness of smelters and refiners to process mine products, delays in the connection of wells to a gathering system, blowouts or other accidents, recovery by the operators of expenses incurred in the operation of the royalty/stream properties, the establishment by the operators of reserves for such expenses or the insolvency of the operator. Franco-Nevada’s rights to payment under the royalties/streams must, in most cases, be enforced by contract without the protection of a security interest over property that Franco-Nevada could readily liquidate. This inhibits Franco-Nevada’s ability to collect outstanding royalties/streams upon a default. In the event of a bankruptcy of an operator or owner, Franco-Nevada will be treated as an unsecured creditor and, therefore, have a limited prospect for full recovery of revenue. Failure to receive any payments from the owners and operators of the relevant properties may result in a material and adverse effect on Franco-Nevada’s profitability, results of operation and financial condition.
Certain royalty/stream interests and working interests included in the royalty/stream interests are subject to rights in favour of others or third parties that could adversely affect the revenues generated from the asset portfolio
Some royalty/stream interests and working interests in the royalty/stream interests are subject to: (i) buy-down right provisions pursuant to which an operator may buy-back all or a portion of the royalty/stream, (ii) pre-emptive rights pursuant to which parties to operating and royalty/stream agreements have the right of first refusal or first offer with respect to a proposed sale or assignment of a royalty/stream to Franco-Nevada, or (iii) claw back rights pursuant to which the seller of a royalty/stream to Franco-Nevada has the right to re-acquire the royalty/stream. Holders may exercise these rights such that certain royalty/stream interests and working interests would not be available to Franco-Nevada.
The asset portfolio includes a number of royalty interests based on net profits, and the revenue derived from such royalty interests is dependent upon factors beyond the control of Franco-Nevada that may have an adverse effect on the overall revenues generated by the asset portfolio
Franco-Nevada holds a number of net profit royalties, equity interests and working interests in its asset portfolio. These royalties and other interests allow the operator to account for the effect of prevailing cost pressures on the project before calculating the royalty payable to Franco-Nevada. These cost pressures include costs of labour, equipment, fuel, electricity, environmental compliance, oil prices and numerous other capital, operating and production inputs. Such costs will fluctuate in ways that are unpredictable and are beyond the control of Franco-Nevada, and can have a dramatic effect on the revenue payable to Franco-Nevada on these royalties and other interests. Any increase in the costs incurred by the operators on the applicable properties will likely result in a decline in the royalty revenue received by Franco-Nevada. This will affect overall revenue generated by the asset portfolio which may have a material and adverse effect on Franco-Nevada’s profitability, financial condition, and results of operation.
Franco-Nevada may enter into acquisitions or other material royalty or streaming transactions at any time
Franco-Nevada is continuously reviewing opportunities to acquire existing royalties or streams, to create new royalty interests or streaming arrangements through the financing of mining projects or to acquire companies that hold royalties or streams. Franco-Nevada has various types of transactions and acquisition opportunities in various stages of active review, including submission of indications of interest and participation in discussions or negotiations in respect of such transactions. This process also involves the engagement of consultants and advisors to assist in analyzing particular opportunities. Any such acquisition or transaction could be material to Franco-Nevada and may involve the issuance of securities by Franco-Nevada or the incurring of indebtedness to fund any such acquisition. In addition, any such acquisition or other royalty or streaming transaction may have other transaction specific risks associated with it, including risks related to the completion of the transaction, the project operators or the jurisdictions in which assets may be acquired.
Additionally, Franco-Nevada may consider opportunities to restructure its royalties or stream arrangements where it believes such a restructuring may provide a long-term benefit to Franco-Nevada, even if such restructuring may reduce near-term revenues or result in Franco-Nevada incurring transaction related costs.
Franco-Nevada may enter into one or more acquisitions, restructurings or other royalty and streaming transactions at any time.
Franco-Nevada may experience difficulty attracting and retaining qualified management and technical personnel to efficiently operate its business
Franco-Nevada is dependent upon the continued availability and commitment of its key management, whose contributions to immediate and future operations of Franco-Nevada are of significant importance. The loss of any such key management could negatively affect business operations. From time to time, Franco-Nevada may also need to identify and retain additional skilled management and specialized technical personnel to efficiently operate its business. The number of persons skilled in the acquisition, exploration and development of royalties/streams and interests in natural resource properties is limited and competition for such persons is intense. Recruiting and retaining qualified personnel is critical to Franco-Nevada’s success and there can be no assurance of such success. If Franco-Nevada is not successful in attracting and training qualified personnel, Franco-Nevada’s ability to execute its business model and growth strategy could be affected, which could have a material and adverse impact on its profitability, results of operations and financial condition. Franco-Nevada does not intend to maintain “key man” insurance for any members of its management.
Increased competition for royalty/stream interests and resource investments could adversely affect Franco-Nevada’s ability to acquire additional royalties, streams and other investments in mineral and oil and natural gas properties
Many companies are engaged in the search for and the acquisition of mineral and oil and natural gas interests, and there is a limited supply of desirable mineral and oil and natural gas interests. The mineral exploration and mining and oil and natural gas businesses are competitive in all phases. Many companies are engaged in the acquisition of mining and gas interests, including large, established companies with substantial financial resources, operational capabilities and long earnings records. Franco-Nevada may be at a competitive disadvantage in acquiring interests in these natural resource properties, whether by way of royalty, stream or other form of investment, as many competitors have greater financial resources and technical staffs. There can be no assurance that Franco-Nevada will be able to compete successfully against other companies in acquiring new natural resource properties and royalty/stream interests. In addition, Franco-Nevada may be unable to acquire royalties or streams at acceptable valuations. Franco-Nevada’s inability to acquire additional royalty/stream interests and other investments in mineral and oil and natural gas properties may result in a material and adverse effect on Franco-Nevada’s profitability, results of operation and financial condition.
Royalty/stream and other interests may not be honoured by operators of a project
Royalty/stream and other interests in natural resource properties are largely contractual in nature. Parties to contracts do not always honour contractual terms and contracts themselves may be subject to interpretation or technical defects. To the extent grantors of royalty/stream and other interests do not abide by their contractual obligations, Franco-Nevada would be forced to take legal action to enforce its contractual rights. Such litigation may be time consuming and costly and there is no guarantee of success. While any proceedings or actions are pending, or if any decision is determined adversely to Franco-Nevada, that may have a material and adverse effect on Franco-Nevada’s profitability, results of operations and financial condition.
There may be unknown defects in the asset portfolio
A defect in a royalty, stream, working interest or equity interest and/or the underlying contract may arise to defeat or impair the claim of Franco-Nevada to such royalty, working interest or equity interest. When Franco-Nevada acquired the assets from Newmont it was not provided with title representations and warranties relating to the royalties and various equity interests in the Newmont Acquisition Agreement. Newmont only represented that it would transfer the extent of its interest in the assets to Franco-Nevada. If there was a defect in Newmont’s interest in the royalties, working interest or equity interest and/or the underlying contract, Franco-Nevada will not have any recourse against Newmont under the Newmont Acquisition Agreement. Unknown defects in the royalty, stream or other assets of Franco-Nevada may result in a material and adverse effect on Franco-Nevada’s profitability, results of operation and financial condition.
Current global financial conditions continue to be challenging
Following the onset of the credit crisis in 2008, global financial conditions were characterized by increased volatility, with numerous financial institutions having either gone into bankruptcy or having to be rescued by government authorities. While global financial conditions have stabilized somewhat, there remains considerable risk in the global financial system given the extraordinary measures adopted by government authorities to achieve that stability. The deteriorating financial condition of certain government authorities has significantly increased the potential for sovereign defaults in a number of jurisdictions, including within the European Union. Global financial conditions could suddenly and rapidly destabilize in response to future events, as government authorities may have limited resources to respond to future crises. Global capital markets have continued to display increased volatility in response to global events. Future crises may be precipitated by any number of causes, including natural disasters, geopolitical instability, changes to energy prices or sovereign defaults.
Any sudden or rapid destabilization of global economic conditions could negatively impact Franco-Nevada’s ability, or the ability of the operators of the properties in which Franco-Nevada holds royalties, streams or other interests, to obtain equity or debt financing. Additionally, Franco-Nevada may be subject to counterparty risk and liquidity risk. Franco-Nevada is exposed to various counterparty risks including, but not limited to (i) through financial institutions that hold Franco-Nevada’s cash, (ii) through companies that have payables to Franco-Nevada, (iii) through Franco-Nevada’s insurance providers, and (iv) through Franco-Nevada’s lenders. Franco-Nevada is also exposed to liquidity risks in meeting its operating expenditure requirements in instances where cash positions are unable to be maintained or appropriate financing is unavailable. These factors may impact the ability of Franco-Nevada to obtain loans and other credit facilities in the future and, if obtained, on
terms favourable to Franco-Nevada. If increased levels of volatility continue or in the event of a rapid destabilization of global economic conditions, Franco-Nevada’s operations could be adversely impacted and the trading price of the Common Shares could be adversely affected.
Franco-Nevada’s revenue, earnings, the value of its treasury and the value it records for its assets are subject to variations in foreign exchange rates, which may adversely affect the revenue generated by the asset portfolio or cause adjustments to the recorded value of assets
Franco-Nevada’s royalty/stream interests are subject to foreign currency fluctuations and inflationary pressures, which may have a material and adverse effect on Franco-Nevada’s profitability, results of operation and financial condition. There can be no assurance that the steps taken by management to address variations in foreign exchange rates will eliminate all adverse effects and Franco-Nevada may suffer losses due to adverse foreign currency rate fluctuations.
The ability to pay dividends will be dependent on the financial condition of Franco-Nevada
Payment of dividends on the Common Shares is within the discretion of Franco-Nevada’s board of directors and will depend upon Franco-Nevada’s future earnings, cash flows, acquisition capital requirements and financial condition, and other relevant factors. Although Franco-Nevada intends to pay a regular dividend, there can be no assurance that it will be in a position to declare dividends due to the occurrence of one or more of the risks described herein.
Changes in tax legislation could affect the profitability of Franco-Nevada
Changes to, or differing interpretation of, taxation laws in any of Canada, the United States, Mexico, Barbados, Australia or any of the countries in which Franco-Nevada’s assets are located could result in some or all of Franco-Nevada’s profits being subject to additional taxation. No assurance can be given that new taxation rules will not be enacted or that existing rules will not be applied in a manner which could result in Franco-Nevada’s profits being subject to additional taxation which could have a material adverse effect on Franco-Nevada.
Certain of Franco-Nevada’s directors and officers serve in similar positions with other public companies, which put them in a conflict position from time to time
Certain of the directors and officers of Franco-Nevada also serve as directors or officers of, or have significant shareholdings in, other companies involved in natural resource exploration and development and, to the extent that such other companies may participate in the same ventures in which Franco-Nevada participates, or in ventures in which Franco-Nevada may seek to participate, the directors and officers of Franco-Nevada may have a conflict of interest in negotiating and concluding terms respecting the extent of such participation. In all cases where directors and officers have an interest in other companies, such other companies may also compete with Franco-Nevada for the acquisition of royalties/streams, or mineral or oil and natural gas property investments. Such conflicts of the directors and officers may result in a material and adverse effect on Franco-Nevada’s profitability, results of operation and financial condition.
Franco-Nevada can provide no assurance that it will be able to obtain adequate financing in the future or that the terms of such financing will be favourable and Franco-Nevada may have to raise additional capital through the issuance of additional equity, which will result in dilution to Franco-Nevada’s shareholders
There can be no assurance that Franco-Nevada will be able to obtain adequate financing in the future or that the terms of such financing will be favourable. Failure to obtain such additional financing could result in delay or postponement of further business activities which may result in a material and adverse effect on Franco-Nevada’s profitability, results of operation and financial condition. Franco-Nevada may require new capital to continue to grow its business and there are no assurances that capital will be available when needed, if at all. It is likely that such additional capital will be raised through the issuance of additional equity, which will result in dilution to shareholders.
If Franco-Nevada expands its business beyond the acquisition of royalty/stream interests, Franco-Nevada may face new challenges and risks which could affect its profitability, results of operations and financial condition
Franco-Nevada’s operations and expertise have been focused on the acquisition and management of royalty/stream interests. Franco-Nevada may pursue acquisitions outside this area, including acquiring and/or investing in, developing resource projects. Expansion of Franco-Nevada’s activities into new areas would present challenges and risks that it has not faced in the past, including many of the risks described under “Risks Related to Mining Operations and Oil and Natural Gas Operations”. The failure to manage these
challenges and risks successfully may result in a material and adverse effect on Franco-Nevada’s profitability, results of operation and financial condition.
Risks Related to Mining Operations and Oil and Natural Gas Operations
Franco-Nevada is subject to the same risk factors as the properties in which it holds a royalty, stream or other interests
To the extent that they relate to the production of gold or other precious metals from, or the continued operation of, the properties in which Franco-Nevada holds a royalty, stream or interest, Franco-Nevada will be subject to the risk factors applicable to the operators of such mines or projects.
The inability to add additional reserves to its asset portfolio through either the development of existing resources or the acquisition of new mineral or oil and natural gas producing assets could affect Franco-Nevada
The revenue generated by Franco-Nevada is principally based on the exploitation of mineral and oil and natural gas reserves on assets underlying the royalty/stream interests and on which Franco-Nevada has a royalty, stream or other interest. Such reserves are continually being depleted through extraction and the long-term viability of the asset portfolio depends on the replacement of reserves through new producing assets and increases in reserves on existing producing assets. While Franco-Nevada may be able to maintain all or a portion of its interest in its reserve inventory through acquisitions, its business model relies on the successful development of the non-producing properties in its asset portfolio. Exploration for minerals and energy resources is a speculative venture necessarily involving substantial risk. There is no certainty that the expenditures made by the operator of any given project will result in discoveries of commercial quantities of minerals or energy resources on properties underlying the asset portfolio. Even in those cases where a significant mineral or oil and natural gas deposit is identified, there is no guarantee that the deposit can be economically extracted. Substantial expenditures are required to establish reserves through drilling, to develop processes to extract the resources and, in the case of new properties, to develop the extraction and processing facilities and infrastructure at any site chosen for extraction. Although substantial benefits may be derived from the discovery of a major deposit, no assurance can be given that new reserves will be identified to replace or increase the amount of reserves currently in the asset portfolio. This includes mineral resources, as the resources that have been discovered have not been subjected to sufficient analysis to justify commercial operations or the allocation of funds required for development. The inability to add additional reserves or to replace existing reserves through either the development of existing resources or the acquisition of new mineral or oil and natural gas producing assets may result in a material and adverse effect on Franco-Nevada’s profitability, results of operation and financial condition.
Reserves and resources are estimates based on interpretation and assumption and actual production may differ from amounts identified in such estimates
The mineral and oil and natural gas reserves and resources on properties underlying Franco-Nevada’s royalty/stream interests are estimates only, and no assurance can be given that the estimated reserves and resources are accurate or that the indicated level of minerals and oil and natural gas will be produced. Such estimates are, in large part, based on interpretations of geological data obtained from drill holes and other sampling techniques. Actual mineralization or formations may be different from those predicted. Further, it may take many years from the initial phase of drilling before production is possible and during that time the economic feasibility of exploiting a discovery may change.
Resource estimates in particular must be considered with caution. Resource estimates for properties that have not commenced production are based, in many instances, on limited and widely spaced drill hole or other limited information, which is not necessarily indicative of the conditions between and around drill holes. Such resource estimates may require revision as more drilling or other exploration information becomes available or as actual production experience is gained. Further, resources may not have demonstrated economic viability and may never be extracted by the operator of a property. It should not be assumed that any part or all of the mineral resources on properties underlying Franco-Nevada’s royalty/stream interests constitute or will be converted into reserves. Market price fluctuations of the applicable commodity, as well as increased production and capital costs or reduced recovery rates, may render the proven and probable reserves on properties underlying Franco-Nevada’s royalty/stream interests unprofitable to develop at a particular site or sites for periods of time or may render reserves containing relatively lower grade mineralization uneconomic. Moreover, short-term operating factors relating to the reserves, such as the need for the orderly development of ore bodies or the processing of new or different ore grades, may cause reserves to be reduced or not
extracted. Estimated reserves may have to be recalculated based on actual production experience. Any of these factors may require operators to reduce their reserves and resources, which may result in a material and adverse effect on Franco-Nevada’s profitability, results of operation and financial condition.
The exploration and development of mining and resource properties is inherently dangerous and subject to risks beyond the control of Franco-Nevada
Companies engaged in mining and oil and natural gas activities are subject to all of the hazards and risks inherent in exploring for and developing natural resource projects. These risks and uncertainties include, but are not limited to, environmental hazards, industrial accidents, labour disputes, increase in the cost of labour, social unrest, fires, changes in the regulatory environment, impact of non-compliance with laws and regulations, fire, explosion, blowouts, cratering, sour gas releases and spills, encountering unusual or unexpected geological formations or other geological or grade problems, unanticipated metallurgical characteristics or less than expected mineral recovery, encountering unanticipated ground or water conditions, cave-ins, pit wall failures, flooding, rock bursts, periodic interruptions due to inclement or hazardous weather conditions, earthquakes, seismic activity, other natural disasters or unfavourable operating conditions and losses. Should any of these risks or hazards affect a company’s exploration or development activities, it may (i) cause the cost of development or production to increase to a point where it would no longer be economic to produce the metal or oil and natural gas from the company’s resources or expected reserves, (ii) result in a write down or write-off of the carrying value of one or more projects, (iii) cause delays or stoppage of mining or processing, (iv) result in the destruction of properties, processing facilities or third party facilities necessary to the company’s operations, (v) cause personal injury or death and related legal liability, or (vi) result in the loss of insurance coverage. The occurrence of any of above mentioned risks or hazards could result in an interruption or suspension of operation of the properties in which Franco-Nevada holds a royalty/stream interest and have a material and adverse effect on Franco-Nevada’s profitability, results of operation and financial condition.
There are known title defects and there may be unforeseen and unknown title defects, which may result in a loss of entitlement to a property
A defect in the chain of title to any of the properties underlying the royalty/stream interests may arise to defeat or impair the claim of the operator to a property. In addition, claims by third parties or aboriginal groups in Canada and elsewhere may impact on the operator’s ability to conduct activities on a property to the detriment of Franco-Nevada’s royalty/stream interests. To the extent an owner or operator does not have title to the property, it may be required to cease operations or transfer operational control to another party. Many royalties/streams are contractual, rather than an interest in land, with the risk that an assignment or bankruptcy or insolvency proceedings by an owner will result in the loss of any effective royalty/stream interest in a particular property. Further, even in those jurisdictions where there is a right to record or register royalties/streams in land registries or mining recorders offices, such registrations may not necessarily provide any protection to the royalty/stream holder. Accordingly, the royalty/stream holder may be subject to risk from third parties. As a result, known title defects, as well as unforeseen and unknown title defects may impact operations at a project in which Franco-Nevada has a royalty/stream interest and may result in a material and adverse effect on Franco-Nevada’s profitability, results of operation and financial condition.
The operations in which Franco-Nevada holds a royalty, stream or other interest require various property rights, permits and licenses in order to conduct current and future operations, and delays or a failure to obtain or maintain such property rights, permits and licenses, or a failure to comply with the terms of any of such property rights, permits and licenses could result in interruption or closure of operations or exploration on the properties
Exploration, development and operation of mining and oil and natural gas properties are subject to laws and regulations governing health and worker safety, employment standards, environmental matters, mine development, project development, mineral production, permitting and maintenance of title, exports, taxes, labour standards, reclamation obligations, heritage and historic matters and other matters. Franco-Nevada, in respect of its own assets and operations, as well as the owners and operators of the properties in which Franco-Nevada holds a royalty, stream or other interest, require licenses and permits from various governmental authorities in order to conduct their operations. Future changes in such laws and regulations or in such licenses and permits could have a material adverse impact on the revenue Franco-Nevada derives from the royalty/stream interests. Such licenses and permits are subject to change in various circumstances and are required to be kept in good standing through a variety of means, including cash payments and satisfaction of conditions of issue. Such licenses and permits are subject to expiration, relinquishment and/or
termination without notice to, control of or recourse by Franco-Nevada. There can be no guarantee that Franco-Nevada or the operators of those properties in which Franco-Nevada holds a royalty, stream or other interest, will be able to obtain or maintain all necessary licenses and permits in good standing that may be required to explore, develop and operate the properties, commence construction or operation of mining or oil and natural gas facilities, or maintain operations that economically justify the cost. Any failure to comply with applicable laws and regulations, permits and licenses, or to maintain permits and licenses in good standing, even if inadvertent, could result in interruption or closure of exploration, development or mining operations or fines, penalties or other liabilities accruing to the owner or operator of the project. Any such occurrence could substantially decrease production or cause the termination of operations on the property and have a material and adverse effect on Franco-Nevada’s profitability, results of operation and financial condition.
The operations in which Franco-Nevada holds an interest are subject to environmental laws and regulations that may increase the costs of doing business and may restrict the operations
All phases of the mining and the oil and natural gas business present environmental risks and hazards and are subject to environmental regulation pursuant to a variety of government laws and regulations. Compliance with such laws and regulations can require significant expenditures and a breach may result in the imposition of fines and penalties, which may be material. Environmental legislation is evolving in a manner expected to result in stricter standards and enforcement, larger fines and liability and potentially increased capital expenditures and operating costs. Any breach of environmental legislation by Franco-Nevada, as an owner or operator of a property, or by owners or operators of properties underlying the asset portfolio could have a material impact on the viability of the relevant property and impair the revenue derived from the owned property or applicable royalty, which could have a material and adverse affect on Franco-Nevada’s profitability, results of operation and financial condition.
Additional costs may be incurred as a result of international climate change initiatives and may effect the availability of resources and cause business disruptions
Franco-Nevada acknowledges climate change as an international and community concern. Franco-Nevada supports and endorses various initiatives for voluntary actions consistent with international initiatives on climate change. Franco-Nevada is committed to reducing energy consumption and greenhouse gas emissions and it promotes energy efficiency. In addition to voluntary actions, governments are moving to introduce climate change legislation and treaties at the international, national, state/provincial and local levels. Where legislation already exists, regulation relating to emission levels and energy efficiency is becoming more stringent. Some of the costs associated with reducing emissions can be offset by increased energy efficiency and technological innovation. However, if the current regulatory trend continues, Franco-Nevada expects this may result in increased costs at some of the operations underlying its royalty/stream interests.
Franco-Nevada is exposed to risks of changing political attitudes and stability and ensuing changes in government regulation in the countries in which it holds royalty, stream or other interests
The properties on which Franco-Nevada holds or will hold a royalty, stream or other interests are located in multiple legal jurisdictions and political systems. There is sovereign risk in investing in foreign countries, including the risk that the resource concessions may be susceptible to revision or cancellation by new laws or changes in direction by the government in question. It is possible that changes in applicable laws, regulations, or in their enforcement or regulatory interpretation could result in adverse changes to mineral or oil and natural gas operations. These are matters over which Franco-Nevada has no control. There is no assurance that future political and economic conditions in such countries will not result in the adoption of different policies or attitudes respecting the development and ownership of resources. Any such changes in policy or attitudes may result in changes in laws affecting ownership of assets, land tenure and resource concessions, licensing fees, taxation, royalties, price controls, exchange rates, export controls, environmental protection, labour relations, foreign investment, nationalization, repatriation of income and return of capital, which may affect both the ability to undertake exploration and development on, or production from, the properties on which Franco-Nevada holds a royalty, stream or other interest. In certain areas where Franco-Nevada holds a royalty, stream or other interest, the regulatory environment is in a state of continuing change, and new laws, regulations and requirements may be retroactive in their effect and implementation. Any changes in governmental laws, regulations, economic conditions or shifts in political attitudes or stability are beyond the control of Franco-Nevada and the owners and operators of the properties in which Franco-Nevada has an interest and such changes may result in a material and adverse effect on Franco-Nevada’s profitability, results of operation and financial condition.
Additionally, Franco-Nevada is indirectly exposed to the risks faced by the operators of the properties in which Franco-Nevada holds or will hold royalties, streams or other interests in foreign jurisdictions. These include risks related to political and economic instability, under-developed legal systems, inconsistencies in the application of local laws and other legal uncertainty, terrorism, military repression, political violence, crime, corruption, infectious diseases, unsophisticated infrastructure and inaccessibility.
Potential litigation affecting the properties in which Franco-Nevada holds its royalty/stream interests could have an adverse effect on Franco-Nevada
Potential litigation may arise on a property on which Franco-Nevada holds or has a royalty/stream interest (for example, litigation between joint venture partners or original property owners). As a royalty/stream holder, Franco-Nevada will not generally have any influence on the litigation and will not generally have access to data. Any such litigation that results in the cessation or reduction of production from a property (whether temporary or permanent) could have a material and adverse effect on Franco-Nevada’s profitability, results of operations and financial condition.
Increased Regulatory Compliance Costs Relating to the Dodd-Frank Act
In July 2010, the Dodd-Frank Wall Street Reform and Consumer Protection Act (“Dodd-Frank Act”) was enacted, representing an overhaul of the framework for regulation of U.S. financial markets. The Dodd-Frank Act calls for various regulatory agencies, including the SEC and the Commodities Futures Trading Commission, to establish regulations for implementation of many of the provisions of the Dodd-Frank Act, and the Company anticipates that these new regulations will provide additional clarity regarding the extent of the impact of this legislation on the Company. If the Company’s efforts to comply with new laws, regulations and standards differ from the activities intended by regulatory or governing bodies due to ambiguities related to practice, regulatory authorities may initiate legal proceedings against the Company and its business may be harmed. The Company may need to incur additional costs and invest additional resources, including management’s time, in order to comply with the new regulations and anticipated additional reporting and disclosure obligations. The Company will not be able to assess the full impact of the Dodd-Frank Act until all the implementing regulations have been adopted.
The Company may fail to achieve and maintain the adequacy of internal control over financial reporting as per the requirements of the Sarbanes-Oxley Act
The Company is not yet required to assess its internal control procedures in order to satisfy the requirements of Section 404 of the Sarbanes-Oxley Act of 2002 (“SOX”). SOX will require an annual assessment by management of the effectiveness of the Company’s internal control over financial reporting and an attestation report by the Company’s independent auditors addressing this assessment beginning with the fiscal year ended December 31, 2012. The Company may in the future fail to achieve and maintain the adequacy of its internal control over financial reporting, as such standards are modified, supplemented or amended from time to time, and the Company may not be able to ensure that it can conclude on an ongoing basis that it has effective internal control over financial reporting in accordance with Section 404 of SOX. The Company’s failure to satisfy the requirements of Section 404 of SOX on an ongoing, timely basis could result in the loss of investor confidence in the reliability of its financial statements, which in turn could harm the Company’s business and negatively impact the trading price of its Common Shares. In addition, any failure to implement required new or improved controls, or difficulties encountered in their implementation, could harm the Company’s operating results or cause it to fail to meet its reporting obligations. Future acquisitions of companies may provide the Company with challenges in implementing the required processes, procedures and controls in its acquired operations. Acquired companies may not have disclosure controls and procedures or internal control over financial reporting that are as thorough or effective as those required by securities laws currently applicable to the Company.
No evaluation can provide complete assurance that the Company’s internal control over financial reporting will detect or uncover all failures of persons within the Company to disclose material information otherwise required to be reported. The effectiveness of the Company’s controls and procedures could also be limited by simple errors or faulty judgments. In addition, should the Company expand in the future, the challenges involved in implementing appropriate internal control over financial reporting will increase and will require that the Company continue to improve its internal control over financial reporting. Although the Company intends to devote substantial time and incur substantial costs, as necessary, to ensure compliance, the Company cannot be certain that it will be successful in complying with Section 404 on an ongoing basis.
Significant changes to western Canadian provinces’ royalty framework may have an adverse effect on the revenue generated by Oil & Gas Assets
In addition to federal regulation, each province has legislation and regulations that govern royalties, production rates and other matters. The royalty regime in a given province is a significant factor in the profitability of crude oil, natural gas liquids, sulfur and natural gas production. Royalties payable on production from lands other than Crown lands are determined by negotiation between the mineral freehold owner and the lessee, although production from such lands is subject to certain provincial taxes and royalties. Royalties from production on Crown lands are determined by governmental regulation and are generally calculated as a percentage of the value of gross production. The rate of royalties payable generally depends in part on prescribed reference prices, well productivity, geographical location, field discovery date, method of recovery and the type or quality of the petroleum product produced. Other royalties and royalty-like interests are, from time to time, carved out of the working interest owner’s interest through non-public transactions. These are often referred to as overriding royalties, gross overriding royalties, net profits interests, or net carried interests.
Occasionally the governments of the western Canadian provinces create incentive programs for exploration and development. Such programs often provide for royalty rate reductions, royalty holidays, or royalty tax credits and are generally introduced when commodity prices are low to encourage exploration and development activity by improving earnings and cash flow within the industry.
Any increased royalty burden may affect the operations of the owners or operators of properties underlying Franco-Nevada’s Oil & Gas Assets which may materially and adversely affect its profitability, results of operations and financial condition.
Proposed changes to U.S. federal mining and public land law could impose, among other things, royalties and fees paid to the U.S. government by mining companies and royalty holders
Periodically, members of the U.S. Congress have introduced bills which would supplant or alter the provisions of The General Mining Law of 1872 which governs the disposal of metallic minerals on lands owned by the federal government. Some of the production covered by Franco-Nevada’s royalties occurs on unpatented mining claims located on U.S. federal lands. In 2012, the U.S. President’s budget message to the U.S. Congress called for legislation to amend the U.S. mining law to impose a leasing system for gold, silver, and certain other metallic minerals, to impose a royalty on the production from federal lands, and a reclamation fee on production from federal and other lands. To date, no legislation has been introduced to implement this request to amend the mining law. Such legislation, if enacted by the U.S. Congress, could substantially increase the cost of holding mining claims and could reduce the revenue Franco-Nevada receives from royalties on unpatented mining claims, and to a lesser extent, on other lands in the United States. Moreover, such legislation could significantly impair the ability of owners of properties subject to Franco-Nevada’s royalties to develop mineral resources on unpatented mining claims. Although it is impossible at this time to predict what royalties and fees may be imposed in the future, the imposition of such royalties and fees could adversely affect the potential for development of such mining claims and the economics of existing operating mines on federal lands. Passage of such legislation may result in a material and adverse effect on Franco-Nevada’s profitability, results of operations, and financial condition.
Adequate infrastructure may not be available to develop the properties in which Franco-Nevada has an interest
Mining, processing, development and exploration activities depend, to one degree or another, on adequate infrastructure. Reliable roads, bridges, power sources and water supply are important determinants, which affect capital and operating costs. Unusual or infrequent weather phenomena, sabotage, government or other interference in the maintenance or provision of such infrastructure could adversely affect the operations on which Franco-Nevada has a royalty/stream interest.
There is no infrastructure available to produce or deliver to market natural gas from the Arctic gas properties in which Franco-Nevada has an interest and currently there is no plan or operating agreement to develop or produce these reserves. Franco-Nevada’s ability to generate revenues and, ultimately, profits from production from its Arctic gas interests depends upon the ability to develop and produce from these properties and to transport the natural gas and natural gas liquids to market. Franco-Nevada holds various working interests in the Arctic gas resources and, as such, is exposed to the capital costs of developing such resources. Franco-Nevada’s inability to produce or develop the Arctic gas resources or transport its natural gas to market may result in a material and adverse effect on Franco-Nevada’s profitability, results of operation and financial condition.
Production is dependent on good relations with operators’ employees
Production from the properties in which Franco-Nevada holds an interest depends on the efforts of operators’ employees. There is intense competition for geologists and persons with mining expertise. The ability of the owners and operators of such properties to hire and retain geologists and persons with mining expertise is key to those operations. Further, relations with employees may be affected by changes in the scheme of labour relations that may be introduced by the relevant governmental authorities in the jurisdictions in which those operations are conducted. Changes in such legislation or otherwise in the owners and operators of such properties’ relationships with their employees may result in strikes, lockouts or other work stoppages, any of which could have a material adverse effect on such operations, results of operations and financial condition of Franco-Nevada. If these factors cause the owners and operators of such properties to decide to cease production at one or more of the properties, such decision could have a material adverse effect on the business and financial condition of Franco-Nevada.
Franco-Nevada may become subject to risks related to certain operations in South Africa
Certain operators are subject to risks normally associated with the conduct of business in South Africa. Risks may include, among others, problems relating to power supply, labour disputes, delays or invalidation of governmental orders and permits, corruption, uncertain political and economic environments, civil disturbances and crime, arbitrary changes in laws or policies, foreign taxation and exchange controls, nationalization of assets, opposition to mining from environmental or other non-governmental organizations or changes in the political attitude towards mining, limitations on foreign ownership, power supply issues, limitations on repatriation of earnings, infrastructure limitations and increased financing costs. The above risks may limit, disrupt or negatively impact the operator’s business activities.
Operators in South Africa must remain compliant with the South African Mining Charter (the “Mining Charter”) and the Black Economic Empowerment (“BEE”) participation requirements. However, no assurance can be given that operators will be able to meet the objectives of the Mining Charter going forward, including the 26% historically disadvantaged South Africans ownership objective. Any failure by the operators to satisfy the BEE requirements of the Mining Charter could jeopardize their operations, ability to acquire, develop, or maintain any additional mining rights or properties. There is also no guarantee that the interests of these operators will be wholly-aligned with the interests of its (direct or indirect) BEE shareholders.
Certain South African assets are also affected by the unique political, technological and environmental factors that affect the nuclear industry; an industry that is subject to public opinion risks that could have an adverse impact on the demand for nuclear power and increase the regulation of the nuclear power industry.
Indigenous Peoples
Various international and national laws, codes, resolutions, conventions, guidelines, and other materials relate to the rights of indigenous peoples. Franco-Nevada holds royalty/stream interests on operations located in some areas presently or previously inhabited or used by indigenous peoples. Many of these materials impose obligations on government to respect the rights of indigenous people. Some mandate that government consult with indigenous people regarding government actions which may affect indigenous people, including actions to approve or grant mining rights or permits. The obligations of government and private parties under the various international and national materials pertaining to indigenous people continue to evolve and be defined. Franco-Nevada’s current and future operations are subject to a risk that one or more groups of indigenous people may oppose continued operation, further development, or new development of those projects or operations on which Franco-Nevada holds a royalty or stream. Such opposition may be directed through legal or administrative proceedings or protests, roadblocks or other forms of public expression against Franco-Nevada or the operators’ activities. Opposition by indigenous people to such activities may require modification of or preclude operation or development of projects or may require the entering into of agreements with indigenous people. Claims and protests of indigenous peoples may disrupt or delay activities of the operators of Franco-Nevada’s royalty/stream assets.
Franco-Nevada may be impacted by regulatory requirements under the U.S. public land laws which limit access to federal lands for mineral exploration and development
Recent proposed rulemaking by the U.S. Department of the Interior would create a framework for the Secretary of the Interior to exercise authority under the Federal Land Policy and Management Act to withdraw from mineral entry federal lands found to be critical habitat for Sage grouse. If such proposed rules are promulgated, withdrawal of lands for Sage grouse habitat could impact explorers and developers of mineral
deposits in the western U.S., including the operators of projects subject to Franco-Nevada’s royalties, by constraining or prohibiting exploration or development of new deposits or the development or expansion of existing mining projects impacted by such regulations.
Risks Related to Franco-Nevada’s securities
Franco-Nevada’s securities may experience price volatility
Securities markets have a high level of price and volume volatility, and the market price of securities of many companies have experienced wide fluctuations in price which have not necessarily been related to the operating performance, underlying asset values or prospects of such companies. Factors unrelated to the financial performance or prospects of Franco-Nevada include macroeconomic developments in North America and globally, and market perceptions of the attractiveness of particular industries. There can be no assurance that continued fluctuations in mineral and oil and natural gas prices will not occur. As a result of any of these factors, the market price of Franco-Nevada’s securities at any given time may not accurately reflect the long term value of Franco-Nevada.
In the past, following periods of volatility in the market price of a company’s securities, shareholders have instituted class action securities litigation against them. Such litigation, if instituted, could result in substantial cost and diversion of management attention and resources, which could significantly harm profitability and the reputation of Franco-Nevada.
There may be limitations on enforcement of civil judgments
Certain of the experts named elsewhere in this AIF are residents of countries other than Canada. A substantial portion of the assets of Franco-Nevada are located outside of Canada. As a result, it may be difficult for investors in Franco-Nevada’s securities to commence legal proceedings in Canada against these non-Canadian residents. In addition, it may not be possible for investors in Franco-Nevada’s securities to collect from Franco-Nevada or these non-Canadian residents judgments obtained in courts in Canada predicated on the civil liability provisions of securities legislation of certain of the provinces and territories of Canada. It may also be difficult for investors in Franco-Nevada’s securities to succeed in a lawsuit in the United States, based solely on violations of Canadian securities laws.
Additional issuance of securities by Franco-Nevada may dilute existing securityholders, reduce some or all of Franco-Nevada’s financial measures on a per share basis, reduce the trading price of the Common Shares or other Franco-Nevada securities or impede Franco-Nevada’s ability to raise future capital
Franco-Nevada may issue additional securities in the future in connection with acquisitions, strategic transactions, financings or for other purposes. To the extent additional securities are issued, Franco-Nevada’s existing securityholders could be diluted and some or all of Franco-Nevada’s financial measures could be reduced on a per share basis. Additionally, Franco-Nevada securities issued in connection with a transaction may not be subject to resale restrictions and, as such, the market price of Franco-Nevada’s securities may decline if certain large holders of Franco-Nevada securities or recipients of Franco-Nevada securities in connection with an acquisition, sell all or a significant portion of such securities or are perceived by the market as intending to sell such securities. In addition, such issuances of securities may impede Franco-Nevada’s ability to raise capital through the sale of additional equity securities in the future.
The Company may be, or may become, a “passive foreign investment company,” which may result in adverse tax consequences for United States investors
If the Company were to constitute a “passive foreign investment company” within the meaning of Section 1297 of the Code (a “PFIC”) for any year during a U.S. holder’s holding period, then certain potentially adverse U.S. federal income tax rules may affect the U.S. federal income tax consequences to such U.S. holder resulting from the acquisition, ownership and disposition of Common Shares.
The U.S. Treasury Department has not issued specific guidance on how the income and assets of a non-U.S. corporation such as the Company (a company that derives a substantial part of its operating revenue from the sale of gold and other precious metals that it has agreed to purchase from mining companies) will be treated under the PFIC rules. Although the matter is not free from doubt, the Company believes, on a more likely than not basis, that it will not be a PFIC for its current tax year ending on December 31, 2012, and for the foreseeable future. The Company, however, also believes that it was a PFIC for its tax year ended December 31, 2011, and prior tax years.
The determination as to whether a corporation is, or will be, a PFIC for a particular tax year depends, in part, on the application of complex U.S. federal income tax rules, which are subject to differing interpretations. In addition, whether any corporation will be a PFIC for any tax year depends on its assets and income over the course of such tax year, and, as a result, the Company’s PFIC status for its current tax year and any future tax year cannot be predicted with certainty. Accordingly, there can be no assurance that the Internal Revenue Service will not challenge the views of the Company concerning its PFIC status. Each U.S. holder should consult its own tax advisor regarding the PFIC status of the Company.
This risk factor is qualified in its entirety by the discussion set forth under the heading, “Certain United States Federal Income Tax Considerations” contained in the Company’s Annual Report on Form 40-F which has been filed with the Securities and Exchange Commission and can be found at the SEC’s website www.sec.gov.
Franco-Nevada may become subject to burdensome regulatory requirements under U.S. laws regulating pension plans
Franco-Nevada may not qualify as an “operating company” for purposes of the Employee Retirement Income Security Act of 1974 (United States), as amended (“ERISA”). Consequently, if 25% or more of the issued Common Shares were held by private pension plans subject to ERISA or plans subject to the U.S. Internal Revenue Code’s “prohibited transaction” rules (such as individual retirement accounts), then Franco-Nevada’s assets would be treated as ERISA “plan assets”. As a result, Franco-Nevada could become subject to the ERISA regulatory regime, including, among other potentially burdensome regulatory requirements, heightened fiduciary duties owed to plan participants. While Franco-Nevada intends to monitor beneficial ownership of its Common Shares by ERISA plans, there can be no assurance that Franco-Nevada will not become subject to ERISA regulations in the future. If Franco-Nevada were subject to ERISA regulatory requirements, it could have a material and adverse effect on Franco-Nevada’s ability to manage its business and/or its results of operation and financial condition.
DIVIDENDS
The following table sets forth the dividends paid by Franco-Nevada for each of the three most recently completed financial years:
Dividends Paid |
| 2011(1) |
| 2010 |
| 2009 |
| |||
Per Common Share(2)(3) |
| $ | 0.32 |
| $ | 0.29 |
| $ | 0.25 |
|
In aggregate(2)(4) |
| $ | 49,220,260 |
| $ | 33,301,000 |
| $ | 28,232,000 |
|
(1) | Beginning July 2011, the Corporation began declaring its dividend in US dollars. |
|
|
(2) | The exchange rate used to convert the dividends to C$ is the noon rate posted by the Bank of Canada on the day before the dividend declaration date. |
|
|
(3) | The C$ equivalents for 2011, 2010 and 2009 are $0.38, $0.30, and $0.28 respectively. |
|
|
(4) | The C$ equivalents for 2011, 2010 and 2009 are $48,912,349, $34,325,472, and $31,425,396 respectively. |
Franco-Nevada has adopted a dividend policy to pay an adequate sustainable dividend as determined by its board of directors to qualify its Common Shares for large generalist institutional funds. In July 2010, Franco-Nevada began to declare and pay monthly dividends and it is anticipated that it will continue to do so. The board of directors may change the dividend policy at any time at its sole discretion and there is no assurance that Franco-Nevada will be able to pay any dividends or sustain any level of dividend payments. It is expected that the board of directors will conduct its annual review of Franco-Nevada’s dividend policy at its meeting in May 2012.
CAPITAL STRUCTURE
The authorized share capital of Franco-Nevada consists of an unlimited number of Common Shares and an unlimited number of preferred shares of which, as of March 26, 2012, 143,965,430 Common Shares and no preferred shares were outstanding.
Common Shares
Each Common Share carries the right to one vote at all meetings of shareholders of Franco-Nevada. There are no special rights or restrictions of any nature attached to the Common Shares. All Common Shares rank equally as to dividends, voting powers and participation in assets upon liquidation of Franco-Nevada.
Preferred Shares
The preferred shares may be issued in one or more series, each series to consist of such number of shares as may, before the issue thereof, be fixed by resolution of the board of directors. The directors shall determine before the issue thereof the designations, rights, privileges, restrictions and conditions attaching to the preferred shares of each series including the rate or amount of dividends or the method of calculating dividends, the dates of payment thereof, the redemption and/or purchase prices and terms and conditions of redemption and/or purchase, any voting rights, any conversion rights and any sinking fund or other provisions.
The preferred shares of each series will, with respect to payment of dividends and the distribution of assets in the event of liquidation, dissolution or winding up, rank on a parity with the preferred shares of every other series and be entitled to preference over the Common Shares and over any other shares ranking junior to the preferred shares. The preferred shares of any series may also be given such other preferences over the Common Shares and over any other shares ranking junior to the preferred shares as may be fixed by the directors.
Warrants
Franco-Nevada and its wholly-owned subsidiary FN GLW have outstanding certain warrants to purchase Common Shares, of which the following three classes are or have recently been listed and posted for trading.
2012 Warrants
The Corporation recently had warrants outstanding, each warrant entitling the holder to purchase one Common Share upon payment of C$32.00 (the “2012 Warrants”). The 2012 Warrants expired on March 13, 2012. The 2012 Warrants were listed and posted for trading on the TSX under the symbol “FNV.WT”.
2017 Warrants
The Corporation has outstanding as of the date hereof 6,510,769 warrants (including those issued in connection with the Lumina acquisition), each warrant entitling the holder to purchase one Common Share upon payment of C$75.00 until June 16, 2017 (the “2017 Warrants”). In addition, the Corporation has issued one special warrant which is exchangeable into 2,000,000 2017 Warrants upon the holder achieving certain permitting, development and financing criteria. The 2017 Warrants are listed and posted for trading on the TSX under the symbol “FNV.WT.A”.
2013 GLW Warrants
FN GLW has outstanding as of the date hereof 25,999,998 warrants, each warrant entitling the holder to acquire, at the holder’s election at the time of exercise, either 0.1556 of one Common Share or C$5.20 in cash, upon payment of C$10.00 until July 8, 2013 (the “2013 GLW Warrants”). The 2013 GLW Warrants are listed and posted for trading on the TSX under the symbol “FNV.WT.B”.
MARKET FOR SECURITIES
The Common Shares of Franco-Nevada are listed and posted for trading on the TSX and the NYSE in each case under the symbol “FNV”.
The 2017 Warrants are listed and posted for trading on the TSX under the symbol “FNV.WT.A”.
The 2013 GLW Warrants are listed and posted for trading on the TSX under the symbol “FNV.WT.B”. Prior to February 4, 2010, the 2013 GLW Warrants traded on the TSX Venture Exchange.
Trading Price and Volume
The following table sets forth the high and low prices and volumes for the Common Shares traded on the TSX for the most recently completed financial year and on the NYSE since the commencement of trading thereon on September 8, 2011.
|
| Common Shares TSX |
| Common Shares NYSE |
| ||||||||
|
| High C$ |
| Low C$ |
| Volume |
| High |
| Low |
| Volume |
|
2011 |
|
|
|
|
|
|
|
|
|
|
|
|
|
January |
| 33.34 |
| 27.75 |
| 11,518,773 |
| — |
| — |
| — |
|
February |
| 33.20 |
| 27.95 |
| 15,382,834 |
| — |
| — |
| — |
|
March |
| 36.85 |
| 32.82 |
| 9,611,270 |
| — |
| — |
| — |
|
April |
| 38.38 |
| 34.89 |
| 7,687,866 |
| — |
| — |
| — |
|
May |
| 37.66 |
| 34.78 |
| 5,725,641 |
| — |
| — |
| — |
|
June |
| 37.71 |
| 35.39 |
| 8,061,856 |
| — |
| — |
| — |
|
July |
| 40.49 |
| 35.50 |
| 9,601,937 |
| — |
| — |
| — |
|
August |
| 44.26 |
| 38.49 |
| 14,003,079 |
| — |
| — |
| — |
|
September |
| 47.24 |
| 36.76 |
| 14,654,270 |
| 48.25 |
| 35.25 |
| 2,934,653 |
|
October |
| 41.61 |
| 36.42 |
| 12,546,546 |
| 41.30 |
| 34.03 |
| 3,428,721 |
|
November |
| 44.97 |
| 38.72 |
| 13,571,019 |
| 43.38 |
| 37.99 |
| 2,500,023 |
|
December |
| 43.50 |
| 37.68 |
| 14,371,425 |
| 42.80 |
| 36.50 |
| 4,840,058 |
|
2012 |
|
|
|
|
|
|
|
|
|
|
|
|
|
January |
| 45.97 |
| 38.69 |
| 11,374,010 |
| 45.95 |
| 38.27 |
| 4,087,677 |
|
February |
| 46.50 |
| 41.97 |
| 15,537,890 |
| 46.55 |
| 42.15 |
| 3,688,748 |
|
March (1-26) |
| 44.67 |
| 40.53 |
| 11,283,358 |
| 45.17 |
| 40.56 |
| 3,889,160 |
|
The following table sets forth the high and low prices and volumes for the 2012 Warrants, 2017 Warrants and 2013 GLW Warrants traded on the TSX for the most recently completed financial year.
|
| 2012 Warrants |
| 2017 Warrants |
| 2013 GLW Warrants |
| ||||||||||||
|
| High C$ |
| Low C$ |
| Volume |
| High C$ |
| Low C$ |
| Volume |
| High C$ |
| Low C$ |
| Volume |
|
2011 |
|
|
|
|
|
|
|
|
|
|
|
|
|
|
|
|
|
|
|
January |
| 5.37 |
| 2.78 |
| 858,259 |
| 7.10 |
| 5.80 |
| 68,475 |
| 0.36 |
| 0.16 |
| 3,945,708 |
|
February |
| 4.59 |
| 2.88 |
| 641,014 |
| 6.20 |
| 5.80 |
| 72,785 |
| 0.19 |
| 0.11 |
| 1,920,220 |
|
March |
| 6.23 |
| 4.06 |
| 1,231,599 |
| 6.20 |
| 5.90 |
| 154,779 |
| 0.28 |
| 0.19 |
| 646,040 |
|
April |
| 7.50 |
| 5.18 |
| 1,002,258 |
| 6.50 |
| 6.05 |
| 33,579 |
| 0.24 |
| 0.16 |
| 2,044,753 |
|
May |
| 6.99 |
| 5.05 |
| 794,921 |
| 6.21 |
| 5.80 |
| 54,550 |
| 0.22 |
| 0.16 |
| 2,198,100 |
|
June |
| 6.59 |
| 4.78 |
| 487,701 |
| 6.25 |
| 6.05 |
| 16,460 |
| 0.18 |
| 0.14 |
| 163,366 |
|
July |
| 8.60 |
| 4.91 |
| 757,893 |
| 6.20 |
| 5.99 |
| 1,614,565 |
| 0.21 |
| 0.13 |
| 1,333,879 |
|
August |
| 12.49 |
| 7.00 |
| 1,258,348 |
| 8.71 |
| 6.01 |
| 134,530 |
| 0.39 |
| 0.19 |
| 3,247,224 |
|
September |
| 15.15 |
| 5.67 |
| 1,674,035 |
| 8.22 |
| 6.00 |
| 192,860 |
| 0.68 |
| 0.34 |
| 3,471,504 |
|
October |
| 9.87 |
| 5.61 |
| 647,396 |
| 7.00 |
| 5.60 |
| 106,894 |
| 0.46 |
| 0.30 |
| 659,597 |
|
November |
| 13.01 |
| 7.30 |
| 1,138,519 |
| 7.50 |
| 6.55 |
| 541,545 |
| 0.51 |
| 0.30 |
| 1,938,001 |
|
December |
| 11.50 |
| 6.11 |
| 783,408 |
| 7.00 |
| 4.95 |
| 426,345 |
| 0.36 |
| 0.23 |
| 929,548 |
|
2012 |
|
|
|
|
|
|
|
|
|
|
|
|
|
|
|
|
|
|
|
January |
| 13.92 |
| 6.95 |
| 1,104,239 |
| 6.75 |
| 5.25 |
| 591,074 |
| 0.34 |
| 0.27 |
| 1,953,320 |
|
February |
| 14.45 |
| 10.00 |
| 1,189,619 |
| 6.75 |
| 5.80 |
| 86,757 |
| 0.35 |
| 0.27 |
| 1,472,641 |
|
March (1-26) |
| 12.62 | (1) | 9.48 | (1) | 503,442 | (1) | 6.35 |
| 5.30 |
| 87,853 |
| 0.31 |
| 0.21 |
| 1,912,711 |
|
(1) March (1-13) as these warrants expired on March 13, 2012.
DIRECTORS AND OFFICERS
The following table sets forth, as at the date hereof, the name, province or state and country of residence, position held with Franco-Nevada and principal occupation of each director and executive officer of Franco-Nevada:
Name and Municipality of Residence |
| Position with Franco-Nevada(1) |
| Principal Occupation |
|
|
|
|
|
Pierre Lassonde |
| Director and Chairman |
| Chairman, Franco-Nevada |
Toronto, Ontario, Canada |
|
|
|
|
|
|
|
|
|
David Harquail |
| Director, President and Chief Executive Officer |
| President and Chief Executive Officer, Franco-Nevada |
|
|
|
|
|
Derek W. Evans(3) |
| Director |
| President and CEO, Pengrowth Energy Corporation |
Calgary, Alberta, Canada |
|
|
|
|
|
|
|
|
|
Graham Farquharson(2) |
| Director |
| President, Strathcona Mineral Services Limited |
Toronto, Ontario, Canada |
|
|
|
|
|
|
|
|
|
Louis Gignac(3) |
| Director |
| President, G Mining Services Inc. |
Brossard, Quebec, Canada |
|
|
|
|
|
|
|
|
|
Randall Oliphant(3) |
| Director |
| Executive Chairman, New Gold Inc. |
Toronto, Ontario, Canada |
|
|
|
|
|
|
|
|
|
Hon. David R. Peterson(2) |
| Director |
| Chairman, Cassels Brock & Blackwell LLP |
Toronto, Ontario, Canada |
|
|
|
|
|
|
|
|
|
Sandip Rana |
| Chief Financial Officer |
| Chief Financial Officer, Franco-Nevada |
Brampton, Ontario, Canada |
|
|
|
|
|
|
|
|
|
Jacqueline A. Jones |
| Chief Legal Officer & Corporate Secretary |
| Chief Legal Officer & Corporate Secretary, Franco-Nevada |
|
|
|
|
|
Geoff Waterman |
| Chief Operating Officer |
| Chief Operating Officer, Franco-Nevada |
Toronto, Ontario, Canada |
|
|
|
|
Name and Municipality of Residence |
| Position with Franco-Nevada(1) |
| Principal Occupation |
Paul Brink |
| Senior Vice President, Business Development |
| Senior Vice President, Business Development, Franco-Nevada |
(1) All of the directors have served since November 2007 with the exception of Derek Evans who was appointed in August 2008.
(2) Member of the Compensation and Corporate Governance Committee.
(3) Member of the Audit and Risk Committee.
Each director’s term of office expires at the next annual meeting of shareholders of Franco-Nevada or when his successor is duly elected or appointed, unless his term ends earlier in accordance with the articles or by-laws of Franco-Nevada, he resigns from office or he becomes disqualified to act as a director of Franco-Nevada.
As of the date hereof, the directors and executive officers of Franco-Nevada, as a group, beneficially own, directly or indirectly, or exercise control or direction over an aggregate of 4,854,344 Common Shares, representing approximately 3.4% of the Common Shares outstanding.
Biographical information regarding the directors and executive officers of Franco-Nevada is provided as follows:
Pierre Lassonde, Director and Chairman — Pierre Lassonde is Chairman of the Board. Mr. Lassonde formerly served as President of Newmont Mining Corporation (“Newmont”) from 2002 to 2006 and resigned as a director and Vice-Chairman of Newmont effective November 30, 2007. Previously, Mr. Lassonde served as a director and President (1982 to 2002) and Co-Chief Executive Officer (1999 to 2002) of Franco-Nevada Mining Corporation Limited (“Old Franco-Nevada”). Mr. Lassonde also served as President and Chief Executive Officer of Euro-Nevada Mining Corporation from 1985 to 1999, prior to its amalgamation with Old Franco-
Nevada. Mr. Lassonde served as a director of Normandy Mining Limited from 2001 to 2002. Mr. Lassonde is past Chairman and a director of the World Gold Council, Chairman of the Quebec National Art Museum and a director of New Gold Inc. and Enghouse Systems Limited. Mr. Lassonde received his Chartered Financial Analyst designation from the University of Virginia in 1984, a P. Eng (Association of Professional Engineers of Ontario) in 1976, a Master of Business Administration from the University of Utah in 1973, a B.Sc. (Electrical Engineering) from Ecole Polytechnique in 1971 and a B.A. from Seminaire de St. Hyacinthe/Université de Montréal in 1967.
David Harquail, President, Chief Executive Officer and Director — David Harquail is President and Chief Executive Officer of the Corporation and is a director of the Corporation. Mr. Harquail served as Executive Vice President of Newmont (2006 to 2007) and previously served as President and Managing Director of Newmont Capital, the merchant banking division of Newmont (2002 to 2006). Prior to the acquisition by Newmont of Old Franco-Nevada in 2002, Mr. Harquail was with Old Franco-Nevada for a period of 15 years with the final position of Senior Vice President responsible for the metals royalty division and corporate development. Mr. Harquail has also held roles as President and Chief Executive Officer of Redstone Resources Inc., as a director of Inco Limited, Echo Bay Mines Limited, Kinross Gold Corporation and the Prospectors and Developers Association of Canada and as a task force advisor to the Toronto Stock Exchange. Mr. Harquail holds a B.A.Sc. in Geological Engineering from the University of Toronto, a Master’s degree in Business Administration from McGill University and is a registered Professional Engineer in Ontario.
Derek W. Evans, Director — Derek Evans is currently the President and Chief Executive Officer of Pengrowth Energy Corporation, as well as a director of the Corporation. From May to September 2009, Mr. Evans was President and Chief Operating Officer of Pengrowth Energy Trust. Mr. Evans served as President and Chief Executive Officer of Focus Energy Trust from May 2002 until March 2008. Mr. Evans has over 25 years of experience in the oil and gas business in Western Canada and has spent the majority of his career with Renaissance Energy Limited in senior management. Mr. Evans holds a Bachelor of Science degree in Mining Engineering from Queen’s University and is a registered Professional Engineer in Alberta. Mr. Evans is also a member of the Institute of Corporate Directors.
Graham Farquharson, Director — Graham Farquharson has been the President of Strathcona Mineral Services Limited since 1974 and is a director of the Corporation as well as a director of St Andrew Goldfields Ltd. Mr. Farquharson previously served on the boards of Placer Dome Inc., Cambior Inc. and several other mining companies. In addition, Mr. Farquharson is the Chairman of the Canadian Mineral Industry Education Foundation and a director of the Physicians Services Incorporated Foundation. Mr. Farquharson holds a Bachelor of Science degree in Mining Engineering from the University of Alberta, a Master’s degree in Business Administration from Queen’s University and is a registered Professional Engineer in Ontario. Mr. Farquharson was recently inducted into the Canadian Mining Hall of Fame.
Louis Gignac, Director — Louis Gignac is currently President of G Mining Services Inc., a private consultancy, and is a director of the Corporation. Mr. Gignac previously served as President, Chief Executive Officer and a director of Cambior Inc. from its creation in 1986 until its acquisition by IAMGOLD Corporation in 2006. Mr. Gignac previously held management positions with Falconbridge Copper Company and Exxon Minerals Company. Mr. Gignac also served as a professor in mining engineering at Laval University from 1979 to 1981. Mr. Gignac currently serves as a director of Domtar Corporation and St Andrew Goldfields Ltd., and is a member of the Ordre des ingénieurs du Québec. Mr. Gignac holds a Doctorate in Mining Engineering from the University of Missouri Rolla, a Master’s degree in Mineral Engineering from the University of Minnesota, and a Bachelor of Science degree in Mining Engineering from Laval University.
Randall Oliphant, Director — Randall Oliphant is the Executive Chairman of New Gold Inc. and is a director of the Corporation and Chairman of Silver Bear Resources Inc. Mr. Oliphant is a member of the advisory board for Metalmark Capital LLC (formerly Morgan Stanley Capital Partners), is a director of WesternZagros Resources Ltd. and also serves on the boards and advisory boards of a number of companies and not-for-profit organizations. Mr. Oliphant held positions with Barrick Gold Corporation from 1987 to 2003 and served as Barrick’s President and Chief Executive Officer from 1999 to 2003. Mr. Oliphant received his Bachelor of Commerce degree in 1984 from the University of Toronto and his Chartered Accountant designation in 1986.
Hon. David R. Peterson, Director — David Peterson is Chairman of the law firm Cassels Brock & Blackwell LLP, and is a director of the Corporation. Prior to that he was the Premier of the Province of Ontario from 1985 to 1990. He was the founding chairman of the Toronto Raptors of the National Basketball Association and was chairman of the successful Toronto Bid for the 2015 Pan Am Games. Mr. Peterson currently serves as a director of a number of companies, including Rogers Communications Inc., Shoppers Drug Mart Corporation,
Industrielle-Alliance Insurance and Financial Services Inc., South East Group Limited, MBAC Fertilizer Corp. and Versapay Corporation. Mr. Peterson is Chancellor of the University of Toronto and a director of St. Michael’s Hospital. Mr. Peterson holds an LL.B. from the University of Toronto, was called to the Bar of Ontario in 1969, appointed Queen’s Counsel in 1980 and summoned by Her Majesty to the Privy Council in 1992.
Sandip Rana, Chief Financial Officer — Sandip Rana joined Franco-Nevada on April 22, 2010. He was previously with Four Seasons Hotels and Resorts as Vice President, Corporate Finance. Prior to joining Four Seasons in 2003, Mr. Rana was International Controller and Treasurer of Franco-Nevada Mining Corporation Limited. Prior to that, Mr. Rana had experience at IMAX Corporation and Coopers & Lybrand. Mr. Rana is a Chartered Accountant and has a Bachelor of Business Administration from the Schulich School of Business at York University.
Jacqueline A. Jones, Chief Legal Officer & Corporate Secretary — Jacqueline Jones joined Franco-Nevada on April 29, 2010. Ms. Jones has been a lawyer for over 20 years and was previously with Yamana Gold Inc. as Senior Vice-President, Legal, General Counsel and Corporate Secretary. Prior to joining Yamana Gold Inc. in May 2005, Ms. Jones held the position of Counsel — Securities at Nortel Networks from July 1999 to January 2005. Prior to that time, Ms. Jones articled, and was an associate, at the law firm Smith, Lyons LLP from 1992 to 1999 where she worked in the securities law department. From 1988 to 1990, Ms. Jones worked as an associate in the corporate law department of the law firm Reid & Priest in New York. Ms. Jones holds a Bachelor of Arts from Dartmouth College and a Juris Doctorate from Columbia University School of Law. She is called to the bar in the Province of Ontario, the District of Columbia, and the State of New York. Ms. Jones is a member of The Law Society of Upper Canada, the American Bar Association, the New York Bar Association and the District of Columbia Bar Association, and is a member of the Rocky Mountain Mineral Law Foundation.
Geoff Waterman, Chief Operating Officer — Geoff Waterman has more than 20 years of association with Franco-Nevada’s asset portfolio and served as Vice President, Oil & Gas, of Newmont Capital from 2002 to 2007. Prior to that, he held increasingly senior roles at Old Franco-Nevada which he joined in 1992. Mr. Waterman was an auditor with Coopers & Lybrand and holds a Bachelor’s degree in economics from Trent University.
Paul Brink, Senior Vice President, Business Development — Paul Brink joined Newmont Capital in 2006 as Director of Corporate Development. Mr. Brink has experience in mining investment banking, working at BMO Nesbitt Burns and in project financing, working at UBS. Mr. Brink holds a Bachelor’s degree in Mechanical Engineering from the University of Witwatersrand and a Master’s degree in Management Studies from Oxford University.
Cease Trade Orders, Bankruptcies, Penalties or Sanctions
Except as set out below, no director or executive officer of Franco-Nevada (or where applicable, personal holding company of a director or executive officer):
(a) is, as at the date hereof, or has been, within 10 years before the date hereof, a director, chief executive officer or chief financial officer of any company (including the Company) that:
(i) was subject to an order that was issued while the director or executive officer was acting in the capacity as director, chief executive officer or chief financial officer, or
(ii) was subject to an order that was issued after the director or executive officer ceased to be a director, chief executive officer or chief financial officer and which resulted from an event that occurred while that person was acting in the capacity as director, chief executive officer or chief financial officer; or
(b) is, as at the date hereof, or has been, within 10 years before the date hereof, a director or executive officer of any company (including the Company) that, while that person was acting in that capacity, or within a year of that person ceasing to act in that capacity, became bankrupt, made a proposal under any legislation relating to bankruptcy or insolvency or was subject to or instituted any proceedings, arrangement, or compromise with creditors or had a receiver, receiver-manager or trustee appointed to hold its assets; or
(c) has, within 10 years before the date hereof, become bankrupt, made a proposal under any legislation relating to bankruptcy or insolvency, or become subject to or instituted any proceedings, arrangement or compromise with creditors, or had a receiver, receiver-manager or trustee appointed to hold the assets of the director or executive officer; or
(d) has been subject to:
(i) any penalties or sanctions imposed by a court relating to securities legislation or by a securities regulatory authority or has entered into a settlement agreement with a securities regulatory authority; or
(ii) any other penalties or sanctions imposed by a court or regulatory body that would likely be considered important to a reasonable investor in making an investment decision.
For the purposes of the above, “order” means: (i) a cease trade order; (ii) an order similar to a cease trade order, or (iii) an order that denied the relevant company access to any exemption under securities legislation, and, with respect to each, was in effect more than 30 consecutive days.
Conflicts of Interest
In the opinion of management of Franco-Nevada, there are no existing or potential conflicts of interest among Franco-Nevada, its directors, officers or other insiders of Franco-Nevada, other than as described in the following paragraph. Various officers, directors or other insiders of Franco-Nevada may hold senior positions with entities involved in the resource industry or otherwise be involved in transactions within the resource industry and may develop other interests outside Franco-Nevada. In the event that any such conflict of interest arises, a director who has such a conflict will be required to disclose the conflict to a meeting of the directors of Franco-Nevada and abstain from voting for or against the approval of such participation or such terms. In appropriate cases, Franco-Nevada will establish a special committee of independent directors to review a matter in which several directors, or management, may have a conflict. Any decision made by any of such directors involving Franco-Nevada will be required to be made in accordance with their duties and obligations to deal honestly and in good faith with a view to the best interests of Franco-Nevada.
Pierre Lassonde is currently a director and Randall Oliphant is currently Executive Chairman of New Gold Inc., a payor of two of Franco-Nevada’s royalty interests. Louis Gignac and Graham Farquharson are currently directors of St Andrew Goldfields Ltd., a payor of Franco-Nevada’s royalty interests. Conflicts of interest of these directors could arise from time to time in their capacities as directors or officers of these third parties.
LEGAL PROCEEDINGS AND REGULATORY ACTIONS
There are no outstanding legal proceedings to which Franco-Nevada or any of its subsidiaries is a party or was a party to during fiscal 2011 or to which the royalty and stream interests comprising the asset portfolio is subject or was subject during fiscal 2011, and no proceedings are known to be contemplated against Franco-Nevada, any of its subsidiaries or any of the royalty or stream interests comprising the asset portfolio.
There have been no penalties or sanctions imposed against Franco-Nevada by a court relating to securities legislation or by a securities regulatory authority during fiscal 2011 and there have been no other penalties or sanctions imposed by a court or regulatory body against Franco-Nevada that would likely be considered important to a reasonable investor in making an investment decision. Franco-Nevada has not entered into any settlement agreement before a court relating to securities legislation or with a securities regulatory authority during fiscal 2011.
INTERESTS OF MANAGEMENT AND OTHERS IN MATERIAL TRANSACTIONS
No director or executive officer of Franco-Nevada, any other insider of Franco-Nevada or any associate or affiliate of any of such individuals or companies has any material interest, directly or indirectly, in any transaction within the three most recently completed financial years or during the current financial year that has materially affected Franco-Nevada or is reasonably expected to materially affect Franco-Nevada.
REGISTRAR AND TRANSFER AGENT
The registrar and transfer agent for the Common Shares is Computershare Investor Services Inc. at its principal office in Toronto, Ontario and Computershare Investor Services at its principal office in Golden, Colorado.
The warrant agent for the 2017 Warrants is Computershare Trust Company of Canada Limited at its principal office in Toronto, Ontario.
The warrant agent for the 2013 GLW Warrants is Computershare Trust Company of Canada Limited, at its principal office in Vancouver, British Columbia.
MATERIAL CONTRACTS
The following are the material contracts entered into by Franco-Nevada since October 17, 2007 (date of incorporation) and still in effect or entered into since the beginning of Franco-Nevada’s most recently completed financial year, other than material contracts entered into in the ordinary course of business (unless otherwise required to be disclosed):
1. the Newmont Acquisition Agreement described under “General Development of Franco-Nevada’s Business — Background of Franco-Nevada”;
2. the 2009 Underwriting Agreement relating to the public offering in June 2009 described under “General Development of Franco-Nevada’s Business — 2009 Public Offering”;
3. a warrant indenture dated June 16, 2009 and supplemented June 15, 2010 between Franco-Nevada and Computershare Trust Company of Canada, as warrant agent, pursuant to which the 2017 Warrants were created and issued and by which they are governed;
4. the Taseko Agreement described under “General Development of Franco-Nevada’s Business — Acquisition of the Prosperity Gold Stream”;
5. the Arrangement Agreement described under “General Development of Franco-Nevada’s Business — Acquisition of Gold Wheaton”;
6. a warrant indenture dated July 8, 2008 and supplemented February 4, 2010 and March 14, 2011 between FN GLW, Franco-Nevada and Computershare Trust Company of Canada pursuant to which the 2013 GLW Warrants were created and issued and by which they are governed;
7. a warrant indenture dated May 26, 2009 and supplemented February 4, 2010 and March 14, 2011 between FN GLW, Franco-Nevada and Computershare Trust Company of Canada pursuant to which two other classes of FN GLW warrants expiring in 2014 were created and issued and by which they are governed; and
8. the 2011 Underwriting Agreement relating to the public offering in November 2011 described under “General Development of Franco-Nevada’s Business — 2011 Public Offering”.
A copy of each material contract is available on SEDAR under Franco-Nevada’s profile or FN GLW’s profile, as applicable, at www.sedar.com.
EXPERTS
The following are the technical reports prepared in accordance with NI 43-101 from which certain technical and scientific information contained in this AIF was derived:
· Goldstrike Complex— “Technical Report on the Goldstrike Mine, Eureka and Elko Counties, State of Nevada, USA” dated March 16, 2012 prepared by RPA for Barrick and Franco-Nevada under the supervision of and endorsed by Chester M. Moore, P. Eng., R. Dennis Bergen, P. Eng., Wayne W. Valliant, P. Geo., Stuart E. Collins, P.E. and Kathleen Ann Altman, Ph.D., P.E., who are each a “qualified person” for the purposes of NI 43-101; and
· Palmarejo Report— “Palmarejo Project SW Chihuahua State, Mexico Technical Report” dated January 1, 2012 prepared for Franco-Nevada under the supervision Mr. Donald J. Birak, Senior Vice President — Exploration, Coeur d’Alene Mines Corporation and Mr. Keith Blair, Manager, Applied Geoscience LLC, each of whom is a “qualified person” for the purposes of NI 43-101.
In addition, disclosure in this AIF for the reserve assessment and evaluation in respect of the Oil & Gas Assets on the Weyburn Unit, Midale Unit and Edson Property was prepared by GLJ for Franco-Nevada and was dated February 28, 2012, with an effective date of December 31, 2011, in accordance with NI 51-101.
To the knowledge of Franco-Nevada, each of these experts held less than 1% of the outstanding Common Shares at the time of the preparation of the reports and/or at the time of the preparation of the technical information contained in this AIF. None of the aforementioned firms or persons, nor any directors, officers or
employees of such firms, are currently, or are expected to be elected, appointed or employed as, a director, officer or employee of Franco-Nevada, or of any associate or affiliate of Franco-Nevada.
Additionally, a report of Deloitte & Touche LLP dated March 8, 2010 was included in a business acquisition report filed by Franco-Nevada on March 22, 2011 in respect of the acquisition of Gold Wheaton. Deloitte & Touche LLP, Chartered Accountants, of Vancouver, Canada were the independent auditors of Gold Wheaton and were independent of Gold Wheaton within the meaning of the Rules of Professional Conduct of the Institute of Chartered Accountants of British Columbia.
Franco-Nevada’s auditors are PricewaterhouseCoopers LLP. They have advised Franco-Nevada that they are independent with respect to Franco-Nevada within the meaning of the rules of professional conduct of the Institute of Chartered Accountants of Ontario.
ADDITIONAL INFORMATION
Additional information relating to Franco-Nevada is available electronically on SEDAR at www.sedar.com and on EDGAR at www.sec.gov and on its website www.franco-nevada.com. The metric conversion table, listing of certain oil and gas terms, glossary of non-technical terms and glossary of technical terms are generally available on Franco-Nevada’s website.
Additional information, including directors’ and officers’ remuneration and indebtedness, principal holders of Franco-Nevada’s securities and securities authorized for issuance under equity compensation plans, will be contained in Franco-Nevada’s management information circular for its annual and special meeting of shareholders scheduled to be held on May 8, 2012. For information relating to compensation and corporate governance related matters, please see “Statement of Executive Compensation” and “Statement of Governance Practices”, respectively, in such circular.
Additional financial information is provided in Franco-Nevada’s financial statements and MD&A for its most recently completed financial year.
AUDIT AND RISK COMMITTEE INFORMATION
The following information is provided in accordance with Form 52-110F1 under the Canadian Securities Administrators’ National Instrument 52-110 — Audit Committees (“NI 52-110”).
Audit and Risk Committee Charter
The Audit and Risk Committee Charter (the “Charter”) is attached as Appendix C to this AIF. The Charter was last updated effective March 24, 2011 with minor revisions.
With respect to risk management, the Charter provides that the Audit and Risk Committee (the “ARC”) will generally review with management the Company’s significant risks and exposures and the steps management has taken to manage, monitor and control such risks and exposures. The ARC will also more specifically review the Company’s principal business, political, financial, litigation and control risks and exposures with a view to ensuring that such risks and exposures are being effectively managed, monitored or controlled. For more information regarding the ARC’s responsibilities relating to risk management, please see Appendix C to this AIF.
Composition of the Audit and Risk Committee
As of December 31, 2011, the ARC was composed of the following three directors: Derek Evans, Louis Gignac and Randall Oliphant, Chair. Each director is considered “independent” and “financially literate” (as such terms are defined in NI 52-110, the rules of the NYSE and Rule 10A-3 of the U.S. Exchange Act).
Relevant Education and Experience
Each member of the ARC is financially literate, i.e., has the ability to read and understand financial statements. Collectively, the ARC has the education and experience to fulfill the responsibilities outlined in the Charter, including those relating to risk management. The education and current and past experience of each ARC member that is relevant to the performance of his responsibilities as an ARC member is summarized below:
Education and Experience (Past and Present)
Derek Evans |
| · | President and CEO, Pengrowth Energy Corporation (2009-present) |
|
|
|
|
|
| · | Chairman of Endurance Energy |
|
|
|
|
|
| · | President and CEO of Focus Energy Trust (2002-2008) |
|
|
|
|
|
| · | Senior Executive Renaissance Energy (15 years) |
|
|
|
|
|
| · | Member Institute of Corporate Directors |
|
|
|
|
Louis Gignac |
| · | Minor in Business, University of Minnesota |
|
|
|
|
|
| · | President and Chief Executive Officer of Cambior Inc. (1986-2006) |
|
|
|
|
|
| · | Has served on several audit committees including Sceptre Resources Ltd., Domtar Inc. and Domtar Corp. |
|
|
|
|
|
| · | Currently serving on the audit committee of Domtar Corp. and St Andrew Goldfields Ltd. |
|
|
|
|
Randall Oliphant |
| · | Bachelor of Commerce (with honours), University of Toronto, 1984 |
|
|
|
|
|
| · | Chartered Accountant (1986) |
|
|
|
|
|
| · | Chief Financial Officer of Barrick Gold Corporation (1994-1999) |
|
|
|
|
|
| · | Currently serving as Chair of the audit committee of WesternZagros Resources Ltd. |
Pre-Approval Policies and Procedures
The Board, upon the recommendation of the ARC, has adopted policies and procedures regarding services provided by external auditors (collectively, the “Auditor Independence Policy”). Under the Auditor Independence Policy, specific proposals for audit services and permitted non-audit services must be pre-approved by the ARC. The ARC may delegate to any one or more of its members pre-approval authority (other than pre-approval of the annual audit service engagement). Any approvals granted under this delegated authority must be presented to the ARC at its next meeting. The Auditor Independence Policy also provides that the ARC may pre-approve services (other than the annual audit service engagement) without the requirement for a specific proposal where the scope and parameters of such services and their attendant fees are clearly defined. The ARC must be informed in writing at its next scheduled meeting of any engagement of the external auditor to provide services in such circumstances. The Auditor Independence Policy deems de minimus non-audit services to have been pre-approved by the ARC in limited circumstances and subject to certain conditions being met.
The Auditor Independence Policy prohibits the external auditors from providing any of the following types of non-audit services:
· bookkeeping or other services related to the accounting records or financial statements;
· financial information systems design and implementation;
· appraisal or valuation services, fairness opinion, or contribution-in-kind reports;
· actuarial services;
· internal audit outsourcing services;
· management functions or human resources services;
· corporate finance or other services;
· broker-dealer, investment advisor or investment banking services;
· legal services; and
· any other service that under applicable law and generally accepted auditing standards cannot be provided by an external auditor.
The Auditor Independence Policy provides that the external auditor should not be precluded from providing tax or advisory services that do not fall within any the categories described above, unless the provision of those services would reasonably be expected to compromise the independence of the external auditor.
Reliance on Certain Exemptions
At no time since the commencement of Franco-Nevada’s most recently completed financial year has Franco-Nevada relied on any exemption from NI 52-110.
Audit Committee Oversight
At no time since the commencement of Franco-Nevada’s most recently completed financial year was a recommendation of the ARC to nominate or compensate an external auditor not adopted by the board of directors of Franco-Nevada.
Fees
For the periods ended December 31, 2011 and 2010, PricewaterhouseCoopers LLP billed fees from the Corporation as detailed below:
|
| December 31, 2011 |
| December 31, 2010 |
| ||
Audit Fees |
| C$ | 391,991 |
| C$ | 290,100 |
|
Audit-Related Fees |
| C$ | 557,365 |
| C$ | 47,366 |
|
Tax Fees |
| C$ | 7,090 |
|
| Nil |
|
Other Fees |
| C$ | 9,950 |
|
| Nil |
|
Total Fees |
| C$ | 966,396 |
| C$ | 337,466 |
|
For the years ended December 31, 2011 and 2010, “Audit Fees” noted above included C$138,000 and C$Nil, respectively, for services relating to IFRS.
For the years ended December 31, 2011 and 2010, “Audit-Related Fees” noted above included C$55,000 and C$Nil, respectively, for services relating to US GAAP reconciliation, C$105,000 and C$Nil, respectively, for services relating to the U.S. listing, C$237,000 and C$Nil, respectively, for services relating to the Corporation’s equity offering and C$160,365 and C$47,366, respectively, for the accounting treatment of certain transactions completed by the Corporation.
For the years ended December 31, 2011 and 2010, “Tax Fees” noted above included C$7,090 and C$Nil, respectively, for tax advice.
For the years ended December 31, 2011 and 2010, “Other Fees” noted above included C$9,945 and C$Nil, respectively, for payroll processing advice and CPAB fees.
APPENDIX A
FORM 51-101F2
Reports on Reserves Data
by
Independent Qualified Reserves Evaluator or Auditor
| Page: 1 of 2 FORM 51-101F2 REPORT ON RESERVES DATA BY INDEPENDENT QUALIFIED RESERVES EVALUATOR OR AUDITOR To the board of directors of Franco-Nevada Corporation (the "Company"): 1. We have evaluated the Company's reserves data as at December 31, 2011. The reserves data are estimates of proved reserves and probable reserves and related future net revenue as at December 31, 2011, estimated using forecast prices and costs. 2. The reserves data are the responsibility of the Company's management. Our responsibility is to express an opinion on the reserves data based on our evaluation. We carried out our evaluation in accordance with standards set out in the Canadian Oil and Gas Evaluation Handbook (the "COGE Handbook") prepared jointly by the Society of Petroleum Evaluation Engineers (Calgary Chapter) and the Canadian Institute of Mining, Metallurgy & Petroleum (Petroleum Society). 3. Those standards require that we plan and perform an evaluation to obtain reasonable assurance as to whether the reserves data are free of material misstatement. An evaluation also includes assessing whether the reserves data are in accordance with principles and definitions presented in the COGE Handbook. 4. The following table sets forth the estimated future net revenue (before deduction of income taxes) attributed to proved plus probable reserves, estimated using forecast prices and costs and calculated using a discount rate of 10 percent, included in the reserves data of the Company evaluated by us for the year ended December 31, 2011, and identifies the respective portions thereof that we have audited, evaluated and reviewed and reported on to the Company's board of directors: Location of Reserves Description and (Country or Independent Preparation Date of Foreign Net Present Value of Future Net Revenue Qualified Reserves Evaluation Geographic (before income taxes, 10% discount rate - M$) Evaluator Report Area) Audited Evaluated Reviewed Total Corporate Summary GLJ Petroleum Consultants February 28, 2012 Canada 203,756 203,756 5. In our opinion, the reserves data respectively evaluated by us have, in all material respects, been determined and are in accordance with the COGE Handbook, consistently applied. 6. We have no responsibility to update our reports referred to in paragraph 4 for events and circumstances occurring after their respective preparation dates. - |

| Page: 2 of 2 7. Because the reserves data are based on judgements regarding future events, actual results will vary and the variations may be material. EXECUTED as to our report referred to above: GLJ Petroleum Consultants Ltd., Calgary, Alberta, Canada, March 6, 2012 ORIGINALLY SIGNED BY John H. Stilling, P. Eng. Vice President |

APPENDIX B
FORM 51-101F3
REPORT OF MANAGEMENT AND DIRECTORS ON OIL AND GAS DISCLOSURE
Management of Franco-Nevada Corporation (“Franco-Nevada”) is responsible for the preparation and disclosure of information with respect to Franco-Nevada’s oil and gas activities in accordance with securities regulatory requirements. This information includes reserves data, which are estimates of proved reserves and probable reserves and related future net reserves as at December 31, 2011 estimated using forecast prices and costs.
An independent qualified reserves evaluator has evaluated Franco-Nevada’s reserves data. The report of the independent qualified reserves evaluator is presented in Appendix A of this Annual Information Form.
The Audit and Risk Committee of Franco-Nevada has:
(a) reviewed Franco-Nevada’s procedures for providing information to the independent qualified reserves evaluator;
(b) met with the independent qualified reserves evaluator to determine whether any restrictions affected the ability of the independent qualified reserves evaluator to report without reservation; and
(c) reviewed the reserves data with management and independent qualified reserves evaluator.
The Audit and Risk Committee of Franco-Nevada has reviewed the procedures for assembling and reporting other information associated with oil and gas activities and has reviewed that information with management. The Board of Directors on the recommendation of the Audit and Risk Committee has approved:
(d) the content and filing with securities regulatory authorities of Form 51-101F1 containing reserves data and other oil and gas information;
(e) the filing of Form 51-101F2 which is the report of the independent qualified reserves evaluator on the reserves data; and
(f) the content and filing of this report.
Because the reserves data are based on judgments regarding future events, actual results will vary and the variations may be material. However, any variations should be consistent with the fact that reserves are categorized according to the probability of their recovery.
DATED as of this 21st day of March, 2012.
(signed) “David Harquail” |
| (signed) “ Geoffrey Waterman” |
David Harquail |
| Geoffrey Waterman |
|
|
|
(signed) “Randall Oliphant” |
| (signed) “Derek Evans” |
Randall Oliphant |
| Derek Evans |
APPENDIX C
FRANCO-NEVADA CORPORATION
AUDIT AND RISK COMMITTEE CHARTER
PURPOSE
The Audit and Risk Committee is appointed by the Board of Directors of Franco-Nevada Corporation (the “Company”) to assist the Board of Directors in its oversight and evaluation of:
· the quality and integrity of the financial statements of the Company,
· �� the compliance by the Company with legal and regulatory requirements in respect of financial disclosure,
· the qualification, independence and performance of the Company’s independent auditors,
· the performance of the Company’s Chief Financial Officer,
· risk management oversight,
· the compliance by the Company with legal and regulatory requirements in respect of its oil and gas disclosure, and
· the qualification, independence and performance of the Company’s qualified oil and gas reserves evaluator or auditor.
In addition, the Audit and Risk Committee provides an avenue for communication between the independent auditor, financial management, other employees and the Board of Directors concerning accounting and auditing matters.
The Audit and Risk Committee is directly responsible for the appointment, compensation, retention (and termination) and oversight of the work of the independent auditor (including oversight of the resolution of any disagreements between management and the independent auditor regarding financial reporting) for the purpose of preparing audit reports or performing other audit, review or attest services for the Company.
The Audit and Risk Committee is not responsible for:
· planning or conducting audits,
· certifying or determining the completeness or accuracy of the Company’s financial statements or that those financial statements are in accordance with applicable accounting principles or standards, or
· guaranteeing the report of the Company’s independent auditor.
The fundamental responsibility for the Company’s financial statements and disclosure rests with management. It is not the duty of the Audit and Risk Committee to conduct investigations, to itself resolve disagreements (if any) between management and the independent auditor or to ensure compliance with applicable legal and regulatory requirements.
REPORTS
The Audit and Risk Committee shall report to the Board of Directors of the Company on a regular basis and, in any event, before the public disclosure by the Company of its quarterly and annual financial results. The reports of the Audit and Risk Committee shall include any issues of which the Committee is aware with respect to the quality or integrity of the Company’s financial statements, its compliance with legal or regulatory requirements in respect of financial matters and disclosure, and the performance and independence of the Company’s independent auditor.
The Committee shall also prepare, as required by applicable law, any committee report required for inclusion in the Company’s publicly filed documents.
COMPOSITION
The members of the Audit and Risk Committee shall be three or more individuals who are appointed (and may be replaced) by the Board of Directors of the Company on the recommendation of the Company’s Compensation and Corporate Governance Committee. Each of the members of the Audit and Risk Committee
shall be “independent” and “financially literate” within the meaning of National Instrument 52-110 — Audit Committees (“NI 52-110”) and any other securities legislation and stock exchange rules applicable to the Company, and as confirmed by the Board of Directors using its business judgment. In addition, at least one member of the Audit and Risk Committee shall be a “financial expert” as determined by the Board of Directors in its business judgment. No member of the Audit and Risk Committee shall accept (directly or indirectly) any consulting, advisory or other compensatory fee from the Company or any of its subsidiaries or affiliates (collectively, the “Franco-Nevada Group”) (other than remuneration for acting in his or her capacity as a director) or be an “affiliated entity” within the meaning of NI 52-110.
RESPONSIBILITIES
Independent Auditors
The Audit and Risk Committee shall:
· Recommend to the Board of Directors the independent auditor to be nominated for the purpose of preparing or issuing an auditor’s report or performing other audit, review or attest services for the Company and the compensation of the independent auditor;
· Recommend to the Board of Directors any change of the independent auditor, and oversee any such change to ensure compliance with the provisions of the Canada Business Corporations Act and applicable securities legislation;
· Require and obtain confirmation from the independent auditor that it ultimately is accountable, and will report directly, to the Audit and Risk Committee and the Board of Directors of the Company;
· Oversee the work of the independent auditor engaged for the purpose of preparing or issuing an auditor’s report or performing other audit, review or attest services for the Company, including the resolution of disagreements between management and the external auditor regarding financial reporting;
· Pre-approve all audit and permitted non-audit services provided to the Company and its subsidiary entities by the independent auditor, including adopting policies and procedures for the pre-approval of the retention thereof (subject to any restrictions on such services imposed by applicable securities legislation) and including procedures for the delegation of authority to provide such approval to one or more members of the Audit and Risk Committee; and
· At least annually, review the qualifications, performance and independence of the independent auditor. In doing so, the Audit and Risk Committee should, among other things, undertake the measures set forth in Schedule “A”.
The Financial Statements, Audit Process and Related Disclosure
The Audit and Risk Committee shall:
· As may be delegated by the Board of Directors, review, approve and authorize the issuance of the Company’s interim financial statements, MD&A and interim earnings press releases before the Company publicly discloses this information;
· Review and recommend to the Board of Directors for approval the Company’s annual financial statements, MD&A and press releases before the Company publicly discloses the information; and
· Be satisfied that adequate procedures are in place for the review of the Company’s public disclosure of financial information extracted or derived from the Company’s financial statements and will periodically assess the adequacy of those procedures.
The Audit and Risk Committee shall also, as it determines to be appropriate:
· Review with management and the independent auditor,
· the planning and staffing of the audit by the independent auditor,
· financial information and any earnings guidance provided to analysts and rating agencies, recognizing that this review and discussion may be done generally (consisting of a discussion of the types of information to be disclosed and the types of presentations to be made) and need not take place in advance of the disclosure of each release or provision of guidance,
· any significant financial reporting issues and judgments made in connection with the preparation of the Company’s financial statements, including any significant changes in the selection or application of accounting principles or standards, any major issues regarding auditing principles and practices, and the adequacy of internal controls that could significantly affect the Company’s financial statements, as raised by the independent auditor, and review management’s response thereto,
· all critical accounting policies and practices used,
· all alternative treatments of financial information by applicable accounting principles or standards that have been discussed with management, ramifications of the use of such alternative disclosures and treatments, and the treatment preferred by the independent auditor,
· the use of “pro forma” or “adjusted” information that is not consistent with applicable accounting principles or standards,
· the effect of regulatory and accounting initiatives, as well as any off-balance sheet structures, transactions, arrangements and obligations (contingent or otherwise), on the Company’s financial statements,
· any disclosures concerning any weaknesses or any deficiencies in the design or operation of internal controls or disclosure controls made to the Audit and Risk Committee by the Chief Executive Officer and the Chief Financial Officer during their certification process for forms filed with applicable securities regulators, and
· the adequacy of the Franco-Nevada Group’s internal accounting controls and management information systems and its financial, auditing and accounting organizations and personnel and any special steps adopted in light of any material control deficiencies.
· Review with the independent auditor,
· the quality as well as the acceptability of the accounting principles or standards that have been applied,
· any problems or difficulties the independent auditor may have encountered during the provision of its audit-related services, including any restrictions on the scope of activities or access to requested information and any significant disagreements with management, any management letter provided by the independent auditor or other material communication (including any schedules of unadjusted differences) to management and the Company’s response to that letter or communication, and
· any changes to the Company’s significant auditing and accounting principles, standards and practices suggested by the independent auditor to members of management.
Risk Management Oversight
The Audit and Risk Committee shall:
· Generally review with management the Franco-Nevada Group’s significant risks and exposures and the steps management has taken to manage, monitor and control such risks and exposures.
· More specifically review the Company’s principal business, political, financial, litigation and control risks and exposures with a view to ensuring that such risks and exposures are being effectively managed, monitored or controlled by:
· reviewing the Company’s risk philosophy as set forth by management and the Board of Directors,
· reviewing management’s assessment of the significant risks and exposures facing the Company,
· reviewing management’s policies, plans, processes and programs to manage and control significant risks and exposures, including the Company’s loss prevention policies, disaster response and recovery programs, corporate liability protection programs for directors and officer and any other insurance programs, as applicable,
· receiving regular reports from management regarding the development and implementation of its policies, plans, processes and programs to manage, monitor and control significant risks and exposures, and
· if the Audit and Risk Committee deems it appropriate, requesting the independent auditor’s opinion of management’s assessment of significant risks facing the Company and how effectively they are managed, monitored and controlled.
Oil and Gas Reserves
The Audit and Risk Committee shall:
· Recommend to the Board of Directors the appointment of the qualified oil and gas reserves evaluators or auditors, who must be independent of the Company and who will report to the Board of Directors and the Committee on the Company’s oil and gas reserves data.
· Review, with reasonable frequency, the Company’s procedures relating to the disclosure of information with respect to oil and gas activities, including its procedures for complying with applicable disclosure requirements and restrictions.
· Review each appointment of the Company’s qualified oil and gas reserves evaluators or auditors, and in the case of any proposed change in such appointment, determine the reasons for the proposal and whether there have been disputes between the appointed qualified oil and gas reserves evaluator or auditor and management of the Company.
· Review, with reasonable frequency, the Company’s procedures for providing information to the qualified oil and gas reserves evaluators or auditors who report on oil and gas reserves data.
· Prior to approving the filing of oil and gas reserves data and the report of the qualified oil and gas reserves evaluators or auditors meet with management and each qualified oil and gas reserves evaluator or auditor to:
· determine whether any restrictions affect the ability of the qualified oil and gas reserves evaluator or auditor to report on the oil and gas reserves data without reservation; and
· review the oil and gas reserves data and the report of the qualified oil and gas reserves evaluator or auditor thereon.
· Recommend to the Board of Directors whether to approve:
· the content and filing of the statement of oil and gas reserves data and other required information,
· the filing of the report of the independent qualified oil and gas reserves evaluator or auditor, and
· the content and filing of the required report of management and the directors.
Compliance
The Audit and Risk Committee shall:
· Establish procedures for:
· the receipt, retention and treatment of complaints received by the Company regarding accounting, internal accounting controls or auditing matters, and
· the confidential, anonymous submission by employees of the Franco-Nevada Group of concerns regarding questionable accounting or auditing matters.
· Review and approve clear policies for the hiring by the Franco-Nevada Group of partners, employees or former partners or employees of the present and former independent auditor of the Company.
The Audit and Risk Committee shall also, as it determines appropriate:
· Obtain reports from the Chief Financial Officer, other members of management and the independent auditor that the Company’s subsidiary/foreign affiliated entities are in conformity with applicable legal requirements and the Company’s Code of Business Conduct and Ethics, including disclosures of insider and affiliated party transactions.
· Review with the Chief Financial Officer, other members of management and the independent auditor any correspondence with regulators or governmental agencies and any employee complaints or published reports, which raise material issues regarding the Company’s financial statements or accounting policies.
· Advise the Board of Directors of the Company with respect to the Franco-Nevada Group’s policies and procedures regarding compliance with applicable laws and regulations and with the Company’s Code of Business Conduct and Ethics.
· Review with the Chief Financial Officer legal matters that may have a material impact on the financial statements, the Franco-Nevada Group’s compliance policies and any material reports or inquiries received from regulators or governmental agencies.
· Periodically review with management the need for an internal audit function.
Delegation
To avoid any confusion, the Audit and Risk Committee responsibilities identified above are the sole responsibility of the Audit and Risk Committee and may not be delegated to a different committee.
MEETINGS
The Audit and Risk Committee shall meet at least quarterly and more frequently as circumstances require. All members of the Audit and Risk Committee should strive to be at all meetings. The Audit and Risk Committee shall meet separately, periodically, with management and the independent auditors and may request any officer or employee of the Franco-Nevada Group or the Franco-Nevada Group’s outside counsel or independent auditor to attend meetings of the Committee or with any members of, or advisors to, the Committee. The Audit and Risk Committee also may meet with the investment bankers, financial analysts and rating agencies that provide services to, or follow, the Franco-Nevada Group.
The Audit and Risk Committee may form and delegate authority to individual members and subcommittees where the Committee determines it is appropriate to do so.
INDEPENDENT ADVICE
In discharging its mandate, the Audit and Risk Committee shall have the authority to retain (and authorize the payment by the Company of) and receive advice from special legal, accounting or other advisors as the Audit and Risk Committee determines to be necessary to permit it to carry out its duties.
ANNUAL EVALUATION
At least annually, the Audit and Risk Committee shall, in a manner it determines to be appropriate:
· Perform a review and evaluation of the performance of the Committee and its members, including the compliance of the Audit and Risk Committee with this Charter.
· Review and assess the adequacy of its Charter and recommend to the Board of Directors any improvements to this Charter that the Committee determines to be appropriate.
SCHEDULE “A”
Qualifications, Performance and Independence of Independent Auditor
· Review the experience and qualifications of the senior members of the independent auditor’s team.
· Confirm with the independent auditor that it is in compliance with applicable legal, regulatory and professional standards relating to auditor independence.
· Review annual reports from the independent auditor regarding its independence and consider whether there are any non-audit services or relationships that may affect the objectivity and independence of the independent auditor and, if so, recommend that the Board of Directors of the Company take appropriate action to satisfy itself of the independence of the independent auditor.
· Obtain and review such report(s) from the independent auditor as may be required by applicable legal and regulatory requirements.
Updated: March 24, 2011
