Exhibit 99.2
PALMAREJO PROJECT
SW Chihuahua State, Mexico
YE 2012 - TECHNICAL REPORT
Prepared for Franco-Nevada Corporation
January 1, 2013
Prepared by or under the Supervision of:
Donald J. Birak, Senior Vice President - Exploration, Coeur d’Alene Mines Corporation, a Qualified Person under NI 43-101, Fellow AusIMM, Member SME.
Keith Blair, Manager, Applied Geoscience LLC, a Qualified Person under NI 43-101, Member AIPG (CPG).
Klaus Triebel, Senior Corporate Resource Geologist, Coeur d’Alene Mines Corporation, a Qualified Person under NI 43-101, Member AIPG (CPG).
1
TABLE OF CONTENTS
SECTION | | PAGE |
| |
SECTION 1 - SUMMARY | 13 |
1.1 Property Description and Location | 13 |
1.2 Exploration | 14 |
1.3 Status of Development and Mine Operations | 14 |
1.4 Mineral Resource and Mineral Reserve Estimates | 15 |
1.5 Economic Analysis | 18 |
1.6 Conclusions and Recommendations | 22 |
SECTION 2 - INTRODUCTION | 23 |
SECTION 3 - RELIANCE ON OTHER EXPERTS | 24 |
SECTION 4 - PROPERTY DESCRIPTION AND LOCATION | 25 |
4.1 Property Description and Location | 25 |
4.2 Land Tenure | 26 |
4.2.1 Mining Concession Agreements | 29 |
4.2.2 Ejido Agreements | 33 |
4.2.3 Royalty Agreement | 35 |
SECTION 5 - ACCESSIBILITY, CLIMATE, LOCAL RESOURCES, INFRASTRUCTURE AND PHYSIOGRAPHY | 36 |
5.1 Accessibility | 36 |
5.2 Climate | 36 |
5.3 Local Resources and Infrastructure | 36 |
5.4 Physiography and Vegetation | 37 |
SECTION 6 - HISTORY | 40 |
6.1 Exploration and Mining History | 40 |
6.2 Historic Resource Estimates | 42 |
6.2.1 NI 43-101 Compliant Mineral Resource Estimates | 42 |
6.3 Palmarejo Mine - Coeur Mexicana Production | 51 |
SECTION 7 - GEOLOGIC SETTING and MINERALIZATION | 52 |
7.1 Regional Geology | 52 |
7.2 Regional Mineralization | 54 |
7.3 Palmarejo Area | 56 |
7.4 Guadalupe Area | 60 |
7.5 La Patria Area | 66 |
7.6 Other Areas of Mineralization | 69 |
SECTION 8 - DEPOSIT TYPES | 71 |
SECTION 9 - EXPLORATION | 73 |
9.1 Planet Gold Exploration, 2003-2007 | 73 |
9.2 Coeur Mexicana Exploration 2008-Present | 75 |
SECTION 10 - DRILLING | 76 |
10.1 Pre-Coeur Mexicana Drilling - Planet Gold Drilling (2003-2007) | 76 |
10.2 Coeur Mexicana Drilling | 77 |
10.3 Core Drilling and Logging | 77 |
10.4 Reverse Circulation Drilling and Logging | 78 |
10.5 Sampling Method and Approach Summary | 78 |
10.6 Diamond Drilling Sampling | 79 |
2
10.7 Reverse Circulation Drilling Sampling | 79 |
SECTION 11 - SAMPLE PREPARATION, ANALYSIS, AND SECURITY | 81 |
11.1 Historic QA/QC and Third Party Reviews | 81 |
11.1.1 Historic Palmarejo QA/QC Program Review by Applied Geoscience, LLC | 81 |
11.1.2 AMEC’s 2008 Review of Palmarejo QA/QC | 83 |
11.1.3 Guadalupe Project Historic QA/QC and Third Party Reviews | 84 |
11.1.4 La Patria Project QA/QC Review | 84 |
11.1.5 Third Party Reviews of Historic QA/QC - Discussion and Recommendations | 85 |
11.2 Coeur QA/QC Programs | 86 |
11.2.1 Coeur QA/QC Summary - Palmarejo Deposit | 86 |
11.2.1.1 QAQC Results Palmarejo Exploration and Production Sampling 2012 | 86 |
11.2.1.2 2012 QA/QC Palmarejo Mine Area Exploration and Production | 87 |
11.2.2 Coeur QA/QC Summary - Guadalupe, La Patria and District Exploration Targets | 100 |
11.2.2.1 Earlier QA/QC Programs | 100 |
11.2.2.2 NCL Audit | 100 |
11.2.2.3 Palmarejo District QA/QC (excluding Palmarejo mine area) QA/QC Discussion and Recommendations | 101 |
11.2.2.4 QAQC Results Guadalupe, La Patria and Other Exploration Sampling 2012 | 102 |
SECTION 12 - DATA VERIFICATION | 115 |
12.1 Assays | 115 |
12.1.1 External Audit of Assays in AcQuire | 115 |
12.1.2 Internal Assay Validation | 116 |
12.2 Palmarejo | 116 |
12.3 Guadalupe | 116 |
12.4 La Patria | 117 |
12.4.1 Internal Geology Validation | 118 |
12.5 Site Visit | 118 |
SECTION 13 - MINERAL PROCESSING AND METALLURGICAL TESTING | 119 |
13.1 Historic Third Party Test Programs Summary | 119 |
13.2 Palmarejo Metallurgical Test work Summary | 121 |
13.3 Guadalupe Metallurgical Test work Summary | 133 |
13.4 La Patria Metallurgical Test work Summary | 137 |
SECTION 14 - MINERAL RESOURCES | 142 |
14.1 Mineral Resource Estimation Methodology Palmarejo Deposit | 142 |
14.1.1 Assay Data | 142 |
14.1.2 Material Density | 143 |
14.1.3 Geology Modeling | 144 |
14.1.4 Exploratory Data Analysis (EDA) | 150 |
14.1.5 Block Model Validation | 165 |
14.1.6 Resource Classification | 174 |
14.1.7 Statement of Mineral Resources Palmarejo Deposit | 174 |
14.2 Mineral Resource Estimation Methodology Guadalupe Deposit | 176 |
14.2.1 Data | 176 |
14.2.2 Density | 177 |
14.2.3 Deposit Geology Pertinent to Resource Modeling | 178 |
14.2.4 Exploratory Data Analysis (EDA) | 181 |
14.2.5 Block Model Estimation Methodology Guadalupe | 185 |
14.2.6 Block Model Validation | 187 |
14.2.7 Classification Scheme | 192 |
3
14.2.8 Statement of Mineral Resources Guadalupe Deposit | 193 |
14.3 Mineral Resource Estimation Methodology La Patria | 195 |
14.3.1 Data | 195 |
14.3.2 Material Density | 196 |
14.3.3 Geological Model | 197 |
14.3.4 Exploratory Data Analysis (EDA) | 200 |
14.3.5 Block Model Estimation Methodology La Patria | 204 |
14.3.6 Block Model Estimation Methodology La Patria | 207 |
14.3.7 Classification Scheme | 208 |
14.3.8 Block Model Validation | 208 |
14.3.9 Visual Validation | 208 |
14.3.10 Statement of Mineral Resources La Patria | 216 |
14.4 Summary of Mineral Resources Palmarejo District | 217 |
SECTION 15 - MINERAL RESERVE ESTIMATES | 219 |
15.1 Palmarejo Deposit Mineral Reserves | 219 |
15.1.1 Palmarejo Underground Reserve Methodology | 219 |
15.1.2 Palmarejo Open Pit Reserve Methodology | 220 |
15.2 Guadalupe Deposit Mineral Reserves | 220 |
15.2.1 Guadalupe Underground Reserve Methodology | 221 |
15.2.2 Guadalupe Open Pit Reserve Methodology | 221 |
15.3 Summary of Mineral Reserves Palmarejo District | 222 |
15.4 Equivalent Factor | 222 |
SECTION 16 - MINING METHODS | 223 |
16.1 Palmarejo Operations | 224 |
16.2 Guadalupe Operations | 227 |
SECTION 17 - RECOVERY METHODS | 230 |
17.1 Mineral Processing | 230 |
17.2 Crushing | 230 |
17.3 Grinding | 230 |
17.4 Flotation | 230 |
17.5 Flotation Concentrate Leaching | 232 |
17.6 Flotation Tailings Leaching | 232 |
17.7 Carbon Desorption | 232 |
17.8 Carbon Regeneration | 233 |
17.9 Electrowinning, Merrill Crowe and Smelting | 233 |
17.10 Cyanide Detoxification | 233 |
17.11 Metallurgical Performance | 235 |
SECTION 18 - PROJECT INFRASTRUCTURE | 236 |
SECTION 19 - MARKET STUDIES AND CONTRACTS | 237 |
SECTION 20 - ENVIRONMENTAL STUDIES, PERMITTING AND SOCIAL OR COMMUNITY IMPACT | 238 |
SECTION 21 - CAPITAL AND OPERATING COSTS | 241 |
21.1 Capital Cost Estimate Palmarejo and Guadalupe | 241 |
21.2 Operating Cost Estimate Palmarejo | 241 |
21.3 Operating Cost Estimate Guadalupe | 241 |
SECTION 22 - ECONOMIC ANALYSIS | 243 |
SECTION 23 - ADJACENT PROPERTIES | 248 |
SECTION 24 - OTHER RELEVANT DATA AND INFORMATION | 249 |
4
SECTION 25 - INTERPRETATION AND CONCLUSIONS | 250 |
SECTION 26 - RECOMMENDATIONS | 251 |
26.1 Sampling | 251 |
26.2 Resource modeling | 251 |
26.3 Processing | 252 |
SECTION 27 - REFERENCES | 254 |
5
LIST OF TABLES | | PAGE |
| | |
Table 1.1: Total Palmarejo District Resource Inclusive of Mineral Reserves | 17 |
Table 1.2: Total Palmarejo District Mineral Reserves | 18 |
Table 1.3: Total Palmarejo District Mineral Resource Exclusive of Mineral Reserves | 18 |
Table 1.4: Palmarejo Operating Cost Estimates | 19 |
Table 1.5: Guadalupe Mine Operating Cost Estimates | 20 |
Table 1.6: Life-Of-Mine Economic Analysis | 21 |
Table 4.1: Mining Concessions Owned by Coeur Mexicana | 27 |
Table 4.2: Mining Concessions Partially Owned by Coeur Mexicana | 28 |
Table 4.3: CMP Agreement Concessions | 30 |
Table 4.4: Carmen Breach Valenzuela Agreement Concessions | 31 |
Table 4.5: Ricardo Rodriguez Lugo and Joaquin Rodriguez Lugo Agreement Concessions | 31 |
Table 4.6: Eva Alicia Fontes Manriquez, Et vir Agreement Concessions | 32 |
Table 4.7: Minera Azteca de Oro y Plata Agreement Concessions | 33 |
Table 6.1: Minas Huruapa S.A. de C.V. Production at Palmarejo Mine: 1979 to 1992 | 41 |
Table 6.2: Pre-Planet Gold Estimates of “Reserves” for the Palmarejo Mine | 42 |
Table 6.3: Palmarejo 2004 Silver and Gold Resources | 42 |
Table 6.4: Palmarejo 2005 Silver and Gold Resources | 43 |
Table 6.5: Palmarejo 2006 Silver and Gold Resources | 44 |
Table 6.6: Palmarejo 2007 Silver and Gold Resources; September 2007 | 45 |
Table 6.7: Guadalupe Inferred Resources; October 2006 | 46 |
Table 6.7a: Guadalupe Indicated Resources; September 2007 | 46 |
Table 6.7b: Guadalupe Inferred Resources; September 2007 | 47 |
Table 6.8: La Patria Inferred Resources: September 2007 | 47 |
Table 6.9: Total Palmarejo District Mineral Resources, January 1, 2009 | 48 |
Table 6.10: Total Palmarejo District Mineral Reserves, January 1, 2009 | 48 |
Table 6.11: Remaining Palmarejo District Mineral Resources, January 1, 2009 | 48 |
Table 6.12: Total Palmarejo District Mineral Resources, January 1, 2010 | 49 |
Table 6.13: Total Palmarejo District Mineral Reserves, January 1, 2010 | 49 |
Table 6.14: Remaining Palmarejo District Mineral Resources, January 1, 2010 | 49 |
Table 6.15: Total Palmarejo District Mineral Reserves, January 1, 2011 | 49 |
Table 6.16: Remaining Palmarejo District Mineral Resource, January 1, 2011 | 50 |
Table 6.17: Total Palmarejo District Mineral Reserves, January 1, 2012 | 50 |
Table 6.18: Remaining Palmarejo District Mineral Resource, January 1, 2012 | 50 |
Table 6.19: Coeur Palmarejo Mine Ore Production - Inception to December 31, 2012 | 51 |
Table 9.1: Planet Gold Palmarejo Underground Channel Sample Database Statistics | 73 |
Table 10.1: Palmarejo Drilling Summary - Planet Gold | 76 |
Table 10.2: Guadalupe Drilling Summary - Planet Gold 2005 - 2007 | 76 |
Table 10.3: Total Drilling at La Patria, 2005-2007 | 76 |
Table 11.1: Drilling Report Activity 2012 | 87 |
Table 11.2: Field and QA/QC Sample Activity 2012 | 88 |
Table 11.3: QAQC Failure Rate for 2012 Sampling Program | 88 |
Table 11.4: Standards Used in 2012 | 89 |
Table 11.5: Pulp Duplicate Failure for Resource Definition Drilling (ALS Chemex) | 94 |
6
Table 11.6: Sample Split Duplicate Failure for Resource Definition Drilling (ALS Chemex) | 94 |
Table 11.7: Sample Split Duplicate Failure for Development Drilling (PAL Site Lab) | 95 |
Table 11.8: Check Sample Results Guadalupe and La Patria Exploration Programs | 99 |
Table 11.9: Exploration QAQC Summary Palmarejo District - 2012 | 102 |
Table 11.10: Standards Used in 2012 Exploration Program | 103 |
Table 11.11: QAQC Failure Rate for 2012 Quality Control Standards and Blanks | 103 |
Table 11.12: Pulp Duplicate Failure for Resource Definition Drilling (ALS Chemex) | 109 |
Table 11.13: Check Sample Results Guadalupe and La Patria Exploration Programs | 112 |
Table 12.1: MDA Assay Certificate Audit Results | 115 |
Table 12.2: Guadalupe Laboratory Certificates Selected for Verification | 116 |
Table 12.3: Guadalupe Drillholes Selected for Collar Verification | 117 |
Table 12.4: La Patria Drillholes Selected for Collar Verification | 117 |
Table 13.1: Samples Tested | 122 |
Table 13.2: Comminution Test work Summary | 123 |
Table 13.3: Different Process Route Test work Summary | 124 |
Table 13.4: Flotation Test work Summary | 125 |
Table 13.5: Leaching Test work Summary | 126 |
Table 13.6: Cyanide Destruction Test work Summary | 127 |
Table 13.7: Settling Test work Summary | 129 |
Table 13.8: Oxygen Uptake Test work Summary | 130 |
PTable 13.9: Merrill Crowe Zinc Precipitation Test work Summary | 131 |
Table 13.10: Guadalupe Metallurgical Samples Selected | 133 |
Table 13.11: Guadalupe Metallurgical Test Results | 135 |
Table 13.12: Mineral Species at Guadalupe and Palmarejo | 136 |
Table 13.13: La Patria Metallurgical Test Drill Holes | 138 |
Table 14.1: Palmarejo Mine Area Drill and Other Data - YE2012 Mineral Resources Model | 142 |
Table 14.2: Palmarejo Specific-Gravity Statistics by Geology | 144 |
Table 14.3: Palmarejo Specific-Gravity by Geology | 144 |
Table 14.4: Palmarejo Lithological Unit Descriptions and Codes | 146 |
Table 14.5: Minas Huruapa Production 1979 to 1992 | 148 |
Table 14.6: Palmarejo Project – Mineral-Type Model Solid Description | 150 |
Table 14.7: Sample Statistics – Rosario Area | 151 |
Table 14.8: Sample Statistics – Tucson-Chapotillo Area | 152 |
Table 14.9: Sample Statistics – 76-108 Clavo Area | 152 |
Table 14.10: Trimming Levels by Area and Mineral Type | 153 |
Table 14.11: Trimmed Sample Statistics – Rosario Area | 153 |
Table 14.12: Trimmed Sample Statistics – Tucson-Chapotillo Area | 154 |
Table 14.13: Trimmed Sample Statistics – 76-108 Clavo Area | 154 |
Table 14.14: Indicator Grade Levels – Ag_ppm, Au_ppm | 158 |
Table 14.15: Vein/Structure Orientations by Area | 163 |
Table 14.16: Variogram Models by Indicator Domain and Metal– Rosario Area | 164 |
Table 14.17: Block Model Geometry | 164 |
Table 14.18: ID3 vs. NN Block Grades a: Gold and Silver Statistics | 171 |
Table 14.19: ID3 Model and Mean Composite Grade Comparison: Gold and Silver Statistics (xval: composite mean) | 173 |
7
Table 14.20: Resource Classification Parameters | 174 |
Table 14.21: Total Palmarejo Deposit Total Mineral Resource- Inclusive of Mineral Reserves | 175 |
Table 14.22: Palmarejo Deposit Remaining Mineral Resource- Exclusive of Reserves | 176 |
Table 14.23: Guadalupe Resource Drill Data - YE2012 Model | 177 |
Table 14.24: Guadalupe Specific - Gravity Statistics: Mineralized Core Samples | 178 |
Table 14.25: Guadalupe Mineral - Type Domain Codes | 180 |
Table 14.26: Guadalupe – Assay Sample Statistics by Mineral Type | 182 |
Table 14.27: Composite Statistics for each Lithological Domain for Gold and Silver | 183 |
Table 14.28: Guadalupe - Pair-Wise Variography Models by Metal,, Structural Domain, and Lithology Type | 185 |
Table 14.29: Structural Domain Definitions | 187 |
Table 14.30: Block Grades and Composite Grades Comparison by Rock Type: Gold and Silver Statistics) | 192 |
Table 14.31: Classification Criteria | 193 |
Table 14.32: Guadalupe Deposit Mineral Resource Inclusive of Mineral Reserves | 194 |
Table 14.33: Guadalupe Deposit Remaining Mineral Resource- Exclusive of Reserves | 195 |
Table 14.34: Coeur Mexicana La Patria Drill-Hole Database | 196 |
Table 14.35: La Patria – Specific - Gravity Statistics: Mineralized Core Samples | 197 |
Table 14.36: La Patria – Mineral Type Domain Coding | 198 |
Table 14.37: La Patria - Sample Statistics by Mineral Type | 200 |
Table 14.38: La Patria - Trimming Levels by Mineral Type | 201 |
Table 14.39: La Patria – Trimmed Sample Statistics by Mineral Type | 202 |
Table 14.40: La Patria – Composite Statistics by Mineral Type | 203 |
Table 14.41: La Patria - Vein/Structure Orientations by Area | 205 |
Table 14.42: La Patria – Exponential Variogram Models Parameters | 206 |
Table 14.43: La Patria – Search Parameters | 207 |
Table 14.44: La Patria - Block Model Geometry | 207 |
Table 14.45: La Patria – Block Classification Scheme | 208 |
Table 14.46: La Patria – Block Model Statistics | 214 |
Table 14.47: La Patria - Deposit Mineral Resources | 217 |
Table 14.48: Total Palmarejo District Mineral Resource Inclusive of Mineral Reserves | 217 |
Table 14.49: Total Palmarejo District Mineral Resource Exclusive of Mineral Reserves | 218 |
Table 15.1: Proven and Probable Mineral Reserves – Palmarejo Deposit | 219 |
Table 15.2: Proven and Probable Mineral Reserves – Guadalupe Deposit | 221 |
Table 15.3: Total Palmarejo District Mineral Reserves | 222 |
Table 16.1: Remaining Life-of-Mine Production Summary with Development | 223 |
Table 16.2: Palmarejo Underground Mining Methods and Stope Design Parameters | 225 |
Table 16.3: Palmarejo Open Pit Design and Operational Parameters | 226 |
Table 16.4: Guadalupe Underground Mining Methods, Design Parameters and Major Equipment | 228 |
Table 16.5: Guadalupe Basis For Open Pit Design and Operational Parameters | 229 |
Table 21.1: Palmarejo Operating Cost, Recovery and Cut-Off Grade Estimate | 241 |
Table 21.2: Guadalupe Operating Cost, Recovery and Cut-Off Grade Estimate | 242 |
Table 22.1: Life-Of-Mine Economic Analysis | 243 |
Table 22.2: Yearly Production and Cash Flows | 244 |
8
Table 22.3: Sensitivity of Project Performance to Gold and Silver Price | 244 |
Table 22.4: Sensitivity of Project Performance to a 10% Increase in Gold and Silver Grade | 245 |
Table 22.5: Sensitivity of Project Performance to a 10% Decrease in Gold and Silver Grade | 245 |
Table 22.6: Sensitivity of Project Performance to a 10% Increase in Operating Cost | 245 |
Table 22.7: Sensitivity of Project Performance to a 10% Decrease in Operating Cost | 245 |
Table 22.8: Sensitivity of Project Performance to a 10% Increase in Capital Costs | 246 |
Table 22.9: Sensitivity of Project Performance to a 10% Decrease in Capital Costs | 246 |
Table 22.10: Tax Rates | 247 |
9
LIST OF FIGURES | | PAGE |
| | |
Figure 1.1: Regional Map Showing Project Location | 13 |
Figure 1.2: Localized Map Showing Project Location | 14 |
Figure 1.3: Locations of Palmarejo District Mineral Deposits | 16 |
Figure 4.1: General Project Location | 25 |
Figure 4.2: Property Map of the Palmarejo District | 29 |
Figure 5.1: Overview of the Palmarejo Area | 38 |
Figure 5.2: Overview of the Guadalupe Area | 39 |
Figure 7.1: Palmarejo Location at the Boundary between the Western Mexican Basin and Range Province and the Sierra Madre Occidental (Earthscope, 2012) | 52 |
Figure 7.2: Regional Geology of the Palmarejo Area | 55 |
Figure 7.3: Geologic Map of the Palmarejo Area | 57 |
Figure 7.4: Four Breccia Types of the Palmarejo Mineralized Veins | 59 |
Figure 7.5: Geologic Map of the Guadalupe Area | 61 |
Figure 7.6: Cross Section of the Guadalupe Structure | 62 |
Figure 7.7: Photo Showing the Guadalupe Norte Clay Alteration (Looking ENE) | 63 |
Figure 7.8: Photo Showing Sulfide Mineralization | 63 |
Figure 7.9: Photo Showing Mineralized Rhodochrosite | 64 |
Figure 7.10: Photo Showing Late - Deposited Carbonates | 65 |
Figure 7.11: Poorly Mineralized Structure at Surface and Clay Alteration at Guadalupe Norte. | 66 |
Figure 7.12: Geologic Map of the La Patria Area | 68 |
Figure 8.1: Low Sulfidation Polymetallic Silver-Gold Mineralization | 72 |
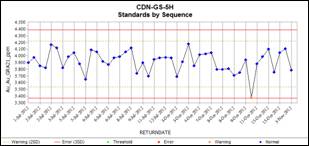
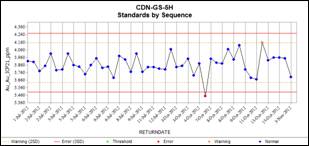
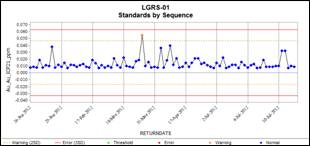
Figure 11.1: Standard Results for Category 3 Drilling Silver Gravimetric Results | 90 |
Figure 11.2: Standard Results for Categgory 3 Drilling Gold ICP Results | 91 |
Figure 11.3: Standard Results for Development Drilling Silver Gravimetric Results | 92 |
Figure 11.4: Standard Results for Development Drilling Gold AA Results | 92 |
Figure 11.5: Blank Results for Development Drilling | 93 |
Figure 11.6: Sample Duplicate Results for Category 3 Drilling | 96 |
Figure 11.7: Pulp Duplicate Results for Category 3 Drilling | 97 |
Figure 11.8: Sample Duplicate Results for Development Drilling | 98 |
Figure 11.9: Check Sample Results Palmarejo Gold Analysis | 99 |
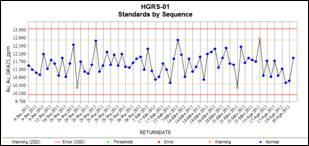
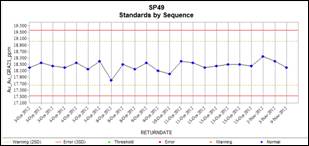
Figure 11.10: Guadalupe Standards ALS Chemex Silver Gravimetric Results | 104 |
Figure 11.11: Guadalupe Standards ALS Chemex Gold Gravimetric Results | 104 |
Figure 11.12: Guadalupe Standards ALS Chemex Gold ICP Results | 105 |
Figure 11.13: La Patria Standards ALS Chemex Silver Gravimetric Results | 105 |
Figure 11.14: La Patria Standards ALS Chemex Gold Gravimetric Results | 106 |
Figure 11.15: La Patria Standards ALS Chemex Gold ICP Results | 106 |
Figure 11.16: Guadalupe Blanks ALS Chemex Silver and Gold | 107 |
Figure 11.17: La Patria Blanks ALS Chemex Silver and Gold | 108 |
Figure 11.18: Guadalupe Pulp Duplicates ALS Chemex Silver and Gold | 110 |
Figure 11.19: La Patria Pulp Duplicates ALS Chemex Silver and Gold | 111 |
Figure 11.20: Gaudalupe Check Samples ALS Chemex vs. SGS | 113 |
Figure 11.21: La Patria Check Samples ALS Chemex vs. SGS | 113 |
Figure 13.1: Location of Samples for Metallurgical Testing | 133 |
10
Figure 13.2: Location of Samples for Mineralogical Studies | 134 |
Figure 13.3: Photomicrograph of Drill Hole TGDH-254 | 137 |
Figure 13.4: La Patria; Gold Extraction (%) vs. Calculated Head (g/t) | 139 |
Figure 13.5: La Patria; Silver Extraction (%) vs. Calculated Head (g/t) | 139 |
Figure 13.6: La Patria; Gold Extraction (%) vs. Calculated Head (gr/mt) | 140 |
Figure 13.7: La Patria; Silver Extraction (%) vs. Calculated Head (g/t) | 140 |
Figure 14.1 Palmarejo Project – Exploration and Definition Drill Holes | 143 |
Figure 14.2 Palmarejo Project – Model Domain Areas, Mineral-Type Model Coding | 145 |
Figure 14.3: AMEC/Coeur 2007 Void Model – 3-D view | 149 |
Figure 14.4: Composite Statistics by Mineral Type – Rosario Area | 155 |
Figure 14.5: Composite Statistics by Mineral Type – Tucson-Chapotillo Area | 156 |
Figure 14.6: Composite Statistics by Mineral Type – 76-108 Clavo Area | 157 |
Figure 14.7: Ag Indicator-Probability Domain Models – 3D View Looking Northeast | 159 |
Figure 14.8: Au Indicator-Probability Domain Models – 3D View Looking Northeast | 159 |
Figure 14.9: Composite Statistics by Indicator Domain – Rosario Area | 160 |
Figure 14.10: Composite Statistics by Indicator Domain – Tucson-Chapotillo Area | 161 |
Figure 14.11: Composite Statistics by Indicator Domain – 76-108 Clavo Area | 162 |
Figure 14.12: 76-108 Clavo Blocks and Composites Colored by Silver Grade | 166 |
Figure 14.13: 76-108 Clavo Blocks and Composites Colored by Gold Grade | 167 |
Figure 14.14: 76 Clavo Blocks and Composites Colored by Silver Grade | 168 |
Figure 14.15: 76 Clavo Blocks and Composites Colored by Gold Grade | 169 |
Figure 14.16: Guadalupe Project – Structural Domain Areas, Mineral-Type Model Coding | 181 |
Figure 14.17: Box Plots of Assay Silver grades in the four Lithology Domains | 182 |
Figure 14.18: Assay Length Distribution | 183 |
Figure 14.19: Box Plots of Composite Silver grades in the four Lithology Domains | 184 |
Figure 14.20: Block Model Geometry | 186 |
Figure 14.21: Ag Consolidated Block Model ID2 Grades vs. Ag Composites in g/t | 188 |
Figure 14.22: Au Consolidated Block Model ID2 Grades vs. Au Composites in g/t | 189 |
Figure 14.23: Guadalupe YE2012 Vein Domains -Swath Plots by Row—MI Blocks | 190 |
Figure 14.24: Guadalupe YE2012 Vein Domains - Swath Plots by Bench — MI Blocks | 191 |
Figure 14.25: La Patria – Drillhole – Vein Intersection Separation Distance | 196 |
Figure 14.26: La Patria – Structural Domain Areas, Vein Model | 199 |
Figure 14.27: La Patria - Sample Statistics Au Raw Assays | 200 |
Figure 14.28: La Patria - Sample Statistics Ag Raw Assays | 201 |
Figure 14.29: La Patria – Sample Length Frequency | 202 |
Figure 14.30: La Patria – Composite Statistics Ag | 203 |
Figure 14.31: La Patria – Composite Statistics Au | 204 |
Figure 14.32: Block Model Geometry | 205 |
Figure 14.33: La Patria – Inclined Long Section – Gold Model for Vein (100) | 209 |
Figure 14.34: La Patria – Inclined Long Section – Silver Model for Vein (100) | 209 |
Figure 14.35: La Patria – Vertical Section 1370 – Gold (looking northwest) | 210 |
Figure 14.36: La Patria – Vertical Section 1370 – Silver (looking northwest) | 211 |
Figure 14.37: La Patria – Vertical Section 1030 – Gold (looking northwest) | 212 |
Figure 14.38: La Patria – Vertical Section 1030 – Silver (looking northwest) | 213 |
Figure 14.39: La Patria YE2012 Geologic Domains - Swath Plots by Column – All Blocks | 215 |
11
Figure 14.40: La Patria YE2012 Geologic Domains - Swath Plots by Level – All Blocks | 216 |
Figure 17.1: Palmarejo Flotation Circuit Flow | 231 |
Figure 17.2: Palmarejo Process Flow Sheet | 234 |
12
SECTION 1 - SUMMARY
This Technical Report concerns the Palmarejo silver and gold project located in the Sierra Madre mountain range in the western portion of the state of Chihuahua, Mexico. The data presented in this report are related to the Palmarejo, Guadalupe, and La Patria deposits and their Mineral Resource and Reserve estimates. The information in this Technical Report is effective as of January 1, 2013, unless otherwise stated. All currency is expressed as US dollars unless otherwise noted.
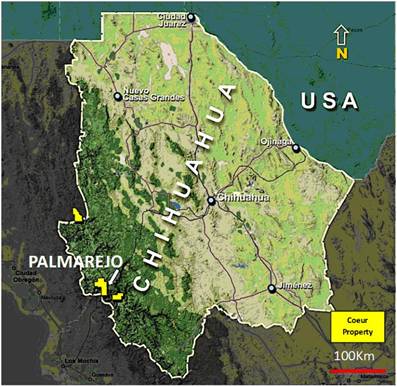
1.1 Property Description and Location
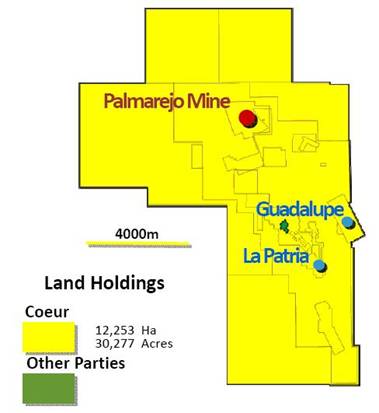
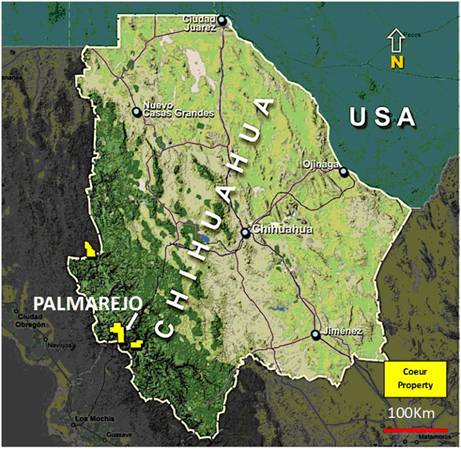
The Palmarejo Project is located about 420 kilometers by road southwest of the city of Chihuahua in the state of Chihuahua in northern Mexico and on the western edge of the Sierra Madre Occidental in the Témoris mining district (Figure 1.1). The project consists of the current Palmarejo surface and underground mine and mill complex, the Guadalupe deposit, located about 7 kilometers southeast of the Palmarejo mine and the La Patria deposit, located located southwest of Guadalupe (Figure 1.2). The terms “Palmarejo Project” or “Palmarejo District” used in this document refer to all three of the above mentioned deposits and consist of approximately 12,253 hectares covered by mining concessions. Coeur Mexicana owns or controls a 100% interest in 32 concessions totaling 12,204.10 hectares, a 50% interest in one concession of 43.77 hectares and 60% interest in two concessions totaling 5 additional hectares. (see Section 4).
Figure 1.1: Regional Map Showing Project Location
13
Figure 1.2: Localized Map Showing Project Location
1.2 Exploration
During the 2012 Exploration Year Coeur Mexicana drilled 103,873 meters of surface and underground core in 285 holes. This compares to the budgeted meterage of 84,000. Additional AFE’s extended the original budgeted funds from $15.8M USD to $21.0M USD expended at Palmarejo. Late in 2012 a new study indicated that potential for surface mineral deposits existed in the Animas (south) and Guadalupe North sections of the Guadalupe deposit. Drilling in early 2013 will further evaluate these areas. New mineralization was also cut in the Independencia clavo. Additional drilling during 2013 will seek to expand this deposit area. The Total Exploration Budget for 2013 at Palmarejo is $15 million.
1.3 Status of Development and Mine Operations
The Palmarejo Mine experienced its first complete year of operation in 2010 and recovered over 5.9 million ounces of silver and 102,000 ounces of gold. In 2011, 9.0 million ounces of silver and 125,000 ounces of gold were recovered in doré. Recovered precious metals for 2012 were 8.2 millon ounces of silver and 106,000 ounces for gold. The final tailings dam began receiving
14
tails during 2010 and continues to be constructed in stages to the final design crest elevation of 825 meters above sea level to be completed by 2014.
Ore at Palmarjo is mined by both conventional open pit techniques and by long hole underground techniques. Open pit mining operations are at full capacity. Haulage access to the process plant run-of-mine (ROM) stockpile and all waste dump areas are complete. Underground operation began stoping in mid-2010 with both transverse and longitudinal long hole stopes. During 2010 the Cement Rock Fill (CRF) backfill plant was completed and has been in full operation since the first quarter of 2011.
Current Mineral Reserves at the Palmarejo Mine include the “Rosario”, “Tucson”, and “Chapotillo” areas, mined by open pit methods and the “Rosario”, “76” and “108” areas, mined by underground methods.
The Guadalupe mine operation will operate as a satellite to the Palmarejo Mine. Haul road construction, geotechnical model development, and north portal pad construction were initiated in 2011. Collaring of the north portal took place in in 2012, with ore production scheduled to begin during third quarter 2013. The Palmarejo Mine will provide processing, tailings and administrative support for the Guadalupe Mine. Ore will be mined by long hole underground techniques (see Section 16). The ore material mined from Guadalupe to be hauled to the Palmarejo Mine site for processing at the existing Palmarejo mill and has been confirmed to have similar metallurgical characteristics as the existing Palmarejo underground operations.
1.4 Mineral Resource and Mineral Reserve Estimates
The silver and gold mineral deposits in the Palmarejo district are zoned epithermal occurrences hosted in quartz veins and quartz-rich breccias within a package of volcanic and volcano-sedimentary rocks known to host similar occurrences in the Sierra Madre Occidental of northern Mexico. The style of mineralization is typical of other epithermal precious metal deposits in the range as well as other parts of the world. Three deposits comprise the Mineral Resources and Reserves cited in this report —Guadalupe, Palmarejo, and La Patria (there are other mineralized targets on the property). The locations of mineralized structures are shown in red on the map below (Figure 1.3). The Palmarejo deposit includes the La Blanca and La Prieta veins that form a wishbone shown to the north. The Guadalupe and La Patria structures are shown to the south of the Palmarejo project.
15
Figure 1.3: Locations of Palmarejo District Mineral Deposits

16
The Mineral Resources and Mineral Reserves for the Palmarejo District stated in tables 1.1, 1.2 and 1.3 are effective January 1, 2013, and include the Palmarejo, Guadalupe, and La Patria silver and gold deposits. Palmarejo Mineral Resources are comprised of open pit resources above a cutoff grade of 0.98 g/t AuEq within a Whittle™ optimized pit and underground resources above a cutoff grade of 2.09 g/t AuEq. Guadalupe Mineral Resources are comprised of an open pit resources above a cutoff grade of 1.03 g/t and an underground resources above a cutoff grade of 2.14 g/t AuEq. La Patria Mineral Resources were calculated using a cutoff grade of 0.47 g/t AuEq. All resource cutoff grades were calculated using metal prices of US$1,700/oz gold and US$33.00/oz silver. The Au equivalent factor for Palmarejo and Guadalupe Mineral Resources were 58.96 and for LaPatria 56.49 (see Section 15). Rounding of tonnes, average grades and contained ounces may result in apparent discrepancies with total rounded tonnes, average grades and total contained ounces.
Table 1.1: Total Palmarejo District Resource Inclusive of Mineral Reserves
| | | | Average Grade
(g/t) | | Contained Ounces | |
Category | | Tonnes | | Au | | Ag | | Au | | Ag | |
Measured | | 8,103,000 | | 2.55 | | 190.3 | | 663,000 | | 49,578,000 | |
Indicated | | 25,067,000 | | 1.20 | | 61.1 | | 966,000 | | 49,272,000 | |
Meas. and Ind. | | 33,170,000 | | 1.53 | | 92.7 | | 1,629,000 | | 98,851,000 | |
Inferred | | 10,798,000 | | 1.32 | | 63.7 | | 457,000 | | 22,104,000 | |
Total Mineral Resource includes Proven and Probable Reserves
Cut-off grade for Palmarejo deposit: open pit 0.98 g/tAuEq, underground 2.09 g/tAuEq
Cut-off grade for Guadalupe deposit: open pit 1.03 g/tAuEq, underground 2.14 g/tAuEq
Cut-off grade for La Patria deposit 0.47 g/tAuEq
The Proven and Probable Mineral Reserves, effective January 1, 2013 (Table 1.2), are based on Measured and Indicated Mineral Resources only. The total Mineral Reserves for the Palmarejo District include the Palmarejo and Guadalupe deposits only. There are no Mineral Reserves defined for the La Patria deposit at this time. The separate Mineral Reserves for each deposit are detailed in Section 15 of this report. Each ore body has been evaluated using the appropriate mining method and corresponding cut-off grades using metal prices of US$27.50/oz silver and US$1,450/oz gold. Palmarejo Deposit Mineral Reserves were calculated using an open pit cutoff grade of 1.15 g/t AuEq and an underground cutoff grade of 2.45 g/t AuEq. Guadalupe Mineral Reserves were calculated using an open pit cutoff grade of 1.21 g/t AuEq and an underground cutoff grade of 2.51 g/t AuEq.
17
Table 1.2: Total Palmarejo District Mineral Reserves
| | | | Average Grade
(g/t) | | Contained Ouncespol; | |
Category | | Tonnes | | Au | | Ag | | Au | | Ag | |
Proven | | 5,213,000 | | 2.08 | | 160.2 | | 348,000 | | 26,858,000 | |
Probable | | 6,446,000 | | 1.53 | | 126.7 | | 317,000 | | 26,251,000 | |
Total | | 11,659,000 | | 1.77 | | 141.7 | | 665,000 | | 53,110,000 | |
Metal prices used were $1,450 USD per Au ounce, $27.50 US per Ag ounce
Includes Mineral Reserves for Palmarejo and Guadalupe deposits
Table 1.3 shows the remaining Mineral Resource for the Palmarejo District (including the Palmarejo, Guadalupe and La Patria deposits) exclusive of the Mineral Reserves and have not demonstrated economic viability.
Table 1.3: Total Palmarejo District Mineral Resource Exclusive of Mineral Reserves
| | | | Average Grade
(g/t) | | Contained Ounces | |
Category | | Tonnes | | Au | | Ag | | Au | | Ag | |
Measured | | 2,890,000 | | 3.39 | | 244.5 | | 315,000 | | 22,720,000 | |
Indicated | | 18,621,000 | | 1.08 | | 38.5 | | 649,000 | | 23,021,000 | |
Meas. and Ind. | | 21,511,000 | | 1.39 | | 66.1 | | 964,000 | | 45,741,000 | |
Inferred | | 10,798,000 | | 1.32 | | 63.7 | | 457,000 | | 22,104,000 | |
Mineral Resources are in addition to Mineral Reserves and have not demonstrated economic viability
Cut-off grade for Palmarejo deposit: open pit 1.03 g/tAuEq, underground 1.92 g/tAuEq
Cut-off grade for Guadalupe deposit: underground only 1.98 g/tAuEq
Cut-off grade for La Patria deposit 1.12 g/tAuEq
1.5 Economic Analysis
The economic analysis for Palmarejo District was based on a cash flow model which included the following inputs:
· Mineral Reserves as of January 1, 2013;
· Silver and gold prices of $1,450/oz Au and $27.50/oz Ag;
· Metallurgical recovery for silver and gold based on actual process plant results obtained to date and reasonable assumptions for continuous process improvement over time;
· Smelting and refining costs based on site information;
· Underground and open-pit mine production plans and schedules for Palmarejo and Guadalupe;
· Underground and open pit mining, ore processing and general and administration (G and A) Operating costs derived from previous actuals and LOM budget for Palmarejo and Guadalupe;
18
· Capital cost inputs including remaining construction, operating, sustaining and underground development capital for Palmarejo and Guadalupe; and
· Royalty payments to Franco Nevada Corporation according to the royalty agreement described in section 22;
Input parameters for ore and metal production, metallurgical recovery, capital and operating costs, and project schedule are based on current mine planning, detailed engineering, capital and operating cost updates and construction progress to date. The operating cost assumptions, metal prices, and process plant recoveries used for estimating open pit and underground reserves at Palmarejo and Guadalupe are summarized in Tables 1.4 and 1.5 (see Sections 21 and 22 for detailed costs and economic analysis).
Table 1.4: Palmarejo Operating Cost Estimates
Item | | Unit | | Value | |
Open Pit Mining | | $/tonne mined | | 1.92 | |
Underground Mining | | $/tonne mined | | 57.02 | |
Ore Processing | | $/tonne ore | | 32.47 | |
G & A - Open Pit and Underground | | $/tonne ore | | 17.66 | |
Reclamation – Open Pit | | $/tonne ore | | 0.20 | |
Cut-off Grade - Open Pit - Internal | | g/t AuEq | | 1.15 | |
Cut-off Grade - Underground | | g/t AuEq | | 2.45 | |
Gold Price | | $/oz | | 1450.00 | |
Silver Price | | $/oz | | 27.50 | |
Mill Recovery - Gold | | % | | 94 | % |
Mill Recovery - Silver | | % | | 82.5 | % |
Payable Metal - Gold | | % | | 99.90 | % |
Payable Metal - Silver | | % | | 99.70 | % |
19
Table 1.5: Guadalupe Mine Operating Cost Estimates
Item | | Unit | | Value | |
Open Pit Mining | | $/tonne mined | | 1.92 | |
Underground Mining | | $/tonne mined | | 57.02 | |
Ore Processing | | $/tonne ore | | 32.47 | |
Ore Transport — Guadalupe to Palmarejo Mill | | $/tonne ore | | 2.56 | |
G & A - Open Pit and Underground | | $/tonne ore | | 17.66 | |
Reclamation — Open Pit | | $/tonne ore | | 0.20 | |
Cut-off Grade - Open Pit — Internal | | g/t AuEq | | 1.21 | |
Cut-off Grade — Underground | | g/t AuEq | | 2.51 | |
Gold Price | | $/oz | | 1450.00 | |
Silver Price | | $/oz | | 27.50 | |
Mill Recovery — Gold | | % | | 94 | % |
Mill Recovery — Silver | | % | | 82.5 | % |
Payable Metal — Gold | | % | | 99.90 | % |
Payable Metal — Silver | | % | | 99.70 | % |
A summary of the economic analysis is shown in Table 1.6. The production schedule is based on concurrent mining of the Palmarejo open pit and underground Mineral Reserves and the Guadalupe underground Mineral Reserves.
20
Table 1.6: Life-Of-Mine Economic Analysis
Item | | Unit | | Palmarejo | | Guadalupe | |
Mine Production | | | | | | | |
Open Pit Tonnes | | tonnes ore | | 1,930,795 | | 563,102 | |
Ore Au Grade | | g/t Au | | 1.04 | | 1.42 | |
Ore Ag Grade | | g/t Ag | | 154.2 | | 156.1 | |
Underground Tonnes | | tonnes ore | | 2,508,240 | | 6,577,604 | |
Ore Au Grade | | g/t Au | | 3.14 | | 1.51 | |
Ore Ag Grade | | g/t Ag | | 183.6 | | 121.6 | |
Stockpile | | tonnes ore | | 79,391 | | | |
Ore Au Grade | | g/t Au | | 0.55 | | | |
Ore Ag Grade | | g/t Ag | | 77.0 | | | |
Mill Throughput | | | | | | | |
Total Ore Processed | | tonnes ore | | 11,659,133 | |
Ore Grade Au | | g/t Au | | 1.77 | |
Ore Grade Ag | | g/t Ag | | 141.7 | |
Metallurgical Recovery Au | | % | | 94% | |
Metallurgical Recovery Ag | | % | | 82.5% | |
Payable Au | | Oz Au | | 99.90% | |
Payable Ag | | Oz Ag | | 99.70% | |
Revenue | | | | | |
Gold Price | | $/oz | | $1,450 | |
Silver Price | | $/oz | | $27.50 | |
Gross Revenue | | $M | | $2,110.8 | |
Operating Costs | | | | | |
Open Pit Mining | | $M | | $(105.4) | |
Underground Mining | | $M | | $(253.0) | |
Milling/Processing | | $M | | $(378.6) | |
Smelting and Refining | | $M | | $(22.2) | |
G & A | | $M | | $(205.9) | |
Corporate Management Fee | | $M | | $(35.3) | |
Royalty(1) | | $M | | $(138.1) | |
Total Operating Cost | | $M | | $(1,138.5) | |
Cash Flow | | | | | |
Operating Cash Flow | | $M | | $936.5 | |
Capital | | $M | | $(171.3) | |
Royalty1 | | $M | | $(189.8) | |
Total Cash Flow (Net Cash Flow) | | $M | | $575.3 | |
Project NPV (8% discount rate) | | $M | | $431.4 | |
As of January 1, 2013, the Mineral Reserves are estimated to return an NPV of $431.4M at 8% discount rate, and generate a pre-tax net cash flow of $575.3M over the remaining life of the
21
project as illustrated in Table 1.6 above. The stated Mineral Reserves yield an estimated mine life of approximately eight years.
1.6 Conclusions and Recommendations
Palmarejo is an operating mining venture that has demonstrated positive cash flow. The financial analysis and associated assumptions conducted for this report support the conclusion that the Palmarejo mine will continue to be profitable and generate acceptable returns over the life of the mine.
It is recommended, based on the Guadalupe Mineral Reserves and joint economic analysis with the Palmarejo Mine, that Coeur continue to advance the Guadalupe project. Further work on Guadalupe will focus on optimization of mine designs and plans to maximize economic benefit of this addition to Palmarejo simultaneously as mine development work advances.
The Qualified Persons have visited the project sites and have reviewed all information regarding their relevant scopes of work (see Section 2). Data and assumptions used in the estimation of Mineral Resources and Mineral Reserves summarized in this report have been reviewed by the Qualified Persons, with reliance on other experts where appropriate (see Section 3), and they believe that the data are an accurate and reasonable representation of the Palmarejo silver-gold project.
It is the opinion of the Qualified Persons for this report that the Mineral Resource and Reserve estimates are based on valid data and are reasonably estimated using standard engineering practices. There are no known environmental, permitting, legal, title, socio-economic, marketing, or political issues that could materially affect the Palmarejo and Guadalupe Mineral Reserves.
22
SECTION 2 - INTRODUCTION
This Technical Report was prepared by or under the supervision of the Qualified Persons, for Coeur d’Alene Mines Corporation (Coeur), a publically-traded silver and gold mining company listed on the New York Stock Exchange as CDE, the Toronto Stock Exchange as CDM. The report has been prepared to provide scientific and technical information on the continuing operations, development and exploration of the Palmarejo Mine and surrounding concessions controlled by Coeur Mexicana (Palmarejo District) in a manner that is in accordance with Canadian National Instrument 43-101 disclosure and reporting requirements.
Mine Development Associates (MDA) authored previous Technical Reports (Gustin, M, 2004, 2005, 2006, 2007) pertaining to the Palmarejo District for the prior owners, Bolnisi Gold NL (BSG) and Palmarejo Silver and Gold Co (PJO). On December 21, 2007, Coeur acquired all of the outstanding stock of BSG, an Australian company listed on the Australian Stock Exchange, and PJO, a Canadian company listed on the TSX Venture Exchange. The principal asset of BSG was its ownership of 72.8% of the outstanding common shares of PJO. PJO, through its operating company Planet Gold S.A.de C.V., was engaged in the exploration and development of silver and gold properties located in Mexico. Among those was the Palmarejo Project. Section 27 details the sources of information used in the preparation of this report.
The Qualified Persons and contributors to this Technical Report are either senior members of Coeur’s corporate and technical staff or consultants retained to assist in preparing certain portions of the Technical Report. The contributors are or have been involved with the mineral exploration and extraction activities conducted by Coeur in the Palmarejo District.
The Qualified Persons for this Technical Report are
· Donald J. Birak, Coeur’s Senior Vice President— Exploration. Mr. Birak last visited the property from November 17th to November 19th, 2012.
· Keith R. Blair, Manager, Applied Geoscience LLC, Qualified Person per NI43-101. Mr. Blair (CPG) is a consulting geologist who was contracted to prepare the Mineral Resource estimates for the Palmarejo and La Patria deposits. He is a Qualified Person for the resource estimates of those properties.
· Klaus Triebel, Coeur’s Corporate Resource Geologist. Mr. Triebel (CPG) generated the resource estimate for the Guadalupe deposit and acts as a Qualified Person on that propery.
· Mr. Birak is the Qualified Person for all other aspects of this report.
The information contained in this Technical Report is current as of January 1, 2013 unless otherwise noted.
23
SECTION 3 - RELIANCE ON OTHER EXPERTS
The authors of this report state that they are the Qualified Persons for those areas identified in the appropriate “Certificate of Qualified Person” attached to this report. The authors may have relied upon, and believe there is a sound basis for reliance upon, the following experts and reports.
Open pit and underground mine designs, plans and schedules were prepared by mining engineers at the Palmarejo mine and at Coeur’s corporate office in Coeur d’Alene, Idaho. Such planning is generally subject to internal checks and verification but no exhaustive verification process was conducted by the Qualified Person for this report.
Economic analysis and associated financial model inputs were calculated, chosen and used by planning and accounting staff at the Palmarejo mine and at Coeur’s corporate office in Coeur d’Alene, Idaho. Such work is generally subject to internal checks and verification but no exhaustive verification process was conducted by the qualified person for this report.
Coeur has also relied on the drilling, interpretations, and results conducted by other experts (including AMEC and MDA). The Qualified Person has not personally verified the work performed by AMEC to create a model of the historic mining at Palmarejo and relies on their expertise, noting that the volume of the void model is reasonable for depletion of the Palmarejo resource model. The Qualified Persons have reviewed this information and drilling and sampling methods conducted by Coeur Mexicana and believe that the methods employed are sound and that the results and interpretations are accurate and within industry standards.
AMEC International (Chile) S.A., “Palmarejo Resource Modeling, Chihuahua, Mexico,” a private report for Coeur d’Alene Mines Corporation, February, 2008.
Outokumpu Pty Ltd., “Supaflo® Thickener Test Data Report S559TA”, private report for Intermet Engineering Technologies for the Palmarejo Project, July, 2005.
SGS, “Batch and Pilot Flotation on a Sample of Palmarejo Silver/Gold Ore, Lakefield Oretest Job Number 9632”; a private report for Bolnisi Gold NL, May, 2005.
SGS, “Pruebas Metalúrgicas Para Determinar la Susceptibilidad de Dos Muestras de Mineral a los Procesos de Lixiviación, Flotación y Concentración Gravimétrica”, Report No. SGS-49-08; a private report for Planet Gold, S.A. de C.V., November 11, 2008.
SGS, “Pruebas Metalúrgicas Para Determinar la Susceptibilidad de Cuatro Compositos de Mineral a los Procesos de Lixiviación, Flotación y Concentración Gravimétrica”, Report No. SGS-04-09; a prívate report for Coeur Mexicana, S.A. de C.V., March 06, 2009.
Pincock Allen & Holt PAH Consultants, “Mine Planning Exercise at the Coeur Palmarejo Mine, Mexico” PAH Project No. DE-00179, May, 2011.
24
SECTION 4 - PROPERTY DESCRIPTION AND LOCATION
4.1 Property Description and Location
The Palmarejo District is located in the state of Chihuahua in northern Mexico, 420 kilometers by road southwest of the city of Chihuahua, the state capital (Figures 1.1 and 4.1). The project lies in the Témoris mining district, part of the gold-silver belt of the Sierra Madre Occidental, about 15 kilometers northwest of the town of Témoris.
The project can be found on the Instituto de Nacional de Estadística, Geografía e Informática (“INEGI”) Ciudad Obregon geological sheet and the INEGI Chinipas de Almada topographic map and is centered on coordinates 27°23’ Longitude and 108°26’ Latitude. The coordinate system used for all maps and sections in this report is the Universal Transverse Mercator (WGS 84) Zone 12 (Northern Hemisphere).
The Dirección General de Minas (“General Bureau of Mines”) administers Mining Concessions in Mexico. A legal survey (“Trabajos Periciales”) of the property was completed as part of the process of obtaining the original Concessions.
Figure 4.1: General Project Location
25
4.2 Land Tenure
The Palmarejo Mine area consists of approximately 12,253 hectares covered by Mining Concessions (Figure 4.2). The Guadalupe project area is located entirely within this area of Mining Concessions and is contained within the San Carlos Concession, which consists of 160.0000 hectares, and is 100% owned by Coeur Mexicana S.A. de C.V. (“Coeur Mexicana”).
Mining Concessions totaling 32 and consisting of 12,204.1118 hectares are 100% owned and registered by Coeur Mexicana, formerly known as Planet Gold S.A. de C.V. (“Planet Gold”) are listed in Table 4.1 and include:
(1) 3,852.5095 hectares in the Trogan and Trogan Fracción Mining Concessions, the first tenements staked by Planet Gold to envelope all of the existing Concessions in the immediate project area (the “original Trogan Concessions”);
(2) The Ampliación Trogan, Ampliación Trogan Oeste, Trogan Norte 1, Trogan Norte 2, and Trogan Oeste Mining Concessions totaling 7,145.5227 hectares that are contiguous to the original Trogan Concessions on the north, northeast, and west;
(3) The La Buena Fe Norte Mining Concession covers 98.0878 hectares and was acquired by means of a lottery when the prior tenement holder defaulted on payment of Mining Duties; and
(4) 1,013.51 hectares in 21 concessions purchased by Planet Gold within the original Trogan Concessions that include the Palmarejo Resources described in following sections.
(5) 94.4844 hectares in three Concessions purchased by Coeur Mexicana in 2011 from Minera Azteca de Oro y Plata S.A. de C.V. (Minera Azteca). The acquisition is described below as the Guerra al Tirano agreement.
As shown in Table 4.2, three Concessions totaling 48.7717 hectares are partially owned by Coeur Mexicana (formerly Planet Gold), including 50% of the Camila Concession of 43.7717 hectares, and 60% of the Carrizo Concessions.
26
Table 4.1: Mining Concessions Owned by Coeur Mexicana
Concession | | Title Number | | Area (has.) | | Expiration Date | |
Trogan | | 221490 | | 3844.5413 | | Feb 18, 2054 | |
Trogan Fracción | | 221491 | | 7.9682 | | Feb 18, 2054 | |
Ampliación Trogan | | 224118 | | 703.2318 | | Apr 07, 2055 | |
Ampliación Trogan Oeste | | 225223 | | 1699.9939 | | Aug 04, 2055 | |
Trogan Norte 1 | | 225278 | | 1024.0000 | | Aug 11, 2055 | |
Trogan Norte 2 | | 225279 | | 1019.2222 | | Aug 11, 2055 | |
Trogan Oeste | | 225308 | | 2699.0748 | | Aug 15, 2055 | |
La Buena Fe Norte | | 226201 | | 98.0878 | | Nov 28, 2055 | |
Caballero Azteca | | 209975 | | 5.0510 | | Aug 30, 2049 | |
Carmelita | | 209976 | | 5.3430 | | Aug 30, 2049 | |
El Risco | | 210163 | | 24.0000 | | Sep 09, 2049 | |
La Aurelia | | 209541 | | 10.0000 | | Aug 02, 2049 | |
La Mexicana | | 212281 | | 142.1410 | | Sep 28, 2050 | |
Lezcura | | 210479 | | 14.5465 | | Oct 07, 2049 | |
Palmarejo | | 164465 | | 52.0737 | | May 08, 2029 | |
San Carlos | | 188817 | | 160.0000 | | Nov 28, 2040 | |
Santo Domingo | | 194678 | | 15.3737 | | May 06, 2042 | |
Unificación Huruapa | | 195487 | | 213.7755 | | Sep 13, 2039 | |
La Moderna | | 225574 | | 75.8635 | | Sep 22, 2055 | |
Los Tajos | | 186009 | | 2.7043 | | Dec 13, 2039 | |
La Estrella | | 189692 | | 59.5863 | | Dec 4, 2040 | |
Virginia | | 214101 | | 12.0906 | | Aug 9, 2051 | |
La Buena Fe | | 188820 | | 60.0000 | | Nov 28, 2040 | |
Ampliación La Buena Fe | | 209648 | | 40.8700 | | Aug 2, 2049 | |
La Victoria | | 210320 | | 76.0883 | | Sep 23, 2049 | |
Patria Vieja | | 167323 | | 4.0000 | | Nov 2, 2030 | |
Nueva Patria | | 167281 | | 11.0000 | | Oct 29, 2030 | |
Maclovia | | 167282 | | 6.0000 | | Oct 29, 2030 | |
San Juan de Dios | | 167322 | | 23.0000 | (1) | Nov 2, 2030 | |
Unificación Guerra al Tirano | | 170588 | | 27.4471 | | Jun 1, 2032 | |
Reyna de Oro | | 198543 | | 27.1791 | | Nov 29, 2043 | |
Tres de Mayo | | 187906 | | 39.8582 | | Nov 21, 2040 | |
Total | | | | 12,204.1118 | | | |
(1) The Title at the General Bureau of Mines (the “Bureau”) erroneously states Mining Concession is 5.2300 Ha. Coeur Mexicana is filing Writ to petition the Bureau, to have the Title accurately reflect the true size of San Juan de Dios Mining Concession, which is 23.0000 Ha.
27
Table 4.2: Mining Concessions Partially Owned by Coeur Mexicana
Concession | | Title Number | | Area (has.) | | Expiration Date | | Ownership | |
Camila | | 220801 | | 43.7717 | | Oct 7, 2053 | | 50 | % |
Carrizo Anexas | | 167284 | | 1.0000 | | Oct 29, 2030 | | 60 | % |
El Carrizo Anexas | | 167283 | | 4.0000 | | Oct 29, 2030 | | 60 | % |
Total | | | | 48.7717 | | | | | |
Types of Concession
Pursuant to an amendment of the Mexican Mining Law (the “Law”), by Congressional Decree of February 22, 2005, which was published in the Federal Official Gazette April 28, 2005, there is no longer any distinction between an Exploration Concession and an Exploitation Concession. Consequently, all Concessions are “Mining Concessions” (Exploration and Exploitation), and as a result, all Exploration and Exploitation Concessions have been converted into Mining Concessions, expiring fifty years from the date they were originally granted.
28
Figure 4.2: Property Map of the Palmarejo District

4.2.1 Mining Concession Agreements
Corporación Minera de Palmarejo S.A. de C.V. Agreement
A Lease and Option to Purchase Agreement (the “Agreement”) between Planet Gold and Corporación Minera de Palmarejo, S.A. de C.V. (“CMP”) represented by Mr. Ruben Rodriguez Villegas, for Concessions totaling 642.3262 hectares (Table 4.3) was signed on June 26, 2003. The Concessions correspond to the core of the Palmarejo and Guadalupe projects. The Agreement, which could have been terminated with 30 days notice by Planet Gold, granted Planet Gold an exclusive five-year exploration right over the project in exchange for cash payments, including $20,000 on signing and nine escalating semi-annual payments totaling $385,000. When these obligations were fulfilled (or before if convenient for the company), Planet Gold could acquire a 100% interest in the concessions by making a payment of $115,000 by the end of five years from the effective date of the agreement. Planet Gold exercised the option on April 6, 2005 and all the Concessions were transferred to Planet Gold.
29
Table 4.3: CMP Agreement Concessions
Concession | | Title Number | | Area (has.) | | Expiration Date | |
Caballero Azteca | | 209975 | | 5.0510 | | Aug 30, 2049 | |
Carmelita | | 209976 | | 5.3430 | | Aug 30, 2049 | |
El Risco | | 210163 | | 24.0000 | | Sep 09, 2049 | |
La Aurelia | | 209541 | | 10.0000 | | Aug 02, 2049 | |
La Mexicana | | 212281 | | 142.1410 | | Sep 28, 2050 | |
Lezcura | | 210479 | | 14.5565 | | Oct 07, 2049 | |
Palmarejo | | 164465 | | 52.0855 | | May 08, 2029 | |
San Carlos | | 188817 | | 160.0000 | | Nov 28, 2040 | |
Santo Domingo | | 194678 | | 15.3737 | | May 06, 2042 | |
Unificación Huruapa | | 195487 | | 213.7755 | | Sep 13, 2039 | |
Total | | | | 642.3262 | | | |
Aldo Arturo Aguayo Dozal Agreement
On July 7, 2003, an application for the Trogan Concession was filed in Chihuahua with the Informe Pericial. This application was configured to surround the Palmarejo District area and other properties of interest along major northwest and west-northwest trending structures; the initial application covered about 16km in a northwest-southeast direction and three to five kilometers in a northeast-southwest direction. From the application, the Trogan and Trogan Fracción Mining Concessions (Table 4.1) were granted in the name of Aldo Arturo Aguayo Dozal, a Mexican employee of Planet Gold, on February 19, 2004. On October 15, 2004, Aldo Arturo Aguayo Dozal transferred all rights to the Trogan and Trogan Fracción Mining Concessions to Planet Gold S.A. de C.V. for a nominal sum.
Carmen Breach Valenzuela Agreement
A Lease and Option to Purchase Agreement (the “Agreement”) between Planet Gold and Carmen Breach Russo Viuda de Valenzuela (“Mrs. Breach Valenzuela”), the heir of the late Sr. Francisco Jacobo Valenzuela (“Mr. Valenzuela Breach”), for Concessions totaling 49.0000 hectares (Table 4.4) was signed on October 9, 2003. The Concessions lie in three discrete areas within the broader project region. The Agreement, which could have been terminated with 30 days notice by Planet Gold, granted Planet Gold an exclusive four-year exploration right over the project in exchange for cash payments, including $25,000 on signing and seven escalating semi-annual payments totaling $205,000. When these obligations were fulfilled, Planet Gold could acquire a 100% interest in the Concessions by making a payment of $70,000 by the end of four years from the effective date of the Agreement.
All contractual obligations and cash payments have been completed and the transfer of rights to Coeur Mexicana for Concessions Patria Vieja, Nueva Patria, Maclovia, and San Juan de Dios has been accomplished.
30
Table 4.4: Carmen Breach Valenzuela Agreement Concessions
Concession | | Title Number | | Area (has.) | | Expiration Date | |
Patria Vieja | | 167323 | | 4.0000 | | Nov 2, 2030 | |
Nueva Patria | | 167281 | | 11.0000 | | Oct 29, 2030 | |
Maclovia | | 167282 | | 6.0000 | | Oct 29, 2030 | |
San Juan de Dios | | 167322 | | 23.0000 | (2) | Nov 2, 2030 | |
Carrizo Anexas | | 167284 | | 1.0000 | | Oct 29, 2030 | |
El Carrizo Anexas | | 167283 | | 4.0000 | | Oct 29, 2030 | |
Total | | | | 49.00 | | | |
Mrs. Breach Valenzuela currently is the registered owner of 60% of the El Carrizo Anexas and Carrizo Anexas Concessions; Mrs. Breach Valenzuela needs to complete a transfer of rights to the remaining 40% ownership before Coeur Mexicana can hold an option on 100% of the two Concessions.
Ricardo Rodriguez Lugo and Joaquin Rodriguez Lugo Agreement
A Lease and Option to Purchase Agreement (the “Agreement”) between Planet Gold and Messrs. Ricardo Rodriguez Lugo and Joaquin Rodriguez Lugo for Concessions totaling 100.8701 hectares (Table 4.5) was signed on April 20, 2004. The Agreement, which could have been terminated with 30 days notice by Planet Gold, granted Planet Gold an exclusive four-year exploration right over the Concessions in exchange for cash payments, including $12,800 on signing and seven escalating semi-annual payments totaling $102,800. When these obligations were fulfilled, Planet Gold could acquire a 100% interest in the Concessions by making a payment of $80,000 by the end of 4.5 years from the effective date of the Agreement.
All of the contractual obligations and cash payments have been completed and the La Buena Fe Concession was transferred to Planet Gold, while an administrative mistake by the Dirección General de Minas, concerning the Ampliación La Buena Fe Concession is being corrected, so this Concessions will be valid, in good standing and correctly identified as being owned by Coeur Mexican S.A. de C.V., formerly known as Planet Gold.
Table 4.5: Ricardo Rodriguez Lugo and Joaquin Rodriguez Lugo Agreement Concessions
Concession | | Title Number | | Area (has.) | | Expiration Date | |
La Buena Fe | | 188820 | | 60.0000 | | Nov 28, 2040 | |
Ampliación La Buena Fe | | 209648 | | 40.8701 | | Aug 2, 2049 | |
Total | | | | 100.8701 | | | |
(2) The Title at the General Bureau of Mines (the “Bureau”) erroneously states Mining Concession is 5.2300 Ha. Coeur Mexicana is filing Writ to petition the Bureau, to have the Title accurately reflect the true size of San Juan de Dios Mining Concession, which is 23.0000 Ha.
31
Francisco Yanez Medina Agreement
Under the terms of a Purchase Agreement (the “Agreement”) between Planet Gold and Francisco Yanez Medina, signed on September 14, 2004, Planet Gold purchased the La Moderna Exploration Concession (Table 4.1) for $12,000. The Exploration Concession was scheduled to expire on September 29, 2004, but Planet Gold filed an application to convert it to an Exploitation Concession; the application was granted on September 23, 2005.
Arturo Perea Saenz Agreement
Planet Gold acquired a 100% interest in the Los Tajos Mining Concession (Table 4.1) from Arturo Perea Saenz for $25,000 on April 21, 2005.
Eva Alicia Fontes Manriquez and James Max Patterson Campbell Agreement
On May 5, 2005, Planet Gold signed a Lease and Purchase Option Agreement (the “Agreement”) with Eva Alicia Fontes Manriquez and husband, James Max Patterson Campbell, concerning the Victoria Mining Concession (Table 4.6). Under this Agreement, Planet Gold held a three-year exploration right for escalating semi-annual payments totaling USD$180,000. On or before the conclusion of the three-year period, Planet Gold retained the right to purchase 100% ownership of the Concession for an additional USD$120,000.
All of the contractual obligations and cash payments were completed and the Victoria Concession was transferred to Coeur Mexicana.
Table 4.6: Eva Alicia Fontes Manriquez, Et vir Agreement Concessions
Concession | | Title Number | | Area (has.) | | Expiration Date | |
Victoria | | 210320 | | 76.0883 | | Sep 23 2049 | |
Total | | | | 76.0883 | | | |
Ruben Walterio Rascon Tapia Agreement
Planet Gold signed a Purchase Agreement (the “Agreement”) with Mr. Ruben Walterio Rascon Tapia for the La Estrella Mining Concession on February 17, 2004. The purchase price was $500,000, including a $150,000 payment in May 2006, five $25,000 payments every four months thereafter, and a final payment of $225,000, 24 months after the May 2006 payment.
All of the contractual obligations were fully satisfied and the La Estrella Concession was transferred to Planet Gold.
Maritza Rascon Serrano Agreement
On May 16, 2006, Planet Gold signed a Purchase Agreement (the “Agreement”) with Mrs.
32
Maritza Rascon Serrano for the Virginia Mining Concession. The purchase price was $625,000, including $300,000 upon execution of the Agreement, five payments of $25,000 every 4 months thereafter, and a final payment of $200,000, 24 months after the initial payment.
All of the contractual obligations were fully satisfied and the Virginia Concession was transferred to Planet Gold.
Mr. Francisco Hernandez Rochin Agreement
On December 6, 2005, Planet Gold signed a Transfer Agreement (the “Agreement”) with Mr. Francisco Hernandez Rochin for 50% of the Camila Concession, which comprises 43.7717 ha. This Concession is located outside of any areas of active exploration or operations being conducted by Coeur Mexicana. Mr. Simon Trejo Rascon owns the remaining 50% interest in and to Camila.
Minera Azteca de Oro y Plata S.A. de C.V. Agreement
A Purchase Agreement between Coeur Mexicana and Minera Azteca de Oro y Plata S.A. de C.V. (“Minera Azteca”), for Concessions totaling 94.4844 hectares (Table 4.7) was signed on October 10, 2011. The Concessions constitute the core of the Guerra al Tirano project, which is located at the south central area within the Trogan block. The Agreement transferred 100% of the mining rights in exchange for a cash payment of $1,200,000 on signing, plus a royalty of 2% NSR. Coeur Mexicana may acquire, at any time, up to 1.5% of the NSR, at a fixed price of $750,000.
The contractual obligations and cash payment were completed and the transfer of rights to Coeur Mexicana for Concessions Unificación Guerra al Tirano, Reyna de Oro, and Tres de Mayo was accomplished.
Table 4.7: Minera Azteca de Oro y Plata Agreement Concessions
Name | | Title Number | | Area (has.) | | Expiration date | |
Unificación Guerra al Tirano | | 170588 | | 27.4471 | | Jun 2, 2032 | |
Reyna de Oro | | 198554 | | 27.1791 | | Nov 25, 2043 | |
Tres de Mayo | | 187906 | | 39.8582 | | Nov 22, 2040 | |
Total | | | | 94.4844 | | | |
4.2.2 Ejido Agreements
Exploration Ejido Agreements
In addition to the Lease and Option to Purchase Agreements described above, Coeur Mexicana obtained initial Exploration Agreements (the “Agreement(s)”) that allow surface disturbance for
33
the purpose of conducting exploration activities from four ejidos, or surface-owner councils, that covered the Coeur Mexicana land holdings. The project area is under the jurisdiction of each of these four ejidos, which include the Palmarejo, Guazapares, Guerra al Tirano, and Agua Salada ejidos. Agreements with the Palmarejo, Guazapares, and Guerra al Tirano ejidos were effective through November 2009, while the Agua Salada Agreement was effective through September 2010. These Agreements allowed Coeur Mexicana to carry out exploration on the ejido grounds in exchange for paying nominal sums determined by the areas of disturbance associated with the construction of new roads, drill pads, etc. As part of its public relations program with the local inhabitants, Coeur Mexicana also granted certain specific requests by the ejidos above those commitments contained in the Agreements.
Surface Use Ejido Agreements
Subsequent to the Exploration Agreements described above, Coeur Mexicana executed Agreements with the Guazapares, Palmarejo and Agua Salada ejidos covering surface activities involved with the exploration, exploitation, and processing of mineral deposits, the construction of all necessary mining and processing facilities, and the undertaking of mining operations, in return for annual rental payments.
The annual rental payment to the Guazapares ejido is $17,500 and annual rent to the Palmarejo ejido is $25,000. The Agreements were signed on October 16, 2005 and October 30, 2005, respectively, and are effective for 15 years with an option for the company to extend the terms for an additional 15 years. The Palmarejo ejido agreement was modified in 2010 to include additional right-of-way authorizations. As a result, the annual rent was increased to about $45,000. Planet Gold also negotiated a similar agreement with the Agua Salada ejido on November 20, 2005, in return for annual rent of $3,560.
These Agreements are registered with the Registro Agrario Nacional (“Agrarian National Registry”).
Further Exploration Area Ejido Agreements
In October 2008, Planet Gold entered into an agreement with Guazaparez ejido for land use in the Guadalupe/Los Bancos area. An annual rent of $50,000 is paid to the ejido for the use of 372.8 hectares during a renewable 4-year term. In 2009, a contract modification with the Guazapares ejido was finalized assuring Coeur Mexicana the use of 643.7 hectares for the planned mining activities at Guadalupe as outlined in this report. This mining agreement has a six-year term, is renewable, and raised the annual rent to $85,000. Coeur Mexicana has also obtained complete control of part of the rented area by paying compensation to some land-holding ejidatarios(3).
On August 16, 2010, Coeur Mexicana signed a 4-year Exploration Agreement with the Guerra al Tirano ejido, covering 69.7 hectares in the La Patria project.
(3) Individual members of an ejido.
34
In October 2011, Coeur Mexicana acquired the Guerra al Tirano Project from Minera Azteca. Included, was an agreement Minera Azteca executed with the Guerra al Tirano ejido, for the use of the surface land. This agreement was originally executed in February 2007, and provides for an annual rent payable to the ejido during the exploration phase, for the use of 94.48 hectares for approximately USD$8,000. After the exploration phase, the annual rent will increase in several stages, up to a maximum of approximately USD$80,000 per year, after the 6th year of production. There is no expiration date.
4.2.3 Royalty Agreement
On January 20, 2009, Coeur Mexicana, S.A. de C.V. (“Coeur Mexicana”) entered into a gold production royalty transaction (the “Royalty Agreement”) with Franco-Nevada Mexico Corporation, S.A. de C.V. (“Franco-Nevada”) under which Franco-Nevada purchased a royalty covering 50% of the life of mine gold to be produced from the Palmarejo Mine. Coeur Mexicana received $75 million in cash plus a warrant to acquire Franco-Nevada Common Shares, which was valued at $3 million at closing of the transaction. The Royalty Agreement provides for a minimum obligation to be paid monthly on a total of 400,000 troy ounces of gold, or 4,167 troy ounces per month, over an initial eight year period. Each monthly payment is an amount equal to the greater of 4,167 troy ounces of gold or 50% of actual gold production multiplied by the excess of the monthly average market price of gold above $400 per troy ounces (which $400 floor is subject to a 1% inflation compounding adjustment beginning on January 21, 2013). After payments have been made on a total of 400,000 troy ounces of gold, the royalty obligation is payable in the amount of 50% of actual gold production per month multiplied by the excess of the monthly average market price of gold above $400 per troy ounce, adjusted as described above. Payments under the Royalty Agreement are to be made in cash or gold bullion.
Please refer to Section 20 for discussion regarding environmental and permitting factors related to the property.
35
SECTION 5 - ACCESSIBILITY, CLIMATE, LOCAL RESOURCES, INFRASTRUCTURE AND PHYSIOGRAPHY
5.1 Accessibility
Access to Palmarejo from the city of Chihuahua, in the state of Chihuahua, Mexico is via paved Highways 16 and 127 to the town of San Rafael. From San Rafael travel is by gravel road to Témoris, and finally to Palmarejo. Approximate total driving time is 7 hours from Chihuahua. Construction of 40 km of additional paved road is currently being carried out by the Chihuahua State Government between San Rafael and Bahuichivo, as part of the Chihuahua-Sinaloa road project. The Chihuahua-Pacifico rail service operates between Chihuahua and Los Mochis (Topolobampo seaport) on the southwest coast of Mexico. Two passenger trains and one freight train operate daily between these cities. Estación Témoris rail station is located 10 km south from the town of Témoris. Access from Témoris to Palmarejo is along 35 km of company-maintained gravel road, an extension of Highway 127, that continues on through to Chinipas (Gustin and Prenn, 2007).
5.2 Climate
The climate of the area is moderate. Average maximum temperature is about 34°C, with an average minimum temperature of about 5°C. Rainfall occurs mainly in the summer months, with an average annual precipitation of about 800 mm (Gustin and Prenn, 2007). The climate poses no significant impediments to current work in the area and all anticipated exploration and operations activities can be conducted year round.
5.3 Local Resources and Infrastructure
The Palmarejo area has moderately well developed infrastructure and a local work force familiar with mining operations. Approximately four to five thousand inhabitants reside within a one-hour drive, on all-weather compacted dirt roads, of the project (Skeet, 2004). Chinipas and Temoris are the two nearest towns, both with an estimated population of approximately 1,600 inhabitants (according to 2005 census data). The small village of Palmarejo lies immediately northwest of the Palmarejo District area and, according to the 2010 census, has a population of about 430 (census data from www.inegi.org.mx, viewed January, 2011). Many of the workers are employees at the mine and live in these three, nearby communities.
The Chihuahua-Pacifico railway connects Chihuahua with Los Mochis, located on Mexico’s western coast in the state of Sinaloa. Passenger and freight trains pass along this railway daily. The Estación Témoris rail station is about 45 km from Palmarejo by gravel road. Light aircraft airstrips are located in both Témoris and Chinipas, and in 2011 an airstrip was built in Palmarejo to service the mine.
The Palmarejo Mine site was serviced with a 33,000-volt power line supplied by the Comisión Federal Electricidad (CFE), the Mexican federal power authority. An additional 115-kV high voltage line was constructed from the Divisadero substation to the Palmarejo Mine site during
36
2009, and the Palmarejo mine, plant and all other electrical load is now connected to this grid. The same 115-kV high voltage line is within 7 kilometers of the Guadalupe project and excess capacity exists on this line to supply the estimated 2.5 MW of power needed for Guadalupe.
The state road between San Rafael and Palmarejo was initially upgraded in late 2007 for the mobilization of equipment and construction materials. This is an on-going activity as Coeur has permanent maintenance crews working on the road. A joint project between the Chihuahua and Sinaloa State Governments to build a paved road between San Rafael (Chihuahua) and Choix (Sinaloa) is currently underway.
Water for the Palmarejo mine is obtained from a variety of sources. As of 2011 the primary water for milling is recycled from the tailings dam and from the Fresh Water Diversion Dam (FWDD). When needed, additional make-up water, is either pumped from the Chinipas river infiltration gallery, from a shallow water well located in Agua Salada, or from the FWDD and piped to site via a 17 km pipeline. Water for domestic use is also obtained from the FWDD and hauled to the camps by truck load (10,000 L tanks on flatbed trucks) Water from the FWDD is also pumped to the underground mine for drilling and dust suppression, or to the plant for make-up water.
Fresh water for the Guadalupe Mine is planned to come from a combination of sources which includes surface water in nearby arroyos and the FWDD. Water will also be collected in sumps constructed in the underground mines and clarified for recycling in the underground system.
The infrastructure for the Palmarejo mine is complete and the mine is operating and processing ore 24 hours per day 7 days per week. The Guadalupe project will be run as a satellite operation of the Palmarejo mine and much of the existing infrastructure at Palmarejo will support the Guadalupe mine and material processing.
The first phase of the Palmarejo Final Tailings Dam (FTD) was completed in 2010 to the 790 meter elevation and started accepting tailings since the fourth quarter of 2010. The second phase of the Final Tailings Dam was completed in August of 2011 to the 800 meter elevation. Phase three, build-up to 810 meters was completed in 2012. Currently, the engineering department is working on the fourth phase that will go to the 825 meter elevation and is expected to be completed by July of 2014. The FTD crest will be continued to be built up over a three year period to the final design crest elevation 825 meters above sea level in 2014. The construction of the Environmental Control Dam (ECD) which is directly below the FTD and the construction of the FWDD were completed in 2009 and are currently in use.
5.4 Physiography and Vegetation
The Palmarejo District is located on the western flank of the Sierra Madre Occidental, a mountain range that comprises the central spine of northern Mexico. The Sierra Madre Occidental trends north-northwest and is composed of a relatively flat-lying sequence of Tertiary volcanic rocks that forms a volcanic plateau. This volcanic plateau is deeply incised in the Palmarejo-Trogan project area, locally forming steep-walled canyons. The Sierra Madre
37
Occidental gives way in the west to an extensional terrain that represents the southward continuation of the Basin and Range Province of the western United States, and then to the coastal plain of western Mexico. The property lies at the boundary of the volcanic plateau and Mexican Basin and Range Province (Gustin and Prenn, 2007).
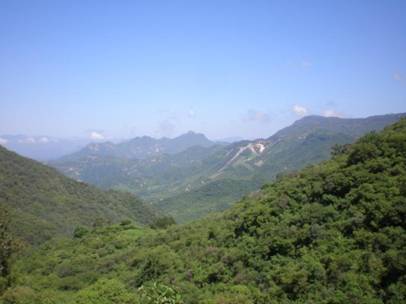
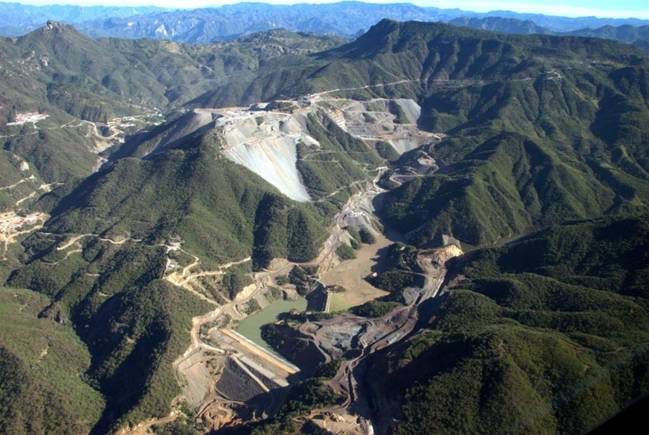
The elevation of the current Palmarejo mining area is about 1,150m above sea level, and the area is hilly to mountainous (Figure 5.1), with densely vegetated, steep-sided slopes with local stands of cacti. Conifers occur at high elevations, while oak trees, cacti, and thorny shrubs dominate the vegetation at low levels. Local ranchers and farmers graze cattle and grow corn and other vegetables on small-scale plots.
Figure 5.1: Overview of the Palmarejo Area
(Looking North-Northwest - October, 2010)
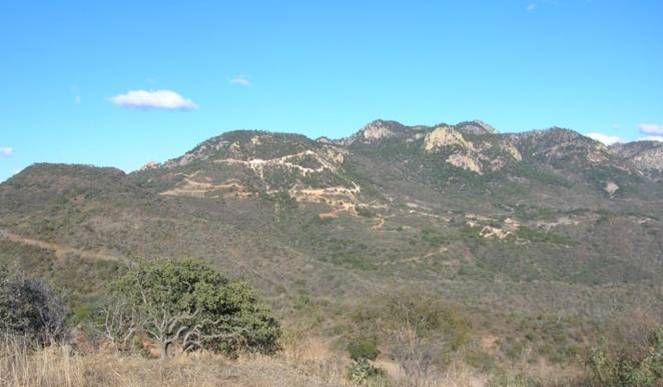
The elevation of the Guadalupe development project is about 1,300m above sea level. The area is hilly to mountainous (Figure 5.2), with densely vegetated, steep-sided slopes with local stands of cacti. Conifers occur at high elevations, while oak trees, cacti, and thorny shrubs dominate the vegetation at low levels. Local ranchers and farmers graze cattle and grow corn and other vegetables on small-scale plots.
38
Figure 5.2: Overview of the Guadalupe Area
(Looking North)
Surface rights controlled by Coeur Mexicana are sufficient to support current and anticipated mining, ore processing and exploration activities in the Palmarejo property. Adequate power, water and personnel exist for all current and planned activities.
39
SECTION 6 - HISTORY
6.1 Exploration and Mining History
The Palmarejo District area lies within the Témoris Mining District. Silver and gold production from the district, though poorly documented, has a long, intermittent history dating from Spanish colonial exploitation in the 1620’s. Although local miners claim that mines such as Todos Santos, La Patria, Carmelite, and Guadalupe have been worked for over 100 years, there are no known detailed records of their past production, and they are now abandoned. Many small adits and superficial workings along the district’s two main mineralized structural trends, the Virginia and Guadalupe trends, attest to past mining activity.
Spaniards may have mined high-grade near-surface ores at Palmarejo in the 1600s, although written reports state that the deposit was discovered in 1818. Small-scale production is reported intermittently through 1881, when a stamp mill was constructed at the mine site. The mine was purchased by the British company Palmarejo Mining Co. in 1886; the company was later renamed Palmarejo and Mexican GoldFields, Ltd. (“PMG”). From 1890 to 1892, PMG constructed a mill located two miles east of Chinipas, an aqueduct for power, and a railroad from the mine site to the mill. PMG operated the Palmarejo mine through 1910.
There are no production records for the early period of mining at Palmarejo prior to 1909. McCarthy, a mining engineer hired by PMG to examine the mine in some detail and evaluate its future prospects, provides an “approximate estimate of the ore that has been taken out and milled in the past history of the mine” (McCarthy, 1909). He further notes that, “[t]his necessarily must be but an approximation owing to the want of proper records and plans, but which I believe to be correct within reasonable limits.” McCarthy estimated the cumulative strike length of the old stopes and multiplied it by average dip lengths and widths of the stopes at La Prieta and La Blanca. These crude calculations resulted in an estimate of 562,000 short tons mined from the La Prieta vein and 175,000 short tons from the La Blanca vein, the two, main precious metal mineralization-controlling geologic structures, up to 1909 (McCarthy, 1909).
Following recommendations outlined by McCarthy (1909), production from Palmarejo was halted, extensive developmental work was completed to ready the mine for renewed production, and a new mill was emplaced. PMG never resumed production due to the onset of the Mexican Revolution. The exact tonnage removed from Palmarejo as part of the development recommended by McCarthy is not known. McCarthy recommended 4,444m of development work, which is reported to have been completed. Assuming average dimensions of this development of 2m x 2m, which is consistent with information supplied by Jorge Cordoba (General Director of Operations at Palmarejo for Minas Huruapa, S.A. de C.V.; pers. comm. to Stuart Mathews, Coeur Mexicana General Manager and Vice President, 2007), McCarthy’s recommendations would entail mining a total of about 46,000 tonnes. While this tonnage was mined for developmental reasons, essentially all of it is within modeled mineralization.
Production at Palmarejo was resumed by Minas Huruapa, S.A. de C.V. (Huruapa) during the period from 1979 to 1992. Huruapa mined ore previously developed according to McCarthy’s
40
recommendations. Records newly provided by Jorge Cordoba, General Director of Operations for Huruapa at Palmarejo, indicate that Huruapa mined 168,352 tonnes of ore grading 297 g Ag/t and 1.37 g Au/t (Table 6.1). A three-dimensional void model to account for historic mining was constructed by Coeur and its consultants in 2007 and 2008, and the resultant tonnes and grade were subtracted from the Palmarejo deposit resources and reserves reported herein (see Section 14).
Table 6.1: Minas Huruapa S.A. de C.V. Production at Palmarejo Mine: 1979 to 1992
(provided by Jorge Cordoba, pers. comm. 2007)
| | | | Mined Grade | |
Year | | Tonnes | | g Au/t | | g Ag/t | |
1979 | | 735 | | 0.24 | | 142 | |
1980 | | 7,455 | | 0.79 | | 201 | |
1981 | | 12,383 | | 1.49 | | 275 | |
1982 | | 10,459 | | 1.69 | | 436 | |
1983 | | 11,500 | | 1.59 | | 335 | |
1984 | | 12,562 | | 1.83 | | 345 | |
1985 | | 12,991 | | 1.41 | | 317 | |
1986 | | 12,712 | | 1.50 | | 317 | |
1987 | | 13,708 | | 1.10 | | 260 | |
1988 | | 14,410 | | 1.10 | | 280 | |
1989 | | 12,889 | | 1.00 | | 258 | |
1990 | | 17,782 | | 1.20 | | 289 | |
1991 | | 18,186 | | 1.30 | | 269 | |
1992 | | 10,580 | | 1.50 | | 302 | |
Totals | | 168,352 | | 1.37 | | 297 | |
Historic reports of mining at Guadalupe suggest that approximately 3,700 tonnes of material grading 458 g Ag/t were mined from that area. Three-dimensional models of historic workings at Guadalupe and at La Patria were developed and the resultant tonnes and grade removed from the resources and reserves stated herein (see Section 14).
The La Currita mine, located in the Guadalupe area, produced at a rate of about 100 tons per day from 1985 to 1998. The silver-gold ore from the mine was processed at a 150-tons-per-day flotation mill that also received ore from other area mines (Laurent, 2004); production ceased at La Currita due to low metals prices. According to Laurent (2004), Kalahari Resources undertook exploration drilling at La Currita in 1991, while Silver Standard Resources Inc. completed additional drilling in 1998.
High-grade gold-silver shoots at the Guerra-al-Tirano, La Virginia, and San Juan de Dios prospects were being mined intermittently by local miners until quite recently. These small underground mines did not use modern mining practices, with little grade control or constant production rates (Laurent, 2004). Ore was trucked to a mill near the town of Los Llanos for flotation, with the concentrate sent for refining in Torreon, Coahuila.
Other than the drilling at the La Currita mine mentioned above, the only other drilling known to have been completed within the Palmarejo property prior to that of Planet Gold is referred to by
41
McCarthy (1909). McCarthy refers to five diamond-drill core (“core”) holes drilled from stations in the underground workings at Palmarejo.
6.2 Historic Resource Estimates
Several estimates in respect to mineralization at the Palmarejo mine were completed between 1909 and 1996. There are insufficient details available on the procedures used in these estimates to permit Coeur to determine that any of the estimates meet modern regulatory standards, and none of the estimates include a classification. Accordingly, the resource figures are presented here merely as an item of historical interest with respect to the exploration target and should not be construed as being representative of actual Mineral Reserves or Resources reported herein.
Table 6.2 shows mineral inventory estimates, consisting of mineralized material lying between workings existing at the time, prepared by or for some of the companies who have been involved with the Palmarejo mine from 1909 to 1996. No drilling data are known to have been used for any of these calculations. The use of the term “reserve” in Table 6.2 is not consistent nor necessarily compliant with Canadian National Instrument 43-101. They are included herein as a matter of historical reference only and have no bearing on the Mineral Reserves stated herein.
Table 6.2: Pre-Planet Gold Estimates of “Reserves” for the Palmarejo Mine
(From Beckton, 2004a)
| | | | | | Grade | | Ounces | |
Estimator | | Date | | Tonnes | | g Au/t | | g Ag/t | | Au Oz | | Ag Oz | |
E.T. McCarthy | | 1909 | | 615,000 | | ? | | 559 | | ? | | 11,054,180 | |
W.D. Hole | | 1919 | | 446,142 | | 3.0 | | 407 | | 43,175 | | 5,838,578 | |
Garcia y Cisneros | | 1969 | | 189,000 | | 3.4 | | 482 | | 20,662 | | 2,929,196 | |
E.T. Knight | | 1975 | | 416,000 | | 2.5 | | 428 | | 33,440 | | 5,725,016 | |
San Luis | | 1978 | | 150,014 | | 2.8 | | 356 | | 13,506 | | 1,717,202 | |
Minas Huruapa | | 1990 | | 124,139 | | 2.4 | | 294 | | 9,574 | | 1,176,898 | |
San Luis | | 1996 | | 120,407 | | 1.6 | | 231 | | 6,194 | | 894,341 | |
6.2.1 NI 43-101 Compliant Mineral Resource Estimates
NI 43-101-compliant resources for the Palmarejo Project, using data from 106 reverse circulation (“RC”), 11 core holes, and underground channel samples, were reported in the 2004 Palmarejo technical report (Gustin, 2004). The resource estimate was completed by MDA for Bonita Capital in December 2004 (Gustin, M, 2004) (Table 6.3).
Table 6.3: Palmarejo 2004 Silver and Gold Resources
Classification | | Tonnes | | Au g/t | | Ag g/t | | Au Ounces | | Ag Ounces | |
Inferred | | 20,900,000 | | 1.75 | | 190.6 | | 1,176,000 | | 128,300,000 | |
Based on a cutoff grade of 1.0 g/t AuEq. AuEq=Au+Ag/65 based on US$375/oz Au and US$5.77/oz Ag
42
The Palmarejo resource estimate was updated in October, 2005 using a database comprised of 291 RC holes, 21 core holes, and 40 core continuations of RC holes (Gustin, 2005; Table 6.4).
Table 6.4: Palmarejo 2005 Silver and Gold Resources
Measured Resources
Au-equiv. Cutoff(1) | | tonnes | | g Au/tonne | | oz Au | | g Ag/tonne | | oz Ag | |
1.0 | | 4,400,000 | | 1.63 | | 230,000 | | 218 | | 30,840,000 | |
1.5 | | 3,500,000 | | 1.98 | | 221,000 | | 259 | | 29,070,000 | |
2.0 | | 2,800,000 | | 2.35 | | 211,000 | | 302 | | 27,230,000 | |
2.5 | | 2,300,000 | | 2.73 | | 202,000 | | 345 | | 25,500,000 | |
3.0 | | 1,900,000 | | 3.12 | | 192,000 | | 388 | | 23,930,000 | |
3.5 | | 1,700,000 | | 3.47 | | 185,000 | | 426 | | 22,670,000 | |
Indicated Resources
Au-equiv. Cutoff(1) | | tonnes | | g Au/tonne | | oz Au | | g Ag/tonne | | oz Ag | |
1.0 | | 5,400,000 | | 1.52 | | 265,000 | | 225 | | 39,310,000 | |
1.5 | | 4,200,000 | | 1.89 | | 256,000 | | 272 | | 36,740,000 | |
2.0 | | 3,300,000 | | 2.33 | | 245,000 | | 323 | | 34,050,000 | |
2.5 | | 2,600,000 | | 2.79 | | 234,000 | | 378 | | 31,680,000 | |
3.0 | | 2,100,000 | | 3.27 | | 223,000 | | 433 | | 29,620,000 | |
3.5 | | 1,800,000 | | 3.68 | | 215,000 | | 482 | | 28,070,000 | |
Inferred Resources
Au-equiv. Cutoff(1) | | tonnes | | g Au/tonne | | oz Au | | g Ag/tonne | | oz Ag | |
1.0 | | 10,600,000 | | 1.40 | | 477,000 | | 196 | | 66,470,000 | |
1.5 | | 8,100,000 | | 1.75 | | 454,000 | | 237 | | 61,540,000 | |
2.0 | | 6,200,000 | | 2.18 | | 431,000 | | 283 | | 56,090,000 | |
2.5 | | 4,800,000 | | 2.64 | | 409,000 | | 331 | | 51,300,000 | |
3.0 | | 3,800,000 | | 3.20 | | 388,000 | | 385 | | 46,640,000 | |
3.5 | | 3,100,000 | | 3.77 | | 370,000 | | 438 | | 42,970,000 | |
(1) Au-equiv. = Au grade + Ag grade/65 and is reported as g/t based on a gold price of US$375 per ounce and a silver price of US$5.77 per ounce; no recovery factor applied.
43
The Palmarejo resources were updated again in May, 2006 using 527 RC holes, 117 core holes, and 88 core continuations of RC holes, for a total of over 126,000m (Gustin, 2006; Table 6.5).
Table 6.5: Palmarejo 2006 Silver and Gold Resources
MEASURED RESOURCES
Au-equiv./t Cutoff(1) | | tonnes | | g Au/tonne | | oz Au | | g Ag/tonne | | oz Ag | |
0.8 | | 5,400,000 | | 2.22 | | 384,000 | | 200 | | 34,600,000 | |
1.0 | | 4,900,000 | | 2.40 | | 379,000 | | 216 | | 34,110,000 | |
1.5 | | 3,900,000 | | 2.91 | | 365,000 | | 260 | | 32,690,000 | |
2.0 | | 3,300,000 | | 3.37 | | 353,000 | | 299 | | 31,380,000 | |
2.5 | | 2,800,000 | | 3.76 | | 343,000 | | 332 | | 30,300,000 | |
3.0 | | 2,500,000 | | 4.12 | | 333,000 | | 362 | | 29,260,000 | |
3.5 | | 2,300,000 | | 4.46 | | 325,000 | | 388 | | 28,300,000 | |
INDICATED RESOURCES
Au-equiv./t Cutoff(1) | | tonnes | | g Au/tonne | | oz Au | | g Ag/tonne | | oz Ag | |
0.8 | | 9,100,000 | | 2.00 | | 587,000 | | 186 | | 54,660,000 | |
1.0 | | 8,200,000 | | 2.19 | | 577,000 | | 204 | | 53,750,000 | |
1.5 | | 6,400,000 | | 2.69 | | 550,000 | | 250 | | 51,270,000 | |
2.0 | | 5,300,000 | | 3.12 | | 520,000 | | 290 | | 49,140,000 | |
2.5 | | 4,500,000 | | 3.51 | | 508,000 | | 326 | | 47,200,000 | |
3.0 | | 3,900,000 | | 3.88 | | 491,000 | | 359 | | 45,390,000 | |
3.5 | | 3,500,000 | | 4.24 | | 475,000 | | 390 | | 43,690,000 | |
INFERRED RESOURCES
Au-equiv./t Cutoff(1) | | tonnes | | g Au/tonne | | oz Au | | g Ag/tonne | | oz Ag | |
0.8 | | 4,000,000 | | 1.31 | | 169,000 | | 138 | | 17,930,000 | |
1.0 | | 3,400,000 | | 1.50 | | 162,000 | | 160 | | 17,290,000 | |
1.5 | | 2,300,000 | | 1.98 | | 147,000 | | 213 | | 15,850,000 | |
2.0 | | 1,800,000 | | 2.41 | | 137,000 | | 259 | | 14,760,000 | |
2.5 | | 1,400,000 | | 2.80 | | 129,000 | | 301 | | 13,870,000 | |
3.0 | | 1,200,000 | | 3.19 | | 122,000 | | 342 | | 13,080,000 | |
3.5 | | 1,000,000 | | 3.57 | | 116,000 | | 380 | | 12,390,000 | |
(1) Au-equiv. = Au grade + (Ag grade / 55) and is reported in g/t metric units. Gold-equivalent grades are calculated using a gold to silver ratio of 1:55 based on a review of historic gold and silver price ratios, as well as projected metallurgical recoveries.
44
The Palmarejo resources were updated again in September, 2007 using 527 RC holes, 205 core holes, and 88 core continuations of RC holes, for a total of over 126,372m (Gustin and Prenn, 2007; Table 6.6).
Table 6.6: Palmarejo 2007 Silver and Gold Resources; September 2007
PALMAREJO MEASURED RESOURCES
Au-equiv./t Cutoff(1) | | tonnes | | g Ag/tonne | | oz Ag | | g Au/tonne | | oz Au | |
0.8 | | 5,100,000 | | 197 | | 32,520,000 | | 2.22 | | 367,000 | |
1.0 | | 4,700,000 | | 213 | | 32,040,000 | | 2.41 | | 363,000 | |
1.5 | | 3,700,000 | | 257 | | 30,660,000 | | 2.93 | | 349,000 | |
2.0 | | 3,100,000 | | 297 | | 29,380,000 | | 3.41 | | 337,000 | |
2.5 | | 2,700,000 | | 330 | | 28,340,000 | | 3.81 | | 327,000 | |
3.0 | | 2,400,000 | | 360 | | 27,330,000 | | 4.19 | | 318,000 | |
3.5 | | 2,100,000 | | 387 | | 26,440,000 | | 4.53 | | 310,000 | |
PALMAREJO INDICATED RESOURCES
Au-equiv./t Cutoff(1) | | tonnes | | g Ag/tonne | | oz Ag | | g Au/tonne | | oz Au | |
0.8 | | 8,800,000 | | 184 | | 52,390,000 | | 2.01 | | 571,000 | |
1.0 | | 7,900,000 | | 202 | | 51,500,000 | | 2.20 | | 560,000 | |
1.5 | | 6,100,000 | | 249 | | 49,070,000 | | 2.71 | | 534,000 | |
2.0 | | 5,100,000 | | 288 | | 46,990,000 | | 3.14 | | 513,000 | |
2.5 | | 4,300,000 | | 324 | | 45,120,000 | | 3.55 | | 493,000 | |
3.0 | | 3,800,000 | | 357 | | 43,380,000 | | 3.93 | | 476,000 | |
3.5 | | 3,300,000 | | 389 | | 41,750,000 | | 4.29 | | 461,000 | |
PALMAREJO INFERRED RESOURCES
Au-equiv./t Cutoff(1) | | tonnes | | g Ag/tonne | | oz Ag | | g Au/tonne | | oz Au | |
0.8 | | 4,500,000 | | 153 | | 22,290,000 | | 1.39 | | 203,000 | |
1.0 | | 3,800,000 | | 175 | | 21,610,000 | | 1.58 | | 195,000 | |
1.5 | | 2,700,000 | | 228 | | 20,080,000 | | 2.04 | | 180,000 | |
2.0 | | 2,200,000 | | 273 | | 18,900,000 | | 2.44 | | 169,000 | |
2.5 | | 1,800,000 | | 314 | | 17,900,000 | | 2.80 | | 160,000 | |
3.0 | | 1,500,000 | | 351 | | 17,020,000 | | 3.14 | | 152,000 | |
3.5 | | 1,300,000 | | 388 | | 16,200,000 | | 3.48 | | 146,000 | |
(1) Au-equiv./t= Au grade + (Ag grade / 55) and are reported in metric units g/t. Gold-equivalent grades are calculated using a gold to silver ratio of 1:55 based on a review of historic gold and silver price ratios, as well as projected metallurgical recoveries (see Section 16).
(2) Mineral Resources that are not Mineral Reserves have not demonstrated economic viability.
The first Mineral Resources for Guadalupe were also reported in October 2006 (Gustin, 2006; Table 6.7) using the data from 17,487m of drilling, including 44 RC holes (7,954m) and 47 core holes (9,533m; includes 6 core continuations of RC holes).
45
Table 6.7: Guadalupe Inferred Resources; October 2006
Au-equiv. (1) Cutoffs | | | | | | | | | | | |
Above 1300m | | Below 1300m | | tonnes | | g Au/tonne | | oz Au | | g Ag/tonne | | oz Ag | |
0.8 | | 3.0 | | 5,700,000 | | 0.83 | | 155,000 | | 106 | | 19,570,000 | |
1.0 | | 3.0 | | 5,000,000 | | 0.94 | | 150,000 | | 116 | | 18,640,000 | |
1.5 | | 3.0 | | 3,500,000 | | 1.21 | | 138,000 | | 142 | | 16,220,000 | |
2.0 | | 3.0 | | 2,700,000 | | 1.46 | | 128,000 | | 162 | | 14,270,000 | |
2.5 | | 3.0 | | 2,300,000 | | 1.67 | | 122,000 | | 175 | | 12,780,000 | |
3.0 | | 3.0 | | 1,900,000 | | 1.85 | | 115,000 | | 186 | | 11,580,000 | |
3.5 | | 3.5 | | 1,400,000 | | 2.18 | | 98,000 | | 210 | | 9,460,000 | |
4.0 | | 4.0 | | 1,100,000 | | 2.48 | | 86,000 | | 230 | | 8,010,000 | |
5.0 | | 5.0 | | 720,000 | | 2.96 | | 69,000 | | 266 | | 6,170,000 | |
7.0 | | 7.0 | | 340,000 | | 3.77 | | 41,000 | | 336 | | 3,680,000 | |
10.0 | | 10.0 | | 130,000 | | 5.13 | | 21,000 | | 416 | | 1,720,000 | |
(1) Au-equiv./t = Au grade + (Ag grade / 55) and are reported in metric units g/t. Gold —equivalent grades are calculated using a gold to silver ratio of 1:55 based on a review of historic gold and silver price ratios, as well as projected Palmarejo metallurgical recoveries (see section 16).
Guadalupe Resources were updated in September 2007 (Gustin and Prenn, 2007; Table 6.8a and b) using the data from 17,487m of drilling, including 62 RC holes (7,954m) and 75 core holes (9,533m; includes 6 core continuations of RC holes).
Table 6.7a: Guadalupe Indicated Resources; September 2007
Au-Equiv/Tonne Cutoff | | | | | | | | | | | |
0 to 150m Depth | | >150m Depth | | Tonnes | | g Ag/Tonne | | oz Ag | | g Au/Tonne | | oz Au | |
0.8 | | 2.5 | | 710,000 | | 166 | | 3,790,000 | | 2.16 | | 49,000 | |
1.5 | | 2.5 | | 610,000 | | 184 | | 3,610,000 | | 2.49 | | 49,000 | |
2.0 | | 2.5 | | 570,000 | | 192 | | 3,490,000 | | 2.66 | | 48,000 | |
2.5 | | 2.5 | | 540,000 | | 196 | | 3,400,000 | | 2.78 | | 48,000 | |
3.0 | | 3.0 | | 440,000 | | 217 | | 3,090,000 | | 3.19 | | 45,000 | |
5.0 | | 5.0 | | 220,000 | | 303 | | 2,090,000 | | 5.13 | | 35,000 | |
10.0 | | 10.0 | | 64,000 | | 481 | | 995,000 | | 10.65 | | 22,000 | |
(1) Au-equiv./t = Au grade + (Ag grade / 55) and are reported in metric units g/t. Gold —equivalent grades are calculated using a gold to silver ratio of 1:55 based on a review of historic gold and silver price ratios, as well as projected Palmarejo metallurgical recoveries (see section 16).
46
Table 6.7b: Guadalupe Inferred Resources; September 2007
Au-equiv./t Cutoff(1) | | | | | | | | | | | |
0 to 150m Depth | | >150m Depth | | tonnes | | g Ag/tonne | | oz Ag | | g Au/tonne | | oz Au | |
0.8 | | 2.5 | | 8,000,000 | | 136 | | 35,120,000 | | 1.34 | | 345,000 | |
1.5 | | 2.5 | | 6,500,000 | | 157 | | 32,530,000 | | 1.63 | | 337,000 | |
2.0 | | 2.5 | | 5,900,000 | | 164 | | 31,180,000 | | 1.75 | | 332,000 | |
2.5 | | 2.5 | | 5,600,000 | | 168 | | 30,040,000 | | 1.83 | | 327,000 | |
3.0 | | 3.0 | | 4,300,000 | | 186 | | 25,970,000 | | 2.11 | | 294,000 | |
5.0 | | 5.0 | | 1,600,000 | | 264 | | 13,400,000 | | 3.64 | | 185,000 | |
10.0 | | 10.0 | | 330,000 | | 414 | | 4,350,000 | | 7.44 | | 78,000 | |
(1) Au-equiv./t = Au grade + (Ag grade / 55) and are reported in metric units g/t. Gold —equivalent grades are calculated using a gold to silver ratio of 1:55 based on a review of historic gold and silver price ratios, as well as projected Palmarejo metallurgical recoveries (see section 16).
The first Mineral Resources for La Patria were reported in September, 2007 (Table 6.8). Gold and silver mineralization at La Patria was modeled by MDA (Gustin, M, 2007) in September 2007 using data generated by Planet Gold through late September 2006, including geologic mapping and RC and core drilling results. The resource calculation was done from 51,778 meters of drilling, including 81 RC holes (18,120m) and 100 core holes (33,658m).
Table 6.8: La Patria Inferred Resources: September 2007
Au-
equiv/tonne
Cutoff | | tonnes | | g Ag/tonne | | oz Ag | | g Au/tonne | | oz Au | |
0.8 | | 3,600,000 | | 35 | | 4,030,000 | | 1.49 | | 171,000 | |
1.0 | | 2,600,000 | | 43 | | 3,600,000 | | 1.81 | | 152,000 | |
1.5 | | 1,700,000 | | 57 | | 3,050,000 | | 2.34 | | 126,000 | |
2.0 | | 1,200,000 | | 67 | | 2,660,000 | | 2.73 | | 109,000 | |
2.5 | | 830,000 | | 82 | | 2,190,000 | | 3.29 | | 88,000 | |
3.0 | | 530,000 | | 104 | | 1,770,000 | | 4.05 | | 69,000 | |
5.0 | | 260,000 | | 149 | | 1,250,000 | | 5.54 | | 46,000 | |
10.0 | | 71,000 | | 242 | | 556,000 | | 8.06 | | 19,000 | |
Au-equiv./t = Au grade + (Ag grade / 55) and are reported in metric units g/t. Gold —equivalent grades are calculated using a gold to silver ratio of 1:55 based on a review of historic gold and silver price ratios, as well as 2007 projected Palmarejo metallurgical recoveries.
Following the December 2007 acquisition by Coeur d’Alene Mines Corporation, Palmarejo District Mineral Reserve and Resource estimates, including the Palmarejo, Guadalupe, and La Patria deposits, have been periodically updated and are listed in the following tables. Mineral resources, unless stated otherwise, are exclusive of mineral reserves and have not demonstrated economic viability.
47
Table 6.9: Total Palmarejo District Mineral Resources, January 1, 2009
Inclusive of Mineral Reserves
| | | | Average Grade (g/t) | | Contained Ounces | |
Category | | Tonnes | | Au | | Ag | | Au | | Ag | |
Measured | | 9,887,000 | | 2.02 | | 167.9 | | 642,000 | | 53,386,000 | |
Indicated | | 12,952,000 | | 1.89 | | 152.9 | | 789,000 | | 63,652,000 | |
Meas. and Ind. | | 22,839,000 | | 1.95 | | 159.4 | | 1,431,000 | | 117,038,000 | |
Inferred | | 21,590,000 | | 1.27 | | 84.3 | | 880,000 | | 58,508,000 | |
Cut-off grades are variable for each deposit.
Metals prices used were $750/oz Au and $13.25/oz Ag for Palmarejo and Guadalupe deposits.
Metals prices used were $600/oz Au and $11/oz Ag for La Patria deposit (Inferred Resource only).
Measured Resources determination parameter is material demonstrating grade continuity that is less than or equal to 15 meters distance from the nearest hole, with a minimum of 5 samples, no more than 2 of which originate from the same diamond drill hole.
The corresponding estimation parameter for Indicated Resource estimation is less than or equal to 35 meters.
Table 6.10: Total Palmarejo District Mineral Reserves, January 1, 2009
| | | | Average Grade (g/t) | | Contained Ounces | |
Category | | Tonnes | | Au | | Ag | | Au | | Ag | |
Proven | | 6,205,000 | | 2.03 | | 174.7 | | 406,000 | | 34,844,000 | |
Probable | | 4,858,000 | | 2.24 | | 184.0 | | 350,000 | | 28,732,000 | |
Total | | 11,063,000 | | 2.13 | | 178.7 | | 756,000 | | 63,576,000 | |
For Palmarejo deposit Reserves:
Cut-off grade of 0.91 g/t Au Equivalent for open pit minable Reserves [Au Eq = Au g/t + (Ag g/t/59)]
Cut-off grade of 2.34 g/t Au Equivalent for underground minable Reserves [Au Eq = Au g/t + (Ag g/t/59)]
Metal prices used were $750 US per Au ounce, $13.25 US per Ag ounce
Underground Mining Dilution of 15% at 0.13 g/t Au and 14.4 g/t Ag grade, 100% recovery
Open pit dilution of 10% at 0.13 g/t Au and 14.4 g/t Ag grade, 95% recovery
For Guadalupe deposit Reserves:
Cut-off grade for Open Pit reserve was 1.20 g/t Au Equivalent [(AuEq = Au g/t + (Ag g/t.59)]
Table 6.11: Remaining Palmarejo District Mineral Resources, January 1, 2009
Exclusive of Mineral Reserves
| | | | Average Grade (g/t) | | Contained Ounces | |
Category | | Tonnes | | Au | | Ag | | Au | | Ag | |
Measured | | 4,886 | | 1.51 | | 117.9 | | 237,000 | | 18,515,000 | |
Indicated | | 9,060 | | 1.51 | | 119.5 | | 439,000 | | 34,808,000 | |
Meas. and Ind. | | 13,946 | | 1.51 | | 118.9 | | 676,000 | | 53,323,000 | |
Inferred | | 21,590 | | 1.27 | | 84.3 | | 880,000 | | 58,508,000 | |
Mineral Resources are in addition to Mineral Reserves and have not demonstrated economic viability
Cut-off grades are variable for each deposit.
Metals prices used were $750/oz Au and $13.25/oz Ag for Palmarejo and Guadalupe deposits.
Metals prices used were $600/oz Au and $11/oz Ag for La Patria deposit (Inferred Resource only).
48
Table 6.12: Total Palmarejo District Mineral Resources, January 1, 2010
Inclusive of Mineral Reserves
| | | | Average Grade (g/t) | | Contained Ounces | |
Category | | Tonnes | | Au | | Ag | | Au | | Ag | |
Measured | | 7,356,300 | | 2.18 | | 182.6 | | 514,600 | | 43,181,300 | |
Indicated | | 12,310,600 | | 2.04 | | 163.3 | | 808,100 | | 64,619,200 | |
Meas. and Ind. | | 19,666,900 | | 2.09 | | 170.5 | | 1,322,700 | | 107,800,600 | |
Inferred | | 13,450,000 | | 1.57 | | 95.0 | | 678,400 | | 41,071,900 | |
The Total Mineral Resource includes Proven and Probable Reserves.
Cut-off grade for Palmarejo deposit: open pit 0.76 g/tAuEq, underground 2.02 g/tAuEq
Cut-off grade for Guadalupe deposit: open pit 0.95 g/t AuEq, underground 1.93 g/tAuEq
Cut-off grade for La Patria deposit 0.80 g/tAuEq
Table 6.13: Total Palmarejo District Mineral Reserves, January 1, 2010
| | | | Average Grade (g/t) | | Contained Ounces | |
Category | | Tonnes | | Au | | Ag | | Au | | Ag | |
Proven | | 6,601,500 | | 2.08 | | 174.9 | | 441,600 | | 37,120,900 | |
Probable | | 9,637,200 | | 2.13 | | 172.3 | | 660,100 | | 53,399,600 | |
Total | | 16,238,700 | | 2.11 | | 173.4 | | 1,101,700 | | 90,520,500 | |
Metal prices used were $850 US per Au ounce, $14.50 US per Ag ounce
Includes Mineral Reserves for Palmarejo and Guadalupe deposits.
Table 6.14: Remaining Palmarejo District Mineral Resources, January 1, 2010
Exclusive of Mineral Reserves
| | | | Average Grade (g/t) | | Contained Ounces | |
Category | | Tonnes | | Au | | Ag | | Au | | Ag | |
Measured | | 1,110,500 | | 1.44 | | 116.61 | | 51,400 | | 4,163,400 | |
Indicated | | 2,965,800 | | 1.61 | | 120.55 | | 153,500 | | 11,494,500 | |
Total | | 4,076,300 | | 1.56 | | 119.5 | | 204,900 | | 15,657,900 | |
Inferred | | 13,450,000 | | 1.57 | | 95.0 | | 678,400 | | 41,071,900 | |
Metal prices used for Guadalupe and Palmarejo Resources were $1,100 US per Au ounce, $17.00 US per Ag ounce
Metals prices used for the La Patria resource were $600/oz Au and $11/oz Ag
Cut-off grade for Palmarejo deposit: open pit 0.76 g/tAuEq, underground 2.02 g/tAuEq
Cut-off grade for Guadalupe deposit: open pit 0.95 g/t AuEq, underground 1.93 g/tAuEq
Cut-off grade for La Patria deposit 0.80 g/tAuEq
Table 6.15: Total Palmarejo District Mineral Reserves, January 1, 2011
| | | | Average Grade
(g/t) | | Contained Ounces | |
Category | | Tonnes | | Au | | Ag | | Au | | Ag | |
Proven | | 4,217,300 | | 3.22 | | 244 | | 436,600 | | 33,095,700 | |
Probable | | 8,182,100 | | 1.65 | | 147 | | 433,600 | | 38,661,700 | |
Total | | 12,399,400 | | 2.18 | | 180 | | 870,200 | | 71,757,400 | |
Metal prices used were $1,025 US per Au ounce, $16.25 US per Ag ounce
49
Includes Mineral Reserves for Palmarejo and Guadalupe deposits
Table 6.16: Remaining Palmarejo District Mineral Resource, January 1, 2011
Exclusive of Mineral Reserves
| | | | Average Grade
(g/t) | | Contained Ounces | |
Category | | Tonnes | | Au | | Ag | | Au | | Ag | |
Measured | | 1,472,400 | | 1.20 | | 111 | | 56,800 | | 5,244,200 | |
Indicated | | 2,613,000 | | 1.60 | | 136 | | 134,700 | | 11,404,300 | |
Total | | 4,085,400 | | 1.46 | | 127 | | 191,500 | | 16,648,500 | |
Inferred | | 10,703,600 | | 1.82 | | 98 | | 625,300 | | 33,807,800 | |
Mineral Resources are in addition to Reserves and have not demonstrated economic viability
Cut-off grade for Palmarejo deposit: open pit 1.01 g/tAuEq, underground 2.08 g/tAuEq
Cut-off grade for Guadalupe deposit: underground only 1.80 g/tAuEq
Cut-off grade for La Patria deposit 0.80 g/tAuEq
Table 6.17: Total Palmarejo District Mineral Reserves, January 1, 2012
| | | | Average Grade (g/t) | | Contained Ounces | |
Category | | Tonnes | | Au | | Ag | | Au | | Ag | |
Proven | | 4,459,600 | | 2.30 | | 182.0 | | 329,950 | | 26,090,800 | |
Probable | | 6,877,600 | | 1.62 | | 139.0 | | 358,170 | | 30,727,300 | |
Total | | 11,337,200 | | 1.89 | | 155.9 | | 688,120 | | 56,818,100 | |
Metal prices used were $1,220 US per Au ounce, $23.00 US per Ag ounce
Includes Mineral Reserves for Palmarejo and Guadalupe deposits
Table 6.18: Remaining Palmarejo District Mineral Resource, January 1, 2012
Exclusive of Mineral Reserves
| | | | Average Grade (g/t) | | Contained Ounces | |
Category | | Tonnes | | Au | | Ag | | Au | | Ag | |
Measured | | 1,626,500 | | 1.78 | | 145.2 | | 93,300 | | 7,593,900 | |
Indicated | | 2,965,200 | | 1.17 | | 98.6 | | 111,300 | | 9,398,900 | |
Meas. and Ind. | | 4,591,700 | | 1.39 | | 115.1 | | 204,500 | | 16,992,800 | |
Inferred | | 10,581,700 | | 1.80 | | 82.2 | | 611,700 | | 27,928,200 | |
Mineral Resources are in addition to Mineral Reserves and have not demonstrated economic viability
Cut-off grade for Palmarejo deposit: open pit 1.03 g/tAuEq, underground 1.92 g/tAuEq
Cut-off grade for Guadalupe deposit: underground only 1.98 g/tAuEq
Cut-off grade for La Patria deposit 1.12 g/tAuEq
50
6.3 Palmarejo Mine - Coeur Mexicana Production
Open pit mining operations began in 2008 and milling operations and metal recovery commenced in 2009, ramping up to full capacity in 2010. Production from open pit and underground sources since operations commenced in 2008 at Palmarejo is summarized below (Table 6.19). 9
Table 6.19: Coeur Palmarejo Mine Ore Production - Inception to December 31, 2012
Production | | 2012 | | 2011 | | 2010 | | 2009 | | 2008 | |
Ore Tonnes Milled | | 1,962,958 | | 1,563,156 | | 1,665,082 | | 966,629 | | — | |
Ore grade Ag (g/t) | | 157.3 | | 235.5 | | 157.6 | | 147.9 | | — | |
Ore grade Au (g/t) | | 1.78 | | 2.70 | | 2.10 | | 2.00 | | — | |
Recovery Ag (%) | | 82.96 | | 76.4 | | 69.8 | | 66.3 | | — | |
Recovery Au (%) | | 94.41 | | 92.2 | | 91.1 | | 88.2 | | — | |
Silver produced (oz.) | | 8,236,013 | | 9,041,488 | | 5,887,576 | | 3,047,843 | | — | |
Gold produced (oz.) | | 106,038 | | 125,071 | | 102,440 | | 54,740 | | — | |
51
SECTION 7 - GEOLOGIC SETTING AND MINERALIZATION
7.1 Regional Geology
The Palmarejo District lies near the western edge of the Sierra Madre Occidental, a north-northwest-trending volcanic plateau that separates the southward extension of the Basin and Range Physiographic Province of the southwestern United States into two parts; Sedlock et al. (1993) suggested calling these two areas of extension the Eastern and Western Mexican Basin and Range provinces. Palmarejo is near the boundary between the Sierra Madre Occidental and the Western Mexican Basin and Range Province (Figure 7.1).
Figure 7.1: Palmarejo Location at the Boundary between the Western Mexican Basin and Range Province and the Sierra Madre Occidental (Earthscope, 2012)

Basement rocks in the Sierra Madre Occidental are obscured by Cenozoic-aged volcanic flows, tuffs, and related intrusions but are inferred to include Proterozoic basement rocks, overlying Paleozoic shelf and eugeosynclinal sedimentary rocks, possibly scattered Triassic-Jurassic clastic rocks, and Mesozoic intrusions (Sedlock et al., 1993; Salas, 1991). The Palmarejo District area lies southwest of the west-northwest to northwest-trending Mojave-Sonora Megashear, along which an estimated 700 to 800km of left-lateral displacement are thought to have occurred during the Jurassic (Silver and Anderson, 1974 and 1983, and Anderson and Silver, 1979, cited by Sedlock et al., 1993).
Cenozoic magmatic rocks in northern Mexico, including the Sierra Madre Occidental, are generally thought to reflect subduction-related continental arc magmatism that slowly migrated
52
eastward during the early Tertiary and then retreated westward more quickly, reaching the western margin of the continent by the end of the Oligocene (Sedlock et al., 1993). The eastward migration is represented in the Sierra Madre Occidental by the Late Cretaceous-Paleocene Lower Volcanic Series (LVS), or Nacozari Group, of calc-alkaline composition. Over 2,000m of predominantly andesitic volcanic rocks, with some interlayered ash flows and associated intrusions, comprise the LVS. Rhyolitic ignimbrites and flows, with subordinate andesite, dacite, and basalt, formed during Eocene and Oligocene caldera eruptions. These volcanic rocks form a one-kilometer-thick unit that unconformably overlies the lower volcanic series andesitic rocks and constitutes the Upper Volcanic Supergroup of the Sierra Madre Occidental (Sedlock et al., 1993). The Upper Volcanic Supergroup is also commonly referred to as the “Upper Volcanic Series” (UVS), or Yecora Group. The ignimbrites are gently dipping to flat lying. As the magmatic arc retreated to the western edge of the continent, becoming inactive by the end of middle Miocene, late Oligocene to Miocene (24-17 Ma) basaltic andesites were erupted in a back-arc basin in the Sierra Madre Occidental. Still younger alkalic basalts related to Basin and Range extension are found in and east of the range. Although there appears to have been little late Cenozoic extension in the Sierra Madre Occidental itself, extensional Basin and Range-type structures and ranges formed to the east and west.
In the Témoris mining district, the lowest exposed unit of the LVS consists of rhyolitic flows, volcaniclastic units, and related shallow intrusions. These are overlain by andesitic flows and epiclastic rocks with related andesitic porphyry intrusions. Local pillow lavas and limestone within the andesitic sequence attest to their deposition in a subaqueous environment (Corbett, 2004). Dacitic and rhyolitic intrusions, which in some areas are altered and appear to be closely associated with mineralization, are interpreted to be contemporaneous with the LVS. Cliff-forming rhyolitic ignimbrites of the Upper Volcanic Series are well exposed in the eastern and southern parts of the project area.
Mineralization in the district, which is hosted in the LVS, may be synchronous with the upper dacite and rhyolite intrusions (Laurent, 2004). Mineralized veins are commonly within 500m of the unconformity with the Upper Volcanic Series (Masterman et al., 2005). The LVS exhibits regional propylitic alteration.
Structural extension in the district takes the form of what are interpreted to be listric normal faults striking north-south to north-northwest, with west-northwest-trending flexures, as well as dilation of west-northwest-trending fractures, caused by strike-slip faulting (Corbett, 2004).
A gold-silver metallogenic province that hosts low-sulfidation epithermal polymetallic gold-silver deposits lies along the western margin of the Sierra Madre Occidental (Figure 7.2). This province appears to exhibit a regional zonation of silver-rich deposits (Au:Ag ratios of 1:150) to the west and gold-rich deposits (Au:Ag of 1:40) to the east (Laurent, 2004). Palmarejo, a silver-rich deposit, lies in the western part of this province.
The LVS is exposed in the central portions of the Palmarejo project, and the UVS is exposed in the northern, northeastern, and southwestern limits of the property (Figure 7.2).
53
7.2 Regional Mineralization
The Mineral Resources that are the focus of this report are located at Palmarejo, Guadalupe, and La Patria. The mineralization found in these areas is described first, followed by brief descriptions of mineralization located elsewhere in the Palmarejo District area.
Host rocks are an important influence on vein formation at Palmarejo, especially competent brittle hosts that allow development of through-going fractures. Silicified laminated sandstones are particularly favorable hosts (examples of this include the 76, 108, Chapotillo, and parts of the Rosario clavos).
Dilational portions of fault zones, such as flexures, link veins in fault jogs, or stockwork tension veins, favor development of mineralized shoots or clavos. Throughout the Palmarejo area, left-stepping (west-northwest) bends in the generally northwest-trending structures are particularly favorable sites for clavo development. Increased normal fault displacement also appears to be important, and structures such as Tres Cruces that have little normal fault displacement tend not to be well mineralized (Corbett, 2007).
54
Figure 7.2: Regional Geology of the Palmarejo Area
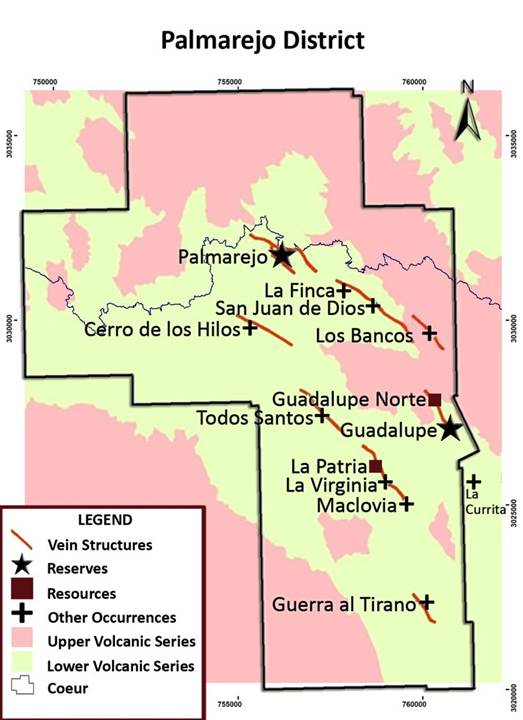
55
7.3 Palmarejo Area
The Palmarejo zone ore bodies are hosted in northwest-striking and west-dipping structures that cut through a volcano-sedimentary sequence of re-sedimented volcaniclastic, coherent and pyroclastic deposits. The volcaniclastic rocks include ash-rich mudstones and sandstones. The coherent rocks include microcrystalline massive basalt, fine grained massive andesite and plagioclase crystal rich massive andesite. The pyroclastic unit includes tuffaceous sandstone, lapillistone tuff and breccias (Galvan, 2007).
The Palmarejo Mineral Resources, described in Section 14, lie within and adjacent to the La Prieta and La Blanca structures (Figure 7.3). The La Prieta structure extends for at least two kilometers, has a variable strike that averages about 115°, and dips to the southwest at 35° to 85°.
The La Blanca structure strikes about 160°, has an average dip of about 50° to the southwest, and is thought to be a listric normal fault (Corbett, 2004) that parallels the trend of the regional faults in the Sierra Madre Occidental. Masterman et al. (2005) estimated up to 300m of throw on the La Blanca fault. Faults with similar orientations are the most commonly mineralized structures in the district.
A broad zone of mineralized quartz stockwork formed at the intersection of the La Blanca and La Prieta structures. North-trending splays from other north-northwest-striking structures at Palmarejo may offset both the La Blanca and La Prieta faults (Beckton, 2004).
56
Figure 7.3: Geologic Map of the Palmarejo Area

Gold-silver veins and vein/breccias occur within, and at the intersection of, the west-northwest-striking La Prieta structure and the north-northwest-striking La Blanca structure. Multiple stages of hydrothermal activity and mineralization filled these structures with quartz veins and formed quartz stockwork mineralization within the wedge of rock formed by the intersection of the structures. Both the La Prieta and La Blanca veins have polymetallic silver-gold vein/breccias with an epithermal silver-gold overprint that forms high-grade shoots in the steeper-dipping portions of the listric normal faults (Corbett, 2004). Early mining focused on the La Prieta vein, where high-grade silver mineralization was present as bands of fine-grained acanthite and galena within the vein.
The Palmarejo mineralization can be divided into three domains: the La Prieta and La Blanca vein domains and the footwall and hanging-wall stockwork domain developed along each of the two vein domains. The La Prieta vein domain consists of the La Prieta vein/breccia that dominated the historic production from the area. The La Prieta footwall domain encompasses quartz stockwork mineralization and silicification within epiclastic rocks and andesitic tuffs. The La Prieta hanging-wall domain consists of extensive sheeted-quartz-stockwork mineralization that is well exposed in the underground workings. The predominant geologic unit within this domain is the amygdaloidal andesite that lies between the La Prieta and La Blanca vein domains. The La Blanca vein domain consists of the La Blanca vein/breccia, which lies between
57
porphyritic andesite on the hanging wall and amygdaloidal andesite and andesitic tuffs on the footwall. The La Blanca hanging-wall domain includes quartz-stockwork mineralization within the porphyritic andesite.
Steeply plunging, high-grade clavos have been identified in each of the vein structures. The Rosario and 76 clavos contain the bulk of the mineralization at Palmarejo. The Rosario clavo lies at the intersection of the La Blanca and La Prieta veins and is up to 30m wide. The 76 clavo is a subvertically plunging shoot located at an inflection in the strike of the La Blanca structure. It terminates at depth as the structure flattens. The 108 clavo, also located on the La Blanca structure at its contact with silicified sandstone, is a gold-rich shoot. The Tucson and Chapotillo clavos lie within the La Prieta structure.
At Palmarejo, four tectonic-hydrothermal breccia types have been identified that make up the main mineralized veins (Figure 7.4). The breccias include (pictured below); a jigsaw-fit monomictic breccia, a massive cement-supported polymictic breccia, a massive, cemented, rotated lithic and vein fragment breccia and a matrix supported, chaotic polymictic breccia (Galvan, 2007).
58
Figure 7.4: Four Breccia Types of the Palmarejo Mineralized Veins

Jigsaw-fit (in situ) monomictic breccia, cemented with grey quartz; PMDH 191D; depth 403.50 m.

Massive, grey quartz - cement - supported polymictic breccia; PMDH 586D, 261.75 m.
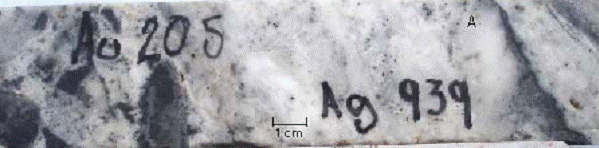
Massive cemented rotated lithic-vein cobble fragments breccia
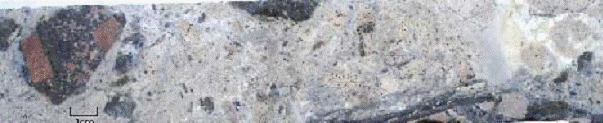
Granular-kaolinite cement-supported, chaotic polymictic-round cobble breccia, PMDH_191D, depth 405 m
Drilling by Planet Gold along the La Prieta vein structure has tested approximately 3.5km of strike length and has penetrated the structure over an elevation range of about 900 to 1250m.
59
The Palmarejo silver and gold Mineral Resources discussed in Section 14 remain open for possible expansion in several areas. Drilling has tested the intersection zone of the La Prieta and La Blanca structures, referred to as the Rosario clavo, below the deepest mineralization intercepted in either of the principal structures. The presence of significant mineralization in the deep Rosario target has been demonstrated by hole PMDH522D, which returned 24.4m (true width of approximately 13m) grading 2.30 g Au/t and 196 g Ag/t in stockwork mineralization in the hanging wall of the La Blanca structure more than 200 meters down plunge from the previously deepest intercept in the Rosario clavo.
7.4 Guadalupe Area
The Guadalupe zone is about seven kilometers southeast of Palmarejo and includes the Guadalupe Norte, Guadalupe, El Salto, and Las Animas prospects (Figure 7.5). It is located along the major northwest-trending (330°) structure that can be traced for approximately 3,000m along strike and has an average dip of approximately -55° to the northeast. Mapping by Stewart (2005) indicates both normal and strike-slip offset across the fault, with vertical displacement estimated to be at least a few hundred meters (Davies, 2007). Secondary west-northwest- and north-northeast-trending structures have been identified by surface mapping in the Guadalupe area (Laurent, 2004; Davies, 2007).
60
Figure 7.5: Geologic Map of the Guadalupe Area
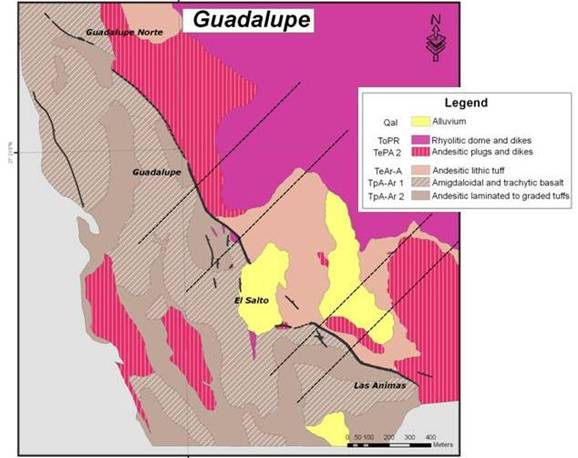
The Guadalupe zone comprises silver- and gold-bearing quartz-carbonate veins hosted in a volcanic-sedimentary package that is intruded by shallow andesitic porphyries and a felsic dome complex (Figure 7.6). The stratigraphic sequence of the volcanic-sedimentary package at Guadalupe is similar to that at Palmarejo with the exception of more abundant rhyolitic dikes, sills and domes. The Guadalupe hanging-wall block consists of predominantly flat-lying volcaniclastic sandstones, and conglomerates as well as andesite tuff that are locally underlain by amygdaloidal basaltic andesite. The footwall block comprises the lower thin-layered and fine grained volcaniclastic units and basaltic-andesitic lavas. The felsic-dome complex intrudes both volcaniclastic blocks and the andesite porphyries and is characterized by flow-banded and porphyritic rhyolite dikes and domes. Contact breccias are locally developed along the margins of the dome. Talus deposits containing fragments of flow-banded and porphyritic rhyolite partially overlies the structure between Guadalupe and Las Animas.
61
Figure 7.6: Cross Section of the Guadalupe Structure
(showing the relative position of the different lithologic units in relation to the vein)
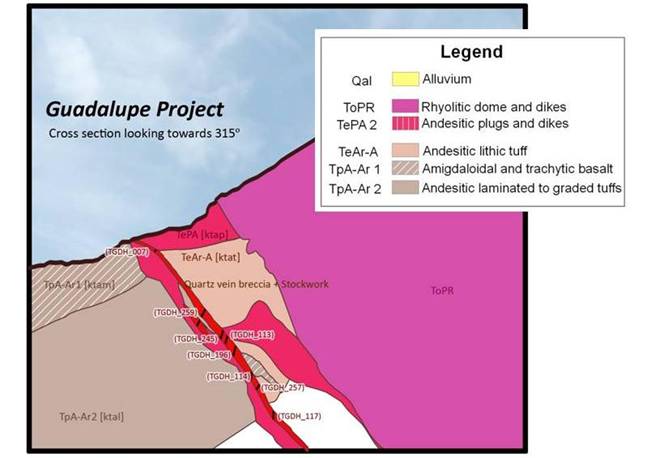
The silver-gold (±base metals) mineralization at Guadalupe occurs predominantly within the northwest-trending quartz-carbonate breccia veins enveloped by variably developed quartz hydrothermal breccias and quartz-stockwork zones. The multiphase quartz-carbonate breccia veins have an average dip of 55° to the northeast and range in thickness from less than a meter to at least 20 meters (true width). Subparallel veins, vein splays and sigmodial loops of varying thicknesses are hosted in both the hanging-wall and footwall blocks. Quartz-stockwork zones are typically developed in the hanging-wall blocks or between closely-spaced subparallel quartz-carbonate-bearing structures.
The quartz-carbonate breccia veins at Guadalupe are hosted in both the volcanic-sedimentary package as well as in the andesitic porphyries and the felsic-dome complex. Outcrop expressions of the structure are dominantly characterized by moderately to pervasively clay-altered wall rocks and laterally discontinuous quartz veins with thicknesses ranging from millimeters to a few meters. The clay-rich fault trace is best preserved at Guadalupe Norte (Figure 7.7). Beneath the clay-rich upper zone, the quartz-carbonate breccia vein swells up to 15m true width and is
62
spatially associated with quartz-carbonate-pyrite-sericite-clay-epidote-chlorite alteration in the wall rock.
Figure 7.7: Photo Showing the Guadalupe Norte Clay Alteration (Looking ENE)
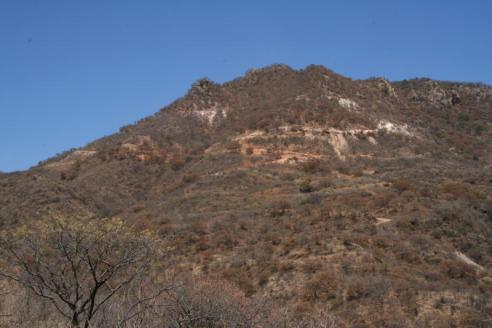
Precious and base-metal mineral assemblages are dominated by fine-grained pyrite, argentite (acanthite), sphalerite, galena, and electrum. Free gold was found in some specimens that contain narrow semi-massive sulfide mineralization (Figure 7.8), hypogene hematite-siderite, or have been altered by supergene processes (Corbett, 2007).
Figure 7.8: Photo Showing Sulfide Mineralization
(NQ core sample from hole TGDH 055 at 368 m, assaying 186 ppm Au and 3720 ppm Ag)
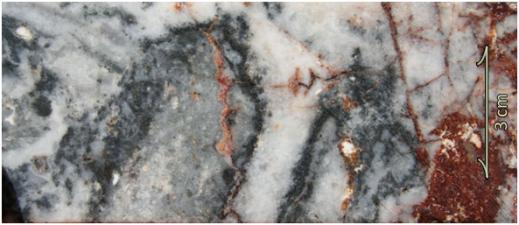
63
Hypogene mineralization typically occurs as bands and disseminations in veins and, to a lesser extent, as 2 to 4cm wide semi-massive sulfide vein infill (Corbett, 2007). Clay-rich fault zones in the upper portion of the deposit are barren to poorly mineralized (Figure 7.9). Results from the drilling indicate that shallow levels of the structure are characterized by silver mineralization, while significant gold values are encountered at depths of about 200m vertical or greater (generally below 1300m elevation).
Figure 7.9: Photo Showing Mineralized Rhodochrosite
(NQ core sample from hole TGDH 115 at 365 m, assaying 8 ppm Au and 410 ppm Ag)
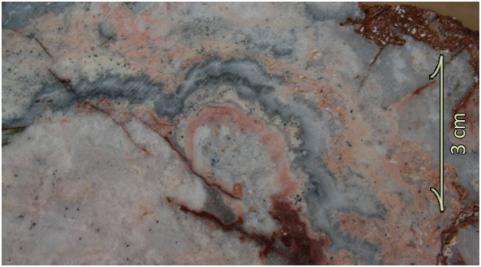
Corbett (2007) suggests multiphase silver-gold (± base metal) mineralization at Guadalupe comprises three main temporal and spatial styles, including: early gold-rich quartz-sulfide style mineralization typically developed at deeper levels; polymetallic silver-rich mineralization at intermediate levels characterized by pyrite-argentite (acanthite)-sphalerite-galena and minor chalcopyrite in the presence of several carbonate species (Figures 7.9 and 7.10) and hypogene hematite; and polymetallic silver-rich mineralization at shallow levels in the presence of abundant argentite (acanthite) and local electrum and free gold in association with white sphalerite and pyrite.
64
Figure 7.10: Photo Showing Late - Deposited Carbonates
(NQ core sample from hole TGDH 091 at 358.4 m)
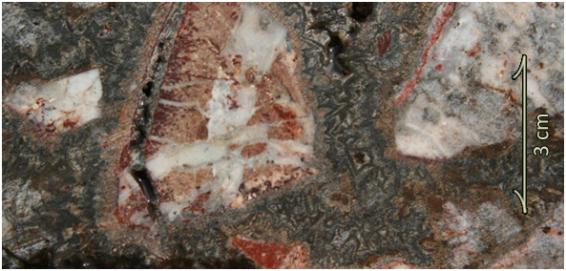
A barren clay-rich zone overlies silver-dominant mineralization in Guadalupe (Figure 7.11), and suggests a setting similar to that at the 76 clavo at Palmarejo. Masterman (2006) noted early drilling by Planet Gold intersected well-mineralized, silver-dominated quartz-carbonate breccia veins between the clay alteration zone and the 1,300m elevation. Deep drilling down-dip of the silver-rich portion of the system has delineated several wide zones with strongly mineralized gold-silver breccia veins located predominantly between the 1,300 and 1,100 m elevation levels. These results, in addition to surface geological interpretations, suggest that Guadalupe target represents the highest levels of a fully preserved epithermal system.
65
Figure 7.11: Poorly Mineralized Structure at Surface and Clay Alteration at Guadalupe Norte.
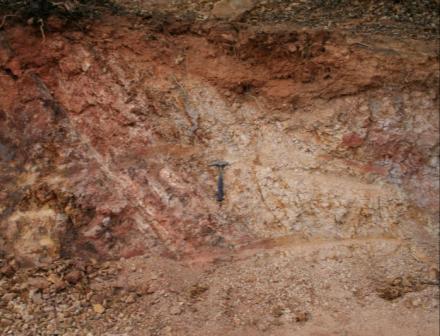
7.5 La Patria Area
The La Patria zone is located about seven kilometers south-southeast of Palmarejo (Figure 7.2) and includes the La Patria, La Virginia, and Maclovia prospects (Figure 7.12). It is located within the northwest-trending La Patria — Todos Santos structure that can be traced for over 4,000m along strike.
Prospects at the La Patria zone have a combined strike length of 1,800m and are spatially associated with sub parallel faults that strike predominantly northwest (335°) and dip approximately 45° to the northeast. Mapping suggests dominant displacement along the structure includes both normal and strike-slip movement (Davies, 2006). Several prospects, including Santa Ursula and Todos Santos, are located over several kilometers along strike to the northwest of the La Patria.
The La Patria zone comprises gold- and silver-bearing quartz-carbonate veins hosted in a volcanic-sedimentary package that is intruded by felsic dikes. The hanging-wall block consists of interlayered flat-lying amygdaloidal basalt, andesite porphyry, sandstones, mudstones, and conglomerates. The footwall block comprises porphyritic granodiorite, welded rhyolite ignimbrite, conglomerates, and the interlayered volcanic-sedimentary package. Felsic dikes with flow-banded and porphyritic textures intrude both the footwall and hanging-wall blocks.
66
The mineralization is hosted in a quartz-vein breccia unit with enriched proximal dense stockwork. Well-formed pyrite, chalcopyrite, galena and sphalerite is found within the darker grey (high temperature) quartz veining. Visible gold is present in many samples observed as native gold and electrum. Oxidation is prevalent with goethite/limonite developed in pyrite pseudomorphs.
The Quartz-vein Breccia unit lies within a typical normal extension fault with apparent preferential mineralization at the intersection lineation between the NW (335°/58°) east dipping regional structure and the WNW (300°/75°) cross structures.
There is up to 800m of strike traceable on surface from Virginia to the south through to La Patria to the north. The average width of the Quartz-vein breccia is 4m wide. The degree of oxidation is important and may increase the potential for oxide-ore, open-cut mining.
Maclovia is located ~500m south-southeast of La Patria and immediately northeast of and beneath the 1600m high Cerro Guerra al Tirano. The prospects are located on both sides of a 200m deep steeply incised valley, elevations are between 1100 & 1300m. The series of structures that make up Maclovia have been intermittently worked, possibly as early as the days of the Spanish Conquistadors and more recently in the middle of the 20th century.
At Maclovia the main north-northwest trending structure which also hosts the Virginia, La Patria, Santa Ursula and Todos Santos prospects to the north bifurcates into 6 or 7 narrow, high-grade, structures. The individual structures are between 0.1 and 2.5m wide, nominally <1.0m, and are vertically continuous for more than 100m. The strike varies from northwest to almost north — south and the dips range from 50°SW to 80°E.
Typically the structures are characterized by intensely silicified and brecciated colloform banded quartz veins hosted in silicified andesite; pyrite is common often up to 5mm and was observed at most locations. Alteration of the host rock adjacent to the veining/structure is silicic and includes minor pyrite. More distal, >2m, the andesitic rocks are strongly argillized with rare quartz veinlets and minor (absent) silicification, no economic gold or silver grades were recorded from the host.
67
Figure 7.12: Geologic Map of the La Patria Area
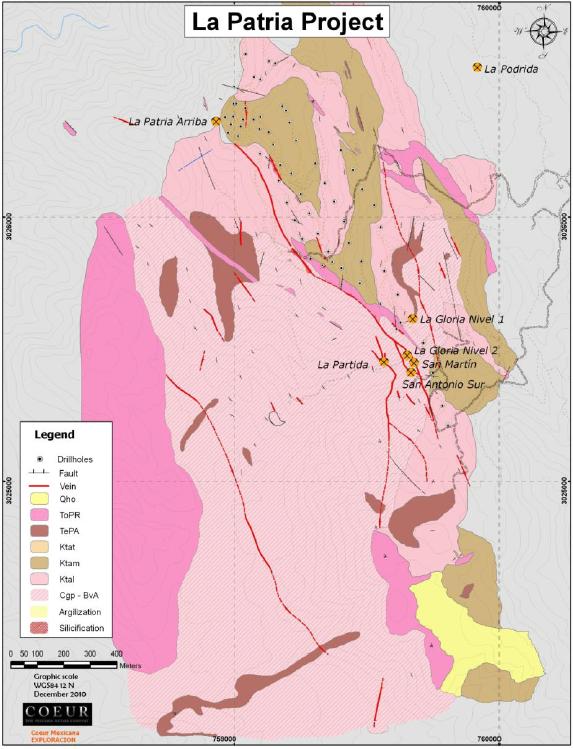
68
7.6 Other Areas of Mineralization
Palmarejo Norte
Drilling at the extension of the La Blanca structure approximately one-kilometer northwest of the limit of the Palmarejo Resources at the intersection of the La Blanca and La Prieta structures did not encounter significant mineralization.
Los Bancos
Los Bancos is an argillic bloom located 1 km north of Guadalupe Norte and 1 km southeast of San Juan de Dios. Alteration is similar to that found above Guadalupe Norte and the 76 Clavo in Palmarejo which suggests the presence of blind mineralization. Grades and thickness clearly increase with depth in drillholes. The vein was confirmed in 2009. Field reconnaissance work in the area has led to the identification of several other veins whose width ranges from 0.5 to 2.0 m with grades up to 1.5 g Au/t and 150 g Ag/t at low elevations, and up to 10 m stockwork zones in the surface projection of the Los Bancos vein with no significant grades. Suggesting the presence of a well preserved epithermal system with no mineralization exposed at the surface, similar to Guadalupe Norte and the 76 Clavo. Due to the preservation of the epithermal system surface exposures only contain minor mineralization but metal grades dramatically increase with depth.
San Juan de Dios
The San Juan de Dios area is located 2.3 km due SE from Palmarejo. A set of veins in this area had been identified by field reconnaissance where mapping and sampling geologic programs were developed. The San Juan structure trends N40°W; dips are variable from 54° to 74° to the SW. The mineralization in San Juan is represented by a set of veins up to 2.5 m thick in exposures, but dominant thicknesses are in the range of less than 1 m as observed in the old mine workings.
Several old shafts and adits were developed by earlier gambusinos, the deepest, called San Juan and El Zapote, were built as deep as 60 m. Drill-holes at this location intercepted a mineralized zone composed of thin veins ranging in thickness from 0.30 to 1.1 m; gangue minerals include quartz-carbonates. The veins are associated at least in space to earlier rhyolitic dikes that crosscut the KTAL lithological unit. It is inferred that the rhyolitic dikes pre-date the vein mineralization, since crosscutting relationships of quartz and visible sulphides show that mineralization is hosted in the vein itself, as well as in the Kaolin-altered rhyolitic intrusives as disseminations.
During the 2010 drilling campaign, fifteen holes were executed in the San Juan area. Diamond core drilling was conducted to investigate 1,100 m of vein strike length, from San Juan to El Rincón zone.
69
Other Targets
During 2012 the Palmarejo Exploration Group began systematic mapping, sampling, interpretation and evaluation of several objectives in and near current active mine areas. This project was collectively called “Task Force” project and was designed to identify new drill targets close the current mine and mill.. The work generated several drill targets including but not limited to the La Blanca Norte, Victoria-Santo Domingo Vein system, Chapotillio East and Cerro de Los Hilos. Exploration drilling continues at all of these targets and work continues to identify others.
Data at Guadalupe and La Patria Projects indicate potential for viable surface mining at these deposits. Additional in-fill drilling to enable surface mining evaluation is in progress at both of these projects.
Geological mapping combined with aeromagnetic data interpretation and spectral analysis (from Aster and Hyperspectral surveys) has generated several conceptual objectives. These objectives will be investigated during the 2013 field season.
70
SECTION 8 - DEPOSIT TYPES
Mineralization in the Palmarejo district consists of epithermal, intermediate-sulfidation, silver-gold vein and vein-breccia deposits that exhibit vertical and lateral zoning. The deposits occur within north-northwest-striking and west-northwest-striking structures (Sillitoe, 2010). The Espinazo del Diablo sector, immediately west of the current mining area, is defined as a series of high-sulfidation, advanced argillic ledges, constituting a lithocap and an important intrusive occurrence in the district (Sillitoe, 2010).
Early epithermal quartz-carbonate veins are locally overprinted by high-level, high-grade silver-gold quartz veins. This deposit type is common within the gold-silver metallogenic province of the Sierra Madre Occidental and accounts for much of the historic silver and gold production from the province. The silver and gold deposits are characterized by pervasive silicification, quartz-fill expansion breccias, and sheeted veins. Multiple stages of mineralization produced several phases of silica, ranging from chalcedony to comb quartz, and two periods of silver-gold mineralization (Corbett, 2007).
Epithermal, polymetallic silver-gold mineralization dominates the Palmarejo district (Figure 8.1, Corbett, 2005). This strongly zoned mineralization is characterized by pyrite, sphalerite, galena, and argentite (acanthite) deposited within the quartz vein/breccias at lower elevations and higher-grade precious-metals mineralization with fine-grained, black, silver-rich sulfide bands or breccia-infill in the upper portions of the structures. There is a general sense across the district that higher gold values occur deeper in the original mineral system, while richer silver values were deposited in the upper reaches of these systems. Much of the silver and gold mineralization is succeeded by the bulk of the quartz-vein material, which is weakly mineralized and tends to lie in the interior portion of the veins in the mineralized shoots. Silicic, argillic, chloritic, and hematitic alteration were noted during underground and surface mapping throughout the district (Laurent, 2004). Propylitic alteration is commonly present as wide haloes around faults and veins. Gold is present as native gold and electrum, while silver occurs as acanthite, electrum/argentian gold, native silver, (Skeet, 2004, Townend and Associates, 2004). In 2009, additional petrographic work by Panterra Geoservices Inc. identified abundant copper-silver sulfides such as mckinstryite, jalpaite, stromeyerite and pearcite. (Ross, 2009)
71
Figure 8.1: Low Sulfidation Polymetallic Silver-Gold Mineralization
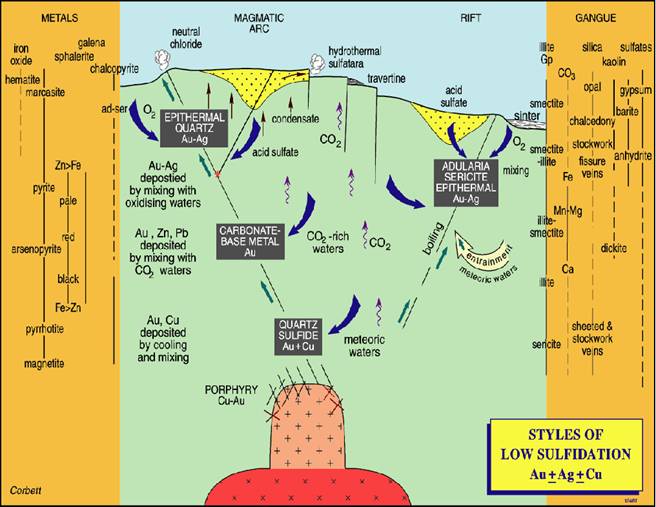
The above figure shows spatial relationships to varying alteration and mineralization in epithermal vein systems. The Palmarejo, Guadalupe, La Patria, and Guerra al Tirano precious metal occurrence currently identified would fall within the Epithermal Quartz Au-Ag level, according to Corbett (2005).
The concept of an epithermal origin for the silver and gold mineralization at Palmarejo, the associated zonation of metals and trace elements, and related hydrothermal alteration effects as well as the structural geology controls evident in surface and mine exposures has helped to frame past exploration programs. Coeur Mexicana continues to refine the epithermal origin model for silver and gold mineralization at Palmarejo to help guide drill target selection.
72
SECTION 9 - EXPLORATION
9.1 Planet Gold Exploration, 2003-2007
In January and February of 2003, Hall Stewart conducted a reconnaissance study on behalf of Planet Gold (Coeur’s operating company) in the Palmarejo-Trogan area, an old mining district with several historic underground workings. Stewart’s efforts led to Planet Gold’s submission of the Trogan application and the initiation of negotiations on internal claims. Detailed field investigations by Planet Gold began immediately following the signing of the Corporación Minera de Palmarejo (Ruben Rodriguez Villegas) agreement in June 2003.
Reconnaissance surface mapping, trenching, and underground sampling and mapping on known prospects within the project area led to the identification of significant precious metal anomalies in the Palmarejo area (Beckton, 2004). A more focused trenching and underground sampling effort was then undertaken at Palmarejo, and drill testing commenced in November 2003 with a single reverse-circulation rig.
A total of 286 underground channel samples from the 6, 7, and 8 levels of the La Prieta workings were collected by Planet Gold through September 2004 (Table 9.1). Mapping of the stratigraphy, structure, and alteration in these levels was also completed. Surveying of the Palmarejo underground workings commenced in October 2004. Planet Gold collected 79 channel samples from underground workings in nine prospect areas in other portions of the project through September 2004 (Laurent, 2004).
Table 9.1: Planet Gold Palmarejo Underground Channel Sample Database Statistics
Samples | | Au Grade (g Au/t) | | Ag Grade (g Au/t) | |
No. | | Avg. Length | | Mean | | Min | | Max | | Std Dev | | CV | | Mean | | Min | | Max | | Std Dev | | CV | |
286 | | 1.91 m | | 1.638 | | 0 | | 36.700 | | 3.309 | | 2.020 | | 220.8 | | 0 | | 4330.0 | | 410.2 | | 1.9 | |
Sixty-eight surface trenches, for a total of about 1500m, were excavated and sampled by Planet Gold as part of the reconnaissance of the Trogan area through June 2005 (G. Masterman, pers. comm., 2005; Beckton, 2004; Laurent, 2004). These trenches varied in length from one to 116m. An additional 43 trenches were completed at Palmarejo for a total of 927m. The trenches were completed with picks and shovels to a depth of up to one meter, with samples typically chipped over three-meter intervals. The trenches were mapped for lithology, alteration, structural controls of mineralization, oxidation, and stratigraphy. The results from the trench sampling were not used in the Resource estimations. Additional rock chip, mine dump, and select geochemical samples from various parts of the project area were also collected and assayed (Laurent, 2004).
Drilling by Planet Gold on the Palmarejo-Trogan project was initiated in November 2003 at Palmarejo. The La Prieta vein structure was drill tested first, as the most extensive historic mining occurred within this structure. Drilling then progressed to testing both the La Prieta and La Blanca structures, with focused drilling undertaken in the areas of the Rosario, Tucson,
73
Chapotillo, 76 and 108 mineralized shoots. Additional details of the Palmarejo drilling program are discussed in Section 10.
Planet Gold collected almost 2,200 shortwave infrared (“SWIR”) spectral measurements from drill samples from holes on a series of sections across the La Blanca and La Prieta structures using an ASD Terraspec instrument. An additional 500 SWIR spectra were measured as part of a regional alteration-mapping program on the Trogan project. A new exploration model using structural and stratigraphic targets, high-level clay mineralogy, and the silver-gold and pathfinder-element geochemistry was developed from these data and is being applied throughout the Palmarejo-Trogan exploration programs.
Four hundred forty drill samples from Guadalupe were analyzed for a 50-element suite by combination ICP-MS and ICP-AES. The goal of these geochemical analyses was to evaluate vertical and lateral zoning of major and trace elements in the mineralized shoots at Guadalupe.
One hundred and eighty-six Palmarejo drill samples and 282 trench-sample pulps were analyzed for a 50-element suite by combination ICP-MS and ICP-AES. A further 440 drill samples from Guadalupe were similarly analyzed. The goal of these geochemical analyses was to evaluate vertical and lateral zoning of major and trace elements in the mineralized shoots at Palmarejo and Guadalupe.
Preliminary surface and underground chip sampling of the quartz vein/breccia at La Patria returned 1 to 5 g Au/t and 20 to 100 g Ag/t. Based on this initial regional evaluation and encouraging trench-sample results, Planet Gold originally assigned a higher priority to the La Patria-Virginia structure than to Palmarejo. Since 2004, Planet Gold has completed geological mapping, rock-chip sampling, and 179.5m of trenching (both surface and underground) from which a series of structural-geochemical drill targets were identified. Following this work, Planet Gold began drill testing the La Patria target area in November 2005. A total of 121 holes (25,867m) have been drilled at the La Patria project. This drilling has tested and defined the structure for approximately 1,700m along strike and an elevation range of 1464 to 1020m.
Results of Planet Gold’s exploration programs outside of the Palmarejo, Guadalupe, and La Patria project areas, including the drilling undertaken at La Finca, San Juan de Dios, Todos Santos — Canadensia, Cerro de Los Hilos, Cerro de Los Hilos SE, Guerra al Tirano, and Los Bancos are summarized in Section 10. The Palmarejo, Guadalupe, and La Patria Resources are discussed in Section 14.
As of December 2007, Planet Gold had completed 180 trenches, for a total of 3,960m, and 1,135 drill holes, for a total of 246,830.9 m, within the Palmarejo-Trogan property. A total of 1,429 samples were collected from the trenches, and 800m of underground channel sampling was completed (365 samples). Drilling includes 27 geotechnical holes (494m) drilled at Palmarejo.
74
9.2 Coeur Mexicana Exploration 2008-Present
Since January 2008, Coeur Mexicana has continued to conduct exploration within the district. This work has consisted of geologic mapping and sampling of known surface fault and vein occurrences, prospecting for new fault and vein occurrences, as well as zones of visible clay zones or “blooms’, from hydrothermal alteration events. These blooms are often subtle in appearance but more readily evident in road cut exposures (Fig. 7.7) and spatially-related to silver and gold mineralization. This work precedes drilling which formed the largest component of the Coeur’s annual exploration budget in the district since the December 2007 acquisition (see Section 10).
During the 2012 Exploration Year Coeur Mexicana drilled 103,873 meters of surface and underground core in 285 holes. This compares to the budgeted meterage of 84,000. Additional AFE’s extended the original budgeted funds from $15.8M USD to $21.0M USD expended.
Underground core drilling along the La Blanca 315° structure was aimed at expanding and defining mineral resources in the Rosario, 76 and 108 clavos. A total of 45, 609 meters in 138 holes were expended in this effort.
Surface drilling was aimed at infill drilling at the Guadalupe deposit, definition of the La Patria deposit and mineral discovery in the Independencia clavo. Late in 2012 new study indicated that potential for surface mineral deposits existed in the Animas (South) and Guadalupe North sections of the Guadalupe deposit. Drilling in early 2013 will further evaluate these areas.
Favourable metallurgical test results at La Patria led to re-evaluation of the near-surface areas of the LaPatria deposit. Additional test work, metallurgical study and drilling in 2013 will in-fill parts of the La Patria deposit to evaluate this area for amenability to heap leach processes and surface mining.
During 2012 new mineralization was cut in the Independencia clavo. Additional drilling during 2013 will seek to expand this deposit area.
The Exploration Budget for the Palmarejo District for 2013 is a follows.
· Discovery and definition to at least Inferred Mineral Resource confidence (Coeur’s Category 2 programs)r is budgeted at $9 million. The funds are to be used for drilling objectives at Indepedencia, Los Bancos, Task Force and other near-mine surface targets. In the underground areas similar objective drilling is planned for Palmarejo and Guadalupe..
· Definition of Inferred Mineral Resources to at least Indicated Mineral Resource confidence (Coeur’s Category 3 programs) is budgeted at $6 million. The funds are being used to drill-define two surface areas above the Guadalupe deposit and areas around the La Patria deposit. In addition UG drilling will target the Rosario and 108 clavos and infill at Guadalupe.
75
SECTION 10 - DRILLING
10.1 Pre-Coeur Mexicana Drilling - Planet Gold Drilling (2003-2007)
Planet Gold conducted drilling primarily at Palmarejo from November 10, 2003 — September 26, 2007. During this time, other target areas tested include La Finca, San Juan de Dios, Guadalupe, Todos Santos, La Patria, Cerro de Los Hilos, Cerro de Los Hilos SE, Guerra al Tirano, and Los Bancos.
The Palmarejo drilling done by Planet Gold through September 26, 2007 is shown in Table 10.1.
Table 10.1: Palmarejo Drilling Summary - Planet Gold
| | | | | | | | | | RC | | | | | |
| | RC | | Core | | Precollared | | Total | | Total | |
Year | | No. | | Meters | | No. | | Meters | | No. | | Meters | | Drill Holes | | Meters | |
2003-2007 | | 545 | | 92,689 | | 117 | | 25,549 | | 88 | | 11,089 | | 750 | | 129,327 | |
Planet Gold initiated drilling at Guadalupe in early 2005 and drilling had been ongoing until early 2007 (Table 10.2).
Table 10.2: Guadalupe Drilling Summary - Planet Gold 2005 - 2007
| | RC | | Core | | Total | | Total | |
Year | | No. | | Meters | | No. | | Meters | | Drill Holes | | Meters | |
2005-2007 | | 96 | | 21,349 | | 139* | | 46,489 | | 239 | | 67,838 | |
*Includes 4 core continuations of RC holes & 2 core (wedge) continuations of core holes
Planet Gold drilling at La Patria is summarized in Table 10.3. No drilling was performed at La Patria from 2007 to the end of 2010. Drilling resumed in 2011. Coeur Mexicana exploration drill and sample data for that year are summarized in Table 10.4.
Table 10.3: Total Drilling at La Patria, 2005-2007
(Gustin, 2007)
| | | | | | | | | | Total | | | |
| | RC | | Core | | Drill | | Total | |
Year | | No. | | Meters | | No. | | Meters | | Holes | | Meters | |
2005-2007 | | 79 | | 14,014 | | 42 | | 11,852 | | 121 | | 25,866 | |
Three drillholes from previous RC drilling campaigns at La Patria were twinned with core in 2011 (LPDH_014 with LPDH_159, LPDH_077 with LPDH_162 and LPDH_051 with
76
LPDH_164). Overall, the twin pairs show similar results in the main mineralized zone and similar thicknesses. The core holes for the first 2 pairs show lower overall grades (20-30%) while the core drilling for the 3rd pair shows much higher grades (25%). This may be caused by the presence of groundwater during the RC drilling. All results are used in the 2011 resource model.
10.2 Coeur Mexicana Drilling
To define and expand mineral resources at Palmarejo, drilling, done by the exploration and mine geology groups of Coeur Mexicana, has been conducted annually since 2008. Coeur Mexicana Operations has also continued channel sampling at Palmarejo.. RC drilling is conducted as part of the open pit ore control program and condemnation drilling. The Palmarejo District mineral resource estimate was updated in 2012 using data collected from 2003 through approximately mid-2012 (see Section 14).
10.3 Core Drilling and Logging
Diamond core drilling in the Palmarejo District has been conducted by drilling companies under contract to Bolnisi/ Palmarejo Gold and Silver and, since 2008, Coeur Mexicana.
Under Coeur Mexicana, G4 Forage Drilling, headquartered in Val-d’Or, Quebec, Canada, Landdrill International Mexico from Hermosillo, Mexico, and GDA Servicios Mineros SA de CV, a Chilean drilling company, have been used to perform the core drilling at the Palmarejo District. In 2011 and 2012, all contract drilling, from both underground and surface positions, was conducted by G4. Coeur Mexicana reviews its drilling requirements and awards contracts annually for its exploration and resource definition drilling.
Water for the Palmarejo core drilling is supplied by water truck from Palmarejo Creek and/or pump and water line running from the creek. Water at Guadalupe is supplied by water truck from the old mill at Arroyo Blanco and from a creek at Los Llanos.
The core holes that were collared at the surface recovered HQ or PQ core, unless the intersection of voids or down-hole drilling problems were encountered, in which case the drillers reduced to NQ or HQ, respectively. The core tails, which were drilled when RC holes were terminated prematurely due to encountering groundwater and/or down-hole problems, recovered NQ or HQ core (Gustin and Prenn, 2007).
Diamond-core holes were logged for geotechnical data and geology, including rock type, alteration, mineralization assemblages, vein-quartz percentage, and oxidation. Graphic logs were also created for stratigraphy, vein orientation, and visual identification of mineralized zones. Digital photographs of wetted core were taken and initially archived at the field offices. Holes were re-logged by a second geologist following receipt of assay results to validate data.
A new descriptive system of logging volcanic lithologies and breccia textures and mineralization from CODES (Centre of Excellence in Ore Deposits, Tasmania) and MDRU (Mineral Deposit
77
Research Unit, British Columbia) has been adopted by Coeur Mexicana. The system allows for more consistent logging of geology and is entered into an AcQuire database for documentation. The data is also exported into three-dimensional modeling software for further understanding of the geology and mineral controls.
All core at Palmarejo was moved to the new Guadalupe exploration area during 2008. The facility consists of a covered and secured storage building, a covered logging and sampling area, two enclosed core cutting saws and a three room office building with a room for the resident watchman. All core is photographed and photos are available and well organized at the Chihuahua office for exploration core and at the mine site for operations core.
As part of the mine construction a new core logging and geologic office facility was built at the Palmarejo mine site. This facility consists of fully enclosed logging, cutting and sampling areas and geologic offices.
10.4 Reverse Circulation Drilling and Logging
Reverse circulation (RC) drilling was a major part of the initial drilling method by the prior owners of the Palmarejo District. However, since 2008 through 2012, very little to no RC drilling was performed for exploration purposes.
RC drilling is conducted as part of the open pit ore control program and condemnation drilling (Table 10.4).
The Qualified Persons have reviewed this information and believe that the methods employed are sound and that the results and interpretations are accurate and within industry standards.
10.5 Sampling Method and Approach Summary
The core in the Palmarejo district is being sampled only in the intervals suspected to contain precious metal mineralization. Where the rock displays minor alteration and/or quartz-carbonate veinlets, the standard sample interval is one meter. In a section where the core has intersected a strongly mineralized structure, sampling may be reduced to a nominal 0.5 meter interval but can vary depending on the mineralogical changes. When structure is clearly broken into different veins or domains, it is sampled separately at contacts and sample intervals may be less than 0.5 meters.
Reverse circulation holes used the Palmarejo mineral resource model were sampled every five feet (1.52 m) down the hole. Holes that were drilled in a new area were sampled along the entire length of the hole. In-fill or close-spaced holes were sampled at 5 foot intervals through zones of suspected mineralization. As a standard procedure, only material from dry drilling was being sampled and once the water table was intersected the RVC hole was stopped and usually continued with core.
78
10.6 Diamond Drilling Sampling
The core is removed from the core barrel and placed into boxes for HQ and NQ core. All breaks of the core made by the drillers are marked in order to assist in the differentiation of natural vs. manmade fractures. On selected Palmarejo holes, the core driller marked an orientation at the top of the core run prior to retrieving the core barrel with a spear-system that is sent by wireline. The core barrel is then retrieved and placed into core boxes.
At the core shed, the core was first pieced together by a geologist or technician, with the orientation mark facing up (if applicable). Cut lines were then traced along the core axis when HQ diameter surfaces drill cores were logged, sample intervals were marked on the core, and the intervals were assigned sample numbers. The sample lengths for wall rock average 1.5 m at Palmarejo and Guadalupe. Suspected mineralized zones were sampled at intervals averaging about 0.5 m. at all projects before Coeur’s acquisition. Since Coeur performed exploration at Guadalupe suspected mineralized zones were sampled at intervals averaging about 0.75 m. Sample lengths were variably adjusted by the supervising geologist to avoid sampling across geological contacts. Digital photographs of wetted core were taken and the core was then sawed into two halves along the cut lines. The half of the core to the right of the orientation line was chosen for assaying and placed in a numbered bag along with a sample tag. A duplicate tag was kept in the sample-tag book and archived at the Palmarejo field office. The left side of the core was retained in the core boxes on site.
During 2011 and 2012, the selected diameter for drilling was HQ for surface holes and NQ for underground drilling. The sample length for mineralized zones ranges from 0.30 m to 1 m at Palmarejo. Underground drilling included production ore control and definition drilling as well as infill holes to bring inferred resources to indicated or measured status. For surface drilling, HQ diameter core samples were saw-split. The entire sample was bagged and tagged. Underground NQ diameter core samples were bagged in their entirety in order to reduce sample variability due to the small sample provided by NQ diameter cores.
Exploration drilling at Guadalupe, La Patria and other exploration targets during 2012 was conducted using HQ diameter core. The core was laid out and logged under a shed facility on wooden tables. The selected core samples, which vary from 0.4 m to 1.5 m, were saw-split, and half of the sample was bagged and tagged; the remaining half of the core was returned to the plastic box for storage. All remaining core is organized in metallic racks inside a fully-covered warehouse. QAQC samples standards, blanks and duplicates are inserted and bagged and tagged by the geologist in charge. Core used for infill, resource definition, purposes may or may not be cut.
10.7 Reverse Circulation Drilling Sampling
RC chips were recovered up through the center of the double-wall pipe, and the sample was discharged at the surface via a cyclone directly onto a contractor-supplied three-tiered Jones splitter. If groundwater caused the sample exiting the cyclone to be wet, and the hole could not be dried with the addition of a compressed air booster, the sampling was halted, the RC portion
79
of the hole was terminated, and any continuation of the hole was completed by coring. The depth at which groundwater water was encountered was logged by the supervising geologist.
Each entire 1.52 m sample was collected into a cyclone and then released into a hopper into a Gilson, riffle-type splitter. The sample was initially split so that half of the material was discarded. The remaining half was split in half again, and each of these quarter splits were poured directly from the splitter pans into buckets containing sample bags. The sample numbers were recorded as the drilling progressed by a geologist that supervised the RC drilling. One quarter split was used as the sample for assaying and the other was stored as an archive duplicate. Once bagged, the samples were placed in order on the ground near the drill. All samples to be submitted for analyses were placed at a collection point on the drill pad for the weekly pickup by a sample truck sent by the assay lab.
Past studies of core and RC twin holes at Palmarejo have suggested a low bias (-30%) to the core samples because of local poor recovery in faulted/crumbly and oxidized mineralized zones, most notably in the Rosario area at the intersection of the La Blanca and La Prieta vein structures. AMEC (2008) analyzed the assay results of both core and RC samples and has concluded that there are no obvious deficiencies with the Ag and Au assay data. The Qualified Persons have reviewed the AMEC results and are in agreement with AMEC that the data are sufficiently accurate for resource estimation and classification purposes.
During the 2008-2012 mine operations, RC drilling has been conducted at the Palmarejo Mine for ore control purposes only, with the exception of condemnation drilling in 2008 and some infill exploration holes. The drilling and sampling procedure described above was used, with sampling at 1.52 m intervals. The RC drilling is conducted on a 10 meter grid in pit areas. Areas evaluated with RC drilling include Rosario, Tucson and Chapotillo. The rig performing the drilling at Palmarejo is a Company-owned Atlas Copco, model Rock L-8. The rock chips are recovered up through the center of the double-wall pipe, and the sample is discharged at the surface via a cyclone directly, then bagged and tagged.
80
SECTION 11 - SAMPLE PREPARATION, ANALYSIS, AND SECURITY
11.1 Historic QA/QC and Third Party Reviews
The results of all pre-Coeur Mexicana QA/QC programs on drilling conducted by Bolnisi and Palmarejo Silver and Gold have been reviewed by independent third parties, whose findings are summarized in this section.
Keith Blair of Applied Geoscience LLC, studied the results of the quality assurance/quality control (“QA/QC”) program implemented by Planet Gold for the Palmarejo, Guadalupe, and La Patria projects (Blair, 2005; Blair, 2006; Blair, 2008) and the Quality Assurance/Quality Control (“QA/QC”) program at the Guadalupe project for data collected from July, 2005 to March, 2008. The data reviewed by Mr. Blair includes reference sample results, duplicate sample and duplicate assay results, and second-laboratory check assays. The main goal of Blair’s studies is to assess and comment on the quality of the assay data for the projects.
The data and discussions presented in this section are quoted directly or derived entirely from MDA’s 2007 Palmarejo Technical Report (Gustin, 2007) that summarizes Blair’s study of the Palmarejo project (Blair, 2006), and the Guadalupe (Blair, 2008) and La Patria projects (Blair, 2008), unless otherwise noted. The Blair 2006 report is an update to a review he completed previously for the Palmarejo project (Blair, 2005). Blair’s review for Guadalupe reviews information for the drilling conducted from July, 2005 up to March, 2008. Blair’s 2007 report presents the first QA/QC review of the La Patria project. Mr. Blair is a Qualified Person under Canadian Securities Administrators’ National Instrument 43-101, and he is independent of Coeur, Planet Gold, Palmarejo Silver and Gold, and Bolnisi.
As part of the MDA (Gustin, 2004) technical review of the Palmarejo project in 2004, 21 samples from two RC holes were selected and splits of the original sample were sent to Chemex for analysis using the preparation and assay protocol used by the project. MDA concluded that the results for both metals show good agreement; there is no apparent bias to either metal.
AMEC Mining and Metals also conducted a review of Palmarejo data during 2008, which is summarized in this section.
11.1.1 Historic Palmarejo QA/QC Program Review by Applied Geoscience, LLC.
A total of 557 Chemex assay reports for Palmarejo, covering the period of December 4, 2003 to September 12, 2006, were reviewed by Keith Blair of Applied Geoscience LLC (2006). The following is a summary of the Palmarejo QA/QC review taken from the MDA Technical Report (Gustin, 2007).
Review of Blank Analyses
Blank-sample results were mostly acceptable for gold, with only 10 of the 999 blank assays containing detectable metal greater than 3 times the detection limit for the analytical method and
81
4 instances being greater than 5 times the detection limit. Blank sample results for silver show 8 of 999 instances with detectable metal greater than 3 times the detection limit for the analytical method and 5 of 999 instances being greater than 5 times the detection limit. The field blank material used during the period had not been characterized, so it is likely that the material contained minor mineralized material.
Review of Standards Analyses
Nine analytical standards were used to evaluate the analytical accuracy of the assay laboratory: one blank composed of core from non-mineralized drill intervals from the project, 4 standards from Ore Research (including 2 chip standards), three standards from Rocklabs, one custom standard of mineralized material from Palmarejo (PJO1), and one internal standard from ALS-Chemex. All but the two chip standards had certified gold and silver values.
A low bias was apparent in the 2 chip standards, which could be due to the high level of other metals in the material. These reference samples have anomalous arsenic (1000-2000 ppm) and antimony (120-160 ppm) that could be suppressing gold during fire assaying. Use of the chip standards was discontinued in late 2005. Standard OREAS-33 was used only during Feburary and March 2005. Use of OREAS-33 was discontinued due to the inappropriate high base metal content matrix. Analytical standards were used to evaluate the analytical accuracy of the assay laboratory. . Other standards showed some scatter but no systematic bias, with the exception of two: PJO1 and BPL-4. Standard PJO1, a custom standard with the highest silver grade of all the project standards, 258 g/t Ag, showed a slight low bias in Ag analyses, with four reports outside the -2 standard-deviation limit. Standard BPL-04 is an internal standard to ALS-Chemex with high expected values for both gold (47 g Au/t) and silver (682 g Ag/t). Gold results are variable but show no systematic bias at the mean. The calculated mean for silver shows a slight low bias, but is within accepted limits. Most of the anomalous silver instances are below the -2 standard-deviation limit and give an overall low sense to the data set.
Review of Duplicate Samples
Duplicate samples can be used to evaluate the grade variance introduced by inherent geologic variability, sample size, or introduced sampling biases. For 2003-2006, the Palmarejo project had a large data set of gold and silver analyses of duplicate samples. Duplicate samples were collected at the drill during RC drilling; these are referred to as rig-resplit duplicates. The rig resplit duplicates were collected using a 1:100 sample ratio while drilling. Duplicate samples from core were collected as splits from the coarse preparation rejects of ALS-Chemex (now ALS Minerals or ALS).
For the different duplicate sample and assay groups, metal statistics are influenced by a large number of below detection limit results. Below detection results were set to one-half of the detection limit or 0.025 g Au/t for gold and 2.5 g Ag/t for silver.
The data showed very good agreement for both gold and silver, but with some scatter in the lower portions of each distribution. The agreement between the duplicate assays is very good
82
within the grade range of interest (> 1g Au/t gold and >30 g Ag/t silver). Rig-resplit duplicates show fair agreement but with some scatter in the lower portions of the distributions.
Part of the internal QA/QC program at ALS is random check assaying of samples in each assay job. Results showed good agreement with a few outliers noted for silver. The scatter in the lower portions of the data reflect the low resolution of the assay method at levels slightly above the detection limit to approximately 3 to 5 times the detection limit for both metals. The method variance at these levels is important when evaluating reference-sample results with expected values in this range. Most of the silver standards used by the project are in this three to five times the detection-limit range. Thus, the variable results for the reference sample are expected.
Review of Check Assays
Similar to analytical standards, check assays by an independent laboratory on pulps from the primary assay lab are used to evaluate the analytical accuracy of the primary lab. In contrast, check assays by the primary laboratory on its own pulps can be used to examine the analytical precision of the primary lab.
The initial batch of check assaying was performed in 2005 and was made up of 17 samples from drill hole PMDH - 109. The check assay laboratory was BSI Inspectorate (“BSI”) in Reno, Nevada. Analysis for both metals was by fire assay with gravimetric finish on a 1 assay-ton sample charge. The BSI results showed good agreement for gold, but very poor agreement for silver. BSI silver results are systematically lower than the original assay by approximately 40%. These silver check assay data were considered suspect.
During the period from July 2005 to November 2005, an additional 920 pulp samples were submitted to ACME laboratories of Vancouver, B.C. for check analysis. Analysis for both metals was by fire assay with gravimetric finish on a 1 assay-ton sample charge. These samples are from across the deposit and from assay reports over the life of the project. Gold results from ACME agree well with the original ALS results and show slightly higher grades (+5%) at the median and upper quantile. For silver, ACME is systematically higher than ALS by 5% to 10% between 50 g Au/t and 1500 g Au/t. Below 50 g Ag/t there is much more scatter. Above 1500 g Ag/t silver, the assays agree well. Additional check analyses from the 2006 assaying program were recommended for a more conclusive statement of quality for this part of the assay database. A review of the data collected by Bolnisi and Planet Gold was conducted in 2011 which included additional check analyses for that period (see Sections 11.2.1.3 and 11.2.2.3 - 2011 Review of Historic Sampling).
11.1.2 AMEC’s 2008 Review of Palmarejo QA/QC
During a site visit in 2008 to Palmarejo, AMEC Mining and Metals (AMEC), an independent consultant to Coeur, acquired QA/QC assay data supplied by Bolnisi (AMEC, 2008). AMEC evaluated the twin and duplicate samples according to the hyperbolic method. The Ag failure rates were within acceptable limits (less than 10%), but the Au failure rates are slightly above the
83
acceptable limits. However, considering that most of the failures lie very close to the failure lines, AMEC is of the opinion that the sampling and analytical precisions are acceptable.
AMEC also evaluated Certified Reference Materials (CRMs, certified Standard samples). In total, 1,040 samples corresponding to four commercial CRMs and one in-house CRM were assayed. Most CRMs were characterized by relatively large proportions of outliers, particularly for Ag (4.1% to 7.5%), regardless of the Ag grade. However, the Ag accuracy was appropriate (-3.6% to 1.2% bias). The only exception was CRM SG14, with -6.4% bias, but with a very low value (11 ppm). The Au assays also had relatively large proportions of outliers (0.6% to 5.9%), but the Au accuracy was within acceptable limits (-0.8% to 1.2% bias).
AMEC also reviewed the assays of 1,240 coarse blanks inserted in the batches. The threshold value was considered as five times the detection limit. Only two samples for Ag and five samples for Au displayed values above the threshold value. AMEC is of the opinion that significant Ag and Au cross-contamination did not occur.
11.1.3 Guadalupe Project Historic QA/QC and Third Party Reviews
Applied Geoscience, LLC’s review of the Guadalupe QA/QC data did not encounter significant problems or biases for the period studied (data collected from July, 2005-March, 2008), and the assay database was found to be of acceptable quality for resource modeling.
Reference-sample statistics and control charts showed acceptable results for the gold fire assays. Silver assays from the project standards with expected values of less than approximately 50 g Ag/t showed scatter outside the tolerance limits. The variance in the silver results is likely due to analytical method variance and low resolution of the assay method at the lower-grade levels. Most of the silver standards used by the project are three to five times the detection-limit range, thus the variable results for the reference sample are expected. Some of the higher-grade silver standards showed a systematic low bias (ALS results are biased low in comparison to the expected value of the standard). This condition may be due to silver volatilization during fire-assay cupellation. Check analyses on pulps have confirmed the silver assays from selected mineralized zones at Guadalupe.
Duplicate-sample analyses showed acceptable reproducibility for both silver and gold, and check analyses agreed well with the original assays. Check analyses for Guadalupe agreed well with the original assays for the assay reports to March, 2007. Check analyses for the remaining 2007 and 2008 data showed satisfactory agreement with the original assay, but with some complication given mishandling of samples from two sample batches at one or both of the assay labs.
11.1.4 La Patria Project QA/QC Review
A total of 119 assay reports from February 10, 2006 to April 20, 2007 were included in Blair’s review of the La Patria QA/QC data (2007). The following discussion is summarized from MDA’s 2007 Technical Report (Gustin, 2007).
84
Blair’s review of the quality assurance and quality-control information for the La Patria projects did not encounter significant problems or biases within the assay database for the period studied, and the assay database is of acceptable quality for preliminary resource modeling. Check analyses are required for final approval of the La Patria assay database.
Reference-sample statistics and control charts show acceptable results for the gold fire assays. Silver assays of the project standards show scatter outside the tolerance limits for some standards with expected values of less than approximately 50 g Ag/t. This variance in the silver results is likely due to analytical method variance and low resolution at the lower-grade levels for the assay method. Some of the silver standards results show a systematic low bias at higher concentrations. This condition may be due to silver volatilization during fire assay cupellation, although this does not appear to be the case with the Chemex internal reference-sample assays.
Duplicate sample and internal laboratory check analyses show acceptable reproducibility for both metals.
A monthly QC report is done so that “problem” reports can be quickly identified and action taken by project personnel in a timely fashion. Regular submission of samples for check analyses will also provide a more current and efficient QC monitoring program. During the initial review of QC data for La Patria, minor database problems were recognized. All have been discussed with exploration personnel, and action has been taken.
11.1.5 Third Party Reviews of Historic QA/QC - Discussion and Recommendations
The third party reviews of the historic QA/QC data summarized above did not encounter significant problems or biases within the Palmarejo, Guadalupe, or La Patria assay data. Based on these reviews, the Palmarejo 2003-2007 assay data is of acceptable quality for resource modeling.
Reference sample statistics and control charts show acceptable results for the gold fire assays. Silver assays for the project standards show scatter outside the tolerance limits for the standards, with expected values of less than approximately 30 g Ag/t. The variance in the silver results is likely due to analytical method variance and lower resolution at the low-grade levels.
Duplicate-sample analyses show acceptable reproducibility for both metals. Check analyses at secondary laboratories agree well with the original assays.
All data collected from 2003-2007 was used for resource estimation for the Palmarejo and La Patria deposits. All data collected from inception in 2005 to 14th March, 2008 and used in the Guadalupe deposit resource estimation have been reviewed by AMEC, MDA and/or Applied Geoscience, LLC and was considered of acceptable quality for resource modeling (see Section 27 for a list of references).
The Qualified Persons have reviewed the assay data and the third party reviews of the Palmarejo and Guadalupe databases and QA/QC programs done by AMEC (2008), MDA (Gustin, 2004,
85
2006) and Keith Blair (2005, 2006, 2007) and are in agreement with the conclusion of these reports that the data collected by Bolnisi and Palmarejo Silver and Gold is suitable for resource modeling and that there are no known factors that could materially affect the sample results.
11.2 Coeur QA/QC Programs
The Palmarejo Project QA/QC program for gold and silver assays has changed from when work began in 2003. Initially the project inserted reference samples into the sample stream at a 1:200 ratio, whereby one reference sample was inserted for every 200 drill samples. Starting in mid-2005, the proportion was increased to approximately 1:25 to ensure that every fire-assay furnace lot contained reference samples. When Coeur assumed control of the project in late 2007 the following protocols were implemented for exploration and development drilling; one reference standard inserted for every 20 field samples, one blank sample inserted for every 20 field samples and one field duplicate is collected for every 20 field samples. Additionally, 5% of the sample pulps are sent to a different lab for check analysis. In 2012 the new protocols for exploration and development changes: one standard and one blank for every 20 field samples,but one duplicate is collected for every 40 fields samples.
Coeur utilizes the acQuire Technology data management system to store and analyze QA/QC results as they are made available. Results are not released until QC has been completed on each assay certificate.
QA/QC results are examined for each batch of assays received from the laboratory. Significant failure of standard samples requires re-submitting the pulps (the failed standard plus a minimum of 5 samples either side of the failure) for re-analysis. The results of the re-analysis will either trigger acceptance of the original batch or re-run of the entire batch with rejection of the original results. All sample re-runs are given precedence over the original results. Results are also reviewed quarterly and elements of the QC program are adjusted as necessary.
11.2.1 Coeur QA/QC Summary - Palmarejo Deposit
Samples collected during exploration core drilling and underground development drilling have been sent to ALS Minerals in Chihuahua (ALS) and SGS Laboratory, Durango (SGS), Mexico for preparation and analysis using industry standard methods. ALS and SGS are accredited commercial laboratories conforming with requirements of CAN-P-1579, CAN-P-4E (ISO/IEC 17025:2005)). Since late 2010, all exploration and definition drill samples have been prepared and analyzed by ALS. SGS or other commercial laboratories are used to check results from ALS on samples submitted by Coeur Mexicana geologists.
11.2.1.1 QAQC Results Palmarejo Exploration and Production Sampling 2012
During 2012 the assay QAQC process was standardized for exploration using the process described in Section 11.2. Results are reported and reviewed quarterly for exploration and production sampling.
86
11.2.1.2 2012 QA/QC Palmarejo Mine Area Exploration and Production
The current commercial analytical lab for the Palmarejo mine area resource definition drilling is ALS with sample preparation in Chihuahua, Chihuahua. A split of the prepared pulp is sent to Vancouver, B.C. for fire assay with gravimetric finish for both gold and silver. ALS complies with the international standards ISO 9001:2000 and ISO 17025:1999.
Underground development core drilling, channel samples and open pit RC drilling results are analyzed by the Palmarejo site lab operated by SGS. Samples are crushed to 10 mesh and a 250g split is taken. The sample is then pulverized to -200 mesh (80% passing). A split is taken and stored for up to 3 months. Samples are analyzed for Au and Ag using a 2-acid digestion AA method. Silver is then re-analyzed with a fire assay gravimetric method.
During the year 45,610 meters of diamond core drilling was conducted. A total of 24,307 core samples were analyzed. A summary of the sampling conducted is shown in Table 11.2. The results of the 2012 QA/QC sample program for exploration drilling and production sampling within the Palmarejo District are summarized in the following section (Table 11.1).
Table 11.1: Drilling Report Activity 2012
Drilling Report
Category | | Drilled (m) | | Hole Count | | Primary
Samples | |
DDH3
UGDDH | | Diamond Core Drilling | | 45,610 | | 138 | | 16,382 | |
| 12,137 | | 157 | | 7,925 | |
RC | | RC Open Pit Drilling | | 27,454 | | 1209 | | 13,447 | |
Total | | 85,201 | | 1,504 | | 37,754 | |
87
Table 11.2: Field and QA/QC Sample Activity 2012
ALS | | Primary
Samples | | Standards | | Blanks | | Duplicates | |
Mine area Resource Definition Drilling | | Cat-3 | | 16,382 | | 863 (5.3%) | | 866 (5.3%) | | 765 (4.7%) | |
| | | | | | Au | Ag | | Au | Ag | | Au | Ag | |
Failures | | | | 17 | 19 | | 1 | 1 | | 381 | 123 | |
SGS Palmarejo | | Primary
Samples | | Standards | | Blanks | | Duplicates | |
DO Underground Development | | Underground | | 7,925 | | 375 (4.7%) | | 375 (4.7%) | | 458 (5.8%) | |
Channels Underground | | | 1,495 | | 94 | | 100 | | 0 | |
RC Open Pit Drilling | | Open Pit | | 13,447 | | 348 | | 348 | | 348 | |
Channels Open Pit | | | 683 | | 0 | | 0 | | 0 | |
Total | | 23,550 | | 817 | | 823 | | 806 | |
| | | | | | Au | Ag | | Au | Ag | | Au | Ag | |
Failures | | | | 28 | 18 | | 9 | 6 | | 287 | 116 | |
Failure rates are shown in Table 11.3 for Au and Ag in 2012 sampling program for mine area resource and production.
Table 11.3: QAQC Failure Rate for 2012 Sampling Program
| | | | Au | | Ag | |
Mine area Resource Definition Drilling | | Standard | | 1.97 | % | 2.20 | % |
| Blank | | 0.12 | % | 0.12 | % |
| Duplicates | | 49.80 | % | 16.08 | % |
| | | | | | | |
Production Sampling (Includes development drilling) | | Standard | | 3.43 | % | 2.20 | % |
| Blank | | 1.09 | % | 0.73 | % |
| Duplicates | | 35.61 | % | 14.39 | % |
2012 Standards
Five of the internal standards prepared for the 2010 — 2011 drilling were also used for the exploration and development drilling in 2012 (STD-00003, 00006, 00008, 00009 and 00010). Standard STD-00009 and 00010 was newly created by SGS Durango utilizing material from the Palmarejo mine site. Expected values of each standard are shown in (Table 11.4). Round robin assaying on the new standard STD-00009 and 000010 was conducted by 4 separate laboratories.
88
Overall results from the standards are considered within acceptable limits of three times the standard deviation of the standard. Failures occurred in random batches and there appears to be no bias in the timing. Failure rates are outlined in table 11. 3 above.
Table 11.4: Standards Used in 2012
Standard | | Expected
Au Value | | Expected
Ag Value | |
STD-00003 | | 0.75 | | 76.6 | |
STD-00006 | | 0.63 | | 104.6 | |
STD-00008 | | 2.98 | | 246 | |
STD-00009 | | 0.69 | | 90 | |
STD-00010 | | 3.66 | | 305 | |
89
Figure 11.1: Standard Results for Category 3 Drilling Silver Gravimetric Results

90
Figure 11.2: Standard Results for Categgory 3 Drilling Gold ICP Results
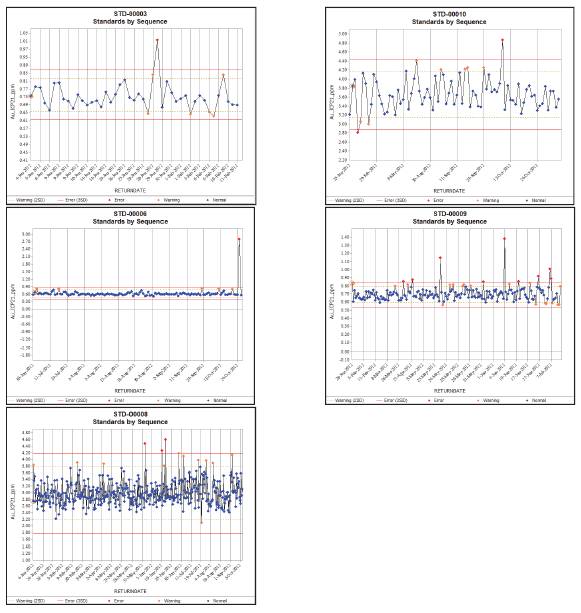
91
Figure 11.3: Standard Results for Development Drilling Silver Gravimetric Results

Figure 11.4: Standard Results for Development Drilling Gold AA Results

92
2012 Blanks
During 2012, one blank was utilized during the year for resource definition drilling. BLANK-3,created during 2010 is discussed in Section 11.2.1.2.1of this technical report. Blank-3 along with BLANCO_RC were utilized for production related sampling.
Blanks performed very well at ALS Chemex and SGS Durango where resource definition drilling results are analyzed. Blanks included with development drilling and RC open pit drilling samples prepared and analyzed at the Palmarejo site laboratory indicate minor sample preparation contamination. Failure is considerd five times the analytical method detection limit. Failure rates are outlined in Table 11.8 above.
Figure 11.5: Blank Results for Development Drilling
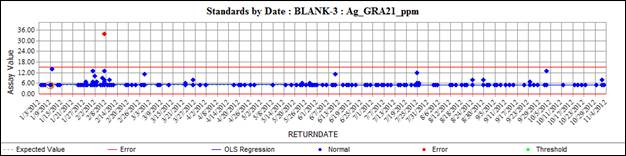

2012 Duplicates
Duplicates were taken as core splits and splits from the pulp for resource definition drilling samples. All duplicates had a failure criterion of +/- 20% variance. Results are shown in Table 11.5 and Table 11.6. Development drillholes only utilized sample duplicates. Results are shown in Table 11.7. Both duplicate types show a high rate of failure across all grade ranges and at both ALS Chemex and the Palmarejo site laboratory. Comparison of sample duplicate failure rates shown in Table 11.6 and Table 11.7 show the PAL site lab performing better than ALS Chemex on duplicate analysis.
93
Table 11.5: Pulp Duplicate Failure for Resource Definition Drilling (ALS Chemex)
Au_ICP21 Method | |
Au ppm | | Samples | | Failures | | Percent Failure | |
All | | 706 | | 243 | | 34% | |
>0.1 ppm | | 58 | | 25 | | 43% | |
>0.2 ppm | | 28 | | 9 | | 32% | |
Ag_GRA21 Method | |
Ag ppm | | Samples | | Failures | | Percent Failure | |
All | | 712 | | 73 | | 10% | |
> 10 ppm | | 37 | | 6 | | 16% | |
> 20 ppm | | 22 | | 4 | | 18% | |
>30 ppm | | 17 | | 2 | | 12% | |
Table 11.6: Sample Split Duplicate Failure for Resource Definition Drilling (ALS Chemex)
Au_ICP21 Method | |
Au ppm | | Samples | | Failures | | Percent Failure | |
All | | 756 | | 377 | | 50% | |
>0.1 ppm | | 55 | | 27 | | 49% | |
>0.2 ppm | | 33 | | 19 | | 58% | |
Ag_GRA21 Method | |
Ag ppm | | Samples | | Failures | | Percent Failure | |
All | | 762 | | 121 | | 16% | |
> 10 ppm | | 41 | | 25 | | 61% | |
> 20 ppm | | 23 | | 13 | | 57% | |
> 30 ppm | | 20 | | 11 | | 55% | |
94
Table 11.7: Sample Split Duplicate Failure for Development Drilling (PAL Site Lab)
Au_FAA313 Method | |
Au ppm | | Samples | | Failures | | Percent Failure | |
All | | 425 | | 161 | | 38% | |
>0.1 ppm | | 198 | | 53 | | 27% | |
>0.2 ppm | | 121 | | 21 | | 17% | |
Ag_AAS12E Method | |
Ag ppm | | Samples | | Failures | | Percent Failure | |
All | | 427 | | 55 | | 13% | |
> 10 ppm | | 100 | | 8 | | 8% | |
> 20 ppm | | 65 | | 5 | | 8% | |
>30 ppm | | 47 | | 3 | | 6% | |
95
Figure 11.6: Sample Duplicate Results for Category 3 Drilling

96
Figure 11.7: Pulp Duplicate Results for Category 3 Drilling
97
Figure 11.8: Sample Duplicate Results for Development Drilling
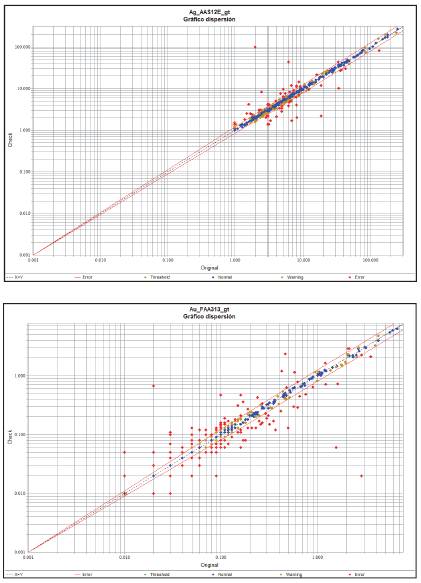
2012 Check Assays
Check sample pulps were submitted to SGS Durango during the 1st, 3rd and 4th quarters of 2012 for analysis. A total of 855 check sample results were available for review. Results for the gold check samples appear to have a slightly higher bias in the SGS AA results below 0.25 ppm. Results are shown in Table 11.8 and Figure 11.9. No lab bias is noted for the variance in silver results. However, the silver methods are comparing a fire assay gravimetric finish to an acid digestion with atomic absorption finish. These methods are not comparable and this methodology should be addressed prior to further check sample analysis. Silver results are shown in Table 11.8.
98
Table 11.8: Check Sample Results Guadalupe and La Patria Exploration Programs
Silver —(ALS) GRA21 method vs. (SGS) AAS21E method
Project | | Number Samples | | Number Samples Above
Lower Detection Limit | | % Failure
(> 10% Variance) | |
Palmarejo | | 855 | | 110 | | 57% | |
Gold (ALS) ICP21 method vs. (SGS) FAA313 method
Project | | Number Samples | | Number Samples Above
Lower Detection Limit | | % Failure
(> 10% Variance) | |
Palmarejo | | 853 | | 508 | | 60.4% | |
Figure 11.9: Check Sample Results Palmarejo Gold Analysis
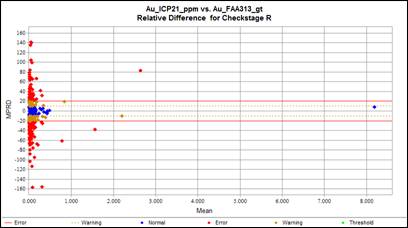
11.2.2.5 Palmarejo District QA/QC (excluding Palmarejo mine area) QA/QC Discussion and Recommendations
1. No systematic bias or accuracy problems were detected for gold or silver assays based on results from the standard samples results.
2. No contamination of the CAT3 sampling was detected from routine insertion of blank samples. Intermittent contamination during sample prep at the site laboratory was detected and reported.
3. Duplicate sampling methodology should be reviewed in 2013 for appropriateness with regards to mineralization, sample length and sample size. Sample selection for duplicate analysis should also be reviewed to provide a more representative subset of the material submitted for assay. Sampling procedures and processing should be reviewed at the laboratories in 2013.
99
4. Check assays results and sample selection methodology should be re-evaluated in 2013.
5. Check assay results will require re-assessment of the methods chosen for comparison.
11.2.2 Coeur QA/QC Summary - Guadalupe, La Patria and District Exploration Targets
The current commercial analytical lab for the Guadalupe project is ALS with sample preparation in Chihuahua, Chihuahua. A split of the prepared pulp is sent to Vancouver, B.C. for fire assay with gravimetric finish for both gold and silver. ALS complies with the international standards ISO 9001:2000 and ISO 17025:1999
ALS Preparation (ALS code: PREP-31) The entire sample is dried and crushed to > 70% passing a 2mm (10 mesh) screen. A split of up to 250g is pulverized to > 85% passing a 75 micron (200 mesh) screen.
ALS Au and Ag Analyses (ALS codes: Au-ICP21, Au-GRA21, Ag-GRA21, ME-GRA21) All assays techniques at Guadalupe and La Patria utilize an initial 30 gram charge that is digested by the fire assay method. Then the metal content is determined by different finish techniques. The GRA21 technique uses a gravimetric finish or a physical weighing of the gold and or silver bead, detection limit for Au by this finish method is 0.05 to 1,000 ppm and 5 to 10,000 ppm for Ag. QA/QC analysis over the past year has shown that commercial labs have difficulty reproducing gold values below 1 ppm with the gravimetric finish method due to the difficulty of physically weighing the small bead therefore a fire digestion followed by an ICP finish is being used for initial gold analyses and when the gold exceeds 2.0 ppm the sample is re-assayed by a fire digestion and gravimetric finish.
11.2.2.1 Earlier QA/QC Programs
QA/QC programs of 2009 and 2010 were discussed in technical reports pertaining to those years.
11.2.2.2 NCL Audit
In September 2011, NCL Ingeneria y Construccion Ltda. reviewed the database and QA/QC procedures and results for the Guadalupe and La Patria projects. Their conclusions were as follows:
The procedures established by CUU (acronym for the Exploration team at Palmarejo) are correct and according to industry standards.
Coeur Mexicana’s Exploration department is following the defined procedures in a reasonable way, nevertheless there are several aspects that may be improved.
The reports produced are reasonable in terms of contained information, nevertheless; it would be highly convenient if some opinion about the results is included, to make easier and faster the understanding of the figures for a non-specialist reader. Also these opinions may reinforce the adequate reaction to some unexpected results.
100
The number of samples used for QA/QC seems a little high in comparison with the definitions set by Coeur Mexicana and with NCL’s recommendations.
The reference to the recommended rate of insertion was taken from the QA/QC procedures and protocol document. Some of recommended rates are not clear. For example, the rates of each individual type of duplicates: field, coarse and pulp. An even number for each type was assumed in these cases. For reference, the rate of insertion usually recommended by NCL for precious metals exploration projects is also included, which could be considered as an industry average.
The number of primary samples controlled is taken from the total number of primary samples of the holes referred in the control samples log.
The actual rate of insertion is well above both NCL and Coeur recommendation rates. Although the Coeur recommendation is for minimum rates, it is not clear the reason for the difference. This rate may be reduced, saving budget and manpower, without any loss of quality.
Apparently the entire control program is focused in checking the primary lab. It is not clear if any efforts are done in relation with other labs (as established in the QA/QC protocols).
In general, the results of the QA/QC program are well stored, nevertheless some more tidiness is recommended, there are some samples without their complete information, like acceptable limits, or other. It is recommended to review and complete the missing information or, in case it is not available, to delete the incomplete samples from the database.
The numerical analysis done to the QA/QC data is adequate; the only suggestion is to introduce the use of HARD plots.
11.2.2.3 Palmarejo District QA/QC (excluding Palmarejo mine area) QA/QC Discussion and Recommendations
Review of the exploration QA/QC data did not encounter significant problems or biases for the period studied, and the assay database was found to be of acceptable quality for resource modeling.
1. QA/QC samples were inserted into the field sample stream at the proper rate of at least 1 per 20 samples or 5%.
2. All four types of QA/QC samples were inserted or completed, standards, blanks, duplicates and check assays at the proper rates of 5 +/- 0.5 % of the total field sample population.
3. No systematic bias or accuracy problems were detected for gold or silver assays based on results from the standard samples.
4. No contamination was detected from routine insertion of blank samples.
5. Duplicate samples showed good precision for silver values above 30 ppm and gold values above 2.0 ppm by the 30 gram fire assay gravimetric technique. The ICP test method is
101
being used since November 2009 to date with satisfactory output data for values below 10 ppm.
6. Check assays verified original sample values within acceptable limits for most drillholes. Further analyses should be conducted on LPDH_131 and TGDH_130.
7. When significant failures occurred within any QA/QC samples in ore zones follow up actions included re-assaying of the failed QA/QC sample and at least five field samples on both sides of the QA/QC samples were taken.
The Qualified Persons’ review of the 2011 QA/QC procedures and data did not encounter significant problems or biases for the period studied and demonstrates the assay data to be of acceptable quality for resource modeling.
11.2.2.4 QAQC Results Guadalupe, La Patria and Other Exploration Sampling 2012
The current commercial analytical lab for the Guadalupe and La Patria drilling is ALS Chemex with sample preparation in Chihuahua, Chihuahua. A split of the prepared pulp is sent to Vancouver, B.C. for fire assay with gravimetric finish for both gold and silver. ALS Chemex complies with the international standards ISO 9001:2000 and ISO 17025:1999.
The 2012 QA/QC sample program for exploration drilling within the Palmarejo District (excluding the Palmarejo Mine Resource Area) are summarized in the following section (Table 11.9). The QA/QC program carried out during 2012 at Guadalupe, La Patria and surrounding district includes Exploration Cat 2 and 3 drilling program, totaling 58,624 meters of HQ drilling in 147 core holes drilled this year and 1317 m of core re-sampling for 41 drill holes for La Patria project. 18,307 samples were included in the quality control program.
Table 11.9: Exploration QAQC Summary Palmarejo District - 2012
Summary Table | 01-Jan-2012 to 31-Dec-2012 |
LABORATORY ALS Chemex | Priority 1 |
| | | | | | | | | | | | | | | | | | | | | | | | | | | |
Results based on Return Date of the Sample Assays* | | Field Data** | |
| | | | | | # | | # | | | | | | | | | | | | | | | | | | # Field | |
| | # Holes | | # Assays | | Standard | | Standard | | % Standards | | # Blanks | | # Blanks | | % Blank | | # Dup | | # Dup | | % Dup | | # Holes | | Samples | |
Area | | Assayed | | Returned | | Ag | | Au | | Ag | | Au | | Ag | | Au | | Ag | | Au | | Ag | | Au | | Ag | | Au | | Sampled | | Collected | |
GUADALUPE | | 86 | | 8194 | | 377 | | 359 | | 4.6 | | 4.38 | | 373 | | 377 | | 4.55 | | 4.6 | | 449 | | 449 | | 5.48 | | 5.48 | | 72 | | 5637 | |
GUERRA AL TIRANO | | 5 | | 889 | | 38 | | 38 | | 4.27 | | 4.27 | | 39 | | 43 | | 4.39 | | 4.84 | | 40 | | 40 | | 4.5 | | 4.5 | | 5 | | 709 | |
LA PATRIA | | 50 | | 4365 | | 226 | | 229 | | 5.18 | | 5.25 | | 228 | | 229 | | 5.22 | | 5.25 | | 246 | | 246 | | 5.64 | | 5.64 | | 48 | | 2517 | |
LOS_BANCOS | | 8 | | 1801 | | 88 | | 88 | | 4.89 | | 4.89 | | 89 | | 86 | | 4.94 | | 4.78 | | 122 | | 122 | | 6.77 | | 6.77 | | 11 | | 1846 | |
PALMAREJO | | 35 | | 3058 | | 149 | | 148 | | 4.87 | | 4.84 | | 149 | | 147 | | 4.87 | | 4.81 | | 208 | | 204 | | 6.8 | | 6.67 | | 44 | | 4431 | |
Total | | 184 | | 18307 | | 878 | | 862 | | | | | | 878 | | 882 | | | | | | 1065 | | 1061 | | | | | | 180 | | 15140 | |
*Sample ID’s are tallied for the assays returned from the laboratory reported. Samples are only counted once, regardless of the number of assay methods returned for each sample.
**Sample ID’s taken in the field are tallied for the date range reported. Samples may not have assays returned during the time period stated.
102
2012 Standards
Six standards were used during the 2012 exploration program HGRS-01, LGRS-01, CDN.GS-5H, SP49, M-Alto y M-Bajo. No systematic bias or accuracy problems were detected for gold or silver assays based on results from all project quality control programs. Expected values of each standard are shown in (Table 11.10).
Table 11.10: Standards Used in 2012 Exploration Program
Standard | | Expected
Au Value | | Expected
Ag Value | |
HGRS-01 | | 11.7 | | 64.1 | |
LGRS-01 | | 0.025 | | 228.4 | |
CDN.GS-5H | | 3.84 | | 50.4 | |
SP49 | | 18.34 | | 60.2 | |
M-Alto | | 2.225 | | 183.03 | |
M-Bajo | | 0.648 | | 56.81 | |
Overall results from the standards are considered within acceptable limits (three standard deviations). Failures occurred in random batches and there appears to be no bias in the timing. Failure rates are outlined in table 11. 11 below. Overall performance is shown in Figures 11.10 — 11.15 for Guadalupe and La Patria results.
Table 11.11: QAQC Failure Rate for 2012 Quality Control Standards and Blanks
| | | | Au | | Ag | |
Guadalupe | | Standard | | 1.9 | % | 0.8 | % |
| Blank | | 0.5 | % | 0.1 | % |
La Patria | | Standard | | 0.3 | % | 3.7 | % |
| Blank | | 1.3 | % | 1.6 | % |
Palmarejo
(Outside Current Resource Area) | | Standard | | 1.1 | % | 8.1 | % |
| Blank | | 0.4 | % | 0.2 | % |
Other | | Standard | | 0.9 | % | 8.9 | % |
| Blank | | 0 | | 1.6 | % |
103
Figure 11.10: Guadalupe Standards ALS Chemex Silver Gravimetric Results

Figure 11.11: Guadalupe Standards ALS Chemex Gold Gravimetric Results

104
Figure 11.12: Guadalupe Standards ALS Chemex Gold ICP Results

Figure 11.13: La Patria Standards ALS Chemex Silver Gravimetric Results
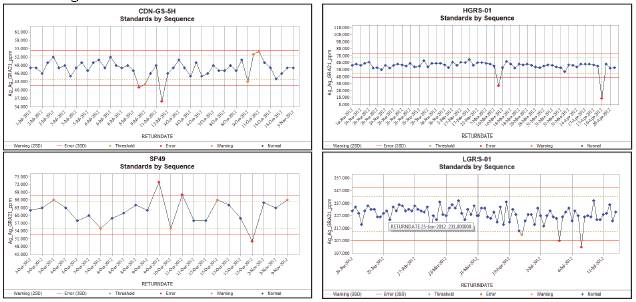
105
Figure 11.14: La Patria Standards ALS Chemex Gold Gravimetric Results
Figure 11.15: La Patria Standards ALS Chemex Gold ICP Results
2012 Blanks
During 2012, two blanks were utilized during the year. Blank 2 and Blank 3 (primary blank) were created from barren material in the Temoris area in 2010. The material was certified by round robin assay as outlined in QAQC protocols. Several inconsistent values were detected during the 1st and 2nd quarters of 2012. Appropriate measures were taken to re-evaluate the samples based on internal QAQC procedures (Coeur 2012). Blank performance is shown in Figures 11.16 — 11.17 for the Guadalupe and La Patria projects.
106
Figure 11.16: Guadalupe Blanks ALS Chemex Silver and Gold

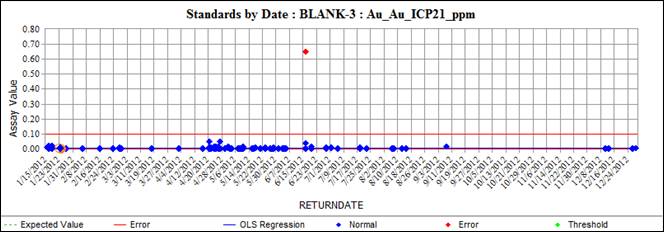
107
Figure 11.17: La Patria Blanks ALS Chemex Silver and Gold

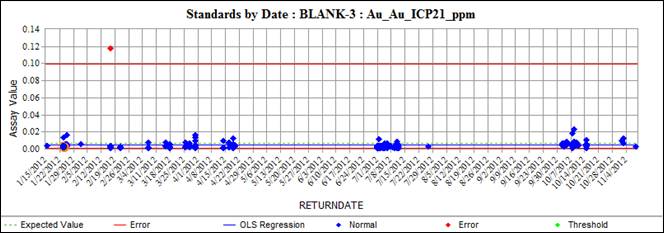
2012 Duplicates
Duplicates were primarily taken as pulp splits. Approximately 18% sample duplicates and 4% crush duplicates were analyzed for silver results and < 4% sample and < 3% crush duplicates were analyzed for gold. Results using a variance of 15% to calculate error are shown in Table 11.12. Graphic performance for duplicates taken at the Guadalupe and La Patria projects are shown in Figures 11.18 - 11.19.
108
Table 11.12: Pulp Duplicate Failure for Resource Definition Drilling (ALS Chemex)
Guadalupe Pulp Duplicates
| | Dataset | | Samples | | Failures | | Percent Failure | |
Ag_GRA21 Method | | All | | 376 | | 67 | | 18% | |
| | > 10 ppm | | 119 | | 29 | | 24% | |
| | > 20 ppm | | 84 | | 17 | | 20% | |
| | > 30 ppm | | 70 | | 10 | | 14% | |
Ag_ICP41 Method | | All | | 46 | | 12 | | 26% | |
| | > 10 ppm | | 6 | | 2 | | 33% | |
Au_ICP21 Method | | All | | 375 | | 136 | | 36% | |
| | >0.1 ppm | | 163 | | 40 | | 25% | |
| | >0.2 ppm | | 119 | | 23 | | 19% | |
La Patria Pulp Duplicates
| | Dataset | | Samples | | Failures | | Percent Failure | |
Ag_GRA21 Method | | All | | 242 | | 19 | | 8% | |
Ag_ICP41 Method | | All | | 16 | | 6 | | 38% | |
Au_ICP21 Method | | All | | 242 | | 129 | | 53% | |
| >0.1 ppm | | 107 | | 61 | | 57% | |
| >0.2 ppm | | 66 | | 35 | | 53% | |
Palmarejo Pulp Duplicates
| | Dataset | | Samples | | Failures | | Percent Failure | |
Ag_GRA21 Method | | All | | 308 | | 16 | | 5% | |
Ag_ICP41 Method | | All | | 262 | | 51 | | 19% | |
Au_ICP21 Method | | All | | 330 | | 165 | | 50% | |
| >0.1 ppm | | 37 | | 18 | | 49% | |
| >0.2 ppm | | 11 | | 6 | | 55% | |
Other Exploration Area Pulp Duplicates
| | | | Samples | | Failures | | Percent Failure | |
Ag_GRA21 Method | | All | | 192 | | 7 | | 4% | |
Ag_ICP41 Method | | All | | 152 | | 29 | | 19% | |
Au_ICP21 Method | | All | | 192 | | 98 | | 51% | |
109
Figure 11.18: Guadalupe Pulp Duplicates ALS Chemex Silver and Gold

110
Figure 11.19: La Patria Pulp Duplicates ALS Chemex Silver and Gold

111
2012 Check Assays
Check sample pulps were submitted to SGS Durango during 2012 for analysis. Majority of the check samples were sent to the laboratory late in the 4th quarter 2012 and will be reported as 2013 results. The results shown were returned in the first 3 quarters of 2012. Discuss results shown.
Table 11.13: Check Sample Results Guadalupe and La Patria Exploration Programs
Silver - Fire Assay Comparison
Project | | Number Samples | | Number Samples Above
Lower Detection Limit | | % Failure
(> 10% Variance) | |
Guadalupe | | 906 | | 352 | | 33.80% | |
La Patria | | 192 | | 46 | | 30.40% | |
Gold ICP vs Fire Assay Gravimetric Finish
Project | | Number Samples | | Number Samples Above
Lower Detection Limit | | % Failure
(> 10% Variance) | |
Guadalupe | | 896 | | 722 | | 62.70% | |
La Patria | | 188 | | 155 | | 64% | |
Gold Fire Assay Gravimetric Finish Comparison
Project | | Number Samples | | Number Samples Above
Lower Detection Limit | | % Failure
(> 10% Variance) | |
Guadalupe | | 896 | | 722 | | 62.70% | |
La Patria | | 21 | | 20 | | 65% | |
112
Figure 11.20: Gaudalupe Check Samples ALS Chemex vs. SGS
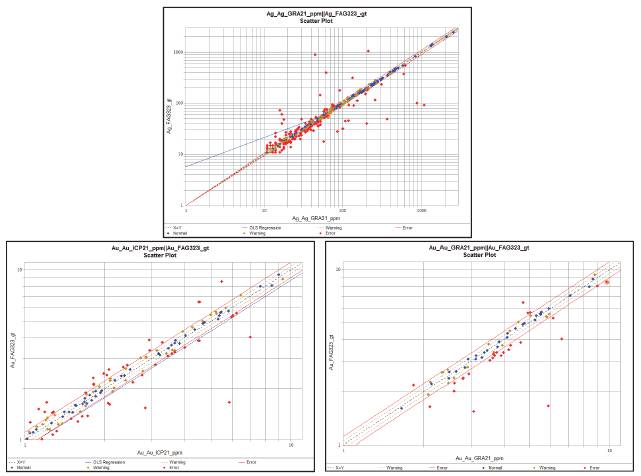
Figure 11.21: La Patria Check Samples ALS Chemex vs. SGS
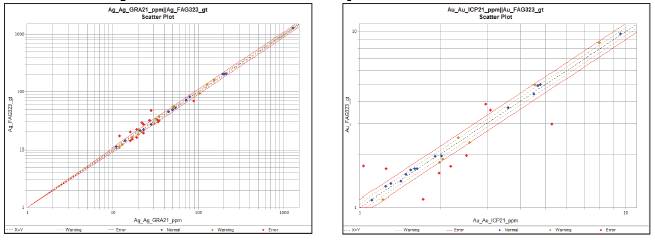
113
11.2.2.5 Palmarejo District QA/QC (excluding Palmarejo mine area) QA/QC Discussion and Recommendations
1. A total of 944 samples from 27 laboratory batches across all exploration projects were rejected and re-run during 2012 based on failure of standards and blanks as required by the QAQC guidelines for exploration. Protocols were followed.
2. No systematic bias or accuracy problems were detected for gold or silver assays based on results from the standard samples.
3. Duplicate sampling methodology should be reviewed in 2013 for appropriateness with regards to mineralization, sample length and sample size. Sample selection for duplicate analysis should also be reviewed to provide a more representative subset of the material submitted for assay. Sampling procedures and processing should be reviewed at the laboratories in 2013.
4. Check assays results and sample selection methodology should be re-evaluated in 2013.
5. The check assay laboratory will be changed in 2013 from SGS to ACME. ACME will provide more compatible analytical methods to the ALS Chemex methods.
114
SECTION 12 - DATA VERIFICATION
All Palmarejo District exploration and production data is loaded into an acQuire™ Geoscientific Information Management System (GIMS) database. Data is exported from acQuire and loaded into Gemcom for modeling. QAQC and auditing are completed during data collection and after export to Gemcom.
Drill hole data is also reviewed after import into Gemcom using the included Data Validation utilities. This validation utility reviews the database tables for logic errors: data beyond the end of hole, overlapping sample or geology intervals etc.). This utility was used to verify all new drill hole data added since the last resource models were completed for the projects covered in this report. No significant logic errors were found; the few inconsistent sample and geology intervals identified were due to rounding on export from acQuire™ and import to Gemcom.
12.1 Assays
12.1.1 External Audit of Assays in AcQuire
In December, 2010, Mine Development Associates of Reno, Nevada conducted an audit of primary assay results loaded to the acQuire database system for exploration and production of the Palmarejo property (Avery, 2010). Of the assay certificates loaded to the Exploration database for Guadalupe, La Patria and all other areas not including the Palmarejo minesite, 9.3% were evaluated. The same audit was conducted for the Palmarejo mine and included 4.6% of the assay certificates loaded to the Palmarejo mine site database. MDA received the original assay certificates directly from the laboratory (SGS Durango or ALS Chemex). Table 12.1 shows the results of the assay certificate audit.
Table 12.1: MDA Assay Certificate Audit Results
| | DATABASE | |
TEST | | Production | | Exploration | |
Certificates Requested | | 199 | | 164 | |
Certificates Requested but not supplied | | 12 | | 1 | |
Total Sample Intervals Imported for Audit | | 5729 | | 15165 | |
Total Sample Intervals QA/QC | | 1227 | | 609 | |
Total Sample Intervals compared | | 4422 | | 7723 | |
Sample Intervals with differing values | | 2 | | 0 | |
Received Certificates not completely imported into acQuire | | 6 | | | |
MDA also conducted a brief review of all the data available in both databases. No significant problems were found. Minor issues were checked and corrected by the geology staff.
NCL Ingenieria y Construccion Ltda. of Santiago, Chile conducted external audits of the acQuire database and field procedures in 2011 for Guadalupe and La Patria exploration. This audit did
115
not review assay results or compare stored records against laboratory certificates. QAQC results and protocols were reviewed and the results deemed acceptable.
External audits of the databases were not conducted in 2012.
12.1.2 Internal Assay Validation
Starting in 2008 all assay data is imported to the acQuire™ database from original lab electronic certificates. Prior to this a similar import process was used to populate a Datashed™ SQL database. Assays are assigned a priority ranking based on QAQC results, test method and assay laboratory; the acceptable assays are exported from acQuire for use in resource estimates.
12.2 Palmarejo
Review of assay certificates was not completed prior to modeling. All data was verified utilizing Gemcom verification tools. Data was reviewed for overlapping intervals, missing intervals and completeness.
12.3 Guadalupe
Assays
The portion of the data in the acQuire database to be used for the Guadalupe resource estimation were validated against original laboratory certificats. This database was submitted by Coeur Mexicana as separate excel sheets.
The assay results of the electronic laboratory certificates were compared to the those of the database. For that reason the assay certificates were sorted in sequence and every thenth lab certificate was selected to be checked. This yielded 49 certificates to be examined (Table 12.2) with a total of 3,188 assays (including standards, duplicates and blanks). No errors were encountered.
Table 12.2: Guadalupe Laboratory Certificates Selected for Verification
CH06023398 | | CH06041012 | | CH06064453 | | CH06089135 | | CH06111371 |
CH06131730 | | CH07005764 | | CH07019207 | | CH07040363 | | CH07049234 |
CH07060325 | | CH07063197 | | CH07071592 | | CH07082178 | | CH07091839 |
CH07098570 | | CH07101637 | | CH07107788 | | CH07124689 | | CH07135226 |
CH07150522 | | CH08079404 | | CH08120072 | | CH08144342 | | CH08153203 |
CH08176544 | | CH09029964 | | CH09040087 | | CH09053610 | | CH09057685 |
CH09127810 | | CH09143547 | | CH10061899 | | CH10080833 | | CH10112215 |
CH10132093 | | CH10183205 | | CH10187549 | | CH11180612 | | CH11227808 |
CH11238564 | | CH11251962 | | CH11259614 | | CH12030668 | | CH12080690 |
CH12092512 | | CH12097158 | | CH12114877 | | DU18725 | | |
116
12.4 La Patria
Review of assay certificates was not completed prior to modeling. All data was verified utilizing Gemcom verification tools. Data was reviewed for overlapping intervals, missing intervals and completeness.
Internal Validation of Collar and Downhole Survey Data
Collar elevations for the Guadalupe property were checked against the topographic surface and a multitude of collars were found to be outside of reasonable ranges (i.e. sticking out of the topo surface for more than 15 meters or laying considerably below it).
Enrique Fuentes, Senior Geologist, Coeur Mexicana Exploration replaced the provided topography with a more detailed one and most of the holes fell into place. Slight adjustments were made to those surface locations that needed additional modifications before it was used for resource estimation.
From August 31 to September 1st, 2011, 68 La Patria drillhole collars and 21 Guadalupe drillhole collars were re-surveyed in the field to verify locations. A review of the coordinate data and field inspection of sites determined the original survey locations were accurate. Three additional drillhole collars were identified for field verification during the 2012 modeling process.
Table 12.3: Guadalupe Drillholes Selected for Collar Verification
TGDH_87 | | TGDH_399 | | TGDH_329 | | TGDH_315 |
TGDH_407 | | TGDH_398 | | TGDH_326 | | TGDH_086 |
TGDH_405 | | TGDH_397 | | TGDH_325 | | TGDH_085 |
TGDH_404 | | TGDH_396 | | TGDH_322 | | TGDH_023 |
TGDH_401 | | TGDH_330 | | TGDH_320 | | TGDH_012 |
TGDH_400 | | | | | | |
Table 12.4: La Patria Drillholes Selected for Collar Verification
LPDH_012 | | LPDH_053 | | LPDH_122 | | LPDH_135 | | LPDH_146 | | LPDH_157 | | LPDH_167 |
LPDH_016 | | LPDH_069 | | LPDH_123 | | LPDH_136 | | LPDH_147 | | LPDH_158 | | LPDH_168 |
LPDH_019 | | LPDH_070 | | LPDH_124 | | LPDH_137 | | LPDH_148 | | LPDH_159 | | LPDH_169 |
LPDH_020 | | LPDH_071 | | LPDH_125 | | LPDH_138 | | LPDH_149 | | LPDH_160 | | LPDH_170 |
LPDH_021 | | LPDH_072 | | LPDH_126 | | LPDH_139 | | LPDH_150 | | LPDH_161 | | LPDH_171 |
LPDH_036 | | LPDH_073 | | LPDH_127 | | LPDH_140 | | LPDH_151 | | LPDH_162 | | LPDH_172 |
LPDH_037 | | LPDH_075 | | LPDH_128 | | LPDH_142 | | LPDH_152 | | LPDH_163 | | LPDH_173 |
LPDH_044 | | LPDH_081 | | LPDH_131 | | LPDH_143 | | LPDH_153 | | LPDH_164 | | LPDH_174 |
LPDH_047 | | LPDH_085 | | LPDH_133 | | LPDH_144 | | LPDH_154 | | LPDH_165 | | |
LPDH_048 | | LPDH_087 | | LPDH_134 | | LPDH_145 | | LPDH_155 | | LPDH_166 | | |
117
12.4.1 Internal Geology Validation
A review of the La Patria geology was conducted by comparing core photos (diamond drill holes only) against electronically stored data plotted in section. Lithology, veining and mineralization were compared. A recommendation was made in July 2012 to re-log all historic RC drillholes and all remaining coreholes completed prior to 2010. This recommendation is based on standardization of the logging. An additional 80 intervals from 47 drillholes were indentified for sampling within stockwork and mineralized host material to better define the extent of mineralization. Other recommendations with regard to geology include logging of an oxidation-reduction boundary for each drillhole and documenting classification of vein-stockwork-mineralized host material based on vein density and width.
12.5 Site Visit
Site visits to Guadalupe and La Patria were conducted by Qualified Persons and staff geologists from Coeur’s corporate Exploration and Technical Services departments in 2012. A review of drilling, site preparation, sampling, geologic logging and sample storage conditions was conducted. All was found to be in good order and followed exploration procedure guidelines.
118
SECTION 13 - MINERAL PROCESSING AND METALLURGICAL TESTING
13.1 Historic Third Party Test Programs Summary
Six test work campaigns have been conducted over a two year period, between the end of 2003 and the end of 2005. Two campaigns were carried out by Ammtec Ltd and four by SGS Lakefield Oretest, with both of the laboratories being located in Perth, Australia. In addition to these main campaigns, additional test work has been run by laboratories at Electrometals Technologies Limited and Outokumpu. Cytec (2005) have also conducted additional flotation reagent test work at the SGS Lakefield Oretest laboratory. A brief summary of each campaign is given below. Test-work and the method, selection and size of samples used in the various test programs were designed to accurately represent the characteristics and metallurgical behavior of the ore body. Results are considered to be consistent. Criteria upon which the process plant was designed and is currently being constructed were based on the results of this test program.
Ammtec Campaign — January 2004.
Two RC drill samples tested, PMDH 002, 003 & 004.
Head assays of each sample and mineralogy investigation.
Direct ore leach, gravity and leaching of concentrates and tailings and flotation and leaching on flotation concentrate and tailings. The flotation and leach gave the highest recovery.
SGS Lakefield Oretest Campaign — 9609, December 2004.
One Diamond ore sample, PMDH 070D
Five diamond waste samples, PMDH 56D, 58D, 59D, 68D & 78D.
ARD and UCS tests were done on ore and waste samples.
Head assays of ore sample and mineralogy investigation.
Crushing Work Index, Abrasion Index, Bond Rod Mill Work Index and Bond Ball Mill Work Index on ore sample (PMDH 070D).
Sighter and bulk flotation tests on ore sample. Investigate optimum reagent selection, grind size sensitivity.
Cyanide leach testing of whole ore sample, flotation concentrate and tailings
SGS Lakefield Oretest Campaign — 9632, May 2005
Four RC drill samples tested, PMDH 6, 22, 35, 76.
Master composite made from all of drill holes.
A sighter flotation test and three cleaner flotation tests were conducted on the master composite.
A pilot plant was run to produce a rougher concentrate, scavenger concentrate and scavenger tailings products. Leaching of the rougher, scavenger and tailings products was done to confirm recovery and to produce leach liquor for electrowinning test work. Rougher and scavenger concentrate were filtered to allow preliminary sizing of filter required for this duty.
119
Ammtec Ltd Campaign — A9848, September 2005
Two bulk underground samples tested, sample ‘Q’ being a quartz vein breccia and sample ‘S’ being a stockwork sample.
Advanced media competency testing was done on each sample.
SGS Lakefield Oretest Campaign — 9745, December 2005
Three diamond drill samples tested, PMDH 078D, 115D, 125D. A surface outcrop sample was also received, labeled “Hall’s Clavo” (now referred to as Chapotillo).
Comminution testing on the four samples including JK Drop Weight and SMC tests, UCS tests, Bond Rod, Ball and Abrasions tests and Impact Crushing tests.
Master composite made from three diamond drill holes.
Six batch rougher flotation test and two cleaner flotation tests were conducted on the master composite, followed by a locked cycle flotation test.
Fifteen large scale batch flotation test of master composite sample, to produce large sample of flotation concentrate and tailings for downstream testing.
Leaching optimization tests for flotation concentrate and tailings samples.
Oxygen uptake tests on both concentrate and tailings samples.
Variability flotation testing in conjunction with cyanide testing of flotation concentrate and tailing samples.
Zinc precipitation test work. Cyanide detoxification test work, including both batch and continuous tests.
Slurry viscosity test work.
SGS Lakefield Oretest Campaign — 9772, December 2005
Two diamond drill samples tested, PMDH 280D and 340D. ‘Q’ sample used for comminution test work at Ammtec (A9848) was also tested.
Comminution testing on the two diamond drill samples including JK Drop Weight and SMC tests, Bond Rod, Ball and Abrasions tests.
Cleaner flotation tests were conducted on all three samples.
Variability flotation testing in conjunction with cyanide testing of flotation concentrate and tailing samples for each of the three samples.
Master composite made from 340D drill hole and Q sample.
Batch flotation test done on master composite.
A pilot plant was run to produce a cleaner concentrate and scavenger tailings products. Leaching of the cleaner and tailings products was done to confirm recovery and to produce leach liquor for electrowinning test work. Leached concentrate and tailings samples sent for thickening test work and also tailings geochemical and geotechnical testing.
Cyclic carbon loading tests were done on flotation tailings sample.
Outokumpu Technologies Pty Ltd — S559TA, July 2005
Flotation concentrate and tailings samples tested.
120
Outokumpu Technologies Pty Ltd — December 2005
Leached flotation concentrate sample and final tailings sample (leached flotation concentrate and leached flotation tailings combined) tested.
Electrometals Technologies Ltd — November 2005
Two solutions produced from pilot plant flotation trials were sent for electrowinning testing. The first was tested in April 2005 and the second in November 2005.
Cytec Mining Chemicals — December 2005
Twenty batch cleaner flotation tests on a sample of the master composite prepared in the SGS campaign 9772. This was made up of material from drill holes 340D and Q sample. Testing included alternative reagents and grinding procedures to optimize flotation response.
13.2 Palmarejo Metallurgical Test work Summary
Sample Selection
A total of 13 drill holes sample have been tested along with three bulk samples. The drill holes sample consist of seven reverse circulation (RC) drill holes and six diamond drill holes. The bulk samples consist of two underground samples taken from the existing workings from the La Prieta structure and one surface outcrop sample from the Chapotillo Clavo.
The total mass of samples tested is 2,394 kg from all of the sample sources and for nine of the drill holes, the total intersection length tested is 253.5 meters (Table 13.1).
121
Table 13.1: Samples Tested
| | Drill Intersection | | Intersection
Tested | | Sample | |
| | From | | To | | Total | | Weight | |
Sample Source | | m | | m | | m | | kg | |
PMDH 002 RC | | 19.8 | | 29 | | 9.2 | | 55 | |
PMDH 003 RC | | 18.3 | | 24.4 | | 6.1 | | 44.5 | |
PMDH 004 RC | | 86.9 | | 91.5 | | 4.6 | | 33.8 | |
PMDH 070 D | | 102 | | 161 | | 35 | | 71.1 | |
PMDH 006 RC | | | | | | | | 209 | |
PMDH 022 RC | | | | | | | | 74 | |
PMDH 035 RC | | | | | | | | 176 | |
PMDH 076 RC | | | | | | | | 84 | |
PMDH 078 D | | 322.22 | | 347.65 | | 25.4 | | 58.2 | |
PMDH 115 D | | 34.15 | | 65.01 | | 30.9 | | 57.7 | |
PMDH 125 D | | 151.1 | | 179.5 | | 28.4 | | 58.2 | |
PMDH 280 D | | 192.15 | | 226.34 | | 15.8 | | 80 | |
PMDH 340 D | | 9.6 | | 196.9 | | 98.1 | | 523 | |
Chapotillo (formerly Hall’s Clavo) — Surface Sample | | | | | | | | 27.4 | |
‘Q’ — Underground Sample | | | | | | | | 500 | |
‘S’ — Underground Sample | | | | | | | | 400 | |
TOTAL | | | | | | 253.5 | | 2393.7 | |
Comminution Test Work
Comminution test work has been carried out on all six diamond drill holes sample as well as the three bulk samples from both the surface and underground sampling. This testing has included Unconfined Compressive Strength (UCS) determinations, Crushing Work Index (CWi) determinations, Apparent Relative Density (ARD) determinations, Bond Rod, Ball and Abrasion Index (BRWi, BBWi, Ai) determinations, JK Drop Weight determinations, JK SMC determinations, Advanced Media Competency Work Index determinations. A summary of the comminution test work is provided in Table 13.2.
122
Table 13.2: Comminution Test work Summary
| | Ore Type | |
Ore Parameter | | Quartz
Vein
Breccia | | Amygdaloidal
Andesite | | Footwall
Sediments | | Oxide | | Blended
Ore | |
UCS | | | | | | | | | | | |
- Low (mPa) | | 56.3 | | 41.1 | | 66.9 | | — | | — | |
- High (mPa) | | 180.1 | | 96.4 | | 167 | | — | | — | |
- Average (mPa) | | 133.4 | | 62.6 | | 126.5 | | — | | — | |
CWi (kWh/t) | | 8.6 | | 15 | | 8.6 | | 5 | | 10.8 | |
SG | | 2.63 | | 2.65 | | 2.52 | | 2.5 | | — | |
Abrasion Index | | 0.393 | | 0.163 | | 0.389 | | — | | — | |
BRWi (kWh/t) | | 17.0 | | 18.1 | | 19.2 | | 10 | | 17.2 | |
BBWi (kWh/t) | | 18.9 | | 19.0 | | 19.4 | | 10 | | 18.2 | |
A | | 70 | | 62.5 | | 67 | | — | | — | |
B | | 0.59 | | 0.54 | | 0.66 | | — | | — | |
A x b | | 41.1 | | 31.9 | | 44.2 | | — | | — | |
Ta | | 0.34 | | 0.45 | | — | | — | | — | |
AMC, Indicative Energy (kWh/t) | | 3.65 | | 3.01 | | — | | — | | — | |
A review of the results indicate that the ore is quite hard and also quite variable for all of the major ore types with the Bond Rod Work Index varying between 15.1 and 21.8 kWh/t, and up to 26.2 for the Jasper Breccia, which is not a major ore source. The Bond Ball mill work index varied between 17.1 and 20 kWh/t, and up to 24.9 for the Jasper Breccia. Abrasion index varied between 0.1126 and 0.4528, and up to 0.7297 for the Jasper Breccia.
The JK SMC tests gave some very hard figures for the amygdaloidal andesite samples when tested, with the hardest A x b figure of 24.9 and an average of 31.9. This indicates a very hard competent material that is close to the limit for SAG milling. However, the JK Drop Weight test on the identical amygdaloidal sample that was the hardest gave an A x b figure of 39.9. As the JK Drop Weight test is carried out on whole core samples (as compared to the ¼ core samples tested in the JK SMC test) this indicates that the material may not be as hard as the SMC tests indicate. However, the averages of the JK SMC and JK Drop Weight tests have been used in the design of the milling circuit.
The quartz vein breccia samples and other footwall sediments tested gave higher average figures for the A x b figures of 41.1 and 44.2 respectively. The higher figures for the A x b for these samples indicate that these materials are softer than the amygdaloidal andesite.
All of the comminution data has been forwarded to Orway Mineral Consultants Pty Ltd (OMC) for analysis and comminution circuit modeling. The modeling consists of determining the ore parameters for each major ore type to be treated in the milling circuit. Each ore type is then modeled along with the expected ore blend that the circuit is projected to handle. A draft report from OMC has been received following their study of the results.
123
Flotation Test Work
Early test work programs tested the different circuit configurations to maximize silver and gold recovery and included whole ore leaching, gravity concentrations followed by leaching of the concentrate and tailings and finally flotation followed by leaching of the flotation concentrate and tailings. This early test work indicated that the best recovery was achieved by flotation followed by leaching. Silver recovery from these tests increased from 45% for the whole ore leach to 81.1% for gravity followed by leaching and 90.2% for flotation and leaching. The corresponding gold recoveries were 82.5%, 93.7% and 96.0% respectively. The whole ore leaching did not include any lead nitrate addition whereas all other tests did and as such the whole ore recoveries would probably be higher for silver with the addition of lead nitrate. A summary of the different process routes tested is provided in Table 13.3.
Table 13.3: Different Process Route Test work Summary
| | Calculated
Head (g/t) | | Recovery to
Conc. (%) | | Overall
Recovery 48 hr.
(%) | |
| | Au | | Ag | | Au | | Ag | | Au | | Ag | |
*Direct Leach | | 6.29 | | 861 | | — | | — | | 82.51 | | 44.95 | |
Gravity / Leach | | 6.64 | | 865 | | 13.5 | | 14.49 | | 93.73 | | 81.19 | |
Float / Leach | | 6.49 | | 900 | | 76.96 | | 78.06 | | 96.00 | | 90.16 | |
*No lead nitrate addition
Subsequent test work campaigns have concentrated on optimizing the flotation circuit configuration and reagent selection. Early flotation test work indicated high flotation recoveries into a rougher concentrate with a mass pull to concentrate of 6 to 10 % (average 9.5%) and recoveries of between 77 to 89% for both silver and gold. Due to these high recoveries flotation tests were carried out to try to obtain a ‘throw away tail’ from flotation, i.e. that the flotation tailings could be sent straight to the tailings dam. Tests that were included were gravity, followed by flotation and finally controlled potential sulfidization and flotation. This test did not result in a tail that was low enough grade to be discarded, so this approach was not pursued further.
Flotation test work then concentrated on the best option for handling the rougher concentrate following cyanide leaching. Test work on early rougher concentrates indicated that the concentrate contained a considerable quantity of fine material that generated difficulties with settling and filtration of this product. A number of cleaner tests were carried out to see if the concentrate could be cleaned to a lower mass pull and higher grade product that could be more easily handled after leaching. The cleaner test work indicated that the mass pull could be reduced to between 1.1% to 5.3%, and an average of 3.6%, with considerably higher grades also achieved. The silver and gold recovery was found to drop only marginally and the resulting product was found to settle better than the rougher concentrate. Silver and gold recoveries were lower than the rougher only flotation but averaged 79.1% for gold and 80.9% for silver.
124
Following the batch flotation test work to optimize the circuit configuration and reagent selection and dosage a locked cycle tests was carried out on a master composite sample that had been prepared from drill holes numbers 078D, 115D and 125D. This test was carried out for seven cycles and gave a mass pull of 5.3% and gold and silver recoveries of 92.0% and 85.1% respectively.
Two pilot plant flotation runs were conducted. The first was conducted on four RC drill holes samples with the primary objective to produce a flotation concentrate that could be leached and the resulting liquor separated from the solids and then sent for electrowinning testing. The flotation circuit included only roughing and scavenging, with no cleaner stage. This pilot produced a high mass pull to concentrate (17.2%) and relative low silver and gold grades in the concentrate, 25 g/t gold and 2,297 g/t silver.
The second pilot tests was carried out on combined samples from diamond drill hole 340D and bulk underground sample ‘Q’. The flotation circuit consisted of rougher flotation followed by a cleaner stage. The flotation circuit initially ran well with control samples indicating high grade concentrate and low tailings grade, however after a number of hours it became apparent that a circulating load of fine gangue material had built up in the circuit which finally reported to the cleaner concentrate. This resulted in a high mass pull of cleaner concentrate which was low grade. This has highlighted the need to monitor the circulating load in the cleaner circuit at site and also contingency has been made to feed the cleaner tail at different points within the rougher circuit.
As the primary objective of the pilot program was to again produce a leached solution for electrowinning testing, it was decided to re-clean the cleaner concentrate by pumping the concentrate through the cleaner cell again, after the pilot trial was complete. This cleaning increased the concentrate grades to 23.7 g/t gold and 3,170 g/t silver. This concentrate was leached, the solids were removed and the clear solution sent for electrowinning testing. A summary of the batch rougher tests, cleaner flotation tests, locked cycle testing and pilot plant tests are given in Table 13.4.
Table 13.4: Flotation Test work Summary
| | | | Flotation | |
| | | | | | | | Conc | | | | Conc | | �� | |
| | Head Grade | | Wt | | Au | | Au | | Ag | | Ag | |
| | Au | | Ag | | Rec | | Grade | | Rec | | Grade | | Rec | |
Test Type | | (g/t) | | (g/t) | | (%) | | (g/t) | | (%) | | (g/t) | | (%) | |
Rougher Flotation | | 5.3 | | 421 | | 9.5 | | 52.3 | | 89.1 | | 4149 | | 85.7 | |
Cleaner Flotation | | 3.41 | | 217 | | 3.6 | | 78.6 | | 79.1 | | 6274 | | 80.9 | |
Locked Cycle Test (7 cycles) | | 6.01 | | 306 | | 5.3 | | 105 | | 92 | | 4967 | | 85.1 | |
Pilot Trial 1 | | 8.26 | | 560 | | 17.2 | | 25 | | 89 | | 2297 | | 87 | |
Pilot Trial 2 | | 1.04 | | 132 | | 16.5 | | 5.1 | | 81.3 | | 670 | | 83.7 | |
Pilot Trial 2 (Re-cleaned Conc.) | | 1.04 | | 132 | | 3.1 | | 23.7 | | 70.6 | | 3170 | | 74.4 | |
125
Leaching Test Work
Leaching test work has been carried out on all flotation concentrate and tailings samples that have tested for the entire major test work campaigns. Leaching of the concentrate indicated that high cyanide levels (initially 5%) were required to ensure high silver and gold recoveries. Latter cyanide optimization tests were carried out on flotation concentrates with and without the addition of oxygen. The tests indicate that the optimum cyanide level was 5% if air is added to the slurry. However the cyanide concentration could be lowered to 1% if the slurry is sparged with oxygen. The majority of concentrate leaches achieved silver and gold recoveries in excess of 97%, although one variability test on drill hole 078D only achieved concentrate leach recoveries of 44.4% for silver and 94.4 % for gold. This was a high grade sample and the leach curves from this test indicate that the silver leaching was still going and that a higher cyanide concentration may be required to increase the leaching rate for this test. This is supported as the master composite that was made up from drill holes 078D, 115D and 125D achieved 97.9% silver recovery on the concentrate leach. A summary of the leaching results for the flotation concentrate and tailings is given in Table 13.5.
Table 13.5: Leaching Test work Summary
| | | | Leaching | |
| | | | | | | | Residue | | | | Residue | | | |
| | Grades | | Wt | | Au | | Au | | Ag | | Ag | |
| | Au | | Ag | | Rec | | Grade | | Rec | | Grade | | Rec | |
Test Type | | (g/t) | | (g/t) | | (%) | | (g/t) | | (%) | | (g/t) | | (%) | |
Average all leach tests | | | | | | | | | | | | | | | |
Flotation Concentrate | | 69.1 | | 7456 | | 4.7 | | 1.74 | | 97.8 | | 765 | | 92.7 | |
Flotation Tailings | | 1.09 | | 68 | | 95.3 | | 0.23 | | 84.0 | | 21 | | 72.3 | |
Calculated Feed | | 3.83 | | 330 | | 100 | | 0.29 | | 93.2 | | 51 | | 87.9 | |
| | | | | | | | | | | | | | | |
Average all leaching tests excluding 078D variability test | | | | | | | | | | | | | | | |
Flotation Concentrate | | 57.0 | | 6945 | | 4.7 | | 0.86 | | 98.2 | | 142 | | 97.5 | |
Flotation Tailings | | 0.74 | | 52 | | 95.3 | | 0.09 | | 85.6 | | 15 | | 71.7 | |
Calculated Feed | | 2.93 | | 300 | | 100 | | 0.13 | | 94.0 | | 25 | | 91.7 | |
The leaching of the flotation tailings samples generally gave lower leach recoveries than achieved from the concentrate samples, as would be expected. The average leach recoveries were 84% for gold and 72.3% for silver. Recoveries were quite variable, which is partly due to the head grades treated, but varied between 55 and 96.6%.
The overall leaching recoveries from both the concentrate and tailings leaches were 93.2% for gold and 87.9% for silver. However, again if the 078D variability sample is excluded, then gold recovery is 94.0% and silver recovery is 91.7%.
126
The reagent consumption for the flotation concentrate leach tests was 19.9 kg/t and 0.59 kg/t lime. The highest cyanide consumption figure for the concentrate leach was 54.2 kg/t and the lowest 0.31 kg/t. The average dropped when the lower cyanide concentration was used in conjunction with the oxygen and appears to be around 10 kg/t.
The reagent consumption for the flotation tailings leach tests was 0.71 kg/t and 1.21 kg/t lime. The highest cyanide consumption figure for the tailings leach was 1.64 kg/t and the lowest 0.33 kg/t. The combined reagent consumption for the tests results in a consumption of 1.26 kg/t cyanide and 1.16 kg/t lime.
Cyanide Destruction Test Work
Cyanide destruction test work has been carried out on the master composite sample that was produced from drill holes 078D, 115D and 125D, in test campaign 9745. Approximately 100 kg of master composite sample was treated through a 7 kg batch flotation cell to produce a cleaner flotation concentrate and a tailings sample, both of which were used for the destruction test work. Only the Inco SO2/air system was assessed, as this is considered the most cost effective technique. The results of all of the cyanide destruction test work are given in Table 13.6.
Table 13.6: Cyanide Destruction Test work Summary
| | | | | | Destruction Results | |
| | | | | | | | | | Tail+ | | | | | |
| | | | | | Feed | | | | 48hr | | | | | |
| | Test Conditions | | CN | | Tail CN | | CN | | Lime | | | |
| | Density | | Na2S2O3 | | WAD | | WAD | | WAD | | Addn | | | |
Test Run | | % | | % | | mg/l | | mg/l | | mg/l | | kg/t | | pH | |
Batch Test 1 | | 45 | | 115 | | 870 | | 126 | | 110 | | 0.99 | | 9.0 | |
Batch Test 2 | | 45 | | 140 | | 870 | | 174 | | 170 | | 1.24 | | 9.2 | |
Batch Test 3 | | 45 | | 165 | | 870 | | 126 | | 120 | | 1.24 | | 9.1 | |
Batch Test 4 | | 42.5 | | 143 | | 210 | | 4 | | 2 | | 0.33 | | 8.4 | |
Batch Test 5 | | 42.5 | | 190 | | 210 | | 2 | | 5 | | 0.35 | | 8.4 | |
Batch Test 6 | | 37.5 | | 139 | | 170 | | 4 | | 7 | | 0.26 | | 8.4 | |
Continuous Test 1 | | 42 | | 165 | | 265 | | 2 | | 0.6 | | 2.8 | | 8.4 | |
Continuous Test 2 | | 42 | | 150 | | 265 | | 1.7 | | 0.6 | | 1.7 | | 8.5 | |
The method used to prepare the sample for testing was quite involved due to the nature of the circuit design. This method included leaching a sample of flotation concentrate for 48 hours to simulate the concentrate leach circuit in the plant. Carbon was added for the last four hours to remove the silver and gold from solution. At the completion of the leaching, the carbon was removed from the slurry and the slurry was then added to tailings slurry at the correct mass split as was produced during the flotation process. This combined slurry was then leached for 24 hours, with carbon added for the last four hours to remove the silver and gold from solution. The
127
carbon was then removed from the slurry and flocculant was added to the slurry and the slurry was allowed to settle overnight. The excess clear solution was then removed from the slurry (to simulate the tailings thickener) and then fresh water was added to the slurry to reduce the density back to the density required for destruction test work. The destruction test work was now commenced on this slurry.
Cyanide destruction test work included six batch tests and two semi continuous tests. The batch testing was done in two separate phases, with the aim being to define the conditions required for the semi-continuous tests. The first phase of batch testing was done when the cyanide concentration to be used in the concentrate leach was 5%, which resulted in a feed to cyanide destruction of 870 mg/l CN wad and a CN total of 1100 mg/l. The testing of this slurry was done at a solids density of 45% w/w solids, pH was maintained at 9.0 and metabisulphite additions were tested at 115, 150 and 165% of the stoichiometry requirement. These tests reduced the cyanide wad level to only 126 mg/l and did not achieve the target level of 10 mg/l.
It was noted that during the tests that the viscosity of the slurry increased dramatically during the test and it is believed that this had a significant impact on the final destruction. It was also felt that a lower pH of the slurry would help with the process.
Subsequent to the first phase of testing, cyanide optimization test work had been carried out on the flotation concentrate sample. This optimization resulted in the addition of oxygen to the concentrate and a reduction in the cyanide concentration to 1%. The second phase of testing was done at the lower cyanide level in the concentrate leach and also was planned to study the effect of pulp density on cyanide destruction. The feed slurry to the test work was now at a lower cyanide concentration of 240 mg/l wad cyanide. Three tests were done with two tests to be done at a target density of 40% solids and one at 35% solids. The two tests at 40% solids were to be done at a target of 150 and 200% metabisulphite stoichiometry and the 35% solids at 150% metabisulphite stoichiometry. The density of the tests was found to be higher than planned, at 42.5 and 37.5%, however all three of the tests decreased the wad cyanide level below the target value of 10 mg/l.
A final large slurry sample was produced to allow two semi-continuous tests to be carried. These tests were done to confirm the conditions determined from the batch test work and to confirm final cyanide levels in the resultant slurry. Both tests were done at 42% solids, maintained the pH between 8.0 and 8.5, had a residence time of 70 minutes and tested the metabisulphite stoichiometry at 150 and 165%. Both tests gave cyanide wad levels of less than 10 mg/l and were in fact less than 2 mg/l.
Electrowinning Test Work
Two solutions were produced from the two pilot plant trials that were conducted at the SGS Lakefield Oretest laboratory. The first solution was produced from a rougher concentrate product that was leached with a 5 % cyanide concentration leach in April 2005. The solution produced contained approximately 1000 ppm silver and 10.3 ppm gold with 5% cyanide. This
128
solution indicated that the silver would form plate at the higher concentration and then powder as the silver concentration dropped below 300 ppm.
The second solution was produced from a flotation cleaner sample produced from the second pilot trial and leached at 1% cyanide in November 2005. This solution contained approximately 1900 ppm silver and 18.2 ppm gold. This solution produced silver powder for the full range of testing and indicated a higher production rate per cell than the first solution tested.
The second solution produced is expected to be more representative of the solution that will be processed at site. This is for a number of reasons, which are given below:
The concentrate used to produce the second solution was cleaned in the flotation circuit to remove excess gangue material prior to leaching.
The cyanide concentration of the leach was at the planned level of 1%, not 5% as in the first solution.
Electrometals Technologies have used the results from the second solution testing for sizing the required electrowinning circuit. The advantage of being able to use the powder cells is that this style of cell can be automated and the powder can be collected in a filter. This helps in security of the product as well as minimizing the workforce required to work in the refinery area.
Electrometals have produced two reports that summarize the test results. These reports are titled “Summary Report: Silver Electrowinning from a Cyanide Electrolyte using EMEW®”, November, 2005 and “Summary Report: Electrowinning a Synthetic Palmarejo Electrolyte”, January 2006.
Settling Test Work
Two settling test work campaigns have been done by Outokumpu Technologies at their laboratory. The first was done on samples produced from the master composite sample made from drill holes numbers 078D, 115D and 125D. A flotation cleaner concentrate and flotation tailings samples were sent for testing. Different flocculants were screened for the flotation tailings and a flocculant was selected, which is the Nalco product 83384. Dynamic settling tests were then done on both samples at different unit areas and at different dilution concentrations. The unit rate for the flotation tailings was found to be best at 0.76 t/m2/h and for the concentrate this was done at 0.28 t/m2/h. A summary of the settling test work is given in Table 13.7.
Table 13.7: Settling Test work Summary
| | Oxygen Uptake Rate — mg/l/min | |
Sample | | Solids
t/m2h | | Diluted
Feed
% w/w | | Flocc
Dosage
(g/t) | | U/F
Solids
%w/w | | Vane
YS
(Pa) | | Clarity
(ppm) | |
Flotation Tailings | | 0.76 | | 10.3 | | 19 | | 58.2 | | 44 | | 120 | |
Flotation Concentrate | | 0.28 | | 12.4 | | 13 | | 63.8 | | 77 | | 80 | |
Leached Concentrate | | 0.21 | | 11.7 | | 19 | | 66.7 | | 64 | | 580 | |
Final Tailings | | 0.81 | | 9.8 | | 19 | | 59.4 | | 28 | | 110 | |
129
The second round of testing was done on leached flotation concentrate and leached combined concentrate and tailings sample. These were samples that had been produced from the second pilot plant operation. Dynamic thickening tests were carried out on these samples at unit settling rates of 0.80 t/m2/h for the combined tailings sample and 0.2 t/m2/h for the leached concentrate samples. Both tests indicated that the targeted underflow densities should be achieved; however overflow clarity may not be as good as expected. This is especially true for the concentrate sample that is at a high pH and has high sodium content due to the high cyanide levels. Further test work on optimum flocculants is recommended at site during commissioning.
Miscellaneous Test Work
A number of other metallurgical tests have been carried out to collect data required for the plant design and as alternative process route. These have included the following:
Rheology Test work.
Oxygen Uptake Test work.
Merrill Crowe Test work.
Tailings Test work
Chloride Analysis.
Rheology test work has been carried out on flotation concentrate and tailings samples at different densities. This data has been used in pump and agitator designs.
Oxygen uptake tests were done on both flotation concentrate and tailings samples. This was done to determine the oxygen requirement for each slurry type and in turn allows for the sizing of the oxygen plant required for the process plant. The concentrate slurry has a high oxygen demand, 0.3207 mg/l/min, for the first six hours and then slowly reduces over the next 18 hours. The tailings sample oxygen demand was quite low with a peak of 0.0286 mg/l/min. A summary of the oxygen uptake test work is given in Table 13.8.
Table 13.8: Oxygen Uptake Test work Summary
| | Oxygen Uptake Rate — mg/l/min | |
| | 0 | | 1 hr. | | 2 hr. | | 4 hr. | | 6 hr. | | 24 hr. | |
Flotation Concentrate — GJ1822 | | 0.0000 | | 0.0471 | | 0.2139 | | 0.3207 | | 0.1639 | | 0.0732 | |
Flotation Tailings — GJ1822 | | 0.0014 | | 0.0136 | | 0.0282 | | 0.015 | | 0.0154 | | 0.0032 | |
Merrill Crowe test work was done on concentrate leach liquors as an alternative process route to the electrowinning route. The test work was done on a high grade solution produced from leaching a flotation concentrate sample, to test the possible inclusion of a high grade Merrill Crowe circuit to directly replace the electrowinning circuit. The test work indicated high silver and gold precipitation rates from the solution, although some minor re-dissolution was seen over one hour. Solution tenors dropped from 2,360 ppm silver to approximately 7 ppm in 15 minutes
130
at a zinc stoichiometry of 1:1, 0.85:1 and 1.15:1. A summary of the Merrill Crowe zinc precipitation test work is given in Table 13.9.
Table 13.9: Merrill Crowe Zinc Precipitation Test work Summary
Sample Time | | Calculated Head
(g/t) | | Recovery to
Conc. (%) | | Overall Recovery
48 hr. (%) | |
(min.) | | Ag | | Au | | Ag | | Au | | Ag | | Au | |
0 | | 2360 | | 35.1 | | 2360 | | 35.1 | | 2360 | | 35.1 | |
15 | | 7.7 | | 0.12 | | 6.5 | | 0.12 | | 7.2 | | 0.09 | |
30 | | 5.0 | | 0.11 | | 6.9 | | 0.13 | | 4.8 | | 0.07 | |
60 | | 11.0 | | 0.30 | | 34.2 | | 0.65 | | 11.5 | | 0.18 | |
Electrowinning test work had shown some signs of corrosion on the anode from the first stage of testing. The corrosion appeared to be pitting, indicating the presence of chlorides in the pregnant solution. Difficulties were experienced in trying to assay for chlorides in solution containing very high cyanide concentration. A number of commercial laboratories were approached; however the CSIRO laboratory in Perth finally offered the best service for chloride analysis. The leach liquors from the concentrate leach solution were found to contain chlorides between 22 ppm to 199 ppm. Electrometals had indicated that the upper limit of chlorides for stainless steel anodes was 50 ppm. Due to the range of chloride levels and the re-circulation of solution within the process plant, it was decided that titanium with a DSA coating would be selected for the anodes in the electrowinning cells.
Cytec Test Work
Cytec Mining Chemicals organized to do additional batch flotation test work at the SGS Lakefield Oretest laboratory to investigate alternative flotation reagent schemes. Twenty batch cleaner flotation tests were carried out on a sample of the master composite prepared from drill holes 340D and Q sample. Testing included alternative reagents and grinding procedures to optimize flotation response. The results of this test work are summarized in a report titled “Palmarejo Brief Technical Update 22nd December 2005”. The key findings of this study was that the frother selection could be changed from Terric 405 to Cytec F549, that the best flotation reagents are those already selected, but that A3418A showed some promise that could be trialed at site following commissioning.
Mineralogy
Mineralogy has been done on five different drill hole head samples and on one concentrate sample produced from the master composite made from drill holes number 078D, 115D and 125D. All of these reports have identified that the majority of the silver occurs as electrum and as silver sulfide (Acanthite). A number of other silver minerals have been identified in different holes, but they are not consistent through all of the drill holes. Some of these minerals include
131
Aurorite ((Mn2AgCa)Mn4O7.3H2O), native silver and a number of copper/silver/sulfide minerals. Gold occurs mainly as electrum.
The mineralogy of the flotation concentrate confirms that the sample is predominately a pyrite concentrate with other base metal sulfides including galena, sphalerite, chalcopyrite, chalcocite, covellite, bornite, marcasite, etc.
Conclusions
A total of 13 drill holes samples have been tested along with three bulk samples. The drill holes samples consist of seven reverse circulation (RC) drill holes and six diamond drill holes. The bulk samples consist of two underground samples taken from the existing workings from the ‘La Prieta’ structure and one surface outcrop sample from the Chapotillo Clavo. In total, almost 2.5 tonnes of samples have been tested to allow the design of the plant to proceed.
A detailed comminution test work program has been carried out on both whole diamond core samples and bulk samples taken from the surface and underground. The testing has included the conventional bond work index test work, UCS testing, AMC testing and the more advanced JK Drop weight and SMC testing used for modeling. This testing has indicated that some of the rock types (amygdaloidal andesite) are hard and competent, while other rock types are less hard and competent (the quartz vein breccia and footwall sediments). The data from all of these tests indicate that the ore is amenable to SAG milling, but due to the hard component nature of some of the rock types, a two stage milling circuit will be required.
Flotation test work has been carried out at batch scale, followed by locked cycle testing and finally at pilot plant scale. All of the data suggests that the ore is very amenable to flotation. The tests indicate that approximately 80% of the silver and gold can be collected into a very small mass of approximately 5% of the feed tonnage. This has the advantage of allowing high cyanide concentration leaching of the concentrate to produce a high tenor solution for precious metal recovery.
Leaching test work has been carried out to optimize reagent additions and define the plant recoveries. Leaching of the flotation concentrate generally exceeds 97% for both silver and gold, while flotation tailings recoveries are approximately 85% for gold and 72% for silver. The overall leaching recovery is 93.2% for gold and 87.9% for silver, although higher recoveries are indicated when tests that did not appear to be correct are removed to give a gold recovery of 94% and silver of 91.7%. Overall reagent consumptions were 1.26 kg/t for cyanide and 1.16 kg/t for lime.
Commercial production commenced in April 2009. Recovery of gold has been consistent with the initial metallurgical test work and feasibility study estimates and averaged 92% during 2010. The recovery of silver has not achieved the feasibility study values and averaged 71% during 2010. During 2010, silver recoveries at feasibility levels of 80% were achieved but not consistently. Additional metallurgical work has identified causes for the variable recoveries. Adjustments have been made to the current plant and an expansion of the CIL circuit is being
132
evaluated for 2011 which is designed to achieve consistently higher silver recoveries from all ore types.
13.3 Guadalupe Metallurgical Test work Summary
Sample Selection
Two drill holes samples have completed metallurgical testing in 2007, (TGDH-129 and TGDH-184) and four more samples (TGDH-054, TGDH-214, TGDH-225, and TGDH-238) were submitted in 2008 to be tested at SGS labs in Durango, Mexico. Additional metallurgical samples TGDH-341 and TGDH- 355 were sent during 2010, partial results shown cyanidation recoveries of gold up to 92%, and silver from 70 to 87%. Samples were selected from different areas (Figures 13.1-13.2) within the Guadalupe vein and represent all the mineralization styles in the deposit. Table 13.10 summarizes the main characteristics of such samples.
Table 13.10: Guadalupe Metallurgical Samples Selected
SAMPLE | | SAMPLE
TYPE | | ORE TYPE | | COMPOSITION | |
TGDH-129 | | CORE | | SULFIDES | | QUARTZ CEMENTED BRECCIA | |
TGDH-184 | | RC | | OXIDES | | QUARTZ CEMENTED BRECCIA | |
TGDH-054 | | CORE | | SULFIDES | | QUARTZ VEIN CEMENTED BRECCIA | |
TDGH-214 | | CORE | | SULFIDES | | CARBONATE CEMENTED BRECCIA | |
TGDH-225 | | CORE | | SULFIDES | | QUARTZ CARBONATE CEMENTED BRECCIA | |
TGDH-238 | | CORE | | MIXED SULF/OXIDE | | QUARTZ CARBONATE CEMENTED BRECCIA AND STOCKWORK | |
TDGH-341 | | CORE | | MIXED SULF/OXIDE | | QUARTZ VEIN CEMENTED BRECCIA | |
TGDH-355 | | CORE | | OXIDES | | QUARTZ CARBONATE CEMENTED BRECCIA | |
Figure 13.1: Location of Samples for Metallurgical Testing

133
In addition to the eight metallurgical samples, eighteen samples from different parts of the Guadalupe deposit were submitted for mineralogical studies. Mineralogy was conducted on samples from drill holes shown in Figure 13.2., which also shows the distribution of the silver-bearing mineral phases.
Figure 13.2: Location of Samples for Mineralogical Studies
(Showing Silver-Bearing Minerals)
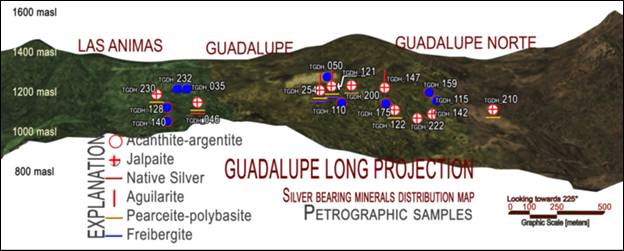
Additional test work from the Palmarejo Mine, 7 kilometers northwest, is available on ores from the Palmarejo deposit, which are mineralogically similar to the Guadalupe ores (see Sections 13.1 and 13.2).
The Bottle Roll Leach test were industry standard tests where the samples were tested for gold and silver recoveries at three grind sizes and four different concentrations of cyanide. The test showed silver recoveries ranging from 84 to 92% and gold recoveries ranging from 80 to 93%.
The Floatation tests were standard floatation tests conducted at two grind sizes. The floatation concentrate was then assayed for metal content. The floatation tails where then submitted for additional metal extraction with cyanide leaching.
The Gravity tests were conducted on coarse grind sizes than the Bottle Roll and float tests. The samples were gravity concentrated using a Knelson bowl. The gravity concentrates were then submitted to cyanide leach testing to check for the susceptibilities to leaching with cyanide.
Results
The best recoveries this far were achieved by flotation followed by leaching. Table 13.11 summarizes the results of these tests. The poorest overall recovery was found with the gravity concentrate method.
134
Table 13.11: Guadalupe Metallurgical Test Results
| | | | RECOVERIES | |
| | Head
Grade | | Cyanide Bottle | | | | Cyanide Leach of | | Gravity | | Cyanide Leach of
Gravity | |
Composite | | Au | | Ag | | Roll Test | | Bulk Flotation | | Flotation Tails * | | Concentration | | Concentrate | |
Drill-Hole | | g/t | | g/t | | Au % | | Ag % | | Au % | | Ag % | | Au % | | Ag % | | Au % | | Ag % | | Au % | | Ag % | |
TGDH-129 | | 2.68 | | 270 | | 93 | | 84.0 | | 86.3 | | 85.6 | | 96.6 | | 96.6 | | 46.3 | | 33.6 | | 85.3 | | 84.5 | |
TGDH-184 | | 0.40 | | 631 | | 80 | | 92.0 | | 76.3 | | 94.0 | | 96.4 | | 99.0 | | 23.2 | | 36.9 | | 76.8 | | 90.7 | |
TGDH-054 | | 1.19 | | 159 | | 91 | | 89.3 | | 80.6 | | 81.4 | | 96.6 | | 94.3 | | 33.4 | | 32.2 | | 86.5 | | 87.5 | |
TGDH-214 | | 5.43 | | 209 | | 95.4 | | 89.8 | | 89.8 | | 93.5 | | 98.7 | | 98.3 | | 58.1 | | 45.9 | | 84.8 | | 67.9 | |
TGDH-225 | | 1.71 | | 196 | | 89.2 | | 86.3 | | 84.1 | | 84.9 | | 95.8 | | 94.1 | | 35 | | 31.8 | | 84 | | 85.2 | |
TGDH-238 | | 1.90 | | 119 | | 95.6 | | 66.2 | | 80.0 | | 63.5 | | 96.9 | | 75.4 | | 42.1 | | 25.1 | | 84.8 | | 83.0 | |
TGDH-341 | | 1.84 | | 135 | | N/A | | N/A | | 70.4 | | 81.2 | | 97.2 | | 97.9 | | N/A | | N/A | | 69.7 | | 80.4 | |
TGDH-355 | | 3.94 | | 211 | | N/A | | N/A | | 71.5 | | 86.0 | | 96.8 | | 97.9 | | N/A | | N/A | | 70.8 | | 85.1 | |
* Listed recovery of “Cyanide Leach of Floatation Tails” is the final total recovery from both bulk flotation and leaching of tails
Mineralogy
Mineralogical studies have been conducted on eighteen samples from different drill holes and spatial locations within the Guadalupe deposit. The studies consisted of both thin section analyses and microprobe work to identify individual mineral species. The mineralogical work shows that the mineralogy of the Palmarejo deposit and the Guadalupe deposit are similar (Table 13.12).
135
Table 13.12: Mineral Species at Guadalupe and Palmarejo
| | Palmarejo Mineral Species |
Guadalupe Mineral Species
Petro Lab, 2010 | | Ross, 2009; Reyes, 2009a & b; Petro Lab,
2006 |
Electrum | | Electrum |
Native Gold | | Native Gold |
Acanthite-argentite | | Acanthite |
Native silver | | Native silver |
Jalpaite | | Jalpaite |
Aguilarite | | Aguilarite |
Pyrite | | Pyrite |
Sphalerite | | Sphalerite |
Galena | | Galena |
Chalcopyrite | | Chalcopyrite |
Chalcosite | | Altaite |
Enargite | | Billingsleyite |
Bornite | | Cervellite |
Tennantite-tetrahedrite | | Tennantite-tetrahedrite |
Freibergite | | Proustite |
Pearceite-polybasite | | Pearceite-polybasite |
Covellite-digenite | | Covellite-digenite |
Unspecified Iron Oxides | | Mckinstrite |
Unspecified Manganese Oxides | | Stromeyerite |
Note: Mineral species were identified by optical microscopy and scanning electron microprobe work EDAX technique
136
Figure 13.3: Photomicrograph of Drill Hole TGDH-254
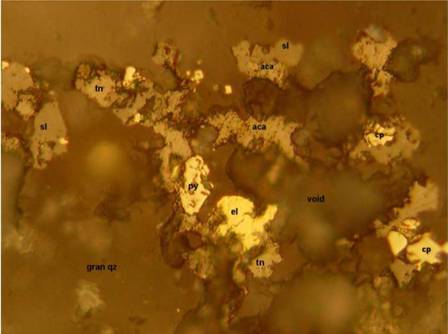
Electrum (el) associated to the base metals mineral suite, developing binary and ternary grains among them. Electrum (el) and tenantite (tn), chalcopyrite (cp), sphalerite (sl), and acanthite-argentite (aca), this one shows typical light etching as microscope source light hits the Ag-rich mineral grain´s surface. Matrix is granular quartz (gran qz). Notice some voids or cavities among the metallic minerals. Photomicrograph under reflected light, 50X increments and plain polars PPL.-(Petrolab, laboratorio de investigaciones geologicas, 2010).
Conclusions
Metallurgical tests indicate recoveries of silver and gold by flotation and leaching from Guadalupe ores are similar to the recoveries experienced at Palmarejo in the full scale process plant with a flotation and leaching circuit. Mineralogical test work shows that the ore minerals at both deposits are also similar. No additional test work was conducted at Guadalupe in 2012.
13.4 La Patria Metallurgical Test work Summary
Sample Selection
A total of forty-two drill holes were selected from the current geological data base to obtain representative test samples for a series of cyanide solubility test meant to determine gold and silver extraction rates. Table 13.13 shows selected drill hole identification numbers.
137
Table 13.13: La Patria Metallurgical Test Drill Holes
Drill Hole | | | | Drill Hole | | |
ID | | Project | | ID | | Project |
LPDH-122 | | LP | | LPDH-164 | | LP |
LPDH-123 | | LP | | LPDH-167 | | LP |
LPDH-126 | | LP | | LPDH-168 | | LP |
LPDH-127 | | LP | | LPDH-170 | | LP |
LPDH-129 | | LP | | LPDH-173 | | LP |
LPDH-130 | | LP | | LPDH-176 | | LP |
LPDH-131 | | LP | | LPDH-178 | | LP |
LPDH-132 | | LP | | LPDH-180 | | LP |
LPDH-134 | | LP | | LPDH-181 | | LP |
LPDH-136 | | LP | | LPDH-183 | | LP |
LPDH-137 | | LP | | LPDH-184 | | LP |
LPDH-141 | | LP | | LPDH-185 | | LP |
LPDH-143 | | LP | | LPDH-188 | | LP |
LPDH-145 | | LP | | LPDH-190 | | LP |
LPDH-147 | | LP | | LPDH-192 | | LP |
LPDH-150 | | LP | | LPDH-194 | | LP |
LPDH-155 | | LP | | LPDH-195 | | LP |
LPDH-159 | | LP | | LPDH-197 | | LP |
LPDH-161 | | LP | | LPDH-199 | | LP |
LPDH-162 | | LP | | LPDH-200 | | LP |
LPDH-163 | | LP | | LPDH-201 | | LP |
A total of 411 samples were submitted in October 2012 to Kappes, Cassiday & Associates in Reno NV, USA. Additional 367 samples were submitted in November. Samples were selected within the La Patria ore deposit representing most of the mineralized areas. The first set of samples consisted of assay pulp samples at minus 150 mesh in size whereach individual sample was tested as received without further processing. The second set of samples consisted of coarse sample rejects and each individual sample was pulverized to minus 150 mesh (106 micron) before testing.
Cyanide solubility test is an industry standard method to determine precious metal ore response when dissolved in a predetermined cyanide strength solution. This is a preliminary test and its results provide information to define a more robust metallurgical test work follow-up program.
138
Results
The test results for the first set of samples showed a gold extraction average of 83.53% and a silver extraction average of 74.97%. Figures 13.4 and 13.5 show cyanide solubility test extraction vs. calculated head plotted data for gold and silver respectively.
Figure 13.4: La Patria; Gold Extraction (%) vs. Calculated Head (g/t)

Figure 13.5: La Patria; Silver Extraction (%) vs. Calculated Head (g/t)

139
The test results for the second set of samples showed a gold extraction average of 81.98% and a silver extraction average of 76.11%. Figures 13.6 and 13.7 show cyanide solubility test extraction vs. calculated head plotted data for gold and silver respectively.
Figure 13.6: La Patria; Gold Extraction (%) vs. Calculated Head (gr/mt)
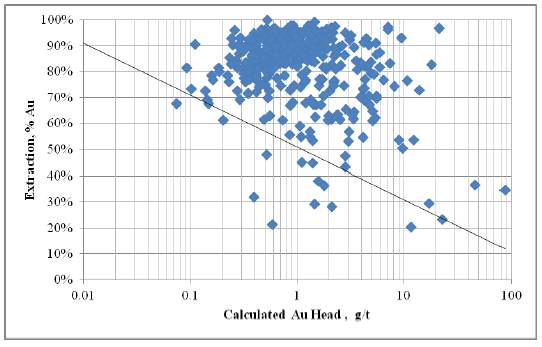
Figure 13.7: La Patria; Silver Extraction (%) vs. Calculated Head (g/t)

140
Results for both set of samples indicate that both gold and silver are amenable to be extracted into a cyanide solution. Gold extraction rates seems to be consistent for samples containing grades less than 1.0 g/t, however, samples containing gold grades greater than 1.0 g/t, present lower extraction rates, this condition is indicative that a longer leach cycle would improve gold extraction in general.
Silver extraction rates are different for the two sets of samples evaluated, the first set is showing a lower extraction rate for samples containing grades leass than 10.0 g/t, with an ascendent extraction rate trend for grades greater than 10.0 g/t. The second set of samples is showing an opposite trend considereing same silver grade ranges however the second set of samples is mostly populated by samples containing less than 10.0 g/t. Longer leach cycles are necessary to better definition of the silver extraction rates.
These initial metallurgical results are preliminary in nature. They, however, strongly support a continued and more extensive metallurgical test work program. This work is planned for 2013, it will include bottle roll and column test on different feed sizes for representative composites along La Patria ore deposit.
141
SECTION 14 - MINERAL RESOURCES
14.1 Mineral Resource Estimation Methodology Palmarejo Deposit
14.1.1 Assay Data
The original geology model for the Palmarejo Deposit was created by AMEC in 2007 and 2008 at Coeur’s request, for estimating silver and gold Resources at Palmarejo using data generated by Planet Gold through late September 2007, including geologic mapping, RC and core drilling results, and surveying of underground workings. A wireframe of the underground workings was created by AMEC using historical data prepared by previous operators and was incorporated into the resource modeling. Aerial photography was used to create a topographic model with two-meter contours.
The drill hole database used in the Palmarejo resource model update was current to 23 July, 2012. The database contains the original 729 surface exploration drill holes (136,364 m) and 1201 surface and underground definition drill holes (170,580.4m). These drill phases are shown in Figure 14.1. Production/ore-control drilling in the open pit mining areas at Palmarejo has supplied 5,432 additional RC drill holes (107,371 m) to the database for geology and resource modeling. In addition to the drill hole data, there are 12,154.6 m of grade control chip-channel samples in 1,081 sample strings from underground development and production drifts in the 76 Clavo and 108 Clavo areas. Underground chip channel samples and 74 surface trench samples were used in the interpretation of the mineral-type model but not in metal grade estimation given the sample type and the lack of quality control data for most of the data set. A summary of the drill/sample data used for the estimation of the Mineral Resource of the Palmarejo mine area is shown in Table 14.1.
Table 14.1: Palmarejo Mine Area Drill and Other Data - YE2012 Mineral Resources Model
| | RC * | | Core ** | | UG Channel *** | | Trench | | Total | |
No. Sampled Holes | | 6,095 | | 1,175 | | 1,173 | | 74 | | 8,520 | |
Drilled Meters (Sampled Holes Only) | | 193,627.5 | | 212,635.8 | | 12,849.2 | | 1972.8 | | 421,085 | |
Sampled Meters | | 188,512.9 | | 82,634.7 | | 12,715.8 | | 1,595.5 | | 285,459 | |
No. Samples in the Database | | 121,016 | | 79,458 | | 14,626 | | 664 | | 215,764 | |
* Includes 5,432 open pit angled RC ore-control holes (~18m length)
** Includes 86 RC Pilot Holes Continued by Core
*** Includes 1,081 underground channel ore-control sample strings
Cutoff date for resource data was July 23, 2012.
These data were incorporated into a digital database and all subsequent modeling of the Palmarejo Deposit Resource was performed using GEMCOM Gems™ software.
142
Figure 14.1 Palmarejo Project — Exploration and Definition Drill Holes
(Topographic contours on Aug 2012 surface)
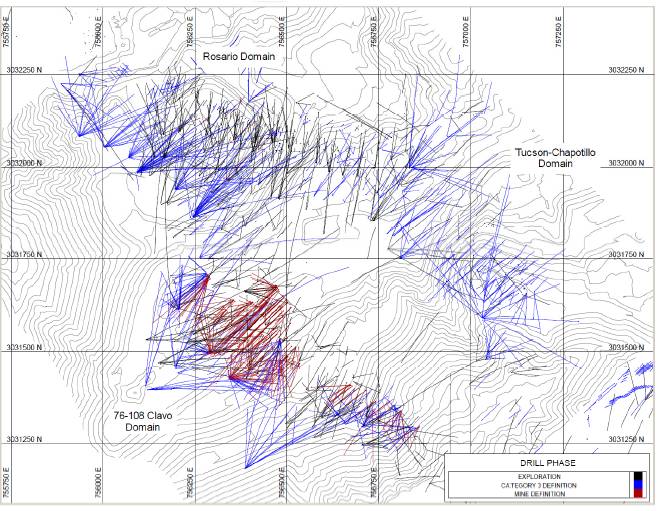
14.1.2 Material Density
Planet Gold personnel gathered dry bulk specific-gravity data using standard water-immersion methods on dried and waxed whole-core samples of mineralized and unmineralized units. These data are supplemented by measurements collected on whole and half core as part of third-party metallurgical studies (Table 14.2). Table 14.3 lists the specific gravities used in the Palmarejo modeling (lithology and corresponding codes are described in Table 14.4).
143
Table 14.2: Palmarejo Specific-Gravity Statistics by Geology
Unit | | Mean | | Median | | Std Dev | | CV | | Min | | Max | | Count | |
Tfbr | | 2.45 | | 2.46 | | 0.02 | | 0.01 | | 2.43 | | 2.48 | | 4 | |
Ktal | | 2.58 | | 2.61 | | 0.14 | | 0.05 | | 2.04 | | 3.23 | | 133 | |
Ktam | | 2.68 | | 2.70 | | 0.08 | | 0.03 | | 2.46 | | 2.77 | | 20 | |
Ktap | | 2.62 | | 2.66 | | 0.12 | | 0.05 | | 2.26 | | 2.77 | | 30 | |
Ktapp | | 2.68 | | 2.70 | | 0.07 | | 0.03 | | 2.52 | | 2.80 | | 28 | |
Ktat | | 2.52 | | 2.53 | | 0.08 | | 0.03 | | 2.33 | | 2.71 | | 29 | |
Ktrt | | 2.50 | | 2.51 | | 0.07 | | 0.03 | | 2.32 | | 2.63 | | 24 | |
LaPrieta-LaBlanca Veins | | 2.58 | | 2.61 | | 0.14 | | 0.05 | | 2.04 | | 3.23 | | 133 | |
Stockwork | | 2.58 | | 2.64 | | 0.30 | | 0.12 | | 0.99 | | 3.43 | | 105 | |
Table 14.3: Palmarejo Specific-Gravity by Geology
Lithology — Specific Gravities
Unit | | Model SG | |
Tfbr | | 2.45 | |
Ktapp | | 2.69 | |
Ktat (includes Ktap) | | 2.59 | |
Ktam | | 2.68 | |
Ktal | | 2.63 | |
Ktrt | | 2.50 | |
La Prieta-La Blanca Veins | | 2.56 | |
Stockwork | | 2.56 | |
A density of 2.56 g/cm3 was assigned to modeled mineralization (discussed below), which takes into account natural void spaces, such as open fractures, that could not be accurately accounted for in the measurements. No additional work on the specific gravity data and the density model was completed for the year-end 2012 resource update.
14.1.3 Geology Modeling
Geological modeling of the Palmarejo Mine area was broken up into separate, but contiguous, project areas based on mineral controls and actual or projected mining styles (open-pit or underground). Project domains and mineral-type model coding are shown in Figure 14.2.
144
Figure 14.2 Palmarejo Project — Model Domain Areas, Mineral-Type Model Coding
(Topographic contours on Aug 2012 surface, Mineral-type interpretation at 1000m elev.)

Lithological Model
Bolnisi geologists in the Chihuahua office prepared an interpretation of the main lithological units at Palmarejo during 2007 and 2008. The interpretation was done using parallel vertical sections spaced every 25 m and oriented N45°E. Table 14.4 shows the text codes and description of lithological units interpreted and defined by Bolnisi and the integer codes used to identify the units in all subsequent block models.
145
Table 14.4: Palmarejo Lithological Unit Descriptions and Codes
Bolnisi Lithological Unit Code | | Unit Description | | Block Code | |
KTA | | Trachytic Andesite | | 150 | |
KTAL | | Laminated Andesitic Sandstone | | 500 | |
KTAM | | Amygdaloidal Andesite | | 100 | |
KTAP | | Porphyritic Andesite | | 250 | |
KTAPP | | Strongly Porphyritic Andesite | | 200 | |
KTAT | | Coarse Andesitic Sandstone | | 300 | |
KTRT | | Rhyolitic Tuffs | | 600 | |
Using only the vertical sections, Bolnisi created lithological solids in Surpac® software. This lithology model was imported to GEMS™ and has been used in all subsequent resource models. The mineralization at Palmarejo is not completely lithologically controlled and the main purpose of this model is to assign specific gravity values to the block model.
The Bolnisi lithology model was not modified during the year-end 2012 resource update; the Mineral Control model, discussed below, was inserted into the existing lithology model and used for assigning density to the wall rock material outside the mineral control model. Subsequent resource model updates will include modification of the lithology model to better honor the new drilling information.
Void Model
Prior to Coeur’s acquisition of the Palmarejo property, Planet Gold created a three-dimensional `wireframe’ model of the underground workings at Palmarejo (the “Planet Gold void model”). This model was built using data from historic mine maps, Planet Gold drill data (intersected workings or mine backfill), and survey data collected from accessible underground workings. The mining history of the Palmarejo area is discussed in Section 6.
Pre-feasibility work in July and August 2007 by Coeur in anticipation of a corporate merger of Coeur, Bolnisi, and Palmarejo Silver and Gold identified stopes mined by Minas Huruapa that were not included in the Planet Gold void model and, more significantly, historic documentation that suggests the Planet Gold void model does not fully account for mining that took place prior to 1909. The Planet Gold void model accounts for approximately 517,000 tonnes of material mined at Palmarejo, while the report brought to MDA’s attention suggests that a total of approximately one million tonnes may have actually been mined (789,000 tonnes prior to 1909; 46,000 tonnes of development work in and around the vein structures that was completed a few years after 1909; and 168,000 tonnes mined from 1979 to 1992.
While the pre-1909 mining at Palmarejo is almost entirely undocumented by historic mine maps, and these old workings are not accessible, the tonnage figure quoted above for the material mined prior to 1909 originates from a crude estimate by a mining engineer in 1909 (McCarthy, 1909). McCarthy provides an “approximate estimate of the ore that has been taken out and
146
milled in the past history of the mine.” He further notes that, “[t]his necessarily must be but an approximation owing to the want of proper records and plans, but which I believe to be correct within reasonable limits.” McCarthy estimates the cumulative strike length of the old stopes, and multiplies this strike length by average dip extents and widths of the stopes at La Prieta and La Blanca. These crude calculations result in an estimate of 562,000 short tons mined from the La Prieta vein and 175,000 short tons from the La Blanca structure up to 1909 (McCarthy, 1909). Converting these into metric tonnes using densities applied to the resource modeling (McCarthy applied a lower density than used in the MDA model), these equate to 611,000 metric tonnes from La Prieta and 178,000 tonnes from La Blanca, for a total of 789,000 tonnes of production through 1909.
The pre-1909 workings, therefore, cannot be directly modeled, and the location and true scale of these workings cannot be determined with certainty. McCarthy (1909) notes that many of the pre-1909 stopes had caved or were filled with what was considered waste at the time of mining. He estimated that the cutoff grades used by Palmarejo and Mexican Goldfields, Ltd (PMG) were 30 oz Ag/ton (900 g Ag/t) from 1888 to 1901 and 20 oz Ag/ton (600 g Ag/t) from 1902 to 1909. Waste rock used to fill the stopes, therefore, could be of potential economic interest today in an open-pit mining scenario. In fact, some of these backfilled stopes were mined in the last years of the PMG underground operations (McCarthy). Due to the wide envelopes of lower-grade mineralization that typically encompass the high-grade mineralized zones at Palmarejo, caving of the stope walls could also partially fill the old stopes with material of potential economic importance today. Unmodeled caved and/or back-filled stopes are more an issue of lower density than missing stopes in a void model if: (1) the potential method of mining the resources is open pit; and (2) the stope-fill material does not contain deleterious quantities of active carbon derived from timber.
When the historic mine void model was built, the Palmarejo drill hole database contained a total of 169 void and mine-fill intercepts (collectively referred to as void intercepts) from 110 holes, including 19 core and 92 RC holes (one void intercept was cut by both an RC hole and its core tail). The mean down-hole length of the void intercepts is 3.17m, with a minimum of 0.80m and a maximum of 15.24m. Up to 4 void intercepts are recorded for a single hole; McCarthy documents old stopes on hanging wall, central, and footwall portions of the main vein structure. Some of these void intercepts lie within the Planet Gold void model, and others were thought to represent natural voids, but in light of the newly reviewed historical reports the Qualified Person believes, and is in agreement with MDA and AMEC, that most of the void intercepts reflect mining voids.
Production from Palmarejo stopped after the recommendations outlined by McCarthy instructed PMG to begin intensive development work to prepare the mine for a new mill and production increases. However, the production never materialized for PMG due to the onset of the Mexican Revolution.
Production was resumed at Palmarejo by Minas Huruapa, S.A during the period from 1979 to 1992. Minas Huruapa mined the areas previously developed by PMG according to McCarthy’s recommendations. Records were provided to Coeur and AMEC by Jorge Cordoba, General
147
Director of Operations for Minas Huruapa during that time, which MDA was unaware of. These records indicate that Minas Huruapa mined 168,352 tonnes of ore grading at 297 g/t Ag and 1.37 g/t Au (Table 14.5).
Table 14.5: Minas Huruapa Production 1979 to 1992
| | | | Mined Grade | |
Year | | Tonnes | | g/t Au | | g/t Ag | |
1979 | | 735 | | 0.24 | | 142 | |
1980 | | 7,455 | | 0.79 | | 201 | |
1981 | | 12,383 | | 1.49 | | 275 | |
1982 | | 10,459 | | 1.69 | | 436 | |
1983 | | 11,500 | | 1.59 | | 335 | |
1984 | | 12,562 | | 1.83 | | 345 | |
1985 | | 12,991 | | 1.41 | | 317 | |
1986 | | 12,712 | | 1.50 | | 317 | |
1987 | | 13,708 | | 1.10 | | 260 | |
1988 | | 14,410 | | 1.10 | | 280 | |
1989 | | 12,889 | | 1.00 | | 258 | |
1990 | | 17,782 | | 1.20 | | 289 | |
1991 | | 18,186 | | 1.30 | | 269 | |
1992 | | 10,580 | | 1.50 | | 302 | |
Totals | | 168,352 | | 1.37 | | 297 | |
As a result of the newly discovered historical data, AMEC engineers were contracted by Coeur to produce a new void model incorporating all known historic information into its construction for use in the 2008 Feasibility Study and Mineral Resource estimation. Coeur used an updated density of 2.56 for the present volume to tonnes calculation found that 611,000 metric tonnes were mined from La Prieta and 178,000 tonnes from La Blanca for a grand total of 789,000 tonnes of production up to 1909. The AMEC void model was constructed with these volumes in mind. The AMEC void model shown in Figure 14.3 below was completed in late September, 2007. The AMEC void model was employed in all subsequent Mineral Resource estimations. The Qualified Person has not personally verified the work performed by AMEC and relies on their expertise, noting that the volume of the void model is reasonable for depletion of the Palmarejo resource model.
A nearest-neighbor estimation of possible mining voids was used to incorporate the new model into the final 2008 Palmarejo Resource estimation, and the same mining void estimate was used in the year-end 2010 Palmarejo resource update. This is an unbiased approach that is only as accurate as the drill-density, sample locations, and logging of void intercepts. Inspection of the results shows a reasonable representation of the stopes known to be missing from the Planet Gold void model, as well as some other areas of stoping that are described in a general fashion in McCarthy’s report. However, the results remain a crude representation of possible areas of stopes, partially filled stopes, and caved stopes. As a result of the void estimation, a total of 665,500 tonnes were classified as Inferred category. The resultant void resource model now
148
accounts for a total of almost 1.1 million tonnes, an amount that overstates the approximated 1 million tonnes mined according to historic reports. In addition, McCarthy’s calculations assume one hundred percent extraction, while pillars must have been left in the stopes, and he states “many thousands of tons of ore have been irretrievably lost” to future underground mining due to the “wasteful system pursued in the development of the mine in the past,” which indicates that McCarthy believed ore-grade material was left between the historic stopes. For all of these reasons, the void-coded blocks are categorized as Inferred instead of being totally removed from the Resources.
The historic mine void model has not been updated since 2008. The Qualified Person of this report recommended a review of the void model be performed in 2012 using updated drilling data and open-pit production information.
Figure 14.3: AMEC/Coeur 2007 Void Model — 3-D view
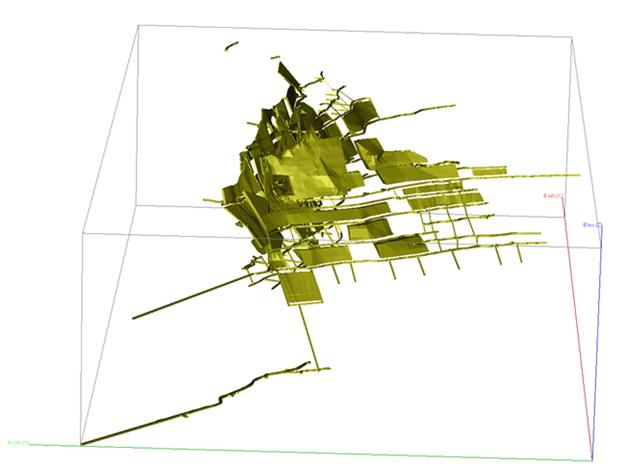
Determination of Mineral-Type Domains
The silver and gold mineralization at Palmarejo was divided into three main mineral control domains: Veins, Footwall Stockwork and Hanging wall Stockwork. These mineral domains are controlled by the main fault structures and fault intersections within the volcanic rock
149
stratigraphy. It is likely that the vein and stockwork zones are also controlled by lithology with the mineral zones preferentially located within specific volcano-stratigraphic horizons where the rock is more brittle and able to retain open spaces. Data outside these mineral domains and below the topographic surface were considered to be located in the Host mineral domain.
The most strongly mineralized unit is the vein domain, formed mainly by quartz-vein breccias. The veins are logged in the drilling database as “QVBX”. The Footwall (FW) and Hanging wall (HW) domains contain sheeted quartz veins, located above and below, but always nearby the main vein structures. The significant sheeted veins in both the hanging walls and footwalls were graphically defined to minimize over-estimation of grade in the stock work surrounding the main veins. Inclusion in this domain is dominated by quartz percentage, generally over 15%, and mineralization at significant grades above surrounding material, but not following a rigid rule. The information is extracted from the drill hole intervals.
Mineral-type model interpretations were completed by Erika Vega, senior mine geologist for the Palmarejo mine. The interpretation was based on the mineral-type model from the 2011 resource model and incorporated the drill information collected since the 2011 resource model was completed.
The 2012 mineral-type solids are described in Table 14.6 and are current to August, 2012 (see also Figure 14.2).
Table 14.6: Palmarejo Project — Mineral-Type Model Solid Description
SOLID | | ROCK_CODE | | MIN_CODE | | PROJECT AREA | | DESCRIPTION |
LP_QVBX | | LP_QVBX | | 700 | | Rosario, Tucson-Chapotillo | | La Prieta Vein |
LP_QVBX1 | | LP_QVBX1 | | 710 | | Tucson-Chapotillo | | La Prieta Vein Splay |
LB_QVBX | | LB_QVBX | | 800 | | Rosario, 76-108 Clavo | | La Blanca Vein |
LB_NSQVB | | LB_NSQVB | | 810 | | 76-108 Clavo | | Norte-Sur Vein |
LB_HSTK | | LB_HSTK | | 900 | | Rosario, 76-108 Clavo | | La Blanca Hanging Wall Stockwork |
LB_FSTK | | LB_FSTK | | 910 | | Rosario, 76-108 Clavo | | La Blanca Footwall Stockwork |
LB_FSTK1 | | LB_FSTK1 | | 911 | | 76-108 Clavo | | La Blanca Footwall Stockwork - isolated body in footwall |
LP_HSTK | | LP_HSTK | | 920 | | Rosario, Tucson-Chapotillo | | La Prieta Hanging Wall Stockwork |
LP_FSTK | | LP_FSTK | | 930 | | Rosario, Tucson-Chapotillo | | La Prieta Footwall Stockwork |
LP_FSTK2 | | LP_FSTK2 | | 932 | | Rosario | | La Prieta Footwall Stockwork - isolated body in footwall |
LP_FSTK3 | | LP_FSTK3 | | 933 | | Tucson-Chapotillo | | La Prieta Footwall Stockwork - isolated body in footwall |
LP_FSTK4 | | LP_FSTK4 | | 934 | | Tucson-Chapotillo | | La Prieta Footwall Stockwork - isolated body in footwall |
LV_QVBX | | VT_QVBX | | 999 | | Rosario | | La Victoria Vein |
14.1.4 Exploratory Data Analysis (EDA)
Exploratory data analysis (EDA) for the Palmarejo Project was done by project area and began during the modeling of the mineral type model by examining the mineral-type coding along with the gold and silver assays and other logged attributes. Each drill hole sample was tagged with the corresponding mineral type based on the interpreted solids. Length-weighted statistics were
150
calculated for the gold and silver sample assays; histograms and log-probability plots were generated for metal by mineral type.
Sample statistics by project area and mineral-type are summarized in Table 14.7 to Table 14.9.
Table 14.7: Sample Statistics — Rosario Area
ROSARIO | | Metal | | MIN_CODE | | N | | Mean | | Std.Dev. | | C.V. | | Max | | Q75 | | Median | | Q25 | | Min | |
Host | | Ag_ppm | | 10 | | 35994 | | 8.02 | | 73.8 | | 9.2 | | 4215 | | 2.9 | | 0.01 | | 0.01 | | 0.01 | |
LB_HSTK | | Ag_ppm | | 900 | | 5056 | | 77.71 | | 211.14 | | 2.72 | | 3110 | | 52 | | 7 | | 0.6 | | 0.01 | |
LB_QVBX | | Ag_ppm | | 800 | | 4735 | | 191.14 | | 395.07 | | 2.07 | | 6390 | | 226.88 | | 54 | | 6 | | 0.01 | |
LB_FSTK | | Ag_ppm | | 910 | | 15966 | | 39.03 | | 182.71 | | 4.68 | | 9034 | | 16.6 | | 4.8 | | 1 | | 0.01 | |
LP_HSTK | | Ag_ppm | | 920 | | 11182 | | 44.62 | | 193.34 | | 4.33 | | 14133 | | 22 | | 5 | | 0.01 | | 0.01 | |
LP_QVBX | | Ag_ppm | | 700 | | 3921 | | 132.06 | | 207.88 | | 1.57 | | 2315 | | 172 | | 45.2 | | 8 | | 0.01 | |
LP_FSTK | | Ag_ppm | | 930 | | 5134 | | 36.77 | | 133.2 | | 3.62 | | 5780 | | 17.4 | | 5.4 | | 1.6 | | 0.01 | |
LV_QVBX | | Ag_ppm | | 999 | | 1085 | | 72.88 | | 230.98 | | 3.17 | | 3262 | | 42.3 | | 8.6 | | 1.6 | | 0.01 | |
ROSARIO | | Metal | | MIN_CODE | | N | | Mean | | Std.Dev. | | C.V. | | Max | | Q75 | | Median | | Q25 | | Min | |
Host | | Au_ppm | | 10 | | 35994 | | 0.059 | | 0.776 | | 13.247 | | 97.13 | | 0.02 | | 0.001 | | 0.001 | | 0.001 | |
LB_HSTK | | Au_ppm | | 900 | | 5056 | | 0.525 | | 1.799 | | 3.428 | | 77 | | 0.31 | | 0.04 | | 0.001 | | 0.001 | |
LB_QVBX | | Au_ppm | | 800 | | 4735 | | 1.397 | | 3.264 | | 2.336 | | 74.1 | | 1.37 | | 0.331 | | 0.03 | | 0.001 | |
LB_FSTK | | Au_ppm | | 910 | | 15966 | | 0.344 | | 1.936 | | 5.62 | | 103.28 | | 0.17 | | 0.05 | | 0.01 | | 0.001 | |
LP_HSTK | | Au_ppm | | 920 | | 11182 | | 0.368 | | 1.71 | | 4.645 | | 123 | | 0.21 | | 0.05 | | 0.007 | | 0.001 | |
LP_QVBX | | Au_ppm | | 700 | | 3921 | | 1.003 | | 1.884 | | 1.879 | | 23.77 | | 1.06 | | 0.29 | | 0.07 | | 0.001 | |
LP_FSTK | | Au_ppm | | 930 | | 5134 | | 0.298 | | 1.042 | | 3.495 | | 35.7 | | 0.19 | | 0.07 | | 0.02 | | 0.001 | |
LV_QVBX | | Au_ppm | | 999 | | 1085 | | 0.647 | | 1.959 | | 3.029 | | 39.2 | | 0.387 | | 0.101 | | 0.028 | | 0.001 | |
151
Table 14.8: Sample Statistics — Tucson-Chapotillo Area
TUC-CHAP | | Metal | | MIN_CODE | | N | | Mean | | Std.Dev. | | C.V. | | Max | | Q75 | | Median | | Q25 | | Min | |
Host | | Ag_ppm | | 10 | | 13377 | | 4.9 | | 26.38 | | 5.38 | | 1390 | | 2.7 | | 0.01 | | 0.01 | | 0.01 | |
LP_HSTK | | Ag_ppm | | 920 | | 2823 | | 11.64 | | 53.54 | | 4.6 | | 1760 | | 5 | | 1.1 | | 0.01 | | 0.01 | |
LP_QVBX | | Ag_ppm | | 700 | | 2473 | | 62.39 | | 184.82 | �� | 2.96 | | 8280 | | 54.7 | | 13.2 | | 1.8 | | 0.01 | |
LP_QVBX1 | | Ag_ppm | | 710 | | 2363 | | 71.74 | | 328.52 | | 4.58 | | 11883 | | 35.68 | | 7.33 | | 2.5 | | 0.01 | |
LP_FSTK | | Ag_ppm | | 930 | | 15408 | | 17.6 | | 95.67 | | 5.44 | | 4220 | | 6.9 | | 2.4 | | 0.9 | | 0.01 | |
LP_FSTK3 | | Ag_ppm | | 933 | | 13 | | 7.42 | | 18 | | 2.43 | | 88 | | 6 | | 5 | | 0.01 | | 0.01 | |
LP_FSTK4 | | Ag_ppm | | 934 | | 24 | | 4.91 | | 3.43 | | 0.7 | | 17 | | 5.2 | | 4.77 | | 3.79 | | 0.01 | |
TUC-CHAP | | Metal | | MIN_CODE | | N | | Mean | | Std.Dev. | | C.V. | | Max | | Q75 | | Median | | Q25 | | Min | |
Host | | Au_ppm | | 10 | | 13377 | | 0.071 | | 0.376 | | 5.285 | | 31.4 | | 0.045 | | 0.002 | | 0.001 | | 0.001 | |
LP_HSTK | | Au_ppm | | 920 | | 2823 | | 0.12 | | 0.532 | | 4.436 | | 17.87 | | 0.07 | | 0.012 | | 0.001 | | 0.001 | |
LP_QVBX | | Au_ppm | | 700 | | 2473 | | 0.516 | | 1.566 | | 3.034 | | 48.8 | | 0.366 | | 0.114 | | 0.03 | | 0.001 | |
LP_QVBX1 | | Au_ppm | | 710 | | 2363 | | 1.298 | | 8.634 | | 6.653 | | 564 | | 0.63 | | 0.164 | | 0.066 | | 0.001 | |
LP_FSTK | | Au_ppm | | 930 | | 15408 | | 0.268 | | 1.293 | | 4.822 | | 45.77 | | 0.15 | | 0.06 | | 0.02 | | 0.001 | |
LP_FSTK3 | | Au_ppm | | 933 | | 13 | | 0.092 | | 0.175 | | 1.902 | | 0.857 | | 0.077 | | 0.044 | | 0.018 | | 0.016 | |
LP_FSTK4 | | Au_ppm | | 934 | | 24 | | 0.042 | | 0.032 | | 0.751 | | 0.15 | | 0.05 | | 0.032 | | 0.015 | | 0.015 | |
Table 14.9: Sample Statistics — 76-108 Clavo Area
76-108 CLAVO | | Metal | | MIN_CODE | | N | | Mean | | Std.Dev. | | C.V. | | Max | | Q75 | | Median | | Q25 | | Min | |
Host | | Ag_ppm | | 10 | | 11668 | | 2.08 | | 19.7 | | 9.46 | | 1525 | | 0.01 | | 0.01 | | 0.01 | | 0.01 | |
LB_HSTK | | Ag_ppm | | 900 | | 11611 | | 91.35 | | 430.22 | | 4.71 | | 16347 | | 27 | | 5 | | 1.2 | | 0.01 | |
LB_QVBX | | Ag_ppm | | 800 | | 8103 | | 177.63 | | 841.16 | | 4.74 | | 36892 | | 82 | | 19 | | 5 | | 0.01 | |
LB_NSQVBX | | Ag_ppm | | 810 | | 640 | | 168.04 | | 589.58 | | 3.51 | | 8686 | | 116 | | 24.1 | | 3.6 | | 0.01 | |
LB_FSTK | | Ag_ppm | | 910 | | 9811 | | 27.11 | | 142.15 | | 5.24 | | 4328 | | 10 | | 3.6 | | 0.9 | | 0.01 | |
LB_FSTK1 | | Ag_ppm | | 911 | | 50 | | 17.18 | | 26.78 | | 1.56 | | 110 | | 27.33 | | 3.16 | | 0.01 | | 0.01 | |
76-108 CLAVO | | Metal | | MIN_CODE | | N | | Mean | | Std.Dev. | | C.V. | | Max | | Q75 | | Median | | Q25 | | Min | |
Host | | Au_ppm | | 10 | | 11668 | | 0.044 | | 0.298 | | 6.783 | | 13.55 | | 0.008 | | 0.001 | | 0.001 | | 0.001 | |
LB_HSTK | | Au_ppm | | 900 | | 11611 | | 1.15 | | 6.299 | | 5.476 | | 263.42 | | 0.28 | | 0.05 | | 0.001 | | 0.001 | |
LB_QVBX | | Au_ppm | | 800 | | 8103 | | 3.138 | | 15.683 | | 4.998 | | 491 | | 1 | | 0.2 | | 0.034 | | 0.001 | |
LB_NSQVBX | | Au_ppm | | 810 | | 640 | | 2.502 | | 20.473 | | 8.184 | | 443.85 | | 0.93 | | 0.19 | | 0.035 | | 0.001 | |
LB_FSTK | | Au_ppm | | 910 | | 9811 | | 0.756 | | 6.105 | | 8.079 | | 526.49 | | 0.26 | | 0.067 | | 0.008 | | 0.001 | |
LB_FSTK1 | | Au_ppm | | 911 | | 50 | | 0.185 | | 0.399 | | 2.16 | | 2.96 | | 0.213 | | 0.06 | | 0.023 | | 0.001 | |
High-Grade Trimming
Each domain shows anomalous samples at the upper end of the distributions. To limit the over-extrapolation of these samples on grade estimates; high grade trimming levels were established. Statistics for each mineral type in each project area were examined and initial grade levels were
152
selected based on obvious discontinuities in the upper portions of the log-probability plots. The selection of the final trimming levels was aided by decile analysis and down-hole indicator correlation. Grades levels were also visualized in 3D to evaluate the continuity of the anomalous samples. Table 14.10 summarizes the trimming levels selected for each metal.
Table 14.10: Trimming Levels by Area and Mineral Type
| | Rosario - 1 | | Tucson-Chapotillo - 2 | | Clavo 76-108 - 3 | |
Domain | | Au
Trim | | ntrim /
total | | Ag
Trim | | ntrim /
total | | Au
Trim | | ntrim /
total | | Ag
Trim | | ntrim /
total | | Au
Trim | | ntrim /
total | | Ag
Trim | | ntrim /
total | |
LB_HSTK_800 | | 15 | | 9 / 5056 | | 1720 | | 16 / 5056 | | — | | — | | — | | — | | 75 | | 25 / 11611 | | 5110 | | 17 / 11611 | |
LB_NSQVBX_810 | | — | | — | | — | | — | | — | | — | | — | | — | | 44 | | 5 / 640 | | 2540 | | 6/ 640 | |
LB_QVBX_800 | | 23 | | 23 / 4735 | | 2450 | | 20 / 4735 | | — | | — | | — | | — | | 168 | | 18 / 8103 | | 8572 | | 19/ 8103 | |
LB_FTSK_910 | | 15 | | 29 / 15966 | | 1720 | | 24 / 15966 | | — | | — | | — | | — | | 52 | | 19 / 9811 | | 2160 | | 11 / 9811 | |
LB_FSTK1_911 | | — | | — | | — | | — | | — | | — | | — | | — | | 0.5 | | 4 / 50 | | 67 | | 4 / 50 | |
| | | | | | | | | | | | | | | | | | | | | | | | | |
LV_QVBX_999 | | 18 | | 4 / 1085 | | 1200 | | 10 / 1085 | | — | | — | | — | | — | | — | | — | | — | | — | |
| | | | | | | | | | | | | | | | | | | | | | | | | |
LP_HSTK_920 | | 19 | | 9 / 11182 | | 1740 | | 13 /11182 | | 5.65 | | 3 / 2823 | | 600 | | 8 / 2823 | | — | | — | | — | | — | |
LP_QVBX_700 | | 12 | | 14 / 3921 | | 1800 | | 3 / 3921 | | 9 | | 12 / 2473 | | 1100 | | 10 / 2473 | | — | | — | | — | | — | |
LP_QVBX1_710 | | — | | — | | — | | — | | 38 | | 13 / 2363 | | 2282 | | 8 / 2363 | | — | | — | | — | | — | |
LP_FSTK_930 | | 11 | | 7 / 5134 | | 1405 | | 5 / 5134 | | 13.7 | | 29 / 15408 | | 1130 | | 16 / 15408 | | — | | — | | — | | — | |
LP_FSTK3_933 | | — | | — | | — | | — | | — | | — | | 14 | | 1 / 13 | | — | | — | | — | | — | |
LP_FTSK4_934 | | — | | — | | — | | — | | — | | — | | — | | — | | — | | — | | — | | — | |
Cut sample statistics by project area and mineral-type are summarized in Table 14.11 to Table 14.13.
Table 14.11: Trimmed Sample Statistics — Rosario Area
ROSARIO | | Metal | | MIN_CODE | | N | | Mean | | Std.Dev. | | C.V. | | Max | | Q75 | | Median | | Q25 | | Min | |
LB_HSTK | | AgCut_ppm | | 900 | | 5056 | | 76.23 | | 196.51 | | 2.58 | | 1720 | | 52 | | 7 | | 0.6 | | 0.01 | |
LB_QVBX | | AgCut_ppm | | 800 | | 4735 | | 184.2 | | 328.55 | | 1.78 | | 2450 | | 226.88 | | 54 | | 6 | | 0.01 | |
LB_FSTK | | AgCut_ppm | | 910 | | 15966 | | 36.81 | | 133.25 | | 3.62 | | 1720 | | 16.6 | | 4.8 | | 1 | | 0.01 | |
LP_HSTK | | AgCut_ppm | | 920 | | 11182 | | 42.42 | | 128.66 | | 3.03 | | 1740 | | 22 | | 5 | | 0.01 | | 0.01 | |
LP_QVBX | | AgCut_ppm | | 700 | | 3921 | | 131.61 | | 203.66 | | 1.55 | | 1800 | | 172 | | 45.2 | | 8 | | 0.01 | |
LP_FSTK | | AgCut_ppm | | 930 | | 5134 | | 35.74 | | 105.3 | | 2.95 | | 1405 | | 17.4 | | 5.4 | | 1.6 | | 0.01 | |
LV_QVBX | | AgCut_ppm | | 999 | | 1085 | | 66.18 | | 167.68 | | 2.53 | | 1200 | | 42.3 | | 8.6 | | 1.6 | | 0.01 | |
ROSARIO | | Metal | | MIN_CODE | | N | | Mean | | Std.Dev. | | C.V. | | Max | | Q75 | | Median | | Q25 | | Min | |
LB_HSTK | | AuCut_ppm | | 900 | | 5056 | | 0.509 | | 1.488 | | 2.92 | | 15 | | 0.31 | | 0.04 | | 0.001 | | 0.001 | |
LB_QVBX | | AuCut_ppm | | 800 | | 4735 | | 1.351 | | 2.774 | | 2.053 | | 23 | | 1.37 | | 0.331 | | 0.03 | | 0.001 | |
LB_FSTK | | AuCut_ppm | | 910 | | 15966 | | 0.313 | | 1.133 | | 3.621 | | 15 | | 0.17 | | 0.05 | | 0.01 | | 0.001 | |
LP_HSTK | | AuCut_ppm | | 920 | | 11182 | | 0.353 | | 1.146 | | 3.244 | | 19 | | 0.21 | | 0.05 | | 0.007 | | 0.001 | |
LP_QVBX | | AuCut_ppm | | 700 | | 3921 | | 0.986 | | 1.753 | | 1.777 | | 12 | | 1.06 | | 0.29 | | 0.07 | | 0.001 | |
LP_FSTK | | AuCut_ppm | | 930 | | 5134 | | 0.29 | | 0.877 | | 3.026 | | 11 | | 0.19 | | 0.07 | | 0.02 | | 0.001 | |
LV_QVBX | | AuCut_ppm | | 999 | | 1085 | | 0.63 | | 1.744 | | 2.769 | | 18 | | 0.387 | | 0.101 | | 0.028 | | 0.001 | |
153
Table 14.12: Trimmed Sample Statistics — Tucson-Chapotillo Area
TUC-CHAP | | Metal | | MIN_CODE | | N | | Mean | | Std.Dev. | | C.V. | | Max | | Q75 | | Median | | Q25 | | Min | |
LP_HSTK | | AgCut_ppm | | 920 | | 2823 | | 11.29 | | 47.82 | | 4.23 | | 600 | | 5 | | 1.1 | | 0.01 | | 0.01 | |
LP_QVBX | | AgCut_ppm | | 700 | | 2473 | | 59.7 | | 130.83 | | 2.19 | | 1100 | | 54.7 | | 13.2 | | 1.8 | | 0.01 | |
LP_QVBX1 | | AgCut_ppm | | 710 | | 2363 | | 64.76 | | 219.65 | | 3.39 | | 2282 | | 35.68 | | 7.33 | | 2.5 | | 0.01 | |
LP_FSTK | | AgCut_ppm | | 930 | | 15408 | | 16.45 | | 69.87 | | 4.25 | | 1130 | | 6.9 | | 2.4 | | 0.9 | | 0.01 | |
LP_FSTK3 | | AgCut_ppm | | 933 | | 13 | | 4.01 | | 3.85 | | 0.96 | | 14 | | 6.06 | | 5 | | 0.01 | | 0.01 | |
LP_FSTK4 | | AgCut_ppm | | 934 | | 24 | | 4.91 | | 3.43 | | 0.7 | | 17 | | 5.2 | | 4.77 | | 3.79 | | 0.01 | |
TUC-CHAP | | Metal | | MIN_CODE | | N | | Mean | | Std.Dev. | | C.V. | | Max | | Q75 | | Median | | Q25 | | Min | |
LP_HSTK | | AuCut_ppm | | 920 | | 2823 | | 0.115 | | 0.418 | | 3.638 | | 5.65 | | 0.07 | | 0.012 | | 0.001 | | 0.001 | |
LP_QVBX | | AuCut_ppm | | 700 | | 2473 | | 0.481 | | 1.131 | | 2.351 | | 9 | | 0.366 | | 0.114 | | 0.03 | | 0.001 | |
LP_QVBX1 | | AuCut_ppm | | 710 | | 2363 | | 1.074 | | 3.649 | | 3.399 | | 38 | | 0.63 | | 0.164 | | 0.066 | | 0.001 | |
LP_FSTK | | AuCut_ppm | | 930 | | 15408 | | 0.249 | | 0.897 | | 3.601 | | 13.7 | | 0.15 | | 0.06 | | 0.02 | | 0.001 | |
LP_FSTK3 | | AuCut_ppm | | 933 | | 13 | | 0.092 | | 0.175 | | 1.902 | | 0.857 | | 0.077 | | 0.044 | | 0.018 | | 0.016 | |
LP_FSTK4 | | AuCut_ppm | | 934 | | 24 | | 0.042 | | 0.032 | | 0.751 | | 0.15 | | 0.05 | | 0.032 | | 0.015 | | 0.015 | |
Table 14.13: Trimmed Sample Statistics — 76-108 Clavo Area
76-108 CLAVO | | Metal | | MIN_CODE | | N | | Mean | | Std.Dev. | | C.V. | | Max | | Q75 | | Median | | Q25 | | Min | |
LB_HSTK | | AgCut_ppm | | 900 | | 11611 | | 87.64 | | 353.73 | | 4.04 | | 5110 | | 27 | | 5 | | 1.2 | | 0.01 | |
LB_QVBX | | AgCut_ppm | | 800 | | 8103 | | 159.51 | | 536.75 | | 3.37 | | 5580 | | 82 | | 19 | | 5 | | 0.01 | |
LB_NSQVBX | | AgCut_ppm | | 810 | | 640 | | 144.17 | | 365.03 | | 2.53 | | 2540 | | 116 | | 24.1 | | 3.6 | | 0.01 | |
LB_FSTK | | AgCut_ppm | | 910 | | 9811 | | 26.13 | | 120.2 | | 4.6 | | 2160 | | 10 | | 3.6 | | 0.9 | | 0.01 | |
LB_FSTK1 | | AgCut_ppm | | 911 | | 50 | | 15.41 | | 21.82 | | 1.42 | | 67 | | 27.33 | | 3.16 | | 0.01 | | 0.01 | |
76-108 CLAVO | | Metal | | MIN_CODE | | N | | Mean | | Std.Dev. | | C.V. | | Max | | Q75 | | Median | | Q25 | | Min | |
LB_HSTK | | AuCut_ppm | | 900 | | 11611 | | 1.092 | | 5.089 | | 4.661 | | 75 | | 0.28 | | 0.05 | | 0.001 | | 0.001 | |
LB_QVBX | | AuCut_ppm | | 800 | | 8103 | | 2.96 | | 12.428 | | 4.198 | | 168 | | 1 | | 0.2 | | 0.034 | | 0.001 | |
LB_NSQVBX | | AuCut_ppm | | 810 | | 640 | | 1.655 | | 5.568 | | 3.365 | | 44 | | 0.93 | | 0.19 | | 0.035 | | 0.001 | |
LB_FSTK | | AuCut_ppm | | 910 | | 9811 | | 0.657 | | 3.149 | | 4.797 | | 52 | | 0.26 | | 0.067 | | 0.008 | | 0.001 | |
LB_FSTK1 | | AuCut_ppm | | 911 | | 50 | | 0.131 | | 0.144 | | 1.096 | | 0.5 | | 0.213 | | 0.06 | | 0.023 | | 0.001 | |
Drill Hole Compositing
Drill hole assays were composited after high grade trimming to a constant 1.5m for consistency with previous estimates and to retain the reverse-circulation drilling sample support; the grade control samples from the open pit reverse-circulation drill holes were left “as-is” given a common 2m sample length for these holes. Composites were tagged with the majority mineral-type code from the samples and checked on screen. Composite statistics are summarized below in Figure 14.4 to Figure 14.6.
154
Figure 14.4: Composite Statistics by Mineral Type — Rosario Area

155
Figure 14.5: Composite Statistics by Mineral Type — Tucson-Chapotillo Area
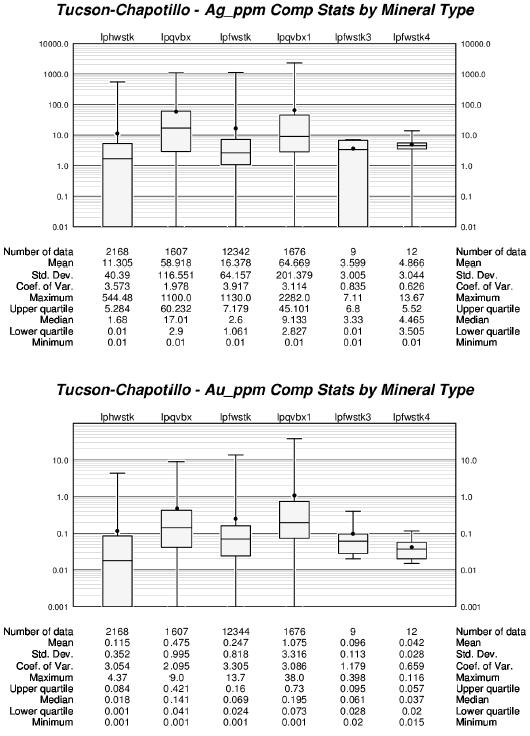
156
Figure 14.6: Composite Statistics by Mineral Type — 76-108 Clavo Area
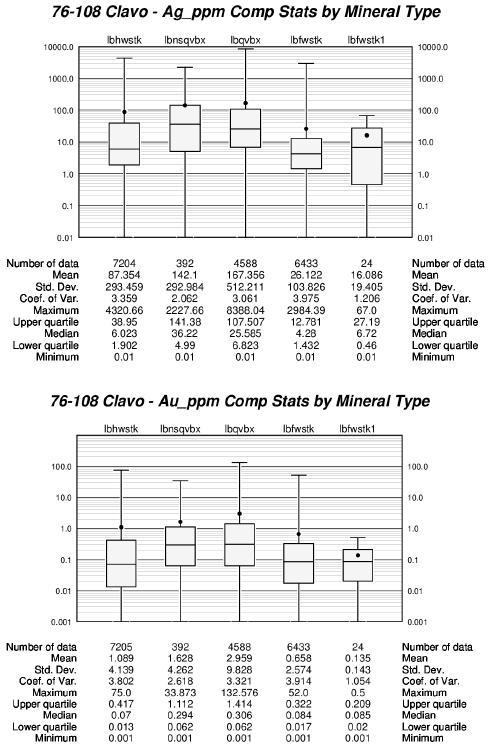
157
Composite statistics show that most domains have significant variability after high-grade trimming and compositing. Additional mineral controls were built to guide the search ellipsoid and ensure that shoot dimensions and geometries were honored.
The better grade material appears to be controlled along structural intersections with sharp “shoot” edges elongated in the down-dip direction. Vein composite statistics and log-probability plots were examined to define grade levels at obvious population breaks. Grade levels selected for both silver and gold generally correspond to the median, upper quartile, 90 percentile and 95 percentile for each metal. Indicator/probability levels are summarized in Table 14.14.
Table 14.14: Indicator Grade Levels — Ag_ppm, Au_ppm
Description | | Au (g/t) | | Au Domain | | Ag (g/t) | | Ag Domain | |
< median | | < 0.4 | | 1000 | | < 40 | | 6000 | |
median-75% | | 0.4 - 1.2 | | 2000 | | 40 - 150 | | 7000 | |
75%-90% | | 1.2 - 6.4 | | 3000 | | 150 - 620 | | 8000 | |
90%-95% | | 6.4 - 22 | | 4000 | | 620 - 1400 | | 9000 | |
>95% | | > 22 | | 5000 | | > 1400 | | 10000 | |
Models of the indicator transformed data were generated within the vein and stockwork solids using the vein axis surfaces to guide the search ellipse. The indicator models were contoured at a “probability” of equal to or greater than 0.5. Solids generated from the process (in Leapfrog) were used to code additional block model attributes as defined in Table 14.14. Three-dimensional views of the solids are shown in Figure 14.7 and Figure 14.8 for silver and gold.
Composite statistics by indicator domain and area are summarized in Figure 14.9 to Figure 14.11.
158
Figure 14.7: Ag Indicator-Probability Domain Models — 3D View Looking Northeast

Figure 14.8: Au Indicator-Probability Domain Models — 3D View Looking Northeast
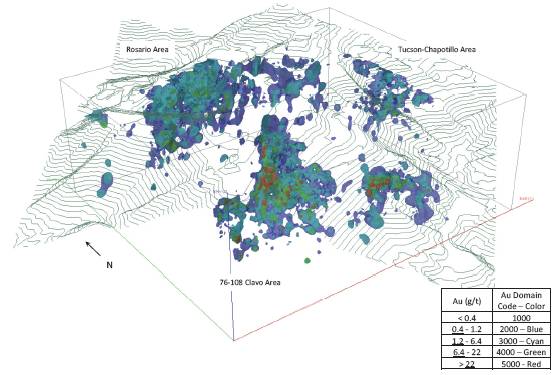
159
Figure 14.9: Composite Statistics by Indicator Domain — Rosario Area
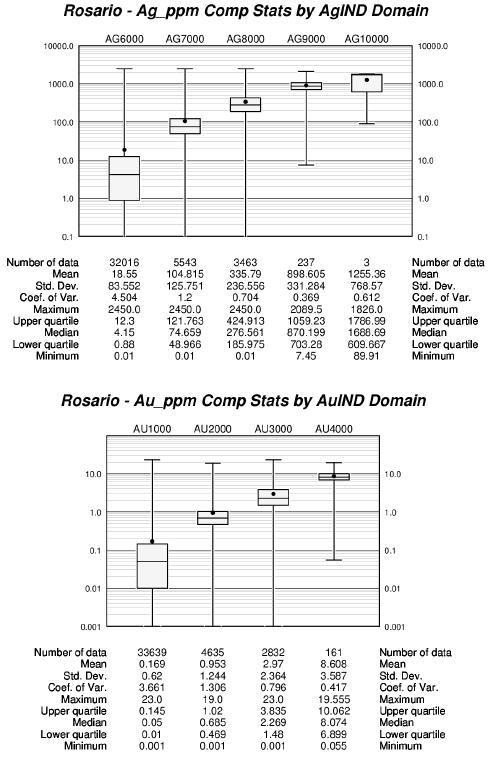
160
Figure 14.10: Composite Statistics by Indicator Domain — Tucson-Chapotillo Area
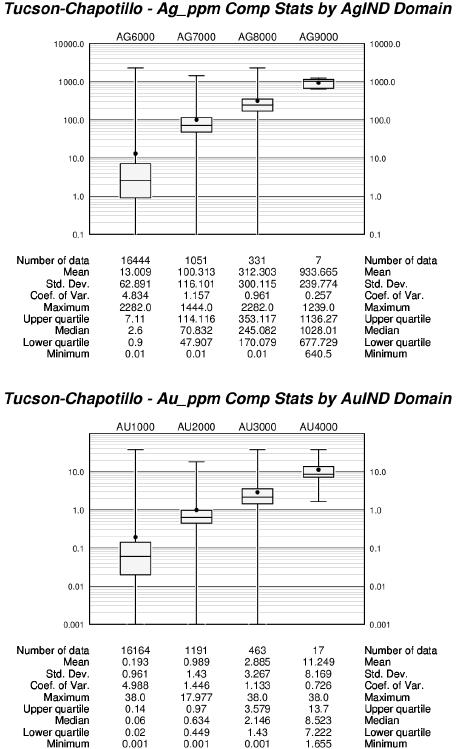
161
Figure 14.11: Composite Statistics by Indicator Domain — 76-108 Clavo Area
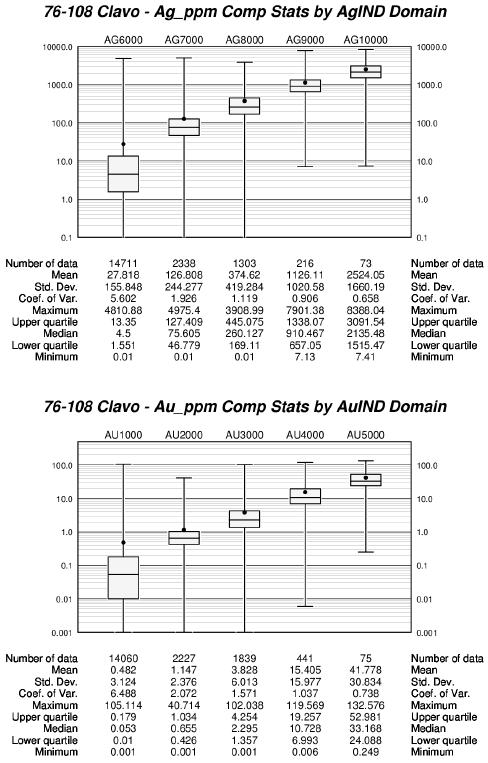
162
Spatial Correlation Studies - Variography
Spatial correlation studies for the project began with visualizing the composite data along with the vein solid models to identify the main directions of continuity in each area along the La Blanca and La Prieta structures. Main structural attitudes summarized in Table 14.15.
Table 14.15: Vein/Structure Orientations by Area
(dip, dip direction format)
/Area | | Rosario | | Tucson-Chapotillo | | 76-108 Clavo | |
ROCKCODE | | MINCODE | | Dip | | Dip Azm | | Dip | | Dip Azm | | Dip | | Dip Azm | |
| | | | | | | | | | | | | | | |
LP_QVBX | | 700 | | -60 | | 193 | | -40 | | 226 | | — | | — | |
LP_QVBX1 | | 710 | | — | | — | | -53 | | 217 | | — | | — | |
| | | | | | | | | | | | | | | |
LB_QVBX | | 800 | | -50 | | 241 | | — | | — | | -50 | | 206 | |
LB_NSQVB | | 810 | | — | | — | | — | | — | | -50 | | 226 | |
LB_HSTK | | 900 | | -50 | | 241 | | — | | — | | -50 | | 206 | |
LB_FSTK | | 910 | | -50 | | 241 | | — | | — | | -50 | | 206 | |
LB_FSTK1 | | 911 | | — | | — | | — | | — | | -47 | | 220 | |
| | | | | | | | | | | | | | | |
LP_HSTK | | 920 | | -60 | | 193 | | -40 | | 226 | | — | | — | |
LP_FSTK | | 930 | | -60 | | 193 | | -46 | | 221 | | — | | — | |
LP_FSTK3 | | 933 | | — | | — | | -55 | | 225 | | — | | — | |
LP_FSTK4 | | 934 | | — | | — | | -67 | | 232 | | — | | — | |
| | | | | | | | | | | | | | | |
LV_QVBX | | 999 | | -60 | | 210 | | — | | — | | — | | — | |
Once the main axes were identified, variograms were calculated along the selected axes and the orthogonal directions for establishing the ranges in each direction and the anisotropy ratios for each domain. Down-hole variograms were calculated and modeled for each mineral type and indicator domain to establish the nugget effect and to view the ranges of continuity along the drill strings which are nearly orthogonal to the vein structures. Correlograms and Indicator variograms at various grade thresholds were calculated within the plane of the vein and modeled to provide a measure of the change in spatial correlation with increasing grade for both metals. The ultimate ranges and anisotropy ratios were used as the search dimensions for grade estimation in each area. Experimental variogram models by mineral type for the Rosario area are summarized in Table 14.16.
163
Table 14.16: Variogram Models by Indicator Domain and Metal— Rosario Area
(median indicator — spherical models)
AUIND1000 (0.06 ppm)
C0 | | C1/C2 | | 217º azm, -51º | | 307º azm, 0º | | 37º azm, -39º | |
0.2 | | 0.30 | | 4m | | 4m | | 4m | |
| | 0.50 | | 153m | | 123m | | 54m | |
AUIND2000 (0.68 ppm)
C0 | | C1/C2 | | 217º azm, -51º | | 307º azm, 0º | | 37º azm, -39º | |
0.25 | | 0.34 | | 4m | | 4m | | 3m | |
| | 0.41 | | 102m | | 75m | | 27m | |
AUIND3000 (2.3 ppm)
C0 | | C1/C2 | | 217º azm, -51º | | 307º azm, 0º | | 37º azm, -39º | |
0.28 | | 0.38 | | 4m | | 4.5m | | 3m | |
| | 0.34 | | 72m | | 56m | | 24m | |
AUIND4000 (10 ppm)
C0 | | C1/C2 | | 217º azm, -51º | | 307º azm, 0º | | 37º azm, -39º | |
0.37 | | 0.39 | | 5m | | 5m | | 3m | |
| | 0.24 | | 72m | | 54m | | 21m | |
AUIND5000 ( 34 ppm - 76-108 Clavo)
C0 | | C1/C2 | | 206º azm, -50º | | 296º azm, 0º | | 26º azm, -40º | |
0.6 | | 0.27 | | 3m | | 3m | | 3m | |
| | 0.13 | | 42m | | 21m | | 4.5m | |
AGIND6000 (4 ppm)
C0 | | C1/C2 | | 217º azm, -51º | | 307º azm, 0º | | 37º azm, -39º | |
0.2 | | 0.28 | | 4m | | 4m | | 4m | |
| | 0.52 | | 130m | | 111m | | 51m | |
AGIND7000 (75 ppm)
C0 | | C1/C2 | | 217º azm, -51º | | 307º azm, 0º | | 37º azm, -39º | |
0.22 | | 0.32 | | 5m | | 5m | | 3m | |
| | 0.46 | | 102m | | 75m | | 27m | |
AGIND8000 (270 ppm)
C0 | | C1/C2 | | 217º azm, -51º | | 307º azm, 0º | | 37º azm, -39º | |
0.27 | | 0.42 | | 4m | | 5m | | 3m | |
| | 0.31 | | 78m | | 60m | | 21m | |
AGIND9000 (890 ppm)
C0 | | C1/C2 | | 217º azm, -51º | | 307º azm, 0º | | 37º azm, -39º | |
0.48 | | 0.35 | | 4m | | 5m | | 3m | |
| | 0.17 | | 72m | | 45m | | 21m | |
AGIND10000 (2130 ppm - 76-108 Clavo)
C0 | | C1/C2 | | 206º azm, -50º | | 296º azm, 0º | | 26º azm, -40º | |
0.64 | | 0.26 | | 3m | | 6m | | 3m | |
| | 0.10 | | 60m | | 30m | | 18m | |
14.1.5 Block Model Estimation Methodology Palmarejo
Block Model Geometry
A block model framework was used to cover the area modeled for the solids and preliminary ultimate pit limits. A standard block model was defined for the 2012 resource update.
Table 14.17 shows the block model geometry. The block model is rotated 45º counter-clockwise about the origin.
Table 14.17: Block Model Geometry
Axis | | Origin* | | Block Size (m) | | Model Extent (m) | | No. Blocks | |
X | | 756,738.388 | | 2.5 | | 1,375 | | 550 | |
Y | | 3,030,611.612 | | 2.5 | | 1,787.5 | | 714 | |
Z | | 1,270 | | 2.5 | | 570 | | 228 | |
* Origin is defined at the upper southwest corner.
164
Block Model Grade Estimation
Gold and Silver metal grades were interpolated into the block model using an inverse-distance-cubed (ID3) algorithm. Metal grades were estimated in one pass. Search distances were based on the variogram models in Table 14.17; search attitudes in each structural domain were changed to the major vein/structure attitudes in Table 14.16.
An octant search was used to help de-cluster the estimates. The search was ellipsoidal using a minimum of 1 informed octant and a maximum of 6 composites per octant. A minimum of 2 composites and a maximum of 24 composites were used for an estimate with no more than 3 composites from any one drill hole. Boundary conditions between the mineral types were kept hard, allowing only those composites within the same mineral type to estimate metal grades.
14.1.5 Block Model Validation
APGS used visual and statistical validation methods to evaluate the grade models.
Visual Validation
A visual inspection of the block model in section and plan was the first validation method used. Figure 14.12 to Figure 14.15 show example plans and sections through the 76-108 Clavo area with blocks and composites colored by silver and gold grade. The block grade estimates honor the composites and the anisotropy observed in the deposit.
165
Figure 14.12: 76-108 Clavo Blocks and Composites Colored by Silver Grade
(960m Level — ID3 Grade Model, Indicator Shells)

166
Figure 14.13: 76-108 Clavo Blocks and Composites Colored by Gold Grade
(960m Level — ID3 Grade Model — Indicator Shells)
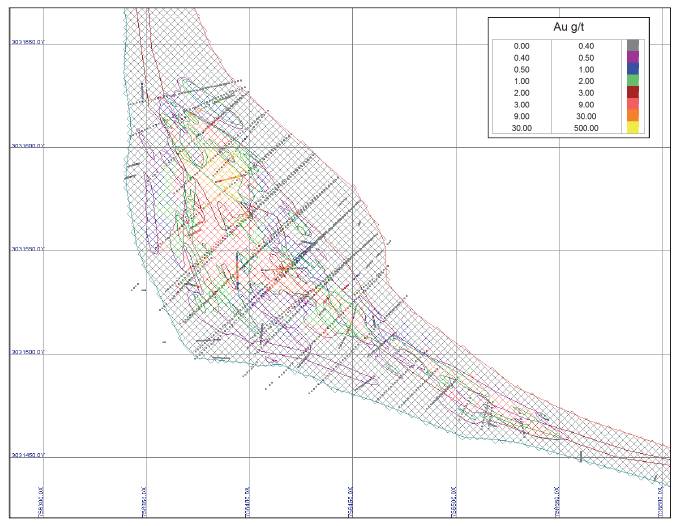
167
Figure 14.14: 76 Clavo Blocks and Composites Colored by Silver Grade
(Vertical Cross Section 100x0, Looking Northwest — ID3 Grade Model — Indicator Shells)

168
Figure 14.15: 76 Clavo Blocks and Composites Colored by Gold Grade
(Vertical Section 100x0, Looking Northwest — ID3 Grade Model — Indicator Shells)
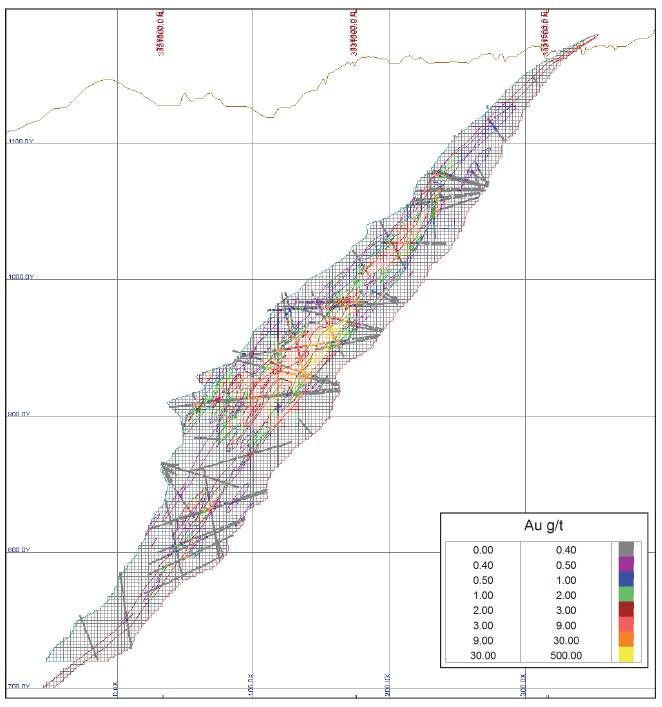
169
Grade Model and Composite Comparisons
Other checks on the grade models were simple statistical comparisons of the estimated grade models with interpolated nearest-neighbor models and drill hole composites to check for global and local bias.
Statistical comparisons of the Inverse-distance (ID) and nearest neighbor (NN) models for the Palmarejo Project are summarized in Table 14.18 by area.
170
Table 14.18: ID3 vs. NN Block Grades a: Gold and Silver Statistics
(measured + indicated blocks, ppm)
ROSARIO
AGIND | | N | | AGID Means | | AgNN Means | | %Diff | |
6000 | | 1666763 | | 6.6 | | 6.3 | | 4.9 | |
7000 | | 86192 | | 99.4 | | 104.8 | | -5.5 | |
8000 | | 42686 | | 316.8 | | 322.3 | | -1.7 | |
9000 | | 2570 | | 876.0 | | 895.6 | | -2.2 | |
10000 | | 3 | | 1355.6 | | 1155.2 | | 14.8 | |
All Grps | | 1798214 | | 19.7 | | 19.8 | | -0.6 | |
MIN | | N | | AGID Means | | AgNN Means | | %Diff | |
700 | | 129947 | | 39.6 | | 40.2 | | -1.5 | |
800 | | 105246 | | 76.5 | | 79.1 | | -3.3 | |
900 | | 148516 | | 38.2 | | 37.9 | | 0.7 | |
910 | | 673415 | | 11.0 | | 11.0 | | 0.1 | |
920 | | 509578 | | 12.0 | | 11.8 | | 1.7 | |
930 | | 198666 | | 12.2 | | 12.4 | | -1.9 | |
999 | | 32846 | | 18.7 | | 17.6 | | 5.6 | |
All Grps | | 1798214 | | 19.7 | | 19.8 | | -0.6 | |
AUIND | | N | | AUID Means | | AuNN Means | | %Diff | |
1000 | | 1691568 | | 0.07 | | 0.07 | | 0.8 | |
2000 | | 70004 | | 0.85 | | 0.88 | | -3.5 | |
3000 | | 35096 | | 2.77 | | 2.83 | | -2.1 | |
4000 | | 1749 | | 8.81 | | 9.63 | | -9.3 | |
All Grps | | 1798417 | | 0.16 | | 0.16 | | -1.6 | |
MIN | | N | | AUID Means | | AuNN Means | | %Diff | |
700 | | 129967 | | 0.30 | | 0.31 | | -3.0 | |
800 | | 105290 | | 0.57 | | 0.60 | | -4.2 | |
900 | | 148523 | | 0.29 | | 0.30 | | -0.2 | |
910 | | 673428 | | 0.10 | | 0.11 | | -2.6 | |
920 | | 509661 | | 0.10 | | 0.10 | | 1.9 | |
930 | | 198694 | | 0.11 | | 0.11 | | 0.2 | |
999 | | 32854 | | 0.18 | | 0.18 | | -0.4 | |
All Grps | | 1798417 | | 0.16 | | 0.16 | | -1.6 | |
TUCSON-CHAPOTILLO
AGIND | | N | | AGID Means | | AGNN Means | | %Diff | |
6000 | | 1021981 | | 4.0 | | 4.2 | | -4.6 | |
7000 | | 25307 | | 96.8 | | 97.6 | | -0.8 | |
8000 | | 5268 | | 343.8 | | 334.5 | | 2.7 | |
9000 | | 39 | | 847.1 | | 863.2 | | -1.9 | |
All Grps | | 1052595 | | 8.0 | | 8.1 | | -1.9 | |
MIN | | N | | AGID Means | | AGNN Means | | %Diff | |
700 | | 100680 | | 29.6 | | 30.7 | | -3.6 | |
710 | | 51090 | | 15.8 | | 16.8 | | -6.3 | |
920 | | 217617 | | 6.4 | | 6.3 | | 1.4 | |
930 | | 683208 | | 4.7 | | 4.7 | | -0.6 | |
All Grps | | 1052595 | | 8.0 | | 8.1 | | -1.9 | |
AUIND | | N | | AUID Means | | AUNN Means | | %Diff | |
1000 | | 1020036 | | 0.07 | | 0.07 | | 2.6 | |
2000 | | 25594 | | 0.91 | | 0.93 | | -2.0 | |
3000 | | 6890 | | 2.88 | | 3.08 | | -6.9 | |
4000 | | 75 | | 10.04 | | 10.55 | | -5.2 | |
All Grps | | 1052595 | | 0.11 | | 0.11 | | 0.1 | |
MIN | | N | | AUID Means | | AUNN Means | | %Diff | |
700 | | 100680 | | 0.24 | | 0.26 | | -8.9 | |
710 | | 51090 | | 0.31 | | 0.32 | | -1.3 | |
920 | | 217617 | | 0.07 | | 0.07 | | 3.3 | |
930 | | 683208 | | 0.09 | | 0.09 | | 3.1 | |
All Grps | | 1052595 | | 0.11 | | 0.11 | | 0.1 | |
76-108 CLAVOS
AGIND | | N | | AGID Means | | AgNN Means | | %Diff | |
6000 | | 668121 | | 14.4 | | 13.7 | | 4.8 | |
7000 | | 55813 | | 109.3 | | 113.5 | | -3.9 | |
8000 | | 26478 | | 336.4 | | 352.8 | | -4.9 | |
9000 | | 3156 | | 1035.8 | | 1086.0 | | -4.9 | |
10000 | | 1023 | | 2236.3 | | 2160.5 | | 3.4 | |
All Grps | | 754591 | | 40.0 | | 40.4 | | -1.0 | |
MIN | | N | | AGID Means | | AgNN Means | | %Diff | |
800 | | 138917 | | 84.9 | | 87.4 | | -2.9 | |
810 | | 10928 | | 103.6 | | 104.0 | | -0.4 | |
900 | | 284904 | | 40.4 | | 40.9 | | -1.4 | |
910 | | 319842 | | 18.0 | | 17.3 | | 3.7 | |
All Grps | | 754591 | | 40.0 | | 40.4 | | -1.0 | |
AUIND | | N | | AUID Means | | AuNN Means | | %Diff | |
1000 | | 649346 | | 0.25 | | 0.24 | | 2.5 | |
2000 | | 59076 | | 1.02 | | 1.14 | | -12.5 | |
3000 | | 38167 | | 3.73 | | 3.86 | | -3.6 | |
4000 | | 7232 | | 14.32 | | 13.40 | | 6.5 | |
5000 | | 798 | | 32.39 | | 33.78 | | -4.3 | |
All Grps | | 754619 | | 0.65 | | 0.66 | | -0.6 | |
MIN | | N | | AUID Means | | AuNN Means | | %Diff | |
800 | | 138940 | | 1.44 | | 1.52 | | -5.5 | |
810 | | 10929 | | 1.19 | | 1.16 | | 2.5 | |
900 | | 284904 | | 0.52 | | 0.52 | | 1.0 | |
910 | | 319846 | | 0.41 | | 0.39 | | 4.7 | |
All Grps | | 754619 | | 0.65 | | 0.66 | | -0.6 | |
171
These statistics show satisfactory agreement between the grade models with no significant bias by area.
A second check was between the grade models and the composites, but for only those blocks that contain composites. Block estimates were compared with the mean composite grade within the block; statistics are summarized in Table 14.19.
172
Table 14.19: ID3 Model and Mean Composite Grade Comparison: Gold and Silver Statistics (xval: composite mean)
ROSARIO
AGIND | | N | | AGID Means | | AGxval Means | | %Diff | |
6000 | | 23150 | | 16.5 | | 17.3 | | -4.8 | |
7000 | | 3944 | | 103.3 | | 104.2 | | -0.9 | |
8000 | | 2386 | | 335.6 | | 338.5 | | -0.9 | |
9000 | | 173 | | 906.3 | | 893.1 | | 1.5 | |
All Grps | | 29653 | | 58.9 | | 59.8 | | -1.5 | |
MIN | | N | | AGID Means | | AGxval Means | | %Diff | |
700 | | 2330 | | 125.3 | | 126.2 | | -0.7 | |
800 | | 2669 | | 166.1 | | 168.4 | | -1.4 | |
900 | | 3018 | | 70.4 | | 72.7 | | -3.3 | |
910 | | 10424 | | 35.1 | | 35.0 | | 0.2 | |
920 | | 7323 | | 39.6 | | 40.5 | | -2.2 | |
930 | | 3220 | | 32.3 | | 33.0 | | -2.2 | |
999 | | 669 | | 59.1 | | 63.7 | | -7.8 | |
All Grps | | 29653 | | 58.9 | | 59.8 | | -1.5 | |
AUIND | | N | | AUID Means | | AUxval | | %Diff | |
1000 | | 24284 | | 0.15 | | 0.16 | | -5.4 | |
2000 | | 3314 | | 0.92 | | 0.94 | | -1.6 | |
3000 | | 1952 | | 2.98 | | 2.99 | | -0.2 | |
4000 | | 110 | | 8.74 | | 8.61 | | 1.5 | |
All Grps | | 29660 | | 0.46 | | 0.47 | | -1.8 | |
MIN | | N | | AUID Means | | AUxval | | %Diff | |
700 | | 2330 | | 0.94 | | 0.96 | | -1.6 | |
800 | | 2670 | | 1.22 | | 1.23 | | -1.0 | |
900 | | 3018 | | 0.47 | | 0.49 | | -3.4 | |
910 | | 10430 | | 0.30 | | 0.30 | | -0.4 | |
920 | | 7323 | | 0.33 | | 0.34 | | -2.7 | |
930 | | 3220 | | 0.26 | | 0.27 | | -1.8 | |
999 | | 669 | | 0.50 | | 0.56 | | -12.1 | |
All Grps | | 29660 | | 0.46 | | 0.47 | | -1.8 | |
TUCSON-CHAPOTILLO
AGIND | | N | | AGID Means | | AGxval Means | | %Diff | |
6000 | | 11531 | | 12.2 | | 12.8 | | -4.9 | |
7000 | | 751 | | 101.0 | | 101.1 | | -0.1 | |
8000 | | 219 | | 325.9 | | 314.2 | | 3.6 | |
9000 | | 4 | | 885.3 | | 885.3 | | 0.0 | |
All Grps | | 12505 | | 23.3 | | 23.7 | | -1.5 | |
MIN | | N | | AGID Means | | AGxval Means | | %Diff | |
700 | | 1094 | | 56.5 | | 57.3 | | -1.3 | |
710 | | 1136 | | 62.5 | | 62.7 | | -0.2 | |
920 | | 1478 | | 10.9 | | 11.3 | | -4.5 | |
930 | | 8797 | | 16.2 | | 16.5 | | -2.0 | |
All Grps | | 12505 | | 23.3 | | 23.7 | | -1.5 | |
AUIND | | N | | AUID Means | | AUxval Means | | %Diff | |
1000 | | 11330 | | 0.18 | | 0.19 | | -4.6 | |
2000 | | 839 | | 0.96 | | 0.97 | | -1.2 | |
3000 | | 327 | | 2.90 | | 2.91 | | -0.2 | |
4000 | | 11 | | 12.43 | | 10.87 | | 12.5 | |
All Grps | | 12507 | | 0.32 | | 0.32 | | -2.2 | |
MIN | | N | | AUID Means | | AUxval Means | | %Diff | |
700 | | 1094 | | 0.45 | | 0.46 | | -1.1 | |
710 | | 1136 | | 1.03 | | 1.03 | | -0.4 | |
920 | | 1478 | | 0.11 | | 0.11 | | -4.0 | |
930 | | 8799 | | 0.24 | | 0.25 | | -3.4 | |
All Grps | | 12507 | | 0.32 | | 0.32 | | -2.2 | |
76-108 CLAVOS
AGIND | | N | | AGID Means | | AGxval Means | | %Diff | |
6000 | | 9964 | | 25.7 | | 27.3 | | -6.0 | |
7000 | | 1498 | | 126.2 | | 125.5 | | 0.6 | |
8000 | | 855 | | 374.3 | | 376.0 | | -0.5 | |
9000 | | 130 | | 1153.8 | | 1145.2 | | 0.7 | |
10000 | | 41 | | 2621.5 | | 2508.5 | | 4.3 | |
All Grps | | 12488 | | 81.9 | | 82.7 | | -1.0 | |
MIN | | N | | AGID Means | | AGxval Means | | %Diff | |
800 | | 3023 | | 152.4 | | 151.8 | | 0.4 | |
810 | | 273 | | 122.8 | | 127.3 | | -3.6 | |
900 | | 4867 | | 84.2 | | 86.0 | | -2.2 | |
910 | | 4325 | | 27.6 | | 28.0 | | -1.6 | |
All Grps | | 12488 | | 81.9 | | 82.7 | | -1.0 | |
AUIND | | N | | AUID Means | | AUxval Means | | %Diff | |
1000 | | 9520 | | 0.47 | | 0.50 | | -5.1 | |
2000 | | 1461 | | 1.11 | | 1.13 | | -2.3 | |
3000 | | 1193 | | 3.92 | | 3.93 | | -0.3 | |
4000 | | 279 | | 15.11 | | 15.25 | | -0.9 | |
5000 | | 36 | | 45.40 | | 42.41 | | 6.6 | |
All Grps | | 12489 | | 1.33 | | 1.35 | | -1.3 | |
MIN | | N | | AUID Means | | AUxval Means | | %Diff | |
800 | | 3023 | | 2.67 | | 2.66 | | 0.2 | |
810 | | 273 | | 1.32 | | 1.41 | | -6.7 | |
900 | | 4868 | | 1.05 | | 1.08 | | -3.2 | |
910 | | 4325 | | 0.71 | | 0.72 | | -1.2 | |
All Grps | | 12489 | | 1.33 | | 1.35 | | -1.3 | |
173
These statistics show satisfactory agreement between the estimates and the composites; no significant local bias is indicated.
No volume-variance checks were performed on the models and no adjustments were made to the models.
14.1.6 Resource Classification
For consistency with previous resource models and reports, the same classification scheme as used in past years was imposed on the current model. The classification parameters are shown in Table 14.20.
Table 14.20: Resource Classification Parameters
Resource
Category | | Distance to
Closest Composite | | Min. Comps/
Drill Holes |
Measured | | <15m | | 6 / 2 |
Indicated | | 15m to <45m for Vein/Stockwork | | 6 / 2 |
Inferred | | >45m for Vein/Stockwork | | 3 / 1 |
Because of the uncertainty in the interpretation of some portions of the void model, the void solid model was separated into three categories:
Low Confidence
Medium Confidence
High Confidence
Blocks were then downgraded to the Inferred category using the following rule:
If the block has more than 25% of low confidence voids, or
If the block has more than 75% of medium confidence voids.
14.1.7 Statement of Mineral Resources Palmarejo Deposit
This section refers only to the “Palmarejo” deposit portion of the Palmarejo District Resources. The “Guadalupe” and “La Patria” deposit portions of the Palmarejo District are discussed separately in Sections 14.2 and 14.3 of this report. The Mineral Resource for Palmarejo is effective January 1, 2012. The Mineral Reserve is a subset of the Resource (see Section 15).
The open pit portion of the Resource was based on a Whittle™ shell using current open pit mining, processing and G&A costs and the Resource metal price assumptions of $1,500/oz Au and $30.00/oz Ag. Blocks within the Whittle shell were reported at a cut-off grade of 1.03 g/t AuEq (AuEq factor based on [($Price Au) x ($Price Ag)] x (%Recovery Au)/(%Recovery Ag) x (%Payable Au)/(%Payable Ag)]; see Section 15). The open pit Mineral Resource reported in
174
Table 14.21 is based on the year-end 2011 updated block model, whose methodology is described in Section 14.1 of this report.
The underground portion of the Resource was reported from the year-end 2010 block model using current underground mining, processing and G&A costs and the same metal price assumptions as the open pit, resulting in an underground Resource cutoff of 1.92 g/t AuEq. Table 14.21 shows the total Mineral Resource for Palmarejo inclusive of Mineral Reserves. Some of these Mineral Resources have not demonstrated economic viability. Table 14.22 shows the remaining Resource for Palmarejo exclusive of Mineral Reserve, these Mineral Resources are in addition to Reserves and have not demonstrated economic viability.
Table 14.21: Total Palmarejo Deposit Total Mineral Resource- Inclusive of Mineral Reserves
Total | | | | | | Average Grade
(g/t) | | Contained Ounces | |
Resource | | Category | | Tonnes | | Au | | Ag | | Au | | Ag | |
Open Pit | | Measured | | 2,681,000 | | 1.22 | | 148.80 | | 105,000 | | 12,827,000 | |
| Indicated | | 825,000 | | 1.03 | | 135.15 | | 27,000 | | 3,586,000 | |
| Meas. and Ind. | | 3,506,000 | | 1.17 | | 145.57 | | 132,000 | | 16,413,000 | |
| Inferred | | 26,000 | | 3.87 | | 164.4 | | 3,000 | | 135,000 | |
| | | | | | | | | | | | | |
Underground | | Measured | | 3,744,000 | | 3.90 | | 240.9 | | 470,000 | | 28,997,000 | |
| Indicated | | 623,000 | | 2.83 | | 157.1 | | 57,000 | | 3,148,000 | |
| Meas. and Ind. | | 4,367,000 | | 3.75 | | 228.9 | | 526,000 | | 32,145,000 | |
| Inferred | | 144,000 | | 3.90 | | 146.3 | | 18,000 | | 679,000 | |
| | | | | | | | | | | | | |
Total | | Measured | | 6,425,000 | | 2.78 | | 202.5 | | 574,000 | | 41,824,000 | |
| Indicated | | 1,448,000 | | 1.80 | | 144.6 | | 84,000 | | 6,733,000 | |
| Meas. and Ind. | | 7,874,000 | | 2.60 | | 191.8 | | 658,000 | | 48,558,000 | |
| Inferred | | 170,000 | | 3.89 | | 149.0 | | 21,000 | | 815,000 | |
Total Mineral Resource includes Proven and Probable Reserves
Metals prices used were $1,700/oz Au and $33.00/oz Ag.
Cut-off grade for resource: open pit 0.98 g/t AuEq, underground 2.09 g/t AuEq [(Au Eq = Au g/t + (Ag g/t / 58.96)]
AuEq factor based on [(($Price Au) - ($Refining Au)) / (($Price Ag) – ($Refining Ag))] x [(%Recovery Au)/(%Recovery Ag)] x [(%Payable Au)/(%Payable Ag)]=
175
Table 14.22: Palmarejo Deposit Remaining Mineral Resource- Exclusive of Reserves
Remaining | | | | | | Average Grade
(g/t) | | Contained Ounces | |
Resource | | Category | | Tonnes | | Au | | Ag | | Au | | Ag | |
Open Pit | | Measured | | 1,111,000 | | 1.47 | | 143.89 | | 53,000 | | 5,138,000 | |
| Indicated | | 385,000 | | 1.10 | | 121.68 | | 14,000 | | 1,507,900 | |
| Meas. and Ind. | | 1,496,000 | | 1.38 | | 138.17 | | 66,000 | | 6,646,000 | |
| Inferred | | 26,000 | | 3.87 | | 164.36 | | 3,000 | | 135,000 | |
| | | | | | | | | | | | | |
Underground | | Measured | | 1,632,000 | | 4.78 | | 310.78 | | 251,000 | | 16,309,000 | |
| Indicated | | 273,000 | | 2.49 | | 117.40 | | 22,000 | | 1,031,000 | |
| Meas. and Ind. | | 1,905,000 | | 4.45 | | 283.07 | | 273,000 | | 17,339,000 | |
| Inferred | | 98,000 | | 5.72 | | 211.27 | | 18,000 | | 667,000 | |
| | | | | | | | | | | | | |
Total | | Measured | | 2,743,000 | | 3.44 | | 243.20 | | 304,000 | | 21,447,000 | |
| Indicated | | 612,000 | | 1.80 | | 128.97 | | 35,000 | | 2,538,000 | |
| Meas. and Ind. | | 3,355,000 | | 3.14 | | 222.36 | | 339,000 | | 23,986,000 | |
| Inferred | | 124,000 | | 5.34 | | 201.55 | | 21,000 | | 802,000 | |
Mineral Resources are in addition to Reserves and have not demonstrated economic viability
Metals prices used were $1,700/oz Au and $33.00/oz Ag.
Cut-off grade for resource: open pit 0.98 g/t AuEq, underground 2.09 g/t AuEq [(Au Eq = Au g/t + (Ag g/t / 58.96)]
Stockpile Reserve was subtracted from OP resource
AuEq factor based on [(($Price Au) - ($Refining Au)) / (($Price Ag) – ($Refining Ag))] x [(%Recovery Au)/(%Recovery Ag)] x [(%Payable Au)/(%Payable Ag)]=
Some Inferred material was included in the Mineral Reserve at 0 g/t Au and Ag as internal dilution (see Section 15).
14.2 Mineral Resource Estimation Methodology Guadalupe Deposit
14.2.1 Data
Klaus Triebel with Coeur’s Technical Services department updated the Guadalupe block model from data collected and interpreted by Coeur Mexicana. A model was created for estimating the silver and gold resources at Guadalupe from data generated by Coeur Mexico through July, 2012, including RC and core drilling results. Aerial photography was used to create a topographic model with two-meter contours. These data were incorporated into a digital database, and all subsequent modeling of the Guadalupe Mineral Resource was performed using GEMCOM Gems™ mining software.
The Guadalupe drillhole database used for the model update contained a total of 509 holes at the cutoff date, July 20, 2012. Four of the holes in the database (TGDH_032, TGDH_074, TGDH_199, and 1TGDH_299) were not sampled. The total drilled length for these holes is 173,173.96m including non-sampled holes; the total sampled length is 46,484.25m. Table 14.23 is a summary of drill and sample data used for the estimation of the Mineral Resource of Guadalupe. Eleven holes started as RC holes and continued as core holes (TGDH_002,
176
TGDH_007, TGDH_014, TGDH_015, TGDH_060, TGDH_070, TGDH_103, TGDH_143, TGDH_150, TGDH_155, TGDH_156).
Table 14.23: Guadalupe Resource Drill Data - YE2012 Model
| | RC | | Core | | Total | |
No. Sampled Holes in Resource Database | | 105 | | 400 | | 505 | |
Drilled Meters (Sampled Holes Only)* | | 23,382.45 | | 148,890.8 | | 172,273.25 | |
Assayed Meters** | | 16,150.51 | | 30,248.33 | | 46,398.85 | |
No. Samples in Resource DB | | 10,598 | | 31,116 | | 41,714 | |
* Eleven holes started as RC and then switched to core. Partial meters were assigned
**57 Samples (85.4m) were never assayed (NR in sample form) and are not included
Cutoff for resource data was July 20, 2012
14.2.2 Density
Density values for the Guadalupe project were obtained by both Planet Gold and Coeur personnel over a period of several years using standard water-immersion methods on dried and waxed whole-core samples of mineralized and unmineralized geologic units.
In Table 14.24, density values by rock type and the corresponding number of measurements is listed. Even though different rock types are listed for the main ore vein/breccia zones, which host the gold and silver mineralization, these units are complexly intermixed with each other and cannot separated out in a practical mining or modeling scenario so weighted averages are used for the densities.
177
Table 14.24: Guadalupe Specific - Gravity Statistics: Mineralized Core Samples
Coeur and Bolnisi Density Data Combined
Rock type | | Density | | # Samples | |
Main Ore vein/Breccia zones | | 2.54 | | 269 | |
Stockwork zones | | 2.54 | | 41 | |
Density Measurements by Coeur Staff (holes 277-313)
Rock type | | Density | | # Samples | | Original Rock codes | |
Main Ore vein/Breccia zones | | | | | | | |
carbonate breccia vein | | 2.55 | | 8 | | vn, carb, bx | |
carbonate vein | | 2.60 | | 12 | | vn, carb | |
carbonate/quartz vein | | 2.57 | | 7 | | vn, carb, qtz, +/- bx | |
quartz vein | | 2.59 | | 16 | | vn, qtz | |
breccia vein | | 2.55 | | 38 | | vn, bx | |
qtz vein | | 2.63 | | 2 | | qtz | |
carbonate breccia | | 2.43 | | 2 | | bx, carb | |
breccia | | 2.63 | | 2 | | bx | |
breccia of vein + rhyolite | | 2.52 | | 2 | | vn, bx, rhy | |
Arithmetic average | | 2.56 | | 89 | | | |
Weighted average | | 2.57 | | | | | |
| | | | | | | |
Stockwork zones | | | | | | | |
andesite porphyry w/ stwk vns | | 2.52 | | 16 | | ktap, stwk | |
rhyolite w/ qtz stockwork | | 2.54 | | 12 | | Rhy, qtz stwk | |
laminated vfg volcaniclastic w/ stwk vns | | 2.60 | | 7 | | ktal, stwk | |
find grained volcaniclastic w/ stwk vns | | 2.50 | | 6 | | stwk, qtz, Ktat | |
Arithmetic average | | 2.54 | | 41 | | | |
Weighted average | | 2.54 | | | | | |
| | | | | | | |
Lithological Units | | | | | | | |
fine grained volcaniclastic | | 2.51 | | 7 | | Ktat | |
rhyolite | | 2.61 | | 3 | | Rhy | |
andesite prophyry | | 2.65 | | 3 | | Ktap | |
fault zone | | 2.37 | | 2 | | Fit | |
Density Measurements by Bolnisi Staff (holes 1-196)
Rock type | | Density | | # Samples | | Original Rock codes | |
Main Ore vein/Breccia zones | | | | | | | |
qtz veins and breccias | | 2.53 | | 180 | | QVBX, HMBX, BX, VN | |
During 2009, Coeur has established a new protocol for density measurements that includes measurements on the stockwork zones, which are modeled separately. To date density information shows the stockwork zone to be similar to the vein/breccia zones. These zones are modeled separately but do have the same bulk density. The density assigned to the year-end 2012 Guadalupe model was 2.54 g/cm3.
14.2.3 Deposit Geology Pertinent to Resource Modeling
The primary control of the silver and gold at Guadalupe is the northwest-striking quartz-vein structure, which dips to thenortheast at approximately 50°. The structural zone that hosts the mineralization is exposed at the surface as either a distinct quartz vein breccia unit or as an intensely clay altered zone.
Near surface, the structure is usually less than 2 meters wide but as it continues down dip the structure widens out into a 10 to 35 meters wide zone of a multiphase quartz-carbonate breccia
178
and adjacent stockwork zones. The main high-grade mineralization is within the massive multiphase quartz-carbonate vein breccias that are interpreted as the main epithermal fluid conduits. Higher grade intervals, called clavos, occur where NNW cross-faults intersect the main NW breccia-bearing structures.These main structures are sub-parallel along dip and form typical sygmoidal loops and extensional veins into the footwall and hanging wall. Between the main structures are blocks of wall rock, from small to vary large, that have been variable fractured and now host quartz-carbonate stockworks. Depending on the frequency of the stockwork veins and veinlets these zones can be of ore grade.
The massive quartz-carbonate vein breccias (Vein 1 through 3) were modeled as continuous veins following typical geologic geometries found in extensional systems and the stockwork zones were modeled as adjacent zones or envelopes of variable mineralization. The model was developed on paper sections with the use of core photos, drill logs and physical inspection of the core and then transferred into GEMCOM Gems™ by constructing polylines on screen and then a set of final 3-D solids were constructed. Quartz-vein stockwork mineralization occurs in the walls of the structure. The drill data demonstrate there is silver-gold zonation, whereby silver/gold ratios decrease with depth. The lithology solids were generated by Coeur Mexicana and validated by corporate technical sevices. Minor modifications were carried out mainly by eliminating geometric errors.
Void Model
Planet Gold created a computer model of the mine workings at the Guadalupe mine based on historic plan maps, which has been used in the resource estimation process. Historic reports suggest that approximately 3,700 tonnes of material grading 458 g Ag/t were mined at the Guadalupe mine. The size of the Planet Gold model void, when compared to the entire resource, is insignificant. Removing the adit portion of the void that is in modeled waste would remove about 6,714 tonnes or approximately 0.05% of the overall resource. The Planet Gold void model was not used to deplete the Guadalupe resources and reserves reported herein.
Determination of Mineral-Type Domains
Vertical sections oriented perpendicular to the strike of the main structure were generated on 10m intervals across the Guadalupe deposit. The topographic profile and drill-hole traces were placed on the sections, with silver and gold assays colored by the grade population ranges, as well as lithology and alteration codes. These vertical sections were then interpreted by a Senior Geologist at Coeur Mexicana Exploration. This interpretation process utilized core photos and drill logs. Vein and stockwork mineral domains were interpreted and digitized on cross section. Once the sectional interpretations were completed the individual vertical sections were used to create wireframes (domain solids) in Gems™ using 3D rings and tie lines. 3D rings or tie lines were snapped to assay intervals to ensure inclusion of the correct intervals in the domain solids.
The domain codes assigned to each geologic domain is shown in Table 14.25 below.
179
Table 14.25: Guadalupe Mineral - Type Domain Codes
Domain | | Code | | Definition |
Vein1 | | 100 | | Main Vein in Structural South, Central, and North Central Domains |
Vein2 | | 101 | | Shorter Vein in Structural North Central and North Domains |
Vein3 | | 102 | | Shortest Vein in Structural North Central Domain |
Stockwork | | 200 | | Stockwork |
The three vein domain solids are restricted to areas with the logged geologic code (or observed in the case of photos) as vein1, vein2, and vein3 and depict the highest continuity with respect to geology. The additional stockwork domain is a more poorly mineralized zone of stockwork and veinlets with less continuity of mineralization and geologic structures. The stockwork solid was created in GEMCOM Gems™ in the same manner as the vein solids. These so created solids were then checked by the Qualified Person for errors. One minor issue was corrected before these wireframes were used for resource modeling.
The mineral-type domain model was further divided into four structural domains based on the attitude of the main Guadalupe structure. In the modeling process these structural domains were defined as four groups of block model rows. A plan map showing the approximate structural domains and mineral-type model is shown on Figure 14.16.
180
Figure 14.16: Guadalupe Project — Structural Domain Areas, Mineral-Type Model Coding
(10m topographic contours, mineral-type interpretation at 1180m elev.)

14.2.4 Exploratory Data Analysis (EDA)
Validated domain solids were used to back-code the raw assay intervals with geologic domain codes. This back-coding allowed the raw assays for each domain to be extracted for descriptive statistics.
181
Table 14.26 shows the sample assay statistics for gold and silver by mineral type. Figure 14.17 presents the same information graphically as box plots (Au only as an example).
Table 14.26: Guadalupe — Assay Sample Statistics by Mineral Type
| | Vein 1 - 100
Assays | | Vein2 - 101
Assays | | Vein3 - 102
Assays | | Stockwork - 200
Assays | |
| | AG | | AU | | AG | | AU | | AG | | AU | | AG | | AU | |
Number of samples | | 4270 | | 4270 | | 1325 | | 1325 | | 63 | | 63 | | 9029 | | 9029 | |
Minimum value | | 0.40 | | 0.0005 | | 2.50 | | 0.0050 | | 6.00 | | 0.0310 | | 0.60 | | 0.0005 | |
Maximum value | | 5050.0 | | 315.0 | | 5590.0 | | 101.0 | | 932.0 | | 19.6 | | 3760.0 | | 167.5 | |
Mean | | 129.337 | | 1.875 | | 156.865 | | 2.928 | | 209.994 | | 3.221 | | 42.313 | | 0.572 | |
Median | | 66.000 | | 0.570 | | 77.000 | | 1.280 | | 99.000 | | 1.270 | | 14.000 | | 0.170 | |
Geometric Mean | | 56.446 | | 0.499 | | 69.463 | | 1.200 | | 102.296 | | 1.305 | | 14.973 | | 0.162 | |
Variance | | 59474.7 | | 98.4 | | 96361.1 | | 41.6 | | 63244.4 | | 22.1 | | 11152.8 | | 5.4 | |
Standard Deviation | | 243.9 | | 9.9 | | 310.4 | | 6.5 | | 251.5 | | 4.7 | | 105.6 | | 2.3 | |
Coefficient of variation | | 1.9 | | 5.3 | | 2.0 | | 2.2 | | 1.2 | | 1.5 | | 2.5 | | 4.1 | |
Figure 14.17: Box Plots of Assay Silver grades in the four Lithology Domains
Veins 1 and 2 are very similar in nature. Vein 3 has a better average grade but the sample population is only 63 assays. The stockwork domain is clearly different from the veins with a distinctly lower grade.
High-Grade Trimming
High grade trimming was not performed on the assays but rather on the composites since the statistical support is uniform in the latter.
182
Drill Hole Compositing
Drill hole assays were composited to a constant 1.6 m length. This warranted approximately 96% of all samples to be composited and 4% to be split into shorter intervals (Figure 14.18).
Figure 14.18: Assay Length Distribution

Composites were tagged with the majority mineral-type code from the solids and checked on screen. Composite statistics are summarized below in Table 14.27. The associated graphical box plot representation is depicted in Figure 14.19.
Table 14.27: Composite Statistics for each Lithological Domain for Gold and Silver
| | Vein 1 - 100 | | Vein2 - 101 | | Vein3 - 102 | | Stockwork - 200 | |
| | Composites | | Composites | | Composites | | Composites | |
| | AG | | AU | | AG | | AU | | AG | | AU | | AG | | AU | |
Number of samples | | 2107 | | 2107 | | 750 | | 750 | | 39 | | 39 | | 5962 | | 5962 | |
Minimum value | | 0.35 | | 0.00275 | | 2.50 | | 0.01538 | | 1.08 | | 0.00345 | | 0.19 | | 0.00125 | |
Maximum value | | 3296.6 | | 219.0 | | 2606.5 | | 67.3 | | 885.5 | | 15.2 | | 2542.5 | | 53.7 | |
Mean | | 119.204 | | 1.647 | | 137.986 | | 2.539 | | 179.872 | | 2.690 | | 38.623 | | 0.519 | |
Median | | 72.938 | | 0.606 | | 80.219 | | 1.348 | | 90.750 | | 0.935 | | 17.188 | | 0.197 | |
Geometric Mean | | 63.085 | | 0.565 | | 74.077 | | 1.265 | | 86.530 | | 1.058 | | 16.954 | | 0.186 | |
Variance | | 30229.5 | | 54.3 | | 41907.9 | | 24.0 | | 48245.7 | | 14.9 | | 6297.5 | | 1.8 | |
Standard Deviation | | 173.9 | | 7.4 | | 204.7 | | 4.9 | | 219.6 | | 3.9 | | 79.4 | | 1.3 | |
Coefficient of variation | | 1.5 | | 4.5 | | 1.5 | | 1.9 | | 1.2 | | 1.4 | | 2.1 | | 2.6 | |
183
Figure 14.19: Box Plots of Composite Silver grades in the four Lithology Domains
Spatial Correlation Studies - Variography
The mineral type zones were subdivided visually into four structural domains (defined by rows of blocks) with more or less uniform orientations of the veins (Figure 14.10). Within the lithology type solids of the structural domains spatial correlation studies were carried out to identify the main directions of continuity in each wireframe along the Guadalupe structure This yielded two individual variography analyses in the south zone, three in the central zone, four in the north central zone and two in the north zone - each for gold and silver (total of 22 variographies). However, the variography for vein1 in the North-Central zone was inconclusive so that the variography of vein2 was used instead.
Once the main axes were identified pair-wise variograms were calculated along the direction of those axes. These variograms established the range along each direction and the anisotropy. The ranges and anisotropy ratios from these models were used to define the search dimensions of the search ellipsoids for grade estimation.
Experimental pair-wise exponential variography models are summarized in Table 14.28.
184
Table 14.28: Guadalupe - Pair-Wise Variography Models by Metal,, Structural Domain, and Lithology Type
Element | | Domain | | Mineral
Structure | | Nugget
Effect | | Total Sill | | Nugget
Effect in %
of Sill | | Principal
Azimuth | | Principal
Dip | | Intermediate
Azimuth | | Major
Ellipsoid
Dimension | | Intermediate
Ellipsoid
Dimension | | Minor
Ellipsoid
Dimension | |
Ag | | South | | Vein1 | | 0.135 | | 0.607 | | 22 | % | 108 | | -4 | | 13 | | 150 | | 83 | | 49 | |
Ag | | South | | Stockwork | | 0.182 | | 0.697 | | 26 | % | 58 | | -49 | | 301 | | 105 | | 105 | | 24 | |
Ag | | Central | | Vein1 | | 0.147 | | 0.625 | | 24 | % | 165 | | 11 | | 268 | | 82 | | 82 | | 49 | |
Ag | | Central | | Vein2 | | 0.152 | | 0.618 | | 25 | % | 177 | | 32 | | 312 | | 70 | | 70 | | 25 | |
Ag | | Central | | Stockwork | | 0.288 | | 0.793 | | 36 | % | 113 | | -43 | | 343 | | 100 | | 99 | | 49 | |
Ag | | North Central | | Vein1 | | 0.175 | | 0.593 | | 30 | % | 167 | | 59 | | 293 | | 114 | | 69 | | 25 | |
Ag | | North Central | | Vein2 | | 0.175 | | 0.593 | | 30 | % | 167 | | 59 | | 293 | | 114 | | 69 | | 25 | |
Ag | | North Central | | Vein3 | | 0.202 | | 1.001 | | 20 | % | 161 | | 59 | | 292 | | 62 | | 62 | | 31 | |
Ag | | North Central | | Stockwork | | 0.382 | | 0.920 | | 42 | % | 130 | | 12 | | 237 | | 100 | | 100 | | 49 | |
Ag | | North | | Vein2 | | 0.211 | | 0.583 | | 36 | % | 125 | | 53 | | 259 | | 111 | | 48 | | 24 | |
Ag | | North | | Stockwork | | 0.110 | | 0.753 | | 15 | % | 91 | | -43 | | 294 | | 135 | | 83 | | 34 | |
Au | | South | | Vein1 | | 0.204 | | 0.832 | | 25 | % | 116 | | 4 | | 214 | | 157 | | 62 | | 26 | |
Au | | South | | Stockwork | | 0.136 | | 0.764 | | 18 | % | 139 | | 9 | | 238 | | 108 | | 77 | | 24 | |
Au | | Central | | Vein1 | | 0.218 | | 0.706 | | 31 | % | 148 | | -9 | | 47 | | 100 | | 68 | | 22 | |
Au | | Central | | Vein2 | | 0.165 | | 0.622 | | 26 | % | 236 | | 56 | | 346 | | 125 | | 106 | | 26 | |
Au | | Central | | Stockwork | | 0.288 | | 0.775 | | 37 | % | 82 | | -50 | | 339 | | 100 | | 100 | | 32 | |
Au | | North Central | | Vein1 | | 0.223 | | 0.871 | | 26 | % | 142 | | 5 | | 239 | | 68 | | 68 | | 20 | |
Au | | North Central | | Vein2 | | 0.181 | | 0.625 | | 29 | % | 226 | | 54 | | 311 | | 101 | | 101 | | 10 | |
Au | | North Central | | Vein3 | | 0.183 | | 1.061 | | 17 | % | 155 | | 48 | | 286 | | 95 | | 83 | | 40 | |
Au | | North Central | | Stockwork | | 0.646 | | 2.131 | | 30 | % | 104 | | -20 | | 351 | | 105 | | 105 | | 34 | |
Au | | North | | Vein2 | | 0.203 | | 0.648 | | 31 | % | 131 | | 47 | | 275 | | 161 | | 99 | | 50 | |
Au | | North | | Stockwork | | 0.230 | | 0.719 | | 32 | % | 53 | | -60 | | 288 | | 104 | | 104 | | 26 | |
14.2.5 Block Model Estimation Methodology Guadalupe
Block Model Geometry
A block model framework was created to cover the modeled area and encapsulate all geologic domains to be used in the Guadalupe year-end 2012 interpolation process. In analogy to the composite coding process blocks were likewise coded by the lithology solids on a percent basis. The Guadalupe block model geometry was rotated 45 degrees counter-clockwise to orient the blocks relative to the strike of the Guadalupe domains. Figure 14.20 shows the rotated block model geometry, the Guadalupe stockwork solid, and block model parameters as an insert table. Last year’s smaller model extension is shown for comparison.
185
Figure 14.20: Block Model Geometry
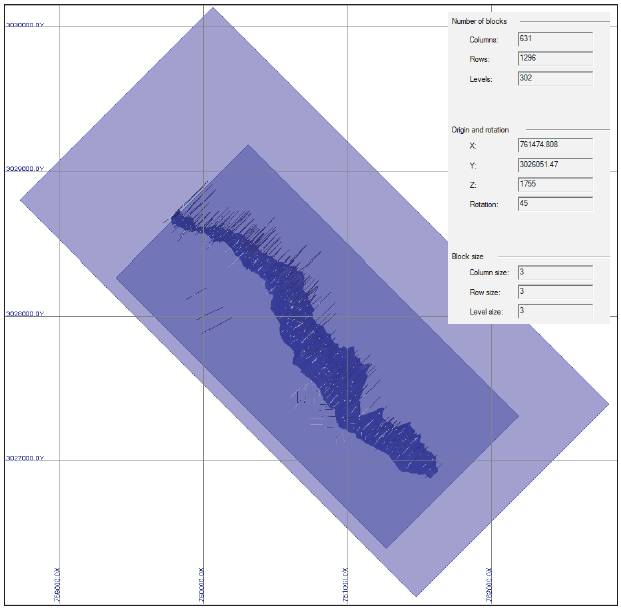
Block Model Grade Estimation
Gold and Silver metal grades were interpolated into the block model using an inverse-distance-squared (ID2), ordinary kriging and nearest neighbor algorithms. Search dimensions and directions were based on variogram models for each area and lithology type. Search parameters are summarized on Table 14.29
A minimum of 1 composite and a maximum of 25 composites were used for an estimate with no more than 3 composites from any one drill hole. Boundary conditions between the mineral types were kept hard, allowing only those composites within the corresponding mineral type to
186
estimate grade. Boundary conditions between structural domains were kept soft allowing for smooth transitions between those. The process applied wac constrained to four segments of block rows (Table 14.29).
Table 14.29: Structural Domain Definitions
| Structural Domain | | Block Rows | | |
| South | | 1 to 410 | | |
| Central | | 411 to 568 | | |
| North Central | | 569 to 911 | | |
| North | | 912 1296 | | |
14.2.6 Block Model Validation
Visual and statistical validation methods were used to evaluate the quality of the grade models for Guadalupe.
Visual Validation
A visual inspection of the block model in vertical section was the first validation method used. Blocks, and composites were shown on the section and reviewed for how well blocks matched the composite data. Possible issues with domain coding of composites can be seen this way as well. Figure 14.21 is an example of a vertical section (section 1170) showing Vein1 (red) surrounded by the Stockwork domain (blue) with blocks and composites colored by silver grade. Figure 14.22 shows the same section colored by gold grade. The block grade estimates honor the composites and the anisotropy observed in the deposit. There were no observable high-grade over-projections, and blocks showed good local variability and trend orientations in agreement with what one would expect based on geology. Overall the model was found to be consistent with drill hole and composite information.
187
Figure 14.21: Ag Consolidated Block Model ID2 Grades vs. Ag Composites in g/t
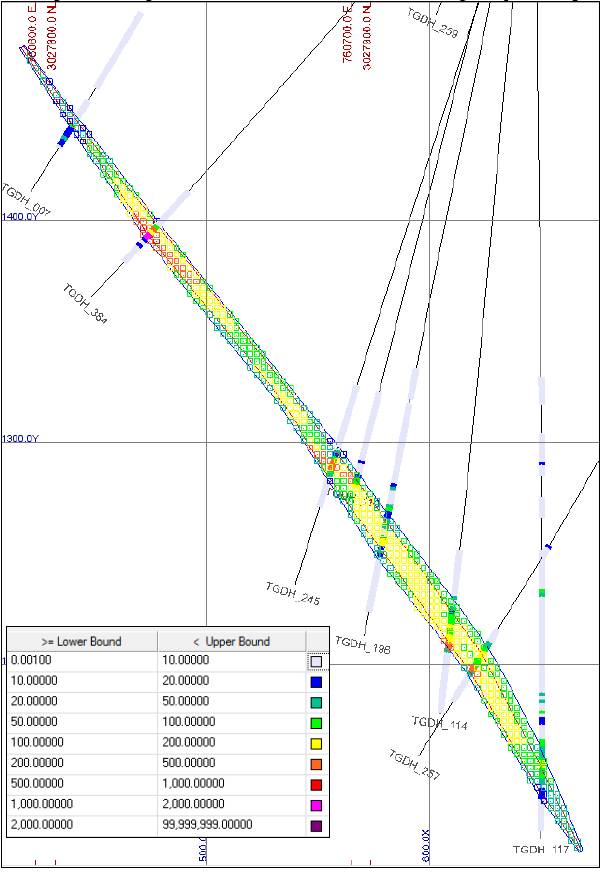
188
Figure 14.22: Au Consolidated Block Model ID2 Grades vs. Au Composites in g/t
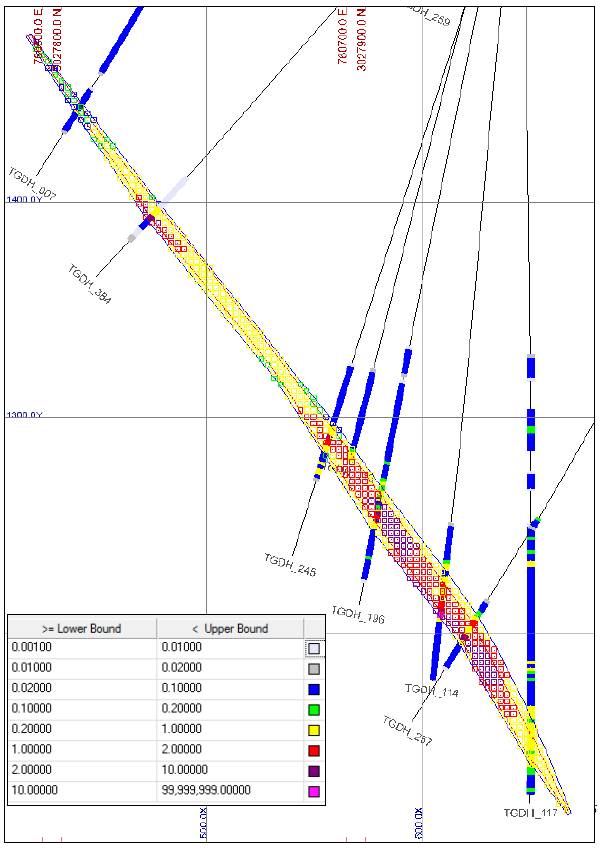
189
Grade Trend / Swath Plots
Grade trend or Swath plots were prepared comparing Au and Ag model grades from the three different interpolation methods (Inverse Distance, Kriging and Nearest Neighbor), taking into account Measured and Indicated category blocks only. As examples Figure 14.23 and Figure 14.24 show the swath plots for gold and silver of block rows (which are most perpendicular to the extension of the mineralization) and block elevations.
Figure 14.23: Guadalupe YE2012 Vein Domains -Swath Plots by Row—MI Blocks
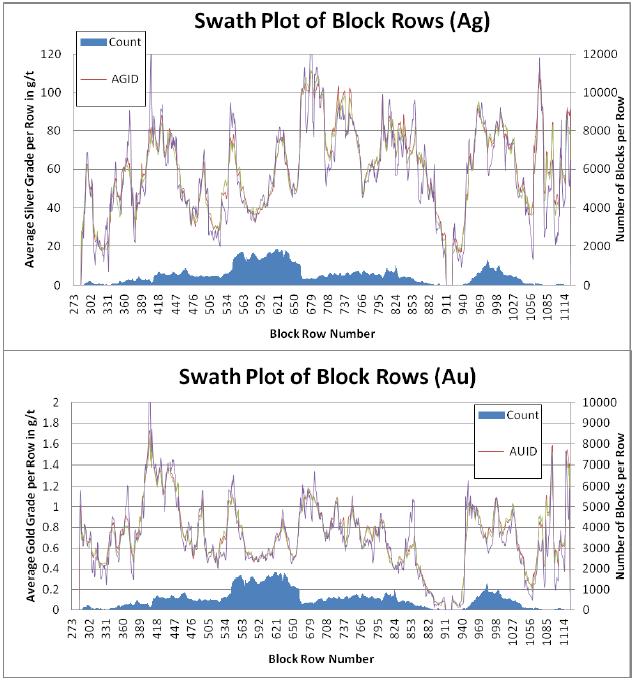
190
Figure 14.24: Guadalupe YE2012 Vein Domains - Swath Plots by Bench — MI Blocks
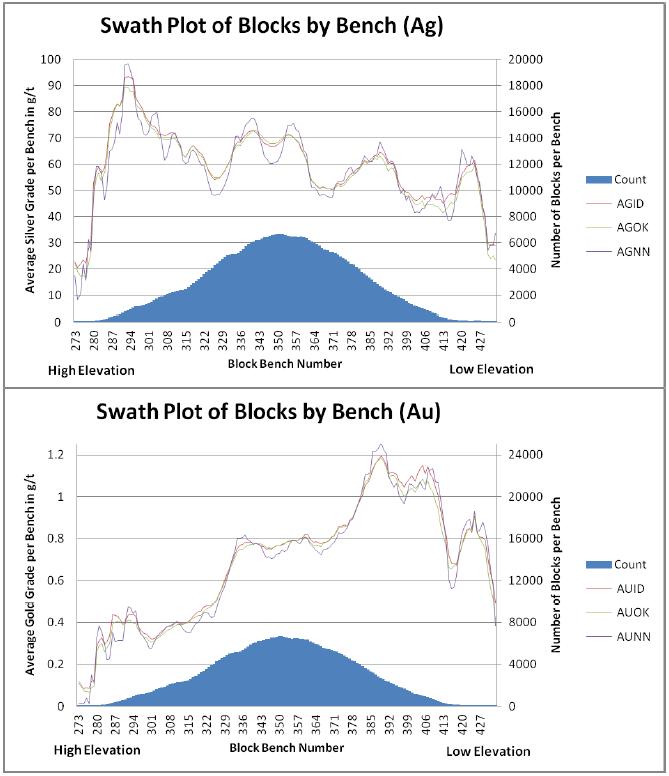
191
Overall, gold and silver grades tracked well amongst the three interpolated grades with the Nearest Neighbor method meandering around the other two. Kriging and ID2 grades are closest when a high number of blocks was averaged and deviate from another at low block counts. Also visible in the bench graphs is a grade dependency with elevation. Silver grades decrease and gold grades increase with depth. The Qualified Person believes the swath plots show no significant issues with the model.
Grade Model and Composite Comparisons
Other checks on the grade models were simple statistical comparisons of the estimated grade models with the composites to check for global bias. Estimated block grades and composite grade statistics for individual rock types of the Guadalupe Project are summarized in Table 14.30.
Table 14.30: Block Grades and Composite Grades Comparison by Rock Type: Gold and Silver Statistics)
| | Vein 1 - 100 | | Vein2 - 101 | | Vein3 - 102 | | Stockwork - 200 | |
| | Composites | | Blocks | | Composites | | Blocks | | Composites | | Blocks | | Composites | | Blocks | |
| | AG | | AU | | AGID | | AUID | | AG | | AU | | AGID | | AUID | | AG | | AU | | AGID | | AUID | | AG | | AU | | AGID | | AUID | |
Number of samples | | 2,107 | | 2,107 | | 164,322 | | 164,322 | | 750 | | 750 | | 49,077 | | 49,077 | | 39 | | 39 | | 929 | | 929 | | 5,962 | | 5,962 | | 435,664 | | 435,664 | |
Minimum value | | 0.35 | | 0.00275 | | 0.49 | | 0.01157 | | 2.50 | | 0.01538 | | 3.21 | | 0.03720 | | 1.08 | | 0.00345 | | 5.75 | | 0.08683 | | 0.19 | | 0.00125 | | 0.02 | | 0.00022 | |
Maximum value | | 3296.6 | | 219.0 | | 867.5 | | 8.9 | | 2606.5 | | 67.3 | | 1366.0 | | 10.9 | | 885.5 | | 15.2 | | 550.4 | | 10.5 | | 2542.5 | | 53.7 | | 491.4 | | 7.5 | |
Mean | | 119.204 | | 1.647 | | 113.835 | | 1.203 | | 137.986 | | 2.539 | | 145.404 | | 2.218 | | 179.872 | | 2.690 | | 188.891 | | 2.847 | | 38.623 | | 0.519 | | 34.891 | | 0.481 | |
Median | | 72.938 | | 0.606 | | 97.398 | | 0.980 | | 80.219 | | 1.348 | | 109.959 | | 1.809 | | 90.750 | | 0.935 | | 166.631 | | 2.029 | | 17.188 | | 0.197 | | 28.245 | | 0.346 | |
Geometric Mean | | 63.085 | | 0.565 | | 91.105 | | 0.904 | | 74.077 | | 1.265 | | 110.981 | | 1.814 | | 86.530 | | 1.058 | | 154.893 | | 2.076 | | 16.954 | | 0.186 | | 27.389 | | 0.330 | |
Variance | | 30229.5 | | 54.3 | | 6294.3 | | 0.8 | | 41907.9 | | 24.0 | | 17946.2 | | 2.4 | | 48245.7 | | 14.9 | | 12933.3 | | 5.1 | | 6297.5 | | 1.8 | | 727.8 | | 0.2 | |
Standard Deviation | | 173.9 | | 7.4 | | 79.3 | | 0.9 | | 204.7 | | 4.9 | | 134.0 | | 1.6 | | 219.6 | | 3.9 | | 113.7 | | 2.3 | | 79.4 | | 1.3 | | 27.0 | | 0.5 | |
Coefficient of variation | | 1.5 | | 4.5 | | 0.7 | | 0.8 | | 1.5 | | 1.9 | | 0.9 | | 0.7 | | 1.2 | | 1.4 | | 0.6 | | 0.8 | | 2.1 | | 2.6 | | 0.8 | | 1.0 | |
These statistics show satisfactory agreement between the grade models and composites; there is no indication of significant global bias.
14.2.7 Classification Scheme
Blocks received a classification status based on the number of composites found to interpolate the grade, number of holes these composites came from, distance to the closest composite and the average distance of all composites Table 14.31 shows the distribution of these criteria. The average distance had to be determined individually for each lithology within each structural domain since differently sized ellipsoids were used and larger ellipsoids of course yielded increased average distances. The thresholds were established as the 16th and 84th percentile of the length distribution within each of the 11 domains.
192
Table 14.31: Classification Criteria
| | Minimum
number of
drillholes | | Minimum
number of
composites | | Maximum
distance of
closest
composite
[m] | | Maximum
average
distance* of
composites
[m] |
Measured | | 9 | | 25 | | 35 | | @16% of CPP |
Indicated | | 7 | | 20 | | 35 | | @84% of CPP |
Inferred | | Every block that has an interpolated grade for Ag and Au |
*Distances in Cumulative Probability Plots (CPP) per lithology and structural domain for Measured (M) and Indicated (I)
South – Vein1 | | M: 40 m; I: 63 m |
South – Stockwork | | M: 42 m; I: 63 m |
Central – Vein1 | | M: 39 m; I: 56 m |
Central – Vein2 | | M: 33 m; I: 50 m |
Central – Stockwork | | M: 36 m; I: 63 m |
North Central – Vein1 | | M: 39 m; I: 53 m |
North Central – Vein2 | | M: 35 m; I: 57 m |
North Central – Vein3 | | M: 31 m; I: 39 m |
North Central – Stockwork | | M: 34 m; I: 50 m |
North – Vein2 | | M: 39 m; I: 53 m |
North – Stockwork | | M: 43 m; I: 62 m |
Following the completion of the silver and gold estimations and classification of blocks, the 3m x 3m x 3m consolidated block model was passed to Coeur Technical Services engineers for Mineral Reserve definition work. No volume-variance adjustments were made to the block models.
14.2.8 Statement of Mineral Resources Guadalupe Deposit
The Guadalupe Resources are conform to the definitions adopted by the Canadian Institute of Mining, Metallurgy and Petroleum (“CIM”), November, 2010, and meet the criteria of those definitions. The Qualified Person for this Technical Report believes the methods employed were appropriate and that the resultant Mineral Resources are compliant with CIM NI43-101 standards.
The Mineral Resources for the Guadalupe deposit, effective January 1, 2013, were calculated using a cut-off grade which used metals prices of $1,700/oz Au and $33.00/oz Ag in conjunction with cost and recovery assumptions based on operating experience at Palmarejo (see Section 21). The Mineral Resource cutoff grade for Guadalupe using these criteria was 2.14 g/t AuEq and the resultant Mineral Resources are summarized in metric units in Tables 14.32 and 14.33.
193
Table 14.32: Guadalupe Deposit Mineral Resource Inclusive of Mineral Reserves
Total | | | | | | Average Grade
(g/t) | | Contained Ounces | |
Resource | | Category | | Tonnes | | Au | | Ag | | Au | | Ag | |
Open Pit | | Measured | | 191,000 | | 2.09 | | 170.6 | | 13,000 | | 1,047,000 | |
| Indicated | | 1,066,000 | | 0.91 | | 124.8 | | 31,000 | | 4,277,000 | |
| Meas. and Ind. | | 1,256,000 | | 1.09 | | 131.8 | | 44,000 | | 5,324,000 | |
| Inferred | | 464,000 | | 0.88 | | 125.1 | | 13,000 | | 1,866,000 | |
| | | | | | | | | | | | | |
Underground | | Measured | | 1,487,000 | | 1.58 | | 140.3 | | 76,000 | | 6,707,000 | |
| Indicated | | 6,651,000 | | 1.68 | | 133.0 | | 360,000 | | 28,433,800 | |
| Meas. and Ind. | | 8,138,000 | | 1.66 | | 134.3 | | 436,000 | | 35,141,000 | |
| Inferred | | 3,639,000 | | 2.09 | | 145.1 | | 245,000 | | 16,975,000 | |
| | | | | | | | | | | | | |
Total | | Measured | | 1,678,000 | | 1.64 | | 143.7 | | 89,000 | | 7,754,000 | |
| Indicated | | 7,716,000 | | 1.58 | | 131.9 | | 391,000 | | 32,711,000 | |
| Meas. and Ind. | | 9,395,000 | | 1.59 | | 134.0 | | 480,000 | | 40,465,000 | |
| Inferred | | 4,102,000 | | 1.95 | | 142.8 | | 258,000 | | 18,841,000 | |
Total Mineral Resource includes Proven and Probable Reserves |
Metals prices used were $1,700/oz Au and $33.00/oz Ag. |
Cut-off grade for resource: open pit 1.03 g/t AuEq, underground 2.14 g/t AuEq [(Au Eq = Au g/t + (Ag g/t / 58.96)] |
AuEq factor based on [(($Price Au) - ($Refining Au)) / (($Price Ag) – ($Refining Ag))] x [(%Recovery Au)/(%Recovery Ag)] x [(%Payable Au)/(%Payable Ag)]= |
194
Table 14.33: Guadalupe Deposit Remaining Mineral Resource- Exclusive of Reserves
Remaining | | | | | | Average Grade
(g/t) | | Contained Ounces | |
Resource | | Category | | Tonnes | | Au | | Ag | | Au | | Ag | |
Open Pit | | Measured | | 7,000 | | 0.35 | | 63.4 | | 0 | | 14,000 | |
| Indicated | | 686,000 | | 0.83 | | 112.6 | | 18,000 | | 2,484,000 | |
| Meas. and Ind. | | 693,000 | | 0.82 | | 112.1 | | 18,000 | | 2,499,000 | |
| Inferred | | 464,000 | | 0.88 | | 125.1 | | 13,000 | | 1,866,000 | |
| | | | | | | | | | | | | |
Underground | | Measured | | 140,000 | | 2.50 | | 279.3 | | 11,000 | | 1,258,000 | |
| Indicated | | 1,420,000 | | 2.29 | | 178.9 | | 105,000 | | 8,170,000 | |
| Meas. and Ind. | | 1,561,000 | | 2.31 | | 187.9 | | 116,000 | | 9,429,000 | |
| Inferred | | 3,490,000 | | 2.18 | | 151.3 | | 245,000 | | 16,975,000 | |
| | | | | | | | | | | | | |
Total | | Measured | | 147,000 | | 2.39 | | 269.1 | | 11,000 | | 1,273,000 | |
| Indicated | | 2,107,000 | | 1.82 | | 157.3 | | 123,000 | | 10,654,000 | |
| Meas. and Ind. | | 2,254,000 | | 1.85 | | 164.6 | | 134,000 | | 11,927,000 | |
| Inferred | | 3,954,000 | | 2.03 | | 148.2 | | 258,000 | | 18,841,000 | |
Mineral Resources are in addition to Reserves and have not demonstrated economic viability |
Metals prices used were $1,700/oz Au and $33.00/oz Ag. |
Cut-off grade for resource: open pit 1.03 g/t AuEq, underground 2.14 g/t AuEq [(Au Eq = Au g/t + (Ag g/t / 58.96)] |
AuEq factor based on [($Price Au) - ($Refining Au)) x (($Price Ag) - ($Refining Ag))] x (%Recovery Au)/(%Recovery Ag) x (%Payable Au)/(%Payable Ag)] |
Some Inferred material was included in the Mineral Reserve at 0 g/t Au and Ag as internal dilution (see Section 15). |
14.3 Mineral Resource Estimation Methodology La Patria
14.3.1 Data
Gold and silver mineralization at La Patria was originally modeled by MDA (Gustin, 2007) in September 2007 using data generated by Planet Gold through late September 2007 Drilling was not performed again at the project site until May 2011. A new resource estimate was completed for 2012 by Coeur’s Technical Services department with some guidance by Applied Geoscience, LLC.
The Patria drill hole database used for the current model update in 2012 contained a total of 200 holes at the cutoff date. The total drilled length for these holes is 42,349.7 m; the total sampled length is 25,638.9 m.
In addition to the drill holes, the database contains 3,341.8 meters of surface trenching in 84 trenches collected in late 2011. The trench sample data were used for modeling mineralization but not in grade estimation. The Resource database is summarized in Table 14.34. The cutoff date for drilling included in the resource model was October 3, 2012.
195
Table 14.34: Coeur Mexicana La Patria Drill-Hole Database
Summary- Data Included in Resource Estimate 2012
| | RC | | Core | | Total | |
No. Sampled Holes in Resource Database | | 80 | * | 120 | | 200 | |
Drilled Meters | | 14,014 | | 28,336 | | 42,350 | |
Sampled Meters | | 13,852 | | 11,261 | | 25,113 | |
No. Samples in Resource DB | | 9,090 | | 10,005 | | 19,095 | |
*13 RC holes do not have downhole surveys
These data were incorporated into a digital database and all subsequent modeling of the Patria Deposit Resource was performed using GEMCOM Gems™ software.
A review of the drillhole pierce points through the geologic vein solid shows that approximately one half of the drillhole intercepts are spaced more than 50 meters apart. The graph is shown in Figure 14.25.
Figure 14.25: La Patria — Drillhole — Vein Intersection Separation Distance

14.3.2 Material Density
Planet Gold and Coeur Mexicana personnel performed dry bulk specific-gravity measurements using standard water-immersion methods on 210 dried and waxed whole-core samples of mineralized units (Table 14.35).
196
Table 14.35: La Patria — Specific - Gravity Statistics: Mineralized Core Samples
| | No. Samples | | Min | | Max | | Mean | |
Vein | | 51 | | 2.07 | | 2.93 | | 2.49 | |
Stockwork | | 46 | | 2.2 | | 2.66 | | 2.49 | |
Mineralized Host | | 113 | | 0.92 | | 3.05 | | 2.46 | |
*All values greater than 6 were removed from the analysis
A density of 2.49 g/m3 was assigned to the modeled mineralized zones.
14.3.3 Geological Model
Gold and silver mineralization at La Patria occurs in northwest-striking quartz ± carbonate breccia veins enveloped by variably developed quartz hydrothermal breccias. These mineralized structures dip 45-50° to the northeast and are accompanied by associated quartz-stockwork zones. The breccia veins range in thickness from less than a meter up to 15 meters in true width. Several hanging-wall splays occur within the upper 100m of the system, and these merge with the principal structure at depth. Quartz-stockwork zones are typically developed in the hanging-wall blocks, whereas narrow veins are hosted in the footwall block. La Patria appears to represent a partially preserved epithermal system that is more deeply eroded than Guadalupe.
The La Patria mineralization was modeled on cross sections, which were used to code the block model directly; no plan interpretations were completed. Gold and silver were modeled and estimated independently.
Void Model
Planet Gold also created a model of the La Patria mine workings located within the La Patria Resource model. Historic data, as well as visual inspection of accessible portions of the workings, suggest that the La Patria mine consisted of three levels. Accessible portions of the lowermost level have been surveyed by Planet Gold, and these data have been combined with historic maps to create the three-dimensional computer model. This model was used to remove mined tonnes and grade from the La Patria Resource herein.
Determination of Mineral-Type Domains
Vertical sections oriented perpendicular to the strike of the main structure were generated on 10m intervals across the La Patria deposit. The topographic profile and drill-hole traces were placed on the sections, with silver and gold assays colored by the grade population ranges, as well as lithology mineralizationcodes. These vertical sections were then interpreted by Senior Geologists at Coeur Mexicana Exploration and Coeur d’Alene Mining Corporation Technical Services. This interpretation process utilized core photos and drill logs. Vein, stockwork, and mineralized host domains were interpreted and digitized on section. The mineral control model consisted of 3 mineral-type domains: vein or quartz breccia, stockwork material, and a mineralized host zone typically surrounding stockwork material but occasionally modeled along
197
structural splays from the vein-stockwork system. Mineralized host is essentially a weak stockwork/stringer vein domain with low grade gold and silver mineralization.
Once the sectional interpretations were completed the individual vertical sections were used to create wireframes (domain solids) in Gems™ using 3D rings and tie lines. 3D rings or tie lines were snapped to assay intervals to ensure inclusion of the correct intervals in the domain solids. Axis lines were completed on plan views at 20m intervals to check the vertical section interpretation..
Codes assigned to each mineral-type domain are shown in Table 14.36 below.
Table 14.36: La Patria — Mineral Type Domain Coding
Domain | | Code | | Definition | |
QVBX | | 100 | | Main La Patria Vein and Splays | |
STKWK | | 260 | | Stockwork Material | |
MINHOST | | 360 | | Mineralized Host | |
HOST | | 10 | | Unmineralized Wallrock | |
VOID | | 20 | | Historic Mining Voids | |
A plan map showing the vein and stockwork model is shown in Figure 14.26
198
Figure 14.26: La Patria — Structural Domain Areas, Vein Model
(10m topographic contours, mineral-type interpretation at 1260m elev.)
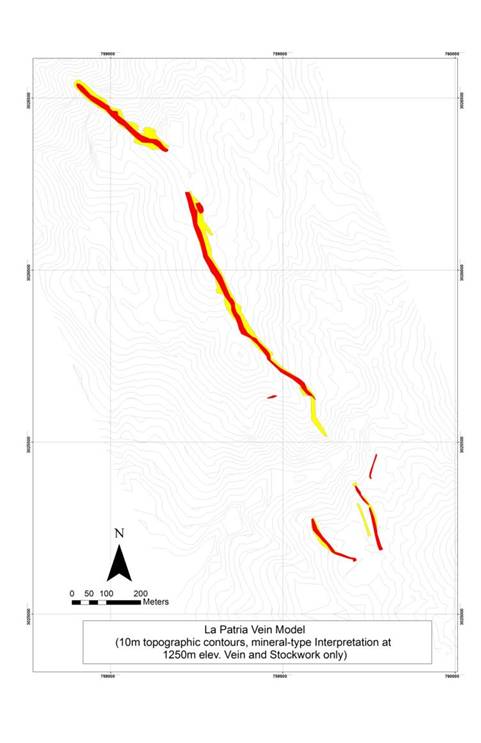
199
14.3.4 Exploratory Data Analysis (EDA)
Validated domain solids were used to code the original sample intervals with mineral-type domain codes. Sample statistics were calculated for each metal and mineral-type. Figures 14.27 and 14.28 as well as Table 14.37 show the sample assay statistics for gold and silver by mineral type.
Table 14.37: La Patria - Sample Statistics by Mineral Type
Min Type | | Code | | Metal | | N | | Mean | | Std.Dev. | | C.V. | | Max | | Q75 | | Med | | Q25 | | Min | |
QVBX | | 100 | | Au_ppm | | 738 | | 2.05 | | 5.74 | | 2.80 | | 123 | | 1.93 | | 0.73 | | 0.23 | | 0.001 | |
QVBX | | 100 | | Ag_ppm | | 738 | | 54.00 | | 130.19 | | 2.41 | | 1895 | | 52.75 | | 13 | | 5 | | 1 | |
STKWK | | 250 | | Au_ppm | | 1949 | | 0.76 | | 1.99 | | 2.60 | | 36.4 | | 0.70 | | 0.34 | | 0.139 | | 0.001 | |
STKWK | | 250 | | Ag_ppm | | 1949 | | 14.86 | | 63.49 | | 4.27 | | 2280 | | 9 | | 5 | | 5 | | 0.4 | |
MINHOST | | 350 | | Au_ppm | | 7981 | | 0.32 | | 1.36 | | 4.26 | | 69.3 | | 0.29 | | 0.1 | | 0.05 | | 0.001 | |
MINHOST | | 350 | | Ag_ppm | | 7981 | | 7.90 | | 23.28 | | 2.94 | | 1105 | | 5 | | 5 | | 5 | | 0.2 | |
HOST | | 10 | | Au_ppm | | 8424 | | 0.12 | | 0.64 | | 5.10 | | 40.7 | | 0.07 | | 0.05 | | 0.05 | | 0.001 | |
HOST | | 10 | | Ag_ppm | | 8424 | | 5.68 | | 8.10 | | 1.43 | | 527 | | 5 | | 1.54 | | 0.5 | | 0.5 | |
Figure 14.27: La Patria - Sample Statistics Au Raw Assays

200
Figure 14.28: La Patria - Sample Statistics Ag Raw Assays

High Grade Trimming
Each mineral domain shows anomalous samples at the upper end of the distributions. To limit the over-extrapolation of these samples on grade estimates; high grade trimming levels were established. Statistics for each mineral type were examined and trimming levels were selected based on obvious discontinuities in the upper portions of the log-probability plots. Table 14.38 summarizes the trimming levels selected for each metal.
Table 14.38: La Patria - Trimming Levels by Mineral Type
| | | | Au | | Ag | |
Min Type | | Min Code | | Level g/t | | N trim / total samples | | Level g/t | | N trim / total samples | |
QVBX | | 100 | | 23.5 | | 3 /735 | | 611 | | 4/743 | |
STKWK | | 260 | | 17.4 | | 5/1944 | | 278 | | 3/1958 | |
MIN HOST | | 360 | | 12.05 | | 12/8267 | | 274 | | 7/7974 | |
HOST | | 10 | | 5.46 | | 7/8609 | | 97 | | 9/8415 | |
Statistical summaries for the trimmed samples are presented in Table 14.39.
201
Table 14.39: La Patria — Trimmed Sample Statistics by Mineral Type
Min Type | | Code | | Metal | | N | | Mean | | Std.Dev. | | C.V. | | Max | | Q75 | | Med | | Q25 | | Min | |
QVBX | | 100 | | Au_ppm | | 738 | | 1.86 | | 3.20 | | 1.72 | | 23.5 | | 1.93 | | 0.73 | | 0.23 | | 0.001 | |
QVBX | | 100 | | Ag_ppm | | 738 | | 49.69 | | 90.63 | | 1.82 | | 611 | | 51.25 | | 12 | | 5 | | 0.41 | |
STKWK | | 250 | | Au_ppm | | 1949 | | 0.73 | | 1.58 | | 2.15 | | 17.4 | | 0.70 | | 0.34 | | 0.139 | | 0.001 | |
STKWK | | 250 | | Ag_ppm | | 1949 | | 13.33 | | 27.37 | | 2.05 | | 278 | | 9 | | 5 | | 5 | | 0.16 | |
MINHOST | | 350 | | Au_ppm | | 7981 | | 0.30 | | 0.77 | | 2.6 | | 12.05 | | 0.42 | | 0.124 | | 0.05 | | 0.001 | |
MINHOST | | 350 | | Ag_ppm | | 7981 | | 7.59 | | 14.14 | | 1.86 | | 274 | | 5 | | 5 | | 5 | | 0.05 | |
HOST | | 10 | | Au_ppm | | 8424 | | 0.12 | | 0.32 | | 2.73 | | 5.46 | | 0.07 | | 0.05 | | 0.05 | | 0.001 | |
HOST | | 10 | | Ag_ppm | | 8424 | | 5.58 | | 4.87 | | 0.87 | | 97 | | 5 | | 5 | | 5 | | 0.05 | |
Drill Hole Compositing
Drill hole samples were composited to 1.52 m after high-grade trimming; this length was selected to approximately match the original sample support of the reverse-circulation drill holes (Figure 14.29). This length resulted in approximately 77% of all samples being composited and 23% of the samples being split. Eleven percent of the intervals to be split are within vein and stockwork material. 83% of the split intervals measured 1.53 m. Unsampled core intervals within the model solids were assigned a 0.001 g/t Au and 0.01 g/t Ag default composite grade. Composites were tagged with the majority mineral-type code from the samples and checked on screen. Composite statistics are summarized below in Table 14.40 and Figure 14.30 and 14.31.
Figure 14.29: La Patria — Sample Length Frequency

202
Table 14.40: La Patria — Composite Statistics by Mineral Type
Min Type | | Code | | Metal | | N* | | Mean | | Std.Dev. | | C.V. | | Max | | Q75 | | Med | | Q25 | | Min | |
QVBX | | 100 | | Au_ppm | | 680 | | 1.75 | | 2.79 | | 1.60 | | 23.5 | | 1.93 | | 0.73 | | 0.23 | | 0.001 | |
QVBX | | 100 | | Ag_ppm | | 680 | | 47.04 | | 80.98 | | 1.72 | | 611 | | 51.25 | | 12 | | 5 | | 0.41 | |
STKWK | | 250 | | Au_ppm | | 1855 | | 0.68 | | 1.18 | | 1.73 | | 12.63 | | 0.70 | | 0.34 | | 0.139 | | 0.001 | |
STKWK | | 250 | | Ag_ppm | | 1855 | | 13.38 | | 24.48 | | 1.83 | | 272 | | 9 | | 5 | | 5 | | 0.16 | |
MINHOST | | 350 | | Au_ppm | | 8990 | | 0.22 | | 0.53 | | 2.37 | | 9.69 | | 0.42 | | 0.124 | | 0.05 | | 0.001 | |
MINHOST | | 350 | | Ag_ppm | | 8990 | | 5.94 | | 10.42 | | 1.75 | | 260 | | 5 | | 5 | | 5 | | 0.05 | |
HOST | | 10 | | Au_ppm | | 17071 | | 0.049 | | 0.16 | | 3.31 | | 4.54 | | 0.07 | | 0.05 | | 0.05 | | 0.001 | |
HOST | | 10 | | Ag_ppm | | 17071 | | 2.53 | | 3.89 | | 1.54 | | 182 | | 5 | | 5 | | 5 | | 0.05 | |
* Includes unsampled intervals assigned a 0.001 for Au and 0.01 for Ag during compositing
Figure 14.30: La Patria — Composite Statistics Ag

203
Figure 14.31: La Patria — Composite Statistics Au
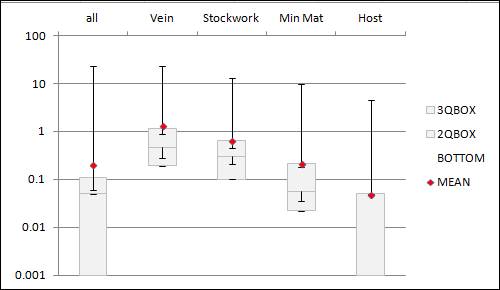
14.3.5 Block Model Estimation Methodology La Patria
Block Model Geometry
A block model framework was created to cover the modeled area and encapsulate all geologic domains to be used in the La Patria year-end 2012 interpolation process. Blocks were coded by the lithology solids on a percent basis. The La Patria block model geometry was rotated 30 deg counter-clockwise to orient the blocks relative to the strike of the La Patria domains. Figure 14.32 shows the rotated block model geometry, the La Patria vein and stockwork solid, and block model parameters as an insert table.
204
Figure 14.32: Block Model Geometry
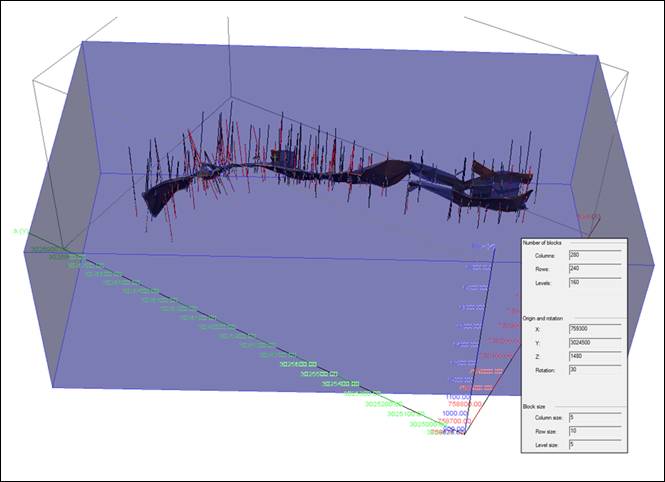
Spatial Correlation Studies - Variography
Spatial correlation studies for the project began with visualizing the composite data along with the mineral type models to identify the main directions of continuity in each area along the main La Patria structure. Main structural attitudes summarized in Table 14.41.
Table 14.41: La Patria - Vein/Structure Orientations by Area
(dip, dip direction format)
/Area | | North | | Main | | South | |
ROCKCODE | | MINCODE | | Dip | | Dip Azm | | Dip | | Dip Azm | | Dip | | Dip Azm | |
QVBX | | 100 | | -44 | | 36 | | -45 | | 66 | | -53 | | 60 | |
STOCKWORK | | 260 | | -44 | | 36 | | -45 | | 66 | | -53 | | 60 | |
MIN HOST | | 360 | | -44 | | 40 | | -46 | | 62 | | -53 | | 60 | |
Once the main axes were identified, a general strike and dip was chosen. A dip of -48 and dip azimuth of 60 were used in variography of the individual rockcode groups. Down dip variography was completed on three dip orientations to assess nugget affect and view ranges of
205
continuity along the major intersection angles to the structure. A minimum of three variograms were created to test for rake and higher grade ore shoots within each rock group (Table 14.42).
Table 14.42: La Patria — Exponential Variogram Models Parameters
Silver
| | VEIN = 100 | | STOCKWORK = 260 | | MinHost = 360 | | Host = < 10 | |
| | | | | | | | | |
Nugget | | 0.017 | | 0.047 | | 0.0122 | | 0 | |
Sill | | 0.863 | | 0.364 | | 0.2373 | | 0.25094 | |
Range | | 88.338 | | 11.561 | | 9.845 | | 25.614 | |
% nugget to sill | | 1.93 | | 11.44 | | 4.89 | | 0 | |
| | | | | | | | | |
Principle Azimuth | | 208.88 | | 188.57 | | 60.00 | | 231.07 | |
Principle Dip | | 43.55 | | 34.70 | | -48.00 | | 47.65 | |
Ellipsiod Dip | | 16.00 | | 33.00 | | 34.00 | | -85.00 | |
Intermediate Azimuth | | 310.05 | | 298.86 | | 303.38 | | 237.82 | |
major/semi-major | | 1.45 | | 1.61 | | 1.44 | | 1.00 | |
major/minor | | 7.46 | | 2.86 | | 1.00 | | 1.52 | |
Anisotropy 1 | | 206.22 | | 162.57 | | 48.11 | | 108.97 | |
Anisotropy 2 | | 142.63 | | 100.68 | | 33.52 | | 108.97 | |
Anisotropy 3 | | 37.65 | | 56.79 | | 48.11 | | 71.58 | |
From Variogram | | | | | | | | | |
CO | | 0.36 | | 0.05 | | 0.10 | | 0.34 | |
Sill (structure 1) | | 0.49 | | 0.56 | | 0.65 | | 0.82 | |
Range | | 206.22 | | 162.57 | | 48.11 | | 108.97 | |
current sill total | | 0.85 | | 0.61 | | 0.75 | | 1.16 | |
Sill:Nugget RATIO | | 0.42 | | 0.08 | | 0.14 | | 0.29 | |
Gold
| | VEIN = 100 | | STOCKWORK = 260 | | MinHost = 360 | | Host = < 10 | |
| | | | | | | | | |
Nugget | | 0.101 | | 0.053 | | 0.0376 | | 0.022 | |
Sill | | 0.464 | | 0.495 | | 0.394 | | 0.243 | |
Range | | 7.221 | | 8.903 | | 9.925 | | 17.825 | |
% nugget to sill | | 17.88 | | 9.67 | | 8.71 | | 8.3 | |
| | | | | | | | | |
Principle Azimuth | | 194.77 | | 231.07 | | 60.00 | | 231.07 | |
Principle Dip | | 38.03 | | 47.65 | | -48.00 | | 47.65 | |
Ellipsiod Dip | | 45.00 | | 23.00 | | -23.00 | | 17.00 | |
Intermediate Azimuth | | 316.41 | | 338.49 | | 347.51 | | 333.81 | |
major/semi-major | | 1.00 | | 1.35 | | 1.70 | | 1.28 | |
major/minor | | 3.78 | | 9.67 | | 3.85 | | 1.00 | |
Anisotropy 1 | | 82.27 | | 109.34 | | 64.55 | | 97.32 | |
Anisotropy 2 | | 82.27 | | 80.73 | | 38.03 | | 75.94 | |
Anisotropy 3 | | 21.77 | | 11.31 | | 16.75 | | 97.32 | |
From Variogram | | | | | | | | | |
CO | | 0.20 | | 0.05 | | 0.07 | | 0.25 | |
Sill (structure 1) | | 0.69 | | 0.77 | | 0.92 | | 0.91 | |
Range | | 82.27 | | 109.34 | | 64.55 | | 97.32 | |
curernt sill total | | 0.89 | | 0.83 | | 0.99 | | 1.16 | |
Sill:Nugget RATIO | | 0.23 | | 0.06 | | 0.08 | | 0.22 | |
206
Visualization and variography shows that the continuity is in the down-dip direction. There is no obvious rake to the better grade shoots. Variography was affected slightly by the change in strike of the system since variography was not divided into nouth, south and cenral sections. However, the search distances are spherical within the plane of the structure. Future modeling should be conducted on the natural geologic breaks cross cutting the system.
Review of the resulting block model statistics led to adjustment of the search parameters taken from the gold variography prior to application to the final model. Original search ellipse distances suggested by variography for silver were roughly twice the length of the gold search parameters. Visual verification of the blocks in section and statistical comparison of the models ran showed the larger search ellipses were overestimating grade in areas of poor sampling density. It was decided to utilize the shorter search distances associated with the gold variography and localize the affects of higher grade zones. The parameters used for gold and silver are outlined in Table 14.43.
Table 14.43: La Patria — Search Parameters
SEARCH PARAMETERS
MATERIAL | | PRINCIPAL AZIMUTH | | DIP | | INT. AZIMUTH | | ANISOTROPY X | | ANISOTROPY Y | | ANISOTROPY Z | |
HOST* | | 60 | | -48 | | 347 | | 65 | | 40 | | 10 | |
MINERALIZED MATERIAL | | 60 | | -48 | | 347 | | 65 | | 40 | | 10 | |
STOCKWORK | | 231 | | 48 | | 338 | | 100 | | 80 | | 11 | |
VEIN | | 195 | | 38 | | 316 | | 80 | | 80 | | 20 | |
14.3.6 Block Model Estimation Methodology La Patria
A percentage block model was created to cover the modeled area and encapsulate all domains in the La Patria mineral-type model.
Gold and silver metal grades were interpolated into the percentage block model using an inverse-distance-cubed (ID3) algorithm and an Ordinary Kriging model for comparison. Metal grades were estimated in one pass. Search dimensions were based on variogram models for the gold values by rock type and are summarized in Table 14.44.
Table 14.44: La Patria - Block Model Geometry
Axis | | Origin** | | Block Size
(m) | | Model Extent
(m) | | No. Blocks | |
X | | 7,558,000 | | 5 | | 1400 | | 280 | |
Y | | 3,024,500 | | 10 | | 1900 | | 190 | |
Z | | 1480 | | 5 | | 880 | | 176 | |
*Origin is defined at the top corner of the block located at the lowest west and south coordinates and highest elevation
*The block model was rotated 30 degrees
207
The search was ellipsoidal-octant using a minimum of 1 informed octant and a maximum of 6 composites per octant. An octant search was used to help “decluster” the estimates. A minimum of 1 composites and a maximum of 18 composites were used for an estimate with no more than 4 composites from any one drill hole. Boundary conditions between the mineral types were kept hard, allowing only those composites within the corresponding mineral type to estimate grade.
14.3.7 Classification Scheme
Blocks received a classification status based on the number of composites used to interpolate the grade, and distance to the nearest drillhole Table 14.45 shows the distribution of these criteria. This classification scheme is consistent with that used at the Palmarejo Mine.
Table 14.45: La Patria — Block Classification Scheme
CLASSIFICATION SCHEME | | No. Drillholes | | Distance to nearest Drillhole | |
MEASURED (1) | | >1 | | <15 meters | |
INDICATED (2) | | >1 | | 15-40 meters | |
INFERRED (3) | | >1 | | >40 meters | |
14.3.8 Block Model Validation
Metal models were checked visually on screen in section with the composites used. There are no obvious discrepancies within the vein domain. A minimum vein width should be determined for future estimations. Division of the composites between vein and stockwork in the southern extension of the system where veins are < 1m limits the data per unit for interpolation. Inclined long-sections with the estimated gold and silver models are shown on Figure 14.19 and Figure 14.20.
14.3.9 Visual Validation
Visual and statistical validation methods were used to evaluate the quality of the grade models for La Patria.
A visual inspection of the block model in long section was the first validation method used. Blocks were shown on section and reviewed for distribution down dip and horizontally along the vein and stockwork structures. This review identified areas where compositing lengths were greater than the vein widths and the resulting composites were classified as stockwork. Results are shown in Figure 14.33 and Figure 14.34.
The next inspection was done in vertical section comparing block model grades to composite grades. The block model shown in Figure 14.35 thru Figure 14.38 is a composite of the percentage models used for volume calculations. Drillhole composite grades, vein and stockwork outlines are also shown. Block grades honor the composites for gold and silver. Blocks show good trends with geology. No high-grade over-projections were observed.
208
Figure 14.33: La Patria — Inclined Long Section — Gold Model for Vein (100)
(looking southwest)
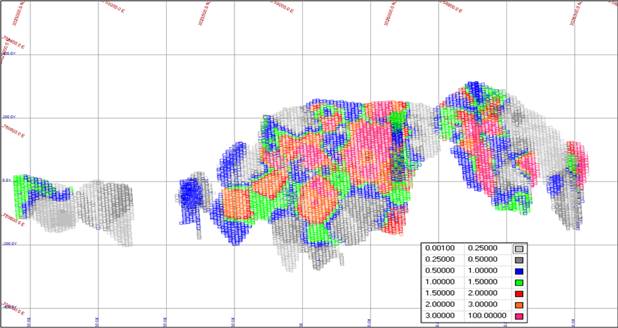
Figure 14.34: La Patria — Inclined Long Section — Silver Model for Vein (100)
(looking southwest)

209
Figure 14.35: La Patria — Vertical Section 1370— Gold (looking northwest)
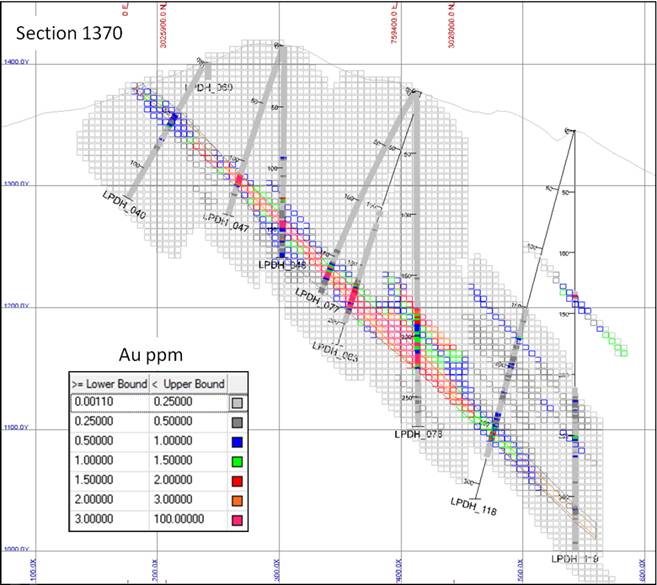
210
Figure 14.36: La Patria — Vertical Section 1370— Silver (looking northwest)
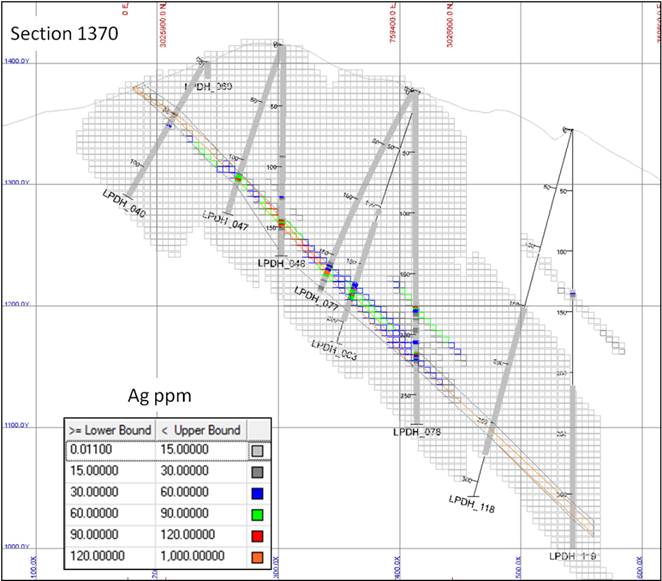
211
Figure 14.37: La Patria — Vertical Section 1030— Gold (looking northwest)
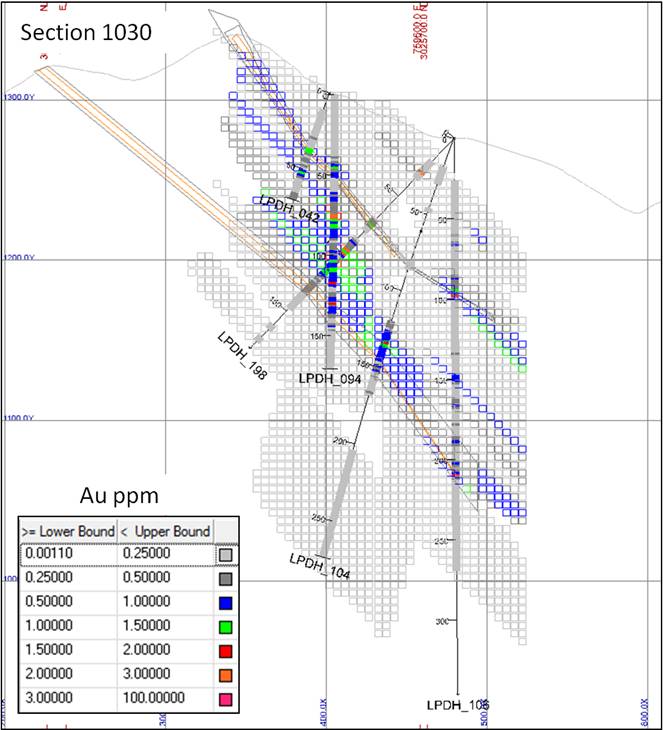
212
Figure 14.38: La Patria — Vertical Section 1030— Silver (looking northwest)

213
Statistical Checks
Statistical checks on the models were simple comparisons between the inverse-distance and oridinary kriged (OK) models, interpolated nearest-neighbor models (NN), and mean block grades. Block model statistics are summarized on Table 14.46.
Table 14.46: La Patria — Block Model Statistics
| | | | AUID g/t | | AUNN g/t | | AUMEAN g/t | | AUOK g/t | |
Min Type | | Min Code | | N | | Mean | | N | | Mean | | N | | Mean | | N | | Mean | |
QVBX | | 100 | | 18789 | | 1.27 | | 18789 | | 1.25 | | 18789 | | 1.26 | | 18789 | | 1.27 | |
STCKWK | | 260 | | 45669 | | 0.7 | | 45669 | | 0.7 | | 45669 | | 0.7 | | 45669 | | 0.7 | |
MIN HOST | | 360 | | 109467 | | 0.21 | | 109467 | | 0.21 | | 109467 | | 0.21 | | 109467 | | 0.21 | |
| | | | AGID g/t | | AGNN g/t | | AGMEAN g/t | | AGOK g/t | |
Min Type | | Min Code | | N | | Mean | | N | | Mean | | N | | Mean | | N | | Mean | |
QVBX | | 100 | | 18789 | | 31.42 | | 18789 | | 31.40 | | 18789 | | 30.92 | | 18789 | | 30.98 | |
STCKWK | | 260 | | 45669 | | 13.7 | | 45669 | | 13.6 | | 45669 | | 13.8 | | 45669 | | 13.7 | |
MIN HOST | | 360 | | 109467 | | 5.1 | | 109467 | | 5.1 | | 109467 | | 5.0 | | 109467 | | 5.0 | |
Block model statistics show that the La Patria model is globally unbiased. For the mineralized host domain, there were 310 composites in unsampled intervals of core that were given a default of 0.001 g/t gold and 0.01 g/t silver These extra composites apply influence to the composite statistics; no significant overestimation of grade is expected in the Mineralized Material domain.
Grade Trend / Swath Plots
Swath plots were prepared comparing Au and Ag model grades from the four different interpolation methods (Inverse Distance, Kriging, Nearest Neighbor and Mean Block Grade), Figure 14.39 — 14.40 shows the swath plots for gold and silver of block rows, which are most perpendicular to the extension of the mineralization. All indicated and inferred data was used for the plots.
214
Figure 14.39: La Patria YE2012 Geologic Domains - Swath Plots by Column — All Blocks

215
Figure 14.40: La Patria YE2012 Geologic Domains - Swath Plots by Level — All Blocks
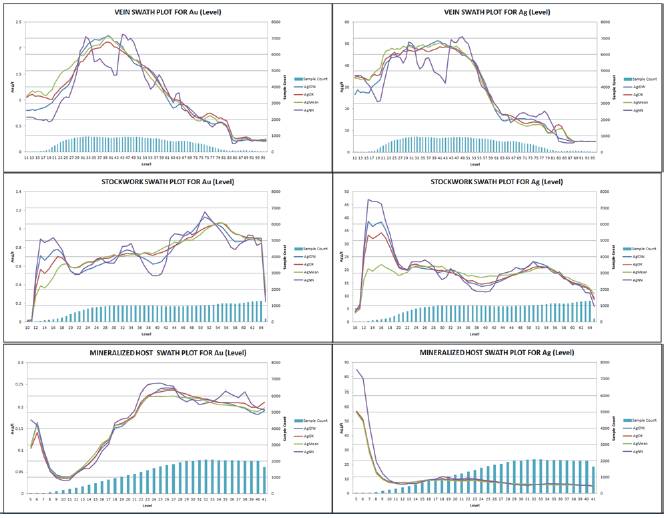
Overall, gold and silver grades tracked well amongst the four interpolated grades. The Mean block grade tends to track best with the Ordinary Kriged interpolation and IDW3 results. The Nearest Neighbor has greater variability around these estimates. In the Vein rock type, gold and silver grades track similarly with depth but in the stockwork and mineralized host material, gold grades increase with depth while silver decreases.
14.3.10 Statement of Mineral Resources La Patria
The Mineral Resources for the La Patria deposit are summarized in Table 14.47. These Mineral Resources are based on a gold equivalent cutoff of 0.47 g/t based on an open pit mining scenario using metal prices of US$1,700/oz for gold, and US$33.00/oz for silver. The resource estimate is based on a Whittle pit design utilizing estimated costs.
216
Table 14.47: La Patria - Deposit Mineral Resources
No Reserves
| | | | Average Grade
(g/t) | | Contained Ounces | |
Category | | Tonnes | | Au | | Ag | | Au | | Ag | |
Measured | | 0 | | 0.00 | | 0.0 | | 0 | | 0 | |
Indicated | | 15,902,000 | | 0.96 | | 19.2 | | 491,000 | | 9,828,000 | |
Meas. and Ind. | | 15,902,000 | | 0.96 | | 19.2 | | 491,000 | | 9,828,000 | |
Inferred | | 6,720,000 | | 0.83 | | 11.4 | | 178,000 | | 2,461,000 | |
Mineral Resources have not demonstrated economic viability
Metals prices used were $1,700/oz Au and $33.00/oz Ag.
Cut-off grade for resource was 0.47 g/t Au Equivalent [(Au Eq = Au g/t + (Ag g/t / 56.49)]
AuEq factor based on [(($Price Au) - ($Refining Au)) / (($Price Ag) – ($Refining Ag))] x [(%Recovery Au)/(%Recovery Ag)] x [(%Payable Au)/(%Payable Ag)]
14.4 Summary of Mineral Resources Palmarejo District
The following tables present the total of all Mineral Resources defined for the Palmarejo District deposits (including the Palmarejo Mine area, Guadalupe and La Patria). Mineral Resources for each deposit are discussed in greater detail previously in this section, and are presented here together as a summary.
Table 14.48 shows the Mineral Resource for the Palmarejo District (including the Palmarejo, Guadalupe and La Patria deposits).
Table 14.48: Total Palmarejo District Mineral Resource Inclusive of Mineral Reserves
| | | | Average Grade
(g/t) | | Contained Ounces | |
Category | | Tonnes | | Au | | Ag | | Au | | Ag | |
Measured | | 8,103,000 | | 2.55 | | 190.3 | | 663,000 | | 49,578,000 | |
Indicated | | 25,067,000 | | 1.20 | | 61.1 | | 966,000 | | 49,272,000 | |
Meas. and Ind. | | 33,170,000 | | 1.53 | | 92.7 | | 1,629,000 | | 98,851,000 | |
Inferred | | 10,798,000 | | 1.32 | | 63.7 | | 457,000 | | 22,104,000 | |
Total Mineral Resource includes Proven and Probable Reserves
Cut-off grade for Palmarejo deposit: open pit 0.98 g/tAuEq, underground 2.09 g/tAuEq
Cut-off grade for Guadalupe deposit: open pit 1.03 g/tAuEq, underground 2.14 g/tAuEq
Cut-off grade for La Patria deposit 0.47 g/tAuEq
Table 14.49 shows the remaining Mineral Resource for the Palmarejo District (including the Palmarejo, Guadalupe and La Patria deposits) exclusive of the Mineral Reserves, and although stated with consideration given to economics, Coeur emphasizes that these Mineral Resources have not demonstrated economic viability.
217
Table 14.49: Total Palmarejo District Mineral Resource Exclusive of Mineral Reserves
| | | | Average Grade
(g/t) | | Contained Ounces | |
Category | | Tonnes | | Au | | Ag | | Au | | Ag | |
Measured | | 2,890,000 | | 3.39 | | 244.5 | | 315,000 | | 22,720,000 | |
Indicated | | 18,621,000 | | 1.08 | | 38.5 | | 649,000 | | 23,021,000 | |
Meas. and Ind. | | 21,511,000 | | 1.39 | | 66.1 | | 964,000 | | 45,741,000 | |
Inferred | | 10,798,000 | | 1.32 | | 63.7 | | 457,000 | | 22,104,000 | |
Mineral Resources are in addition to Mineral Reserves and have not demonstrated economic viability
Cut-off grade for Palmarejo deposit: open pit 0.98 g/tAuEq, underground 2.09 g/tAuEq
Cut-off grade for Guadalupe deposit: open pit 1.03 g/tAuEq, underground 2.14 g/tAuEq
Cut-off grade for La Patria deposit 0.47 g/tAuEq
218
SECTION 15 - MINERAL RESERVE ESTIMATES
Currently Mineral Reserves exist for the Palmarejo and Guadalupe deposits.
15.1 Palmarejo Deposit Mineral Reserves
The Proven and Probable Mineral Reserves, effective January 1, 2013, for the Palmarejo Area are based on Measured and Indicated Mineral Resources only (Table 15.1). Open pit Mineral Reserves are based on an updated year-end 2012 block model as well as current surface mine designs (design criteria and basis for which are available in Section 16 of this report). Underground Mineral Reserves are based on the same year-end 2012 block model as well as updated underground mine designs. Production schedules and economic analyses have been performed which show the economic viability of the Mineral Reserves reported herein (see Sections 16, 21, and 22). Reserve cutoffs are based on current operating costs, metals recoveries, (see Section 21) and approximate 3-year trailing average metals prices of $1450 per ounce Au and $27.50 per ounce Ag. Reserve estimates were obtained by applying a 1.15 g/t AuEq (gold equivalent, see Section 15.4) cutoff to Measured and Indicated Resource blocks within the ultimate pit and a 2.45 g/t AuEq cutoff against fully diluted underground stopes (for explanation of cutoff grades used, see Section 21).
Table 15.1: Proven and Probable Mineral Reserves — Palmarejo Deposit
| | | | | | Average Grade (g/t) | | Contained Ounces | |
Reserve | | Category | | Tonnes | | Au | | Ag | | Au | | Ag | |
Open Pit | | Proven | | 1,491,000 | | 1.06 | | 156.3 | | 51,000 | | 7,492,000 | |
| | Probable | | 440,000 | | 0.96 | | 147.0 | | 14,000 | | 2,078,000 | |
| | | | | | | | | | | | | |
Underground | | Proven | | 2,112,000 | | 3.22 | | 186.9 | | 219,000 | | 12,689,000 | |
| | Probable | | 396,000 | | 2.74 | | 166.1 | | 35,000 | | 2,117,000 | |
| | | | | | | | | | | | | |
Stockpile | | Proven | | 79,000 | | 0.55 | | 77.0 | | 1,000 | | 197,000 | |
| | | | | | | | | | | | | |
Total | | Proven | | 3,682,000 | | 2.29 | | 172.1 | | 271,000 | | 20,377,000 | |
| | Probable | | 836,000 | | 1.81 | | 156.0 | | 49,000 | | 4,195,000 | |
| | Proven and Probable | | 4,518,000 | | 2.20 | | 169.1 | | 319,000 | | 24,572,000 | |
Metal prices used were $1,450 US per Au ounce, $27.50 US per Ag ounce
Cutoff grade for reserve: open pit 1.15 g/t AuEq, underground 2.45 g/t AuEq [(Au Eq = Au g/t + (Ag g/t / 60.37)]
AuEq factor based on [($Price Au) / ($Price Ag)] x [(%Recovery Au)/(%Recovery Ag)] x [(%Payable Au)/(%Payable Ag)]
15.1.1 Palmarejo Underground Reserve Methodology
Stopes were designed in detail to create mineable shapes which may have included internal dilution in the form of unclassified or inferred tonnes. Any unclassified or inferred tonnes were
219
treated as internal waste at 0 g/t Au and Ag grade. External dilution from overbreak and ore loss were also taken into account. Depending on the type of mining method to be used in a given stope, previously calculated external dilution factors and grades were applied. A flat rate ore loss factor was applied to all designed stopes.
After stope design was complete and external dilution and ore loss factors were applied, any stope that was sub-economic with an average grade of less than 2.45 g/t AuEq) was eliminated. The nature of eliminating stopes created a loss of potential ore associated with waste on the outer edge of the deposit.
15.1.2 Palmarejo Open Pit Reserve Methodology
Open pit Mineral Reserves have been defined by first generating a detailed pit design based on an optimized shell produced in Gemcom Whittle™ software, determining ore and waste by applying a cutoff grade, and then creating a production schedule that supplies ore to the mill. Life-of-mine economic and design parameters are discussed in Section 16 of this report.
Dilution and Mining Loss
Before generating the optimized shell, the resource model was block diluted to 5m x 5m x 7.5m to incorporate dilution along the edges of the mineralized structures. Ore control practices at Palmarejo allow for reasonable selectivity with relationship to the block size. The block dilution described above is appropriate for a statement of reserves without additional factors. Thus, no additional dilution factors have been used.
15.2 Guadalupe Deposit Mineral Reserves
The Proven and Probable Mineral Reserves, effective January 1, 2013, for the Guadalupe Area are based on Measured and Indicated Mineral Resources only (Table 15.2). Open pit Mineral Reserves are based on an updated year-end 2012 block model as well as current surface mine designs (design criteria and basis for which are available in Section 16 of this report). Underground Mineral Reserves are based on the same year-end 2012 block model as well as updated underground mine designs. Production schedules and economic analyses have been performed which show the economic viability of the Mineral Reserves reported herein (see Sections 16, 21, and 22). Reserve cutoffs are based on current operating costs, metals recoveries, (see Section 21) and approximate 3-year trailing average metals prices of $1450 per ounce Au and $27.50 per ounce Ag. Reserve estimates were obtained by applying a 1.21 g/t AuEq (gold equivalent, see Section 15.4) cutoff to Measured and Indicated Resource blocks within the ultimate pit and a 2.51 g/t AuEq cutoff against fully diluted underground stopes (for explanation of cutoff grades used, see Section 21).
220
Table 15.2: Proven and Probable Mineral Reserves — Guadalupe Deposit
| | | | | | Average Grade
(g/t) | | Contained Ounces | |
Area | | Category | | Tonnes | | Au | | Ag | | Au | | Ag | |
Open Pit | | Proven | | 184,000 | | 2.16 | | 174.7 | | 13,000 | | 1,033,000 | |
| | Probable | | 379,000 | | 1.06 | | 147.0 | | 13,000 | | 1,793,000 | |
| | | | | | | | | | | | | |
Underground | | Proven | | 1,347,000 | | 1.49 | | 125.8 | | 65,000 | | 5,449,000 | |
| | Probable | | 5,230,000 | | 1.52 | | 120.5 | | 255,000 | | 20,264,000 | |
| | | | | | | | | | | | | |
Total | | Proven | | 1,531,000 | | 1.57 | | 131.7 | | 77,000 | | 6,481,000 | |
| | Probable | | 5,610,000 | | 1.49 | | 122.3 | | 268,000 | | 22,057,000 | |
| | Proven and Probable | | 7,141,000 | | 1.50 | | 124.3 | | 345,000 | | 28,538,000 | |
Metal prices used were $1450 US per Au ounce, $27.50 US per Ag ounce
Cutoff grade for reserve: open pit 1.21 g/t AuEq, underground 2.51 g/t AuEq [(Au Eq = Au g/t + (Ag g/t / 60.37)]
AuEq factor based on [(($Price Au)-($Refining Au)) / (($Price Ag)-($Refining Ag))] x [(%Recovery Au)/(%Recovery Ag)] x [(%Payable Au)/(%Payable Ag)]
15.2.1 Guadalupe Underground Reserve Methodology
Stopes were designed in detail to create mineable shapes which may have included internal dilution in the form of unclassified or inferred tonnes. Any unclassified or inferred tonnes were treated as internal waste at 0 g/t Au and Ag grade. External dilution from overbreak and ore loss were also taken into account. Depending on the type of mining method to be used in a given stope, previously calculated external dilution factors and grades were applied. A flat rate ore loss factor was applied to all designed stopes.
After stope design was complete and external dilution and ore loss factors were applied, any stope that was sub-economic with an average grade of less than 2.51 g/t AuEq) was eliminated. The nature of eliminating stopes created a loss of potential ore associated with waste on the outer edge of the deposit.
15.2.2 Guadalupe Open Pit Reserve Methodology
Open pit Mineral Reserves have been defined by first generating a detailed pit design based on an optimized shell produced in Gemcom Whittle™ software, determining ore and waste by applying a cutoff grade, and then creating a production schedule that supplies ore to the mill. Life-of-mine economic and design parameters are discussed in Section 16 of this report.
The final pit shape used for reporting mineral reserves was limited by a surface boundary corresponding to the currently permitted five hectare area. Without the five hectare limit the economic open pit reserves would be much larger.
221
Dilution and Mining Loss
Before generating the optimized shell, the resource model was block diluted to 6m x 6m x 6m to incorporate dilution along the edges of the mineralized structures. Ore control practices at Guadalupe will allow for reasonable selectivity with relationship to the block size. The block dilution described above is appropriate for a statement of reserves without additional factors. Thus, no additional dilution factors have been used.
15.3 Summary of Mineral Reserves Palmarejo District
The Total Mineral Reserves for the Palmarejo District are stated in Table 15.3 and include the Palmarejo and Guadalupe deposit Mineral Reserves. The Total Mineral Reserves are based on open pit and underground cut-off grades calculated using operating cost, metals recoveries, and metal prices of US$27.50/ oz silver and US$1450/ oz gold. There are no known environmental, permitting, legal, title, socio-economic, marketing, or political issues that could materially affect the Palmarejo deposit Mineral Reserves.
Table 15.3: Total Palmarejo District Mineral Reserves
| | | | Average Grade (g/t) | | Contained Ounces | |
Category | | Tonnes | | Au | | Ag | | Au | | Ag | |
Proven | | 5,213,000 | | 2.08 | | 160.2 | | 348,000 | | 26,858,000 | |
Probable | | 6,446,000 | | 1.53 | | 126.7 | | 317,000 | | 26,251,000 | |
Total | | 11,659,000 | | 1.77 | | 141.7 | | 665,000 | | 53,110,000 | |
Metal prices used were $1450 US per Au ounce, $27.50 US per Ag ounce
Includes Mineral Reserves for Palmarejo and Guadalupe deposits
15.4 Equivalent Factor
Cutoff grades are based on gold equivalent grade (AuEq). The gold equivalent factor (multiplier) is calculated as follows:
[(($Price Au) - ($Refining Au)) / (($Price Ag) – ($Refining Ag))] x [(%Recovery Au)/(%Recovery Ag)] x [(%Payable Au)/(%Payable Ag)]= AuEq Factor
Example using Reserve metals prices:
[(($1450 oz/Au) – ($0.514 oz/Au)) / (($27.50 oz/Ag) – ($0.081 oz/Ag))] x [(94%)/(82.5%)] x [(99.90%)/(99.70%)]= 60.35
222
SECTION 16 - MINING METHODS
Starting in 2008, Coeur has mined at Palmarejo by both conventional open pit and longhole underground techniques. The mining operation at Palmarejo is currently at planned capacity and is expected to continue through 2016, with mining and milling of Guadalupe ore commencing in late 2013 and continuing through 2020 as summarized in Table 16.1.
Table 16.1: Remaining Life-of-Mine Production Summary with Development
Palmarejo and Guadalupe Underground and Open Pit Sources
| | 2013 | | 2014 | | 2015 | | 2016 | | 2017 | | 2018 | | 2019 | | 2020 | | Total | |
Palmarejo Open Pit | | | | | | | | | | | | | | | | | | | |
Tonnes Ore | | 1,159,212 | | 771,583 | | | | | | | | | | | | | | 1,930,795 | |
Au Grade (g/t) | | 0.87 | | 1.28 | | | | | | | | | | | | | | 1.04 | |
Ag Grade (g/t) | | 126.16 | | 196.20 | | | | | | | | | | | | | | 154.16 | |
Tonnes Waste (tx1000) | | 20,388 | | 20,338 | | | | | | | | | | | | | | 40,726 | |
Palmarejo Underground | | | | | | | | | | | | | | | | | | | |
Tonnes Ore | | 729,894 | | 602,401 | | 805,521 | | 370,424 | | | | | | | | | | 2,508,240 | |
Au Grade (g/t) | | 3.09 | | 3.88 | | 3.27 | | 1.80 | | | | | | | | | | 3.14 | |
Ag Grade (g/t) | | 189.75 | | 198.59 | | 190.25 | | 132.51 | | | | | | | | | | 183.60 | |
Development UG (tonnes) | | 194,621 | | 175,422 | | 114,244 | | 7,597 | | | | | | | | | | 491,884 | |
Guadalupe Open Pit | | | | | | | | | | | | | | | | | | | |
Tonnes Ore | | | | 180,000 | | 383,102 | | | | | | | | | | | | 563,102 | |
Au Grade (g/t) | | | | 0.83 | | 1.70 | | | | | | | | | | | | 1.42 | |
Ag Grade (g/t) | | | | 155.87 | | 156.14 | | | | | | | | | | | | 156.07 | |
Tonnes Waste (tx1000) | | | | 3,924 | | 6,988 | | | | | | | | | | | | 10,911 | |
Guadalupe Underground | | | | | | | | | | | | | | | | | | | |
Tonnes Ore | | 54,588 | | 385,000 | | 700,000 | | 1,150,000 | | 1,150,000 | | 1,150,000 | | 1,150,000 | | 838,016 | | 6,577,604 | |
Au Grade (g/t) | | 1.67 | | 1.66 | | 1.67 | | 2.38 | | 1.60 | | 1.65 | | 0.81 | | 0.76 | | 1.51 | |
Ag Grade (g/t) | | 114.86 | | 119.83 | | 132.40 | | 130.43 | | 139.70 | | 143.66 | | 99.10 | | 77.27 | | 121.58 | |
Development UG (tonnes) | | 266,667 | | 199,124 | | 102,644 | | 115,443 | | 103,446 | | 118,120 | | 106,725 | | 14,556 | | 1,026,725 | |
Palmarejo Stockpile | | | | | | | | | | | | | | | | | | | |
Tonnes Ore | | | | 79,391 | | | | | | | | | | | | | | 79,391 | |
Au Grade (g/t) | | | | 0.55 | | | | | | | | | | | | | | 0.55 | |
Ag Grade (g/t) | | | | 76.99 | | | | | | | | | | | | | | 77.00 | |
The following section describes the mining methods and details the design parameters used to generate the reserve and resource statements in Section 15 and the economic analyses in Section 22 of this report. The Qualified Person for this Technical Report has reviewed the work contained herein and believes the methods employed were appropriate and compliant with CIM NI 43-101 standards.
223
16.1 Palmarejo Operations
Operations at Palmarejo consist of mining from both underground and open pit sources and stockpiling the ore on a surface run-of-mine (ROM) pad. The ore is then blended and fed through the primary crusher at a rate of 6,000 tpd as described in Section 17.
Palmarejo Underground Mining
Underground mining is designed and scheduled based on detailed economic stope designs with dilution and loss assumptions as outlined in Section 15. The size, shape and steeply dipping nature of the vein structure make the Palmarejo underground deposit most amenable to mechanized conventional longhole stoping in the vein sections narrower than 15 meters and transverse longhole stoping in the areas where the vein exceeds 15 meters. The mining is accomplished using jumbo drills, jackleg drills, longhole drills, LHD loaders and 30-45 tonne trucks. Both mining methods require primary and secondary development as outlined in the production schedule in Table 16.1. The underground longhole mining utilizes cemented rock fill (CRF) from a CRF plant located on the surface for backfilling of primary stopes. The operational and design criteria and mining equipment used for the Palmarejo mine are summarized below in Table 16.2.
224
Table 16.2: Palmarejo Underground Mining Methods and Stope Design Parameters
Item | | Unit |
Conventional Longhole Stope Mining | | |
Vein Width (meters) | | 5 - 15 |
Separation Between Levels (meters) | | 20 |
Proportion of Underground Mining (%) | | 45% |
Maximum Width (meters) | | 15 |
Maximum Stope Length (meters) | | 80 |
Minimum Hanging Wall Dip (degrees) | | 45 |
Miniumum Footwall Dip (degrees) | | 50 |
Production Rate (tonnes/day) | | 2400 |
Transverse Longhole Stope Mining | | |
Vein Width (meters) | | > 15 |
Separation Between Levels (meters) | | 20 |
Proportion of Underground Mining (%) | | 55% |
Maximum Width of Primary and Secondary Stopes (meters) | | 8 |
Minimum Hanging Wall Dip (degrees) | | 45 |
Miniumum Footwall Dip (degrees) | | 50 |
Maximum Stope Length (meters) | | 40 |
Production Rate (tonnes/day) | | 2400 |
Access Development - Access Ramps, Haulage Drifts, Stope Access Crosscuts | | |
Drift Dimensions (meters) | | 5.5 x 5 |
Maximum Gradient (%) | | +/- 15% |
Main Level Drift Gradient (%) | | 3.0% |
Underground Production Mining Equipment | | |
4 & 8 CY LHD Loader | | 11 units |
30-45 Tonne Truck | | 10 units |
Long Hole Drill | | 2 units |
Jumbo Drill | | 5 units |
Working Time | | |
Hours/Shift | | 12 |
Shifts/Day | | 2 |
Days/Week | | 7 |
In 2012, the Palmarejo underground mining encountered significant and unexpected geotechnical issues in the weak hangingwall at the intersection of a number of high-grade fault-bound vein structures of the 076 Clavo. The hangingwall failed in some of these areas, which forced temporary closure of crosscuts and alteration of the short range mine plan for 2012. Palmarejo has formulated and started implementation of a mitigation plan allowing safe extraction of the ore in these areas of low rock quality. The recovery plan consists of a combination of cemented rock fill (CRF), cemented sand and different types of rock bolting to shore up already-failed material and prevent failures of other areas of weak rock mass. Going forward, mining will also leave a narrow layer of competent rock against the fault, which will result in the ability to safely recover nearly all the remaining reserves with minimum dilution.
225
Palmarejo Open Pit Mining
Surface mining is by conventional drill and blast, truck and shovel operations on 7.5 meter benches. Mining is conducted by blasthole drills, hydraulic front shovels, front-end loaders and 100-tonne class trucks. Waste rock from the open pit mine is placed beyond the edges of the open pit boundary, with provision to backfill mined out areas of the pit in future years. Open pit ore is delivered to the ROM pad for blending with the underground ore prior to crushing.
Open pit reserves have been defined by first calculating an optimized pit with Gemcom’s Whittle™ software using the resource block model constrained by the design parameters outlined in Table 16.3 below, as well as the economic and metal recovery parameters from Section 21. Dilution and loss assumptions are explained in Section 15. The ultimate reserve pit is designed from the Whittle™ results modified to allow catch bench design, access of people and equipment and other pertinent considerations that affect mineability. The production schedule mines the pit in multiple designed phases to facilitate timely waste stripping and ensure consistent ore feed. A summary of mining and design parameters and equipment is shown in Table 16.3.
Table 16.3: Palmarejo Open Pit Design and Operational Parameters
Item | | Unit |
Pit Design | | |
Bench Height (meters) | | 7.5 |
Footwall Pit Slopes (degrees) | | 43.8 |
Footwall Bench Face Angle (degrees) | | 60 |
Footwall Catch Bench (meters) | | 7 |
Hangingwall Pit Slopes (degrees) | | 51.3 |
Hangingwall Bench Face Angle (degrees | | 75 |
Hangingwall Catch Bench (meters) | | 8 |
Minimum Mining Width (meters) | | 30 |
Haul Road Design Width (meters) | | 23 |
Haul Road Gradient (%) | | 10 |
Ore Production Rate (tonnes/day) | | 3400 |
Working Time | | |
Shift Schedule | | 2-12 hour shifts/day, 7 days/wk. |
Days lost for weather, etc. per year | | 10 days/year |
Operating standby time | | 1.75 hours/shift |
Production Equipment | | |
O&K RH120 Hydraulic Front Shovels (units) | | 2 units |
CAT 992G Front-End Loader (units) | | 2 units |
CAT 777G Haul Trucks (units) | | 14 units |
Blasthole Drills | | 5 units |
Cristian Caceres, a professional geotechnical consultant, completed a geotechnical study of the Palmarejo open pit (for both existing highwalls and future designs) for Coeur in 2012. The study reaffirmed the previous Golder recommendations for geotechnical design parameters in the
226
existing highwalls and Coeur will continue to maintain those highwall design criteria going forward.
A comprehensive waste placement design was completed in 2012, which utilizes permitted dumping areas to the east and west of the ultimate pit. Coeur plans to conduct a geotechnical study for the waste dumps in 2013.
16.2 Guadalupe Operations
The Guadalupe deposit is located approximately 6 kilometers southeast of the Palmarejo mine site (Figure 7.2) and processing plant and will be operated as a satellite of Palmarejo, which will provide processing, tailings and administrative support for the Guadalupe Mine. Guadalupe ore will be mined by conventional and transverse longhole underground stoping techniques and by conventional open pit and trucked to the Palmarejo mill via surface roads.
Guadalupe Underground Mining
Underground mining is designed and scheduled based on detailed economic stope designs, dilution and loss assumptions as outlined in Section 15. The vein structure is most amenable to mechanized conventional longhole stoping in the vein sections narrower than 15 meters and transverse longhole stoping in the areas where the vein exceeds 15 meters. The mining will be accomplished using jumbo drills, jackleg drills, bolters, longhole drills, LHD loaders and 30-45 tonne trucks. Both mining methods require primary and secondary development as outlined in the production schedule in Table 16.1. The underground longhole mining will utilize cemented rock fill (CRF) from a CRF plant located on the surface for backfilling of primary stopes. The parameters, design criteria and mining equipment used for the Guadalupe mine are summarized below in Table 16.4.
Ventilation is planned according to industry standards for the mining method and planned equipment.
Coeur contracted Golder Associates to complete a geotechnical study for Guadalupe in 2011. The results indicate Guadalupe geotechnical stability to be better overall than at Palmarejo, with some variable conditions encountered in the development areas. Coeur has implemented Golder’s recommendations into the Guadalupe designs, which include mining dimensions and analyzing operational applications such as bolting types, spacing and patterns.
227
Table 16.4: Guadalupe Underground Mining Methods, Design Parameters and
Major Equipment
Item | | Unit |
Conventional Longhole Stope Mining | | |
Vein Width (meters) | | 5 - 15 |
Separation Between Levels (meters) | | 20 |
Proportion of Underground Mining (%) | | 45% |
Maximum Width (meters) | | 15 |
Maximum Stope Length (meters) | | 80 |
Minimum Hanging Wall Dip (degrees) | | 45 |
Miniumum Footwall Dip (degrees) | | 50 |
Production Rate (tonnes/day) | | 2400 |
Transverse Longhole Stope Mining | | |
Vein Width (meters) | | > 15 |
Separation Between Levels (meters) | | 20 |
Proportion of Underground Mining (%) | | 55% |
Maximum Width of Primary and Secondary Stopes (meters) | | 8 |
Minimum Hanging Wall Dip (degrees) | | 45 |
Miniumum Footwall Dip (degrees) | | 50 |
Maximum Stope Length (meters) | | 4 |
Production Rate (tonnes/day) | | 2400 |
Access Development - Access Ramps, Haulage Drifts, Stope Access Crosscuts | | |
Drift Dimensions (meters) | | 5.5 x 5 |
Maximum Gradient (%) | | +/- 15% |
Main Level Drift Gradient (%) | | 0.50% |
Underground Production Mining Equipment | | |
4 & 8 CY LHD Loader | | 6 units |
30-45 Tonne Truck | | 5 units |
Long Hole Drill | | 2 units |
Jumbo Drill | | 5 units |
988-Class Front End Loader - For Ore Haul | | 1 unit |
100-Tonne Haul Truck - For Ore Haul | | 1 unit |
Working Time | | |
Hours/Shift | | 12 |
Shifts/Day | | 2 |
Days/Week | | 7 |
Guadalupe Open Pit Mining
Surface mining is planned at Guadalupe but has not yet commenced.
Similar to Palmarejo, surface mining will be by conventional drill and blast, truck and shovel operations on 7.5 meter benches. Mining will be conducted by blasthole drills, hydraulic front shovels, front-end loaders and 100-tonne class trucks. Waste rock from
the open pit mine will placed beyond the edges of the open pit boundary, with provision to backfill mined out areas of
228
the pit in future years. Open pit ore will be delivered to the Palmarejo ROM pad via surface roads for blending with the ore from other sources prior to crushing.
Open pit reserves have been defined by first calculating an optimized pit with Gemcom’s Whittle™ software using the resource block model constrained by the permitted footprint, the design parameters outlined in Table 16.5 below, as well as the economic and metal recovery parameters from Section 21. Dilution and loss assumptions are explained in Section 15. The ultimate reserve pit is designed from the Whittle™ results modified to allow catch bench design, access of people and equipment and other pertinent considerations that affect mineability. The production schedule mines the pit in multiple designed phases to facilitate timely waste stripping and ensure consistent ore feed. A summary of mining and design parameters and equipment assumptions are shown in Table 16.5. It is currently assumed that the open pit production equipment at Palmarejo will transfer to Guadalupe when necessary to maintain the schedule.
Table 16.5: Guadalupe Basis For Open Pit Design and Operational Parameters
Item | | Unit |
Pit Design | | |
Bench Height (meters) | | 7.5 |
Pit Slopes (degrees) | | 45 |
Bench Face Angle (degrees) | | 60 |
Catch Bench (meters) | | 7 |
Minimum Mining Width (meters) | | 30 |
Haul Road Design Width (meters) | | 23 |
Haul Road Gradient (%) | | 10 |
Ore Production Rate (tonnes/day) | | 2850 |
Working Time | | |
Shift Schedule | | 2-12 hour shifts/day, 7 days/wk. |
Days lost for weather, etc. per year | | 10 days/year |
Operating standby time | | 1.75 hours/shift |
Production Equipment | | |
O&K RH120 Hydraulic Front Shovels (units) | | 1 units |
CAT 992G Front-End Loader (units) | | 1 units |
CAT 777G Haul Trucks (units) | | 6 units |
Blasthole Drills | | 2 units |
Coeur intends to conduct a geotechnical study for the planned open pit at Guadalupe in 2013.
Other Guadalupe Infrastructure
Necessary infrastructure for Guadalupe not supported by the Palmarejo complex is either planned or in place. This includes electrical power via a spur line from the Palmarejo feed, compressed air, office and other buildings, etc. Underground water will be collected in sumps and recycled for use. Excess water will be clarified and sent to the Palmarejo fresh water dam.
229
SECTION 17 - RECOVERY METHODS
17.1 Mineral Processing
The processing plant is located immediately south and overlooking the village of Palmarejo at an elevation of approximately 880 meters. The plant is designed to operate 365 days per year at 91.3 percent availability. In full production the plant design mill throughput is 6,000 tonnes per day of combined underground and open pit ore. The gold and silver are recovered by a sequential process including flotation and leaching onto solution using a cyanide solution and the plant is designed to achieve an overall recovery of approximately 94.0 percent of the gold and 91.0 percent of the silver. Thus, the final valuable product from the plant is called doré.
17.2 Crushing
Ore is delivered from the underground and open pit mining activities either to a Run of Mine (ROM) stockpile located adjacent to the primary crusher area or directly to the primary crusher dump hopper. The dump hopper has a fixed grizzly on top with an approximately opening of 20” and an apron feeder at the discharge. The ROM is fed with a front end loader and oversize is broken with a backhoe fitted with a hammer. The installed jaw crusher is a Nordberg C-140 with an opening of approximately 1.1 m by 1.4 m capable to handle 350 tonne/hr at a 5” CSS (Close Side Setting).
Crushed ore is discharged from the jaw crusher onto a conveyor and delivered to a 1,250 tonnes capacity stockpile. Two variable vibrating feeders reclaim the crushed ore onto a belt conveyor to delivery to the SAG mill for further comminution.
17.3 Grinding
Crushed ore is directly fed to the grinding circuit from the crushed ore stockpile. The grinding circuit consists of a SAG mill and a Ball mill operating in a closed circuit with a battery of cyclones for classification. The cyclone battery consists of nine 80inch Krebs cyclones with an apex opening of 4.25 inches and vortex opening of 6 inches. Cyclone operational pressure is maintained in a range from 14 to 16 psi. The cyclone battery underflow reports to the ball mill to maintain a recirculating load to have a better control on the flotation feed size, while the cyclone overflow reports to flotation.
Both mills are 6.7 m. in dia. and 7.5 m. long. Grinding circuit feed and product is 80% passing sizes of 120,000 micron and 75 micron respectively.
17.4 Flotation
The ball mill cyclone overflows at a nominal 80 percent minus 75 micron in size and pulp density of 30% flows by gravity to the rougher conditioner tank where the slurry is conditioned with Aero 404 and potassium amyl xanthate (PAX). The conditioner tank overflows to feed a bank of six 100 m3 capacity tank cells. Rougher flotation occurs at the first bank of two tank cells and scavenger flotation occurs sequentially down the bank. Frother and PAX are added to rougher feed and during the scavenging flotation.
230
In 2012 the flotation circuit was slightly modified to add flexibility and improve performance. Now the rougher flotation concentrate reports either to the cleaner concentrate tank to be combined with the cleaner concentrate or to the scavenger concentrate tank to be combined with the scavenger concentrate. Scavenger flotation concentrate reports to a bank of two 17 m3 capacity cells where the first cleaner stage is provided. Then the first cleaner concentrate reports to a conditioning tank for additional reagents adjustment and afterwards flows to a bank of three 17 m3 capacity cells where the final cleaner flotation is provided. The final cleaner concentrate is pumped to the concentrate thickener for dewatering. The concentrate thickener overflow reports to the grinding circuit as recycled water. Thickener underflow, at approximately 65% solids, is pumped to the concentrate leach circuit for intense cyanide leaching to dissolve the contained gold and silver. The cleaner concentrate weight recovery is designed at nominal 5%.
Cleaner flotation tailings are recycled to the rougher flotation conditioner tank or alternatively to the 3rd or 5th rougher cell for additional treatment.
Flotation tailings are transferred to the tailings thickener for dewatering, tailings thickener overflow reports to the grinding circuit as recycled water. Thickener underflow, at approximately 60% solids is transferred to the Float Tails CIL (Carbon in Leach) circuit for cyanide leaching and dissolution of residual gold and silver values. Figure 17.1 shows a simplified flotation circuit flow sheet.
Figure 17.1: Palmarejo Flotation Circuit Flow
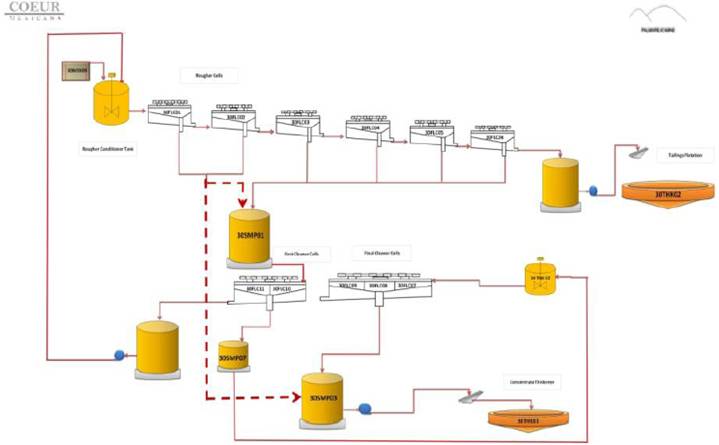
231
17.5 Flotation Concentrate Leaching
The concentrate leaching circuit is located in the Leaching/Recovery Area of the mill facilities and is comprised of 4 agitated leach tanks, each with a volume of 200 m3, providing a total leaching time of 48 hours.
Thickened flotation concentrate is pumped to the concentrate leach circuit. The slurry is then diluted to approximately 50 % solids and sodium cyanide solution is added to maintain a concentration of 10 g/l NaCN. The concentrate leach tanks are sparged with oxygen which enables reducing cyanide concentration from 50 g/l to 10 g/lt NaCN with a substantial reduction on the cyanide consumption.
Leached slurry from the concentrate leach circuit is then pumped to a three stages CCD wash circuit to recover the dissolved gold and silver values. Each stage consists of a high torque, 9.0 m diameter thickener and an inter-stage mixing tank to enhance washing efficiency. Pregnant solution containing metal bearing overflows from the first CCD thickener and it is pumped to the pregnant solution tank for subsequent delivery to the electrowinning circuit at the refinery for further treatment. Thickened underflow from the final CCD thickener is pumped to the CIL leach circuit for additional leaching and potential recovery of residual metal values.
17.6 Flotation Tailings Leaching
The tailings leaching circuit is also located in the Leaching/Recovery Area of the mill facilities and is comprised of 1 leach tank and 7 CIL tanks, each tank contains a volume of 2,000 m3, providing an overall retention time of 24 hours.
Thickened flotation tails are pumped to the tailings CIL circuit. The slurry is combined with the concentrate leached residue, the slurry is diluted to approximately 42% solids and sodium cyanide solution, lime slurry and lead nitrate are added along sparged oxygen through the agitator shafts in tanks 1, 2 and 4. Carbon slurry is advanced between the CIL tanks by use of recessed impeller pumps. Loaded carbon is screened from the second tank (first CIL tank) and transferred to the AARL circuit for stripping of the adsorbed gold and silver values. The CIL circuit tailings slurry is transferred to the cyanide detoxification circuit.
17.7 Carbon Desorption
Loaded carbon from the CIL circuit is transferred in an approximately 10.0 tonnes batch to a split AARL (Anglo American Research Laboratory) carbon stripping circuit. The carbon is acid washed in a 22 m3 capacity reinforced plastic tank before elution. Carbon elution is done in a 24 m3 capacity stainless steel elution column. The stripping circuit nominal capacity is two batches per day. The eluted solution from the carbon stripping circuit is pumped into a pregnant solution tank and combined with the concentrate leach solution and then pumped to the electrowinning circuit.
232
17.8 Carbon Regeneration
Eluted carbon form every elution batch is transferred by eductor to the carbon regeneration kiln feeder bin. The carbon is dewatered in the kiln feed hopper to remove free moisture before regeneration. The dewatered carbon is then fed by a screw feeder into a diesel fired rotary horizontal kiln and regenerated at a temperature range of 650 to 700 oC for a period of time of approximately 20 minutes. The regenerated carbon is discharged to a quench tank via a small vibrating screen; the quenched carbon is then transferred to the last stage of the CIL circuit.
17.9 Electrowinning, Merrill Crowe and Smelting
Pregnant eluted solution from each stripping cycle in the AARL circuit and solution from the flotation concentrate leach CCD first thickener overflow are combined into a pregnant solution tank. The resultant pregnant solution is pumped to one of three batch solution tanks for filling. The second of the batch tanks is circulating solution through the electrowinning powder cells for approximately 6 hours or until the pregnant solution is reduced to approximately 50 ppm Ag. The powder produced during the electrowinning phase is collected in a filter.
The third batch tank is pumped to a Merrill-Crowe system, at a flow rate of 35 m3/hr. of pregnant leach solution. In the Merrill Crowe process, total suspended solids (TSS) are first removed from the pregnant solution in the clarification filters.
The clarified pregnant solution is routed to a deaeration tower to impact a 0.34 m3 bed of high-surface area plastic tower packing. As the solution travels down the packing, dissolved oxygen (DO) is removed from the solution and is routed through the vacuum system piping to the vacuum pump, and then to the atmosphere. The DO is removed to a concentration less than approximately 1 ppm and preferably less than 0.7 ppm. Once the pregnant solution has been clarified and deaerated, it is ready for precious metal precipitation by zinc cementation. The precipitated gold and silver resulting from the zinc cementation reactions are routed to the precipitate filters. The spent solution is pumped to the CIL circuit and/or the concentrate leach circuit for slurry dilution.
The powder produced by electrowinning and precipitate produced by Merrill Crowe are dried before being smelted in a 600 kg/hr. capacity electric induction furnace and poured into 30 kg dore ingots.
Dore ingots are shipped by armored truck to a refinery.
17.10 Cyanide Detoxification
CIL tailings slurry, at approximately 42 % solids is transferred to a tailings thickener for water and cyanide recovery purposes, prior to delivery to the Cyanide Detoxification circuit. Thickener overflow is recycled back to the leach circuit while the thickened underflow is pumped to two 534 m3 capacity agitated tanks in series.
233
The CIL tailings detoxification circuit is based on the use of SO2 /Air for the destruction of cyanide. SO2 is supplied by the addition of sodium metabisulphite (Na2S2O5). In July 2012, a new source of SO2 was used to replace sodium metabisulfite. This new reagent, kown commercially as “Neutralite”, provides similar cyanide destruction capabilities as the sodium metabisulfite. It achieves an average of 96.8 percent total CN- destruction.
Compressed air is injected into the agitated tanks along with the tailings slurry, dilution process water, neutralite and lime (copper sulphate if required) to destroy the cyanide in the tailings prior to discharge to the tailings dam.
Palmarejo process flow sheet is shown at Figure 17.2.
Figure 17.2: Palmarejo Process Flow Sheet
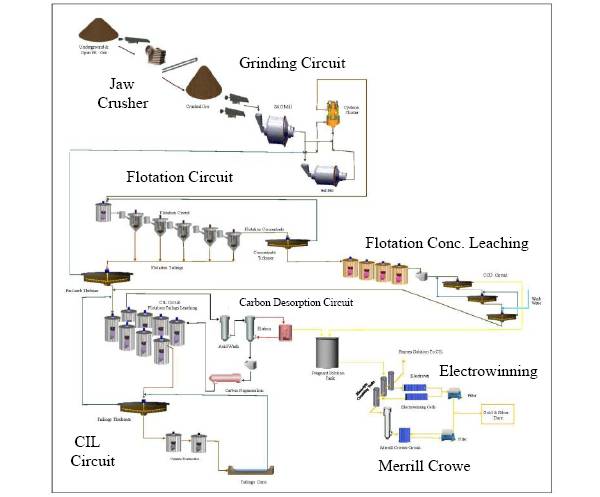
234
17.11 Metallurgical Performance
The processing plant is receiving ore from different mining areas, currently 70% percent of the total ore is provided by the open pit and 30% from underground. Different mineralization zones are under production and the most predominant ore type includes sulfides including silver sulfides (Acanthite), also some of these minerals include Aurorite ((Mn2AgCa)Mn 4O7.3H2O), native silver and a number of copper/silver/sulphide minerals. Gold occurs mainly as electrum.
Ore complexity represents a variety of recoverability during the ore processing stages. In 2012 better ore blending practices were implemented which accounded for a more consistent silver-gold feed grade with a controlled concentration of soluble copper and manganese. In the past the Palmarejo processing plant had experienced difficulties in treating ore with high copper and manganese contents.
Laboratory assays and leaching tests are conducted on samples from each specific mineral zone to determine gold, silver, total copper, soluble copper, manganese and iron values. These values are used to prepare the appropriate ore blending ratio to be fed to the process.
Steady head grades and controlled copper values helped to stabilize the process thereby improving metallurgical performance.
The flotation circuit modification resulted in a significant gold and silver recovery improvement towards the second half of the year. Year to date flotation recoveries were 78.0% Ag and 79.0% Au compared to 70.0% Ag and 73.0% Au from the previous year.
The 2012 year end results show a feed grade of 1.70 g/tonne Au and 165.0 g/tonne Ag. Concentrate leaching recoveries were 93.4% Ag and 95.8% Au. Overall recovery was 83.1% Ag and 93.3% Au.
235
SECTION 18 - PROJECT INFRASTRUCTURE
The Palmarejo area has moderately well developed infrastructure and a local work force familiar with mining operations. The Chihuahua-Pacifico railway connects Chihuahua with Los Mochis, located on Mexico’s western coast in the state of Sinaloa. Passenger and freight trains pass along this railway daily. The Estación Témoris rail station is about 45 km from Palmarejo by gravel road. Light aircraft airstrips are located in both Témoris and Chinipas, and in 2011 an airstrip was built in Palmarejo to service the mine.
The Palmarejo Mine site was serviced with a 33,000-volt power line supplied by the Comisión Federal Electricidad (CFE), the Mexican federal power authority. An additional 115-kV high voltage line was constructed from the Divisadero substation to the Palmarejo Mine site during 2009, and the Palmarejo mine, plant and all other electrical load is now connected to this grid. The same 115-kV high voltage line is within 7 kilometers of the Guadalupe project and excess capacity exists on this line to supply the estimated 2.5 MW of power needed for Guadalupe.
The state road between San Rafael and Palmarejo was initially upgraded in late 2007 for the mobilization of equipment and construction materials. This is an on-going activity as Coeur has permanent maintenance crews working on the road. A joint project between the Chihuahua and Sinaloa State Governments to build a paved road between San Rafael (Chihuahua) and Choix (Sinaloa) is currently underway.
Water for the Palmarejo and Guadalupe mines is obtained from a variety of sources. Since 2010, tailing from the plant have been deposted in the Final Tailing Dam (FTD). Residual water from the wet tailing is recycled back to the plant from the FTD. Underflow from the FTD as was designed is collected in the Environmental Control Dam (ECD), this water is also recycled as make-up water back to the plant. When needed, additional make-up water can be pumped from the Chinipas river infiltration gallery that is piped to site via a 17 km pipeline. The water piped from the Chinipas river infiltration gallery is stored in the FWDD for use in solution make-up or for use in the mine camp. Domestic use water is purchased from local municipalities or is trucked to site from various stations that hold water sent to site from the Chinipas River pipeline.
The infrastructure for the Palmarejo mine is complete and the mine is operating and processing ore 24 hours per day 7 days per week. The Guadalupe project is complemented by the infrastructure of the Palmarejo mine. Much of the existing infrastructure at Palmarejo such as the crushing and milling structures, tailing facility, roads, water treatment plants etc, will all support the Guadalupe mine and material processing.
The latest phase of the Final Tailings Dam was completed in April of 2012 to the 810 meter elevation. The crest of the final phase of the Final Tailings Dam construction is scheduled to be completed by by the first quarter 2015 if not sooner. This will bring dam to the final elevation of 825 meters and complete the final phase of all dam construction at Palmarejo. At this time it is not anticipated that any of the dams will be expanded beyond the currently permitted sizes and elevations.
236
SECTION 19 - MARKET STUDIES AND CONTRACTS
The final product shipped from Palmarejo consists of doré ingots weighing approximately 30kg each. It is estimated that the bars are composed of approximately 95.0% silver, 1.5% gold and 3.5% miscellaneous impurities. Doré bullion is shipped by armored truck to a refinery. The Company markets its doré to credit worthy bullion trading houses, market makers and members of the London Bullion Market Association, industrial companies and sound financial institutions. Coeur has no control over the ultimate end use of its gold and silver.
Contracts
Coeur has numerous business contracts in place to allow day-to-day mining, crushing and processing functions to operate smoothly. The terms of these contracts, with regard to charges, etc. are all within industry norms.
237
SECTION 20 - ENVIRONMENTAL STUDIES, PERMITTING AND SOCIAL OR COMMUNITY IMPACT
The Mexican mine environmental permitting process requires essentially two different permitting documents. Both documents are authorized by Mexico’s primary environmental ministry the Secretariat of Environment and Natural Resources (Secretaría del Medio Ambiente y Recursos Naturales, or SEMARNAT).
The primary evaluation of the environment impact to the mine area and the surrounding environs is the critical first step in the permitting process. In 2006, Coeur submitted the first of many documents that present a through the environmental impact analysis (Manifestación de Impacto Ambiental or MIA) of the proposed action. Thus far the Palmarejo and Guadalupe projects have submitted to SERMARNAT the MIAs for the Palmarejo mine (564 hectares), the Guadalupe project (644 hectares) and a link haul road between Palmarejo and Guadalupe (7.5 hectares). Following the acceptance of the MIA for each project the next step is to attain a specific permit for the disturbance that was evaluated through the MIA. This permit is entitieled the Change in Land Use (Spanish: Cambio de Uso de Suelo or CUS). The orginal CUS was approved in 2006 for a period of 10 years. The MIA has a term of 13 years and will expire in 2019 if there are no additions or changes proposed.
The Palmarejo Mine has been granted full authorization for open pit and underground gold and silver mining within the area depicted in the MIA, as amended. This includes permits for exploration and for construction and operations of the open pit and underground gold and silver mine, and associated cyanide leaching, refining and cyanide detoxification of the tailings prior to discharge into the tailings impoundment (INCO detoxification process). In 2012, the SERMARNAT clarified a specific limit for cyanide concentrations in the tailing disposed in the Final Tailing Dam (FTD); this limit is consistent with other Coeur facility operations at 50 ppm WAD cyanide. Coeur contintues efforts in the management of the Plamrejo tailing facility which is directed toward the company’s goals to attain conformance with operating standards identified by the international cyanide management code.
Palmarejo received an initial environmental authorization from SEMARNAT in 2006 for a period of 10. This was labeled as Phase I for permitting. Phase I also included a specific provision for a Change of Land Use (CLU) an additional approval that is granted from the Mexican authorities for specific land disturbance. The CLU requires a specific mine reclamation plan to restore land disturbed from mining. The Phase I approvals were for 378 hectares for the environmenatal evaluation (MIA) and 329 hectares for the actual land disturbance (CLU). The surface areas overlap in Phase I. Subsequent to the Phase I permitting processes Palmarejo filed for and received approval of a new environmental disturbance authorization for additional 564 hectares was issued in 2010 for 10 years, ending in 2020. Both mining land use authorizations can be extended by SEMARNAT through a relatively simple notification procedure. Subsequent to initial construction, Palmarejo received approvals for continued construction, including the required authorizations for the Change in Land Use.. Should additional disturbance be required it can be added to the balance up to 564 hectares without additional permitting requirements. Payment to the Forestry Fund in accordance with the additional disturbance would be required.
238
Guadalupe is permitted for land disturbance related to an underground and open pit mine and related disturbance (small waste dump, access roads and electrical line distribution). This project received its authorization for environmental disturbance in 2010, and its initial authorization for change of land use in Novemberof 2010. Both authorizations are required by the Mexican government to operate a mine. The mine is currently open and development of the underground structures continues. Ore that is removed was taken to the mill and plant facility via a fully approved roadway.
A right of way agreement for the construction of the Guadalupe-Palmarejo haul corridor was signed with the Guazapares ejido on February 27, 2011. Environmental disturbance and change of land use authorizations were awarded by SEMARNAT on May 30, 2011 and July 11, 2011, respectively. Additional approvals will be required for the final sections of the revised road way which are scheduled for evaluationin 2013. Additional permitting and revised right of way agreements will include a full sized access road to provide for large truck traffic to and from the Guadalupe mine. Accesss to the Palmarejo facilities as described above has been fully permitted and authorized.
Critical to the appropriate management of the Palmarejo and Guadalupe mines is the evaluation of the acid rock drainage (ARD) potential for waste rock and tailing in the extraction process. The results of ARD testing (an accounting of acids and bases following leaching procedures) thus far indicate that the majority of the waste rock mined through 2012 will not create an acidic leachate that drains through the waste rock or tailing facility. Thus far in the mining sequence, the majority of waste rock has been produced by the highly oxidized zones in the open pit. While a statistically valid set of samples have been analyzed for the acid generating potential, the acid base accounting results indicate that disposal of the waste rock and tailing will not become acid forming. However, further testing is required as the mine progresses so that Coeur can fully develop the database for assessment of the potential for acid rock generation as mining proceeds into less oxidized zones. The focus of future testing will provide information on the classification of individual rock types and specific acid base accounting tests to ultimately construct waste rock dumps that provide a physically and chemically stable land form.
In 2012, a long term humidity cell test was conducted on composite tailings samples to assess the potential for the generation of acid. Results from testing conclusively indicate that pre-2012 tailings deposited in the Final Tailings Dam (FTD) will not present problems with acid generation. Additional test will be conducted in 2013 and each subsequent year to determine leaching potential and the potential for acid generation. While the intial data indicate that the potential for acid generation of the tailings in the FTD is low,the tailings are essentially anoxic and incapable of oxidizing while inundated with water.
For the forth consecutive year, in 2012, Coeur Mexicana received the distinctive Environment and Social Responsibility Award from The Mexican Center of Philanthropy. This award is given to companies that have demonstrated a commitment to promoting social responsibility within the company as well as in the communities where they operate.
239
The SEMARNAT Environmental and Forestry Authorization for the project and NOM-141-SEMARNAT-2003 requires a restoration program for mining areas that will recover the soil for landscape restitution and restore ecosystem conditions that provide for previous land use objectives. Coeur conducts an annual review of its potential reclamation responsibilities company wide. The year end 2012 preliminary assessment for the life of mine disturbance for final reclamation at the Palmarejo mine is estimated to be $16.8 million which includes the Guadalupe project.
240
SECTION 21 - CAPITAL AND OPERATING COSTS
21.1 Capital Cost Estimate Palmarejo and Guadalupe
The capital cost estimate for the Palmarejo and Guadalupe Mines are based on combined open pit and underground mine operations with supporting plant & infrastructure that maximizes extraction of the ore resource. Capital expenditures for the LOM for Palmarejo and Guadalupe are estimated at an additional $171.3 million from January 1, 2013 through the end of the mine life.
Major expenditures in 2013 at Palmarejo include $6.0 million for the Final Tailings Dam (FTD) construction and $9.1 million for capitalized development and mine equipment. Expenditures for Guadalupe in 2013 are budgeted at $20.0 million for development and mine equipment.
21.2 Operating Cost Estimate Palmarejo
Operating costs are summarized in Table 21.1 These operating costs are based on recent actuals as well as budgeted and expected LOM costs. Open pit mining costs are shown for waste and ore mining. Underground mining costs are shown for sustaining development and ore mining. General and Administrative (G&A) includes all other costs incurred to sustain the operation.
Table 21.1: Palmarejo Operating Cost, Recovery and Cut-Off Grade Estimate
Item | | Unit | | Value | |
Open Pit Mining | | $/tonne mined | | 1.92 | |
Underground Mining | | $/tonne mined | | 57.02 | |
Ore Processing | | $/tonne ore | | 32.47 | |
G & A - Open Pit and Underground | | $/tonne ore | | 17.66 | |
Reclamation — Open Pit | | $/tonne ore | | 0.20 | |
Cut-off Grade - Open Pit - Internal | | g/t AuEq | | 1.15 | |
Cut-off Grade - Underground | | g/t AuEq | | 2.45 | |
Gold Price | | $/oz | | 1450.00 | |
Silver Price | | $/oz | | 27.50 | |
Mill Recovery - Gold | | % | | 94 | % |
Mill Recovery - Silver | | % | | 82.5 | % |
Payable Metal - Gold | | % | | 99.90 | % |
Payable Metal - Silver | | % | | 99.70 | % |
21.3 Operating Cost Estimate Guadalupe
Operating costs are summarized in Table 21.2. Underground mining cost includes sustaining development and ore mining costs. General and administrative (G&A) includes all other costs
241
incurred to sustain the operation. All costs are based on Palmarejo current budgeted and expected LOM costs with the exception of ore transport costs.
Table 21.2: Guadalupe Operating Cost, Recovery and Cut-Off Grade Estimate
Item | | Unit | | Value | |
Open Pit Mining | | $/tonne mined | | 1.92 | |
Underground Mining | | $/tonne mined | | 57.02 | |
Ore Processing | | $/tonne ore | | 32.47 | |
Ore Transport — Guadalupe to Palmarejo Mill | | $/tonne ore | | 2.56 | |
G & A - Open Pit and Underground | | $/tonne ore | | 17.66 | |
Reclamation — Open Pit | | $/tonne ore | | 0.20 | |
Cut-off Grade - Open Pit — Internal | | g/t AuEq | | 1.21 | |
Cut-off Grade — Underground | | g/t AuEq | | 2.51 | |
Gold Price | | $/oz | | 1450.00 | |
Silver Price | | $/oz | | 27.50 | |
Mill Recovery — Gold | | % | | 94 | % |
Mill Recovery — Silver | | % | | 82.5 | % |
Payable Metal — Gold | | % | | 99.90 | % |
Payable Metal — Silver | | % | | 99.70 | % |
242
SECTION 22 - ECONOMIC ANALYSIS
Table 22.1 below demonstrates that the Palmarejo Mineral Reserves are economically viable based on Coeur’s working financial model, which was updated with life-of-mine reserve production schedules, metal recoveries, costs and capital expenditures.
Table 22.1: Life-Of-Mine Economic Analysis
| | Unit | | Palmarejo | | Guadalupe | |
Mine Production | | | | | | | |
Open Pit Tonnes | | tonnes ore | | 1,930,795 | | 563,102 | |
Ore Au Grade | | g/t Au | | 1.04 | | 1.42 | |
Ore Ag Grade | | g/t Ag | | 154.2 | | 156.1 | |
Underground Tonnes | | tonnes ore | | 2,508,240 | | 6,577,604 | |
Ore Au Grade | | g/t Au | | 3.14 | | 1.51 | |
Ore Ag Grade | | g/t Ag | | 183.6 | | 121.6 | |
Stockpile | | tonnes ore | | 79,391 | | | |
Ore Au Grade | | g/t Au | | 0.55 | | | |
Ore Ag Grade | | g/t Ag | | 77.0 | | | |
Mill Throughput | | | | | | | |
Total Ore Processed | | tonnes ore | | 11,659,133 | |
Ore Grade Au | | g/t Au | | 1.77 | |
Ore Grade Ag | | g/t Ag | | 141.7 | |
Metallurgical Recovery Au | | % | | 94% | |
Metallurgical Recovery Ag | | % | | 82.5% | |
Payable Au | | Oz Au | | 99.90% | |
Payable Ag | | Oz Ag | | 99.70% | |
Revenue | | | | | |
Gold Price | | $/oz | | $1,450 | |
Silver Price | | $/oz | | $27.50 | |
Gross Revenue | | $M | | $2,110.8 | |
Operating Costs | | | | | |
Open Pit Mining | | $M | | ($105.4) | |
Underground Mining | | $M | | ($253.0) | |
Milling/Processing | | $M | | ($378.6) | |
Smelting and Refining | | $M | | ($22.2) | |
G & A | | $M | | ($205.9) | |
Corporate Management Fee | | $M | | ($35.3) | |
Royalty(1) | | $M | | ($138.1) | |
Total Operating Cost | | $M | | ($1,138.5) | |
Cash Flow | | | | | |
Operating Cash Flow | | $M | | $936.5 | |
Capital | | $M | | ($171.3) | |
Royalty(1) | | $M | | ($189.8) | |
Total Cash Flow (Net Cash Flow) | | $M | | $575.3 | |
Project NPV (8% discount rate) | | $M | | $431.4 | |
243
As of January 1, 2013, the Mineral Reserves are estimated to return an NPV of $431.4M at 8% discount rate, and generate a pre-tax net cash flow of $575.3M over the remaining life of the project based on the design and operational parameters contained in this report, including metal prices reflecting a trailing 36-month model (prior to January 1, 2013).
Table 22.2 depicts the annual ore production schedule and projected cash flows based on stated reserves. Tons and recovered metal starts to decline after year 2015 when the Palmarejo and Guadalupe open pits mine out and ore production is coming solely from the Palmarejo and Guadalupe underground operations.
Table 22.2: Yearly Production and Cash Flows
| | 2013 | | 2014 | | 2015 | | 2016 | | 2017 | | 2018 | | 2019 | | 2020 | | Total | |
Ore Tonnes Milled
(x1000) | | 1,944 | | 2,018 | | 1,889 | | 1,520 | | 1,150 | | 1,150 | | 1,150 | | 838 | | 11,659 | |
Recovered Oz Au
(x1000) | | 101.5 | | 125.7 | | 134.5 | | 102.7 | | 55.5 | | 57.4 | | 28.2 | | 19.3 | | 624.7 | |
Recovered Oz Ag
(x1000) | | 7,719 | | 9,320 | | 8,111 | | 5,281 | | 4,262 | | 4,383 | | 3,023 | | 1,718 | | 43,816 | |
Oper. Cash Flow
($M) | | $ | 137.8 | | $ | 214.8 | | $ | 231.4 | | $ | 117.1 | | $ | 87.4 | | $ | 98.5 | | $ | 35.5 | | $ | 14.0 | | $ | 936.5 | |
Net Cash Flow
($M) | | $ | 41.5 | | $ | 104.5 | | $ | 127.6 | | $ | 98.1 | | $ | 77.5 | | $ | 88.6 | | $ | 25.6 | | $ | 12.0 | | $ | 575.3 | |
Tables 22.3 - 22.9 illustrate the financial sensitivity of the project to standalone changes in a number of operating parameters. The base case used to estimate mineral reserves for this report is in bold type and underlined. The net cash flow is most sensitive to grade, then operating cost then capital costs.
Table 22.3: Sensitivity of Project Performance to Gold and Silver Price
Gold Price
($/oz) | | Silver Price
($/oz) | | Net Cash
Flow ($M) | |
$ | 1,050 | | $ | 21.50 | | $ | 187.5 | |
$ | 1,250 | | $ | 24.50 | | $ | 381.4 | |
$ | 1,450 | | $ | 27.50 | | $ | 575.3 | |
$ | 1,650 | | $ | 30.50 | | $ | 769.3 | |
$ | 1,850 | | $ | 33.50 | | $ | 963.2 | |
244
Table 22.4: Sensitivity of Project Performance to a 10% Increase in Gold and Silver Grade
Gold Price
($/oz) | | Silver Price
($/oz) | | Net Cash
Flow ($M) | |
$ | 1,050 | | $ | 21.50 | | $ | 324.8 | |
$ | 1,250 | | $ | 24.50 | | $ | 538.1 | |
$ | 1,450 | | $ | 27.50 | | $ | 751.4 | |
$ | 1,650 | | $ | 30.50 | | $ | 964.7 | |
$ | 1,850 | | $ | 33.50 | | $ | 1,178.0 | |
Table 22.5: Sensitivity of Project Performance to a 10% Decrease in Gold and Silver Grade
Gold Price
($/oz) | | Silver Price
($/oz) | | Net Cash
Flow ($M) | |
$ | 1,050 | | $ | 21.50 | | $ | 50.2 | |
$ | 1,250 | | $ | 24.50 | | $ | 224.7 | |
$ | 1,450 | | $ | 27.50 | | $ | 399.3 | |
$ | 1,650 | | $ | 30.50 | | $ | 573.8 | |
$ | 1,850 | | $ | 33.50 | | $ | 748.3 | |
Table 22.6: Sensitivity of Project Performance to a 10% Increase in Operating Cost
Gold Price
($/oz) | | Silver Price
($/oz) | | Net Cash
Flow ($M) | |
$ | 1,050 | | $ | 21.50 | | $ | 93.2 | |
$ | 1,250 | | $ | 24.50 | | $ | 287.1 | |
$ | 1,450 | | $ | 27.50 | | $ | 481.0 | |
$ | 1,650 | | $ | 30.50 | | $ | 675.0 | |
$ | 1,850 | | $ | 33.50 | | $ | 868.9 | |
Table 22.7: Sensitivity of Project Performance to a 10% Decrease in Operating Cost
Gold Price
($/oz) | | Silver Price
($/oz) | | Net Cash
Flow ($M) | |
$ | 1,050 | | $ | 21.50 | | $ | 281.8 | |
$ | 1,250 | | $ | 24.50 | | $ | 475.7 | |
$ | 1,450 | | $ | 27.50 | | $ | 669.6 | |
$ | 1,650 | | $ | 30.50 | | $ | 863.5 | |
$ | 1,850 | | $ | 33.50 | | $ | 1,057.5 | |
245
Table 22.8: Sensitivity of Project Performance to a 10% Increase in Capital Costs
Gold Price
($/oz) | | Silver Price
($/oz) | | Net Cash
Flow ($M) | |
$ | 1,050 | | $ | 21.50 | | $ | 170.4 | |
$ | 1,250 | | $ | 24.50 | | $ | 364.3 | |
$ | 1,450 | | $ | 27.50 | | $ | 558.2 | |
$ | 1,650 | | $ | 30.50 | | $ | 752.1 | |
$ | 1,850 | | $ | 33.50 | | $ | 946.0 | |
Table 22.9: Sensitivity of Project Performance to a 10% Decrease in Capital Costs
Gold Price
($/oz) | | Silver Price
($/oz) | | Net Cash
Flow ($M) | |
$ | 1,050 | | $ | 21.50 | | $ | 204.6 | |
$ | 1,250 | | $ | 24.50 | | $ | 398.5 | |
$ | 1,450 | | $ | 27.50 | | $ | 592.5 | |
$ | 1,650 | | $ | 30.50 | | $ | 786.4 | |
$ | 1,850 | | $ | 33.50 | | $ | 980.3 | |
For comparison purposes, Coeur d’Alene Mines Corporation, the parent company of Coeur Mexicana, realized $1665 per ounce of gold and $30.92 per ounce of silver on metal sales for 2012.
Taxes
The authority to tax in Mexico rests primarily with the federal government. The Constitution grants exclusive rights to the Congress to levy taxes on domestic and foreign trade; as well as all commercial and industrial activities. The states also have taxing powers; however, they are prohibited by the Constitution from levying taxes in areas exclusively reserved for the federal government. Generally, the states have the right to tax real property, and in most states impose local taxes on salaries.
Companies doing business in Mexico are primarily subject to corporate income tax, business flat tax (IETU tax), tax on real property, value added tax, customs/excise duties, and employer social security contributions. Companies are also subject to various withholding tax requirements on payments to non-residents.
Tax rates for the primary taxes are as follows in Table 22.10.
246
Table 22.10: Tax Rates
Tax Type | | Tax Rate |
Corporate Income Tax | | 30% |
IETU Tax | | 17.5% |
Chihuahua Real Estate Tax | | .2% - .6% |
*Withholding Tax —Technical Assistance | | 25% |
*Withholding Tax — Royalties (Patents, Trademarks, etc.) | | 30% |
*Withholding Tax - Interest | | 10% -30% |
Value Added Tax | | 0%-16% |
Customs and Excise Duties | | 0% - 20% |
Tax on Cash Deposit | | 3% |
Employer Social Security Contributions | | Up to 34.71% of Employees’ Salary Subject to Certain Limitations |
* Reduced rates may be applicable if tax treaty is in force and if appropriate documentation is submitted. Please note, Mexico withholding tax does not apply to payments made to Mexico residents
Royalties
On January 21, 2009, the Company’s wholly-owned subsidiary, Coeur Mexicana SA de CV, entered into a gold production royalty transaction with Franco-Nevada Corporation under which Franco-Nevada purchased a royalty covering 50% of the life of mine gold to be produced from its Palmarejo silver and gold mine in Mexico. Coeur Mexicana received total consideration of $78.0 million consisting of $75.0 million in cash plus a warrant to acquire Franco-Nevada Common Shares (the “Franco-Nevada warrant”), which was valued at $3.0 million at closing of the Franco-Nevada transaction. On September 19, 2010, the warrant was exercised and the related shares were sold for $10.0 million.
The royalty agreement provides for a minimum obligation to be paid in monthly payments on a total of 400,000 ounces of gold, or 4,167 ounces per month over an initial eight year period. Each monthly payment is an amount equal to the greater of the minimum of 4,167 ounces of gold or 50% of actual gold production per month multiplied by the excess of the monthly average market price of gold above $400 per ounce (which $400 floor is subject to a 1% annual inflation compounding adjustment beginning on January 21, 2013). After payments have been made on a total of 400,000 ounces of gold, the royalty obligation is payable in the amount of 50% of actual gold production per month multiplied by the excess of the monthly average market price of gold above $400 per ounce, adjusted as described above. Payments under the royalty agreement are to be made in cash or gold bullion. Payments made during the minimum obligation period will result in a reduction to the remaining minimum obligation. Payments made beyond the minimum obligation period will be recognized as other cash operating expenses and result in an increase to Coeur Mexicana’s reported cash cost per ounce of silver.
Royalty payments were appropriately included in the financial analysis model and totals are shown in Table 22.1.
247
SECTION 23 - ADJACENT PROPERTIES
Exploration activities are under way across the Sierra Madre Occidental by many domestic and foreign mining and mineral exploration companies. Very little open land exists in the belt and around the Palmarejo District and other companies control mineral concessions immediately bordering or within the external boundaries of the Palmarejo District (Foreign Concessions). However, none of the Foreign Concessions have an impact on the Mineral Resources and Reserves stated herein.
248
SECTION 24 - OTHER RELEVANT DATA AND INFORMATION
All relevant data and information is contained within the appropriate sections of this report.
249
SECTION 25 - INTERPRETATION AND CONCLUSIONS
Palmarejo is an operating mining venture that has demonstrated positive cash flow. The financial analysis and associated assumptions conducted for this report support the conclusion that the Palmarejo mine will continue to be profitable and generate acceptable returns over the life of the mine. It is generally assumed, however, that the economic viability of any mining venture, including Palmarejo, is subject to many risks and is not guaranteed.
Guadalupe Mineral Reserves and joint economic analysis with the Palmarejo Mine demonstrate that it is profitable to continue to advance the Guadalupe project. Further work on Guadalupe will focus on optimization of mine designs and plans to maximize economic benefit of this addition to Palmarejo simultaneously as mine development work advances.
A Qualified Person has visited the project sites and has reviewed information pertinant to resource estimation (see Section 2). Data and assumptions used in the estimation of Mineral Resources and Mineral Reserves summarized in this report have been reviewed by the Qualified Persons, with reliance on other experts where appropriate (see Section 3), and they believe that the data are an accurate and reasonable representation of the Palmarejo silver-gold project.
It is the opinion of the Qualified Persons for this report that the Mineral Resource and Reserve estimates are based on valid data and are reasonably estimated using standard engineering practices. There are no known environmental, permitting, legal, title, socio-economic, marketing, or political issues that could materially affect the Palmarejo and Guadalupe Mineral Reserves.
250
SECTION 26 - RECOMMENDATIONS
26.1 Sampling
Based on results of internal quality control programs with regard to the analysis of duplicate sampling results it is recommended to review sampling and sample preparation procedures with regards to sample size, sample length, mineral distribution and grain size to evaluate sources of variance and how to best minimize inconsistencies in the results.
Check sample programs for all properties should be reviewed for appropriateness of analytical methods compared and samples submitted for analysis. Majority of samples reviewed are in the lower grade ranges. Samples submitted for secondary analysis should be representative of the grade population distribution for gold and silver. Standards should be included in all sample batches submitted to the secondary laboratory.
26.2 Resource modeling
Density Measurements
To address reliable density associations with lithology and mineral-type units, it is recommended to review the existing density determinations in the exploration drill holes and perform additional measurements where required. Since this is an operating mine these measurements can be obtained in the core shed by weighing rock dry and submersed in water and need not be performed in outside laboratories. Each lithology and mineral type should be measured in each drill hole. The projected large population of these measurements would allow adequate differentiation of densities for individual lithology units and make resource modeling more reliable. There are no unbudgeted costs associated with this endeavor since this activity will be part of the core shed activities.
Lithology Model
It is recommended that the lithology models be updated on an ongoing basis when new drill holes are added to the database . If derived from cross-sectional polygons the lithology wireframes should be re-interpreted in plan view to warrant a smooth and non-edgy continuation of the veins.
There are no unbudgeted costs associated with this endeavor since this activity should be part of any drill campaign.
Void Model
The Qualified Person has not personally verified the work performed by AMEC (2008) to create a model of the historic mining at Palmarejo and relies on their expertise, noting that the volume of the void model is reasonable for depletion of the Palmarejo resource model. However, the Qualified Person of this report recommends a review of the void model be performed in 2013, taking into account current operating and drilling data.
251
Classification
It is suggested to revisit the classification constraints for Guadalupe. The multitude of veins and stockwork solids within different structural portions of the deposit were interpolated based on their individual variographies. This sometimes resulted in abrupt changes of classification identifiers of neighboring blocks belonging to other lithologies or domains since different numbers of holes and subsequently a different number of associated samples (the basis for classification determinatins) might have been found by the varying search ellipsoids.
26.3 Processing
In 2013 improvements on metal accounting are recommended. This involves evaluating current sampling points and the possibility of the addition additional ones. Sample collection, handling and preparation procedures should be evaluated to establish an optimization program that will allow to obtain more reliable data and to improve metal accounting and process control.
Additional metallurgical test work is recommended to be conducted for La Patria ores. A series of representative composites should be collected using remaining drill core samples corresponding to the different mineralized zones that need to be evaluated by heap leaching techniques. The recommended test work for La Patria will include a series of bottle roll and column tests at different feed sizes to define the ore amenability to be treated under heap leach conditions. A later bulk test using some surface material could be planned depending on the initial metallurgical results.
Costs for the suggested La Patria ore testing (as extrapolated from previous Coeur test programs), can be estimated as follows:
· Part 1 – La Patria representative composites (four composites) evaluation. Bottle roll program Cost estimate: $25,000
· Part 2 - La Patria representative composites (four composites) evaluation. Column test program Cost estimate: $55,000.
Also it is recommended to include the following tests procedures:
· Comminution
· Mineralogical Examination
Based on experience from prior similar test cycles the estimated cost for these additional testing procedures is $20,000.
26.4 Mine Design
Coeur updated the waste dump designs for Palmarejo in 2012 and a geotechnical study should be conducted in 2013 to ensure long term stability. Coeur believes the waste placement plan is sound and the geotechnical study should not significantly alter the life of mine waste plan or other aspects of the mining process. Coeur should conduct a pre-mining geotechnical study for the planned open pit at Guadalupe in 2013.
252
It is recommended that Coeur further refine the Guadalupe open pit design criteria including capital and equipment requirements, waste placement and ore haulage to the Palmarejo mill. This needs to include agreements with the appropriate Ejido entities affected by the proposed ore haulage routes as well as increasing the permitted open pit size to accommodate future reserve and resource additions.
253
SECTION 27 - REFERENCES
Ammtec Ltd., “Comminution Testwork Conducted Upon Samples of Ore from the Palmarejo Gold and Silver Deposit”, a private report for Bolnisi Gold NL, Report Number A9848, September, 2005.
AMEC International (Chile) S.A., “Palmarejo Resource Modeling, Chihuahua, Mexico,” a private report for Coeur d’Alene Mines Corporation, February 2008.
Ammtec Ltd., a report prepared for Planet Gold, January 2004.
Anderson, T. H., and Silver, L.T., “The role of the Mojave-Sonora Megashear in the Tectonic Evolution of Northern Sonora”, in Anderson, T.H., and Roldan-Quintana, J., eds., Geology of Northern Sonora: Geological Society of America, Field Trip Guidebook, 1979.
Avery, Don, “Palmarejo Project Database Audit”, a private report prepared by Mine Development Associates for Coeur d’Alene Mines Corporation, December 13, 2010.
Beckton, J.M., “Resource Report - Palmarejo, June 2004”, internal report of Planet Gold S.A. de C.V., 2004.
Blair, Keith, “A Review of Assay Quality Assurance and Quality Control Information from the Palmarejo Project, Chihuahua, Mexico”, private report prepared by Applied Geoscience LLC for Palmarejo Silver and Gold Corporation, 2005.
Blair, K. R., “A Review of Assay Quality Assurance and Quality Control Information from the Palmarejo Project and Guadalupe Projects, Chihuahua, Mexico”, private report prepared by Applied Geoscience LLC for Palmarejo Silver and Gold Corporation, 2006.
Blair, Keith, Guadalupe and La Patria Projects - Assay Quality Control Review, private report prepared by Applied Geoscience LLC for Palmarejo Silver and Gold Corporation, 2007
Blair, Keith, “Guadalupe and La Patria Projects — Assay Quality Control Review”, private report prepared by Applied Geoscience LLC for Palmarejo Silver and Gold Corporation, July, 2008.
Caceres, Cristian A., “Tucson Pit Geotechnical Study”, private report prepared by Cristian Caceres and Sheila Ballantyne for Palmarejo Silver and Gold Corporation, November, 2012.
Coeur d’Alene Mines Corporation, “Palmarejo Fourth Quarter/Annual QAQC Summary Report 2011”, an internal report, December, 2011.
Coeur, Coeur Expl_QAQC Procedures and Protocols Version 01_31_2012_Final_Spanish, 2012
Corbett, G., “Comments on Palmarejo, and Nearby Exploration Projects, Northern Mexico”, private report for Bolnisi Gold NL, 2005.
254
Corbett, G., “Comments on Palmarejo, El Realito and Yecora Exploration Projects, Northern Mexico”, private report for Bolnisi Gold NL, 2004.
Corbett, G., “Comments on the geology of Guadalupe and nearby Projects at Palmarejo, Mexico”, private report for Bolnisi Gold NL, 2007.
Cytec Mining Chemicals, “Update on Reagent Test Work on Palmarejo Ore”, 22 December, 2005.
Davies, R.C., “La Patria Project Structural Study”, internal memorandum of Bolnisi Gold NL, 2006.
Davies, R.C., “Guadalupe Project Structural Study”, internal memorandum of Bolnisi Gold NL, 2007.
Earthscope Voyager website, viewed February 23, 2012, http://www.dpc.ucar.edu/earthscopeVoyager/JVV_Jr/didyouknow/b-rIntro.html.
Electrometals Technologies Ltd., “Summary Report: Electrowinning a Synthetic Palmarejo Electrolyte”, a private report for Bolnisi Gold NL, January, 2006.
Electrometals Technologies Ltd., “Summary Report: Silver Electrowinning from a Cyanide Electrolyte using EMEW®”, a private report for Bolnisi Gold NL, November, 2005.
Galvan, Victor H., “Palmarejo Epithermal Ag-Au Deposit, Chihuahua, Mexico: Report on First PhD Field Season, January-February 2007”, University of Tasmania, Hobart Australia, 2007.
Gustin, Michael M., “Technical Report, Palmarejo — Trogan Project, Chihuahua, Mexico, 43-101 Technical Report”, (Mine Development Associates, 2004).
Gustin, Michael M., “Updated Technical Report, Palmarejo — Trogan Project, Chihuahua, Mexico, 43-101 Technical Report”, (Mine Development Associates, 2005).
Gustin, Michael M., “Updated Technical Report, Palmarejo — Trogan Project, Chihuahua, Mexico, 43-101 Technical Report”, (Mine Development Associates, 2006).
Gustin, Michael M. and Neil B. Prenn. “Updated Technical Report Palmarejo-Trogan Project, Chihuahua, Mexico”, prepared for Palmarejo Silver and Gold Corporation and Coeur d’ Alene Mines Corporation September 17, 2007 by Mine Development Associates, 2007.
Instituto Nacional de Estadistica y Geografia (INEGI), census data and location, viewed January, 2011, http://www.inegi.org.mx/sistemas/mexicocifras.
255
Jorge Cordoba, General Director of Operations at Palmarejo for Minas Huruapa, S.A. de C.V; [Personal Communication], 2007.
Laurent, I., “Palmarejo/Trogan Project: Annual Technical Report, 1st July 2003 — 30th June 2004”, internal report of Planet Gold, S.A. de C.V., 2004.
Masterman, G., “Guadalupe Precious Metal Zonation Patterns”, internal memorandum of Bolnisi Gold NL, 2006.
Masterman, G., Phillips, K., Stewart, H., Laurent, I., Beckton, J., Cordery, J., and Skeet, J., “Palmarejo Silver — Gold Project, Chihuahua, Mexico: Discovery of a Ag-Au Deposit in the Mexican Sierra”, unpublished report, 2005.
McCarthy, E.T., untitled letter to the chairman and directors of Palmarejo and Mexican Goldfields, Ltd. and attached schedules, 1909.
NCL Ingeniería y Construcción Ltda., “Guadalupe and La Patria Database Review”, prepared for Coeur d’Alene Mines Corporation, September, 2011.
Orway Mineral Consultants Pty. Ltd., “Analysis and Comminution Circuit Modeling”, a draft report prepared for Planet Gold.
Outokumpu Pty Ltd., “Supaflo® Thickener Test Data Report S559TA”, private report for Intermet Engineering Technologies for the Palmarejo Project, July, 2005.
Outokumpu Technologies Pty Ltd., “Summary of Palmarejo Testwork — Leached Products”, December, 2005.
Rhyes, D., Panterra Geoservices Inc., “Evaluation of Structural and Geological Controls on Vein-Hosted Gold Mineralization at the Palmarejo Deposit, Chihuahua State, Mexico”, 2009a.
Rhyes, D., Panterra Geoservices Inc., “Guadalupe Project Area-Observations on its Lithostructural Setting and Potential Controls”, 2009b.
Ross, K, Panterra Geoservices Inc., “Petrographic Study of the Palmarejo Deposit, Chihuahua, Mexico”, September 2009.
Petrolab Laboratorio de inveStigaciones geologicas, “Mineralogy of Guadalupe Au-Ag Vein Deposit”, Melchor, A., January, 2010.
Pincock Allen & Holt PAH Consultants, “Mine Planning Exercise at the Coeur Palmarejo Mine, Mexico” PAH Project No. DE-00179, May, 2011
256
Salas, G.P., ‘Sierra Madre Occidental Metallogenic Province’, in Salas, G.P., ed., “Economic Geology, Mexico” (Boulder, Colorado, Geological Society of America, The Geology of North America, v. P-3, p197-198.,1991 [Palmarejo geology], 1991
Sedlock, R.L., Ortega-Gutierrez, F., and Speed, R.C., “Tectonostratigraphic Terranes and Tectonic Evolution of Mexico”, Geological Society of America Special Paper 278, 142 p., 1993.
SGS Lakefield Oretest Campaign, “Report no. 9745”; prepared for Planet Gold, December 2005.
SGS Lakefield Oretest Campaign, “Report no. 9772”; prepared for Planet Gold, December 2005.
SGS, “Batch and Pilot Flotation on a Sample of Palmarejo Silver/Gold Ore, Lakefield Oretest Job Number 9632”; a private report for Bolnisi Gold NL, May, 2005.
SGS, “Comminution and Flotation Testwork on Palmarejo Drill Core Samples, Lakefield Oretest Job Number 9609”; a private report for Bolnisi Gold NL, December, 2004.
SGS, “Pruebas Metalúrgicas Para Determinar la Susceptibilidad de Dos Muestras de Mineral a los Procesos de Lixiviación, Flotación y Concentración Gravimétrica”, Report No. SGS-49-08; a private report for Planet Gold, S.A. de C.V., November 11, 2008.
SGS, “Pruebas Metalúrgicas Para Determinar la Susceptibilidad de Cuatro Compositos de Mineral a los Procesos de Lixiviación, Flotación y Concentración Gravimétrica”, Report No. SGS-04-09; a prívate report for Coeur Mexicana, S.A. de C.V., March 06, 2009.
Silver, L. T., and Anderson, T. H., “Possible Left-Lateral Early to Middle Mesozoic Disruption of the Southwestern North American Craton Margin”, Geological Society of America Abstracts with Programs, v.6, 1974.
Silver, L. T., and Anderson, T.H., “Further Evidence and Analysis of the Role of the Mojave-Sonora Megashear(s) in Mesozoic Cordilleran Tectonics”, Geological Society of America Abstracts with Programs, v. 15., 1983.
Skeet, J., “Palmarejo Gold-Silver Preliminary Project Summary”, internal report of Bolnisi Gold NL, 2004.
Stewart, H. H., “Progress report for the Guadalupe/Las Animas Target May 3, 2005”, internal memorandum of Bolnisi Gold NL, 2005.
Sillitoe, Richard H., “Comments on Geology and Exploration of the Palmarejo Epithermal Silver-Gold Deposit and Environs, Chihuahua, Mexico”; prepared for Coeur d’Alene Mines Corporation, August 2010.
Townend, R., and Associates, “Private Report on Mineralogy”, private report for Bolnisi Gold NL, 2004.
257