Exhibit 99.3
FRANCO-NEVADA CORPORATION CONSOLIDATED STATEMENTS OF FINANCIAL POSITION (unaudited, in millions of U.S. dollars) September 30, 2013 December 31, 2012 ASSETS Cash and cash equivalents (Note 4) $ 789.5 $ 631.7 Short-term investments (Note 5) 52.1 148.2 Receivables (Note 6) 65.9 83.4 Prepaid expenses and other 29.9 15.9 Current assets 937.4 879.2 Royalty, stream and working interests, net 2,157.5 2,223.6 Investments (Note 5) 70.5 108.4 Deferred income tax assets 9.1 8.7 Other 28.4 24.0 Total assets $ 3,202.9 $ 3,243.9 LIABILITIES Accounts payable and accrued liabilities (Note 10(b)) $ 41.5 $ 44.0 Current income tax liabilities 4.8 12.8 Current liabilities 46.3 56.8 Deferred income tax liabilities 45.3 38.0 Total liabilities 91.6 94.8 SHAREHOLDERS' EQUITY (Note 10) Common shares 3,127.6 3,116.7 Contributed surplus 46.1 47.2 Deficit (105.5) (120.6) Accumulated other comprehensive income 43.1 105.8 Total shareholders' equity 3,111.3 3,149.1 Total liabilities and shareholders' equity $ 3,202.9 $ 3,243.9 The accompanying notes are an integral part of these interim consolidated financial statements. 34 FNV The GOLD Investment that WORKS |
FRANCO-NEVADA CORPORATION CONSOLIDATED STATEMENTS OF INCOME AND COMPREHENSIVE INCOME (unaudited, in millions of U.S. dollars, except per share amounts) For the three months ended September 30, For the three months ended September 30, For the nine months ended September 30, 2010 2013 2012 2013 2012 Revenue (Note 6) $ 98.8 $ 105.2 $ 300.9 $ 312.9 Costs and expenses Cost of sales (Note 7) 13.9 14.1 42.3 44.7 Depletion and depreciation 32.3 31.2 94.9 93.9 Corporate administration (Note 8 & 10(c)) 4.1 4.2 11.4 11.6 Business development 0.5 0.5 2.0 1.7 Impairment of investments (Note 5) - - 5.9 - 50.8 50.0 156.5 151.9 Operating income 48.0 55.2 144.4 161.0 Foreign exchange gains/(losses) and other income/(expenses) 0.1 8.3 (13.9) 9.6 Income before finance items and income taxes 48.1 63.5 130.5 170.6 Finance items Finance income 0.8 3.5 2.5 8.2 Finance expenses (0.2) (0.3) (1.3) (0.9) Net income before income taxes $ 48.7 $ 66.7 $ 131.7 $ 177.9 Income tax expense (Note 9) 13.4 14.7 39.4 42.2 Net income $ 35.3 $ 52.0 $ 92.3 $ 135.7 Other comprehensive income (loss): Items that may be reclassified subsequently to profit and loss: Unrealized gain (loss) in market value of available-for-sale investments, net of income tax of $0.2 (2012 - $2.3) and $2.5 (2012 - $2.6)(Note 5) 1.1 15.0 (16.2) 16.2 Currency translation adjustment 26.9 45.2 (46.5) 38.0 Other comprehensive income (loss) 28.0 60.2 (62.7) 54.2 Total comprehensive income $ 63.3 $ 112.2 $ 29.6 $ 189.9 Basic earnings per share (Note 11) $ 0.24 $ 0.36 $ 0.63 $ 0.95 Diluted earnings per share (Note 11) $ 0.24 $ 0.35 $ 0.62 $ 0.94 The accompanying notes are an integral part of these interim consolidated financial statements. 35 FNV 2013 Q3 REPORT Franco-Nevada Corporation |
FRANCO-NEVADA CORPORATION CONSOLIDATED STATEMENTS OF CASH FLOWS (unaudited, in millions of U.S. dollars) For the nine months ended September 30, 2009 2013 2012 Cash flows from operating activities Net income $ 92.3 $ 135.7 Adjustments to reconcile net income to net cash provided Depletion and depreciation 94.9 93.9 Impairment of investments (Note 5) 5.9 - Other non-cash items 0.6 0.1 Deferred income tax expense (Note 9) 8.4 14.5 Share-based payments (Note 10(c)) 3.4 2.3 Unrealized foreign exchange loss 2.4 0.1 Loss on sale of gold 2.0 0.1 Mark-to-market on warrants 9.5 (9.9) Changes in non-cash assets and liabilities: Decrease in receivables 17.5 1.2 Increase in prepaid expenses and other (18.4) (18.7) Increase/(decrease) in accounts payable and accrued liabilities (10.1) (0.2) Net cash provided by operating activities 208.4 219.1 Cash flows from investing activities Proceeds on sale of short-term investments 201.9 184.2 Purchase of short-term investments (107.7) (343.0) Acquisition of interest in oil & gas properties (0.8) (2.0) Acquisition of working interest in oil & gas properties - (43.9) Acquisition of interests in mineral properties (62.1) (40.2) Purchase of investments (0.3) (18.6) Return of capital on investments 1.8 - Purchase of property and equipment (1.3) - Purchase of oil & gas well equipment (4.5) (13.9) Net cash provided by (used in) investing activities 27.0 (277.4) Cash flows from financing activities Payment of dividends (78.2) (55.8) Credit facility amendment costs (1.5) - Proceeds from exercise of warrants 2.3 241.4 Proceeds from exercise of stock options 5.5 14.4 Net cash provided by (used in) financing activities (71.9) 200.0 Effect of exchange rate changes on cash and cash equivalents (5.7) 15.4 Net increase in cash and cash equivalents 157.8 157.1 Cash and cash equivalents at beginning of period 631.7 794.1 Cash and cash equivalents at end of period $ 789.5 $ 951.2 Supplemental cash flow information: Cash paid for interest expense and loan standby fees during the period $ 0.7 $ 0.6 Income taxes paid during the period $ 36.0 $ 36.7 The accompanying notes are an integral part of these interim consolidated financial statements. 36 FNV The GOLD Investment that WORKS |
FRANCO-NEVADA CORPORATION CONSOLIDATED STATEMENTS OF CHANGES IN SHAREHOLDERS' EQUITY (unaudited, in millions of U.S. dollars) Share capital Contributed Surplus Accumulated other comprehensive income Deficit Total Equity (Note 10) Balance at January 1, 2013 3,116.7 47.2 105.8 (120.6) 3,149.1 Net income - - - 92.3 92.3 Other comprehensive loss - - (62.7) - (62.7) Total comprehensive income - - - - 29.6 Exercise of stock options 7.3 (1.8) - - 5.5 Exercise of warrants 3.3 (1.0) - - 2.3 Share-based payments - 3.4 - - 3.4 Vesting of restricted share units 0.3 (0.3) - - - Adjustment to finance costs - (1.4) - - (1.4) Dividends declared - - - (77.2) (77.2) Balance at September 30, 2013 3,127.6 46.1 43.1 (105.5) 3,111.3 Balance at January 1, 2012 2,803.6 99.5 66.6 (135.5) 2,834.2 Net income - - - 135.7 135.7 Other comprehensive income - - 54.2 - 54.2 Total comprehensive income - - - - 189.9 Exercise of stock options 18.8 (4.4) - - 14.4 Share-based payments - 2.3 - - 2.3 Exercise of warrants 289.6 (48.2) - - 241.4 Vesting of restricted share units 0.3 (0.3) - - - Adjustment to finance costs - - - - - Dividends declared - - - (61.0) (61.0) Balance at September 30, 2012 3,112.3 48.9 120.8 (60.8) 3,221.2 The accompanying notes are an intergral part of these consolidated financial statements. 37 FNV 2013 Q3 REPORT Franco-Nevada Corporation |
Note 1 – Corporate Information Franco-Nevada Corporation (“Franco-Nevada” or the “Company”) is incorporated under the Canada Business Corporations Act. The Company is a gold-focused royalty and stream company with additional interests in platinum group metals, oil & gas and other resource assets. The majority of revenue is generated from a diversified portfolio of properties in the United States, Canada and Mexico. The portfolio includes over 340 royalties and streams covering properties at various stages from production to early stage exploration. The Company’s shares are listed on the Toronto Stock Exchange and the New York Stock Exchange and the Company is domiciled in Canada. The Company’s head and registered office is located at 199 Bay Street, Suite 2000, Toronto, Ontario, Canada. Note 2 – Significant accounting policies Basis of presentation These condensed interim consolidated financial statements have been prepared in accordance with International Financial Reporting Standards (“IFRS”) as issued by the International Accounting Standards Board (“IASB”) applicable to the preparation of interim financial statements, including IAS 34 “Interim Financial Reporting”. These condensed interim consolidated financial statements should be read in conjunction with the Company’s annual financial statements for the year ended December 31, 2012 and were prepared using the same accounting policies, method of computation and presentation as were applied in the annual financial statements for the year ended December 31, 2012, except for the adoption of new accounting standards as described in Note 2(b). These condensed interim consolidated financial statements were authorized for issuance by the Board of Directors on November 4, 2013. The financial information included herein reflects all adjustments, consisting only of normal recurring adjustments which, in the opinion of management, are necessary for a fair statement of the results for the interim periods presented. The results of operations for the three and nine months ended September 30, 2013 are not necessarily indicative of the results to be expected for the full year. Seasonality is not considered to have a significant impact over the interim consolidated financial statements. Taxes on income in the interim period has been accrued using the tax rates that would be applicable to expected total annual income. Certain comparative figures have been reclassified to conform to the current period's presentation. Changes in accounting policies The Company has adopted the following new standards, along with any consequential amendments, effective January 1, 2013. These changes were made in accordance with the applicable transitional provisions. IAS 1, Presentation of Financial Statements IAS 1 was amended to change the disclosure of items presented in other comprehensive income (“OCI”), including a requirement to separate items presented in OCI into two groups based on whether or not they may be recycled to profit or loss in the future. 38 FNV The GOLD Investment that WORKS |
IFRS 10, Consolidated Financial Statements In May 2011, the IASB issued IFRS 10 Consolidated Financial Statements to replace IAS 27 Consolidated and Separate Financial Statements and SIC 12 Consolidation – Special Purpose Entities. The new consolidation standard changes the definition of control so that the same criteria apply to all entities, both operating and special purpose entities, to determine control. The revised definition focuses on the need to have both power and variable returns before control is present. We conducted our review of all our wholly-owned entities and determined that the adoption of IFRS 10 did not result in any change in the consolidation status of any of our subsidiaries. IFRS 11, Joint Arrangements In May 2011, the IASB issued IFRS 11 Joint Arrangements to replace IAS 31 Interests in Joint Ventures. The new standard defines two types of arrangements: Joint Operations and Joint Ventures. Focus is on the rights and obligations of the parties involved to reflect the joint arrangement, thereby requiring parties to recognize the individual assets and liabilities to which they have rights or for which they are responsible, even if the joint arrangement operates in a separate legal entity. We conducted a review of our working interests and determined that the adoption of IFRS 11 did not result in any change in the accounting treatment of these working interests. IFRS 12, Disclosure of Interests in Other Entities In May 2011, the IASB issued IFRS 12 Disclosure of Interests in Other Entities to create a comprehensive disclosure standard to address the requirements for subsidiaries, joint arrangements, and associates including the reporting entity’s involvement with other entities. It also includes the requirements for unconsolidated structured entities (i.e. special purpose entities). We adopted IFRS 12 effective January 1, 2013. The adoption of IFRS 12 will result in incremental disclosures in our annual consolidated financial statements. IFRS 13, Fair Value Measurement In May 2011, the IASB issued IFRS 13 Fair Value Measurement as single source guidance for all fair value measurements required by IFRS to reduce the complexity and improve consistency across its application. The standard provides a definition of fair value and guidance on how to measure fair value as well as a requirement for enhanced disclosures. Enhanced disclosures about fair value are required to enable financial statement users to understand how the fair values were derived. We adopted IFRS 13 on a prospective basis. We have added additional disclosures on fair value measurement in Note 12 – Fair value measurement. Note 3 – Acquisitions Sissingue Royalty On May 29, 2013, the Company acquired a 0.5% net smelter return (“NSR”) on certain tenements that comprise the Sissingue gold project located in Cote d’Ivoire and operated by Perseus Mining Limited, for Australian $2.0 million in cash. Brucejack Royalty On May 13, 2013, the Company acquired an existing 1.2% NSR on Pretium Resources Inc.’s Brucejack gold project located in British Columbia for $45.0 million in cash. The NSR becomes payable following the production of approximately 0.5 million ounces of gold and 17.9 million ounces of silver from the project. Golden Meadows Royalty On May 9, 2013, the Company acquired a new 1.7% NSR on Midas Gold Corp.’s (“Midas”) Golden Meadows gold project located in Idaho for $15.0 million in cash subject to an option by Midas to re-acquire one-third of the royalty for $9.0 million. Under the terms of the acquisition, Franco-Nevada also subscribed for 2,000,000 Midas warrants which are exerciseable into Midas common shares with each warrant having an exercise price of C$1.23 and a ten-year term. The warrants have a forced conversion provision whereby should the volume weighted average trading price of Midas’ common shares be equal to or greater than C$3.23 per share for a 30-day period, Midas may force the holder to exercise the warrants. 39 FNV 2013 Q3 REPORT Franco-Nevada Corporation |
Note 4 - Cash and Cash Equivalents As at September 30, 2013, cash and cash equivalents were primarily held in Canadian and U.S. denominated treasury bills, interest bearing cash deposits and highly-liquid corporate bonds. (expressed in millions) At September 30, 2013 At December 31, 2012 Cash deposits $ 438.8 $ 95.7 Term deposits 129.2 331.5 Treasury bills 102.1 111.8 Canadian federal and provincial government bonds 42.7 44.7 Corporate bonds 76.7 48.0 $ 789.5 $ 631.7 Note 5 – Investments (expressed in millions) At September 30, 2013 December 31, 2012 Short-term investments: Canadian dollar denominated treasury bills $ 20.4 $ 29.8 Term deposits - 99.7 Government bonds 19.4 6.0 Corporate bonds 12.3 12.7 Total short-term investments $ 52.1 $ 148.2 Non-current investments: Equity investments $ 62.8 $ 91.5 Convertible debentures 3.4 3.5 Warrants 4.3 13.4 Total investments $ 70.5 $ 108.4 Short-term investments These investments have been designated as available-for-sale and, as a result, have been recorded at fair value. Non-current investments These investments comprise equity interests in various public and non-public entities which the Company acquired through the open market, as part of its initial public offering or through certain transactions, warrants in various publicly-listed companies and convertible debentures. Equity investments have been designated as available-for-sale and, as a result, have been recorded at fair value, other than one equity investment, a non-public entity, which is recorded at cost as no reliable estimate of fair value can be determined. As at September 30, 2013, the market value of certain of these investments, excluding the warrants, increased compared to their values at June 30, 2013 and the Company recorded a net unrealized gain of $1.1 million (2012 – gain of $15.0 million), net of an income tax expense of $0.2 million, (2012 – income tax expense of $2.3 million) in other comprehensive income (loss) for the three months ended September 30, 2013. 40 FNV The GOLD Investment that WORKS |
As at September 30, 2013, the market value of certain of these investments, excluding the warrants, decreased compared to their values at December 31, 2012 and the Company recorded a net unrealized loss of $16.2 million (2012 – gain of $16.2 million), net of an income tax recovery of $2.5 million, (2012 – income tax expense of $2.6 million) in other comprehensive income (loss) for the nine months ended September 30, 2013. For the three and nine months ended September 30, 2013, the fair values of the warrants decreased by $0.4 million (2012 – gain of $7.3 million) and $9.5 million (2012 – gain of $9.9 million), respectively, from the fair values as at June 30, 2013 and December 31, 2012 and have been included in net income. During the nine months ended September 30, 2013, the fair value of certain of its investments which had been impaired at December 31, 2012, continued to decline in value and resulted in write-downs of $5.9 million (2012 – nil) being included in net income. Note 6 – Revenue Revenue is comprised of the following: Three months ended September 30, Nine months ended September 30, (expressed in millions) 2013 2012 2013 2012 Mineral royalties $ 37.6 $ 51.0 $ 126.3 $ 137.2 Mineral streams 38.9 45.8 120.2 147.8 Oil & gas interests 22.3 8.4 54.4 27.9 Total $ 98.8 $ 105.2 $ 300.9 $ 312.9 Included in receivables is $12.3 million (December 31, 2012 - $19.7 million) subject to provisional price adjustments which are marked-to-market at each reporting period with the change being recorded in revenue in the period. These contracts relate to gold and platinum group metal sales which are provisionally priced and settle at a future date. Note 7 – Costs of sales Costs of sales comprise: Three months ended September 30, Nine months ended September 30, (expressed in millions) 2013 2012 2013 2012 Cost of stream sales $ 11.5 $ 10.7 $ 34.6 $ 35.4 Production taxes 0.6 2.3 2.3 6.8 Oil & gas operating costs 1.8 1.1 5.4 2.5 Total $ 13.9 $ 14.1 $ 42.3 $ 44.7 41 FNV 2013 Q3 REPORT Franco-Nevada Corporation |
Note 8 – Related Party Disclosures Key management personnel include the Board of Directors and executive management team. Compensation for key management personnel of the Company was as follows: Three months ended September 30, Nine months ended September 30, (expressed in millions) 2013 2012 2013 2012 Short-term benefits(1) $ 0.8 $ 0.7 $ 2.3 $ 2.0 Share-based payments(2) 1.0 0.7 1.9 1.9 Total $ 1.8 $ 1.4 $ 4.2 $ 3.9 Includes salary, benefits and short-term accrued incentives/other bonuses earned in the period. Represents the expense of stock options and RSUs earned during the period. Note 9 - Income taxes Three months ended September 30, Nine months ended September 30, (expressed in millions) 2013 2012 2013 2012 Current income tax expense $ 8.2 $ 5.9 $ 31.0 $ 27.7 Deferred income tax expense 5.2 8.8 8.4 14.5 Total $ 13.4 $ 14.7 $ 39.4 $ 42.2 A reconciliation of the provision for income tax taxes computed at the combined Canadian federal and provincial statutory rate to the provision for income taxes as shown in the consolidated statements of income and comprehensive income for the three and nine months ended September 30, 2013 and 2012, are as follows: Three months ended September 30, Nine months ended September 30, (expressed in millions) 2013 2012 2013 2012 Net income before income taxes $ 48.7 $ 66.7 $ 131.7 $ 177.9 Statutory tax rate 24.38% 24.40% 24.38% 24.40% Tax expense at statutory rate 11.9 16.3 32.1 43.4 Reconciling items: Recognition of previously unrecognized tax benefit - - - (0.8) Income/expenses not taxed/deductible - (2.2) 2.4 (2.5) Differences in foreign statutory tax rates 1.4 2.8 4.9 7.4 Differences due to changing future tax rates - (0.2) (0.1) 0.6 Foreign withholding tax 0.2 0.2 0.7 (2.7) Temporary differences subject to initial recognition exemption 0.3 0.4 0.5 0.9 Indexation of mineral properties in foreign jurisdiction - (0.2) (1.3) (1.3) Unrealized foreign exchange on translation - (1.1) 0.1 (1.5) Other (0.4) (1.3) 0.1 (1.3) Income tax expense $ 13.4 $ 14.7 $ 39.4 $ 42.2 42 FNV The GOLD Investment that WORKS |
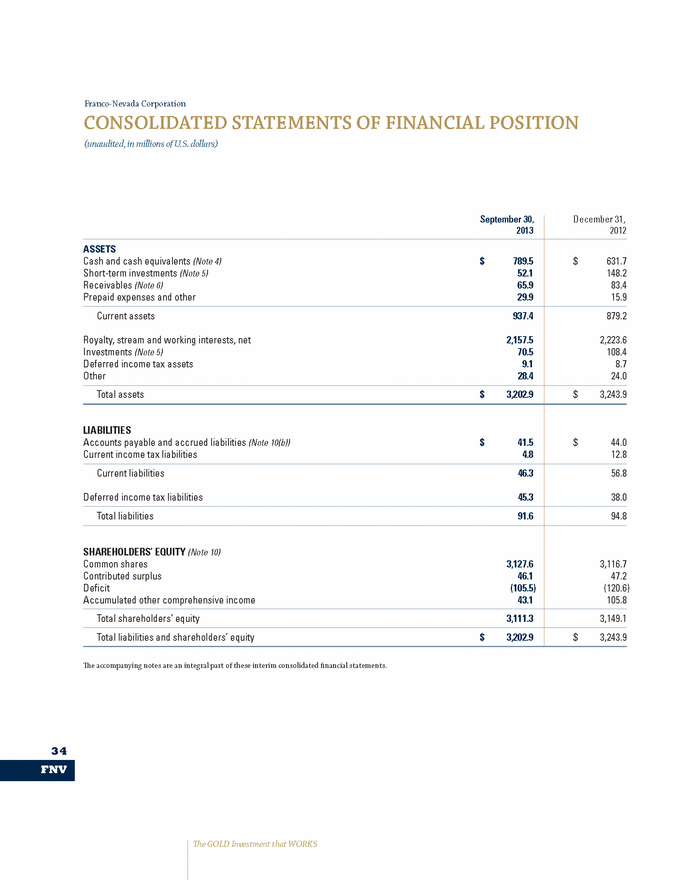
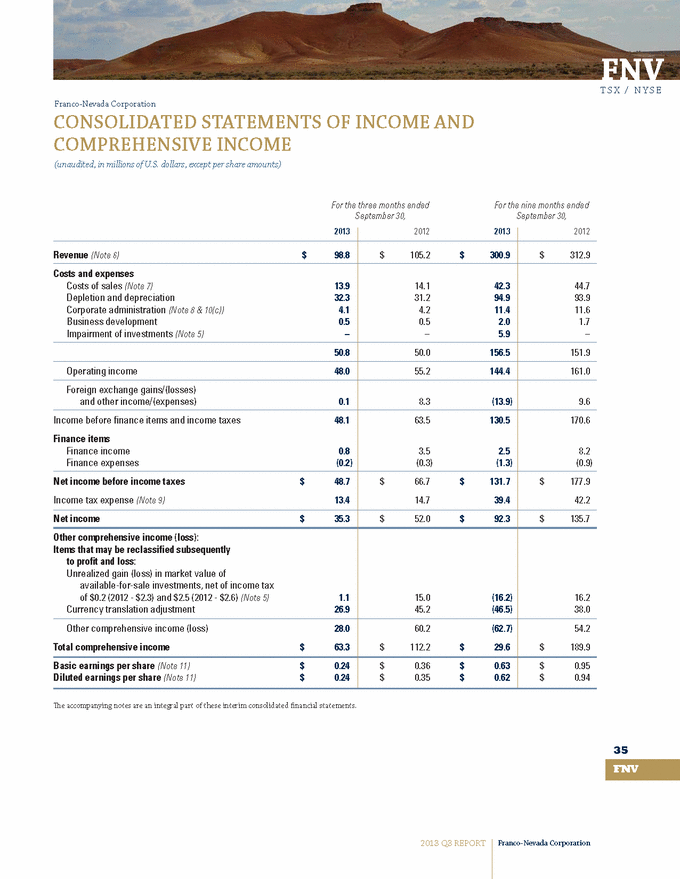
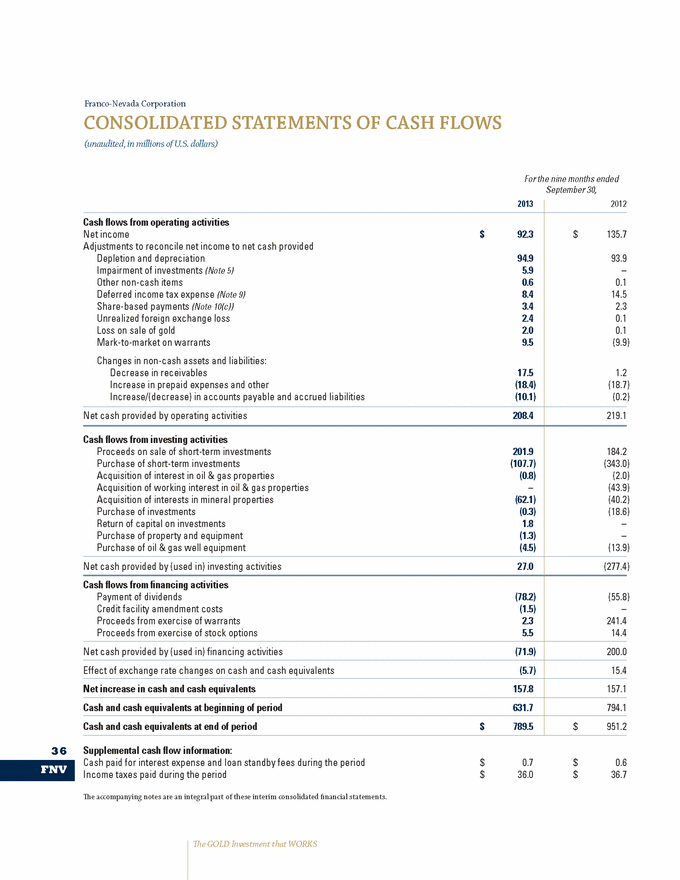
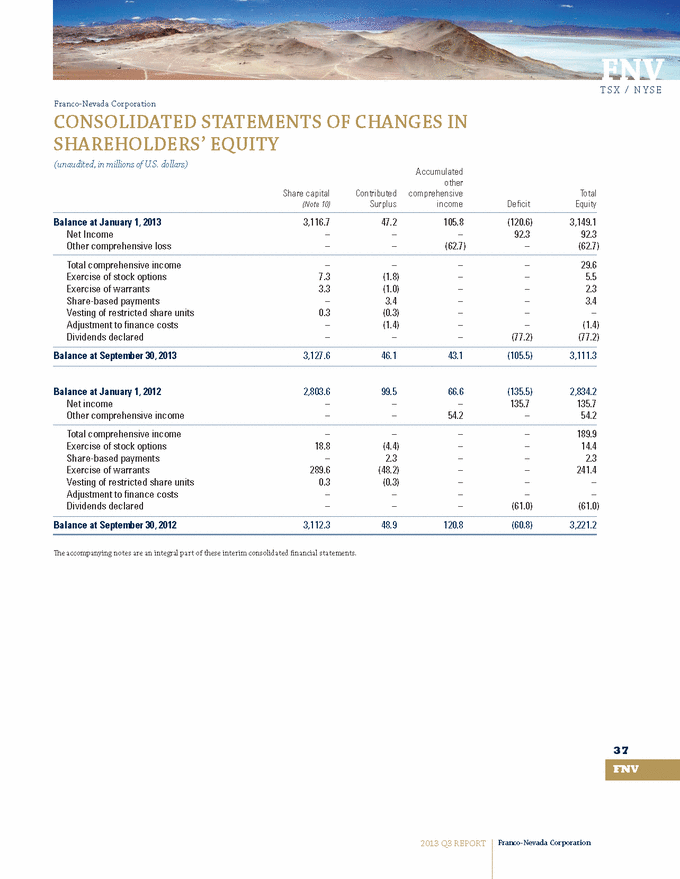
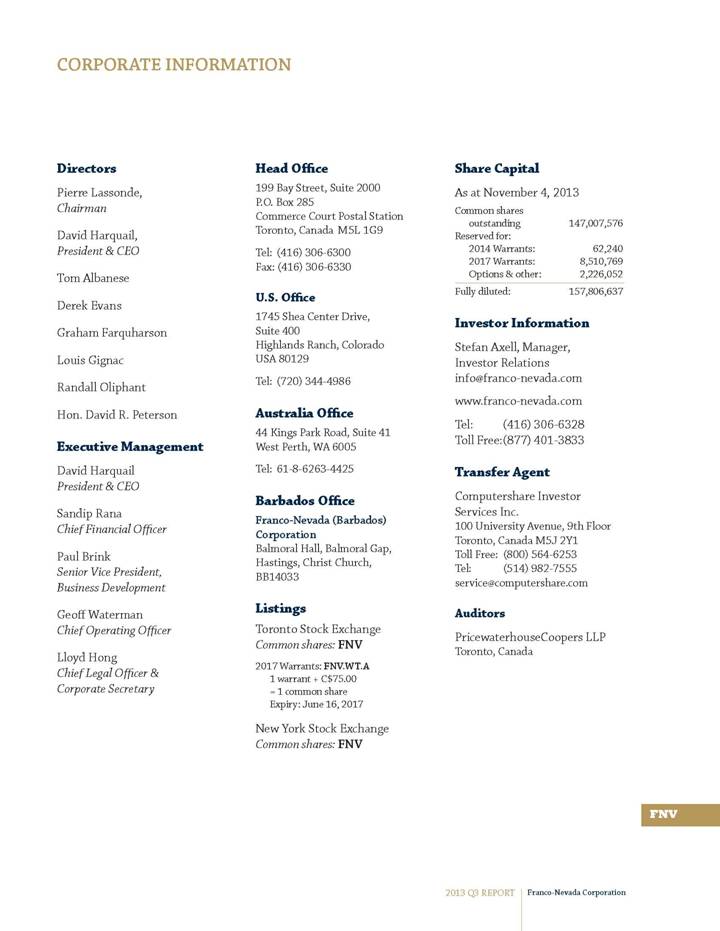
Note 10 - Shareholders’ equity Common shares The Company’s authorized capital stock includes an unlimited number of common shares (issued 146,987,727 common shares) having no par value and preferred shares issuable in series (issued nil). During the three and nine months ended September 30, 2013, the Company issued 123,909 common shares (2012 – 2,620,487) and 257,417 common shares (2012 – 8,183,710), respectively, upon the exercise of stock options and warrants and the vesting of restricted share units for cash proceeds of $3.8 million (2012 – $75.3 million) and $7.8 million (2012 – $255.8 million), respectively. Dividends During the three months ended September 30, 2013 and 2012, the Company declared dividends in the amount of $26.1 million, or $0.18 per share, and $22.1 million, or $0.15 per share, respectively. The Company paid dividends in the amount of $25.9 million, or $0.18 per share, and $21.7 million, or $0.15 per share, in the three months ended September 30, 2013 and 2012, respectively. During the nine months ended September 30, 2013 and 2012, the Company declared dividends in the amount of $78.1 million, or $0.54 per share, and $60.8 million, or $0.42 per share, respectively. The Company paid dividends in the amount of $78.2 million, or $0.54 per share, and $55.8 million, or $0.39 per share, in the nine months ended September 30, 2013 and 2012, respectively. At September 30, 2013, included in accounts payable is an amount of $26.1 million related to declared dividends (December 31, 2012 - $26.4 million). c) Stock-based payments During the three and nine months ended September 30, 2013, 100,000 stock options were granted (2012 – Nil for three months ended September 30, 2012 and 25,000 for nine months ended September 30, 2012). The fair value of the stock options granted during the three and nine months ended September 30, 2013 has been determined to be $1.6 million (2012 – Nil for the three months ended September 30, 2012 and $0.2 million for the nine months ended September 30, 2012)). The fair value of the options was calculated using the Black-Scholes option pricing model and utilized the following weighted average assumptions: 2013 2012 Risk-free interest rate 1.84% 0.98% Expected dividend yield 1.61% 1.131% Expected price volatility of the Company’s common shares 43.05% 28.08% Expected life of the option 5.0 years 2.0 years This resulted in a weighted average fair value of C$15.90 (2012 – C$6.67) per stock option. During the three months ended September 30, 2013, an expense of $0.8 million (2012 - $0.3 million) related to stock options has been included in the consolidated statement of income and comprehensive income (loss). For the nine months ended September 30, 2013, an expense of $2.2 million (2012 - $1.2 million) related to stock options has been included in the consolidated statement of income and comprehensive income (loss). In addition, included in share-based compensation expense for the three and nine months ended September 30, 2013 were amounts of $0.4 million (2012 - $0.3 million) and $1.2 million (2012 - $1.1 million), respectively, related to restricted share units. 43 FNV 2013 Q3 REPORT Franco-Nevada Corporation |
Note 11 – Earnings per Share (“EPS”) For the three months ended September 30, 2013 (expressed in millions except per share amounts) Net Income (Numerator) Shares (Denominator) Per Share Amount Basic EPS $35.3 146.9 $ 0.24 Effect of dilutive securities - 1.0 - Diluted EPS $35.3 147.9 $ 0.24 For the three months ended September 30, 2012 (expressed in millions except per share amounts) Net Income (Numerator) Shares (Denominator) Per Share Amount Basic EPS $52.0 145.3 $ 0.36 Effect of dilutive securities - 1.3 (0.01) Diluted EPS $52.0 146.6 $ 0.35 For the nine months ended September 30, 2013 (expressed in millions except per share amounts) Net Income (Numerator) Shares (Denominator) Per Share Amount Basic EPS $92.3 146.8 $ 0.63 Effect of dilutive securities - 1.0 (0.01) Diluted EPS $92.3 147.8 $ 0.62 For the nine months ended September 30, 2012 (expressed in millions except per share amounts) Net Income (Numerator) Shares (Denominator) Per Share Amount Basic EPS $135.7 143.1 $ 0.95 Effect of dilutive securities - 1.2 (0.01) Diluted EPS $135.7 144.3 $ 0.94 As at September 30, 2013, 373,396 outstanding stock options (2012 – Nil), 6,510,769 share purchase warrants (2012 – 10,556,369) and 65,351 restricted share units (2012 – 92,138) were not included in the computation of diluted EPS due to the exercise prices of the stock options and share purchase warrants being greater than the weighted average price of the common shares for the three and nine months ended September 30, 2013 and due to the performance criteria for the vesting of the RSUs having not been measurable prior to September 30, 2013. 44 FNV The GOLD Investment that WORKS |
Note 12 – Fair value measurement Fair value is defined as the price that would be received to sell an asset or paid to transfer a liability in an orderly transaction between market participants at the measurement date. The fair value hierarchy establishes three levels to classify the inputs to valuation techniques used to measure fair value. Level 1 inputs are quoted prices (unadjusted) in active markets for identical assets or liabilities. Level 2 inputs are quoted prices in markets that are not active, quoted prices for similar assets or liabilities in active markets, inputs other than quoted prices observable for the asset or liability (for example, interest rate and yield curves observable at commonly quoted intervals, forward pricing curves used to value currency and commodity contracts and volatility measurements used to value option contracts), or inputs that are derived principally from or corroborated by observable market data or other means. Level 3 inputs are unobservable (supported by little or no market activity). The fair value hierarchy gives the highest priority to Level 1 inputs and the lowest priority to Level 3 inputs. Assets and liabilities measured at fair value on a recurring basis include: As at September 30, 2013 (expressed in millions) Quoted Prices in Active Markets for Identical Assets (Level 1) Significant Other Observable Inputs (Level 2) Significant Unobservable Inputs (Level 3) Aggregate Fair Value Cash and cash equivalents $ 789.5 $ - $ - $ 789.5 Short-term investments 52.1 - - 52.1 Investments(1) 40.4 - - 40.4 $ 882.0 $ - $ - $ 882.0 Investments exclude $30.1 million of investments which are recorded at cost. Fair Value of Financial Instruments As at September 30, 2013 As at Dec. 31, 2012 (expressed in millions) Carrying amount Estimated fair value Carrying amount Estimated fair value Financial assets Cash and cash equivalents(1) $ 789.5 $ 789.5 $ 631.7 $ 631.7 Short-term investments(1) 52.1 52.1 148.2 148.2 Receivables(1) 65.9 65.9 83.4 83.4 Investments(2) 40.4 40.4 73.9 73.9 $ 947.9 $ 947.9 $ 937.2 $ 937.2 Financial liabilities Accounts payable and accrued liabilities(1) $ 41.5 $ 41.5 $ 44.0 $ 44.0 $ 41.5 $ 41.5 $ 44.0 $ 44.0 Fair value approximates the carrying amounts due to the short-term nature and historically negligible credit losses. Investments exclude $30.1 million (Dec. 31, 2012 - $34.5 million) of investments which are recorded at cost. Investments that have a quoted market price are carried at fair value. 45 FNV 2013 Q3 REPORT Franco-Nevada Corporation |
We have not offset financial assets with financial liabilities. The valuation techniques that are used to measure fair value are as follows: Cash and cash equivalents The fair value of cash and cash equivalents are classified within Level 1 of the fair value hierarchy because they are valued using quoted market prices in active markets. Our cash equivalents are comprised of Canadian and U.S. denominated treasury bills, interest-bearing cash deposits, and highly-liquid government and corporate bonds. Short-term investments The fair value of government and corporate bonds and treasury bills is determined based on quoted market prices in active markets and is classified within Level 1 of the fair value hierarchy. Investments The fair value of investments is determined based on a market approach reflecting the closing price of each particular security at the statement of financial position date. The closing prices are a quoted market price obtained from the exchange that is the principal active market for the particular security, and therefore are classified within Level 1 of the fair value hierarchy. Note 13 – Subsequent event On October 31, 2013, the Company acquired a 2.5% NSR on Kirkland Lake Gold Inc.’s (“Kirkland Lake”) properties in Kirkland Lake, Ontario, for $50.0 million. Kirkland Lake has a 3 year option to buy back 1% of the NSR for $36.0 million (less the royalty proceeds attributable to the buy-back portion of the NSR that has been paid to Franco-Nevada prior to the date of the buy back). On November 1, 2013, the Company acquired a portfolio of royalties from Barrick Gold Corporation for $20.9 million. 46 FNV The GOLD Investment that WORKS |
CORPORATE INFORMATION Directors Pierre Lassonde, Chairman David Harquail, President & CEO Derek Evans Graham Farquharson Louis Gignac Randall Oliphant Hon. David R. Peterson Executive Management David Harquail President & CEO Sandip Rana Chief Financial Officer Paul Brink Senior Vice President, Business Development Geoff Waterman Chief Operating Officer Lloyd Hong Chief Legal Officer & Corporate Secretary Head Office 199 Bay Street, Suite 2000 P.O. Box 285 Commerce Court Postal Station Toronto, Canada M5L 1G9 Tel: (416) 306-6300 Fax: (416) 306-6330 U.S. Office 1745 Shea Center Drive, Suite 400 Highlands Ranch, Colorado USA 80129 Tel: (720) 344-4986 Australia Office 44 Kings Park Road, Suite 41 West Perth, WA 6005 Tel: 61-8-6263-4425 Barbados Office Franco-Nevada (Barbados) Corporation Balmoral Hall, Balmoral Gap, Hastings, Christ Church, BB14033 Listings Toronto Stock Exchange Common shares: FNV 2017 Warrants: FNV.WT.A 1 warrant + C$75.00 = 1 common share Expiry: June 16, 2017 New York Stock Exchange Common shares: FNV Share Capital As at November 4, 2013 Common shares outstanding 147,007,576 Reserved for: 2014 Warrants: 62,240 2017 Warrants: 8,510,769 Options & other: 2,226,052 Fully diluted: 157,806,637 Investor Information Stefan Axell, Manager, Investor Relations info@franco-nevada.com www.franco-nevada.com Tel: (416) 306-6328 Toll Free: (877) 401-3833 Transfer Agent Computershare Investor Services Inc. 100 University Avenue, 9th Floor Toronto, Canada M5J 2Y1 Toll Free: (800) 564-6253 Tel: (514) 982-7555 service@computershare.com Auditors PricewaterhouseCoopers LLP Toronto, Canada FNV 2013 Q3 REPORT Franco-Nevada Corporation |
www.franco-nevada.com |