Exhibit 99.1

TABLE OF CONTENTS
|
| Page |
|
|
|
GENERAL MATTERS |
| 1 |
FORWARD LOOKING STATEMENTS |
| 1 |
NON-IFRS MEASURES |
| 4 |
EXCHANGE RATE INFORMATION |
| 4 |
COMMODITY PRICE INFORMATION |
| 4 |
THE CORPORATION |
| 5 |
GENERAL DEVELOPMENT OF FRANCO-NEVADA’S BUSINESS |
| 6 |
EXPLANATION OF ROYALTIES, STREAMS AND OTHER INTERESTS |
| 13 |
TECHNICAL AND THIRD PARTY INFORMATION |
| 15 |
FRANCO-NEVADA’S ASSETS |
| 16 |
Asset Revenue and Descriptions |
| 17 |
Summary of Mineral Reserves and Mineral Resources |
| 21 |
Gold Assets |
| 28 |
United States |
| 28 |
Canada |
| 33 |
Australia |
| 37 |
Rest of World |
| 40 |
PGM Assets |
| 47 |
Other Minerals Assets |
| 48 |
Exploration Assets |
| 49 |
Oil & Gas Assets |
| 52 |
TECHNICAL REPORTS |
| 56 |
Palmarejo Mining and Technical Information |
| 56 |
RESERVES DATA AND OTHER OIL & GAS INFORMATION |
| 69 |
RISK FACTORS |
| 80 |
DIVIDENDS |
| 93 |
CAPITAL STRUCTURE |
| 94 |
MARKET FOR SECURITIES |
| 94 |
DIRECTORS AND OFFICERS |
| 96 |
LEGAL PROCEEDINGS AND REGULATORY ACTIONS |
| 99 |
INTERESTS OF MANAGEMENT AND OTHERS IN MATERIAL TRANSACTIONS |
| 100 |
REGISTRAR AND TRANSFER AGENT |
| 100 |
MATERIAL CONTRACTS |
| 100 |
EXPERTS |
| 101 |
ADDITIONAL INFORMATION |
| 101 |
AUDIT AND RISK COMMITTEE INFORMATION |
| 101 |
APPENDIX A FORM 51-101F2 |
| A-1 |
APPENDIX B FORM 51-101F3 |
| B-1 |
APPENDIX C FRANCO-NEVADA CORPORATION AUDIT AND RISK COMMITTEE CHARTER |
| C-1 |
GENERAL MATTERS
Unless otherwise noted or the context otherwise indicates, the terms “Franco-Nevada”, “Company”, “Corporation”, “our” and “we” refer to Franco-Nevada Corporation and its subsidiaries. For reporting purposes, the Corporation presents its financial statements in United States dollars and in conformity with International Financial Reporting Standards as issued by the International Accounting Standards Board (“IFRS”). All dollar amounts in this Annual Information Form (“AIF”) are expressed in United States dollars, except as otherwise indicated. References to “$” or “dollars” are to United States dollars, references to “C$” are to Canadian dollars, references to “A$” are to Australian dollars and references to “ZAR” are to South African rand.
The information contained in this AIF is as of December 31, 2013, unless otherwise indicated. More current information may be available on our public website at www.franco-nevada.com or on the System for Electronic Document Analysis and Retrieval (“SEDAR”) at www.sedar.com or on the website of the United States Securities and Exchange Commission (the “SEC”) at www.sec.gov. In addition, we generally maintain supporting materials on our website which may assist in reviewing (but are not to be considered part of) this AIF including a Glossary of Non-Technical Terms, Glossary of Technical Terms, Certain Oil & Natural Gas Terms and a Metric Conversion Table.
FORWARD LOOKING STATEMENTS
This AIF contains “forward looking information” and “forward looking statements” within the meaning of applicable Canadian securities laws and the U.S. Private Securities Litigation Reform Act of 1995, respectively, which may include, but are not limited to, statements with respect to future events or future performance, management’s expectations regarding Franco-Nevada’s growth, results of operations, estimated future revenues, requirements for additional capital, mineral reserve and mineral resource estimates, production estimates, production costs and revenue, future demand for and prices of commodities, expected mining sequences, business prospects and opportunities. In addition, statements (including data in tables) relating to reserves and resources and gold equivalent ounces are forward looking statements, as they involve implied assessment, based on certain estimates and assumptions, and no assurance can be given that the estimates will be realized. Such forward looking statements reflect management’s current beliefs and are based on information currently available to management. Often, but not always, forward looking statements can be identified by the use of words such as “plans”, “expects”, “is expected”, “budgets”, “scheduled”, “estimates”, “forecasts”, “predicts”, “projects”, “intends”, “targets”, “aims”, “anticipates” or “believes” or variations (including negative variations) of such words and phrases or may be identified by statements to the effect that certain actions “may”, “could”, “should”, “would”, “might” or “will” be taken, occur or be achieved. Forward looking statements involve known and unknown risks, uncertainties and other factors, which may cause the actual results, performance or achievements of Franco-Nevada to be materially different from any future results, performance or achievements expressed or implied by the forward looking statements. A number of factors could cause actual events or results to differ materially from any forward looking statement, including, without limitation: fluctuations in the prices of the primary commodities that drive royalty and stream revenue (gold, platinum group metals, copper, nickel, uranium, silver, iron-ore and oil and gas); fluctuations in the value of the Canadian and Australian dollar, Mexican peso and any other currency in which revenue is generated, relative to the U.S. dollar; changes in national and local government legislation, including permitting and licensing regimes and taxation policies; regulations and political or economic developments in any of the countries where properties in which Franco-Nevada holds a royalty, stream or other interest are located or through which they are held; risks related to the operators of the properties in which Franco-Nevada holds a royalty, stream or other interest, including changes in the ownership and control of such operators; influence of macroeconomic developments; business opportunities that become available to, or are pursued by Franco-Nevada; reduced access to debt and equity capital; litigation; title, permit or license disputes related to interests on any of the properties in which Franco-Nevada holds a royalty, stream or other interest; whether or not the Corporation is determined to have PFIC status; excessive cost escalation as well as development, permitting, infrastructure, operating or technical difficulties on any of the properties in which Franco-Nevada holds a royalty, stream or other interest; rate and timing of production differences from resource estimates; risks and hazards associated with the business of development and mining on any of the properties in which Franco-Nevada holds a royalty, stream or other interest, including, but not limited to unusual or unexpected geological and metallurgical conditions, slope failures or cave-ins, flooding and other natural disasters or civil unrest; and the integration of acquired assets. The forward looking statements contained in this AIF are based upon assumptions management believes to be reasonable, including, without limitation: the ongoing operation of the properties in which Franco-Nevada holds a royalty, stream or other interest by the owners or operators of
such properties in a manner consistent with past practice; the accuracy of public statements and disclosures made by the owners or operators of such underlying properties; no material adverse change in the market price of the commodities that underlie the asset portfolio; the Corporation’s ongoing income and assets relating to determination of its PFIC status; no adverse development in respect of any significant property in which Franco-Nevada holds a royalty, stream or other interest; the accuracy of publicly disclosed expectations for the development of underlying properties that are not yet in production; integration of acquired assets; and the absence of any other factors that could cause actions, events or results to differ from those anticipated, estimated or intended. However, there can be no assurance that forward looking statements will prove to be accurate, as actual results and future events could differ materially from those anticipated in such statements and investors are cautioned that forward looking statements are not guarantees of future performance. Franco-Nevada cannot assure investors that actual results will be consistent with these forward looking statements. Accordingly, investors should not place undue reliance on forward looking statements due to the inherent uncertainty therein. For additional information with respect to risks, uncertainties and assumptions, please refer to the “Risk Factors” section of this AIF as well as Franco-Nevada’s most recent Management’s Discussion and Analysis filed with the Canadian securities regulatory authorities on www.sedar.com and the SEC on www.sec.gov. The forward looking statements herein are made as of the date of this AIF only and Franco-Nevada does not assume any obligation to update or revise them to reflect new information, estimates or opinions, future events or results or otherwise, except as required by applicable law.
CAUTIONARY NOTE REGARDING MINERAL AND OIL AND GAS RESERVE AND RESOURCE ESTIMATES
This AIF has been prepared in accordance with the requirements of Canadian securities laws in effect in Canada, which differ from the requirements of U.S. securities laws. Unless otherwise indicated, all mineral resource and reserve estimates included in this AIF have been prepared in accordance with NI 43-101 and the Canadian Institute of Mining and Metallurgy Classification System. NI 43-101 is a rule developed by the Canadian securities regulatory authorities which establishes standards for all public disclosure an issuer makes of scientific and technical information concerning mineral projects. NI 43-101 permits a historical estimate made prior to the adoption of NI 43-101 that does not comply with NI 43-101 to be disclosed using the historical terminology if the disclosure: (a) identifies the source and date of the historical estimate; (b) comments on the relevance and reliability of the historical estimate; (c) states whether the historical estimate uses categories other than those prescribed by NI 43-101; and (d) includes any more recent estimates or data available.
Canadian standards, including NI 43-101, differ significantly from the requirements of the SEC, and resource information contained herein may not be comparable to similar information disclosed by U.S. companies. In particular, and without limiting the generality of the foregoing, the term “resource” does not equate to the term “reserves”. Under U.S. standards, mineralization may not be classified as a “reserve” unless the determination has been made that the mineralization could be economically and legally produced or extracted at the time the reserve determination is made. The SEC’s disclosure standards normally do not permit the inclusion of information concerning “measured mineral resources”, “indicated mineral resources” or “inferred mineral resources” or other descriptions of the amount of mineralization in mineral deposits that do not constitute “reserves” by U.S. standards in documents filed with the SEC. U.S. investors should also understand that “inferred mineral resources” have a great amount of uncertainty as to their existence and great uncertainty as to their economic and legal feasibility. It cannot be assumed that all or any part of an “inferred mineral resource” will ever be upgraded to a higher category. Under Canadian rules, estimated “inferred mineral resources” may not form the basis of feasibility or pre-feasibility studies except in rare cases. Investors are cautioned not to assume that all or any part of an “inferred mineral resource” exists or is economically or legally mineable. Disclosure of “contained ounces” in a resource is permitted disclosure under Canadian regulations; however, the SEC normally only permits issuers to report mineralization that does not constitute “reserves” by SEC standards as in-place tonnage and grade without reference to unit measures. The requirements of NI 43-101 for identification of “reserves” are also not the same as those of the SEC, and reserves reported by the Corporation in compliance with NI 43-101 may not qualify as “reserves” under SEC standards. Accordingly, information concerning mineral deposits set forth herein may not be comparable with information made public by companies that report in accordance with U.S. standards.
In addition to NI 43-101, a number of resource and reserve estimates have been prepared in accordance with the JORC Code or the SAMREC Code (as such terms are defined in NI 43-101), which differ from the requirements of NI 43-101 and U.S. securities laws. Accordingly, information containing descriptions of the Corporation’s mineral properties set forth herein may not be comparable to similar information made public by
U.S. companies subject to the reporting and disclosure requirements under the U.S. federal securities laws and the rules and regulations thereunder. For more information, see “Reconciliation to CIM Definitions”.
Similarly, the requirements of NI 51-101 for disclosure of oil and gas activities differ significantly from those of the SEC, and disclosure concerning the oil and gas properties in which the Corporation has interests may not be comparable with information made public by companies that report in accordance with U.S. standards. The primary differences between the Canadian requirements and the U.S. standards for oil and gas related disclosure are that:
· �� NI 51-101 requires disclosure of gross and net reserves using forecast prices, whereas the SEC rules require the disclosure of net reserves estimated using a historical 12-month average price;
· NI 51-101 requires the disclosure of the net present value of future net revenue attributable to all of the disclosed reserves categories, estimated using forecast prices and costs, before and after deducting future income tax expenses, calculated without discount and using discount rates of 5%, 10%, 15% and 20%, whereas the SEC rules require disclosure of the present value of future net cash flows attributable to proved reserves only, estimated using a constant price (the historical 12-month average price) and a 10% discount rate;
· NI 51-101 requires a one-year reconciliation of gross proved reserves, gross probable reserves and gross proved plus probable reserves, based on forecast prices and costs, for various product types, whereas the SEC rules require a three-year reconciliation of net proved reserves, based on constant prices and costs, for less specific product types; and
· NI 51-101 requires reserves to show a hurdle rate of return, whereas the SEC rules require reserves to be cash flow positive on an undiscounted basis.
NON-IFRS MEASURES
Franco-Nevada included in its 2011, 2012 and 2013 years, the following Non-IFRS Measures:
“EBITDA” is defined by the Corporation as net income (loss) excluding income tax expense/recovery, finance income and costs, and depletion and depreciation.
“Adjusted EBITDA” is defined by the Corporation as net income (loss) excluding income tax expense/recovery, finance income and costs, foreign exchange gains/losses and other income/expenses, gains/losses on sale of investments, losses from equity investees, and depletion and depreciation and impairment charges related to royalties, streams, working interests and investments.
“Adjusted Net Income” is defined by the Corporation as net income (loss) excluding foreign exchange gains/losses, gains/losses on sale of investments, impairment charges related to royalties, streams, working interests and investments, unusual non-recurring items, and the impact of taxes on these items. “EBITDA” is defined by the Corporation as net income (loss) excluding income tax expense/recovery, finance income, finance expenses and depletion and depreciation.
Franco-Nevada plans to continue using these methods.
Please see the notes to the table on page 19 for additional information regarding Adjusted EBITDA. See also the Corporation’s most recently filed MD&A for further information regarding Non-IFRS Measures and reconciliations to Adjusted EBITDA and Adjusted Net Income.
EXCHANGE RATE INFORMATION
The following table sets out the high and low rates of exchange for one U.S. dollar expressed in Canadian dollars in effect at the end of each of the following periods; the average rate of exchange for those periods; and the rate of exchange in effect at the end of each of those periods, each based on the noon rate published by the Bank of Canada.
|
| Years ended December 31, |
| |||||||
|
| 2013 |
| 2012 |
| 2011 |
| |||
High |
| $ | 1.0697 |
| $ | 1.0418 |
| $ | 1.0604 |
|
Low |
| $ | 0.9839 |
| $ | 0.9710 |
| $ | 0.9449 |
|
Average for the Period |
| $ | 1.0299 |
| $ | 0.9996 |
| $ | 0.9891 |
|
End of Period |
| $ | 1.0636 |
| $ | 0.9949 |
| $ | 0.9833 |
|
On March 18, 2014 the noon rate was U.S.$1.00 = C$1.1086 as published by the Bank of Canada.
COMMODITY PRICE INFORMATION
|
| Spot Commodity Prices |
| |||||||||||||
|
| Gold /oz |
| Platinum /oz |
| Palladium /oz |
| Oil / C$ bbl |
| Gas / C$ mcf |
| |||||
|
|
|
|
|
|
|
|
|
|
|
| |||||
Average for 2011 |
| $ | 1,569 |
| $ | 1,720 |
| $ | 733 |
| $ | 95 |
| $ | 3.44 |
|
Average for 2012 |
| $ | 1,669 |
| $ | 1,552 |
| $ | 645 |
| $ | 86 |
| $ | 2.28 |
|
Average for 2013 |
| $ | 1,411 |
| $ | 1,487 |
| $ | 725 |
| $ | 93 |
| $ | 3.01 |
|
THE CORPORATION
Name, Address and Incorporation
Franco-Nevada was incorporated under the Canada Business Corporations Act on October 17, 2007 and was amalgamated with Franco-Nevada Canada Corporation, its wholly-owned subsidiary, on January 1, 2008. Franco-Nevada’s head office and registered office is currently located at Suite 2000, Commerce Court West, 199 Bay Street, Toronto, Ontario M5L 1G9. Franco-Nevada has additional offices in Denver, Colorado, Perth, Australia and Hastings, Christ Church, Barbados, all of which are used to manage its asset portfolio and pursue new investment opportunities.
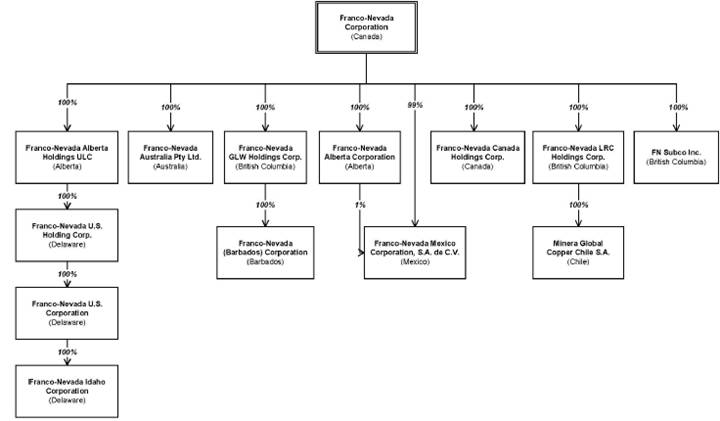
Intercorporate Relationships
Franco-Nevada has thirteen wholly-owned subsidiaries: Franco-Nevada Alberta Holdings ULC, Franco-Nevada U.S. Holding Corp., Franco-Nevada U.S. Corporation (“FN U.S.”), Franco-Nevada Idaho Corporation, Franco-Nevada Australia Pty Ltd., Franco-Nevada GLW Holdings Corp. (“FN GLW”), Franco-Nevada (Barbados) Corporation (“FN Barbados”), Franco-Nevada Alberta Corporation, Franco-Nevada Mexico Corporation, S.A. de C.V., Franco-Nevada Canada Holdings Corp., Franco-Nevada LRC Holdings Corp., Minera Global Copper Chile S.A. and FN Subco Inc. All subsidiaries are wholly-owned by Franco-Nevada either directly or indirectly and are incorporated under the laws of the jurisdictions set out below.
GENERAL DEVELOPMENT OF FRANCO-NEVADA’S BUSINESS
Overview
Franco-Nevada is a gold-focused royalty and stream company with additional interests in platinum group metals (“PGM”), oil & gas and other resource assets. Franco-Nevada is the leading gold royalty and stream company by both gold revenues and number of gold assets. The majority of revenues are generated from a diversified portfolio of properties in the United States, Canada, Mexico, Australia and Africa. The portfolio includes over 370 assets covering properties at various stages from production to early stage exploration. Royalties and streams are mostly revenue or production based. The portfolio also includes profit-based royalties and other forms of periodic future payments. Streams differ from royalties and are generally contracts for the forward purchase of a portion of future precious metal from a mining property.
Franco-Nevada’s assets are mostly mineral and oil & gas royalties or streams but also include some working and equity interests, undeveloped properties, options to acquire royalties and streams and other assets. The mineral royalties and streams are further characterized by commodity as being in the gold, PGM or base metals categories and these in turn are further subdivided by their project status as being either producing, advanced or exploration assets. A majority of the mineral royalties and streams are characterized as being gold and the majority of revenues are from gold assets. Franco-Nevada considers its stream interest in the Palmarejo project to be its only material mineral project for the purposes of NI 43-101. Previously, Franco-Nevada’s royalty interests in the Goldstrike complex were considered to be a material mineral project for the purposes of NI 43-101 but in light of additions to Franco-Nevada’s asset portfolio, the contributions from the Goldstrike complex in 2013, and the expected contribution from the Goldstrike complex in the future compared to the entire portfolio, the Goldstrike complex is no longer considered to be a material mineral project to Franco-Nevada. Franco-Nevada will continue to assess the materiality of its assets as new assets are acquired or move into production. Franco-Nevada’s oil & gas assets are located primarily in the Western Canadian sedimentary basin with a larger amount of revenue generated from conventional oil than from natural gas properties in 2013. The oil & gas assets also include mineral rights to approximately 100,000 gross acres of unproved land in Canada primarily related to oil & natural gas rights as well as working interests in Arctic gas resources.
Mineral royalties and streams are an alternative to other more conventional forms of financing, including equity, convertible securities and debt financings which can be used to finance mineral projects. Franco-Nevada competes directly against these other sources of capital to provide financing for mining and oil & gas projects.
Franco-Nevada currently operates a small organization. As of March 19, 2014, Franco-Nevada has 26 full-time employees and 4 part-time contractors. As such, Franco-Nevada is dependent upon the continued availability and commitment of its key management, whose contributions to the immediate and future operations of Franco-Nevada are of significant importance. From time to time, Franco-Nevada may also need to identify and retain additional skilled management and specialized technical personnel to efficiently operate its business. For additional information, see “Risk Factors”.
Franco-Nevada has several foreign subsidiaries and holds royalties, streams and other interests in numerous jurisdictions around the world. For additional information on risks related to these interests in foreign jurisdictions, see “Risk Factors”.
Corporate Policies
Franco-Nevada currently does not operate any of the mineral or oil & gas assets in which it has royalty/stream interests. However, Franco-Nevada recognizes its business model is dependent on the industry operating in a responsible fashion and actively supports the industry in its efforts and initiatives. Franco-Nevada may from time to time engage in exploration efforts as part of advancing a property or to conduct due diligence in advance of undertaking an investment. When doing so, Franco-Nevada undertakes to be guided by the Principles and Guidance for a Framework of Responsible Exploration as set forth by the e3Plus program of the Prospectors and Developers Association of Canada.
Franco-Nevada has adopted policies relating to its business conduct, including a code of business conduct and ethics, an environmental and corporate social responsibility policy and a health and safety policy. Franco-Nevada was also a leader and founding signatory of the World Gold Council’s Conflict-Free Gold Standard which was published in October 2012. The Corporation also occasionally makes corporate social investments in cooperation with the operators of its assets. In 2012, the Corporation committed to fund $500,000 over
five years to support the new School of Mines at Laurentian University in Sudbury, Ontario. In 2013, the Corporation made its annual contribution of $100,000 under this commitment. Additional information relating to these and other policies are contained in Franco-Nevada’s information circular for its annual and special meeting of shareholders held on May 8, 2013 and will also be contained in Franco-Nevada’s information circular for its annual and special meeting of shareholders scheduled to be held on May 7, 2014. See “Statement of Governance Practices” in such circulars.
Background of Franco-Nevada
Many of Franco-Nevada’s assets were originally acquired and developed by Franco-Nevada Mining Corporation Limited (“Old Franco-Nevada”), Normandy Mining Limited (“Normandy”) and Newmont Mining Corporation (“Newmont”). Old Franco-Nevada was a publicly-listed company on the Toronto Stock Exchange (the “TSX”) from 1983 to 2002 and had originally acquired royalties at the Goldstrike complex along with many other royalties. In February 2002, Newmont acquired Old Franco-Nevada along with Normandy. Old Franco-Nevada’s assets and part of its management team were incorporated into a new division of Newmont called Newmont Capital Limited (“Newmont Capital”). Newmont Capital’s activities included the management of royalty, investment and project portfolios as well as corporate development. Pursuant to an acquisition agreement, Franco-Nevada acquired its initial royalty portfolio from Newmont effective December 20, 2007 and also agreed to assume certain liabilities related to such portfolio. Franco-Nevada then acquired more assets of which the more significant included the Gold Quarry royalty in 2008, the Palmarejo gold stream and Subika royalty in 2009 and the Prosperity gold stream in 2010.
Three-Year History
2011
Material Transactions and Developments
Acquisition of Gold Wheaton
On March 14, 2011, pursuant to an arrangement agreement dated as of January 5, 2011 (the “Arrangement Agreement”) between Franco-Nevada and Gold Wheaton Gold Corp. (“Gold Wheaton”), Franco-Nevada acquired all of the outstanding common shares of Gold Wheaton that it did not already own and amalgamated Gold Wheaton with a wholly-owned subsidiary of Franco-Nevada to form FN GLW. Franco-Nevada had previously acquired on January 5, 2011, a 34.5% interest in Gold Wheaton from Quadra FNX Mining Ltd. (“Quadra FNX”) for C$4.65 per share in cash (C$262,558,186 million). Following the acquisition of Gold Wheaton, the Corporation topped up Quadra FNX’s total consideration to C$5.20 per share in cash (an additional C$31,055,269) on March 21, 2011, which was the same consideration received by Gold Wheaton shareholders. The total aggregate purchase price was C$293,613,455 for the 34.5% interest.
The Arrangement Agreement provided Gold Wheaton shareholders (other than Franco-Nevada) with the option to elect to receive either (i) 0.1556 of a Common Share or (ii) C$5.20 in cash (the “Arrangement Consideration”), for each Gold Wheaton common share, subject to applicable caps and pro-ration. In accordance with the Arrangement Agreement, Gold Wheaton shareholders (other than Franco-Nevada) received in the aggregate cash consideration of approximately C$259.5 million and approximately 11.65 million common shares of Franco-Nevada (“Common Shares” and each a “Common Share”). In accordance with the maximum cash and share caps and pro-rationing mechanism under the Arrangement Agreement and as a result of Gold Wheaton shareholder elections, Gold Wheaton shareholders who elected or were deemed to have elected all cash received C$5.20 in cash, for each Gold Wheaton common share. Gold Wheaton shareholders who elected all shares received approximately 0.1262 of a Common Share and approximately C$0.99, for each Gold Wheaton common share.
Gold Wheaton warrants that were outstanding as of 12:01 a.m. (Vancouver time) on March 14, 2011 (the “Effective Time”) became warrants of FN GLW that upon exercise would entitle each holder thereof, at its election, to receive the Arrangement Consideration. Based on the original C$10 per share exercise price of the original Gold Wheaton warrants, the effective exercise price of these FN GLW warrants was C$64.27 per Common Share. The FN GLW warrants expired on July 8, 2013 (the “2013 GLW Warrants”).
Gold Wheaton options that were outstanding at the Effective Time became options of FN GLW that upon exercise will entitle each holder thereof to receive 0.1556 of a Franco-Nevada Common Share.
Prior to the above transaction, on December 31, 2010, Franco-Nevada acquired 10% secured notes of Gold Wheaton from third parties having an aggregate face value of C$100 million. Franco-Nevada purchased the
notes for approximately C$111 million plus accrued interest. The purchase price was equal to the price at which the holder had the right to call the notes in the event of a change of control of Gold Wheaton. Notes with a face value of C$7 million remained outstanding following the closing of the acquisition and were repaid on March 20, 2011.
A business acquisition report dated March 22, 2011 in respect of the acquisition of Gold Wheaton was filed by Franco-Nevada on SEDAR at www.sedar.com. For a description of the assets acquired as a result of the acquisition of Gold Wheaton, see “Gold Assets — Canada — Sudbury (Gold), Ontario” and “PGM Assets — Sudbury (PGM), Ontario” and “Gold Assets — Rest of World — MWS, South Africa and Cooke 4, South Africa”.
New York Stock Exchange (“NYSE”) Listing
On September 8, 2011, the Common Shares began trading on the NYSE under the symbol “FNV”.
2011 Public Offering
On September 15, 2011, Franco-Nevada filed a short form base shelf prospectus (the “Base Shelf Prospectus”) in Canada and the U.S. which allowed the Corporation to offer and issue from time to time Common Shares, preferred shares, debt securities, warrants to purchase Common Shares, preferred shares or debt securities and subscription receipts or any combination thereof for an aggregate initial offering price of up to C$1 billion (or the equivalent thereof in other currencies) during the 25-month period that the Base Shelf Prospectus, including any amendments thereto, remained effective.
On November 30, 2011, Franco-Nevada issued 9,200,000 Common Shares (including the full exercise of an over-allotment option) at a price of C$42.50 per share for aggregate gross proceeds of C$391 million. This public offering was made by way of a prospectus supplement to the Base Shelf Prospectus. The Common Shares were sold on a bought-deal basis pursuant to an underwriting agreement dated November 23, 2011 (the “2011 Underwriting Agreement”) between Franco-Nevada and a syndicate of investment dealers led by BMO Capital Markets.
Other Transactions and Developments
Acquisition of the Edikan Royalty Interest
On June 30, 2011, Franco-Nevada acquired for $35 million an effective 1.5% net smelter return (“NSR”) royalty on gold production from the Ayanfuri concession in Ghana. Perseus Mining Limited (“Perseus”) is the operator of this property.
Acquisition of the Canadian Malartic Royalty Interest
On July 12, 2011, Franco-Nevada acquired a 1.5% gross overriding metal royalty encompassing seven mining claims which comprise a portion of Osisko Mining Corporation’s (“Osisko”) Malartic project in Canada. The purchase price was C$9.7 million payable by the issuance of 267,000 Common Shares.
Acquisition of the Phoenix Royalty Interest
On August 31, 2011, Franco-Nevada acquired a 2% NSR royalty payable on part of Rubicon Minerals Corporation’s (“Rubicon”) Phoenix gold project in Red Lake, Ontario lying primarily beneath the waters of Red Lake. Rubicon has an option to repurchase a 0.5% NSR royalty from Franco-Nevada. The purchase price was approximately $23.7 million payable by the issuance of 550,000 Common Shares.
Acquisition of Lumina Royalty Corp.
On September 21, 2011, Franco-Nevada and Lumina Royalty Corp. (“Lumina”) entered into an arrangement agreement pursuant to which Franco-Nevada agreed to acquire all of the outstanding common shares of Lumina by way of a statutory plan of arrangement for consideration payable in Common Shares and 2017 Warrants (as defined below). The transaction closed on December 1, 2011 and Lumina shareholders received an aggregate of 1,383,850 Common Shares and 2017 Warrants (aggregate of 760,769 warrants issued).
With this acquisition, Franco-Nevada acquired the following royalty interests:
· a 1.5% NSR royalty on Teck Resources Ltd.’s Relincho copper/molybdenum project located in Region III, Chile;
· a 1.08% NSR royalty on Lumina Copper Corp.’s Taca Taca copper/gold/molybdenum project located in Salta Province, Argentina;
· certain royalties on Coro Mining Corp.’s San Jorge copper/gold/molybdenum project located in Mendoza Province, Argentina (which royalties have been restructured such that Franco-Nevada receives, among other things, a 7.5% NSR royalty on gold produced from the property); and
· a 2% NSR royalty on open pit mining and a 1% NSR royalty on underground mining on a portion of Los Andes Copper Limited’s Vizcachitas copper/molybdenum project located in Region V, Chile.
2012
Material Transactions and Developments
Acquisition of Cobre Panama Precious Metals Stream
On August 20, 2012, Franco-Nevada announced the acquisition of a precious metals stream on Inmet Mining Corporation’s (“Inmet”) Cobre Panama copper project in Panama (“Cobre Panama”) which is currently owned 80% by a successor to Inmet and 20% by Korea Panama Mining Corp. (“KPMC”).
Under the terms of the agreement (the “Cobre Panama Agreement”) between FN Barbados, Minera Panama, S.A. (“MPSA”), the owner and developer of Cobre Panama, and other Inmet subsidiaries, Franco-Nevada will provide a $1 billion deposit, secured by a pledge of Inmet’s interest in MPSA, to fund a portion of Cobre Panama’s capital costs. In 2013, Inmet was acquired by First Quantum Minerals Ltd. (“First Quantum”) which plans to advance the development of Cobre Panama. Franco-Nevada’s deposit will become available after First Quantum’s funding reaches $1 billion and funding of the deposit will be pro-rata on a 1:3 ratio of First Quantum’s share of the capital costs (First Quantum owns 80% of the project), up to a maximum of $1 billion. First Quantum has requested changes under the security and reporting requirements of the Cobre Panama Agreement. Franco-Nevada is considering changes to achieve a mutually beneficial outcome. Franco-Nevada expects to fund approximately $200 million in 2014 under the Cobre Panama Agreement.
The amount of gold and silver deliverable under the Cobre Panama Agreement is indexed to copper in concentrate produced from Cobre Panama and approximates 86% of the payable precious metals attributable to First Quantum’s 80% ownership. Beyond the initial contemplated mine life, the precious metals deliverable under the stream will be based on a fixed percentage of the precious metals in concentrate. Under the terms of the Cobre Panama Agreement, Franco-Nevada will pay $400 per ounce (“ounce” or “oz”) for gold and $6 per ounce for silver (subject to an annual adjustment for inflation) for the first 1,341,000 ounces of gold and 21,510,000 ounces of silver, respectively, delivered to Franco-Nevada under the agreement. Thereafter Franco-Nevada will pay the greater of $400 per ounce for gold and $6 per ounce for silver (subject to an annual adjustment for inflation), respectively, and one half of the then prevailing market price (collectively, the “Fixed Price”) based on a fixed percentage of the precious metals in concentrate.
KPMC did not participate in the transaction. An amended and restated shareholders’ agreement between Inmet and KPMC provides that the precious metals stream will not adversely impact KPMC’s economic interest in or funding requirements for Cobre Panama.
Following an extensive review of the project, First Quantum provided an update in January 2014. The revised project will have an initial installed capacity of 70 million tonnes per annum (“Mtpa”) which is higher than anticipated in the Inmet plan although first concentrate production is now only expected in fourth quarter of 2017. The increased capacity is expected to deliver metal to Franco-Nevada at an increased rate which would be partially offset by the construction delay. The new plan envisions a 34 year mine life with potential further expansion from 70 Mtpa to 100 Mtpa after 10 years of operation.
Acquisition of Weyburn Net Royalty Interest
On November 13, 2012, the Company acquired an 11.71% net royalty interest in the Weyburn Unit for C$400 million in cash from Penn West Petroleum Ltd. and Penn West Petroleum. The acquisition increased the Company’s exposure to the Weyburn Unit, a long-life oil project located in Saskatchewan, and had an effective date of October 1, 2012.
Other Transactions and Developments
Acquisition of Additional Royalty in Bronzewing
On January 11, 2012, Franco-Nevada increased its NSR royalty on Navigator Resources Limited’s (“Navigator”) Bronzewing mine in Western Australia from 1% to 2% for A$4.5 million.
Acquisition of Working Interest in Weyburn Unit
On February 23, 2012, Franco-Nevada acquired an additional 1.15% working interest in the Weyburn Unit in southeast Saskatchewan for approximately C$55 million, increasing its total working interest in the Weyburn Unit to 2.26% at that time,
Acquisition of Timmins West Royalty Interest
On February 29, 2012, Franco-Nevada acquired a 2.25% NSR royalty from Lake Shore Gold Corp. (“Lake Shore”) on the Timmins West Complex located in Ontario for $35 million. In addition to the royalty, Franco-Nevada acquired 10,050,591 common shares of Lake Shore for C$15 million.
2013
Material Transactions and Developments
Credit Facility
On January 23, 2013, the Company replaced its $175.0 million credit facility with a $500.0 million unsecured revolving term credit facility with Canadian Imperial Bank of Commerce, as Administrative Agent. See “Material Contracts” for the other parties to the credit agreement. The facility has a four year term and may be used for general corporate purposes, including working capital requirements and funding acquisitions. On March 19, 2014, the Company extended its credit facility for an additional two years with the amended expiry being March 19, 2019.
Base Shelf Prospectus
Franco-Nevada’s Base Shelf Prospectus filed on September 15, 2011 expired on October 15, 2013. On October 29, 2013, Franco-Nevada filed a new short form base shelf prospectus (the “2013 Base Shelf Prospectus”) in Canada and the U.S. which allows the Corporation to offer and issue from time to time Common Shares, preferred shares, debt securities, warrants to purchase Common Shares, preferred shares or debt securities and subscription receipts or any combination thereof for an aggregate initial offering price of up to C$1 billion (or the equivalent thereof in other currencies) during the 25-month period that the 2013 Base Shelf Prospectus, including any amendments thereto, remains effective.
Other Transactions and Developments
Acquisition of Brucejack Royalty Interest
On May 13, 2013, Franco-Nevada acquired an existing 1.2% NSR royalty covering Pretium Resources Inc.’s Brucejack gold project in northwestern British Columbia for $45.0 million in cash. The NSR royalty becomes payable after approximately 500,000 ounces of gold and 17.9 million ounces of silver have been produced. The project includes two principal deposits, the Valley of the Kings and the West Zone.
Acquisition of Golden Meadows Royalty Interest
On May 9, 2013, Franco-Nevada acquired a newly created 1.7% NSR royalty covering Midas Gold Corp.’s (“Midas Gold”) project in Idaho for $15.0 million in cash subject to an option by Midas Gold to re-acquire one-third of the royalty for $9.0 million for a period of three years. As part of the transaction, Franco-Nevada also subscribed for 2,000,000 Midas Gold common share purchase warrants having an exercise price of C$1.23 per common share and a ten year term.
Acquisition of Sissingue Royalty Interest
On May 29, 2013, Franco-Nevada acquired a 0.5% NSR royalty on certain tenements that comprise the Sissingue gold project located in Côte d’Ivoire and operated by Perseus. The purchase price was A$2.0 million in cash.
Dividend Reinvestment Plan
On July 9, 2013, Franco-Nevada adopted a Dividend Reinvestment Plan (the “DRIP”), to provide, among other things, eligible holders of Franco-Nevada’s Common Shares with a means to reinvest dividends declared and payable to them as shareholders (less any withholding tax) in additional Common Shares of Franco-Nevada. Currently, such Common Shares are issued from treasury at a 3% discount to the market price. The discount may be adjusted in future but cannot exceed 5%. Shareholders were able to participate in the DRIP starting with the October 2013 dividend payment.
Acquisition of Kirkland Lake Royalty Interest
On October 31, 2013, Franco-Nevada acquired a 2.5% NSR royalty on Kirkland Lake Gold Inc.’s (“Kirkland Lake”) properties in Kirkland Lake, Ontario for $50.0 million in cash. Kirkland Lake has a three-year option to buy back 1% of the NSR for $36.0 million (less the royalty proceeds attributable to the buy-back portion of the NSR that have been paid to Franco-Nevada prior to the date of the buy back).
Acquisition of Barrick Royalty Portfolio Interests
On November 4, 2013, Franco-Nevada completed its acquisition of a portfolio of approximately 20 royalties from Barrick Gold Corporation (“Barrick”) for $20.9 million in cash. Producing royalties have been added to the Company’s portfolio from the Osborne copper/gold mine and Henty gold mine, both in Australia, as well as a 3% NSR royalty on Premier Gold Mines Ltd.’s Hardrock project, located in Ontario, which has been classified as an advanced royalty. The majority of the remaining royalties are classified as exploration covering over 2,000 square kilometres of prospective geology.
2014
Other Transactions and Developments
Acquisition of Sabodala Gold Stream
On January 15, 2014, Franco-Nevada acquired a 6% gold stream on Teranga Gold Corporation’s (“Teranga”) Sabodala gold project located in Senegal, Africa. Under the terms of the gold stream agreement, Franco-Nevada funded a $135.0 million deposit in exchange for 22,500 ounces of gold per year, payable monthly, for the first six years of the agreement, after which the Company will purchase 6% of the gold produced from Sabodala. Franco-Nevada will pay 20% of the market price of gold for each ounce delivered under the agreement.
Acquisition of Cerro Moro Royalty Interest
On January 31, 2014, Franco-Nevada entered into an agreement with AngloGold Ashanti Limited (“AngloGold Ashanti”) to acquire an existing 2% NSR royalty on Yamana Gold Inc.’s (“Yamana”) Cerro Moro project in Argentina for the Argentine peso equivalent of $23.5 million (at the official Argentine peso exchange rate) in cash. Cerro Moro is an advanced high grade gold-silver exploration deposit which is Yamana’s priority development asset. The transaction is expected to close during the first half of 2014.
Acquisition of Fire Creek/Midas Portfolio Interests
On February 11, 2014, Franco-Nevada entered into a gold purchase agreement with Klondex Mines Ltd. (“Klondex”) and acquired a 2.5% NSR royalty on Klondex’s Fire Creek and Midas properties, both of which are located in Nevada, U.S., for a total consideration of $35.0 million in cash. Under the terms of the gold purchase agreement, Klondex will deliver 38,250 ounces of gold, payable monthly, by December 31, 2018 following which the NSR royalty will become payable on gold produced from the Fire Creek and Midas properties.
New Prosperity Permitting
On February 27, 2014 the Government of Canada announced that it will not issue the federal authorizations necessary for Taseko Mines Limited’s (“Taseko”) New Prosperity project to proceed. Franco-Nevada has committed to provide a $350 million deposit and certain warrant consideration for the construction of New Prosperity when the project is fully permitted and financed. Franco-Nevada’s financing commitment remains available to Taseko but can be terminated at the option of Franco-Nevada.
2014 Guidance
The following contains forward looking statements about Franco-Nevada’s guidance for 2014. Reference should be made to the “Forward Looking Statements” section at the beginning of this AIF. For a description of material factors that could cause our actual results to differ materially from the forward looking statements in the following, please see the “Forward Looking Statements” and the “Risk Factors” sections of this AIF.
In 2013, Franco-Nevada realized 241,402 Gold Equivalent Ounces (“GEOs”) from its mineral assets and $67.0 million in revenue from its oil & gas assets. This compares to Franco-Nevada’s original 2013 guidance made in March 2013 of 215,000 to 235,000 GEOs and $55-$65 million for oil & gas revenue. GEO production benefited from the strength of the rest-of-world gold and the PGM assets more than offsetting weakness from
the U.S. and Canada gold assets especially the net profit royalties. Oil & gas revenues benefited from stronger than expected prices and a narrowing in differentials.
For 2014, Franco-Nevada is expecting to receive between 245,000 to 265,000 GEOs from its mineral assets and $60.0 to $70.0 million in revenue from its oil & gas assets. Of the 245,000 to 265,000 GEOs, Franco-Nevada expects to receive 130,000 to 140,000 GEOs under its various stream agreements compared with 123,387 ounces in 2013.
GEOs include our gold, platinum, palladium and other mineral assets. GEOs are estimated on a gross basis for NSR royalties and, in the case of stream ounces, before the payment of the per ounce contractual price paid by the Company. For NPI royalties, GEOs are calculated taking into account the NPI economics. Platinum, palladium and other minerals were converted to GEOs by dividing associated revenue by the average gold price for the period. For the 2014 guidance, platinum and palladium metals have been converted to GEOs using assumed commodity prices of $1,300/oz Au, $1,400/oz Pt and $725/oz Pd. The WTI oil price is assumed to average $95 per barrel with higher discounts for Canadian oil than experienced in 2013. 2014 guidance assumes the continued steady state of operations from our assets and is also based on the assumptions set out below.
In addition, we expect to fund approximately $200.0 million in 2014 in connection with our precious metals stream agreement on Cobre Panama.
More specifically, we expect the following with respect to key producing assets for 2014:
· Gold — U.S.: Overall GEOs from U.S. gold assets are expected to be higher in 2014. Goldstrike royalty ounces for 2014 are expected to be slightly higher than 2013 due to higher production on grounds covered by our NSR and net profit interests (“NPI”) claims. At Gold Quarry, we expect 11,250 royalty ounces in 2014 as payments will be based on the minimum royalty provision. In addition, GEOs are expected from the Fire Creek/Midas transaction which will start delivering ounces in mid-2014. Hollister is expected to remain on care and maintenance throughout 2014.
· Gold — Canada: GEOs earned from Canadian assets in 2014 are expected to be in-line with 2013 levels with projected increases from Detour Lake, as it reaches production capacity, and a full year of production from the new Kirkland Lake royalty. These increases are expected to be partially offset by lower production from the Sudbury and Golden Highway assets and NPI royalties.
· Gold — Australia: We expect Australian GEOs to be slightly higher in 2014 than 2013. Duketon gold production is expected to increase as the operator, Regis Resources Ltd. (“Regis”), has reported that Rosemont, the third operation on the Duketon property, has completed construction and commissioning commenced in October 2013. In addition, Regis reported that construction on the plant expansion started in the fourth quarter of 2013 which is expected to increase long-term gold production from both Garden Well and Rosemont.
· Gold — Rest of World: 2014 Rest of World gold assets are expected to generate higher GEOs in 2014 than 2013. Our 50% gold stream over Palmarejo includes an annual minimum provision of 50,000 ounces, payable monthly. At Mine Waste Solutions (“MWS”), we expect to earn higher stream ounces. We expect to receive 22,500 ounces under the newly acquired Sabodala gold stream. At Tasiast, where we hold a 2% NSR, we anticipate 2014 to be consistent with what was earned in 2013. At Subika, royalty ounces are expected to be lower than in 2013 as mining moves off of ground covered by our royalty. At Edikan, where we have an effective 1.5% NSR, we expect slightly higher production in 2014.
· PGM: Sudbury stream ounces for 2014 are expected to be lower as mining at Podolsky ceased in 2013. At Stillwater, 2014 royalty ounces are expected to be consistent with 2013 levels.
· Other minerals: Overall, GEOs from other minerals are expected to be higher in 2014 than 2013 with Peculiar Knob, an iron-ore project in South Australia, and Osborne, a recent addition to the portfolio, being significant contributors.
· Oil & Gas: For 2014, oil & gas revenues are expected to be $60.0 million to $70.0 million with slightly lower volumes and price discounts offset by reduced capital spending.
EXPLANATION OF ROYALTIES, STREAMS AND OTHER INTERESTS
A royalty is a payment to a royalty holder by a property owner or an operator of a property and is typically based on a percentage of the minerals or other products produced or the revenues or profits generated from the property. The granting of a royalty to a person usually arises as a result of: (i) paying part of the consideration payable to land owners, prospectors or junior mining companies for the purchase of their property interests; (ii) providing capital in exchange for granting a royalty; or (iii) converting a participating interest in a joint venture relationship into a royalty.
Royalties are not typically working interests in a property. Therefore, depending on the nature of the royalty interest and the laws applicable to the royalty and project, the royalty holder is generally not responsible for, and has no obligation to contribute, additional funds for any purpose, including, but not limited to, operating or capital costs, or environmental or reclamation liabilities. Typically, royalty interests are established through a contract between the royalty holder and the property owner, although many jurisdictions permit the holder to also register or otherwise record evidence of a royalty interest in applicable mineral title or land registries. The unique characteristics of royalties may provide royalty holders with special commercial benefits not available to the property owner because the royalty holder may enjoy the upside potential of the property with reduced risk.
Revenue-based Royalties: The majority of revenues that Franco-Nevada receives are royalties based on revenues from the value of production. The key types of revenue-based royalties are described in general terms below:
Net Smelter Return (“NSR”) royalties are based on the value of production or net proceeds received by the operator from a smelter or refinery. These proceeds are usually subject to deductions or charges for transportation, insurance, smelting and refining costs as set out in the royalty agreement. For gold royalties, the deductions are generally minimal, while for base metal projects the deductions can be much more substantial. This type of royalty generally provides cash flow that is free of any operating or capital costs and environmental liabilities. A smaller percentage NSR in a project can effectively equate to the economic value of a larger percentage profit or working interest in the same project.
Gross Royalties (“GR”) or Gross Overriding Royalties (“GOR”) are based on the total revenue stream from the sale of production from the property with few, if any, deductions. Some contracts refer to gross proceeds (“GP”) which have been characterized as comparable to GRs in this document.
Overriding Royalties (“ORR”) and Lessor or Freehold Royalties (“FH”) are based on the proceeds from gross production and are usually free of any operating, capital and environmental costs. These terms are usually applied in the oil & gas industry.
Profit-based Royalties: Franco-Nevada also receives a portion of its revenues from royalties that are calculated based on profits, as described below:
Net Profit Interest (“NPI”) is based on the profit realized after deducting costs related to production as set out in the royalty agreement. NPI payments generally begin after payback of capital costs. Although the royalty holder is generally not responsible for providing capital, covering operating losses or environmental liabilities, increases in production costs will affect net profits and royalties payable.
Net Royalty Interest (“NRI”) is paid net of operating and capital costs similar to an NPI.
Fixed Royalties: Franco-Nevada has a small number of fixed royalties. These are royalties that are paid based on a set rate per tonne mined, produced or processed or even a minimum for a period of time rather than as a percentage of revenue or profits. These types of royalties are more common for iron ore, coal and industrial minerals and usually do not have exposure to changes in the underlying commodity price.
The royalty types listed above can include additional provisions that allow them to change character in different circumstances or have varying rates. Some examples are as follows:
Minimum Royalty (“MR”) is a provision included in some royalties that requires fixed payments at a certain level even if the project is not producing, or the project is producing at too low a rate to achieve the minimum.
Advance Minimum Royalty (“AMR”) is similar to an MR except that, once production begins, the minimum payments already paid are often credited against subsequent royalty payments from production that exceeds the minimum.
Sliding Scale Royalty (“Sliding Scale” or “ss”) refers to royalties where the royalty percentage is variable. Generally this royalty percentage is indexed to metal prices or a production threshold. Generally, a minimum or maximum percentage would be applied to such a royalty.
Capped Royalty (“Capped”) refers to royalties that expire or cease payment after a particular cumulative royalty amount has been paid or a set production volume threshold or time period has been reached.
Royalties can be commodity specific and, for instance, apply only to gold or hydrocarbons or have varying royalty structures for different commodities from the same property. Royalties can be restricted or varied by metallurgy, ore type or even by stratigraphic horizon. Generally, the contract terms for royalties in the oil & gas business are more standardized than those found in the mineral business.
Streams: Streams are distinct from royalties. They are metal purchase agreements where, in exchange for an upfront deposit and ongoing payments for metal delivered, the holder purchases all or a portion of one or more metals produced from a mine, at a preset price. In the case of gold, the agreements typically provide for the purchase price to be the spot price at the time of delivery with a fixed price per ounce (typically $400 for gold with a small inflationary adjustment) payable in cash and the balance paid by applying the upfront deposit. Once the upfront deposit is fully applied, the purchase price is typically the lesser of the fixed price per ounce payable in cash (with a small inflationary adjustment) and the spot price at the time of delivery. Gold streams are well suited to co-product production providing incentive to the operator to produce the gold. Because streams can also be used as a form of financing a gold project, the stream structure may also help maintain the borrowing capacity for the project. Streams can provide higher leverage to commodity price changes as a result of the fixed purchase price per ounce.
Working Interests (“WI”): A working interest is significantly different than a royalty or stream in that a holder of a WI owns an undivided possessory interest in the land or leasehold itself, and is liable for its share of capital, operating and environmental costs, usually in proportion to its ownership percentage, and it receives its pro-rata share of revenue. Minority working or equity interests are not considered to be royalties because of the ongoing funding commitments, although they can be similar in their calculations to NPIs.
Example of a Royalty (NSR or NPI) versus a Stream
Assume for one ounce of gold, a sales price of $1,300, a “stream cost” of $400 per ounce and an “all-in sustaining cost”(1) of $873 per ounce. Also assume that Franco-Nevada has a 4% NSR, a 4% NPI or WI or a 4% stream.
|
| NSR |
| Stream |
| Developed |
| |||
One ounce sold at |
| $ | 1,300 |
| $ | 1,300 |
| $ | 1,300 |
|
Applicable cost |
| — |
| $ | 400 |
| $ | 873 | (1) | |
Margin for calculation |
| $ | 1,300 |
| $ | 900 |
| $ | 427 |
|
|
|
|
|
|
|
|
| |||
NSR, Stream or NPI % |
| 4 | % | 4 | % | 4 | % | |||
Revenue per ounce to FNV |
| $ | 52 |
| $ | 36 |
| $ | 17 |
|
(1) For applicable costs for a developed NPI or WI, Franco-Nevada is, for illustrative purposes, assuming Barrick’s 2013 all-in sustaining cash cost measure, as Barrick represents the largest gold company by production and reserves, as well as being the operator at five of Franco-Nevada’s assets. Excluded from the all-in sustaining measure are general and administrative costs as Franco-Nevada also has such costs which have not been reflected in the applicable cost for NSRs or streams.
Based on the above economics, a comparable percentage NSR is more than three times more valuable than an equivalent Developed NPI or WI and 44% more valuable than a stream interest. With changes to the gold price, the NPI or WI would demonstrate the most leverage while the NSR would provide the most down side protection. The stream provides commodity price leverage similar to a low cost operating company with more certainty as to future costs.
TECHNICAL AND THIRD PARTY INFORMATION
Except where otherwise stated, the disclosure in this AIF relating to properties and operations on the properties in which Franco-Nevada holds royalty or stream interests is based on information publicly disclosed by the owners or operators of these properties and information/data available in the public domain as at March 10, 2014 (except where stated otherwise), and none of this information has been independently verified by Franco-Nevada. Specifically, as a royalty or stream holder, Franco-Nevada has limited, if any, access to properties included in its asset portfolio. Additionally, Franco-Nevada may from time to time receive operating information from the owners and operators of the properties, which it is not permitted to disclose to the public. Franco-Nevada is dependent on the operators of the properties and their qualified persons to provide information to Franco-Nevada (such as the Palmarejo Report (as defined below)) or on publicly available information to prepare required disclosure pertaining to properties and operations on the properties on which Franco-Nevada holds royalty or stream interests and generally has limited or no ability to independently verify such information. Although Franco-Nevada does not have any knowledge that such information may not be accurate, there can be no assurance that such third party information is complete or accurate. Some information publicly reported by operators may relate to a larger property than the area covered by Franco-Nevada’s royalty or stream interest. Franco-Nevada’s royalty or stream interests often cover less than 100% and sometimes only a portion of the publicly reported mineral reserves, mineral resources and production of the property.
Except where otherwise noted, the disclosure in this AIF relating to mineral reserve and mineral resource statements for individual properties is made as at December 31, 2013. In addition, numerical information presented in this AIF which has been derived from information publicly disclosed by owners or operators may have been rounded by Franco-Nevada and, therefore, there may be some inconsistencies within this AIF with respect to significant digits presented.
The disclosure in this AIF of a scientific or technical nature for the Palmarejo project is based on a technical report dated January 1, 2013 prepared for Coeur d’Alene Mines Corporation (now known as Coeur Mining, Inc. (“Coeur”)) and Franco-Nevada in accordance with NI 43-101 (as was in force at such time), except for information dated subsequent to the Palmarejo Report which is based on Coeur’s public disclosure. The technical report for the Palmarejo project (the “Palmarejo Report”) is entitled “Palmarejo Project SW Chihuahua State, Mexico YE 2012 — Technical Report” and was prepared by or under the supervision of Donald J. Birak, Senior Vice President — Exploration, Coeur at the time of the Palmarejo Report, Keith Blair, Manager, Applied Geoscience LLC at the time of the Palmarejo Report, and Klaus Triebel, Senior Corporate Resource Geologist, Coeur at the time of the Palmarejo Report, each of whom is a “qualified person” for the purposes of NI 43-101 and who also reviewed the disclosure of scientific and technical information in this AIF regarding the Palmarejo project. The Palmarejo Report has been filed on SEDAR under Franco-Nevada’s profile at www.sedar.com and is available on the SEC’s website at www.sec.gov.
The disclosure in this AIF for the reserve assessment and evaluation of the oil & gas reserves including the Weyburn Unit, Midale Unit and Edson Property (each as defined below), was prepared by GLJ Petroleum Consultants Ltd. (“GLJ”) for Franco-Nevada and was dated February 18, 2014, with a preparation date of February 11, 2014 and an effective date of December 31, 2013, in accordance with NI 51-101.
Reconciliation to CIM Definitions
In this AIF, Franco-Nevada has disclosed a number of resource and reserve estimates covering properties related to the mineral assets that are not based on Canadian Institute of Mining, Metallurgy and Petroleum (“CIM”) definitions, but instead have been prepared in reliance upon JORC, SAMREC and SEC Industry Guide 7 (collectively, the “Acceptable Foreign Codes”). Estimates based on Acceptable Foreign Codes are recognized under NI 43-101 in certain circumstances.
In each case, the mineral resources and mineral reserves reported in this AIF are based on estimates previously disclosed by the relevant property owner or operator, without reference to the underlying data used to calculate the estimates. Accordingly, Franco-Nevada is not able to reconcile the resource and reserve estimates prepared in reliance on an Acceptable Foreign Code with that of CIM definitions. Franco-Nevada previously sought confirmation from one of its technical advisory firms, that is comprised of engineers experienced in the preparation of resource and reserve estimates using CIM and each of the Acceptable Foreign Codes, of the extent to which an estimate prepared under an Acceptable Foreign Code would differ from that prepared under CIM definitions. Franco-Nevada was advised that, while the CIM definitions are not identical to those of the Acceptable Foreign Codes, the resource and reserve definitions and categories are
substantively the same as the CIM definitions mandated in NI 43-101 and will typically result in reporting of substantially similar reserve and resource estimates. Such advisors further confirmed, without reference to the procedures in which the estimates prepared using Acceptable Foreign Codes that are reproduced in this AIF were conducted, that in the course of their preparation of a resource or reserve estimate they would effectively use the same procedures to prepare and report the resource or reserve estimate regardless of the reliance on CIM or any of the Acceptable Foreign Codes. Such advisors noted two provisos to this confirmation, being (i) SEC Industry Guide 7 prohibits the reporting of resources, and will only permit reporting of reserves, and (ii) it is now generally accepted practice that staff at the SEC expect to see metals prices based on historic three year average prices, while each of CIM and the other Acceptable Foreign Codes permits the author of a resource or reserve estimate to use his or her discretion to establish a reasonable assumed metal price in such calculations. See “Cautionary Note Regarding Mineral and Oil and Gas Reserve and Resource Reporting Estimates”.
FRANCO-NEVADA’S ASSETS
Franco-Nevada’s assets are categorized by commodity and stage of development. By commodity, assets are either “Gold”, “PGM”, “Other Minerals” or “Oil & Gas”. The categories of Gold and PGM are together referred to as “Precious Metals”. The categories other than Oil & Gas are collectively referred to as “Mineral Assets”. For presentation purposes, “Gold” encompasses some silver assets and polymetallic exploration prospects. “PGM” encompasses the platinum group metals including palladium. “Other Minerals” includes base metals, iron ore, coal, industrial and miscellaneous minerals. “Producing” assets are those that have generated revenue from steady-state operations to Franco-Nevada or are expected to in the next year. “Advanced” are assets on projects that in management’s view have a reasonable possibility of generating steady-state revenue to Franco-Nevada in the next five years or includes properties under development, permitting, feasibility or advanced exploration. “Exploration” represents assets on early stage exploration properties that are speculative and are expected to require more than five years to generate revenue, if ever, or are currently not active.
For accounting purposes, the number of assets has been counted in different manners depending on the category. Royalties on a producing or advanced property are generally counted as a single asset even if Franco-Nevada has multiple different royalties on the property, such as at the Goldstrike complex. Streams covering a group of mines in close proximity and operated by a common operator such as the Sudbury streams have also been counted as one asset. However, royalties and streams on producing properties that have significant co-products have been counted twice, such as the Robinson royalties for gold and copper or the Sudbury streams for gold and PGM. Exploration royalties are simply counted by the number of royalty contracts and no effort has been made to consolidate royalties on the same property. Franco-Nevada’s wholly-owned undeveloped oil & gas land positions and its working interests in Arctic gas resources are additional assets of the Corporation. However, for the purposes of tabulating an indicative number of assets, the undeveloped oil & gas land positions and certain working interests are not counted. More detail on Franco-Nevada’s oil & gas land positions can be found in the section entitled “Oil & Gas Assets”.
As of March 19, 2014, Franco-Nevada estimates that it holds 235 Mineral Assets and 137 Oil & Gas Assets for a total of 372 assets and another 160 undeveloped Oil & Gas agreements.
Franco-Nevada Asset Tabulation at March 19, 2014
|
| Gold |
| PGM |
| Other |
| Total |
| Oil & |
| TOTAL |
|
Producing |
| 38 |
| 3 |
| 6 |
| 47 |
| 137 |
| 184 |
|
Advanced |
| 29 |
| 0 |
| 6 |
| 35 |
| — |
| 35 |
|
Exploration |
| 130 |
| 2 |
| 21 |
| 153 |
| # | (1) | 153 |
|
TOTAL |
| 197 |
| 5 |
| 33 |
| 235 |
| 137 |
| 372 |
|
(1) 160 undeveloped Oil & Gas agreements not included in asset counts.
Asset Revenue and Descriptions
The following table sets forth Franco-Nevada’s principal assets and revenue related to each. The table and following asset descriptions should be read with the following considerations:
· For presentation purposes, the table has simplified the details of some royalties and streams and should be read in conjunction with the more detailed descriptions of the assets that follow.
· The terminology and ranges of some of our interests have also been simplified for presentation purposes.
· Except where otherwise stated, information of a technical nature in the asset descriptions, including all of the mine information, is based solely on information publicly disclosed by the owners or operators of these properties and information/data available in the public domain as of March 10, 2014. None of this information has been independently verified by Franco-Nevada or its consultants. See “Technical and Third Party Information”.
· Each asset is described in a comparable manner as reported by the property owner or operator, unless otherwise noted. As a result, units of measurement and numbers of significant digits may not be consistent between asset descriptions.
· Except where otherwise stated, reserve and resource figures are for the calendar year ends.
· Some information publicly reported by owners or operators may relate to a larger property than the area covered by Franco-Nevada’s royalty or stream interest.
· Schematic representations of the properties are meant to be indicative of Franco-Nevada’s understanding of what it is permitted to publicly disclose of the positioning of its royalty or stream interests relative to current operations and should not be treated as fully scaled or complete representations from the operators of those projects.
The subsequent tables characterize the Revenue and Adjusted EBITDA from the Company’s assets by commodity, geography and type. The Company uses Revenue and Adjusted EBITDA as core financial metrics when evaluating performance. These tables set forth how the Company performed against these measures.
|
|
|
|
|
|
|
| Revenue ($ millions) |
|
| |||||||
|
| Asset |
| Operator |
| Interest and % |
| 2013 |
| 2012 |
| 2011 |
| Notes | |||
G O L D |
|
|
|
|
|
|
|
|
|
|
|
|
|
| |||
UNITED STATES |
| Goldstrike |
| Barrick Gold Corporation |
| NSR 2-4%, NPI 2.4-6% |
| $ | 21.2 |
| $ | 55.7 |
| $ | 45.0 |
| 1, 2, P |
| Gold Quarry |
| Newmont Mining |
| NSR 7.29% |
| 20.7 |
| 18.6 |
| 17.9 |
| 1, 3, P | ||||
| Marigold |
| Silver Standard Resources |
| NSR 1.75-5%, GR 0.5-4% |
| 8.8 |
| 10.9 |
| 10.3 |
| 1, 2, 3, 5, P | ||||
| Fire Creek/Midas |
| Klondex Mines Ltd. |
| NSR 2.5%, Fixed to 2018 |
| — |
| — |
| — |
| 3, Px2 | ||||
| Bald Mountain |
| Barrick Gold Corporation |
| NSR/GR 0.875-5% |
| 3.8 |
| 8.8 |
| 3.9 |
| 1, 2, 3, 5, P | ||||
| Mesquite |
| New Gold Inc. |
| NSR 0.5-2% |
| 2.3 |
| 3.9 |
| 4.8 |
| 2, P | ||||
| Other (8 assets) |
|
|
|
|
| 2.3 |
| 3.8 |
| 5.5 |
| 8, Px3, Ax4 | ||||
CANADA |
| Sudbury |
| KGHM International Ltd. |
| Stream 50% |
| 11.6 |
| 15.4 |
| 14.3 |
| 1, 7, P | |||
| Golden Highway |
| St Andrew Goldfields Ltd. |
| NSR 2-15% |
| 12.5 |
| 14.3 |
| 10.8 |
| 3, 5, Px3 | ||||
| Detour Lake |
| Detour Gold Corporation |
| NSR 2% |
| 5.9 |
| — |
| — |
| P | ||||
| Musselwhite |
| Goldcorp Inc. |
| NPI 5% |
| 3.7 |
| 6.3 |
| 5.1 |
| 6, P | ||||
| Hemlo |
| Barrick Gold Corporation |
| NSR 3%, NPI 50% |
| 3.1 |
| 7.5 |
| 1.4 |
| 1, 6, P | ||||
| Kirkland Lake |
| Kirkland Lake Gold Inc. |
| NSR 2.5-5.5%, NPI 20% |
| 0.6 |
| 0.1 |
| 0.2 |
| 2, 3, P | ||||
| Timmins West |
| Lake Shore Gold Corp. |
| NSR 2.25% |
| 3.2 |
| 2.0 |
| — |
| P | ||||
| Other (9 assets) |
|
|
|
|
| 3.0 |
| 0.4 |
| 0.6 |
| Px2, Ax6 | ||||
AUSTRALIA |
| Duketon |
| Regis Resources Ltd. |
| NSR 2% |
| 7.9 |
| 5.3 |
| 3.1 |
| 1, P | |||
| Henty |
| Unity Mining Limited |
| GR 1%/10%, Ounce-based |
| 1.1 |
| 2.7 |
| 4.5 |
| 2, P | ||||
| Other (13 assets) |
|
|
|
|
| 0.7 |
| 3.6 |
| 1.9 |
| Px5, Ax8 | ||||
REST OF WORLD |
| Palmarejo |
| Coeur Mining, Inc. |
| Stream 50% |
| 83.5 |
| 96.0 |
| 101.9 |
| 3, 7, P | |||
| MWS |
| AngloGold Ashanti Limited |
| Stream 25% |
| 35.7 |
| 33.0 |
| 32.3 |
| 7, P | ||||
| Sabodala |
| Teranga Gold Corporation |
| Stream 6%, Fixed to 2019 |
| — |
| — |
| — |
| 3, P | ||||
| Subika |
| Newmont Mining |
| NSR 2% |
| 14.4 |
| 3.2 |
| — |
| 1, P | ||||
| Tasiast |
| Kinross Gold Corporation |
| NSR 2% |
| 6.6 |
| 6.4 |
| 2.8 |
| P | ||||
| Edikan |
| Perseus Mining Limited |
| NSR 1.5% |
| 4.1 |
| 5.1 |
| 1.5 |
| P | ||||
| Cerro San Pedro |
| New Gold Inc. |
| GR 1.95% |
| 3.3 |
| 5.5 |
| 5.9 |
| 1, P | ||||
| Cooke 4 |
| Sibanye Gold Limited |
| Stream 7% |
| 3.5 |
| 3.3 |
| 27.3 |
| 7, P | ||||
| Cobre Panama |
| First Quantum Minerals |
| Streams (indexed) |
| — |
| — |
| — |
| A | ||||
| Other (10 assets) |
|
|
|
|
| 6.4 |
| 8.8 |
| 5.8 |
| Px2; Ax8 | ||||
|
| 130 Exploration Assets |
|
|
|
|
| — |
| — |
| — |
| E | |||
|
|
|
|
|
|
|
| $ | 269.9 |
| $ | 320.6 |
| $ | 306.8 |
|
|
P G M |
|
|
|
|
|
|
|
|
|
|
|
|
|
| |||
|
| Sudbury |
| KGHM International Ltd. |
| Stream 50% |
| $ | 33.1 |
| $ | 43.1 |
| $ | 40.4 |
| 1, 7, P |
| Stillwater |
| Stillwater Mining Company |
| NSR 5% |
| 18.0 |
| 17.3 |
| 23.1 |
| 1, P | ||||
| Pandora |
| Angloplat/Lonmin Plc |
| NPI 5% |
| 0.5 |
| 0.3 |
| 0.4 |
| 1, 3, P | ||||
| 2 Exploration Assets |
|
|
|
|
| — |
| — |
| — |
| E | ||||
|
|
|
|
|
|
| $ | 51.6 |
| $ | 60.7 |
| $ | 63.9 |
|
| |
O T H E R M I N E R A L S |
|
|
|
|
|
|
|
|
|
|
|
|
|
| |||
|
| Peculiar Knob (Fe) |
| Arrium Limited |
| Production Payment |
| $ | 8.0 |
| $ | 0.6 |
| $ | — |
| P |
| Osborne (Cu,Au) |
| Shanxi Donghui |
| NSR 2% |
| 0.8 |
| — |
| — |
| 9, P | ||||
| Mt Keith (Ni) |
| BHP Billiton Limited |
| NPI 0.25%, GR 0.375% |
| 1.7 |
| 2.2 |
| 3.8 |
| P | ||||
| Rosemont (Cu,Mo,Ag) |
| Augusta Resource |
| NSR 1.5% |
| — |
| — |
| — |
| A | ||||
| Relincho (Cu,Mo) |
| Teck Resources Limited |
| NSR 1.5% |
| — |
| — |
| — |
| 4, A | ||||
| Taca Taca (Cu,Au,Mo) |
| Lumina Copper Corp. |
| NSR 1.08% |
| — |
| — |
| — |
| A | ||||
| Other (6 assets) |
|
|
|
|
| 1.9 |
| 2.0 |
| 1.8 |
| Px3, Ax3 | ||||
| 21 Exploration Assets |
|
|
|
|
| — |
| — |
| — |
| E | ||||
|
|
|
|
|
|
| $ | 12.4 |
| $ | 4.8 |
| $ | 5.6 |
|
| |
O I L & G A S |
|
|
|
|
|
|
|
|
|
|
|
|
|
| |||
|
| Weyburn Unit |
| Cenovus Energy Inc. |
| NRI 11.71%, ORR 0.44%, WI 2.26% |
| $ | 50.7 |
| $ | 25.0 |
| $ | 12.3 |
| P |
| Midale Unit |
| Apache Canada Ltd. |
| ORR 1.14%, WI 1.59% |
| 3.6 |
| 4.0 |
| 4.1 |
| P | ||||
| Edson |
| Canadian Natural Resources |
| ORR 15% |
| 4.3 |
| 3.9 |
| 7.7 |
| P | ||||
| Other (134 assets) |
|
|
|
|
| 8.4 |
| 8.0 |
| 10.8 |
| Px134 | ||||
| 160 Agreements |
|
|
|
|
| — |
| — |
| — |
| E | ||||
|
|
|
|
|
|
| $ | 67.0 |
| $ | 40.9 |
| $ | 34.9 |
|
| |
R E V E N U E |
|
|
|
|
|
|
| $ | 400.9 |
| $ | 427.0 |
| $ | 411.2 |
|
|
“NSR” | Net Smelter Return Royalty |
“GR” | Gross Royalty |
“ORR” | Overriding Royalty |
“FH” | Freehold or Lessor Royalty |
“NPI” | Net Profits Interest |
“NRI” | Net Royalty Interest |
“WI” | Working Interest |
“P” | “Producing” assets are those that have generated revenue from steady-state operations to Franco-Nevada or are expected to in the next year. |
“A” | “Advanced” are assets on projects that in management’s view have a reasonable possibility of generating steady-state revenue to Franco-Nevada in the next five years or includes properties under development, permitting, feasibility or advanced exploration. |
“E” | “Exploration” represents assets on early stage exploration properties that are speculative and are expected to require more than five years to generate revenue, if ever, or are currently not active. |
1 Does not cover all the reserves or resources reported for the property by the operator.
2 Percentage varies depending on the claim block of the property.
3 �� Provides for minimum or advance payments.
4 Payments pending achievement of a minimum production hurdle or time threshold.
5 Percentage varies depending on the commodity price or value of ore.
6 Payable after operator recovers defined exploration and development expenses.
7 These revenue numbers are before the deduction of the purchase cost per ounce.
8 Includes dividends in the amounts of $0.1, $0.1, and $0.1 for 2013, 2012 and 2011.
9 Capped at a payout level.
REVENUE(1)
|
| 2013 |
| 2012 |
| 2011 |
| |||||||||
|
| $ millions |
| % |
| $ millions |
| % |
| $ millions |
| % |
| |||
Commodity |
|
|
|
|
|
|
|
|
|
|
|
|
| |||
Gold |
| $ | 269.9 |
| 67 | % | $ | 320.6 |
| 75 | % | $ | 306.8 |
| 75 | % |
PGM |
| 51.6 |
| 13 | % | 60.7 |
| 14 | % | 63.9 |
| 16 | % | |||
Other Minerals |
| 12.4 |
| 3 | % | 4.8 |
| 1 | % | 5.6 |
| 1 | % | |||
Oil & Gas |
| 67.0 |
| 17 | % | 40.9 |
| 10 | % | 34.9 |
| 8 | % | |||
|
| $ | 400.9 |
| 100 | % | $ | 427.0 |
| 100 | % | $ | 411.2 |
| 100 | % |
|
|
|
|
|
|
|
|
|
|
|
|
|
| |||
Geography |
|
|
|
|
|
|
|
|
|
|
|
|
| |||
United States |
| $ | 77.9 |
| 19 | % | $ | 120.0 |
| 28 | % | $ | 111.6 |
| 28 | % |
Canada |
| 143.9 |
| 36 | % | 130.2 |
| 30 | % | 107.7 |
| 26 | % | |||
Mexico |
| 86.9 |
| 22 | % | 101.6 |
| 24 | % | 107.8 |
| 26 | % | |||
Australia |
| 21.1 |
| 5 | % | 15.1 |
| 4 | % | 13.9 |
| 3 | % | |||
Rest of World |
| 71.1 |
| 18 | % | 60.1 |
| 14 | % | 70.2 |
| 17 | % | |||
|
| $ | 400.9 |
| 100 | % | $ | 427.0 |
| 100 | % | $ | 411.2 |
| 100 | % |
|
|
|
|
|
|
|
|
|
|
|
|
|
| |||
Type |
|
|
|
|
|
|
|
|
|
|
|
|
| |||
Revenue-based royalties |
| $ | 169.0 |
| 42 | % | $ | 179.0 |
| 42 | % | $ | 152.3 |
| 37 | % |
Stream-based |
| 167.3 |
| 42 | % | 190.9 |
| 45 | % | 216.1 |
| 53 | % | |||
Profit-based royalties |
| 42.7 |
| 11 | % | 41.8 |
| 10 | % | 30.8 |
| 7 | % | |||
Working interests and other |
| 21.9 |
| 5 | % | 15.3 |
| 3 | % | 12.0 |
| 3 | % | |||
|
| $ | 400.9 |
| 100 | % | $ | 427.0 |
| 100 | % | $ | 411.2 |
| 100 | % |
ADJUSTED EBITDA(1)(2)
|
| 2013 |
| 2012 |
| 2011 |
| |||||||||
|
| $ millions |
| % |
| $ millions |
| % |
| $ millions |
| % |
| |||
Commodity |
|
|
|
|
|
|
|
|
|
|
|
|
| |||
Gold |
| $ | 216.2 |
| 67 | % | $ | 265.3 |
| 76 | % | $ | 243.0 |
| 74 | % |
PGM |
| 38.1 |
| 12 | % | 46.6 |
| 14 | % | 50.1 |
| 15 | % | |||
Other Minerals |
| 11.7 |
| 4 | % | 4.5 |
| 1 | % | 5.3 |
| 2 | % | |||
Oil & Gas |
| 56.5 |
| 17 | % | 31.4 |
| 9 | % | 28.9 |
| 9 | % | |||
|
| $ | 322.5 |
| 100 | % | $ | 347.8 |
| 100 | % | $ | 327.3 |
| 100 | % |
|
|
|
|
|
|
|
|
|
|
|
|
|
| |||
Geography |
|
|
|
|
|
|
|
|
|
|
|
|
| |||
United States |
| $ | 71.6 |
| 22 | % | $ | 108.1 |
| 31 | % | $ | 100.4 |
| 31 | % |
Canada |
| 115.5 |
| 36 | % | 102.6 |
| 30 | % | 85.4 |
| 26 | % | |||
Mexico |
| 58.9 |
| 18 | % | 74.1 |
| 21 | % | 76.4 |
| 23 | % | |||
Australia |
| 20.0 |
| 6 | % | 14.3 |
| 4 | % | 13.2 |
| 4 | % | |||
Rest of World |
| 56.5 |
| 18 | % | 48.7 |
| 14 | % | 51.9 |
| 16 | % | |||
|
| $ | 322.5 |
| 100 | % | $ | 347.8 |
| 100 | % | $ | 327.3 |
| 100 | % |
|
|
|
|
|
|
|
|
|
|
|
|
|
| |||
Type |
|
|
|
|
|
|
|
|
|
|
|
|
| |||
Revenue-based royalties |
| $ | 150.4 |
| 47 | % | $ | 160.9 |
| 46 | % | $ | 137.5 |
| 42 | % |
Stream-based |
| 109.7 |
| 34 | % | 137.2 |
| 39 | % | 151.9 |
| 46 | % | |||
Profit-based royalties |
| 36.7 |
| 11 | % | 37.8 |
| 11 | % | 27.9 |
| 9 | % | |||
Working interests and other |
| 25.7 |
| 8 | % | 11.9 |
| 4 | % | 10.0 |
| 3 | % | |||
|
| $ | 322.5 |
| 100 | % | $ | 347.8 |
| 100 | % | $ | 327.3 |
| 100 | % |
(1) Dividends have been included in “Gold”, “United States” and “Working interests and other” categories.
(2) As defined on page 4 of this AIF. Adjusted EBITDA is a non-IFRS financial measure, which excludes the following from net income: income tax expense/recovery; finance income and costs; foreign exchange gains/losses; gains/losses on the sale of investments; income/losses from equity investees; impairment charges related to royalty, stream and working interests and investments; and depletion and depreciation. Management believes that Adjusted EBITDA is a valuable indicator of the Company’s ability to generate liquidity from operating cash flow to (i) fund working capital needs; (ii) service working interest capital requirements; (iii) fund acquisitions and commitments; and (iv) fund dividend payments. Management uses Adjusted EBITDA for this purpose and other internal purposes. Management’s internal budgets and forecasts do not reflect potential impairment charges, fair value changes or foreign currency translation gains or losses. Consequently, the presentation of this non-IFRS financial measure enables investors and analysts to better understand the underlying operating performance of our business through the eyes of management. Adjusted EBITDA may be used by investors and analysts for valuation purposes whereby Adjusted EBITDA is multiplied by a factor of an “EBITDA multiple” that is based on observed or an inferred relationship between Adjusted EBITDA and market valuations to determine the approximate total enterprise value of a company. Management periodically evaluates the components of this non-IFRS financial measure based on an internal assessment of performance metrics that it believes is useful for evaluating the operating performance of our business and a review of the non-IFRS measures used by analysts and other royalty/stream companies. Adjusted EBITDA is intended to provide additional information to investors and analysts, does not have any standardized meaning under IFRS and should not be considered in isolation or as a substitute for measures of performance prepared in accordance with IFRS. Adjusted EBITDA excludes the impact of cash costs of financing activities and taxes, and the effects of changes in operating working capital balances, and therefore is not necessarily indicative of operating profit or cash flow from operations as determined under IFRS. Other companies may calculate Adjusted EBITDA differently. See “Non-IFRS Financial Measures - Reconciliation” in our Annual MD&A for additional information.
The following table outlines GEOs attributable to Franco-Nevada for the twelve months ended December 31, 2013 and 2012 by commodity (excluding oil & gas), geographical location and type of interest. GEOs include our gold, platinum, palladium and other mineral assets. GEOs are estimated on a gross basis for NSR royalties and, in the case of stream ounces, before the payment of the per ounce contractual price paid by the Company. For NPI royalties, GEOs are calculated taking into account the NPI economics. Platinum, palladium and other minerals were converted to GEOs by dividing associated revenue by the average gold price for the period.
GOLD EQUIVALENT OUNCES(1)(2)(3)(4)(5)
|
| For the twelve months ended December 31, |
| ||||||
|
| 2013 |
| 2012 |
| ||||
|
| # |
| % |
| # |
| % |
|
Commodity |
|
|
|
|
|
|
|
|
|
Gold |
| 192,297 |
| 80 | % | 191,610 |
| 83 | % |
PGM |
| 40,007 |
| 16 | % | 35,826 |
| 16 | % |
Other Minerals |
| 9,098 |
| 4 | % | 2,816 |
| 1 | % |
|
| 241,402 |
| 100 | % | 230,252 |
| 100 | % |
Geography |
|
|
|
|
|
|
|
|
|
United States |
| 54,436 |
| 23 | % | 71,719 |
| 31 | % |
Canada |
| 58,955 |
| 24 | % | 52,697 |
| 23 | % |
Mexico |
| 62,232 |
| 26 | % | 60,912 |
| 26 | % |
Australia |
| 15,205 |
| 6 | % | 8,894 |
| 4 | % |
Rest of World |
| 50,574 |
| 21 | % | 36,030 |
| 16 | % |
|
| 241,402 |
| 100 | % | 230,252 |
| 100 | % |
Type |
|
|
|
|
|
|
|
|
|
Revenue-based |
| 102,558 |
| 43 | % | 89,845 |
| 39 | % |
Streams |
| 123,387 |
| 51 | % | 113,837 |
| 49 | % |
Profit-based |
| 8,060 |
| 3 | % | 25,042 |
| 11 | % |
Other |
| 7,397 |
| 3 | % | 1,528 |
| 1 | % |
|
| 241,402 |
| 100 | % | 230,252 |
| 100 | % |
(1) For 2013, platinum and palladium metals have been converted to GEOs using average commodity prices of $1,411/oz gold (2012 - $1,669/oz), $1,487/oz platinum (2012 - $1,552/oz) and $725/oz palladium (2012 - $645/oz).
(2) The calculation of GEOs earned from the Sudbury assets was amended which resulted in a change to the GEOs previously calculated. The effect of the amendment was an increase of approximately 3,800 GEOs in 2013 and decrease of 600 GEOs in 2012.
(3) The cost of sales associated with stream sales were $50.1 million and $45.8 million for 2013 and 2012 respectively.
(4) The Corporation began providing GEO guidance in 2013 and prepared comparative information for 2012. Comparative information for 2011 has not been prepared.
(5) Average gold price realized on Franco-Nevada’s stream ounces approximates average gold price for the period (2013 - $1,411/oz and 2012 - $1,669/oz).
Oil & gas revenues are not included in the reported GEO numbers above.
Summary of Mineral Reserves and Mineral Resources
The mineral reserves and mineral resources tabulated in this AIF reflect the most recent publicly disclosed figures by the operators of the assets (converted to a 100% basis where appropriate) in which Franco-Nevada has interests. However, Franco-Nevada’s interests often do not cover the entire mineral reserve and mineral resource that is publicly reported by the operator.
|
|
|
|
|
| Percentage |
| ||||||||||||||||
|
|
|
| Mineral Reserves |
| Covered by |
| ||||||||||||||||
|
|
|
| Proven |
| Probable |
| Proven & Probable |
| royalty or |
| ||||||||||||
|
|
|
| Tonnes |
| Grade |
| Contained |
| Tonnes |
| Grade |
| Contained |
| Tonnes |
| Grade |
| Contained |
| stream |
|
|
| Notes |
| 000s |
| g/t |
| 000 oz |
| 000s |
| g/t |
| 000 oz |
| 000s |
| g/t |
| 000 oz |
| interest(236) |
|
GOLD — UNITED STATES |
|
|
|
|
|
|
|
|
|
|
|
|
|
|
|
|
|
|
|
|
|
|
|
Goldstrike |
| 1,2,3,4 |
| 59,824 |
| 3.52 |
| 6,762 |
| 26,112 |
| 4.70 |
| 3,945 |
| 85,936 |
| 3.88 |
| 10,707 |
| 74 | % |
Gold Quarry |
| 1,5 |
|
|
| not available |
|
|
|
|
| not available |
|
|
|
|
| not available |
|
|
| — |
|
Marigold |
| 1,6,7 |
| 32,681 |
| 0.65 |
| 684 |
| 207,369 |
| 0.52 |
| 3,483 |
| 240,050 |
| 0.54 |
| 4,167 |
| 100 | % |
Midas/Fire Creek |
| 3,8 |
| 45 |
| 6.86 |
| 10 |
| 181 |
| 3.43 |
| 20 |
| 227 |
| 4.11 |
| 30 |
| 100 | % |
Bald Mountain |
| 1,3,9 |
| 37,613 |
| 0.71 |
| 857 |
| 84,902 |
| 0.59 |
| 1,603 |
| 122,516 |
| 0.62 |
| 2,460 |
| 74 | % |
Mesquite |
| 10,11 |
| 3,809 |
| 0.70 |
| 86 |
| 112,094 |
| 0.60 |
| 2,152 |
| 115,903 |
| 0.60 |
| 2,238 |
| 100 | % |
Hollister |
| 12,13 |
| 101 |
| 20.62 |
| 67 |
| 161 |
| 19.97 |
| 104 |
| 262 |
| 20.29 |
| 171 |
| 100 | % |
Robinson |
| 14,15 |
| 105,490 |
| 0.18 |
| 620 |
| 4,530 |
| 0.15 |
| 20 |
| 110,020 |
| 0.18 |
| 640 |
| 100 | % |
Golden Meadows |
|
|
| — |
| — |
| — |
| — |
| — |
| — |
| — |
| — |
| — |
| — |
|
Castle Mountain |
|
|
| — |
| — |
| — |
| — |
| — |
| — |
| — |
| — |
| — |
| — |
|
Pinson |
| 1,16,17 |
| 917 |
| 12.56 |
| 370 |
| 668 |
| 12.79 |
| 275 |
| 1,584 |
| 12.65 |
| 645 |
| 1 | % |
Sandman |
| 1,3 |
| — |
| — |
| — |
| — |
| — |
| — |
| — |
| — |
| — |
| — |
|
Dee (South Arturo) |
| 1,3,18,19 |
| 11 |
| 4.90 |
| 2 |
| 31,023 |
| 1.68 |
| 1,677 |
| 31,033 |
| 1.68 |
| 1,678 |
| 90 | % |
|
|
|
|
|
|
|
|
|
|
|
|
|
|
|
|
|
|
|
|
|
|
|
|
GOLD — CANADA |
|
|
|
|
|
|
|
|
|
|
|
|
|
|
|
|
|
|
|
|
|
|
|
Sudbury |
| 1,20,21,22 |
| — |
| — |
| — |
| 1,670 |
| 0.74 |
| 40 |
| 1,670 |
| 0.74 |
| 40 |
| 100 | % |
Hislop |
| 23 |
| 7 |
| 1.07 |
| 0 |
| 381 |
| 4.36 |
| 53 |
| 388 |
| 4.30 |
| 54 |
| 100 | % |
Holloway |
| 24 |
| 37 |
| 4.47 |
| 5 |
| 22 |
| 4.53 |
| 3 |
| 60 |
| 4.49 |
| 9 |
| 100 | % |
Holt |
| 25 |
| 1,479 |
| 4.17 |
| 198 |
| 1,623 |
| 5.26 |
| 275 |
| 3,101 |
| 4.74 |
| 473 |
| 100 | % |
Taylor, Aquarius, Clavos |
| 26 |
| — |
| — |
| — |
| 736 |
| 5.63 |
| 133 |
| 736 |
| 5.63 |
| 133 |
| 100 | % |
Detour Lake |
| 27 |
| 96,800 |
| 1.27 |
| 3,964 |
| 379,700 |
| 0.95 |
| 11,585 |
| 476,500 |
| 1.02 |
| 15,549 |
| 100 | % |
Musselwhite |
| 28 |
| 3,630 |
| 7.08 |
| 830 |
| 5,360 |
| 5.97 |
| 1,030 |
| 8,990 |
| 6.42 |
| 1,850 |
| 100 | % |
Hemlo |
| 1,3,29 |
| 1,542 |
| 2.68 |
| 133 |
| 11,260 |
| 2.45 |
| 886 |
| 12,802 |
| 2.48 |
| 1,019 |
| 15 | % |
Kirkland Lake |
| 30,31 |
| 1,235 |
| 13.35 |
| 530 |
| 1,696 |
| 16.95 |
| 924 |
| 2,931 |
| 15.43 |
| 1,454 |
| 100 | % |
Timmins West |
| 32,33 |
| — |
| — |
| — |
| 4,922 |
| 5.21 |
| 824 |
| 4,922 |
| 5.21 |
| 824 |
| 100 | % |
Canadian Malartic |
| 1,34,35 |
| 48,800 |
| 0.89 |
| 1,400 |
| 261,800 |
| 1.04 |
| 8,720 |
| 310,600 |
| 1.01 |
| 10,120 |
| 10 | % |
Mouska |
| 36 |
| 20 |
| 15.60 |
| 10 |
| — |
| — |
| — |
| 20 |
| 15.60 |
| 10 |
| 100 | % |
Brucejack |
| 37,38 |
| 2,000 |
| 6.22 |
| 400 |
| 16,900 |
| 12.70 |
| 6,900 |
| 18,900 |
| 12.01 |
| 7,300 |
| 100 | % |
Courageous Lake |
| 39,40 |
| 12,000 |
| 2.41 |
| 1,000 |
| 79,000 |
| 2.17 |
| 5,500 |
| 91,000 |
| 2.20 |
| 6,500 |
| 100 | % |
Goldfields (Box/Athona) |
| 41,42 |
| 1,228 |
| 1.90 |
| 75 |
| 21,105 |
| 1.39 |
| 945 |
| 22,333 |
| 1.42 |
| 1,020 |
| 100 | % |
Hardrock/Geraldton |
|
|
| — |
| — |
| — |
| — |
| — |
| — |
| — |
| — |
| — |
| — |
|
Phoenix |
|
|
| — |
| — |
| — |
| — |
| — |
| — |
| — |
| — |
| — |
| — |
|
Monument Bay |
|
|
| — |
| — |
| — |
| — |
| — |
| — |
| — |
| — |
| — |
| — |
|
|
|
|
|
|
|
|
|
|
|
|
|
|
|
|
|
|
|
|
|
|
|
|
|
GOLD - AUSTRALIA |
|
|
|
|
|
|
|
|
|
|
|
|
|
|
|
|
|
|
|
|
|
|
|
Duketon |
| 1,43,44 |
| 8,300 |
| 1.50 |
| 400 |
| 59,100 |
| 1.39 |
| 2,643 |
| 67,400 |
| 1.40 |
| 3,043 |
| 99 | % |
Henty |
| 45,46 |
| 607 |
| 4.70 |
| 93 |
| 85 |
| 10.20 |
| 28 |
| 692 |
| 5.40 |
| 121 |
| 100 | % |
Admiral Hill |
|
|
| — |
| — |
| 0 |
| — |
| — |
| — |
| — |
| — |
| — |
| — |
|
Bronzewing |
| 47,48 |
| — |
| — |
| 0 |
| 6,924 |
| 1.49 |
| 331 |
| 6,924 |
| 1.49 |
| 331 |
| 100 | % |
South Kalgoorlie |
| 1,49,50,51 |
| 1,000 |
| 0.93 |
| 30 |
| 12,400 |
| 1.48 |
| 590 |
| 13,400 |
| 1.44 |
| 620 |
| 73 | % |
White Dam |
|
|
| — |
| — |
| 0 |
| — |
| — |
| — |
| — |
| — |
| — |
| — |
|
Aphrodite |
|
|
| — |
| — |
| 0 |
| — |
| — |
| — |
| — |
| — |
| — |
| — |
|
Bullabulling |
|
|
| — |
| — |
| 0 |
| — |
| — |
| — |
| — |
| — |
| — |
| — |
|
Edna May |
| 1,52,53 |
| 13,400 |
| 0.93 |
| 402 |
| 9,140 |
| 1.04 |
| 306 |
| 22,540 |
| 0.98 |
| 708 |
| 2 | % |
Glenburgh |
|
|
| — |
| — |
| 0 |
| — |
| — |
| — |
| — |
| — |
| — |
| — |
|
Moyagee |
| 54,55 |
| — |
| — |
| 0 |
| 343 |
| 2.24 |
| 25 |
| 343 |
| 2.24 |
| 25 |
| 100 | % |
Red October |
| 1,56,57 |
| — |
| — |
| 0 |
| 287 |
| 5.64 |
| 52 |
| 287 |
| 5.64 |
| 52 |
| 100 | % |
Wiluna |
|
|
| — |
| — |
| 0 |
| — |
| — |
| — |
| — |
| — |
| — |
| — |
|
|
|
|
|
|
|
|
|
|
|
|
|
|
|
|
|
|
|
|
|
|
|
|
|
GOLD — REST OF WORLD |
|
|
|
|
|
|
|
|
|
|
|
|
|
|
|
|
|
|
|
|
|
|
|
Palmarejo |
| 3,58 |
| 4,627 |
| 1.72 |
| 256 |
| 5,566 |
| 1.75 |
| 313 |
| 10,192 |
| 1.74 |
| 569 |
| 100 | % |
MWS |
| 59,60 |
| 141,700 |
| 0.23 |
| 1,050 |
| 158,600 |
| 0.25 |
| 1,300 |
| 300,300 |
| 0.24 |
| 2,350 |
| fixed interest |
|
Sabodala |
| 61,62 |
| 12,780 |
| 1.24 |
| 510 |
| 47,090 |
| 1.53 |
| 2,310 |
| 59,870 |
| 1.47 |
| 2,820 |
| 100 | % |
Subika |
| 1,3,63 |
| 41,095 |
| 1.30 |
| 1,720 |
| 119,476 |
| 2.19 |
| 8,400 |
| 160,571 |
| 1.96 |
| 10,120 |
| 50 | % |
Tasiast |
| 64 |
| 20,567 |
| 1.98 |
| 1,308 |
| 69,148 |
| 2.35 |
| 5,235 |
| 89,715 |
| 2.27 |
| 6,543 |
| 100 | % |
Edikan |
| 65,66 |
| 59,600 |
| 1.14 |
| 2,177 |
| 23,100 |
| 1.13 |
| 836 |
| 82,700 |
| 1.10 |
| 2,925 |
| 100 | % |
Cerro San Pedro |
| 1,67 |
| 12,982 |
| 0.47 |
| 197 |
| 13,714 |
| 0.44 |
| 195 |
| 26,696 |
| 0.46 |
| 392 |
| 100 | % |
Cooke 4 |
| 68,69 |
| 470 |
| 3.58 |
| 50 |
| 2,710 |
| 3.63 |
| 320 |
| 3,180 |
| 3.63 |
| 370 |
| 100 | % |
Cerro Moro |
| 70 |
| — |
| — |
| — |
| 1,954 |
| 11.38 |
| 715 |
| 1,954 |
| 11.38 |
| 715 |
| 100 | % |
Cobre Panama |
| 71,72 |
| 258,000 |
| 0.14 |
| 1,118 |
| 2,800,000 |
| 0.07 |
| 6,170 |
| 3,058,000 |
| 0.07 |
| 7,288 |
| 80 | % |
Ity |
| 73,74,75 |
| — |
| — |
| — |
| 1,167 |
| 4.85 |
| 182 |
| 1,167 |
| 4.85 |
| 182 |
| fixed interest |
|
North Lanut |
| 76 |
| 1,079 |
| 1.29 |
| 45 |
| 220 |
| 1.15 |
| 8 |
| 1,299 |
| 1.27 |
| 53 |
| fixed interest |
|
Agi Dagi |
|
|
| — |
| — |
| — |
| — |
| — |
| — |
| — |
| — |
| — |
| — |
|
Calcatreu |
|
|
| — |
| — |
| — |
| — |
| — |
| — |
| — |
| — |
| — |
| — |
|
Gurupi |
| 77,78 |
| — |
| — |
| — |
| 63,757 |
| 1.14 |
| 2,328 |
| 63,757 |
| 1.14 |
| 2,328 |
| 100 | % |
Kiziltepe |
| 79,80 |
| 924 |
| 3.32 |
| 99 |
| 225 |
| 2.33 |
| 17 |
| 1,149 |
| 3.13 |
| 115 |
| 100 | % |
Perama Hill |
| 81 |
| 2,477 |
| 4.44 |
| 354 |
| 7,220 |
| 2.68 |
| 621 |
| 9,697 |
| 3.13 |
| 975 |
| 100 | % |
San Jorge |
|
|
| — |
| — |
| — |
| — |
| — |
| — |
| — |
| — |
| — |
| — |
|
Sissingue |
| 82,83 |
| — |
| — |
| — |
| 9,700 |
| 2.11 |
| 657 |
| 9,700 |
| 2.11 |
| 657 |
| 100 | % |
Taca Taca |
|
|
| — |
| — |
| — |
| — |
| — |
| — |
| — |
| — |
| — |
| — |
|
Volcan |
|
|
| — |
| — |
| — |
| — |
| — |
| — |
| — |
| — |
| — |
| — |
|
|
|
|
|
|
|
|
|
|
|
|
|
|
|
|
|
|
|
|
|
|
|
|
|
TOTAL GOLD MINERAL RESERVES |
|
|
|
|
|
|
| 27,811 |
|
|
|
|
| 84,677 |
|
|
|
|
| 112,392 |
|
|
|
|
|
|
|
|
|
|
|
|
|
|
|
|
|
|
|
|
|
|
|
|
|
|
| Percentage |
|
|
|
|
| Mineral Resources - Inclusive of Reserves |
| Mineral Resources |
| Covered by |
| ||||||||||||||||
|
|
|
| Measured (M) |
| Indicated (I) |
| (M)+(I) |
| Inferred |
| royalty or |
| ||||||||||||
|
|
|
| Tonnes |
| Grade |
| Contained |
| Tonnes |
| Grade |
| Contained |
| Contained |
| Tonnage |
| Grade |
| Contained |
| stream |
|
|
| Notes |
| 000s |
| g/t |
| 000 oz |
| 000s |
| g/t |
| 000 oz |
| 000 oz |
| 000s |
| g/t |
| 000 oz |
| interest(236) |
|
GOLD — UNITED STATES |
|
|
|
|
|
|
|
|
|
|
|
|
|
|
|
|
|
|
|
|
|
|
|
|
|
Goldstrike |
| 1,2,3,100 |
| 61,597 |
| 3.69 |
| 7,312 |
| 35,130 |
| 4.97 |
| 5,618 |
| 12,930 |
| 2,162 |
| 6.93 |
| 482 |
| 74 | % |
Gold Quarry |
| 1,101 |
|
|
| not available |
|
|
|
|
| not available |
|
|
|
|
|
|
| not available |
|
|
| — |
|
Marigold |
| 1,2,102,103 |
| 35,166 |
| 0.64 |
| 723 |
| 238,453 |
| 0.51 |
| 3,918 |
| 4,641 |
| 22,694 |
| 0.44 |
| 324 |
| 100 | % |
Midas/Fire Creek |
| 3,104,105 |
| 53 |
| 39.72 |
| 67 |
| 471 |
| 17.35 |
| 263 |
| 330 |
| 1,045 |
| 13.14 |
| 441 |
| 100 | % |
Bald Mountain |
| 1,2,3,106 |
| 82,153 |
| 0.69 |
| 1,824 |
| 227,637 |
| 0.58 |
| 4,215 |
| 6,039 |
| 52,176 |
| 0.45 |
| 758 |
| 65 | % |
Mesquite |
| 107,108 |
| 9,070 |
| 0.65 |
| 191 |
| 304,081 |
| 0.48 |
| 4,713 |
| 4,904 |
| 17,550 |
| 0.42 |
| 238 |
| 100 | % |
Hollister |
| 109,110 |
| 166 |
| 38.37 |
| 205 |
| 280 |
| 31.33 |
| 282 |
| 487 |
| 433 |
| 16.76 |
| 233 |
| 100 | % |
Robinson |
| 111,112 |
| 510,270 |
| 0.15 |
| 2,460 |
| 139,380 |
| 0.14 |
| 620 |
| 3,080 |
| 139,610 |
| 0.14 |
| 620 |
| 100 | % |
Golden Meadows |
| 113,114 |
| — |
| — |
| — |
| 80,752 |
| 1.67 |
| 4,326 |
| 4,326 |
| 56,294 |
| 1.60 |
| 2,897 |
| 100 | % |
Castle Mountain |
| 115,116,117 |
| — |
| — |
| — |
| 165,100 |
| 0.59 |
| 3,150 |
| 3,150 |
| 57,800 |
| 0.57 |
| 1,060 |
| 100 | % |
Pinson |
| 1,118,119 |
| 20,664 |
| 1.97 |
| 1,307 |
| 5,088 |
| 4.57 |
| 748 |
| 2,055 |
| 2,776 |
| 9.79 |
| 874 |
| 1 | % |
Sandman |
| 1,2,3,120 |
| — |
| — |
| — |
| 1,179 |
| 1.32 |
| 50 |
| 50 |
| 998 |
| 1.85 |
| 59 |
| 100 | % |
Dee (South Arturo) |
| 1,2,3,121,122 |
| 21 |
| 4.90 |
| 3 |
| 80,343 |
| 1.58 |
| 4,075 |
| 4,078 |
| 23,407 |
| 0.49 |
| 367 |
| 90 | % |
|
|
|
|
|
|
|
|
|
|
|
|
|
|
|
|
|
|
|
|
|
|
|
|
|
|
GOLD — CANADA |
|
|
|
|
|
|
|
|
|
|
|
|
|
|
|
|
|
|
|
|
|
|
|
|
|
Sudbury |
| 1,123,124 |
| 420 |
| 0.74 |
| 10 |
| 2,230 |
| 0.98 |
| 70 |
| 80 |
| 750 |
| 0.83 |
| 20 |
| 100 | % |
Hislop |
| 2,125 |
| 7 |
| 1.07 |
| 0 |
| 1,351 |
| 4.10 |
| 178 |
| 179 |
| 690 |
| 4.15 |
| 92 |
| 100 | % |
Holloway |
| 2,126 |
| 318 |
| 3.91 |
| 40 |
| 3,201 |
| 4.10 |
| 422 |
| 462 |
| 3,279 |
| 4.59 |
| 484 |
| 100 | % |
Holt |
| 2,127 |
| 5,106 |
| 3.94 |
| 646 |
| 3,768 |
| 4.66 |
| 565 |
| 1,211 |
| 1,101 |
| 5.11 |
| 181 |
| 100 | % |
Taylor, Aquarius, Clavos |
| 2,128,129,130 |
| — |
| — |
| — |
| 27,174 |
| 1.99 |
| 1,736 |
| 1,736 |
| 3,233 |
| 3.88 |
| 403 |
| 100 | % |
Detour Lake |
| 2,131 |
| 114,700 |
| 1.29 |
| 4,746 |
| 498,100 |
| 0.98 |
| 15,669 |
| 20,415 |
| 21,700 |
| 0.81 |
| 564 |
| 100 | % |
Musselwhite |
| 2,132 |
| 3,740 |
| 7.07 |
| 850 |
| 6,050 |
| 5.96 |
| 1,160 |
| 1,990 |
| 4,730 |
| 5.66 |
| 860 |
| 100 | % |
Hemlo |
| 1,2,3,133 |
| 1,847 |
| 2.86 |
| 170 |
| 63,801 |
| 1.34 |
| 2,752 |
| 2,922 |
| 1,524 |
| 4.92 |
| 241 |
| 15 | % |
Kirkland Lake |
| 134,135,136 |
| 2,227 |
| 13.41 |
| 960 |
| 8,703 |
| 10.30 |
| 2,883 |
| 3,843 |
| 10,013 |
| 6.94 |
| 2,234 |
| 100 | % |
Timmins West |
| 137,138 |
| — |
| — |
| — |
| 6,516 |
| 5.92 |
| 1,240 |
| 1,240 |
| 9,545 |
| 5.93 |
| 1,819 |
| 100 | % |
Canadian Malartic |
| 1,139,140 |
| 45,800 |
| 0.98 |
| 1,440 |
| 301,500 |
| 1.06 |
| 10,250 |
| 11,690 |
| 49,600 |
| 0.75 |
| 1,200 |
| 10 | % |
Mouska |
| 141 |
| 29 |
| 14.70 |
| 14 |
| — |
| — |
| — |
| 14 |
| 255 |
| 15.10 |
| 124 |
| 100 | % |
Brucejack |
| 142,143 |
| 4,400 |
| 12.02 |
| 1,700 |
| 15,900 |
| 15.65 |
| 8,000 |
| 9,600 |
| 9,900 |
| 17.91 |
| 5,700 |
| 100 | % |
Courageous Lake |
| 144,145 |
| 13,401 |
| 2.53 |
| 1,090 |
| 93,914 |
| 2.28 |
| 6,884 |
| 7,974 |
| 48,963 |
| 2.18 |
| 3,432 |
| 100 | % |
Goldfields (Box/Athona) |
| 146,147 |
| 858 |
| 2.04 |
| 56 |
| 20,002 |
| 1.51 |
| 971 |
| 1,027 |
| 4,564 |
| 1.54 |
| 226 |
| 100 | % |
Hardrock/Geraldton |
| 148,149 |
| — |
| — |
| — |
| 55,750 |
| 1.81 |
| 3,241 |
| 3,241 |
| 34,712 |
| 3.39 |
| 3,784 |
| 100 | % |
Phoenix |
| 150,151 |
| — |
| — |
| — |
| 4,120 |
| 8.52 |
| 1,129 |
| 1,129 |
| 7,452 |
| 9.26 |
| 2,219 |
| 100 | % |
Monument Bay |
| 152,153,154 |
| 15,543 |
| 1.47 |
| 736 |
| 51,603 |
| 1.30 |
| 2,164 |
| 2,900 |
| 26,460 |
| 0.82 |
| 697 |
| 100 | % |
|
|
|
|
|
|
|
|
|
|
|
|
|
|
|
|
|
|
|
|
|
|
|
|
|
|
GOLD - AUSTRALIA |
|
|
|
|
|
|
|
|
|
|
|
|
|
|
|
|
|
|
|
|
|
|
|
|
|
Duketon |
| 1,155,156 |
| 12,900 |
| 1.24 |
| 515 |
| 132,400 |
| 1.09 |
| 4,640 |
| 5,155 |
| 104,200 |
| 0.88 |
| 2,936 |
| 99 | % |
Henty |
| 157,158 |
| 1,613 |
| 4.78 |
| 248 |
| 143 |
| 8.70 |
| 40 |
| 288 |
| 31 |
| 8.03 |
| 8 |
| 100 | % |
Admiral Hill |
| 159,160,161 |
| — |
| — |
| — |
| 907 |
| 1.46 |
| 43 |
| 43 |
| 1,338 |
| 1.11 |
| 48 |
| fixed interest |
|
Bronzewing |
| 162,163 |
| — |
| — |
| — |
| 12,380 |
| 1.69 |
| 674 |
| 674 |
| 5,120 |
| 1.86 |
| 307 |
| 100 | % |
South Kalgoorlie |
| 1,164,165 |
| 2,000 |
| 1.71 |
| 110 |
| 46,600 |
| 1.98 |
| 2,960 |
| 3,070 |
| 35,600 |
| 1.93 |
| 2,210 |
| 76 | % |
White Dam |
| 166,167 |
| — |
| — |
| — |
| 1,915 |
| 1.10 |
| 68 |
| 68 |
| 3,255 |
| 0.89 |
| 93 |
| fixed interest |
|
Aphrodite |
| 168,169 |
| — |
| — |
| — |
| 16,390 |
| 1.71 |
| 899 |
| 899 |
| 12,350 |
| 1.25 |
| 498 |
| 100 | % |
Bullabulling |
| 1,170,171 |
| — |
| — |
| — |
| 72,400 |
| 0.98 |
| 2,279 |
| 2,279 |
| 36,700 |
| 1.11 |
| 1,305 |
| 50 | % |
Edna May |
| 1,172,173 |
| 21,100 |
| 0.93 |
| 629 |
| 17,130 |
| 1.20 |
| 660 |
| 1,289 |
| 8,760 |
| 1.26 |
| 354 |
| 2 | % |
Glenburgh |
| 174,175 |
| — |
| — |
| — |
| 6,900 |
| 1.72 |
| 382 |
| 382 |
| 14,200 |
| 1.34 |
| 614 |
| 100 | % |
Moyagee |
| 176,177 |
| — |
| — |
| — |
| 1,034 |
| 2.22 |
| 74 |
| 74 |
| 3,039 |
| 3.17 |
| 310 |
| 100 | % |
Red October |
| 1,178,179 |
| 105 |
| 10.66 |
| 36 |
| 4,103 |
| 1.94 |
| 256 |
| 292 |
| 3,291 |
| 1.67 |
| 177 |
| 100 | % |
Wiluna |
| 180,181,182 |
| 100 |
| 2.80 |
| 9 |
| 16,255 |
| 3.78 |
| 1,975 |
| 1,984 |
| 24,554 |
| 2.91 |
| 2,294 |
| 100 | % |
|
|
|
|
|
|
|
|
|
|
|
|
|
|
|
|
|
|
|
|
|
|
|
|
|
|
GOLD — REST OF WORLD |
|
|
|
|
|
|
|
|
|
|
|
|
|
|
|
|
|
|
|
|
|
|
|
|
|
Palmarejo |
| 3,183 |
| 8,715 |
| 2.44 |
| 685 |
| 25,338 |
| 1.26 |
| 1,024 |
| 1,709 |
| 10,533 |
| 1.83 |
| 621 |
| 100 | % |
MWS |
| 184 |
| 161,320 |
| 0.23 |
| 1,170 |
| 161,550 |
| 0.24 |
| 1,260 |
| 2,430 |
| 15,510 |
| 0.30 |
| 150 |
| fixed interest |
|
Sabodala |
| 185 |
| 25,070 |
| 1.40 |
| 1,130 |
| 112,180 |
| 1.40 |
| 5,050 |
| 6,180 |
| 77,150 |
| 1.05 |
| 2,600 |
| 100 | % |
Subika |
| 1,2,3,186 |
| 45,631 |
| 1.29 |
| 1,890 |
| 168,373 |
| 1.97 |
| 10,640 |
| 12,530 |
| 32,568 |
| 2.60 |
| 2,720 |
| 50 | % |
Tasiast |
| 2,187 |
| 87,918 |
| 0.90 |
| 2,556 |
| 262,226 |
| 1.40 |
| 11,794 |
| 14,350 |
| 14,146 |
| 1.46 |
| 664 |
| 100 | % |
Edikan |
| 188,189 |
| 82,204 |
| 1.12 |
| 2,956 |
| 80,310 |
| 1.06 |
| 2,739 |
| 5,695 |
| 77,447 |
| 0.98 |
| 2,430 |
| 100 | % |
Cerro San Pedro |
| 1,190 |
| 13,387 |
| 0.46 |
| 199 |
| 14,311 |
| 0.43 |
| 198 |
| 397 |
| 1,174 |
| 0.34 |
| 13 |
| 100 | % |
Cooke 4 |
| 191,192 |
| 2,980 |
| 5.08 |
| 490 |
| 22,110 |
| 3.89 |
| 2,760 |
| 3,250 |
| 54,330 |
| 3.11 |
| 5,430 |
| 100 | % |
Cerro Moro |
| 2,193 |
| — |
| — |
| — |
| 3,731 |
| 6.98 |
| 837 |
| 837 |
| 3,559 |
| 1.92 |
| 220 |
| 100 | % |
Cobre Panama |
| 194,195 |
| 262,000 |
| 0.13 |
| 1,118 |
| 3,941,000 |
| 0.06 |
| 7,888 |
| 9,006 |
| 3,686,000 |
| 0.04 |
| 4,396 |
| 80 | % |
Ity |
| 196,197 |
| 2,500 |
| 4.46 |
| 359 |
| 3,312 |
| 2.69 |
| 286 |
| 645 |
| 8,832 |
| 1.60 |
| 455 |
| fixed interest |
|
North Lanut |
| 198 |
| 5,874 |
| 1.06 |
| 200 |
| 1,657 |
| 1.05 |
| 56 |
| 256 |
| 1,695 |
| 2.08 |
| 113 |
| fixed interest |
|
Agi Dagi |
| 1,199,200,201 |
| — |
| — |
| — |
| 93,944 |
| 0.56 |
| 1,699 |
| 1,699 |
| 43,501 |
| 0.64 |
| 891 |
| 95-100 | % |
Calcatreu |
| 202 |
| — |
| — |
| — |
| 8,000 |
| 2.63 |
| 676 |
| 676 |
| 3,400 |
| 2.07 |
| 226 |
| 100 | % |
Gurupi |
| 203,204 |
| 46,027 |
| 0.73 |
| 1,076 |
| 95,979 |
| 0.79 |
| 2,444 |
| 3,520 |
| 7,719 |
| 0.67 |
| 165 |
| 100 | % |
Kiziltepe |
| 205,206 |
| 783 |
| 4.10 |
| 103 |
| 972 |
| 2.08 |
| 65 |
| 168 |
| 357 |
| 1.64 |
| 19 |
| 100 | % |
Perama Hill |
| 207 |
| 3,064 |
| 4.30 |
| 424 |
| 9,375 |
| 3.18 |
| 958 |
| 1,382 |
| 8,766 |
| 1.96 |
| 554 |
| 100 | % |
San Jorge |
| 208,209 |
| 79,518 |
| 0.22 |
| 584 |
| 104,091 |
| 0.19 |
| 626 |
| 1,211 |
| 11,235 |
| 0.16 |
| 59 |
| 100 | % |
Sissingue |
| 210,211 |
| 4,225 |
| 2.24 |
| 304 |
| 14,750 |
| 1.31 |
| 621 |
| 925 |
| 7,000 |
| 1.29 |
| 291 |
| 100 | % |
Taca Taca |
| 212,213,214 |
| — |
| — |
| — |
| 2,408,000 |
| 0.10 |
| 7,630 |
| 7,630 |
| 938,000 |
| 0.06 |
| 1,700 |
| 100 | % |
Volcan |
| 215,216 |
| — |
| — |
| — |
| — |
| — |
| — |
| — |
| 18,600 |
| 0.85 |
| 510 |
| 25 | % |
|
|
|
|
|
|
|
|
|
|
|
|
|
|
|
|
|
|
|
|
|
|
|
|
|
|
TOTAL GOLD MINERAL RESOURCES |
|
|
| 43,342 |
|
|
|
|
| 165,492 |
| 208,716 |
|
|
|
|
| 68,014 |
|
|
| ||||
|
|
|
|
|
|
|
|
|
|
|
|
|
|
|
|
|
|
|
|
|
| Percentage |
|
|
|
|
| PGM Mineral Reserves |
| Covered by |
| ||||||||||||||||
|
|
|
| Proven |
| Probable |
| Proven & Probable |
| royalty or |
| ||||||||||||
|
|
|
| Tonnes |
| Grade |
| Contained |
| Tonnes |
| Grade |
| Contained |
| Tonnes |
| Grade |
| Contained |
| stream |
|
|
| Notes |
| 000s |
| g/t |
| 000 oz |
| 000s |
| g/t |
| 000 oz |
| 000s |
| g/t |
| 000 oz |
| interest(236) |
|
PGM |
|
|
|
|
|
|
|
|
|
|
|
|
|
|
|
|
|
|
|
|
|
|
|
Sudbury |
| 1,84,85,86 |
| — |
| — |
| — |
| 1,670 |
| 5.4 |
| 290 |
| 1,670 |
| 5.4 |
| 290 |
| 100 | % |
Stillwater |
| 1 |
| 5,532 |
| 17.1 |
| 3,037 |
| 38,474 |
| 15.4 |
| 19,027 |
| 44,006 |
| 15.6 |
| 22,064 |
| 94 | % |
Pandora |
| 1,87,88 |
| 1,435 |
| 3.8 |
| 176 |
| 16,069 |
| 4.1 |
| 2,139 |
| 17,504 |
| 4.1 |
| 2,313 |
| 80 | % |
|
|
|
|
|
|
|
|
|
|
|
|
|
|
|
|
|
|
|
|
|
|
|
|
TOTAL PGM MINERAL RESERVES |
| 3,213 |
|
|
|
|
| 21,456 |
|
|
|
|
| 24,667 |
|
|
| ||||||
|
|
|
|
|
|
|
|
|
|
|
|
|
|
|
|
|
|
|
|
|
|
|
| Percentage |
|
|
|
|
| PGM Mineral Resources - Inclusive of Reserves |
|
|
|
|
|
|
| Covered by |
| ||||||||||||
|
|
|
| Measured (M) |
| Indicated (I) |
| (M)+(I) |
| Inferred |
| royalty or |
| ||||||||||||
|
|
|
| Tonnes |
| Grade |
| Contained |
| Tonnes |
| Grade |
| Contained |
| Contained |
| Tonnage |
| Grade |
| Contained |
| stream |
|
|
| Notes |
| 000s |
| g/t |
| 000 oz |
| 000s |
| g/t |
| 000 oz |
| 000 oz |
| 000s |
| g/t |
| 000 oz |
| interest(236) |
|
PGM |
|
|
|
|
|
|
|
|
|
|
|
|
|
|
|
|
|
|
|
|
|
|
|
|
|
Sudbury |
| 1,217,218 |
| 420 |
| 3.4 |
| 50 |
| 2,230 |
| 6.0 |
| 430 |
| 480 |
| 750 |
| 2.5 |
| 60 |
| 100 | % |
Stillwater |
| 1,2 |
| 5,532 |
| 17.1 |
| 3,037 |
| 38,474 |
| 15.4 |
| 19,027 |
| 22,064 |
| — |
| — |
| — |
| 94 | % |
Pandora |
| 1,219,220 |
| 25,825 |
| 4.8 |
| 3,985 |
| 140,603 |
| 4.6 |
| 20,840 |
| 24,825 |
| 22,669 |
| 4.7 |
| 3,455 |
| 80 | % |
|
|
|
|
|
|
|
|
|
|
|
|
|
|
|
|
|
|
|
|
|
|
|
|
|
|
TOTAL PGM MINERAL RESOURCES |
| 7,072 |
|
|
|
|
| 40,297 |
| 47,369 |
|
|
|
|
| 3,515 |
|
|
| ||||||
|
|
|
|
|
|
|
|
|
|
|
|
|
|
|
|
|
|
|
|
|
| Percentage |
|
|
|
|
| Copper Mineral Reserves |
| Covered by |
| ||||||||||||||||
|
|
|
| Proven |
| Probable |
| Proven & Probable |
| royalty or |
| ||||||||||||
|
|
|
| Tonnes |
| Grade |
| Contained |
| Tonnes |
| Grade |
| Contained |
| Tonnes |
| Grade |
| Contained |
| stream |
|
|
| Notes |
| 000s |
| % |
| Mlbs |
| 000s |
| % |
| Mlbs |
| 000s |
| % |
| Mlbs |
| interest(236) |
|
Copper |
|
|
|
|
|
|
|
|
|
|
|
|
|
|
|
|
|
|
|
|
|
|
|
Osborne |
| 89,90 |
| 2,660 |
| 0.94 | % | 55 |
| 2,590 |
| 1.47 | % | 84 |
| 5,250 |
| 1.21 | % | 139 |
| fixed interest |
|
Rosemont |
| 91,92 |
| 279,479 |
| 0.46 | % | 2,834 |
| 325,796 |
| 0.42 | % | 3,017 |
| 605,276 |
| 0.44 | % | 5,851 |
| 100 | % |
Relincho |
| 93 |
| 435,300 |
| 0.38 | % | 3,647 |
| 803,800 |
| 0.37 | % | 6,557 |
| 1,239,100 |
| 0.37 | % | 10,203 |
| 100 | % |
Taca Taca |
|
|
| — |
| — |
| — |
| — |
| — |
| — |
| — |
| — |
| — |
| 100 | % |
Robinson |
| 94,95 |
| 105,490 |
| 0.51 | % | 1,181 |
| 4,530 |
| 0.40 | % | 40 |
| 110,020 |
| 0.50 | % | 1,222 |
| 100 | % |
Vizcachitas |
|
|
| — |
| — |
| — |
| — |
| — |
| — |
| — |
| — |
| — |
| 100 | % |
|
|
|
|
|
|
|
|
|
|
|
|
|
|
|
|
|
|
|
|
|
|
|
|
TOTAL COPPER MINERAL RESERVES |
| 7,662 |
|
|
|
|
| 9,614 |
|
|
|
|
| 17,276 |
|
|
| ||||||
|
|
|
|
|
|
|
|
|
|
|
|
|
|
|
|
|
|
|
|
|
|
|
| Percentage |
|
|
|
|
| Copper Mineral Resources - Inclusive of Reserves |
|
|
|
|
|
|
| Covered by |
| ||||||||||||
|
|
|
| Measured (M) |
| Indicated (I) |
| (M)+(I) |
| Inferred |
| royalty or |
| ||||||||||||
|
|
|
| Tonnes |
| Grade |
| Contained |
| Tonnes |
| Grade |
| Contained |
| Contained |
| Tonnage |
| Grade |
| Contained |
| stream |
|
|
| Notes |
| 000s |
| % |
| Mlbs |
| 000s |
| % |
| Mlbs |
| Mlbs |
| 000s |
| % |
| Mlbs |
| interest(236) |
|
Copper |
|
|
|
|
|
|
|
|
|
|
|
|
|
|
|
|
|
|
|
|
|
|
|
|
|
Osborne |
| 221,222 |
| 6,500 |
| 1.31 | % | 187 |
| 5,470 |
| 1.43 | % | 172 |
| 359 |
| 5,840 |
| 1.37 | % | 177 |
| fixed interest |
|
Rosemont |
| 223,224 |
| 342,914 |
| 0.42 | % | 3,202 |
| 548,481 |
| 0.37 | % | 4,438 |
| 7,640 |
| 126,733 |
| 0.40 | % | 1,110 |
| 100 | % |
Relincho |
| 2 |
| 515,200 |
| 0.36 | % | 4,122 |
| 1,120,900 |
| 0.36 | % | 8,933 |
| 13,056 |
| 610,800 |
| 0.38 | % | 5,117 |
| 100 | % |
Taca Taca |
| 225,226,227 |
| — |
| — |
| — |
| 2,165,000 |
| 0.44 | % | 21,150 |
| 21,150 |
| 921,000 |
| 0.37 | % | 7,550 |
| 100 | % |
Robinson |
| 228,229 |
| 510,270 |
| 0.35 | % | 3,882 |
| 139,980 |
| 0.27 | % | 846 |
| 4,728 |
| 139,610 |
| 0.29 | % | 882 |
| 100 | % |
Vizcachitas |
| 230,231 |
| — |
| — |
| — |
| 1,038,000 |
| 0.37 | % | 8,539 |
| 8,539 |
| 318,000 |
| 0.34 | % | 2,415 |
| 100 | % |
|
|
|
|
|
|
|
|
|
|
|
|
|
|
|
|
|
|
|
|
|
|
|
|
|
|
TOTAL COPPER MINERAL RESOURCES |
| 11,206 |
|
|
|
|
| 43,907 |
| 55,113 |
|
|
|
|
| 17,074 |
|
|
| ||||||
|
|
|
|
|
|
|
|
|
|
|
|
|
|
|
|
|
|
|
|
|
| Percentage |
|
|
|
|
| Nickel Mineral Reserves |
| Covered by |
| ||||||||||||||||
|
|
|
| Proven |
| Probable |
| Proven & Probable |
| royalty or |
| ||||||||||||
|
|
|
| Tonnes |
| Grade |
| Contained |
| Tonnes |
| Grade |
| Contained |
| Tonnes |
| Grade |
| Contained |
| stream |
|
|
| Notes |
| 000s |
| % |
| Mlbs |
| 000s |
| % |
| Mlbs |
| 000s |
| % |
| Mlbs |
| interest(236) |
|
Nickel |
|
|
|
|
|
|
|
|
|
|
|
|
|
|
|
|
|
|
|
|
|
|
|
Mt Keith |
| 96,97 |
| 98,000 |
| 0.59 | % | 1,272 |
| 15,000 |
| 0.50 | % | 165 |
| 113,000 |
| 0.58 | % | 1,437 |
| 100 | % |
Falcondo |
| 98,99 |
| 44,900 |
| 1.28 | % | 1,267 |
| 26,300 |
| 1.36 | % | 789 |
| 71,200 |
| 1.31 | % | 2,056 |
| 100 | % |
|
|
|
|
|
|
|
|
|
|
|
|
|
|
|
|
|
|
|
|
|
|
|
|
TOTAL NICKEL MINERAL RESERVES |
| 2,539 |
|
|
|
|
| 954 |
|
|
|
|
| 3,493 |
|
|
| ||||||
|
|
|
|
|
|
|
|
|
|
|
| Percentage |
| |||||||||||||
|
|
|
| Nickel Mineral Resources - Inclusive of Reserves |
|
|
|
|
|
|
| Covered by |
| |||||||||||||
|
|
|
| Measured (M) |
| Indicated (I) |
| (M)+(I) |
| Inferred |
| royalty or |
| |||||||||||||
|
|
|
| Tonnes |
| Grade |
| Contained |
| Tonnes |
| Grade |
| Contained |
| Contained |
| Tonnage |
| Grade |
| Contained |
| stream |
| |
|
| Notes |
| 000s |
| % |
| Mlbs |
| 000s |
| % |
| Mlbs |
| Mlbs |
| 000s |
| % |
| Mlbs |
| interest(236) |
| |
Nickel |
|
|
|
|
|
|
|
|
|
|
|
|
|
|
|
|
|
|
|
|
|
|
|
|
| |
Mt Keith |
| 232, 233 |
| 199,000 |
| 0.50 | % | 2,194 |
| 107,000 |
| 0.50 | % | 1,179 |
| 3,373 |
| 35,000 |
| 0.50 | % | 386 |
| 100 | % | |
Falcondo |
| 234, 235 |
| 36,700 |
| 1.48 | % | 1,197 |
| 31,100 |
| 1.53 | % | 1,049 |
| 2,246 |
| 4,900 |
| 1.40 | % | 151 |
| 100 | % | |
|
|
|
|
|
|
|
|
|
|
|
|
|
|
|
|
|
|
|
|
|
|
|
|
|
| |
TOTAL NICKEL MINERAL RESOURCES |
| 3,391 |
|
|
|
|
| 2,228 |
| 5,620 |
|
|
|
|
| 537 |
|
|
| |||||||
|
| Notes |
|
| All Mineral Reserves and Mineral Resources have been calculated in accordance with acceptable foreign codes, including CIM, SEC, JORC, or SAMREC guidelines |
|
| Mineral Resources which are not Mineral Reserves do not have demonstrated economic viability |
|
| Unless otherwise noted, Mineral Reserves and Mineral Resources are reported as of December 31, 2013 |
|
| Unless otherwise noted, Mineral Resources were reported by the operator inclusive of Mineral Reserves |
|
| Contained ounces do not take into account recovery losses |
|
| Mineral Reserves and Mineral Resources based on publicly disclosed information as of March 10, 2014 |
|
| Rows and columns may not add up due to rounding |
|
| Inferred Resources are in addition to Measured and Indicated Resources. Inferred Resources have a great amount of uncertainty as to their existence and whether they can be mined legally or economically. It cannot be assumed that all or any part of the Inferred Resources will ever be upgraded to a higher category. See “Cautionary Note Regarding Mineral and Oil and Gas Reserve and Resource Estimates”. |
|
|
|
(1) |
| Royalty does not cover entire property or cover all known Mineral Reserves and Mineral Resources |
(2) |
| Mineral Resources shown by operator as exclusive of Mineral Reserves. The Company’s qualified person determined the Inclusive Mineral Resources by adding the exclusive Measured and Indicated Mineral Resources to the Proven and Probable Reserves |
(3) |
| Mineral Reserves and Mineral Resources are reported by the operator in non-metric units. The Company’s qualified person calculated the metric conversion using 1opt=34.286 g/tonne, 1 short ton = 0.9018 metric tonnes, 1 oz = 31.1035 g |
(4) |
| Mineral Reserves are calculated using a long term average gold price of $1,100 per ounce |
(5) |
| In accordance with certain provisions of the royalty agreement, Franco-Nevada is not able to disclose Mineral Reserves and Mineral Resources for Gold Quarry |
(6) |
| Mineral Reserves are calculated using a long term average gold price of $1,300 per ounce |
(7) |
| Mineral Reserves and Mineral Resources converted to 100% basis from Barrick’s 33.33% interest |
(8) |
| Mineral Reserves for Midas are calculated using a gold price of $1,300 per ounce |
(9) |
| Mineral Reserves are calculated using a long term average gold price of $1,100 per ounce |
(10) |
| Mineral Reserves calculated using $1,300 Au |
(11) |
| Mineral Reserves reported at a cut-off 0.21 g/t Au for oxide & transition, 0.41 g/t Au non-oxide |
(12) |
| As of June 2012, depleted to September 30, 2012 |
(13) |
| Mineral Reserves assumes $1,400/oz Au and a cut-off of 0.25 oz/ton |
(14) |
| As of December 31, 2010 |
(15) |
| Mineral Reserves reported above a cut-off of 2.93 recoverable lbs Cu per ton assuming $1,000/oz Au and $2.50/lb Cu |
(16) |
| As of May 18, 2012 |
(17) |
| Underground Mineral Reserve based on a 0.2 opt cut-off and $1,300/oz Au |
(18) |
| Mineral Reserves are calculated using a long term average gold price of $1,100 per ounce |
(19) |
| Mineral Reserves converted to 100% basis from Barricks’ 60% attributable share |
(20) |
| As of December 31, 2010 |
(21) |
| Mineral Reserves estimated using $2.50/lb Cu, $7.00/lb Ni, $1,500/oz Pt, $400/oz Pd and $1,000/oz Au |
(22) |
| Mineral Reserves cut-off is based on direct cost, indirect cost, sustaining capital and impact of Gold Wheaton agreement |
(23) |
| Mineral Reserves estimated using an average long-term gold price of $1,300/oz and a cut-off grade of 1.64 g/t Au at the West Pit and 3.00 g/t Au for Thor |
(24) |
| Mineral Reserves estimated using an average long-term gold price of $1,300/oz and a cut-off grade of 3.93 g/t |
(25) |
| Mineral Reserves estimated using an average long-term gold price of $1,300/oz and a cut-off grade of 3.01 g/t Au |
(26) |
| Mineral Reserves assume $1,300/ oz Au and a stope by stope cut-off grade |
(27) |
| Mineral Reserves reported using $1000/oz Au at a 0.5 g/t cut-off |
(28) |
| Mineral Reserves are calculated using $1,300/oz Au |
(29) |
| Mineral Reserves are calculated using a long term average gold price of $1,100 per ounce & exchange rate of 1.05 $Can/$US |
(30) |
| As of December 31, 2012 |
(31) |
| Estimated at a 0.18 oz/ton cut-off and $1,400.56/oz Au |
(32) |
| Based on May 2012 Technical Report |
(33) |
| Mineral Reserves reported at a cut-off grade of 3.0 g/t Au |
(34) |
| As of January 01, 2013 |
(35) |
| Mineral Reserves and Mineral Resources estimate using base case $1475 engineered pit shell and cut-off grade of 0.31 to 0.34 g/t Au |
(36) |
| Mineral Reserves estimated using $1,300 Au |
(37) |
| As of June 21, 2013 |
(38) |
| Calculated at a C$180/tonne cut-off assuming $1350/oz Au |
(39) |
| As of July 24, 2012 |
(40) |
| Waste to ore cut-offs determined using $1,244/oz Au and pit limit based on a Cdn$20.10 per tonne cut-off |
(41) |
| As of December 31, 2011 |
(42) |
| Mineral Reserves assumes a gold price of CAD$1,250/oz and a cut-off grade of 0.72 g/t with a marginal cut-off grade of 0.33 g/t |
(43) |
| As of June 30, 2012 except for Rosemont (January 2013) and Garden Well (net of mining to May 2013) |
(44) |
| Assumes a cut-off of 0.6 g/t for Garden Well, 0.4-0.5 g/t for Moolart Well, 0.7 g/t for Erlistoun, and 0.5 g/t for Rosemont |
(45) |
| As of June 30, 2013 |
(46) |
| Estimated at a 3.8 g/t gold cut-off using a gold price of A$1450 |
(47) |
| As of June 30, 2012 |
(48) |
| Cockburn Mineral Reserve 2012: A$1350/oz & 0.50 g/t Au cut-off; Corboys Mineral Reserve 2010: A$1300/oz & 0.91 g/t Au cut-off; Challenger Mineral Reserve 2012: A$1250/oz & 0.84 g/t Au cut-off |
(49) |
| As of December 31, 2012 |
(50) |
| Mineral Reserves Gold Price: HBJ - A$1,250/oz; HBJ Underground - A$1,642/oz; Mt Martin - A$1,350/oz; Pernatty - A$1,400/oz; |
(51) |
| Mineral Reserves Au cut-off: HBJ - 0.49 g/t; HBJ Underground - 1.64 g/t; Mt Martin - 0.44 g/t; Pernatty - 0.6 g/t |
(52) |
| As of December 31, 2012 |
(53) |
| Mineral Reserves are calculated at a 0.4 g/t Au cut-off using A$1500/oz Au |
(54) |
| As of June 30, 2013 |
(55) |
| No gold price or cut-off assumptions disclosed |
(56) |
| As of June 30, 2013 |
(57) |
| Assumes a cut-off of 3.0 g/t using A$1,400/oz Au |
(58) |
| Mineral Reserves assumes a $1,450 /oz Au & $25.00/oz Ag |
(59) |
| As of December 31, 2012 |
(60) |
| Mineral Reserves estimated using $1,300/oz Au; 0.24 g/t Au cut-off; and US$/ZAR 6.94 |
(61) |
| cut-off Au grades: Sabodala 0.4 g/t oxide & 0.5 g/t fresh; Niakifiri 0.35 g/t oxide & 0.5 g/t fresh; Gora 0.76 g/t; Masato, Golouma & Kerekounda — 0.45 g/t oxide & 0.50 g/t fresh |
(62) |
| Gold Price assumptions: Sabodala $1,250/oz; Niakifiri $1,350/oz; Gora $1,200 oz, others $1250/oz |
(63) |
| Mineral Reserves assumes $1300/oz Au |
(64) |
| Mineral Reserves assume $1,200/oz Au |
(65) |
| As of July 01, 2013 |
(66) |
| Mineral Reserves estimated using $1200/oz Au; 0.6 g/t Au cut-off oxides; 0.5 g/t Au cut-off transitional; and 0.4 g/t Au cut-off sulphide |
(67) |
| Mineral Reserves assumes $1,300/oz gold and $22.00/oz silver and a cut-off of $3.00/tonne NSR |
(68) |
| As of August 2013 |
(69) |
| Mineral Reserves are estimated using a pay limit that is based on ZAR 450,000 /kg ($1750/oz and ZAR/USD 8:1) |
(70) |
| Mineral Reserves are estimated using $950 Au and $18.00 Ag; open pit cut-off at 3.4 g/t AuEq & underground cut-off at 6.2 g/t AuEq |
(71) |
| As of December 31, 2012 |
(72) |
| Mineral Reserves estimated using a $2.25 copper price, $1,000/oz gold price and $16/oz silver price |
(73) |
| As of December 31, 2011 |
(74) |
| Mineral Reserves converted to 100% basis from La Mancha’s 45.9% attributable share |
(75) |
| Mineral Reserves estimated at cut-offs between 0.8 and 2.0 g/t Au at US$650/oz Au |
(76) |
| As of December 31, 2011 |
(77) |
| As of January 31, 2011 |
(78) |
| Mineral Reserves assumes a gold price of $1,066/oz |
(79) |
| As of October 2012 |
(80) |
| Mineral Reserves based on cut-off grade of 1 g/t AuEq and $1,058/oz Au & $16.60/oz Ag |
(81) |
| Mineral Reserves assume a gold price of $1,250/oz and cut-off grade of 0.8g/t |
(82) |
| Mineral Reserves as of December 22, 2010 |
(83) |
| Mineral Reserves calculated at a cut-off of 0.55 g/t Au based on $950/oz Au |
(84) |
| As of December 31, 2010 |
(85) |
| Mineral Reserves estimated using $2.50/lb Cu, $7.00/lb Ni, $1,500/oz Pt, $400/oz Pd and $1,000/oz Au |
(86) |
| Mineral Reserve cut-off is based on direct cost, indirect cost, sustaining capital and impact of Gold Wheaton agreement |
(87) |
| As of September 30, 2013 based on Lonmin Plc disclosure |
(88) |
| Mineral Reserves calculated from Lonmin Plc 34.85% attributable interest |
(89) |
| As of December 31, 2012 |
(90) |
| Mineral Reserves reported at a cut-off of 0.35% CuEq for Osborne open pit extension and 1.5% CuEq for Osborne underground and 1.4% CuEq for Kulthor underground where CuEq = Cu(%) + Au(g/t) *0.6 |
(91) |
| As of July 17, 2012 |
(92) |
| Mineral Reserves assumes $2.50/lb Cu, $15.00/lb Mo and $20/oz Ag |
(93) |
| Mineral Reserves assumes $2.80/lb copper, $13.70/lb molybdenum |
(94) |
| As of December 31, 2010 |
(95) |
| Mineral Reserves reported above a cut-off of 2.93 recoverable lbs Cu per ton assuming $1,000/oz Au and $2.50/lb Cu |
(96) |
| As of June 30, 2012 |
(97) |
| Mineral Reserves calculated at a cut-off grade 0.35% Ni |
(98) |
| As of December 31, 2012 |
(99) |
| Mineral Reserves assumes a cut-off grade of 1.2% Ni |
(100) |
| Resources estimated using varying cut-off grades, depending on both the type of mine or project, its maturity and ore types at each property |
(101) |
| In accordance with certain provisions of the royalty agreement, Franco-Nevada is not able to disclose Mineral Reserves and Mineral Resources for Gold Quarry |
(102) |
| Resources estimated using varying cut-off grades, depending on both the type of mine or project, its maturity and ore types at each property |
(103) |
| Mineral Reserves and Mineral Resources converted to 100% basis from Barrick’s 33.33% interest |
(104) |
| Mineral Resources are reported exclusive of Mineral Reserves using a gold price of $1400/oz for Midas |
(105) |
| Mineral Resources are reported using a gold price of $1250/oz for Fire Creek at 6.9 g/t cut-off |
(106) |
| Resources estimated using varying cut-off grades, depending on both the type of mine or project, its maturity and ore types at each property |
(107) |
| Mineral Resources calculated using $1,400 Au |
(108) |
| Mineral Resources reported at a cut-off 0.11 g/t Au for oxide & transition, 0.22 g/t Au non-oxide |
(109) |
| As of June 2012 depleted to September 30, 2012 |
(110) |
| Mineral Resources reported based on a 0.15 oz/ton cut-off |
(111) |
| As of December 31, 2010 |
(112) |
| Mineral Resources reported above a cut-off of 1.24 recoverable lbs Cu per ton assuming $1,000/oz Au and $2.50/lb Cu |
(113) |
| As of December 31, 2012 (Open Pit oxide and sulphide); As of October 22, 2013 (tailings) |
(114) |
| Mineral Resource cut-off: 0.42 g/t Au for oxides, 0.75 g/t Au for sulphides & 0.75 g/t Au for tailings |
(115) |
| As of November 21, 2013 |
(116) |
| Mineral Resources are estimated at a cut-off grade of 0.14 g/t Au. |
(117) |
| Mineral Resources are contained within a Whittle pit shell, generated using a gold price of US$1300/oz Au. |
(118) |
| As of Feb 6, 2012 |
(119) |
| Mineral Resources assume a cut-off 6.34 g/t Au underground and 0.34 g/t Au open pit |
(120) |
| Mineral Resources reported at gold price of $1400/oz Au |
(121) |
| Mineral Resources converted to 100% basis from Barricks’ 60% attributable share |
(122) |
| Resources estimated using varying cut-off grades, depending on both the type of mine or project, its maturity and ore types at each property |
(123) |
| As of December 31, 2010 |
(124) |
| Mineral Resources estimated using $2.50/lb Cu, $7.00/lb Ni, $1,500/oz Pt, $400/oz Pd and $1,000/oz Au |
(125) |
| Mineral Resources estimated using an average long-term gold price of $1,400 and a cut-off grade of 2.5 g/t |
(126) |
| Mineral Resources estimated using an average long-term gold price of $1,400 and a cut-off grade of 2.5 g/t |
(127) |
| Mineral Resources estimated using an average long-term gold price of $1,400 and a cut-off grade of 2.5 g/t |
(128) |
| Mineral Resources for Taylor as at December 31, 2013 |
(129) |
| Mineral Resources for Aquarius as at October 2, 2006 assuming $500/oz Au No cut-off grade was applied |
(130) |
| Mineral Resources for Clavos as at October, 2012 assuming $1,600/oz Au, a cut-off grade of ranging from 2.75 g/t and converted to 100% basis from SAS 40% interest |
(131) |
| Mineral Resources reported using US$1200/oz Au at a 0.5 g/t cut-off; 0.6 g/t for Block A |
(132) |
| Mineral Resources are calculated using $1,500 /oz Au |
(133) |
| Resources estimated using varying cut-off grades, depending on both the type of mine or project, its maturity and ore types at each property |
(134) |
| As of June 17, 2011 (Upper Canada and McBean); As of October 2011 (Amalgamated Kirkland) |
(135) |
| As of December 31, 2012 (Macassa Mineral Resource); estimated at cut-off grades between 0.15-0.18 oz/ton and do not include Mineral Reserves |
(136) |
| Price & cut-offs: Upper Canada $1,200/oz (Pit 0.44 g/t; UG 2.4 g/t); McBean $900/oz (2.5 g/t); Amalgamated Kirkland $1,200/oz (2.0 g/t) |
(137) |
| Based on May 2012 Technical Report |
(138) |
| Mineral Resources assumes a cut-off of 2.0 g/t Au for Thunder Creek, a cut-off of 1.5 g/t Au for Timmins West Mine and $1,200/oz Au |
(139) |
| As of January 01, 2013 |
(140) |
| Mineral Reserves and Mineral Resources estimate using base case US$1,475 engineered pit shell and cut-off grade of 0.31 to 0.34 g/t Au |
(141) |
| Mineral Resources estimated using $1,300 Au |
(142) |
| Valley of the Kings as of December 19, 2013; West Zone as of November 20, 2012 |
(143) |
| Mineral Resources estimated at a 5.0 g/t Aueq cut-off & 53:1 Ag:Au value ratio |
(144) |
| As of January 9, 2012 |
(145) |
| Mineral Resources assumes a cut-off of 0.83 g/t Au |
(146) |
| As of December 31, 2011 |
(147) |
| Mineral Resources assumes a gold price of CAD$1,250/oz and a cut-off grade of 0.50 g/t with a marginal cut-off grade of 0.33 g/t |
(148) |
| As of September 23, 2013 |
(149) |
| Assumes: 0.5 g/t Au cut-off grade for open pit; 3.0 g/t Au cut-off grade for underground; $1300/oz Au |
(150) |
| As per Press Release June 25, 2013 |
(151) |
| Assumes a cut-off grade of 4.0 g/t based on US$1500/oz Au |
(152) |
| As of June 17, 2013 |
(153) |
| Pit Constrained Twin Lakes Deposit cut-off: open pit 0.7 g/t Au; underground 4.0 g/t Au; Mid East and AZ Deposits: 0.4 g/t Au |
(154) |
| Cut-off grades are based on a price of $1,372/oz Au |
(155) |
| As of June 30, 2012 other than Rosemont (January 2013) and Garden Well (net of mining to May 2013) |
(156) |
| Assumes a cut-off of 0.5 g/t for Garden Well, 0.3-1.0 g/t for Moolart Well, 0.5 g/t for Erlistoun, 0.5 g/t for Rosemont and 0.5-2.0 g/t for Satellite |
(157) |
| As of June 30, 2013 |
(158) |
| Estimated at a 2.0 g/t gold cut-off using a gold price of A$1450 |
(159) |
| As of June 30, 2012 |
(160) |
| Admiral Hill Mineral Resources calculated at a 0.3 g/t Au cut-off |
(161) |
| Castaway Mineral Resources calculated at a 0.5 g/t Au cut-off |
(162) |
| As of June 30, 2012 |
(163) |
| Cockburn Mineral Resource as of 2011: A$2000/oz pit shell; Corboys Mineral Resource as of 2010; Challenger Mineral Resource estimate as of 2012; Cockburn UG Mineral Resource as of 2011 beneath A$2000/oz pit shell |
(164) |
| As of December 31, 2012 |
(165) |
| Mineral Reserves Au cut-off: HBJ - 0.5/0.9/1.0 g/t; HBJ Underground - 1g/t; Mt Martin - 0.5g/t; Pernatty - 0.5/1.0 g/t; Mt Marion - 1.0 g/t |
(166) |
| Mineral Resource for White Dam (which is depleted to Jan 2012) was re-estimated Oct 2010 at cut-off of 0.3 g/t |
(167) |
| Vertigo Mineral Resource depleted to end of mining in May 2012 |
(168) |
| As of June 12, 2013 |
(169) |
| cut-off of 0.5 g/t Au for potential open pit and 3.0 g/t Au for underground mineable Mineral Resources |
(170) |
| As of October 2013 |
(171) |
| Mineral Resources reported at an 0.5 g/t Au cut-off |
(172) |
| As of December 31, 2012 |
(173) |
| Assumes a 0.4 g/t Au cut-off for open pit, 3.0 g/t Au cut-off for underground using A$1350/oz Au gold price |
(174) |
| As of April 2013 |
(175) |
| Mineral Resources assumes a 0.5 g/t Au cut-off grade |
(176) |
| As of June 30, 2013 |
(177) |
| No gold price or cut-off assumptions disclosed |
(178) |
| As of June 30, 2013 |
(179) |
| Mineral Resources assumes an open pit cut-off of 0.8 g/t Au and underground cut-off of 2.0 g/t Au |
(180) |
| Wiluna Mineral Resource as of June 30, 2012, Matilda Mineral Resource as of January 20, 2014 |
(181) |
| Wiluna Au Mineral Resource cut-off grades vary from 0.5 g/t for Indicated & Inferred oxide material and 2g/t for Indicated transition and fresh material |
(182) |
| Matilda Mineral Resource has been reported at a 0.75 g/t cut-off above 200m depth and at a 2 g/t cut-off below 200m depth |
(183) |
| Mineral Resources are the addition of Palmarejo, Guadalupe and La Patria and assume $1600/oz Au and $29/oz Ag |
(184) |
| As of December 31, 2012 |
(185) |
| Au cut-off grades: Sabodala, Masato, Goluma, Kerekounda & Somigol: 0.2 g/t oxide & 0.35 g/t fresh; Niakifiri 0.3 g/t oxide & 0.5 g/t fresh; Gora 0.5 g/t; Niakifiri West & Soukhoto 0.3 g/t; Diadiako is 0.2 g/t |
(186) |
| Mineral Resources assume a gold price of $1400/oz Au |
(187) |
| Mineral Resources assume $1,400/oz Au |
(188) |
| As of April 30, 2013 |
(189) |
| Mineral Resource assumes a cut-off of 0.4 g/t |
(190) |
| Mineral Resources assumes $1,400/oz gold and $24.00/oz silver and a cut-off of 0.1 g/t AuEq for open pit oxide and 0.3 g/t AuEq open pit sulphide resources |
(191) |
| As of August 2013 |
(192) |
| Gold Mineral Resources are declared at a cut-off grade of 3.0 g/t Au; Mineral Resources for the E9EC contain Uranium and are therefore estimated at a gold equivalent cut-off of 3.4 g/t |
(193) |
| Mineral Resources are estimated using a 1.0 g/t AuEq cut-off |
(194) |
| As of December 31, 2012 |
(195) |
| Mineral Resource inside a pit shell defined by $2.60/lbs copper and cut-off grade of 0.15% copper |
(196) |
| As of December 31, 2011 |
(197) |
| Mineral Resources converted to 100% basis from La Mancha’s 45.9% attributable share |
(198) |
| As of December 31, 2011 |
(199) |
| As of December 31, 2012 |
(200) |
| Mineral Resource for Agi Dagi are estimated using: US$1500/oz Au; US$28.00/oz Ag; and 0.20 g/t Au cut-off |
(201) |
| Mineral Resource for Camyurt are estimated using: US$1250/oz Au; 60:1 Ag:Au ratio and a 0.20 g/t Au cut-off |
(202) |
| Metal prices used were $12.50/oz Ag & $650/oz Au |
(203) |
| As of January 31, 2011 |
(204) |
| Mineral Resources assumes a cut-off of 0.33 g/t |
(205) |
| As of October 2011 |
(206) |
| Mineral Resources assumes a cut-off grade of 1 g/t Au |
(207) |
| Mineral Resources assumes a cut-off grade of 0.5 g/t |
(208) |
| As of March 1, 2012 |
(209) |
| Mineral Resource assumes $1.50/lb Cu and a 0.30% Cu cut-off |
(210) |
| As of April 18, 2013 |
(211) |
| Mineral Resources calculated at a cut-off of 0.6 g/t Au |
(212) |
| As of October 30, 2012 |
(213) |
| Assumes a 0.3% CuEq cut-off for sulphides; 0.2 g/t gold cut-off for oxides |
(214) |
| CuEq calculated using $2.00/lb Cu, $800/oz Au, $12.00/lb Mo |
(215) |
| As of October 2008 |
(216) |
| Mineral Resource assumes 0.5 g/t Au cut-off on the Ojo de Agua deposit only |
(217) |
| As of December 31, 2010 |
(218) |
| Mineral Resources estimated using $2.50/lb Cu, $7.00/lb Ni, $1,500/oz Pt, $400/oz Pd and $1,000/oz Au |
(219) |
| As of September 30, 2013 based on Lonmin Plc disclosure |
(220) |
| Mineral Resources calculated from Lonmin Plc 34.85% attributable interest |
(221) |
| As of December 31, 2012 |
(222) |
| Mineral Resources reported at a cut-off of 0.5% CuEq for Osborne open pit and 1.2% CuEq for Osborne and Kulthor underground where CuEq = Cu(%) + Au(g/t) *0.6 |
(223) |
| As of July 17, 2012 |
(224) |
| Mineral Resource cut-off: Oxides 0.10% CuEq; Sulfide 0.15% CuEq; and mixed 0.3% CuEq (CuEq based on $2.50/lb Cu, $15/lb Mo & $20/oz Ag) |
(225) |
| As of October 30, 2012 |
(226) |
| Assumes a 0.3% CuEq cut-off for sulphides; 0.2 g/t gold cut-off for oxides |
(227) |
| CuEq calculated using $2.00/lb Cu, $800/oz Au, $12.00/lb Mo |
(228) |
| As of December 31, 2010 |
(229) |
| Mineral Resources reported above a cut-off of 1.24 recoverable lbs Cu per ton assuming $1,000/oz Au and $2.50/lb Cu |
(230) |
| As of December 13, 2013 |
(231) |
| Mineral Resource estimated using a cut-off of 0.3% CuEq where CuEq (%) = CuT (%) + 4.95 x Mo (%) where 4.95 represents the Mo/Cu price ratio |
(232) |
| As of June 30, 2013 |
(233) |
| Mineral Resources calculated at a cut-off grade 0.35% Ni |
(234) |
| As of December 31, 2012 |
(235) |
| Mineral Resource assumes a cut-off grade of 1.2% Ni |
(236) |
| Franco-Nevada’s royalties may not cover the entire property or cover all known Mineral Reserves and Mineral Resources over the assets in its portfolio. Management has used its best judgment based on information available to it to estimate the percentage covered by the royalty or stream interest, where applicable. The percentages have not been reviewed or endorsed by the operators of the projects. |
Gold Assets
Gold — United States
Goldstrike, Nevada
Franco-Nevada holds royalties covering the majority of the Goldstrike complex operated by Barrick. The Goldstrike complex is located on the Carlin Trend, about 60 km northwest of the town of Elko, Nevada. The Goldstrike complex includes the open-pit Betze-Post mine, as well as the underground operations of Meikle and Rodeo immediately to the north. Mining activity commenced on the property in 1976 and, since 1986, has been operated by Barrick. Barrick reported that the Goldstrike complex produced 892,000 ounces of gold in 2013, down from 1,174,000 ounces in 2012.
Franco-Nevada holds NSR (2-4%) and NPI (2.4-6%) royalties at Goldstrike covering the majority, but not all of the reported Mineral Reserves and Mineral Resources. Included is low grade ore that has been stockpiled for later processing. The royalties vary depending on the claim blocks, as shown in the figure. As a result, royalty payments can vary substantially on a quarterly basis, depending on mine sequencing and waste stripping. The timing of capital investments can also impact the timing of the payment of profit royalties.
Goldstrike is a mature mining operation but remains one of Barrick’s five core mines. Overall production rates declined in 2013 impacting Franco-Nevada’s NSR and Barrick expects Goldstrike to produce 865-915,000 ounces in 2014 at an all-in sustaining cost of $920-$950 per ounce, slightly higher than 2013 levels. At the same time, increased capital spending has also reduced Franco-Nevada’s NPI in recent periods. The autoclave facility is undergoing modifications that will enable Goldstrike to bring forward about 4,000,000 ounces of production. Barrick expects the modified autoclaves to contribute about 350-450,000 ounces of annual production in their first full five years of operation. Production is anticipated by Barrick to increase to above 1,000,000 ounces in 2015 with a full year of operation from the modified autoclaves.
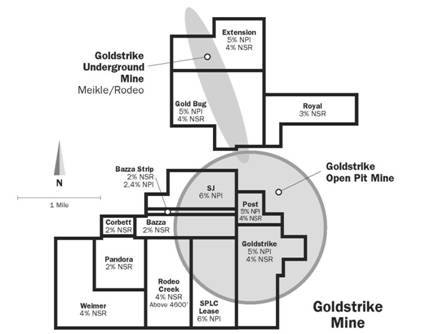
Gold Quarry, Nevada
The Gold Quarry operation is part of Newmont’s Carlin operations in north-central Nevada. It is a large open pit mine that has been in production since 1985 supplying ore as part of an integrated mining complex with different mines supplying variable ore types and grades to a variety of processing facilities situated throughout the complex. Newmont has significant milling and roasting processing infrastructure immediately east of the Gold Quarry pit. Newmont currently reports Mineral Reserves and production numbers by area and does not publicly quote separate Gold Quarry numbers.
Franco-Nevada’s royalty interest covers only a portion of the Gold Quarry property as shown in the schematic. The Gold Quarry royalty is a 7.29% NSR based on production or on different annual minimum royalty payment obligations tied to MineralReserves and stockpiles attributed to the Gold Quarry royalty property. Based on reserve related minimum royalty provisions, Franco-Nevada expects to receive on average at least 11,250 gold royalty ounces per annum. Newmont has reported that Gold Quarry produces an average of 500,000 ounces per year. In 2013, Franco-Nevada received 14,334 ounces based on the minimum royalty provisions.
Gold Quarry completed mining in the Phase 4 layback in 2013 and began mining the Phase 7 layback in 2013. Phase 7 is expected to be mined for six to seven years. Mine life is now estimated, by Newmont, to extend to 2028.
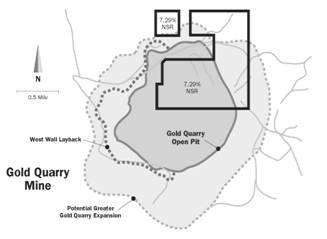
Marigold, Nevada
The Marigold mine is located approximately 64 km southeast of Winnemucca, Nevada. The mine has been in continuous production since 1988. Ore is mined by conventional truck and shovel equipment and processed via a large run-of-mine heap leach operation with 40,000 tonnes per day (“tpd”) capacity. Franco-Nevada has various royalties on the operation (1.75-5% NSR and 0.5-4% GR), as shown in the schematic, together covering almost all of the current mineral reserve base. Franco-Nevada’s original royalties were acquired in connection with its IPO and, in December 2009, additional royalties covering alternate sections were added. Each full section covers one square mile.
The operators reported production of 162,000 ounces in 2013 compared to 144,000 ounces produced in 2012. Mining focused on the Target 2 Phase 1 pit and mining into the top of the ore body in the Mackay Phase 1 pit. It is expected that the Mackay pit is where ore will be primarily sourced in 2014.
Marigold is currently operated by a joint venture between Goldcorp Inc. (“Goldcorp”) (66.7%) and Barrick (33.3%). On February 4, 2014, Goldcorp and Barrick announced an agreement to sell Marigold to Silver Standard Resources Inc. for $275 million. The sale of Marigold is expected to close in April 2014.
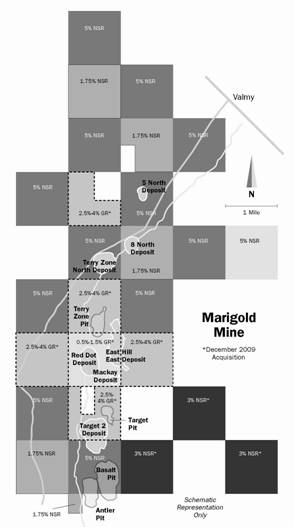
Fire Creek/Midas, Nevada
In February 2014, Franco-Nevada assisted Klondex in the acquisition of the Midas mine and milling facility located in Nevada from Newmont. Franco-Nevada paid $35 million for a prepaid gold purchase arrangement for 38,250 ounces of gold to be delivered by December 31, 2018 and a 2.5% NSR royalty on the Fire Creek and Midas properties commencing in 2019. Under the terms of the agreement, prepaid gold purchase deliveries will be made at the end of each month with the first delivery due on June 30, 2014. The annualized delivery schedule is: 6,750 ounces in 2014; 7,500 ounces in 2015; 8,000 ounces in each of 2016, 2017 and 2018.
Klondex purchased the Midas mill to provide it with processing capacity for its Fire Creek ores, which are located 112 miles south (via highway and roadways) of Midas, while providing the option to potentially extend mine life at Midas. The Fire Creek property is located in north central Nevada, situated at the cross-section of the Northern Nevada Rift and the Battle Mountain Trend and is a high-grade epithermal gold deposit. The property consists of a combination of private fee land and U.S. Bureau of Land Management (“BLM”) land for a total area of approximately 11,208 acres.
Midas was found and constructed by Franco-Nevada’s predecessor company prior to its combination with Newmont, and has produced 2,200,000 ounces of gold and 27,000,000 ounces of silver over its 14 year mine life. Midas has remaining mineral resources with numerous targets for mineral resource expansion.
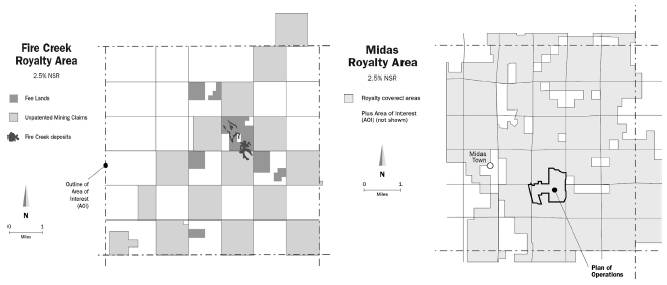
Bald Mountain, Nevada
The Bald Mountain mine lies within the Southern Ruby Mountains of northeastern Nevada, approximately 110 km southeast of Elko. Bald Mountain is operated by Barrick and ore is sourced from multiple open pits over an estimated 150,000 acre property. Processing is done at multiple conventional heap leaching facilities. Bald Mountain is the largest mine site by area in the U.S. It stretches 40 km north to south and 16 km east to west with the north and south areas being 19 km apart. Bald Mountain is working with the BLM to consolidate the site into two plans of operation, so that the site can expand. The expansion plans were submitted to the BLM in October 2011, with the final Environmental Impact Study not expected until 2015.
Franco-Nevada’s Bald Mountain royalties cover a significant portion, but not all, of the Bald Mountain property. Franco-Nevada holds various revenue royalties on the property depending on the claim groups, ranging from 0.875% to 5% NSR/GR. A detailed map of our royalties is shown in the schematic.
After the 2013 third quarter, Barrick announced changes to its mine plan, to reduce the number of pits and focus on the most profitable ounces, while retaining the option to access other ore in the future. Barrick reported that production at Bald Mountain decreased by 42% from 2012 to 94,000 ounces of gold in 2013, mainly due to a decline in ore tons placed on the leach pads as the mine went through a significant development phase in 2013. Bald Mountain is expected to be a long-term, stable producer for Franco-Nevada.
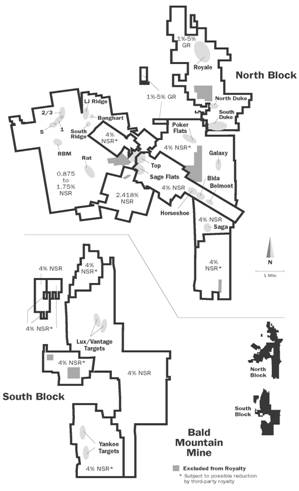
Mesquite, California
Mesquite is a gold operation located in south-east California approximately 70 km northwest of Yuma, Arizona and 230 km east of San Diego, California. The mine is an open pit, run-of-mine, heap leach operation. It was originally started in 1986 and then re-started in January 2008 by Western Goldfields Inc., a predecessor company of New Gold Inc. (“New Gold”). Franco-Nevada holds royalties on the entire Mesquite mine property that range from a 0.5% to 2% NSR, depending on the claim block, as shown by the schematic.
New Gold reported 2013 production of 107,000 ounces of gold, which was down from 142,000 ounces in 2012. Mesquite’s 2013 operational results were impacted by lower than anticipated grades being mined and processed. With average gold grades scheduled to increase compared to 2013, gold production is expected to be approximately 10% higher in 2014 to 113-123,000 ounces. The higher grades will be partially offset by lower ore tonnes placed on the pad as mining moves into a new area of the pit in 2014, resulting in a higher stripping ratio for this year.
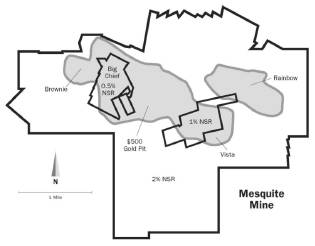
Golden Meadows, Idaho
In May 2013, Midas Gold agreed to sell to Franco-Nevada a newly created 1.7% NSR on the future gold production from Midas Gold’s Golden Meadows project in Idaho for $15.0 million. The agreement is subject to an option by Midas Gold to re-acquire one-third of the royalty for $9.0 million which expires on May 9, 2016. As part of the transaction, Franco-Nevada also subscribed for 2,000,000 Midas Gold common share purchase warrants having an exercise price of C$1.23 per warrant and a ten year term.
The Golden Meadows project covers a district that has been mined intermittently for gold, antimony and tungsten from 1925 to 1997. The property lies about 153 km northeast of Boise, Idaho. Midas Gold has consolidated 10,698 hectares of unpatented and patented claims. The project comprises three open pit deposits including Hangar Flats, Yellow Pine and West End. Midas Gold is currently in the permitting stage for its Golden Meadows project.
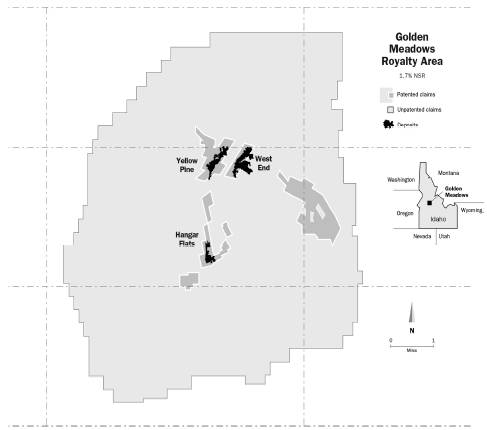
Gold — Canada
Sudbury (Gold), Ontario
Please refer to “PGM Assets — Sudbury (PGM), Ontario” for an asset description.
Golden Highway, Ontario
Franco-Nevada has multiple NSR royalties ranging from 0.25-15% over the Destor-Porcupine mineral trend just east of Timmins, Ontario spread over more than 120 km. Highway 101 that parallels this trend is referred to as the “Golden Highway” therefore Franco-Nevada has grouped together several producing royalties and development projects under this one title. Most of the properties are owned and operated by St Andrew Goldfields Ltd. (“St Andrew”) and ore is processed through a central milling complex. Production in 2013 of 99,548 ounces was slightly higher than production of 95,600 ounces in 2012. For 2014, St Andrew expects to produce between 75,000-85,000 ounces, however it anticipates production increasing to approximately 100,000 ounces in 2015 with exploration and technical work conducted in 2014.
Holt: The Holt property is immediately south of the Holloway mine and consists of the Holt mill complex and the Holt mine. Franco-Nevada has a sliding scale NSR royalty beginning at 2% when the gold price is less than or equal to $500/ounce and increasing in 1% increments for each $100/ounce increase in the gold price, to a maximum of 10%. St Andrew re-started operations at the Holt mine in 2011. Holt produced 58,898 ounces or approximately 59% of total St Andrew production in 2013.
Holloway: Franco-Nevada has a sliding scale NSR royalty of 2% if the price of gold is less than $800/ounce, increasing by 1% for every $100/ounce increase in the price of gold, up to a maximum of 15%. St Andrew re-started production at the Holloway mine in 2009. Holloway produced 21,147 ounces or approximately 21% of total St Andrew production in 2013.
Hislop: The Hislop property is located approximately 50 km to the west of the Holt mill where ore is trucked for processing. Franco-Nevada has a 4% NSR royalty on the Hislop property which includes minimum royalty payment commitments. St Andrew brought the Hislop open pit mine into production in the third quarter of 2010. Hislop produced 19,321 ounces or approximately 19% of total St Andrew production in 2013.
In addition, Franco-Nevada has royalties on St Andrew’s Taylor project (1% NSR) and the Aquarius deposit (1-2% NSR). St Andrew believes that the best strategy moving forward is focusing on the advanced exploration at Taylor, which includes ramp development and extraction of a second bulk sample located at depth.
Detour Lake, Ontario
Franco-Nevada has a 2% NSR royalty that covers all reported mineral resources at the Detour Lake mine which is located 185 km northeast from the town of Cochrane, Ontario. Detour Gold Corporation (“Detour”) is the operator. Placer Dome Inc. operated a mine on the property from 1983 through 1999 and has reported that it produced approximately 1,800,000 ounces of gold.
The new mine poured its first gold in February 2013 and declared commercial production on August 12, 2013. Detour produced 232,287 ounces in 2013 which is expected to increase to a range of 450,000 to 500,000 ounces in 2014. Longer term production is expected to increase to a life of mine average of approximately 660,000 ounces over a mine life of over 21 years based on an update provided by Detour in February 2014.
Longer term, the Block A project (consolidated with the purchase by Detour of Trade Winds Ventures Inc.) could add additional growth given the current resources on that portion of the property. In addition, two main gold structures cover the combined property with a total strike length of over 80 km. Franco-Nevada added to its interest in the area in 2013 with the purchase of the Gowest royalty, a 1% royalty on a parcel of land located to the west of the current operation.
Musselwhite, Ontario
Franco-Nevada has a 5% NPI royalty that covers all of the original leased lands at Goldcorp’s Musselwhite operation located in northwestern Ontario, 480 km north of Thunder Bay. The royalty also covers an area of interest surrounding the property as shown in the schematic. The mine is a fly-in/fly-out underground operation which began operating in April 1997 and has produced in excess of 3,000,000 ounces of gold.
Franco-Nevada received its first payment under the NPI royalty in 2011 as the mine had then recovered all historical capital and operational costs. The operation produced 256,300 ounces in 2013 compared to 239,200 ounces in 2012. Goldcorp is forecasting production between 230-240,000 ounces in 2014. While production is down slightly year over year, Goldcorp has stated that forecasted all-in costs should be lower which should positively impact the NPI payment.
In 2013, drilling continued to explore the Upper Lynx, PQ Deeps and West Limb targets with encouraging results from both the Upper Lynx and West Limb drilling. The C-Block of the PQ Deeps was extended to the north by 150 meters.
Hemlo, Ontario
The Hemlo gold camp has been producing gold for over 25 years and is located just off the Trans-Canada highway near Marathon, Ontario. Barrick is the operator and manages both the open-pit and underground operations. Franco-Nevada has both a 3% NSR royalty and a 50% NPI royalty on a portion of the western down-dip underground extension of the Hemlo ore-body as shown in the longitudinal schematic.
Initial mining on the royalty property began in late 2008, but revenues were limited to the 3% NSR royalty. The 50% NPI portion of the royalty began paying in third quarter 2012 once the upfront capital costs had been recovered by the operator. Franco-Nevada received a significant payment from the NPI in 2012. However, NPI payments are highly dependent on the timing of capital spending as well as the prevailing gold price and thus declined in 2013 with the fall in the gold price.
Barrick reported that production in 2013 was 204,000 ounces of gold from the entire Hemlo operation, a similar production rate to the 206,000 ounces the mine produced in 2012. Barrick does not break-out production guidance for Hemlo.
Kirkland Lake, Ontario
Franco-Nevada has various royalties covering over 25 km of the Larder Lake and Main Breaks in the historic Kirkland Lake gold camp of Ontario. Kirkland Lake operates the Macassa mine and has recently discovered and started mining the high grade South Mine Complex (“SMC”).
In 2013, Franco-Nevada added an overlying 2.5% NSR on Kirkland Lake’s properties including the Macassa mine for $50 million. In addition to the new royalty, which covers all of Kirkland Lake’s land, immediately to the south-west of the SMC, Franco-Nevada has a 20% profit-based royalty as shown in the inset of the schematic. Franco-Nevada also has a 2-3% NSR royalty on claims that Kirkland Lake purchased from Queenston Mining Inc. (“Queenston”) in July 2012, as well as a 2% NSR royalty on a number of other claims held by Osisko Mining Corporation (“Osisko”) which acquired Queenston in December 2012.
Kirkland Lake has recently completed a multi-year capital program and expects continued production growth in the following years. All of this production is covered by the 2.5% NSR. In addition, Kirkland Lake has developed the SMC onto the 20% NPI royalty claims and is processing some of this material. The first profit royalty payments were made to Franco-Nevada in late 2011. Kirkland Lake has reported additional high grade intercepts on the royalty claims as far as 600 metres west of initial mining. Franco-Nevada expects that more intermittent mining will be undertaken on the NPI royalty claims as Kirkland Lake expands production. Given the land position and historic mining in the area, Franco-Nevada believes that there will be continued exploration success from both Kirkland Lake and Osisko.
Timmins West, Ontario
Franco-Nevada acquired a 2.25% NSR royalty on Lake Shore’s Timmins West property in February 2012. The royalty covers a large land package to the west of the City of Timmins, Ontario which hosts the Timmins and Thunder Creek deposits as well as the Gold River Trend and 144 exploration zones to the south.
In the third quarter 2013, Lake Shore completed its mill expansion which increased capacity to 3,000 tpd from 2,000 tpd. With the increased milling capacity, Lake Shore reported that, for 2014, production from the Timmins West Mine is targeted at greater than 130,000 ounces versus 107,100 ounces produced in 2013. Lake Shore is exploring the potential for a future expansion which could include increasing the crushing and grinding circuit to handle 5,500 tpd.
Lake Shore continues to explore at its most advanced exploration targets, the Gold River Trend and the 144 Zone. The Gold River deposit has a small Indicated Resource and an Inferred Resource over 1,000,000 ounces (5.3 Mt @ 6.06 g/t) and Lake Shore has released several positive drill results from the 144 Zone. Given the significant land package, Franco-Nevada expects that Lake Shore will be able to add to existing Mineral Reserves and Mineral Resources.
Gold — Australia
Duketon, Western Australia
Franco-Nevada has a 2% NSR royalty that covers 267,819 hectares of the Duketon gold project in Western Australia. The project is operated by Regis and includes ten deposits at various stages of development. The royalty covers all known Mineral Reserves and Mineral Resources, except for a portion of the Erlistoun Deposit.
Moolart Well: This deposit has been in production since August 2010. Moolart Well has a 2.6 Mtpa plant and Regis has forecasted average annual production of approximately 90,000 ounces of gold over its remaining 4 year mine life. Regis reported 2013 production of 104,000 ounces of gold.
Garden Well: This deposit has been in production since September 2012. Garden Well has a 4 Mtpa plant, 7 year remaining mine life, with forecast average annual gold production of 200-220,000 ounces. In 2013, Regis reported gold production of 176,000 ounces.
Rosemont: Regis completed Stage 1 construction of a 1.5 Mtpa crushing, grinding and pumping operation at the Rosemont project site in October 2013. Milled ore product is piped 10 km in a slurry form for leaching in the Garden Well carbon-in-leach (“CIL”) circuit. Regis has commenced Stage 2 construction and expects to expand capacity to 2 Mtpa with production ramping up to 100,000 ounces per year in second quarter 2014. Rosemont has an 8 year mine life, with forecast average annual gold production of 80-100,000 ounces. Regis reported 2013 production of 8,000 ounces of gold.
Erlistoun: Regis has announced that it was able to re-optimize the reserve study at Erlistoun to reflect the shorter haulage distance to Garden Well which is 7 km away, rather than trucking the ore to Moolart Well which is 45 km away. Regis has estimated that 89% of Erlistoun Mineral Reserves are covered by Franco-Nevada’s royalty.
On February 20, 2014, Regis announced that a major rainfall resulted in extensive flooding at Duketon. Open pit mining at Garden Well and Rosemont will be suspended for 4-6 weeks, and the processing plants will be fed from stockpiles. Interim mining operations in available pit areas will then commence, with full normal mining operations expected to resume in May 2014 at Rosemont and July 2014 at Garden Well. Operations continue uninterrupted at Moolart Well.
Henty, Tasmania
Franco-Nevada holds a 10% gross royalty on certain claims and a 1% gross royalty on the balance of the claims at the Henty Gold Mine located in northwest Tasmania operated by Unity Mining Limited (“Unity”). All current production, Mineral Reserves and Mineral Resources are on property subject to Franco-Nevada’s royalties which cover 1,458 hectares.
Henty is an underground gold mine that has been in continuous production since 1996. Unity has reported that the mine has historically produced 1,300,000 ounces of gold. Ownership has changed multiple times during this period. Revenues to Franco-Nevada have decreased in recent years due to the decreased share of production from the 10% royalty ground. Unity reported that in 2013, Henty produced 44,000 ounces of gold. While Unity has reported that it expects to maintain the current production rate in the future, Franco-Nevada expects its revenue to decline as a higher share of production is sourced from the 1% royalty area. The largest contributor to mineral resource additions in recent years has been from the 1% royalty area.
As part of its acquisition of a portfolio of approximately 20 royalties from Barrick and effective July 1, 2013, Franco-Nevada acquired a production payment royalty of A$10-40/ounce of gold, covering the Henty Gold Mine tenements, but excluding the core areas of underground development. The production payment royalty is capped at A$22 million and expires on July 10, 2019. Historic royalty payments to July 1, 2013 total A$200,000. During the six months ended December 31, 2013, there was no production at Henty subject to this production payment royalty.
Gold — Rest of World
Palmarejo, Mexico
In January 2009, Franco-Nevada acquired a 50% gold stream on the Palmarejo gold and silver mine located in Chihuahua Province, Mexico. Palmarejo is owned and operated by Coeur. The project includes open pits, an underground mine and processing facilities. Production began in 2009 and to date has been limited to the Palmarejo deposits.
Franco-Nevada receives 50% of the gold produced from the Palmarejo mine and makes ongoing payments equal to the lesser of $400/ounce of payable gold (subject to a 1% inflation adjustment starting after 4 years) and the then prevailing spot price for gold. The attributable ounces are the greater of actual production and a minimum amount of 50,000 ounces per year until payments have been made on 400,000 ounces. By the end of 2013, Coeur had paid Franco-Nevada just over 266,600 ounces of gold of the 400,000 ounce minimum. For 2014, Coeur expects to produce 87,000-95,000 ounces of gold at Palmarejo.
Coeur holds an extensive land position with multiple prospects. Coeur has previously reported on development efforts at the nearby Guadalupe deposit as a possible underground mine, however, with lower precious metals prices, Coeur announced that development was suspended in the third quarter 2013.
Please see the section headed “Technical Reports — Palmarejo Mining and Technical Information” for further information in respect of the Palmarejo project.
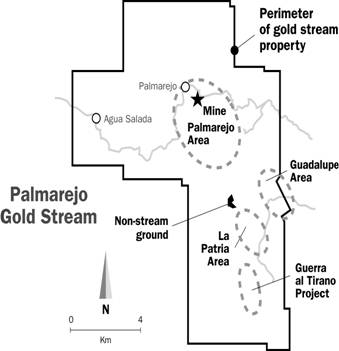
MWS, South Africa
MWS is a gold and uranium tailings recovery operation located near Stilfontein, approximately 160 km west of Johannesburg, South Africa. The operation processes multiple tailings dumps in the area through three production modules, the last of which was commissioned in 2011. It also includes a modern tailings storage facility approximately 15 km from the gold plant.
Franco-Nevada receives 25% of the gold produced from the MWS dumps and makes ongoing payments equal to the lesser of $400/ounce of payable gold (subject to a 1% inflation adjustment starting after 4 years) and the then prevailing spot price for gold. Franco-Nevada acquired its interest in MWS as a result of its acquisition of Gold Wheaton in March 2011.
AngloGold Ashanti purchased the operation from First Uranium Corporation in July 2012. As part of the AngloGold Ashanti purchase, Franco-Nevada amended the agreement and is now entitled to receive 25% of all the gold produced through the MWS plant including treatment of AngloGold Ashanti’s tailings until Franco-Nevada has received 312,500 ounces of gold, starting on January 1, 2012 (the prior agreement had no production cap). In 2013, Franco-Nevada received 25,496 ounces of gold and 45,314 of the 312,500 ounce cap since the amendment of the agreement.
In the first quarter 2014, AngloGold Ashanti anticipates that MWS will produce uranium after commissioning of the uranium plant. This is expected to increase gold recoveries.
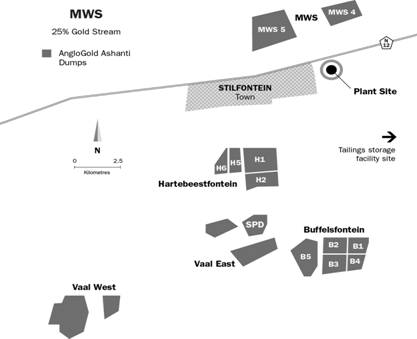
Sabodala, Senegal
In December 2013, Franco-Nevada provided Teranga with $135 million to fund the acquisition by Teranga of the remaining interests of the Oromin Joint Venture (“OJVG”). The OJVG owned the adjacent property which hosts several deposits representing future ore sources for Teranga’s neighbouring Sabodala mill.
Under terms of the agreement between Franco-Nevada and Teranga, Teranga will deliver 22,500 ounces of gold annually over the first six years of the agreement. Following delivery of 135,000 ounces of gold, Franco-Nevada will receive 6% of gold production that is sourced from either the Sabodala or OJVG properties. Franco-Nevada will make ongoing payments for each ounce of gold delivered equal to 20% of the spot gold price.
The combination of Sabodala and the OJVG satellite deposits is expected to allow Teranga to reach its phase 1 growth objective of 250-350,000 ounces of annual gold production leveraging off of its existing mill and infrastructure. In addition to existing mine and mill facilities, Teranga now controls a sizable land package of 1,055 km2 which includes much of a 70 km strike length along a prospective greenstone belt.
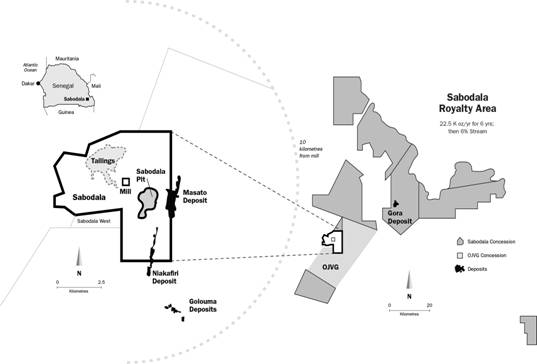
Subika, Ghana
Franco-Nevada has a 2% NSR royalty which covers a 78 km2 area over the Subika deposit at the southern end of Newmont’s Ahafo project in Ghana (shown in the schematic). Franco-Nevada’s royalty is believed to cover most, if not all, of the Subika open pit as well as a majority of the Subika underground mineralization identified to date. The royalty first became payable to Franco-Nevada in third quarter 2012.
Ahafo produced 570,000 ounces of gold in 2013 compared to 561,000 ounces in 2012. Newmont is forecasting 2014 production of 365-400,000 ounces of gold. According to Newmont, the lower anticipated production in 2014 is due to lower grades and a higher strip ratio which is anticipated to last the next two years. In September, as part of Newmont’s effort to improve business efficiency and cost cutting, Newmont announced that Ahafo would cut 300 jobs at the mine.
Newmont is currently studying expansion opportunities for the Ahafo project which may ultimately offset the decline in production. These include increasing the milling facility (potential to increase capacity from 8 Mtpa to 13 Mtpa) or further developing the Subika Underground deposit. Newmont may consider authorizing full funding for the mill expansion during 2014 subject to permit approval and attractive economic returns.
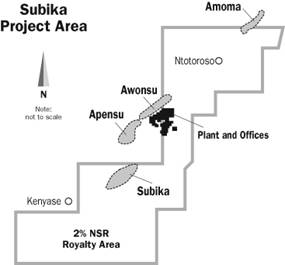
Tasiast, Mauritania
Franco-Nevada has a 2% NSR royalty on the Tasiast project operated by Kinross Gold Corporation (“Kinross”). Franco-Nevada’s royalty first became payable in third quarter 2011. Kinross acquired control of Tasiast in September 2010 pursuant to its acquisition of Red Back Mining Inc. The royalty originally covered three large permit areas in Mauritania, West Africa of which the most prominent is Tasiast with a currently reported mining license area of 312 km2 and a total exploration license area of 3,118 km2.
Kinross released an updated pre-feasibility study for Tasiast in April 2013 which concluded that a new 38,000 tpd mill would be expected to provide the optimum economics for an expanded project. This would replace the existing 8,000 tpd mill. A full feasibility study for the 38,000 tpd mill is expected to be presented in 2014. However, higher gold prices would likely be required to proceed.
In 2013, Tasiast produced 248,000 ounces of gold compared to 185,000 ounces of gold produced in 2012. The increased production was due to increased tonnes processed, higher grade and better recoveries. Kinross provides regional guidance and not individual asset guidance but did state that Tasiast should benefit from improved grades in 2014.
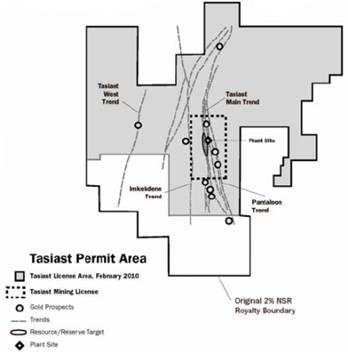
Edikan, Ghana
In 2011, Franco-Nevada acquired an effective 1.5% NSR royalty on Perseus’ Edikan gold mine in Ghana. Perseus has 650 km² of tenements centered on the Ashanti Gold Belt including two mining leases that are the focus of initial production. The property is located in close proximity to AngloGold Ashanti’s large Obuasi mine.
First gold production was achieved on August 21, 2011 and the mine achieved commercial production on January 1, 2012. In October 2013, Perseus released a revised mine plan for Edikan which estimated average gold production of 230,000 ounces per year from 2014 through 2024 at an all-in site cash cost of $937/oz. Perseus has provided production guidance for the first 6 months of 2014 of 99,000-109,000 ounces of gold.
Recently, minimal amounts were spent by Perseus on exploration activities in Ghana at the Edikan gold mine and on adjoining license areas as the focus remains on operation improvements and maintaining financial flexibility.
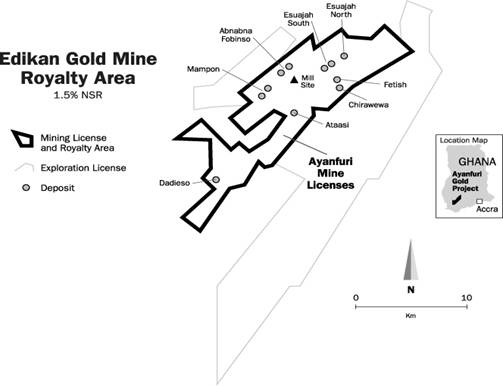
Cerro San Pedro, Mexico
Franco-Nevada has a 1.95% GR that covers most of the known mineralization on the Cerro San Pedro project operated by New Gold. Cerro San Pedro is located near San Luis Potosi in central Mexico. The project property is a gold-silver, open pit, run-of-mine heap leach operation and consists of 36 mining and exploration concessions totaling 78 km2 in the historic Cerro San Pedro mining district.
In 2013, the operation was impacted by a pit wall movement which reduced production to 102,800 ounces of gold in 2013 versus 137,600 ounces of gold produced in 2012. For 2014, New Gold expects further reductions to a range of 70-80,000 ounces of gold which reflects increased stripping and mining of lower grade ore. Silver production is expected to be down marginally to a range of 1.1-1.3 million ounces for 2014. The significant 2014 waste stripping campaign is expected to lower stripping requirements in 2015.
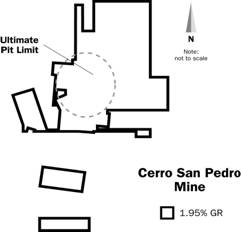
Cooke 4, South Africa
Cooke 4, which was formerly known as the Western Areas Gold Mine or Ezulwini, is an underground mine located near the town of Westonaria approximately 40 km west of Johannesburg, South Africa. The mine was re-opened in 2008. Facilities include shafts to access the Upper Elsberg and the Middle Elsberg reef horizons, ancillary infrastructure and surface gold and uranium plants with capacity of 200,000 tonnes per month (“tpm”) and 100,000 tpm respectively.
Franco-Nevada, as a result of its acquisition of Gold Wheaton, receives 7% of the gold produced from the Cooke 4 mine and makes ongoing payments equal to the lesser of $400/ounce of payable gold (subject to a 1% inflation adjustment starting after 4 years) and the then prevailing market price of gold. In 2011, Franco-Nevada benefited from a minimum stream delivery commitment of 19,500 ounces.
Gold One International Limited (“Gold One”) purchased the operation from First Uranium Corporation in 2012. The Cooke 4 operation is contiguous to Gold One’s Cooke Underground and Randfontein Surface operations and allows for the sharing of services between Cooke 4 and Cooke 1-3 facilities. In August 2013, Gold One announced that its West Rand assets, including Cooke 4, would be acquired by Sibanye Gold Limited (“Sibanye”). The transaction has not yet closed.
Franco-Nevada has been advised that Sibanye is exploring the potential to process ore from the other Cooke shafts at the Cooke 4 mill and while this ore will not be subject to the Franco-Nevada gold stream, it could improve the overall economics of the Cooke 4 operation. The Cooke 4 mill has ample capacity to treat additional ore. In 2013, 2,500 ounces of gold was delivered to Franco-Nevada’s account under the Cooke 4 stream agreement.
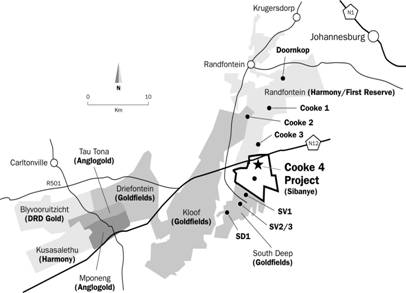
Cobre Panama, Panama
Franco-Nevada entered into an agreement with Inmet in August 2012 for a precious metals stream on the Cobre Panama copper project in Panama, one of the world’s largest copper-gold-silver-molybdenum porphyry deposits currently being constructed. Under the terms of the precious metals purchase agreement, Franco-Nevada will provide a $1 billion deposit to fund a portion of the Cobre Panama project capital costs. In 2013, Inmet was acquired by First Quantum which plans to advance the development of the Cobre Panama project. Franco-Nevada’s deposit will become available after First Quantum’s funding reaches $1 billion and funding of the deposit will be pro-rata on a 1:3 ratio of First Quantum’s share of the capital costs (First Quantum owns 80% of the project), up to a maximum of $1 billion. First Quantum has requested changes under the security and reporting requirements of the agreement. Franco-Nevada is considering changes to achieve a mutually beneficial outcome.
The amount of precious metals deliverable under the precious metals purchase agreement is indexed to the copper in concentrate produced from the entire project and approximates 86% of the expected payable precious metals attributable to First Quantum. Beyond the initially contemplated mine life, the precious metals deliverable under the agreement will be based on a fixed percentage of the precious metals in concentrate.
Following an extensive review of the project, First Quantum provided an update in January 2014. The revised project will have an initial installed capacity of 70 Mtpa which is higher than anticipated in the Inmet plan although first concentrate production is now only expected in fourth quarter 2017. The increased capacity is expected to deliver metal to Franco-Nevada at an increased rate which would be partially offset by the construction delay. The new plan envisions a 34 year mine life with potential further expansion from 70 Mtpa to 100 Mtpa after 10 years of operation.
Please see the section headed “Three-Year History — 2012 — Material Transaction Developments — Acquisition of Cobre Panama Precious Metals Stream” for further information in respect of Cobre Panama.
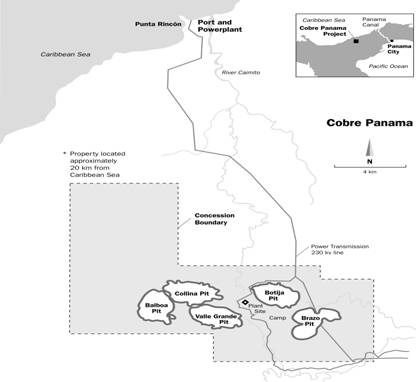
PGM Assets
Sudbury (PGM), Ontario
Franco-Nevada acquired three precious metals streams in the Sudbury basin of Ontario with its acquisition of Gold Wheaton on March 14, 2011. Franco-Nevada is entitled to purchase 50% of the precious metals contained in ore produced from the footwall portions of three separate mines in the Sudbury basin of Ontario and makes ongoing payments equal to the lesser of $400/ounce of payable gold (subject to a 1% inflation adjustment starting after 4 years) and the then prevailing spot price for gold. At the time of acquisition by Franco-Nevada, the mines were operated by Quadra FNX which was acquired by KGHM International Ltd. (“KGHM”) in March 2012.
The three mines are the Levack (Morrison deposit), Podolsky and McCreedy West mines. The footwall deposits are primarily rich in palladium followed by platinum and gold. The PGM revenues are reported separately from the gold revenues. KGHM does not have processing facilities in Sudbury and sells the ore to third parties for processing. The stream is calculated based on contained precious metals in the delivered ore rather than payable metals as is common in many royalty and stream arrangements.
Levack (Morrison deposit): The stream agreement applies to the Levack (Morrison deposit) which has been in production since 2007. In late 2011, Quadra FNX and Xstrata Nickel (“Xstrata”) entered into an agreement which allowed Quadra FNX to utilize the underground infrastructure of Xstrata’s Craig Mine. Rehabilitation of the shaft was completed in second quarter 2013 which led to higher production rates for the balance of the year. Drift access from the Craig shaft is expected to be completed in third quarter 2014 which should help improve the knowledge of the orebody and the deeper high grade portions of the Morrison deposit.
McCreedy West Mine: The stream agreement applies to the PM and 700 deposits at the McCreedy West mine which has been in production since 2003. In third quarter 2011, McCreedy West changed from mining copper and precious metal-rich ores in the PM deposit to mining contact nickel ores that are not applicable to the stream. In early 2014, KGHM announced it will cease production of contact nickel ores at McCreedy as Glencore had cancelled its off-take contract. Limited mining continues at the 700 deposit subject to the stream.
Podolsky Mine: The stream agreement applies to the 2000 and North deposits at the Podolsky mine which has been in operation since 2008. Podolsky was put on care and maintenance at the end of third quarter 2013.
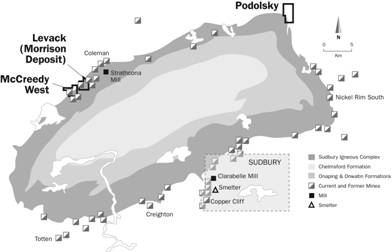
Stillwater, Montana
Stillwater Mining Company (“Stillwater”) owns and operates the Stillwater mine and the East Boulder mine in Montana (together, the “Stillwater Complex”). Production began in 1986 at the Stillwater mine and in 2002 at the East Boulder mine. Franco-Nevada has a 5% NSR royalty on all commercially recoverable metals produced from 813 of the 995 claims that cover the Stillwater Complex. The amount of the royalty is reduced by
permissible “onward processing” deductions, which have averaged 10-12% of revenue over the last several years.
Based on Franco-Nevada’s estimates, NSR royalty currently covers 80-85% of the Stillwater Mineral Reserves and Mineral Resources and 100% of the East Boulder Mineral Reserves and Mineral Resources. Historically, because of reliance on near-shaft stopes in the Stillwater mine, production has been sourced disproportionately from non-Franco-Nevada royalty ground however, in recent years, the percentage of Stillwater Complex production subject to Franco-Nevada’s royalty has increased, averaging approximately 85% since 2005.
Stillwater has reported 2013 mine production of 524,000 ounces of PGM, which exceeded Stillwater’s guidance for production of 505-515,000 ounces of PGM. For 2014, Stillwater anticipates production of approximately 520,000-535,000 ounces of PGM from the Stillwater Complex. Projecting beyond 2014, Stillwater expects first production from its Graham Creek project at the East Boulder Mine in third or fourth quarter 2014. In addition, Stillwater is initiating development of the Far West project, a new undeveloped mining area with attractive ore grades situated within the Stillwater Mine with production scheduled for 2017.
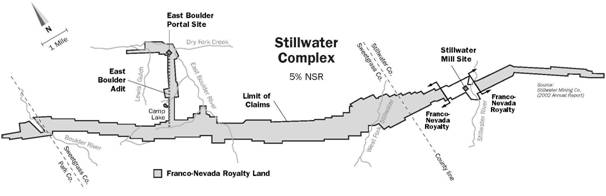
Other Minerals Assets
Peculiar Knob, South Australia
Franco-Nevada has a variable dollar per tonne royalty on the Peculiar Knob iron ore deposit located northwest of Prominent Hill in South Australia. The royalty rate is A$0.5985 multiplied by the percentage of iron ore content in ore shipped and also adjusted for movements in the iron ore index price from a base date of December 4, 2003. Franco-Nevada estimates this royalty to be comparable to a 2% gross royalty at current prices. Franco-Nevada’s royalty interest covers 251 hectares and includes all known Mineral Reserves and Mineral Resources of the Peculiar Knob iron ore deposit.
On October 10, 2012, Arrium Limited (“Arrium”) announced its first ore sale from Peculiar Knob and, on December 24, 2012, Arrium announced first ore shipped through Whyalla Port. On February 18, 2014, Arrium reported production from Peculiar Knob for 2013 of 3,232,000 tonnes iron ore processed (including 1,961,000 tonnes for the second half of 2013).
Royalties are paid quarterly on iron ore processed.
During July 2013, Arrium completed the Whyalla Port expansion from 6 Mtpa to 13 Mtpa, allowing Arrium to increase Peculiar Knob production rate to 3.6 Mtpa.
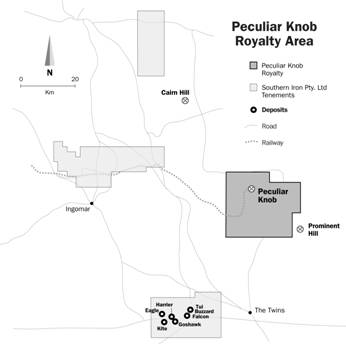
Exploration Assets
Franco-Nevada has interests in 153 exploration stage mineral properties as at March 19, 2014. By commodity, these include 130 gold exploration assets, 2 PGM exploration assets and 21 other minerals exploration assets. Exploration assets are speculative and unlikely to generate revenue to Franco-Nevada in the next five years, if ever. While some of these assets are associated with properties that have production, mineral reserves or mineral resources, Franco-Nevada’s exploration stage property interests are estimated to be outside known mineral resources or require mineral reserves or mineral resource additions to become economic. A good portion of the properties are inactive and may not see activity again. Some of the properties are in proximity to producing or advanced projects discussed above. Franco-Nevada has not visited or audited its full list of exploration assets and has relied on operator reports, public disclosures and title searches to determine which properties are in good standing. It is possible some properties may have lapsed. In early 2014, the following exploration assets were reclassified as advanced assets: Castle Mountain, in California and Monument Bay, in Manitoba.
The following table is a list of exploration assets of Franco-Nevada as at March 19, 2014. Assets that have had their terms or leases expire and have been written off are not listed. In 2013, Franco-Nevada wrote off 2 exploration royalty assets and removed them from its asset counts.
Exploration Assets as at March 19, 2014
Asset |
| Operator |
| Interest and %(1) | ||
UNITED STATES |
| Zeolites, Arizona |
| Zeox Corporation |
| $1.50/ton plus escalator (Clay) |
|
| Darwin, California |
| Project Darwin LLC |
| 5% NSR plus other (Au, etc.) |
|
| Santa Rosa, California |
| Sungro Minerals Inc. |
| 2% NSR; capped at $2M (Au, Ag, Zn, Cu, Pb) |
|
| Shoshone, California |
| Kenneth Henry, Tom Ver Hoef, Amargosa |
| 2% NSR (Au, Ag, Zn) |
|
| Cripple Creek, Colorado |
| Hondo Minerals, Inc. |
| 3% NSR (Au, Ag) |
|
| Golden Meadows, Idaho |
| Midas Gold Corp. |
| 1.7% NSR (Au) |
|
| Corbin Wickes, Montana |
| Elkhorn Goldfields LLC |
| 5% NSR (Au) |
|
| Elkhorn, Montana |
| Elkhorn Goldfields LLC |
| 1.1875% NSR (Au) |
|
| Forest Products (Tuxedo Mine), Montana |
| Beartooth Platinum Corp |
| 2% NSR (All Minerals) |
|
| Bald Mountain (White Pine), Nevada |
| Barrick Gold Corporation |
| 1-5% GR (Au) |
|
| Chukar Claims, Nevada |
| Tesoro Gold Company |
| 1.67% NSR (All Minerals) |
|
| Currant Creek, Nevada |
| Carlin Gold Corp. |
| 3% NSR (All Minerals) |
|
| Curtiss-Wright, Nevada |
| South Meadows Property Ltd. |
| 2% NSR (Au) |
|
| EaglePicher Diatomite II, Nevada |
| EP Minerals, LLC |
| $0.25/short ton plus other |
|
| Getchell, Nevada |
| Barrick Gold Corporation |
| 2% NSR (Au) |
|
| Goldstrike (Rodeo Creek), Nevada |
| Barrick Gold Corporation |
| 4% NSR; capped at $500K (Au, Ag) |
|
| Limousine Butte, Nevada |
| McEwen Mining Inc. |
| 1.5-2.5% NSR (Au) |
|
| Marigold (SAR), Nevada |
| Silver Standard Resources Inc. |
| 5% NSR (Au) |
|
| Marigold (Trout Creek), Nevada |
| Newmont Mining Corporation |
| 3% NSR (Au) |
|
| Mountain View, Nevada |
| Allied Nevada Gold Corp. |
| 1% NSR (All Minerals) |
|
| NMC/NGC Deeds Barium, Nevada |
| Barium, Inc. |
| 3% GP (All Precious Metals) |
|
| NMC/NGC Deeds Pacific Spar, Nevada |
| Pacific Spar Corp. |
| 3% GP (Au) |
|
| Preble, Nevada |
| Barrick Gold Corporation |
| 10% NP (Au) |
|
| Preble (Pinson Fee), Nevada |
| Barrick Gold Corporation |
| 1.5-7.5% NSR (Au, Ag) |
|
| Tonkin Springs, Nevada |
| McEwen Mining Inc. |
| 1-2% NSR (Au) |
|
| Willow Creek, Nevada |
| Carlin Gold Corp. |
| 1% NSR (All Minerals) |
|
| Boling Dome, Texas |
| Total E&P USA/H&L Newgulf |
| $0.0028225 per long ton (Sulfur) |
|
| Hobson Pearson, Texas |
| Bridge Oil |
| 20% OR (Uranium) |
|
| Texas Sulfur, Texas |
| Pacific Coast Mines, Inc. |
| 4% GR (Sulfur) |
|
| Kings Canyon, Utah |
| Geomark Exploration Ltd. |
| 4% NSR (Au) |
|
| Silver Bell, Utah |
| Unico, Inc. |
| 5% NSR plus other (Au, Cu, Pb, Zn) |
|
| Tintic, Utah |
| Keystone Surveys |
| 1% NSR (All Minerals) |
|
| Davy Crockett, Wyoming |
| Pathfinder Mines Corp. |
| 4% on FMV (Uranium) |
CANADA |
| Eskay Creek, British Columbia |
| Barrick Gold Corporation |
| 1% NSR (Au, Ag, Pb) |
|
| Myrtle Proserpine, British Columbia |
| Barkerville Gold Mines Ltd. |
| 3% NSR (All Minerals) |
|
| Red Mountain, British Columbia |
| Seabridge Gold Inc. |
| 1% NSR and Production Payments (All Minerals) |
|
| Tide, British Columbia |
| 0945473 B.C. Ltd. |
| 1.5% NSR (All Minerals) |
|
| Trout Lake (MAX Moly Mine), British Columbia |
| Roca Mines Inc. (Forty Two Metals Inc.) |
| 2.5% NSR (All Minerals) |
|
| Maverick 1 (Puffy Lake), Manitoba |
| Auriga Gold Corp. |
| 2-3% NSR (All Minerals) |
|
| Maverick 2 (Nokomis), Manitoba |
| Auriga Gold Corp. |
| 2-3% NSR (All Minerals) |
|
| Oxford Lake, Manitoba |
| Alto Ventures Ltd. |
| 1.5-2.5% NSR (All Minerals) |
|
| Clan Lake (Sito Lake), NWT |
| Tyhee Gold Corp. |
| 2-3% NSR (All Minerals) |
Asset |
| Operator |
| Interest and %(1) | ||
|
| Redstone (Coates Lake), NWT |
| Copper North Mining Corp. |
| 3-4% NSR (Cu, Ag) |
|
| Butler and Sanderson (Diagnos), Ontario |
| MacDonald Mines Exploration Ltd. |
| ROFR on Diagnos Royalty (Diamonds/Base Metals) |
|
| Catharine 1, Ontario |
| Canadian Exploration Services Limited |
| 1/3 of a 2-3% NSR (All Minerals) |
|
| Catharine 4, Ontario |
| Canadian Exploration Services Limited |
| 2-3% NSR (All Minerals) |
|
| Detour (Gowest), Ontario |
| Detour Gold Corporation |
| 1% NSR (All Minerals) |
|
| Detour (Mikwam), Ontario & Quebec |
| Alpha Minerals Inc. |
| 0.4824% NSR (All Minerals) |
|
| Golden Highway (Aquarius), Ontario |
| St Andrew Goldfields Ltd. |
| 1-2% NSR (All Minerals) |
|
| Golden Highway (Central Timmins), Ontario |
| St Andrew Goldfields Ltd. |
| 0-1% NSR (All Minerals) |
|
| Golden Highway (Stock), Ontario |
| Primero Mining Corp. |
| 1% NSR (All Minerals) |
|
| Golden Highway (Stoughton), Ontario |
| Harte Gold Corp. |
| 0.5-2.5% NSR (Au) |
|
| Golden Highway (Taylor), Ontario |
| St Andrew Goldfields Ltd. |
| 1% NSR (All Minerals) |
|
| Hemlo (JOA), Ontario |
| Beaufield Resources Inc. (Jiminex option) |
| 0.5-1% NSR (Au) |
|
| Kerrs Leases, Ontario |
| Sheltered Oak Resources Corp. |
| 1-2% NSR (Au) |
|
| Kirkland Lake (KLG 2% NSR), Ontario |
| Kirkland Lake Gold Inc. |
| 2% NSR (Au) |
|
| Kirkland Lake (KLG 2-3% NSR), Ontario |
| Kirkland Lake Gold Inc. |
| 2-3% NSR (Au) |
|
| Kirkland Lake (Osisko 2% NSR), Ontario |
| Osisko Mining Corporation |
| 2% NSR (Au) |
|
| Marathon PGM (Par Lake), Ontario |
| Stillwater Canada Inc. |
| 2% NSR (Pt, Pd) |
|
| Newman-Heyson (Madsen), Ontario |
| Sabina Gold & Silver Corp. |
| 1.5-2% NSR (All Minerals) |
|
| Newman-Todd, Ontario |
| Redstar Gold Corp. |
| 1.5-2% NSR (Au) |
|
| Red Lake (Skinner), Ontario |
| Sabina Gold & Silver Corp. |
| 1% NSR (All Minerals) |
|
| Shining Tree (Creso), Ontario |
| Creso Exploration Inc. |
| Option to acquire 2% NSR (All Minerals) |
|
| Shining Tree (Knight), Ontario |
| Bear Paw Resources Inc. |
| 2-3% NSR (Au) |
|
| Timmins (Cripple Creek), Ontario |
| Richmont Mines Inc. |
| 1.05-1.75% NSR (Au) |
|
| Timmins (Project 81), Ontario |
| Noble Mineral Exploration Inc. |
| Option to purchase 2.25% NSR (Au, Other Minerals) |
|
| Timmins (Sewell), Ontario |
| Richmont Mines Inc. |
| 1.5-2.5% NSR (Au) |
|
| Timmins (West Porcupine), Ontario |
| Trillium North Minerals Ltd. |
| 2% NSR (All Minerals) |
|
| Timmins (Whitney 1), Ontario |
| John Prochnau |
| 2.5% NSR (All Minerals) |
|
| Timmins (Whitney 2), Ontario |
| Goldcorp Inc. |
| 2.5% NSR (All Minerals) |
|
| Windarra (East Property), Ontario |
| Wesdome Gold Mines/Windarra Minerals |
| 0.5% NSR (All Minerals) |
|
| Cadillac-Sphinx, Quebec |
| Agnico-Eagle Mines Limited |
| 1.5% NSR (All Minerals) |
|
| Casa Berardi (Caribou-Estrees), Quebec |
| IAMGOLD/Cogitore Resources |
| 1.275-2.125% NSR (Au) |
|
| Casa Berardi (Dieppe), Quebec |
| Agnico-Eagle Mines Limited |
| 2-3% NSR (Au) |
|
| Destiny (Rochebaucourt), Quebec |
| Alto Ventures Ltd. |
| 3% NSR (All Minerals) |
|
| Eastmain, Quebec |
| Eastmain Mines Inc. |
| 1-1.15% NSR on initial 250 koz (Au) |
|
| Galinee, Quebec |
| Nyrstar NV |
| 1.5-2% NSR (Au) |
|
| Norlartic-Camflo, Quebec |
| Richmont Mines Inc. |
| 25% NPI (All Minerals) |
|
| Radisson, Quebec |
| Eastmain Resources Inc. |
| 2% NSR (All Minerals) |
|
| Brewery Creek, Yukon |
| Americas Bullion Royalty Corp. |
| $10-40/oz; capped at $300K (Au) |
|
| Wernecke, Yukon |
| Newmont Mining Corporation |
| 1.2% NSR (All Minerals) |
AUSTRALIA |
| Blayney, New South Wales |
| Straits Resources Limited |
| 2.25% NSR (All Minerals) |
|
| Brown’s Creek, New South Wales |
| Australian Native Landscapes/Hargraves |
| 2.25% NSR (All Minerals) |
|
| Chariot Gold/Giants Reef, Northern Territory |
| Emmerson Resources Limited |
| A$17.10 or A$30/oz (Au) |
|
| Legend, Northern Territory |
| Legend International Holdings, Inc |
| 1% GR (All Minerals) |
|
| Reynolds Range, Northern Territory |
| ABM Resources NL |
| 1-2.5% NSR (Au) |
|
| Rover, Northern Territory |
| Adelaide Resources Limited |
| 1.5-2.5% NSR (All Minerals) |
|
| Tennant Creek, Northern Territory |
| Emmerson Resources Limited |
| 1.29% NSR (Au) |
|
| Yambarra, Northern Territory |
| North Australian Diamonds Ltd et al |
| 1.25% NPI (All Minerals) |
|
| Agate Creek, Queensland |
| Laneway Resources Limited |
| 1% NSR (All Minerals) |
|
| Crush Creek, Queensland |
| Basin Gold Pty Ltd |
| 2.75% GR (All Minerals) |
|
| Mt Carlton, Queensland |
| Evolution Mining Limited |
| 2.75% GR (All Minerals) |
|
| Power Station, Queensland |
| Millmerran Power Partnership |
| 8.3% of cashflow; NPV threshold (Coal) |
|
| Tate River, Queensland |
| Sovereign Metals/Paladin Energy |
| 2% NSR (All Minerals) |
|
| Top Camp, Queensland |
| Orion Metals Limited |
| 0.5% GR (Au)/NPI (Other Minerals) |
|
| Twin Hills, Queensland |
| Evolution Mining Limited |
| 2.5% NSR (Au) |
|
| Third Plain, S. Australia |
| Perilya/Minotaur Exploration |
| 0.5% NSR (Zn) |
|
| Agnew, W. Australia |
| Gold Fields Limited |
| 2.5% GR (All Minerals) |
|
| Agnew-Cox, W. Australia |
| Gold Fields Limited |
| 5% GR (Au) |
|
| Breakaway Dam (12 Mile), W. Australia |
| Norton Gold Fields Limited |
| $1/ton (All Minerals) |
|
| Carbine North (Chadwin’s Dam), W. Australia |
| Blackham Resources/Phoenix Gold |
| 3% NPI (All Minerals) |
|
| Day Dawn (Big Bell Gold), W. Australia |
| Westgold Resources Limited |
| 1% GR (Au) |
|
| Duketon Southwest, W. Australia |
| South Boulder Mines/Independence Group |
| 2% NSR (All Minerals) |
|
| Duketon West, W. Australia |
| South Boulder Mines/Independence Group |
| 2% NSR (All Minerals) |
|
| Flushing Meadow, W. Australia |
| Orex Mining/Maximus Resources |
| 1% NSR (Au, Other Minerals) |
|
| Gidgee (Wyooda Thangoo), W. Australia |
| Panoramic Resources Limited |
| A$0.60/tonne (Au) |
|
| Hampton, W. Australia |
| BHP Billiton Limited |
| 1.75% NSR (Au, Ag); 1% NSR (Other Minerals) |
Asset |
| Operator |
| Interest and %(1) | ||
|
| Heather Bore/Mount Clifford, W. Australia |
| Independence Group NL |
| 1-2% NSR (Cu, Zn, Other Metals) |
|
| Ironstone Well, W. Australia |
| Orex Mining/Maximus Resources |
| 1% NSR (All Minerals) |
|
| Jeffreys Gold, W. Australia |
| Mincor Resources NL |
| 2% GP (Au) |
|
| Karonie (Aldiss), W. Australia |
| Integra Mining Ltd |
| $10-20/oz (Au) |
|
| Lady Jane, W. Australia |
| Phoenix Gold Limited |
| 4.5% GR (Au) |
|
| Lake Maitland, W. Australia |
| Mega Uranium Mining /Jaurd/Itochu |
| 1% NSR (All Minerals) |
|
| Lake Percy, W. Australia |
| Norilsk Nickel |
| 2% NPI (All Minerals) |
|
| Langford’s Find, W. Australia |
| Enterprise Metals Limited |
| 2% NSR (All Minerals) |
|
| Marvel Loch (May Queen), W. Australia |
| St Barbara Limited |
| $0.50-1.00/cubic metre (Au) |
|
| Matilda, W. Australia |
| Blackham Resources Ltd |
| 3-5% NSR (Au); 2% NSR (Ni) |
|
| Matt Dam, W. Australia |
| Norton Gold Fields Limited |
| A$0.60/tonne (A$1.00/t x 60%) (Au) |
|
| Miranda (Ni), W. Australia |
| Gold Fields Limited |
| 0.5% of Production (Ni) |
|
| Miranda Gold, W. Australia |
| Gold Fields Limited |
| 3% GR (Au) |
|
| Munni Munni (Elizabeth Hill), W. Australia |
| Platina Resources Limited |
| One-time payment on production (Au and/or Pt) |
|
| Murrin Murrin, W. Australia |
| Zeta Resources Limited |
| 3.5% NSR (Au and Sulfides) |
|
| Polar Bear, W. Australia |
| Sirius Resources NL |
| 2% NSR (All Minerals) |
|
| Randwick Gold Hill, W. Australia |
| E Bouverie, Trindal P/L, Lucas Gold P/L et al |
| 1-1.5% GR (Au) |
|
| Red Lake, W. Australia |
| Echo Resources Limited |
| 0.5 or 1.5% NSR (All Minerals) |
|
| Red October District, W. Australia |
| Saracen Mineral Holdings Limited |
| 0.68-1% NSR (Au) |
|
| Sandstone II, W. Australia |
| Panoramic Resources Limited |
| $0.35/dry tonne (All Minerals) |
|
| Tanami, W. Australia |
| Astro Resources NL |
| 1% GR (All Minerals) |
|
| Western Lease, W. Australia |
| KCGM Pty Ltd (Newmont/Barrick) |
| 1.25% GR (Au) |
|
| Windich South, W. Australia |
| Barrick Gold Corporation |
| 1% NSR (All Minerals) |
|
| Yerilla, W. Australia |
| Wild Acre Metals Limited |
| 2% NSR (All Minerals) |
REST OF WORLD |
| Mara Rosa, Brazil |
| Amarillo Gold Corporation |
| 1% NSR (Au, Ag) |
|
| Para South, Brazil |
| Talon Metals Corp. |
| 0.5-1% NSR (All Metals) |
|
| Terra Escura, Brazil |
| Talon Metals Corp. |
| 1-2% NSR (All Metals); 4% Cash Dividends |
|
| Trairao, Brazil |
| Talon Metals Corp. |
| $0.2995 per tonne (Fe) |
|
| La Coipa, Chile |
| Kinross Gold Corporation |
| 3% NSR (Au) |
|
| Vizcachitas, Chile |
| Los Andes Copper Limited |
| 1-2% NSR (All Minerals) |
|
| Hispaniola, Dominican Republic |
| Energold Drilling Corp. |
| 0.6% NSR (All Minerals) |
|
| Camporo (Cacamuya), Honduras |
| First Point Minerals Corp. |
| 0.6% NSR (Au, Ag) |
|
| Charaltyn, Kazakhstan |
| Kazakhymys PLC |
| $10.41/oz plus escalator (Au) |
|
| Ayahuanca, Peru |
| Geoandina Exploraciones SAC |
| 1% NSR (Au) |
|
| Choreveco, Peru |
| Minera del Norte S.A./Aruntani S.A.C. |
| 0.1-0.3% NSR (Au) |
|
| Cristiana, Peru |
| Fresnillo Peru S.A.C. |
| 1.5% NSR (All Metals) |
|
| Dorato, Peru |
| Xiana Mining Inc. |
| 2% NSR (All Minerals) |
|
| Invicta (Victoria), Peru |
| Lupaka Gold Corp. |
| 1% NSR (All Minerals) |
|
| Los Pinos, Peru |
| Tamerlane Ventures Inc. |
| 0.5% NSR (All Metals) |
|
| Minasnioc, Peru |
| Duran Ventures Inc. |
| 2% NSR (All Metals) |
|
| Nangali, Peru |
| Compass Resources/Indo Mines |
| 1.5% NSR (Au) |
|
| Parinacochas (Urbaque), Peru |
| Minera Suyamarca S.A.C. |
| 2% NSR (All Minerals) |
|
| Pukaqaqa (Antoro Sur), Peru |
| Compania Minera Milpo S.A.A. |
| 1-2% NSR (All Minerals) |
|
| Yanamina, Peru |
| Coronet Metals Inc. |
| 5% NSR (All Minerals) |
|
| NPI, Philippines |
| Nickel Asia Corporation |
| Production Payment |
|
| Demirci, Turkey |
| Ariana Resources PLC |
| 2% NSR (Au) |
|
| Hasandagi-Dikmen, Turkey |
| Teck/Koza Altin |
| 2% NSR (Au) |
|
| Karadag, Turkey |
| Koza Altin |
| 2.5% NSR (Au) |
|
| Torul, Turkey |
| Koza Altin |
| 1.5% NSR (Au) |
|
| Kasese, Uganda |
| Blue Earth Refineries Inc. |
| 10% of free cash flow (Co) |
(1) Royalty terms have been simplified for presentation purposes. Different terms may apply to certain portions of properties or by commodity. Some royalties may have sliding scales tied to commodity price. Others may include participation in sale proceeds of property or gross sales.
Oil & Gas Assets
Franco-Nevada’s Oil & Gas Assets include producing and non-producing lands located in British Columbia, Alberta, Saskatchewan, Manitoba and the Canadian Arctic. Producing lands include Crown, freehold, unitized and non-unitized oil & natural gas production. The properties contain long-life, low-decline reserves, include interests in frontier areas and are operated by experienced operators, including, among others, Cenovus Energy Inc. (“Cenovus”), Apache Canada Ltd. (“Apache”) and Canadian Natural Resources Limited (“CNRL”).
Please see “Reserves Data and Other Oil & Gas Information” for additional information regarding Franco-Nevada’s Oil & Gas Assets presented in accordance with the requirements of NI 51-101. In addition, Oil & Gas abbreviations, conversions, information advisories and cautionary statements can be found under the heading “Reserves Data and Other Oil & Gas Information”. See also “Cautionary Note Regarding Mineral and Oil and Gas Reserve and Resource Estimates”. The estimates of reserves and future net revenue for individual properties may not reflect the same confidence level as estimates of reserves and future net revenue for all properties due to the effects of aggregation.
The following table sets forth certain financial and operating information concerning Franco-Nevada’s Oil & Gas Assets for the periods indicated.
|
| 2013 |
| 2012 |
| 2011 |
| |||
Revenue to Franco-Nevada ($000)(1) |
| $ |
|
| $ |
|
| $ |
|
|
Significant Producing Assets |
| 58,606 |
| 32,878 |
| 24,145 |
| |||
Other Producing Assets |
| 8,436 |
| 8,058 |
| 10,778 |
| |||
Total |
| $ | 67,042 |
| $ | 40,936 |
| $ | 34,923 |
|
Operating Costs ($000) |
| $ | 3,928 |
| $ | 3,214 |
| 1,771 |
| |
Operating Statistics |
|
|
|
|
|
|
| |||
Production (Boe/d)(2) |
| 2,844 |
| 2,460 |
| 1,850 |
| |||
Production Split Ratio (oil:gas)(3) |
| 75:25 |
| 66:34 |
| 51:49 |
| |||
Revenue Split Ratio (oil:gas) |
| 95:05 |
| 95:05 |
| 83:17 |
| |||
(1) Revenue refers only to payments made to Franco-Nevada.
(2) Net to Franco-Nevada.
(3) Natural gas volumes converted to Boe (conversion rate of six Mcf to one bbl).
Significant Producing Assets
The following describes the significant producing assets, the production from those assets net to Franco-Nevada and the proved reserves of those assets net to Franco-Nevada. The significant producing assets are the Weyburn Unit, Midale Unit and Edson Property which accounted for approximately 87% of Franco-Nevada’s Oil & Gas production revenue for the year ended December 31, 2013 and 95% of proved reserves for the year ended December 31, 2013. As of December 31, 2013 proved reserves for the significant producing assets was 22,602 Mboe using forecast costs and prices.
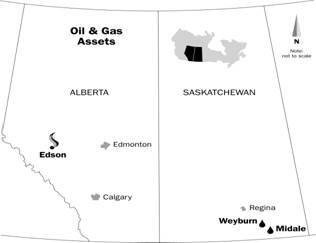
Weyburn Unit, Saskatchewan
The “Weyburn Unit” is located approximately 129 km southeast of Regina, Saskatchewan and encompasses approximately 53,360 gross (net 7,689) acres in which the Mississippian Midale beds are unitized. As of December 31, 2013, Franco-Nevada held an 11.71% NRI, a 0.44% ORR and a 2.26% WI in the Weyburn Unit. Production commenced from the Midale zone within the unitized area in 1955 under primary depletion (solution gas expansion). Formation of the Weyburn Unit occurred in 1963 for the purpose of implementing an inverted nine-spot waterflood pressure maintenance scheme on 80 acre well spacing. Cenovus is the operator.
Current gross production capability of the Weyburn Unit is approximately 30,000 Bbls/d at an average water cut of 88.5%. Current production is from 614 gross (net 88.5) wells. Produced oil within the Weyburn Unit averages 31 degrees API and contains approximately 2.2% sulphur.
For 2013, revenue received by Franco-Nevada from the Weyburn Unit was $50.7 million and light/medium oil production net to Franco-Nevada was 1,655 Bbls/d. Franco-Nevada takes product-in-kind for the WI and NRI shares of this production and markets it through a third party marketer. As of December 31, 2013, Franco-Nevada’s proved reserves for the Weyburn Unit were 21,036 Mboe.
On February 23, 2012, Franco-Nevada purchased an additional 1.15% WI in the Weyburn Unit. The effective date of this acquisition was January 1, 2012.
On November 13, 2012, Franco-Nevada purchased an 11.71% NRI in the Weyburn Unit. The effective date of this acquisition was October 1, 2012.
The following table sets forth the revenue and production from the Weyburn Unit for the periods indicated:
|
| 2013 |
| 2012 |
| 2011 |
| |||
Revenue to Franco-Nevada ($000)(1) |
| $ | 50,668 |
| $ | 24,950 |
| $ | 12,314 |
|
Production (Mbbl)(2) |
| 604 |
| 325 |
| 146 |
| |||
(1) Revenue refers only to payments made to Franco-Nevada.
(2) Net to the Oil & Gas Interests.
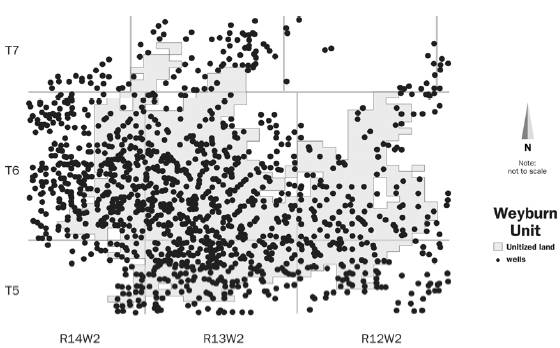
Midale Unit, Saskatchewan
The “Midale Unit” was discovered in 1953 and the Midale Unit was formed in 1964 for the purpose of implementing a pressure maintenance scheme by water injection. The Midale Unit is located in southeast Saskatchewan approximately 40 km southeast of the city of Weyburn and encompasses 13,760 gross (net 376) acres with 253 gross (net 6.9) producing wells. Franco-Nevada holds a 1.59% working interest and a 1.14% gross override royalty interest in the Midale Unit. Apache is the operator.
For 2013, revenue received by Franco-Nevada from the Midale Unit was $3.6 million and light/medium oil production net to Franco-Nevada was 120 Boe/d. Franco-Nevada takes product-in-kind for the working interest portion of this production and markets it through a third party marketer. As of December 31, 2013, Franco-Nevada’s proved reserves for the Midale Unit were 608 Mboe.
The following table sets forth the revenue and production from the Midale Unit for the periods indicated:
|
| 2013 |
| 2012 |
| 2011 |
| |||
Revenue to Franco-Nevada ($000)(1) |
| $ | 3,618 |
| $ | 4,025 |
| $ | 4,099 |
|
Production (MBoe)(2) |
| 44 |
| 48 |
| 48 |
| |||
(1) Revenue refers only to payments made to Franco-Nevada.
(2) Net to Franco-Nevada.
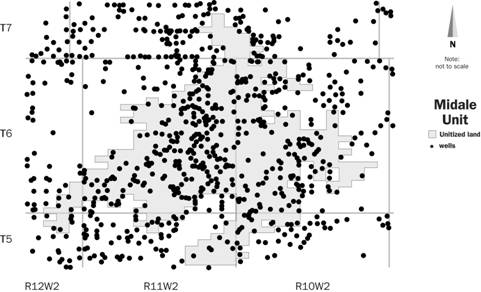
Edson Property, Alberta
The “Edson Property” is located approximately 209 km west of Edmonton, Alberta and encompasses over 25,920 gross (net 3,888) acres, of which 4,480 gross (net 672) acres are currently undeveloped. Franco-Nevada has a 15% overriding royalty in this property. The wells are operated by CNRL. For 2013, revenue received by Franco-Nevada from the Edson Property was $4.3 million. For the same period, the property produced approximately 2.6 MMcf/d of natural gas and 105 Bbls/d of natural gas liquids totalling 544 Boe/d of production net to Franco-Nevada from 137 gross (net 20.5) producing gas wells mainly from the Upper Cretaceous Cardium Formation, with lesser amounts from the Viking, Gething, Cadomin and Bluesky Formations. As of December 31, 2013, Franco-Nevada’s proved reserves for the Edson Property were 959 Mboe.
Gas is processed at the CNRL operated Galloway, Edson West and Ansell gas plants which extract natural gas liquids. These plants have a combined processing capacity of 146 MMcf/d. The main reserves bearing formation in the Edson Property area is the Upper Cretaceous Cardium Formation. The Edson Property lies in an area of northwest southeast trending fault traces where the faults ramp up through the Cardium Formation. The faults dip to the west. The best Cardium wells, both vertical and especially horizontal, have targeted the
hanging wall of the updip leading edge of Cardium sand cycles. This potentially helps the wells take advantage of the better productivity associated with narrow areas of higher fracture density induced by the higher stresses related to deformation along the leading edges of the faults.

The following table sets forth the revenue and production from the Edson Property for the periods indicated:
|
| 2013 |
| 2012 |
| 2011 |
| |||
Revenue to Franco-Nevada ($000)(1) |
| $ | 4,320 |
| $ | 3,902 |
| $ | 7,732 |
|
Production (MBoe)(2) |
| 199 |
| 207 |
| 256 |
| |||
(1) Revenue refers only to payments made to Franco-Nevada.
(2) Net to Franco-Nevada.
Other Producing Assets, Western Canada
The significant producing assets account for approximately 87% of total oil & natural gas revenue in 2013, while the other producing assets account for approximately 13% of total oil & natural gas revenue. The other producing assets are comprised of over 50 areas which include approximately 604 gross producing wells and 56 unitized oil & gas fields, and encompass a wide variety of royalty agreements and operators and are primarily located in Alberta and Saskatchewan.
The following table sets forth the revenue and production from Franco-Nevada’s other producing Oil & Gas Assets for the periods indicated:
|
| 2013 |
| 2012 |
| 2011 |
| |||
Revenue to Franco-Nevada ($000)(1) |
| $ | 8,436 |
| $ | 8,058 |
| $ | 10,778 |
|
Production (MBoe)(2) |
| 192 |
| 205 |
| 225 |
| |||
(1) Revenue refers only to payments made to Franco-Nevada.
(2) Net to Franco-Nevada.
Undeveloped Oil & Gas Interests, Western Canada
Franco-Nevada does not include in its asset tabulations undeveloped oil & gas interests without reportable resources. There are 160 agreements that cover these interests which include over 100,000 acres of undeveloped mineral title, non-producing lands within producing areas and approximately 80,000 gross (net 12,000) acres of unproved non-producing lands under lease. These undeveloped interests are located in Alberta, Saskatchewan and Manitoba.
TECHNICAL REPORTS
Palmarejo Mining and Technical Information
Except where noted otherwise, the information set out below is based on the Palmarejo Report dated January 1, 2013, prepared for Franco-Nevada in compliance with NI 43-101. The Palmarejo Report was prepared by or under the supervision of Donald J. Birak, Senior Vice President Exploration, Coeur at the time of the Palmarejo Report, Keith Blair, Manager, Applied Geoscience LLC at the time of the Palmarejo Report, and Klaus Triebel, Senior Corporate Resource Geologist, Coeur at the time of the Palmarejo Report, each a “qualified person” under NI 43-101.
Property Description and Location

The Palmarejo District is located about 420 km by road southwest of the city of Chihuahua in the state of Chihuahua in northern Mexico and on the western edge of the Sierra Madre Occidental in the Temoris mining district. The Guadalupe deposit is located about 7 km southeast of the Palmarejo mine as shown in the Figure. The La Patria deposit is located southwest of Guadalupe.
The Palmarejo project consists of mining concessions covering approximately 12,253 ha and include the Palmarejo surface and underground mine and mill complex, the Guadalupe and the La Patria deposits. Coeur Mexicana S.A. de C.V. (“Coeur Mexicana”), a subsidiary of Coeur and formerly Planet Gold S.A. de C.V. (“Planet Gold”), owns a 100% interest in 32 mining concessions covering 12,204.1118 ha, a 50% interest in one concession covering 43.771 ha and a 60% interest in two concessions totalling 5.000 additional hectares. The Guadalupe project area is located entirely within this area of mining concessions and is contained within the San Carlos concession which consists of 160ha and is 100% owned by Coeur Mexicana. The mining concessions wholly and partially owned by Coeur currently expire on various dates between 2029 and 2055.
Permits have been granted authorizing mining within the area depicted in the Environmental Impact Assessment (“EIA”) and necessary permits and authorizations required for construction and operation of the Palmarejo mine have been obtained.
Guadalupe is permitted for land disturbance related to underground mine activities and related disturbances. This project received its authorization for environmental disturbance in 2010, and its initial authorization for change of land use in November, 2010. Both authorizations are required by the Mexican Government to operate a mine. The mine is currently open and development of the underground structures is ongoing. A right of way agreement for the construction of the Guadalupe-Palmarejo haul corridor was signed with the Guazapares ejido on February 27, 2011. Environmental disturbance and change of land use authorizations were awarded by SEMARNAT (as defined below) on May 30, 2011 and July 11, 2011, respectively. Additional approvals will be required for the final sections of the revised roadway which were scheduled for evaluation in 2013. A new road location was chosen which impacts the surface rights of Guazapares ejido (surface owner). Negotiations with the Guazapares ejido have been completed and resulted in a new agreement. The permitting process with the environmental authorities is still in progress and is envisioned to be concluded shortly. Additional permitting and revised right of way agreements will include a full sized access road to provide for large truck traffic to and from the Guadalupe mine.
Franco-Nevada holds an interest in 50% of the gold produced from the Palmarejo project (the “Palmarejo Stream”). The Palmarejo Stream agreement provides for a minimum obligation to be paid in monthly payments over a total of 400,000 oz of gold. Each monthly payment is an amount equal to the greater of the minimum of 4,167 oz of gold and 50% of actual gold production per month multiplied by the excess of the monthly average market price of gold above $400/oz (which $400 floor is subject to a 1% annual inflation compounding adjustment beginning on January 21, 2013). After payments have been made on a total of 400,000 oz of gold, the obligation is payable in the amount of 50% of actual gold production per month
multiplied by the excess of the monthly average market price of gold above $400/oz, adjusted as described above. Payments under the Palmarejo Stream are to be made in cash or gold bullion.
The Palmarejo Stream applies to the majority of the Palmarejo project and includes the Palmarejo, Guadalupe and La Patria deposits.
Coeur Mexicana has executed agreements with the Palmarejo, Agua Salada, and Guazapares ejidos (or surface owners) covering surface activities involved with the exploration, exploitation, and processing of mineral deposits, the construction of all necessary mining and processing facilities, and the undertaking of mining operations, in return for annual rental payments. The agreements are effective for 15 years with an option for Coeur Mexicana to extend the terms for an additional 15 years.
These agreements have already been registered with the Mexican Agrarian National Registry, and there are no known title concerns that would affect the development or operation of the mine.
In October 2008, Planet Gold entered into an agreement with the Guazaparez ejido for land use in the Guadalupe/Los Bancos area. In 2009, a mining agreement with the Guazapares ejido was finalized, assuring Coeur Mexicana the surface and land rights sufficient for the planned mining activities at Guadalupe. This mining agreement has a six year term and is renewable. In 2013, Coeur Mexicana negotiated an advanced mining agreement with Guazapares ejido which allows for exploitation and exploration on their property of approximately 1,900 hectares. Coeur Mexicana has also obtained complete control of part of the rented area by paying compensation to some land-holding ejidatarios.
On August 16, 2010, Coeur Mexicana signed with the Guerra al Tirano ejido a 4 year exploration agreement on 69.7 ha covering the La Patria deposit.
In October 2011, Coeur Mexicana acquired the Guerra al Tirano Project from Azteca de Oro y Plata. The agreement transferred 100% of the mining rights in exchange for a cash payment of $1,200,000 on signing plus a 2% NSR royalty. Coeur Mexicana can acquire up to 1.5% of the NSR royalty at a fixed price of $750,000. The acquisition also included a separate agreement in which Azteca de Ora y Plata transferred to Coeur Mexicana an agreement with the ejido originally executed in 2007 for the use of the surface land with the Guerra al Tirano ejido for an annual rent payable to the ejido. There is no expiration date.
The EIA was approved on May 23, 2006. The EIA has a term of 13 years and can be extended by application to the Ministry of Environment and Natural Resources (“SEMARNAT”). The required authorizations from SEMARNAT have also been obtained for Change in Land Use and the Environmental Authorization. The Environmental Authorization for the Palmarejo project requires a restoration program for mining areas that will recover the soil for landscape restitution and restore ecosystem conditions that allow for the area to be inhabitable again for vegetation and animal species that previously lived there. Coeur conducts an annual review of its potential reclamation responsibilities. The year end 2012 preliminary assessment for the life of mine disturbance for final reclamation at the Palmarejo mine is estimated to be $16.8 million which includes the Guadalupe project.
Coeur has adopted a Corporate Environmental Policy, which underpins its commitment to protecting the environment and will adhere to the broad reclamation requirements presented in the SEMARNAT Environmental Authorization and NOM-141-SEMARNAT-2003 (which deals with tailings matters) in developing and implementing the necessary reclamation objectives. Coeur is not aware of any existing environmental liabilities to which the Palmarejo project is subject, other than as stated above.
All mineral and surface rights required to operate the Palmarejo mine have been secured and include rights to property that encompass all Mineral Resources and Mineral Reserves and all present and planned mine workings and related facilities, including mine workings, tailings storage facility, water impoundments, mined rock storage facilities, ore processing and tailings storage facilities, and ancillary site facilities for the Palmarejo mine site within the area depicted in the figure above.
Accessibility, Climate, Local Resources, Infrastructure and Physiography
Palmarejo and Guadalupe are about 1,150m and 1,300m above sea level, respectively. The area is hilly to mountainous with densely vegetated, steep-sided slopes with local stands of cacti. Local ranchers and farmers graze cattle and grow corn and other vegetables on small-scale plots.
The climate of the area is moderate and has little impact on operations. Average maximum temperature is about 34°C, and average minimum temperature is about 5°C. Rainfall occurs mainly in the summer months,
with an average annual precipitation of about 800mm. The climate imposes no significant impediments to work and operations can be conducted year round.
The Palmarejo District has moderately well developed infrastructure and a local work force familiar with mining operations. Chinipas and Temoris are the two nearest towns, both with an estimated population of approximately 1,600 inhabitants. The small village of Palmarejo lies immediately northwest of the Palmarejo District area and has a population of about 430. Many of the workers are employees at the mine and live in these three, nearby communities.
Access to Palmarejo from Chihuahua is via paved highways to the town of San Rafael. From San Rafael travel is by gravel road to Temoris, and finally to Palmarejo. The Chihuahua-Pacifico railway passes through Temoris and access from the rail station at the town of Temoris to Palmarejo is along 45km of gravel road. Light aircraft airstrips are located in both Temoris and Chinipas, and in 2011 an airstrip was built in Palmarejo to service the mine.
The figure below shows the location of the key deposits, Mineral Reserves and Mineral Resources within the Palmarejo Mine property.
The Palmarejo Mine site was serviced with a 33,000-volt power line supplied by the Comisión Federal Electricidad (“CFE”), the Mexican federal power authority. An additional 115-kV high voltage line was constructed from the Divisadero substation to the Palmarejo Mine site during 2009, and the Palmarejo mine, plant and all other electrical load is now connected to this grid. The same 115-kV high voltage line is within 7 km of the Guadalupe project and excess capacity exists on this line to supply the estimated 2.5 MW of power needed for Guadalupe.
Water for the Palmarejo mine is obtained from a variety of sources. As of 2011 the primary water for milling is recycled from the tailings dam and from the Fresh Water Diversion Dam (“FWDD”). When needed, additional make-up water, is either pumped from the Chinipas river infiltration gallery, from a shallow water well located in Agua Salada, or from the FWDD and piped to site via a 17 km pipeline. Water for domestic use is also obtained from the FWDD and hauled to the camps by truck load (10,000 L tanks on flatbed trucks). Water from the FWDD is also pumped to the underground mine for drilling and dust suppression, or to the plant for make-up water.
Fresh water for the Guadalupe Mine is planned to come from a combination of sources which includes surface water in nearby arroyos and the FWDD. Water will also be collected in sumps constructed in the underground mines and clarified for recycling in the underground system.
Waste rock from the open pit mine is placed beyond the edges of the open pit boundary, with provision to backfill mined out areas of the pit in future years.
Tailings are deposited in an impoundment near the process plant. The first phase of the Palmarejo Final Tailings Dam (“FTD”) was completed in 2010 to the 790 meter elevation and started accepting tailings in the fourth quarter of 2010. The second phase of the Final Tailings Dam was completed in August of 2011 to an 800 meter elevation. The third phase build-up to 810 meters elevation was completed in 2012. Phase four of the tailings dam expansion (raising the crest of the dam from 810 meters to 825 meters) was put on hold in 2013 as a diversion solution of excessive rainwater entering the tailings facility had to be addressed first. Rainwater is now diverted around the tailings area directly into the river in accordance with environmental regulations. This solution helped to keep the current freeboard below 12 meters from the impoundment crest. Construction of phase four is planned to start in late 2014 or early 2015 and the tender process has been initiated. The construction of the Environmental Control Dam (“ECD”) which is directly below the FTD and the construction of the FWDD were completed in 2009 and are currently in use.
History and Production
The Palmarejo District area lies within the Temoris Mining District. Silver and gold production from the district, though poorly documented, has a long, intermittent history dating from Spanish colonial exploitation in the 1620s. Small-scale local miners subsequently developed many small adits and superficial workings along the district’s main mineralized structural trends.
The Palmarejo mine was purchased by the British company Palmarejo Mining Co. in 1886 (subsequently re-named Palmarejo and Mexican GoldFields, Ltd.) (“PMG”). PMG operated the Palmarejo mine through 1910. Production was resumed by Minas Huruapa, S.A. de C.V. during the period from 1979 to 1992 and high-grade gold-silver shoots were being mined intermittently by local miners until quite recently. On December 21, 2007, Coeur acquired all of the outstanding shares of Bolnisi Gold NL (“BSG”), an Australian company listed on the Australian Stock Exchange, and Palmarejo Silver and Gold Corporation (“PJO”), a Canadian company listed on the TSX Venture Exchange. The principal asset of BSG was its ownership of 72.8% of the outstanding common shares of PJO. PJO, through its operating company Planet Gold, was engaged in the exploration and development of silver and gold properties located in Mexico. Among those was the Palmarejo project.
Open pit mining operations began in 2008 and milling operations and metal recovery commenced in 2009, ramping up to full capacity in 2010. Production from open pit and underground sources since operations commenced in 2008 at Palmarejo through to December 31, 2013 is summarized below.
Total Palmarejo Ore Production — Inception to December 31, 2013
Production |
| 2013 |
| 2012 |
| 2011 |
| 2010 |
| 2009 |
|
Ore Tonnes Milled |
| 2,107,071 | (1) | 1,962,958 |
| 1,563,156 |
| 1,665,082 |
| 966,629 |
|
Ore grade Ag (g/t) |
| 146.0 | (1) | 157.3 |
| 235.5 |
| 157.6 |
| 147.9 |
|
Ore grade Au (g/t) |
| 2.1 | (1) | 1.78 |
| 2.70 |
| 2.10 |
| 2.00 |
|
Recovery Ag (%) |
| 77.7 |
| 82.96 |
| 76.4 |
| 69.8 |
| 66.3 |
|
Recovery Au (%) |
| 84.2 |
| 94.41 |
| 92.2 |
| 91.1 |
| 88.2 |
|
Silver produced (oz.) |
| 7,603,144 |
| 8,236,013 |
| 9,041,488 |
| 5,887,576 |
| 3,047,843 |
|
Gold produced (oz.) |
| 116,536 |
| 106,038 |
| 125,071 |
| 102,440 |
| 54,740 |
|
(1) Converted to metric from Coeur full-year 2013 results. Coeur reported in Imperial units.
Geology and Mineralization
The Palmarejo District lies near the western edge of the Sierra Madre Occidental. Basement rocks in the Sierra Madre Occidental are obscured by Cenozoic-aged volcanic flows, tuffs, and related intrusions but are inferred to include Proterozoic basement rocks, overlying Paleozoic shelf and eugeosynclinal sedimentary rocks, possibly scattered Triassic-Jurassic clastic rocks, and Mesozoic intrusions.
A gold-silver metallogenic province that hosts low-sulfidation epithermal polymetallic gold silver deposits lies along the western margin of the Sierra Madre Occidental; this province appears to exhibit a regional zonation of silver-rich deposits to the west and gold-rich deposits to the east. Palmarejo, a silver-rich deposit, lies in the western part of this province.
The Palmarejo area ore bodies are hosted in northwest striking and west dipping structures that cut through a volcano-sedimentary sequence of re-sedimented volcaniclastic, coherent and pyroclastic deposits. The
volcaniclastic rocks include ash-rich mudstones and sandstones. The coherent rocks include microcrystalline massive basalt, fine grained massive andesite and plagioclase crystal rich massive andesite. The pyroclastic unit includes tuffaceous sandstone, lapillistone tuff and breccias.
At the Palmarejo mine, gold-silver veins and vein/breccias occur within, and at the intersection of, the west-northwest-striking “La Prieta” structure and the north-northwest-striking “La Blanca” structure.
The La Prieta structure extends for at least 2km, has a variable strike that averages about 115°, and dips to the southwest at 35° to 85°. The La Blanca structure strikes about 160°, has an average dip of about 50° to the southwest, and is thought to be a listric normal fault that parallels the trend of the regional faults in the Sierra Madre Occidental.
Steeply plunging, high-grade clavos have been identified in each of the vein structures. Drilling by Planet Gold along the La Prieta vein structure has tested approximately 3.5km of strike length and has penetrated the structure over an elevation range of about 900 to 1,250m. Approximately 2.5km of strike length of the La Blanca vein has been tested, through an elevation range of about 750 to 1,250m.
The Guadalupe project is located along a northeast-plunging structure which can be traced for approximately 3,000m along strike and has an average dip of approximately 55° to the northeast.
The Guadalupe zone, which includes the Guadalupe Norte, Guadalupe, El Salto and Las Animas prospects, comprises silver and gold-bearing quartz-carbonate veins hosted in a volcanic-sedimentary package that is intruded by shallow andesitic porphyries and a felsic dome complex.
Old mines and prospects occur over a 4 km strike length of the Guadalupe structure. The silver-gold mineralization at Guadalupe occurs predominantly within northwest-trending quartz-carbonate breccia veins enveloped by variably developed quartz hydrothermal breccias and quartz-stockwork zones.
Prospects at the La Patria zone include the La Patria, La Virginia and Maclovia prospects and are located within the northwest-trending La Patria-Todos Santos structure that can be traced for over 4,000m along strike. Prospects at the La Patria zone have a combined strike length of 1,800m and the mineralization is hosted in a quartz-vein breccia unit with enriched proximal dense stockwork. Typically the structures are characterized by intensely silicified and brecciated colloform banded quartz veins hosted in silicified andesite.
During 2012 the Palmarejo Exploration Group began systematic mapping, sampling, interpretation and evaluation of several objectives in and near current active mine areas. The work generated several drill targets including but not limited to the La Blanca Norte, Victoria-Santo Domingo Vein system, Chapotillio East and Cerro de Los Hilos. Exploring this area for new targets or for the extension of known Mineral Resources will continue through 2014.
Drilling and surface trenching continue at Guadalupe to evaluate the feasibility of surface mining. Similarly, La Patria is under review for additional drilling in 2014 to evaluate the potential for surface mining. Geological mapping combined with aeromagnetic data interpretation and spectral analysis has generated several conceptual objectives. These objectives were investigated during the 2013 field season.
Exploration and Drilling
As of December 2007, Planet Gold had completed 180 trenches, for a total of 3,960m, and 1,135 drillholes, for a total of 246,830.9m, within the Palmarejo-Trogan property. A total of 1,429 samples were collected from the trenches, and 800m of underground channel sampling was completed (365 samples). Drilling includes 27 geotechnical holes (494m) drilled at Palmarejo.
Planet Gold collected almost 2,200 shortwave infrared (“SWIR”) spectral measurements from drill samples from holes on a series of sections across the La Blanca and La Prieta structures using an ASD Terraspec instrument. An additional 500 SWIR spectra were measured as part of a regional alteration-mapping program on the Trogan project.
Four hundred forty drill samples from Guadalupe were analyzed for a 50-element suite by combination inductively coupled plasma mass spectrometry (“ICP-MS”) and inductively coupled plasma atomic emission spectrometry (“ICP-AES”). One hundred and eighty-six Palmarejo drill samples and 282 trench-sample pulps were analyzed for a 50-element suite by combination ICP-MS and ICP-AES. A further 440 drill samples from Guadalupe were similarly analyzed.
To define and expand mineral resources at Palmarejo, drilling done by Coeur’s exploration group has been conducted since 2008. Coeur has also continued channel sampling at Palmarejo. RC drilling is conducted as part of the open pit ore control programme and condemnation drilling.
During 2012, 45,610 meters of diamond core drilling was conducted. A total of 24,307 core samples were analyzed. A summary of the sampling conducted is shown in the table below.
Drilling Report Activity, 2012
Drilling Report
Category |
| Drilled (m) |
| Hole Count |
| Primary Samples |
| |
DDH3 | Diamond Core Drilling |
| 45,610 |
| 138 |
| 16,382 |
|
UGDDH |
| 12,137 |
| 157 |
| 7,925 |
| |
RC | RC Open Pit Drilling |
| 27,454 |
| 1,209 |
| 13,447 |
|
| Total |
| 85,201 |
| 1,504 |
| 37,754 |
|
Coeur has also relied on the drilling, interpretations, and results conducted by other experts. The authors of the Palmarejo Report state that they have reviewed this information and believe that the methods employed by these experts are sound and that the results and interpretations are accurate and within industry standards.
Palmarejo Drill Data
Planet Gold undertook drilling continuously at Palmarejo from November 2003 until September 2007, which has been continued by Coeur. The only drilling known by Coeur to have been completed at Palmarejo prior to Planet Gold, consists of five holes drilled underground by PMG in the early 1900s. Beyond their reported existence, no further documentation of the holes is known to Coeur.
Drilling conducted by Planet Gold through to September 2007 is shown in the table below.
Palmarejo Drilling Summary-Planet Gold
|
| RC |
| Core |
| RC Precollared |
| Total Drill |
|
|
| ||||||
Year |
| No. |
| Meters |
| No. |
| Meters |
| No. |
| Meters |
| holes |
| Total (m) |
|
2003-2007 |
| 545 |
| 92,689 |
| 117 |
| 25,549 |
| 88 |
| 11,089 |
| 750 |
| 129,327 |
|
Guadalupe Drill Data
Planet Gold initiated drilling at Guadalupe in early 2005 and drilling through to early 2007 is shown in the table below.
Guadalupe Drilling Summary-Planet Gold
|
|
|
| RC |
| Core |
|
|
|
|
| ||||
Company |
| Year |
| No. |
| Meters |
| No. |
| Meters |
| Total Drill holes |
| Total (m) |
|
Planet Gold |
| 2005-2007 |
| 96 |
| 21,349 |
| 139 | * | 46,489 |
| 229 |
| 67,838 |
|
*Includes 4 core continuations of RC holes & 2 core (wedge) continuations of core holes.
La Patria Drill Data
Planet Gold drilling at La Patria is shown in the table below:
Planet Gold Drilling at La Patria, 2005-2007
|
|
|
| RC |
| Core |
|
|
|
|
| ||||
Company |
| Year |
| No. |
| Meters |
| No. |
| Meters |
| Total Drill holes |
| Total (m) |
|
Planet Gold |
| 2005-2007 |
| 79 |
| 14,014 |
| 42 |
| 11,852 |
| 121 |
| 25,866 |
|
Coeur Mexicana has relied on the drilling, interpretations, and results conducted by other experts (including AMEC Mining and Metals (“AMEC”) and Mine Development Associates (“MDA”)). Coeur’s Qualified Persons
have reviewed this information and believe that the methods employed are sound and that the results and interpretations are accurate and within industry standards.
Drilling Procedures
Diamond core drilling in the Palmarejo District has been conducted by drilling companies under contract to BSG/PJO and, since 2008, Coeur Mexicana. Under Coeur Mexicana, G4 Forage Drilling, headquartered in Val-d’Or, Quebec, Canada, Landdrill International Mexico from Hermosillo, Mexico, and GDA Servicios Mineros SA de CV, a Chilean drilling company, have been used to perform the core drilling at the Palmarejo District. In 2011 and 2012, all contract drilling, from both underground and surface positions, was conducted by G4. Coeur Mexicana reviews its drilling requirements and awards contracts annually for its exploration and resource definition drilling.
Diamond-core holes were logged for geotechnical data and geology, including rock type, alteration, mineralization assemblages, vein-quartz percentage, and oxidation. Graphic logs were also created for stratigraphy, vein orientation, and visual identification of mineralized zones. Digital photographs of wetted core were taken and initially archived at the field offices. Holes were re-logged by a second geologist following receipt of assay results to validate data.
The core in the Palmarejo district is being sampled only in the intervals suspected to contain precious metal mineralization. Where the rock displays minor alteration and/or quartz-carbonate veinlets, the standard sample interval is one meter. In a section where the core has intersected a strongly mineralized structure, sampling may be reduced to a nominal 0.5 meter interval but can vary depending on the mineralogical changes. When structure is clearly broken into different veins or domains, it is sampled separately at contacts and sample intervals may be less than 0.5 meters.
RC drilling was a major part of the initial drilling method by the prior owners of the Palmarejo District. However, since 2008 through 2012, very little to no RC drilling was performed for exploration purposes. Previous RC drilling on the project used center-return hammer bits. If dictated by the geologic or groundwater conditions, an interchange hammer, full-bore tricone, or button bit was used. The water table in the project area is variable due to the topographic relief. RC holes were terminated if the sample exiting the cyclone became wet due to ground water, and the holes were completed with a core tail where applicable or twinned by a diamond core rig.
The RC holes used for the Palmarejo mineral resource model were sampled every five feet (1.52 m) down the hole. Holes that were drilled in a new area were sampled along the entire length of the hole. In-fill or close-spaced holes were sampled at 5 foot intervals through zones of suspected mineralization. As a standard procedure, only material from dry drilling was being sampled and once the water table was intersected the RC hole was stopped and usually continued with core.
The RC drill chips were logged for stratigraphy, alteration, weathering degree, quartz percent, and metallic minerals to aid in geological and sectional interpretation. Representative RC drill chips were collected in chip trays and stored at Palmarejo office or the Arroyo Blanco storage for geologic logging. Holes were re-logged by a second geologist following receipt of assay results to validate the original logged data.
Sampling and Analysis and Security of Samples
Sample preparation and analytical methods use standard methods in the industry.
Prior to December 2007, the primary analytical laboratory for the Palmarejo project area and outlying exploration projects was ALS-Chemex with sample preparation in Chihuahua, Chihuahua and Hermosillo, Sonora. The current analytical lab for the exploration projects outside the Palmarejo Mine area is ALS-Chemex with sample preparation in Chihuahua, Chihuahua. A split of the prepared pulp is sent to Vancouver, B.C. for fire assay with gravimetric finish for both gold and silver. ALS-Chemex complies with the international standards ISO 9001:2000 and ISO 17025:1999. ALS-Chemex sample preparation requires that the entire sample is dried and crushed to > 70% passing a 2mm (10 mesh) screen. A split of up to 250g is pulverized to > 85% passing a 75µm (200 mesh) screen. All assays techniques at La Patria and Guadalupe utilize an initial 30 gram charge that is digested by the fire assay method. Then the metal content is determined by different finish techniques. The GRA21 technique uses a gravimetric finish or a physical weighing of the gold and or silver bead, detection limits for gold by this finish method is 0.05 to 1,000 parts per million (“ppm”) and 5 to 10,000ppm for silver. QA/QC analysis over the past year has shown that commercial labs have difficulty reproducing gold values below 1ppm with the gravimetric finish method due to the difficulty of physically weighing the small bead; therefore, a fire digestion followed by an Induction Coupled Plasma (“ICP”) finish is
being used for initial gold analyses and when the gold exceeds 2.0ppm the sample is reassayed by a fire digestion and gravimetric finish.
Since 2008, samples collected during infill and definition exploration core drilling and underground development drilling at the Palmarejo Mine site have been sent to SGS Mineral Services Laboratory (“SGS”), Durango, Mexico for preparation and analysis using industry standard methods. SGS Durango is an accredited laboratory conforming with the requirements of CAN-P-1579, CAN-P-4E (ISO/IEC 17025:2005).
Coeur has adopted a specific QA/QC protocol that standardizes the procedures for collecting samples and obtaining related information with a goal of providing confidence that the assay results reported by laboratories can be verified and their integrity validated and which includes the use of standards, blanks, duplicates and check assays.
Coeur’s Qualified Persons have reviewed the assay data and the third party reviews of the Palmarejo and Guadalupe databases and QA/QC programs done by AMEC (2008), MDA (Gustin, 2004, 2006) and Keith Blair (2005, 2006, 2007) and are in agreement with the conclusion of these reports that the data collected by BSG/PJO is suitable for resource modeling and that there are no known factors that could materially affect the sample results.
Coeur’s Qualified Persons have reviewed the summary reports of the assay QC data for the 2008 to 2010 Palmarejo QA/QC program. The transition from exploration to development and production at the Palmarejo project saw a drop in the rigor of the assay QC program and monitoring for 2008 and most of 2009. Although not ideal, many of the drill holes and all of the channel samples from this period were not used in the resource model update described in this report. Coeur’s Qualified Persons consider that the remaining data is suitable for resource modeling. The QC program at Palmarejo has been modified to include more regular reporting and check assaying for a larger proportion of the samples.
Coeur’s Qualified Persons’ review of the 2012 QA/QC data did not encounter significant problems or biases for the period studied, and the Qualified Persons believe the assay data to be of acceptable quality for resource modeling.
Mineral Resources and Reserves
The Proven and Probable Mineral Reserves, as of January 1, 2013, for the Palmarejo Area are based on Measured and Indicated Mineral Resources only and do not take into account mining depletion during 2013. The drill hole database used in the Palmarejo resource model update was current to July 23, 2012. Open pit Mineral Reserves are based on an updated year-end 2012 block model as well as current surface mine designs. Underground Mineral Reserves are based on the same year-end 2012 block model as well as updated underground mine designs. Production schedules and economic analyses have been performed which show the economic viability of the Mineral Reserves reported herein.
Open pit Mineral Reserves at Palmarejo have been defined by first generating a detailed pit design based on an optimized shell produced in Gemcom Whittle™ software, determining ore and waste by applying a cutoff grade, and then creating a production schedule that supplies ore to the mill. Before generating the optimized shell, the resource model was block diluted to 5m x 5m x 7.5m to incorporate dilution along the edges of the mineralized structures. Ore control practices at Palmarejo allow for reasonable selectivity with relationship to the block size. The block dilution described above is appropriate for a statement of reserves without additional factors. Thus, no additional dilution factors have been used.
For the open pit reserve at Guadalupe, before generating the optimized shell, the resource model was block diluted to 6m x 6m x 6m to incorporate dilution along the edges of the mineralized structures. Ore control practices at Guadalupe will allow for reasonable selectivity with relationship to the block size. The block dilution described above is appropriate for a statement of reserves without additional factors. Thus, no additional dilution factors have been used.
The final pit shape used for reporting mineral reserves was limited by a surface boundary corresponding to the currently permitted 5 ha area. Without the 5 ha limit the economic open pit reserves would be much larger.
Underground stopes were designed in detail to create mineable shapes which may have included internal dilution in the form of unclassified or inferred tonnes. Any unclassified or inferred tonnes were treated as internal waste at 0 grams per tonne (“g/t”) Au and Ag grade. External dilution from overbreak and ore loss were also taken into account. Depending on the type of mining method to be used in a given stope, previously
calculated external dilution factors and grades were applied. A flat rate ore loss factor was applied to all designed stopes at the Palmarejo deposit.
After stope design was complete, and external dilution and ore loss factors were applied, any stope that was sub-economic with an average grade of less than 2.45 g/t AuEq was eliminated from the Palmarejo mine underground reserve. For the Guadalupe deposit, underground reserve estimates were obtained by applying a 2.51 g/t AuEq cut-off against fully diluted underground stopes. The nature of eliminating stopes created a loss of potential ore associated with waste on the outer edge of the deposit.
The Mineral Resources and Mineral Reserves for the Palmarejo District shown in the table below are as of January 1, 2013, and include the Palmarejo mine, Guadalupe, and La Patria silver and gold deposits and do not take into account mining depletion during 2013. Due to rounding, there may be some minor variations in tonnes, grades or contained ounces.
Mineral Resources have been estimated using varying cut-off grades depending on the type of mining. Cost and recovery estimates used for gold equivalency calculation and cut-off grade determination for open pit and underground mining have been determined by taking into account metal prices, operating costs and metallurgical recoveries based on operating experience gained at Palmarejo.
The gold equivalent factor used for cut-off grade determination is obtained using the following formula:
[(($Price Au) - ($Refining Au))/(($Price Ag) - ($Refining Ag))] x [(%Recovery Au)/(%Recovery Ag)] x [(%Payable Au)/(%Payable Ag)]
Total Palmarejo District Mineral Resources Inclusive of Mineral Reserves
|
|
|
| Average Grade (g/t) |
| Contained Ounces |
| ||||
Category |
| Tonnes |
| Au |
| Ag |
| Au |
| Ag |
|
Measured |
| 8,103,000 |
| 2.55 |
| 190.3 |
| 663,000 |
| 49,578,000 |
|
Indicated |
| 25,067,000 |
| 1.20 |
| 61.1 |
| 966,000 |
| 49,272,000 |
|
Measured and Indicated |
| 33,170.000 |
| 1.53 |
| 92.7 |
| 1,629,000 |
| 98,851,000 |
|
Inferred |
| 10,798,000 |
| 1.32 |
| 63.7 |
| 457,000 |
| 22,104,000 |
|
The Total Mineral Resource includes Proven and Probable Mineral Reserves. Mineral Resources do not have demonstrated economic viability.
Coeur reported production of 116,536 oz gold and 7,603 Koz silver during 2013 from the Palmarejo District.
Cut-off grade for Palmarejo deposit: open pit 0.98g/tAuEq, underground 2.09g/tAuEq.
Cut-off grade for Guadalupe deposit: open pit 1.03g/tAuEq,underground 2.14g/tAuEq.
Cut-off grade for La Patria deposit 0.47g/tAuEq.
Inferred Resources have a great amount of uncertainty as to their existence and whether they can be mined legally or economically. It cannot be assumed that all or any part of the Inferred Resources will ever be upgraded to a higher category. See “Cautionary Note Regarding Mineral and Oil and Gas Reserve and Resource Estimates”.
Mineral Reserves were calculated using metal prices of $1,450/oz Au and $27.50/oz Ag in conjunction with cost and recovery assumptions. All resource cut-off grades were calculated using metal prices of $1,700/oz gold and $33.00/oz silver.
The Proven and Probable Mineral Reserves, as of January 1, 2013, are based on Measured and Indicated Mineral Resources only and are summarized in the table below below and do not take into account mining depletion during 2013. Mineral Resources that are not classified as Mineral Reserves do not have demonstrated economic viability.
There are no known environmental, permitting, legal, title, socio-economic, marketing, or political issues that could materially affect the Palmarejo Mineral Reserves and Resources.
Total Palmarejo District Mineral Reserves
|
|
|
| Average Grade (g/t) |
| Contained Ounces |
| ||||
Category |
| Tonnes |
| Au |
| Ag |
| Au |
| Ag |
|
Proven |
| 5,213,000 |
| 2.08 |
| 160.2 |
| 348,000 |
| 26,858,000 |
|
Probable |
| 6,446.000 |
| 1.53 |
| 126.7 |
| 317,000 |
| 26,251,000 |
|
Total |
| 11,659,000 |
| 1.77 |
| 141.7 |
| 665,000 |
| 53,110,000 |
|
Metal prices used were $1,450/oz Au, $27.50/oz Ag.
Coeur reported production of 116,536 oz gold and 7,603 Koz silver during 2013 from the Palmarejo District.
Includes Mineral Reserves for Palmarejo and Guadalupe deposits.
The table below shows the remaining Mineral Resource for the Palmarejo District (including the Palmarejo, Guadalupe and La Patria deposits) exclusive of the Mineral Reserves and mining depletion during 2013, and although stated with consideration given to economics, Coeur emphasizes that the following Mineral Resources do not have demonstrated economic viability.
Total Palmarejo District Mineral Resources Exclusive of Mineral Reserves
|
|
|
| Average Grade (g/t) |
| Contained Ounces |
| ||||
Category |
| Tonnes |
| Au |
| Ag |
| Au |
| Ag |
|
Measured |
| 2,890,000 |
| 3.39 |
| 244.5 |
| 315,000 |
| 22,720,000 |
|
Indicated |
| 18,621,000 |
| 1.08 |
| 38.5 |
| 649,000 |
| 23,021,000 |
|
Measured and Indicated |
| 21,511,000 |
| 1.39 |
| 66.1 |
| 964,000 |
| 45,741,000 |
|
Inferred |
| 10,798,000 |
| 1.32 |
| 63.7 |
| 457,000 |
| 22,104,000 |
|
Mineral Resources are in addition to Mineral Reserves and do not have demonstrated economic viability.
Coeur reported production of 116,536 oz gold and 7,603 Koz silver during 2013 from the Palmarejo District.
Cut-off grade for Palmarejo deposit: open pit 0.98 g/tAuEq, underground 2.09 g/tAuEq.
Cut-off grade for Guadalupe deposit: open pit 1.03 g/t AuEq, underground 2.14 g/tAuEq.
Cut-off grade for La Patria deposit 0.47 g/tAuEq.
Inferred Resources have a great amount of uncertainty as to their existence and whether they can be mined legally or economically. It cannot be assumed that all or any part of the Inferred Resources will ever be upgraded to a higher category. See “Cautionary Note Regarding Mineral and Oil and Gas Reserve and Resource Estimates”.
The Mineral Reserve and Resource for the Palmarejo deposit, as of January 1, 2013, are summarized in metric tonne units in the tables below and do not take into account mining depletion during 2013. Mineral Resources do not have demonstrated economic viability.
Palmarejo Deposit Mineral Reserves
|
|
|
| Average Grade (g/t) |
| Contained Ounces |
| ||||
Category |
| Tonnes |
| Au |
| Ag |
| Au |
| Ag |
|
Proven |
| 3,682,000 |
| 2.29 |
| 172.1 |
| 271,000 |
| 20,377,000 |
|
Probable |
| 836,000 |
| 1.81 |
| 156.0 |
| 49,000 |
| 4,195,000 |
|
Proven and Probable |
| 4,518,000 |
| 2.20 |
| 169.1 |
| 319,000 |
| 24,572,000 |
|
Metals prices used were $1,450/oz Au and $27.50/oz Ag.
Coeur reported production of 116,536 oz gold and 7,603 Koz silver during 2013 from the Palmarejo District.
Cutoff grade for reserve: open pit 1.15 g/t AuEq, underground 2.45 g/t AuEq [(AuEq = Au g/t + (A g/t / 60.37)]].
AuEq factor based on [(($Price Au)-($Refining Au)) / (($Price Ag)-($RefiningAg)] x [(%Recovery Au)/(%Recovery Ag)] x [(%Payable Au)/(%Payable Ag)].
Palmarejo Deposit Mineral Resource Inclusive of Mineral Reserves
|
|
|
| Average Grade (g/t) |
| Contained Ounces |
| ||||
Category |
| Tonnes |
| Au |
| Ag |
| Au |
| Ag |
|
Measured |
| 6,425,000 |
| 2.78 |
| 202.5 |
| 574,000 |
| 41,824,000 |
|
Indicated |
| 1,448,000 |
| 1.80 |
| 144.6 |
| 84,000 |
| 6,733,000 |
|
Measured and Indicated |
| 7,874,000 |
| 2.60 |
| 191.8 |
| 658,000 |
| 48,558,000 |
|
Inferred |
| 170,000 |
| 3.89 |
| 149.0 |
| 21,000 |
| 815,000 |
|
Total Mineral Resource includes Proven and Probable Reserves. Mineral Resources do not have demonstrated economic viability.
Coeur reported production of 116,536 oz gold and 7,603 Koz silver during 2013 from the Palmarejo District.
Metals prices used were $1,700/oz Au and $33.00/oz Ag.
Cut-off grade for resource: open pit 0.98 g/t AuEq, underground 2.09 g/t AuEq [(Au Eq = Au g/t + (Ag g/t / 58.96)].
AuEq factor based on [(($Price Au)-($RefiningAu)) / (($Price Ag)-($refiningAg))] x [(%Recovery Au)/(%Recovery Ag)] x [(%Payable Au)/(%Payable Ag)].
Inferred Resources have a great amount of uncertainty as to their existence and whether they can be mined legally or economically. It cannot be assumed that all or any part of the Inferred Resources will ever be upgraded to a higher category. See “Cautionary Note Regarding Mineral and Oil and Gas Reserve and Resource Estimates”.
Palmarejo Deposit Remaining Mineral Resource Exclusive of Mineral Reserves
|
|
|
| Average Grade (g/t) |
| Contained Ounces |
| ||||
Category |
| Tonnes |
| Au |
| Ag |
| Au |
| Ag |
|
Measured |
| 2,743,000 |
| 3.44 |
| 243.20 |
| 304,000 |
| 21,447,000 |
|
Indicated |
| 612,000 |
| 1.80 |
| 128.97 |
| 35,000 |
| 2,538,000 |
|
Measured and Indicated |
| 3,355,000 |
| 3.14 |
| 222.36 |
| 339,000 |
| 23,986,000 |
|
Inferred |
| 124,000 |
| 5.34 |
| 201.55 |
| 21,000 |
| 802,000 |
|
Mineral Resources are in addition to Mineral Reserves and do not have demonstrated economic viability.
Coeur reported production of 116,536 oz gold and 7,603 Koz silver during 2013 from the Palmarejo District.
Metals prices used were $1,700/oz Au and $33.00/oz Ag.
Cut-off grade for resource: open pit 0.98 g/t AuEq, underground 2.09 g/t AuEq [(Au Eq = Au g/t + (Ag g/t / 58.96)].
AuEq factor based on [(($Price Au)-($RefiningAu)) / (($Price Ag)-($refiningAg))] x [(%Recovery Au)/(%Recovery Ag)] x [(%Payable Au)/(%Payable Ag)].
Some Inferred material was included in the Mineral Reserve at 0 g/t Au and Ag as internal dilution.
Inferred Resources have a great amount of uncertainty as to their existence and whether they can be mined legally or economically. It cannot be assumed that all or any part of the Inferred Resources will ever be upgraded to a higher category. See “Cautionary Note Regarding Mineral and Oil and Gas Reserve and Resource Estimates”.
The Mineral Reserve and Resource for Guadalupe as of January 1, 2013 are summarized in metric tonne units in the tables below and do not take into account any mining depletion during 2013. Mineral Resources do not have demonstrated economic viability.
Guadalupe Deposit Mineral Reserves
|
|
|
| Average Grade (g/t) |
| Contained Ounces |
| ||||
Category |
| Tonnes |
| Au |
| Ag |
| Au |
| Ag |
|
Proven |
| 1,531,000 |
| 1.57 |
| 131.7 |
| 77,000 |
| 6,481,000 |
|
Probable |
| 5,610,000 |
| 1.49 |
| 122.3 |
| 268,000 |
| 22,057,000 |
|
Proven and Probable |
| 7,141,000 |
| 1.50 |
| 124.3 |
| 345,000 |
| 28,538,000 |
|
Metals prices used were $1,450/oz Au and $27.50/oz Ag.
Cutoff grade for reserve: open pit 1.21 g/t AuEq, underground 2.51 g/t AuEq [(AuEq = Au g/t + (A g/t / 60.37)]].
AuEq factor based on [(($Price Au)-($Refining Au)) / (($Price Ag)-($RefiningAg)] x [(%Recovery Au)/(%Recovery Ag)] x [(%Payable Au)/(%Payable Ag)].
Guadalupe Deposit Mineral Resource Inclusive of Mineral Reserves
|
|
|
| Average Grade (g/t) |
| Contained Ounces |
| ||||
Category |
| Tonnes |
| Au |
| Ag |
| Au |
| Ag |
|
Measured |
| 1,678,000 |
| 1.64 |
| 143.7 |
| 89,000 |
| 7,754,000 |
|
Indicated |
| 7,716,000 |
| 1.58 |
| 131.9 |
| 391,000 |
| 32,711,000 |
|
Measured and Indicated |
| 9,395,000 |
| 1.59 |
| 134.0 |
| 480,000 |
| 40,465,000 |
|
Inferred |
| 4,102,000 |
| 1.95 |
| 142.8 |
| 258,000 |
| 18,841,000 |
|
Total Mineral Resource includes Proven and Probable Reserves. Mineral Resources do not have demonstrated economic viability.
Metals prices used were $1,700/oz Au and $33.00/oz Ag.
Cut-off grade for resource: Open pit 1.03 g/t AuEq, underground 2.14 g/t AuEq [(Au Eq = Au g/t + (Ag g/t / 58.96)].
AuEq factor based on [(($Price Au)-($RefiningAu)) / (($Price Ag)-($RefiningAg)] x [(%Recovery Au)/(%Recovery Ag)] x [(%Payable Au)/(%Payable Ag)].
Inferred Resources have a great amount of uncertainty as to their existence and whether they can be mined legally or economically. It cannot be assumed that all or any part of the Inferred Resources will ever be upgraded to a higher category. See “Cautionary Note Regarding Mineral and Oil and Gas Reserve and Resource Estimates”.
Guadalupe Deposit Remaining Mineral Resource Exclusive of Mineral Reserves
|
|
|
| Average Grade (g/t) |
| Contained Ounces |
| ||||
Category |
| Tonnes |
| Au |
| Ag |
| Au |
| Ag |
|
Measured |
| 147,000 |
| 2.39 |
| 269.1 |
| 11,000 |
| 1,273,000 |
|
Indicated |
| 2,107,000 |
| 1.82 |
| 157.3 |
| 123,000 |
| 10,654,000 |
|
Measured and Indicated |
| 2,254,000 |
| 1.85 |
| 164.6 |
| 134,000 |
| 11,927,000 |
|
Inferred |
| 3,954,000 |
| 2.03 |
| 148.2 |
| 258,000 |
| 18,841,000 |
|
Mineral Resources are in addition to Mineral Reserves and do not have demonstrated economic viability.
Metals prices used were $1,700/oz Au and $33.00/oz Ag.
Cut-off grade for resource: open pit 1.03 g/t AuEq, underground 2.14 g/t AuEq [(Au Eq = Au g/t + (Ag g/t / 58.96)].
AuEq factor based on [(($Price Au)-($RefiningAu)) / (($Price Ag)-($refiningAg))] x [(%Recovery Au)/(%Recovery Ag)] x [(%Payable Au)/(%Payable Ag)].
Some Inferred material was included in the Mineral Reserve at 0 g/t Au and Ag as internal dilution.
Inferred Resources have a great amount of uncertainty as to their existence and whether they can be mined legally or economically. It cannot be assumed that all or any part of the Inferred Resources will ever be upgraded to a higher category. See “Cautionary Note Regarding Mineral and Oil and Gas Reserve and Resource Estimates”.
La Patria has no Mineral Reserve at this time and the Mineral Resources for the La Patria deposit, as at January 1, 2013, are summarized in metric tonne units in the table below. Mineral Resources do not have demonstrated economic viability.
La Patria Deposit Mineral Resources
No Reserves
|
|
|
| Average Grade (g/t) |
| Contained Ounces |
| ||||
Category |
| Tonnes |
| Au |
| Ag |
| Au |
| Ag |
|
Measured |
| — |
| — |
| — |
| — |
| — |
|
Indicated |
| 15,902,000 |
| 0.96 |
| 19.2 |
| 491,000 |
| 9,828,000 |
|
Measured and Indicated |
| 15,902,000 |
| 0.96 |
| 19.2 |
| 491,000 |
| 9,828,000 |
|
Inferred |
| 6,720,000 |
| 0.83 |
| 11.4 |
| 178,000 |
| 2,461,000 |
|
Mineral Resources do not have demonstrated economic viability.
Metals prices used were $1,700/oz Au and $33.00/oz Ag.
Cut-off grade for resource was 0.47 g/t Au Equivalent [(Au Eq = Au g/t + (Ag g/t / 56.49)].
AuEq factor based on [(($Price Au)-($RefiningAu)) / (($Price Ag)-($RefiningAg)] x [(%Recovery Au)/(%Recovery Ag)] x [(%Payable Au)/(%Payable Ag)].
Inferred Resources have a great amount of uncertainty as to their existence and whether they can be mined legally or economically. It cannot be assumed that all or any part of the Inferred Resources will ever be upgraded to a higher category. See “Cautionary Note Regarding Mineral and Oil and Gas Reserve and Resource Estimates”.
Mining Operations
Palmarejo mine
The Palmarejo mine, process plant, diesel power generating station, and ancillary facilities is operational, with the first doré produced on schedule in late March 2009. Production commenced using an interim tailings storage facility while the final tailings dam was being constructed.
Ore is mined by both conventional open pit techniques and by longhole underground techniques. Open pit mining operations are at full capacity.
Cristian Caceres, a professional geotechnical consultant, completed a geotechnical study of the Palmarejo open pit (for both existing highwalls and future designs) for Coeur in 2012. The study reaffirmed the previous Golder Associates (“Golder”) recommendations for geotechnical design parameters in the existing highwalls and Coeur will continue to maintain those highwall design criteria going forward.
In 2012, the Palmarejo underground mining encountered significant and unexpected geotechnical issues which forced temporary closure of crosscuts and alteration of the short range mine plan for 2012. Coeur has formulated and started implementation of a mitigation plan allowing safe extraction of the ore in these areas of low rock quality. This is achieved by timely backfilling of stopes thereby preventing excessive weakening of material not mined yet.
Ore from both underground and open pit operations is hauled to the run of mine stockpile immediately adjacent to the north portal. A loader feeds the primary jaw crusher, blending ores from various sources in the process. A small crushed ore stockpile downstream of the primary crusher is reclaimed by apron feeder to feed the semi autogenous grind and ball mills, with cyclone overflow reporting to rougher-scavenger and cleaner flotation cells. Flotation concentrate is thickened and cyanide leached, and all float tails report to a carbon-in-leach (“CIL”) circuit. The pregnant eluate from the concentrate leach and stripped CIL carbon is treated by electro-winning to produce a powder that is filtered, dried and smelted on site into 150kg ingots. Doré bullion is shipped by contract armored truck to a refinery.
Tailings slurry undergoes thickening for water recovery, cyanide detoxification, and is ultimately discharged to the tailings impoundment located in the east watershed outlet downstream of the open pit waste rock storage area.
The 2012 year end results show a feed grade of 1.70 g/t Au and 165 g/t Ag with an overall recovery of 83.1% Ag and 93.3% Au.
The final product shipped from Palmarejo consists of doré ingots. The relatively pure precious metals are then sold by the refinery on the open market.
Metallurgical tests indicate recoveries of silver and gold by flotation and leaching from Guadalupe ores is similar to the recoveries experienced at Palmarejo in the full scale process plant with a flotation and leaching circuit. Mineralogical test work shows that the ore minerals at both deposits are also similar.
At La Patria, a total of forty-two drill holes were selected from the current geological data base to obtain representative test samples for a series of cyanide solubility tests meant to determine gold and silver extraction rates. Two sets of samples were submitted for testing in late 2012 and results for both sets of samples indicate that both gold and silver are amenable to be extracted into a cyanide solution. These initial metallurgical results are preliminary in nature; however, they strongly support a continued and more extensive metallurgical test work program. This work was planned for 2013, and was expected to include bottle roll and column tests on different feed sizes for representative composites along the La Patria ore deposit.
Coeur has numerous business contracts in place to allow day-to-day mining, crushing and processing functions to operate smoothly. The terms of these contracts, with regard to charges, etc. are all within industry norms.
The stated Mineral Reserves, as of January 1, 2013, yield an estimated mine life of approximately 8 years and are estimated to generate a pre-tax net cashflow of $575.3 million based on future capital expenditure of $171.3 million.
Guadalupe
The Guadalupe deposit is located approximately 7 km southeast of the Palmarejo mine site and processing plant and will be operated as a satellite of Palmarejo, which will provide processing, tailings and administrative support for the Guadalupe Mine. Guadalupe ore will be mined by open pit and conventional and transverse longhole underground stoping techniques and trucked to the Palmarejo mill via surface roads.
The open pit production schedule provides for mining the pit in multiple designed phases to facilitate timely waste stripping and ensure consistent ore feed. It is currently assumed that the open pit production equipment at Palmarejo will transfer to Guadalupe when necessary to maintain the schedule.
Underground mining is designed and scheduled based on detailed economic stope designs, dilution and loss assumptions. The vein structure is most amenable to mechanized conventional longhole stoping in the vein sections narrower than 15 meters and transverse longhole stoping in the areas where the vein exceeds 15 meters. The mining will be accomplished using jumbo drills, jackleg drills, bolters, longhole drills, Load-Haul-Dump (“LHD”) loaders and 30-45 tonne trucks. The underground longhole mining will utilize cemented rock fill (“CRF”) from a CRF plant located on the surface for backfilling of primary stopes.
Ventilation is planned according to industry standards for the mining method and planned equipment.
Coeur contracted Golder to complete a geotechnical study for Guadalupe in 2011. The results indicate Guadalupe geotechnical stability to be better overall than at Palmarejo, with some variable conditions encountered in the development areas. Coeur has implemented Golder’s recommendations into the Guadalupe designs, which include mining dimensions and analyzing operational applications such as bolting types, spacing and patterns.
Necessary infrastructure for Guadalupe not supported by the Palmarejo complex is either planned or in place. This includes electrical power via a spur line from the Palmarejo feed, compressed air, office and other buildings, etc. Underground water will be collected in sumps and recycled for use. Excess water will be clarified and sent to the Palmarejo fresh water dam.
On November 6, 2013, Coeur announced that it had decided to temporarily delay completing the underground mine development of the Guadalupe deposit stating that the expected returns on this production do not meet its threshold in the current market environment and that it expects to replace anticipated 2014 production from Guadalupe with lower cost ounces from existing areas in the mine.
Reclamation
Coeur conducts an annual review of its potential reclamation responsibilities company-wide. Its year end 2012 preliminary assessment for the life of mine disturbance for final reclamation at the Palmarejo Mine is estimated in the Palmarejo Report to be $16.8 million which includes the Guadalupe project.
Taxes
The Palmarejo Stream is subject to 16% Value Added Tax (“VAT”) in Mexico. The monthly payment received from the operator is grossed up for the VAT which Franco-Nevada submits to the tax authorities.
Capital Costs
The capital cost estimate for the Palmarejo project in the Palmarejo Report is based on development and construction of a combined open pit and underground mine operation with a supporting plant and infrastructure.
Capital expenditures for Palmarejo and Guadalupe from January 1, 2013 through the end of the mine life are estimated to be an additional $171.3 million in the Palmarejo Report. Major budgeted expenditures in 2013 at Palmarejo were expected to include $6.0 million for the final tailings dam construction and $9.1 million for capitalized development and mine equipment as estimated by Coeur in the Palmarejo Report. Expenditures for Guadalupe in 2013 were budgeted at $20.0 million for development and mine equipment as estimated by Coeur in the Palmarejo Report. Coeur reported total capital expenditure at Palmarejo of $33.7 million during 2013.
RESERVES DATA AND OTHER OIL & GAS INFORMATION
GLJ was engaged by Franco-Nevada to evaluate the crude oil & natural gas reserves of its producing Oil & Gas properties and the value of future net revenue attributable to such reserves. GLJ has prepared a report in accordance with the requirements of NI 51-101. The GLJ Report was dated February 18, 2014 with a preparation date of February 11, 2014 and an effective date of December 31, 2013. The GLJ Report was prepared using assumptions and methodology guidelines outlined in the Canadian Oil and Gas Evaluation Handbook (the “COGE Handbook”).
All evaluations of future revenue contained in the GLJ Report are after the deduction of royalties, development costs, production costs and well abandonment costs of all wells to which reserves have been attributed, but before consideration of indirect costs such as general and administrative, overhead recovery and other miscellaneous expenses. The estimated future net revenues contained in the following tables do not necessarily represent the fair market value of the reserves. There is no assurance that the forecast price and cost assumptions contained in the GLJ Report will be attained and variances could be material. Other assumptions and qualifications relating to costs and other matters are included in the notes to the tables. The recovery and reserves estimates described herein are estimates only. The actual reserves may be greater or less than those calculated.
Oil & Gas Abbreviations and Conversions
Oil & Natural Gas Liquids |
|
|
| Natural Gas |
|
| |||
bbl |
| barrel |
| Bcf |
| billion cubic feet | |||
bbls/d |
| barrels per day |
| Mcf |
| thousand cubic feet | |||
Mbbls/d |
| thousand barrels per day |
| MMcf |
| million cubic feet | |||
MMbbls |
| million barrels |
| MMcf/d |
| million cubic feet per day | |||
NGLs |
| natural gas liquids |
| MMBtu |
| million British thermal units | |||
Boe |
| barrel of oil equivalent of natural gas and crude oil on the basis of 1 Boe for 6 Mcf of natural gas or 1bbl of oil |
| Mcfe |
| thousand cubic feet of gas equivalent | |||
Boe/d |
| barrels of oil equivalent per day |
|
|
|
| |||
Mboe |
| thousand barrels of oil equivalent |
|
|
|
| |||
Mboe/d |
| thousand barrels of oil equivalent per day |
|
|
|
| |||
MMboe |
| million barrels of oil equivalent |
|
|
|
| |||
WTI |
| West Texas Intermediate |
|
|
|
| |||
API |
| American Petroleum Institute |
|
|
|
| |||
Oil & Gas Information Advisory
In this AIF, certain natural gas volumes have been converted to barrels of oil equivalent on the basis of six Mcf to one bbl. Boe, Mboe, MMboe and related terms may be misleading, particularly if used in isolation. A conversion ratio of six Mcf to one bbl is based on an energy equivalency conversion method primarily applicable at the burner tip and does not represent value equivalency at the wellhead. The estimates of reserves and future net revenue for individual properties may not reflect the same confidence level as estimates of reserves and future net revenue for all properties, due to the effects of aggregation. Estimates of future net revenue presented below do not represent fair market value.
Reserves Data (Forecast Prices and Costs)
The following table sets forth a summary of the crude oil & natural gas reserves and the value of future net revenue of Franco-Nevada as at December 31, 2013 as evaluated by GLJ in the GLJ Report using forecast prices and costs. The pricing used in the forecast price evaluation is set forth below under the heading “Forecast Prices and Costs”. Some of the tables may not add due to rounding. All reserves are in Canada. See “Cautionary Regarding Mineral and Oil and Gas Reserve and Resource Estimates”.
|
| Light & |
| Heavy Oil |
| Natural |
| NGLs |
| Total Oil |
| ||||||||||
RESERVES |
| Gross (Mbbl) |
| Net |
| Gross |
| Net |
| Gross |
| Net (MMcf) |
| Gross |
| Net |
| Gross |
| Net |
|
Proved |
|
|
|
|
|
|
|
|
|
|
|
|
|
|
|
|
|
|
|
|
|
Producing |
| 15,322 |
| 14,395 |
| — |
| 81 |
| — |
| 7,783 |
| 193 |
| 383 |
| 15,515 |
| 16,156 |
|
Developed Non-Producing |
| 2,012 |
| 1,742 |
| — |
| — |
| — |
| — |
| — |
| — |
| 2,012 |
| 1,742 |
|
Undeveloped |
| 3,216 |
| 2,868 |
| — |
| — |
| — |
| — |
| — |
| — |
| 3,216 |
| 2,868 |
|
Total Proved |
| 20,550 |
| 19,005 |
| — |
| 81 |
| — |
| 7,783 |
| 193 |
| 383 |
| 20,742 |
| 20,767 |
|
Total Probable |
| 8,997 |
| 8,367 |
| — |
| 19 |
| — |
| 2,586 |
| 64 |
| 133 |
| 9,061 |
| 8,951 |
|
Total Proved Plus Probable |
| 29,547 |
| 27,373 |
| — |
| 100 |
| — |
| 10,369 |
| 257 |
| 517 |
| 29,804 |
| 29,718 |
|
The following tables set forth the net present value of future net revenue attributable to the reserves categories referred to above, before and after deducting future income tax expenses, calculated without discount and using a discount rate of 5%, 10%, 15% and 20%:
|
| Net Present Values of Future Net Revenue |
| |||||||||||||
Reserves Category |
| 0% |
| 5% |
| 10% |
| 15% |
| 20% |
| |||||
|
|
|
|
|
| (C$000) |
|
|
|
|
| |||||
|
|
|
|
|
|
|
|
|
|
|
| |||||
Proved Producing |
| $ | 831,556 |
| $ | 586,201 |
| $ | 449,181 |
| $ | 363,364 |
| $ | 305,244 |
|
Developed Non-Producing |
| 137,423 |
| 74,358 |
| 46,028 |
| 30,967 |
| 22,139 |
| |||||
Undeveloped |
| 132,106 |
| 67,978 |
| 35,594 |
| 18,096 |
| 8,088 |
| |||||
|
|
|
|
|
|
|
|
|
|
|
| |||||
Total Proved |
| 1,101,085 |
| 728,537 |
| 530,802 |
| 412,426 |
| 335,471 |
| |||||
Total Probable |
| 615,588 |
| 286,406 |
| 154,103 |
| 91,954 |
| 59,208 |
| |||||
|
|
|
|
|
|
|
|
|
|
|
| |||||
Total Proved Plus Probable |
| $ | 1,716,673 |
| $ | 1,014,943 |
| $ | 684,905 |
| $ | 504,380 |
| $ | 394,679 |
|
|
| Net Present Values of Future Net Revenue |
| |||||||||||||
Reserves Category |
| 0% |
| 5% |
| 10% |
| 15% |
| 20% |
| |||||
|
|
|
|
|
| (C$000) |
|
|
|
|
| |||||
|
|
|
|
|
|
|
|
|
|
|
| |||||
Proved Producing |
| $ | 736,267 |
| $ | 518,261 |
| $ | 397,665 |
| $ | 322,433 |
| $ | 271,538 |
|
Developed Non-Producing |
| 103,493 |
| 55,104 |
| 33,915 |
| 22,771 |
| 16,267 |
| |||||
Undeveloped |
| 96,986 |
| 49,579 |
| 25,705 |
| 12,803 |
| 5,422 |
| |||||
|
|
|
|
|
|
|
|
|
|
|
| |||||
Total Proved |
| 936,746 |
| 622,944 |
| 457,285 |
| 358,007 |
| 293,227 |
| |||||
Total Probable |
| 452,219 |
| 210,161 |
| 112,833 |
| 67,126 |
| 43,059 |
| |||||
|
|
|
|
|
|
|
|
|
|
|
| |||||
Total Proved Plus Probable |
| $ | 1,388,966 |
| $ | 833,104 |
| $ | 570,118 |
| $ | 425,134 |
| $ | 336,286 |
|
The following table sets forth the undiscounted future net revenue attributable to proved and proved plus probable reserves (in total) as of December 31, 2013 is set forth below:
Reserves Category |
| Revenue |
| Royalties |
| Operating |
| Development |
| Well |
| Future Net Income |
| Future |
| Future Net |
| ||||||||
Total Proved (C$000) |
| $ | 2,106,219 |
| $ | 401,802 |
| $ | 524,357 |
| $ | 32,183 |
| $ | 46,791 |
| $ | 1,101,085 |
| $ | 164,339 |
| $ | 936,746 |
|
Total Proved Plus Probable (C$000) |
| $ | 3,140,714 |
| $ | 571,384 |
| $ | 758,891 |
| $ | 42,401 |
| $ | 51,365 |
| $ | 1,716,673 |
| $ | 327,707 |
| $ | 1,388,966 |
|
The following table sets forth the net present value of future net revenue (before deducting future income tax expenses), by production group, estimated using forecast prices and costs and calculated using a discount rate of 10%:
Reserves Category |
| Production group |
| Net present value of future net revenue before income taxes |
| $/boe |
| $/Mcfe |
|
Total Proved |
|
|
|
|
|
|
|
|
|
|
| Light & Medium Oil(2) |
| 502,665 |
| 26.13 |
| 4.36 |
|
|
| Heavy Oil(2) |
| 3,550 |
| 43.73 |
| 7.29 |
|
|
| Natural Gas(3) |
| 24,588 |
| 16.96 |
| 2.83 |
|
|
| Total |
| 530,802 |
| 25.56 |
| 4.26 |
|
Total Proved Plus Probable |
|
|
|
|
|
|
|
|
|
|
| Light & Medium Oil(2) |
| 650,661 |
| 23.51 |
| 3.92 |
|
|
| Heavy Oil(2) |
| 3,887 |
| 38.74 |
| 6.46 |
|
|
| Natural Gas(3) |
| 30,358 |
| 15.65 |
| 2.61 |
|
|
| Total |
| 684,905 |
| 23.05 |
| 3.84 |
|
(1) Other company revenue and costs not related to a specific production group have been allocated proportionately to production groups. Unit values are based on the Company’s net reserves.
(2) Including solution gas and other by-products.
(3) Including by-products but excluding solution gas.
Forecast Prices and Costs
The following table sets forth forecast prices and costs pricing assumptions used in the GLJ Report with respect to net present values of future net revenue as well as the inflation rates used for operating and capital
costs. GLJ is an independent qualified reserves evaluator appointed pursuant to NI 51-101. The crude oil & natural gas forecast prices are based on the January 1, 2014 posted price as determined by GLJ. The forecast price assumptions assume the continuance of current laws, regulations and operating costs in effect on the date of the GLJ Report.
Year |
| WTI @ |
| Light, |
| WCS |
| Canadian |
| NGL |
| NGL |
| NGL |
| Inflation |
| Exchange |
|
2014 |
| 97.50 |
| 92.76 |
| 75.60 |
| 4.03 |
| 57.83 |
| 73.22 |
| 105.20 |
| 2.0 |
| 0.950 |
|
2015 |
| 97.50 |
| 97.37 |
| 79.36 |
| 4.26 |
| 58.42 |
| 75.95 |
| 107.11 |
| 2.0 |
| 0.950 |
|
2016 |
| 97.50 |
| 100.00 |
| 81.50 |
| 4.50 |
| 60.00 |
| 78.00 |
| 107.00 |
| 2.0 |
| 0.950 |
|
2017 |
| 97.50 |
| 100.00 |
| 81.50 |
| 4.74 |
| 60.00 |
| 78.00 |
| 107.00 |
| 2.0 |
| 0.950 |
|
2018 |
| 97.50 |
| 100.00 |
| 81.50 |
| 4.97 |
| 60.00 |
| 78.00 |
| 107.00 |
| 2.0 |
| 0.950 |
|
2019 |
| 97.50 |
| 100.00 |
| 81.50 |
| 5.21 |
| 60.00 |
| 78.00 |
| 107.00 |
| 2.0 |
| 0.950 |
|
2020 |
| 98.54 |
| 100.77 |
| 82.13 |
| 5.33 |
| 60.46 |
| 78.60 |
| 107.82 |
| 2.0 |
| 0.950 |
|
2021 |
| 100.51 |
| 102.78 |
| 83.76 |
| 5.44 |
| 61.67 |
| 80.17 |
| 109.97 |
| 2.0 |
| 0.950 |
|
2022 |
| 102.52 |
| 104.83 |
| 85.44 |
| 5.55 |
| 62.90 |
| 81.77 |
| 112.17 |
| 2.0 |
| 0.950 |
|
2023 |
| 104.57 |
| 106.93 |
| 87.14 |
| 5.66 |
| 64.16 |
| 83.40 |
| 114.41 |
| 2.0 |
| 0.950 |
|
2024+ |
| +2.0%/yr |
| +2.0%/yr |
| +2.0%/yr |
| +2.0%/yr |
| +2.0%/yr |
| +2.0%/yr |
| +2.0%/yr |
| 2.0 |
| 0.950 |
|
Reconciliation of Changes in Reserves
The table below is a reconciliation of gross reserves and is provided to satisfy the requirement of NI 51-101. Under NI 51-101, gross reserves include only working interests before the deduction of royalties payable and do not include any royalties receivable. As a significant percentage of Franco-Nevada’s assets are royalty interests, they are excluded from this table. This hinders an investor’s ability to compare its reserves to others in the industry. Therefore, in addition to presenting the reconciliation using gross reserves, a reconciliation using the Company’s net interest reserves is also presented. The Company’s net interest reserves are gross working interest reserves plus net royalty interest reserves.
December 31, 2013
Reconciliation of Company Gross Reserves
by Principal Product Type
Forecast Prices and Costs
|
| Total Oil |
| Residue & Solution Gas |
| Natural Gas Liquids |
| Oil Equivalent |
| ||||||||||||||||
FACTORS |
| Proved |
| Probable |
| Proved + |
| Proved |
| Probable |
| Proved + |
| Proved |
| Probable |
| Proved + |
| Proved |
| Probable |
| Proved + |
|
December 31, 2012 |
| 20,726 |
| 10,049 |
| 30,775 |
| 1 |
| 0 |
| 2 |
| 171 |
| 92 |
| 263 |
| 20,897 |
| 10,141 |
| 31,038 |
|
Discoveries |
| 0 |
| 0 |
| 0 |
| 0 |
| 0 |
| 0 |
| 0 |
| 0 |
| 0 |
| 0 |
| 0 |
| 0 |
|
Extensions* |
| 0 |
| 0 |
| 0 |
| 0 |
| 0 |
| 0 |
| 0 |
| 0 |
| 0 |
| 0 |
| 0 |
| 0 |
|
Infill Drilling* |
| 77 |
| (63 | ) | 14 |
| 0 |
| 0 |
| 0 |
| 0 |
| 0 |
| 0 |
| 77 |
| (63 | ) | 14 |
|
Improved Recovery* |
| 635 |
| (607 | ) | 29 |
| 0 |
| 0 |
| 0 |
| 28 |
| (28 | ) | 0 |
| 635 |
| (607 | ) | 29 |
|
Technical Revisions |
| 419 |
| (382 | ) | 37 |
| (0 | ) | (0 | ) | (0 | ) | 0 |
| 0 |
| 0 |
| 447 |
| (410 | ) | 37 |
|
Acquisitions |
| 0 |
| 0 |
| 0 |
| 0 |
| 0 |
| 0 |
| 0 |
| 0 |
| 0 |
| 0 |
| 0 |
| 0 |
|
Dispositions |
| 0 |
| 0 |
| 0 |
| 0 |
| 0 |
| 0 |
| 0 |
| 0 |
| 0 |
| 0 |
| 0 |
| 0 |
|
Economic Factors |
| 0 |
| 0 |
| 0 |
| 0 |
| 0 |
| 0 |
| 0 |
| 0 |
| 0 |
| 0 |
| 0 |
| 0 |
|
Production |
| (1,308 | ) | 0 |
| (1,308 | ) | (1 | ) | 0 |
| (1 | ) | (7 | ) | 0 |
| (7 | ) | (1,315 | ) | 0 |
| (1,315 | ) |
December 31, 2013 |
| 20,550 |
| 8,997 |
| 29,547 |
| 0 |
| 0 |
| 0 |
| 193 |
| 64 |
| 257 |
| 20,742 |
| 9,061 |
| 29,804 |
|
* The above change categories correspond to standards set out in the COGE Handbook. For reporting under NI 51-101, reserves additions under Infill Drilling, Improved Recovery and Extensions should be combined and reported as “Extensions and Improved Recovery”.
December 31, 2013
Reconciliation of Company Net Interest Reserves
by Principal Product Type
Forecast Prices and Costs
|
| Total Oil |
| Residue & Solution Gas |
| Natural Gas Liquids |
| Oil Equivalent |
| ||||||||||||||||
FACTORS |
| Proved |
| Probable |
| Proved + |
| Proved |
| Probable |
| Proved + |
| Proved |
| Probable |
| Proved + |
| Proved |
| Probable |
| Proved + |
|
December 31, 2012 |
| 22.365 |
| 10,627 |
| 32.992 |
| 8,555 |
| 2,762 |
| 11,317 |
| 408 |
| 177 |
| 585 |
| 24,198 |
| 11,266 |
| 35,464 |
|
Discoveries |
| 0 |
| 0 |
| 0 |
| 0 |
| 0 |
| 0 |
| 0 |
| 0 |
| 0 |
| 0 |
| 0 |
| 0 |
|
Extensions* |
| 20 |
| 5 |
| 25 |
| 13 |
| 3 |
| 16 |
| 0 |
| 0 |
| 0 |
| 22 |
| 5 |
| 27 |
|
Infill Drilling* |
| 79 |
| (65 | ) | 14 |
| 0 |
| 0 |
| 0 |
| 0 |
| 0 |
| 0 |
| 79 |
| (65 | ) | 14 |
|
Improved Recovery* |
| 655 |
| (626 | ) | 29 |
| 0 |
| 0 |
| 0 |
| 0 |
| 0 |
| 0 |
| 655 |
| (626 | ) | 29 |
|
Technical Revisions |
| 453 |
| (414 | ) | 39 |
| 736 |
| (179 | ) | 557 |
| 28 |
| (42 | ) | (14 | ) | 604 |
| (486 | ) | 118 |
|
Acquisitions |
| 0 |
| 0 |
| 0 |
| 0 |
| 0 |
| 0 |
| 0 |
| 0 |
| 0 |
| 0 |
| 0 |
| 0 |
|
Dispositions |
| 0 |
| 0 |
| 0 |
| 0 |
| 0 |
| 0 |
| 0 |
| 0 |
| 0 |
| 0 |
| 0 |
| 0 |
|
Economic Factors |
| 0 |
| 0 |
| 0 |
| 0 |
| 0 |
| 0 |
| 0 |
| 0 |
| 0 |
| 0 |
| 0 |
| 0 |
|
Production |
| (1.460 | ) | 0 |
| (1.460 | ) | (1,520 | ) | 0 |
| (1,520 | ) | (46 | ) | 0 |
| (46 | ) | (1,759 | ) | 0 |
| (1,759 | ) |
December 31, 2013 |
| 22,113 |
| 9,527 |
| 31,640 |
| 7,783 |
| 2,586 |
| 10,369 |
| 390 |
| 135 |
| 525 |
| 23,800 |
| 10,093 |
| 33,893 |
|
* The above change categories correspond to standards set out in the COGE Handbook. For reporting under NI 51-101, reserves additions under Infill Drilling, Improved Recovery and Extensions should be combined and reported as “Extensions and Improved Recovery”.
Additional Information Relating to Reserves Data
Undeveloped Reserves
Proved and probable undeveloped reserves on a forecast price and cost basis have been estimated in accordance with procedures and standards contained in the COGE Handbook. Franco-Nevada holds both non-operating working interests and royalty interests in its oil & gas assets and, therefore, does not principally determine the development schedule of these oil & gas assets. The operators of these assets determine the development of these assets and Franco-Nevada’s role, as a working interest holder, will be limited to paying its working interest share of the expenses associated therewith. For proved undeveloped properties, see the preceding charts under “Reserves Data (Forecast Prices and Costs)”, “Net Present Values of Future Net Revenue (Before Income Taxes)” and “Net Present Values of Future Net Revenue (After Income Taxes)”.
Company Gross Reserves First Attributed by Year
Proved Undeveloped Reserves
|
| Light & Medium Oil |
| Heavy Oil (Mbbl) |
| Natural Gas (MMcf) |
| Natural Gas Liquids |
| Oil Equivalent (Mbbl) |
| ||||||||||
|
| * First |
| Total at |
| First |
| Total at |
| First |
| Total at |
| First |
| Total at |
| First | �� | Total at |
|
2010 |
| 180 |
| 481 |
| — |
| — |
| — |
| — |
| — |
| 171 |
| 180 |
| 652 |
|
2011 |
| 35 |
| 429 |
| — |
| — |
| — |
| — |
| — |
| 171 |
| 35 |
| 600 |
|
2012 |
| 437 |
| 4,639 |
| — |
| — |
| — |
| — |
| — |
| 171 |
| 437 |
| 4,810 |
|
2013 |
| 85 |
| 3,216 |
| — |
| — |
| — |
| — |
| — |
| — |
| 85 |
| 3,216 |
|
* “First Attributed” refers to reserves first attributed at year-end of the corresponding fiscal year.
Probable Undeveloped Reserves
|
| Light & Medium Oil |
| Heavy Oil (Mbbl) |
| Natural Gas (MMcf) |
| Natural Gas Liquids |
| Oil Equivalent (Mbbl) |
| ||||||||||
|
| * First |
| Total at |
| First |
| Total at |
| First |
| Total at |
| First |
| Total at |
| First |
| Total at |
|
2010 |
| 58 |
| 385 |
| — |
| — |
| — |
| — |
| — |
| 42 |
| 58 |
| 427 |
|
2011 |
| 15 |
| 340 |
| — |
| — |
| — |
| — |
| — |
| 42 |
| 15 |
| 382 |
|
2012 |
| 556 |
| 5,020 |
| — |
| — |
| — |
| — |
| — |
| 42 |
| 556 |
| 5,062 |
|
2013 |
| 33 |
| 3,678 |
| — |
| — |
| — |
| — |
| — |
| — |
| 33 |
| 3,678 |
|
* “First Attributed” refers to reserves first attributed at year-end of the corresponding fiscal year.
Significant Factors or Uncertainties
The process of evaluating reserves is inherently complex. It requires significant judgments and decisions based on available geological, geophysical, engineering and economic data. As circumstances change and additional data becomes available, reserve estimates also change. Estimates are reviewed and revised, either upward or downward, as warranted by the new information. Revisions are often required due to changes in well performance, prices, economic conditions and governmental restrictions. Revisions to reserve estimates can arise from changes in year-end prices, reservoir performance and geologic conditions or production. These revisions can be either positive or negative.
The reserve estimates contained herein are based on current production forecasts, prices and economic conditions. These factors and assumptions include among others: (i) historical production in the area compared with production rates from analogous producing areas; (ii) initial production rates; (iii) production decline rates; (iv) ultimate recovery of reserves; (v) success of future development activities; (vi) marketability of production; (vii) effects of government regulations; and (viii) other government levies imposed over the life of the reserves.
The evaluated oil & natural gas assets have no material extraordinary risks or uncertainties beyond those which are inherent in an oil & natural gas producing company. See “Risk Factors — Risks Related to Mining Operations and Oil & Natural Gas Operations”.
Future Development Costs
The table below sets out the development costs deducted in the estimation of future net revenue attributable to Franco-Nevada’s proved reserves reported in the GLJ Report using forecast prices and costs.
|
| Annual Capital Expenditure (C$000) |
| ||||||||||||||||||||||||||||
|
| 2014 |
| 2015 |
| 2016 |
| 2017 |
| 2018 |
| 2019 |
| 2020 |
| 2021 |
| 2022 |
| 2023 |
| 2024 |
| 2025 |
| Remainder |
| Total |
| Total 10% |
|
Total Proved |
| 5,277 |
| 3,943 |
| 3,616 |
| 2,984 |
| 2,032 |
| 1,584 |
| 1,470 |
| 1,346 |
| 1,257 |
| 1,134 |
| 854 |
| 621 |
| 6,064 |
| 32,183 |
| 19,790 |
|
Total Proved Plus Probable |
| 5,453 |
| 5,262 |
| 5,883 |
| 4,563 |
| 3,443 |
| 1,956 |
| 1,626 |
| 1,502 |
| 1,426 |
| 1,322 |
| 1,095 |
| 880 |
| 7,990 |
| 42,401 |
| 25,990 |
|
Franco-Nevada expects to fund its estimated future development costs from working capital. Franco-Nevada does not anticipate that such costs will make development of any asset uneconomic or will have any material impact on disclosed reserves or future net revenue. All costs are to be incurred in Canada.
Other Oil & Gas Information
Forward Contracts
Franco-Nevada does not have any forward contracts for oil or natural gas.
Additional Information Concerning Abandonment and Reclamation Costs
Franco-Nevada is liable for ongoing environmental obligations and for the ultimate abandonment and reclamation costs for its oil, gas and NGL assets (including surface leases, wells, facilities and pipelines) upon abandonment only in respect of its working interests including its net royalty interest in the Weyburn Unit. There are no ongoing obligations of Franco-Nevada on its royalty interests in oil & natural gas assets. Franco-Nevada identifies obligations related to its oil, gas and NGL assets by estimating the present value of expected future costs to reclaim and abandon these properties and the timing of costs to be incurred in future periods.
The estimates for abandonment are currently based on 92.7 net wells of which Franco-Nevada expects to incur such costs. Franco-Nevada anticipates the total amount of such costs to be approximately C$46,791,000 on an undiscounted basis (approximately C$8,622,000 discounted at 10 percent). Of this amount, Franco-Nevada anticipates that approximately C$794,000 (undiscounted) will be incurred in the next three financial years.
Tax Horizon
Franco-Nevada is taxable at an expected rate of approximately 26.56% on the revenue from the oil & natural gas royalty and working interests.
Costs Incurred
The following table sets out Franco-Nevada’s property acquisition, exploration and development costs for the fiscal year ended December 31, 2013.
|
| Proved |
| Unproved |
| |||||||||||
Location |
| Property |
| Exploration |
| Development |
| Property |
| Total |
| |||||
Canada (C$000) |
| $ | 824 |
| $ | — |
| $ | 6,361 |
| $ | — |
| $ | 7,185 |
|
Exploration and Development Activities
The following table summarizes the number and type of wells that Franco-Nevada drilled or participated in drilling for the fiscal year ended December 31, 2013. All of Franco-Nevada’s current exploration and development activities are in Canada.
|
|
|
|
|
| Net Wells Drilled |
| ||||||||
|
| Gross |
| Net |
| Oil |
| Gas |
| Service |
| Dry |
| Stratigraphic |
|
Exploratory Wells |
| — |
| — |
| — |
| — |
| — |
| — |
| — |
|
Development Wells |
| 18.0 |
| 0.4 |
| 0.2 |
| — |
| 0.2 |
| — |
| — |
|
|
|
|
|
|
|
|
|
|
|
|
|
|
|
|
|
Total (Canada) |
| 18.0 |
| 0.4 |
| 0.2 |
| — |
| 0.2 |
| — |
| — |
|
Production Estimates
The following tables present GLJ’s forecasted case for proved and proved plus probable average daily production by product type for 2014. All production is from Canada. The production of oil and natural gas liquids from the Weyburn Unit NRI will account for 63% of Franco-Nevada’s production of natural gas, natural gas liquids and oil for the 12 months ended December 31, 2014. The Weyburn Unit NRI is expected to account for 74% of all oil production and 18% of all natural gas liquids production.
2014 Average Daily Production from Total Proved Reserves (Forecast Case)
|
| Light and |
| Heavy Oil |
| Natural Gas |
| Natural Gas |
| ||||||||
|
| Gross |
| Net |
| Gross |
| Net |
| Gross |
| Net |
| Gross |
| Net |
|
Total Proved |
|
|
|
|
|
|
|
|
|
|
|
|
|
|
|
|
|
Weyburn Unit NRI |
| 3,118 |
| 2,724 |
| 0 |
| 0 |
| 0 |
| 0 |
| 21 |
| 21 |
|
Other Properties |
| 674 |
| 945 |
| 0 |
| 17 |
| 0 |
| 3,532 |
| 4 |
| 97 |
|
Total: Total Proved |
| 3,792 |
| 3,669 |
| 0 |
| 17 |
| 0 |
| 3,532 |
| 26 |
| 118 |
|
2014 Average Daily Production from Total Proved Plus Probable Reserves (Forecast Case)
|
| Light and |
| Heavy Oil |
| Natural Gas |
| Natural Gas |
| ||||||||
|
| Gross |
| Net |
| Gross |
| Net |
| Gross |
| Net |
| Gross |
| Net |
|
Total Proved Plus Probable |
|
|
|
|
|
|
|
|
|
|
|
|
|
|
|
|
|
Weyburn Unit NRI |
| 3,214 |
| 2,810 |
| 0 |
| 0 |
| 0 |
| 0 |
| 29 |
| 28 |
|
Other Properties |
| 696 |
| 973 |
| 0 |
| 17 |
| 0 |
| 3,600 |
| 6 |
| 100 |
|
Total: Total Proved Plus Probable |
| 3,910 |
| 3,782 |
| 0 |
| 17 |
| 0 |
| 3,600 |
| 34 |
| 128 |
|
Production History
The following table sets forth Franco-Nevada’s Oil & Gas Assets’ average daily production volumes for oil, natural gas and natural gas liquids, before deduction of royalties, for each fiscal quarter in 2013.
|
| Average Daily Production (boe/d)* |
| ||||||
2013 |
| Oil |
| Natural Gas |
| Natural Gas |
| Total |
|
First Quarter |
| 1,803 |
| 812 |
| 93 |
| 2,707 |
|
Second Quarter |
| 2,327 |
| 621 |
| 104 |
| 3,052 |
|
Third Quarter |
| 2,302 |
| 758 |
| 114 |
| 3,173 |
|
Fourth Quarter |
| 1,686 |
| 648 |
| 110 |
| 2,443 |
|
* Reflects net production from Weyburn NRI.
The following table sets forth Franco-Nevada’s Oil & Gas Assets’ average prices received, royalties paid, production costs and resulting netback for oil, natural gas and natural gas liquids for each fiscal quarter in 2013.
Oil ($C/bbl) |
| Q1 |
| Q2 |
| Q3 |
| Q4 |
| ||||
Price received |
| $ | 78.66 |
| $ | 82.08 |
| $ | 104.14 |
| $ | 81.76 |
|
Royalties Paid |
| 5.23 |
| 4.22 |
| 4.99 |
| 5.07 |
| ||||
Production costs |
| 4.95 |
| 3.44 |
| 4.29 |
| 5.01 |
| ||||
|
|
|
|
|
|
|
|
|
| ||||
Netback |
| $ | 68.47 |
| $ | 74.42 |
| $ | 94.86 |
| $ | 71.68 |
|
|
|
|
|
|
|
|
|
|
|
|
|
|
|
Natural Gas ($C/Mcf) |
| Q1 |
| Q2 |
| Q3 |
| Q4 |
| ||||
Price received |
| $ | 2.61 |
| $ | 3.20 |
| $ | 3.05 |
| $ | 3.64 |
|
Royalties Paid |
| — |
| — |
| — |
| — |
| ||||
Production costs |
| — |
| — |
| — |
| — |
| ||||
|
|
|
|
|
|
|
|
|
| ||||
Netback |
| $ | 2.61 |
| $ | 3.20 |
| $ | 3.05 |
| $ | 3.64 |
|
NGL($C/bbl) |
| Q1 |
| Q2 |
| Q3 |
| Q4 |
| ||||
Price received |
| $ | 70.81 |
| $ | 67.20 |
| $ | 60.67 |
| $ | 69.40 |
|
Royalties Paid |
| — |
| — |
| — |
| — |
| ||||
Production costs |
| — |
| — |
| — |
| — |
| ||||
|
|
|
|
|
|
|
|
|
| ||||
Netback |
| $ | 70.81 |
| $ | 67.20 |
| $ | 60.67 |
| $ | 69.40 |
|
The following table sets forth Franco-Nevada’s Oil & Gas Assets’ production volumes for oil, natural gas and natural gas liquids, for the twelve months ended December 31, 2013.
Production (Mboe) |
| Oil |
| Natural Gas |
| Natural Gas |
| Total |
|
|
|
|
|
|
|
|
|
|
|
Weyburn Unit |
| 604.2 |
| — |
| — |
| 604.2 |
|
Midale Unit |
| 43.7 |
| — |
| — |
| 43.7 |
|
Edson |
| — |
| 160.3 |
| 38.4 |
| 198.6 |
|
Other |
| 93.0 |
| 98.6 |
| — |
| 191.5 |
|
|
|
|
|
|
|
|
|
|
|
Total |
| 741.0 |
| 258.7 |
| 38.4 |
| 1,038.1 |
|
Definitions, Notes and Other Cautionary Statements
In the tables set forth above under the subheading “Statement of Reserves Data and Other Oil & Natural Gas Information” and elsewhere in this AIF, unless otherwise indicated, the following definitions and other notes are applicable.
“Gross” means:
(a) in relation to the Corporation’s interest in production or reserves, its “company gross reserves”, which are its working interest (operating or non-operating) share before deduction of royalties and without including any royalty interests of the Corporation;
(b) in relation to wells, the total number of wells in which the Corporation has an interest; and
(c) in relation to properties, the total area of properties in which the Corporation has an interest.
“Net” means:
(a) in relation to the Corporation’s interest in production or reserves its working interest (operating or non-operating) share after deduction of royalty obligations, plus the Corporation’s royalty interests in production or reserves;
(b) in relation to the Corporation’s interest in wells, the number of wells obtained by aggregating the Corporation’s working interest in each of its gross wells; and
(c) in relation to the Corporation’s interest in a property, the total area in which the Corporation has an interest multiplied by the working interest owned by the Corporation.
Definitions of Reserves:
Reserves Categories
Reserves are estimated remaining quantities of oil & natural gas and related substances anticipated to be recoverable from known accumulations, from a given date forward, based on:
(a) analysis of drilling, geological, geophysical and engineering data;
(b) the use of established technology; and
(c) specified economic conditions, which are generally accepted as being reasonable, and shall be disclosed.
Reserves are classified according to the degree of certainty associated with the estimates.
(a) Proved reserves are those reserves that can be estimated with a high degree of certainty to be recoverable. It is likely that the actual remaining quantities recovered will exceed the estimated proved reserves.
(b) Probable reserves are those additional reserves that are less certain to be recovered than proved reserves. It is equally likely that the actual remaining quantities recovered will be greater or less than the sum of the estimated proved plus probable reserves.
(c) Possible reserves are those additional reserves that are less certain to be recovered than probable reserves. It is unlikely that the actual remaining quantities recovered will exceed the sum of the estimated proved plus probable plus possible reserves.
Development and Production Status
Each of the reserves categories (proved, probable and possible) may be divided into developed and undeveloped categories:
(a) Developed reserves are those reserves that are expected to be recovered from existing wells and installed facilities or, if facilities have not been installed, that would involve a low expenditure (for example, when compared to the cost of drilling a well) to put the reserves on production. The developed category may be subdivided into producing and non-producing.
(i) | Developed producing reserves are those reserves that are expected to be recovered from completion intervals open at the time of the estimate. These reserves may be currently producing or, if shut-in, they must have previously been on production, and the date of resumption of production must be known with reasonable certainty. |
|
|
(ii) | Developed non-producing reserves are those reserves that either have not been on production, or have previously been on production, but are shut-in, and the date of resumption of production is unknown. |
(b) Undeveloped reserves are those reserves expected to be recovered from known accumulations where a significant expenditure (for example, when compared to the cost of drilling a well) is required to render them capable of production. They must fully meet the requirements of the reserves classification (proved, probable, possible) to which they are assigned.
In multi-well pools it may be appropriate to allocate total pool reserves between the developed and undeveloped categories or to subdivide the developed reserves for the pool between developed producing and developed non-producing. This allocation should be based on the estimator’s assessment as to the reserves that will be recovered from specific wells, facilities and completion intervals in the pool and their respective development and production status.
Levels of Certainty for Reported Reserves
The qualitative certainty levels referred to in the definitions above are applicable to “individual reserve entities” (which refers to the lowest level at which reserves calculations are performed) and to “reported reserves” (which refers to the highest level sum of individual entity estimates for which reserves are presented). Reported reserves should target the following levels of certainty under a specific set of economic conditions:
(a) at least a 90% probability that the quantities actually recovered will equal or exceed the estimated proved reserves;
(b) at least a 50% probability that the quantities actually recovered will equal or exceed the sum of the estimated proved plus probable reserves;
(c) at least a 10% probability that the quantities actually recovered will equal or exceed the sum of the estimated proved plus probable plus possible reserves.
A quantitative measure of the certainty levels pertaining to estimates prepared for the various reserves categories is desirable to provide a clearer understanding of the associated risks and uncertainties. However, the majority of reserves estimates will be prepared using deterministic methods that do not provide a mathematically derived quantitative measure of probability. In principle, there should be no difference between estimates prepared using probabilistic or deterministic methods.
Future Income Tax Expense
Future income tax expenses are estimated:
(a) making appropriate allocations of estimated unclaimed costs and losses carried forward for tax purposes between oil & gas activities and other business activities;
(b) without deducting estimated future costs that are not deductible in computing taxable income;
(c) taking into account estimated tax credits and allowances; and
(d) applying to the future pre-tax net cash flows relating to the Corporation’s oil & gas activities the appropriate year-end statutory tax rates, taking into account future tax rates already legislated.
“Development costs” means costs incurred to obtain access to reserves and to provide facilities for extracting, treating, gathering and storing the oil & gas from reserves. More specifically, development costs, including applicable operating costs of support equipment and facilities and other costs of development activities, are costs incurred to:
(a) gain access to and prepare well locations for drilling, including surveying well locations for the purpose of determining specific development drilling sites, clearing ground, draining, road building, and relocating public roads, gas lines and power lines to the extent necessary in developing the reserves;
(b) drill and equip development wells, development type stratigraphic test wells and service wells, including the costs of platforms and of well equipment such as casing, tubing, pumping equipment and wellhead assembly;
(c) acquire, construct and install production facilities such as flow lines, separators, treaters, heaters, manifolds, measuring devices and production storage tanks, natural gas cycling and processing plants, and central utility and waste disposal systems; and
(d) provide improved recovery systems.
“Development well” means a well drilled inside the established limits of an oil & gas reservoir, or in close proximity to the edge of the reservoir, to the depth of a stratigraphic horizon known to be productive.
“Exploration costs” means costs incurred in identifying areas that may warrant examination and in examining specific areas that are considered to have prospects that may contain oil & gas reserves, including costs of drilling exploratory wells and exploratory type stratigraphic test wells. Exploration costs may be incurred both before acquiring the related property and after acquiring the property. Exploration costs, which include applicable operating costs of support equipment and facilities and other costs of exploration activities, are:
(a) costs of topographical, geochemical, geological and geophysical studies, rights of access to properties to conduct those studies, and salaries and other expenses of geologists, geophysical crews and others conducting those studies;
(b) costs of carrying and retaining unproved properties, such as delay rentals, taxes (other than income and capital taxes) on properties, legal costs for title defence, and the maintenance of land and lease records;
(c) dry hole contributions and bottom hole contributions;
(d) costs of drilling and equipping exploratory wells; and
(e) costs of drilling exploratory type stratigraphic test wells.
“Exploration well” means a well that is not a development well, a service well or a stratigraphic test well.
“Service well” means a well drilled or completed for the purpose of supporting production in an existing field. Wells in this class are drilled for the following specific purposes: gas injection (natural gas, propane, butane or flue gas), water injection, steam injection, air injection, salt water disposal, water supply for injection, observation or injection for combustion.
Numbers may not add due to rounding.
The estimates of future net revenue presented do not represent fair market value.
The forecast price and cost assumptions assume the continuance of current laws and regulations.
See “Cautionary Note Regarding Mineral and Oil and Gas Reserve and Resource Estimates”.
RISK FACTORS
Investors should carefully consider all of the information disclosed in this AIF prior to investing in the securities of Franco-Nevada. In addition to the other information presented in this AIF, the following risk factors should be given special consideration when evaluating an investment in such securities.
Risks Related to the Business of Franco-Nevada
Changes in the market price of the commodities that underlie the royalty, stream, working and other interests will affect the profitability of Franco-Nevada and the revenue generated therefrom
The revenue derived by Franco-Nevada from its asset portfolio, working interests and investments will be significantly affected by changes in the market price of the commodities underlying the royalties, streams, working interests and investments. Franco-Nevada’s revenue will be particularly sensitive to changes in the price of gold, oil, natural gas, PGM and copper, as the revenue from these commodities represents the majority of the cash flow derived from the asset portfolio. Commodity prices, including those to which Franco-Nevada is exposed, fluctuate on a daily basis and are affected by numerous factors beyond the control of Franco-Nevada, including levels of supply and demand, industrial development levels, inflation and the level of interest rates, the strength of the U.S. dollar and geopolitical events in significant oil & natural gas producing countries. Such external economic factors are in turn influenced by changes in international investment patterns, monetary systems and political developments.
All commodities, by their nature, are subject to wide price fluctuations and future material price declines will result in a decrease in revenue or, in the case of severe declines that cause a suspension or termination of production by relevant operators, a complete cessation of revenue from royalties, streams or working interests applicable to one or more relevant commodities. Moreover, despite Franco-Nevada’s commodity diversification, the broader commodity market tends to be cyclical, and a general downturn in overall commodity prices could result in a significant decrease in overall revenue. Any such price decline may result in a material and adverse effect on Franco-Nevada’s profitability, results of operations and financial condition.
Gold, silver, and/or PGM are produced or will be produced as a by-product metal at some of the assets including the Palmarejo project, Sudbury project, MWS project, Cooke 4 project and Cobre Panama, therefore, production decisions and the economic cut-off applied to the reporting of gold, silver and PGM reserves and resources, as applicable, will be influenced by changes in the commodity prices of other metals at the mines. To some extent risks related to this will be mitigated by Franco-Nevada in respect of Cobre Panama as gold and silver deliveries under the stream are initially tied to the production of copper, the primary product to be produced at such project.
For Mineral Assets that are subject to stream agreements, in the event that the price of gold falls below the fixed price per ounce (subject to inflation adjustment), Franco-Nevada would not realize any profits.
The operation of the properties in which Franco-Nevada holds an interest is generally determined by third party property owners and operators, and Franco-Nevada has limited decision making power as to how these properties are operated, and the operators’ failure to perform could affect the revenues generated by Franco-Nevada
Franco-Nevada is not directly involved in the operation of mines. The revenue derived from the asset portfolio is based on production by third party property owners and operators. The owners and operators will generally have the power to determine the manner in which the relevant properties subject to the asset portfolio are exploited, including decisions to expand, continue or reduce, suspend or discontinue production from a property, decisions about the marketing of products extracted from the property and decisions to advance
exploration efforts and conduct development of non-producing properties. The interests of third party owners and operators and those of Franco-Nevada on the relevant properties may not always be aligned. As an example, it will usually be in the interest of Franco-Nevada to advance development and production on properties as rapidly as possible in order to maximize near-term cash flow, while third party owners and operators may take a more cautious approach to development as they are at risk on the cost of development and operations. The inability of Franco-Nevada to control the operations for the properties in which it has a royalty, stream or working interest may result in a material and adverse effect on Franco-Nevada’s profitability, results of operations and financial condition. In addition, the owners or operators may take action contrary to Franco-Nevada’s policies or objectives; be unable or unwilling to fulfill their obligations under their agreements with Franco-Nevada; have difficulty obtaining or be unable to obtain the financing necessary to move projects forward; or experience financial, operational or other difficulties, including insolvency, which could limit a third party’s ability to perform its obligations under the third party arrangements.
Franco-Nevada may not be entitled to any material compensation if any of the properties in which it holds a royalty, stream or other interest shuts down or discontinues their operations on a temporary or permanent basis. At any time, any of the operators of the properties in which it holds a royalty, stream or other interest or their successors may decide to suspend or discontinue operations.
The owners or operators of the projects in which Franco-Nevada holds an interest may from time to time announce transactions, including the sale or transfer of the projects or of the operator itself, over which Franco-Nevada has little or no control. If such transactions are completed it may result in a new operator controlling the project, who may or may not operate the project in a similar manner to the current operator which may positively or negatively impact Franco-Nevada. In the event any such transaction is announced, there is no certainty that such transaction will be completed, or completed as announced, and any consequences of such non-completion on Franco-Nevada may be difficult or impossible to predict.
Franco-Nevada will have limited access to data and disclosure regarding the operation of properties, which will affect its ability to assess the royalty’s/stream’s performance
As a royalty/stream holder, Franco-Nevada has varying access to data on the operations or to the actual properties themselves. This could affect its ability to assess the performance of the royalty/stream. This could result in delays in cash flow from that which is anticipated by Franco-Nevada based on the stage of development of the properties covered by the asset portfolio. In addition, some royalties/streams may be subject to confidentiality arrangements which govern the disclosure of information with regard to royalties/streams and, as such, Franco-Nevada may not be in a position to publicly disclose non-public information with respect to certain royalties/streams. The limited access to data and disclosure regarding the operations of the properties in which Franco-Nevada has an interest, may restrict Franco-Nevada’s ability to enhance its performance which may result in a material and adverse effect on Franco-Nevada’s profitability, results of operations and financial condition. Although when creating new royalty or stream agreements, we attempt to obtain these rights, there is no assurance that our efforts will be successful.
Franco-Nevada depends on its operators for the calculation of royalty/stream payments. It may not be able to detect errors and payment calculations may call for retroactive adjustments
Franco-Nevada’s royalty/stream payments are calculated by the operators of the properties on which Franco-Nevada has royalties/streams based on the reported production. Each operator’s calculation of our royalty/stream payments is subject to and dependent upon the adequacy and accuracy of its production and accounting functions, and errors may occur from time to time in the calculations made by an operator. Certain royalty/stream agreements require the operators to provide Franco-Nevada with production and operating information that may, depending on the completeness and accuracy of such information, enable Franco-Nevada to detect errors in the calculation of royalty/stream payments that it receives. Franco-Nevada does not, however, have the contractual right to receive production information for all of its royalty/stream interests. As a result, Franco-Nevada’s ability to detect royalty/stream payment errors through its royalty/stream monitoring program and its associated internal controls and procedures is limited, and the possibility exists that Franco-Nevada will need to make retroactive royalty/stream revenue adjustments. Some of our royalty/stream contracts provide us the right to audit the operational calculations and production data for the associated royalty/stream payments; however, such audits may occur many months following our recognition of the royalty/stream revenue and may require us to adjust our revenue in later periods.
The Palmarejo stream is significant to Franco-Nevada and other assets and properties may become significant to Franco-Nevada from time to time and any adverse development related to any such assets will affect the revenue derived from such assets
The stream on the Palmarejo project is currently significant to Franco-Nevada, although as new assets are acquired or move into production, the materiality of this asset will be reconsidered. Any adverse development affecting the operation of, production from or recoverability of mineral reserves from the Palmarejo project or any other significant property in the asset portfolio from time to time, such as, but not limited to, unusual and unexpected geologic formations, seismic activity, rock bursts, cave-ins, flooding and other conditions involved in the drilling and removal of material, any of which could result in damage to, or destruction of, mines and other producing facilities, damage to life or property, environmental damage, or the inability to hire suitable personnel and engineering contractors or secure supply agreements on commercially suitable terms, may have a material adverse effect on Franco-Nevada’s profitability, financial condition and results of operations. In addition, Franco-Nevada has no control over operational decisions made by the third party owners and operators of these projects. Any adverse decision made by the owners and operators, including for example, alterations to mine plans or production schedules, may impact the timing and amount of revenue that Franco-Nevada receives and may have a material and adverse effect on Franco-Nevada’s profitability, financial condition and results of operations. As mines on which Franco-Nevada has royalties/streams mature, it can expect overall declines in production over the years unless operators are able to replace reserves that are mined through mine expansion or successful new exploration.
Franco-Nevada is dependent on the payment of royalties/streams by the owners and operators of the relevant properties and any delay in or failure of such royalty/stream payments will affect the revenues generated by the asset portfolio
Franco-Nevada is dependent to a large extent upon the financial viability and operational effectiveness of owners and operators of the relevant royalty/stream properties. Payments from production generally flow through the operator and there is a risk of delay and additional expense in receiving such revenues. Payments may be delayed by restrictions imposed by lenders, delays in the sale or delivery of products, the ability or willingness of smelters and refiners to process mine products, delays in the connection of wells to a gathering system, blowouts or other accidents, recovery by the operators of expenses incurred in the operation of the royalty/stream properties, the establishment by the operators of reserves for such expenses or the insolvency of the operator. Franco-Nevada’s rights to payment under the royalties/streams must, in most cases, be enforced by contract without the protection of the ability to liquidate a property. This inhibits Franco-Nevada’s ability to collect outstanding royalties/streams upon a default. Additionally, some agreements may provide limited recourse in particular circumstances which may further inhibit Franco-Nevada’s ability to recover or obtain equitable relief in the event of a default under such agreements. In the event of a bankruptcy of an operator or owner, it is possible that an operator may claim that Franco-Nevada should be treated as an unsecured creditor and, therefore, have a limited prospect for full recovery of revenue. Failure to receive any payments from the owners and operators of the relevant properties may result in a material and adverse effect on Franco-Nevada’s profitability, results of operations and financial condition.
Certain royalty/stream interests and working interests are subject to rights in favour of others or third parties that could adversely affect the revenues generated from the asset portfolio
Some royalty/stream interests and working interests are subject to: (i) buy-down right provisions pursuant to which an operator may buy-back all or a portion of the royalty/stream, (ii) pre-emptive rights pursuant to which parties to operating and royalty/stream agreements have the right of first refusal or first offer with respect to a proposed sale or assignment of a royalty/stream to Franco-Nevada, or (iii) claw back rights pursuant to which the seller of a royalty/stream to Franco-Nevada has the right to re-acquire the royalty/stream. Holders may exercise these rights such that certain royalty/stream interests and working interests would not be available to Franco-Nevada.
The asset portfolio includes a number of royalty interests based on net profits, and the revenue derived from such royalty interests is dependent upon factors beyond the control of Franco-Nevada that may have an adverse effect on the overall revenues generated by the asset portfolio
Franco-Nevada holds a number of net profit royalties, equity interests and working interests in its asset portfolio. These royalties and other interests allow the operator to account for the effect of prevailing cost pressures on the project before calculating the royalty payable to Franco-Nevada. These cost pressures include costs of labour, equipment, fuel, electricity, environmental compliance, oil prices and numerous other capital,
operating and production inputs. Such costs will fluctuate in ways that are unpredictable and are beyond the control of Franco-Nevada, and can have a dramatic effect on the revenue payable to Franco-Nevada on these royalties and other interests. Any increase in the costs incurred by the operators on the applicable properties will likely result in a decline in the revenue received by Franco-Nevada. This will affect overall revenue generated by the asset portfolio which may have a material and adverse effect on Franco-Nevada’s profitability, financial condition, and results of operations.
Franco-Nevada may enter into acquisitions or other material royalty or streaming transactions at any time
Franco-Nevada is continuously reviewing opportunities to acquire existing royalties or streams, to create new royalty interests or streaming arrangements through the financing of mining projects or to acquire companies that hold royalties or streams. At any given time Franco-Nevada has various types of transactions and acquisition opportunities in various stages of active review, including submission of indications of interest and participation in discussions or negotiations in respect of such transactions. This process also involves the engagement of consultants and advisors to assist in analyzing particular opportunities. Any such acquisition or transaction could be material to Franco-Nevada and may involve the issuance of securities by Franco-Nevada or the incurring of indebtedness to fund any such acquisition. In addition, any such acquisition or other royalty or streaming transaction may have other transaction specific risks associated with it, including risks related to the completion of the transaction, the project operators or the jurisdictions in which assets may be acquired.
Additionally, Franco-Nevada may consider opportunities to restructure its royalties or stream arrangements where it believes such a restructuring may provide a long-term benefit to Franco-Nevada, even if such restructuring may reduce near-term revenues or result in Franco-Nevada incurring transaction related costs.
Franco-Nevada may enter into one or more acquisitions, restructurings or other royalty and streaming transactions at any time.
Franco-Nevada may experience difficulty attracting and retaining qualified management and technical personnel to efficiently operate its business
Franco-Nevada is dependent upon the continued availability and commitment of its key management, whose contributions to immediate and future operations of Franco-Nevada are of significant importance. The loss of any such key management could negatively affect business operations. From time to time, Franco-Nevada may also need to identify and retain additional skilled management and specialized technical personnel to efficiently operate its business. The number of persons skilled in the acquisition, exploration and development of royalties/streams and interests in natural resource properties is limited and competition for such persons is intense. Recruiting and retaining qualified personnel is critical to Franco-Nevada’s success and there can be no assurance of such success. If Franco-Nevada is not successful in attracting and retaining qualified personnel, Franco-Nevada’s ability to execute its business model and growth strategy could be affected, which could have a material and adverse impact on its profitability, results of operations and financial condition. Franco-Nevada does not intend to maintain “key man” insurance for any members of its management.
Increased competition for royalty/stream interests and resource investments could adversely affect Franco-Nevada’s ability to acquire additional royalties, streams and other investments in mineral and oil & natural gas properties
Many companies are engaged in the search for and the acquisition of mineral and oil & natural gas interests, and there is a limited supply of desirable mineral and oil & natural gas interests. The mineral exploration and mining and oil & natural gas businesses are competitive in all phases. Many companies are engaged in the acquisition of mining and oil & natural gas interests, including large, established companies with substantial financial resources, operational capabilities and long earnings records. Franco-Nevada may be at a competitive disadvantage in acquiring interests in these natural resource properties, whether by way of royalty, stream or other form of investment, as competitors may have greater financial resources and technical staffs. There can be no assurance that Franco-Nevada will be able to compete successfully against other companies in acquiring new natural resource properties and royalty/stream interests. In addition, Franco-Nevada may be unable to acquire royalties or streams at acceptable valuations which may result in a material and adverse effect on Franco-Nevada’s profitability, results of operations and financial condition.
Royalty/stream and other interests may not be honoured by operators of a project
Royalty/stream and other interests in natural resource properties are largely contractual in nature. Parties to contracts do not always honour contractual terms and contracts themselves may be subject to interpretation or technical defects. To the extent grantors of royalty/stream and other interests do not abide by their
contractual obligations, Franco-Nevada would be forced to take legal action to enforce its contractual rights. Such litigation may be time consuming and costly and there is no guarantee of success. Any pending proceedings or actions or any decisions determined adversely to Franco-Nevada, may have a material and adverse effect on Franco-Nevada’s profitability, results of operations, financial condition and the trading price of Franco-Nevada securities.
There may be unknown defects in the asset portfolio
A defect in a royalty, stream, working interest or equity interest and/or the underlying contract may arise to defeat or impair the claim of Franco-Nevada to such royalty, stream, working interest or equity interest. When Franco-Nevada acquired assets from Newmont it was not provided with title representations and warranties relating to the royalties and various equity interests in the Newmont Acquisition Agreement. Newmont only represented that it would transfer the extent of its interest in the assets to Franco-Nevada. If there was a defect in Newmont’s interest in the royalties, working interest or equity interest and/or the underlying contract, Franco-Nevada will not have any recourse against Newmont under the Newmont Acquisition Agreement. Unknown defects in the royalty, stream or other assets of Franco-Nevada may result in a material and adverse effect on Franco-Nevada’s profitability, results of operations, financial condition and the trading price of Franco-Nevada securities.
Current global financial conditions continue to be challenging
Global financial conditions have been characterized by increased volatility, with numerous financial institutions having either gone into bankruptcy or having to be rescued by government authorities. Global financial conditions could suddenly and rapidly destabilize in response to future events, as government authorities may have limited resources to respond to future crises. Global capital markets have continued to display increased volatility in response to global events. Future crises may be precipitated by any number of causes, including natural disasters, geopolitical instability, changes to energy prices or sovereign defaults.
Any sudden or rapid destabilization of global economic conditions could negatively impact Franco-Nevada’s ability, or the ability of the operators of the properties in which Franco-Nevada holds royalties, streams or other interests, to obtain equity or debt financing or make other suitable arrangements to finance their projects. Additionally, Franco-Nevada may be subject to counterparty risk and liquidity risk. Franco-Nevada is exposed to various counterparty risks including, but not limited to (i) through financial institutions that hold Franco-Nevada’s cash, (ii) through companies that have payables to Franco-Nevada, (iii) through Franco-Nevada’s insurance providers, and (iv) through Franco-Nevada’s lenders. Franco-Nevada is also exposed to liquidity risks in meeting its operating expenditure requirements in instances where cash positions are unable to be maintained or appropriate financing is unavailable. These factors may impact the ability of Franco-Nevada to obtain loans and other credit facilities in the future or to obtain them on terms favourable to Franco-Nevada. If increased levels of volatility continue or in the event of a rapid destabilization of global economic conditions, Franco-Nevada’s operations could be adversely impacted and the trading price of Franco-Nevada securities could be adversely affected.
Franco-Nevada’s revenue, earnings, the value of its treasury and the value it records for its assets are subject to variations in foreign exchange rates, which may adversely affect the revenue generated by the asset portfolio or cause adjustments to the recorded value of assets
Franco-Nevada’s royalty/stream interests are subject to foreign currency fluctuations and inflationary pressures, which may have a material and adverse effect on Franco-Nevada’s profitability, results of operations and financial condition. There can be no assurance that the steps taken by management to address variations in foreign exchange rates will eliminate all adverse effects and Franco-Nevada may suffer losses due to adverse foreign currency rate fluctuations.
The ability to pay dividends will be dependent on the financial condition of Franco-Nevada
Payment of dividends on the Common Shares is within the discretion of Franco-Nevada’s Board of Directors and will depend upon Franco-Nevada’s future earnings, cash flows, acquisition capital requirements and financial condition, and other relevant factors. Although Franco-Nevada currently pays a regular dividend, there can be no assurance that it will be in a position to declare dividends due to the occurrence of one or more of the risks described herein.
Changes in tax legislation or accounting rules could affect the profitability of Franco-Nevada
Changes to, or differing interpretation of, taxation laws or regulations in any of Canada, the United States, Mexico, Barbados, Australia or any of the countries in which Franco-Nevada’s assets or relevant contracting parties are located could result in some or all of Franco-Nevada’s profits being subject to additional taxation. No assurance can be given that new taxation rules or accounting policies will not be enacted or that existing rules will not be applied in a manner which could result in Franco-Nevada’s profits being subject to additional taxation or which could otherwise have a material adverse effect on Franco-Nevada’s profitability, results of operations, financial condition and the trading price of Franco-Nevada securities. In addition, the introduction of new tax rules or accounting policies, or changes to, or differing interpretations of, or application of, existing tax rules or accounting policies could make royalties, streams or other investments by Franco-Nevada less attractive to counterparties. Such changes could adversely effect Franco-Nevada’s ability to acquire new assets or make future investments.
Certain of Franco-Nevada’s directors and officers serve in similar positions with other public companies, which could put them in a conflict position from time to time
Certain of the directors and officers of Franco-Nevada also serve as directors or officers of, or have significant shareholdings in, other companies involved in natural resource exploration and development and, to the extent that such other companies may participate in the same ventures in which Franco-Nevada participates, or in ventures in which Franco-Nevada may seek to participate, the directors and officers of Franco-Nevada may have a conflict of interest in negotiating and concluding terms respecting the extent of such participation. In all cases where directors and officers have an interest in other companies, such other companies may also compete with Franco-Nevada for the acquisition of royalties/streams, or mineral or oil & natural gas property investments. Such conflicts of the directors and officers may result in a material and adverse effect on Franco-Nevada’s profitability, results of operations, financial condition and the trading price of Franco-Nevada securities.
Franco-Nevada can provide no assurance that it will be able to obtain adequate financing in the future or that the terms of such financing will be favourable and Franco-Nevada may have to raise additional capital through the issuance of additional equity, which could result in dilution to Franco-Nevada’s shareholders
There can be no assurance that Franco-Nevada will be able to obtain adequate financing in the future or that the terms of such financing will be favourable. Failure to obtain such additional financing could result in delay or postponement of further business activities which may result in a material and adverse effect on Franco-Nevada’s profitability, results of operations and financial condition. Franco-Nevada may require new capital to continue to grow its business and there are no assurances that capital will be available when needed, if at all. It is likely that, at least to some extent, such additional capital will be raised through the issuance of additional equity, which could result in dilution to shareholders.
If Franco-Nevada expands its business beyond the acquisition of royalty/stream interests, Franco-Nevada may face new challenges and risks which could affect its profitability, results of operations and financial condition
Franco-Nevada’s operations and expertise have been focused on the acquisition and management of royalty/stream interests. Franco-Nevada may pursue acquisitions outside this area, including acquiring and/or investing in, developing resource projects. Expansion of Franco-Nevada’s activities into new areas would present challenges and risks that it has not faced in the past, including many of the risks described under “Risks Related to Mining Operations and Oil & Natural Gas Operations”. The failure to manage these challenges and risks successfully may result in a material and adverse effect on Franco-Nevada’s profitability, results of operations, financial condition and the trading price of Franco-Nevada securities.
Potential litigation affecting the properties in which Franco-Nevada holds its royalty/stream interests could have an adverse effect on Franco-Nevada
Potential litigation may arise on a property on which Franco-Nevada holds or has a royalty/stream interest (for example, litigation between joint venture partners or between operators and original property owners or neighbouring property owners). As a royalty/stream holder, Franco-Nevada will not generally have any influence on the litigation and will not generally have access to data. Any such litigation that results in the cessation or reduction of production from a property (whether temporary or permanent) could have a material and adverse effect on Franco-Nevada’s profitability, results of operations, financial condition and the trading price of Franco-Nevada securities.
Risks Related to Mining Operations and Oil & Natural Gas Operations
Franco-Nevada is subject to the same risk factors as the properties in which it holds a royalty, stream or other interests
To the extent that they relate to the production of minerals or oil & natural gas from, or the continued operation of, the properties in which Franco-Nevada holds a royalty, stream or interest, Franco-Nevada will be subject to the risk factors applicable to the operators of such mines or projects.
The inability to add additional reserves to its asset portfolio through either the development of existing resources or the acquisition of new mineral or oil & natural gas producing assets could affect Franco-Nevada
The revenue generated by Franco-Nevada is principally based on the exploitation of mineral and oil & natural gas reserves on assets underlying the royalty/stream interests and on which Franco-Nevada has a royalty, stream or other interest. Such reserves are continually being depleted through extraction and the long-term viability of the asset portfolio depends on the replacement of reserves through new producing assets and increases in reserves on existing producing assets. While Franco-Nevada may be able to maintain all or a portion of its interest in its reserve inventory through acquisitions, its business model relies on the successful development of the non-producing properties in its asset portfolio. Exploration for minerals and energy resources is a speculative venture necessarily involving substantial risk. There is no certainty that the expenditures made by the operator of any given project will result in discoveries of commercial quantities of minerals or energy resources on properties underlying the asset portfolio. Even in those cases where a significant mineral or oil & natural gas deposit is identified, there is no guarantee that the deposit can be economically extracted. Substantial expenditures are required to establish reserves through drilling, to develop processes to extract the resources and, in the case of new properties, to develop the extraction and processing facilities and infrastructure at any site chosen for extraction. Although substantial benefits may be derived from the discovery of a major deposit, no assurance can be given that new reserves will be identified to replace or increase the amount of reserves currently in the asset portfolio. This includes mineral resources, as the resources that have been discovered have not been subjected to sufficient analysis to justify commercial operations or the allocation of funds required for development. The inability to add additional reserves or to replace existing reserves through either the development of existing resources or the acquisition of new mineral or oil & natural gas producing assets may result in a material and adverse effect on Franco-Nevada’s profitability, results of operations, financial condition and the trading price of Franco-Nevada securities.
Reserves and resources are estimates based on interpretation and assumption and actual production may differ from amounts identified in such estimates
The mineral and oil & natural gas reserves and resources on properties underlying Franco-Nevada’s royalty/stream interests are estimates only, and no assurance can be given that the estimated reserves and resources are accurate or that the indicated level of minerals and oil & natural gas will be produced. Such estimates are, in large part, based on interpretations of geological data obtained from drill holes and other sampling techniques. Actual mineralization or formations may be different from those predicted. Further, it may take many years from the initial phase of drilling before production is possible and during that time the economic feasibility of exploiting a discovery may change.
Resource estimates in particular must be considered with caution. Resource estimates for properties that have not commenced production are based, in many instances, on limited and widely spaced drill hole or other limited information, which is not necessarily indicative of the conditions between and around drill holes. Such resource estimates may require revision as more drilling or other exploration information becomes available or as actual production experience is gained. Further, resources may not have demonstrated economic viability and may never be extracted by the operator of a property. It should not be assumed that any part or all of the mineral resources on properties underlying Franco-Nevada’s royalty/stream interests constitute or will be converted into reserves. Market price fluctuations of the applicable commodity, as well as increased production and capital costs or reduced recovery rates, may render the proven and probable reserves on properties underlying Franco-Nevada’s royalty/stream interests unprofitable to develop at a particular site or sites for periods of time or may render reserves containing relatively lower grade mineralization uneconomic. Moreover, short-term operating factors relating to the reserves, such as the need for the orderly development of ore bodies or the processing of new or different ore grades, may cause reserves to be reduced or not extracted. Estimated reserves may have to be recalculated based on actual production experience. The economic viability of a mineral deposit may also be impacted by other attributes of a particular deposit, such as size, grade and proximity to infrastructure, governmental regulations and policy relating to price, taxes,
royalties, land tenure, land use permitting, the import and export of minerals and environmental protection and by political and economic stability. Any of these factors may require operators to reduce their reserves and resources, which may result in a material and adverse effect on Franco-Nevada’s profitability, results of operations, financial condition and the trading price of Franco-Nevada securities.
The exploration and development of mining and resource properties is inherently dangerous and subject to risks beyond the control of Franco-Nevada
Companies engaged in mining and oil & natural gas activities are subject to all of the hazards and risks inherent in exploring for and developing natural resource projects. These risks and uncertainties include, but are not limited to, environmental hazards, industrial accidents, labour disputes, increases in the cost of labour, social unrest, fires, changes in the regulatory environment, permitting and title risks, impact of non-compliance with laws and regulations, fires, explosions, blowouts, cratering, sour gas releases and spills, encountering unusual or unexpected geological formations or other geological or grade problems, unanticipated metallurgical characteristics or less than expected mineral recovery, encountering unanticipated ground or water conditions, cave-ins, pit wall failures, flooding, rock bursts, periodic interruptions due to inclement or hazardous weather conditions, earthquakes, seismic activity, other natural disasters or unfavourable operating conditions and losses. Should any of these risks or hazards affect a company’s exploration or development activities, it may (i) cause the cost of development or production to increase to a point where it would no longer be economic to produce the metal or oil & natural gas from the company’s resources or expected reserves, (ii) result in a write down or write-off of the carrying value of one or more projects, (iii) cause delays or stoppage of mining or processing, (iv) result in the destruction of properties, processing facilities or third party facilities necessary to the company’s operations, (v) cause personal injury or death and related legal liability, or (vi) result in the loss of insurance coverage. The occurrence of any of above mentioned risks or hazards could result in an interruption or suspension of operation of the properties in which Franco-Nevada holds a royalty/stream interest and have a material and adverse effect on Franco-Nevada’s profitability, results of operations, financial condition and the trading price of Franco-Nevada securities.
Title defects may result in a loss of entitlement to a property
A defect in the chain of title to any of the properties underlying the royalty/stream interests or necessary for the anticipated development or operation of a particular project to which a royalty/stream interest relates may arise to defeat or impair the claim of the operator to a property. In addition, claims by third parties or aboriginal groups in Canada and elsewhere may impact on the operator’s ability to conduct activities on a property to the detriment of Franco-Nevada’s royalty/stream interests. To the extent an owner or operator does not have title to the property, it may be required to cease operations or transfer operational control to another party. Many royalties/streams are contractual, rather than an interest in land, with the risk that an assignment or bankruptcy or insolvency proceedings by an owner will result in the loss of any effective royalty/stream interest in a particular property. Further, even in those jurisdictions where there is a right to record or register royalties/streams in land registries or mining recorders offices, such registrations may not necessarily provide any protection to the royalty/stream holder. Accordingly, the royalty/stream holder may be subject to risk from third parties. As a result, known title defects, as well as unforeseen and unknown title defects may impact operations at a project in which Franco-Nevada has a royalty/stream interest and may result in a material and adverse effect on Franco-Nevada’s profitability, results of operations, financial condition and the trading price of Franco-Nevada securities.
The operations in which Franco-Nevada holds a royalty, stream or other interest require various property rights, permits and licenses in order to conduct current and future operations, and delays or a failure to obtain or maintain such property rights, permits and licenses, or a failure to comply with the terms of any of such property rights, permits and licenses could result in interruption or closure of operations or exploration on the properties
Exploration, development and operation of mining and oil & natural gas properties are subject to laws and regulations governing health and worker safety, employment standards, environmental matters, mine development, project development, mineral production, permitting and maintenance of title, exports, taxes, labour standards, reclamation obligations, heritage and historic matters and other matters. Franco-Nevada, in respect of its own assets and operations, as well as the owners and operators of the properties in which Franco-Nevada holds a royalty, stream or other interest, require licenses and permits from various governmental authorities in order to conduct their operations. Future changes in such laws and regulations or in such licenses and permits could have a material adverse impact on the revenue Franco-Nevada derives from the royalty/stream interests. Such licenses and permits are subject to change in various circumstances
and are required to be kept in good standing through a variety of means, including cash payments and satisfaction of conditions of issue. Such licenses and permits are subject to expiration, relinquishment and/or termination without notice to, control of or recourse by Franco-Nevada. There can be no guarantee that Franco-Nevada or the operators of those properties in which Franco-Nevada holds a royalty, stream or other interest, will be able to obtain or maintain all necessary licenses and permits in good standing that may be required to explore, develop and operate the properties, commence construction or operation of mining or oil & natural gas facilities, or maintain operations that economically justify the cost. Any failure to comply with applicable laws and regulations, permits and licenses, or to maintain permits and licenses in good standing, even if inadvertent, could result in interruption or closure of exploration, development or mining operations or fines, penalties or other liabilities accruing to the owner or operator of the project. Any such occurrence could substantially decrease production or cause the termination of operations on the property and have a material and adverse effect on Franco-Nevada’s profitability, results of operations, financial condition and the trading price of Franco-Nevada securities.
Franco-Nevada is exposed to risks related to the permitting, construction, development and/or expansion in relation to the projects and properties it holds a royalty, stream or other interest
Many of the projects or properties in which Franco-Nevada holds an interest in are in the permitting, construction, development and/or expansion stage and such projects are subject to numerous risks, including, but not limited to delays in obtaining equipment, materials and services essential to the construction and development of such projects in a timely manner, delays or inability to obtain required permits, changes in environmental or other regulations, currency exchange rates, labour shortages, cost escalations and fluctuations in metal prices. There can be no assurance that the operators of such projects will have the financial, technical and operational resources to complete permitting, construction, development and/or expansion of such projects in accordance with current expectations or at all.
The operations in which Franco-Nevada holds an interest are subject to environmental laws and regulations that may increase the costs of doing business and may restrict the operations
All phases of the mining and the oil & natural gas business present environmental risks and hazards and are subject to environmental regulation pursuant to a variety of government laws and regulations. Compliance with such laws and regulations can require significant expenditures and a breach may result in the imposition of fines and penalties, which may be material. Environmental legislation is evolving in a manner expected to result in stricter standards and enforcement, larger fines and liability and potentially increased capital expenditures and operating costs. Any breach of environmental legislation by Franco-Nevada, as an owner or operator of a property, or by owners or operators of properties underlying the asset portfolio could have a material impact on the viability of the relevant property and impair the revenue derived from the owned property or applicable royalty/stream, which could have a material and adverse effect on Franco-Nevada’s profitability, results of operations, financial condition and the trading price of Franco-Nevada securities.
Additional costs may be incurred as a result of international climate change initiatives and may affect the availability of resources and cause business disruptions
Franco-Nevada acknowledges climate change as an international and community concern. Franco-Nevada supports and endorses various initiatives for voluntary actions consistent with international initiatives on climate change. In addition to voluntary actions, governments are moving to introduce climate change legislation and treaties at the international, national, state/provincial and local levels. Where legislation already exists, regulation relating to emission levels and energy efficiency is becoming more stringent. Some of the costs associated with reducing emissions can be offset by increased energy efficiency and technological innovation. However, if the current regulatory trend continues, Franco-Nevada expects this may result in increased costs at some of the operations underlying its royalty/stream interests.
Franco-Nevada is exposed to risks of changing political attitudes and stability and ensuing changes in government regulation in the countries in which it holds royalty, stream or other interests
The properties on which Franco-Nevada holds or will hold a royalty, stream or other interest are located in multiple legal jurisdictions and political systems. There is sovereign risk in investing in foreign countries, including the risk that the resource concessions may be susceptible to revision or cancellation by new laws, may not be renewed as anticipated or may otherwise be adversely impacted by changes in direction by the government in question. It is possible that changes in applicable laws, regulations, or in their enforcement or regulatory interpretation could result in adverse changes to mineral or oil & natural gas operations. These are matters over which Franco-Nevada has no control. There is no assurance that future political and economic
conditions in such countries will not result in the adoption of different policies or attitudes respecting the development and ownership of resources. Any such changes in policy or attitudes may result in changes in laws affecting ownership of assets, land tenure and resource concessions, licensing fees, taxation, royalties, price controls, exchange rates, export controls, environmental protection, labour relations, foreign investment, nationalization, expropriation repatriation of income and return of capital, which may affect both the ability to undertake exploration and development on, or production from, the properties in which Franco-Nevada holds a royalty, stream or other interest. In certain areas where Franco-Nevada holds a royalty, stream or other interest, the regulatory environment is in a state of continuing change, and new laws, regulations and requirements may be retroactive in their effect and implementation. Any changes in governmental laws, regulations, economic conditions or shifts in political attitudes or stability are beyond the control of Franco-Nevada and the owners and operators of the properties in which Franco-Nevada has an interest and such changes may result in a material and adverse effect on Franco-Nevada’s profitability, results of operations, financial condition and the trading price of Franco-Nevada securities.
Additionally, Franco-Nevada is indirectly exposed to the risks faced by the operators of the properties in which Franco-Nevada holds or will hold royalties, streams or other interests in foreign jurisdictions. These include risks related to political and economic instability, under-developed legal systems, inconsistencies in the application of local laws and other legal uncertainty, terrorism, military repression, political violence, crime, corruption, infectious diseases, unsophisticated infrastructure and inaccessibility.
Changes to western Canadian provinces’ royalty framework may have an adverse effect on the revenue generated by Oil & Gas Assets
In addition to federal regulation, each Canadian province has legislation and regulations that govern royalties, production rates and other matters. The royalty regime in a given province is a significant factor in the profitability of crude oil, natural gas liquids, sulfur and natural gas production. Royalties payable on production from lands other than Crown lands are determined by negotiation between the mineral freehold owner and the lessee, although production from such lands is subject to certain provincial taxes and royalties. Royalties from production on Crown lands are determined by governmental regulation and are generally calculated as a percentage of the value of gross production. The rate of royalties payable generally depends in part on prescribed reference prices, well productivity, geographical location, field discovery date, method of recovery and the type or quality of the petroleum product produced. Other royalties and royalty-like interests are, from time to time, carved out of the working interest owner’s interest through non-public transactions. These are often referred to as overriding royalties, gross overriding royalties, net profits interests, or net carried interests.
Occasionally the governments of the western Canadian provinces create incentive programs for exploration and development. Such programs often provide for royalty rate reductions, royalty holidays, or royalty tax credits and are generally introduced when commodity prices are low to encourage exploration and development activity by improving earnings and cash flow within the industry.
Any increased royalty burden may affect the operations of the owners or operators of properties underlying Franco-Nevada’s Oil & Gas Assets which may materially and adversely affect its profitability, results of operations, financial condition and the trading price of Franco-Nevada securities.
Proposed changes to U.S. federal mining and public land law could impose, among other things, royalties and fees paid to the U.S. government by mining companies and royalty holders
Periodically, members of the U.S. Congress have introduced bills which would supplant or alter the provisions of The General Mining Law of 1872 which governs the disposal of metallic minerals on lands owned by the federal government. Some of the production covered by Franco-Nevada’s royalties occurs on unpatented mining claims located on U.S. federal lands. The U.S. President’s proposed budgets for fiscal years 2014 and 2015 include the proposal to amend the U.S. mining law to impose a royalty on the production of metallic minerals from U.S. federal lands, and a reclamation fee on production from federal and other lands. In addition, legislation has been introduced in the U.S. Congress to implement the President’s proposal to amend the mining law. Such legislation, if enacted by the U.S. Congress, could substantially increase the cost of holding mining claims and could reduce the revenue Franco-Nevada receives from royalties on unpatented mining claims, and to a lesser extent, on other lands in the United States. Moreover, such legislation could significantly impair the ability of owners of properties subject to Franco-Nevada’s royalties to develop mineral resources on unpatented mining claims. Although it is impossible at this time to predict what royalties and fees may be imposed in the future, the imposition of such royalties and fees could adversely affect the potential for development of such mining claims and the economics of existing operating mines on federal
lands. Passage of such legislation may result in a material and adverse effect on Franco-Nevada’s profitability, results of operations, financial condition and the trading price of Franco-Nevada securities.
Adequate infrastructure may not be available to develop the properties in which Franco-Nevada has an interest
Mining, processing, development and exploration activities depend, to one degree or another, on adequate infrastructure. Reliable roads, bridges, power sources and water supply are important determinants, which affect capital and operating costs. Unusual or infrequent weather phenomena, sabotage, government or other interference in the maintenance or provision of such infrastructure could adversely affect the operations in which Franco-Nevada has a royalty/stream interest.
North American crude oil price differentials are expected to continue to be volatile throughout 2014 which will have an impact on crude oil prices for Canadian producers. Overall, supply in excess of current pipeline and refining capacity is expected to exist. Material structural changes are required to reduce these bottlenecks and the resulting price discounts. There are numerous projects proposed to alleviate pipeline bottlenecks in the United States, expand refinery capacity and expand or build new pipelines in Canada and the United States to source new markets, some of which are in the regulatory application phase. There can be no assurance that such regulatory approvals will be secured on a timely basis or at all.
Production is dependent on operators’ employees
Production from the properties in which Franco-Nevada holds an interest depends on the efforts of operators’ employees. There is intense competition for geologists and persons with mining expertise. The ability of the owners and operators of such properties to hire and retain geologists and persons with mining expertise is key to those operations. Further, relations with employees may be affected by changes in the scheme of labour relations that may be introduced by the relevant governmental authorities in the jurisdictions in which those operations are conducted. Changes in such legislation or otherwise in the relationships of the owners and operators of such properties with their employees may result in strikes, lockouts or other work stoppages, any of which could have a material adverse effect on such operations, results of operations and financial condition of Franco-Nevada. If these factors cause the owners and operators of such properties to decide to cease production at one or more of the properties, such decision could have a material adverse effect on the business and financial condition of Franco-Nevada.
Franco-Nevada is subject to risks related to certain operations in South Africa
Certain operators are subject to risks normally associated with the conduct of business in South Africa. Risks may include, among others, problems relating to power supply, labour disputes, delays or invalidation of governmental orders and permits, corruption, uncertain political and economic environments, civil disturbances and crime, arbitrary changes in laws or policies, foreign taxation and exchange controls, nationalization of assets, opposition to mining from environmental or other non-governmental organizations or changes in the political attitude towards mining, Black Economic Empowerment participation requirements, limitations on foreign ownership, power supply issues, limitations on repatriation of earnings, infrastructure limitations and increased financing costs. The above risks may limit, disrupt or negatively impact the operator’s business activities.
Indigenous Peoples
Various international and national, state and provincial laws, codes, resolutions, conventions, guidelines, treaties, and other materials relate to the rights of indigenous peoples. Franco-Nevada holds royalty/stream interests on operations located in some areas presently or previously inhabited or used by indigenous peoples. Many of these materials impose obligations on government to respect the rights of indigenous people. Some mandate that government consult with indigenous people regarding government actions which may affect indigenous people, including actions to approve or grant mining rights or permits. The obligations of government and private parties under the various international and national materials pertaining to indigenous people continue to evolve and be defined. Franco-Nevada’s current and future operations are subject to a risk that one or more groups of indigenous people may oppose continued operation, further development, or new development of those projects or operations on which Franco-Nevada holds a royalty or stream. Such opposition may be directed through legal or administrative proceedings or protests, roadblocks or other forms of public expression against Franco-Nevada or the operators’ activities. Opposition by indigenous people to such activities may require modification of or preclude operation or development of projects or may require the
entering into of agreements with indigenous people. Claims and protests of indigenous peoples may disrupt or delay activities of the operators of Franco-Nevada’s royalty/stream assets.
Franco-Nevada may be impacted by regulatory requirements under the U.S. public land and endangered species laws that limit or restrict access to federal lands for mineral exploration and development
Recent proposed rulemaking by the U.S. Department of the Interior would create a framework for the Secretary of the Interior to exercise authority under the Federal Land Policy and Management Act (“FLPMA”) to withdraw from mineral entry federal lands found to be critical habitat for Sage grouse. In addition, on March 23, 2010, the U.S. Fish & Wildlife Service published a rangewide “warranted but precluded” finding (75 FR 13909) that Sage grouse are entitled to protections under the federal Endangered Species Act (“ESA”), but are presently precluded by the need to focus federal resources on other, higher priority listing candidate species. If such proposed FLPMA rules are promulgated, or the Sage grouse are listed under the ESA, withdrawal of lands or use restrictions on Sage grouse habitat could impact explorers and developers of mineral deposits in the western U.S., including the operators of projects subject to Franco-Nevada’s royalties, by constraining or prohibiting exploration or development of new deposits or the development or expansion of existing mining projects impacted by such regulations.
Risks Related to Franco-Nevada’s securities
Franco-Nevada’s securities are subject to price volatility
Securities markets have a high level of price and volume volatility, and the market price of securities of many companies have experienced wide fluctuations in price which have not necessarily been related to the operating performance, underlying asset values or prospects of such companies. Factors unrelated to the financial performance or prospects of Franco-Nevada include macroeconomic developments in North America and globally, and market perceptions of the attractiveness of particular industries or asset classes. There can be no assurance that continued fluctuations in mineral and oil & natural gas prices will not occur. As a result of any of these factors, the market price of Franco-Nevada’s securities at any given time may not accurately reflect the long term value of Franco-Nevada.
In the past, following periods of volatility in the market price of a company’s securities, shareholders have instituted class action securities litigation against them. Such litigation, if instituted, could result in substantial cost and diversion of management attention and resources, which could significantly harm profitability and the reputation of Franco-Nevada.
There may be limitations on enforcement of civil judgments
Certain of the experts named elsewhere in this AIF are residents of countries other than Canada. A substantial portion of the assets of Franco-Nevada are located outside of Canada. As a result, it may be difficult for investors in Franco-Nevada’s securities to commence legal proceedings in Canada against these non-Canadian residents. In addition, it may not be possible for investors in Franco-Nevada’s securities to collect from Franco-Nevada or these non-Canadian residents judgments obtained in courts in Canada predicated on the civil liability provisions of securities legislation of certain of the provinces and territories of Canada. It may also be difficult for investors in Franco-Nevada’s securities to succeed in a lawsuit in the United States, based solely on violations of Canadian securities laws.
Additional issuance of securities by Franco-Nevada may dilute existing securityholders, reduce some or all of Franco-Nevada’s financial measures on a per share basis, reduce the trading price of the Common Shares or other Franco-Nevada securities or impede Franco-Nevada’s ability to raise future capital
Franco-Nevada may issue additional securities in the future in connection with acquisitions, strategic transactions, financings or for other purposes. To the extent additional securities are issued, Franco-Nevada’s existing securityholders could be diluted and some or all of Franco-Nevada’s financial measures could be reduced on a per share basis. Additionally, Franco-Nevada securities issued in connection with a transaction may not be subject to resale restrictions and, as such, the market price of Franco-Nevada’s securities may decline if certain large holders of Franco-Nevada securities or recipients of Franco-Nevada securities in connection with an acquisition, sell all or a significant portion of such securities or are perceived by the market as intending to sell such securities. In addition, such issuances of securities may impede Franco-Nevada’s ability to raise capital through the sale of additional equity securities in the future.
Franco-Nevada may be, or may become, a “passive foreign investment company,” which may result in adverse tax consequences for United States investors
If Franco-Nevada were to constitute a “passive foreign investment company” within the meaning of Section 1297 of the Code (a “PFIC”) for any year during a U.S. holder’s holding period, then certain potentially adverse U.S. federal income tax rules may affect the U.S. federal income tax consequences to such U.S. holder resulting from the acquisition, ownership and disposition of Common Shares.
The U.S. Treasury Department has not issued specific guidance on how the income and assets of a non-U.S. corporation such as Franco-Nevada (a company that derives a substantial part of its operating revenue from the sale of gold and other precious metals that it has agreed to purchase from mining companies) will be treated under the PFIC rules. Although the matter is not free from doubt, Franco-Nevada believes, on a more likely than not basis, that it was not a PFIC for the tax year ended December 31, 2013, and that it will not be a PFIC for its current tax year ending on December 31, 2014, and for the foreseeable future. Franco-Nevada, however, believes that it was a PFIC for its tax year ended December 31, 2011, and prior tax years.
The determination as to whether a corporation is, or will be, a PFIC for a particular tax year depends, in part, on the application of complex U.S. federal income tax rules, which are subject to differing interpretations. In addition, whether any corporation will be a PFIC for any tax year depends on its assets and income over the course of such tax year, and, as a result, Franco-Nevada’s PFIC status for its current tax year and any future tax year cannot be predicted with certainty. Accordingly, there can be no assurance that the Internal Revenue Service will not challenge the views of Franco-Nevada concerning its PFIC status. Each U.S. holder should consult its own tax advisor regarding the PFIC status of Franco-Nevada.
This risk factor is qualified in its entirety by the discussion set forth under the heading, “Certain United States Federal Income Tax Considerations” contained in the Franco-Nevada’s Annual Report on Form 40-F which has been filed with the SEC and can be found at the SEC’s website www.sec.gov.
Franco-Nevada’s business is subject to evolving corporate governance and public disclosure regulations that have increased both Franco-Nevada’s compliance costs and the risk of noncompliance, which could have an adverse effect on the price of Franco-Nevada’s securities
Franco-Nevada is subject to changing rules and regulations promulgated by a number of United States and Canadian governmental and self-regulated organizations, including the SEC, the Canadian Securities Administrators, the New York Stock Exchange, the Toronto Stock Exchange, and the Financial Accounting Standards Board. These rules and regulations continue to evolve in scope and complexity and many new requirements have been created in response to laws enacted by the United States Congress, making compliance more difficult and uncertain. For example, in July 2010, the Dodd-Frank Wall Street Reform and Consumer Protection Act (the “Dodd-Frank Act”) was enacted, which directs the SEC to adopt rules that will require Franco-Nevada to disclose on an annual basis certain payments made by Franco-Nevada, its subsidiaries or entities controlled by it, to the U.S. government and foreign governments, including sub-national governments. Previously adopted rules have been vacated by court ruling and have not yet been re-proposed. Further, Franco-Nevada’s efforts to comply with the Dodd-Frank Act, the rules and regulations promulgated thereunder, and other new rules and regulations have resulted in, and are likely to continue to result in, increased general and administrative expenses and a diversion of management time and attention from revenue-generating activities to compliance activities.
Franco-Nevada may fail to maintain the adequacy of internal control over financial reporting as per the requirements of the Sarbanes-Oxley Act
Section 404 of the Sarbanes-Oxley Act of 2002 (“SOX”) requires an annual assessment by management of the effectiveness of Franco-Nevada’s internal control over financial reporting and an attestation report by Franco-Nevada’s independent auditors addressing this assessment beginning with the fiscal year ended December 31, 2012. While Franco-Nevada’s internal control over financial reporting for the year ended December 31, 2013 were effective, Franco-Nevada may in the future fail to achieve and maintain the adequacy of its internal control over financial reporting, as such standards are modified, supplemented or amended from time to time, and Franco-Nevada may not be able to ensure that it can conclude on an ongoing basis that it has effective internal control over financial reporting in accordance with Section 404 of SOX. Franco-Nevada’s failure to satisfy the requirements of Section 404 of SOX on an ongoing, timely basis could result in the loss of investor confidence in the reliability of its financial statements, which in turn could harm Franco-Nevada’s business and negatively impact the trading price of its Common Shares. In addition, any failure to implement required new or improved controls, or difficulties encountered in their implementation,
could harm Franco-Nevada’s operating results or cause it to fail to meet its reporting obligations. Future acquisitions of companies may provide Franco-Nevada with challenges in implementing the required processes, procedures and controls in its acquired operations. Acquired companies may not have disclosure controls and procedures or internal control over financial reporting that are as thorough or effective as those required by securities laws currently applicable to Franco-Nevada.
No evaluation can provide complete assurance that Franco-Nevada’s internal control over financial reporting will detect or uncover all failures of persons within Franco-Nevada to disclose material information otherwise required to be reported. The effectiveness of Franco-Nevada’s controls and procedures could also be limited by simple errors or faulty judgments. In addition, should Franco-Nevada expand in the future, the challenges involved in implementing appropriate internal control over financial reporting will increase and will require that Franco-Nevada continue to improve its internal control over financial reporting. Although Franco-Nevada intends to devote substantial time and incur substantial costs, as necessary, to ensure compliance, Franco-Nevada cannot be certain that it will be successful in complying with Section 404 on an ongoing basis.
Franco-Nevada may become subject to burdensome regulatory requirements under U.S. laws regulating pension plans
Franco-Nevada may not qualify as an “operating company” for purposes of the Employee Retirement Income Security Act of 1974 (United States), as amended (“ERISA”). Consequently, if 25% or more of the issued Common Shares were held by private pension plans subject to ERISA or plans subject to the U.S. Internal Revenue Code’s “prohibited transaction” rules (such as individual retirement accounts), then Franco-Nevada’s assets would be treated as ERISA “plan assets”. As a result, Franco-Nevada could become subject to the ERISA regulatory regime, including, among other potentially burdensome regulatory requirements, heightened fiduciary duties owed to plan participants. While Franco-Nevada intends to monitor beneficial ownership of its Common Shares by ERISA plans, there can be no assurance that Franco-Nevada will not become subject to ERISA regulations in the future. If Franco-Nevada were subject to ERISA regulatory requirements, it could have a material and adverse effect on Franco-Nevada’s ability to manage its business and/or its results of operations and financial condition.
DIVIDENDS
The following table sets forth the dividends paid by Franco-Nevada for each of the three most recently completed financial years:
Dividends Paid |
| 2013 |
| 2012 |
| 2011(1) |
| |||
Per Common Share(2)(3) |
| $ | 0.72 |
| $ | 0.54 |
| $ | 0.32 |
|
In aggregate(2)(4) |
| $ | 101,812,960 |
| $ | 77,900,202 |
| $ | 49,220,260 |
|
(1) Beginning July 2011, the Corporation began declaring its dividend in US dollars.
(2) The exchange rate used to convert the dividends to C$ is the noon rate posted by the Bank of Canada on the day before the dividend declaration date.
(3) The C$ equivalents for 2013, 2012 and 2011 are $0.75, $0.54, and $0.38 respectively.
(4) The C$ equivalents for 2013, 2012 and 2011 are $105,478,407, $77,930,332, and $48,912,349 respectively.
Franco-Nevada has adopted a dividend policy to pay an adequate sustainable dividend as determined by its Board of Directors to qualify its Common Shares for large generalist institutional funds. In July 2010, Franco-Nevada began to declare and pay monthly dividends and, effective Q2 2014, the Board of Directors has determined to pay dividends on a quarterly basis. The Board of Directors may change the dividend policy at any time at its sole discretion and there is no assurance that Franco-Nevada will be able to pay any dividends or sustain any level of dividend payments. It is expected that the Board of Directors will conduct periodic reviews of Franco-Nevada’s dividend policy.
On July 9, 2013, Franco-Nevada adopted a DRIP to provide, among other things, eligible holders of Franco-Nevada’s Common Shares with a means to reinvest dividends declared and payable to them as shareholders (less any withholding tax) in additional Common Shares of Franco-Nevada. Currently, such Common Shares are issued from treasury at a 3% discount to the market price. The discount may be adjusted in future but cannot exceed 5%. Shareholders were able to participate in the DRIP starting with the October 2013 dividend payment.
CAPITAL STRUCTURE
The authorized share capital of Franco-Nevada consists of an unlimited number of Common Shares and an unlimited number of preferred shares of which, as of March 19 2014, 147,253,398 Common Shares and no preferred shares were outstanding.
Common Shares
Each Common Share carries the right to one vote at all meetings of shareholders of Franco-Nevada. There are no special rights or restrictions of any nature attached to the Common Shares. All Common Shares rank equally as to dividends, voting powers and participation in assets upon liquidation of Franco-Nevada.
Preferred Shares
The preferred shares may be issued in one or more series, each series to consist of such number of shares as may, before the issue thereof, be fixed by resolution of the Board of Directors. The directors shall determine before the issue thereof the designations, rights, privileges, restrictions and conditions attaching to the preferred shares of each series including the rate or amount of dividends or the method of calculating dividends, the dates of payment thereof, the redemption and/or purchase prices and terms and conditions of redemption and/or purchase, any voting rights, any conversion rights and any sinking fund or other provisions.
The preferred shares of each series will, with respect to payment of dividends and the distribution of assets in the event of liquidation, dissolution or winding up, rank on a parity with the preferred shares of every other series and be entitled to preference over the Common Shares and over any other shares ranking junior to the preferred shares. The preferred shares of any series may also be given such other preferences over the Common Shares and over any other shares ranking junior to the preferred shares as may be fixed by the directors.
Warrants
Franco-Nevada and its wholly-owned subsidiary FN GLW have outstanding certain warrants to purchase Common Shares, of which the following two classes are or have recently been listed and posted for trading.
2017 Warrants
The Corporation has outstanding as of the date hereof 6,510,769 warrants (including those issued in connection with the Lumina acquisition), each warrant entitling the holder to purchase one Common Share upon payment of C$75.00 until June 16, 2017 (the “2017 Warrants”). In addition, the Corporation has issued one special warrant which is exchangeable into 2,000,000 2017 Warrants upon the holder achieving certain permitting, development and financing criteria. The 2017 Warrants are listed and posted for trading on the TSX under the symbol “FNV.WT.A”.
2013 GLW Warrants
FN GLW recently had warrants outstanding, each warrant entitling the holder to acquire, at the holder’s election at the time of exercise, either 0.1556 of one Common Share or C$5.20 in cash, upon payment of C$10.00 (the “2013 GLW Warrants”). The 2013 GLW Warrants expired on July 8, 2013. The 2013 GLW Warrants were listed and posted for trading on the TSX under the symbol “FNV.WT.B”.
MARKET FOR SECURITIES
The Common Shares of Franco-Nevada are listed and posted for trading on the TSX and the NYSE in each case under the symbol “FNV”.
The 2017 Warrants are listed and posted for trading on the TSX under the symbol “FNV.WT.A”.
The 2013 GLW Warrants were listed and posted for trading on the TSX under the symbol “FNV.WT.B” until July 8, 2013 when they expired.
Trading Price and Volume
The following table sets forth the high and low prices and volumes for the Common Shares traded on the TSX and on the NYSE for the most recently completed financial year.
|
| Common Shares TSX |
| Common Shares NYSE |
| ||||||||
|
| High C$ |
| Low C$ |
| Volume |
| High $ |
| Low $ |
| Volume |
|
2013 |
|
|
|
|
|
|
|
|
|
|
|
|
|
January |
| 58.09 |
| 51.51 |
| 7,848,176 |
| 59.03 |
| 51.08 |
| 4,549,721 |
|
February |
| 55.08 |
| 48.16 |
| 9,580,897 |
| 55.20 |
| 47.01 |
| 5,303,366 |
|
March |
| 49.88 |
| 44.36 |
| 15,085,754 |
| 48.27 |
| 43.20 |
| 7,964,966 |
|
April |
| 46.46 |
| 35.48 |
| 16,317,588 |
| 45.69 |
| 34.53 |
| 13,694,325 |
|
May |
| 45.07 |
| 39.56 |
| 9,634,792 |
| 44.98 |
| 38.11 |
| 9,846,324 |
|
June |
| 44.89 |
| 33.05 |
| 11,329,120 |
| 43.67 |
| 31.54 |
| 10,007,833 |
|
July |
| 46.55 |
| 35.45 |
| 9,841,144 |
| 45.30 |
| 33.53 |
| 10,114,719 |
|
August |
| 50.93 |
| 39.69 |
| 13,017,380 |
| 48.46 |
| 38.09 |
| 11,921,521 |
|
September |
| 48.94 |
| 41.99 |
| 13,247,195 |
| 47.70 |
| 40.60 |
| 23,111,098 |
|
October |
| 48.82 |
| 41.49 |
| 9,431,728 |
| 46.77 |
| 40.02 |
| 13,511,668 |
|
November |
| 47.68 |
| 40.95 |
| 8,984,966 |
| 45.74 |
| 38.84 |
| 10,789,785 |
|
December |
| 44.20 |
| 39.41 |
| 10,073,710 |
| 41.75 |
| 36.92 |
| 15,514,276 |
|
2014 |
|
|
|
|
|
|
|
|
|
|
|
|
|
January |
| 55.10 |
| 43.38 |
| 10,830,167 |
| 49.41 |
| 40.67 |
| 14,821,362 |
|
February |
| 59.84 |
| 52.24 |
| 9,733,927 |
| 53.70 |
| 47.16 |
| 14,066,046 |
|
March (1-18) |
| 59.20 |
| 54.78 |
| 4,603,590 |
| 53.39 |
| 49.33 |
| 8,360,653 |
|
The following table sets forth the high and low prices and volumes for the 2017 Warrants and 2013 GLW Warrants traded on the TSX for the most recently completed financial year.
|
| 2017 Warrants |
| 2013 GLW Warrants |
| ||||||||
|
| High C$ |
| Low C$ |
| Volume |
| High C$ |
| Low C$ |
| Volume |
|
2013 |
|
|
|
|
|
|
|
|
|
|
|
|
|
January |
| 9.25 |
| 7.00 |
| 113,727 |
| 0.37 |
| 0.09 |
| 1,733,162 |
|
February |
| 7.84 |
| 6.30 |
| 238,796 |
| 0.135 |
| 0.035 |
| 1,615,032 |
|
March |
| 7.10 |
| 6.05 |
| 124,352 |
| 0.07 |
| 0.015 |
| 2,828,496 |
|
April |
| 7.10 |
| 3.74 |
| 299,471 |
| 0.07 |
| 0.005 |
| 1,134,800 |
|
May |
| 5.25 |
| 4.11 |
| 66,807 |
| 0.015 |
| 0.005 |
| 844,189 |
|
June |
| 5.00 |
| 3.10 |
| 132,535 |
| 0.005 |
| 0.005 |
| 376,000 |
|
July |
| 5.20 |
| 3.00 |
| 76,560 |
| — | (1) | — | (1) | — | (1) |
August |
| 8.20 |
| 4.02 |
| 148,037 |
| — |
| — |
| — |
|
September |
| 7.65 |
| 5.50 |
| 98,866 |
| — |
| — |
| — |
|
October |
| 6.50 |
| 5.25 |
| 46,881 |
| — |
| — |
| — |
|
November |
| 5.85 |
| 4.35 |
| 51,758 |
| — |
| — |
| — |
|
December |
| 5.25 |
| 4.25 |
| 33,991 |
| — |
| — |
| — |
|
2014 |
|
|
|
|
|
|
|
|
|
|
|
|
|
January |
| 8.15 |
| 5.00 |
| 523,196 |
| — |
| — |
| — |
|
February |
| 9.33 |
| 7.01 |
| 165,733 |
| — |
| — |
| — |
|
March (1-18) |
| 9.20 |
| 7.52 |
| 69,100 |
| — |
| — |
| — |
|
(1) July (1-8) as these warrants expired on July 8, 2013.
DIRECTORS AND OFFICERS
The following table sets forth, as at the date hereof, the name, province or state and country of residence, position held with Franco-Nevada and principal occupation of each director and executive officer of Franco-Nevada:
Name and Municipality of Residence |
| Position with Franco-Nevada(1) |
| Principal Occupation |
|
|
|
|
|
Pierre Lassonde Toronto, Ontario, Canada |
| Director and Chairman |
| Chair, Franco-Nevada |
|
|
|
|
|
David Harquail Toronto, Ontario, Canada |
| Director, President and Chief Executive Officer |
| President and Chief Executive Officer, Franco-Nevada |
|
|
|
|
|
Tom Albanese(3) Oxshott, Surrey, United Kingdom |
| Director |
| Chief Executive Officer, Vedanta Resources plc(4) |
|
|
|
|
|
Derek W. Evans(3) Calgary, Alberta, Canada |
| Director |
| President and CEO, Pengrowth Energy Corporation |
|
|
|
|
|
Graham Farquharson(2) Toronto, Ontario, Canada |
| Director |
| President, Strathcona Mineral Services Limited |
|
|
|
|
|
Louis Gignac(2)(3) Brossard, Quebec, Canada |
| Director |
| President, G Mining Services Inc. |
|
|
|
|
|
Randall Oliphant(3) Toronto, Ontario, Canada |
| Director |
| Executive Chairman, New Gold Inc. |
|
|
|
|
|
Hon. David R. Peterson(2) Toronto, Ontario, Canada |
| Director |
| Chairman, Cassels Brock & Blackwell LLP |
|
|
|
|
|
Sandip Rana Brampton, Ontario, Canada |
| Chief Financial Officer |
| Chief Financial Officer, Franco-Nevada |
|
|
|
|
|
Lloyd Hong Toronto, Ontario, Canada |
| Chief Legal Officer & Corporate Secretary |
| Chief Legal Officer & Corporate Secretary, Franco-Nevada |
|
|
|
|
|
Geoff Waterman Toronto, Ontario, Canada |
| Chief Operating Officer |
| Chief Operating Officer, Franco-Nevada |
|
|
|
|
|
Paul Brink Toronto, Ontario, Canada |
| Senior Vice President, Business Development |
| Senior Vice President, Business Development, Franco-Nevada |
(1) All of the directors have served since November 2007 with the exception of Derek Evans and Tom Albanese who were appointed in August 2008 and August 2013 respectively.
(2) Member of the Compensation and Corporate Governance Committee. Louis Gignac will become a member effective March 20, 2014.
(3) Member of the Audit and Risk Committee. Louis Gignac will cease to be a member effective March 20, 2014 and Tom Albanese will become a member on March 20, 2014.
(4) Effective April 1, 2014.
Each director’s term of office expires at the next annual meeting of shareholders of Franco-Nevada or when his successor is duly elected or appointed, unless his term ends earlier in accordance with the articles or by-laws of Franco-Nevada, he resigns from office or he becomes disqualified to act as a director of Franco-Nevada.
As of the date hereof, the directors and executive officers of Franco-Nevada, as a group, beneficially own, directly or indirectly, or exercise control or direction over an aggregate of 4,509,660 Common Shares, representing approximately 3.1% of the Common Shares outstanding.
Biographical information regarding the directors and executive officers of Franco-Nevada is provided as follows:
Pierre Lassonde, Director and Chair — Pierre Lassonde is Chair of the Board of Directors. Mr. Lassonde formerly served as President of Newmont from 2002 to 2006 and as a director and Vice-Chair of Newmont until November 30, 2007. Previously, Mr. Lassonde served as a director and President (1982 to 2002) and Co-Chief Executive Officer (1999 to 2002) of Old Franco-Nevada. Mr. Lassonde also served as President and Chief Executive Officer of Euro-Nevada Mining Corporation Limited from 1985 to 1999, prior to its amalgamation with Old Franco-Nevada. Mr. Lassonde served as a director of Normandy Mining Limited from 2001 to 2002. Mr. Lassonde is past Chair and a director of the World Gold Council, Chair of the Quebec National Art Museum and a director of New Gold Inc. and Enghouse Systems Limited. Mr. Lassonde received his Chartered Financial Analyst designation from the CFA Institute in 1984, a P. Eng (Association of Professional Engineers of Ontario) in 1976, a Master of Business Administration from the University of Utah in 1973, a B.Sc. (Electrical Engineering) from Ecole Polytechnique in 1971 and a B.A. from Seminaire de St. Hyacinthe/Université de Montréal in 1967. Mr. Lassonde was appointed a Member of the Order of Canada in 2002 and was inducted into the Canadian Mining Hall of Fame in 2013.
David Harquail, President, Chief Executive Officer and Director — David Harquail is President and Chief Executive Officer of the Corporation and is a director of the Corporation. Mr. Harquail served as Executive Vice President of Newmont (2006 to 2007) and previously served as President and Managing Director of Newmont Capital, the merchant banking division of Newmont (2002 to 2006). Prior to the acquisition by Newmont of Old Franco-Nevada in 2002, Mr. Harquail was with Old Franco-Nevada for a period of 15 years with the final position of Senior Vice President responsible for the metals royalty division and corporate development. Mr. Harquail has also held roles as President and Chief Executive Officer of Redstone Resources Inc., as a director of Inco Limited, Echo Bay Mines Limited, Kinross Gold Corporation and the Prospectors and Developers Association of Canada and as a task force advisor to the Toronto Stock Exchange. Mr. Harquail holds a B.A.Sc. in Geological Engineering from the University of Toronto, a Master’s degree in Business Administration from McGill University and is a registered Professional Engineer in Ontario.
Tom Albanese, Director — Tom Albanese will be, effective April 1, 2014, Chief Executive Officer and a director of Vedanta Resources plc and is a director of Franco-Nevada. From 2007 to January 2013, Mr. Albanese was Chief Executive Officer of Rio Tinto plc. Mr. Albanese previously served on the boards of Ivanhoe Mines Limited, Palabora Mining Company and Turquoise Hill Resources Limited. In addition, Mr. Albanese is a member of the Board of Visitors, Duke University, Fuqua School of Business. Mr. Albanese holds a Master’s of Science degree in Mining Engineering and a Bachelor of Science degree in Mineral Economics both from the University of Alaska Fairbanks.
Derek W. Evans, Director — Derek Evans is President and Chief Executive Officer of Pengrowth Energy Corporation (an oil and natural gas company), and is a director of Franco-Nevada. From May to September 2009, Mr. Evans was President and Chief Operating Officer of Pengrowth Energy Trust. Mr. Evans served as President and Chief Executive Officer of Focus Energy Trust from May 2002 until March 2008. Mr. Evans has over 30 years of experience in a variety of operational and senior management positions in the oil and gas business in Western Canada. Mr. Evans holds a Bachelor of Science degree in Mining Engineering from Queen’s University and is a registered Professional Engineer in Alberta. Mr. Evans is also a member of the Institute of Corporate Directors.
Graham Farquharson, Director — Graham Farquharson is President of Strathcona Mineral Services Limited (a mining consulting firm) and is a director of Franco-Nevada as well as a director of St Andrew Goldfields Ltd. Mr. Farquharson previously served on the boards of Placer Dome Inc., Cambior Inc. and several other mining companies. In addition, Mr. Farquharson is the Chair of the Canadian Mineral Industry Education Foundation. Mr. Farquharson holds a Bachelor of Science degree in Mining Engineering from the University of Alberta, a Master’s degree in Business Administration from Queen’s University and is a registered Professional Engineer in Ontario. Mr. Farquharson was inducted into the Canadian Mining Hall of Fame in 2010.
Louis Gignac, Director — Louis Gignac is President of G Mining Services Inc. (a private consultancy) and is a director of Franco-Nevada. Mr. Gignac previously served as President, Chief Executive Officer and a director of Cambior Inc. from its creation in 1986 until its acquisition by IAMGOLD Corporation in 2006. Mr. Gignac previously held management positions with Falconbridge Copper Company and Exxon Minerals Company and was a director of St Andrew Goldfields Ltd. and Marengo Mining Limited. Mr. Gignac also served as a professor in mining engineering at Laval University from 1979 to 1981. Mr. Gignac serves as a director of Domtar Corporation and is a member of the Ordre des ingénieurs du Québec. Mr. Gignac holds a Doctorate of Engineering in Mining Engineering from the University of Missouri Rolla, a Master’s degree in Mineral
Engineering from the University of Minnesota, and a Bachelor of Science degree in Mining Engineering from Laval University.
Randall Oliphant, Director — Randall Oliphant is Executive Chairman of New Gold Inc. (a gold mining company) and is a director of Franco-Nevada. Mr. Oliphant is a member of the advisory board for Metalmark Capital LLC and serves as a director of WesternZagros Resources Ltd. and Newmarket Gold Inc. Mr. Oliphant is the current Chairman of the World Gold Council and has also served on the boards and advisory boards of a number of companies and not-for-profit organizations. Mr. Oliphant held positions with Barrick Gold Corporation from 1987 to 2003 and served as Barrick’s President and Chief Executive Officer from 1999 to 2003. Mr. Oliphant received his Bachelor of Commerce degree in 1984 from the University of Toronto and his Certified Professional Accountant, CA designation in 1986.
Hon. David R. Peterson, Director — David Peterson is Chair of the law firm Cassels Brock & Blackwell LLP, and is a director of Franco-Nevada. He was the Premier of the Province of Ontario from 1985 to 1990. He was the founding Chair of the Toronto Raptors of the National Basketball Association and was Chair of the successful Toronto Bid for the 2015 Pan Am Games and is now the Chair of the 2015 Pan American and Parapan American Games Organizing Committee. Mr. Peterson serves as a director of a number of companies, including Rogers Communications Inc., Industrial-Alliance Insurance and Financial Services Inc., MBAC Fertilizer Corp. and Versapay Corporation. Mr. Peterson is Chancellor Emeritus of the University of Toronto and a director of St. Michael’s Hospital. Mr. Peterson holds an LL.B. from the University of Toronto, was called to the Bar of Ontario in 1969, appointed Queen’s Counsel in 1980 and summoned by Her Majesty to the Privy Council in 1992.
Sandip Rana, Chief Financial Officer — Sandip Rana joined Franco-Nevada on April 22, 2010. He was previously with Four Seasons Hotels and Resorts as Vice President, Corporate Finance. Prior to joining Four Seasons in 2003, Mr. Rana was International Controller and Treasurer of Old Franco-Nevada. Prior to that, Mr. Rana had experience at IMAX Corporation and Coopers & Lybrand. Mr. Rana is a Chartered Accountant and has a Bachelor of Business Administration from the Schulich School of Business at York University.
Lloyd Hong, Chief Legal Officer & Corporate Secretary — Lloyd Hong joined Franco-Nevada in December 2012. He was previously the Senior Vice-President, Legal Counsel and Assistant Secretary of Uranium One Inc. Prior to that, he was a partner with the Canadian law firm of Davis LLP with a practice focused on corporate finance and mergers and acquisitions. Mr. Hong holds a Bachelor of Commerce degree from the University of Alberta and a Bachelor of Laws degree from Queen’s University. Mr. Hong is a member of The Law Society of Upper Canada and The Law Society of British Columbia.
Geoff Waterman, Chief Operating Officer — Geoff Waterman has more than 21 years of association with Franco-Nevada’s asset portfolio and served as Vice President, Oil & Gas, of Newmont Capital from 2002 to 2007. Prior to that, he held increasingly senior roles at Old Franco-Nevada which he joined in 1992. Mr. Waterman was an auditor with Coopers & Lybrand and holds a Bachelor’s degree in economics from Trent University.
Paul Brink, Senior Vice President, Business Development — Paul Brink joined Newmont Capital in 2006 as Director of Corporate Development. Mr. Brink has experience in mining investment banking, working at BMO Nesbitt Burns and in project financing, working at UBS. Mr. Brink holds a Bachelor’s degree in Mechanical Engineering from the University of Witwatersrand and a Master’s degree in Management Studies from Oxford University.
Cease Trade Orders, Bankruptcies, Penalties or Sanctions
Except as set out below, no director or executive officer of Franco-Nevada (or where applicable, personal holding company of a director or executive officer):
(a) is, as at the date hereof, or has been, within 10 years before the date hereof, a director, chief executive officer or chief financial officer of any company (including the Company) that:
(i) was subject to an order that was issued while the director or executive officer was acting in the capacity as director, chief executive officer or chief financial officer, or
(ii) was subject to an order that was issued after the director or executive officer ceased to be a director, chief executive officer or chief financial officer and which resulted from an event that occurred while that person was acting in the capacity as director, chief executive officer or chief financial officer; or
(b) is, as at the date hereof, or has been, within 10 years before the date hereof, a director or executive officer of any company (including the Company) that, while that person was acting in that capacity, or within a year of that person ceasing to act in that capacity, became bankrupt, made a proposal under any legislation relating to bankruptcy or insolvency or was subject to or instituted any proceedings, arrangement, or compromise with creditors or had a receiver, receiver-manager or trustee appointed to hold its assets; or
(c) has, within 10 years before the date hereof, become bankrupt, made a proposal under any legislation relating to bankruptcy or insolvency, or become subject to or instituted any proceedings, arrangement or compromise with creditors, or had a receiver, receiver-manager or trustee appointed to hold the assets of the director or executive officer; or
(d) has been subject to:
(i) any penalties or sanctions imposed by a court relating to securities legislation or by a securities regulatory authority or has entered into a settlement agreement with a securities regulatory authority; or
(ii) any other penalties or sanctions imposed by a court or regulatory body that would likely be considered important to a reasonable investor in making an investment decision.
For the purposes of the above, “order” means: (i) a cease trade order; (ii) an order similar to a cease trade order, or (iii) an order that denied the relevant company access to any exemption under securities legislation, and, with respect to each, was in effect more than 30 consecutive days.
Conflicts of Interest
In the opinion of management of Franco-Nevada, there are no existing or potential conflicts of interest among Franco-Nevada, its directors, officers or other insiders of Franco-Nevada, other than as described in the following paragraph. Various officers, directors or other insiders of Franco-Nevada may hold senior positions with entities involved in the resource industry or otherwise be involved in transactions within the resource industry and may develop other interests outside Franco-Nevada. In the event that any such conflict of interest arises, a director who has such a conflict will be required to disclose the conflict to a meeting of the directors of Franco-Nevada and abstain from voting for or against the approval of such participation or such terms. In appropriate cases, Franco-Nevada will establish a special committee of independent directors to review a matter in which several directors, or management, may have a conflict. Any decision made by any of such directors involving Franco-Nevada will be required to be made in accordance with their duties and obligations to deal honestly and in good faith with a view to the best interests of Franco-Nevada.
Pierre Lassonde is currently a director and Randall Oliphant is currently Executive Chairman of New Gold Inc., a payor of two of Franco-Nevada’s royalty interests. Graham Farquharson is currently a director of St Andrew Goldfields Ltd., a payor of Franco-Nevada’s royalty interests. Conflicts of interest of these directors could arise from time to time in their capacities as directors or officers of these third parties.
LEGAL PROCEEDINGS AND REGULATORY ACTIONS
There are no outstanding material legal proceedings to which Franco-Nevada or any of its subsidiaries is a party or was a party to during fiscal 2013 or to which the royalty and stream interests comprising the asset portfolio is subject or was subject during fiscal 2013, and no proceedings are known to be contemplated against Franco-Nevada, any of its subsidiaries or any of the royalty or stream interests comprising the asset portfolio.
There have been no penalties or sanctions imposed against Franco-Nevada by a court relating to securities legislation or by a securities regulatory authority during fiscal 2013 and there have been no other penalties or sanctions imposed by a court or regulatory body against Franco-Nevada that would likely be considered important to a reasonable investor in making an investment decision. Franco-Nevada has not entered into any settlement agreement before a court relating to securities legislation or with a securities regulatory authority during fiscal 2013.
INTERESTS OF MANAGEMENT AND OTHERS IN MATERIAL TRANSACTIONS
No director or executive officer of Franco-Nevada, any other insider of Franco-Nevada or any associate or affiliate of any of such individuals or companies has any material interest, directly or indirectly, in any transaction within the three most recently completed financial years or during the current financial year that has materially affected Franco-Nevada or is reasonably expected to materially affect Franco-Nevada.
REGISTRAR AND TRANSFER AGENT
The registrar and transfer agent for the Common Shares is Computershare Investor Services Inc. at its principal office in Toronto, Ontario and Computershare Investor Services at its principal office in Golden, Colorado.
The warrant agent for the 2017 Warrants is Computershare Trust Company of Canada Limited at its principal office in Toronto, Ontario.
MATERIAL CONTRACTS
The following are the material contracts entered into by Franco-Nevada since October 17, 2007 (date of incorporation) and still in effect or entered into since the beginning of Franco-Nevada’s most recently completed financial year, other than material contracts entered into in the ordinary course of business (unless otherwise required to be disclosed):
1. a warrant indenture dated June 16, 2009 and supplemented June 15, 2010 between Franco-Nevada and Computershare Trust Company of Canada, as warrant agent, pursuant to which the 2017 Warrants were created and issued and by which they are governed;
2. a warrant indenture dated May 26, 2009 and supplemented February 4, 2010 and March 14, 2011 between FN GLW, Franco-Nevada and Computershare Trust Company of Canada pursuant to which two other classes of FN GLW warrants expiring in 2014 were created and issued and by which they are governed;
3. the 2011 Underwriting Agreement relating to the public offering in November 2011 described under “General Development of Franco-Nevada’s Business — 2011 Public Offering”;
4. the Cobre Panama Agreement described under “General Development of Franco-Nevada’s Business — Acquisition of Cobre Panama Precious Metals Stream”;
5. an Agreement of Purchase and Sale regarding Weyburn dated November 6, 2012 and amendment dated November 8, 2012 described under “General Development of Franco-Nevada’s Business — Acquisition of Weyburn Net Royalty Interest”; and
6. the Credit Agreement dated January 23, 2013 between Franco-Nevada, FN U.S. and Canadian Imperial Bank of Commerce, as Administrative Agent, and Canadian Imperial Bank of Commerce, RBC Capital Markets, BMO Capital Markets, as Co-Lead Arrangers and Joint Bookrunners, and Royal Bank of Canada, as Syndication Agent, and Bank of Montreal, as Documentation Agent, and the financial institutions and other persons from time to time party thereto as Lenders described under “General Development of Franco-Nevada’s Business — Credit Facility”.
A copy of each material contract is available on SEDAR under Franco-Nevada’s profile or FN GLW’s profile, as applicable, at www.sedar.com.
EXPERTS
The following is the technical report prepared in accordance with NI 43-101 from which certain technical and scientific information contained in this AIF was derived:
· Palmarejo Report — “Palmarejo Project SW Chihuahua State, Mexico, YE 2012 — Technical Report” dated January 1, 2013 prepared for Franco-Nevada by or under the supervision of Donald J. Birak, Senior Vice President — Exploration, Coeur at the time of the Palmarejo Report, Keith Blair, Manager, Applied Geoscience LLC at the time of the Palmarejo Report, and Klaus Triebel, Senior Corporate Resource Geologist, Coeur at the time of the Palmarejo Report, each of whom is a “qualified person” for the purposes of NI 43-101.
In addition, disclosure in this AIF for the reserves assessment and evaluation of the oil & gas reserves including the Weyburn Unit, Midale Unit and Edson Property was prepared by GLJ for Franco-Nevada and was dated February 18, 2014, with an effective date of December 31, 2013, in accordance with NI 51-101.
To the knowledge of Franco-Nevada, each of these experts held less than 1% of the outstanding Common Shares at the time of the preparation of the reports and/or at the time of the preparation of the technical information contained in this AIF. None of the aforementioned firms or persons, nor any directors, officers or employees of such firms, are currently, or are expected to be elected, appointed or employed as, a director, officer or employee of Franco-Nevada, or of any associate or affiliate of Franco-Nevada.
Franco-Nevada’s auditors are PricewaterhouseCoopers LLP. They have advised Franco-Nevada that they are independent with respect to Franco-Nevada within the meaning of the rules of professional conduct of the Institute of Chartered Accountants of Ontario.
ADDITIONAL INFORMATION
Additional information relating to Franco-Nevada is available electronically on SEDAR at www.sedar.com and on the website of the SEC at www.sec.gov and on its website at www.franco-nevada.com. The metric conversion table, listing of certain oil & gas terms, glossary of non-technical terms and glossary of technical terms are generally available on Franco-Nevada’s website.
Additional information, including directors’ and officers’ remuneration and indebtedness, principal holders of Franco-Nevada’s securities and securities authorized for issuance under equity compensation plans, will be contained in Franco-Nevada’s management information circular for its annual and special meeting of shareholders scheduled to be held on May 7, 2014. For information relating to compensation and corporate governance related matters, please see “Statement of Executive Compensation” and “Statement of Governance Practices”, respectively, in such circular.
Additional financial information is provided in Franco-Nevada’s financial statements and MD&A for its most recently completed financial year.
AUDIT AND RISK COMMITTEE INFORMATION
The following information is provided in accordance with Form 52-110F1 under the Canadian Securities Administrators’ National Instrument 52-110 — Audit Committees (“NI 52-110”).
Audit and Risk Committee Charter
The Audit and Risk Committee Charter (the “Charter”) is attached as Appendix C to this AIF. The Charter was last updated effective March 24, 2011 with minor revisions.
With respect to risk management, the Charter provides that the Audit and Risk Committee (the “ARC”) will generally review with management the Company’s significant risks and exposures and the steps management has taken to manage, monitor and control such risks and exposures. The ARC will also more specifically review the Company’s principal business, political, financial, litigation and control risks and exposures with a view to ensuring that such risks and exposures are being effectively managed, monitored or controlled. For more information regarding the ARC’s responsibilities relating to risk management, please see Appendix C to this AIF.
Composition of the Audit and Risk Committee
As of December 31, 2013, the ARC was composed of the following three directors: Derek Evans, Louis Gignac and Randall Oliphant, Chair. Effective March 20, 2014, the ARC will be composed of Derek Evans, Tom Albanese and Randall Oliphant, Chair. Each director was and is considered “independent” and “financially literate” (as such terms are defined in NI 52-110, the rules of the NYSE and Rule 10A-3 of the U.S. Securities Exchange Act of 1934).
Relevant Education and Experience
Each member of the ARC is financially literate, i.e., has the ability to read and understand financial statements. Collectively, the ARC has the education and experience to fulfill the responsibilities outlined in the Charter, including those relating to risk management. The education and current and past experience of each ARC member that is relevant to the performance of his responsibilities as an ARC member is summarized below:
| Education and Experience (Past and Present) | |
|
|
|
Tom Albanese | · | CEO of Vedanta Resources plc (effective April 1, 2014) |
| · | Previous Chief Executive Officer of Rio Tinto plc |
| · | Previous Chair of Rio Tinto plc Risk Committee |
|
|
|
Derek Evans | · | President, CEO and Director, Pengrowth Energy Corporation (2009-present) |
| · | Chairman of Endurance Energy (2008-present) |
| · | President, CEO and Director of Focus Energy Trust (2002-2008) |
| · | Senior Executive of Renaissance Energy (16 years) |
| · | Member, Institute of Corporate Directors |
|
|
|
Louis Gignac | · | President and Chief Executive Officer of Cambior Inc. (1986-2006) |
| · | Has served on several audit committees including Sceptre Resources Ltd., Domtar Inc., Domtar Corp. and St Andrew Goldfields Ltd. |
| · | Minor in Business, University of Minnesota |
|
|
|
Randall Oliphant | · | Executive Chairman and Director, New Gold Inc. (2009-present) |
| · | Chief Financial Officer of Barrick Gold Corporation (1994-1999) |
| · | Currently serving as Chair of the audit committee of WesternZagros Resources Ltd. |
| · | Certified Professional Accountant, CA (1986) |
| · | Bachelor of Commerce (with honours), University of Toronto, 1984 |
Pre-Approval Policies and Procedures
The Board of Directors, upon the recommendation of the ARC, has adopted policies and procedures regarding services provided by external auditors (collectively, the “Auditor Independence Policy”). Under the Auditor Independence Policy, specific proposals for audit services and permitted non-audit services must be pre-approved by the ARC. The ARC may delegate to any one or more of its members pre-approval authority (other than pre-approval of the annual audit service engagement). Any approvals granted under this delegated authority must be presented to the ARC at its next meeting. The Auditor Independence Policy also provides that the ARC may pre-approve services (other than the annual audit service engagement) without the requirement for a specific proposal where the scope and parameters of such services and their attendant fees are clearly defined. The ARC must be informed in writing at its next scheduled meeting of any engagement of the external
auditor to provide services in such circumstances. The Auditor Independence Policy deems de minimus non-audit services to have been pre-approved by the ARC in limited circumstances and subject to certain conditions being met.
The Auditor Independence Policy prohibits the external auditors from providing any of the following types of non-audit services:
· bookkeeping or other services related to the accounting records or financial statements;
· financial information systems design and implementation;
· appraisal or valuation services, fairness opinion, or contribution-in-kind reports;
· actuarial services;
· internal audit outsourcing services;
· management functions or human resources services;
· corporate finance or other services;
· broker-dealer, investment advisor or investment banking services;
· legal services; and
· any other service that under applicable law and generally accepted auditing standards cannot be provided by an external auditor.
The Auditor Independence Policy provides that the external auditor should not be precluded from providing tax or advisory services that do not fall within any the categories described above, unless the provision of those services would reasonably be expected to compromise the independence of the external auditor.
Reliance on Certain Exemptions
At no time since the commencement of Franco-Nevada’s most recently completed financial year has Franco-Nevada relied on any exemption from NI 52-110.
Audit Committee Oversight
At no time since the commencement of Franco-Nevada’s most recently completed financial year was a recommendation of the ARC to nominate or compensate an external auditor not adopted by the Board of Directors of Franco-Nevada.
Fees
For the periods ended December 31, 2013 and 2012, PricewaterhouseCoopers LLP billed fees from the Corporation as detailed below:
|
| December 31, 2013 |
| December 31, 2012 |
| ||
Audit Fees |
| C$ | 546,465 |
| C$ | 547,744 |
|
Audit-Related Fees |
| C$ | 117,900 |
| C$ | 22,700 |
|
Tax Fees |
| C$ | NIL |
| C$ | 28,000 |
|
Other Fees |
| C$ | 19,920 |
| C$ | 55,382 |
|
Total Fees |
| C$ | 684,285 |
| C$ | 653,826 |
|
For the year ended December 31, 2013, “Audit-Related Fees” noted above included C$20,000, C$14,500 and C$83,400 for services related to the Corporation’s shelf prospectus; issuance of a consent included with the registration statement on Form F-3; and French translation, respectively. For the year ended December 31, 2012, “Audit-Related Fees” noted above included C$22,000 for services related to the Corporation’s shelf prospectus.
For the years ended December 31, 2013 and 2012, “Tax Fees” noted above included C$NIL and C$28,000, respectively, for tax advice.
For the year ended December 31, 2013, “Other Fees” noted above included C$7,420 and C$12,500 for CPAB fees and Mexican labour laws advice, respectively. For the year ended December 31, 2012, “Other Fees” noted above included C$50,000 related to Sarbanes-Oxley controls and C$5,382 for CPAB fees.
APPENDIX A
FORM 51-101F2
Reports on Reserves Data
by
Independent Qualified Reserves Evaluator or Auditor
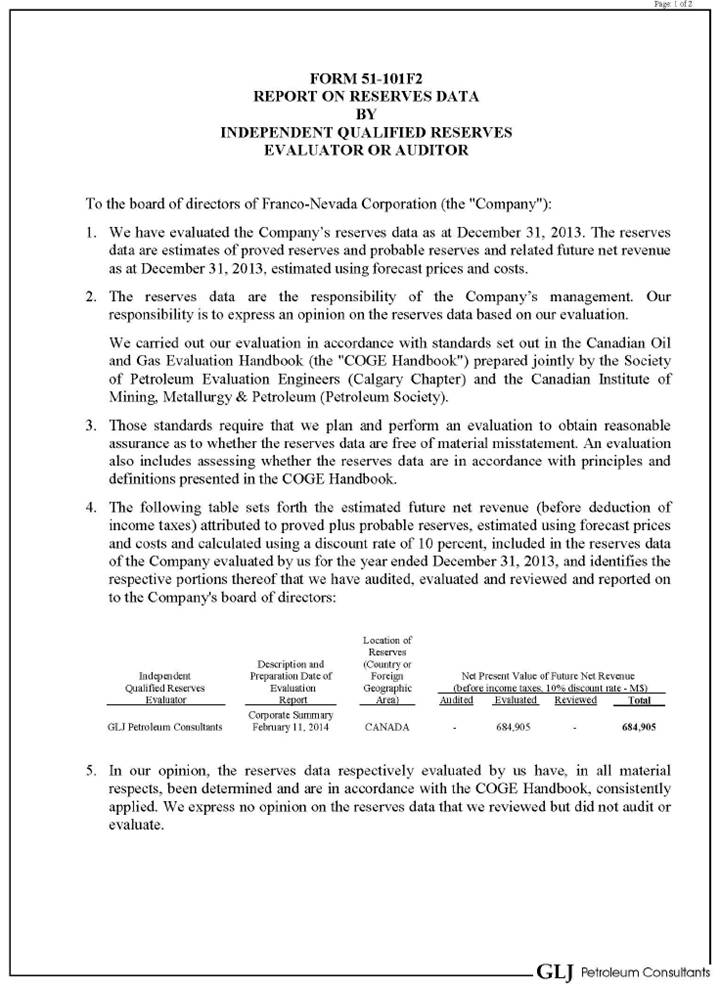
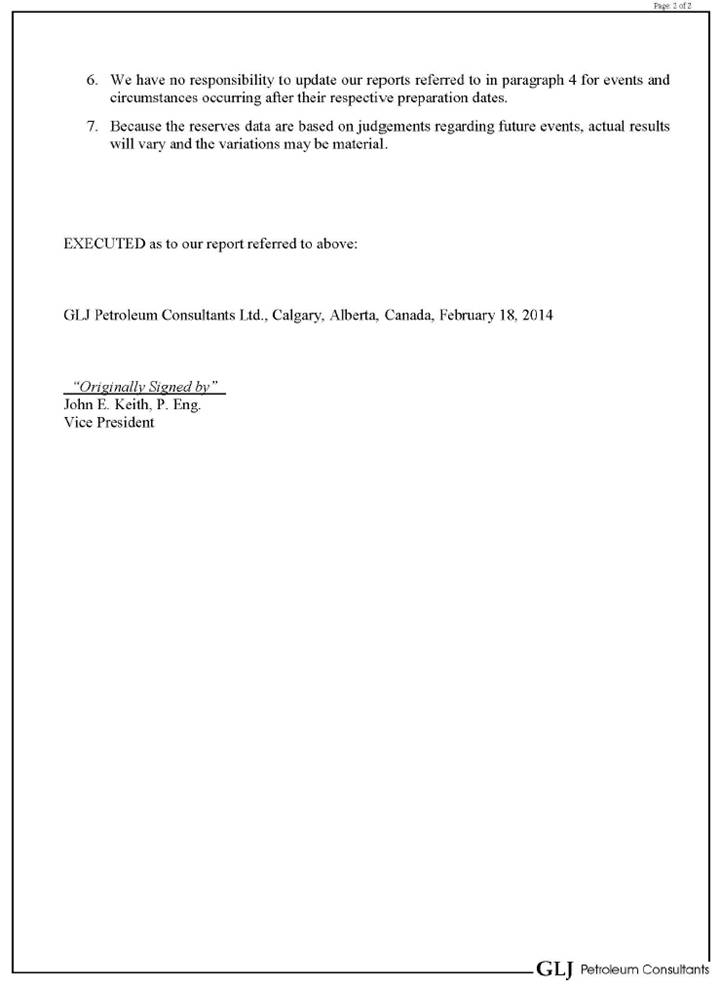
APPENDIX B
FORM 51-101F3
REPORT OF MANAGEMENT AND DIRECTORS ON OIL AND GAS DISCLOSURE
Management of Franco-Nevada Corporation (“Franco-Nevada”) is responsible for the preparation and disclosure of information with respect to Franco-Nevada’s oil and gas activities in accordance with securities regulatory requirements. This information includes reserves data, which are estimates of proved reserves and probable reserves and related future net revenue as at December 31, 2013 estimated using forecast prices and costs.
An independent qualified reserves evaluator has evaluated Franco-Nevada’s reserves data. The report of the independent qualified reserves evaluator is presented in Appendix A of this Annual Information Form.
The Audit and Risk Committee of the Board of Directors of Franco-Nevada has:
(a) reviewed Franco-Nevada’s procedures for providing information to the independent qualified reserves evaluator;
(b) met with the independent qualified reserves evaluator to determine whether any restrictions affected the ability of the independent qualified reserves evaluator to report without reservation; and
(c) reviewed the reserves data with management and independent qualified reserves evaluator.
The Audit and Risk Committee of the Board of Directors of Franco-Nevada has reviewed the procedures for assembling and reporting other information associated with oil and gas activities and has reviewed that information with management. The Board of Directors on the recommendation of the Audit and Risk Committee has approved:
(d) the content and filing with securities regulatory authorities of Form 51-101F1 containing reserves data and other oil and gas information;
(e) the filing of Form 51-101F2 which is the report of the independent qualified reserves evaluator on the reserves data; and
(f) the content and filing of this report.
Because the reserves data are based on judgments regarding future events, actual results will vary and the variations may be material.
DATED as of this 19th day of March, 2014.
(signed) “David Harquail” |
| (signed) “ Geoffrey Waterman” | |
David Harquail | Geoffrey Waterman |
| |
President, Chief Executive Officer and Director | Chief Operating Officer |
| |
|
|
| |
|
|
| |
(signed) “Randall Oliphant” |
| (signed) “Derek Evans” | |
Randall Oliphant | Derek Evans |
| |
Director | Director |
| |
APPENDIX C
FRANCO-NEVADA CORPORATION
AUDIT AND RISK COMMITTEE CHARTER
PURPOSE
The Audit and Risk Committee is appointed by the Board of Directors of Franco-Nevada Corporation (the “Company”) to assist the Board of Directors in its oversight and evaluation of:
· the quality and integrity of the financial statements of the Company,
· the compliance by the Company with legal and regulatory requirements in respect of financial disclosure,
· the qualification, independence and performance of the Company’s independent auditors,
· the performance of the Company’s Chief Financial Officer,
· risk management oversight,
· the compliance by the Company with legal and regulatory requirements in respect of its oil and gas disclosure, and
· the qualification, independence and performance of the Company’s qualified oil and gas reserves evaluator or auditor.
In addition, the Audit and Risk Committee provides an avenue for communication between the independent auditor, financial management, other employees and the Board of Directors concerning accounting and auditing matters.
The Audit and Risk Committee is directly responsible for the appointment, compensation, retention (and termination) and oversight of the work of the independent auditor (including oversight of the resolution of any disagreements between management and the independent auditor regarding financial reporting) for the purpose of preparing audit reports or performing other audit, review or attest services for the Company.
The Audit and Risk Committee is not responsible for:
· planning or conducting audits,
· certifying or determining the completeness or accuracy of the Company’s financial statements or that those financial statements are in accordance with applicable accounting principles or standards, or
· guaranteeing the report of the Company’s independent auditor.
The fundamental responsibility for the Company’s financial statements and disclosure rests with management. It is not the duty of the Audit and Risk Committee to conduct investigations, to itself resolve disagreements (if any) between management and the independent auditor or to ensure compliance with applicable legal and regulatory requirements.
REPORTS
The Audit and Risk Committee shall report to the Board of Directors of the Company on a regular basis and, in any event, before the public disclosure by the Company of its quarterly and annual financial results. The reports of the Audit and Risk Committee shall include any issues of which the Committee is aware with respect to the quality or integrity of the Company’s financial statements, its compliance with legal or regulatory requirements in respect of financial matters and disclosure, and the performance and independence of the Company’s independent auditor.
The Committee shall also prepare, as required by applicable law, any committee report required for inclusion in the Company’s publicly filed documents.
COMPOSITION
The members of the Audit and Risk Committee shall be three or more individuals who are appointed (and may be replaced) by the Board of Directors of the Company on the recommendation of the Company’s Compensation and Corporate Governance Committee. Each of the members of the Audit and Risk Committee
shall be “independent” and “financially literate” within the meaning of National Instrument 52-110 — Audit Committees (“NI 52-110”) and any other securities legislation and stock exchange rules applicable to the Company, and as confirmed by the Board of Directors using its business judgment. In addition, at least one member of the Audit and Risk Committee shall be a “financial expert” as determined by the Board of Directors in its business judgment. No member of the Audit and Risk Committee shall accept (directly or indirectly) any consulting, advisory or other compensatory fee from the Company or any of its subsidiaries or affiliates (collectively, the “Franco-Nevada Group”) (other than remuneration for acting in his or her capacity as a director) or be an “affiliated entity” within the meaning of NI 52-110.
RESPONSIBILITIES
Independent Auditors
The Audit and Risk Committee shall:
· Recommend to the Board of Directors the independent auditor to be nominated for the purpose of preparing or issuing an auditor’s report or performing other audit, review or attest services for the Company and the compensation of the independent auditor;
· Recommend to the Board of Directors any change of the independent auditor, and oversee any such change to ensure compliance with the provisions of the Canada Business Corporations Act and applicable securities legislation;
· Require and obtain confirmation from the independent auditor that it ultimately is accountable, and will report directly, to the Audit and Risk Committee and the Board of Directors of the Company;
· Oversee the work of the independent auditor engaged for the purpose of preparing or issuing an auditor’s report or performing other audit, review or attest services for the Company, including the resolution of disagreements between management and the external auditor regarding financial reporting;
· Pre-approve all audit and permitted non-audit services provided to the Company and its subsidiary entities by the independent auditor, including adopting policies and procedures for the pre-approval of the retention thereof (subject to any restrictions on such services imposed by applicable securities legislation) and including procedures for the delegation of authority to provide such approval to one or more members of the Audit and Risk Committee; and
· At least annually, review the qualifications, performance and independence of the independent auditor. In doing so, the Audit and Risk Committee should, among other things, undertake the measures set forth in Schedule “A”.
The Financial Statements, Audit Process and Related Disclosure
The Audit and Risk Committee shall:
· As may be delegated by the Board of Directors, review, approve and authorize the issuance of the Company’s interim financial statements, MD&A and interim earnings press releases before the Company publicly discloses this information;
· Review and recommend to the Board of Directors for approval the Company’s annual financial statements, MD&A and press releases before the Company publicly discloses the information; and
· Be satisfied that adequate procedures are in place for the review of the Company’s public disclosure of financial information extracted or derived from the Company’s financial statements and will periodically assess the adequacy of those procedures.
The Audit and Risk Committee shall also, as it determines to be appropriate:
· Review with management and the independent auditor,
· the planning and staffing of the audit by the independent auditor,
· financial information and any earnings guidance provided to analysts and rating agencies, recognizing that this review and discussion may be done generally (consisting of a discussion of the types of information to be disclosed and the types of presentations to be made) and need not take place in advance of the disclosure of each release or provision of guidance,
· any significant financial reporting issues and judgments made in connection with the preparation of the Company’s financial statements, including any significant changes in the selection or application of accounting principles or standards, any major issues regarding auditing principles and practices, and the adequacy of internal controls that could significantly affect the Company’s financial statements, as raised by the independent auditor, and review management’s response thereto,
· all critical accounting policies and practices used,
· all alternative treatments of financial information by applicable accounting principles or standards that have been discussed with management, ramifications of the use of such alternative disclosures and treatments, and the treatment preferred by the independent auditor,
· the use of “pro forma” or “adjusted” information that is not consistent with applicable accounting principles or standards,
· the effect of regulatory and accounting initiatives, as well as any off-balance sheet structures, transactions, arrangements and obligations (contingent or otherwise), on the Company’s financial statements,
· any disclosures concerning any weaknesses or any deficiencies in the design or operation of internal controls or disclosure controls made to the Audit and Risk Committee by the Chief Executive Officer and the Chief Financial Officer during their certification process for forms filed with applicable securities regulators, and
· the adequacy of the Franco-Nevada Group’s internal accounting controls and management information systems and its financial, auditing and accounting organizations and personnel and any special steps adopted in light of any material control deficiencies.
· Review with the independent auditor,
· the quality as well as the acceptability of the accounting principles or standards that have been applied,
· any problems or difficulties the independent auditor may have encountered during the provision of its audit-related services, including any restrictions on the scope of activities or access to requested information and any significant disagreements with management, any management letter provided by the independent auditor or other material communication (including any schedules of unadjusted differences) to management and the Company’s response to that letter or communication, and
· any changes to the Company’s significant auditing and accounting principles, standards and practices suggested by the independent auditor to members of management.
Risk Management Oversight
The Audit and Risk Committee shall:
· Generally review with management the Franco-Nevada Group’s significant risks and exposures and the steps management has taken to manage, monitor and control such risks and exposures.
· More specifically review the Company’s principal business, political, financial, litigation and control risks and exposures with a view to ensuring that such risks and exposures are being effectively managed, monitored or controlled by:
· reviewing the Company’s risk philosophy as set forth by management and the Board of Directors,
· reviewing management’s assessment of the significant risks and exposures facing the Company,
· reviewing management’s policies, plans, processes and programs to manage and control significant risks and exposures, including the Company’s loss prevention policies, disaster response and recovery programs, corporate liability protection programs for directors and officer and any other insurance programs, as applicable,
· receiving regular reports from management regarding the development and implementation of its policies, plans, processes and programs to manage, monitor and control significant risks and exposures, and
· if the Audit and Risk Committee deems it appropriate, requesting the independent auditor’s opinion of management’s assessment of significant risks facing the Company and how effectively they are managed, monitored and controlled.
Oil and Gas Reserves
The Audit and Risk Committee shall:
· Recommend to the Board of Directors the appointment of the qualified oil and gas reserves evaluators or auditors, who must be independent of the Company and who will report to the Board of Directors and the Committee on the Company’s oil and gas reserves data.
· Review, with reasonable frequency, the Company’s procedures relating to the disclosure of information with respect to oil and gas activities, including its procedures for complying with applicable disclosure requirements and restrictions.
· Review each appointment of the Company’s qualified oil and gas reserves evaluators or auditors, and in the case of any proposed change in such appointment, determine the reasons for the proposal and whether there have been disputes between the appointed qualified oil and gas reserves evaluator or auditor and management of the Company.
· Review, with reasonable frequency, the Company’s procedures for providing information to the qualified oil and gas reserves evaluators or auditors who report on oil and gas reserves data.
· Prior to approving the filing of oil and gas reserves data and the report of the qualified oil and gas reserves evaluators or auditors meet with management and each qualified oil and gas reserves evaluator or auditor to:
· determine whether any restrictions affect the ability of the qualified oil and gas reserves evaluator or auditor to report on the oil and gas reserves data without reservation; and
· review the oil and gas reserves data and the report of the qualified oil and gas reserves evaluator or auditor thereon.
· Recommend to the Board of Directors whether to approve:
· the content and filing of the statement of oil and gas reserves data and other required information,
· the filing of the report of the independent qualified oil and gas reserves evaluator or auditor, and
· the content and filing of the required report of management and the directors.
Compliance
The Audit and Risk Committee shall:
· Establish procedures for:
· the receipt, retention and treatment of complaints received by the Company regarding accounting, internal accounting controls or auditing matters, and
· the confidential, anonymous submission by employees of the Franco-Nevada Group of concerns regarding questionable accounting or auditing matters.
· Review and approve clear policies for the hiring by the Franco-Nevada Group of partners, employees or former partners or employees of the present and former independent auditor of the Company.
The Audit and Risk Committee shall also, as it determines appropriate:
· Obtain reports from the Chief Financial Officer, other members of management and the independent auditor that the Company’s subsidiary/foreign affiliated entities are in conformity with applicable legal requirements and the Company’s Code of Business Conduct and Ethics, including disclosures of insider and affiliated party transactions.
· Review with the Chief Financial Officer, other members of management and the independent auditor any correspondence with regulators or governmental agencies and any employee complaints or published reports, which raise material issues regarding the Company’s financial statements or accounting policies.
· Advise the Board of Directors of the Company with respect to the Franco-Nevada Group’s policies and procedures regarding compliance with applicable laws and regulations and with the Company’s Code of Business Conduct and Ethics.
· Review with the Chief Financial Officer legal matters that may have a material impact on the financial statements, the Franco-Nevada Group’s compliance policies and any material reports or inquiries received from regulators or governmental agencies.
· Periodically review with management the need for an internal audit function.
Delegation
To avoid any confusion, the Audit and Risk Committee responsibilities identified above are the sole responsibility of the Audit and Risk Committee and may not be delegated to a different committee.
MEETINGS
The Audit and Risk Committee shall meet at least quarterly and more frequently as circumstances require. All members of the Audit and Risk Committee should strive to be at all meetings. The Audit and Risk Committee shall meet separately, periodically, with management and the independent auditors and may request any officer or employee of the Franco-Nevada Group or the Franco-Nevada Group’s outside counsel or independent auditor to attend meetings of the Committee or with any members of, or advisors to, the Committee. The Audit and Risk Committee also may meet with the investment bankers, financial analysts and rating agencies that provide services to, or follow, the Franco-Nevada Group.
The Audit and Risk Committee may form and delegate authority to individual members and subcommittees where the Committee determines it is appropriate to do so.
INDEPENDENT ADVICE
In discharging its mandate, the Audit and Risk Committee shall have the authority to retain (and authorize the payment by the Company of) and receive advice from special legal, accounting or other advisors as the Audit and Risk Committee determines to be necessary to permit it to carry out its duties.
ANNUAL EVALUATION
At least annually, the Audit and Risk Committee shall, in a manner it determines to be appropriate:
· Perform a review and evaluation of the performance of the Committee and its members, including the compliance of the Audit and Risk Committee with this Charter.
· Review and assess the adequacy of its Charter and recommend to the Board of Directors any improvements to this Charter that the Committee determines to be appropriate.
SCHEDULE “A”
Qualifications, Performance and Independence of Independent Auditor
· Review the experience and qualifications of the senior members of the independent auditor’s team.
· Confirm with the independent auditor that it is in compliance with applicable legal, regulatory and professional standards relating to auditor independence.
· Review annual reports from the independent auditor regarding its independence and consider whether there are any non-audit services or relationships that may affect the objectivity and independence of the independent auditor and, if so, recommend that the Board of Directors of the Company take appropriate action to satisfy itself of the independence of the independent auditor.
· Obtain and review such report(s) from the independent auditor as may be required by applicable legal and regulatory requirements.
Updated: March 24, 2011