Exhibit 99.2
MANAGEMENT’S DISCUSSION AND ANALYSIS
This Management’s Discussion and Analysis (“MD&A”) of financial position and results of operations of Franco-Nevada Corporation (“Franco-Nevada”, the “Company”, “we” or “our”) has been prepared based upon information available to the Company as at November 5, 2014 and should be read in conjunction with the Company’s unaudited condensed interim consolidated financial statements and related notes as at and for the three and nine months ended September 30, 2014 and 2013. The unaudited interim condensed consolidated statements and MD&A are presented in U.S. dollars and have been prepared in accordance with International Financial Reporting Standards (“IFRS”) as issued by the International Accounting Standards Board applicable to the preparation of interim financial statements in accordance with IAS 34, Interim Financial Reporting.
Readers are cautioned that the MD&A contains forward-looking statements and that actual events may vary from management’s expectations. Readers are encouraged to read the Cautionary Statement on Forward-Looking Information at the end of this MD&A and to consult Franco-Nevada’s audited consolidated financial statements for the year ended December 31, 2013 and the corresponding notes to the financial statements which are available on the Company’s website at www.franco-nevada.com, on SEDAR at www.sedar.com and in our most recent Form 40-F filed with the Securities and Exchange Commission on EDGAR at www.sec.gov.
Additional information related to the Company, including the Company’s Annual Information Form, is available on SEDAR at www.sedar.com, and the Company’s Form 40-F is available on EDGAR at www.sec.gov. These documents contain detailed descriptions and maps of the Company’s producing and advanced royalty and stream assets. For additional information, the Company’s website can be found at www.franco-nevada.com.
Table of Contents
Overview | 3 |
Strategy | 3 |
Highlights | 4 |
Guidance | 6 |
Selected Financial Information | 8 |
Overview of Financial Performance — Q3 2014 to Q3 2013 | 9 |
Quarterly Financial Information | 19 |
Overview of Financial Performance — Nine Months 2014 to Nine Months 2013 | 20 |
Non-IFRS Financial Measures | 28 |
Financial Position, Liquidity and Capital Resources | 31 |
Capital Resources | 33 |
Critical Accounting Estimates | 34 |
Outstanding Share Data | 34 |
Risk Factors | 35 |
Internal Control Over Financial Reporting and Disclosure Controls and Procedures | 35 |
Cautionary Statement on Forward Looking Information | 37 |
Overview
Franco-Nevada is the leading gold-focused royalty and stream company by gold equivalent ounces (“GEOs”), gold revenues and number of gold assets. We do not operate mines, develop properties or conduct exploration. We own and continue to grow a large, diversified portfolio of royalties, streams and other assets that generate free cash-flow which is used to expand the portfolio and pay dividends. The Company’s shares trade under the symbol FNV on both the Toronto and New York stock exchanges. Franco-Nevada has outperformed the gold price and all relevant benchmarks since its initial public offering. Management believes this outperformance is attributable to:
· the lower risk royalty business model using a diversified portfolio, including oil, and exposure to optionality;
· growing revenues, cash-flow and dividends through organic growth and acquisitions of lower risk, high-margin assets; and
· focusing on gold.
Franco-Nevada provides yield and more upside than a gold ETF with less risk than an operating gold company. The business model benefits from rising commodity prices and new discoveries while limiting exposure to operating and capital cost inflation. Franco-Nevada has a robust balance sheet with assets generating high margins from projects in stable jurisdictions. As at September 30, 2014, Franco-Nevada had $1,312.3 million in working capital, and currently has an undrawn $500.0 million credit facility from which to fund current commitments and future acquisitions.
Strategy
Franco-Nevada’s management aims to continue to build a high quality, manageable business that provides its shareholders with superior long-term returns by:
· Growing a diversified royalty and stream portfolio of cash-flowing assets. Franco-Nevada currently has 47 mineral and 137 oil & gas interests generating revenue;
· Paying dividends, with Franco-Nevada having increased its dividend for 7 consecutive years; and
· Maintaining a low cost structure with margins in excess of 80%.
Highlights
Financial — 3 months
· 70,071 Gold Equivalent Ounces (“GEOs”)1 earned (2013 — 56,6831 2), an increase of 23.6% over Q3 2013;
· Revenue of $107.6 million (2013 - $98.8 million), an increase of 8.9%;
· Net income of $33.2 million, or $0.22 per share (2013 — $35.3 million or $0.24 per share);
· Adjusted Net Income3 of $34.5 million, or $0.23 per share (2013 - $35.3 million or $0.24 per share);
· Adjusted EBITDA(3) of $88.7 million, or $0.59 per share (2013 - $80.3 million or $0.55 per share); and
· Margin(3) of 82.4% (2013 — 81.3%).
Financial — 9 months
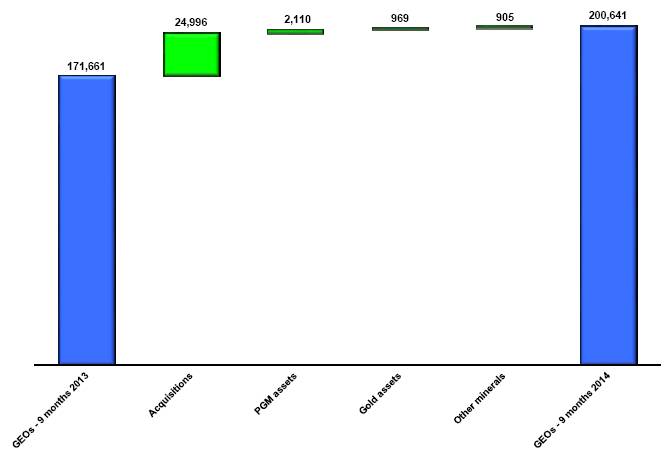
· 200,641 GEOs(1) earned (2013 — 171,661(1) (2)), an increase of 16.9% over 2013;
· Revenue of $319.4 million (2013 - $300.9 million), an increase of 6.1% despite a 11.6% lower average gold price;
· Net income of $105.5 million, or $0.71 per share (2013 — $92.3 million or $0.63 per share);
· Adjusted Net Income(3) of $104.8 million, or $0.71 per share (2013 - $107.8 million or $0.74 per share);
· Adjusted EBITDA(3) of $260.7 million, or $1.75 per share (2013 - $245.2 million or $1.67 per share); and
· Margin(3) of 81.6% (2013 — 81.5%).
Corporate
Candelaria Gold and Silver Stream
On October 6, 2014, the Company announced its agreement to acquire a gold and silver stream on production from the Candelaria project located in Chile from Lundin Mining Corporation (“Lundin”) following Lundin’s acquisition of Candelaria from Freeport-McMoRan Inc. The transaction closed November 3, 2014 with an effective date of July 1, 2014. The Company provided an up-front deposit of $648.0 million to acquire the gold and silver stream and subscribed for C$25.0 million in Lundin’s subscription receipts offering. The
1 Gold Equivalent Ounces (“GEOs”) include our gold, platinum, palladium and other mineral assets. GEOs are estimated on a gross basis for NSR royalties and, in the case of stream ounces, before the payment of the per ounce contractual price paid by the Company. For NPI royalties, GEOs are calculated taking into account the NPI economics. Platinum, palladium and other minerals were converted to GEOs by dividing associated revenue, excluding settlement adjustments, by the average gold price for the period. For average commodity prices used in calculation of GEOs, please refer to average commodity price tables on pages 14 and 23 of this MD&A.
2 For Q3 2013, the calculation of GEOs earned from the Sudbury assets was amended which resulted in a decrease of 769 GEOs previously reported. For the nine months ended September 30, 2013, the amendment resulted in an increase of 2,629 GEOs previously reported.
3 Adjusted Net Income, Adjusted EBITDA and Margin are non-IFRS financial measures with no standardized meaning under IFRS. For further information and a detailed reconciliation, please see pages 28-31 of this MD&A.
Company expects 35,000 to 40,000 applicable GEOs from Candelaria for 2014 and expects to sell, and record as revenue, 20,000 to 30,000 GEOs, prior to the end of 2014.
Palmarejo Gold Stream
On October 2, 2014, the Company acquired a new 50% gold stream on Coeur Mining Inc.’s (“Coeur”) Palmarejo project located in Mexico. Under the terms of the new agreement, the Company will fund a $22.0 million deposit which will be used to partially fund the development of the Guadalupe underground mine. The $22.0 million deposit will be paid in instalments commencing January 15, 2015 and ending on January 15, 2016. The new gold stream will become effective following the completion of the minimum obligation under Franco-Nevada’s existing Palmarejo gold stream. The Company agreed to terminate its existing gold stream on Palmarejo following the completion of the 400,000 ounce minimum obligation in exchange for a cash payment of $2.0 million. Depletion expense related to Palmarejo was amended in the second quarter of 2014 to reflect the change in the ounces expected to be received over the life of the agreement. This change in estimate resulted in an increase in depletion expense of $2.7 million and $5.9 million for the three and nine months ended September 30, 2014, respectively, and is expected to increase depletion by $2.6 million for the remainder of 2014 and $10.5 million for 2015.
Equity Financing
On August 21, 2014, the Company completed a bought deal financing with a syndicate of underwriters for 8,375,000 common shares at $59.75 per common share. The net proceeds to the Company were $479.8 million after deducting underwriters’ commissions and offering expenses of $20.6 million. The Company recorded a deferred tax asset of $5.0 million related to the share issue costs.
Karma Gold Stream
On August 11, 2014, Franco-Nevada and Sandstorm Gold Inc. (“Sandstorm”) (collectively, the Parties) entered into a $120.0 million stream financing agreement with True Gold Mining Inc. (“True Gold”) in exchange for a 6.5% gold stream on True Gold’s Karma project, located in Burkina Faso, West Africa. Under the terms of the agreement, the parties will provide True Gold with $100.0 million in initial funding. The parties will split the agreement 75% to Franco-Nevada and 25% to Sandstorm. Over a period of five years, starting March 31, 2016, True Gold shall deliver to the parties, an aggregate of 20,000 ounces of gold each year, for a total of 100,000 ounces. Thereafter, True Gold shall deliver 6.5% of the gold produced at Karma to the parties. The parties will pay 20% of the spot price of gold to True Gold for each ounce delivered under the agreement. Franco-Nevada has funded $27.8 million of its obligation under the agreement as at November 5, 2014.
AngloGold Ashanti Portfolio
On June 9, 2014, Franco-Nevada acquired eight Australian exploration royalties from AngloGold Ashanti Australia Limited for $2.5 million.
Cerro Moro
On April 23, 2014, Franco-Nevada acquired an existing 2% net smelter return (“NSR”) royalty on Yamana Gold Inc.’s Cerro Moro project located in Argentina for $19.6 million.
Credit Facility
On March 18, 2014, Franco-Nevada’s existing credit facility was extended to March 18, 2019. The facility is currently undrawn and Franco-Nevada remains debt free.
Fire Creek/Midas
On February 11, 2014, Franco-Nevada signed a gold purchase agreement with Klondex Mines Ltd. (“Klondex”) and acquired a 2.5% NSR royalty on Klondex’s Fire Creek and Midas properties, both of which are located in Nevada, U.S., for a total consideration of $35.0 million in cash. Under the terms of the gold purchase agreement, Klondex will deliver 38,250 ounces of gold, payable monthly, starting June 2014 and ending by December 2018, following which the royalty will become payable on gold produced from the Fire Creek and Midas properties.
Sabodala Gold Stream
On January 15, 2014, Franco-Nevada acquired a 6% gold stream on Teranga Gold Corporation’s Sabodala gold project located in Senegal, Africa. Under the terms of the gold stream agreement, Franco-Nevada funded a $135.0 million deposit in exchange for 22,500 ounces of gold per year, payable monthly, for the first six years of the agreement, after which Franco-Nevada will purchase 6% of the gold produced from Sabodala. Franco-Nevada will pay 20% of the market price of gold for each ounce delivered under the agreement.
Guidance
The following contains forward looking statements about our guidance for the remainder of 2014. Reference should be made to the “Cautionary Statement on Forward Looking Information” section at the end of this MD&A. For a description of material factors that could cause our actual results to differ materially from the forward looking statements in the following, please see the Cautionary Statement, the “Risk Factors” section of this MD&A and the “Risk Factors” section of our most recent Annual Information Form filed with the Canadian securities regulatory authorities on www.sedar.com and our most recent Form 40-F filed with the Securities and Exchange Commission on www.sec.gov.
Franco-Nevada realized 70,071 GEOs from its mineral assets and $20.5 million in revenue from its oil & gas assets for third quarter of 2014. For the first nine months of 2014, Franco-Nevada realized 200,641 GEOs and $62.9 million in revenue from its oil & gas assets. Based upon the anticipated performance of the current asset portfolio for the remainder of 2014, the Company is increasing its guidance to 260,000 to 270,000 GEOs for fiscal 2014 which does not include any contributions from Candelaria. Candelaria is expected to contribute 35,000 to 40,000 attributable GEOs with the Company expecting to be able to sell, and record as revenue, 20,000 to 30,000 GEOs prior to the end of 2014. With the contributions from Candelaria, the Company expects 280,000 to 300,000 GEOs in aggregate for fiscal 2014. With respect to the oil & gas assets, the Company expects to earn $70.0 million to $80.0 million in revenue for fiscal 2014. Of the 280,000 to 300,000 GEOs, Franco-Nevada expects to receive 145,000 to 165,000 GEOs under various stream agreements (before adding Candelaria).
GEOs include our gold, platinum, palladium and other mineral assets. GEOs are estimated on a gross basis for NSR royalties and, in the case of stream ounces, before the payment of the per ounce contractual price paid by Franco-Nevada. For net profit interest (“NPI”) royalties, GEOs are calculated taking into account the NPI economics. Platinum, palladium and other minerals were converted to GEOs by dividing the associated revenue, which includes settlement adjustments, by the average gold price for the period. For our guidance
for the remainder of 2014, platinum and palladium metals have been converted to GEOs using commodity prices of $1,225/oz Au, $1,275/oz Pt and $775/oz Pd. For the remainder of 2014, the WTI oil price is assumed to average $80 per barrel with similar discounts for Canadian oil as experienced in 2013. 2014 guidance assumes the continued steady state of operations from our assets and is also based on the assumptions set out below.
In addition, we continue to expect to fund approximately $200.0 million to $250.0 million in the next few months in connection with our precious metals stream agreement on Cobre Panama.
More specifically, we expect the following with respect to key producing assets for the fourth quarter of 2014:
· Gold — U.S.: Overall GEOs from U.S. gold assets are expected to be slightly lower in the fourth quarter of 2014 compared with the third quarter of 2014. In the third quarter, Franco-Nevada recorded four shipments from Fire Creek/Midas with three shipments expected in Q4 2014. For Gold Quarry, we expect 11,250 royalty ounces in 2014 as payments will be based on the minimum royalty provision.
· Gold — Canada: GEOs earned from Canadian assets in Q4 2014 are expected to be in line with Q3 2014 levels. We expect GEOs from Detour Lake and Sudbury to remain stable at Q3 2014 levels. GEOs from NPIs are expected to be lower in the fourth quarter due to capital spending allocations.
· Gold — Australia: We expect Australian GEOs to be at the same levels as Q3 2014 levels with the majority of the GEOs being earned from the Duketon operations.
· Gold — Rest of World: Rest of World gold assets are expected to generate higher GEOs in the fourth quarter 2014 with the acquisition of Candelaria. In addition, our Palmarejo and Sabodala gold streams are expected to contribute 12,500 GEOs and 5,625 GEOS, respectively, in Q4 2014. Other assets are expected to contribute similar GEO levels as were earned in Q3 2014.
· PGM: Sudbury stream ounces for the remainder of 2014 are expected to be in-line with the average of the first nine months of 2014 with Stillwater expected to generate fewer GEOs in Q4 than Q3 2014. We expect to receive GEOs from our Pandora royalty in Q4 2014.
· Other minerals: GEOs from other minerals are expected to be higher in the last quarter of 2014 with Peculiar Knob, an iron-ore mine in South Australia, and the Osborne copper mine, a recent addition to the portfolio, being significant contributors.
· Oil & Gas: For 2014, oil & gas revenues are projected to be $70.0 million to $80.0 million with slightly lower volumes and higher price discounts offset by lower capital spending.
Selected Financial Information
|
| For the three |
| For the three |
| For the nine |
| For the nine |
| ||||
(Expressed in millions, except GEOs and per share amounts) |
|
|
|
|
|
|
|
|
| ||||
Statement of Income and Comprehensive Income (Loss) |
|
|
|
|
|
|
|
|
| ||||
Revenue |
| $ | 107.6 |
| $ | 98.8 |
| $ | 319.4 |
| $ | 300.9 |
|
Operating costs |
| 61.0 |
| 50.8 |
| 176.5 |
| 156.5 |
| ||||
Operating income |
| 46.6 |
| 48.0 |
| 142.9 |
| 144.4 |
| ||||
Net income |
| 33.2 |
| 35.3 |
| 105.5 |
| 92.3 |
| ||||
Basic earnings per share |
| $ | 0.22 |
| $ | 0.24 |
| $ | 0.71 |
| $ | 0.63 |
|
Diluted earnings per share |
| $ | 0.22 |
| $ | 0.24 |
| $ | 0.71 |
| $ | 0.62 |
|
Dividends declared per share |
| $ | 0.20 |
| $ | 0.18 |
| $ | 0.40 |
| $ | 0.54 |
|
Weighted average number of shares outstanding |
| 151.1 |
| 146.9 |
| 148.6 |
| 146.8 |
| ||||
Non-IFRS Measures |
|
|
|
|
|
|
|
|
| ||||
GEOs1 2 |
| 70,071 |
| 56,683 |
| 200,641 |
| 171,661 |
| ||||
Adjusted EBITDA3 |
| 88.7 |
| 80.3 |
| 260.7 |
| 245.2 |
| ||||
Adjusted EBITDA3 per share |
| $ | 0.59 |
| $ | 0.55 |
| $ | 1.75 |
| $ | 1.67 |
|
Margin3 |
| 82.4 | % | 81.3 | % | 81.6 | % | 81.5 | % | ||||
Adjusted Net Income3 |
| 34.5 |
| 35.3 |
| 104.8 |
| 107.8 |
| ||||
Adjusted Net Income3 per share |
| $ | 0.23 |
| $ | 0.24 |
| $ | 0.71 |
| $ | 0.74 |
|
Statement of Cash flows |
|
|
|
|
|
|
|
|
| ||||
Net cash provided by operating activities, before changes in non-cash assets and liabilities |
| 80.1 |
| 75.9 |
| 238.1 |
| 219.4 |
| ||||
Net cash (used in)/provided by investing activities |
| (7.0 | ) | (13.9 | ) | (145.1 | ) | 27.0 |
| ||||
Net cash provided by/(used in) financing activities |
| 458.1 |
| (22.1 | ) | 414.7 |
| (71.9 | ) | ||||
|
| As at |
| As at |
| ||
Statement of Financial Position |
|
|
|
|
| ||
Cash and cash equivalents |
| $ | 1,221.9 |
| $ | 770.0 |
|
Short-term investments |
| — |
| 18.0 |
| ||
Total assets |
| 3,526.1 |
| 3,044.9 |
| ||
Deferred income tax liabilities |
| 37.8 |
| 30.0 |
| ||
Total shareholders’ equity |
| 3,465.3 |
| 2,963.8 |
| ||
|
|
|
|
|
| ||
Working capital |
| 1,312.3 |
| 861.2 |
| ||
Debt |
| Nil |
| Nil |
| ||
(1) For average commodity prices used in calculation of GEOs, please refer to average commodity price tables on pages 14 and 23 of this MD&A.
(2) For Q3 2013, the calculation of GEOs earned from the Sudbury assets was amended which resulted in a decrease of 769 GEOs previously reported. For the nine months ended September 30, 2013, the amendment resulted in an increase of 2,629 GEOs previously reported.
(3) Adjusted Net Income, Adjusted EBITDA and Margin are non-IFRS financial measures with no standardized meaning under IFRS. For further information and a detailed reconciliation, please see pages 28-31 of this MD&A.
Overview of Financial Performance — Q3 2014 to Q3 2013
Gold Equivalent Ounces
The following table outlines GEOs attributable to Franco-Nevada for the three months ended September 30, 2014 and 2013 by commodity (excluding oil & gas), geographical location and type of interest:
|
| Gold Equivalent Ounces 1 |
| ||||||
|
| 2014 |
| 2013 2 |
| ||||
For the three months ended September 30, |
| # |
| % |
| # |
| % |
|
Commodity |
|
|
|
|
|
|
|
|
|
Gold |
| 56,743 |
| 81 | % | 45,456 |
| 80 | % |
PGM |
| 10,761 |
| 15 | % | 8,845 |
| 16 | % |
Other Minerals |
| 2,567 |
| 4 | % | 2,382 |
| 4 | % |
|
| 70,071 |
| 100 | % | 56,683 |
| 100 | % |
Geography |
|
|
|
|
|
|
|
|
|
Canada |
| 16,088 |
| 23 | % | 12,525 |
| 22 | % |
United States |
| 18,346 |
| 26 | % | 12,939 |
| 23 | % |
Mexico |
| 13,095 |
| 19 | % | 14,734 |
| 26 | % |
Australia |
| 4,177 |
| 6 | % | 4,022 |
| 7 | % |
Rest of World |
| 18,365 |
| 26 | % | 12,463 |
| 22 | % |
|
| 70,071 |
| 100 | % | 56,683 |
| 100 | % |
Type |
|
|
|
|
|
|
|
|
|
Revenue-based |
| 28,195 |
| 40 | % | 25,514 |
| 45 | % |
Streams |
| 33,276 |
| 47 | % | 28,493 |
| 50 | % |
Profit-based |
| 3,253 |
| 5 | % | 407 |
| 1 | % |
Other |
| 5,347 |
| 8 | % | 2,269 |
| 4 | % |
|
| 70,071 |
| 100 | % | 56,683 |
| 100 | % |
(1) For average commodity prices used in calculation of GEOs, please refer to average commodity price tables on page 14 of this MD&A.
(2) For Q3 2013, the calculation of GEOs earned from the Sudbury assets was amended which resulted in a decrease of 769 GEOs previously reported.
GEOs were earned from the following asset classes:
|
| Gold Equivalent Ounces(1)(2) |
| ||||||
|
| 2014 |
| 2013 |
| ||||
For the three months ended September 30, |
| # |
| % |
| # |
| % |
|
|
|
|
|
|
|
|
|
|
|
Gold — United States |
| 13,442 |
| 19 | % | 9,318 |
| 16 | % |
Gold — Canada |
| 10,083 |
| 14 | % | 7,164 |
| 13 | % |
Gold — Australia |
| 1,758 |
| 3 | % | 1,777 |
| 3 | % |
Gold — Rest of World |
| 31,460 |
| 45 | % | 27,197 |
| 48 | % |
Gold — Total |
| 56,743 |
| 81 | % | 45,456 |
| 80 | % |
PGM |
| 10,761 |
| 15 | % | 8,845 |
| 16 | % |
Other minerals |
| 2,567 |
| 4 | % | 2,382 |
| 4 | % |
|
| 70,071 |
| 100 | % | 56,683 |
| 100 | % |
Our portfolio is well-diversified with GEOs being earned from approximately 47 different mineral interests in various jurisdictions.
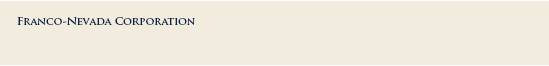
GEO Reconciliation — Q3 2013 to Q3 2014
Gold GEOs
GEOs earned from gold assets increased by 24.8% to 56,743 GEOs in the third quarter of 2014 from 45,456 GEOs in the third quarter of 2013 and increased 11.3% over the second quarter 2014 level of 50,970 GEOs. The growth in GEOs was mainly attributable to recent additions to the portfolio with Sabodala contributing 5,625 GEOs, Fire Creek/Midas contributing 3,858 GEOs and 951 GEOs from Kirkland Lake. PGM assets contributed 1,917 additional GEOs when compared to the comparable period of 2013 due to a combination of higher production and lower average commodity prices. For the quarter, we earned 3,253 GEOs from our gold NPIs compared with 407 GEOs earned from gold NPIs in the same period in 2013.
U.S. assets produced 13,442 GEOs, representing an increase of 44.3%, or 4,126 GEOs. The increase is due to the newly—acquired Fire Creek/Midas interest as well as higher production from the Goldstrike NPI (1,193 GEOs), Bald Mountain (493 GEOs) and Marigold (378 GEOs), partially offset by lower contributions from Gold Quarry (1,346 GEOs) due to a reduction in the minimum royalty provision, and other assets (450 GEOs).
Canadian assets produced 10,083 GEOs in the quarter, an increase of 2,918 GEOs, or 40.7%. The largest increase came from higher production at Hemlo for both the NPI and NSR (1,748 GEOs). Other contributors included Kirkland Lake, a recent addition to the portfolio, Detour (756 GEOs) and Timmins West (231 GEOs), both due to higher production levels. Lower production at the Gold Highway assets (583 GEOs), operated by St Andrew
Goldfields Ltd, and the Sudbury streams (181 GEOs), operated by KGHM International, saw decreases in GEOs earned from these assets over the comparable period.
Australian assets produced 1,758 GEOs for the quarter which was in-line with the third quarter 2013 production of 1,777 GEOs.
Growth of 4,262 GEOs from rest of world gold assets was attributable to Sabodala, Cooke 4 (747 GEOs) and other assets (664 GEOs), partially offset by lower GEOs earned from Palmarejo (1,378 GEOs) where there is a monthly minimum ounce obligation, Mine Waste Solutions (“MWS”) (676 GEOs), Subika (460 GEOs) and Cerro San Pedro (260 GEOs), all due to lower production levels.
PGM GEOs
PGM GEOs produced were 10,761 for the quarter compared to 8,844 GEOs in 2013, an increase of 21.7%. The increase in GEOs is attributable to higher production from Stillwater (1,273 GEOs) and the impact of lower average commodity prices in the period.
Other Mineral GEOs
GEOs generated from other minerals increased slightly to 2,567 GEOs from 2,383 GEOs in the comparable period, mainly due to the recent Osborne acquisition.
Revenue
Franco-Nevada’s revenue is generated from various forms of agreements, ranging from NSR royalties, streams, NPI royalties, net royalty interests (“NRI”), working interests and other. For definitions of the various types of agreements, please refer to our Annual Information Form filed on SEDAR at www.sedar.com or our Form 40-F filed on EDGAR at www.sec.gov.
The market prices of gold, PGM, oil and natural gas are the primary drivers of our profitability and our ability to generate operating cash flow for shareholders.
The following table outlines Franco-Nevada’s revenue for the three months ended September 30, 2014 and 2013, by commodity, geographical location and type of interest and highlights the diversification of the portfolio:
|
| Revenue |
| ||||||||
For the three months ended September 30, |
| 2014 |
| 2013 |
| ||||||
(expressed in millions) |
| $ |
| % |
| $ |
| % |
| ||
Commodity |
|
|
|
|
|
|
|
|
| ||
Gold |
| $ | 71.2 |
| 66 | % | $ | 60.6 |
| 61 | % |
PGM |
| 12.7 |
| 12 | % | 12.7 |
| 13 | % | ||
Other Minerals |
| 3.2 |
| 3 | % | 3.2 |
| 3 | % | ||
Oil & Gas |
| 20.5 |
| 19 | % | 22.3 |
| 23 | % | ||
|
| $ | 107.6 |
| 100 | % | 98.8 |
| 100 | % | |
|
|
|
|
|
|
|
|
|
| ||
Geography |
|
|
|
|
|
|
|
|
| ||
Canada |
| $ | 39.9 |
| 37 | % | 40.0 |
| 40 | % | |
United States |
| 22.3 |
| 21 | % | 17.3 |
| 18 | % | ||
Mexico |
| 16.8 |
| 16 | % | 19.6 |
| 20 | % | ||
Australia |
| 5.3 |
| 5 | % | 5.3 |
| 5 | % | ||
Rest of World |
| 23.3 |
| 21 | % | 16.6 |
| 17 | % | ||
|
| $ | 107.6 |
| 100 | % | 98.8 |
| 100 | % | |
|
|
|
|
|
|
|
|
|
| ||
Type |
|
|
|
|
|
|
|
|
| ||
Revenue-based |
| $ | 39.1 |
| 36 | % | 41.5 |
| 42 | % | |
Streams |
| 41.3 |
| 38 | % | 38.9 |
| 40 | % | ||
Profit-based |
| 15.7 |
| 15 | % | 12.1 |
| 12 | % | ||
Working interests and other |
| 11.5 |
| 11 | % | 6.3 |
| 6 | % | ||
|
| $ | 107.6 |
| 100 | % | 98.8 |
| 100 | % | |
Revenue for the three and nine months ended September 30, 2014 was $107.6 million (2013 - $98.8 million) and $319.4 million (2013 - $300.9 million), respectively, and was comprised of the following:
(expressed in millions)
|
|
|
| For the three months ended |
| For the nine months ended |
| ||||||||
Property |
| Interest |
| 2014 |
| 2013 |
| 2014 |
| 2013 |
| ||||
Gold - United States |
|
|
|
|
|
|
|
|
|
|
| ||||
Goldstrike |
| NSR 2-4%, NPI 2.4-6% |
| $ | 4.5 |
| $ | 3.4 |
| $ | 18.6 |
| $ | 16.5 |
|
Gold Quarry |
| NSR 7.29% |
| 3.0 |
| 5.1 |
| 10.8 |
| 17.5 |
| ||||
Marigold |
| NSR 1.75-5%, GR 0.5-4% |
| 1.3 |
| 2.0 |
| 3.7 |
| 7.2 |
| ||||
Fire Creek/Midas |
| Fixed to 2018 / NSR 2.5% |
| 4.9 |
| — |
| 4.9 |
| — |
| ||||
Bald Mountain |
| NSR/GR 0.875-5% |
| 1.7 |
| 1.1 |
| 3.7 |
| 3.1 |
| ||||
Mesquite |
| NSR 0.5-2% |
| 0.4 |
| 0.4 |
| 1.2 |
| 1.6 |
| ||||
Other |
|
|
| 0.1 |
| 0.4 |
| 0.7 |
| 1.7 |
| ||||
Gold - Canada |
|
|
|
|
|
|
|
|
|
|
| ||||
Sudbury |
| Stream 50% |
| 1.6 |
| 2.0 |
| 5.5 |
| 7.3 |
| ||||
Golden Highway |
| NSR 2-15% |
| 2.3 |
| 3.3 |
| 8.1 |
| 10.0 |
| ||||
Detour Lake |
| NSR 2% |
| 3.0 |
| 2.1 |
| 8.3 |
| 3.5 |
| ||||
Musselwhite |
| NPI 5% |
| 0.7 |
| 0.5 |
| 1.6 |
| 1.8 |
| ||||
Hemlo |
| NSR 3%, NPI 50% |
| 2.7 |
| 0.5 |
| 4.9 |
| 1.4 |
| ||||
Kirkland Lake |
| NSR 2.5-5.5%, NPI 20% |
| 1.2 |
| — |
| 3.5 |
| — |
| ||||
Timmins West |
| NSR 2.25% |
| 1.0 |
| 0.7 |
| 3.2 |
| 2.1 |
| ||||
Other |
|
|
| 0.3 |
| 0.4 |
| 1.0 |
| 2.2 |
| ||||
Gold - Australia |
|
|
|
|
|
|
|
|
|
|
| ||||
Duketon |
| NSR 2% |
| 1.9 |
| 2.0 |
| 5.2 |
| 6.2 |
| ||||
Henty |
| GR 1/10%, Ounce based |
| 0.2 |
| 0.3 |
| 0.5 |
| 0.9 |
| ||||
Other |
|
|
| 0.2 |
| 0.2 |
| 1.0 |
| 0.8 |
| ||||
Gold - Rest of World |
|
|
|
|
|
|
|
|
|
|
| ||||
Palmarejo |
| Stream 50% |
| 16.4 |
| 18.9 |
| 51.6 |
| 60.2 |
| ||||
MWS |
| Stream 25% |
| 7.9 |
| 9.2 |
| 22.6 |
| 27.8 |
| ||||
Sabodala |
| Stream 6%, Fixed to 2019 |
| 7.1 |
| — |
| 21.7 |
| — |
| ||||
Subika |
| NSR 2% |
| 2.6 |
| 3.3 |
| 7.7 |
| 10.1 |
| ||||
Tasiast |
| NSR 2% |
| 1.5 |
| 1.3 |
| 5.6 |
| 5.5 |
| ||||
Edikan |
| NSR 1.5% |
| 1.0 |
| 1.0 |
| 2.7 |
| 3.3 |
| ||||
Cerro San Pedro |
| GR 1.95% |
| 0.3 |
| 0.7 |
| 1.5 |
| 2.6 |
| ||||
Cooke 4 (Ezulwini) |
| Stream 7% |
| 1.7 |
| 0.7 |
| 3.5 |
| 2.3 |
| ||||
Other |
|
|
| 1.7 |
| 1.1 |
| 3.8 |
| 5.1 |
| ||||
|
|
|
| $ | 71.2 |
| $ | 60.6 |
| $ | 207.1 |
| $ | 200.7 |
|
PGM |
|
|
|
|
|
|
|
|
|
|
| ||||
Sudbury |
| Stream 50% |
| 6.6 |
| 8.1 |
| 21.9 |
| 22.7 |
| ||||
Stillwater |
| NSR 5% |
| 6.1 |
| 4.6 |
| 17.3 |
| 15.1 |
| ||||
|
|
|
| $ | 12.7 |
| $ | 12.7 |
| $ | 39.2 |
| $ | 37.8 |
|
Other Minerals |
|
|
|
|
|
|
|
|
|
|
| ||||
Peculiar Knob |
| Production payment |
| 1.2 |
| 2.5 |
| 5.4 |
| 5.2 |
| ||||
Osborne |
| NSR 2% |
| 0.7 |
| — |
| 2.0 |
| — |
| ||||
Mt. Keith |
| NPI 0.25%, GR 0.375% |
| 0.6 |
| 0.4 |
| 1.3 |
| 1.3 |
| ||||
Other |
|
|
| 0.7 |
| 0.3 |
| 1.5 |
| 1.5 |
| ||||
|
|
|
| $ | 3.2 |
| $ | 3.2 |
| $ | 10.2 |
| $ | 8.0 |
|
Oil & Gas |
|
|
|
|
|
|
|
|
|
|
| ||||
Weyburn |
| NRI 11.71%, ORR 0.44%, WI 2.26% |
| 16.6 |
| 17.6 |
| 49.7 |
| 41.8 |
| ||||
Midale |
| ORR 1.14%, WI 1.59% |
| 0.9 |
| 1.1 |
| 2.7 |
| 3.0 |
| ||||
Edson |
| ORR 15% |
| 1.1 |
| 1.2 |
| 3.9 |
| 3.5 |
| ||||
Other |
|
|
| 1.9 |
| 2.4 |
| 6.6 |
| 6.1 |
| ||||
|
|
|
| $ | 20.5 |
| $ | 22.3 |
| $ | 62.9 |
| $ | 54.4 |
|
|
|
|
|
|
|
|
|
|
|
|
| ||||
Revenue |
|
|
| $ | 107.6 |
| $ | 98.8 |
| $ | 319.4 |
| $ | 300.9 |
|
Average Commodity Prices
Quarterly Averages |
|
|
| Q3 2014 |
| Q2 2014 |
| Q3 2013 |
| |||
Precious Metals(1) |
|
|
|
|
|
|
|
|
| |||
Gold |
| ($/oz) |
| $ | 1,282 |
| $ | 1,289 |
| $ | 1,328 |
|
Silver |
| ($/oz) |
| 19.63 |
| 19.62 |
| 21.37 |
| |||
Platinum |
| ($/oz) |
| 1,434 |
| 1,447 |
| 1,451 |
| |||
Palladium |
| ($/oz) |
| 863 |
| 815 |
| 723 |
| |||
Exchange Rates(2) |
|
|
|
|
|
|
|
|
| |||
CAD |
|
|
| 0.9181 |
| 0.9170 |
| 0.9629 |
| |||
(1) Based on London PM Fix
(2) Based on Bank of Canada noon rates
Gold Revenue
The price of gold is the largest single factor in determining profitability and cash flow from operations for Franco-Nevada. During the third quarter of 2014, average gold prices continued to experience significant volatility, trading between $1,214/oz and $1,340/oz with an average price of $1,282/oz. This compares to an average gold price of $1,328/oz for the third quarter of 2013, a decrease of 3.5%, and $1,289/oz for the second quarter of 2014. The volatility of the gold price is attributable to a number of factors, including weaker physical demand, higher ETF redemptions, geopolitical concerns, as well as the state of the U.S. economy and its potential impact on interest rates.
Despite the lower average gold price, overall gold revenue increased to $71.2 million from $60.6 million for the comparable period. The increase was attributable primarily to recent acquisitions, Sabodala ($7.1 million), Fire Creek/Midas ($4.9 million) and Kirkland Lake ($1.2 million), offset by the lower average gold price. Although production levels may have been higher, as discussed in the GEO section above, the associated gold revenue from existing assets was lower overall. NPI interests contributed $4.2 million to revenue in the quarter compared to $0.5 million in the third quarter of 2013.
U.S. assets generated $15.9 million in revenue, an increase of 28.2%, mainly driven by the Fire Creek/Midas acquisition. Revenue from Goldstrike and Bald Mountain was higher in the quarter compared to the prior period due to the NPI contributions at Goldstrike and higher production levels at Bald Mountain.
Canadian assets generated $12.8 million in revenue in the quarter, an increase of $3.3 million, or 34.7% over 2013. The increases were attributable to the Hemlo NPI and NSR, both with higher production in 2014 ($2.2 million), the recent Kirkland Lake acquisition and Detour ($0.9 million) as the operation continued to ramp-up during the quarter, all partially offset by other assets ($0.1 million).
Gold revenue from Australian assets was $2.3 million for the quarter which was slightly lower than the third quarter of 2013.
Rest of world gold assets generated $40.2 million in revenue in the quarter compared to $36.2 million in 2013. The 11.1% increase was due primarily to the Sabodala acquisition. Lower revenue was earned from the other rest of world gold assets due to a combination of lower production and lower average gold prices.
PGM Revenue
The prices for platinum and palladium averaged $1,434/oz and $863/oz, respectively. Palladium is a significantly larger portion of Franco-Nevada’s revenue than platinum. Overall PGM revenue was flat quarter over quarter at $12.7 million, due to a slight decrease in PGM GEOs.
Other Mineral Revenue
Other minerals generated $3.2 million in revenue for the quarter ended September 30, 2014 and 2013. The Osborne royalty, which was acquired in late 2013, contributed $0.7 million, offset by reductions from iron-ore and nickel royalties.
Oil & Gas Revenue
Averages ($/bbl) |
| Q3 2014 |
| Q2 2014 |
| Q3 2013 |
| ||
Edmonton Light |
| C$ | 96.52 |
| C$ | 103.14 |
| 104.93 |
|
Quality Differential |
| C$ | (7.72 | ) | C$ | (5.88 | ) | (0.79 | ) |
Realized oil price |
| C$ | 88.80 |
| C$ | 97.26 |
| 104.14 |
|
Oil & gas revenue was $20.5 million for the quarter (95% oil and 5% gas) compared with $22.3 million for the same period of 2013 (95% oil and 5% gas), a decrease of 8.1%. The decrease is due to lower average oil prices realized in the third quarter of 2014.
Revenue from the Weyburn Unit for the quarter decreased to $16.6 million (2013 - $17.6 million) with $11.5 million earned from the NRI (2013 - $11.6 million), $4.2 million earned from the working interest (2013 - $5.2 million) and $0.9 million earned from the overriding royalties (2013 - $0.8 million). Actual realized price from the NRI was C$89.88/boe for the quarter, down 11.0% from the average price of C$101.02/boe for the third quarter of 2013.
Costs and Expenses
Costs and expenses for the quarter were $61.0 million compared to $50.8 million in 2013. The following table provides a list of the costs and expenses incurred for the three months ended September 30, 2014 and 2013.
|
| Three months ended September 30, |
| |||||||
(expressed in millions) |
| 2014 |
| 2013 |
| Variance |
| |||
Costs of sales |
| $ | 18.4 |
| $ | 13.9 |
| $ | 4.5 |
|
Depletion and depreciation |
| 38.5 |
| 32.3 |
| 6.2 |
| |||
Corporate administration |
| 3.3 |
| 4.1 |
| (0.8 | ) | |||
Business development |
| 0.6 |
| 0.5 |
| 0.1 |
| |||
Subtotal |
| 60.8 |
| 50.8 |
| 10.0 |
| |||
Impairment of royalty interests |
| 0.2 |
| — |
| 0.2 |
| |||
|
| $ | 61.0 |
| $ | 50.8 |
| $ | 10.2 |
|
Costs of sales, which comprises the cost of GEOs purchased under stream agreements, cost of prepaid gold ounces, oil & gas production taxes, operating costs on oil & gas working interests and net proceeds taxes on mineral interests, were $18.4 million for the third quarter of 2014 compared with $13.9 million for the third quarter of 2013. The increase of $4.5 million is attributable to the cost of prepaid ounces under the recently closed Fire Creek/Midas transaction ($3.4 million) and higher cost of stream sales ($1.2 million). These increases were partially offset by lower oil & gas production taxes and operating costs ($0.1 million). Upon the sale of the gold ounces delivered under the Fire Creek/Midas
transaction, Franco-Nevada will record an amount of $882.71/oz as a non-cash cost of sale. Franco-Nevada received 33,276 GEOs under our stream agreements compared to 28,493 GEOs received in Q3 2013.
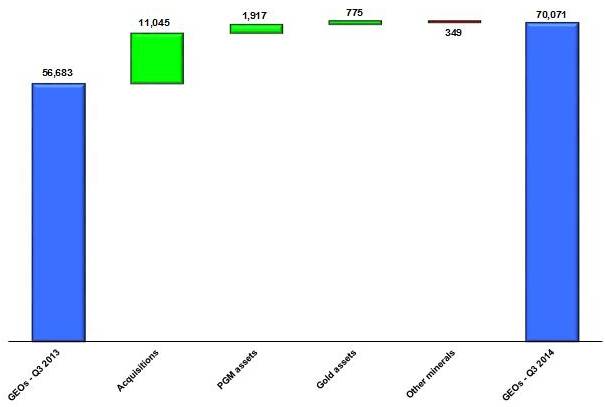
Depletion and depreciation totaled $38.5 million for the quarter compared to $32.3 million in 2013. The increase of $6.2 million is due in part to recent acquisitions, Sabodala ($3.5 million), Kirkland Lake ($0.8 million) and Osborne ($0.5 million), as well as higher depletion on Goldstrike ($1.0 million) due to an increase in the NPI. In addition, depletion on Palmarejo was higher as the units-of-production calculation was adjusted to reflect the restructuring ($2.7 million), partially offset by lower production ($0.3 million). These increases were partially offset by lower production and associated depletion on other assets ($2.0 million).
Depletion Reconciliation — Q3 2013 to Q3 2014
(expressed in millions)
Corporate administration expenses decreased to $3.3 million in the quarter, representing 3.1% of revenue, from $4.1 million in 2013. The decrease is due to lower mark-to-market adjustments associated with Franco-Nevada’s Deferred Share Unit Plan and legal and consulting expenses.
Business development expenses were $0.6 million and $0.5 million for the three months ended September 30, 2014 and 2013, respectively. Timing of incurring these costs will vary depending upon the timing and level of activity of the business development team on completing transactions.
Franco-Nevada recorded $0.2 million in impairment charges on exploration interests where the explorer/operator had abandoned tenements, concessions or ground which was subject to royalty rights held by Franco-Nevada.
Foreign Exchange and Other Income/Expenses
Foreign exchange and other income/expenses comprise foreign exchange gains and losses, mark-to-market adjustments on the fair value of warrants held as investments and gains and losses from the sale of gold where settlement of the royalty/stream obligation is taken in-kind from the operators.
Other expenses for the quarter was $1.2 million compared to other income of $0.1 million in 2013. The following table provides a list of the other income/expenses incurred for the three months ended September 30, 2014 and 2013.
|
| Three months ended September 30, |
| |||||||
(expressed in millions) |
| 2014 |
| 2013 |
| Variance |
| |||
Foreign exchange gain (loss) |
| $ | (0.6 | ) | $ | 0.5 |
| $ | (1.1 | ) |
Mark-to-market gain (loss) on warrants |
| (0.8 | ) | (0.4 | ) | (0.4 | ) | |||
Gain (loss) on sale of gold |
| 0.2 |
| — |
| 0.2 |
| |||
|
| $ | (1.2 | ) | $ | 0.1 |
| $ | (1.3 | ) |
Foreign exchange gains and losses include foreign exchange movements related to investments in bonds and other debt securities, such as government and corporate bonds, treasury bills and intercompany loans, held in the parent company, which are denominated in either U.S. dollars or Mexican pesos. The parent company’s functional currency is the Canadian dollar. Under IFRS, all foreign exchange changes related to the debt securities are recorded in net income as opposed to other comprehensive income.
Foreign exchange losses and other expenses were $1.2 million in the quarter (2013 — other income of $0.1 million) which was comprised of $0.6 million related to foreign exchange losses on intercompany debt securities (2013 — gains of $0.5 million), $0.8 million in mark-to-market losses related to warrants of small to mid-sized publicly-listed resource companies (2013 — $0.4 million) and a $0.2 million gain on the sale of gold (2013 — nil).
Finance Costs and Finance Income
Finance income was $1.2 million (2013 - $0.8 million) for the quarter which was earned on our cash equivalents and/or short-term investments. The increase in finance income was due to higher cash balances invested in 2014 partially offset with a larger U.S. dollar balance, which earns a lower interest rate, when compared to 2013. In addition, the proceeds of a $500.0 million equity offering completed in August 2014, were invested in U.S. cash accounts. Finance expenses were $0.4 million (2013 - $0.2 million) and consist of the costs of maintaining our credit facility in addition to the amortization of the initial set-up costs incurred with respect to the facility. Finance expenses were comprised of standby fees of $0.3 million (2013 - $0.1 million) and amortization of issuance costs were $0.1 million (2013 - $0.1 million).
Income Taxes
Franco-Nevada had an income tax expense of $13.0 million (2013 — $13.4 million) for the quarter comprised of a current income tax expense of $7.3 million (2013 - $8.2 million) and a deferred income tax expense of $5.7 million (2013 — $5.2 million) related to our Canadian and Mexican entities. The Company’s effective tax rate increased slightly to 28.1%, from 27.5% in 2013, due to change in the makeup of income from lower tax jurisdictions to higher tax jurisdictions and the impact of the indexation of mineral properties in Mexico.
Net Income
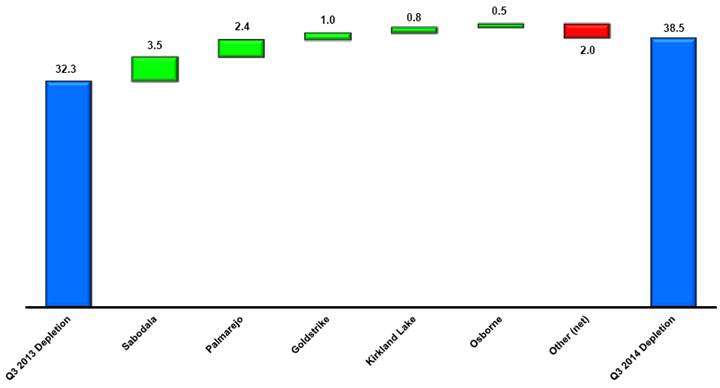
Net income for the quarter was $31.9 million, or $0.21 per share, compared with $35.3 million, or $0.24 per share, for the same period in 2013. Adjusted Net Income was $34.5 million, or $0.23 per share, compared with $35.3 million, or $0.24 per share, for Q3 2013. The decrease in Adjusted Net Income was driven primarily by higher depletion and costs of sales, partially offset by higher revenue.
Adjusted Net Income Reconciliation — Q3 2013 to Q3 2014
(expressed in millions)
Quarterly Financial Information
Selected quarterly financial information from our financial statements is set out below:
(expressed in millions, except per share amounts, GEOs and Margin)1
|
| Q3 |
| Q2 |
| Q1 |
| Q4 |
| Q3 |
| Q2 |
| Q1 |
| Q4 |
| ||||||||
Revenue |
| $ | 107.6 |
| $ | 107.7 |
| $ | 104.1 |
| $ | 100.0 |
| $ | 98.8 |
| $ | 93.3 |
| $ | 108.8 |
| $ | 114.1 |
|
Costs and expenses2 |
| 61.0 |
| 60.1 |
| 55.4 |
| 194.8 |
| 50.8 |
| 50.8 |
| 55.5 |
| 135.9 |
| ||||||||
Operating income (loss) |
| 46.6 |
| 47.6 |
| 48.7 |
| (94.8 | ) | 48.0 |
| 42.5 |
| 53.3 |
| (21.8 | ) | ||||||||
Other income (expenses) |
| (0.4 | ) | 2.0 |
| 1.1 |
| (2.9 | ) | 0.7 |
| (8.9 | ) | (4.5 | ) | (0.4 | ) | ||||||||
Income tax expense (recovery) |
| 13.0 |
| 12.7 |
| 14.4 |
| (17.1 | ) | 13.4 |
| 12.0 |
| 13.4 |
| 10.9 |
| ||||||||
Net income (loss) |
| 33.2 |
| 36.9 |
| 35.4 |
| (80.6 | ) | 35.3 |
| 21.6 |
| 35.4 |
| (33.1 | ) | ||||||||
Basic earnings (loss) per share |
| $ | 0.22 |
| $ | 0.25 |
| $ | 0.24 |
| $ | (0.55 | ) | $ | 0.24 |
| $ | 0.15 |
| $ | 0.24 |
| $ | (0.23 | ) |
Diluted earnings (loss) per share |
| $ | 0.22 |
| $ | 0.25 |
| $ | 0.24 |
| $ | (0.55 | ) | $ | 0.24 |
| $ | 0.15 |
| $ | 0.24 |
| $ | (0.23 | ) |
GEOs |
| 70,071 |
| 64,734 |
| 65,836 |
| 69,741 |
| 56,683 |
| 56,085 |
| 58,893 |
| 59,369 |
| ||||||||
Adjusted EBITDA3 |
| 88.7 |
| 87.2 |
| 84.8 |
| 77.3 |
| 80.3 |
| 75.2 |
| 89.1 |
| 93.7 |
| ||||||||
Adjusted EBITDA3 per share |
| $ | 0.59 |
| $ | 0.58 |
| $ | 0.58 |
| $ | 0.53 |
| $ | 0.55 |
| $ | 0.51 |
| $ | 0.61 |
| $ | 0.65 |
|
Adjusted Net Income3 |
| 34.5 |
| 0.36 |
| 35.4 |
| 30.5 |
| 35.3 |
| 31.9 |
| 40.6 |
| 47.0 |
| ||||||||
Adjusted Net Income3 per share |
| $ | 0.23 |
| $ | 0.24 |
| $ | 0.24 |
| $ | 0.21 |
| $ | 0.24 |
| $ | 0.22 |
| $ | 0.28 |
| $ | 0.32 |
|
Margin3 |
| 82.4 | % | 81.0 | % | 81.5 | % | 77.3 | % | 81.3 | % | 80.6 | % | 81.9 | % | 82.1 | % | ||||||||
1 Due to rounding, amounts may not calculate.
2 Includes impairment charges on royalty, stream, working interests and investments.
3 Adjusted EBITDA, Adjusted Net Income and Margin are non-IFRS financial measures with no standardized meaning under IFRS. For further information and a detailed reconciliation, please see pages 28-31 of this MD&A.
Overview of Financial Performance — Nine Months 2014 to Nine Months 2013
Gold Equivalent Ounces
The following table outlines GEOs attributable to Franco-Nevada for the nine months ended September 30, 2014 and 2013 by commodity (excluding oil & gas), geographical location and type of interest:
|
| Gold Equivalent Ounces 1 |
| ||||||
|
| 2014 |
| 2013 2 |
| ||||
For the nine months ended September 30, |
| # |
| % |
| # |
| % |
|
Commodity |
|
|
|
|
|
|
|
|
|
Gold |
| 162,284 |
| 81 | % | 137,844 |
| 80 | % |
PGM |
| 30,341 |
| 15 | % | 28,231 |
| 17 | % |
Other Minerals |
| 8,016 |
| 4 | % | 5,586 |
| 3 | % |
|
| 200,641 |
| 100 | % | 171,661 |
| 100 | % |
Geography |
|
|
|
|
|
|
|
|
|
Canada |
| 45,004 |
| 22 | % | 37,694 |
| 22 | % |
United States |
| 49,302 |
| 25 | % | 43,159 |
| 25 | % |
Mexico |
| 41,250 |
| 21 | % | 43,215 |
| 25 | % |
Australia |
| 12,681 |
| 6 | % | 10,377 |
| 6 | % |
Rest of World |
| 52,404 |
| 26 | % | 37,216 |
| 22 | % |
|
| 200,641 |
| 100 | % | 171,661 |
| 100 | % |
Type |
|
|
|
|
|
|
|
|
|
Revenue-based |
| 81,291 |
| 40 | % | 76,579 |
| 45 | % |
Streams |
| 98,394 |
| 49 | % | 85,236 |
| 49 | % |
Profit-based |
| 11,667 |
| 6 | % | 5,087 |
| 3 | % |
Other |
| 9,289 |
| 5 | % | 4,759 |
| 3 | % |
|
| 200,641 |
| 100 | % | 171,661 |
| 100 | % |
(1) For average commodity prices used in calculation of GEOs, please refer to average commodity price tables on page 23 of this MD&A.
(2) For the nine months ended September 30, 2013, the calculation of GEOs earned from the Sudbury assets was amended which resulted in an increase of 2,629 GEOs previously reported.
Oil & gas revenues are not included in the reported GEO numbers.
GEOs were earned from the following asset classes:
|
| Gold Equivalent Ounces 1 |
| ||||||
|
| 2014 |
| 2013 2 |
| ||||
For the nine months ended September 30, |
| # |
| % |
| # |
| % |
|
|
|
|
|
|
|
|
|
|
|
Gold — United States |
| 35,338 |
| 18 | % | 32,205 |
| 19 | % |
Gold — Canada |
| 28,173 |
| 14 | % | 19,851 |
| 11 | % |
Gold — Australia |
| 5,118 |
| 2 | % | 5,352 |
| 3 | % |
Gold — Rest of World |
| 93,655 |
| 47 | % | 80,436 |
| 47 | % |
Gold — Total |
| 162,284 |
| 81 | % | 137,844 |
| 80 | % |
PGM |
| 30,341 |
| 15 | % | 28,231 |
| 17 | % |
Other minerals |
| 8,016 |
| 4 | % | 5,586 |
| 3 | % |
|
| 200,641 |
| 100 | % | 171,661 |
| 100 | % |
GEO Reconciliation — Nine Months 2013 to Nine Months 2014
Gold GEOs
GEOs earned from gold assets increased by 17.7% to 162,284 GEOs from 137,843 GEOs in 2013. The increase of 24,441 GEOs is mainly attributable to recent acquisitions, Sabodala (16,875 GEOs), Fire Creek/Midas (3,858 GEOs) and Kirkland Lake (2,662 GEOs). In addition, gold NPIs were higher in 2014 with 11,666 GEOs being earned compared with 5,094 GEOs in the same period of 2013.
U.S. assets produced 35,338 GEOs, representing an increase of 3,133 GEOs, or 9.7%, over 2013. The largest increases came from the Goldstrike NPI which contributed 7,720 GEOs in 2014 compared with 3,654 in 2013 and the Fire Creek/Midas acquisition. GEOs earned from Gold Quarry were lower in 2014 (3,333 GEOs) due to a reduction in the minimum royalty provision when compared to 2013. Lower production from Marigold and other U.S. gold assets resulted in lower GEOs.
Canadian assets produced 28,173 GEOs, an increase of 8,324 GEOs, or 41.9%, with the largest increase coming from Detour Lake (3,822 GEOs) as that operation continued to ramp-up. Recent acquisitions and NPIs contributed 2,662 GEOs and 3,888 GEOs, respectively, in 2014. The Sudbury streams, Golden Highway and other Canadian gold assets had lower production and associated GEOs.
Australian assets produced 5,118 GEOs for the period which was lower than 2013 due to lower production from the Duketon and Henty operations.
Rest of world gold assets produced 93,655 GEOs in the period compared to 80,437 GEOs in 2013. The 16.4% increase in GEOs was due to (i) the Sabodala stream, a Q1 2014 acquisition (16,875 GEOs); and (ii) Cooke 4 (Ezulwini) due to higher production (1,109 GEOs). These increases were partially offset by lower production at MWS (1,644 GEOs), Palmarejo (1,325 GEOs), Subika (1,050 GEOs) and other assets (747 GEOs).
PGM GEOs
PGM GEOs produced were 30,341 for the period compared to 28,231 GEOs in 2013. The increase in GEOs is attributable to higher production from Stillwater (3,119 GEOs) partially offset by lower GEOs from the Sudbury assets (1,016 GEOs). In addition, the GEOs recorded were impacted by lower average commodity prices.
Other Mineral GEOs
GEOs generated from other minerals increased due to the Osborne royalty, acquired in Q4 2013, and higher production from Peculiar Knob, an iron-ore project in Australia.
Revenue
The following table outlines Franco-Nevada’s revenue for the nine months ended September 30, 2014 and 2013, by commodity, geographical location and type of interest:
|
| Revenue |
| ||||||||
For the nine months ended September 30, |
| 2014 |
| 2013 |
| ||||||
(expressed in millions) |
| $ |
| % |
| $ |
| % |
| ||
Commodity |
|
|
|
|
|
|
|
|
| ||
Gold |
| $ | 207.1 |
| 65 | % | $ | 200.7 |
| 67 | % |
PGM |
| 39.2 |
| 12 | % | 37.8 |
| 13 | % | ||
Other Minerals |
| 10.2 |
| 3 | % | 8.0 |
| 2 | % | ||
Oil & Gas |
| 62.9 |
| 20 | % | 54.4 |
| 18 | % | ||
|
| $ | 319.4 |
| 100 | % | 300.9 |
| 100 | % | |
|
|
|
|
|
|
|
|
|
| ||
Geography |
|
|
|
|
|
|
|
|
| ||
Canada |
| $ | 121.1 |
| 38 | % | 105.5 |
| 35 | % | |
United States |
| 61.5 |
| 19 | % | 63.6 |
| 21 | % | ||
Mexico |
| 53.1 |
| 17 | % | 62.8 |
| 21 | % | ||
Australia |
| 16.4 |
| 5 | % | 14.9 |
| 5 | % | ||
Rest of World |
| 67.3 |
| 21 | % | 54.1 |
| 18 | % | ||
|
| $ | 319.4 |
| 100 | % | 300.9 |
| 100 | % | |
|
|
|
|
|
|
|
|
|
| ||
Type |
|
|
|
|
|
|
|
|
| ||
Revenue-based |
| $ | 117.7 |
| 37 | % | 131.7 |
| 44 | % | |
Streams |
| 126.8 |
| 40 | % | 120.2 |
| 40 | % | ||
Profit-based |
| 48.2 |
| 15 | % | 33.3 |
| 11 | % | ||
Working interests and other |
| 26.7 |
| 8 | % | 15.7 |
| 5 | % | ||
|
| $ | 319.4 |
| 100 | % | 300.9 |
| 100 | % | |
Average Commodity Prices
|
|
|
| Nine Months ended September 30, |
|
|
| ||||
Averages |
|
|
| 2014 |
| 2013 |
| Variance |
| ||
Precious Metals(1) |
|
|
|
|
|
|
|
|
| ||
Gold |
| ($/oz) |
| $ | 1,288 |
| $ | 1,457 |
| (11.6 | )% |
Silver |
| ($/oz) |
| 19.91 |
| 24.89 |
| (20.0 | )% | ||
Platinum |
| ($/oz) |
| 1,437 |
| 1,517 |
| (5.3 | )% | ||
Palladium |
| ($/oz) |
| 808 |
| 725 |
| 11.4 | % | ||
Exchange Rates(2) |
|
|
|
|
|
|
|
|
| ||
CAD |
|
|
| 0.9138 |
| 0.9771 |
| (6.5 | )% | ||
(1) Based on London PM Fix
(2) Based on Bank of Canada noon rates
Gold Revenue
During the first nine months of 2014, average gold prices continued to experience significant volatility, trading between $1,214/oz and $1,385/oz with an average price of $1,288/oz. This compares to an average gold price of $1,457/oz over the same period of 2013.
Despite the lower average gold price, overall gold revenue increased 3.2% to $207.1 million from $200.7 million for 2013. The increase was attributable primarily to recent acquisitions, Sabodala ($21.7 million), Fire Creek/Midas ($4.9 million) and Kirkland Lake ($3.5 million), offset by the lower average gold price. Although production levels may have been higher, as discussed in the GEO section above, the associated gold revenue from existing assets was lower overall. NPI interests contributed $14.3 million to revenue in the period compared to $8.1 million in 2013.
U.S. assets generated $43.6 million in revenue, a decrease of 8.4%, from $47.6 million in 2013. Lower revenue was recorded at Gold Quarry, due to a reduction in the minimum royalty provision over 2013, and at Marigold and other assets, primarily due to a lower average gold price and lower production levels. These decreases were partially offset by Fire Creek/Midas, a recent acquisition, and contributions from the Goldstrike NPI due to reduced capital spending attributable to the NPI.
Canadian assets generated $36.1 million in revenue in the period, an increase of $7.8 million, or 27.6% over 2013. The increases were attributable to the higher production from Detour Lake, as ramp-up activities continued, the Hemlo NPI and NSR, both with higher production in 2014 and the recent Kirkland Lake acquisition, all partially offset by lower average gold prices and production levels at the Sudbury streams, Golden Highway and other assets.
Gold revenue from Australian assets was $6.7 million for 2014 which was slightly lower than 2013 at $7.9 million.
Rest of world gold assets generated $120.7 million in revenue compared to $116.9 million in 2013. The 3.3% increase was due primarily to the Sabodala acquisition. Lower revenue was earned from Palmarejo, MWS, Subika and other rest of world gold assets due to a combination of lower production and lower average gold prices.
PGM Revenue
The prices for platinum and palladium averaged $1,437/oz and $808/oz, respectively, representing a decrease of 5.3% for platinum and an increase of 11.4% for palladium compared with the average prices for the first nine months of 2013. PGM price volatility remained high in 2014, similar to the volatility of gold prices.
Revenue from PGM assets was $39.2 million which represented a 3.7% increase over 2013. The increase is due to a combination of higher production and the impact of the lower average gold price.
Other Mineral Revenue
Other minerals increased to $10.2 million for the nine months ended September 30, 2014 which included $2.0 million from the Osborne royalty, which was acquired in late 2013.
Oil & Gas Revenue
|
| Nine months ended September 30, |
|
|
| ||||
Averages ($/bbl) |
| 2014 |
| 2013 |
| Variance |
| ||
Edmonton Light |
| C$ | 99.94 |
| C$ | 95.49 |
| 4.45 |
|
Quality Differential |
| C$ | (8.61 | ) | C$ | (9.43 | ) | 0.82 |
|
Realized oil price |
| C$ | 91.33 |
| C$ | 86.06 |
| 5.27 |
|
Oil & gas revenue was $62.9 million for the period (94% oil and 6% gas) compared with $54.4 million for the same period of 2013 (95% oil and 5% gas), an increase of 15.6%. The increase is due to higher average oil prices realized in the first nine months of 2014, lower capital expenditures associated with the Weyburn NRI and the impact of a weaker Canadian dollar relative to the U.S. dollar.
Revenue from the Weyburn Unit for the period increased to $49.7 million (2013 - $41.8 million) with $33.8 million earned from the NRI (2013 - $25.3 million), $13.2 million earned from the working interest (2013 - $14.1 million) and $2.7 million earned from the overriding royalties (2013 - $2.4 million). Actual realized price from the NRI was C$98.20/boe for the period, up 15.2%, from the average price of C$85.25/boe for the first nine months of 2013.
Costs and Expenses
Costs and expenses for the nine months were $176.5 million compared to $156.5 million in 2013. The following table provides a list of the costs and expenses incurred for the nine months ended September 30, 2014 and 2013.
|
| Nine months ended September 30, |
| |||||||
(expressed in millions) |
| 2014 |
| 2013 |
| Variance |
| |||
Costs of sales |
| $ | 48.2 |
| $ | 42.3 |
| $ | 5.9 |
|
Depletion and depreciation |
| 114.2 |
| 94.9 |
| 19.3 |
| |||
Corporate administration |
| 12.0 |
| 11.4 |
| 0.6 |
| |||
Business development |
| 1.9 |
| 2.0 |
| (0.1 | ) | |||
Subtotal |
| 176.3 |
| 150.6 |
| 25.7 |
| |||
Impairment of royalty interests |
| 0.2 |
| — |
| 0.2 |
| |||
Impairment of investments |
| — |
| 5.9 |
| (5.9 | ) | |||
|
| $ | 176.5 |
| $ | 156.5 |
| $ | 20.0 |
|
Costs of sales, which comprises the cost of GEOs purchased under stream agreements, cost of prepaid gold ounces, oil & gas production taxes, operating costs on oil & gas working interests and net proceeds taxes on mineral interests, were $48.2 million for the first nine
months of 2014 compared with $42.3 million for the same period in 2013. The increase of $5.9 million is attributable to the cost of prepaid ounces under the recently acquired Fire Creek/Midas transaction ($3.4 million) and higher cost of stream sales ($3.2 million), partially offset by lower net proceeds taxes ($0.4 million) due to lower revenue being earned in jurisdictions with these tax regimes and lower oil & gas production taxes and operating and capital costs ($0.3 million). For 2014 to-date, Franco-Nevada has received 98,394 GEOs under our stream agreements compared to 85,236 GEOs received in 2013.
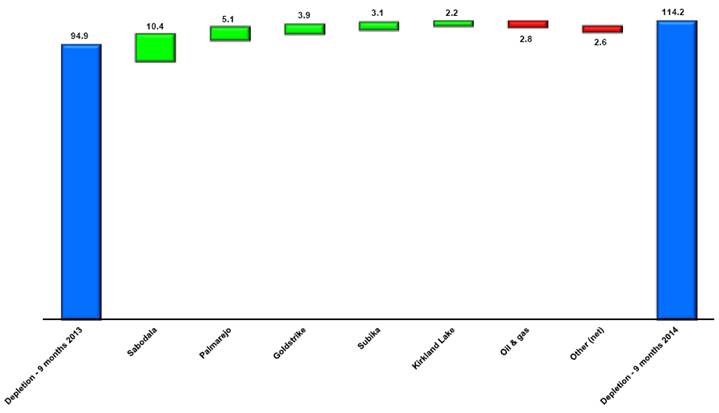
Depletion and depreciation totaled $114.2 million compared to $94.9 million in the prior period. The increase of $19.3 million is due to recent acquisitions, Sabodala ($10.4 million), Kirkland Lake ($2.2 million) and Osborne ($1.5 million), as well as higher depletion on Goldstrike ($3.9 million) due to a higher NPI and Subika ($3.1 million) due to a reduction in the ounces attributable to the NSR. In addition, depletion on Palmarejo was higher as the units-of-production calculation was adjusted to reflect the restructuring ($5.1 million). These increases were partially offset by lower depletion on oil & gas assets ($2.8 million) and other assets ($4.1 million).
Depletion Reconciliation — Nine Months 2013 to Nine Months 2014
(expressed in millions)
Corporate administration expenses increased to $12.0 million, representing 3.8% of revenue, from $11.4 million in 2013. The increase is due to mark-to-market adjustment associated with Franco-Nevada’s Deferred Share Unit Plan and stock-based compensation expense.
Business development expenses were $1.9 million and $2.0 million for the nine months ended September 30, 2014 and 2013, respectively. Timing of incurring these costs will vary depending upon the timing and level of activity of the business development team on completing transactions.
Franco-Nevada recorded $0.2 million in impairment charges on exploration interests where the explorer/operator had abandoned tenements, concessions or ground which was subject to royalty rights held by Franco-Nevada.
Foreign Exchange and Other Income/Expenses
Foreign exchange and other income/expenses comprise foreign exchange gains and losses, mark-to-market adjustments on the fair value of warrants held as investments and gains and losses from the sale of gold where settlement of the royalty/stream obligation is taken in kind from the operators.
Other income for the period was $0.9 million compared to expenses of $13.9 million in 2013. The following table provides a list of the other income/expenses incurred for the nine months ended September 30, 2014 and 2013.
|
| Nine months ended September 30, |
| |||||||
(expressed in millions) |
| 2014 |
| 2013 |
| Variance |
| |||
Foreign exchange gain (loss) |
| $ | (0.5 | ) | $ | (2.4 | ) | $ | 1.9 |
|
Mark-to-market gain (loss) on warrants |
| 1.5 |
| (9.5 | ) | 11.0 |
| |||
Loss on sale of gold |
| (0.1 | ) | (2.0 | ) | 1.9 |
| |||
|
| $ | 0.9 |
| $ | (13.9 | ) | $ | 14.8 |
|
Foreign exchange gains and losses include foreign exchange movements related to investments in bonds and other debt securities, such as government and corporate bonds, treasury bills and intercompany loans, held in the parent company, which are denominated in either U.S. dollars or Mexican pesos. The parent company’s functional currency is the Canadian dollar. Under IFRS, all foreign exchange changes related to the debt securities are recorded in net income as opposed to other comprehensive income.
Foreign exchange and other income was $0.9 million in the period (2013 — expenses of $13.9 million) which was comprised of $0.5 million related to foreign exchange losses on intercompany debt securities (2013 — $2.4 million), $1.5 million in mark-to-market gains related to warrants of small to mid-sized publicly-listed resource companies (2013 — losses of $9.5 million) and a $0.1 million loss on the sale of gold (2013 — $2.0 million).
Finance Costs and Finance Income
Finance income was $3.0 million (2013 - $2.5 million) for the period which was earned on our cash equivalents and/or short-term investments. The increase in finance income was due to higher cash balances invested in 2014 partially offset with a larger U.S. dollar balance, which earns a lower interest rate, when compared to 2013. Finance expenses were $1.2 million (2013 - $1.3 million) and consist of the costs of maintaining our credit facility in
addition to the amortization of the initial set-up costs incurred with respect to the facility. Finance expenses were in line with 2013 and were comprised of standby fees of $0.9 million (2013 - $0.7 million) and amortization of issuance costs were $0.3 million (2013 - $0.3 million). The Company expensed $0.3 million related to a previous credit facility in 2013.
Income Taxes
Franco-Nevada had an income tax expense of $40.1 million (2013 — $39.4 million) for the period comprised of a current income tax expense of $24.8 million (2013 - $31.0 million) and a deferred income tax expense of $15.3 million (2013 — $8.4 million) related to our Canadian and Mexican entities. The Company’s effective tax rate decreased to 27.5%, from 29.9% in 2013, due a shift in income to lower tax jurisdictions and the impact of the indexation of mineral properties in Mexico.
Net Income
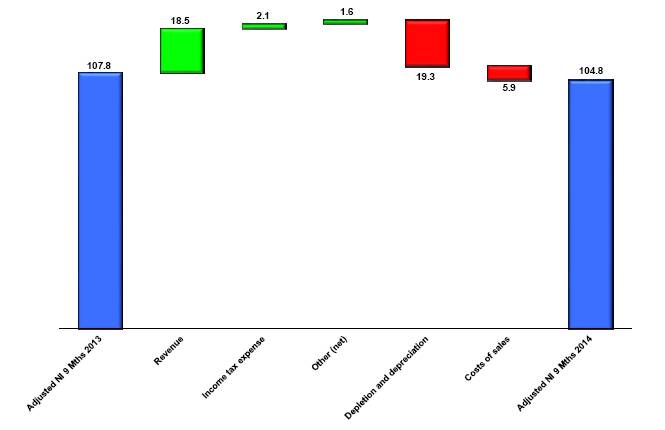
Net income for the period was $104.2 million, or $0.70 per share, compared with $92.3 million, or $0.63 per share, for the same period in 2013. Adjusted Net Income was $104.8 million, or $0.71 per share, compared with $107.8 million, or $0.74 per share, for the nine months of 2013. The decrease in Adjusted Net Income was driven primarily by higher depletion and costs of sales, partially offset by a higher revenue and lower income tax expense.
Adjusted Net Income Reconciliation — Nine Months 2013 to Nine Months 2014
(expressed in millions)
Non-IFRS Financial Measures
Adjusted EBITDA for the three and nine months ended September 30, 2014 and 2013 is presented by commodity, location and type of interest below:
|
| Adjusted EBITDA |
| |||||||
For the three months ended September 30, |
| 2014 |
| 2013 |
| |||||
(expressed in millions) |
| $ |
| % |
| $ |
| % |
| |
Commodity |
|
|
|
|
|
|
|
|
| |
Gold |
| $ | 57.8 |
| 65 | % | 47.8 |
| 60 | % |
PGMs |
| 9.7 |
| 11 | % | 9.9 |
| 12 | % | |
Other |
| 3.1 |
| 4 | % | 3.1 |
| 4 | % | |
Oil & Gas |
| 18.1 |
| 20 | % | 19.5 |
| 24 | % | |
|
| $ | 88.7 |
| 100 | % | 80.3 |
| 100 | % |
|
|
|
|
|
|
|
|
|
| |
Geography |
|
|
|
|
|
|
|
|
| |
Canada |
| $ | 33.6 |
| 38 | % | 33.4 |
| 42 | % |
United States |
| 21.0 |
| 24 | % | 15.8 |
| 20 | % | |
Mexico |
| 11.0 |
| 12 | % | 13.1 |
| 16 | % | |
Australia |
| 5.1 |
| 6 | % | 5.1 |
| 6 | % | |
Rest of World |
| 18.0 |
| 20 | % | 12.9 |
| 16 | % | |
|
| $ | 88.7 |
| 100 | % | 80.3 |
| 100 | % |
|
|
|
|
|
|
|
|
|
| |
Type |
|
|
|
|
|
|
|
|
| |
Revenue-based |
| $ | 36.5 |
| 41 | % | 34.3 |
| 43 | % |
Streams |
| 27.1 |
| 31 | % | 25.6 |
| 32 | % | |
Profit-based |
| 14.0 |
| 16 | % | 11.5 |
| 14 | % | |
Working interests and other |
| 11.1 |
| 12 | % | 8.9 |
| 11 | % | |
|
| $ | 88.7 |
| 100 | % | 80.3 |
| 100 | % |
|
| Adjusted EBITDA |
| |||||||
For the nine months ended September 30, |
| 2014 |
| 2013 |
| |||||
(expressed in millions) |
| $ |
| % |
| $ |
| % |
| |
Commodity |
|
|
|
|
|
|
|
|
| |
Gold |
| $ | 165.5 |
| 63 | % | 162.4 |
| 66 | % |
PGMs |
| 30.5 |
| 12 | % | 28.8 |
| 12 | % | |
Other |
| 9.8 |
| 4 | % | 7.6 |
| 3 | % | |
Oil & Gas |
| 54.9 |
| 21 | % | 46.4 |
| 19 | % | |
|
| $ | 260.7 |
| 100 | % | 245.2 |
| 100 | % |
|
|
|
|
|
|
|
|
|
| |
Geography |
|
|
|
|
|
|
|
|
| |
Canada |
| $ | 101.8 |
| 39 | % | 85.8 |
| 35 | % |
United States |
| 57.1 |
| 22 | % | 58.5 |
| 24 | % | |
Mexico |
| 34.5 |
| 13 | % | 43.4 |
| 18 | % | |
Australia |
| 15.7 |
| 6 | % | 14.2 |
| 6 | % | |
Rest of World |
| 51.6 |
| 20 | % | 43.3 |
| 17 | % | |
|
| $ | 260.7 |
| 100 | % | 245.2 |
| 100 | % |
|
|
|
|
|
|
|
|
|
| |
Type |
|
|
|
|
|
|
|
|
| |
Revenue-based |
| $ | 108.8 |
| 42 | % | 116.2 |
| 47 | % |
Streams |
| 83.7 |
| 32 | % | 80.3 |
| 33 | % | |
Profit-based |
| 42.7 |
| 16 | % | 27.8 |
| 11 | % | |
Working interests and other |
| 25.5 |
| 10 | % | 20.9 |
| 9 | % | |
|
| $ | 260.7 |
| 100 | % | 245.2 |
| 100 | % |
Adjusted EBITDA and Adjusted EBITDA per share
Adjusted EBITDA and Adjusted EBITDA per share are non-IFRS financial measures, which exclude the following from net income and EPS:
· Income tax expense/recovery;
· Finance expenses;
· Finance income;
· Foreign exchange gains/losses and other income/expenses;
· Gains/losses on the sale of investments;
· Impairment charges related to royalty, stream and working interests and investments;
· Depletion and depreciation; and
· Non-cash costs of sales.
Management uses Adjusted EBITDA and Adjusted EBITDA per share to evaluate the underlying operating performance of the Company as a whole for the reporting periods presented, and to assist with the planning and forecasting of future operating results. Management believes that Adjusted EBITDA and Adjusted EBITDA per share allow investors and analysts to better evaluate the results of the underlying business of the Company. While the adjustments to net income and EPS in these measures include items that are both recurring and non-recurring, management believes that Adjusted EBITDA and Adjusted EBITDA per share are useful measures of the Company’s performance because foreign exchange, gains/losses on sale of investments and impairment charges do not reflect the underlying operating performance of our business and are not necessarily indicative of future operating results. Adjusted EBITDA and Adjusted EBITDA per share are intended to provide additional information to investors and analysts, do not have any standardized meaning under IFRS and should not be considered in isolation or as a substitute for measures of performance prepared in accordance with IFRS.
Reconciliation of Net Income to Adjusted EBITDA:
|
| Three months ended |
| Nine months ended |
| ||||||||
(expressed in millions, except per share amounts) |
| 2014 |
| 2013 |
| 2014 |
| 2013 |
| ||||
Net Income |
| $ | 33.2 |
| $ | 35.3 |
| $ | 105.5 |
| $ | 92.3 |
|
Income tax expense |
| 13.0 |
| 13.4 |
| 40.1 |
| 39.4 |
| ||||
Finance costs |
| 0.4 |
| 0.2 |
| 1.2 |
| 1.3 |
| ||||
Finance income |
| (1.2 | ) | (0.8 | ) | (3.0 | ) | (2.5 | ) | ||||
Depletion and depreciation |
| 38.5 |
| 32.3 |
| 114.2 |
| 94.9 |
| ||||
Non-cash costs of sales |
| 3.4 |
| — |
| 3.4 |
| — |
| ||||
Impairment of royalty interests |
| 0.2 |
| — |
| 0.2 |
| — |
| ||||
Impairment of investments |
| — |
| — |
| — |
| 5.9 |
| ||||
Foreign exchange (gains)/losses and other (income)/expenses |
| 1.2 |
| (0.1 | ) | (0.9 | ) | 13.9 |
| ||||
Adjusted EBITDA |
| $ | 88.7 |
| $ | 80.3 |
| $ | 260.7 |
| $ | 245.2 |
|
Basic Weighted Average Shares Outstanding |
| 151.1 |
| 146.9 |
| 148.6 |
| 146.8 |
| ||||
Adjusted EBITDA per share |
| $ | 0.59 |
| $ | 0.55 |
| $ | 1.75 |
| $ | 1.67 |
|
Margin
Margin is a non-IFRS financial measure which is defined by the Company as Adjusted EBITDA divided by revenue. Management uses Margin to evaluate the performance of the Company’s portfolio and we believe Margin provides a meaningful measure for investors and analysts to evaluate our overall ability to generate cash flow from our royalty, stream and working interests. Margin is intended to provide additional information, does not have any standardized definition under IFRS and should not be considered in isolation or as a substitute for a measure of performance in accordance with IFRS.
Reconciliation of Net Income to Margin:
|
| Three months ended |
| Nine months ended |
| ||||||||
(expressed in millions, except per share amounts |
| 2014 |
| 2013 |
| 2014 |
| 2013 |
| ||||
Net Income |
| $ | 33.2 |
| $ | 35.3 |
| $ | 105.5 |
| $ | 92.3 |
|
Income tax expense |
| 13.0 |
| 13.4 |
| 40.1 |
| 39.4 |
| ||||
Finance costs |
| 0.4 |
| 0.2 |
| 1.2 |
| 1.3 |
| ||||
Finance income |
| (1.2 | ) | (0.8 | ) | (3.0 | ) | (2.5 | ) | ||||
Depletion and depreciation |
| 38.5 |
| 32.3 |
| 114.2 |
| 94.9 |
| ||||
Non-cash costs of sales |
| 3.4 |
| — |
| 3.4 |
| — |
| ||||
Impairment of royalty interests |
| 0.2 |
| — |
| 0.2 |
| — |
| ||||
Impairment of investments |
| — |
| — |
| — |
| 5.9 |
| ||||
Foreign exchange (gains)/losses and other (income)/expenses |
| 1.2 |
| (0.1 | ) | (0.9 | ) | 13.9 |
| ||||
Adjusted EBITDA |
| $ | 88.7 |
| $ | 80.3 |
| $ | 260.7 |
| $ | 245.2 |
|
Revenue |
| 107.6 |
| 98.8 |
| 319.4 |
| 300.9 |
| ||||
Margin |
| 82.4 | % | 81.3 | % | 81.6 | % | 81.5 | % | ||||
Adjusted Net Income and Adjusted Net Income per share
Adjusted Net Income and Adjusted Net Income per share are non-IFRS financial measures, which exclude the following from net income and EPS:
· Foreign exchange gains/losses and other income/expenses;
· Gains/losses on the sale of investments;
· Impairment charges related to royalty, stream and working interests and investments;
· Unusual non-recurring items; and
· Impact of income taxes on these items.
Management uses Adjusted Net Income and Adjusted Net Income per share to evaluate the underlying operating performance of the Company as a whole for the reporting periods presented, and to assist with the planning and forecasting of future operating results. Management believes that Adjusted Net Income and Adjusted Net Income per share allow investors and analysts to better evaluate the results of the underlying business of the Company. While the adjustments to net income and EPS in these measures include items that are both recurring and non-recurring, management believes that Adjusted Net Income and Adjusted Net Income per share are useful measures of the Company’s performance because foreign exchange, gains/losses on sale of investments and impairment charges do not reflect the underlying operating performance of our business and are not necessarily indicative of future operating results. Adjusted Net Income and Adjusted Net Income per share are intended to provide additional information to investors and analysts, do not have
any standardized meaning under IFRS and should not be considered in isolation or as a substitute for measures of performance prepared in accordance with IFRS.
Reconciliation of Net Income to Adjusted Net Income:
|
| Three months ended |
| Nine months ended |
| ||||||||
(expressed in millions, except per share amounts) |
| 2014 |
| 2013 |
| 2014 |
| 2013 |
| ||||
Net Income |
| $ | 33.2 |
| $ | 35.3 |
| $ | 105.5 |
| $ | 92.3 |
|
Foreign exchange (gains)/losses and other (Income)/expenses, net of income tax |
| 0.5 |
| (0.3 | ) | 0.5 |
| 1.7 |
| ||||
Mark-to-market changes on derivatives, net of income tax |
| 0.7 |
| 0.3 |
| (1.3 | ) | 8.3 |
| ||||
Impairment of royalty interests, net of income tax |
| 0.1 |
| — |
| 0.1 |
| — |
| ||||
Impairment of investments, net of income tax |
| — |
| — |
| — |
| 5.2 |
| ||||
Credit facility costs written off, net of income tax |
| — |
| — |
| — |
| 0.3 |
| ||||
Adjusted Net Income |
| $ | 34.5 |
| $ | 35.3 |
| $ | 104.8 |
| $ | 107.8 |
|
Basic Weighted Average Shares Outstanding |
| 151.1 |
| 146.9 |
| 148.6 |
| 146.8 |
| ||||
|
|
|
|
|
|
|
|
|
| ||||
Basic EPS |
| $ | 0.22 |
| $ | 0.24 |
| $ | 0.71 |
| $ | 0.63 |
|
Foreign exchange(gains)/losses and other (income)/expenses, net of income tax |
| — |
| (0.1 | ) | 0.01 |
| 0.01 |
| ||||
Mark-to-market changes on derivatives, net of income tax |
| 0.01 |
| 0.1 |
| (0.01 | ) | 0.06 |
| ||||
Impairment of investments, net of income tax |
| — |
| — |
| — |
| 0.04 |
| ||||
Adjusted Net Income per share |
| $ | 0.23 |
| $ | 0.24 |
| $ | 0.71 |
| $ | 0.74 |
|
Financial Position, Liquidity and Capital Resources
Operating Cash Flow
Cash provided by operating activities before changes in non-cash assets and liabilities, relating to operating activities, was $80.1 million and $75.9 million for the three months ended September 30, 2014 and 2013, respectively. The increase was attributable to higher revenues earned in the quarter compared to the same quarter in 2013.
Cash provided by operating activities before changes in non-cash assets and liabilities, relating to operating activities, was $238.1 million and $219.4 million for the nine months ended September 30, 2014 and 2013, respectively. The increase was attributable to higher revenues earned in 2014 compared to 2013.
Investing Activities
Cash used in investing activities was $7.0 million for the quarter compared to $13.9 million in the same period of 2013. The decrease was due to higher proceeds from the sale of investments partially offset by funding of transactions in 2014 compared to 2013.
For the nine months ended September 30, 2014, cash used in investing activities was $145.1 million compared to cash provided by investing of $27.0 million in 2013. In the first nine months of 2014, Franco-Nevada has invested over $222.8 million in new stream and royalty transactions as described in the Corporate section above.
Typically Franco-Nevada invests its excess funds in various term deposits, treasury bills of the U.S. government, Canadian federal and provincial governments and high quality corporate bonds. As at September 30, 2014, the majority of funds were held in cash deposits with several financial institutions. As at September 30, 2014, the investments had
various maturities upon acquisition of 90 days. Accordingly, as at September 30, 2014, those investments were classified as “cash and cash equivalents”.
Financing Activities
Net cash provided by financing activities was $458.1 million for the quarter compared to net cash used of $21.9 million for 2013. The increase in cash generated is attributable to the equity financing completed in August 2014 which generated net proceeds of $479.8 million.
Financing activities provided $414.7 million in cash in the nine months ended September 30, 2014 compared to cash used in financing activities of $71.9 million in 2013. The increase is due to the equity financing and a reduction in cash dividend payments with shareholders electing to participate in the Company’s Dividend Reinvestment Plan.
Cash Resources and Liquidity
Our performance is impacted by foreign currency fluctuations of the Canadian dollar, Mexican peso and Australian dollar relative to the U.S. dollar. The largest exposure we have is with respect to the Canada/U.S. dollar exchange rate as we hold a significant amount of our assets in Canada and report our results in U.S. dollars. The effect of this volatility in these currencies against the U.S. dollar impacts our corporate administration, business development expenses and depletion on mineral and oil & gas interests incurred in our Canadian and Australian entities due to their respective functional currencies. The Canadian dollar traded in a range of $0.8888 to $0.9422, closing the period at $0.8922. The Mexican peso traded in a range of $0.07402 to $0.07784 and the Australian dollar traded between $0.8712 and $0.9449.
Management’s objectives when managing capital are to:
(a) ensure the preservation and availability of capital by investing in low risk investments with high liquidity; and
(b) ensure that adequate levels of capital are maintained to meet requirements.
As at September 30, 2014, our cash, cash equivalents and short-term investments totaled $1,221.9 million (December 31, 2013 - $788.0 million). In addition, we held investments at September 30, 2014 with a combined value of $43.1 million (December 31, 2013 - $38.2 million), of which $38.5 million was held in publicly traded equity instruments (December 31, 2013 - $29.7 million). Working capital as at September 30, 2014 was $1,312.3 million (December 31, 2013 - $861.2 million). The increase is the result of the equity financing completed in August 2014.
Our near-term cash requirements include funding of the Candelaria, Cobre Panama, and Karma stream commitments, corporate administration costs, certain costs of operations, declared dividends and income taxes directly related to the recognition of royalty and stream revenues. As a royalty/stream company, there are limited requirements for capital expenditures other than for the acquisition of additional royalties/streams and working interests’ capital commitments. Such acquisitions are entirely discretionary and will be consummated through the use of cash, as available, or through the issuance of common shares or other equity or debt securities or use of our credit facility. We believe that our current cash resources, our available credit facility and future cash flows will be sufficient to
cover the cost of our commitments under the various stream agreements, administrative expenses, costs of operations and dividend payments for the foreseeable future.
Ore and refined gold purchase commitments
Franco-Nevada has certain ore and refined gold purchase commitments related to its stream agreements once the ore is produced from the mining activities.
Cobre Panama Precious Metals Stream
On August 20, 2012, Franco-Nevada announced the acquisition of a precious metals stream on Inmet’s 80% interest in the Cobre Panama copper project in Panama. Franco-Nevada has committed to fund a $1.0 billion deposit for development of the Cobre Panama project, to be drawn down on a 1:3 ratio with Inmet’s funding after Inmet’s aggregate funding for the project has exceeded $1.0 billion (Inmet, now First Quantum, owns 80% of the project). Franco-Nevada expects to fund the $1.0 billion in stages over a three year period. Under the terms of the precious metals stream agreement, Franco-Nevada will pay $400 per ounce for gold and $6 per ounce for silver (subject to an annual adjustment for inflation) for the first 1,341,000 ounces of gold and 21,510,000 ounces of silver, respectively, delivered to Franco-Nevada under the agreement. Thereafter Franco-Nevada will pay the greater of $400 per ounce for gold and $6 per ounce for silver (subject to an annual adjustment for inflation), respectively, and one half of the then prevailing market price. The gold and silver delivered under the precious metals stream agreement is indexed to the copper-in-concentrate produced from the Cobre Panama project.
In March 2013, Inmet was acquired by First Quantum Minerals Ltd. (“First Quantum”). Following the acquisition, First Quantum undertook a complete review of the Cobre Panama project and released the results in January 2014 which included a larger project with installed capacity approximately 17% higher than the Inmet plan and a revised development timeframe with first concentrate production expected in the fourth quarter of 2017. First Quantum has requested changes under the security and reporting requirements of the agreement which Franco-Nevada is currently considering to achieve a mutually beneficial outcome. Franco-Nevada expects to fund approximately $200.0 million to $250.0 million in the next few months in connection with our Cobre Panama stream agreement.
In addition, the Company has committed to the Candelaria, Karma and Guadalupe stream transactions as outlined in the Corporate section above.
Capital Resources
As of November 5, 2014, the entire amount of $500.0 million, or its Canadian dollar equivalent, is available under our credit facility. Advances under the facility bear interest depending upon the currency of the advance and leverage ratio. On March 18, 2014, Franco-Nevada extended its credit facility for an additional two years which amended the expiry of the credit facility to March 18, 2019. As of November 5, 2014, U.S. and Canadian dollar advances under the facility would bear interest rates of 3.95% and 3.20%, respectively. We can also draw funds using LIBOR 30-day rates plus 120 basis points under our credit facility.
Standby fees of $0.3 million (2013 - $0.1 million) and $0.9 million (2013 - $0.7 million) were incurred and paid for the three and nine months ended September 30, 2014.
Critical Accounting Estimates
The preparation of consolidated financial statements in accordance with IFRS requires the Company to make judgments, estimates and assumptions that affect the reported amounts of assets and liabilities and disclosures of contingent assets and liabilities at the date of the consolidated financial statements and the reported amounts of revenues and expenses during the reporting period. Estimates and assumptions are continuously evaluated and are based on management’s best knowledge of the relevant facts and circumstances, having regard to previous experience. However, actual outcomes may differ from the amounts included in the consolidated financial statements.
Our significant accounting policies and estimates are disclosed in notes 2 and 3 of our most recent annual consolidated financial statements.
Outstanding Share Data
Franco-Nevada is authorized to issue an unlimited number of common and preferred shares. A detailed description of the rights, privileges, restrictions and conditions attached to the authorized shares is included in our Annual Information Form for the year ended December 31, 2013, a copy of which can be found on SEDAR at www.sedar.com and in our 40-F, a copy of which can be found on EDGAR at www.sec.gov.
As of November 5, 2014, the number of common shares outstanding or issuable pursuant to other outstanding securities is as follows:
Common Shares |
| Number |
|
Outstanding |
| 156,077,893 |
|
Issuable upon exercise of Franco-Nevada warrants(1) |
| 6,510,769 |
|
Issuable upon exercise of Franco-Nevada options(2) |
| 2,102,858 |
|
Issuable upon exercise of Gold Wheaton (now Franco-Nevada GLW Holdings Corp.) options(3) |
| 23,340 |
|
Issuable upon exercise of special warrant(4) |
| 2,000,000 |
|
Issuable upon vesting of Franco-Nevada RSUs |
| 128,616 |
|
Diluted common shares |
| 166,843,476 |
|
Notes:
(1) The warrants have an exercise price of C$75.00 per share and an expiry date of June 16, 2017.
(2) There were 2,102,858 stock options under our share compensation plan outstanding to directors, officers, employees and others with exercise prices ranging from C$15.20 to C$57.57 per share.
(3 In connection with the acquisition of Gold Wheaton, Franco-Nevada reserved for issuance 730,698 common shares in connection with options that were outstanding upon closing, with exercise prices ranging between C$2.50 and C$6.00 for 0.1556 of a Franco-Nevada common share. To date, 679,038 Gold Wheaton stock options have been exercised and 28,320 Gold Wheaton stock options have expired.
(4) In connection with the transaction with Taseko Mines Limited, one special warrant was granted to Taseko which will be exchangeable into 2,000,000 purchase share warrants once Taseko’s New Prosperity project gets fully permitted and financed. Each warrant will entitle Taseko to purchase one Franco-Nevada common share at a price of C$75.00 per share before June 16, 2017. New Prosperity’s most recent permit application was denied earlier in 2014.
Franco-Nevada has not issued any preferred shares.
Risk Factors
The following discussion pertains to the outlook and conditions currently known to management which could have a material impact on the financial condition and results of operations. This discussion, by its nature, is not all-inclusive. It is not a guarantee that other factors will or will not affect Franco-Nevada in the future. For additional information with respect to risks and uncertainties, please also refer to the “Risk Factors” section of our most recent Annual Information Form filed with the Canadian securities regulatory authorities on SEDAR at www.sedar.com and our most recent Form 40-F filed with the Securities and Exchange Commission on EDGAR at www.sec.gov.
Fluctuation in Commodity Prices
Commodity prices have fluctuated widely in recent years. The marketability and price of metals, minerals, oil & gas on properties for which we hold interests will be influenced by numerous factors beyond our control and which may have a material and adverse effect on our profitability, results of operations and financial condition.
Significance of the Palmarejo Gold Stream and Weyburn Unit
The Weyburn Unit and, while the minimum obligation remains outstanding, the Palmarejo gold stream are expected to be significant revenue-producers to Franco-Nevada. As a result, any adverse issues associated with financial viability, production and/or the recoverability of reserves from these operations and the associated portions over which we have a stream and/or royalty interests, could have material and adverse effects on our profitability, results of operations and financial condition. The existing minimum royalty under the Palmarejo gold stream to deliver 50,000 ounces per annum, payable monthly, is projected to reach its 400,000 ounce cap sometime in 2016.
Foreign Currency Fluctuations
Franco-Nevada’s royalty/stream interests are subject to foreign currency fluctuations and inflationary pressures, which may have a material and adverse effect on our profitability, results of operations and financial condition. There can be no assurance that the steps taken by management to address variations in foreign exchange rates will eliminate the risk of all adverse effects and, accordingly, we may suffer losses due to foreign currency rate fluctuations.
Franco-Nevada operates on an international basis and, therefore, foreign exchange risk and foreign currency translation risk exposures arise from the translation of transactions denominated in a foreign currency. During the first nine months of 2014, the foreign exchange risk for its Canadian, Australian and Mexican operations arose primarily with respect to the U.S. dollar.
Internal Control Over Financial Reporting and Disclosure Controls and Procedures
Our Chief Executive Officer and Chief Financial Officer are responsible for establishing and maintaining Franco-Nevada’s internal control over financial reporting and other financial disclosure and our disclosure controls and procedures.
Internal control over financial reporting is a process designed to provide reasonable assurance regarding the reliability of financial reporting and the preparation of financial
statements for external purposes in accordance with IFRS. Franco-Nevada’s internal control over financial reporting includes those policies and procedures that (i) pertain to the maintenance of records that, in reasonable detail, accurately and fairly reflect the transactions and dispositions of the assets of Franco-Nevada; (ii) provide reasonable assurance that transactions are recorded as necessary to permit preparation of financial statements in accordance with IFRS, and that receipts and expenditures of Franco-Nevada are being made only in accordance with authorizations of management and directors of Franco-Nevada; and (iii) provide reasonable assurance regarding prevention or timely detection of unauthorized acquisition, use or disposition of Franco-Nevada’s assets that could have a material effect on Franco-Nevada’s financial statements. Internal control over other financial disclosure is a process designed to ensure that other financial information included in this MD&A, fairly represents in all material respects the financial condition, results of operations and cash flows of Franco-Nevada for the periods presented in this MD&A.
Franco-Nevada’s disclosure controls and procedures are designed to provide reasonable assurance that material information relating to Franco-Nevada, including its consolidated subsidiaries, is made known to management by others within those entities, particularly during the period in which this report is prepared and that information required to be disclosed by Franco-Nevada in its annual filings, interim filings or other reports filed or submitted by it under securities legislation is recorded, processed, summarized and reported within the time periods specified in securities legislation.
Due to its inherent limitations, internal control over financial reporting and disclosure may not prevent or detect all misstatements. Also, projections of any evaluation of effectiveness to future periods are subject to the risk that controls may become inadequate because of changes in conditions, or that the degree of compliance with the policies or procedures may change.
For the three and nine months ended September 30, 2014, there has been no change in Franco-Nevada’s internal control over financial reporting that has materially affected, or is reasonably likely to materially affect, Franco-Nevada’s internal control over financial reporting.
Cautionary Statement on Forward Looking Information
This MD&A contains “forward looking information” and “forward looking statements” within the meaning of applicable Canadian securities laws and the U.S. Private Securities Litigation Reform Act of 1995, respectively, which may include, but are not limited to, statements with respect to future events or future performance, management’s expectations regarding Franco-Nevada’s growth, results of operations, estimated future revenues, requirements for additional capital, mineral reserve and mineral resource estimates, production estimates, production costs and revenue, future demand for and prices of commodities, expected mining sequences, business prospects and opportunities. In addition, statements (including data in tables) relating to reserves and resources and gold equivalent ounces are forward looking statements, as they involve implied assessment, based on certain estimates and assumptions, and no assurance can be given that the estimates will be realized. Such forward looking statements reflect management’s current beliefs and are based on information currently available to management. Often, but not always, forward looking statements can be identified by the use of words such as “plans”, “expects”, “is expected”, “budgets”, “scheduled”, “estimates”, “forecasts”, “predicts”, “projects”, “intends”, “targets”, “aims”, “anticipates” or “believes” or variations (including negative variations) of such words and phrases or may be identified by statements to the effect that certain actions “may”, “could”, “should”, “would”, “might” or “will” be taken, occur or be achieved. Forward looking statements involve known and unknown risks, uncertainties and other factors, which may cause the actual results, performance or achievements of Franco-Nevada to be materially different from any future results, performance or achievements expressed or implied by the forward looking statements. A number of factors could cause actual events or results to differ materially from any forward looking statement, including, without limitation: fluctuations in the prices of the primary commodities that drive royalty and stream revenue (gold, platinum group metals, copper, nickel, uranium, silver, iron-ore and oil and gas); fluctuations in the value of the Canadian and Australian dollar, Mexican peso and any other currency in which revenue is generated, relative to the U.S. dollar; changes in national and local government legislation, including permitting and licensing regimes and taxation policies; regulations and political or economic developments in any of the countries where properties in which Franco-Nevada holds a royalty, stream or other interest are located or through which they are held; risks related to the operators of the properties in which Franco-Nevada holds a royalty, stream or other interest, including changes in the ownership and control of such operators; influence of macroeconomic developments; business opportunities that become available to, or are pursued by Franco-Nevada; reduced access to debt and equity capital; litigation; title, permit or license disputes related to interests on any of the properties in which Franco-Nevada holds a royalty, stream or other interest; whether or not the Corporation is determined to have PFIC status; excessive cost escalation as well as development, permitting, infrastructure, operating or technical difficulties on any of the properties in which Franco-Nevada holds a royalty, stream or other interest; rate and timing of production differences from resource estimates; risks and hazards associated with the business of development and mining on any of the properties in which Franco-Nevada holds a royalty, stream or other interest, including, but not limited to unusual or unexpected geological and metallurgical conditions, slope failures or cave-ins, flooding and other natural disasters, terrorism, civil unrest or an outbreak of contagious disease; and the integration of acquired assets. The forward looking statements contained in this MD&A are based upon assumptions management believes to be reasonable, including, without limitation: the ongoing operation of the properties in which Franco-Nevada holds a royalty, stream or other interest by the owners or operators of such properties in a manner consistent with past practice; the accuracy of public statements and disclosures
made by the owners or operators of such underlying properties; no material adverse change in the market price of the commodities that underlie the asset portfolio; the Corporation’s ongoing income and assets relating to determination of our PFIC status; no adverse development in respect of any significant property in which Franco-Nevada holds a royalty, stream or other interest; the accuracy of publicly disclosed expectations for the development of underlying properties that are not yet in production; integration of acquired assets; and the absence of any other factors that could cause actions, events or results to differ from those anticipated, estimated or intended. However, there can be no assurance that forward looking statements will prove to be accurate, as actual results and future events could differ materially from those anticipated in such statements and investors are cautioned that forward looking statements are not guarantees of future performance. Franco-Nevada cannot assure investors that actual results will be consistent with these forward looking statements. Accordingly, investors should not place undue reliance on forward looking statements due to the inherent uncertainty therein. For additional information with respect to risks, uncertainties and assumptions, please refer to the “Risk Factors” section of this MD&A as well as Franco-Nevada’s most recent Annual Information Form filed with the Canadian securities regulatory authorities on www.sedar.com and contained in Franco-Nevada’s Form 40-F filed with the SEC on www.sec.gov. The forward looking statements herein are made as of the date of this MD&A only and Franco-Nevada does not assume any obligation to update or revise them to reflect new information, estimates or opinions, future events or results or otherwise, except as required by applicable law.
CORPORATE INFORMATION
Executive Management | Head Office | Share Capital | |
|
|
| |
David Harquail | 199 Bay Street, | As at November 5, 2014 | |
President & CEO | Suite 2000 | Common shares | |
| P.O. Box 285 | outstanding | 156,077,893 |
Sandip Rana | Commerce Court Postal Station | Reserved for: |
|
Chief Financial Officer | Toronto, Canada | 2017 Warrants: | 8,510,769 |
| M5L 1G9 | Options & other: | 2,254,814 |
Paul Brink |
| Fully diluted: | 166,843,476 |
Senior Vice President, | Tel: (416) 306-6300 |
| |
|
| Investor Information | |
Geoff Waterman | U.S. Office |
| |
Chief Operating Officer | 1745 Shea Center Drive, | Stefan Axell, | |
| Suite 400 | Director, Corporate Affairs | |
Lloyd Hong | Highlands Ranch, Colorado |
| |
Chief Legal Officer & | USA 80129 | info@franco-nevada.com | |
Corporate Secretary |
|
| |
| Tel: (720) 344-4986 | www.franco-nevada.com | |
Directors |
|
| |
| Australia Office | Tel: (416) 306-6328 | |
Pierre Lassonde, |
| Toll Free: (877) 401-3833 | |
Chairman | 44 Kings Park Road, |
| |
| Suite 41 | Transfer Agent | |
David Harquail, | West Perth, |
| |
President & CEO | WA 6005 | Computershare | |
|
| Investor Services Inc. | |
Tom Albanese | Tel: 61-8-6263-4425 |
| |
|
| 100 University Avenue, | |
Derek Evans | Barbados Office | 9th Floor | |
|
| Toronto, Canada | |
Graham Farquharson | Ground Floor, | M5J 2Y1 | |
| Balmoral Hall, Balmoral Gap, |
| |
Louis Gignac | Hastings, Christ Church, | Toll Free: (800) 564-6253 | |
| Barbados, BB14034 | Tel: (514) 982-7555 | |
Randall Oliphant |
| service@computershare.com | |
| Listings |
| |
Hon. David R. Peterson |
| Auditors | |
| Toronto Stock Exchange |
| |
| Common shares: FNV | PricewaterhouseCoopers LLP | |
|
| Toronto, Canada | |
| 2017 Warrants: FNV.WT.A |
| |
| Exercise price: C$75.00 |
| |
| Expiry: June 16, 2017 |
| |
|
|
| |
| New York Stock Exchange |
| |
| Common shares: FNV |
| |
2014 Third Quarter Report |
|