Exhibit 99.2
MANAGEMENT’S DISCUSSION AND ANALYSIS
This Management’s Discussion and Analysis (“MD&A”) of financial position and results of operations of Franco-Nevada Corporation (“Franco-Nevada”, the “Company”, “we” or “our”) has been prepared based upon information available to Franco-Nevada as at May 6, 2015 and should be read in conjunction with Franco-Nevada’s unaudited condensed interim consolidated financial statements and related notes as at and for the three months ended March 31, 2015 and 2014. The unaudited condensed interim consolidated statements and MD&A are presented in U.S. dollars and have been prepared in accordance with International Financial Reporting Standards (“IFRS”) as issued by the International Accounting Standards Board (“IASB”) applicable to the preparation of interim financial statements in accordance with IAS 34, Interim Financial Reporting.
Readers are cautioned that the MD&A contains forward looking statements and that actual events may vary from management’s expectations. Readers are encouraged to read the “Cautionary Statement on Forward Looking Information” at the end of this MD&A and to consult Franco-Nevada’s audited consolidated financial statements for the year ended December 31, 2014 and the corresponding notes to the financial statements which are available on our website at www.franco-nevada.com, on SEDAR at www.sedar.com and in our most recent Form 40-F filed with the Securities and Exchange Commission on EDGAR at www.sec.gov.
Additional information related to Franco-Nevada, including our Annual Information Form, is available on SEDAR at www.sedar.com, and our Form 40-F is available on EDGAR at www.sec.gov. These documents contain detailed descriptions and maps of certain of Franco-Nevada’s producing and advanced royalty and stream assets. For additional information, our website can be found at www.franco-nevada.com.
1
Table of Contents
Overview | 3 |
| |
Highlights | 4 |
| |
Guidance | 4 |
| |
Selected Financial Information | 6 |
| |
Overview of Financial Performance — Q1 2015 to Q1 2014 | 7 |
| |
Quarterly Financial Information | 21 |
| |
Financial Condition Review | 22 |
| |
Balance Sheet Review | 22 |
| |
Financial Position, Liquidity and Capital Resources | 22 |
| |
Capital Resources | 25 |
| |
Critical Accounting Estimates | 25 |
| |
Outstanding Share Data | 26 |
| |
Risk Factors | 27 |
| |
Internal Control Over Financial Reporting and Disclosure Controls and Procedures | 28 |
| |
Non-IFRS Financial Measures | 29 |
| |
Cautionary Statement on Forward Looking Information | 32 |
2
Overview
Franco-Nevada is the leading gold royalty and stream company by both gold revenues and number of gold assets. The Company is gold-focused but also has the largest and most diversified portfolio of royalties and streams by commodity, geography, revenue type and stage of project. The portfolio is actively managed with the long-term aim of maintaining over 80% of revenue from precious metals (gold, silver & platinum group metals (“PGM”)).
Franco-Nevada does not operate mines, develop projects or conduct exploration. Franco-Nevada’s business model is focused on managing and growing its portfolio of royalties and streams. The advantages of this business model are:
· Exposure to the gold price and exploration optionality;
· Limited exposure to many of the risks associated with operating companies;
· A free cash-flow business with limited operating cash calls;
· A high-margin business that can generate cash through the entire commodity cycle;
· A scalable and diversified business in which a large number of assets can be managed with a small stable overhead;
· A forward-looking business in which management focuses on growth opportunities rather than operational or development issues; and
· A perpetual discovery option over large areas of geologically prospective lands with no cost other than the initial investment.
Franco-Nevada’s financial results in the short-term are primarily tied to the price of commodities and the amount of production from its portfolio of producing assets. From time to time, financial results are also supplemented by acquisitions of new producing assets. Over the longer-term, results are impacted by the availability of exploration and development capital applied by the operators of Franco-Nevada’s advanced and exploration assets.
Franco-Nevada has a long-term focus in making its investments and recognizes it is in a cyclical industry. Franco-Nevada has historically operated by maintaining a strong balance sheet so that it can make investments during commodity cycle downturns. At March 31, 2015, Franco-Nevada had $671.3 million in working capital and an undrawn $500.0 million unsecured credit facility.
Franco-Nevada’s shares are listed on the Toronto and New York stock exchanges under the symbol FNV. An investment in Franco-Nevada’s shares is expected to provide investors with yield and more upside than a gold ETF with less of the risks associated with operating companies. Since its IPO over seven years ago, Franco-Nevada’s share price has outperformed the gold price and all relevant gold equity benchmarks.
3
Highlights
Financial — 3 months
· 85,081 Gold Equivalent Ounces (“GEOs”)1 earned (2014 — 65,8361), an increase of 29.2% over Q1 2014;
· Revenue of $109.2 million (2014 - $104.1 million), an increase of 4.9%;
· Adjusted EBITDA2of $83.3 million, or $0.53 per share (2014 - $84.8 million or $0.58 per share);
· Margin2 of 76.3% (2014 — 81.5%);
· Net income of $19.2 million, or $0.12 per share (2014 — $35.4 million or $0.24 per share); and
· Adjusted Net Income2 of $22.9 million, or $0.15 per share (2014 - $35.4 million or $0.24 per share).
Corporate
Ring of Fire
On April 28, 2015, Franco-Nevada acquired royalty rights in the Ring of Fire mining district of Ontario by providing royalty and loan financing to Noront Resources Ltd.
Dublin Gulch (Eagle)
On January 14, 2015, Franco-Nevada acquired an existing 1.5% NSR and 2.0% gross royalty over certain claims that comprise the Eagle deposit located in the Yukon, Canada, for a cash consideration of $7.0 million.
Guidance
The following contains forward looking statements about our guidance for the remainder of 2015. Reference should be made to the “Cautionary Statement on Forward Looking Information” section at the end of this MD&A. For a description of material factors that could cause our actual results to differ materially from the forward looking statements in the following, please see the Cautionary Statement, the “Risk Factors” section of this MD&A and the “Risk Factors” section of our most recent Annual Information Form filed with the Canadian securities regulatory authorities on www.sedar.com and our most recent Form 40-F filed with the Securities and Exchange Commission on www.sec.gov.
Franco-Nevada realized 85,081 GEOs from its mineral assets and $5.5 million in revenue from its oil & gas assets in the first quarter of 2015.
Franco-Nevada is re-iterating its guidance of 335,000 and 355,000 GEOs from its mineral assets and $20.0 million to $30.0 million from its oil & gas assets for 2015. Of the 335,000
1 GEOs include our gold, platinum, palladium, silver and other mineral assets. GEOs are estimated on a gross basis for NSR royalties and, in the case of stream ounces, before the payment of the per ounce contractual price paid by the Company. For NPI royalties, GEOs are calculated taking into account the NPI economics. Platinum, palladium, silver and other minerals were converted to GEOs by dividing associated revenue, which includes settlement adjustments, by the average gold price for the period. For average commodity prices used in calculation of GEOs, please refer to average commodity price tables on pages 14 of this MD&A.
2 Adjusted Net Income, Adjusted EBITDA and Margin are non-IFRS financial measures with no standardized meaning under IFRS. For further information and a detailed reconciliation, please see pages 29-31 of this MD&A.
4
to 355,000 GEOs, Franco-Nevada expects to receive 205,000 to 215,000 GEOs under its various stream agreements.
GEOs include our gold, platinum, palladium, silver and other mineral assets. GEOs are estimated on a gross basis for NSR royalties and, in the case of stream ounces, before the payment of the per ounce contractual price paid by Franco-Nevada. For net profit interest (“NPI”) royalties, GEOs are calculated taking into account the NPI economics. Platinum, palladium, silver and other minerals were converted to GEOs by dividing the associated revenue, which includes settlement adjustments, by the average gold price for the period. For our 2015 guidance, platinum, palladium and silver metals have been converted to GEOs using commodity prices of $1,200/oz Au, $1,200/oz Pt, $750/oz Pd and $17.00/oz Ag. For 2015, the WTI oil price is assumed to average $50 per barrel with a $7.00 per barrel price differential for Canadian oil. 2015 guidance assumes the continued steady state of operations from our assets and is also based on the assumptions set out below.
We expect to fund approximately $300.0 million to $350.0 million in 2015 in connection with our precious metals stream agreement on Cobre Panama. Franco-Nevada continues to work with First Quantum to streamline reporting requirements and provide greater flexibility to finance the project. Franco-Nevada expects to fund its portion of the capital costs when the amendment is finalized.
More specifically, we expect the following with respect to our key asset categories for 2015:
· Gold — U.S.: Overall GEOs from U.S. gold assets are expected to be slightly higher in 2015 compared with 2014. Goldstrike royalty ounces are expected to be slightly higher with Barrick’s thiosulphate project now beginning production. Fire Creek/Midas is expected to deliver 7,500 ounces in 2015 pursuant to the agreement. Gold Quarry is expected to deliver 11,250 royalty ounces in 2015 as payments will be based on the minimum royalty provision.
· Gold — Canada: GEOs earned from Canadian assets in 2015 are expected to be higher than 2014 levels. Detour Lake royalty ounces are expected to be higher as Detour continues to ramp-up production. These increases are expected to be partially offset by declines in production from other Canadian assets.
· Gold — Latin America: GEOs from Latin America will grow significantly with Franco-Nevada benefitting from a full year of production from Candelaria in 2015 compared to a partial year in 2014. Candelaria is expected to deliver 80,000 GEOs in 2015, a substantial increase over 2014 when Candelaria contributed 20,099 GEOs.
· Gold — Rest of World: Rest of World gold assets are expected to generate lower GEOs in 2015. Sabodala is expected to deliver 22,500 ounces pursuant to the stream agreement. Subika is expected to be lower as a result of the delayed expansion at Ahafo.
· PGM: Sudbury stream ounces for 2015 are expected to be in line with 2014 levels and lower PGM ounces are expected from Stillwater.
· Other minerals: GEOs from other minerals are expected to be lower in 2015 as Osborne has lowered its production forecast and Peculiar Knob is scheduled to be
5
put on care and maintenance.
· Oil & Gas: For 2015, oil & gas revenues are projected to be $20.0 million to $30.0 million reflecting significantly lower oil price assumptions compared to last year.
Selected Financial Information
(expressed in millions, except
GEOs, Margin and per share
amounts) | | For the three
months ended
March 31, 2015 | | For the three
months ended
March 31, 2014 | |
Statement of Income and Comprehensive Income (Loss) | | | | | |
Revenue | | $ | 109.2 | | $ | 104.1 | |
Depletion and depreciation | | 51.7 | | 36.1 | |
Impairments(1) | | 0.1 | | — | |
Operating income | | 30.4 | | 48.7 | |
Net income | | 19.2 | | 35.4 | |
Basic earnings per share | | $ | 0.12 | | $ | 0.24 | |
Diluted earnings per share | | $ | 0.12 | | $ | 0.24 | |
Weighted average shares outstanding | | 156.5 | | 147.2 | |
| | | | | |
Non-IFRS Measures | | | | | |
GEOs(2) | | 85,081 | | 65,836 | |
Adjusted EBITDA(3) | | $ | 83.3 | | $ | 84.8 | |
Adjusted EBITDA(3) per share | | $ | 0.53 | | $ | 0.58 | |
Margin(3) | | 76.3 | % | 81.5 | % |
Adjusted Net Income(3) | | $ | 22.9 | | $ | 35.4 | |
Adjusted Net Income(3) per share | | $ | 0.15 | | $ | 0.24 | |
| | | | | |
Statement of Cash Flows | | | | | |
Net cash provided by operating activities, before changes in non-cash assets and liabilities | | $ | 77.9 | | $ | 77.2 | |
Net cash from operating activities per share | | $ | 0.50 | | $ | 0.52 | |
Dividends declared per share | | $ | 0.20 | | $ | — | |
Dividends paid (including DRIP) | | $ | 31.1 | | $ | 25.4 | |
Net cash used in investing activities | | $ | (21.1 | ) | $ | (134.6 | ) |
Net cash used in financing activities | | $ | (23.6 | ) | $ | (22.3 | ) |
| | At March 31,
2015 | | At December 31,
2014 | |
Statement of Financial Position | | | | | |
Cash and cash equivalents | | $ | 598.5 | | $ | 592.5 | |
Total assets | | 3,372.5 | | 3,466.9 | |
Deferred income tax liabilities | | 39.2 | | 40.3 | |
Total shareholders’ equity | | 3,306.6 | | 3,405.5 | |
| | | | | |
Working capital | | $ | 671.3 | | $ | 677.8 | |
Debt | | $ | Nil | | $ | Nil | |
1 Impairments include impairment charges on investments, royalties, streams and working interests.
2 For average commodity prices used in calculation of GEOs, please refer to average commodity price tables on pages 14 of this MD&A.
3 Adjusted EBITDA, Margin and Adjusted Net Income are non-IFRS financial measures with no standardized meaning under IFRS. For further information and a detailed reconciliation, please see pages 29-31 of this MD&A.
6
Overview of Financial Performance — Q1 2015 to Q1 2014
Gold Equivalent Ounces
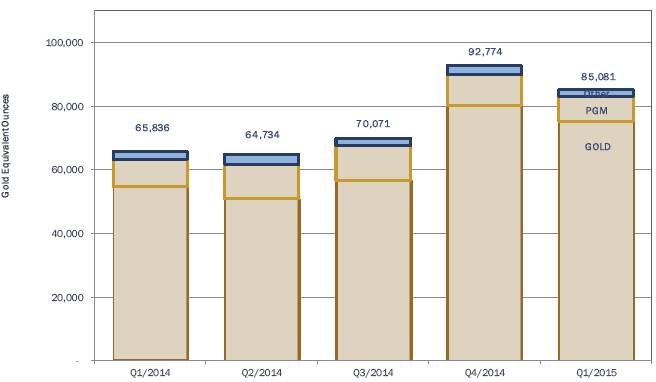
Franco-Nevada continued to grow its GEOs with 85,081 GEOs earned in the first quarter of 2015, an increase of 29.2% over the first quarter of 2014. Franco-Nevada continues to grow its portfolio through acquisitions and organic growth.
7
The following table outlines GEOs attributable to Franco-Nevada for the three months ended March 31, 2015 and 2014 by commodity, geographical location and type of interest (excluding oil & gas):
| | Gold Equivalent Ounces1 | | | |
For the three months ended March 31, | | 2015 | | 2014 | | Variance | | % | |
Commodity | | | | | | | | | |
Gold | | 75,187 | | 54,571 | | 20,616 | | 38 | % |
PGM | | 7,983 | | 8,690 | | (707 | ) | (8 | )% |
Other Minerals | | 1,911 | | 2,575 | | (664 | ) | (26 | )% |
| | 85,081 | | 65,836 | | 19,245 | | 29 | % |
Geography | | | | | | | | | |
United States | | 14,407 | | 17,616 | | (3,209 | ) | (18 | )% |
Canada | | 13,290 | | 12,885 | | 405 | | 3 | % |
Latin America | | 34,959 | | 14,105 | | 20,854 | | 148 | % |
Rest of World | | 22,425 | | 21,230 | | 1,195 | | 6 | % |
| | 85,081 | | 65,836 | | 19,245 | | 29 | % |
Type | | | | | | | | | |
Revenue-based | | 27,695 | | 26,481 | | 1,214 | | 5 | % |
Streams | | 53,936 | | 32,119 | | 21,817 | | 68 | % |
Profit-based | | 854 | | 5,148 | | (4,294 | ) | (83 | )% |
Other | | 2,596 | | 2,088 | | 508 | | 24 | % |
| | 85,081 | | 65,836 | | 19,245 | | 29 | % |
1 For average commodity prices used in calculation of GEOs, please refer to average commodity price tables on page 14 of this MD&A.
GEOs were earned from the following asset classes (excluding oil & gas):
| | Gold Equivalent Ounces1 | | | |
For the three months ended March 31, | | 2015 | | 2014 | | Variance | | % | |
| | | | | | | | | |
Gold – United States | | 10,378 | | 13,216 | | (2,838 | ) | (22 | )% |
Gold – Canada | | 9,132 | | 8,411 | | 721 | | 9 | % |
Gold – Latin America | | 34,960 | | 14,107 | | 20,853 | | 148 | % |
Gold – Rest of World | | 20,717 | | 18,837 | | 1,880 | | 10 | % |
Gold – Total | | 75,187 | | 54,571 | | 20,616 | | 38 | % |
PGM | | 7,983 | | 8,690 | | (707 | ) | (8 | )% |
Other Minerals | | 1,911 | | 2,575 | | (664 | ) | (26 | )% |
| | 85,081 | | 65,836 | | 19,245 | | 29 | % |
1 For average commodity prices used in calculation of GEOs, please refer to average commodity price tables on page 14 of this MD&A.
Our portfolio is well-diversified with GEOs being earned from approximately 45 different mineral interests in various jurisdictions.
8
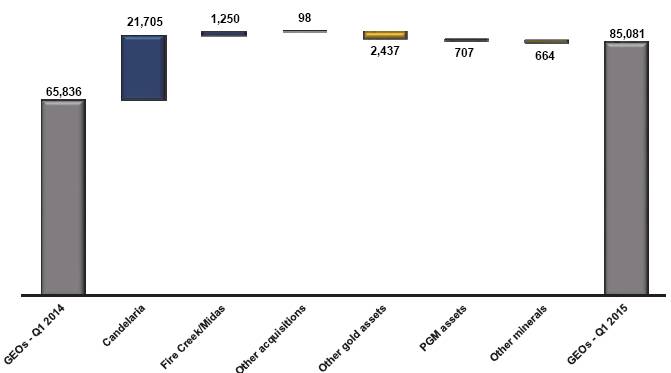
GEO Reconciliation — Q1 2014 to Q1 2015
Gold GEOs
GEOs earned from gold assets increased by 37.8% to 75,187 GEOs in the first quarter of 2015 from 54,571 GEOs in the first quarter of 2014. The growth in GEOs was mainly attributable to the addition of the Candelaria and Fire Creek/Midas streams/fixed ounces. GEOs from existing gold assets, PGM and other minerals were all lower in the quarter due to lower production levels. For the quarter, we earned 854 GEOs from our gold NPIs compared with 5,148 GEOs earned from gold NPIs in the same period in 2014.
U.S. assets produced 10,378 GEOs, representing a decrease of 21.5%, or 2,838 GEOs. The decrease is due to:
· lower production from the Goldstrike NPI (4,482 GEOs), the Goldstrike NSR (586 GEOs) and other assets (316 GEOs);
· partially offset by the Fire Creek/Midas acquisition (1,250 GEOs); and higher production from Bald Mountain (1,296 GEOs).
9
Canadian assets produced 9,132 GEOs in the quarter, an increase of 721 GEOs, or 8.6%. The increase is due to overall higher production at:
· Kirkland Lake (238 GEOs), Timmins West (199 GEOs), Musselwhite NPI (137 GEOs), Detour Lake (109 GEOs), Canadian Malartic (65 GEOs), Hemlo NSR (80 GEOs), and other assets (22 GEOs);
· partially offset by lower production at Sudbury (107 GEOs) and Golden Highway (22 GEOs).
Latin American assets, which include the recent Candelaria acquisition, generated 34,960 GEOs with the major contributions as follows:
· Candaleria’s production was 21,705 GEOs, or 62.1%, of total GEOs from Latin America;
· Palmarejo’s contribution was 12,501 GEOs for Q1 2015, a decrease of 878 GEOs over Q1 2014;
· Cerro San Pedro and other assets generated 754 GEOs, an increase of 26 GEOs over Q1 2014 due to higher production.
During the first quarter 332,421 ounces of silver were converted to GEOs which were received from Candelaria.
Rest of World assets generated 20,717 GEOs, an increase of 10.0%, over 2014 levels, attributable to:
· one additional delivery from Sabodala (1,875 GEOs) received in Q1 2015 compared to Q1 2014;
· higher production from Duketon (405 GEOs), Cooke 4 (213 GEOs), Edikan (130 GEOs) and other assets (833 GEOs);
· partially offset by lower production from Tasiast (699 GEOs), MWS (592 GEOs) and Subika (285 GEOs).
PGM GEOs
PGM GEOs produced were 7,983 for the quarter compared to 8,690 GEOs in Q1 2014, a decrease of 8.1%. The decrease in GEOs is attributable to:
· lower production from the Sudbury assets (400 GEOs) and Stillwater (307 GEOs);
· with platinum and palladium production decreasing by 5.0% and 3.4%, respectively, in the quarter compared to first quarter of 2014.
Other Mineral GEOs
GEOs generated from other minerals decreased to 1,911 GEOs from 2,575 GEOs in the comparable period. Production was 11.4% lower at Peculiar Knob, an iron-ore project in Australia which, coupled with the impact of the lower iron ore prices, resulted in fewer GEOs. This operation is expected to be put on care and maintenance by mid-2015.
10
Revenue
Franco-Nevada’s revenue is generated from various forms of agreements, ranging from NSR royalties, streams, NPI royalties, net royalty interests (“NRI”), working interests and other. For definitions of the various types of agreements, please refer to our Annual Information Form filed on SEDAR at www.sedar.com or our Form 40-F filed on EDGAR at www.sec.gov.
The market prices of gold, PGM, oil and natural gas are the primary drivers of our profitability and our ability to generate operating cash flow for shareholders.
Quarterly Revenue Breakdown
(millions of dollars)
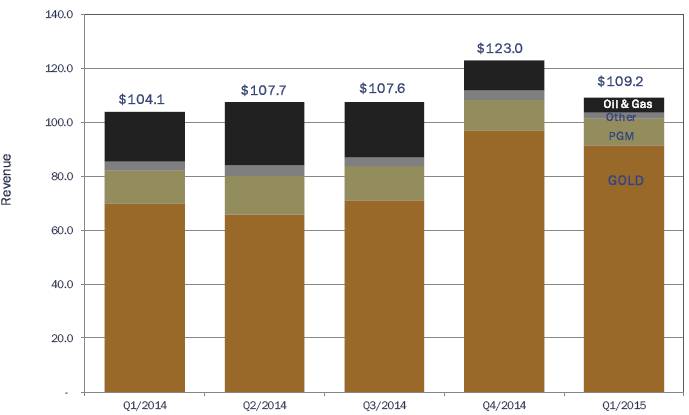
Revenue by Commodity
11
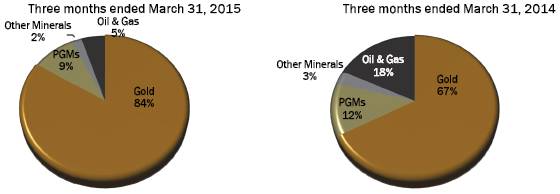
Revenue by Region
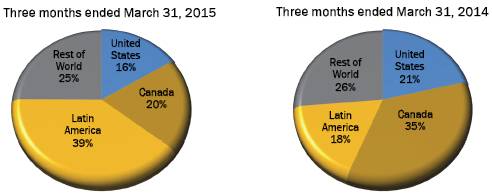
The following table outlines Franco-Nevada’s revenue for the three months ended March 31, 2015 and 2014, by commodity, geographical location and type of interest and highlights the diversification of the portfolio:
For the three months ended March 31, | | Revenue | |
(expressed in millions) | | 2015 | | 2014 | | Variance | | % | |
| | | | | | | | | |
Commodity | | | | | | | | | |
Gold | | $ | 91.7 | | $ | 70.0 | | $ | 21.7 | | 31 | % |
PGM | | 9.7 | | 12.2 | | (2.5 | ) | (21 | )% |
Other Minerals | | 2.3 | | 3.2 | | (0.9 | ) | (28 | )% |
Oil & Gas | | 5.5 | | 18.7 | | (13.2 | ) | (71 | )% |
| | $ | 109.2 | | $ | 104.1 | | $ | 5.1 | | 5 | % |
| | | | | | | | | |
Geography | | | | | | | | | |
United States | | $ | 17.4 | | $ | 22.0 | | $ | (4.6 | ) | (21 | )% |
Canada | | 21.6 | | 36.4 | | (14.8 | ) | (41 | )% |
Latin America | | 42.8 | | 18.2 | | 24.6 | | 135 | % |
Rest of World | | 27.4 | | 27.5 | | (0.1 | ) | — | |
| | $ | 109.2 | | $ | 104.1 | | $ | 5.1 | | 5 | % |
| | | | | | | | | |
Type | | | | | | | | | |
Revenue-based | | $ | 35.6 | | $ | 38.7 | | $ | (3.1 | ) | (8 | )% |
Streams | | 66.0 | | 42.6 | | 23.4 | | 55 | % |
Profit-based | | 2.4 | | 15.4 | | (13.0 | ) | (84 | )% |
Working interests and other | | 5.2 | | 7.4 | | (2.2 | ) | (30 | )% |
| | $ | 109.2 | | $ | 104.1 | | $ | 5.1 | | 5 | % |
12
Revenue for the three months ended March 31, 2015 was $109.2 million (2014 - $104.1 million) and was comprised of the following:
(expressed in millions)
| | | | For the three months ended March 31, | |
Property | | Interest | | 2015 | | 2014 | |
Gold - United States | | | | | | | |
Goldstrike | | NSR 2-4%, NPI 2.4-6% | | $ | 2.8 | | $ | 8.9 | |
Gold Quarry | | NSR 7.29% | | 4.4 | | 4.5 | |
Marigold | | NSR 1.75-5%, GR 0.5-4% | | 1.2 | | 1.5 | |
Fire Creek/Midas | | Fixed to 2018 / NSR 2.5% | | 1.6 | | — | |
Bald Mountain | | NSR/GR 0.875-5% | | 2.2 | | 0.7 | |
Mesquite | | NSR 0.5-2% | | 0.3 | | 0.4 | |
Other | | | | 0.1 | | 0.5 | |
Gold - Canada | | | | | | | |
Detour Lake | | NSR 2% | | 2.5 | | 2.5 | |
Golden Highway | | NSR 2-15% | | 3.0 | | 3.2 | |
Sudbury | | Stream 50% | | 1.8 | | 2.1 | |
Musselwhite | | NPI 5% | | 0.8 | | 0.7 | |
Hemlo | | NSR 3%, NPI 50% | | 0.2 | | 0.1 | |
Kirkland Lake | | NSR 2.5-5.5%, NPI 20% | | 1.3 | | 1.1 | |
Timmins West | | NSR 2.25% | | 1.1 | | 0.9 | |
Other | | | | 0.4 | | 0.3 | |
Gold - Latin America | | | | | | | |
Candelaria | | Stream 68% | | 26.7 | | — | |
Palmarejo | | Stream 50% | | 15.2 | | 17.3 | |
Cerro San Pedro | | GR 1.95% | | 0.6 | | 0.6 | |
Other | | | | 0.3 | | 0.3 | |
Gold - Rest of World | | | | | | | |
MWS | | Stream 25% | | 7.3 | | 8.4 | |
Sabodala | | Stream 6%, Fixed to 2019 | | 9.1 | | 7.3 | |
Subika | | NSR 2% | | 1.6 | | 2.1 | |
Tasiast | | NSR 2% | | 1.3 | | 2.3 | |
Duketon | | NSR 2% | | 2.0 | | 1.7 | |
Edikan | | NSR 1.5% | | 1.0 | | 0.9 | |
Cooke 4 | | Stream 7% | | 0.9 | | 0.7 | |
Other | | | | 2.0 | | 1.0 | |
| | | | $ | 91.7 | | $ | 70.0 | |
PGM | | | | | | | |
Sudbury | | Stream 50% | | 5.0 | | 6.8 | |
Stillwater | | NSR 5% | | 4.7 | | 5.4 | |
| | | | $ | 9.7 | | $ | 12.2 | |
Other Minerals | | | | | | | |
Peculiar Knob | | Production payment | | 1.0 | | 2.1 | |
Osborne | | NSR 2% | | 0.5 | | 0.5 | |
Mt. Keith | | NPI 0.25%, GR 0.375% | | 0.3 | | 0.3 | |
Other | | | | 0.5 | | 0.3 | |
| | | | $ | 2.3 | | $ | 3.2 | |
Oil & Gas | | | | | | | |
Weyburn | | NRI 11.71%, ORR 0.44%, WI 2.26% | | 3.4 | | 14.3 | |
Midale | | ORR 1.14%, WI 1.59% | | 0.5 | | 0.8 | |
Edson | | ORR 15% | | 0.5 | | 1.4 | |
Other | | | | 1.1 | | 2.2 | |
| | | | $ | 5.5 | | $ | 18.7 | |
| | | | | | | |
Revenue | | | | $ | 109.2 | | $ | 104.1 | |
13
Average Precious Metal Commodity Prices
Quarterly Averages | | Q1
2015 | | Q4
2014 | | Variance
(Q1’15-Q4’14) | | Q1
2014 | | Variance
(Q1’15-Q1’14) | |
Gold1 | ($/oz) | | $ | 1,219 | | $ | 1,200 | | 1.6 | % | $ | 1,294 | | (5.8 | )% |
Silver2 | ($/oz) | | 16.71 | | 16.47 | | 1.5 | % | 20.49 | | (18.4 | )% |
Platinum1 | ($/oz) | | 1,193 | | 1,229 | | (2.9 | )% | 1,428 | | (16.5 | )% |
Palladium1 | ($/oz) | | 786 | | 788 | | (0.3 | )% | 744 | | 5.6 | % |
Exchange Rates3 | | | | | | | | | | | | |
CAD | | | 0.8059 | | 0.8806 | | (8.5 | )% | 0.9063 | | (11.1 | )% |
| | | | | | | | | | | | | | | |
1 Based on London PM fix
2 Based on London Bullion Market Association (“LBMA”) silver price
3 Based on Bank of Canada noon rates
Gold Revenue
The price of gold is the largest single factor in determining profitability and cash flow from operations for Franco-Nevada. During Q1 2015, average gold prices continued to experience significant volatility, trading between $1,147/oz and $1,297/oz with an average price of $1,219/oz. This compares to an average gold price of $1,294/oz for the first quarter of 2014, a decrease of 5.8%. Commodity prices continue to experience significant volatility due to the strengthening of the U.S. dollar versus concerns over weak economic performance in Europe and China, as well as the tapering of the monetary stimulus provided by the U.S. Federal Reserve and growing expectations of U.S. interest rate increases starting in 2015.
Despite the current volatility with commodity prices, the Franco-Nevada business model continues to deliver strong results as it is not impacted by reduced margins at the operator level. The royalty and stream payments/deliveries are based on actual production levels with no adjustments for the operator’s operating costs, with the exception of NPI royalties which are based on the profit of the mining operation.
Overall gold revenue increased to $91.7 million from $70.0 million for the comparable period. The increase was attributable primarily to:
· production from recent acquisitions, Candelaria ($26.7 million) and Fire Creek/Midas ($1.6 million), and higher production at Bald Mountain ($1.5 million);
· offset by the lower average gold price.
U.S. assets generated $12.6 million in revenue, a decrease of 23.6%, mainly driven by:
· lower production at Goldstrike ($6.1 million);
· partially offset by the Fire Creek/Midas acquisition and higher production from Bald Mountain.
Canadian assets generated $11.1 million in revenue in the quarter, an increase of $0.2 million, or 1.8% over Q1 2014. The increase was attributable to:
· higher production from Timmins West, Kirkland Lake, Musselwhite and Hemlo;
· partially offset by lower production at Sudbury and Golden Highway.
14
Latin American gold assets generated $42.8 million compared to $18.2 million for the same period in 2014. The increase was mainly due to:
· the acquisition of Candelaria ($26.7 million);
· partially offset by lower revenue from Palmarejo ($2.1 million).
Rest of World gold assets generated $25.2 million in revenue in the quarter compared to $24.4 million in Q1 2014. The 3.3% increase was due primarily to:
· one additional delivery from Sabodala in Q1 2015 compared to Q1 2014 ($1.8 million);
· higher revenue from Duketon ($0.3 million), Cooke 4 ($0.2 million), Edikan ($0.1 million) and other assets ($1.0 million);
· partially offset by lower revenue earned from the other rest of world gold assets due to a combination of lower production and lower average gold prices.
PGM Revenue
The prices for platinum and palladium averaged $1,193/oz and $786/oz, respectively. PGM revenue for the quarter was $9.7 million compared to $12.2 million for the first quarter of 2014, a decrease of 20.5%. Palladium is a significantly larger portion of Franco-Nevada’s revenue than platinum. Overall PGM revenue was lower quarter over quarter by $2.5 million with overall platinum and palladium production down by 5.0% and 3.4%, respectively.
Other Mineral Revenue
Other minerals generated $2.3 million for the quarter. The decrease was due to lower iron-ore prices and the associated revenue from the Peculiar Knob royalty.
Oil & Gas Revenue
Averages (C$/bbl) | | Q1
2015 | | Q4
2014 | | Variance
(Q1’15-Q4’14) | | Q1
2014 | | Variance
(Q1’15-Q1’14) | |
Edmonton Light | | C$ | 53.30 | | C$ | 74.86 | | (28.8 | )% | C$ | 100.17 | | (46.8 | )% |
Quality Differential | | (10.35 | ) | (5.01 | ) | 106.6 | % | (7.06 | ) | 46.6 | % |
Realized oil price | | C$ | 42.95 | | C$ | 69.85 | | (38.5 | )% | C$ | 93.11 | | (53.9 | )% |
Oil & gas revenue was $5.5 million for the quarter (91% oil and 9% gas) compared with $18.7 million for the same period of 2014 (95% oil and 5% gas), a decrease of 70.6%. The decrease is due to lower average oil prices realized in the first quarter of 2015 with production similar to 2014.
Revenue from the Weyburn Unit for the quarter decreased to $3.4 million (2014 - $14.3 million) with $1.4 million earned from the NRI (2014 - $9.4 million), $1.7 million earned from the working interest (2014 - $4.2 million) and $0.3 million earned from the overriding royalties (2014 - $0.7 million). Revenue from the Weyburn NRI was lower due to lower average oil prices. Actual realized price from the NRI was C$44.84/boe for the quarter, down 51.7% from the realized price of C$92.91/boe for the first quarter of 2014.
15
Costs and Expenses
Costs and expenses for the quarter were $78.8 million compared to $55.4 million in Q1 2014. The following table provides a list of the costs and expenses incurred for the three months ended March 31, 2015 and 2014.
| | Three months ended March 31, | |
(expressed in millions) | | 2015 | | 2014 | | Variance | |
Costs of sales | | $ | 22.4 | | $ | 14.6 | | $ | 7.8 | |
Depletion and depreciation | | 51.7 | | 36.1 | | 15.6 | |
Corporate administration | | 4.1 | | 4.2 | | (0.1 | ) |
Business development | | 0.5 | | 0.5 | | — | |
Subtotal | | $ | 78.7 | | $ | 55.4 | | $ | 23.3 | |
Impairment of royalty interests | | 0.1 | | — | | 0.1 | |
| | $ | 78.8 | | $ | 55.4 | | $ | 23.4 | |
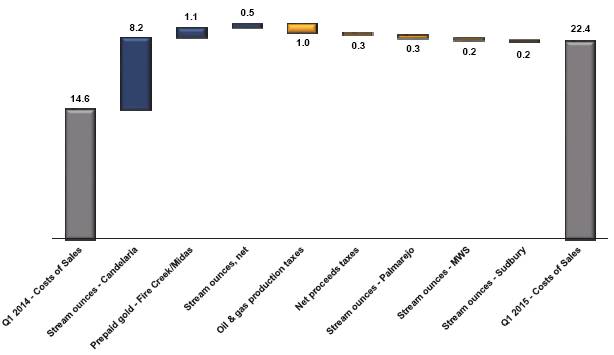
Costs of sales, which are comprised of the cost of GEOs purchased under stream agreements, cost of prepaid gold ounces, oil & gas production taxes, operating costs on oil & gas working interests and net proceeds taxes on mineral interests, were $22.4 million for the first quarter of 2015 compared with $14.6 million for the first quarter of 2014. The increase of $7.8 million is attributable to higher purchase cost of stream ounces due to the Candelaria acquisition ($8.2 million) and other stream ounces ($0.4 million), partially offset by lower production and purchase cost of stream ounces from Palmarejo ($0.3 million), MWS ($0.2 million) and Sudbury ($0.2 million). In addition, costs of sales were higher due the cost of prepaid ounces under the Fire Creek/Midas transaction ($1.1 million), partially offset by lower oil & gas production taxes ($1.0 million) and net proceeds taxes ($0.2 million). Upon the sale of the gold ounces delivered under the Fire Creek/Midas transaction, Franco-Nevada will record an amount of $882.71/oz as a non-cash cost of sale. Franco-Nevada received 53,936 GEOs under its stream agreements in Q1 2015 compared to 32,119 GEOs received in Q1 2014.
16
Costs of Sales Reconciliation — Q1 2014 to Q1 2015
(expressed in millions)
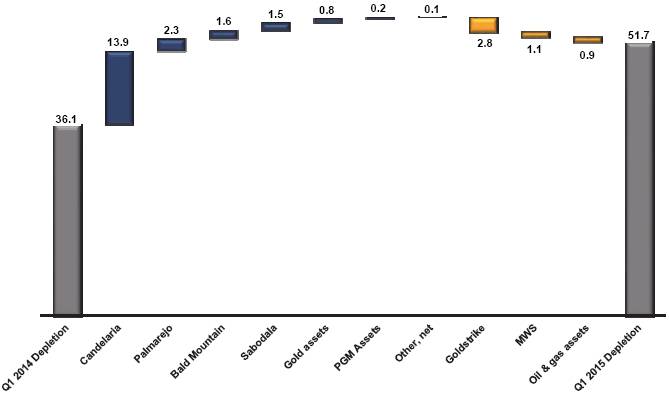
Depletion and depreciation totaled $51.7 million for the quarter compared to $36.1 million in Q1 2014. The increase of $15.6 million is due in part to Candelaria ($13.9 million) and Sabodala ($1.5 million), both recent acquisitions, Bald Mountain ($1.6 million) due to higher production, and Palmarejo ($2.3 million) due to a change in the reserve estimate. These increases were partially offset by lower production and associated depletion on Goldstrike ($2.8 million), MWS ($1.1 million) and oil & gas assets ($0.9 million).
17
Depletion Reconciliation — Q1 2014 to Q1 2015
(expressed in millions)
Corporate administration expenses decreased slightly to $4.1 million in the quarter, representing 3.8% of revenue, from $4.2 million in Q1 2014.
Business development expenses were $0.5 million for the three months ended March 31, 2015 (2014 - $0.5 million). Timing of incurring these costs typically varies depending upon the level of activity of the business development team and the timing of completing transactions.
Impairments of royalty, stream and working interests were $0.1 million for the three months ended March 31, 2015 (2014 - $Nil). The impairment charge was the result of an exploration asset being written down to nil where the explorer/operator had abandoned tenements, concessions or ground subject to royalty rights held by Franco-Nevada.
Foreign Exchange and Other Income/Expenses
Foreign exchange losses and other expenses for the quarter were $2.6 million compared to foreign exchange gains and other income of $0.8 million in Q1 2014. The following table provides a list of foreign exchange losses and other expenses incurred for the three months ended March 31, 2015 and 2014.
18
| | Three months ended March 31, | |
(expressed in millions) | | 2015 | | 2014 | | Variance | |
Foreign exchange loss | | $ | (2.5 | ) | $ | (0.8 | ) | $ | (1.7 | ) |
Mark-to-market (loss) gain on warrants | | (0.1 | ) | 2.0 | | (2.1 | ) |
Loss on sale of gold | | — | | (0.4 | ) | 0.4 | |
| | $ | (2.6 | ) | $ | 0.8 | | $ | (3.4 | ) |
Foreign exchange gains and losses include foreign exchange movements related to investments in bonds and other debt securities, such as government and corporate bonds, treasury bills and intercompany loans, held in the parent company, which are denominated in U.S. dollars. The parent company’s functional currency is the Canadian dollar. Under IFRS, all foreign exchange changes related to the debt securities are recorded in net income as opposed to other comprehensive income.
Finance Costs and Finance Income
Finance income was $0.8 million (2014 - $0.7 million) for the quarter which was earned on our cash and cash equivalents. The increase in finance income was due to higher cash balances invested in the first quarter of 2015. Finance expenses were $0.4 million (2014 - $0.4 million) and consist of the costs of maintaining our credit facility in addition to the amortization of the initial set-up costs incurred with respect to the facility. Finance expenses were comprised of standby fees of $0.3 million (2014 - $0.3 million) and amortization of issuance costs were $0.1 million (2014 - $0.1 million).
Income Taxes
Franco-Nevada had an income tax expense of $9.0 million (2014 — $14.4 million) for the quarter comprised of a current income tax expense of $7.3 million (2014 - $8.8 million) and a deferred income tax expense of $1.7 million (2014 — $5.6 million) related to our Canadian and Mexican entities.
Net Income
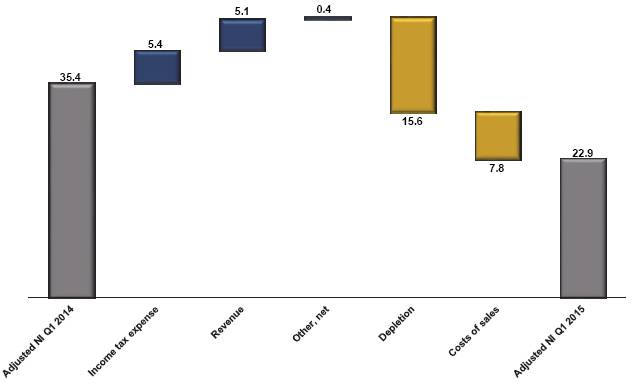
Net income for the quarter was $19.2 million, or $0.12 per share, compared with $35.4 million, or $0.24 per share, for the same period in 2014. Adjusted Net Income was $22.9 million, or $0.15 per share, compared with $35.4 million, or $0.24 per share, for Q1 2014.
The decrease in Adjusted Net Income was driven primarily by:
· higher depletion and costs of sales due to recent acquisitions, such as Candelaria, Sabodala and Fire Creek;
· partially offset by lower income tax expense and higher revenue.
19
Adjusted Net Income Reconciliation — Q1 2014 to Q1 2015
(expressed in millions)
20
Quarterly Financial Information
Selected quarterly financial information from our financial statements is set out below:
(expressed in millions, except per share amounts, Average Gold Price, GEOs, and Margin)1
| | Q1
2015 | | Q4
2014 | | Q3
2014 | | Q2
2014 | | Q1
2014 | | Q4
2013 | | Q3
2013 | | Q2
2013 | |
Revenue | | $ | 109.2 | | $ | 123.0 | | $ | 107.6 | | $ | 107.7 | | $ | 104.1 | | $ | 100.0 | | $ | 98.8 | | $ | 93.3 | |
Costs and expenses2 | | 78.8 | | 109.6 | | 61.0 | | 60.1 | | 55.4 | | 194.8 | | 50.8 | | 50.8 | |
Operating income (loss) | | 30.4 | | 13.4 | | 46.6 | | 47.6 | | 48.7 | | (94.8 | ) | 48.0 | | 42.5 | |
Other income (expenses) | | (2.2 | ) | (2.0 | ) | (0.4 | ) | 2.0 | | 1.1 | | (2.9 | ) | 0.7 | | (8.9 | ) |
Income tax expense (recovery) | | 9.0 | | 10.2 | | 13.0 | | 12.7 | | 14.4 | | (17.1 | ) | 13.4 | | 12.0 | |
Net income (loss) | | 19.2 | | 1.2 | | 33.2 | | 36.9 | | 35.4 | | (80.6 | ) | 35.3 | | 21.6 | |
Basic earnings (loss) per share | | $ | 0.12 | | $ | 0.00 | | $ | 0.22 | | $ | 0.25 | | $ | 0.24 | | $ | (0.55 | ) | $ | 0.24 | | $ | 0.15 | |
Diluted earnings (loss) per share | | $ | 0.12 | | $ | (0.01 | ) | $ | 0.22 | | $ | 0.25 | | $ | 0.24 | | $ | (0.55 | ) | $ | 0.24 | | $ | 0.15 | |
Average Gold Price | | $ | 1,219 | | $ | 1,200 | | $ | 1,282 | | $ | 1,289 | | $ | 1,294 | | $ | 1,272 | | $ | 1,328 | | $ | 1,414 | |
GEOs3 | | 85,081 | | 92,774 | | 70,071 | | 64,734 | | 65,836 | | 69,741 | | 56,683 | | 56,085 | |
Adjusted EBITDA3 | | $ | 83.3 | | $ | 96.2 | | $ | 88.7 | | $ | 87.2 | | $ | 84.8 | | $ | 77.3 | | $ | 80.3 | | $ | 75.2 | |
Adjusted EBITDA3 per share | | $ | 0.53 | | $ | 0.62 | | $ | 0.59 | | $ | 0.58 | | $ | 0.58 | | $ | 0.53 | | $ | 0.55 | | $ | 0.51 | |
Margin3 | | 76.3 | % | 78.2 | % | 82.4 | % | 81.0 | % | 81.5 | % | 77.3 | % | 81.3 | % | 80.6 | % |
Adjusted Net Income3 | | $ | 22.9 | | $ | 31.6 | | $ | 34.5 | | $ | 36.0 | | $ | 35.4 | | $ | 30.5 | | $ | 35.3 | | $ | 31.9 | |
Adjusted Net Income3 per share | | $ | 0.15 | | $ | 0.20 | | $ | 0.23 | | $ | 0.24 | | $ | 0.24 | | $ | 0.21 | | $ | 0.24 | | $ | 0.22 | |
1 Due to rounding, amounts may not calculate.
2 Includes impairment charges on royalty, stream and working interests and investments.
3 GEOs, Adjusted EBITDA, Margin and Adjusted Net Income are non-IFRS measures with no standardized meaning under IFRS. For further information and a detailed reconciliation, please refer to pages 29-31 of this MD&A.
21
Financial Condition Review
Summary Statement of Financial Position and Key Financial Metrics
(expressed in millions, except ratios) | | As at
March 31,
2015 | | As at
December 31,
2014 | |
Total cash and cash equivalents | | $ | 598.5 | | $ | 592.5 | |
Current assets | | 698.0 | | 698.9 | |
Non-current assets | | 2,674.5 | | 2,768.0 | |
Total assets | | $ | 3,372.5 | | $ | 3,466.9 | |
Current liabilities | | 26.7 | | 21.1 | |
Non-current liabilities | | 39.2 | | 40.3 | |
Total liabilities | | 65.9 | | $ | 61.4 | |
Total shareholders’ equity | | $ | 3,306.6 | | $ | 3,405.5 | |
Dividends paid (including DRIP) | | 31.1 | | 118.0 | |
Debt | | — | | — | |
Total common shares outstanding | | 156.6 | | 156.5 | |
Key Financial Ratios | | | | | |
Working capital | | $ | 671.3 | | $ | 677.8 | |
Current ratio | | 26.1:1 | | 33.1:1 | |
Debt to equity | | 0:1 | | 0:1 | |
Balance Sheet Review
Total assets were $3,372.5 million at March 31, 2015 compared to $3,466.9 million at December 31, 2014. The decrease is due to the stronger U.S. dollar upon translation of our Canadian and Australian assets. Our asset base is primarily comprised of non-current assets such as our royalty, stream and working interests, and cash and cash equivalents, which reflect our business strategy of growing a diversified portfolio and ensuring cash is available for future acquisitions and dividends.
Total liabilities at March 31, 2015 were $65.9 million, comprised primarily of current and deferred income tax liabilities. Franco-Nevada continues to maintain a financially strong balance sheet with no debt and a large cash balance.
Financial Position, Liquidity and Capital Resources
Operating Cash Flow
Cash provided by operating activities before changes in non-cash assets and liabilities, relating to operating activities, was $77.9 million and $77.2 million for the three months ended March 31, 2015 and 2014, respectively.
Investing Activities
Cash used in investing activities was $21.1 million for the quarter compared to $134.6 million in the same period of 2014. The decrease was due to fewer mineral acquisitions in the first quarter of 2015 compared to 2014.
Typically Franco-Nevada invests its excess funds in various term deposits, treasury bills of the U.S. government, Canadian federal and provincial governments and high quality corporate bonds. As at March 31, 2015, the majority of funds were held in cash and term
22
deposits with several financial institutions with term deposits having various maturities upon acquisition of up to 90 days and therefore were classified as “cash and cash equivalents”.
Financing Activities
Net cash used in financing activities was $23.6 million for the quarter compared to $22.3 million for Q1 2014 with the majority used for the payment of dividends.
Cash Resources and Liquidity
Our performance is impacted by foreign currency fluctuations of the Canadian dollar and Australian dollar relative to the U.S. dollar. The largest exposure we have is with respect to the Canada/U.S. dollar exchange rate as we hold a significant amount of our assets in Canada and report our results in U.S. dollars. The effect of the fluctuations in these currencies against the U.S. dollar impacts our corporate administration, business development expenses and depletion on mineral and oil & gas interests incurred in our Canadian and Australian entities due to their respective functional currencies. The Canadian dollar traded in a range of $0.7811 to $0.8527, closing the quarter at $0.7885 and the Australian dollar traded between $0.7581 and $0.8211.
Management’s objectives when managing capital are to:
(a) ensure the preservation and availability of capital by investing in low risk investments with high liquidity; and
(b) ensure that adequate levels of capital are available when required.
As at March 31, 2015, our cash and cash equivalents totaled $598.5 million (December 31, 2014 - $592.5 million). In addition, we held investments at March 31, 2015 with a combined value of $75.8 million (December 31, 2014 - $67.1 million), of which $71.4 million was held in publicly traded equity instruments (December 31, 2014 - $62.0 million). Working capital as at March 31, 2015 was $671.3 million (December 31, 2014 - $677.8 million).
Our near-term cash requirements include funding of the Cobre Panama, Karma, Candelaria and Guadalupe stream commitments, corporate administration costs, certain costs of operations, declared dividends and income taxes directly related to the recognition of royalty and stream revenues. As a royalty/stream company, there are limited requirements for capital expenditures other than for the acquisition of additional royalties/streams and working interests’ capital commitments. Such acquisitions are entirely discretionary and will be consummated through the use of cash, as available, or through the issuance of common shares or other equity or debt securities or use of our credit facility. We believe that our current cash resources, our available credit facility and future cash flows will be sufficient to cover the cost of our commitments under the various stream agreements, administrative expenses, costs of operations and dividend payments for the foreseeable future.
23
Ore and refined gold purchase commitments
The following table summarizes Franco-Nevada’s commitments to pay for gold, silver and PGM to which it has the contractual right pursuant to the associated precious metals agreements:
| | Attributable Payable
Production to be Purchased | | Per Ounce Cash Payment 1,2 | | Term of | | Date of | |
Property | | Gold | | Silver | | PGM | | Gold | | Silver | | PGM | | Agreement | | Contract | |
| | | | | | | | | | | | | | | | | |
Candelaria | | 68 | %3 | 68 | %3 | 0 | % | $ | 400 | | $ | 4 | | n/a | | 40 years | | 6-Oct-14 | |
Palmarejo | | 50 | % | 0 | % | 0 | % | $ | 400 | | n/a | | n/a | | Life-of-Mine4 | | 20-Jan-09 | |
Sabodala | | 6 | % | 0 | % | 0 | % | 20 | %5 | n/a | | n/a | | 40 years | | 12-Dec-13 | |
MWS | | 25 | % | 0 | % | 0 | % | $ | 400 | | n/a | | n/a | | 40 years6 | | 2-Mar-12 | |
Cooke 4 | | 7 | % | 0 | % | 0 | % | $ | 400 | | n/a | | n/a | | 40 years | | 5-Nov-09 | |
Sudbury7 | | 50 | % | 0 | % | 50 | % | $ | 400 | | n/a | | $ | 400 | | 40 years | | 15-Jul-08 | |
| | | | | | | | | | | | | | | | | | | | |
1 - Subject to an annual inflationary adjustment.
2 - Should the prevailing market price for gold be lower than this amount, the per ounce cash payment will be reduced to the prevailing market price, with the exception of Palmarejo.
3 - Percentage decreases to 40% after 720,000 ounces of gold and 12 million ounces of silver has been delivered under the agreement.
4 - Agreement is capped at 400,000 ounces of gold.
5 - Purchase price is 20% of prevailing market price at the time of delivery.
6 - Agreement is capped at 312,500 ounces of gold.
7 - The Company is committed to purchase 50% of the precious metals contained in ore from the properties. Cash payment
is based on gold equivalent ounces.
Candelaria Gold and Silver Stream
On April 7, 2015, Lundin Mining Corporation (“Lundin “) released a National Instrument 43-101 compliant reserve statement for certain ore bodies pursuant to the Candelaria stream agreement. Franco-Nevada expects to make an additional $7.5 million payment to Lundin following resolution on post-closing items pursuant to the Candelaria stream agreement. The amount has been recorded as part of the stream interest and accrued as at March 31, 2015.
Karma Gold Stream
On August 11, 2014, Franco-Nevada and Sandstorm Gold Inc. (“Sandstorm”) (collectively, the “parties”) entered into a $120.0 million stream financing agreement with True Gold Mining Inc. (“True Gold”) in exchange for a 6.5% gold stream on True Gold’s Karma project, located in Burkina Faso, West Africa. Under the terms of the agreement, the parties will provide True Gold with $100.0 million in initial funding. The parties will split the agreement 75% to Franco-Nevada and 25% to Sandstorm. Over a period of five years, starting March 31, 2016, True Gold shall deliver to the parties, an aggregate of 20,000 ounces of gold each year, for a total of 100,000 ounces. Thereafter, True Gold shall deliver 6.5% of the gold produced at Karma to the parties. The parties will pay 20% of the spot price of gold to True Gold for each ounce delivered under the agreement. Franco-Nevada has funded $43.3 million of its obligation under the agreement as at May 6, 2015.
24
In early 2015, True Gold announced that construction of Karma had been suspended due to community protests. True Gold has stated that it is in discussions with stakeholders and expects to resume construction, but it has not disclosed a time frame as to when activities would resume.
Guadalupe Gold Stream
On October 2, 2014, Franco-Nevada acquired a new 50% gold stream on Coeur Mining Inc.’s Palmarejo project located in Mexico. Under the terms of the new agreement, Franco-Nevada will fund a $22.0 million deposit which will be used to partially fund the development of the Guadalupe underground mine and Franco-Nevada will pay the lesser of (i) $800 per ounce; or (ii) the London PM gold fix on the date of delivery for each ounce delivered. The $22.0 million deposit will be paid in instalments which commenced on January 15, 2015 and ends on January 15, 2016, with $10.0 million being funded as at May 6, 2015. The new gold stream will become effective following the completion of the minimum obligation under Franco-Nevada’s existing Palmarejo gold stream which is expected to be reached by mid-2016.
Cobre Panama Precious Metal Stream
On August 20, 2012, Franco-Nevada announced the acquisition of a precious metals stream on Inmet Mining Corporation’s (“Inmet”) interest in the Cobre Panama copper project in Panama (“Cobre Panama”). Franco-Nevada has committed to fund a $1.0 billion deposit for the development of Cobre Panama, to be drawn down on a 1:3 ratio with Inmet’s funding after Inmet’s aggregate funding for Cobre Panama has exceeded $1.0 billion. Inmet was acquired by First Quantum Minerals Ltd. (“First Quantum”) in March 2013. Since its acquisition of Inmet, First Quantum has undertaken a complete review of the Cobre Panama project and released the results in January 2014 which includes a larger project with installed capacity approximately 17% higher than the Inmet plan and a revised development timeframe with first concentrate production expected in the fourth quarter of 2017. First Quantum reported that construction at Cobre Panama continued to advance in the first quarter with detailed engineering and site earthworks progressing well.
Franco-Nevada has not funded any amounts under the stream agreement as at May 6, 2015. Franco-Nevada expects to fund $300.0 million to $350.0 million in 2015.
Capital Resources
As of May 6, 2015, the entire amount of $500.0 million, or its Canadian dollar equivalent, is available under our unsecured credit facility. Advances under the facility bear interest depending upon the currency of the advance and leverage ratio. As of May 6, 2015, U.S. and Canadian dollar advances under the facility would bear interest rates of 3.95% and 3.05%, respectively. We can also draw funds using LIBOR 30-day rates plus 120 basis points under our credit facility.
Standby fees of $0.3 million (2014 - $0.3 million) were incurred and paid for the three months ended March 31, 2015.
Critical Accounting Estimates
The preparation of consolidated financial statements in accordance with IFRS requires the Company to make judgments, estimates and assumptions that affect the reported amounts of assets and liabilities and disclosures of contingent assets and liabilities at the date of the consolidated financial statements and the reported amounts of revenues and expenses
25
during the reporting period. Estimates and assumptions are continuously evaluated and are based on management’s best knowledge of the relevant facts and circumstances, having regard to previous experience. However, actual outcomes may differ from the amounts included in the consolidated financial statements.
Our significant accounting policies and estimates are disclosed in notes 2 and 3 of our most recent annual consolidated financial statements.
Outstanding Share Data
Franco-Nevada is authorized to issue an unlimited number of common and preferred shares. A detailed description of the rights, privileges, restrictions and conditions attached to the authorized shares is included in our Annual Information Form for the year ended December 31, 2014, a copy of which can be found on SEDAR at www.sedar.com and in our 40-F, a copy of which can be found on EDGAR at www.sec.gov.
As of May 6, 2015, the number of common shares outstanding or issuable pursuant to other outstanding securities is as follows:
Common Shares | | Number | |
Outstanding | | 156,649,990 | |
Issuable upon exercise of Franco-Nevada warrants(1) | | 6,510,769 | |
Issuable upon exercise of Franco-Nevada options(2) | | 2,131,228 | |
Issuable upon exercise of special warrant(3) | | 2,000,000 | |
Issuable upon vesting of Franco-Nevada RSUs | | 141,863 | |
Diluted common shares | | 167,433,850 | |
Notes:
(1) The warrants have an exercise price of C$75.00 per share and an expiry date of June 16, 2017.
(2) There were 2,131,228 stock options under our share compensation plan outstanding to directors, officers, employees and others with exercise prices ranging from C$15.20 to C$59.52 per share.
(3) In connection with a transaction with Taseko Mines Limited, one special warrant was granted to Taseko which will be exchangeable into 2,000,000 purchase share warrants once Taseko’s New Prosperity project gets fully permitted and financed. Each purchase share warrant will entitle Taseko to purchase one Franco-Nevada common share at a price of C$75.00 per share before June 16, 2017. New Prosperity’s most recent permit application was denied in 2014.
Franco-Nevada has not issued any preferred shares.
26
Risk Factors
The following discussion pertains to the outlook and conditions currently known to management which could have a material impact on the financial condition and results of operations. This discussion, by its nature, is not all-inclusive. It is not a guarantee that other factors will or will not affect Franco-Nevada in the future. For additional information with respect to risks and uncertainties, please also refer to the “Risk Factors” section of our most recent Annual Information Form filed with the Canadian securities regulatory authorities on SEDAR at www.sedar.com and our most recent Form 40-F filed with the Securities and Exchange Commission on EDGAR at www.sec.gov.
Fluctuation in Commodity Prices
Commodity prices have fluctuated widely in recent years. The marketability and price of metals, minerals and oil & gas on properties for which we hold interests will be influenced by numerous factors beyond our control and which may have a material and adverse effect on our profitability, results of operations and financial condition.
Significance of Candelaria, Weyburn Unit and Palmarejo
The Candelaria gold and silver stream, the Weyburn Unit and, while the minimum obligation remains outstanding, the Palmarejo gold stream, are expected to be significant revenue-producers to Franco-Nevada. As a result, any adverse issues associated with financial viability, production and/or the recoverability of reserves from these operations and the associated portions over which we have a stream and/or royalty interests, could have material and adverse effects on our profitability, results of operations and financial condition. The existing minimum royalty under the Palmarejo gold stream to deliver 50,000 ounces per annum, payable monthly, is projected to reach its 400,000 ounce cap sometime in 2016.
Foreign Currency Fluctuations
Franco-Nevada’s royalty/stream interests are subject to foreign currency fluctuations and inflationary pressures, which may have a material and adverse effect on our profitability, results of operations and financial condition. There can be no assurance that the steps taken by management to address variations in foreign exchange rates will eliminate the risk of all adverse effects and, accordingly, we may suffer losses due to foreign currency rate fluctuations.
Franco-Nevada operates on an international basis and, therefore, foreign exchange risk and foreign currency translation risk exposures arise from the translation of transactions denominated in a foreign currency. During the first quarter of 2015, the foreign exchange risk for its Canadian and Australian operations arose primarily with respect to the U.S. dollar.
27
Internal Control Over Financial Reporting and Disclosure Controls and Procedures
Our Chief Executive Officer and Chief Financial Officer are responsible for establishing and maintaining Franco-Nevada’s internal control over financial reporting and other financial disclosure and our disclosure controls and procedures.
Internal control over financial reporting is a process designed to provide reasonable assurance regarding the reliability of financial reporting and the preparation of financial statements for external purposes in accordance with IFRS. Franco-Nevada’s internal control over financial reporting includes those policies and procedures that (i) pertain to the maintenance of records that, in reasonable detail, accurately and fairly reflect the transactions and dispositions of the assets of Franco-Nevada; (ii) provide reasonable assurance that transactions are recorded as necessary to permit preparation of financial statements in accordance with IFRS, and that receipts and expenditures of Franco-Nevada are being made only in accordance with authorizations of management and directors of Franco-Nevada; and (iii) provide reasonable assurance regarding prevention or timely detection of unauthorized acquisition, use or disposition of Franco-Nevada’s assets that could have a material effect on Franco-Nevada’s financial statements. Internal control over other financial disclosure is a process designed to ensure that other financial information included in this MD&A, fairly represents in all material respects the financial condition, results of operations and cash flows of Franco-Nevada for the periods presented in this MD&A.
Franco-Nevada’s disclosure controls and procedures are designed to provide reasonable assurance that material information relating to Franco-Nevada, including its consolidated subsidiaries, is made known to management by others within those entities, particularly during the period in which this report is prepared and that information required to be disclosed by Franco-Nevada in its annual filings, interim filings or other reports filed or submitted by it under securities legislation is recorded, processed, summarized and reported within the time periods specified in securities legislation.
Due to its inherent limitations, internal control over financial reporting and disclosure may not prevent or detect all misstatements. Also, projections of any evaluation of effectiveness to future periods are subject to the risk that controls may become inadequate because of changes in conditions, or that the degree of compliance with the policies or procedures may change.
For the three months ended March 31, 2015, there has been no change in Franco-Nevada’s internal control over financial reporting that has materially affected, or is reasonably likely to materially affect, Franco-Nevada’s internal control over financial reporting.
28
Non-IFRS Financial Measures
Adjusted EBITDA and Adjusted EBITDA per share
Adjusted EBITDA and Adjusted EBITDA per share are non-IFRS financial measures, which exclude the following from net income and earnings per share (“EPS”):
· Income tax expense/recovery;
· Finance expenses;
· Finance income;
· Foreign exchange gains/losses and other income/expenses;
· Gains/losses on the sale of investments;
· Impairment charges related to royalty, stream and working interests and investments;
· Depletion and depreciation; and
· Non-cash costs of sales.
Management uses Adjusted EBITDA and Adjusted EBITDA per share to evaluate the underlying operating performance of the Company as a whole for the reporting periods presented, and to assist with the planning and forecasting of future operating results. Management believes that Adjusted EBITDA and Adjusted EBITDA per share allow investors and analysts to better evaluate the results of the underlying business of the Company. While the adjustments to net income and EPS in these measures include items that are both recurring and non-recurring, management believes that Adjusted EBITDA and Adjusted EBITDA per share are useful measures of the Company’s performance because foreign exchange, gains/losses on sale of investments and impairment charges do not reflect the underlying operating performance of our business and are not necessarily indicative of future operating results. Adjusted EBITDA and Adjusted EBITDA per share are intended to provide additional information to investors and analysts, do not have any standardized meaning under IFRS and should not be considered in isolation or as a substitute for measures of performance prepared in accordance with IFRS.
29
Reconciliation of Net Income to Adjusted EBITDA:
| | Three months ended | |
(expressed in millions, except per share amounts) | | March 31, 2015 | | March 31, 2014 | |
Net Income | | $ | 19.2 | | $ | 35.4 | |
Income tax expense | | 9.0 | | 14.4 | |
Finance costs | | 0.4 | | 0.4 | |
Finance income | | (0.8 | ) | (0.7 | ) |
Depletion and depreciation | | 51.7 | | 36.1 | |
Non-cash costs of sales | | 1.1 | | — | |
Impairment of royalty, stream and working interests | | 0.1 | | — | |
Foreign exchange (gains)/losses and other (income)/expenses | | 2.6 | | (0.8 | ) |
Adjusted EBITDA | | $ | 83.3 | | $ | 84.8 | |
Basic Weighted Average Shares Outstanding | | 156.5 | | 147.2 | |
Adjusted EBITDA per share | | $ | 0.53 | | $ | 0.58 | |
Margin
Margin is a non-IFRS financial measure which is defined by the Company as Adjusted EBITDA divided by revenue. Management uses Margin to evaluate the performance of the Company’s portfolio and we believe Margin provides a meaningful measure for investors and analysts to evaluate our overall ability to generate cash flow from our royalty, stream and working interests. Margin is intended to provide additional information, does not have any standardized definition under IFRS and should not be considered in isolation or as a substitute for a measure of performance in accordance with IFRS.
Reconciliation of Net Income to Margin:
| | Three months ended | |
(expressed in millions, except Margin) | | March 31, 2015 | | March 31, 2014 | |
Net Income | | $ | 19.2 | | $ | 35.4 | |
Income tax expense | | 9.0 | | 14.4 | |
Finance costs | | 0.4 | | 0.4 | |
Finance income | | (0.8 | ) | (0.7 | ) |
Depletion and depreciation | | 51.7 | | 36.1 | |
Non-cash costs of sales | | 1.1 | | — | |
Impairment of royalty, stream and working interests | | 0.1 | | — | |
Foreign exchange (gains)/losses and other (income)/expenses | | 2.6 | | (0.8 | ) |
Adjusted EBITDA | | $ | 83.3 | | $ | 84.8 | |
Revenue | | 109.2 | | 104.1 | |
Margin (%) | | 76.3 | % | 81.5 | % |
30
Adjusted Net Income and Adjusted Net Income per share
Adjusted Net Income and Adjusted Net Income per share are non-IFRS financial measures, which exclude the following from net income and EPS:
· Foreign exchange gains/losses and other income/expenses;
· Gains/losses on the sale of investments;
· Impairment charges related to royalty, stream and working interests and investments;
· Unusual non-recurring items; and
· Impact of income taxes on these items.
Management uses Adjusted Net Income and Adjusted Net Income per share to evaluate the underlying operating performance of the Company as a whole for the reporting periods presented, and to assist with the planning and forecasting of future operating results. Management believes that Adjusted Net Income and Adjusted Net Income per share allow investors and analysts to better evaluate the results of the underlying business of the Company. While the adjustments to net income and EPS in these measures include items that are both recurring and non-recurring, management believes that Adjusted Net Income and Adjusted Net Income per share are useful measures of the Company’s performance because foreign exchange, gains/losses on sale of investments and impairment charges do not reflect the underlying operating performance of our business and are not necessarily indicative of future operating results. Adjusted Net Income and Adjusted Net Income per share are intended to provide additional information to investors and analysts, do not have any standardized meaning under IFRS and should not be considered in isolation or as a substitute for measures of performance prepared in accordance with IFRS.
Reconciliation of Net Income to Adjusted Net Income:
| | Three months ended | |
(expressed in millions, except per share amounts) | | March 31, 2015 | | March 31, 2014 | |
Net income | | $ | 19.2 | | $ | 35.4 | |
Foreign exchange (gains)/losses and other (income)/expenses, net of income tax | | 3.2 | | (1.1 | ) |
Valuation allowance | | 0.9 | | — | |
Indexation tax adjustment | | (0.4 | ) | 1.1 | |
Adjusted Net Income | | $ | 22.9 | | $ | 35.4 | |
| | | | | |
Basic EPS | | $ | 0.12 | | $ | 0.24 | |
Foreign exchange (gains)/losses and other (income)/expenses, net of income tax | | 0.02 | | (0.01 | ) |
Valuation allowance | | 0.01 | | — | |
Indexation adjustment | | — | | 0.01 | |
Adjusted Net Income per Share | | $ | 0.15 | | $ | 0.24 | |
31
Cautionary Statement on Forward Looking Information
This MD&A contains “forward looking information” and “forward looking statements” within the meaning of applicable Canadian securities laws and the U.S. Private Securities Litigation Reform Act of 1995, respectively, which may include, but are not limited to, statements with respect to future events or future performance, management’s expectations regarding Franco-Nevada’s growth, results of operations, estimated future revenues, requirements for additional capital, mineral reserve and mineral resource estimates, production estimates, production costs and revenue, future demand for and prices of commodities, expected mining sequences, business prospects and opportunities. In addition, statements (including data in tables) relating to reserves and resources and gold equivalent ounces are forward looking statements, as they involve implied assessment, based on certain estimates and assumptions, and no assurance can be given that the estimates will be realized. Such forward looking statements reflect management’s current beliefs and are based on information currently available to management. Often, but not always, forward looking statements can be identified by the use of words such as “plans”, “expects”, “is expected”, “budgets”, “scheduled”, “estimates”, “forecasts”, “predicts”, “projects”, “intends”, “targets”, “aims”, “anticipates” or “believes” or variations (including negative variations) of such words and phrases or may be identified by statements to the effect that certain actions “may”, “could”, “should”, “would”, “might” or “will” be taken, occur or be achieved. Forward looking statements involve known and unknown risks, uncertainties and other factors, which may cause the actual results, performance or achievements of Franco-Nevada to be materially different from any future results, performance or achievements expressed or implied by the forward looking statements. A number of factors could cause actual events or results to differ materially from any forward looking statement, including, without limitation: fluctuations in the prices of the primary commodities that drive royalty and stream revenue (gold, platinum group metals, copper, nickel, uranium, silver, iron-ore and oil and gas); fluctuations in the value of the Canadian and Australian dollar, Mexican peso and any other currency in which revenue is generated, relative to the U.S. dollar; changes in national and local government legislation, including permitting and licensing regimes and taxation policies; regulations and political or economic developments in any of the countries where properties in which Franco-Nevada holds a royalty, stream or other interest are located or through which they are held; risks related to the operators of the properties in which Franco-Nevada holds a royalty, stream or other interest, including changes in the ownership and control of such operators; influence of macroeconomic developments; business opportunities that become available to, or are pursued by Franco-Nevada; reduced access to debt and equity capital; litigation; title, permit or license disputes related to interests on any of the properties in which Franco-Nevada holds a royalty, stream or other interest; whether or not the Company is determined to have PFIC status; excessive cost escalation as well as development, permitting, infrastructure, operating or technical difficulties on any of the properties in which Franco-Nevada holds a royalty, stream or other interest; rate and timing of production differences from resource estimates; risks and hazards associated with the business of development and mining on any of the properties in which Franco-Nevada holds a royalty, stream or other interest, including, but not limited to unusual or unexpected geological and metallurgical conditions, slope failures or cave-ins, flooding and other natural disasters, terrorism, civil unrest or an outbreak of contagious disease; and the integration of acquired assets. The forward looking statements contained in this MD&A are based upon assumptions management believes to be reasonable, including, without limitation: the ongoing operation of the properties in which Franco-Nevada holds a royalty, stream or other interest by the owners or operators of such properties in a manner consistent with past practice; the accuracy of public statements and disclosures
32
made by the owners or operators of such underlying properties; no material adverse change in the market price of the commodities that underlie the asset portfolio; the Company’s ongoing income and assets relating to determination of our PFIC status; no adverse development in respect of any significant property in which Franco-Nevada holds a royalty, stream or other interest; the accuracy of publicly disclosed expectations for the development of underlying properties that are not yet in production; integration of acquired assets; and the absence of any other factors that could cause actions, events or results to differ from those anticipated, estimated or intended. However, there can be no assurance that forward looking statements will prove to be accurate, as actual results and future events could differ materially from those anticipated in such statements and investors are cautioned that forward looking statements are not guarantees of future performance. Franco-Nevada cannot assure investors that actual results will be consistent with these forward looking statements. Accordingly, investors should not place undue reliance on forward looking statements due to the inherent uncertainty therein. For additional information with respect to risks, uncertainties and assumptions, please refer to the “Risk Factors” section of this MD&A as well as Franco-Nevada’s most recent Annual Information Form filed with the Canadian securities regulatory authorities on www.sedar.com and contained in Franco-Nevada’s Form 40-F filed with the SEC on www.sec.gov. The forward looking statements herein are made as of the date of this MD&A only and Franco-Nevada does not assume any obligation to update or revise them to reflect new information, estimates or opinions, future events or results or otherwise, except as required by applicable law.
33