Exhibit 99.2

Management’s Discussion and Analysis |
This Management’s Discussion and Analysis (“MD&A”) of financial position and results of operations of Franco-Nevada Corporation (“Franco-Nevada”, the “Company”, “we” or “our”) has been prepared based upon information available to Franco-Nevada as at August 7, 2019 and should be read in conjunction with Franco-Nevada’s unaudited condensed consolidated financial statements and related notes as at and for the three and six months ended June 30, 2019 and 2018. The unaudited condensed consolidated financial statements and MD&A are presented in U.S. dollars and have been prepared in accordance with International Financial Reporting Standards (“IFRS”) as issued by the International Accounting Standards Board (“IASB”).
Readers are cautioned that the MD&A contains forward-looking statements and that actual events may vary from management’s expectations. Readers are encouraged to read the “Cautionary Statement on Forward-Looking Information” at the end of this MD&A and to consult Franco-Nevada’s unaudited consolidated financial statements for the three and six months ended June 30, 2019 and 2018 and the corresponding notes to the financial statements which are available on our website at www.franco-nevada.com, on SEDAR at www.sedar.com and in our most recent Form 6-K filed with the United States Securities and Exchange Commission on EDGAR at www.sec.gov.
Additional information related to Franco-Nevada, including our Annual Information Form, is available on SEDAR at www.sedar.com, and our Form 40-F is available on EDGAR at www.sec.gov. These documents contain descriptions of certain of Franco-Nevada’s producing and advanced royalty and stream assets, as well as a description of risk factors affecting the Company. For additional information, our website can be found at www.franco-nevada.com.
|
|
3 | |
4 | |
5 | |
7 | |
7 | |
8 | |
9 | |
10 | |
14 | |
18 | |
19 | |
20 | |
21 | |
22 | |
24 | |
25 | |
25 | Internal control over financial reporting and disclosure controls and procedures |
26 | |
29 |
Abbreviations used in this report |
The following abbreviations may be used throughout this MD&A:
|
|
|
|
|
|
|
|
|
Abbreviated Definitions |
|
|
|
|
|
| ||
|
|
|
|
|
|
|
|
|
Periods under review |
|
| Interest types |
| Measurement | |||
"H1/2019" | The six-month period ended June 30, 2019 |
|
| "NSR" | Net smelter return royalty |
| "GEO" | Gold equivalent ounces |
"H1/2018" | The six-month period ended June 30, 2018 |
|
| "GR" | Gross royalty |
| "PGM" | Platinum group metals |
"Q2/2019" | The three-month period ended June 30, 2019 |
|
| "ORR" | Overriding royalty |
| "oz" | Ounce |
"Q1/2019" | The three-month period ended March 31, 2019 |
|
| "GORR" | Gross overriding royalty |
| "oz Au" | Ounce of gold |
"Q4/2018" | The three-month period ended December 31, 2018 |
|
| "FH" | Freehold or lessor royalty |
| "oz Ag" | Ounce of silver |
"Q3/2018" | The three-month period ended September 30, 2018 |
|
| "NPI" | Net profits interest |
| "oz Pt" | Ounce of platinum |
"Q2/2018" | The three-month period ended June 30, 2018 |
|
| "NRI" | Net royalty interest |
| "oz Pd" | Ounce of palladium |
|
|
|
| "WI" | Working interest |
| "LBMA" | London Bullion Market Association |
Places and currencies |
|
|
|
|
| "bbl" | Barrel | |
"U.S." | United States |
|
|
|
|
| "boe" | Barrels of oil equivalent |
"$" or "USD" | United States dollars |
|
|
|
|
| "WTI" | West Texas Intermediate |
"C$" or "CAD" | Canadian dollars |
|
|
|
|
| "mcf" | Thousand cubic feet |
"A$" or "AUD" | Australian dollars |
|
|
|
|
|
|
|
|
|
|
|
|
|
|
|
|
For definitions of the various types of agreements, please refer to our most recent Annual Information Form filed on SEDAR at www.sedar.com or our Form 40‑F filed on EDGAR at www.sec.gov.
|
|
2019 Second Quarter Management’s Discussion and Analysis | 2 |
Franco-Nevada is the leading gold-focused royalty and streaming company with the largest and most diversified portfolio of royalties and streams by commodity, geography, revenue type and stage of project. The portfolio is actively managed to maintain a focus on precious metals (gold, silver and PGM) and a diversity of revenue sources with a target of not more than 20% from energy (oil, gas and NGLs).
|
|
|
|
|
|
|
|
Franco-Nevada Asset Count at August 7, 2019 | |||||||
|
| Mining |
| Energy |
|
| TOTAL |
Producing |
| 53 |
| 56 |
|
| 109 |
Advanced |
| 38 |
| — |
|
| 38 |
Exploration |
| 200 |
| 25 |
|
| 225 |
TOTAL |
| 291 |
| 81 |
|
| 372 |
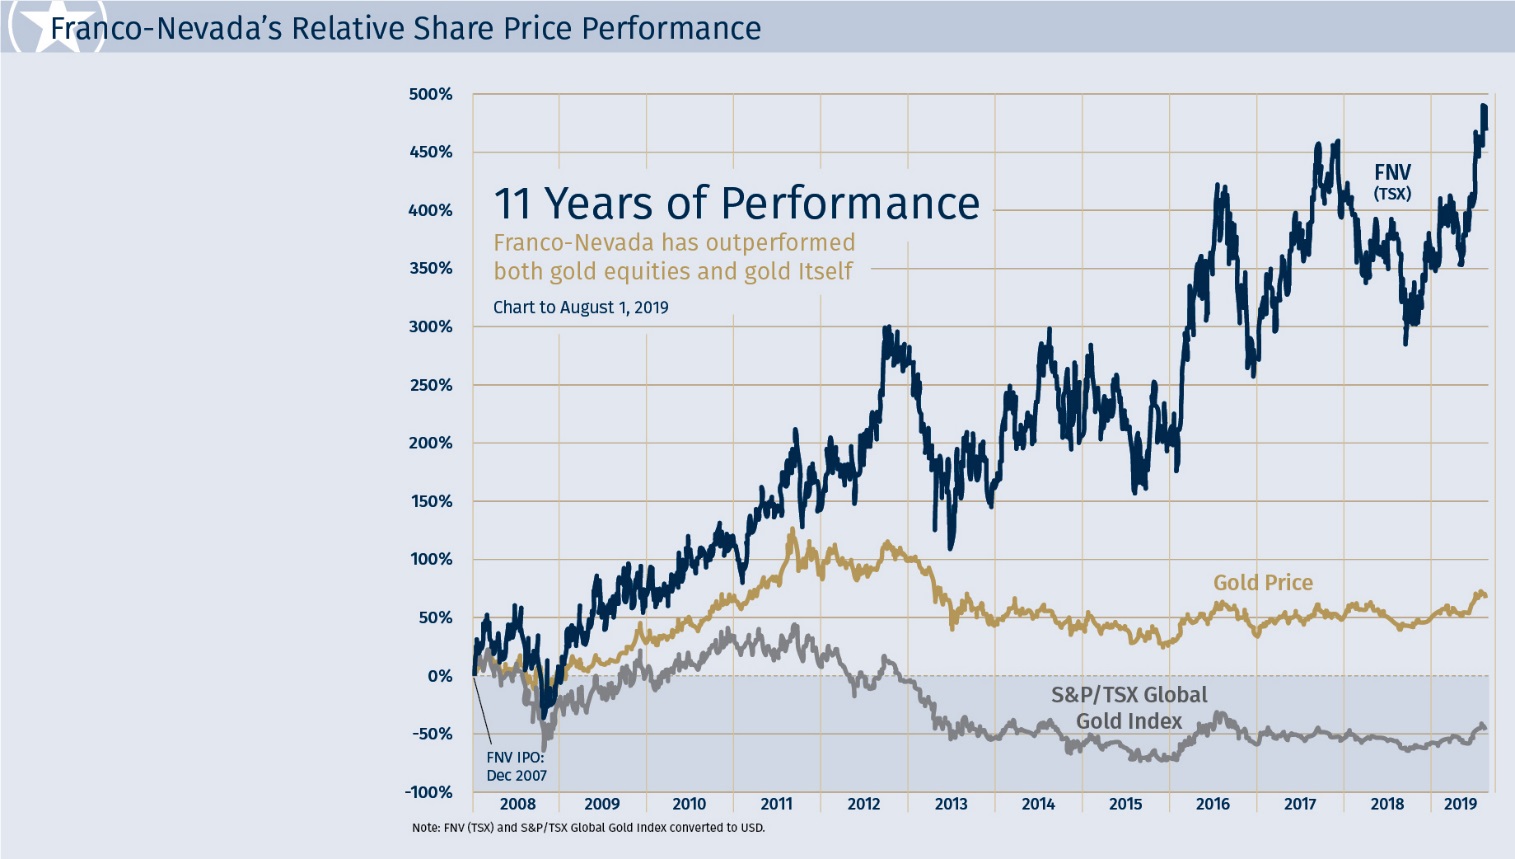
Franco-Nevada’s shares are listed on the Toronto and New York stock exchanges under the symbol FNV. An investment in Franco-Nevada’s shares is expected to provide investors with yield and exposure to commodity price and exploration optionality while limiting exposure to many of the risks of operating companies. Since its initial public offering over eleven years ago, Franco-Nevada has increased its dividend annually and its share price has outperformed the gold price and all relevant gold equity benchmarks.
|
|
2019 Second Quarter Management’s Discussion and Analysis | 3 |
Franco-Nevada’s revenue is generated from various forms of agreements, ranging from net smelter return royalties, streams, net profits interests, net royalty interests, working interests and other types of arrangements.
The Company does not operate mines, develop projects or conduct exploration. Franco-Nevada’s business model is focused on managing and growing its portfolio of royalties and streams. The advantages of this business model are:
· | Exposure to commodity price optionality; |
· | A perpetual discovery option over large areas of geologically prospective lands; |
· | No additional capital requirements other than the initial investment; |
· | Limited exposure to many of the risks associated with operating companies; |
· | A free cash-flow business with limited cash calls; |
· | A high-margin business that can generate cash through the entire commodity cycle; |
· | A scalable and diversified business in which a large number of assets can be managed with a small stable overhead; and |
· | A forward-looking business in which management focuses on growth opportunities rather than operational or development issues. |
Franco-Nevada’s financial results in the short term are primarily tied to the price of commodities and the amount of production from its portfolio of producing assets. Financial results have also been supplemented by acquisitions of new producing assets. Over the longer term, results are impacted by the availability of exploration and development capital applied by other companies to expand or extend Franco-Nevada’s producing assets or to advance Franco-Nevada’s advanced and exploration assets into production.
Franco-Nevada has a long-term investment outlook and recognizes the cyclical nature of the industry. Franco-Nevada has operated by maintaining a strong balance sheet so that it can make investments during commodity cycle downturns.
Franco-Nevada actively manages its portfolio to maintain a focus on precious metals (gold, silver and PGM) and a diversity of revenue sources with a target of not more than 20% from energy (oil, gas and NGLs). In the short term, we may diverge from the long-term target based on opportunities available. In H1/2019, 86.2% of revenue was earned from gold and gold equivalents and 13.8% from Energy assets.
One of the strengths of the Franco-Nevada business model is that our business is not generally impacted when producer costs increase as long as the producer continues to operate. Royalty and stream payments/deliveries are based on production levels with no adjustments for the operator’s operating costs, with the exception of NPI and NRI royalties, which are based on the profit of the underlying operation. Profit-based royalties accounted for approximately 10.1% of total revenue in Q2/2019.
|
|
2019 Second Quarter Management’s Discussion and Analysis | 4 |
Financial Update – Q2/2019
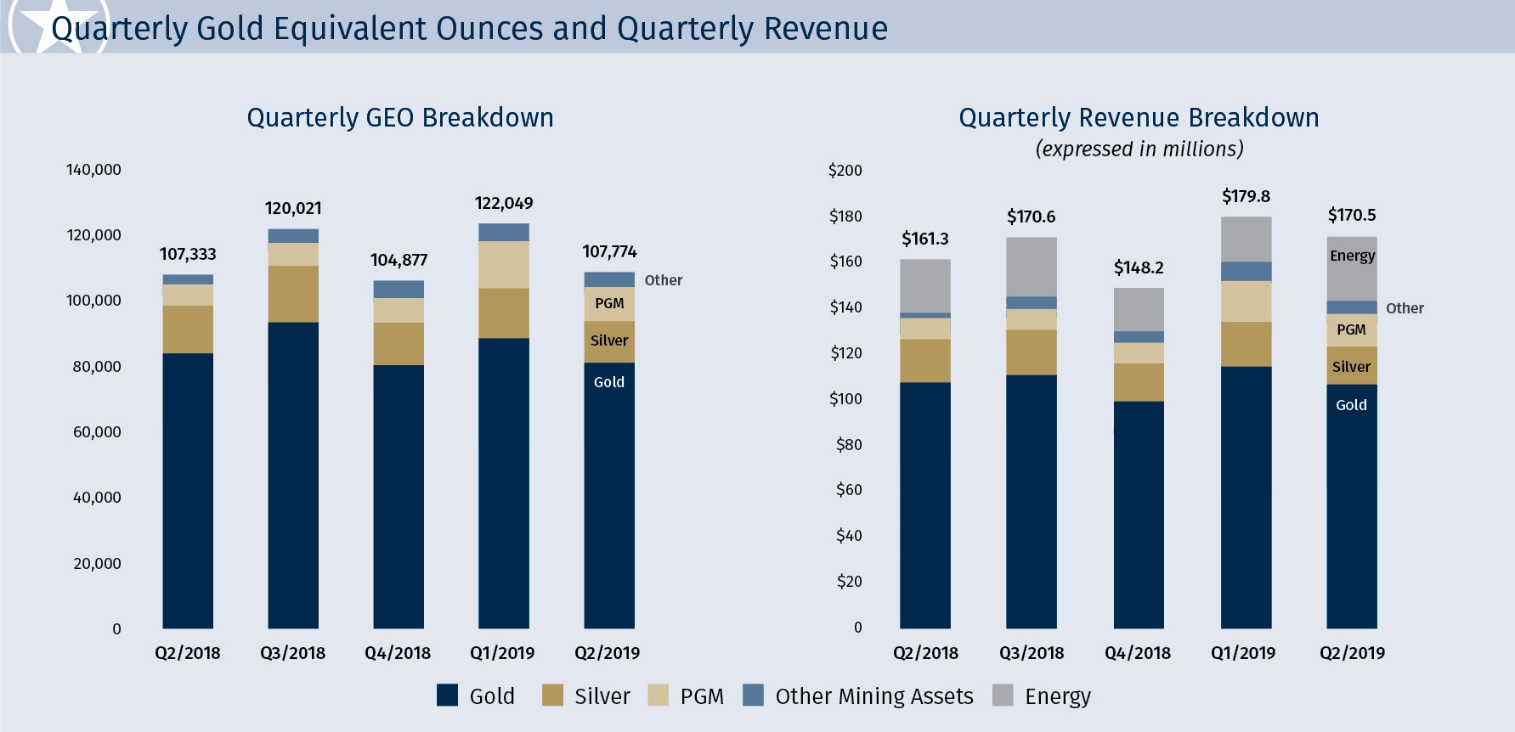
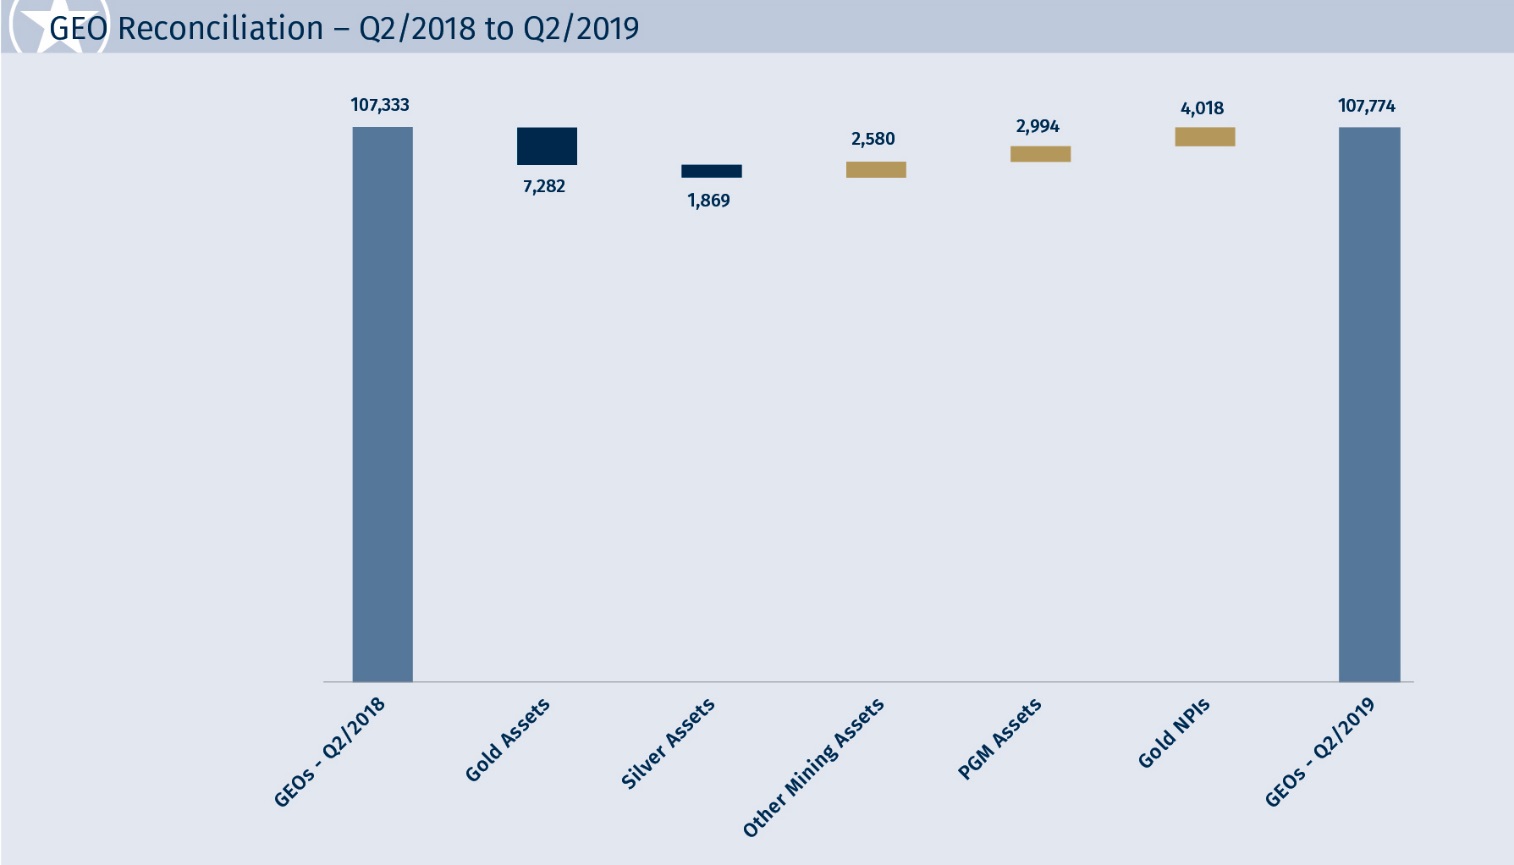
· | 107,774 GEOs(1) earned in Q2/2019, a slight increase of 0.4% from 107,333 GEOs in Q2/2018; |
· | $170.5 million in revenue, an increase of 5.7% compared to Q2/2018; |
· | $25.6 million, or $238 per GEO, in Cash Costs(2) attributable to GEO production, compared to $26.5 million, or $252 per GEO, in Q2/2018; |
· | $137.9 million, or $0.74 per share, of Adjusted EBITDA(2), an increase of 9.2% and 8.8%, respectively, compared to Q2/2018; |
· | 80.9% in Margin(2), compared to 78.3% in Q2/2018; |
· | $64.0 million, or $0.34 per share, in net income, an increase of 19.4% and 17.2%, respectively, compared to Q2/2018; |
· | $64.0 million, or $0.34 per share in Adjusted Net Income(2), an increase of 19.2% and 17.2%, respectively, compared to Q2/2018; |
· | $119.1 million in net cash provided by operating activities, an increase of 7.0% compared to $111.3 million in Q2/2018; |
· | $1.1 billion in available capital as at June 30, 2019. |
Financial Update – H1/2019
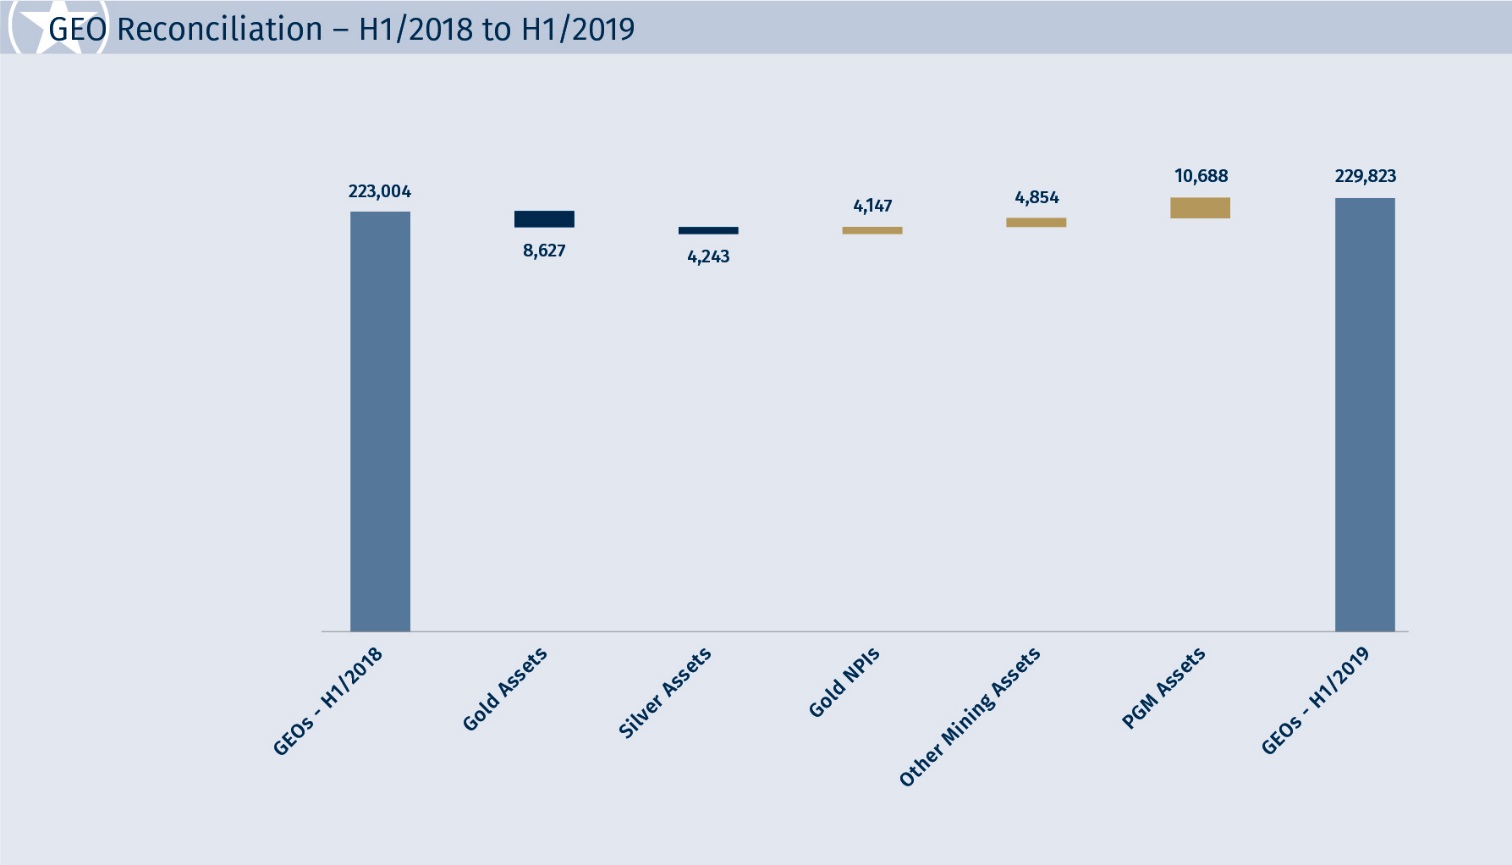
· | 229,823 GEOs earned, an increase of 3.1% from 223,004 GEOs in H1/2018; |
· | $350.3 million in revenue, an increase of 4.8% compared to H1/2018; |
· | $56.6 million, or $246 per GEO, in Cash Costs attributable to GEO production, compared to $53.8 million, or $246 per GEO, in H1/2018; |
· | $278.8 million, or $1.49 per share, in Adjusted EBITDA, an increase of 4.7% and 4.2%, respectively, from H1/2018; |
· | 79.6% in Margin, consistent with H1/2018; |
· | $129.2 million, or $0.69 per share, in net income, an increase of 9.3% and 7.8%, respectively, compared to H1/2018; |
· | $129.2 million, or $0.69 per share, in Adjusted Net Income, increases of 9.9% compared to H1/2018; |
· | $262.7 million in net cash provided by operating activities, an increase of 5.6% compared to H1/2018. |
Corporate Developments
Acquisition of U.S. Oil & Gas Royalty Interest – Marcellus, Pennsylvania, U.S.A.
On July 22, 2019, Franco-Nevada acquired from Range Resources Corporation (“Range”) an overriding royalty interest on acreage in the Marcellus for a gross purchase price of $300.0 million. The royalty is calculated as 1% of gross production, less allowed deductions from approximately 350,000 net acres of Range’s working interest position in Washington, Western Allegheny and Southern Beaver Counties in Pennsylvania. The royalty applies to existing production and future development from the Marcellus formation as well as future potential development from the Utica and Upper Devonian formations. The royalty provides exposure to a significant inventory of undeveloped drilling locations capable of supporting cash flow for several decades. The royalty is registered on title and is a direct interest in real property.
The acquisition was financed with a combination of cash on hand and funds drawn from the Company’s revolving credit facility prior to June 30, 2019. The acquisition has an effective date of March 1, 2019. Between the effective date and the closing date, the asset has generated approximately $9.0 million in royalties, which will be included in the Company’s Energy revenue in Q3/2019. Approximately half of the royalties earned were from natural gas liquids and condensate.
Acquisition of U.S. Oil & Gas Royalty Rights with Continental Resources, Inc. – SCOOP and STACK, Oklahoma, U.S.A.
The Company, through a wholly-owned subsidiary, has a strategic relationship with Continental Resources, Inc. (“Continental”) to acquire, through a jointly-owned entity (the “Royalty Acquisition Venture”), royalty rights in the South Central Oklahoma Oil Province (“SCOOP”) and Sooner Trend Anadarko Basin Canadian and Kingfisher Counties (“STACK”) plays of Oklahoma. The acquisition pace has been favourable so far this year. As a result, the Company has agreed to increase the capital commitment in 2019 to $120.0 million, up from $100.0 million previously. Franco-Nevada recorded contributions to the Royalty Acquisition Venture of $35.1 million and $86.5 million in Q2/2019 and H1/2019, respectively. Of this, $10.8 million was funded after June 30, 2019. The total cumulative investment in the Royalty Acquisition Venture totaled $348.3 million and Franco-Nevada has remaining commitments of up to $171.7 million to be funded over three years by December 31, 2021.
__________________________
1GEOs include production from our Mining assets, and do not include Energy assets. GEOs are estimated on a gross basis for NSR royalties and, in the case of stream ounces, before the payment of the per ounce contractual price paid by the Company. For NPI royalties, GEOs are calculated taking into account the NPI economics. Silver, platinum, palladium and other mining commodities are converted to GEOs by dividing associated revenue, which includes settlement adjustments, by the relevant gold price. The price used in the computation of GEOs earned from a particular asset varies depending on the royalty or stream agreement, which may make reference to the market price realized by the operator, or the average price for the month, quarter, or year in which the mining commodity was produced or sold. For illustrative purposes, please refer to the average commodity price table on pages 10 and 14 of this MD&A for indicative prices which may be used in the calculation of GEOs for the three and six months ended June 30, 2019 and 2018, respectively.
2Cash Costs, Adjusted Net Income, Adjusted EBITDA, and Margin are non-IFRS financial measures with no standardized meaning under IFRS. For further information and a detailed reconciliation, please see the “Non-IFRS Financial Measures” section of this MD&A.
|
|
2019 Second Quarter Management’s Discussion and Analysis | 5 |
Acquisition of Valentine Lake Royalty Interest – Newfoundland, Canada
On February 21, 2019, Franco-Nevada acquired a 2% NSR on Marathon Gold Corporation’s (“Marathon”) Valentine Lake Gold Camp in central Newfoundland for C$18.0 million. Marathon has an option to buy back 0.5% of the NSR for $7.0 million until December 31, 2022.
Acquisition of Salares Norte Royalty Interest – Chile
On January 31, 2019, Franco-Nevada, through a wholly-owned subsidiary, acquired an existing 2% NSR on Gold Fields’ Salares Norte project in the Atacama region of northern Chile for $32.0 million, comprised of $27.0 million of Franco-Nevada common shares (366,499 common shares) and $5.0 million in cash. Gold Fields has an option to buy back 1% of the NSR for $6.0 million within 24 months of the commencement of commercial production.
Significant Portfolio Updates
Additional updates related to our portfolio of assets are available in our News Release issued on August 7, 2019, available on SEDAR at www.sedar.com, and EDGAR at www.sec.gov.
Cobre Panama
First Quantum Minerals Ltd. reported on June 24, 2019 that the first shipment of copper concentrate from Cobre Panama left port, marking the first shipment from the operation and a significant milestone in the ramp-up of the project. First Quantum reports that the project remains on schedule to deliver between 140,000 and 175,000 tonnes of copper in 2019 with approximately 80% of total production expected in the second half of the year. The mine is expected to ramp up to over 300,000 tonnes of annual copper production over the next few years. First Quantum expects the mill to be running at an annualized throughput rate of 72 million tonnes per year by year-end.
Franco-Nevada received its first gold and silver ounces from Cobre Panama in early July, and expects deliveries from the mine to be closer to the top end of our prior guidance of 20,000 to 40,000 GEOs in 2019.
Financing
Credit Facilities
In the first quarter of 2019, the Company paid down $50.0 million of the $210.0 million it had outstanding at December 31, 2018 under its $1.0 billion credit facility (the “Corporate Revolver”). The remaining $160.0 million was refinanced on April 17, 2019, with an unsecured, one-year term, non-revolving credit facility (the “Corporate Term Loan”). The Corporate Term Loan was drawn as a one-month LIBOR loan with interest payable at a rate of LIBOR plus 0.85% and matures April 17, 2020. On June 25, 2019, the Company drew down $275.0 million on its Corporate Revolver to finance its acquisition of the oil and gas royalty interest in the Marcellus that was due to close subsequent to quarter-end. The acquisition had a gross purchase price of $300.0 million. Subsequent to quarter-end, on August 6, 2019, the Company paid down $50.0 million on its Corporate Revolver, such that the outstanding balance as at the date of this MD&A was $225.0 million.
In March 2019, the Company amended its Corporate Revolver to extend the term from March 22, 2023 to March 22, 2024 and reduce the applicable margins and standby fee, which depend on the Company’s leverage ratio. The maturity of the Franco‑Nevada (Barbados) Corporation credit facility (the “FNBC Revolver”) was also extended by an additional year to March 20, 2020.
At-the-Market Equity Program
On July 19, 2019, the Company established an at-the-market program (the “ATM Program”) that allows the Company to issue to $200 million worth of common shares from treasury to the public from time to time at the prevailing market price through the Toronto Stock Exchange, the New York Stock Exchange or any other marketplace on which the common shares are listed, quoted or otherwise trade. The volume and timing of distributions under the ATM Program, if any, will be determined at the Company’s sole discretion, subject to applicable regulatory limitations. The ATM Program will be effective until July 18, 2020, unless terminated prior to such date by the Company.
Dividend Declaration
In Q2/2019, Franco-Nevada declared a quarterly dividend of $0.25 per share. The total dividend declared was $47.4 million, of which $35.1 million was paid in cash and $12.3 million was paid in common shares issued under the Company’s Dividend Reinvestment Plan (“DRIP”). For H1/2019, dividends declared totaled $0.49 per share, or $92.3 million, of which $70.0 million was paid in cash and $22.3 million was paid in common shares.
|
|
2019 Second Quarter Management’s Discussion and Analysis | 6 |
The following contains forward-looking statements. Reference should be made to the “Cautionary Statement on Forward-Looking Information” section at the end of this MD&A. For a description of material factors that could cause our actual results to differ materially from the forward-looking statements below, please see the “Cautionary Statement” and the “Risk Factors” section of our most recent Annual Information Form filed with the Canadian securities regulatory authorities on www.sedar.com and our most recent Form 40-F filed with the United States Securities and Exchange Commission on www.sec.gov. 2019 guidance is based on assumptions including the forecasted state of operations from our assets based on the public statements and other disclosures by the third-party owners and operators of the underlying properties (subject to our assessment thereof).
Based on the strong results year to date and the increase in expected deliveries from Cobre Panama, Franco-Nevada now expects 2019 GEO deliveries to be at the higher end of the previously announced guidance range of 465,000 to 500,000 GEOs. To reflect the addition of the Marcellus royalty and continued strong performance of the Energy assets, Franco-Nevada now expects to earn $100.0 to $115.0 million in revenue from the Energy portfolio for 2019.
|
|
|
|
|
|
|
|
|
|
|
|
|
| Previous guidance |
|
| Revised guidance |
|
| H1/2019 Actual |
|
Gold & Gold Equivalent production(1),(2) |
|
| 465,000 - 500,000 GEOs |
|
| No change |
|
| 229,823 GEOs |
|
Energy revenue(3) |
|
| $70.0 - $85.0 million |
|
| $100.0 - $115.0 million |
|
| $48.4 million |
|
1Of the 465,000 to 500,000 GEOs, Franco-Nevada expects to receive 305,000 to 335,000 GEOs under its various streams. For the three and six months ended June 30, 2019, the Company earned 65,742 and 145,969 GEOs from its streams, respectively.
2In forecasting GEOs for the remainder of 2019, gold, silver, platinum and palladium metals have been converted to GEOs using commodity prices of $1,400 Au, $16.00 Ag, $850 Pt and $1,500 Pd.
3In forecasting revenue from Energy assets for the remainder of 2019, the Company assumed a WTI oil price of $55 per barrel and a Henry Hub natural gas price of $2.40 per mcf.
The Company has estimated depletion and depreciation expense to be between $245.0 million to $275.0 million for the full year 2019. In H1/2019, depletion and depreciation expense totaled $119.8 million, with an estimated $125.0 million to $155.0 million for the remainder of 2019.
With respect to the Royalty Acquisition Venture held with Continental, given the favourable pace of acquisitions, the Company has agreed to increase the capital commitment in 2019 to $120.0 million, up from $100.0 million previously. As at June 30, 2019, the Company recorded contributions of $86.5 million.
The prices of precious metals, gold in particular, are the largest factors in determining profitability and cash-flow from operations for Franco-Nevada. Historically, the price of gold has been subject to volatile price movements and is affected by numerous macroeconomic and industry factors that are beyond the Company’s control. Major influences on the gold price include the level of interest rates, inflation expectations, currency exchange rate fluctuations including the relative strength of the U.S. dollar, and the supply of and demand for gold.
Commodity price volatility also impacts the number of GEOs when converting non-gold commodities to GEOs. Silver, platinum, palladium and other mining commodities are converted to GEOs by dividing associated revenue, which includes settlement adjustments, by the relevant gold price. The price used in the computation of GEOs earned from a particular asset varies depending on the royalty or stream agreement, which may make reference to the market price realized by the operator, or the average price for the month, quarter, or year in which the mining commodity was produced or sold.
During Q2/2019, gold prices averaged $1,310/oz, up slightly by 0.3% compared to the Q2/2018 average of $1,306/oz. Gold prices ended Q2/2019 at $1,409/oz, approximately 8.8% higher than at the end of Q1/2019.
Silver prices averaged $14.89/oz in Q2/2019, a decrease of 10.1% compared to $16.57/oz in Q2/2018. Platinum and palladium prices averaged $842/oz and $1,388/oz, respectively, in Q2/2019, compared to $904/oz and $979/oz, respectively, for Q2/2018, a decrease of 6.8% and an increase of 41.8% year-over-year, respectively.
During the quarter, Edmonton Light prices averaged C$72.48/bbl, down 7.6% compared to Q2/2018, while WTI averaged $59.73/bbl, a 12.0% decrease from Q2/2018.
|
|
2019 Second Quarter Management’s Discussion and Analysis | 7 |
Selected Financial Information
|
|
|
|
|
|
|
|
|
|
|
|
|
|
|
|
|
|
|
|
| For the three months ended |
|
| For the six months ended |
| ||||||||||
(in millions, except Average Gold Price, GEOs sold, |
|
| June 30, |
|
| June 30, |
| ||||||||||
Margin, per ounce amounts and per share amounts) |
|
| 2019 |
|
| 2018 |
|
| 2019 |
|
| 2018 |
| ||||
|
|
|
|
|
|
|
|
|
|
|
|
|
|
|
|
|
|
Statistical Measures |
|
|
|
|
|
|
|
|
|
|
|
|
|
|
|
|
|
Average Gold Price |
|
| $ | 1,310 |
|
| $ | 1,306 |
|
| $ | 1,307 |
|
| $ | 1,318 |
|
GEOs sold(1) |
|
|
| 107,774 |
|
|
| 107,333 |
|
|
| 229,823 |
|
|
| 223,004 |
|
|
|
|
|
|
|
|
|
|
|
|
|
|
|
|
|
|
|
Statement of Income and Comprehensive Income |
|
|
|
|
|
|
|
|
|
|
|
|
|
|
|
|
|
Revenue |
|
| $ | 170.5 |
|
| $ | 161.3 |
|
| $ | 350.3 |
|
| $ | 334.4 |
|
Depletion and depreciation |
|
|
| 58.9 |
|
|
| 59.6 |
|
|
| 119.8 |
|
|
| 120.2 |
|
Costs of sales |
|
|
| 27.4 |
|
|
| 29.8 |
|
|
| 59.8 |
|
|
| 60.0 |
|
Operating income |
|
|
| 79.0 |
|
|
| 64.9 |
|
|
| 159.0 |
|
|
| 142.3 |
|
Net income |
|
|
| 64.0 |
|
|
| 53.6 |
|
|
| 129.2 |
|
|
| 118.2 |
|
Basic earnings per share |
|
| $ | 0.34 |
|
| $ | 0.29 |
|
| $ | 0.69 |
|
| $ | 0.64 |
|
Diluted earnings per share |
|
| $ | 0.34 |
|
| $ | 0.29 |
|
| $ | 0.69 |
|
| $ | 0.63 |
|
|
|
|
|
|
|
|
|
|
|
|
|
|
|
|
|
|
|
Dividends declared per share |
|
| $ | 0.25 |
|
| $ | 0.24 |
|
| $ | 0.49 |
|
| $ | 0.47 |
|
Dividends declared (including DRIP) |
|
| $ | 47.4 |
|
| $ | 44.6 |
|
| $ | 92.3 |
|
| $ | 87.9 |
|
Weighted average shares outstanding |
|
|
| 187.2 |
|
|
| 186.0 |
|
|
| 187.1 |
|
|
| 186.0 |
|
|
|
|
|
|
|
|
|
|
|
|
|
|
|
|
|
|
|
Non-IFRS Measures |
|
|
|
|
|
|
|
|
|
|
|
|
|
|
|
|
|
Cash Costs(2) attributable to GEO production |
|
| $ | 25.6 |
|
| $ | 26.5 |
|
| $ | 56.6 |
|
| $ | 53.8 |
|
Cash Costs(2) per GEO |
|
| $ | 238 |
|
| $ | 252 |
|
| $ | 246 |
|
| $ | 246 |
|
Adjusted EBITDA(2) |
|
| $ | 137.9 |
|
| $ | 126.3 |
|
| $ | 278.8 |
|
| $ | 266.2 |
|
Adjusted EBITDA(2) per share |
|
| $ | 0.74 |
|
| $ | 0.68 |
|
| $ | 1.49 |
|
| $ | 1.43 |
|
Margin(2) |
|
|
| 80.9 | % |
|
| 78.3 | % |
|
| 79.6 | % |
|
| 79.6 | % |
Adjusted Net Income(2) |
|
| $ | 64.0 |
|
| $ | 53.7 |
|
| $ | 129.2 |
|
| $ | 117.6 |
|
Adjusted Net Income(2) per share |
|
| $ | 0.34 |
|
| $ | 0.29 |
|
| $ | 0.69 |
|
| $ | 0.63 |
|
|
|
|
|
|
|
|
|
|
|
|
|
|
|
|
|
|
|
Statement of Cash Flows |
|
|
|
|
|
|
|
|
|
|
|
|
|
|
|
|
|
Net cash provided by operating activities |
|
| $ | 119.1 |
|
| $ | 111.3 |
|
| $ | 262.7 |
|
| $ | 248.8 |
|
Net cash used in investing activities |
|
| $ | (33.5) |
|
| $ | (90.8) |
|
| $ | (89.8) |
|
| $ | (614.0) |
|
Net cash used in financing activities |
|
| $ | 241.4 |
|
| $ | (35.0) |
|
| $ | 156.7 |
|
| $ | (71.1) |
|
|
|
|
|
|
|
|
|
|
|
|
|
|
|
|
|
|
|
|
|
|
|
|
|
|
|
|
|
|
|
| As at |
|
| As at |
| ||
|
|
| June 30, |
|
| December 31, |
| ||
(expressed in millions) |
|
| 2019 |
|
| 2018 |
| ||
Statement of Financial Position |
|
|
|
|
|
|
|
|
|
Cash and cash equivalents |
|
| $ | 398.9 |
|
| $ | 69.7 |
|
Total assets |
|
|
| 5,358.7 |
|
|
| 4,931.8 |
|
Total debt |
|
|
| 432.2 |
|
|
| 207.6 |
|
Deferred income tax liabilities |
|
|
| 81.4 |
|
|
| 67.3 |
|
Total shareholders’ equity |
|
|
| 4,800.4 |
|
|
| 4,631.9 |
|
Working capital(3) |
|
|
| 338.2 |
|
|
| 153.5 |
|
1 | Refer to Note 1 at the bottom of page 5 of this MD&A for the methodology for calculating GEOs, and, for illustrative purposes, to the average commodity price table on pages 10 and 14 of this MD&A for indicative prices which may be used in the calculations of GEOs for the three and six months ended June 30, 2019 and 2018, respectively. |
2 | Cash costs, Adjusted EBITDA, Margin and Adjusted Net Income are non-IFRS financial measures with no standardized meaning under IFRS. For further information and a detailed reconciliation, please see the “Non-IFRS Financial Measures” section of this MD&A. |
3 | The Company defines Working Capital as current assets less current liabilities. |
|
|
2019 Second Quarter Management’s Discussion and Analysis | 8 |
Our portfolio is well-diversified with GEOs and revenue being earned from 53 Mining assets and 55 Energy assets in various jurisdictions. The following table details revenue earned from our various royalty, stream and working interests for the three and six months ended June 30, 2019 and 2018:
|
|
|
|
|
|
|
|
|
|
|
|
|
|
|
|
|
|
|
|
|
|
|
|
| For the three months ended |
|
| For the six months ended |
| ||||||||||
(expressed in millions) |
| Interest and % |
|
| June 30, |
|
| June 30, |
| ||||||||||
Property |
| (Gold unless otherwise noted) |
|
| 2019 |
|
| 2018 |
|
| 2019 |
|
| 2018 |
| ||||
GOLD & GOLD EQUIVALENTS |
|
|
|
|
|
|
|
|
|
|
|
|
|
|
|
|
|
|
|
Latin America |
|
|
|
|
|
|
|
|
|
|
|
|
|
|
|
|
|
|
|
Candelaria |
| Stream 68% Gold & Silver |
|
| $ | 21.0 |
|
| $ | 18.8 |
|
| $ | 47.4 |
|
| $ | 37.6 |
|
Antapaccay |
| Stream (indexed) Gold & Silver |
|
|
| 18.6 |
|
|
| 20.3 |
|
|
| 42.0 |
|
|
| 49.3 |
|
Antamina |
| Stream 22.5% Silver |
|
|
| 10.8 |
|
|
| 11.6 |
|
|
| 23.1 |
|
|
| 27.3 |
|
Guadalupe-Palmarejo |
| Stream 50% |
|
|
| 8.3 |
|
|
| 12.6 |
|
|
| 19.8 |
|
|
| 25.8 |
|
Other |
|
|
|
|
| 2.2 |
|
|
| 0.6 |
|
|
| 3.6 |
|
|
| 1.0 |
|
United States |
|
|
|
|
|
|
|
|
|
|
|
|
|
|
|
|
|
|
|
Goldstrike |
| NSR 2-4%, NPI 2.4-6% |
|
| $ | 8.2 |
|
| $ | 4.4 |
|
| $ | 12.6 |
|
| $ | 7.7 |
|
Stillwater |
| NSR 5% PGM |
|
|
| 8.5 |
|
|
| 5.1 |
|
|
| 17.7 |
|
|
| 11.0 |
|
Gold Quarry |
| NSR 7.29% |
|
|
| 2.7 |
|
|
| 3.6 |
|
|
| 5.8 |
|
|
| 8.0 |
|
Marigold |
| NSR 1.75-5%, GR 0.5-4% |
|
|
| 2.3 |
|
|
| 2.5 |
|
|
| 5.0 |
|
|
| 4.7 |
|
Bald Mountain |
| NSR/GR 0.875-5% |
|
|
| 1.3 |
|
|
| 6.2 |
|
|
| 3.5 |
|
|
| 7.7 |
|
Fire Creek/Midas |
| NSR 2.5%, Fixed to 2018 |
|
|
| 0.3 |
|
|
| 2.5 |
|
|
| 0.6 |
|
|
| 5.4 |
|
South Arturo |
| GR 4-9% |
|
|
| — |
|
|
| 0.5 |
|
|
| 0.1 |
|
|
| 3.6 |
|
Other |
|
|
|
|
| 0.9 |
|
|
| 1.3 |
|
|
| 1.8 |
|
|
| 2.7 |
|
Canada |
|
|
|
|
|
|
|
|
|
|
|
|
|
|
|
|
|
|
|
Sudbury |
| Stream 50% PGM & Gold |
|
| $ | 7.6 |
|
| $ | 6.0 |
|
| $ | 18.7 |
|
| $ | 10.6 |
|
Detour Lake |
| NSR 2% |
|
|
| 3.9 |
|
|
| 3.8 |
|
|
| 8.0 |
|
|
| 7.9 |
|
Golden Highway |
| NSR 2-10% |
|
|
| 0.9 |
|
|
| 1.9 |
|
|
| 3.0 |
|
|
| 4.3 |
|
Hemlo |
| NSR 3%, NPI 50% |
|
|
| 3.5 |
|
|
| 2.5 |
|
|
| 9.7 |
|
|
| 5.1 |
|
Brucejack |
| NSR 1.2% |
|
|
| 1.2 |
|
|
| — |
|
|
| 2.4 |
|
|
| — |
|
Musselwhite |
| NPI 5% |
|
|
| 0.1 |
|
|
| (0.3) |
|
|
| (4.0) |
|
|
| 0.7 |
|
Kirkland Lake |
| NSR 1.5-5.5%, NPI 20% |
|
|
| 1.1 |
|
|
| 1.2 |
|
|
| 2.4 |
|
|
| 2.3 |
|
Timmins West |
| NSR 2.25% |
|
|
| 0.7 |
|
|
| 0.7 |
|
|
| 1.3 |
|
|
| 1.3 |
|
Canadian Malartic |
| GR 1.5% |
|
|
| 0.5 |
|
|
| 0.7 |
|
|
| 1.0 |
|
|
| 1.3 |
|
Other |
|
|
|
|
| 4.4 |
|
|
| 1.2 |
|
|
| 9.4 |
|
|
| 2.9 |
|
Rest of World |
|
|
|
|
|
|
|
|
|
|
|
|
|
|
|
|
|
|
|
MWS |
| Stream 25% |
|
| $ | 9.3 |
|
| $ | 8.4 |
|
| $ | 16.2 |
|
| $ | 17.4 |
|
Sabodala |
| Stream 6%, Fixed to 2019 |
|
|
| 7.3 |
|
|
| 7.3 |
|
|
| 14.7 |
|
|
| 14.8 |
|
Karma |
| Stream 4.875%, Fixed to 80,625 oz |
|
|
| 5.1 |
|
|
| 5.7 |
|
|
| 10.9 |
|
|
| 11.6 |
|
Tasiast |
| NSR 2% |
|
|
| 2.5 |
|
|
| 1.3 |
|
|
| 5.2 |
|
|
| 2.9 |
|
Subika |
| NSR 2% |
|
|
| 4.1 |
|
|
| 2.2 |
|
|
| 7.5 |
|
|
| 4.3 |
|
Duketon |
| NSR 2% |
|
|
| 1.5 |
|
|
| 1.5 |
|
|
| 3.9 |
|
|
| 3.6 |
|
Edikan |
| NSR 1.5% |
|
|
| 0.8 |
|
|
| 1.2 |
|
|
| 1.6 |
|
|
| 2.3 |
|
Other |
|
|
|
|
| 3.3 |
|
|
| 3.3 |
|
|
| 7.0 |
|
|
| 7.6 |
|
|
|
|
|
| $ | 142.9 |
|
| $ | 138.6 |
|
| $ | 301.9 |
|
| $ | 292.7 |
|
ENERGY |
|
|
|
|
|
|
|
|
|
|
|
|
|
|
|
|
|
|
|
United States |
|
|
|
|
|
|
|
|
|
|
|
|
|
|
|
|
|
|
|
SCOOP/STACK - Continental |
| Royalty Acquisition Venture |
|
|
| 5.0 |
|
|
| — |
|
|
| 7.8 |
|
|
| — |
|
SCOOP/STACK - Other |
| Various Royalty Rates |
|
|
| 1.9 |
|
|
| 3.3 |
|
|
| 4.6 |
|
|
| 5.5 |
|
Permian Basin |
| Various Royalty Rates |
|
|
| 4.9 |
|
|
| 6.2 |
|
|
| 9.4 |
|
|
| 9.9 |
|
Canada |
|
|
|
|
|
|
|
|
|
|
|
|
|
|
|
|
|
|
|
Weyburn |
| NRI 11.71%, ORR 0.44%, WI 2.56% |
|
| $ | 10.5 |
|
| $ | 10.2 |
|
| $ | 17.8 |
|
| $ | 20.3 |
|
Orion |
| GORR 4% |
|
|
| 3.2 |
|
|
| 0.9 |
|
|
| 4.9 |
|
|
| 1.7 |
|
Other |
|
|
|
|
| 2.1 |
|
|
| 2.1 |
|
|
| 3.9 |
|
|
| 4.3 |
|
|
|
|
|
| $ | 27.6 |
|
| $ | 22.7 |
|
| $ | 48.4 |
|
| $ | 41.7 |
|
Revenue |
|
|
|
| $ | 170.5 |
|
| $ | 161.3 |
|
| $ | 350.3 |
|
| $ | 334.4 |
|
|
|
2019 Second Quarter Management’s Discussion and Analysis | 9 |
Review of Quarterly Financial Performance
The prices of precious metals, oil and gas and production from Mining and Energy assets are the largest factors in determining profitability and cash flow from operations for Franco-Nevada. The following table summarizes average commodity prices and average exchange rates during the periods presented.
|
|
|
|
|
|
|
|
|
|
|
|
|
|
|
|
|
|
|
|
|
|
|
|
|
|
|
|
|
|
|
| QOQ |
| YOY | |||||
Quarterly average prices and rates |
|
|
|
| Q2/2019 |
|
| Q1/2019 |
| Q2/2018 |
| (Q2/2019-Q1/2019) |
| (Q2/2019-Q2/2018) | |||||
Gold(1) |
| ($/oz) |
|
| $ | 1,310 |
|
| $ | 1,304 |
| $ | 1,306 |
| 0.5 | % |
| 0.3 | % |
Silver(2) |
| ($/oz) |
|
|
| 14.89 |
|
|
| 15.57 |
|
| 16.57 |
| (4.4) | % |
| (10.1) | % |
Platinum(3) |
| ($/oz) |
|
|
| 842 |
|
|
| 823 |
|
| 904 |
| 2.3 | % |
| (6.8) | % |
Palladium(3) |
| ($/oz) |
|
|
| 1,388 |
|
|
| 1,435 |
|
| 979 |
| (3.3) | % |
| 41.8 | % |
|
|
|
|
|
|
|
|
|
|
|
|
|
|
|
|
|
|
|
|
Edmonton Light |
| (C$/bbl) |
|
|
| 72.48 |
|
|
| 67.52 |
|
| 78.41 |
| 7.3 | % |
| (7.6) | % |
West Texas Intermediate |
| ($/bbl) |
|
|
| 59.73 |
|
|
| 54.91 |
|
| 67.88 |
| 8.8 | % |
| (12.0) | % |
|
|
|
|
|
|
|
|
|
|
|
|
|
|
|
|
|
|
|
|
CAD/USD exchange rate(4) |
|
|
|
|
| 0.7476 |
|
|
| 0.7522 |
|
| 0.7747 |
| (0.6) | % |
| (3.5) | % |
1 | Based on LBMA Gold Price PM Fix. |
2 | Based on LBMA Silver Price. |
3 | Based on London PM Fix. |
4 | Based on Bank of Canada daily average rates. |
Revenue
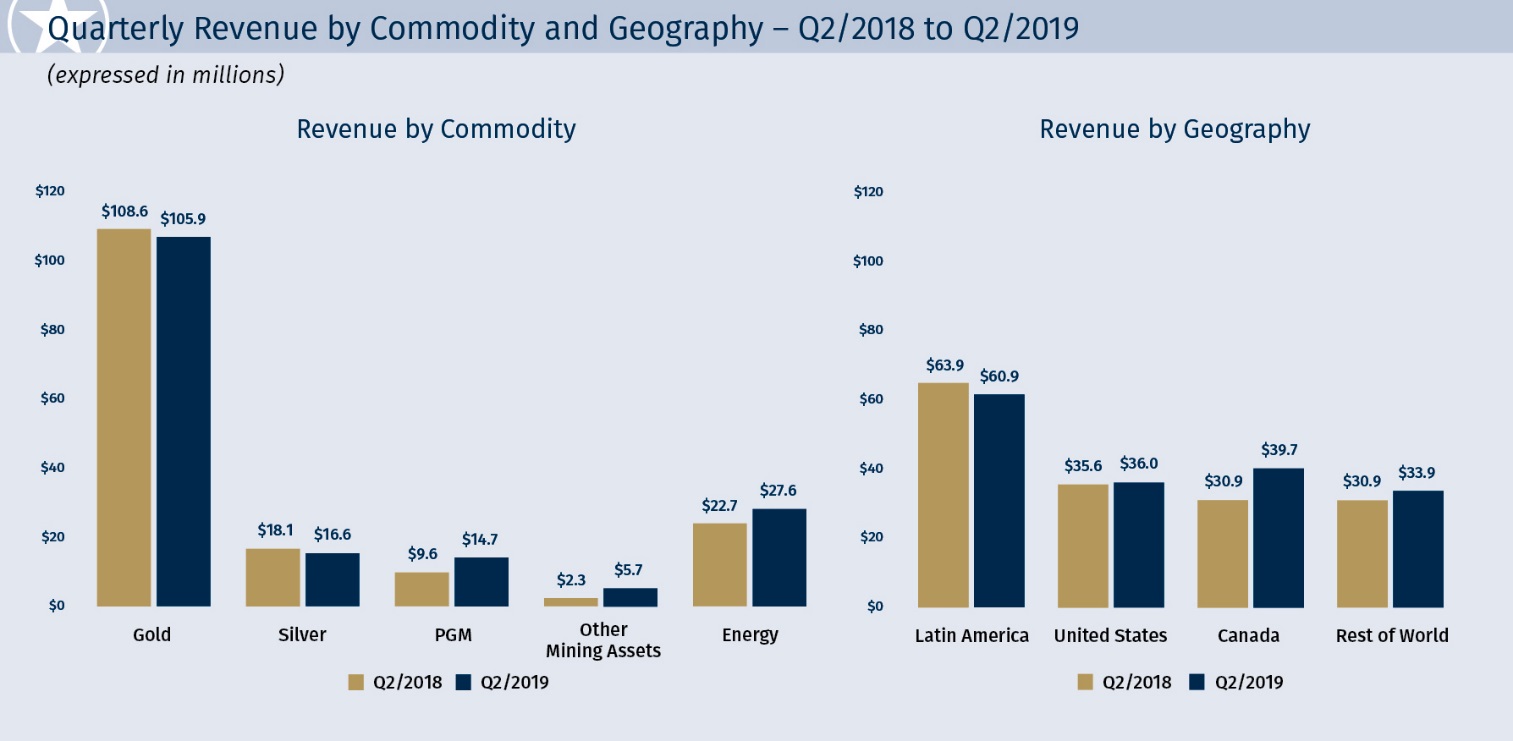
Revenue and GEO production attributable to Franco-Nevada by commodity, geographical location and type of interest for the three months ended June 30, 2019 and 2018 is as follows:
|
|
|
|
|
|
|
|
|
|
|
|
|
|
|
|
|
|
|
|
|
|
|
| Gold Equivalent Ounces(1) |
|
| Revenue (in millions) |
| |||||||||||||
For the three months ended June 30, |
|
| 2019 |
|
| 2018 |
| Variance |
|
| 2019 |
|
| 2018 |
| Variance |
| |||
Commodity |
|
|
|
|
|
|
|
|
|
|
|
|
|
|
|
|
|
|
|
|
Gold |
|
| 80,606 |
|
| 83,870 |
| (3,264) |
|
| $ | 105.9 |
|
| $ | 108.6 |
| $ | (2.7) |
|
Silver |
|
| 12,278 |
|
| 14,147 |
| (1,869) |
|
|
| 16.6 |
|
|
| 18.1 |
|
| (1.5) |
|
PGM |
|
| 10,540 |
|
| 7,546 |
| 2,994 |
|
|
| 14.7 |
|
|
| 9.6 |
|
| 5.1 |
|
Other mining assets |
|
| 4,350 |
|
| 1,770 |
| 2,580 |
|
|
| 5.7 |
|
|
| 2.3 |
|
| 3.4 |
|
Mining |
|
| 107,774 |
|
| 107,333 |
| 441 |
|
| $ | 142.9 |
|
| $ | 138.6 |
| $ | 4.3 |
|
Energy |
|
| - |
|
| - |
| - |
|
|
| 27.6 |
|
|
| 22.7 |
|
| 4.9 |
|
|
|
| 107,774 |
|
| 107,333 |
| 441 |
|
| $ | 170.5 |
|
| $ | 161.3 |
| $ | 9.2 |
|
Geography |
|
|
|
|
|
|
|
|
|
|
|
|
|
|
|
|
|
|
|
|
Latin America |
|
| 46,104 |
|
| 49,606 |
| (3,502) |
|
| $ | 60.9 |
|
| $ | 63.9 |
| $ | (3.0) |
|
United States |
|
| 18,642 |
|
| 20,077 |
| (1,435) |
|
|
| 36.0 |
|
|
| 35.6 |
|
| 0.4 |
|
Canada |
|
| 17,479 |
|
| 13,788 |
| 3,691 |
|
|
| 39.7 |
|
|
| 30.9 |
|
| 8.8 |
|
Rest of World |
|
| 25,549 |
|
| 23,862 |
| 1,687 |
|
|
| 33.9 |
|
|
| 30.9 |
|
| 3.0 |
|
|
|
| 107,774 |
|
| 107,333 |
| 441 |
|
| $ | 170.5 |
|
| $ | 161.3 |
| $ | 9.2 |
|
Type |
|
|
|
|
|
|
|
|
|
|
|
|
|
|
|
|
|
|
|
|
Revenue-based royalties |
|
| 30,471 |
|
| 29,603 |
| 868 |
|
| $ | 56.4 |
|
| $ | 50.5 |
| $ | 5.9 |
|
Streams |
|
| 65,742 |
|
| 70,623 |
| (4,881) |
|
|
| 88.1 |
|
|
| 90.7 |
|
| (2.6) |
|
Profit-based royalties |
|
| 7,885 |
|
| 3,867 |
| 4,018 |
|
|
| 17.3 |
|
|
| 11.9 |
|
| 5.4 |
|
Other |
|
| 3,676 |
|
| 3,240 |
| 436 |
|
|
| 8.7 |
|
|
| 8.2 |
|
| 0.5 |
|
|
|
| 107,774 |
|
| 107,333 |
| 441 |
|
| $ | 170.5 |
|
| $ | 161.3 |
| $ | 9.2 |
|
1 | Refer to Note 1 at the bottom of page 5 of this MD&A for the methodology for calculating GEOs and, for illustrative purposes, to the average commodity price table above for indicative prices which may be used in the calculations of GEOs. |
|
|
2019 Second Quarter Management’s Discussion and Analysis | 10 |
Revenue for Q2/2019 was $170.5 million, up 5.7% from Q2/2018, and comprised $142.9 million from Mining assets, and $27.6 million from Energy assets. Mining revenue increased 3.1% year-over-year, primarily due to higher average realized prices. Energy revenue increased 21.6% compared to the same period in 2018, mainly due to revenue earned from the Royalty Acquisition Venture with Continental.
Mining assets contributed 83.8% of the Company’s total revenue in Q2/2019, compared to 85.9% in Q2/2018. Geographically, the Company remains heavily invested in the Americas, with 80.1% of revenue in Q2/2019, compared to 80.9% in Q2/2018.
GEO Production
|
|
2019 Second Quarter Management’s Discussion and Analysis | 11 |
GEOs produced in Q2/2019 totaled 107,774 ounces, compared to 107,333 GEOs in Q2/2018. The year-over-year increase was primarily due to the following assets:
· | Candelaria –16,088 GEOs were earned from the Company’s Candelaria stream, an increase of 11.2% from 14,472 GEOs earned in Q2/2018, as the mine resumes normal operations following the pitwall slide that occurred in late 2017. |
· | Stillwater – 6,491 GEOs were earned from Stillwater, up 66.4% compared to 3,902 GEOs earned in the same period in 2018. Royalties from Stillwater benefited from both an increase in volumes as the Blitz project continues to ramp-up and higher palladium prices resulting in a higher conversion to GEOs. |
· | Goldstrike – 5,665 GEOs were earned from the Goldstrike NPI, more than double the 2,616 GEOs earned in Q2/2018. |
The above increases were partly offset by the following:
· | Guadalupe – 6,189 GEOs were earned from the Guadalupe stream, down 37.1% from 9,833 GEOs in Q2/2018. The year-over-year decrease was expected as the operator is mining a larger portion outside Franco-Nevada’s stream grounds. |
· | Bald Mountain – 1,005 GEOs were earned, down 78.9% from 4,768 GEOs in Q2/2018, as mining transitions away from Franco-Nevada’s royalty grounds. 2018 was also a particularly strong year of production for the mine compared to 2019. |
Energy Revenue
Energy assets earned revenue of $27.6 million (90% oil and 10% gas) for the quarter, an increase of 21.6% compared to $22.7 million (96% oil and 4% gas) in Q2/2018. U.S. assets represented 42.8% of Franco-Nevada’s Energy revenue. The year-over-year increase in Energy revenue was primarily due to the following assets:
· | SCOOP/STACK - Continental – Revenue from the SCOOP/STACK Continental royalties contributed an incremental $5.0 million in Q2/2019, for which there is no comparative in the same period in 2018. |
· | Weyburn – Revenue from the Weyburn Unit during the quarter was $10.5 million, compared to $10.2 million in Q2/2018, and comprised the following: $7.1 million earned from the NRI (Q2/2018 - $6.7 million), $2.9 million earned from the WI (Q2/2018 - $3.0 million) and $0.5 million earned from the ORRs (Q2/2018 - $0.5 million). Operating costs and capital costs decreased by 7.6% and 30.9%, respectively, in Q2/2019 compared to Q2/2018. However, these benefits were offset by lower realized prices. The actual realized price from the NRI decreased 3.8% in Q2/2019, at C$70.74/boe, compared to C$73.56/boe for Q2/2018. |
· | Orion – Orion contributed $3.2 million in revenue in Q2/2019 (Q2/2018 - $0.9 million), reflecting expansions to production capacity and improved differentials. |
The above increases were partly offset by the following:
· | SCOOP/STACK - Other – Revenue from the SCOOP/STACK, decreased from $3.3 million in Q2/2018 to $1.9 million in Q2/2019, due to lower realized prices and fewer new wells being drilled on Franco-Nevada’s acreage. |
· | Permian Basin – Revenue from the Permian Basin, particularly Delaware, decreased from $6.2 million in Q2/2018 to $4.9 million in Q2/2019, due to lower realized prices and constrained pipeline capacity for natural gas. |
Costs of Sales
|
|
2019 Second Quarter Management’s Discussion and Analysis | 12 |
The following table provides a breakdown of costs of sales incurred in the periods presented:
|
|
|
|
|
|
|
|
|
|
|
|
|
|
|
| For the three months ended June 30, |
| ||||||||
(expressed in millions) |
|
| 2019 |
|
| 2018 |
| Variance |
| |||
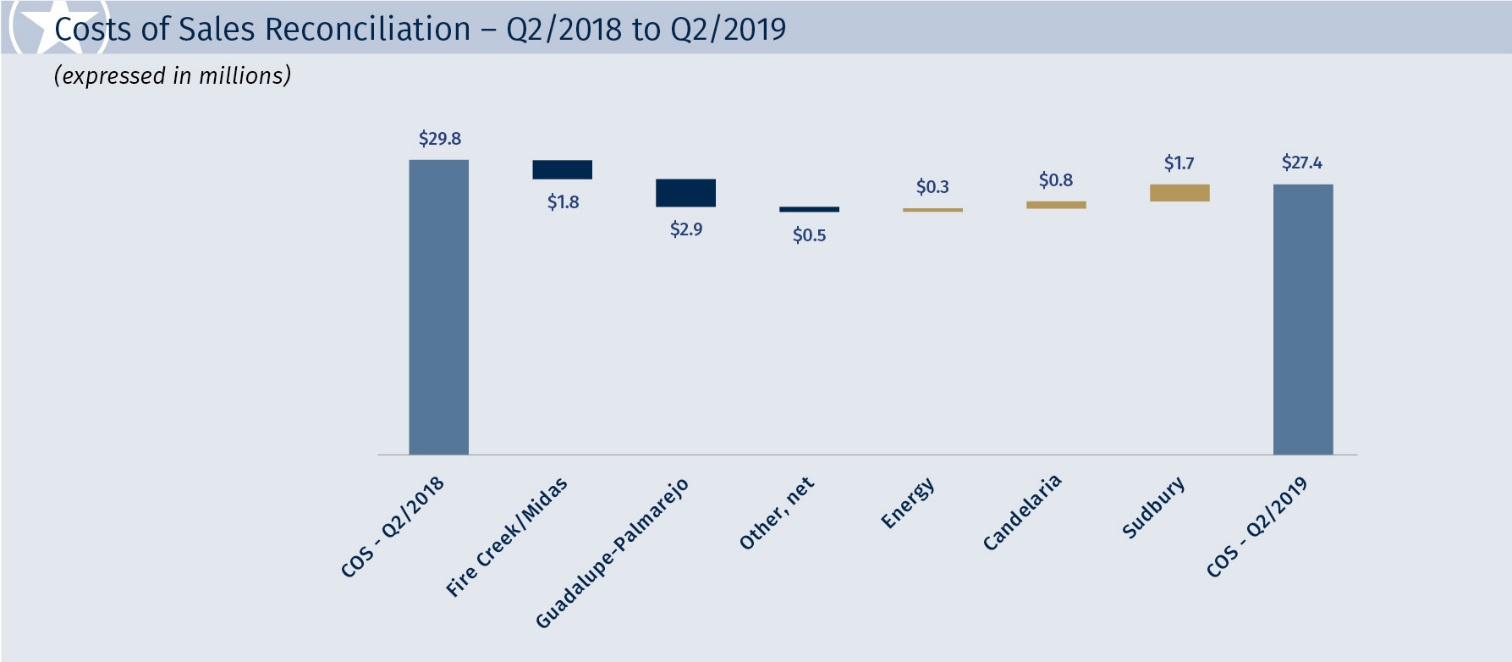
Costs of stream sales |
|
| $ | 25.0 |
|
| $ | 25.7 |
| $ | (0.7) |
|
Costs of prepaid ounces |
|
|
| — |
|
|
| 1.8 |
|
| (1.8) |
|
Mineral production taxes |
|
|
| 0.6 |
|
|
| 0.8 |
|
| (0.2) |
|
Mining operating costs |
|
| $ | 25.6 |
|
| $ | 28.3 |
| $ | (2.7) |
|
Energy operating costs |
|
|
| 1.8 |
|
|
| 1.5 |
|
| 0.3 |
|
|
|
| $ | 27.4 |
|
| $ | 29.8 |
| $ | (2.4) |
|
Costs of stream sales decreased 2.7% year-over-year, reflecting a 6.9% decrease in stream GEOs, from 65,742 GEOs in Q2/2019 compared to 70,623 GEOs in Q2/2018. Lower deliveries from Guadalupe, Antapaccay and Antamina streams were expected based on life of mine plans. Offsetting this decrease in costs of sales is a higher cost per ounce for GEOs from the McCreedy West stream, which carry a higher cash payment per ounce relative to other streams.
Costs of prepaid ounces was nil in Q2/2019, as Fire Creek/Midas met its fixed delivery requirements in 2018.
|
Depletion and Depreciation
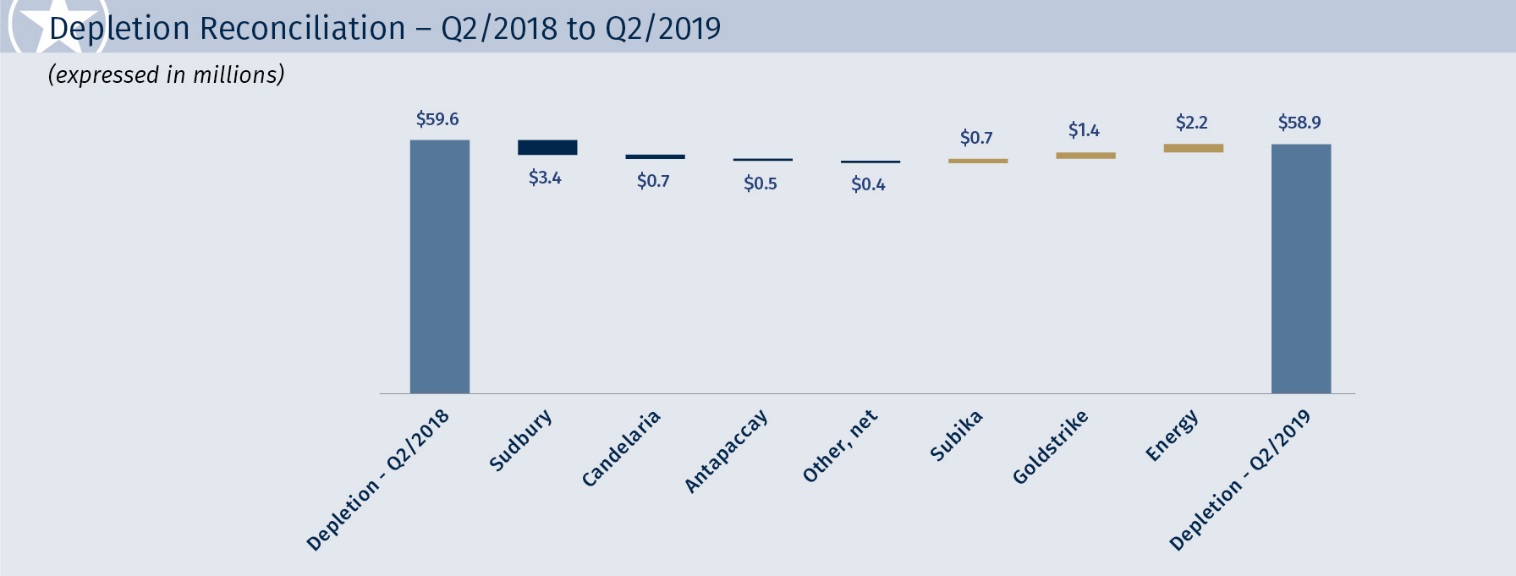
Depletion and depreciation expense totaled $58.9 million in Q2/2019, relatively stable compared to $59.6 million in Q2/2018.
Income Taxes
Income tax expense for the quarter was $13.7 million in Q2/2019 (Q2/2018 - $11.1 million), comprised of a current income tax expense of $11.7 million (Q2/2018 - $5.4 million) and a deferred income tax expense of $2.0 million (Q2/2018 - $5.7 million). The increase in total tax expense was due to higher income earned in Q2/2019.
Net Income
Net income for Q2/2019 was $64.0 million, or $0.34 per share, compared to net income of $53.6 million, or $0.29 per share, for the same period in 2018. Adjusted Net Income, which adjusts for foreign exchange gains and losses and other income and expenses, among other items, was $64.0 million, or $0.34 per share, compared to $53.7 million, or $0.29 per share, earned in Q2/2018.
|
|
2019 Second Quarter Management’s Discussion and Analysis | 13 |
Review of Year-to-Date Financial Performance
The prices of precious metals, oil and gas and the actual production from Mining and Energy assets are the largest factors in determining profitability and cash flow from operations for Franco-Nevada. The following table summarizes average commodity prices and average exchange rates during the periods presented.
|
|
|
|
|
|
|
|
|
|
|
|
|
|
Year-to-date average prices and rates |
|
|
|
| H1/2019 |
|
| H1/2018 |
| Variance |
| ||
Gold(1) |
| ($/oz) |
|
| $ | 1,307 |
|
| $ | 1,318 |
| (0.8) | % |
Silver(2) |
| ($/oz) |
|
|
| 15.23 |
|
|
| 16.65 |
| (8.5) | % |
Platinum(3) |
| ($/oz) |
|
|
| 833 |
|
|
| 941 |
| (11.5) | % |
Palladium(3) |
| ($/oz) |
|
|
| 1,435 |
|
|
| 1,008 |
| 42.4 | % |
|
|
|
|
|
|
|
|
|
|
|
|
|
|
Edmonton Light |
| (C$/bbl) |
|
|
| 70.00 |
|
|
| 75.43 |
| (7.2) | % |
West Texas Intermediate |
| ($/bbl) |
|
|
| 57.32 |
|
|
| 65.38 |
| (12.3) | % |
|
|
|
|
|
|
|
|
|
|
|
|
|
|
CAD/USD exchange rate(4) |
|
|
|
|
| 0.7499 |
|
|
| 0.7828 |
| (4.2) | % |
1 | Based on LBMA Gold Price PM Fix. |
2 | Based on LBMA Silver Price. |
3 | Based on London PM Fix. |
4 | Based on Bank of Canada noon and daily average rates. |
Revenue
Revenue and GEO production attributable to Franco-Nevada by commodity, geographical location and type of interest for the six months ended June 30, 2019 and 2018 by commodity, geographical location is as follows:
|
|
|
|
|
|
|
|
|
|
|
|
|
|
|
|
|
|
|
|
|
|
|
| Gold Equivalent Ounces(1) |
|
| Revenue (in millions) |
| |||||||||||||
For the six months ended June 30, |
|
| 2019 |
|
| 2018 |
| Variance |
|
| 2019 |
|
| 2018 |
| Variance |
| |||
Commodity |
|
|
|
|
|
|
|
|
|
|
|
|
|
|
|
|
|
|
|
|
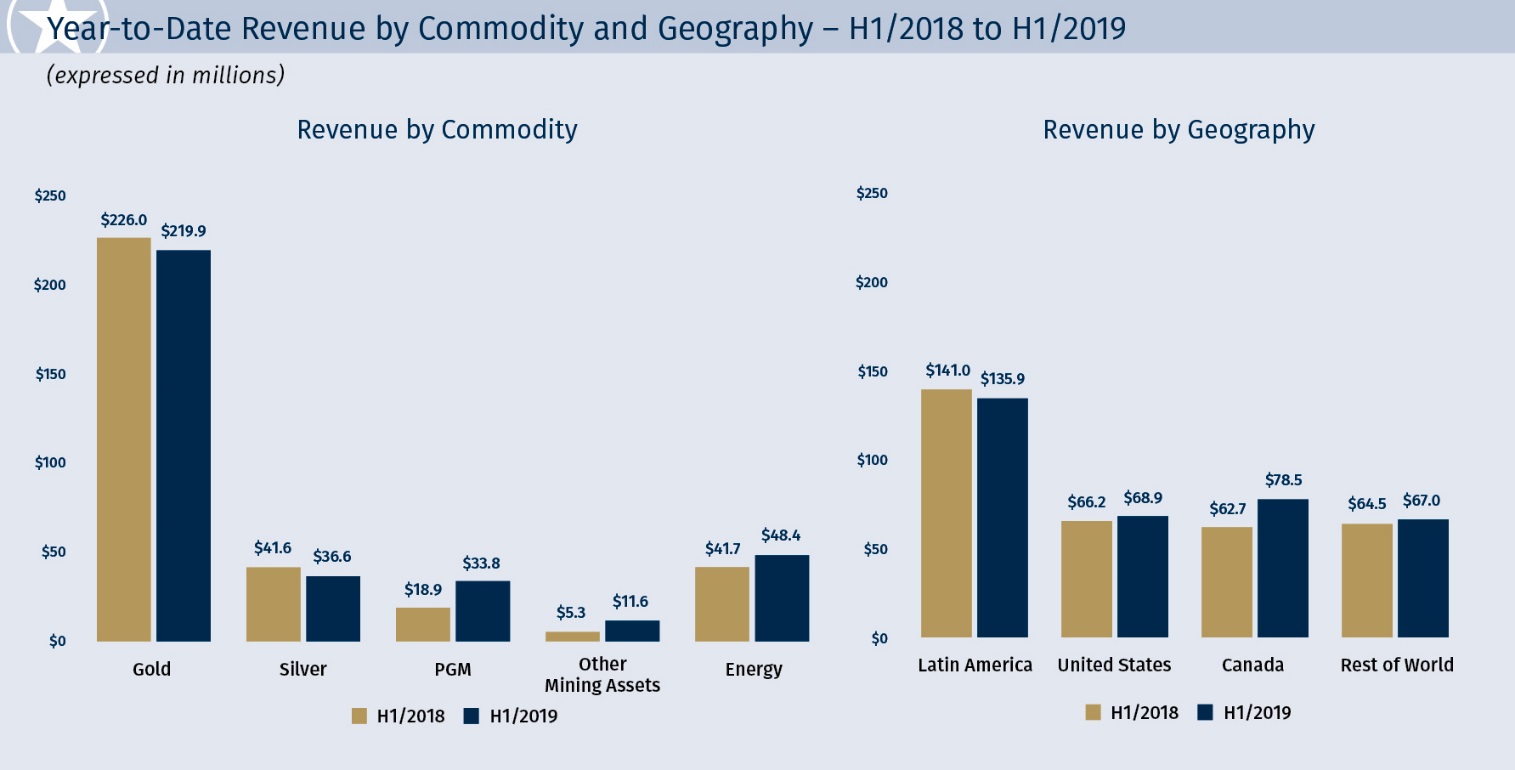
Gold |
|
| 168,184 |
|
| 172,664 |
| (4,480) |
|
| $ | 219.9 |
|
| $ | 226.9 |
| $ | (7.0) |
|
Silver |
|
| 27,576 |
|
| 31,819 |
| (4,243) |
|
|
| 36.6 |
|
|
| 41.6 |
|
| (5.0) |
|
PGM |
|
| 25,169 |
|
| 14,481 |
| 10,688 |
|
|
| 33.8 |
|
|
| 18.9 |
|
| 14.9 |
|
Other mining assets |
|
| 8,894 |
|
| 4,040 |
| 4,854 |
|
|
| 11.6 |
|
|
| 5.3 |
|
| 6.3 |
|
Mining |
|
| 229,823 |
|
| 223,004 |
| 6,819 |
|
| $ | 301.9 |
|
| $ | 292.7 |
| $ | 9.2 |
|
Energy |
|
| - |
|
| - |
| - |
|
|
| 48.4 |
|
|
| 41.7 |
|
| 6.7 |
|
|
|
| 229,823 |
|
| 223,004 |
| 6,819 |
|
| $ | 350.3 |
|
| $ | 334.4 |
| $ | 15.9 |
|
Geography |
|
|
|
|
|
|
|
|
|
|
|
|
|
|
|
|
|
|
|
|
Latin America |
|
| 103,650 |
|
| 107,460 |
| (3,810) |
|
| $ | 135.9 |
|
| $ | 141.0 |
| $ | (5.1) |
|
United States |
|
| 36,200 |
|
| 38,563 |
| (2,363) |
|
|
| 68.9 |
|
|
| 66.2 |
|
| 2.7 |
|
Canada |
|
| 39,060 |
|
| 27,837 |
| 11,223 |
|
|
| 78.5 |
|
|
| 62.7 |
|
| 15.8 |
|
Rest of World |
|
| 50,913 |
|
| 49,144 |
| 1,769 |
|
|
| 67.0 |
|
|
| 64.5 |
|
| 2.5 |
|
|
|
| 229,823 |
|
| 223,004 |
| 6,819 |
|
| $ | 350.3 |
|
| $ | 334.4 |
| $ | 15.9 |
|
Type |
|
|
|
|
|
|
|
|
|
|
|
|
|
|
|
|
|
|
|
|
Revenue-based royalties |
|
| 64,081 |
|
| 59,881 |
| 4,200 |
|
| $ | 112.8 |
|
| $ | 98.9 |
| $ | 13.9 |
|
Streams |
|
| 145,969 |
|
| 148,347 |
| (2,378) |
|
|
| 192.8 |
|
|
| 194.4 |
|
| (1.6) |
|
Profit-based royalties |
|
| 11,808 |
|
| 7,661 |
| 4,147 |
|
|
| 26.9 |
|
|
| 23.7 |
|
| 3.2 |
|
Other |
|
| 7,965 |
|
| 7,115 |
| 850 |
|
|
| 17.8 |
|
|
| 17.4 |
|
| 0.4 |
|
|
|
| 229,823 |
|
| 223,004 |
| 6,819 |
|
| $ | 350.3 |
|
| $ | 334.4 |
| $ | 15.9 |
|
1 | Refer to Note 1 at the bottom of page 5 of this MD&A for the methodology for calculating GEOs and, for illustrative purposes, to the average commodity price table above for indicative prices which may be used in the calculations of GEOs. |
|
|
2019 Second Quarter Management’s Discussion and Analysis | 14 |
Revenue in H1/2019 was $350.3 million, up 4.8% from H1/2018 due to an increase of 3.1% in GEOs and higher revenue from the Energy segment, primarily from the Royalty Acquisition Venture with Continental and Orion.
Mining revenue comprised 86.2% of total revenue in H1/2019, compared to 87.5% in H1/2018. We continue to earn the majority of our revenue from the Americas, at 80.9% compared to 80.7% in H1/2018.
GEO Production
GEOs produced in H1/2019 totaled 229,823 ounces, compared to 223,004 GEOs in H1/2018.
|
|
2019 Second Quarter Management’s Discussion and Analysis | 15 |
The year-over-year increase in GEOs was primarily due to the following assets:
· | Candelaria – 36,337 GEOs were earned from the Company’s Candelaria stream, an increase of 27.3% from 28,547 GEOs earned in H1/2018, as the mine resumes normal operations following the pitwall slide that occurred in late 2017. |
· | Sudbury – 13,500 GEOs were delivered from Sudbury, up 63.7% from the 8,245 GEOs received in H1/2018. The Sudbury assets comprise the McCreedy West and Levack-Morrison mines. Although the Levack-Morrison mine was placed on care and maintenance at the end of March, the impact for 2019 is expected to be offset by the production from McCreedy West which restarted operations in the second half of 2018. Sudbury also benefited from higher palladium prices, resulting in a higher conversion to GEOs. |
· | Stillwater – 13,593 GEOs were earned from Stillwater, up 62.7% compared to 8,355 GEOs earned in the same period in 2018. Royalties from Stillwater benefited from both an increase in volumes as the Blitz project continues to ramp-up and higher palladium prices. |
The above increases were partly offset by the following assets:
· | Antapaccay – 32,144 GEOs were earned from the Antapaccay stream, down 14.2% from 37,483 GEOs in H1/2018. The year-over-year decrease was expected as part of Antapaccay’s 2019 life of mine plan. Deliveries in H1/2019 were also impacted by shipment timing, with a large shipment being received just after the quarter-end. |
· | Antamina – 17,264 GEOs were earned from the Antamina stream, down 17.4% from 20,911 GEOs in H1/2018. Revenue was lower year-over-year as expected based on the 2019 life of mine plan, and was also impacted by lower silver prices compared to the 2018 period. |
· | Guadalupe – 14,992 GEOs were earned from the Guadalupe stream, down 24.0% from 19,739 GEOs in H1/2018. The year-over-year decrease was expected as the operator is mining a larger portion outside Franco-Nevada’s stream grounds. |
Energy Revenue
Revenue from the Company’s Energy assets contributed revenue of $48.4 million in H1/2019 (91% oil and 9% gas), an increase of 16.1% compared to $41.7 million in H1/2018 (96% oil and 4% gas). The Company’s U.S. Energy assets contributed 45.0% of the Company’s Energy revenue. The year-over-year increase in Energy revenue was primarily due to the following assets:
· | SCOOP/STACK - Continental – Assets in the Royalty Acquisition Venture with Continental contributed $7.8 million in revenue to Franco-Nevada, for which there is no comparative in the same period in 2018. |
· | Orion – Revenue more than doubled, with Orion generating $4.9 million in H1/2019 (H1/2018 – $1.7 million). Revenue was positively impacted by lower differentials for heavy oil prices compared to the 2018 period, as well as increased production due to expanded capacity. |
The above increases were partly offset by the following:
· | Weyburn – Revenue from the Weyburn Unit in H1/2019 decreased to $17.8 million (H1/2018 - $20.3 million) with $11.8 million earned from the NRI (H1/2018 - $13.5 million), $5.2 million earned from the WI (H1/2018 - $5.7 million) and $0.8 million earned from the ORRs (H1/2018 - $1.1 million). Decreased revenue was primarily a reflection of weaker oil prices during the year. The actual realized price from the NRI was 3.3% lower in H1/2019, at C$66.62/boe compared to C$68.88/boe in H1/2018. |
· | SCOOP/STACK - Other – Revenue from the SCOOP/STACK, decreased to $4.6 million (H1/2018 - $5.5 million), with fewer new wells being drilled in the current period than in 2018, as well as lower realized prices. |
|
|
2019 Second Quarter Management’s Discussion and Analysis | 16 |
Costs of Sales
The following table provides a breakdown of costs of sales incurred in the periods presented:
|
|
|
|
|
|
|
|
|
|
|
|
|
|
|
| For the six months ended June 30, |
| ||||||||
(expressed in millions) |
|
| 2019 |
|
| 2018 |
| Variance |
| |||
Costs of stream sales |
|
| $ | 55.4 |
|
| $ | 52.7 |
| $ | 2.7 |
|
Costs of prepaid ounces |
|
|
| — |
|
|
| 3.7 |
|
| (3.7) |
|
Mineral production taxes |
|
|
| 1.2 |
|
|
| 1.1 |
|
| 0.1 |
|
Mining operating costs |
|
| $ | 56.6 |
|
| $ | 57.5 |
| $ | (0.9) |
|
Energy operating costs |
|
|
| 3.2 |
|
|
| 2.5 |
|
| 0.7 |
|
|
|
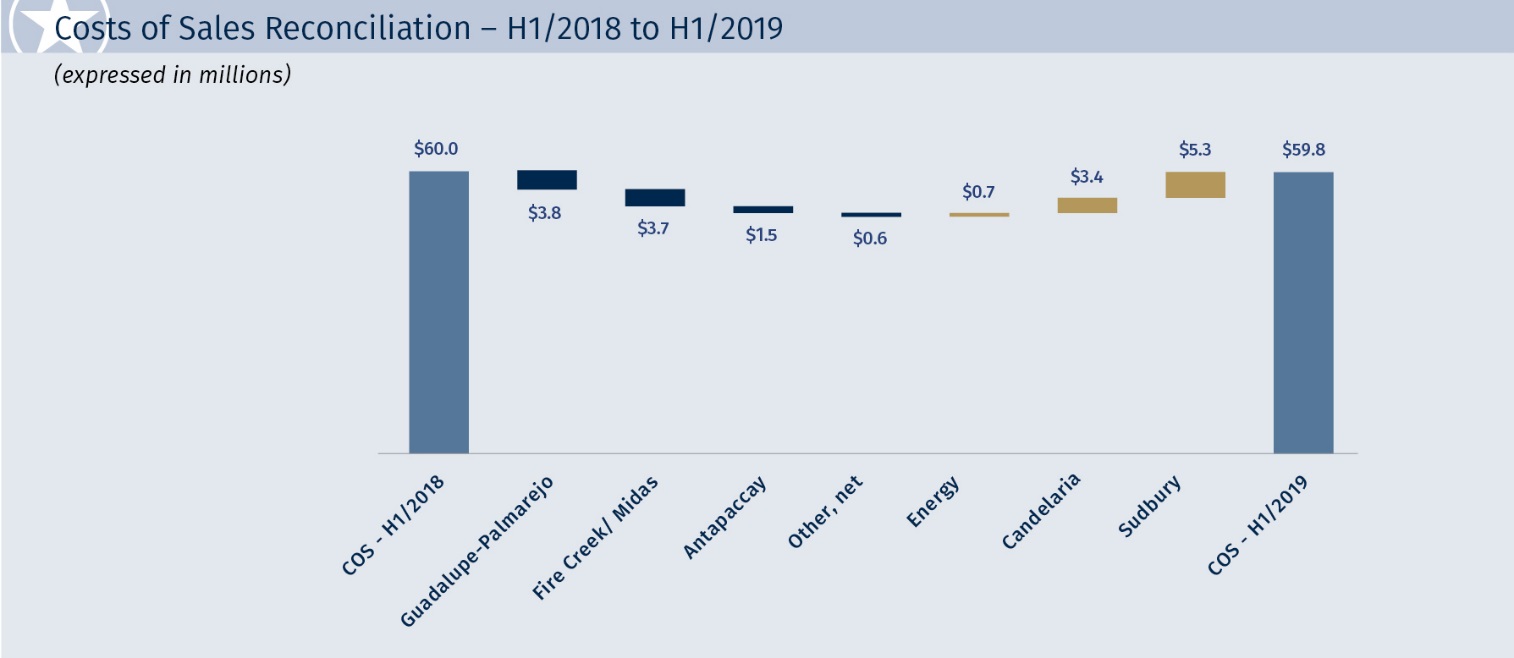
| $ | 59.8 |
|
| $ | 60.0 |
| $ | (0.2) |
|
Costs of stream ounces increased 5.1% relative to H1/2018. While stream GEOs decreased 1.6% year-over-year, costs of stream ounces increased due to the ounces from the McCreedy West stream, which carry a higher cash payment per ounce relative to other streams.
Costs of prepaid ounces was nil in H1/2019, as Fire Creek/Midas met its fixed delivery requirement in 2018.
Depletion and Depreciation
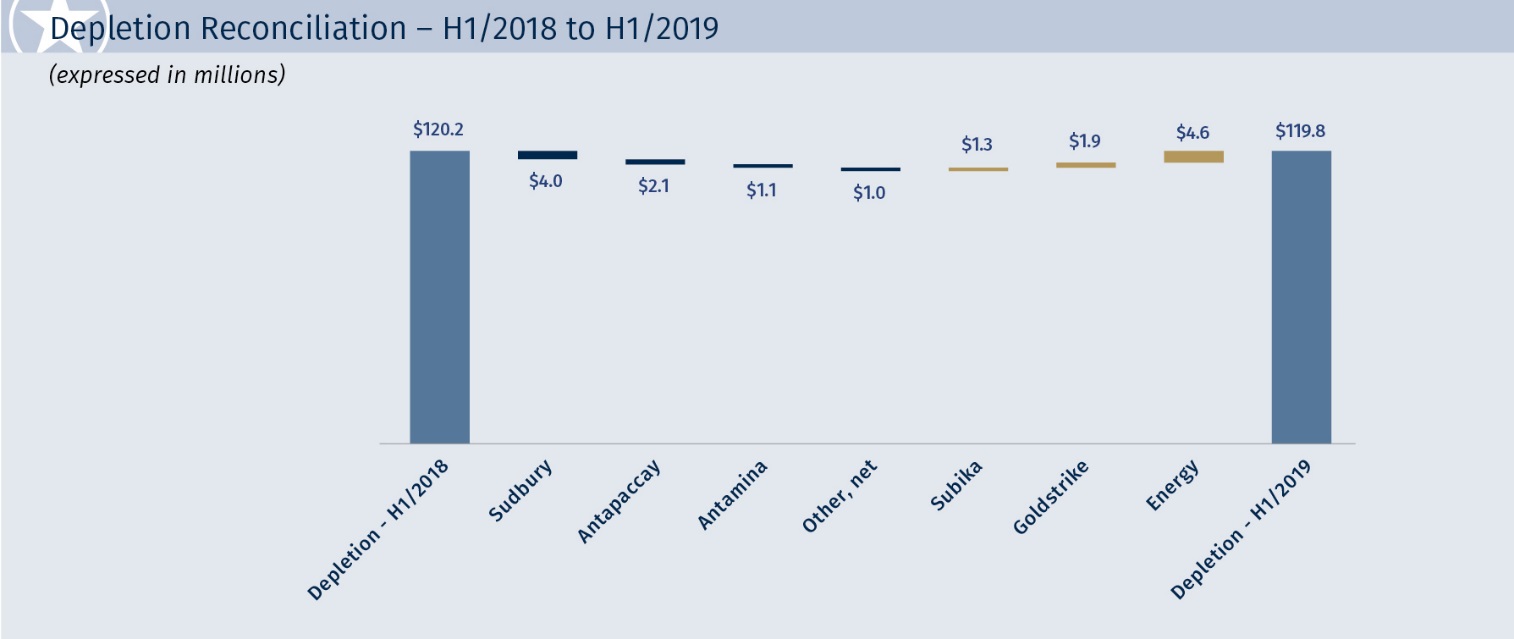
Depletion and depreciation expense totaled $119.8 million in H1/2019, relatively stable compared to $120.2 million in H1/2018.
|
|
2019 Second Quarter Management’s Discussion and Analysis | 17 |
Income Taxes
Income tax expense in H1/2019 totaled $26.7 million (H1/2018 –$24.6 million), comprised of a current income tax expense of $21.4 million (H1/2018 - $12.8 million) and a deferred income tax expense of $5.3 million (H1/2018 – $11.8 million). The increase in the total tax expense was in line with higher income earned in the current period.
Net Income
Net income in H1/2019 was $129.2 million, or $0.69 per share, compared to $118.2 million, or $0.64 per share, for the same period in 2018. Adjusted Net Income was $129.2 million, or $0.69 per share, compared to $117.6 million, or $0.63 per share, earned in H1/2018.
General and Administrative Expenses
The following table provides a breakdown of general and administrative expenses incurred for the periods presented:
|
|
|
|
|
|
|
|
|
|
|
|
|
|
|
|
|
|
|
|
|
|
|
|
|
|
| For the three months ended June 30, |
|
| For the six months ended June 30, |
| ||||||||||||||||
(expressed in millions) |
|
| 2019 |
|
| 2018 |
| Variance |
|
| 2019 |
|
| 2018 |
| Variance |
| ||||||
Salaries and benefits |
|
| $ | 1.5 |
|
| $ | 1.5 |
| $ | — |
|
| $ | 3.4 |
|
| $ | 3.1 |
| $ | 0.3 |
|
Professional fees |
|
|
| 0.9 |
|
|
| 1.4 |
|
| (0.5) |
|
|
| 1.4 |
|
|
| 2.0 |
|
| (0.6) |
|
Office costs |
|
|
| 0.1 |
|
|
| 0.2 |
|
| (0.1) |
|
|
| 0.2 |
|
|
| 0.4 |
|
| (0.2) |
|
Board of Directors' costs |
|
|
| 1.3 |
|
|
| 0.8 |
|
| 0.5 |
|
|
| 2.1 |
|
|
| 0.2 |
|
| 1.9 |
|
Share-based compensation |
|
|
| 1.2 |
|
|
| 1.4 |
|
| (0.2) |
|
|
| 2.6 |
|
|
| 2.6 |
|
| — |
|
Other |
|
|
| 0.6 |
|
|
| 1.7 |
|
| (1.1) |
|
|
| 2.8 |
|
|
| 3.9 |
|
| (1.1) |
|
|
|
| $ | 5.6 |
|
| $ | 7.0 |
| $ | (1.4) |
|
| $ | 12.5 |
|
| $ | 12.2 |
| $ | 0.3 |
|
General and administrative expenses represented 3.3% of revenue for Q2/2019 (Q2/2018 – 4.3%) and 3.6% of revenue in H1/2019 (H1/2018 – 3.6%). General and administrative expenses, which include business development costs, vary depending upon the level of business development related activity and the timing of completing transactions.
Board of Directors’ fees vary according to the mark-to-market of the value of deferred share units (“DSUs”) that are granted to the directors of the Company. The Company’s share price increased to a greater extent in the first half of 2019 compared to 2018, resulting in an increase in the DSU liability and the recognition of a mark-to-market expense.
|
|
2019 Second Quarter Management’s Discussion and Analysis | 18 |
Foreign Exchange and Other Income/Expenses
The following table provides a list of foreign exchange and other income/expenses incurred for the periods presented:
|
|
|
|
|
|
|
|
|
|
|
|
|
|
|
|
|
|
|
|
|
|
|
|
|
|
| For the three months ended June 30, |
|
| For the six months ended June 30, |
| ||||||||||||||||
(expressed in millions) |
|
| 2019 |
|
| 2018 |
| Variance |
|
| 2019 |
|
| 2018 |
| Variance |
| ||||||
Foreign exchange gain (loss) |
|
| $ | (0.1) |
|
| $ | (0.3) |
| $ | 0.2 |
|
| $ | (0.1) |
|
| $ | 0.2 |
| $ | (0.3) |
|
Other income |
|
|
| 0.1 |
|
|
| 0.2 |
|
| (0.1) |
|
|
| 0.1 |
|
|
| 0.3 |
|
| (0.2) |
|
|
|
| $ | — |
|
| $ | (0.1) |
| $ | 0.1 |
|
| $ | — |
|
| $ | 0.5 |
| $ | (0.5) |
|
Under IFRS, all foreign exchange gains or losses related to monetary assets and liabilities held in a currency other than the functional currency are recorded in net income as opposed to other comprehensive income. The parent company’s functional currency is the Canadian dollar, while the functional currency of certain of the Company’s subsidiaries is the U.S. dollar.
Other income includes dividend income on certain of the Company’s equity investments.
Finance Income and Finance Expenses
The following table provides a breakdown of finance income and expenses incurred for the periods presented:
|
|
|
|
|
|
|
|
|
|
|
|
|
|
|
|
|
|
|
|
|
|
|
|
|
|
| For the three months ended June 30, |
|
| For the six months ended June 30, |
| ||||||||||||||||
(expressed in millions) |
|
| 2019 |
|
| 2018 |
| Variance |
|
| 2019 |
|
| 2018 |
| Variance |
| ||||||
Finance income |
|
|
|
|
|
|
|
|
|
|
|
|
|
|
|
|
|
|
|
|
|
|
|
Interest |
|
| $ | 1.2 |
|
| $ | 0.7 |
| $ | 0.5 |
|
| $ | 1.9 |
|
| $ | 1.7 |
| $ | 0.2 |
|
|
|
| $ | 1.2 |
|
| $ | 0.7 |
| $ | 0.5 |
|
| $ | 1.9 |
|
| $ | 1.7 |
| $ | 0.2 |
|
Finance expenses |
|
|
|
|
|
|
|
|
|
|
|
|
|
|
|
|
|
|
|
|
|
|
|
Interest |
|
| $ | 1.7 |
|
|
| — |
|
| 1.7 |
|
| $ | 3.6 |
|
|
| — |
|
| 3.6 |
|
Standby charges |
|
|
| 0.6 |
|
| $ | 0.5 |
| $ | 0.1 |
|
|
| 0.9 |
|
| $ | 1.2 |
| $ | (0.3) |
|
Amortization of debt issue costs |
|
|
| 0.2 |
|
|
| 0.3 |
|
| (0.1) |
|
|
| 0.4 |
|
|
| 0.5 |
|
| (0.1) |
|
Accretion of lease liabilities |
|
|
| — |
|
|
| — |
|
| — |
|
|
| 0.1 |
|
|
| — |
|
| 0.1 |
|
|
|
| $ | 2.5 |
|
| $ | 0.8 |
| $ | 1.7 |
|
| $ | 5.0 |
|
| $ | 1.7 |
| $ | 3.3 |
|
Finance income is earned on our cash and cash equivalents. Finance income also includes interest income in the amount of $0.6 million accrued on the Noront Resources Ltd. loan during Q2/2019 (Q2/2018 – $0.5 million), and $1.1 million in H1/2019 (H1/2018 - $1.1 million). Finance expenses consist of the costs of interest expense incurred on our Corporate Revolver and Corporate Term Loan. The Company also incurs standby charges, which represent the costs of maintaining our credit facilities based on the undrawn amounts, and recognizes the amortization of costs incurred with respect to the initial set-up or subsequent amendments of our credit facilities. Finance expenses also includes the accretion expense of liabilities related to capital leases, as required under IFRS 16 Leases, effective January 1, 2019.
|
|
2019 Second Quarter Management’s Discussion and Analysis | 19 |
Summary of Quarterly Information
Selected quarterly financial and statistical information for the most recent eight quarters(1) is set out below:
|
|
|
|
|
|
|
|
|
|
|
|
|
|
|
|
|
|
|
|
|
|
|
|
|
|
|
|
|
|
|
|
|
(in millions, except Average Gold Price, Margin, |
| Q2 |
|
| Q1 |
|
| Q4 |
|
|
| Q3 |
|
|
| Q2 |
|
|
| Q1 |
|
|
| Q4 |
|
|
| Q3 |
| |||
GEOs, per GEO amounts and per share amounts) |
| 2019 |
|
| 2019 |
|
| 2018 |
|
|
| 2018 |
|
|
| 2018 |
|
|
| 2018 |
|
|
| 2017 |
|
|
| 2017 |
| |||
Revenue |
| $ | 170.5 |
|
| $ | 179.8 |
|
| $ | 148.2 |
|
| $ | 170.6 |
|
| $ | 161.3 |
|
| $ | 173.1 |
|
| $ | 167.2 |
|
| $ | 171.5 |
|
Costs and expenses(2) |
|
| 91.5 |
|
|
| 99.8 |
|
|
| 167.5 |
|
|
| 104.8 |
|
|
| 96.4 |
|
|
| 95.7 |
|
|
| 106.0 |
|
|
| 108.5 |
|
Operating income (loss) |
|
| 79.0 |
|
|
| 80.0 |
|
|
| (19.3) |
|
|
| 65.8 |
|
|
| 64.9 |
|
|
| 77.4 |
|
|
| 61.2 |
|
|
| 63.0 |
|
Other income (expenses) |
|
| (1.3) |
|
|
| (1.8) |
|
|
| (0.3) |
|
|
| 0.1 |
|
|
| (0.2) |
|
|
| 0.7 |
|
|
| (0.8) |
|
|
| (0.1) |
|
Income tax expense |
|
| 13.7 |
|
|
| 13.0 |
|
|
| 11.7 |
|
|
| 13.8 |
|
|
| 11.1 |
|
|
| 13.5 |
|
|
| 16.9 |
|
|
| 2.9 |
|
Net income (loss) |
|
| 64.0 |
|
|
| 65.2 |
|
|
| (31.3) |
|
|
| 52.1 |
|
|
| 53.6 |
|
|
| 64.6 |
|
|
| 43.5 |
|
|
| 60.0 |
|
Basic earnings (loss) per share |
| $ | 0.34 |
|
| $ | 0.35 |
|
| $ | (0.17) |
|
| $ | 0.28 |
|
| $ | 0.29 |
|
| $ | 0.35 |
|
| $ | 0.23 |
|
| $ | 0.32 |
|
Diluted earnings (loss) per share |
| $ | 0.34 |
|
| $ | 0.35 |
|
| $ | (0.17) |
|
| $ | 0.28 |
|
| $ | 0.29 |
|
| $ | 0.35 |
|
| $ | 0.23 |
|
| $ | 0.32 |
|
Net cash provided by operating activities |
| $ | 119.1 |
|
| $ | 143.6 |
|
| $ | 97.8 |
|
| $ | 128.2 |
|
| $ | 111.3 |
|
| $ | 137.5 |
|
| $ | 126.3 |
|
| $ | 116.0 |
|
Net cash used in investing activities |
|
| (33.5) |
|
|
| (56.3) |
|
|
| (285.3) |
|
|
| (89.4) |
|
|
| (90.8) |
|
|
| (523.2) |
|
|
| (116.2) |
|
|
| (185.6) |
|
Net cash (used in) provided by financing activities |
|
| 241.4 |
|
|
| (84.7) |
|
|
| 182.5 |
|
|
| (33.8) |
|
|
| (35.0) |
|
|
| (36.1) |
|
|
| (32.0) |
|
|
| (29.3) |
|
Average Gold Price(3) |
| $ | 1,310 |
|
| $ | 1,304 |
|
| $ | 1,228 |
|
| $ | 1,213 |
|
| $ | 1,306 |
|
| $ | 1,329 |
|
| $ | 1,274 |
|
| $ | 1,278 |
|
GEOs earned(4) |
|
| 107,774 |
|
|
| 122,049 |
|
|
| 104,877 |
|
|
| 120,021 |
|
|
| 107,333 |
|
|
| 115,671 |
|
|
| 119,839 |
|
|
| 123,787 |
|
Cash Costs(5) attributable to GEO production |
| $ | 25.6 |
|
| $ | 31.0 |
|
| $ | 21.5 |
|
| $ | 29.9 |
|
| $ | 26.5 |
|
| $ | 27.3 |
|
| $ | 31.0 |
|
| $ | 31.2 |
|
Cash Costs(5) per GEO |
| $ | 238 |
|
| $ | 254 |
|
| $ | 208 |
|
| $ | 254 |
|
| $ | 252 |
|
| $ | 241 |
|
| $ | 266 |
|
| $ | 253 |
|
Adjusted EBITDA(5) |
| $ | 137.9 |
|
| $ | 140.9 |
|
| $ | 118.7 |
|
| $ | 134.7 |
|
| $ | 126.3 |
|
| $ | 139.9 |
|
| $ | 128.0 |
|
| $ | 134.1 |
|
Adjusted EBITDA(5) per share |
| $ | 0.74 |
|
| $ | 0.75 |
|
| $ | 0.64 |
|
| $ | 0.72 |
|
| $ | 0.68 |
|
| $ | 0.75 |
|
| $ | 0.69 |
|
| $ | 0.72 |
|
Margin(5) |
|
| 80.9 | % |
|
| 78.4 | % |
|
| 80.1 | % |
|
| 79.0 | % |
|
| 78.3 | % |
|
| 80.8 | % |
|
| 76.6 | % |
|
| 78.2 | % |
Adjusted Net Income(5) |
| $ | 64.0 |
|
| $ | 65.2 |
|
| $ | 44.7 |
|
| $ | 54.6 |
|
| $ | 53.7 |
|
| $ | 63.9 |
|
| $ | 52.1 |
|
| $ | 55.3 |
|
Adjusted Net Income(5) per share |
| $ | 0.34 |
|
| $ | 0.35 |
|
| $ | 0.24 |
|
| $ | 0.29 |
|
| $ | 0.29 |
|
| $ | 0.34 |
|
| $ | 0.28 |
|
| $ | 0.30 |
|
1 | Sum of the quarters may not add up to yearly total due to rounding. |
2 | Includes impairment charges on royalty, stream and working interests of $76.0 million recorded in Q4/2018. |
3 | Based on LBMA Gold Price PM Fix. |
4 | GEOs include production from our Mining assets, and do not include Energy assets. GEOs are estimated on a gross basis for NSR royalties and, in the case of stream ounces, before the payment of the per ounce contractual price paid by the Company. For NPI royalties, GEOs are calculated taking into account the NPI economics. Silver, platinum, palladium and other mining commodities are converted to GEOs by dividing associated revenue, which includes settlement adjustments, by the relevant gold price. The price used in the computation of GEOs earned from a particular asset varies depending on the royalty or stream agreement, which may make reference to the market price realized by the operator, or the average price for the month, quarter, or year in which the mining commodity was produced or sold. For illustrative purposes, please refer to the average commodity price table on pages 10 and 14 of this MD&A for indicative prices which may be used in the calculation of GEOs for the three and six months ended June 30, 2019 and 2018, respectively. |
5 | Cash Costs, Adjusted EBITDA, Margin and Adjusted Net Income are non-IFRS measures with no standardized meaning under IFRS. For further information and a detailed reconciliation, please refer to the “Non-IFRS Financial Measures” section of this MD&A. |
|
|
2019 Second Quarter Management’s Discussion and Analysis | 20 |
Summary Balance Sheet and Key Financial Metrics
|
|
|
|
|
|
|
|
|
| At June 30, |
|
| At December 31, | ||
(expressed in millions, except debt to equity ratio) |
| 2019 |
| 2018 |
| ||
Cash and cash equivalents |
| $ | 398.9 |
| $ | 69.7 |
|
|
|
|
|
|
|
|
|
Current assets |
|
| 540.2 |
|
| 178.5 |
|
Non-current assets |
|
| 4,818.5 |
|
| 4,753.3 |
|
Total assets |
| $ | 5,358.7 |
| $ | 4,931.8 |
|
|
|
|
|
|
|
|
|
Current liabilities |
|
| 202.0 |
|
| 25.0 |
|
Non-current liabilities |
|
| 356.4 |
|
| 274.9 |
|
Total liabilities |
| $ | 558.4 |
| $ | 299.9 |
|
|
|
|
|
|
|
|
|
Total shareholders’ equity |
| $ | 4,800.3 |
| $ | 4,631.9 |
|
|
|
|
|
|
|
|
|
Debt |
| $ | 432.2 |
| $ | 207.6 |
|
Total common shares outstanding |
|
| 187.4 |
|
| 186.7 |
|
Key Financial Metrics |
|
|
|
|
|
|
|
Working Capital |
| $ | 338.2 |
| $ | 153.5 |
|
Debt to equity |
|
| 0.09:1 |
|
| 0.04:1 |
|
Assets
Total assets were $5,358.7 million at June 30, 2019 compared to $4,931.8 million at December 31, 2018. Our asset base is primarily comprised of non-current assets such as our royalty, stream and working interests, and equity investments, while our current assets primarily comprise cash and cash equivalents, and accounts receivable. The increase in current assets of $361.7 million reflects the June 25, 2019 draw down on the Corporate Revolver of $275.0 million in anticipation of the acquisition on July 22, 2019 of the royalty interest in the Marcellus at a gross purchase price of $300.0 million. The increase in non-current assets reflects our investments in the Royalty Acquisition Venture with Continental, the acquisitions of the Salares Norte and Valentine Lake royalties, offset by depletion and depreciation expense, and the increase in the fair value of our equity investments.
Liabilities
Total liabilities as at June 30, 2019 primarily comprise $160.0 million borrowed against the Corporate Term Loan, and $275.0 million drawn against the Corporate Revolver. The Corporate Term Loan is a one-year, unsecured, non-revolving credit facility with a maturity of April 17, 2020. The Corporate Term Loan was drawn to refinance amounts that were borrowed from the Corporate Revolver in 2018. The Corporate Term Loan is presented as a current liability given the short-term nature of the facility. This amount was previously presented as a non-current liability when borrowed from the Corporate Revolver, which has a five-year term. Current liabilities also include $10.8 million in accounts payable for contributions to the Royalty Acquisition Venture accrued in Q2/2019.
Shareholders’ Equity
Shareholders’ equity increased by $168.4 million as at June 30, 2019 compared to December 31, 2018, reflecting net income of $129.2 million, a gain on the fair value of Company’s investments of $47.7 million, and a gain of $28.1 million in currency translation adjustment in H1/2019. The Company also issued $27.0 million in common shares as partial consideration for the acquisition of the Salares Norte royalty. Declared dividends reduced shareholders’ equity by $92.3 million, partly settled through the issuance of $22.3 million in common shares pursuant to the Company’s DRIP.
|
|
2019 Second Quarter Management’s Discussion and Analysis | 21 |
Liquidity and Capital Resources
Cash flow for the three and six months ended June 30, 2019 and 2018 was as follows:
|
|
|
|
|
|
|
|
|
|
|
|
|
|
|
| For the three months ended |
| For the six months ended |
| ||||||||
|
| June 30, |
| June 30, |
| ||||||||
(expressed in millions) |
| 2019 |
| 2018 |
| 2019 |
| 2018 |
| ||||
Net cash provided by operating activities |
| $ | 119.1 |
| $ | 111.3 |
| $ | 262.7 |
| $ | 248.8 |
|
Net cash used in investing activities |
|
| (33.5) |
|
| (90.8) |
|
| (89.8) |
|
| (614.0) |
|
Net cash provided by (used in) financing activities |
|
| 241.4 |
|
| (35.0) |
|
| 156.7 |
|
| (71.1) |
|
Effect of exchange rate changes on cash and cash equivalents |
|
| (0.7) |
|
| (1.1) |
|
| (0.4) |
|
| (2.7) |
|
Net change in cash and cash equivalents |
| $ | 326.3 |
| $ | (15.6) |
| $ | 329.2 |
| $ | (439.0) |
|
Operating Cash Flow
Net cash provided by operating activities was $119.1 million in Q2/2019 (Q2/2018 — $111.3 million) and $262.7 million in H1/2019 (H1/2018 – $248.8 million), respectively. The year-over-year increases reflect higher revenue compared to the prior year periods, as well as higher proceeds from the sale of gold bullion the Company receives from royalties settled in-kind.
Investing Activities
Net cash used in investing activities was $33.5 million in Q2/2019 (Q2/2018 – $90.8 million), which primarily consisted of the funding of Franco-Nevada’s share in the Royalty Acquisition Venture. For the six months ended June 30, 2019, investing activities of $89.8 million (H1/2018 – $614.0 million) included $75.7 million for the Royalty Acquisition Venture with Continental, and the acquisition of the Salares Norte and Valentine Lake royalties. In the three and six months ended June 30, 2019, the Company also disposed of some of its long-term equity investments.
Comparatively, investing activities in the prior year periods included the ongoing funding of the Cobre Panama Fixed Payment Stream deposit, the acquisition of the Cobre Panama Floating Payment Stream for $356.0 million, and the acquisition of the Delaware portfolio of oil and gas royalties.
Financing Activities
Net cash provided by financing activities were $241.4 million in Q2/2019 (Q2/2018 – cash used of $35.0 million) and $156.7 million in H1/2019 (H1/2018 – cash used of $71.1 million) reflecting the drawdown of $275.0 million to fund the acquisition of the royalty interest in the Marcellus subsequent to quarter-end. The Company also made a partial repayment of the balance outstanding under the Corporate Revolver as at December 31, 2018, of $50.0 million, and paid cash dividends of $35.1 million and $70.0 million in Q2/2019 and H1/2019, respectively.
Comparatively, financing activities in the three and six months ended June 30, 2018 consisted mainly of the payment of cash dividends, of $35.0 million and $70.6 million, respectively.
Capital Resources
Our cash and cash equivalents totaled $398.9 million as at June 30, 2019 (December 31, 2018 - $69.7 million). Included in this balance are proceeds of a draw down of $275.0 million on our Corporate Revolver on June 25, 2019, which were subsequently used to fund the acquisition of the royalty interest in the Marcellus on July 22, 2019. In addition, we held investments of $226.2 million as at June 30, 2019 (December 31, 2018 - $169.7 million), of which $187.9 million was held in publicly-traded equity instruments (December 31, 2018 - $132.8 million).
As at August 7, 2019, the Company also has a total of $0.9 billion available under its various credit facilities.
The Corporate Revolver is a $1 billion unsecured, revolving credit facility with a five-year term maturing March 22, 2024. Advances under the Corporate Revolver bear interest depending upon the currency of the advance and the Company’s leverage ratio. Funds are generally drawn using LIBOR 30-day rates plus 100 basis points. As at June 30, 2019, the Corporate Revolver had $275.0 million outstanding. Subsequent to quarter-end, on August 6, 2019, the Company paid down $50.0 million on its Corporate Revolver, such that the outstanding balance as at the date of this MD&A was $225.0 million, and the available balance was $0.8 billion.
The FNBC Revolver is a $0.1 billion unsecured, revolving credit facility with a one-year term maturing March 20, 2020. Funds are generally drawn using LIBOR rates plus 135 basis points. As of the date of this MD&A, the available balance was $0.1 billion.
Management’s objectives when managing capital are to:
(a) | ensure the preservation and availability of capital not being used for long-term investments by investing in low risk investments with high liquidity; and |
(b) | ensure that adequate levels of capital are maintained to meet the Company’s operating requirements and other current liabilities. |
|
|
2019 Second Quarter Management’s Discussion and Analysis | 22 |
As at June 30, 2019, the majority of funds were held in cash deposits with several financial institutions. Franco-Nevada invests its excess funds in term deposits. Certain investments with maturities upon acquisition of three months, or 92 days or less, were classified as term deposits with cash and cash equivalents on the statement of financial position.
Our performance is impacted by foreign currency fluctuations of the Canadian dollar and Australian dollar relative to the U.S. dollar. The largest exposure is with respect to the Canadian/U.S. dollar exchange rates as we hold a significant amount of our assets in Canada and report our results in U.S. dollars. The effect of volatility in these currencies against the U.S. dollar impacts our corporate administration, business development expenses and depletion on Mining and Energy interests incurred in our Canadian and Australian entities due to their respective functional currencies. During Q2/2019, the Canadian dollar traded in a range of $0.7393 to $0.7641, closing the quarter at $0.7641, and the Australian dollar traded between $0.7184 and $0.6857, closing the quarter at $0.7029.
Our near-term cash requirements include funding of our commitments towards the Royalty Acquisition Venture with Continental, corporate administration costs, certain costs of operations, payment of dividends and income taxes directly related to the recognition of royalty and stream revenues. As a royalty and stream company, there are limited requirements for capital expenditures other than for the acquisition of additional royalties or streams and capital commitments for our working interests. Such acquisitions are entirely discretionary and will be consummated through the use of cash, as available, or through the issuance of common shares or other equity or debt securities, or use of our credit facilities. We believe that our current cash resources, available credit facilities and future cash flows will be sufficient to cover the costs of our commitments, operating and administrative expenses, and dividend payments for the foreseeable future.
Purchase Commitments
The following table summarizes Franco-Nevada’s commitments to pay for gold, silver and PGM pursuant to the associated precious metals agreements:
|
|
|
|
|
|
|
|
|
|
|
|
|
|
|
|
|
|
|
|
|
|
| Attributable Payable |
|
|
|
|
|
|
|
|
|
|
|
|
|
| ||||
|
| Production to be Purchased |
| Per Ounce Cash Payment (1),(2) |
|
|
|
|
| |||||||||||
|
|
|
|
|
|
|
|
|
|
|
|
|
|
|
|
| Term of |
| Date of |
|
Interest |
| Gold |
| Silver |
| PGM |
| Gold |
| Silver |
| PGM |
| Agreement(3) |
| Contract |
| |||
Antamina |
| 0 | % | 22.5 | % (4) | 0 | % |
| n/a |
|
| 5 | % (5) |
| n/a |
| 40 years |
| 7-Oct-15 |
|
Antapaccay |
| — | % (6) | — | % (7) | 0 | % |
| 20 | % (8) |
| 20 | % (9) |
| n/a |
| 40 years |
| 10-Feb-16 |
|
Candelaria |
| 68 | % (10) | 68 | % (10) | 0 | % | $ | 400 |
| $ | 4.00 |
|
| n/a |
| 40 years |
| 6-Oct-14 |
|
Cobre Panama Fixed Payment Stream |
| — | % (11) | — | % (12) | 0 | % | $ | 418 | (13) | $ | 6.27 | (14) |
| n/a |
| 40 years |
| 19-Jan-18 |
|
Cobre Panama Floating Payment Stream |
| — | % (15) | — | % (16) | 0 | % |
| 20 | % (17) |
| 20 | % (18) |
| n/a |
| 40 years |
| 19-Jan-18 |
|
Karma |
| 4.875 | % (19) | 0 | % | 0 | % |
| 20 | % (20) |
| n/a |
|
| n/a |
| 40 years |
| 11-Aug-14 |
|
Guadalupe-Palmarejo |
| 50 | % | 0 | % | 0 | % | $ | 800 |
|
| n/a |
|
| n/a |
| 40 years |
| 2-Oct-14 |
|
Sabodala |
| 6 | % (21) | 0 | % | 0 | % |
| 20 | % (22) |
| n/a |
|
| n/a |
| 40 years |
| 12-Dec-13 |
|
MWS |
| 25 | % | 0 | % | 0 | % | $ | 400 |
|
| n/a |
|
| n/a |
| 40 years | (23) | 2-Mar-12 |
|
Cooke 4 |
| 7 | % | 0 | % | 0 | % | $ | 400 |
|
| n/a |
|
| n/a |
| 40 years |
| 5-Nov-09 |
|
Sudbury(24) |
| 50 | % | 0 | % | 50 | % | $ | 400 |
|
| n/a |
| $ | 400 |
| 40 years |
| 15-Jul-08 |
|
1 | Subject to an annual inflationary adjustment except for Antamina, Antapaccay, Karma, Guadalupe-Palmarejo, and Sabodala. |
2 | Should the prevailing market price for gold be lower than this amount, the per ounce cash payment will be reduced to the prevailing market price. |
3 | Subject to successive extensions. |
4 | Subject to a fixed payability of 90%. Percentage decreases to 15% after 86 million ounces of silver has been delivered under the agreement. |
5 | Purchase price is 5% of the average silver price at the time of delivery. |
6 | Gold deliveries are referenced to copper in concentrate shipped with 300 ounces of gold delivered for each 1,000 tonnes of copper in concentrate shipped, until 630,000 ounces of gold has been delivered. Thereafter, percentage is 30% of gold shipped. |
7 | Silver deliveries are referenced to copper in concentrate shipped with 4,700 ounces of silver delivered for each 1,000 tonnes of copper in concentrate shipped, until 10.0 million ounces of silver has been delivered. Thereafter, percentage is 30% of silver shipped. |
8 | Purchase price is 20% of the spot price of gold until 750,000 ounces of gold have been delivered, thereafter the purchase price is 30% of the spot price of gold. |
9 | Purchase price is 20% of the spot price of silver until 12.8 million ounces of silver have been delivered, thereafter the purchase price is 30% of the spot price of silver. |
10 | Percentage decreases to 40% after 720,000 ounces of gold and 12.0 million ounces of silver have been delivered under the agreement. |
11 | Gold deliveries are indexed to copper in concentrate produced from the project. 120 ounces of gold per every 1 million pounds of copper produced until 808,000 ounces of gold delivered. Thereafter, 81 ounces of gold per 1 million pounds of copper produced to 1,716,188 ounces of gold delivered. Thereafter, 63.4% of the gold in concentrate. |
12 | Silver deliveries are indexed to copper in concentrate produced from the project. 1,376 ounces of silver per every 1 million pounds of copper produced until 9,842,000 ounces of silver delivered. Thereafter 1,776 ounces of silver per 1 million pounds of copper produced to 29,731,000 ounces of silver delivered. Thereafter, 62.1% of the silver. |
13 | After 1,341,000 ounces of gold delivered, purchase price is the greater of 50% of spot and $418.27 per ounce, subject to an annual inflationary adjustment. As the mill throughput for 30 consecutive days commensurate with annual capacity of 58 million tonnes per annum was not reached by January 1, 2019, Franco‑Nevada will receive a 5% annual rate of return until such mill throughput has been achieved, through a reduction of the applicable fixed gold price of $100 per ounce or a delivery of additional ounces for no consideration. |
14 | After 21,510,000 ounces of silver delivered, purchase price is the greater of 50% of spot and $6.27 per ounce, subject to an annual inflationary adjustment. |
15 | Gold deliveries are indexed to copper in concentrate produced from the project. 30 ounces of gold per every 1 million pounds of copper produced until 202,000 ounces of gold delivered. Thereafter 20.25 ounces of gold per 1 million pounds of copper produced to 429,047 ounces of gold delivered. Thereafter, 15.85% of the gold in concentrate. |
16 | Silver deliveries are indexed to copper in concentrate produced from the project. 344 ounces of silver per every 1 million pounds of copper produced until 2,460,500 ounces of silver delivered. Thereafter, 444 ounces of silver per 1 million pounds of copper produced to 7,432,750 ounces of silver delivered. Thereafter, 15.53% of the silver in concentrate. |
17 | After 604,000 ounces of gold delivered, purchase price is 50% of the spot price of gold. As the mill throughput for 30 consecutive days commensurate with annual capacity of 58 million tonnes per annum was not reached by January 1, 2019, Franco-Nevada will receive a 5% annual rate of return until such mill throughput has been achieved, through a reduction of the applicable fixed gold price of $100 per ounce or a delivery of additional ounces for no consideration. |
18 | After 9,618,000 ounces of silver delivered, purchase price is 50% of the spot price of silver. |
19 | Gold deliveries are fixed at 15,000 ounces per annum from March 31, 2016 until February 28, 2021 (exclusive of an aggregate 5,625 gold ounces, or 703 gold ounces per quarter, to be delivered as a result of the exercise by the operator of its option to increase the upfront deposit). Thereafter, percentage is 4.875%. |
20 | Purchase price is 20% of the average gold price at the time of delivery. |
|
|
2019 Second Quarter Management’s Discussion and Analysis | 23 |
21 | Gold deliveries are fixed at 1,875 ounces per month until December 31, 2019. Thereafter, percentage is 6% of gold produced. |
22 | Purchase price is 20% of prevailing market price at the time of delivery. |
23 | Agreement is capped at 312,500 ounces of gold. |
24 | The Company is committed to purchase 50% of the precious metals contained in ore from the properties. Payment is based on gold equivalent ounces. For McCreedy West, the fixed price per gold equivalent ounce was increased to $800 per ounce (with no annual inflationary adjustment), effective July 1, 2018 until December 31, 2021. |
Acquisition of Royalty Rights with Continental Resources, Inc.
As described in the Corporate Developments section above, the Company has a strategic relationship with a subsidiary of Continental to jointly acquire royalty rights in the SCOOP and STACK plays of Oklahoma. Franco-Nevada is expecting to contribute to the Royalty Acquisition Venture, subject to satisfaction of agreed upon development thresholds, $100 million per year over three years by December 31, 2021. However, given the favourable pace of acquisitions, the Company has agreed to increase the capital commitment in 2019 to $120 million, up $20 million from $100 million previously. These accelerated contributions will reduce Franco-Nevada’s commitment in 2021. As at June 30, 2019, the total remaining commitment was $171.7 million.
Contingencies
Canada Revenue Agency Audit
The Canada Revenue Agency (“CRA”) is conducting an audit of Franco-Nevada’s 2012-2015 taxation years.
Canadian Domestic (2014-2015):
Certain wholly owned Canadian subsidiaries of the Company received proposal letters (the “CRA Letters”) from the CRA at the end of May 2019. The CRA Letters propose to reassess the 2014 and 2015 taxation years to increase income by adjusting the timing of the deduction of the upfront payments with respect to precious metal streams, resulting in additional Federal and provincial income taxes of approximately $1.6 million plus interest and applicable penalties (after applying available non-capital losses).
Mexico (2013):
The Company received a Notice of Reassessment (the “Reassessment”) dated December 24, 2018 from the CRA for the 2013 taxation year in relation to the Company’s Mexican subsidiary. The Reassessment assesses the Company for additional Federal and provincial income taxes of C$10.7 million ($8.2 million) plus interest and applicable penalties but before any relief under the Canada-Mexico tax treaty.
For the 2013 taxation year, the Company’s Mexican subsidiary paid 154.3 million Pesos ($12.1 million) in cash taxes, at a 30% tax rate, to the Mexican tax authorities on income earned in Mexico. If required, the Company intends to seek relief from double taxation under the Canada-Mexico tax treaty.
Management believes that the Company and its subsidiaries have filed their tax returns and paid all applicable taxes in compliance with Canadian and applicable foreign tax laws and as a result, no amounts have been recorded in the financial statements of the Company for the Reassessment, the CRA Letters or for any potential tax liability that may arise in respect of these matters. The Company intends to vigorously defend its position.
The CRA audit is ongoing and there can be no assurance that the CRA will not further challenge the manner in which the Company or any of its subsidiaries has filed its income tax returns and reported its income. In the event that the CRA successfully challenges the manner in which the Company or a subsidiary has filed its tax returns and reported its income, this could potentially result in additional income taxes, penalties and interest, which could have a material adverse effect on the Company.
The preparation of consolidated financial statements in accordance with IFRS requires the Company to make judgments, estimates and assumptions that affect the reported amounts of assets and liabilities and disclosures of contingent assets and liabilities at the date of the consolidated financial statements and the reported amounts of revenues and expenses during the reporting period. Estimates and assumptions are continuously evaluated and are based on management’s best knowledge of the relevant facts and circumstances, having regard to previous experience. However, actual outcomes may differ from the amounts included in the consolidated financial statements.
Our significant accounting policies and estimates are disclosed in Notes 2 and 3 of our most recent annual consolidated financial statements.
New and Amended Standards Adopted by the Company
The following standard was effective and implemented for the annual period as of January 1, 2019.
IFRS 16 Leases
Effective January 1, 2019, the Company has adopted IFRS 16 Leases (“IFRS 16”). IFRS 16 requires lessees to recognize assets and liabilities for most leases. The new standard was applied using a modified retrospective approach whereby the effects of the change in accounting policies for leases as at January 1, 2019 are presented together as a single adjustment to the opening balance of deficit. Therefore, the comparative information has not been restated and continues to be reported under IAS 17 Leases.
|
|
2019 Second Quarter Management’s Discussion and Analysis | 24 |
As permitted under transitional provisions, the Company has elected to use the following practical expedients:
· | Not to separate non-lease from lease components, and instead account for each lease component and any associated non-lease components as a single lease component. |
· | Not to recognize right-of-use assets and associated liabilities for low value assets or lease terms of 12 months or less. |
· | Measure its right-of-use assets at amounts equal to the associated lease liabilities; as such, the adjustment to deficit on transition is nil. |
The Company’s significant lease arrangements relate to its office premises. Adoption of the new standard resulted in the recognition of right-of-use assets of $2.8 million within other assets on the statement of financial position, measured at an amount equal to the related lease liability, discounted using a weighted average incremental borrowing rate of 4.55% at January 1, 2019.
IFRIC 23 Uncertainty over Income Tax Treatments
Effective January 1, 2019, the Company has adopted IFRIC 23 Uncertainty over Income Tax Treatments (“IFRIC 23”). IFRIC 23 clarifies how to apply the recognition and measurement requirements of IAS 12 Income Taxes when there is uncertainty over income tax treatments. The application of IFRIC 23 did not impact the Company’s consolidated financial statements.
New Accounting Standards Issued But Not Yet Effective
Amendments to IFRS 3 Business Combinations
In October 2018, the IASB issued amendments to the definition of a business in IFRS 3 Business Combinations (“IFRS 3”). The amendments are intended to assist entities to determine whether a transaction should be accounted for as a business combination or as an asset acquisition. The amendments clarify the minimum requirements for a business, remove the assessment of whether market participants are capable of replacing any missing elements, add guidance to help entities assess whether an acquired process is substantive, narrow the definitions of a business and of outputs, and introduce an optional fair value concentration test. The amendments to IFRS 3 are effective for annual reporting periods beginning on or after January 1, 2020 and apply prospectively. Earlier application is permitted. While it is generally expected that the application of the amendments will result in more acquisitions being accounted for as asset acquisitions, the Company will evaluate the impact of the amendments based on the nature and terms of acquisitions the Company may complete in future periods.
Franco-Nevada is authorized to issue an unlimited number of common and preferred shares. A detailed description of the rights, privileges, restrictions and conditions attached to each class of authorized shares is included in our most recent Annual Information Form, a copy of which can be found on SEDAR at www.sedar.com and in our Form 40-F, a copy of which can be found on EDGAR at www.sec.gov.
As of August 7, 2019, the number of common shares outstanding or issuable pursuant to other outstanding securities is as follows:
|
|
|
|
Common Shares |
| Number |
|
Outstanding |
| 187,408,583 |
|
Issuable upon exercise of Franco-Nevada options(1) |
| 947,168 |
|
Issuable upon vesting of Franco-Nevada RSUs |
| 115,337 |
|
Diluted common shares |
| 188,471,088 |
|
1 | There were 947,168 stock options under our share compensation plan outstanding to directors, officers, employees and others with exercise prices ranging from C$31.39 to C$100.10 per share. |
Franco-Nevada has not issued any preferred shares.
Internal Control Over Financial Reporting and Disclosure Controls and Procedures
Our Chief Executive Officer and Chief Financial Officer are responsible for establishing and maintaining Franco-Nevada’s internal control over financial reporting and other financial disclosure and our disclosure controls and procedures.
Internal control over financial reporting is a process designed to provide reasonable assurance regarding the reliability of financial reporting and the preparation of financial statements for external purposes in accordance with IFRS. Franco-Nevada’s internal control over financial reporting includes those policies and procedures that (i) pertain to the maintenance of records that, in reasonable detail, accurately and fairly reflect the transactions and dispositions of the assets of Franco-Nevada; (ii) are designed to provide reasonable assurance that transactions are recorded as necessary to permit preparation of financial statements in accordance with IFRS, and that receipts and expenditures of Franco-Nevada are being made only in accordance with authorizations of management and directors of Franco-Nevada; and (iii) are designed to provide reasonable assurance regarding prevention or timely detection of unauthorized acquisition, use or disposition of Franco-Nevada’s assets that could have a material effect on Franco-Nevada’s financial statements. Internal control over other financial disclosure is a process designed to ensure that other financial information included in this MD&A, fairly represents in all material respects the financial condition, results of operations and cash flows of Franco-Nevada for the periods presented in this MD&A.
|
|
2019 Second Quarter Management’s Discussion and Analysis | 25 |
Franco-Nevada’s disclosure controls and procedures are designed to provide reasonable assurance that material information relating to Franco-Nevada, including its consolidated subsidiaries, is made known to management by others within those entities, particularly during the period in which this report is prepared and that information required to be disclosed by Franco-Nevada in its annual filings, interim filings or other reports filed or submitted by it under securities legislation is recorded, processed, summarized and reported within the time periods specified in securities legislation.
Due to its inherent limitations, internal control over financial reporting and other financial disclosure may not prevent or detect all misstatements. Also, projections of any evaluation of effectiveness to future periods are subject to the risk that controls may become inadequate because of changes in conditions, or that the degree of compliance with the policies or procedures may change.
In connection with Franco-Nevada’s annual review and audit procedures for the fiscal year ended December 31, 2018, an evaluation was carried out under the supervision of the CEO and CFO and with the participation of management, of the effectiveness of the design and operation of Franco-Nevada’s internal control over financial reporting as December 31, 2018 based on the framework and criteria established in Internal Control – Integrated Framework (2013) as issued by the Committee of Sponsoring Organizations (COSO) of the Treadway Commission. Based on that evaluation, the CEO and CFO have concluded that Franco-Nevada’s internal control over financial reporting was effective as of December 31, 2018.
An evaluation was also carried out under the supervision of the CEO and CFO and with the participation of management, of the effectiveness of the design and operation of Franco-Nevada’s disclosure controls and procedures (as defined under applicable Canadian securities laws and in Rule 13a – 15(e) and Rule 15d – 15(e) under the U.S. Securities Exchange Act of 1934), and based on that evaluation the CEO and the CFO have concluded that as of December 31, 2018, Franco-Nevada’s disclosure controls and procedures were effective.
For the three and six months ended June 30, 2019, there has been no change in Franco-Nevada’s internal control over financial reporting that has materially affected, or is reasonably likely to materially affect, Franco-Nevada’s internal control over financial reporting.
Cash Costs attributable to GEO production and Cash Costs per GEO
Cash Costs attributable to GEO production and Cash Costs per GEO are non-IFRS financial measures. Cash Costs are calculated by starting with total costs of sales and removing depletion and depreciation, costs not attributable to GEO production such as our Energy operating costs, and other non-cash costs of sales such as costs related to our prepaid gold purchase agreement. Cash Costs per GEO are calculated by dividing Cash Costs by the number of GEOs sold in the period, excluding prepaid GEOs.
Management uses Cash Costs and Cash Costs per GEO to evaluate the Company’s ability to generate positive cash flow from its mining royalty, stream and working interests. Management and certain investors also use this information to evaluate the Company’s performance relative to peers in the mining industry who present this measure on a similar basis. Cash Costs and Cash Costs per GEO are only intended to provide additional information to investors and analysts, and should not be considered in isolation or as a substitute for measures of performance prepared in accordance with IFRS. They do not have any standardized meaning under IFRS, and may not be comparable to similar measures presented by other issuers.
Reconciliation of Cash Costs and Cash Costs per GEO:
|
|
|
|
|
|
|
|
|
|
|
| �� |
|
|
|
|
|
| For the three months ended |
| For the six months ended |
| |||||||||||
|
| June 30, |
|
| June 30, |
| ||||||||||
(expressed in millions, except per GEO amounts) |
| 2019 |
|
| 2018 |
|
| 2019 |
|
| 2018 |
| ||||
Total costs of sales |
| $ | 86.3 |
|
| $ | 89.4 |
|
| $ | 179.6 |
|
| $ | 180.2 |
|
Depletion and depreciation |
|
| (58.9) |
|
|
| (59.6) |
|
|
| (119.8) |
|
|
| (120.2) |
|
Energy operating costs |
|
| (1.8) |
|
|
| (1.5) |
|
|
| (3.2) |
|
|
| (2.5) |
|
Non-cash costs of sales |
|
| — |
|
|
| (1.8) |
|
|
| — |
|
|
| (3.7) |
|
Cash Costs attributable to GEO production |
| $ | 25.6 |
|
| $ | 26.5 |
|
| $ | 56.6 |
|
| $ | 53.8 |
|
GEOs, excluding prepaid ounces |
|
| 107,774 |
|
|
| 105,333 |
|
|
| 229,823 |
|
|
| 218,837 |
|
Cash Costs per GEO |
| $ | 238 |
|
| $ | 252 |
|
| $ | 246 |
|
| $ | 246 |
|
|
|
2019 Second Quarter Management’s Discussion and Analysis | 26 |
Adjusted EBITDA and Adjusted EBITDA per share
Adjusted EBITDA and Adjusted EBITDA per share are non-IFRS financial measures, which exclude the following from net income and earnings per share (“EPS”):
· | Income tax expense/recovery; |
· | Finance expenses; |
· | Finance income; |
· | Depletion and depreciation; |
· | Non-cash costs of sales; |
· | Impairment charges related to royalty, stream and working interests; |
· | Impairment of investments; |
· | Gains/losses on sale of royalty, stream and working interests; |
· | Gains/losses on investments; |
· | Foreign exchange gains/losses and other income/expenses; and |
· | Unusual non-recurring items. |
Management uses Adjusted EBITDA and Adjusted EBITDA per share to evaluate the underlying operating performance of the Company as a whole for the reporting periods presented, to assist with the planning and forecasting of future operating results, and to supplement information in its financial statements. Management believes that in addition to measures prepared in accordance with IFRS such as Net Income and EPS, our investors and analysts use Adjusted EBITDA and Adjusted EBITDA per share to evaluate the results of the underlying business of the Company, particularly since the excluded items are typically not included in our guidance, with the exception of depletion and depreciation expense. While the adjustments to net income and EPS in these measures include items that are both recurring and non-recurring, management believes that Adjusted EBITDA and Adjusted EBITDA per share are useful measures of the Company’s performance because they adjust for items which may not relate to or have a disproportionate effect on the period in which they are recognized, impact the comparability of our core operating results from period to period, are not always reflective of the underlying operating performance of our business and/or are not necessarily indicative of future operating results. Adjusted EBITDA and Adjusted EBITDA per share are only intended to provide additional information to investors and analysts, and should not be considered in isolation or as a substitute for measures of performance prepared in accordance with IFRS. They do not have any standardized meaning under IFRS, and may not be comparable to similar measures presented by other issuers.
Reconciliation of Net Income to Adjusted EBITDA:
|
|
|
|
|
|
|
|
|
|
|
|
|
|
|
|
|
|
| For the three months ended |
|
| For the six months ended |
| ||||||||||
|
| June 30, |
|
| June 30, |
| ||||||||||
(expressed in millions, except per share amounts) |
| 2019 |
|
| 2018 |
|
| 2019 |
|
| 2018 |
| ||||
Net Income |
| $ | 64.0 |
|
| $ | 53.6 |
|
| $ | 129.2 |
|
| $ | 118.2 |
|
Income tax expense |
|
| 13.7 |
|
|
| 11.1 |
|
|
| 26.7 |
|
|
| 24.6 |
|
Finance expenses |
|
| 2.5 |
|
|
| 0.8 |
|
|
| 5.0 |
|
|
| 1.7 |
|
Finance income |
|
| (1.2) |
|
|
| (0.7) |
|
|
| (1.9) |
|
|
| (1.7) |
|
Depletion and depreciation |
|
| 58.9 |
|
|
| 59.6 |
|
|
| 119.8 |
|
|
| 120.2 |
|
Non-cash costs of sales |
|
| — |
|
|
| 1.8 |
|
|
| — |
|
|
| 3.7 |
|
Foreign exchange (gains)/losses and other (income)/expenses |
|
| — |
|
|
| 0.1 |
|
|
| — |
|
|
| (0.5) |
|
Adjusted EBITDA |
| $ | 137.9 |
|
| $ | 126.3 |
|
| $ | 278.8 |
|
| $ | 266.2 |
|
Basic weighted average shares outstanding |
|
| 187.2 |
|
|
| 186.0 |
|
|
| 187.1 |
|
|
| 186.0 |
|
|
|
|
|
|
|
|
|
|
|
|
|
|
|
|
|
|
Basic EPS |
| $ | 0.34 |
|
| $ | 0.29 |
|
| $ | 0.69 |
|
| $ | 0.64 |
|
Income tax expense |
|
| 0.07 |
|
|
| 0.06 |
|
|
| 0.14 |
|
|
| 0.13 |
|
Finance expenses |
|
| 0.02 |
|
|
| — |
|
|
| 0.03 |
|
|
| 0.01 |
|
Finance income |
|
| — |
|
|
| — |
|
|
| (0.01) |
|
|
| (0.01) |
|
Depletion and depreciation |
|
| 0.31 |
|
|
| 0.32 |
|
|
| 0.64 |
|
|
| 0.65 |
|
Non-cash costs of sales |
|
| — |
|
|
| 0.01 |
|
|
| — |
|
|
| 0.02 |
|
Foreign exchange (gains)/losses and other (income)/expenses |
|
| — |
|
|
| — |
|
|
| — |
|
|
| (0.01) |
|
Adjusted EBITDA per share |
| $ | 0.74 |
|
| $ | 0.68 |
|
| $ | 1.49 |
|
| $ | 1.43 |
|
Margin
Margin is a non-IFRS financial measure which is defined by the Company as Adjusted EBITDA divided by revenue. The Company uses Margin in its annual incentive compensation process to evaluate management’s performance in increasing revenue and containing costs. Margin is intended to provide additional information, does not have any standardized definition under IFRS and should not be considered in isolation or as a substitute for a measure of performance in accordance with IFRS.
|
|
2019 Second Quarter Management’s Discussion and Analysis | 27 |
Reconciliation of Net Income to Margin:
|
|
|
|
|
|
|
|
|
|
|
|
|
|
|
|
|
| For the three months ended |
|
| For the six months ended |
| |||||||||
|
| June 30, |
|
| June 30, |
| |||||||||
(expressed in millions, except Margin) |
| 2019 |
|
| 2018 |
|
| 2019 |
| 2018 |
| ||||
Net Income |
| $ | 64.0 |
|
| $ | 53.6 |
|
| $ | 129.2 |
| $ | 118.2 |
|
Income tax expense |
|
| 13.7 |
|
|
| 11.1 |
|
|
| 26.7 |
|
| 24.6 |
|
Finance expenses |
|
| 2.5 |
|
|
| 0.8 |
|
|
| 5.0 |
|
| 1.7 |
|
Finance income |
|
| (1.2) |
|
|
| (0.7) |
|
|
| (1.9) |
|
| (1.7) |
|
Depletion and depreciation |
|
| 58.9 |
|
|
| 59.6 |
|
|
| 119.8 |
|
| 120.2 |
|
Non-cash costs of sales |
|
| — |
|
|
| 1.8 |
|
|
| — |
|
| 3.7 |
|
Foreign exchange (gains)/losses and other (income)/expenses |
|
| — |
|
|
| 0.1 |
|
|
| — |
|
| (0.5) |
|
Adjusted EBITDA |
| $ | 137.9 |
|
| $ | 126.3 |
|
| $ | 278.8 |
| $ | 266.2 |
|
Revenue |
|
| 170.5 |
|
|
| 161.3 |
|
|
| 350.3 |
|
| 334.4 |
|
Margin |
|
| 80.9 | % |
|
| 78.3 | % |
|
| 79.6 | % |
| 79.6 | % |
Adjusted Net Income and Adjusted Net Income per share
Adjusted Net Income and Adjusted Net Income per share are non-IFRS financial measures, which exclude the following from net income and EPS:
· | Foreign exchange gains/losses and other income/expenses; |
· | Impairment charges related to royalty, stream and working interests; |
· | Impairment of investments; |
· | Gains/losses on sale of royalty, stream and working interests; |
· | Gains/losses on investments; |
· | Unusual non-recurring items; and |
· | Impact of income taxes on these items. |
Management uses Adjusted Net Income and Adjusted Net Income per share to evaluate the underlying operating performance of the Company as a whole for the reporting periods presented, to assist with the planning and forecasting of future operating results, and to supplement information in its financial statements. Management believes that in addition to measures prepared in accordance with IFRS such as Net Income and EPS, our investors and analysts use Adjusted Net Income and Adjusted Net Income per share to evaluate the results of the underlying business of the Company, particularly since the excluded items are typically not included in our guidance. While the adjustments to net income and EPS in these measures include items that are both recurring and non-recurring, management believes that Adjusted Net Income and Adjusted Net Income per share are useful measures of the Company’s performance because they adjust for items which may not relate to or have a disproportionate effect on the period in which they are recognized, impact the comparability of our core operating results from period to period, are not always reflective of the underlying operating performance of our business and/or are not necessarily indicative of future operating results. Adjusted Net Income and Adjusted Net Income per share are intended to provide additional information to investors and analysts and should not be considered in isolation or as a substitute for measures of performance prepared in accordance with IFRS. They do not have any standardized meaning under IFRS, and may not be comparable to similar measures presented by other issuers.
Reconciliation of Net Income to Adjusted Net Income:
|
|
|
|
|
|
|
|
|
|
|
|
|
|
|
|
|
|
| For the three months ended |
| For the six months ended |
| |||||||||||
|
| June 30, |
|
| June 30, |
| ||||||||||
(expressed in millions, except per share amounts) |
| 2019 |
|
| 2018 |
|
| 2019 |
|
| 2018 |
| ||||
Net Income |
| $ | 64.0 |
|
| $ | 53.6 |
|
| $ | 129.2 |
|
| $ | 118.2 |
|
Foreign exchange (gains)/losses and other (income)/expenses |
|
| — |
|
|
| 0.1 |
|
|
| — |
|
|
| (0.5) |
|
Tax effect of adjustments |
|
| — |
|
|
| — |
|
|
| — |
|
|
| (0.1) |
|
Adjusted Net Income |
| $ | 64.0 |
|
| $ | 53.7 |
|
| $ | 129.2 |
|
| $ | 117.6 |
|
Basic weighted average shares outstanding |
|
| 187.2 |
|
|
| 186.0 |
|
|
| 187.1 |
|
|
| 186.0 |
|
|
|
|
|
|
|
|
|
|
|
|
|
|
|
|
|
|
Basic EPS |
| $ | 0.34 |
|
| $ | 0.29 |
|
| $ | 0.69 |
|
| $ | 0.64 |
|
Foreign exchange (gains)/losses and other (income)/expenses |
|
| — |
|
|
| — |
|
|
| — |
|
|
| (0.01) |
|
Tax effect of adjustments |
|
| — |
|
|
| — |
|
|
| — |
|
|
| — |
|
Adjusted Net Income per share |
| $ | 0.34 |
|
| $ | 0.29 |
|
| $ | 0.69 |
|
| $ | 0.63 |
|
|
|
2019 Second Quarter Management’s Discussion and Analysis | 28 |
Cautionary Statement on Forward-Looking Information
This MD&A contains “forward-looking information” and “forward-looking statements” within the meaning of applicable Canadian securities laws and the United States Private Securities Litigation Reform Act of 1995, respectively, which may include, but are not limited to, statements with respect to future events or future performance, management’s expectations regarding Franco-Nevada’s growth, results of operations, estimated future revenues, carrying value of assets, future dividends and requirements for additional capital, mineral reserve and mineral resource estimates, production estimates, production costs and revenue, future demand for and prices of commodities, expected mining sequences, business prospects and opportunities, audits being conducted by the CRA and available remedies, and the remedies relating to and consequences of the ruling of the Supreme Court of Panama in relation to the Cobre Panama project, the aggregate value of Common Shares which may be issued pursuant to the ATM Program, and the Corporation’s expected use of the net proceeds of the ATM Program, if any. In addition, statements (including data in tables) relating to reserves and resources and gold equivalent ounces are forward-looking statements, as they involve implied assessment, based on certain estimates and assumptions, and no assurance can be given that the estimates and assumptions are accurate and that such reserves and resources and GEOs will be realized. Such forward-looking statements reflect management’s current beliefs and are based on information currently available to management. Often, but not always, forward-looking statements can be identified by the use of words such as “plans”, “expects”, “is expected”, “budgets”, “scheduled”, “estimates”, “forecasts”, “predicts”, “projects”, “intends”, “targets”, “aims”, “anticipates” or “believes” or variations (including negative variations) of such words and phrases or may be identified by statements to the effect that certain actions “may”, “could”, “should”, “would”, “might” or “will” be taken, occur or be achieved. Forward-looking statements involve known and unknown risks, uncertainties and other factors, which may cause the actual results, performance or achievements of Franco-Nevada to be materially different from any future results, performance or achievements expressed or implied by the forward-looking statements. A number of factors could cause actual events or results to differ materially from any forward-looking statement, including, without limitation: fluctuations in the prices of the primary commodities that drive royalty and stream revenue (gold, platinum group metals, copper, nickel, uranium, silver, iron-ore and Energy); fluctuations in the value of the Canadian and Australian dollar, Mexican Peso and any other currency in which revenue is generated, relative to the U.S. dollar; changes in national and local government legislation, including permitting and licensing regimes and taxation policies and the enforcement thereof; regulatory, political or economic developments in any of the countries where properties in which Franco-Nevada holds a royalty, stream or other interest are located or through which they are held; risks related to the operators of the properties in which Franco-Nevada holds a royalty, stream or other interest, including changes in the ownership and control of such operators; influence of macroeconomic developments; business opportunities that become available to, or are pursued by Franco-Nevada; reduced access to debt and equity capital; litigation; title, permit or license disputes related to interests on any of the properties in which Franco-Nevada holds a royalty, stream or other interest; whether or not the Company is determined to have “passive foreign investment company” (“PFIC”) status as defined in Section 1297 of the United States Internal Revenue Code of 1986, as amended; potential changes in Canadian tax treatment of offshore streams; excessive cost escalation as well as development, permitting, infrastructure, operating or technical difficulties on any of the properties in which Franco-Nevada holds a royalty, stream or other interest; access to sufficient pipeline capacity; actual mineral content may differ from the reserves and resources contained in technical reports; rate and timing of production differences from resource estimates, other technical reports and mine plans; risks and hazards associated with the business of development and mining on any of the properties in which Franco-Nevada holds a royalty, stream or other interest, including, but not limited to unusual or unexpected geological and metallurgical conditions, slope failures or cave-ins, flooding and other natural disasters, terrorism, civil unrest or an outbreak of contagious disease; and the integration of acquired assets. The forward-looking statements contained in this MD&A are based upon assumptions management believes to be reasonable, including, without limitation: the ongoing operation of the properties in which Franco-Nevada holds a royalty, stream or other interest by the owners or operators of such properties in a manner consistent with past practice; the accuracy of public statements and disclosures made by the owners or operators of such underlying properties; no material adverse change in the market price of the commodities that underlie the asset portfolio; the Company’s ongoing income and assets relating to determination of its PFIC status; no material changes to existing tax treatment; the expected application of tax laws and regulations by taxation authorities; the expected assessment and outcome of any audit by any taxation authority; no adverse development in respect of any significant property in which Franco-Nevada holds a royalty, stream or other interest; the accuracy of publicly disclosed expectations for the development of underlying properties that are not yet in production; integration of acquired assets; and the absence of any other factors that could cause actions, events or results to differ from those anticipated, estimated or intended. However, there can be no assurance that forward-looking statements will prove to be accurate, as actual results and future events could differ materially from those anticipated in such statements. Investors are cautioned that forward-looking statements are not guarantees of future performance. Franco-Nevada cannot assure investors that actual results will be consistent with these forward-looking statements. Accordingly, investors should not place undue reliance on forward-looking statements due to the inherent uncertainty therein. For additional information with respect to risks, uncertainties and assumptions, please refer to Franco-Nevada’s most recent Annual Information Form filed with the Canadian securities regulatory authorities on www.sedar.com and Franco-Nevada’s most recent Annual Report filed on Form 40-F filed with the SEC on www.sec.gov. The forward-looking statements herein are made as of the date of this MD&A only and Franco-Nevada does not assume any obligation to update or revise them to reflect new information, estimates or opinions, future events or results or otherwise, except as required by applicable law.
|
|
2019 Second Quarter Management’s Discussion and Analysis | 29 |