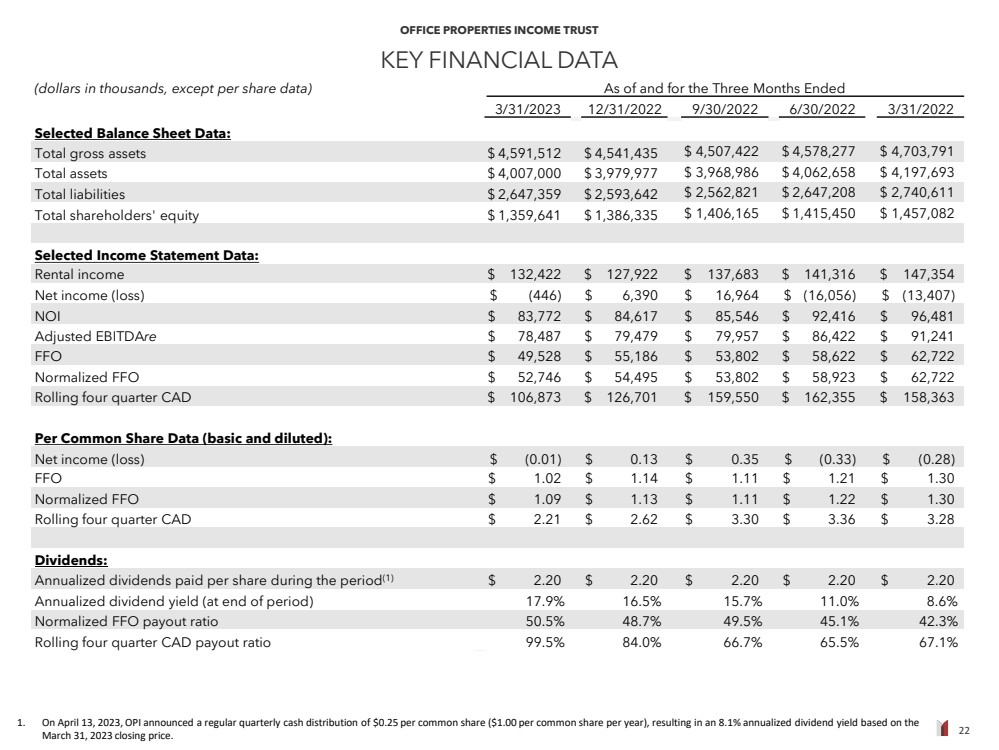
| 22 OFFICE PROPERTIES INCOME TRUST KEY FINANCIAL DATA (dollars in thousands, except per share data) As of and for the Three Months Ended 3/31/2023 12/31/2022 9/30/2022 6/30/2022 3/31/2022 Selected Balance Sheet Data: Total gross assets $ 4,591,512 $ 4,541,435 $ 4,507,422 $ 4,578,277 $ 4,703,791 Total assets $ 4,007,000 $ 3,979,977 $ 3,968,986 $ 4,062,658 $ 4,197,693 Total liabilities $ 2,647,359 $ 2,593,642 $ 2,562,821 $ 2,647,208 $ 2,740,611 Total shareholders' equity $ 1,359,641 $ 1,386,335 $ 1,406,165 $ 1,415,450 $ 1,457,082 Selected Income Statement Data: Rental income $ 132,422 $ 127,922 $ 137,683 $ 141,316 $ 147,354 Net income (loss) $ (446) $ 6,390 $ 16,964 $ (16,056) $ (13,407) NOI $ 83,772 $ 84,617 $ 85,546 $ 92,416 $ 96,481 Adjusted EBITDAre $ 78,487 $ 79,479 $ 79,957 $ 86,422 $ 91,241 FFO $ 49,528 $ 55,186 $ 53,802 $ 58,622 $ 62,722 Normalized FFO $ 52,746 $ 54,495 $ 53,802 $ 58,923 $ 62,722 Rolling four quarter CAD $ 106,873 $ 126,701 $ 159,550 $ 162,355 $ 158,363 Per Common Share Data (basic and diluted): Net income (loss) $ (0.01) $ 0.13 $ 0.35 $ (0.33) $ (0.28) FFO $ 1.02 $ 1.14 $ 1.11 $ 1.21 $ 1.30 Normalized FFO $ 1.09 $ 1.13 $ 1.11 $ 1.22 $ 1.30 Rolling four quarter CAD $ 2.21 $ 2.62 $ 3.30 $ 3.36 $ 3.28 Dividends: Annualized dividends paid per share during the period(1) $ 2.20 $ 2.20 $ 2.20 $ 2.20 $ 2.20 Annualized dividend yield (at end of period) 17.9% 16.5% 15.7% 11.0% 8.6% Normalized FFO payout ratio 50.5% 48.7% 49.5% 45.1% 42.3% Rolling four quarter CAD payout ratio 99.5% 84.0% 66.7% 65.5% 67.1% 1. On April 13, 2023, OPI announced a regular quarterly cash distribution of $0.25 per common share ($1.00 per common share per year), resulting in an 8.1% annualized dividend yield based on the March 31, 2023 closing price. |