| 1 OFFICE PROPERTIES INCOME TRUST INVESTOR PRESENTATION June 2024 Provo, UT |

| 2 OFFICE PROPERTIES INCOME TRUST This presentation contains forward-looking statements within the meaning of the Private Securities Litigation Reform Act of 1995 and other securities laws that are subject to risks and uncertainties. These statements may include words such as “believe”, “expect”, “anticipate”, “intend”, “plan”, “estimate”, “will”, “may” and negatives or derivatives of these or similar expressions. These forward-looking statements include, among others, statements about: OPI's future leasing activity and pipeline and options to address upcoming debt maturities. Forward-looking statements reflect OPI's current expectations, are based on judgments and assumptions, are inherently uncertain and are subject to risks, uncertainties and other factors, which could cause OPI's actual results, performance or achievements to differ materially from expected future results, performance or achievements expressed or implied in those forward-looking statements. Some of the risks, uncertainties and other factors that may cause OPI's actual results, performance or achievements to differ materially from those expressed or implied by forward-looking statements include, but are not limited to, the following: OPI's ability to make required payments on debt or refinance debts as they mature or otherwise become due; OPI's ability to maintain sufficient liquidity, including the availability of borrowings under its revolving credit facility and its ability to obtain new debt financing, and otherwise manage leverage; OPI's ability to comply with the terms of its debt agreements and meet financial covenants; OPI’s ability to effectively raise and balance its use of debt and equity capital; the extent to which changes and trends in office space utilization and needs, including due to remote work arrangements, continue to impact demand for office space at OPI’s properties; whether OPI’s tenants will renew or extend their leases and not exercise early termination options pursuant to their leases or that OPI will obtain replacement tenants on terms as favorable to OPI as its prior leases; OPI’s ability to increase or maintain occupancy at its properties on terms desirable to OPI, and OPI’s ability to increase rents when its leases expire or renew; competition within the commercial real estate industry, particularly in the markets in which OPI’s properties are located; the impact of unfavorable market and commercial real estate industry conditions due to high interest rates, prolonged high inflation, labor market challenges, supply chain disruptions, volatility in the public equity and debt markets and in commercial real estate markets, generally and in the sectors OPI operates, geopolitical instability and tensions, economic downturns or a possible recession or changes in real estate utilization, among other things, on OPI and its tenants; the likelihood that OPI's tenants will pay rent or be negatively impacted by continuing unfavorable market and commercial real estate industry conditions or government budget constraints; OPI's ability to manage its capital expenditures and other operating costs effectively and to maintain and enhance its properties and their appeal to tenants; the financial strength of OPI's tenants; OPI’s ability to sell properties at prices it targets; OPI's tenant and geographic concentration; risks and uncertainties regarding the costs and timing of development, redevelopment and repositioning activities, including as a result of prolonged high inflation, cost overruns, supply chain challenges, labor shortages, construction delays or inability to obtain necessary permits or volatility in the commercial real estate markets; OPI's ability to acquire properties that realize its targeted returns; OPI's credit ratings; OPI's ability to pay distributions to its shareholders and to maintain or increase the amount of such distributions; the ability of OPI's manager, The RMR Group LLC (“RMR”), to successfully manage OPI; compliance with, and changes to, federal, state and local laws and regulations, accounting rules, tax laws and similar matters; the impact of any U.S. government shutdown or failure to increase the government debt ceiling on OPI's ability to collect rents and pay its operating expenses, debt obligations and distributions to shareholders on a timely basis; actual and potential conflicts of interest with OPI's related parties, including its Managing Trustees, RMR, Sonesta International Hotels Corporation, and others affiliated with them; limitations imposed by and OPI's ability to satisfy complex rules to maintain OPI's qualification for taxation as a REIT for U.S. federal income tax purposes; acts of terrorism, outbreaks of pandemics or other public health safety events or conditions, war or other hostilities, global climate change or other manmade or natural disasters beyond OPI's control; and other matters. These risks, uncertainties and other factors are not exhaustive and should be read in conjunction with other cautionary statements that are included in OPI's periodic filings. The information contained in OPI's filings with the SEC, including under the caption "Risk Factors" in its periodic reports, or incorporated therein, identifies other important factors that could cause differences from the forward-looking statements in this presentation. OPI's filings with the SEC are available on the SEC's website at www.sec.gov. You should not place undue reliance upon OPI's forward-looking statements. Except as required by law, OPI does not intend to update or change any forward-looking statements as a result of new information, future events or otherwise. Notes Regarding Certain Information in this Presentation This presentation contains industry and statistical data that OPI obtained from various third party sources. Nothing in the data used or derived from third party sources should be construed as investment advice. Some data and other information presented are also based on our good faith estimates and beliefs, derived from our review of internal surveys and independent sources and our experience. OPI believes that these external sources, estimates and beliefs are reliable and reasonable, but OPI has not independently verified them. Although OPI is not aware of any misstatements regarding the data presented herein, these estimates and beliefs involve inherent risks and uncertainties and are based on assumptions that are subject to change. Unless otherwise expressly noted, (1) all data presented are as of or for the three months ended March 31, 2024, (2) references to “weighted average” mean a weighted average by annualized rental income, (3) references to “annualized rental income” mean the annualized contractual rents, as of March 31, 2024, including straight line rent adjustments and excluding lease value amortization, adjusted for tenant concessions, including free rent and amounts reimbursed to tenants, plus estimated recurring expense reimbursements from tenants (annualized rental income may differ from actual historical rental revenues calculated pursuant to U.S. Generally Accepted Accounting Principles, or GAAP), and (4) all data presented excludes three properties, which are encumbered by $82 million of mortgage notes, owned by two unconsolidated joint ventures in which OPI owns 51% and 50% interests. Non-GAAP Financial Measures This presentation contains non-GAAP financial measures including NOI, Cash Basis NOI, Same Property NOI, Same Property Cash Basis NOI, EBITDA, EBITDAre, Adjusted EBITDAre, FFO, Normalized FFO and CAD. Calculations of, and reconciliations for these metrics to the closest GAAP metrics, are included in an Appendix hereto. OPI believes these measures provide useful information to investors because by excluding the effects of certain historical amounts, such as depreciation and amortization expense, they may facilitate a comparison of OPI's operating performance between periods and with other REITs and, in the case of NOI, Cash Basis NOI, Same Property NOI and Same Property Cash Basis NOI reflecting only those income and expense items that are generated and incurred at the property level may help both investors and management to understand the operations of OPI's properties. Please refer to Non-GAAP Financial Measures and Certain Definitions in the Appendix for terms used throughout this presentation. WARNING REGARDING FORWARD LOOKING STATEMENTS, DISCLAIMERS AND NON-GAAP FINANCIAL MEASURES |
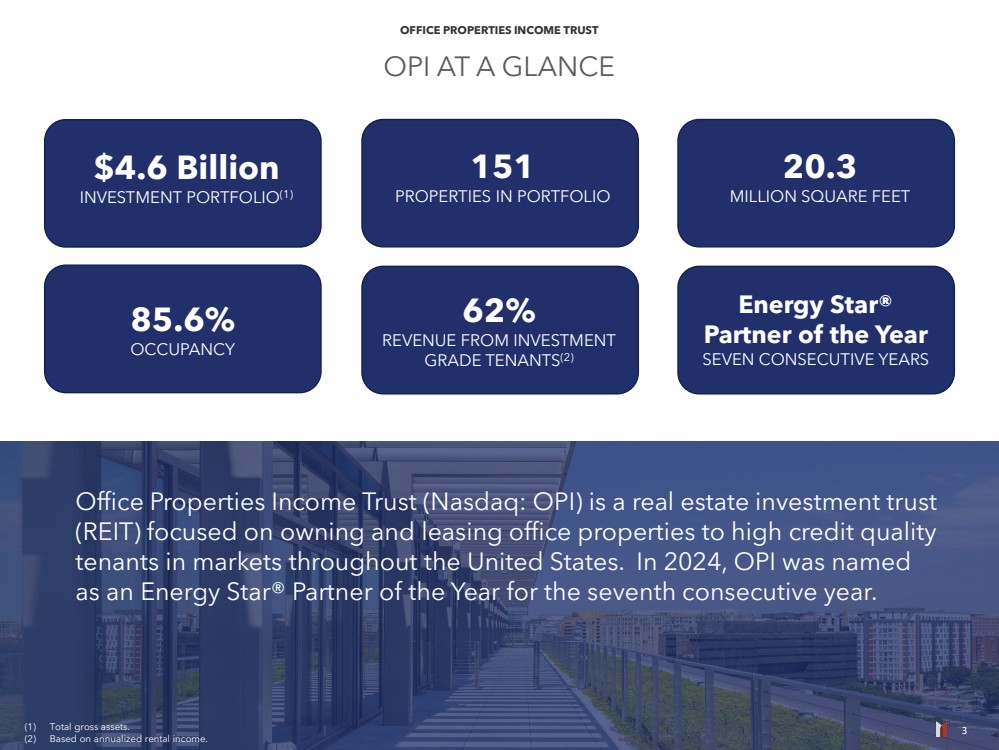
| 3 OFFICE PROPERTIES INCOME TRUST OPI AT A GLANCE 20.3 MILLION SQUARE FEET Energy Star® Partner of the Year SEVEN CONSECUTIVE YEARS $4.6 Billion INVESTMENT PORTFOLIO(1) 85.6% OCCUPANCY 151 PROPERTIES IN PORTFOLIO 62% REVENUE FROM INVESTMENT GRADE TENANTS(2) Office Properties Income Trust (Nasdaq: OPI) is a real estate investment trust (REIT) focused on owning and leasing office properties to high credit quality tenants in markets throughout the United States. In 2024, OPI was named as an Energy Star® Partner of the Year for the seventh consecutive year. (1) Total gross assets. (2) Based on annualized rental income. 3 |
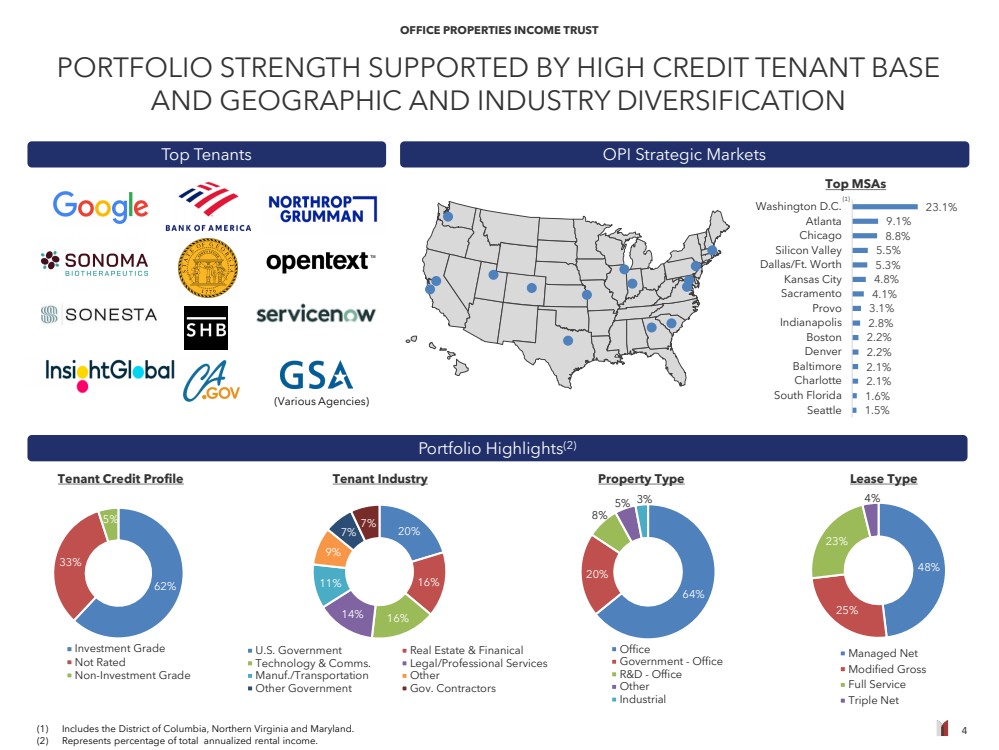
| 4 OFFICE PROPERTIES INCOME TRUST Pho enix PORTFOLIO STRENGTH SUPPORTED BY HIGH CREDIT TENANT BASE AND GEOGRAPHIC AND INDUSTRY DIVERSIFICATION Top MSAs (1) Includes the District of Columbia, Northern Virginia and Maryland. (2) Represents percentage of total annualized rental income. 62% 33% 5% Investment Grade Not Rated Non-Investment Grade 20% 16% 14% 16% 11% 9% 7% 7% U.S. Government Real Estate & Finanical Technology & Comms. Legal/Professional Services Manuf./Transportation Other Other Government Gov. Contractors Top Tenants (Various Agencies) OPI Strategic Markets 1.5% 1.6% 2.1% 2.1% 2.2% 2.2% 2.8% 3.1% 4.1% 4.8% 5.3% 5.5% 8.8% 9.1% 23.1% Seattle South Florida Charlotte Baltimore Denver Boston Indianapolis Provo Sacramento Kansas City Dallas/Ft. Worth Silicon Valley Chicago Atlanta Washington D.C. Portfolio Highlights(2) 64% 20% 8% 5% 3% Office Government - Office R&D - Office Other Industrial 48% 25% 23% 4% Managed Net Modified Gross Full Service Triple Net Tenant Credit Profile Tenant Industry Property Type Lease Type (1) |
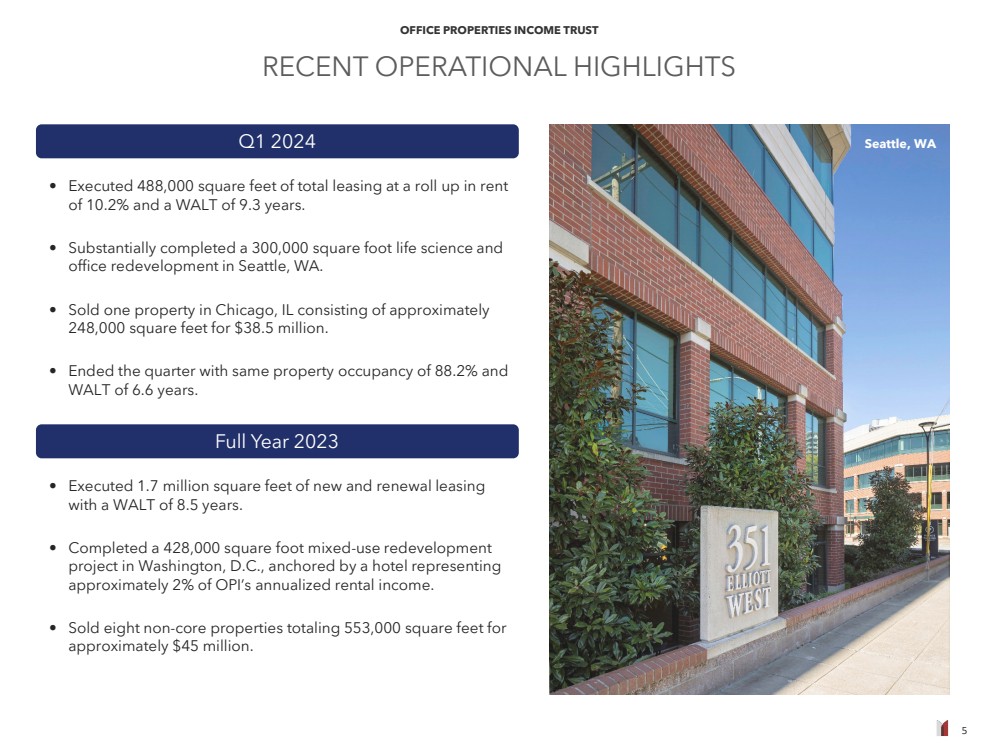
| 5 OFFICE PROPERTIES INCOME TRUST RECENT OPERATIONAL HIGHLIGHTS Q1 2024 • Executed 1.7 million square feet of new and renewal leasing with a WALT of 8.5 years. • Completed a 428,000 square foot mixed-use redevelopment project in Washington, D.C., anchored by a hotel representing approximately 2% of OPI’s annualized rental income. • Sold eight non-core properties totaling 553,000 square feet for approximately $45 million. Seattle, WA Full Year 2023 • Executed 488,000 square feet of total leasing at a roll up in rent of 10.2% and a WALT of 9.3 years. • Substantially completed a 300,000 square foot life science and office redevelopment in Seattle, WA. • Sold one property in Chicago, IL consisting of approximately 248,000 square feet for $38.5 million. • Ended the quarter with same property occupancy of 88.2% and WALT of 6.6 years. |
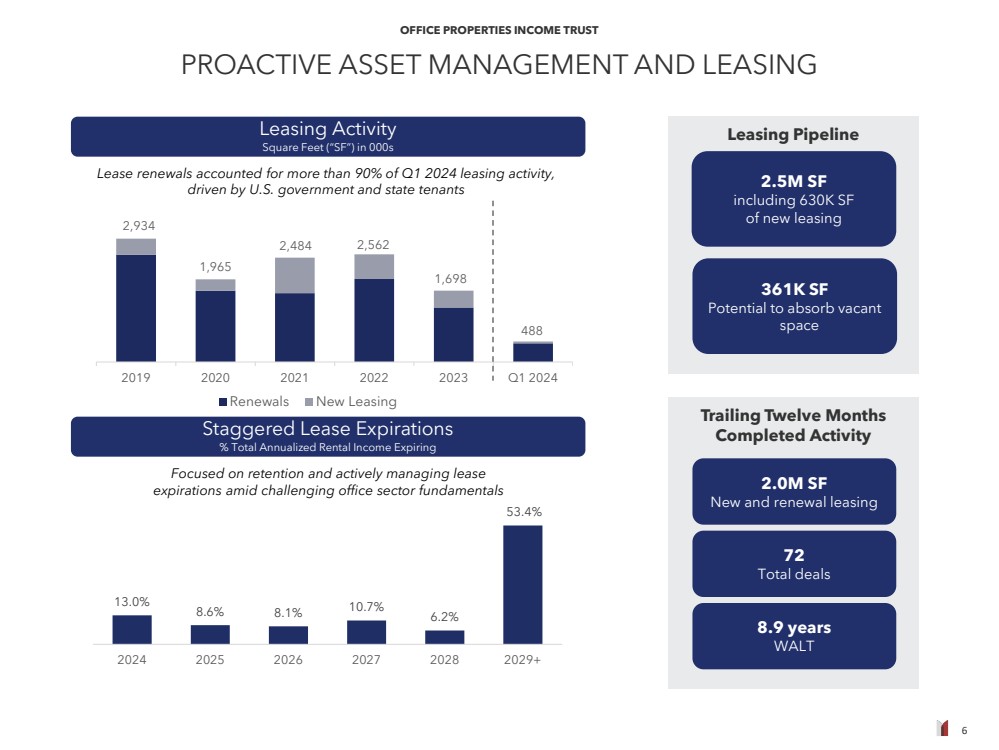
| 6 OFFICE PROPERTIES INCOME TRUST 0 500 1000 1500 2000 2500 3000 3500 2019 2020 2021 2022 2023 Q1 2024 Renewals New Leasing 2.0M SF New and renewal leasing Leasing Activity Square Feet (“SF”) in 000s PROACTIVE ASSET MANAGEMENT AND LEASING Staggered Lease Expirations % Total Annualized Rental Income Expiring 72 Total deals 8.9 years WALT Trailing Twelve Months Completed Activity 2.5M SF including 630K SF of new leasing 361K SF Potential to absorb vacant space Leasing Pipeline Lease renewals accounted for more than 90% of Q1 2024 leasing activity, driven by U.S. government and state tenants Focused on retention and actively managing lease expirations amid challenging office sector fundamentals 2,934 1,965 2,484 2,562 13.0% 8.6% 8.1% 10.7% 6.2% 53.4% 2024 2025 2026 2027 2028 2029+ 1,698 488 |
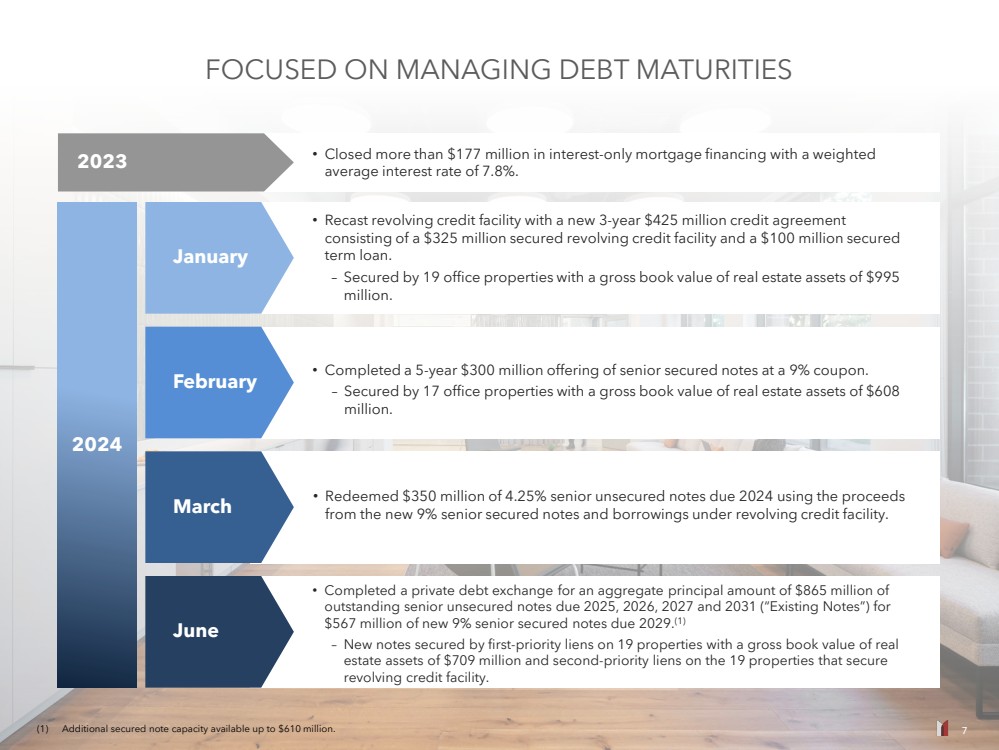
| 7 OFFICE PROPERTIES INCOME TRUST FOCUSED ON MANAGING DEBT MATURITIES January February March June 2023 • Completed a 5-year $300 million offering of senior secured notes at a 9% coupon. – Secured by 17 office properties with a gross book value of real estate assets of $608 million. • Recast revolving credit facility with a new 3-year $425 million credit agreement consisting of a $325 million secured revolving credit facility and a $100 million secured term loan. – Secured by 19 office properties with a gross book value of real estate assets of $995 million. • Redeemed $350 million of 4.25% senior unsecured notes due 2024 using the proceeds from the new 9% senior secured notes and borrowings under revolving credit facility. • Completed a private debt exchange for an aggregate principal amount of $865 million of outstanding senior unsecured notes due 2025, 2026, 2027 and 2031 (“Existing Notes”) for $567 million of new 9% senior secured notes due 2029.(1) – New notes secured by first-priority liens on 19 properties with a gross book value of real estate assets of $709 million and second-priority liens on the 19 properties that secure revolving credit facility. • Closed more than $177 million in interest-only mortgage financing with a weighted average interest rate of 7.8%. 2024 7 (1) Additional secured note capacity available up to $610 million. |
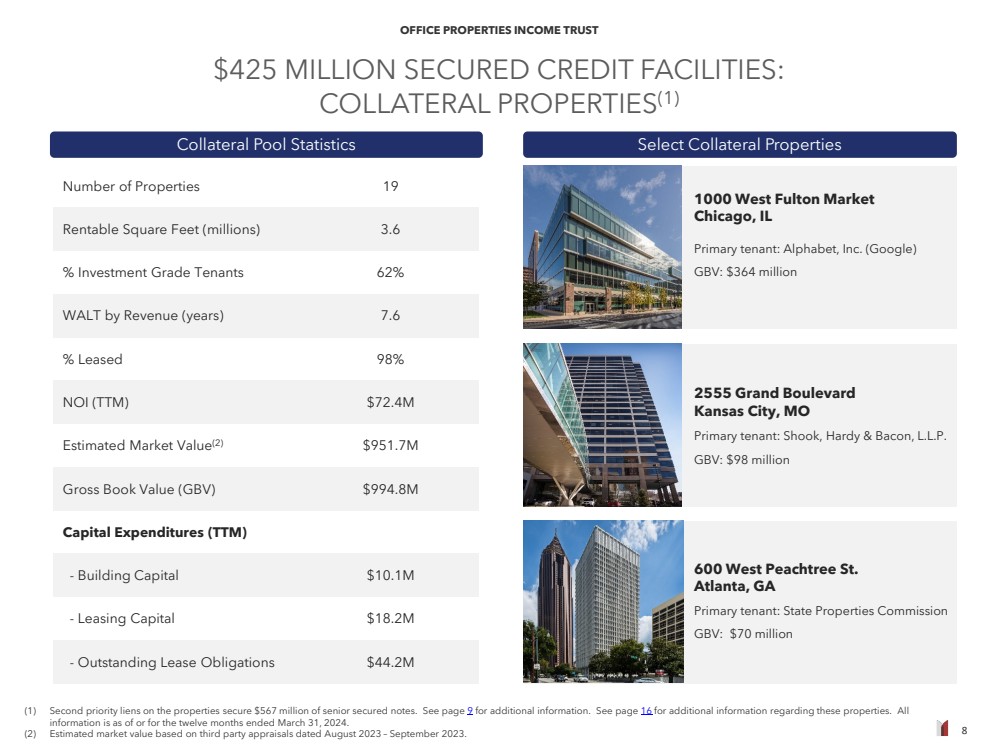
| 8 OFFICE PROPERTIES INCOME TRUST $425 MILLION SECURED CREDIT FACILITIES: COLLATERAL PROPERTIES(1) Collateral Pool Statistics Number of Properties 19 Rentable Square Feet (millions) 3.6 % Investment Grade Tenants 62% WALT by Revenue (years) 7.6 % Leased 98% NOI (TTM) $72.4M Estimated Market Value(2) $951.7M Gross Book Value (GBV) $994.8M Capital Expenditures (TTM) - Building Capital $10.1M - Leasing Capital $18.2M - Outstanding Lease Obligations $44.2M Select Collateral Properties 600 West Peachtree St. Atlanta, GA Primary tenant: State Properties Commission GBV: $70 million 2555 Grand Boulevard Kansas City, MO Primary tenant: Shook, Hardy & Bacon, L.L.P. GBV: $98 million 1000 West Fulton Market Chicago, IL Primary tenant: Alphabet, Inc. (Google) GBV: $364 million (1) Second priority liens on the properties secure $567 million of senior secured notes. See page 9 for additional information. See page 16 for additional information regarding these properties. All information is as of or for the twelve months ended March 31, 2024. (2) Estimated market value based on third party appraisals dated August 2023 – September 2023. |
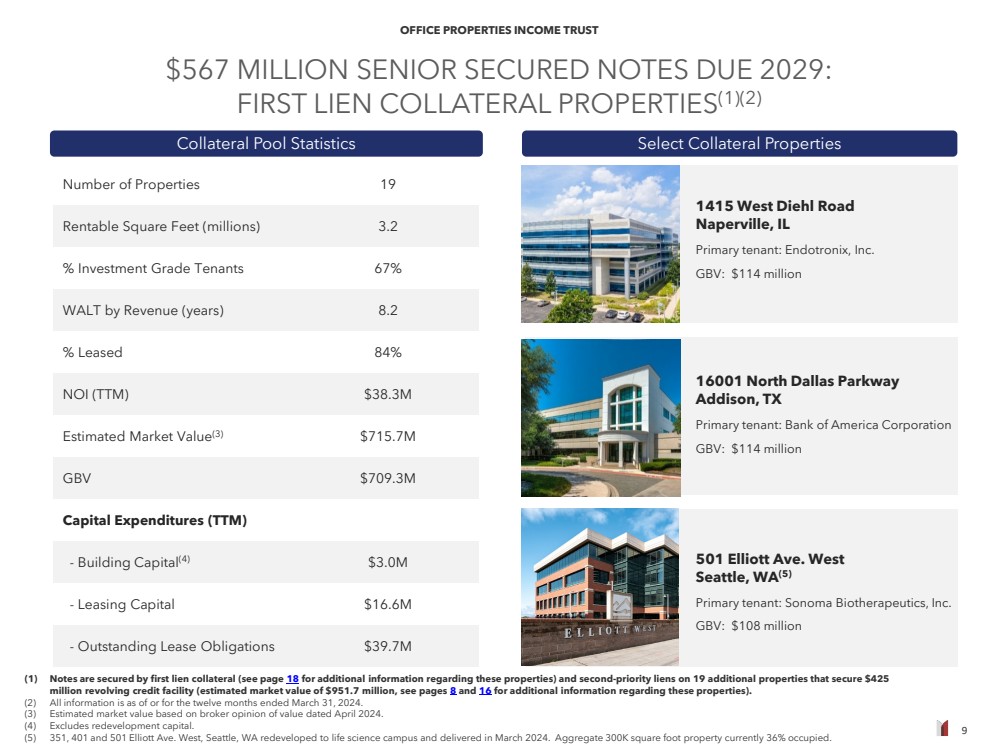
| 9 OFFICE PROPERTIES INCOME TRUST $567 MILLION SENIOR SECURED NOTES DUE 2029: FIRST LIEN COLLATERAL PROPERTIES(1)(2) Collateral Pool Statistics Number of Properties 19 Rentable Square Feet (millions) 3.2 % Investment Grade Tenants 67% WALT by Revenue (years) 8.2 % Leased 84% NOI (TTM) $38.3M Estimated Market Value(3) $715.7M GBV $709.3M Capital Expenditures (TTM) - Building Capital(4) $3.0M - Leasing Capital $16.6M - Outstanding Lease Obligations $39.7M Select Collateral Properties 1415 West Diehl Road Naperville, IL Primary tenant: Endotronix, Inc. GBV: $114 million (1) Notes are secured by first lien collateral (see page 18 for additional information regarding these properties) and second-priority liens on 19 additional properties that secure $425 million revolving credit facility (estimated market value of $951.7 million, see pages 8 and 16 for additional information regarding these properties). (2) All information is as of or for the twelve months ended March 31, 2024. (3) Estimated market value based on broker opinion of value dated April 2024. (4) Excludes redevelopment capital. (5) 351, 401 and 501 Elliott Ave. West, Seattle, WA redeveloped to life science campus and delivered in March 2024. Aggregate 300K square foot property currently 36% occupied. 16001 North Dallas Parkway Addison, TX Primary tenant: Bank of America Corporation GBV: $114 million 501 Elliott Ave. West Seattle, WA(5) Primary tenant: Sonoma Biotherapeutics, Inc. GBV: $108 million |
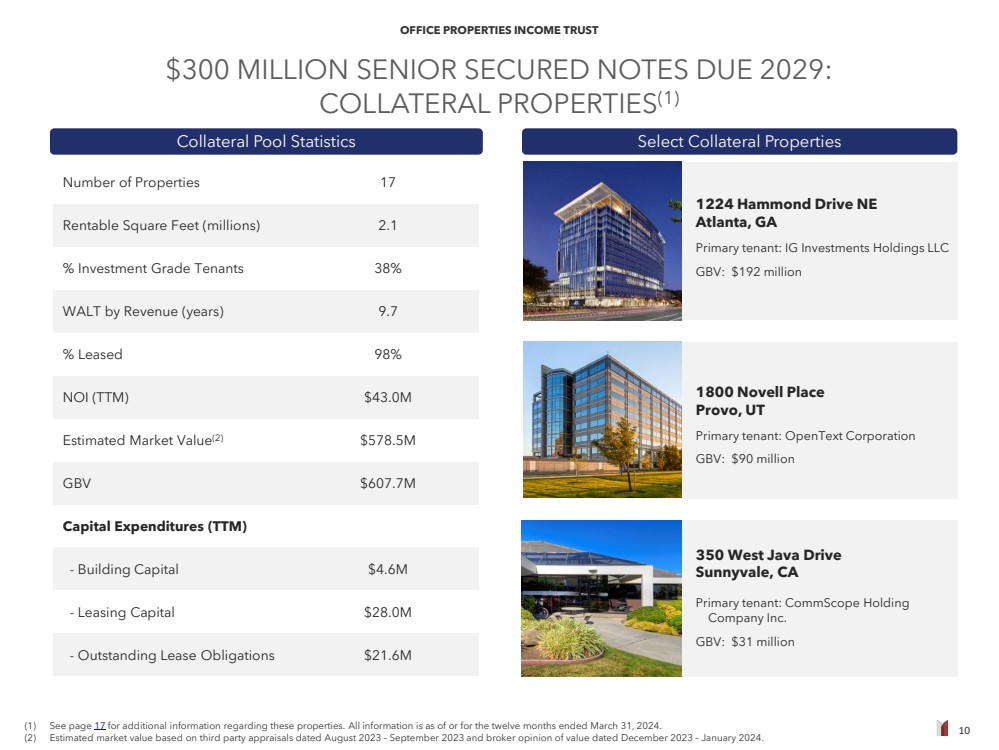
| 10 OFFICE PROPERTIES INCOME TRUST $300 MILLION SENIOR SECURED NOTES DUE 2029: COLLATERAL PROPERTIES(1) Collateral Pool Statistics Number of Properties 17 Rentable Square Feet (millions) 2.1 % Investment Grade Tenants 38% WALT by Revenue (years) 9.7 % Leased 98% NOI (TTM) $43.0M Estimated Market Value(2) $578.5M GBV $607.7M Capital Expenditures (TTM) - Building Capital $4.6M - Leasing Capital $28.0M - Outstanding Lease Obligations $21.6M Select Collateral Properties 1224 Hammond Drive NE Atlanta, GA Primary tenant: IG Investments Holdings LLC GBV: $192 million 1800 Novell Place Provo, UT Primary tenant: OpenText Corporation GBV: $90 million 350 West Java Drive Sunnyvale, CA Primary tenant: CommScope Holding Company Inc. GBV: $31 million (1) See page 17 for additional information regarding these properties. All information is as of or for the twelve months ended March 31, 2024. (2) Estimated market value based on third party appraisals dated August 2023 – September 2023 and broker opinion of value dated December 2023 – January 2024. |
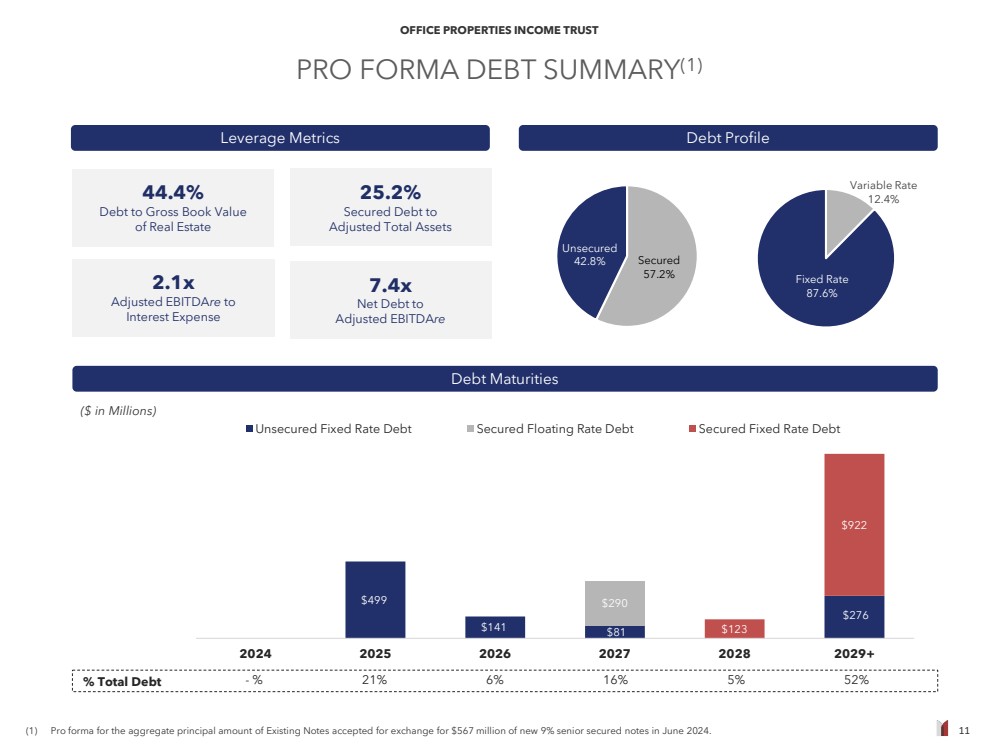
| 11 OFFICE PROPERTIES INCOME TRUST PRO FORMA DEBT SUMMARY(1) $499 $141 $81 $276 $290 $123 $922 2024 2025 2026 2027 2028 2029+ Unsecured Fixed Rate Debt Secured Floating Rate Debt Secured Fixed Rate Debt ($ in Millions) Variable Rate 12.4% Fixed Rate 87.6% Secured 57.2% Unsecured 42.8% (1) Pro forma for the aggregate principal amount of Existing Notes accepted for exchange for $567 million of new 9% senior secured notes in June 2024. Debt Profile Debt Maturities % Total Debt - % 21% 6% 16% 5% 52% Leverage Metrics 44.4% Debt to Gross Book Value of Real Estate 2.1x Adjusted EBITDAre to Interest Expense 25.2% Secured Debt to Adjusted Total Assets 7.4x Net Debt to Adjusted EBITDAre |
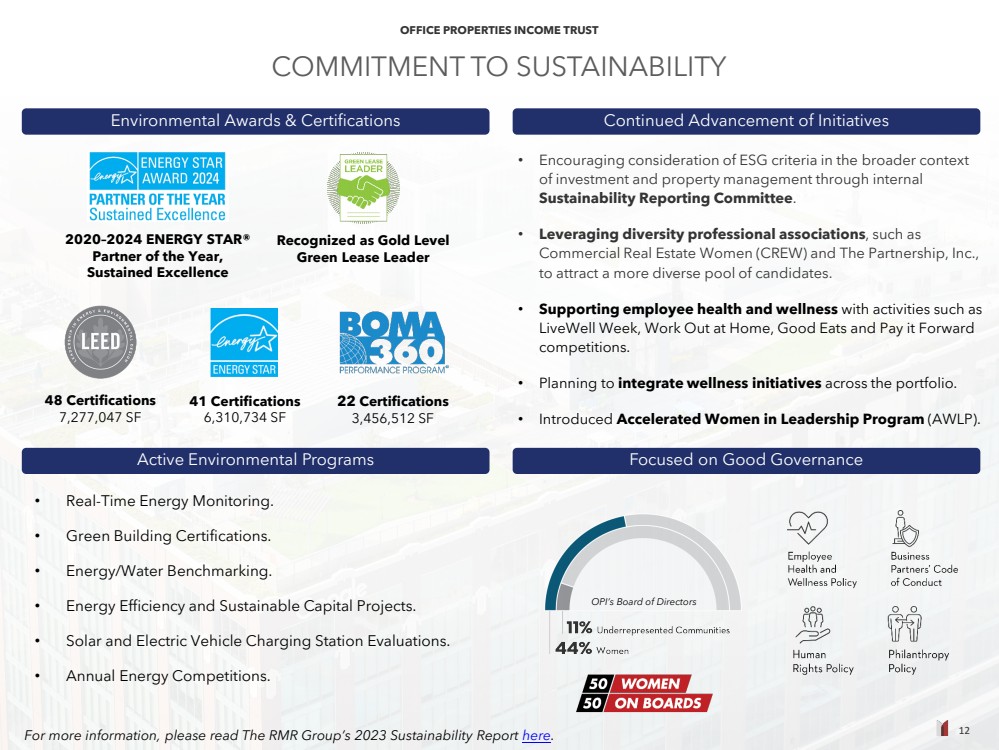
| 12 OFFICE PROPERTIES INCOME TRUST COMMITMENT TO SUSTAINABILITY • Encouraging consideration of ESG criteria in the broader context of investment and property management through internal Sustainability Reporting Committee. • Leveraging diversity professional associations, such as Commercial Real Estate Women (CREW) and The Partnership, Inc., to attract a more diverse pool of candidates. • Supporting employee health and wellness with activities such as LiveWell Week, Work Out at Home, Good Eats and Pay it Forward competitions. • Planning to integrate wellness initiatives across the portfolio. • Introduced Accelerated Women in Leadership Program (AWLP). 48 Certifications 7,277,047 SF 2020–2024 ENERGY STAR® Partner of the Year, Sustained Excellence 41 Certifications 6,310,734 SF 22 Certifications 3,456,512 SF • Real-Time Energy Monitoring. • Green Building Certifications. • Energy/Water Benchmarking. • Energy Efficiency and Sustainable Capital Projects. • Solar and Electric Vehicle Charging Station Evaluations. • Annual Energy Competitions. OPI’s Board of Directors Continued Advancement of Initiatives Active Environmental Programs Focused on Good Governance Environmental Awards & Certifications For more information, please read The RMR Group’s 2023 Sustainability Report here. Recognized as Gold Level Green Lease Leader 12 |
| 13 OFFICE PROPERTIES INCOME TRUST San Jose, CA Financials |

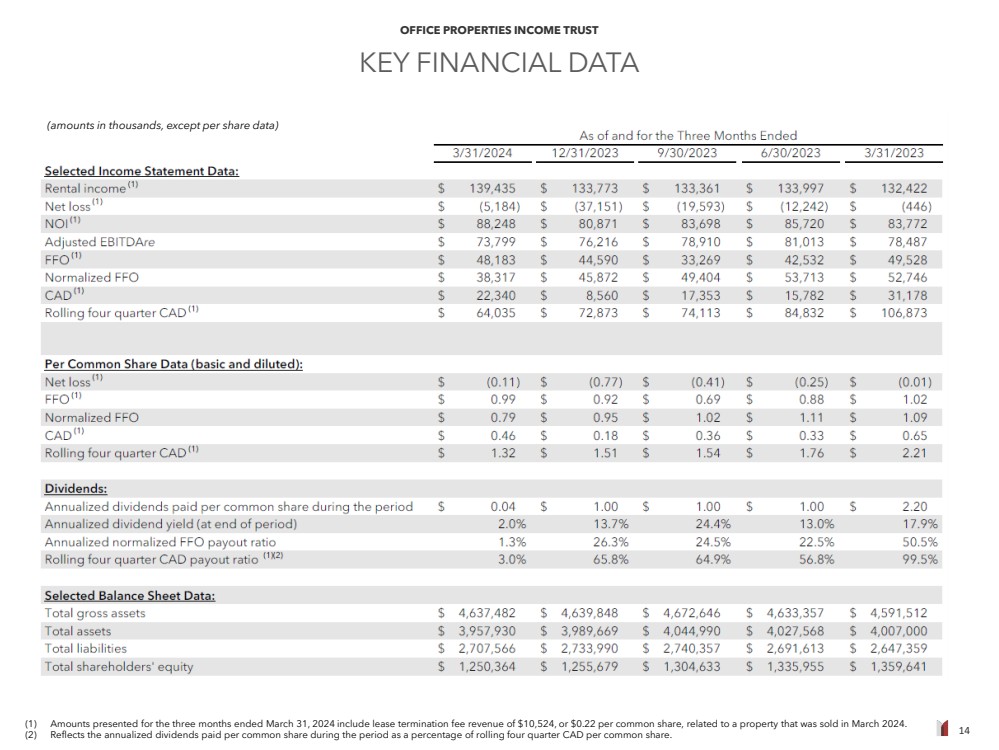
| 14 OFFICE PROPERTIES INCOME TRUST KEY FINANCIAL DATA (1) Amounts presented for the three months ended March 31, 2024 include lease termination fee revenue of $10,524, or $0.22 per common share, related to a property that was sold in March 2024. (2) Reflects the annualized dividends paid per common share during the period as a percentage of rolling four quarter CAD per common share. (amounts in thousands, except per share data) |
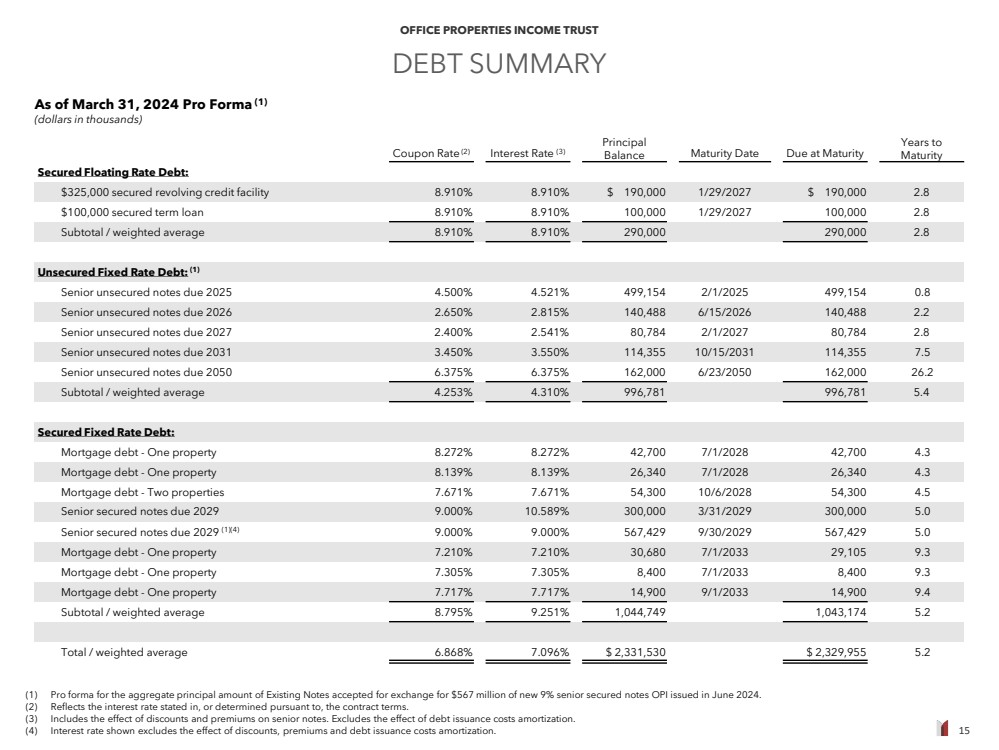
| 15 OFFICE PROPERTIES INCOME TRUST DEBT SUMMARY (1) Pro forma for the aggregate principal amount of Existing Notes accepted for exchange for $567 million of new 9% senior secured notes OPI issued in June 2024. (2) Reflects the interest rate stated in, or determined pursuant to, the contract terms. (3) Includes the effect of discounts and premiums on senior notes. Excludes the effect of debt issuance costs amortization. (4) Interest rate shown excludes the effect of discounts, premiums and debt issuance costs amortization. Coupon Rate (2) Interest Rate (3) Principal Balance Maturity Date Due at Maturity Years to Maturity Secured Floating Rate Debt: $325,000 secured revolving credit facility 8.910% 8.910% $ 190,000 1/29/2027 $ 190,000 2.8 $100,000 secured term loan 8.910% 8.910% 100,000 1/29/2027 100,000 2.8 Subtotal / weighted average 8.910% 8.910% 290,000 290,000 2.8 Unsecured Fixed Rate Debt: (1) Senior unsecured notes due 2025 4.500% 4.521% 499,154 2/1/2025 499,154 0.8 Senior unsecured notes due 2026 2.650% 2.815% 140,488 6/15/2026 140,488 2.2 Senior unsecured notes due 2027 2.400% 2.541% 80,784 2/1/2027 80,784 2.8 Senior unsecured notes due 2031 3.450% 3.550% 114,355 10/15/2031 114,355 7.5 Senior unsecured notes due 2050 6.375% 6.375% 162,000 6/23/2050 162,000 26.2 Subtotal / weighted average 4.253% 4.310% 996,781 996,781 5.4 Secured Fixed Rate Debt: Mortgage debt - One property 8.272% 8.272% 42,700 7/1/2028 42,700 4.3 Mortgage debt - One property 8.139% 8.139% 26,340 7/1/2028 26,340 4.3 Mortgage debt - Two properties 7.671% 7.671% 54,300 10/6/2028 54,300 4.5 Senior secured notes due 2029 9.000% 10.589% 300,000 3/31/2029 300,000 5.0 Senior secured notes due 2029 (1)(4) 9.000% 9.000% 567,429 9/30/2029 567,429 5.0 Mortgage debt - One property 7.210% 7.210% 30,680 7/1/2033 29,105 9.3 Mortgage debt - One property 7.305% 7.305% 8,400 7/1/2033 8,400 9.3 Mortgage debt - One property 7.717% 7.717% 14,900 9/1/2033 14,900 9.4 Subtotal / weighted average 8.795% 9.251% 1,044,749 1,043,174 5.2 Total / weighted average 6.868% 7.096% $ 2,331,530 $ 2,329,955 5.2 As of March 31, 2024 Pro Forma (1) (dollars in thousands) |
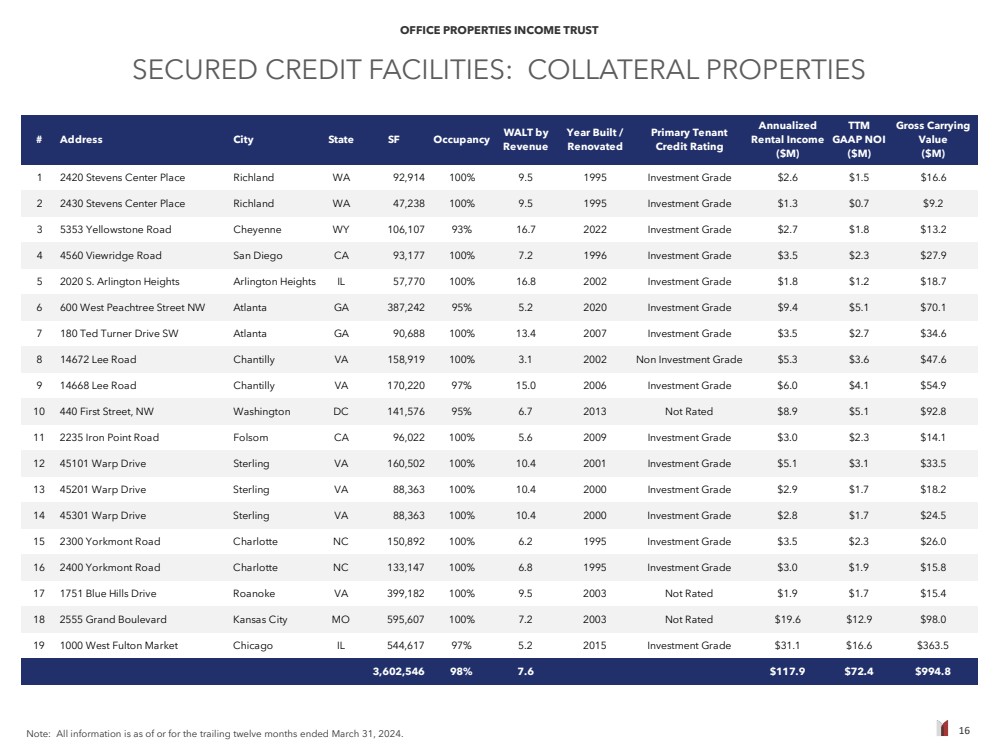
| 16 OFFICE PROPERTIES INCOME TRUST SECURED CREDIT FACILITIES: COLLATERAL PROPERTIES Note: All information is as of or for the trailing twelve months ended March 31, 2024. # Address City State SF Occupancy WALT by Revenue Year Built / Renovated Primary Tenant Credit Rating Annualized Rental Income ($M) TTM GAAP NOI ($M) Gross Carrying Value ($M) 1 2420 Stevens Center Place Richland WA 92,914 100% 9.5 1995 Investment Grade $2.6 $1.5 $16.6 2 2430 Stevens Center Place Richland WA 47,238 100% 9.5 1995 Investment Grade $1.3 $0.7 $9.2 3 5353 Yellowstone Road Cheyenne WY 106,107 93% 16.7 2022 Investment Grade $2.7 $1.8 $13.2 4 4560 Viewridge Road San Diego CA 93,177 100% 7.2 1996 Investment Grade $3.5 $2.3 $27.9 5 2020 S. Arlington Heights Arlington Heights IL 57,770 100% 16.8 2002 Investment Grade $1.8 $1.2 $18.7 6 600 West Peachtree Street NW Atlanta GA 387,242 95% 5.2 2020 Investment Grade $9.4 $5.1 $70.1 7 180 Ted Turner Drive SW Atlanta GA 90,688 100% 13.4 2007 Investment Grade $3.5 $2.7 $34.6 8 14672 Lee Road Chantilly VA 158,919 100% 3.1 2002 Non Investment Grade $5.3 $3.6 $47.6 9 14668 Lee Road Chantilly VA 170,220 97% 15.0 2006 Investment Grade $6.0 $4.1 $54.9 10 440 First Street, NW Washington DC 141,576 95% 6.7 2013 Not Rated $8.9 $5.1 $92.8 11 2235 Iron Point Road Folsom CA 96,022 100% 5.6 2009 Investment Grade $3.0 $2.3 $14.1 12 45101 Warp Drive Sterling VA 160,502 100% 10.4 2001 Investment Grade $5.1 $3.1 $33.5 13 45201 Warp Drive Sterling VA 88,363 100% 10.4 2000 Investment Grade $2.9 $1.7 $18.2 14 45301 Warp Drive Sterling VA 88,363 100% 10.4 2000 Investment Grade $2.8 $1.7 $24.5 15 2300 Yorkmont Road Charlotte NC 150,892 100% 6.2 1995 Investment Grade $3.5 $2.3 $26.0 16 2400 Yorkmont Road Charlotte NC 133,147 100% 6.8 1995 Investment Grade $3.0 $1.9 $15.8 17 1751 Blue Hills Drive Roanoke VA 399,182 100% 9.5 2003 Not Rated $1.9 $1.7 $15.4 18 2555 Grand Boulevard Kansas City MO 595,607 100% 7.2 2003 Not Rated $19.6 $12.9 $98.0 19 1000 West Fulton Market Chicago IL 544,617 97% 5.2 2015 Investment Grade $31.1 $16.6 $363.5 3,602,546 98% 7.6 $117.9 $72.4 $994.8 |
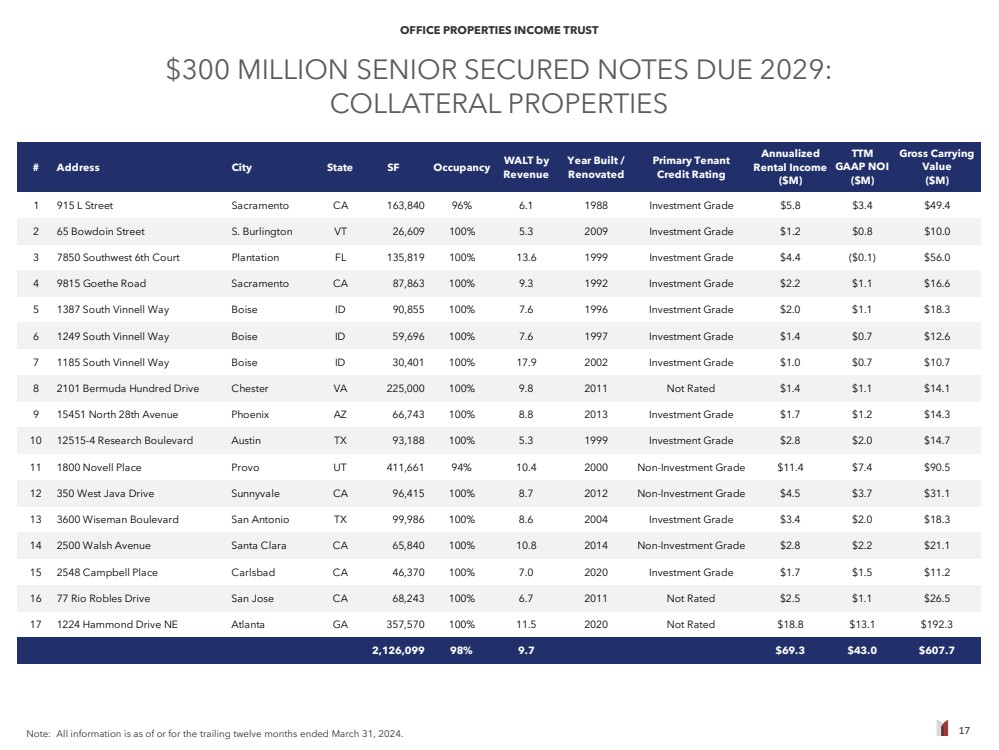
| 17 OFFICE PROPERTIES INCOME TRUST $300 MILLION SENIOR SECURED NOTES DUE 2029: COLLATERAL PROPERTIES Note: All information is as of or for the trailing twelve months ended March 31, 2024. # Address City State SF Occupancy WALT by Revenue Year Built / Renovated Primary Tenant Credit Rating Annualized Rental Income ($M) TTM GAAP NOI ($M) Gross Carrying Value ($M) 1 915 L Street Sacramento CA 163,840 96% 6.1 1988 Investment Grade $5.8 $3.4 $49.4 2 65 Bowdoin Street S. Burlington VT 26,609 100% 5.3 2009 Investment Grade $1.2 $0.8 $10.0 3 7850 Southwest 6th Court Plantation FL 135,819 100% 13.6 1999 Investment Grade $4.4 ($0.1) $56.0 4 9815 Goethe Road Sacramento CA 87,863 100% 9.3 1992 Investment Grade $2.2 $1.1 $16.6 5 1387 South Vinnell Way Boise ID 90,855 100% 7.6 1996 Investment Grade $2.0 $1.1 $18.3 6 1249 South Vinnell Way Boise ID 59,696 100% 7.6 1997 Investment Grade $1.4 $0.7 $12.6 7 1185 South Vinnell Way Boise ID 30,401 100% 17.9 2002 Investment Grade $1.0 $0.7 $10.7 8 2101 Bermuda Hundred Drive Chester VA 225,000 100% 9.8 2011 Not Rated $1.4 $1.1 $14.1 9 15451 North 28th Avenue Phoenix AZ 66,743 100% 8.8 2013 Investment Grade $1.7 $1.2 $14.3 10 12515-4 Research Boulevard Austin TX 93,188 100% 5.3 1999 Investment Grade $2.8 $2.0 $14.7 11 1800 Novell Place Provo UT 411,661 94% 10.4 2000 Non-Investment Grade $11.4 $7.4 $90.5 12 350 West Java Drive Sunnyvale CA 96,415 100% 8.7 2012 Non-Investment Grade $4.5 $3.7 $31.1 13 3600 Wiseman Boulevard San Antonio TX 99,986 100% 8.6 2004 Investment Grade $3.4 $2.0 $18.3 14 2500 Walsh Avenue Santa Clara CA 65,840 100% 10.8 2014 Non-Investment Grade $2.8 $2.2 $21.1 15 2548 Campbell Place Carlsbad CA 46,370 100% 7.0 2020 Investment Grade $1.7 $1.5 $11.2 16 77 Rio Robles Drive San Jose CA 68,243 100% 6.7 2011 Not Rated $2.5 $1.1 $26.5 17 1224 Hammond Drive NE Atlanta GA 357,570 100% 11.5 2020 Not Rated $18.8 $13.1 $192.3 2,126,099 98% 9.7 $69.3 $43.0 $607.7 |
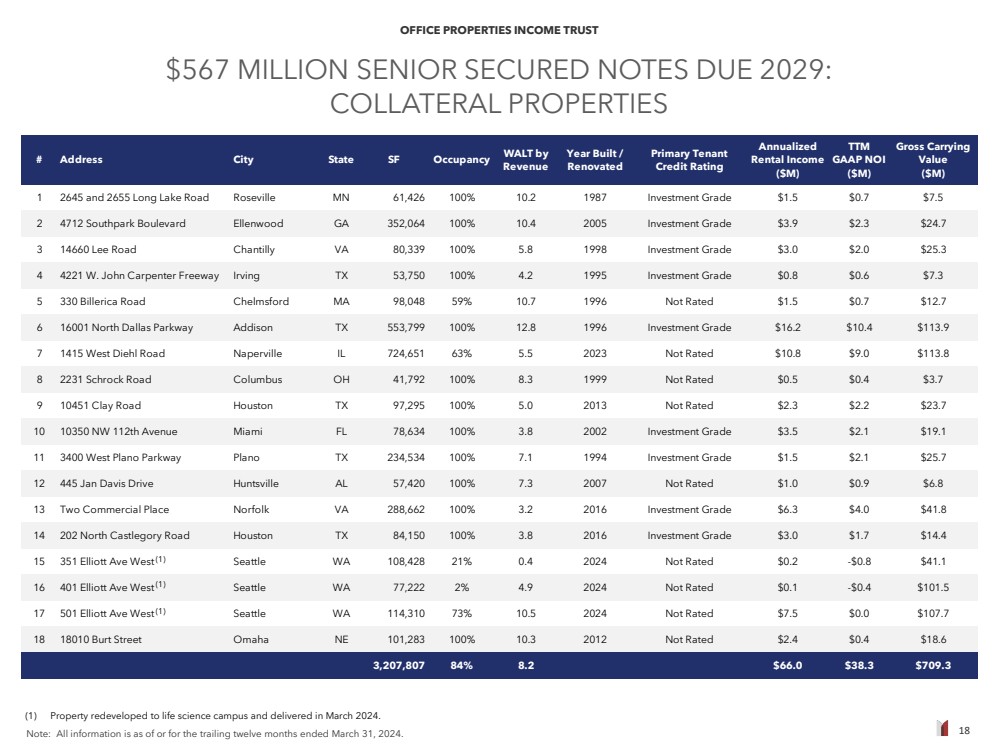
| 18 OFFICE PROPERTIES INCOME TRUST $567 MILLION SENIOR SECURED NOTES DUE 2029: COLLATERAL PROPERTIES Note: All information is as of or for the trailing twelve months ended March 31, 2024. (1) Property redeveloped to life science campus and delivered in March 2024. # Address City State SF Occupancy WALT by Revenue Year Built / Renovated Primary Tenant Credit Rating Annualized Rental Income ($M) TTM GAAP NOI ($M) Gross Carrying Value ($M) 1 2645 and 2655 Long Lake Road Roseville MN 61,426 100% 10.2 1987 Investment Grade $1.5 $0.7 $7.5 2 4712 Southpark Boulevard Ellenwood GA 352,064 100% 10.4 2005 Investment Grade $3.9 $2.3 $24.7 3 14660 Lee Road Chantilly VA 80,339 100% 5.8 1998 Investment Grade $3.0 $2.0 $25.3 4 4221 W. John Carpenter Freeway Irving TX 53,750 100% 4.2 1995 Investment Grade $0.8 $0.6 $7.3 5 330 Billerica Road Chelmsford MA 98,048 59% 10.7 1996 Not Rated $1.5 $0.7 $12.7 6 16001 North Dallas Parkway Addison TX 553,799 100% 12.8 1996 Investment Grade $16.2 $10.4 $113.9 7 1415 West Diehl Road Naperville IL 724,651 63% 5.5 2023 Not Rated $10.8 $9.0 $113.8 8 2231 Schrock Road Columbus OH 41,792 100% 8.3 1999 Not Rated $0.5 $0.4 $3.7 9 10451 Clay Road Houston TX 97,295 100% 5.0 2013 Not Rated $2.3 $2.2 $23.7 10 10350 NW 112th Avenue Miami FL 78,634 100% 3.8 2002 Investment Grade $3.5 $2.1 $19.1 11 3400 West Plano Parkway Plano TX 234,534 100% 7.1 1994 Investment Grade $1.5 $2.1 $25.7 12 445 Jan Davis Drive Huntsville AL 57,420 100% 7.3 2007 Not Rated $1.0 $0.9 $6.8 13 Two Commercial Place Norfolk VA 288,662 100% 3.2 2016 Investment Grade $6.3 $4.0 $41.8 14 202 North Castlegory Road Houston TX 84,150 100% 3.8 2016 Investment Grade $3.0 $1.7 $14.4 15 351 Elliott Ave West Seattle WA 108,428 21% 0.4 2024 Not Rated $0.2 -$0.8 $41.1 16 401 Elliott Ave West Seattle WA 77,222 2% 4.9 2024 Not Rated $0.1 -$0.4 $101.5 17 501 Elliott Ave West Seattle WA 114,310 73% 10.5 2024 Not Rated $7.5 $0.0 $107.7 18 18010 Burt Street Omaha NE 101,283 100% 10.3 2012 Not Rated $2.4 $0.4 $18.6 3,207,807 84% 8.2 $66.0 $38.3 $709.3 (1) (1) (1) |
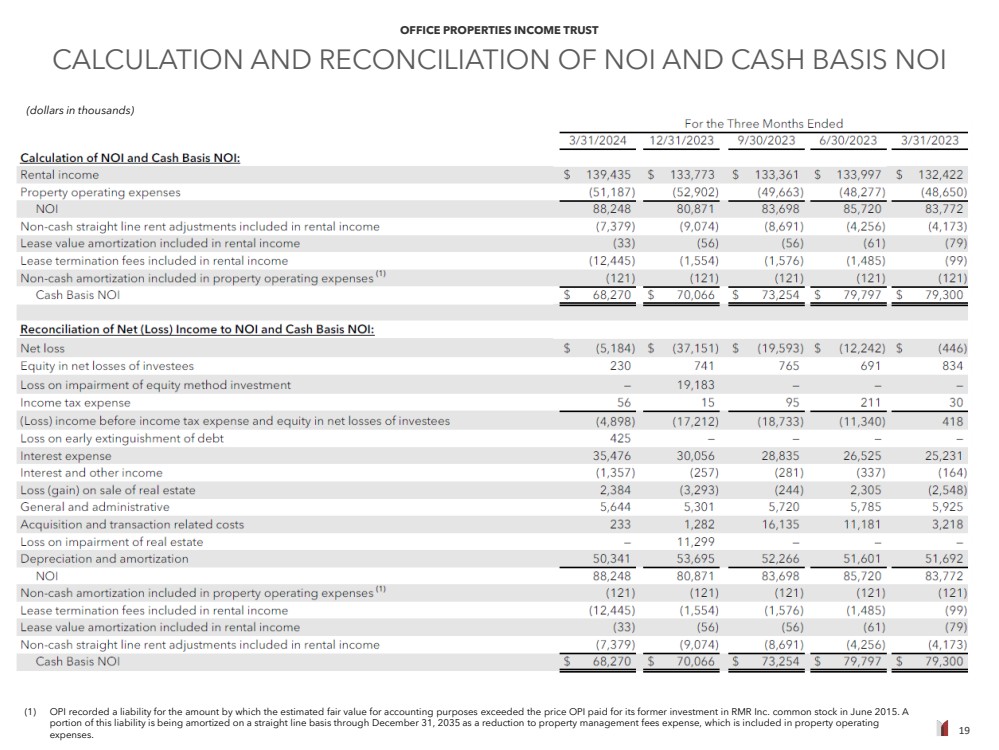
| 19 OFFICE PROPERTIES INCOME TRUST CALCULATION AND RECONCILIATION OF NOI AND CASH BASIS NOI (1) OPI recorded a liability for the amount by which the estimated fair value for accounting purposes exceeded the price OPI paid for its former investment in RMR Inc. common stock in June 2015. A portion of this liability is being amortized on a straight line basis through December 31, 2035 as a reduction to property management fees expense, which is included in property operating expenses. (dollars in thousands) |
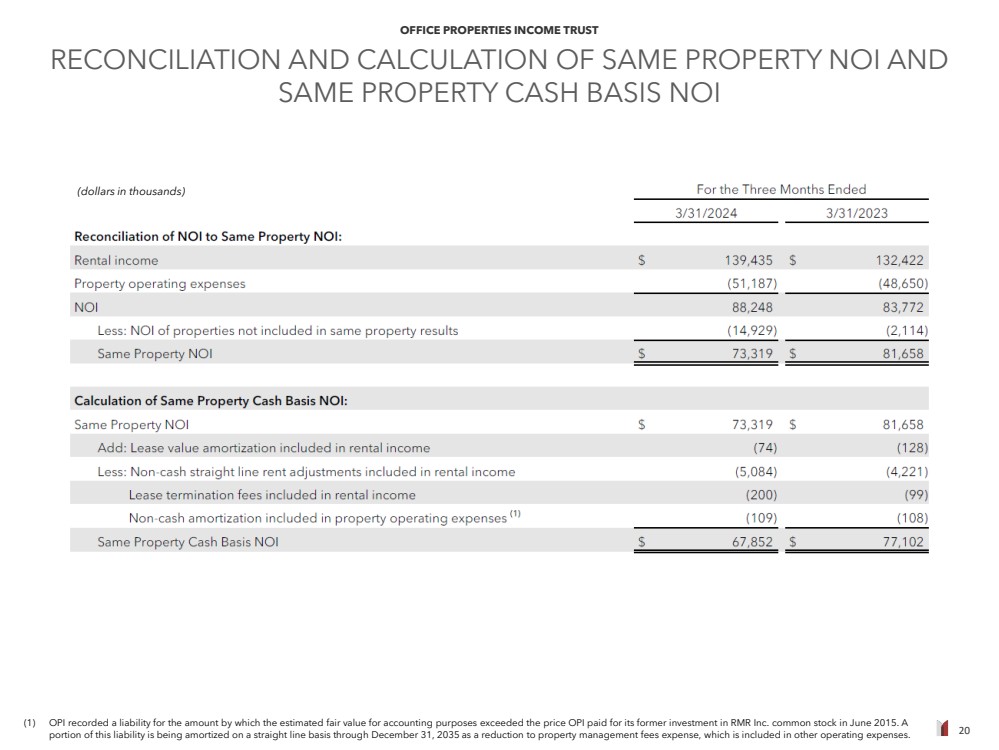
| 20 OFFICE PROPERTIES INCOME TRUST RECONCILIATION AND CALCULATION OF SAME PROPERTY NOI AND SAME PROPERTY CASH BASIS NOI (dollars in thousands) (1) OPI recorded a liability for the amount by which the estimated fair value for accounting purposes exceeded the price OPI paid for its former investment in RMR Inc. common stock in June 2015. A portion of this liability is being amortized on a straight line basis through December 31, 2035 as a reduction to property management fees expense, which is included in other operating expenses. |
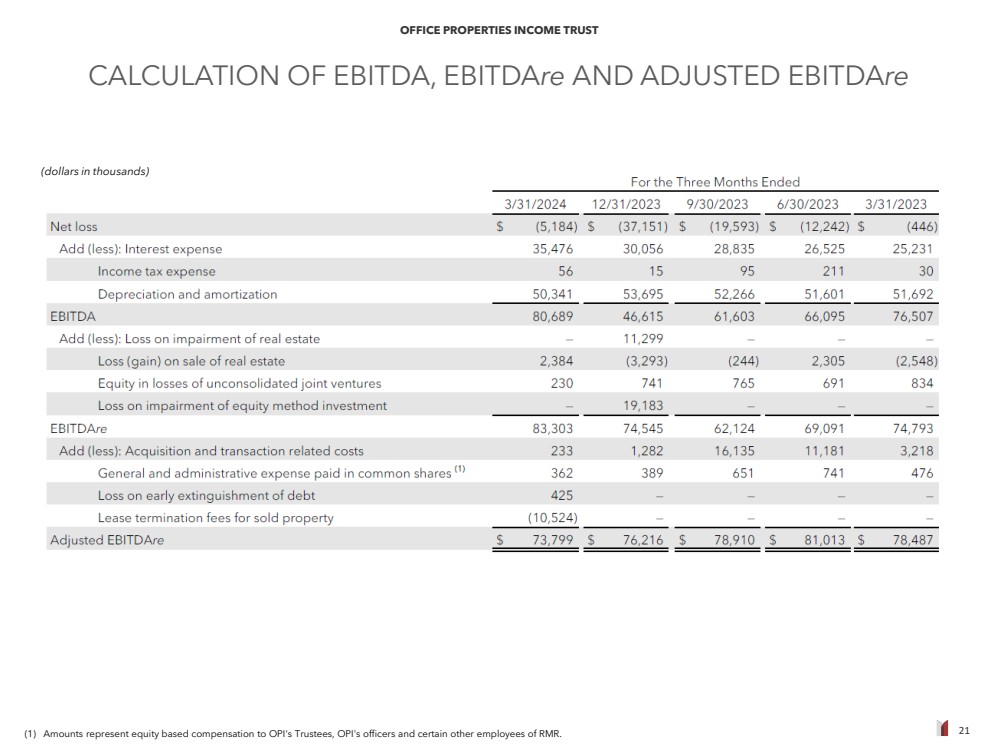
| 21 OFFICE PROPERTIES INCOME TRUST CALCULATION OF EBITDA, EBITDAre AND ADJUSTED EBITDAre (1) Amounts represent equity based compensation to OPI's Trustees, OPI's officers and certain other employees of RMR. (dollars in thousands) |
| 22 OFFICE PROPERTIES INCOME TRUST CALCULATION OF FFO, NORMALIZED FFO AND CAD (1) Non-cash expenses include equity based compensation, adjustments recorded to capitalize interest expense and amortization of the liability for the amount by which the estimated fair value for accounting purposes exceeded the price OPI paid for its former investment in RMR Inc. common stock in June 2015. This liability is being amortized on a straight line basis through December 31, 2035 as an allocated reduction to business management fee expense and property management fee expense, which are included in general and administrative and other operating expenses, respectively. (amounts in thousands, except per share data) |
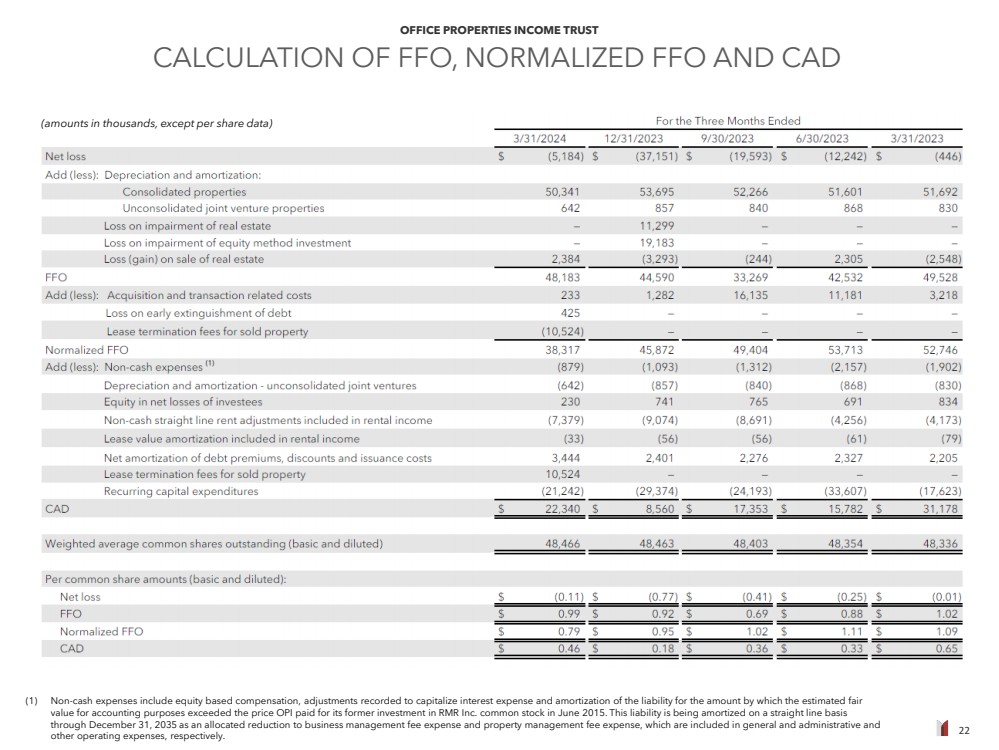
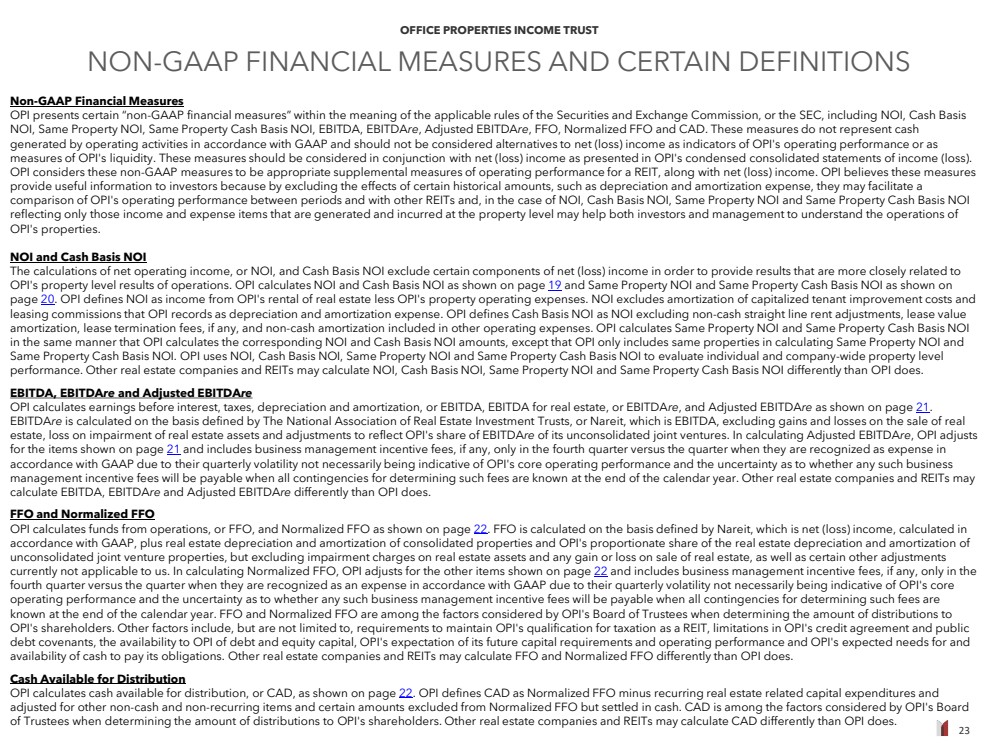
| 23 OFFICE PROPERTIES INCOME TRUST NON-GAAP FINANCIAL MEASURES AND CERTAIN DEFINITIONS Non-GAAP Financial Measures OPI presents certain “non-GAAP financial measures” within the meaning of the applicable rules of the Securities and Exchange Commission, or the SEC, including NOI, Cash Basis NOI, Same Property NOI, Same Property Cash Basis NOI, EBITDA, EBITDAre, Adjusted EBITDAre, FFO, Normalized FFO and CAD. These measures do not represent cash generated by operating activities in accordance with GAAP and should not be considered alternatives to net (loss) income as indicators of OPI's operating performance or as measures of OPI's liquidity. These measures should be considered in conjunction with net (loss) income as presented in OPI's condensed consolidated statements of income (loss). OPI considers these non-GAAP measures to be appropriate supplemental measures of operating performance for a REIT, along with net (loss) income. OPI believes these measures provide useful information to investors because by excluding the effects of certain historical amounts, such as depreciation and amortization expense, they may facilitate a comparison of OPI's operating performance between periods and with other REITs and, in the case of NOI, Cash Basis NOI, Same Property NOI and Same Property Cash Basis NOI reflecting only those income and expense items that are generated and incurred at the property level may help both investors and management to understand the operations of OPI's properties. NOI and Cash Basis NOI The calculations of net operating income, or NOI, and Cash Basis NOI exclude certain components of net (loss) income in order to provide results that are more closely related to OPI's property level results of operations. OPI calculates NOI and Cash Basis NOI as shown on page 19 and Same Property NOI and Same Property Cash Basis NOI as shown on page 20. OPI defines NOI as income from OPI's rental of real estate less OPI's property operating expenses. NOI excludes amortization of capitalized tenant improvement costs and leasing commissions that OPI records as depreciation and amortization expense. OPI defines Cash Basis NOI as NOI excluding non-cash straight line rent adjustments, lease value amortization, lease termination fees, if any, and non-cash amortization included in other operating expenses. OPI calculates Same Property NOI and Same Property Cash Basis NOI in the same manner that OPI calculates the corresponding NOI and Cash Basis NOI amounts, except that OPI only includes same properties in calculating Same Property NOI and Same Property Cash Basis NOI. OPI uses NOI, Cash Basis NOI, Same Property NOI and Same Property Cash Basis NOI to evaluate individual and company-wide property level performance. Other real estate companies and REITs may calculate NOI, Cash Basis NOI, Same Property NOI and Same Property Cash Basis NOI differently than OPI does. EBITDA, EBITDAre and Adjusted EBITDAre OPI calculates earnings before interest, taxes, depreciation and amortization, or EBITDA, EBITDA for real estate, or EBITDAre, and Adjusted EBITDAre as shown on page 21. EBITDAre is calculated on the basis defined by The National Association of Real Estate Investment Trusts, or Nareit, which is EBITDA, excluding gains and losses on the sale of real estate, loss on impairment of real estate assets and adjustments to reflect OPI's share of EBITDAre of its unconsolidated joint ventures. In calculating Adjusted EBITDAre, OPI adjusts for the items shown on page 21 and includes business management incentive fees, if any, only in the fourth quarter versus the quarter when they are recognized as expense in accordance with GAAP due to their quarterly volatility not necessarily being indicative of OPI's core operating performance and the uncertainty as to whether any such business management incentive fees will be payable when all contingencies for determining such fees are known at the end of the calendar year. Other real estate companies and REITs may calculate EBITDA, EBITDAre and Adjusted EBITDAre differently than OPI does. FFO and Normalized FFO OPI calculates funds from operations, or FFO, and Normalized FFO as shown on page 22. FFO is calculated on the basis defined by Nareit, which is net (loss) income, calculated in accordance with GAAP, plus real estate depreciation and amortization of consolidated properties and OPI's proportionate share of the real estate depreciation and amortization of unconsolidated joint venture properties, but excluding impairment charges on real estate assets and any gain or loss on sale of real estate, as well as certain other adjustments currently not applicable to us. In calculating Normalized FFO, OPI adjusts for the other items shown on page 22 and includes business management incentive fees, if any, only in the fourth quarter versus the quarter when they are recognized as an expense in accordance with GAAP due to their quarterly volatility not necessarily being indicative of OPI's core operating performance and the uncertainty as to whether any such business management incentive fees will be payable when all contingencies for determining such fees are known at the end of the calendar year. FFO and Normalized FFO are among the factors considered by OPI's Board of Trustees when determining the amount of distributions to OPI's shareholders. Other factors include, but are not limited to, requirements to maintain OPI's qualification for taxation as a REIT, limitations in OPI's credit agreement and public debt covenants, the availability to OPI of debt and equity capital, OPI's expectation of its future capital requirements and operating performance and OPI's expected needs for and availability of cash to pay its obligations. Other real estate companies and REITs may calculate FFO and Normalized FFO differently than OPI does. Cash Available for Distribution OPI calculates cash available for distribution, or CAD, as shown on page 22. OPI defines CAD as Normalized FFO minus recurring real estate related capital expenditures and adjusted for other non-cash and non-recurring items and certain amounts excluded from Normalized FFO but settled in cash. CAD is among the factors considered by OPI's Board of Trustees when determining the amount of distributions to OPI's shareholders. Other real estate companies and REITs may calculate CAD differently than OPI does. |
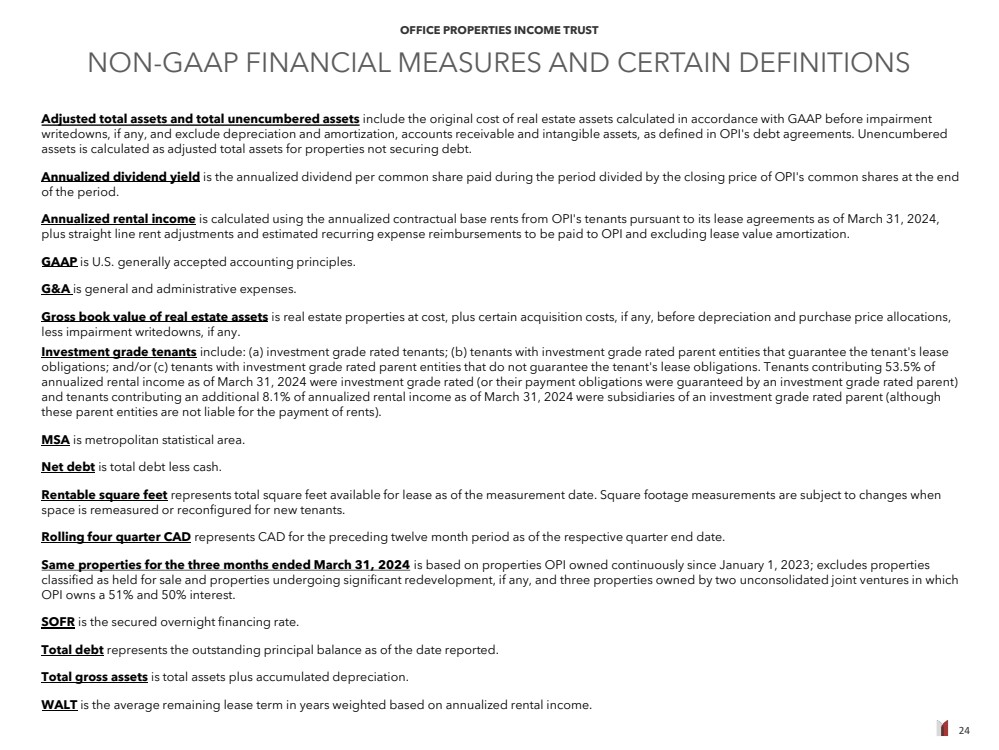
| 24 OFFICE PROPERTIES INCOME TRUST NON-GAAP FINANCIAL MEASURES AND CERTAIN DEFINITIONS Adjusted total assets and total unencumbered assets include the original cost of real estate assets calculated in accordance with GAAP before impairment writedowns, if any, and exclude depreciation and amortization, accounts receivable and intangible assets, as defined in OPI's debt agreements. Unencumbered assets is calculated as adjusted total assets for properties not securing debt. Annualized dividend yield is the annualized dividend per common share paid during the period divided by the closing price of OPI's common shares at the end of the period. Annualized rental income is calculated using the annualized contractual base rents from OPI's tenants pursuant to its lease agreements as of March 31, 2024, plus straight line rent adjustments and estimated recurring expense reimbursements to be paid to OPI and excluding lease value amortization. GAAP is U.S. generally accepted accounting principles. G&A is general and administrative expenses. Gross book value of real estate assets is real estate properties at cost, plus certain acquisition costs, if any, before depreciation and purchase price allocations, less impairment writedowns, if any. Investment grade tenants include: (a) investment grade rated tenants; (b) tenants with investment grade rated parent entities that guarantee the tenant's lease obligations; and/or (c) tenants with investment grade rated parent entities that do not guarantee the tenant's lease obligations. Tenants contributing 53.5% of annualized rental income as of March 31, 2024 were investment grade rated (or their payment obligations were guaranteed by an investment grade rated parent) and tenants contributing an additional 8.1% of annualized rental income as of March 31, 2024 were subsidiaries of an investment grade rated parent (although these parent entities are not liable for the payment of rents). MSA is metropolitan statistical area. Net debt is total debt less cash. Rentable square feet represents total square feet available for lease as of the measurement date. Square footage measurements are subject to changes when space is remeasured or reconfigured for new tenants. Rolling four quarter CAD represents CAD for the preceding twelve month period as of the respective quarter end date. Same properties for the three months ended March 31, 2024 is based on properties OPI owned continuously since January 1, 2023; excludes properties classified as held for sale and properties undergoing significant redevelopment, if any, and three properties owned by two unconsolidated joint ventures in which OPI owns a 51% and 50% interest. SOFR is the secured overnight financing rate. Total debt represents the outstanding principal balance as of the date reported. Total gross assets is total assets plus accumulated depreciation. WALT is the average remaining lease term in years weighted based on annualized rental income. |
| 25 OFFICE PROPERTIES INCOME TRUST Appendix Colorado Springs, CO |
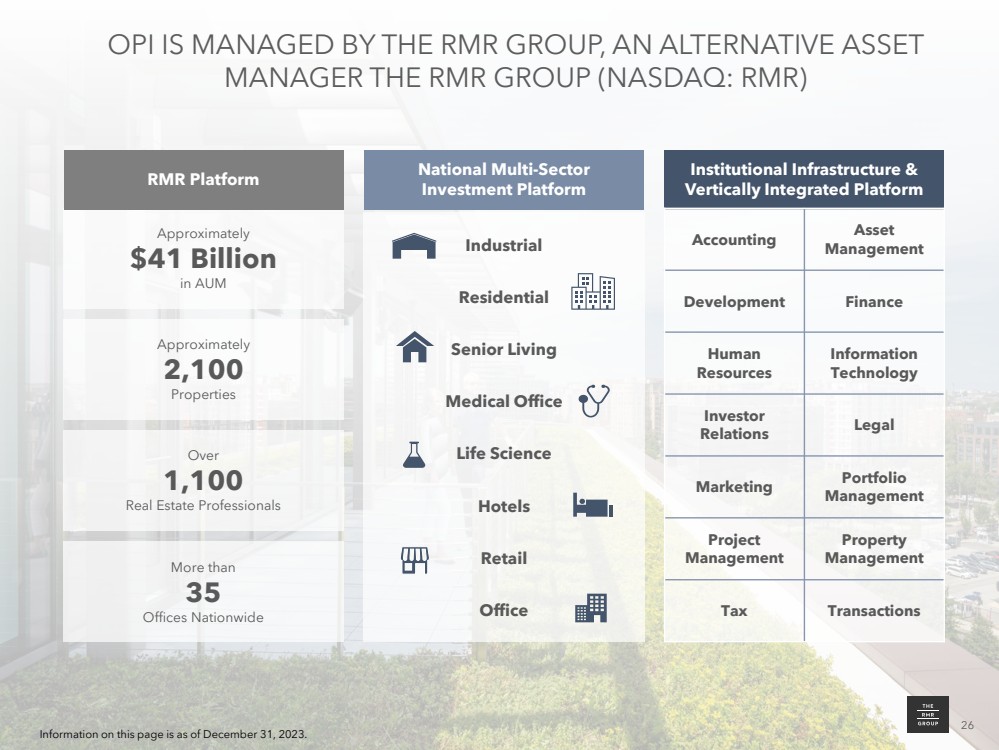
| 26 OFFICE PROPERTIES INCOME TRUST OPI IS MANAGED BY THE RMR GROUP, AN ALTERNATIVE ASSET MANAGER THE RMR GROUP (NASDAQ: RMR) Approximately $41 Billion in AUM RMR Platform Approximately 2,100 Properties More than 35 Offices Nationwide National Multi-Sector Investment Platform Industrial Residential Senior Living Medical Office Life Science Hotels Retail Office 26 Information on this page is as of December 31, 2023. Over 1,100 Real Estate Professionals Institutional Infrastructure & Vertically Integrated Platform Accounting Asset Management Development Finance Human Resources Information Technology Investor Relations Legal Marketing Portfolio Management Project Management Property Management Tax Transactions |
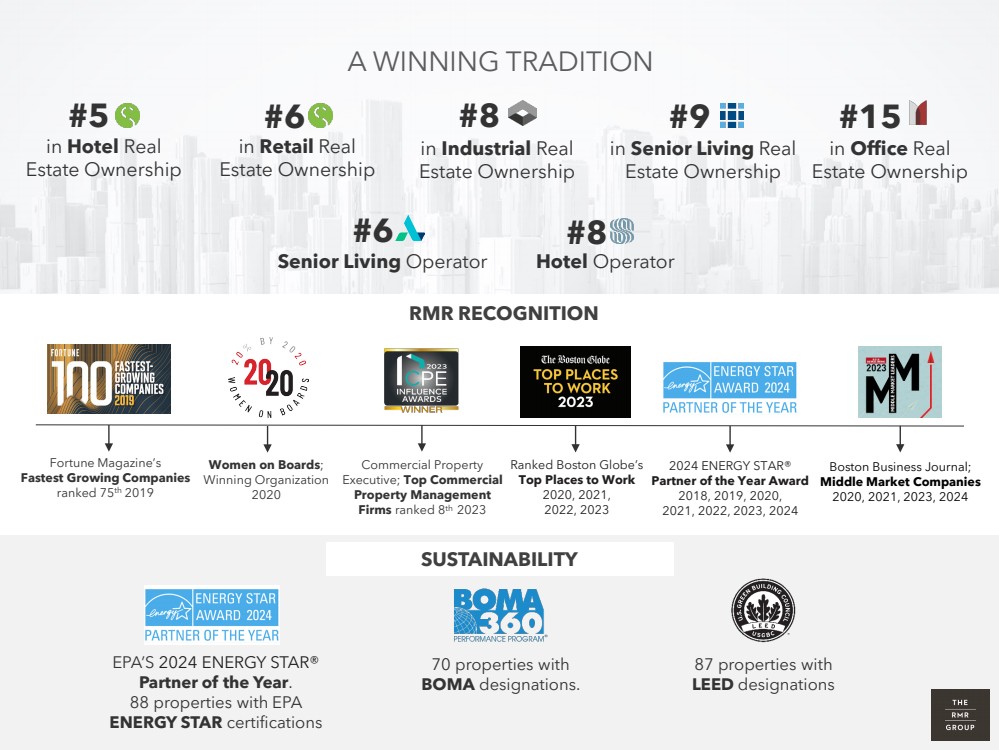
| 27 OFFICE PROPERTIES INCOME TRUST A WINNING TRADITION EPA’S 2024 ENERGY STAR® Partner of the Year. 88 properties with EPA ENERGY STAR certifications 70 properties with BOMA designations. 87 properties with LEED designations SUSTAINABILITY Ranked Boston Globe’s Top Places to Work 2020, 2021, 2022, 2023 Women on Boards; Winning Organization 2020 Fortune Magazine’s Fastest Growing Companies ranked 75th 2019 RMR RECOGNITION in Retail Real Estate Ownership in Hotel Real Estate Ownership in Senior Living Real Estate Ownership in Office Real Estate Ownership in Industrial Real Estate Ownership Senior Living Operator Hotel Operator #6 #8 #5 #6 #8 #9 #15 2024 ENERGY STAR® Partner of the Year Award 2018, 2019, 2020, 2021, 2022, 2023, 2024 Boston Business Journal; Middle Market Companies 2020, 2021, 2023, 2024 Commercial Property Executive; Top Commercial Property Management Firms ranked 8th 2023 |
| 28 OFFICE PROPERTIES INCOME TRUST (1) Source: S&P Global Market Intelligence. Data is for the most recently reported twelve months as of June 10, 2024. RELATIONSHIP WITH RMR PROVIDES SCALE AND EFFICIENCY Key Benefits • RMR provides all the employees; OPI has no employees. • RMR’s acquisitions team has visibility to properties marketed for sale across the United States. • The depth and breadth of the RMR platform attracts strong real estate professionals. • Career advancement opportunities at RMR drives employee engagement and retention. • RMR property management employees focus only on assets managed by RMR. • RMR platform provides centralized support services, including procurement, banking and capital markets. G&A % of Total Revenue(1) 4.2% 5.0% 5.0% 5.2% 6.2% 8.3% 8.5% 8.9% OPI PDM CIO BXP BDN HIW DEA OFC |

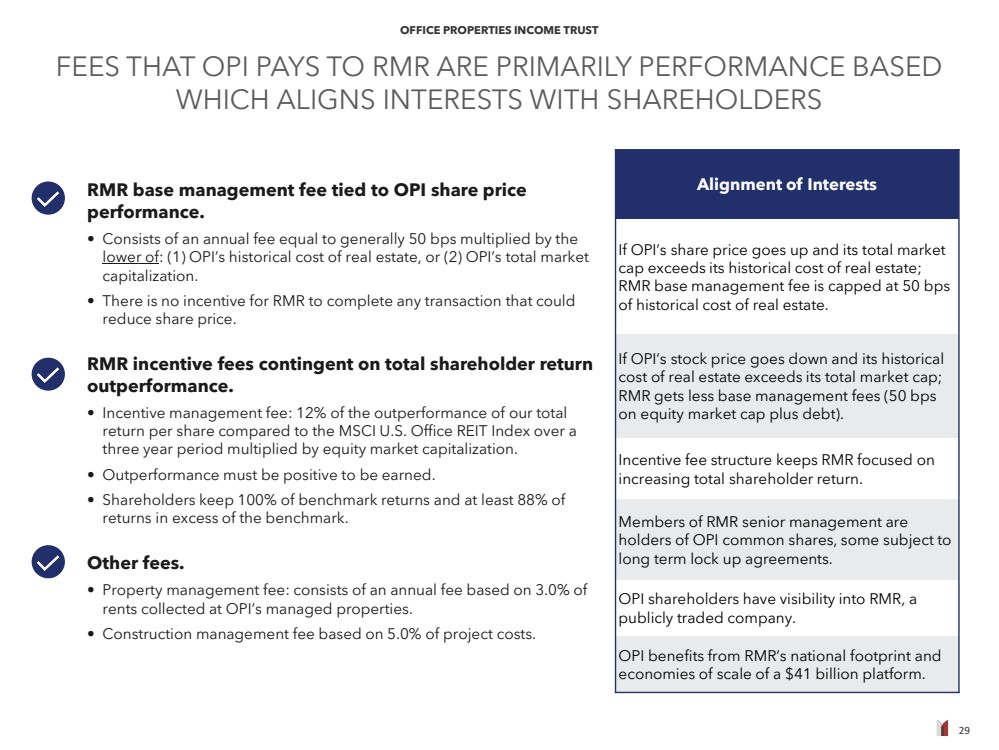
| 29 OFFICE PROPERTIES INCOME TRUST RMR base management fee tied to OPI share price performance. • Consists of an annual fee equal to generally 50 bps multiplied by the lower of: (1) OPI’s historical cost of real estate, or (2) OPI’s total market capitalization. • There is no incentive for RMR to complete any transaction that could reduce share price. RMR incentive fees contingent on total shareholder return outperformance. • Incentive management fee: 12% of the outperformance of our total return per share compared to the MSCI U.S. Office REIT Index over a three year period multiplied by equity market capitalization. • Outperformance must be positive to be earned. • Shareholders keep 100% of benchmark returns and at least 88% of returns in excess of the benchmark. Other fees. • Property management fee: consists of an annual fee based on 3.0% of rents collected at OPI’s managed properties. • Construction management fee based on 5.0% of project costs. Alignment of Interests If OPI’s share price goes up and its total market cap exceeds its historical cost of real estate; RMR base management fee is capped at 50 bps of historical cost of real estate. If OPI’s stock price goes down and its historical cost of real estate exceeds its total market cap; RMR gets less base management fees (50 bps on equity market cap plus debt). Incentive fee structure keeps RMR focused on increasing total shareholder return. Members of RMR senior management are holders of OPI common shares, some subject to long term lock up agreements. OPI shareholders have visibility into RMR, a publicly traded company. OPI benefits from RMR’s national footprint and economies of scale of a $41 billion platform. FEES THAT OPI PAYS TO RMR ARE PRIMARILY PERFORMANCE BASED WHICH ALIGNS INTERESTS WITH SHAREHOLDERS |
| 30 OFFICE PROPERTIES INCOME TRUST INVESTOR PRESENTATION June 2024 Provo, UT Two Newton Place 255 Washington Street, Suite 300 Newton, MA 02458 OPIREIT.COM |