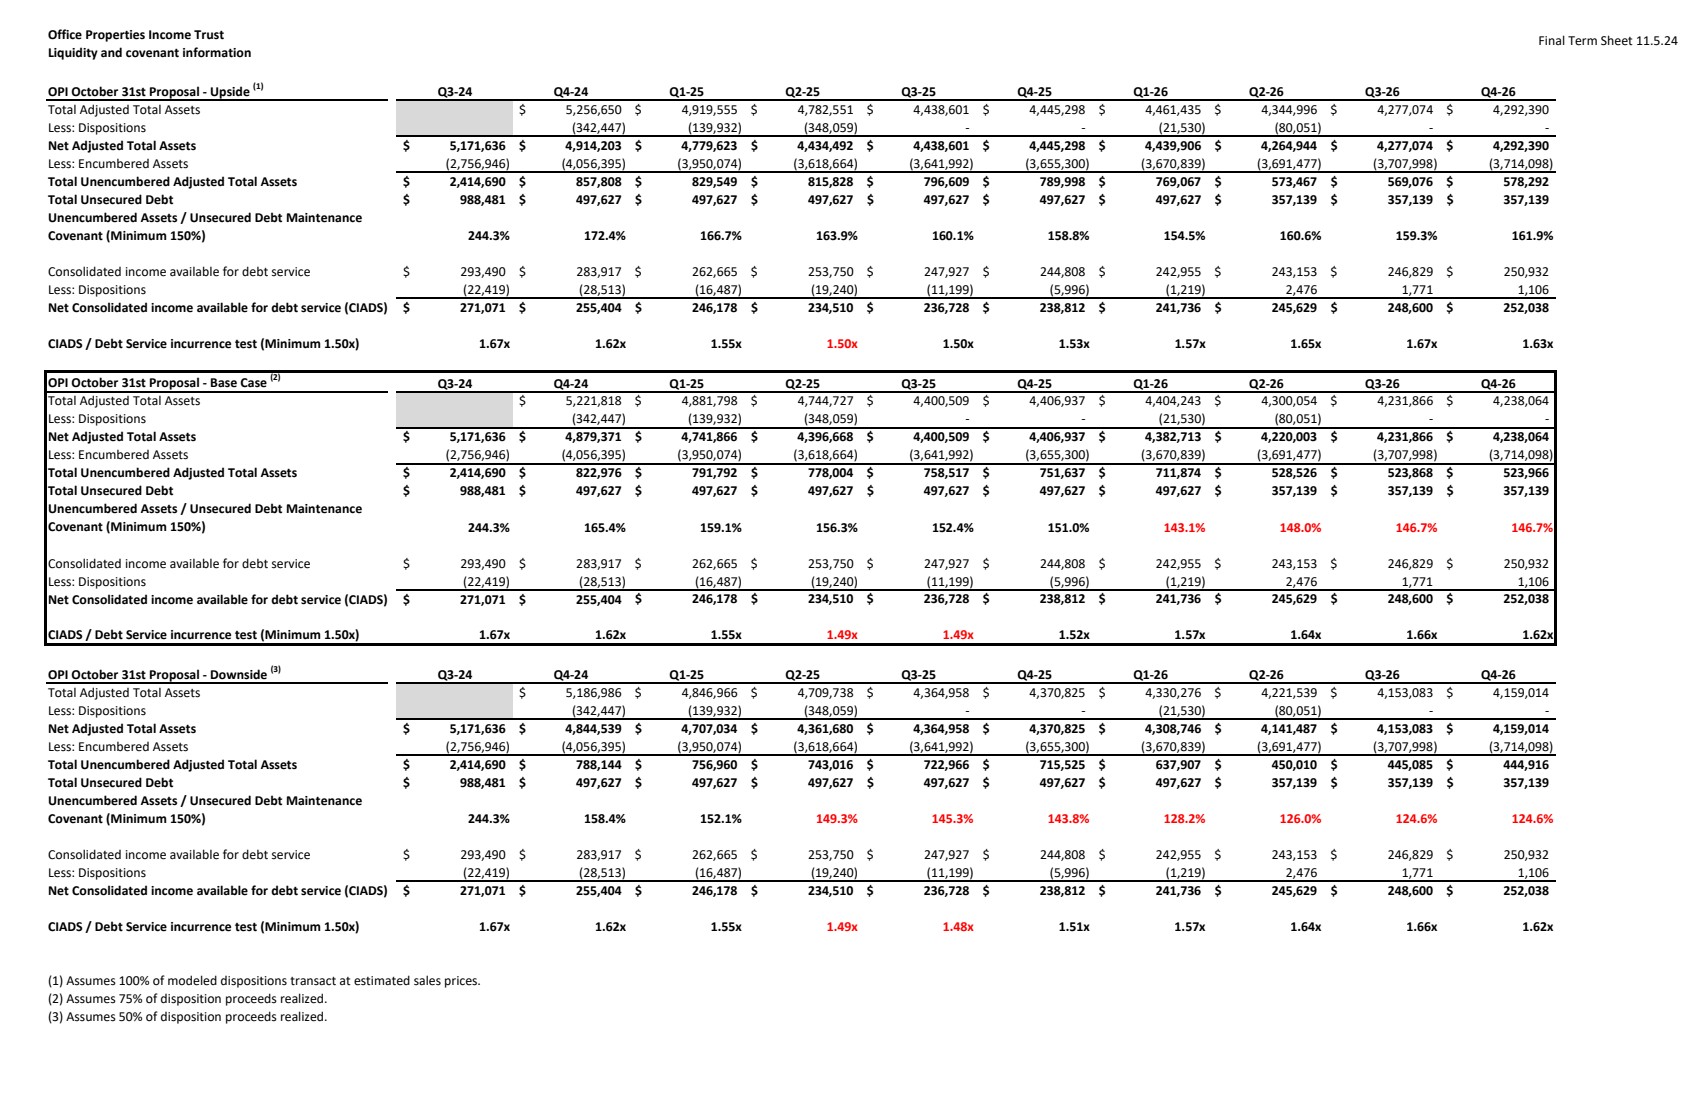
| Final Term Sheet 11.5.24 Office Properties Income Trust Liquidity and covenant information OPI October 31st Proposal ‐ Upside (1) Q3‐24 Q4‐24 Q1‐25 Q2‐25 Q3‐25 Q4‐25 Q1‐26 Q2‐26 Q3‐26 Q4‐26 Total Adjusted Total Assets 5,256,650 $ $ 4,919,555 $ 4,782,551 $ 4,438,601 $ 4,445,298 $ 4,461,435 $ 4,344,996 $ 4,277,074 $ 4,292,390 Less: Dispositions (342,447) (139,932) ‐ (348,059) ‐ (21,530) ‐ (80,051) ‐ Net Adjusted Total Assets 5,171,636 $ $ 4,914,203 $ 4,779,623 $ 4,434,492 $ 4,438,601 $ 4,445,298 $ 4,439,906 $ 4,264,944 $ 4,277,074 $ 4,292,390 Less: Encumbered Assets (2,756,946) (4,056,395) (3,950,074) (3,618,664) (3,641,992) (3,655,300) (3,670,839) (3,691,477) (3,707,998) (3,714,098) Total Unencumbered Adjusted Total Assets 2,414,690 $ $ 857,808 $ 829,549 $ 815,828 $ 796,609 $ 789,998 $ 769,067 $ 573,467 $ 569,076 $ 578,292 Total Unsecured Debt 988,481 $ $ 497,627 $ 497,627 $ 497,627 $ 497,627 $ 497,627 $ 497,627 $ 357,139 $ 357,139 $ 357,139 Unencumbered Assets / Unsecured Debt Maintenance Covenant (Minimum 150%) 244.3% 172.4% 166.7% 163.9% 160.1% 158.8% 154.5% 160.6% 159.3% 161.9% Consolidated income available for debt service 293,490 $ $ 283,917 $ 262,665 $ 253,750 $ 247,927 $ 244,808 $ 242,955 $ 243,153 $ 246,829 $ 250,932 Less: Dispositions (22,419) (28,513) (16,487) (19,240) (11,199) (5,996) (1,219) 2,476 1,771 1,106 Net Consolidated income available for debt service (CIADS) 271,071 $ $ 255,404 $ 246,178 $ 234,510 $ 236,728 $ 238,812 $ 241,736 $ 245,629 $ 248,600 $ 252,038 CIADS / Debt Service incurrence test (Minimum 1.50x) 1.67x 1.62x 1.55x 1.50x 1.50x 1.53x 1.57x 1.65x 1.67x 1.63x OPI October 31st Proposal ‐ Base Case (2) Q3‐24 Q4‐24 Q1‐25 Q2‐25 Q3‐25 Q4‐25 Q1‐26 Q2‐26 Q3‐26 Q4‐26 Total Adjusted Total Assets 5,221,818 $ $ 4,881,798 $ 4,744,727 $ 4,400,509 $ 4,406,937 $ 4,404,243 $ 4,300,054 $ 4,231,866 $ 4,238,064 Less: Dispositions (342,447) (139,932) ‐ (348,059) ‐ (21,530) ‐ (80,051) ‐ Net Adjusted Total Assets 5,171,636 $ $ 4,879,371 $ 4,741,866 $ 4,396,668 $ 4,400,509 $ 4,406,937 $ 4,382,713 $ 4,220,003 $ 4,231,866 $ 4,238,064 Less: Encumbered Assets (2,756,946) (4,056,395) (3,950,074) (3,618,664) (3,641,992) (3,655,300) (3,670,839) (3,691,477) (3,707,998) (3,714,098) Total Unencumbered Adjusted Total Assets 2,414,690 $ $ 822,976 $ 791,792 $ 778,004 $ 758,517 $ 751,637 $ 711,874 $ 528,526 $ 523,868 $ 523,966 Total Unsecured Debt 988,481 $ $ 497,627 $ 497,627 $ 497,627 $ 497,627 $ 497,627 $ 497,627 $ 357,139 $ 357,139 $ 357,139 Unencumbered Assets / Unsecured Debt Maintenance Covenant (Minimum 150%) 244.3% 165.4% 159.1% 156.3% 152.4% 151.0% 143.1% 148.0% 146.7% 146.7% Consolidated income available for debt service 293,490 $ $ 283,917 $ 262,665 $ 253,750 $ 247,927 $ 244,808 $ 242,955 $ 243,153 $ 246,829 $ 250,932 Less: Dispositions (22,419) (28,513) (16,487) (19,240) (11,199) (5,996) (1,219) 2,476 1,771 1,106 Net Consolidated income available for debt service (CIADS) 271,071 $ $ 255,404 $ 246,178 $ 234,510 $ 236,728 $ 238,812 $ 241,736 $ 245,629 $ 248,600 $ 252,038 CIADS / Debt Service incurrence test (Minimum 1.50x) 1.67x 1.62x 1.55x 1.49x 1.49x 1.52x 1.57x 1.64x 1.66x 1.62x OPI October 31st Proposal ‐ Downside (3) Q3‐24 Q4‐24 Q1‐25 Q2‐25 Q3‐25 Q4‐25 Q1‐26 Q2‐26 Q3‐26 Q4‐26 Total Adjusted Total Assets 5,186,986 $ $ 4,846,966 $ 4,709,738 $ 4,364,958 $ 4,370,825 $ 4,330,276 $ 4,221,539 $ 4,153,083 $ 4,159,014 Less: Dispositions (342,447) (139,932) ‐ (348,059) ‐ (21,530) ‐ (80,051) ‐ Net Adjusted Total Assets 5,171,636 $ $ 4,844,539 $ 4,707,034 $ 4,361,680 $ 4,364,958 $ 4,370,825 $ 4,308,746 $ 4,141,487 $ 4,153,083 $ 4,159,014 Less: Encumbered Assets (2,756,946) (4,056,395) (3,950,074) (3,618,664) (3,641,992) (3,655,300) (3,670,839) (3,691,477) (3,707,998) (3,714,098) Total Unencumbered Adjusted Total Assets 2,414,690 $ $ 788,144 $ 756,960 $ 743,016 $ 722,966 $ 715,525 $ 637,907 $ 450,010 $ 445,085 $ 444,916 Total Unsecured Debt 988,481 $ $ 497,627 $ 497,627 $ 497,627 $ 497,627 $ 497,627 $ 497,627 $ 357,139 $ 357,139 $ 357,139 Unencumbered Assets / Unsecured Debt Maintenance Covenant (Minimum 150%) 244.3% 158.4% 152.1% 149.3% 145.3% 143.8% 128.2% 126.0% 124.6% 124.6% Consolidated income available for debt service 293,490 $ $ 283,917 $ 262,665 $ 253,750 $ 247,927 $ 244,808 $ 242,955 $ 243,153 $ 246,829 $ 250,932 Less: Dispositions (22,419) (28,513) (16,487) (19,240) (11,199) (5,996) (1,219) 2,476 1,771 1,106 Net Consolidated income available for debt service (CIADS) 271,071 $ $ 255,404 $ 246,178 $ 234,510 $ 236,728 $ 238,812 $ 241,736 $ 245,629 $ 248,600 $ 252,038 CIADS / Debt Service incurrence test (Minimum 1.50x) 1.67x 1.62x 1.55x 1.49x 1.48x 1.51x 1.57x 1.64x 1.66x 1.62x (1) Assumes 100% of modeled dispositions transact at estimated sales prices. (2) Assumes 75% of disposition proceeds realized. (3) Assumes 50% of disposition proceeds realized. |