UNITED STATES
SECURITIES AND EXCHANGE COMMISSION
Washington, D.C. 20549
FORM N-CSR
CERTIFIED SHAREHOLDER REPORT OF REGISTERED
MANAGEMENT INVESTMENT COMPANIES
|
| Investment Company Act file number 811-22280 |
|
| Goldman Sachs Credit Strategies Fund |
(Exact name of registrant as specified in charter)
|
| 71 South Wacker Drive, Chicago, Illinois 60606 |
(Address of principal executive offices) (Zip code)
| | |
| | Copies to: |
| | Geoffrey R.T. Kenyon, Esq. |
Caroline Kraus | | Dechert LLP |
| Goldman, Sachs & Co. | | 200 Clarendon Street |
200 West Street New York, New York 10282 | | 27th Floor Boston, MA 02116-5021 |
(Name and address of agents for service)
Registrant’s telephone number, including area code: (312) 655-4400
Date of fiscal year end: March 31
Date of reporting period: September 30, 2012
| ITEM 1. | REPORTS TO STOCKHOLDERS. |
The Semi-Annual Report to Stockholders is filed herewith.
Goldman Sachs Funds

| | | | |
| | |
| Semi-Annual Report | | | | September 30, 2012 |
| | |
| | | | Credit Strategies Fund |

Goldman Sachs Credit Strategies Fund
| | | | |
TABLE OF CONTENTS | | | | |
| |
Principal Investment Strategies and Risks | | | 1 | |
| |
Portfolio Management Discussion and Analysis | | | 2 | |
| |
Schedule of Investments | | | 7 | |
| |
Financial Statements | | | 15 | |
| |
Financial Highlights | | | 18 | |
| |
Notes to the Financial Statements | | | 20 | |
| |
Other Information | | | 31 | |
| | | | |
| | | |
| NOT FDIC-INSURED | | May Lose Value | | No Bank Guarantee |
GOLDMAN SACHS CREDIT STRATEGIES FUND
Principal Investment Strategies and Risks
This is not a complete list of risks that may affect the Fund. For additional information concerning the risks applicable to the Fund, please see the Fund’s Prospectus.
The Goldman Sachs Credit Strategies Fund is a closed-end interval fund that invests opportunistically in, among other things, credit-related instruments, including debt securities, instruments and obligations of U.S. and non-U.S. government, corporate and other non-governmental entities and issuers, and preferred securities. The Fund’s investments in credit-related instruments are subject to the risks associated with debt securities generally, including credit, liquidity and interest rate risk. The Fund may invest in non-investment grade securities, including without limitation distressed securities, special situation investments and collateralized loan obligations. Non-investment grade securities involve greater price volatility and present greater risks than higher rated fixed income securities. The Fund may purchase the securities of issuers that are in default. The Fund may invest in loans directly or indirectly, by purchasing participations or sub-participations from financial institutions. Indirect purchases may subject the Fund to greater delays, expenses and risks than direct obligations in the case that a borrower fails to pay scheduled principal and interest. Derivative instruments may involve a high degree of financial and other risks. These risks include the risk that a small movement in the price of the underlying security or benchmark may result in a disproportionately large movement, unfavorable or favorable, in the price of the derivative instrument; risks of default by a counterparty; and liquidity risk. Foreign securities may be more volatile and less liquid than its investment in U.S. securities and will be subject to the risks of currency fluctuations and adverse economic or political developments. At times, the Fund may be unable to sell certain of its investments without a substantial drop in price, if at all. The Fund is “non-diversified” and may invest more of its assets in fewer issuers than “diversified” funds. Accordingly, the Fund may be more susceptible to adverse developments affecting any single issuer held in its portfolio and to greater losses resulting from these developments.
As an unlisted, closed-end interval fund, shareholders of the Fund are not able to have their shares redeemed or otherwise sell their shares on a daily basis. Instead, the Fund will conduct quarterly repurchase offers for between 5% and 25% of the Fund’s outstanding shares at net asset value. In connection with any given repurchase offer, it is possible that the Fund may offer to repurchase only the minimum amount of 5% of its outstanding shares. It is also possible that a repurchase offer may be oversubscribed, with the result that shareholders may only be able to receive a portion of their shares repurchased. The Fund is suitable only for investors who can bear the risks associated with limited liquidity of the shares.
1
PORTFOLIO RESULTS
Goldman Sachs Credit Strategies Fund
Investment Objective
The Fund seeks a total return comprised of income and capital appreciation.
Portfolio Management Discussion and Analysis
Below, the Goldman Sachs Global Corporate Credit Portfolio Management Team discusses the Goldman Sachs Credit Strategies Fund’s (the “Fund”) performance and positioning for the six-month period ended September 30, 2012 (the “Reporting Period”).
| Q | | How did the Fund perform during the Reporting Period? |
| A | | During the Reporting Period, the Fund’s Common Shares generated a cumulative total return, without sales charges, of 4.38%. These returns compare to the 0.16% cumulative total return of the Fund’s benchmark, the Bank of America/Merrill Lynch USD LIBOR 1-Month Constant Maturity Index (the “BofA/Merrill Lynch Index”) during the same time period. |
| | Because the composition of the BofA/Merrill Lynch Index (e.g. short-term cash securities) is not comparable to the range of instruments in which the Fund may transact (e.g., various credit-related instruments), the BofA/Merrill Lynch Index is for informational purposes only. The benchmark is not necessarily an indication of how the Fund is managed nor of the Fund’s portfolio holdings. |
| Q | | What economic and market factors most influenced the corporate credit markets as a whole during the Reporting Period? |
| A | | The corporate credit markets performed well through much of the Reporting Period, as investors showed a strong appetite for yield amidst an environment of low economic growth, low interest rates and low defaults. The exception was May 2012, when the corporate credit markets experienced moderate weakness. |
| | Corporate fundamentals generally remained solid during the Reporting Period, and the high yield default rate remained well below historical averages. Many companies took advantage of favorable market conditions to refinance high cost debt at lower rates while also extending maturities. Moreover, many companies retained high levels of cash on their balance sheets. |
| | In addition to generally solid fundamentals supporting the corporate credit markets during the Reporting Period, we believe recent monetary measures taken by the Federal Reserve (the “Fed”) provided a boost to the technicals, or supply and demand, backdrop for the corporate credit markets. In September 2012, the Fed announced its third round of quantitative easing, dubbed QE3, which entails the purchase of agency mortgage-backed securities until the U.S. labor market substantially improves. Additionally, the Fed committed to keep short-term interest rates at “exceptionally low levels” at least through mid-2015. These measures, in our view, should spur ongoing demand for corporate credit, resulting in further spread compression, or a narrowing of yield differential between corporate bonds and U.S. Treasuries. |
| Q | | What key factors were responsible for the Fund’s performance during the Reporting Period? |
| A | | Consistent with the cornerstone of our fundamentally-based investment process, which seeks total return comprised of income and capital appreciation through bottom-up security selection, the Fund’s performance during the Reporting Period is primarily attributable to effective individual security selection across the spectrum of corporate credit. |
2
PORTFOLIO RESULTS
| | We entered the Reporting Period with a cautious but constructive view on the corporate credit markets. As such, we focused on high yield credit securities that were of short duration and higher credit quality. We maintained our longstanding belief that short-dated credit offers opportunities to earn attractive risk-adjusted returns. From a fundamental perspective, the high degree of visibility on near-term cash flows and liquidity gave us a great deal of confidence in our security selection. Importantly, since the Fund’s portfolio is constructed through bottom-up, fundamental research and not relative to a benchmark, there is no requirement to hold issues from any single company. |
| Q | | Which segments of the corporate credit sector most significantly affected Fund performance? |
| A | | The greatest contributors to the Fund’s performance during the Reporting Period were a number of individual positions in the specialty finance sector, where we focused primarily on short-dated bonds. Specifically, positions in the bonds of SLM were the biggest drivers of positive performance. SLM, commonly known as Sallie Mae, is a company engaged in originating and serving student loans. SLM has a strong liquidity profile and has generated a significant amount of cash through its private lending business. |
| | Another key positive contributor was Ally Financial, a company that provides automobile financing services in North America. The Fund owned a number of positions across Ally Financial’s capital structure, including preferred securities and short-dated senior debt. Ally Financial’s entire capital structure performed quite well during the Reporting Period. Given this strong performance, we scaled down the Fund’s position late in the Reporting Period, as potential upside seemed limited in the near term. We reduced the Fund’s position in Ally Financial’s preferred securities from 1.3% of total net assets at the start of the Reporting Period to 0.6% of total net assets by September 30. We retained a position in the short-dated senior debt, as Ally Financial has, in our view, a strong liquidity position with $24 billion in cash and $14 billion of debt maturing through the end of 2013. Additionally, the company has continued to lower its cost of capital by issuing debt at lower coupon rates and growing its retail bank. |
| | Other positions in the specialty finance sector that contributed meaningfully to Fund performance during the Reporting Period included Springleaf Finance bank loans and CIT Group senior debt. |
| | Elsewhere, a number of positions within the energy sector, such as Samson and PetroBakken Energy, contributed positively to the Fund’s performance. |
| | The only notable detractor from the Fund’s performance during the Reporting Period was a position in Quicksilver Resources, an energy company focused on unconventional natural gas resources. The Fund owned bonds maturing in 2015 and 2016, which in aggregate accounted for approximately 2% of the Fund’s total net assets at the beginning of the Reporting Period. Relative to many of its peers, Quicksilver Resources is more highly leveraged. However, we believed the company had sufficient asset coverage ratios, and the yield on its short-dated bonds offered, in our view, an attractive risk/reward profile. During the Reporting Period, the company’s debt came under pressure amid a steep decline in the prices of both natural gas and liquefied natural gas (“LNG”). Historically, LNG prices have averaged approximately 60% of crude oil prices. However, prices during the Reporting Period fell to approximately one-third of the price of crude oil. We reduced the Fund’s position in Quicksilver Resources during the Reporting Period as its then-current high levels of debt, in our view, made its operating results especially sensitive to changes in commodity prices. We believe the company is focused on paying down its highest cost debt as opposed to its most senior debt, since it has no debt maturing prior to 2015. The bonds due in 2016 are the highest cost debt in Quicksilver Resources’ capital structure, and we maintained a position in these bonds in order to potentially benefit from a repayment prior to maturity. |
| Q | | Did the Fund’s duration and yield curve positioning strategy help or hurt its results during the Reporting Period? |
| A | | The Fund does not use duration and yield curve positioning as active management strategies within its investment process. |
| Q | | How did the Fund use derivatives and similar instruments during the Reporting Period? |
| A | | The Fund used foreign currency exchange forward contracts to hedge the currency risk in non-U.S. dollar-denominated issues to U.S. dollars. The Fund also used interest rate swaps to hedge the interest rate risk of certain bonds, thereby limiting the Fund’s exposure to changes in interest rates. Lastly, the Fund used single-name and index credit default swaps to efficiently implement credit views. |
3
PORTFOLIO RESULTS
| Q | | Were there any notable changes in the Fund’s weightings during the Reporting Period? |
| A | | During the Reporting Period, we continued to pursue investment opportunities based on two key themes. First, we favored short-dated credit with a bias toward those issuers that we believed had strong liquidity profiles and the ability to meet near-term obligations. Second, we sought opportunities to earn attractive risk-adjusted returns in the energy sector. Specifically, we identified a number of mid-sized companies with what we considered to be low levels of leverage and high asset coverage ratios. We believe these positions can provide an attractive yield profile. |
| Q | | How was the Fund positioned at the end of September 2012? |
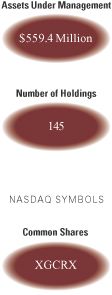
| A | | As of September 30, 2012, approximately 49% of the Fund’s total net assets was invested in unsecured high yield corporate bonds, 19% in secured high yield corporate bonds, 7% in investment grade corporate bonds, 14% in bank loans, 1.5% across municipal bonds, preferred equity, convertible and private common equity and the remainder in cash and cash equivalents. The Fund had a total of 145 holdings from 100 issuers at September 30, 2012, with the Fund’s top corporate issuers, as measured by a percentage of total net assets invested, being CIT Group, PetroBakken Energy, Samson Investment Company, E*Trade Financial and Ally Financial. |
| Q | | What is the Fund’s tactical view and strategy for the months ahead? |
| A | | Amidst an environment of muted economic growth and low interest rates, we believe the corporate credit markets should continue to perform well in the months ahead. In general, corporate fundamentals remain strong, in our view, and many companies have refinanced their debt over the past few years and reduced their borrowing costs. Nevertheless, investors face numerous headwinds, including the persistent European sovereign debt crisis, the looming U.S. fiscal cliff, and the slowing economic growth in China. |
| | Given these risks, we believe it is important to maintain a flexible and defensive approach when evaluating investment opportunities. Therefore, we believe thoughtful issuer and security selection will continue to be of paramount importance going forward. We intend to continue to seek to identify attractive idiosyncratic opportunities in corporate credit with a bias toward high yield securities that are of short duration and/or higher credit quality. At the end of the Reporting Period, the Fund was defensively positioned with a focus on companies we believe have ample liquidity and sufficiently low levels of leverage to withstand a prolonged period of low economic growth. We continue to see attractive single name opportunities in the energy sector, where we expect to be generally focused on issuers with low levels of leverage and high asset coverage ratios. In short, we continue to seek investments in what we believe are the most attractive risk-adjusted return opportunities across the corporate credit quality spectrum and corporate capital structure, while targeting a low event risk and low interest rate risk portfolio. |
| | In the months ahead, our investment team will continue to perform rigorous fundamental analysis to identify what we believe to be the most attractive investment opportunities on a risk-adjusted basis. |
4
FUND BASICS
Credit Strategies Fund
as of September 30, 2012
| | | | | | | | | | | | | | | | | | |
| | PERFORMANCE REVIEW | |
| | | April 1, 2012– September 30, 2012 | | Fund Total
Return
(based on NAV)1 | | | BofA/
Merrill Lynch
Index2 | | | 30-Day
Standardized
Subsidized Yield3 | | | 30-Day
Standardized
Unsubsidized Yield3 | |
| | | Common Shares | | | 4.38 | % | | | 0.16 | % | | | 3.28 | % | | | 3.28 | % |
| | 1 | | The net asset value (“NAV”) represents the net assets of the Fund (ex-dividend) divided by the total number of shares outstanding. The Fund’s performance assumes the reinvestment of dividends and other distributions. The Fund’s performance does not reflect the deduction of any applicable sales charges. |
| | 2 | | The BofA/Merrill Lynch Index tracks the performance of a synthetic asset paying LIBOR to a stated maturity. The BofA/Merrill Lynch Index is based on the assumed purchase at par of a synthetic instrument having exactly its stated maturity and with a coupon equal to that day’s fixing rate. That issue is assumed to be sold the following business day (priced at a yield equal to the current day fixing rate) and rolled into a new instrument. As such, the Fund, which invests primarily in corporate credit securities, may be expected to generate returns over various time periods with significant disparity from those of this benchmark index. |
| | 3 | | The 30-Day Standardized Subsidized Yield of the Fund is calculated by dividing the net investment income per share (as defined by securities industry regulations) earned by the Fund over a 30-day period (ending on the stated month-end date) by the maximum public offering price (“POP”) per share of the Fund on the last day of the period. This number is then annualized. This yield does not necessarily reflect income actually earned and distributed by the Fund and, therefore, may not be correlated with the dividends or other distributions paid to shareholders. The 30-Day Standardized Unsubsidized Yield does not reflect any applicable expense reductions. |
| | | | | | | | | | |
| | STANDARDIZED TOTAL RETURNS4 |
| | | For the period ended 9/30/12 | | One Year | | | Since Inception | | Inception Date |
| | | Common Shares | | | 10.88 | % | | 8.98% | | 6/15/09 |
| | 4 | | The Standardized Total Returns are average annual total returns as of the most recent calendar quarter-end. They assume reinvestment of all distributions at NAV. These returns reflect a maximum initial sales charge of 2.5%. |
| | | | The returns set forth in the tables above represent past performance. Past performance does not guarantee future results. The Fund’s investment return and principal value will fluctuate so that an investor’s shares, when redeemed, may be worth more or less than their original cost. Current performance may be lower or higher than the performance quoted above. Please visit our web site at www.goldmansachsfunds.com to obtain the most recent month-end returns. Performance reflects fee waivers and/or expense limitations in effect. In their absence, performance would be reduced. Returns do not reflect the deduction of taxes that a shareholder would pay on Fund distributions or the redemption of Fund shares. |
| | | | | | | | | | |
| | EXPENSE RATIOS5 | |
| | | | | Net Expense Ratio (Current) | | | Gross Expense Ratio (Before Waivers) | |
| | | Common Shares | | | 1.48 | % | | | 1.48 | % |
| | 5 | | The expense ratios of the Fund, both current (net of applicable fee waivers and/or expense limitations) and before waivers (gross of applicable fee waivers and/or expense limitations), are as set forth above according to the most recent publicly available Prospectus, for the Fund and may differ from the expense ratios disclosed in the Financial Highlights in this report. The Fund’s waivers and/or expense limitations, if any, will remain in place through at least July 27, 2013, and prior to such date the Investment Adviser may not terminate the arrangements without the approval of the Fund’s Board of Trustees. If these arrangements are discontinued in the future, the expense ratios may change without shareholder approval. |
5
FUND BASICS
|
| FUND COMPOSITION6 |
| Percentage of Net Assets |
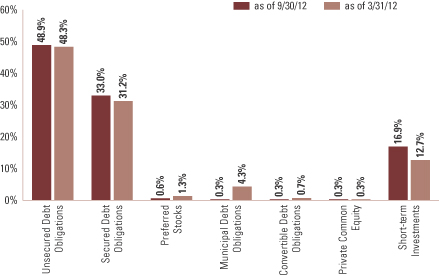
| | 6 | | The percentage shown for each investment category reflects the value of investments in that category as a percentage of net assets. Short-term investments represent repurchase agreements. Figures in the graph may not sum to 100% due to the exclusion of other assets and liabilities. The graph depicts the Fund’s investments but may not represent the Fund’s market exposure due to the exclusion of certain derivatives, if any, as listed in the Additional Investment Information section of the Schedule of Investments. |
| | | | | | |
| | TOP TEN INDUSTRY ALLOCATIONS7 | | | | |
| | | As of September 30, 2012 | | Percentage of Net Assets | |
| | Energy - Exploration & Production | | | 20.1 | % |
| | Finance | | | 14.4 | |
| | Health Care - Medical Products | | | 6.4 | |
| | Health Care - Services | | | 4.5 | |
| | Packaging | | | 4.1 | |
| | Retailers | | | 3.5 | |
| | Brokerage | | | 3.4 | |
| | Media - Non Cable | | | 2.8 | |
| | Entertainment | | | 2.7 | |
| | | Consumer Cyclical Services | | | 2.7 | |
| | 7 | | The percentage shown for each investment category reflects the value of investments in that category as a percentage of net assets. The above table depicts the Fund’s investments but may not represent the Fund’s market exposure due to the exclusion of certain derivatives, if any, as listed in the Additional Investment Information section of the Schedule of Investments. |
6
GOLDMAN SACHS CREDIT STRATEGIES FUND
Schedule of Investments
September 30, 2012 (Unaudited)
| | | | | | | | | | | | | | |
Principal
Amount | | | Interest
Rate | | | Maturity
Date | | | Value | |
| | | | | | | | | | | | | | |
| | Secured Debt Obligations – 33.0% | |
| Senior Term Loans(a) – 13.8% | |
| Aerospace/Defense – 0.7% | |
| Flying Fortress, Inc. (BB-/Ba3) | |
| $ | 4,050,000 | | | | 5.000 | % | | | 06/30/17 | | | $ | 4,095,563 | |
| | |
| Automotive – 0.1% | |
| Allison Transmission, Inc. (BB-/Ba3) | |
| | 495,234 | | | | 3.720 | | | | 08/07/17 | | | | 495,481 | |
| | |
| Chemicals – 0.1% | |
| PetroLogistics LP (B/B1) | |
| | 686,550 | | | | 7.000 | | | | 03/23/17 | | | | 694,274 | |
| | |
| Consumer Cyclical Services – 0.8% | |
| First Data Corp. (B+/B1) | |
| | 110,620 | | | | 2.967 | | | | 09/24/14 | | | | 110,260 | |
| | 3,695,000 | | | | 2.967 | | | | 09/30/18 | | | | 3,624,167 | |
| Sabre, Inc. (B/B1) | |
| | 483,720 | | | | 5.962 | | | | 12/29/17 | | | | 479,730 | |
| | | | | | | | | | | | | | |
| | | | | | | | | | | | | 4,214,157 | |
| | |
| Consumer Products – 1.5% | |
| ACCO Brands Corp. (BB+/Baa1) | |
| | 1,992,985 | | | | 4.250 | | | | 04/30/19 | | | | 2,002,950 | |
| Grifols, Inc. (BB-/Ba3) | |
| | 2,109,326 | | | | 4.500 | | | | 06/01/17 | | | | 2,121,202 | |
| Prestige Brands, Inc. (BB-/Ba3) | |
| | 1,617,955 | | | | 5.268 | | | | 01/31/19 | | | | 1,633,632 | |
| Schaeffler AG (B/B2) | |
| | 2,570,000 | | | | 6.000 | | | | 01/27/17 | | | | 2,594,107 | |
| | | | | | | | | | | | | | |
| | | | | | | | | | | | | 8,351,891 | |
| | |
| Diversified Manufacturing – 0.4% | |
| Rexnord Corp. (BB-/Ba3) | |
| | 2,312,525 | | | | 5.000 | | | | 04/02/18 | | | | 2,321,914 | |
| | |
| Energy – Exploration & Production – 0.6% | |
| Samson Investment Co. (B+/B1) | |
| | 3,382,000 | | | | 6.000 | | | | 09/13/18 | | | | 3,400,330 | |
| | |
| Entertainment – 1.3% | |
| Caesars Entertainment Operating Co. (B/Caa1) | |
| | 7,169,000 | | | | 3.217 | | | | 01/28/15 | | | | 6,943,678 | |
| | |
| Finance – 2.5% | |
| American Capital Holdings, Inc. (B/B2) | |
| | 1,216,000 | | | | 5.500 | | | | 07/19/16 | | | | 1,216,000 | |
| Springleaf Finance Corp. (CCC+/B3) | |
| | 12,845,000 | | | | 5.500 | | | | 05/10/17 | | | | 12,565,621 | |
| | | | | | | | | | | | | | |
| | | | | | | | | | | | | 13,781,621 | |
| | |
| Health Care – Medical Products – 1.0% | |
| Bausch & Lomb, Inc. (B+/B1) | |
| | 1,745,625 | | | | 5.250 | | | | 05/17/19 | | | | 1,763,448 | |
| HCA, Inc. (BB/Ba3) | |
| | 3,653,000 | | | | 3.612 | | | | 03/31/17 | | | | 3,656,434 | |
| | | | | | | | | | | | | | |
| | | | | | | | | | | | | 5,419,882 | |
| | |
| Principal
Amount |
| |
| Interest
Rate |
| |
| Maturity
Date |
| | | Value | |
| | | | | | | | | | | | | | |
| | Secured Debt Obligations – (continued) | |
| Media – Non Cable – 0.5% | |
| Univision Communications, Inc. (B-/B2) | |
| $ | 3,028,528 | | | | 2.216 | % | | | 09/29/14 | | | $ | 3,017,171 | |
| | |
| Packaging – 0.2% | |
| Consolidated Container Co. LLC (B/B1) | |
| | 1,191,807 | | | | 6.250 | | | | 07/03/19 | | | | 1,204,476 | |
| | |
| Real Estate Investment Trust – 1.1% | |
| iStar Financial, Inc. (B+/Caa1) | |
| | 4,335,005 | | | | 5.000 | | | | 06/28/13 | | | | 4,341,334 | |
| Realogy Corp. (B-/B1) | |
| | 126,974 | | | | 4.464 | | | | 10/10/16 | | | | 125,228 | |
| | 1,622,707 | | | | 4.478 | | | | 10/10/16 | | | | 1,600,394 | |
| | | | | | | | | | | | | | |
| | | | | | | | | | | | | 6,066,956 | |
| | |
| Retailers – 3.0% | |
| Burlington Coat Factory Warehouse Corp. (B/B3) | |
| | 3,500,000 | | | | 5.500 | | | | 02/23/17 | | | | 3,532,270 | |
| Collective Brands Finance, Inc. (B/NR) | |
| | 2,600,000 | | | | 7.250 | | | | 09/19/19 | | | | 2,604,888 | |
| Magic NewCo. LLC (B+/Ba3) | |
| | 2,340,000 | | | | 7.250 | | | | 12/12/18 | | | | 2,351,115 | |
| National Vision, Inc. (BB-/B1) | |
| | 2,324,175 | | | | 7.000 | | | | 08/02/18 | | | | 2,347,417 | |
| Neiman-Marcus Group, Inc. (BB-/B3) | |
| | 6,126,000 | | | | 4.750 | | | | 05/16/18 | | | | 6,153,873 | |
| | | | | | | | | | | | | | |
| | | | | | | | | | | | | 16,989,563 | |
| | |
| TOTAL SENIOR TERM LOANS
(Cost $75,603,997) |
| | $ | 76,996,957 | |
| | |
| Other Secured Debt Obligations – 19.2% | |
| Automotive(b)(c) – 0.3% | |
| Pittsburgh Glass Works LLC (B+/B2) | |
| $ | 1,507,000 | | | | 8.500 | % | | | 04/15/16 | | | $ | 1,401,510 | |
| | |
| Chemicals(b)(c) – 0.7% | |
| Taminco Global Chemical Corp. (B-/Caa1) | |
| | 3,426,000 | | | | 9.750 | | | | 03/31/20 | | | | 3,682,950 | |
| | |
| Consumer Cyclical Services(b)(c) – 1.3% | |
| First Data Corp. (B+/B1) | |
| | 3,953,000 | | | | 7.375 | | | | 06/15/19 | | | | 4,071,590 | |
| | 1,201,000 | | | | 6.750 | | | | 11/01/20 | | | | 1,188,990 | |
| Sabre, Inc. (B/B1) | |
| | 2,000,000 | | | | 8.500 | | | | 05/15/19 | | | | 2,065,000 | |
| | | | | | | | | | | | | | |
| | | | | | | | | | | | | 7,325,580 | |
| | |
| Entertainment(b) – 1.4% | |
| MU Finance PLC (NR/NR) | |
| | 5,803,166 | | | | 8.375 | (c) | | | 02/01/17 | | | | 6,325,451 | |
| GBP | 871,000 | | | | 8.750 | | | | 02/01/17 | | | | 1,533,074 | |
| | | | | | | | | | | | | | |
| | | | | | | | | | | | | 7,858,525 | |
| | |
| Finance(b)(c) – 0.7% | |
| CIT Group, Inc. (BB-/B1) | |
| $ | 3,878,000 | | | | 4.750 | | | | 02/15/15 | | | | 4,033,120 | |
| | |
| | |
| The accompanying notes are an integral part of these financial statements. | | 7 |
GOLDMAN SACHS CREDIT STRATEGIES FUND
Schedule of Investments (continued)
September 30, 2012 (Unaudited)
| | | | | | | | | | | | | | |
| Principal
Amount |
| |
| Interest
Rate |
| |
| Maturity
Date |
| | | Value | |
| | | | | | | | | | | | | | |
| | Secured Debt Obligations – (continued) | |
| Gaming(b) – 2.2% | |
| Caesars Entertainment Operating Co., Inc. (B/B2) | |
| $ | 5,536,000 | | | | 11.250 | % | | | 06/01/17 | | | $ | 5,937,360 | |
| MGM Resorts International (B+/Ba2) | |
| | 2,281,000 | | | | 10.375 | | | | 05/15/14 | | | | 2,560,423 | |
| Yonkers Racing Corp. (B+/B1)(c) | |
| | 3,365,000 | | | | 11.375 | | | | 07/15/16 | | | | 3,600,550 | |
| | | | | | | | | | | | | | |
| | | | | | | | | | | | | 12,098,333 | |
| | |
| Health Care – Medical Products(b)(c) – 0.8% | |
| DJO Finance LLC/DJO Finance Corp. (B-/B3) | |
| | 4,135,000 | | | | 8.750 | | | | 03/15/18 | | | | 4,414,113 | |
| | |
| Health Care – Services – 1.3% | |
| HCA, Inc. (BB/Ba3)(b) | |
| | 6,607,000 | | | | 7.875 | | | | 02/15/20 | | | | 7,424,616 | |
| US Oncology, Inc. (NR/NR) | |
| | 5,876,000 | | | | 9.125 | | | | 08/15/17 | | | | 88,140 | |
| | | | | | | | | | | | | | |
| | | | | | | | | | | | | 7,512,756 | |
| | |
| Lodging(b) – 1.6% | |
| Felcor Lodging LP (B-/B2) | |
| | 7,862,000 | | | | 10.000 | | | | 10/01/14 | | | | 9,021,645 | |
| | |
| Media – Cable(b)(c) – 0.4% | |
| LBI Media, Inc. (CCC/B3) | |
| | 2,665,000 | | | | 9.250 | | | | 04/15/19 | | | | 2,438,475 | |
| | |
| Media – Non Cable(b) – 2.1% | |
| Gray Television, Inc. (CCC+/Caa2) | |
| | 4,772,000 | | | | 10.500 | | | | 06/29/15 | | | | 5,165,690 | |
| Unitymedia Hessen (BB-/NR)(c) | |
| EUR | 545,000 | | | | 5.500 | | | | 09/15/22 | | | | 684,594 | |
| Univision Communications, Inc. (B+/B2)(c) | |
| $ | 5,591,000 | | | | 6.750 | | | | 09/15/22 | | | | 5,591,000 | |
| | | | | | | | | | | | | | |
| | | | | | | | | | | | | 11,441,284 | |
| | |
| Packaging(b) – 3.7% | |
| Ardagh Packaging Finance PLC / Ardagh MP Holdings USA, Inc.
(B+/NR)(c) |
|
| EUR | 1,902,000 | | | | 7.375 | | | | 10/15/17 | | | | 2,590,814 | |
| Reynolds Group Issuer, Inc. (B+/B1) | |
| | 3,324,000 | | | | 7.750 | (c) | | | 10/15/16 | | | | 4,431,687 | |
| $ | 13,864,000 | | | | 5.750 | | | | 10/15/20 | | | | 13,829,340 | |
| | | | | | | | | | | | | | |
| | | | | | | | | | | | | 20,851,841 | |
| | |
| Retailers(b)(c) – 0.4% | |
| Toys R US – Delaware, Inc. (B+/B1) | |
| | 2,274,000 | | | | 7.375 | | | | 09/01/16 | | | | 2,313,795 | |
| | |
| Services Cyclical – Rental Equipment(b) – 1.2% | |
| Hertz Holdings Netherlands BV (B+/B1) | |
| EUR | 4,880,000 | | | | 8.500 | | | | 07/31/15 | | | | 6,772,726 | |
| | |
| Principal
Amount |
| |
| Interest
Rate |
| |
| Maturity
Date |
| | | Value | |
| | | | | | | | | | | | | | |
| | Secured Debt Obligations – (continued) | |
| Tobacco(b) – 1.1% | |
| Vector Group Ltd. (NR/B1) | |
| $ | 5,900,000 | | | | 11.000 | % | | | 08/15/15 | | | $ | 6,143,375 | |
| | |
| | TOTAL OTHER SECURED DEBT OBLIGATIONS | |
| | (Cost $104,830,703) | | | $ | 107,310,028 | |
| | |
| | TOTAL SECURED DEBT OBLIGATIONS | |
| | (Cost $180,434,700) | | | $ | 184,306,985 | |
| | |
| | | | | | | | | | | | | | |
| | Unsecured Debt Obligations – 48.9% | |
| Automotive(b) – 0.9% | |
| Allison Transmission, Inc. (B-/B3)(c) | |
| $ | 1,133,000 | | | | 7.125 | % | | | 05/15/19 | | | $ | 1,217,975 | |
| Jaguar Land Rover PLC (BB-/Ba3)(c) | |
| | 1,136,000 | | | | 7.750 | | | | 05/15/18 | | | | 1,206,156 | |
| Visteon Corp. (B+/B2) | |
| | 2,397,000 | | | | 6.750 | | | | 04/15/19 | | | | 2,540,820 | |
| | | | | | | | | | | | | | |
| | | | | | | | | | | | | 4,964,951 | |
| | |
| Brokerage(b) – 3.4% | |
| E*Trade Financial Corp. (B-/B2) | |
| | 3,831,000 | | | | 7.875 | | | | 12/01/15 | | | | 3,878,887 | |
| | 5,617,000 | | | | 6.750 | | | | 06/01/16 | | | | 5,925,935 | |
| E*Trade Financial Corp. (B-/NR) | |
| | 7,911,000 | | | | 12.500 | | | | 11/30/17 | | | | 8,978,985 | |
| | | | | | | | | | | | | | |
| | | | | | | | | | | | | 18,783,807 | |
| | |
| Capital Goods – Others(b)(c) – 0.0% | |
| General Cable Corp. (B+/B1) | |
| | 110,000 | | | | 5.750 | | | | 10/01/22 | | | | 111,650 | |
| | |
| Chemicals(b) – 0.2% | |
| Rockwood Specialties Group, Inc. (BB/Ba2) | |
| | 1,126,000 | | | | 4.625 | | | | 10/15/20 | | | | 1,141,483 | |
| | |
| Consumer Cyclical Services(b) – 0.6% | |
| Heckmann Corp. (B-/Caa1) | |
| | 1,305,000 | | | | 9.875 | | | | 04/15/18 | | | | 1,344,150 | |
| iPayment, Inc. (CCC+/B3) | |
| | 2,074,000 | | | | 10.250 | | | | 05/15/18 | | | | 1,814,750 | |
| | | | | | | | | | | | | | |
| | | | | | | | | | | | | 3,158,900 | |
| | |
| Consumer Products(b) – 0.5% | |
| ADS Waste Holdings, Inc. (NR/Caa1)(c) | |
| | 1,759,000 | | | | 8.250 | | | | 10/01/20 | | | | 1,780,988 | |
| Sealy Mattress Co. (CCC+/Caa1) | |
| | 900,000 | | | | 8.250 | | | | 06/15/14 | | | | 911,250 | |
| | | | | | | | | | | | | | |
| | | | | | | | | | | | | 2,692,238 | |
| | |
| Distributors(b) – 0.5% | |
| AmeriGas Finance LLC/AmeriGas Finance Corp. (NR/Ba2) | |
| | 1,444,000 | | | | 6.750 | | | | 05/20/20 | | | | 1,537,860 | |
| | 1,170,000 | | | | 7.000 | | | | 05/20/22 | | | | 1,257,750 | |
| | | | | | | | | | | | | | |
| | | | | | | | | | | | | 2,795,610 | |
| | |
| | |
| 8 | | The accompanying notes are an integral part of these financial statements. |
GOLDMAN SACHS CREDIT STRATEGIES FUND
| | | | | | | | | | | | | | |
| Principal
Amount |
| |
| Interest
Rate |
| |
| Maturity
Date |
| | | Value | |
| | | | | | | | | | | | | | |
| | Unsecured Debt Obligations – (continued) | |
| Electric(b) – 0.8% | |
| Midwest Generation LLC (B-/Caa1) | |
| $ | 5,156,971 | | | | 8.560 | % | | | 01/02/16 | | | $ | 4,718,628 | |
| | |
| Energy – Exploration & Production(b) – 19.5% | |
| Aurora USA Oil & Gas, Inc. (CCC+/Caa1)(c) | |
| | 387,000 | | | | 9.875 | | | | 02/15/17 | | | | 414,090 | |
| Bill Barrett Corp. (BB-/B1) | |
| | 186,000 | | | | 7.625 | | | | 10/01/19 | | | | 196,695 | |
| | 1,699,000 | | | | 7.000 | | | | 10/15/22 | | | | 1,745,723 | |
| BreitBurn Energy Partners LP (B/B3) | |
| | 492,000 | | | | 8.625 | | | | 10/15/20 | | | | 536,280 | |
| | 2,443,000 | | | | 7.875 | (c) | | | 04/15/22 | | | | 2,522,397 | |
| Carrizo Oil & Gas, Inc. (B/B3) | |
| | 3,788,000 | | | | 8.625 | | | | 10/15/18 | | | | 4,053,160 | |
| | 1,679,000 | | | | 7.500 | | | | 09/15/20 | | | | 1,716,778 | |
| Chesapeake Energy Corp. (BB-/Ba3) | |
| | 4,279,000 | | | | 9.500 | | | | 02/15/15 | | | | 4,717,597 | |
| EV Energy Partners LP (B-/B3) | |
| | 1,075,000 | | | | 8.000 | | | | 04/15/19 | | | | 1,116,656 | |
| Linn Energy LLC/Linn Energy Finance Corp. (B/B2)(c) | |
| | 1,654,000 | | | | 6.250 | | | | 11/01/19 | | | | 1,641,595 | |
| Lone Pine Resources Canada Ltd. (B-/Caa2)(c) | |
| | 2,488,000 | | | | 10.375 | | | | 02/15/17 | | | | 2,288,960 | |
| Magnum Hunter Resources Corp. (CCC+/Caa1)(c) | |
| | 5,000,000 | | | | 9.750 | | | | 05/15/20 | | | | 5,100,000 | |
| Newfield Exploration Co. (BB+/Ba2) | |
| | 2,648,000 | | | | 6.875 | | | | 02/01/20 | | | | 2,886,320 | |
| Northern Oil and Gas, Inc. (B-/Caa1) | |
| | 649,000 | | | | 8.000 | | | | 06/01/20 | | | | 674,960 | |
| Oasis Petroleum, Inc. (B/B3) | |
| | 866,000 | | | | 6.500 | | | | 11/01/21 | | | | 917,960 | |
| PetroBakken Energy Ltd. (CCC+/Caa1)(c) | |
| | 19,750,000 | | | | 8.625 | | | | 02/01/20 | | | | 20,540,000 | |
| Petrohawk Energy Corp. (BBB+/Baa3) | |
| | 6,389,000 | | | | 6.250 | | | | 06/01/19 | | | | 7,187,625 | |
| Plains Exploration & Production Co. (BB-/B1) | |
| | 1,803,000 | | | | 7.625 | | | | 06/01/18 | | | | 1,924,703 | |
| | 3,616,000 | | | | 8.625 | | | | 10/15/19 | | | | 4,022,800 | |
| | 1,464,000 | | | | 7.625 | | | | 04/01/20 | | | | 1,562,820 | |
| | 6,384,000 | | | | 6.750 | | | | 02/01/22 | | | | 6,447,840 | |
| QR Energy LP/QRE Finance Corp. (B-/Caa1)(c) | |
| | 4,577,000 | | | | 9.250 | | | | 08/01/20 | | | | 4,679,982 | |
| Quicksilver Resources, Inc. (CCC/Caa1) | |
| | 4,308,000 | | | | 7.125 | | | | 04/01/16 | | | | 3,726,420 | |
| Resolute Energy Corp. (B-/B3)(c) | |
| | 700,000 | | | | 8.500 | | | | 05/01/20 | | | | 717,500 | |
| Samson Investment Co. (B-/B3) | |
| | 15,098,000 | | | | 9.750 | (c) | | | 02/15/20 | | | | 15,513,195 | |
| | 325,000 | | | | 9.750 | | | | 02/15/20 | | | | 333,938 | |
| Swift Energy Co. (B+/B3) | |
| | 2,748,000 | | | | 7.125 | | | | 06/01/17 | | | | 2,844,180 | |
| | 1,068,000 | | | | 8.875 | | | | 01/15/20 | | | | 1,150,770 | |
| | 4,428,000 | | | | 7.875 | | | | 03/01/22 | | | | 4,771,170 | |
| Vanguard Natural Resources LLC/VNR Finance Corp. (B-/Caa1) | |
| | 1,926,000 | | | | 7.875 | | | | 04/01/20 | | | | 1,940,445 | |
| | |
| Principal
Amount |
| |
| Interest
Rate |
| |
| Maturity
Date |
| | | Value | |
| | | | | | | | | | | | | | |
| | Unsecured Debt Obligations – (continued) | |
| Energy – Exploration & Production(b) – (continued) | |
| Venoco, Inc. (CCC+/Caa1) | |
| $ | 1,696,000 | | | | 8.875 | % | | | 02/15/19 | | | $ | 1,458,560 | |
| | | | | | | | | | | | | | |
| | | | | | | | | | | | | 109,351,119 | |
| | |
| Energy – Independent(b) – 0.4% | |
| Rosetta Resources, Inc. (BB-/B3) | |
| | 2,122,000 | | | | 9.500 | | | | 04/15/18 | | | | 2,355,420 | |
| | |
| Finance – 11.2% | |
| Ally Financial, Inc. (B+/B1) | |
| | 3,423,000 | | | | 6.750 | | | | 12/01/14 | | | | 3,662,610 | |
| | 3,300,000 | | | | 0.000 | (b)(d) | | | 06/15/15 | | | | 2,904,000 | |
| | 2,489,000 | | | | 4.625 | | | | 06/26/15 | | | | 2,551,225 | |
| | 318,000 | | | | 5.500 | | | | 02/15/17 | | | | 331,515 | |
| CIT Group, Inc. (BB-/B1)(b) | |
| | 13,611,000 | | | | 4.250 | | | | 08/15/17 | | | | 14,155,440 | |
| | 3,303,000 | | | | 5.500 | (c) | | | 02/15/19 | | | | 3,600,270 | |
| GMAC International Finance BV (B+/B1) | |
| EUR | 4,362,000 | | | | 7.500 | | | | 04/21/15 | | | | 6,040,365 | |
| International Lease Finance Corp. (BBB-/Ba3) | |
| $ | 1,169,000 | | | | 5.250 | | | | 01/10/13 | | | | 1,177,768 | |
| | 2,498,000 | | | | 5.625 | | | | 09/20/13 | | | | 2,576,062 | |
| | 2,752,000 | | | | 4.875 | | | | 04/01/15 | | | | 2,848,320 | |
| Morgan Stanley (A-/Baa1)(e) | |
| | 5,322,000 | | | | 0.935 | | | | 10/15/15 | | | | 5,070,929 | |
| National Money Mart Co. (B+/B2)(b) | |
| | 4,315,000 | | | | 10.375 | | | | 12/15/16 | | | | 4,811,225 | |
| Nationstar Mortgage LLC (NR/B2)(b)(c) | |
| | 1,980,000 | | | | 7.875 | | | | 10/01/20 | | | | 2,019,600 | |
| SLM Corp. (BBB-/Ba1)(b) | |
| | 1,912,000 | | | | 3.875 | | | | 09/10/15 | | | | 1,976,918 | |
| | 4,841,000 | | | | 6.250 | | | | 01/25/16 | | | | 5,310,885 | |
| | 3,417,000 | | | | 4.625 | | | | 09/25/17 | | | | 3,483,196 | |
| | | | | | | | | | | | | | |
| | | | | | | | | | | | | 62,520,328 | |
| | |
| Health Care – Medical Products(b) – 4.6% | |
| Alere, Inc. (B/B2) | |
| | 4,727,000 | | | | 7.875 | | | | 02/01/16 | | | | 4,975,167 | |
| Bausch & Lomb, Inc. (B/Caa1) | |
| | 13,679,000 | | | | 9.875 | | | | 11/01/15 | | | | 14,089,370 | |
| DJO Finance LLC/DJO Finance Corp. (CCC+/Caa1) | |
| | 5,105,000 | | | | 10.875 | | | | 11/15/14 | | | | 5,309,200 | |
| | 1,103,000 | | | | 9.875 | | | | 04/15/18 | | | | 1,091,970 | |
| | | | | | | | | | | | | | |
| | | | | | | | | | | | | 25,465,707 | |
| | |
| Health Care – Services(b) – 3.2% | |
| DaVita, Inc. (B/B2) | |
| | 6,019,000 | | | | 6.375 | | | | 11/01/18 | | | | 6,410,235 | |
| | 259,000 | | | | 6.625 | | | | 11/01/20 | | | | 276,806 | |
| | 4,643,000 | | | | 5.750 | | | | 08/15/22 | | | | 4,828,720 | |
| LifePoint Hospitals, Inc. (BB-/Ba1) | |
| | 1,058,000 | | | | 6.625 | | | | 10/01/20 | | | | 1,153,220 | |
| Tenet Healthcare Corp. (B+/B1) | |
| | 4,716,000 | | | | 8.875 | | | | 07/01/19 | | | | 5,305,500 | |
| | | | | | | | | | | | | | |
| | | | | | | | | | | | | 17,974,481 | |
| | |
| | |
| The accompanying notes are an integral part of these financial statements. | | 9 |
GOLDMAN SACHS CREDIT STRATEGIES FUND
Schedule of Investments (continued)
September 30, 2012 (Unaudited)
| | | | | | | | | | | | | | |
Principal
Amount | | | Interest
Rate | | | Maturity
Date | | | Value | |
| | | | | | | | | | | | | | |
| | Unsecured Debt Obligations – (continued) | |
| Media – Non Cable(b) – 0.2% | |
| Lamar Media Corp. (BB-/B1) | |
| $ | 519,000 | | | | 5.875 | % | | | 02/01/22 | | | $ | 552,735 | |
| Sirius XM Radio, Inc. (BB/B1)(c) | |
| | 686,000 | | | | 5.250 | | | | 08/15/22 | | | | 680,855 | |
| | | | | | | | | | | | | | |
| | | | | | | | | | | | | 1,233,590 | |
| | |
| Metals & Mining(b)(c) – 0.9% | |
| Molycorp, Inc. (CCC+/B3) | |
| | 4,833,000 | | | | 10.000 | | | | 06/01/20 | | | | 4,772,587 | |
| | |
| Packaging(b) – 0.2% | |
| Silgan Holdings, Inc. (BB-/Ba2) | |
| | 946,000 | | | | 5.000 | | | | 04/01/20 | | | | 986,205 | |
| | |
| Paper(b) – 0.4% | |
| Smurfit Kappa Acquisition Co. (BB/Ba2)(c) | |
| | 1,155,000 | | | | 4.875 | | | | 09/15/18 | | | | 1,162,219 | |
| Xerium Technologies, Inc. (B/B3) | |
| | 1,047,000 | | | | 8.875 | | | | 06/15/18 | | | | 934,447 | |
| | | | | | | | | | | | | | |
| | | | | | | | | | | | | 2,096,666 | |
| | |
| Pipelines(b) – 0.9% | |
| Copano Energy LLC/ Copano Energy Finance Corp. (B/B1) | |
| | 2,712,000 | | | | 7.750 | | | | 06/01/18 | | | | 2,847,600 | |
| | 2,280,000 | | | | 7.125 | | | | 04/01/21 | | | | 2,388,300 | |
| | | | | | | | | | | | | | |
| | | | | | | | | | | | | 5,235,900 | |
| | |
| Retailers(b) – 0.1% | |
| Burlington Coat Factory Warehouse Corp. (CCC/Caa1) | |
| | 515,000 | | | | 10.000 | | | | 02/15/19 | | | | 565,213 | |
| | |
| Services Cyclical – Rental Equipment(b)(c) – 0.1% | |
| B-Corp Merger Sub, Inc. (CCC+/Caa1) | |
| | 488,000 | | | | 8.250 | | | | 06/01/19 | | | | 492,880 | |
| | |
| Telecommunications – Wireless(b)(c) – 0.2% | |
| Viasat, Inc. (NR/B1) | |
| | 1,350,000 | | | | 6.875 | | | | 06/15/20 | | | | 1,393,875 | |
| | |
| Telecommunications – Wirelines(b) – 0.1% | |
| Cincinnati Bell, Inc. (B/B1) | |
| | 682,000 | | | | 8.250 | | | | 10/15/17 | | | | 728,035 | |
| | |
| | TOTAL UNSECURED DEBT OBLIGATIONS | |
| | (Cost $269,114,543) | | | $ | 273,539,273 | |
| | |
| | | | | | | | | | | | | | |
| | Convertible Debt Obligations(b)(f) – 0.3% | |
| Noncaptive – Financial – 0.2% | |
| DFC Global Corp. (NR/NR) | |
| $ | 950,000 | | | | 2.875 | % | | | 06/30/27 | | | $ | 970,719 | |
| | |
| Pipelines – 0.1% | |
| Carrizo Oil & Gas, Inc. (NR/NR) | |
| | 691,000 | | | | 4.375 | | | | 06/01/28 | | | | 698,933 | |
| | |
| | TOTAL CONVERTIBLE DEBT OBLIGATIONS | |
| | (Cost $1,551,534) | | | $ | 1,669,652 | |
| | |
| | | | | | | | | | | | | | |
| Principal
Amount |
| |
| Interest
Rate |
| |
| Maturity
Date |
| | | Value | |
| | | | | | | | | | | | | | |
| | Municipal Debt Obligation – 0.3% | |
| New Jersey – 0.3% | |
| New Jersey Economic Development Authority RB for
Continental Airlines, Inc. Project Series 1999 (B/B3) |
|
| $ | 1,730,000 | | | | 4.875 | % | | | 09/15/19 | | | $ | 1,766,244 | |
| | (Cost $1,730,000) | |
| | |
| | | | | | | | |
| Shares | | | Description | | Value | |
| | Private Common Equity(g) – 0.3% | |
| Capital Markets – 0.3% | |
| | 97,905 | | | DeepOcean Group Holding | | $ | 1,566,480 | |
| | (Cost $2,045,096) | | | | |
| | |
| | | | | | | | |
| Shares | | Rate | | | Value | |
| Preferred Stocks – 0.6% | |
Ally Financial, Inc. | |
| 851 | | | 7.000 | %(c) | | $ | 796,084 | |
GMAC Capital Trust I(e) | |
| 99,275 | | | 8.125 | | | | 2,492,795 | |
| |
| TOTAL PREFERRED STOCKS — 0.6% | |
| (Cost $3,179,303) | | | $ | 3,288,879 | |
| |
| TOTAL INVESTMENTS BEFORE SHORT-TERM INVESTMENT | |
| (Cost $458,055,176) | | | $ | 466,137,513 | |
| |
| | | | | | | | | | | | | | |
Principal
Amount | | | Interest
Rate | | | Maturity
Date | | | Value | |
| | | | | | | | | | | | | | |
| | Short-term Investment(h) – 16.9% | |
| Repurchase Agreement – 16.9% | |
| Joint Repurchase Agreement Account II | |
| $ | 94,700,000 | | | | 0.245 | % | | | 10/01/12 | | | $ | 94,700,000 | |
| | (Cost $94,700,000) | | | | | |
| | |
| | TOTAL INVESTMENTS – 100.3% | | | $ | 560,837,513 | |
| | (Cost $552,755,176) | | | | | |
| | |
| LIABILITIES IN EXCESS OF
OTHER ASSETS – (0.3)% |
| | | (1,452,350 | ) |
| | |
| | NET ASSETS – 100.0% | | | $ | 559,385,163 | |
| | |
| | |
| 10 | | The accompanying notes are an integral part of these financial statements. |
GOLDMAN SACHS CREDIT STRATEGIES FUND
| | |
The percentage shown for each investment category reflects the value of investments in that category as a percentage of net assets. |
(a) | | Senior Term Loans often require prepayments from excess cash flows or permit the borrower to repay at its election. The degree to which borrowers repay, whether as a contractual requirement or at their election, cannot be predicted with accuracy. As a result, the actual remaining maturity may be substantially less than the stated maturities shown. The stated interest rate represents the weighted average interest rate of all contracts within the senior loan facility at September 30, 2012. Senior Term Loans typically have rates of interest which are predetermined either daily, monthly, quarterly or semi-annually by reference to a base lending rate, plus a premium. These base lending rates are primarily the London-interbank Offered Rate (“LIBOR”), and secondarily the prime rate offered by one or more major United States banks (the “Prime Rate”) and the certificate of deposit (“CD”) rate or other base lending rates used by commercial lenders. |
(b) | | Security with “Call” features with resetting interest rates. Maturity dates disclosed are the final maturity dates. |
(c) | | Exempt from registration under Rule 144A of the Securities Act of 1933. Under procedures approved by the Board of Trustees, such securities have been determined to be liquid by the investment adviser and may be resold, normally to qualified institutional buyers in transactions exempt from registration. Total market value of Rule 144A securities amounts to $122,578,467, which represents approximately 21.9% of net assets as of September 30, 2012. |
| | |
(d) | | Issued with a zero coupon. Income is recognized through the accretion of discount. |
(e) | | Variable rate security. Interest rate disclosed is that which is in effect at September 30, 2012. |
(f) | | Security with “Put” features with resetting interest rates. Maturity dates disclosed are the final maturity dates. |
(g) | | Represents a restricted security acquired on May 26, 2011 at a cost of $2,045,096. |
(h) | | Joint repurchase agreement was entered into on September 28, 2012. Additional information appears on page 14. |
Security ratings disclosed, if any, are obtained from Standard & Poor’s/Moody’s Investors Service. A description of the ratings is available in the Fund’s Statement of Additional Information.
| | |
|
Currency Abbreviations: |
EUR | | —Euro |
GBP | | —British Pound |
| | |
Investment Abbreviations: |
LIBOR | | —London Interbank Offered Rate |
NR | | —Not Rated |
RB | | —Revenue Bond |
|
| | |
| The accompanying notes are an integral part of these financial statements. | | 11 |
GOLDMAN SACHS CREDIT STRATEGIES FUND
Schedule of Investments (continued)
September 30, 2012 (Unaudited)
|
| ADDITIONAL INVESTMENT INFORMATION |
FORWARD FOREIGN CURRENCY EXCHANGE CONTRACTS — At September 30, 2012, the Fund had the following forward foreign currency exchange contracts:
FORWARD FOREIGN CURRENCY EXCHANGE CONTRACTS WITH UNREALIZED GAIN
| | | | | | | | | | | | |
| Counterparty | | Contracts to
Buy/Sell | | Settlement
Date | | Current Value | | | Unrealized
Gain | |
Citibank NA | | USD/EUR | | 03/14/13 | | $ | 13,646,244 | | | $ | 40,263 | |
| | | USD/EUR | | 10/15/12 | | | 5,912,126 | | | | 131,538 | |
| TOTAL | | | | | | | | | | $ | 171,801 | |
FORWARD FOREIGN CURRENCY EXCHANGE CONTRACTS WITH UNREALIZED LOSS
| | | | | | | | | | | | |
| Counterparty | | Contracts to
Buy/Sell | | Settlement
Date | | Current
Value | | | Unrealized
Loss | |
Citibank NA | | USD/EUR | | 10/15/12 | | $ | 3,052,456 | | | $ | (86,533 | ) |
| | | USD/GBP | | 03/14/13 | | | 4,720,860 | | | | (11,464 | ) |
| TOTAL | | | | | | | | | | $ | (97,997 | ) |
| | |
| 12 | | The accompanying notes are an integral part of these financial statements. |
GOLDMAN SACHS CREDIT STRATEGIES FUND
|
| ADDITIONAL INVESTMENT INFORMATION (continued) |
SWAP CONTRACTS — At September 30, 2012, the Fund had the following swap contracts:
INTEREST RATE SWAP CONTRACTS
| | | | | | | | | | | | | | |
| | | | | | | Rates Exchanged | | | | |
| Counterparty | | Notional
Amount
(000s) | | Termination
Date | | Payments
Received | | Payments
Made | | | Unrealized
Gain
(Loss)* | |
Citibank NA | | $2,500 | | 05/17/17 | | 3 month LIBOR | | | 1.101 | % | | $ | (55,376 | ) |
| | * | | There are no upfront payments on the swap contract(s), therefore the unrealized gain (loss) of the swap contracts is equal to their market value. |
CREDIT DEFAULT SWAP CONTRACTS
| | | | | | | | | | | | | | | | | | | | | | | | | | |
| | | | | | | | | | | | | | | | | Market Value | |
| Counterparty | | Referenced
Obligation | | Notional
Amount
(000s) | | | Rates
Received
(Paid) | | | Termination
Date | | | Credit
Spread at
September 30,
2012(a) | | | Upfront
Payments
Made
(Received) | | | Unrealized
Gain (Loss) | |
Protection Sold: | | | | | | | | | | | | | | | | | | | | | | | | | | |
Citibank NA | | CDX North America Investment Grade Index 18 | | $ | 1,196 | | | | 5.000 | % | | | 06/20/17 | | | | 4.868 | % | | $ | 3,731 | | | $ | 4,442 | |
| | SLM Corp., 6.250, 1/25/16 | | | 1,810 | | | | 5.000 | | | | 06/20/17 | | | | 3.289 | | | | 20,958 | | | | 114,555 | |
Credit Suisse First Boston Corp. | | SLM Corp., 6.250, 1/25/16 | | | 3,950 | | | | 5.000 | | | | 06/20/17 | | | | 3.289 | | | | 25,000 | | | | 270,733 | |
| | Fiat Finance North America, Inc., 5.625, 6/12/17 | | | 2,430 | | | | 5.000 | | | | 09/20/17 | | | | 6.817 | | | | (406,389 | ) | | | 183,139 | |
| | SLM Corp., 6.250, 1/25/16 | | | 1,200 | | | | 5.000 | | | | 09/20/17 | | | | 3.361 | | | | 45,117 | | | | 44,617 | |
JPMorgan Securities, Inc. | | CDX North America Investment Grade Index 18 | | | 1,089 | | | | 5.000 | | | | 06/20/17 | | | | 4.868 | | | | (6,126 | ) | | | 12,963 | |
| TOTAL | | | | | | | | | | | | | | | | | | | | $ | (317,709 | ) | | $ | 630,449 | |
| | (a) | | Credit spread on the referenced obligation, together with the term of the swap contracts, are indicators of payment/performance risk. The likelihood of a credit event occurring which would require a fund to make a payment or otherwise be required to perform under the swap contract is generally greater as the credit spread and the term of the swap contract increase. |
| | |
| The accompanying notes are an integral part of these financial statements. | | 13 |
GOLDMAN SACHS CREDIT STRATEGIES FUND
Schedule of Investments (continued)
September 30, 2012 (Unaudited)
|
| ADDITIONAL INVESTMENT INFORMATION (continued) |
JOINT REPURCHASE AGREEMENT ACCOUNT II — At September 30, 2012, the Fund had undivided interests in the Joint Repurchase Agreement Account II, with a maturity date of October 1, 2012, as follows:
| | | | | | |
| Fund Name | | Principal Amount | | Maturity Value | | Collateral Allocation Value |
Credit Strategies | | $94,700,000 | | $94,701,933 | | $96,945,838 |
REPURCHASE AGREEMENTS — At September 30, 2012, the Principal Amount of the Fund’s interest in the Joint Repurchase Agreement Account II were as follows:
| | | | | | | | |
| Counterparty | | Interest Rate | | | Principal Amounts | |
BNP Paribas Securities Co. | | | 0.250 | % | | | $10,627,590 | |
Credit Suisse Securities LLC | | | 0.200 | | | | 3,815,032 | |
Deutsche Bank Securities, Inc. | | | 0.250 | | | | 17,854,351 | |
JPMorgan Securities LLC | | | 0.250 | | | | 35,152,797 | |
Wells Fargo Securities LLC | | | 0.240 | | | | 27,250,230 | |
| TOTAL | | | | | | | $94,700,000 | |
At September 30, 2012, the Joint Repurchase Agreement Account II was fully collateralized by:
| | | | | | | | |
| Issuer | | Interest Rates | | | Maturity Dates | |
Federal Home Loan Mortgage Corp. | | | 2.500 to 5.500 | % | | | 08/01/22 to 09/01/42 | |
Federal National Mortgage Association | | | 2.500 to 8.500 | | | | 06/01/14 to 07/01/51 | |
Government National Mortgage Association | | | 2.500 to 4.500 | | | | 04/15/27 to 09/20/42 | |
U.S. Treasury Notes | | | 0.375 to 4.875 | | | | 10/15/12 to 05/15/19 | |
| | |
| 14 | | The accompanying notes are an integral part of these financial statements. |
GOLDMAN SACHS CREDIT STRATEGIES FUND
Statement of Assets and Liabilities
September 30, 2012 (Unaudited)
| | | | | | |
| | | | | | |
| | Assets: | |
| | Investments, at value (cost $458,055,176) | | $ | 466,137,513 | |
| | Repurchase agreement, at value which equals cost | | | 94,700,000 | |
| | Foreign currencies, at value (cost $8,226,753) | | | 8,202,566 | |
| | Receivables: | | | | |
| | Investments sold on an extended settlement basis | | | 14,922,889 | |
| | Investments sold | | | 4,622,673 | |
| | Interest | | | 8,182,376 | |
| | Fund shares sold | | | 4,813,167 | |
| | Unrealized gain on swap contracts | | | 630,449 | |
| | Collateral on certain derivative contracts | | | 400,000 | |
| | Unrealized gain on forward foreign currency exchange contracts | | | 171,801 | |
| | Upfront payments made on swap contracts | | | 94,806 | |
| | Due from broker — upfront payment | | | 5,067 | |
| | Other assets | | | 1,528 | |
| | Total assets | | | 602,884,835 | |
| | | | | | |
| | Liabilities: | | | | |
| | Due to custodian | | | 1,935,412 | |
| | Payables: | | | | |
| | Investments purchased on an extended settlement basis | | | 24,925,762 | |
| | Investments purchased | | | 9,427,889 | |
| | Income distribution | | | 5,683,003 | |
| | Amounts owed to affiliates | | | 645,323 | |
| | Upfront payments received on swap contracts | | | 412,515 | |
| | Collateral on certain derivative contracts | | | 193,762 | |
| | Unrealized loss on forward foreign currency exchange contracts | | | 97,997 | |
| | Unrealized loss on swap contracts | | | 55,376 | |
| | Accrued expenses | | | 122,633 | |
| | Total liabilities | | | 43,499,672 | |
| | | | | | |
| | Net Assets: | | | | |
| | Paid-in capital | | | 539,913,625 | |
| | Undistributed net investment income | | | 970,465 | |
| | Accumulated net realized gain | | | 9,776,740 | |
| | Net unrealized gain | | | 8,724,333 | |
| | NET ASSETS | | $ | 559,385,163 | |
| | Shares Outstanding $0.001 par value (unlimited shares authorized): | | | 51,812,526 | |
| | Net asset value, offering and redemption price per share:(a) | | | $10.80 | |
| | (a) | | Maximum public offering price per share is $11.08. |
| | |
| The accompanying notes are an integral part of these financial statements. | | 15 |
GOLDMAN SACHS CREDIT STRATEGIES FUND
Statement of Operations
For the Six Months Ended September 30, 2012 (Unaudited)
| | | | | | |
| | | | | | |
| | Investment income: | | | | |
| | Interest | | $ | 15,502,970 | |
| | Dividends | | | 258,393 | |
| | Total investment income | | | 15,761,363 | |
| | | | | | |
| | Expenses: | | | | |
| | Management fees | | | 2,740,945 | |
| | Service fees | | | 641,827 | |
| | Transfer Agent fees | | | 411,142 | |
| | Professional fees | | | 69,873 | |
| | Custody and accounting fees | | | 67,779 | |
| | Printing and mailing costs | | | 46,767 | |
| | Registration fees | | | 14,375 | |
| | Trustee fees | | | 8,359 | |
| | Other | | | 10,211 | |
| | Total expenses | | | 4,011,278 | |
| | NET INVESTMENT INCOME | | | 11,750,085 | |
| | | | | | |
| | Realized and unrealized gain (loss): | | | | |
| | Net realized gain (loss) from: | | | | |
| | Investments | | | 9,230,572 | |
| | Swap contracts | | | 1,229,862 | |
| | Forward foreign currency exchange contracts | | | 535,170 | |
| | Foreign currency transactions | | | (1,617,818 | ) |
| | Net change in unrealized gain (loss) on: | | | | |
| | Investments | | | 1,191,883 | |
| | Swap contracts | | | 540,102 | |
| | Forward foreign currency exchange contracts | | | 622,625 | |
| | Foreign currency translation | | | (7,060 | ) |
| | Net realized and unrealized gain | | | 11,725,336 | |
| | NET INCREASE IN NET ASSETS RESULTING FROM OPERATIONS | | $ | 23,475,421 | |
| | |
| 16 | | The accompanying notes are an integral part of these financial statements. |
GOLDMAN SACHS CREDIT STRATEGIES FUND
Statements of Changes in Net Assets
| | | | | | | | | | |
| | | | | For the
Six Months Ended
September 30, 2012
(Unaudited) | | | For the Fiscal
Year Ended
March 31, 2012 | |
| | From operations: | |
| | Net investment income | | $ | 11,750,085 | | | $ | 24,422,161 | |
| | Net realized gain | | | 9,377,786 | | | | 7,246,727 | |
| | Net change in unrealized gain | | | 2,347,550 | | | | 1,290,795 | |
| | Net increase in net assets resulting from operations | | | 23,475,421 | | | | 32,959,683 | |
| | | | | | | | | | |
| | Distributions to shareholders: | |
| | From net investment income | | | (12,215,335 | ) | | | (24,625,906 | ) |
| | From net realized gains | | | — | | | | (13,812,892 | ) |
| | Total distributions to shareholders | | | (12,215,335 | ) | | | (38,438,798 | ) |
| | | | | | | | | | |
| | From share transactions: | |
| | Proceeds from sales of shares | | | 53,032,608 | | | | 127,657,712 | |
| | Reinvestment of distributions | | | 823,713 | | | | 2,844,042 | |
| | Cost of shares redeemed | | | (39,230,443 | ) | | | (123,320,924 | ) |
| | Net increase in net assets resulting from share transactions | | | 14,625,878 | | | | 7,180,830 | |
| | TOTAL INCREASE | | | 25,885,964 | | | | 1,701,715 | |
| | | | | | | | | | |
| | Net assets: | |
| | Beginning of period | | | 533,499,199 | | | | 531,797,484 | |
| | End of period | | $ | 559,385,163 | | | $ | 533,499,199 | |
| | Undistributed net investment income | | $ | 970,465 | | | $ | 1,435,715 | |
| | |
| The accompanying notes are an integral part of these financial statements. | | 17 |
GOLDMAN SACHS CREDIT STRATEGIES FUND
Financial Highlights
Selected Data for a Share Outstanding Throughout Each Period
| | | | | | | | | | | | | | | | | | | | | | | | | | | | | | |
| | | | | | | | Income (loss) from
investment operations | | | Distributions
to shareholders | |
| | | Year - Share Class | |
Net asset
value,
beginning
of period | | | Net
investment
income(a) | | | Net realized
and unrealized
gain | | | Total from
investment
operations | | | From net
investment
income | | | From net
realized
gains | | | Total
distributions | |
| | FOR THE SIX MONTHS ENDED SEPTEMBER 30, (UNAUDITED) | |
| | 2012 | | $ | 10.58 | | | $ | 0.23 | | | $ | 0.23 | | | $ | 0.46 | | | $ | (0.24 | ) | | $ | — | | | $ | (0.24 | ) |
| | | | | | | | | | | | | | | | | | | | | | | | | | | | | | |
| | FOR THE FISCAL YEARS ENDED MARCH 31, | |
| | 2012 | | | 10.70 | | | | 0.51 | | | | 0.17 | | | | 0.68 | | | | (0.51 | ) | | | (0.29 | ) | | | (0.80 | ) |
| | 2011 | | | 10.75 | | | | 0.56 | | | | 0.26 | | | | 0.82 | | | | (0.56 | ) | | | (0.31 | ) | | | (0.87 | ) |
| | | | | | | | | | | | | | | | | | | | | | | | | | | | | | |
| | FOR THE PERIOD ENDED MARCH 31, | |
| | 2010 (Commenced June 15, 2009) | | | 10.00 | | | | 0.48 | | | | 0.82 | | | | 1.30 | | | | (0.45 | ) | | | (0.10 | ) | | | (0.55 | ) |
| | (a) | | Calculated based on the average shares outstanding methodology. |
| | (b) | | Assumes investment at the net asset value at the beginning of the period, reinvestment of all dividends and distributions, a complete redemption of the investment at the net asset value at the end of the period and no sales or redemption charges. Total returns would be reduced if a sales or redemption charge was taken into account. Returns do not reflect the deduction of taxes that a shareholder would pay on Fund distributions or the redemption of Fund shares. Total returns for periods less than one full year are not annualized. |
| | (c) | | The Fund’s portfolio turnover rate is calculated in accordance with regulatory requirements, without regard to transactions involving short term investments and certain derivatives. If such transactions were included, the Fund’s portfolio turnover rate may be higher. |
| | |
| 18 | | The accompanying notes are an integral part of these financial statements. |
GOLDMAN SACHS CREDIT STRATEGIES FUND
| | | | | | | | | | | | | | | | | | | | | | | | | | | | | | | | | | | | | | | | |
| | | | | | | | | | | | | | | | | | | | | | | | | | | | | | | | | | |
| | | Net asset
value, end
of period | | | | | Total
return(b) | | | | | Net assets,
end of
period
(in 000s) | | | | | Ratio of
net expenses
to average
net assets | | | | | Ratio of
total expenses
to average
net assets | | | | | Ratio of
net investment
income
to average
net assets | | | | | Portfolio
turnover(c) | |
| | | | | | | | | | | | | | | | | | | | | | | | | | | | | | | | | | | | | | | | |
| | $ | 10.80 | | | | | | 4.38 | % | | | | $ | 559,385 | | | | | | 1.46 | %(d) | | | | | 1.46 | %(d) | | | | | 4.28 | %(d) | | | | | 88 | % |
| | | | | | | | | | | | | | | | | | | | | | | | | | | | | | | | | | | | | | | | |
| | | | | | | | | | | | | | | | | | | | | | | | | | | | | | | | | | | | | | | | |
| | | 10.58 | | | | | | 6.69 | | | | | | 533,499 | | | | | | 1.48 | | | | | | 1.48 | | | | | | 4.81 | | | | | | 215 | |
| | | 10.70 | | | | | | 7.94 | | | | | | 531,797 | | | | | | 1.50 | | | | | | 1.50 | | | | | | 5.23 | | | | | | 204 | |
| | | | | | | | | | | | | | | | | | | | | | | | | | | | | | | | | | | | | | | | |
| | | | | | | | | | | | | | | | | | | | | | | | | | | | | | | | | | | | | | | | |
| | | 10.75 | | | | | | 13.33 | | | | | | 431,676 | | | | | | 1.60 | (d) | | | | | 1.67 | (d) | | | | | 5.88 | (d) | | | | | 122 | |
| | |
| The accompanying notes are an integral part of these financial statements. | | 19 |
GOLDMAN SACHS CREDIT STRATEGIES FUND
Notes to Financial Statements
September 30, 2012 (Unaudited)
Goldman Sachs Credit Strategies Fund (the “Fund”) is a continuously offered, non-diversified, closed-end management investment company registered under the Investment Company Act of 1940 (the “Act”) which commenced operations on June 15, 2009. The Fund seeks a total return comprised of income and capital appreciation. The Fund is organized as a Delaware statutory trust and was established by the Declaration of Trust as amended and restated on March 12, 2009. The Fund currently offers one class of common shares (the “Shares”). The Fund charges a maximum sales charge of 2.50% of the Fund’s offering price.
The Fund is an “interval fund”, a type of fund which, in order to provide some liquidity to shareholders, makes quarterly offers to repurchase between 5% and 25% of its outstanding Shares at net asset value (“NAV”), pursuant to Rule 23c-3 under the Act.
Goldman Sachs Asset Management, L.P. (“GSAM”), an affiliate of Goldman Sachs & Co. (“Goldman Sachs” or the “Distributor”), serves as investment adviser to the Fund pursuant to a management agreement (the “Agreement”) with the Fund.
|
| 2. SIGNIFICANT ACCOUNTING POLICIES |
The financial statements have been prepared in accordance with accounting principles generally accepted in the United States of America (“GAAP”) and require management to make estimates and assumptions that may affect the reported amounts and disclosures. Actual results may differ from those estimates and assumptions.
A. Investment Valuation — The Fund’s valuation policy is to value investments at fair value.
B. Investment Income and Investments — Investment income includes interest income and dividend income, net of any foreign withholding taxes, less any amounts reclaimable. Interest income is accrued daily and adjusted for amortization of premiums and accretion of discounts. Dividend income is recognized on ex-dividend date or, for certain foreign securities, as soon as such information is obtained subsequent to the ex-dividend date. Investment transactions are reflected on trade date. Realized gains and losses are calculated using identified cost. Investment transactions are recorded on the following business day for daily Net Asset Value (“NAV”) calculations. Any foreign capital gains tax is accrued daily based upon net unrealized gains, and is payable upon sale of such investments.
For derivative contracts, realized gains and losses are recorded upon settlement of the contract. Upfront payments on swaps are recorded as realized gains or losses and are recognized over the contract’s term/event with the exception of forward starting interest rate swaps whose realized gain or losses are recognized from the effective start date. For securities with paydown provisions, principal payments received are treated as a proportionate reduction to the cost basis of the securities and excess amounts are recorded as gains. For treasury inflation protected securities (“TIPS”), adjustments to principal due to inflation/deflation are reflected as increases/decreases to interest income with a corresponding adjustment to cost.
C. Expenses — Expenses incurred by the Fund, which may not specifically relate to the Fund, may be shared with other registered investment companies having management agreements with GSAM or its affiliates, as appropriate. These expenses are allocated to the Fund on a straight-line and/or pro-rata basis depending upon the nature of the expenses and are accrued daily.
D. Federal Taxes and Distributions to Shareholders — It is the Fund’s policy to comply with the requirements of the Internal Revenue Code of 1986, as amended (the “Code”), applicable to regulated investment companies (mutual funds) and to distribute each year substantially all of its investment company taxable income and capital gains to its shareholders. Accordingly, the Fund is not required to make any provisions for the payment of federal income tax. Distributions to shareholders are recorded on the ex-dividend date. Income, if any, is declared daily and paid quarterly and capital gains distributions, if any, are declared and paid annually.
20
GOLDMAN SACHS CREDIT STRATEGIES FUND
|
| 2. SIGNIFICANT ACCOUNTING POLICIES (continued) |
Net capital losses are carried forward to future fiscal years and may be used to the extent allowed by the Code to offset any future capital gains. Utilization of capital loss carryforwards will reduce the requirement of future capital gains distributions.
The characterization of distributions to shareholders for financial reporting purposes is determined in accordance with federal income tax rules, which may differ from GAAP. The source of the Fund’s distributions may be shown in the accompanying financial statements as either from net investment income, net realized gain or capital. Certain components of the Fund’s net assets on the Statement of Assets and Liabilities reflect permanent GAAP/tax differences based on the appropriate tax character.
E. Foreign Currency Translation — The accounting records and reporting currency of the Fund are maintained in U.S. dollars. Assets and liabilities denominated in foreign currencies are translated into U.S. dollars using the current exchange rates at the close of each business day. The effect of changes in foreign currency exchange rates on investments is included within net realized and unrealized gain (loss) on investments. Changes in the value of other assets and liabilities as a result of fluctuations in foreign exchange rates are included in the Statement of Operations within net change in unrealized gain (loss) on foreign currency transactions. Transactions denominated in foreign currencies are translated into U.S. dollars on the date the transaction occurred, the effects of which are included within realized gain (loss) on foreign currency transactions.
| | |
| 3. INVESTMENTS AND FAIR VALUE MEASUREMENTS | | |
The fair value of a financial instrument is the amount that would be received to sell an asset or paid to transfer a liability in an orderly transaction between market participants at the measurement date (i.e., the exit price). GAAP establishes a fair value hierarchy that prioritizes the inputs to valuation techniques used to measure fair value. The hierarchy gives the highest priority to unadjusted quoted prices in active markets for identical assets or liabilities (Level 1 measurements) and the lowest priority to unobservable inputs (Level 3 measurements). The levels used for classifying investments are not necessarily an indication of the risk associated with investing in these investments. The three levels of the fair value hierarchy are described below:
Level 1 — Unadjusted quoted prices in active markets that are accessible at the measurement date for identical, unrestricted assets or liabilities;
Level 2 — Quoted prices in markets that are not active or financial instruments for which significant inputs are observable (including, but not limited to, quoted prices for similar investments, interest rates, foreign exchange rates, volatility and credit spreads), either directly or indirectly;
Level 3 — Prices or valuations that require significant unobservable inputs (including GSAM’s assumptions in determining fair value measurement).
A. Level 1 and Level 2 Fair Value Investments — The valuation techniques and significant inputs used in determining the fair values for investments classified as Level 1 and Level 2 are as follows:
Debt Securities — Debt securities, for which market quotations are readily available, are valued daily on the basis of quotations supplied by dealers or an independent pricing service approved by the trustees. The pricing services may use valuation models or matrix pricing, which consider: (i) yield or price with respect to bonds that are considered comparable in characteristics such as rating, interest rate and maturity date or (ii) quotations from securities dealers to determine current value. Short-term debt obligations that mature in sixty days or less and that do not exhibit signs of credit deterioration are valued at amortized cost, which
21
GOLDMAN SACHS CREDIT STRATEGIES FUND
Notes to Financial Statements (continued)
September 30, 2012 (Unaudited)
|
| 3. INVESTMENTS AND FAIR VALUE MEASUREMENTS (continued) |
approximates fair value. With the exception of treasury securities which, are generally classified as Level 1, these investments are generally classified as in Level 2 of the fair value hierarchy.
i. Senior Term Loans — Senior Term Loans (“Loans”) are interests in amounts owed by corporate, governmental, or other borrowers to lenders or lending syndicates. Loans are arranged through private negotiations between the borrower and one or more financial institutions (“Lenders”). Investments in Loans are in the form either participations in Loans (“Participations”) or assignments of all or a portion of Loans from third parties (“Assignments”). A Fund has the right to receive payments of principal, interest and any fees to which it is entitled from the Lender selling Participations and only upon receipt by the Lender of the payments from the borrower. A Fund generally has no right to enforce compliance by the borrower with the terms of the loan agreement.
Certain Loans may have commitment provision, whereby a fund commits to fund a predetermined amount of capital to the borrower over a specified time. A fund is obligated to fund these commitments at the borrower’s discretion. A fund may receive a commitment fee based on the undrawn portion of the underlying line of credit of a Senior Term Loan.
Equity Securities — Equity securities and investment companies traded on a United States (“U.S.”) securities exchange or the NASDAQ system, or those located on certain foreign exchanges including, but not limited to the Americas, are valued daily at their last sale price or official closing price on the principal exchange or system on which they are traded. If no sale occurs, equity securities and exchange traded investment companies are valued at the last bid price for long positions and at the last ask price for short positions. Investments in investment companies (other than those that are exchange traded) are valued at the NAV on the valuation date. To the extent these investments are actively traded, they are classified as Level 1 of the fair value hierarchy.
Unlisted equity securities for which market quotations are available are valued at the last sale price on the valuation date, or if no sale occurs, at the last bid price. Securities traded on certain foreign securities exchanges are valued daily at fair value determined by an independent fair value service (if available) under valuation procedures approved by the trustees and consistent with applicable regulatory guidance. The independent fair value service takes into account multiple factors including, but not limited to, movements in the securities markets, certain depositary receipts, futures contracts and foreign currency exchange rates that have occurred subsequent to the close of the foreign securities exchange. Investments applying these valuation adjustments are classified as Level 2 of the fair value hierarchy.
Derivative Contracts — A derivative is an instrument whose value is derived from underlying assets, indices, reference rates or a combination of these factors.
Exchange-traded derivatives, including futures contracts, typically fall within Level 1 of the fair value hierarchy. Over-the-counter (“OTC”) derivatives are valued using market transactions and other market evidence, including market-based inputs to models, calibration to market-clearing transactions, broker or dealer quotations, or other alternative pricing. Where models are used, the selection of a particular model to value an OTC derivative depends upon the contractual terms of, and specific risks inherent in, the instrument, as well as the availability of pricing information in the market. Valuation models require a variety of inputs, including contractual terms, market prices, yield curves, credit curves, measures of volatility, voluntary and involuntary prepayment rates, loss severity rates and correlations of such inputs. For OTC derivatives that trade in liquid markets, model inputs
22
GOLDMAN SACHS CREDIT STRATEGIES FUND
|
| 3. INVESTMENTS AND FAIR VALUE MEASUREMENTS (continued) |
can generally be verified and model selection does not involve significant management judgment. OTC derivatives are classified within Level 2 of the fair value hierarchy when significant inputs are corroborated by market evidence.
i. Forward Foreign Currency Exchange Contracts — In a forward foreign currency contract, the Funds agree to receive or deliver a fixed quantity of one currency for another, at a pre-determined price at a future date. All forward foreign currency exchange contracts are marked to market daily at the applicable forward rate.
ii. Swap Contracts — Swaps are marked to market daily using pricing vendor quotations, counterparty prices or model prices, and the change in value, if any, is recorded as an unrealized gain or loss.
An interest rate swap is an agreement that obligates two parties to exchange a series of cash flows at specified intervals, based upon or calculated by reference to changes in specified prices, rates or indices for a specified amount of an underlying asset or notional principal amount. The payment flows are usually netted against each other, with the difference being paid by one party to the other.
A credit default swap is an agreement that involves one party making a stream of payments to another party in exchange for the right to receive protection on a reference security or obligation. A Fund may use credit default swaps to provide a measure of protection against defaults of the reference security or obligation or to take a short position with respect to the likelihood of default. A Fund’s investment in credit default swaps may involve greater risks than if the Fund had invested in the referenced obligation directly. Credit events are contract specific but may include bankruptcy, failure to pay, restructuring and obligation acceleration. If a Fund buys protection through a credit default swap and no credit event occurs, its payments are limited to the periodic payments previously made to the counterparty. Upon the occurrence of a specified credit event, a Fund, as a buyer of credit protection, is entitled to receive an amount equal to the notional amount of the swap and deliver to the seller the defaulted reference obligation in a physically settled trade. A Fund may also receive a net settlement amount in the form of cash or securities equal to the notional amount of the swap reduced by the recovery value of the reference obligation in a cash settled trade.
As a seller of protection, a Fund generally receives a payment stream throughout the term of the swap, provided that there is no credit event. In addition, if the Fund sells protection through a credit default swap, a Fund could suffer a loss because the value of the referenced obligation may be less than the premium payments received. Upon the occurrence of a specified credit event, a Fund, as a seller of credit protection, may be required to take possession of the defaulted reference obligation and pay the buyer an amount equal to the notional amount of the swap in a physically settled trade. A Fund may also pay a net settlement amount in the form of cash or securities equal to the notional amount of the swap reduced by the recovery value of the reference obligation in a cash settled trade. Recovery values are at times established through the credit event auction process in which market participants are ensured that a transparent price has been set for the defaulted security or obligation. In addition, a Fund is entitled to a return of any assets, which have been pledged as collateral to the counterparty.
The maximum potential amount of future payments (undiscounted) that the Fund as seller of protection could be required to make under a credit default swap would be an amount equal to the notional amount of the agreement. These potential amounts would be partially offset by any recovery values of the respective referenced obligations or net amounts received from a settlement of a credit default swap for the same reference security or obligation where the Fund bought credit protection.
23
GOLDMAN SACHS CREDIT STRATEGIES FUND
Notes to Financial Statements (continued)
September 30, 2012 (Unaudited)
|
| 3. INVESTMENTS AND FAIR VALUE MEASUREMENTS (continued) |
Short Term Investments — Short-term investments having a maturity of 60 days or less are generally valued at amortized cost which approximates fair market value. These investments are classified as Level 2 of the fair value hierarchy.
Repurchase Agreements — Repurchase agreements involve the purchase of securities subject to the seller’s agreement to repurchase the securities at a mutually agreed upon date and price. During the term of a repurchase agreement, the value of the underlying securities held as collateral on behalf of the Fund, including accrued interest, is required to exceed the value of the repurchase agreement, including accrued interest. The underlying securities for all repurchase agreements are held at the Fund’s custodian or designated sub-custodians under tri-party repurchase agreements.
Pursuant to exemptive relief granted by the Securities and Exchange Commission and terms and conditions contained therein, the Fund, together with other registered investment companies having management agreements with GSAM or its affiliates, may transfer uninvested cash into joint accounts, the daily aggregate balance of which is invested in one or more repurchase agreements. Under these joint accounts, the Fund maintains pro rata credit exposure to the underlying repurchase agreements’ counterparties. With the exception of certain transaction fees, the Fund is not subject to any expenses in relation to these investments.
B. Level 3 Fair Value Investments — The valuation techniques and significant inputs used in determining the fair values for investments classified as Level 3 are as follows:
To the extent that the aforementioned significant inputs are unobservable, or if quotations are not readily available, or if GSAM believes that such quotations do not accurately reflect fair value, the fair value of the Fund’s investments may be determined under valuation procedures approved by the trustees. GSAM, consistent with its procedures and applicable regulatory guidance, may make an adjustment to the most recent valuation prices of either domestic or foreign securities in light of significant events to reflect what it believes to be the fair value of the securities at the time of determining the Fund’s NAV. Significant events which could affect a large number of securities in a particular market may include, but are not limited to: significant fluctuations in U.S. or foreign markets; market dislocations; market disruptions; or unscheduled market closings. Significant events which could also affect a single issuer may include, but are not limited to: corporate actions such as reorganizations, mergers and buy-outs; ratings downgrades; and bankruptcies.
C. Fair Value Hierarchy — The following is a summary of the Funds’ investments and derivatives classified in the fair value hierarchy as of September 30, 2012:
| | | | | | | | | | | | |
| | | |
| Investment Type | | Level 1 | | | Level 2 | | | Level 3 | |
| Assets | | | | | | | | | | | | |
Fixed Income | | | | | | | | | | | | |
Secured Debt Obligations | | $ | — | | | $ | 184,306,985 | | | $ | — | |
Unsecured Debt Obligations | | | — | | | | 273,539,273 | | | | — | |
Convertible Debt Obligations | | | — | | | | 1,669,652 | | | | — | |
Municipal Debt Obligation | | | — | | | | 1,766,244 | | | | — | |
Common Stock and/or Other Equity Investments | | | — | | | | 3,288,879 | | | | 1,566,480 | |
Short-term Investments | | | — | | | | 94,700,000 | | | | — | |
| Total | | $ | — | | | $ | 559,271,033 | | | $ | 1,566,480 | |
24
GOLDMAN SACHS CREDIT STRATEGIES FUND
|
| 3. INVESTMENTS AND FAIR VALUE MEASUREMENTS (continued) |
| | | | | | | | | | | | |
| | | |
| Derivative Type | | Level 1 | | | Level 2 | | | Level 3 | |
| Assets(a) | | | | | | | | | | | | |
Forward Foreign Currency Exchange Contracts | | $ | — | | | $ | 171,801 | | | $ | — | |
Credit Default Swap Contracts | | | — | | | | 630,449 | | | | — | |
| Total | | $ | — | | | $ | 802,250 | | | $ | — | |
| Liabilities(a) | | | | | | | | | | | | |
Forward Foreign Currency Exchange Contracts | | $ | — | | | $ | (97,997 | ) | | $ | — | |
Interest Rate Swap Contracts | | | | | | | (55,376 | ) | | | | |
| Total | | $ | — | | | $ | (153,373 | ) | | $ | — | |
| (a) | | Amount shown represents unrealized gain (loss) at period end. |
| | |
| 4. INVESTMENTS IN DERIVATIVES | | |
The following table sets forth, by certain risk types, the gross value of derivative contracts as of September 30, 2012. These instruments were used to meet the Fund’s investment objectives and to obtain and/or manage exposure related to the risks below. The values in the table below exclude the effects of cash collateral received or posted pursuant to these derivative contracts, and therefore are not representative of the Fund’s net exposure.
| | | | | | | | | | | | |
| Risk | | Statement of Assets and Liabilities | | Assets | | | Statement of Assets
and Liabilities | | Liabilities | |
Interest rate | | — | | $ | — | | | Payable for unrealized loss on swap contracts(a) | | $ | (55,376) | |
Credit | | Receivable for unrealized gain on swap contracts | | | 630,449 | | | — | | | — | |
Currency | | Receivable for unrealized gain on forward foreign currency exchange contracts | | | 171,801 | | | Payable for unrealized loss on forward foreign currency exchange contracts | | | (97,997) | |
| Total | | $ | 802,250 | | | | | $ | (153,373) | |
| (a) | | Amount represents the payments to be made pursuant to bilateral agreements should counterparties exercise their “right to terminate” provisions based on, among others, the Fund’s performance, its failure to pay on its obligations or failure to pledge collateral. The amount does not include incremental charges directly associated with the close-out of the agreements. It also does not reflect the fair value of any assets pledged as collateral which, through the daily margining process, substantially offsets the aforementioned amounts and for which the Fund is entitled to a full return. |
The following table sets forth, by certain risk types, the Fund’s gains (losses) related to these derivatives and their indicative volumes for the six months ended September 30, 2012. These gains (losses) should be considered in the context that these derivative contracts may have been executed to economically hedge certain investments, and accordingly, certain gains (losses) on
25
GOLDMAN SACHS CREDIT STRATEGIES FUND
Notes to Financial Statements (continued)
September 30, 2012 (Unaudited)
|
| 4. INVESTMENTS IN DERIVATIVES (continued) |
such derivative contracts may offset certain (losses) gains attributable to investments. These gains (losses) are included in “Net realized gain (loss)” or “Net change in unrealized gain (loss)” on the Statement of Operations:
| | | | | | | | | | | | | | |
| Risk | | Statement of Operations Location | | Net Realized Gain (Loss) | | | Net Change
in Unrealized Gain (Loss) | | | Average
Number of
Contracts(a) | |
| Interest rate | | Net realized gain (loss) from swap contracts/Net change in unrealized gain (loss) on
swap contracts | | $ | (5,914 | ) | | $ | (55,376 | ) | | | 1 | |
| Credit | | Net realized gain (loss) from swap contracts/Net change in unrealized gain (loss) on
swap contracts | | | 1,235,776 | | | | 595,478 | | | | 9 | |
| Currency | | Net realized gain (loss) from forward foreign currency exchange contracts/Net change
in unrealized gain (loss) on forward foreign currency exchange contracts | | | 535,170 | | | | 622,625 | | | | 7 | |
| Total | | | | $ | 1,765,032 | | | $ | 1,162,727 | | | | 17 | |
| (a) | | Average number of contracts is based on the average of month end balances for the six months ended September 30, 2012. |
| | |
| 5. AGREEMENTS AND AFFILIATED TRANSACTIONS | | |
A. Management Agreement — Under the Agreement, GSAM manages the Fund, subject to the general supervision of the trustees.
As compensation for the services rendered pursuant to the Agreement, the assumption of the expenses related thereto and administration of the Fund’s business affairs, including providing facilities, GSAM is entitled to a management fee, accrued daily and paid monthly, equal to an annual percentage rate of the Fund’s average daily net assets.
For the six months ended September 30, 2012, the contractual management fee with GSAM was at the following rates:
| | | | | | | | | | | | | | | | |
| Contractual Management Fee Rate |
First $1 billion | | Next $1 billion | | Next $3 billion | | | Next $3 billion | | | Over $8 billion | | | Effective Net
Management Fee Rate |
1.00% | | 0.90% | | | 0.86 | % | | | 0.84 | % | | | 0.82 | % | | 1.00% |
B. Service Plan — The Fund has adopted a Service Plan (the “Plan”). Under the Plan, Goldman Sachs is entitled to receive a fee (“Service fee”) equal to, on an annual basis, up to 0.25% of the Fund’s average daily net assets attributed to the Shares. This fee is for personal and account maintenance services, and may be used to make payments: (i) to Goldman Sachs, or (ii) by Goldman Sachs to certain brokers, dealers and financial service firms that have entered into agreements with Goldman Sachs to provide such services.
C. Distribution Agreement — Goldman Sachs also serves as distributor of the Shares of the Fund pursuant to a Distribution Agreement. Goldman Sachs will receive no compensation for its services as Distributor.
26
GOLDMAN SACHS CREDIT STRATEGIES FUND
|
| 5. AGREEMENTS AND AFFILIATED TRANSACTIONS (continued) |
D. Transfer Agency Agreement — Goldman Sachs also serves as the transfer agent of the Fund for a fee pursuant to a Transfer Agency Agreement. The fee charged for such transfer agency services is accrued daily and paid monthly at an annual rate of 0.15% of the average daily net assets of the Shares.
E. Other Expense Agreements and Affiliated Transactions — GSAM has agreed to limit certain “Other Expense” of the Fund (excluding management fees, service fees, acquired fund fees and expenses, transfer agent fees and expenses, taxes, interest, brokerage fees and litigation, indemnification, shareholder meetings and other extraordinary expenses, exclusive of any custody and transfer agent fee credit reductions) to the extent such expenses exceed, on an annual basis, 0.204% of the average daily net assets of the Fund. Such Other Expense reimbursements, if any, are accrued daily and paid monthly. In addition, the Fund is not obligated to reimburse GSAM for prior fiscal year expense reimbursements, if any. These Other Expense reimbursements, if any, will remain in place through at least July 27, 2013, and prior to such date GSAM may not terminate the arrangements without the approval of the trustees. In addition, the Fund has entered into certain offset arrangements with the custodian and the transfer agent, which may result in a reduction in the Fund’s expenses.
As of September 30, 2012, the amounts owed to affiliates were (in thousands) $461, $115, and $69 for management, service, and transfer agent fees, respectively.
F. Line of Credit Facility — As of September 30, 2012, the Fund participated in a $630,000,000 committed, unsecured revolving line of credit facility (“the facility”) together with other funds of the Trust and registered investment companies having management agreements with GSAM or its affiliates (“Other Borrowers”). Pursuant to the terms of the facility, the Fund and Other Borrowers could increase the credit amount by an additional $340,000,000, for a total of up to $970,000,000. This facility is to be used solely for temporary or emergency purposes. The interest rate on borrowings is based on the federal funds rate. The facility also requires a fee to be paid by the Fund based on the amount of the commitment that has not been utilized. For the six months ended September 30, 2012, the Fund did not have any borrowings under the facility. Prior to May 8, 2012, the amount available through the facility was $580,000,000.
| | |
| 6. PORTFOLIO SECURITIES TRANSACTIONS | | |
The cost of purchases and proceeds from sales and maturities of long-term securities for the six months ended September 30, 2012, were $401,940,573 and $402,974,576, respectively.
27
GOLDMAN SACHS CREDIT STRATEGIES FUND
Notes to Financial Statements (continued)
September 30, 2012 (Unaudited)
As of the Fund’s most recent fiscal year end, March 31, 2012, the Fund’s timing difference (post-October losses and income distribution), was $(10,732,392), on a tax basis.
As of September 30, 2012, the Fund’s aggregate security unrealized gains and losses based on cost for U.S. federal income tax purposes were as follows:
| | | | |
Tax Cost | | $ | 553,144,554 | |
Gross unrealized gain | | | 11,050,782 | |
Gross unrealized loss | | | (3,357,823 | ) |
Net unrealized security gain | | $ | 7,692,959 | |
The difference between GAAP-basis and tax-basis unrealized gains (losses), as of the most recent fiscal year end, is attributable to wash sales and net mark-to-market gains (losses) on foreign currency exchange contracts and the differences related to the tax treatment of swap transactions.
GSAM has reviewed the Fund’s tax positions for all open tax years (the current and prior three years, as applicable) and has concluded that no provision for income tax is required in the Fund’s financial statements. Such open tax years remain subject to examination and adjustment by tax authorities.
The Fund’s risks include, but are not limited to, the following:
Foreign Custody Risk — A fund that invests in foreign securities may hold such securities and foreign currency with foreign banks, agents, and securities depositories appointed by the Fund’s custodian (each a “Foreign Custodian”). In some countries, Foreign Custodians may be subject to little or no regulatory oversight or independent evaluation of their operations. Further, the laws of certain countries may place limitations on the Fund’s ability to recover its assets if a Foreign Custodian enters into bankruptcy. Investments in emerging markets may be subject to greater custody risks than investments in more developed markets. Custody services in emerging market countries are often undeveloped and may be less regulated than in more developed countries, and thus may not afford the same level of investor protection as would apply in developed countries.
Liquidity Risk — The Fund may make investments that may be illiquid or that may become less liquid in response to market developments or adverse investor perceptions. Liquidity risk may also refer to the risk that a Fund will not be able to pay redemption proceeds within the allowable time period because of unusual market conditions, an unusually high volume of redemption requests, or other reasons. To meet redemption requests, a Fund may be forced to sell investments at an unfavorable time and/or under unfavorable conditions.
Market and Credit Risks — In the normal course of business, the Fund trades financial instruments and enters into financial transactions where risk of potential loss exists due to changes in the market (market risk). Additionally, the Fund may also be exposed to credit risk in the event that an issuer fails to perform or that an institution or entity with which the Fund has unsettled or open transaction defaults.
Investing in foreign markets may involve special risks and considerations not typically associated with investing in the U.S. These risks include revaluation of currencies, high rates of inflation, repatriation restrictions on income and capital and adverse political and economic developments. Moreover, securities issued in these markets may be less liquid, be subject to government ownership controls, have delayed settlements and their prices may be more volatile than those of comparable securities in the U.S.
Non-Diversification Risk — The Fund is non-diversified and is permitted to invest more of its assets in fewer issuers than a “diversified” mutual fund. Thus, the Fund may be more susceptible to adverse developments affecting any single issuer held in its portfolio, and may be more susceptible to greater losses because of these developments.
28
GOLDMAN SACHS CREDIT STRATEGIES FUND
Portfolio Concentration Risk — As a result of the Fund’s ability to invest a large percentage of its assets in obligations of issuers within the same country, state, region, currency or economic sector, an adverse economic, business or political development may affect the value of the Fund’s investments more than if its investments were not so concentrated.
Under the Trust’s organizational documents, its trustees, officers, employees and agents are indemnified, to the extent permitted by the Act, against certain liabilities that may arise out of performance of their duties to the Fund. Additionally, in the course of business, the Fund enters into contracts that contain a variety of indemnification clauses. The Fund’s maximum exposure under these arrangements is unknown, as this would involve future claims that may be made against the Fund that have not yet occurred. However, GSAM believes the risk of loss under these arrangements to be remote.
| | |
| 10. SHARES OF BENEFICIAL INTEREST | | |
Each quarter, the trustees, in its sole discretion, will determine the number of Shares that the Fund will offer to repurchase (the “Repurchase Offer Amount”) for a particular Repurchase Offer (defined below). The Repurchase Offer Amount will be at least 5% but not more than 25% of the total number of Shares outstanding on the date by which a shareholder can tender their Shares in response to a Repurchase Offer (“Repurchase Request Deadline”). In connection with any given Repurchase Offer, it is possible that the Fund may offer to repurchase only the minimum amount of 5% of its outstanding Shares on the Repurchase Request Deadline. If shareholders tender more than the Repurchase Offer Amount for a particular Repurchase Offer, the Fund may repurchase up to an additional 2% of the Shares outstanding on the Repurchase Request Deadline. The Fund may not be able to repurchase the entire amount of Shares a shareholder has tendered in a Repurchase Request for a particular Repurchase Offer if the aggregate tenders exceed the Repurchase Offer Amount and, when applicable, up to the additional 2% of Shares offered to be repurchased by the Fund.
For the six months ended September 30, 2012, the Fund extended the following Repurchase Offers:
| | | | | | |
Repurchase
Request
Deadline | | Percentage of Outstanding Shares the Fund Offered
to be Repurchased | | Amount of Shares the Fund Offered
to Repurchase | | Number of Shares
Tendered |
| 6/15/2012 | | 10% | | 5,235,929 | | 1,930,999 |
| 9/14/2012 | | 10% | | 5,282,287 | | 1,752,310 |
The Fund is authorized to issue an unlimited number of shares and at the date of this report has registered 125,100,000 shares, par value $0.001 each. Transactions in shares of beneficial interest were as follows:
| | | | | | | | | | |
| | | | | For the Period Ended September 30, 2012
(Unaudited) | | | For the Fiscal Year Ended March 31, 2012 | |
Shares sold | | | | | 4,980,157 | | | | 12,206,573 | |
Reinvestment of distributions | | | | | 77,174 | | | | 274,962 | |
Shares repurchased | | | | | (3,683,309 | ) | | | (11,760,161 | ) |
Net increase | | | | | 1,374,022 | | | | 721,374 | |
29
GOLDMAN SACHS CREDIT STRATEGIES FUND
Notes to Financial Statements (continued)
September 30, 2012 (Unaudited)
Other — On February 8, 2012, the Commodity Futures Trading Commission (CFTC) adopted amendments to several of its rules relating to commodity pool operators, including Rule 4.5. The Funds currently rely on Rule 4.5’s exclusion from CFTC regulation for regulated investment companies. GSAM is currently evaluating the amendments and their impact, if any, on the Funds’ financial statements.
Subsequent events after the balance sheet date have been evaluated through the date the financial statements were issued. GSAM has concluded that there is no impact requiring adjustment or disclosure in the financial statements.
30
GOLDMAN SACHS CREDIT STRATEGIES FUND
| | |
Fund Expenses — Six Month Period Ended September 30, 2012 (Unaudited) | | |
As a shareholder of Common Shares of the Fund, you incur two types of costs: (1) transaction costs, including sales charges on purchase payments; and (2) ongoing costs, including management fees; service (12b-1) fees; and other Fund expenses. This Example is intended to help you understand your ongoing costs (in dollars) of investing in the Fund and to compare these costs with the ongoing costs of investing in other mutual funds.
The Example is based on an investment of $1,000 invested at the beginning of the period and held for the entire period from April 1, 2012 through September 30, 2012.
Actual Expenses — The first line in the table below provides information about actual account values and actual expenses. You may use the information in this line, together with the amount you invested, to estimate the expenses that you paid over the period. Simply divide your account value by $1,000 (for example, an $8,600 account value divided by $1,000=8.6), then multiply the result by the number in the first line under the heading entitled “Expenses Paid” to estimate the expenses you paid on your account during this period.
Hypothetical Example for Comparison Purposes — The second line in the table below provides information about hypothetical account values and hypothetical expenses based on the Fund’s actual net expense ratio and an assumed rate of return of 5% per year before expenses, which is not the Fund’s actual return. The hypothetical account values and expenses may not be used to estimate the actual ending account balance or expenses you paid for the period. You may use this information to compare the ongoing costs of investing in the Fund and other funds. To do so, compare this 5% hypothetical example with the 5% hypothetical examples that appear in the shareholder reports of the other funds.
Please note that the expenses shown in the table are meant to highlight your ongoing costs only and do not reflect any transactional costs, such as sales charges, redemption fees, or exchange fees. Therefore, the second line of the table is useful in comparing ongoing costs only, and will not help you determine the relative total costs of owning different funds. In addition, if these transactional costs were included, your costs would have been higher.
| | | | | | | | | | | | |
| Common Shares | | Beginning
Account Value
4/1/12 | | | Ending
Account Value
9/30/12 | | | Expenses Paid for the
6 months ended
9/30/12* | |
Actual | | $ | 1,000.00 | | | $ | 1,043.80 | | | $ | 7.48 | |
Hypothetical 5% return | | | 1,000.00 | | | | 1,017.75 | + | | | 7.38 | |
| | * | | Expenses are calculated using the Fund’s annualized net expense ratio, which represents the ongoing expenses as a percentage of net assets for the six months ended September 30, 2012. Expenses are calculated by multiplying the annualized net expense ratio by the average account value for the period; then multiplying the result by the number of days in the most recent fiscal half year; and then dividing that result by the number of days in the fiscal year. The annualized net expense ratio for the period was 1.46%. | |
| | + | | Hypothetical expenses are based on the Fund’s actual annualized net expense ratio and an assumed rate of return of 5% per year before expenses. | |
31
GOLDMAN SACHS CREDIT STRATEGIES FUND
Statement Regarding Basis for Approval of Management Agreement (Unaudited)
Background
The Goldman Sachs Credit Strategies Fund (the “Fund”) is a closed-end management investment company that commenced operations on June 15, 2009. The Board of Trustees oversees the management of the Fund and reviews the investment performance and expenses of the Fund at regularly scheduled meetings held during the year. In addition, the Board of Trustees determines annually whether to approve the continuance of the Fund’s investment management agreement (the “Management Agreement”) with Goldman Sachs Asset Management, L.P. (the “Investment Adviser”).
The Management Agreement was most recently approved for continuation until June 30, 2013 by the Board of Trustees, including those Trustees who are not parties to the Management Agreement or “interested persons” (as defined in the Investment Company Act of 1940, as amended) of any party thereto (the “Independent Trustees”), at a meeting held on June 13, 2012 (the “Annual Meeting”).
The review process undertaken by the Trustees spans the course of the year and culminates with the Annual Meeting. To assist the Trustees in their deliberations, the Trustees have established a Contract Review Committee (the “Committee”), comprised of the Independent Trustees. The Committee held three meetings over the course of the year since the Management Agreement was last approved. At those Committee meetings, regularly scheduled Board meetings and/or the Annual Meeting, the Board, or the Independent Trustees, as applicable, considered matters relating to the Management Agreement, including:
| | (a) | | the nature and quality of the advisory, administrative and other services provided to the Fund by the Investment Adviser and its affiliates, including information about: |
| | (i) | | the structure, staff and capabilities of the Investment Adviser and its portfolio management teams; |
| | (ii) | | the groups within the Investment Adviser and its affiliates that support the portfolio management teams or provide other types of necessary services, including fund services groups (e.g., accounting and financial reporting, tax, shareholder services and operations), controls and risk management groups (e.g., legal, compliance, valuation oversight, credit risk management, internal audit, compliance testing, market risk analysis, finance and strategy and central funding), sales and distribution support groups and others (e.g., information technology and training); |
| | (iii) | | trends in headcount; |
| | (iv) | | the Investment Adviser’s financial resources and ability to hire and retain talented personnel and strengthen its operations; and |
| | (v) | | the parent company’s support of the Investment Adviser and its registered fund business, as expressed by the firm’s senior management; |
| | (b) | | information on the investment performance of the Fund, including comparisons to the performance of a group of similar funds, as provided by a third party fund data provider engaged as part of the contract review process (the “Outside Data Provider”), and its benchmark performance index, and general investment outlooks in the markets in which the Fund invests; |
| | (c) | | the terms of the Management Agreement and agreements with affiliated service providers entered into by the Fund; |
| | (d) | | expense information for the Fund, including: |
| | (i) | | the relative management fee and expense levels of the Fund as compared to those of comparable funds managed by other advisers, as provided by the Outside Data Provider; and |
| | (ii) | | the Fund’s expense trends over time; |
| | (e) | | with respect to the extensive investment performance and expense comparison data provided by the Outside Data Provider, its processes in producing that data for the Fund; |
| | (f) | | the undertaking of the Investment Adviser to limit certain expenses of the Fund that exceed a specified level; |
| | (g) | | information relating to the profitability of the Management Agreement and the transfer agency and distribution and service arrangements of the Fund to the Investment Adviser and its affiliates; |
| | (h) | | whether the Fund’s existing management fee schedule adequately addressed any economies of scale; |
32
GOLDMAN SACHS CREDIT STRATEGIES FUND
Statement Regarding Basis for Approval of Management Agreement (Unaudited) (continued)
| | (i) | | a summary of the “fall-out” benefits derived by the Investment Adviser and its affiliates from their relationships with the Fund, including the fees received by the Investment Adviser’s affiliates from the Fund for transfer agency, portfolio trading, and other services; |
| | (j) | | a summary of potential benefits derived by the Fund as a result of its relationship with the Investment Adviser; |
| | (k) | | information regarding portfolio trading and how the Investment Adviser carries out its duty to seek best execution; |
| | (l) | | portfolio manager ownership of Fund shares; the manner in which portfolio manager compensation is determined; and the number and types of accounts managed by the portfolio managers; |
| | (m) | | the nature and quality of the services provided to the Fund by its unaffiliated service providers, and the Investment Adviser’s general oversight and evaluation (including reports on due diligence) of those service providers as part of the administration services provided under the Management Agreement; and |
| | (n) | | the Investment Adviser’s processes and policies addressing various types of potential conflicts of interest; its approach to risk management; the annual review of the effectiveness of the Fund’s compliance program; and compliance reports. |
The Trustees also received an overview of the Fund’s distribution and servicing arrangements. They received information regarding the Fund’s assets, share purchase and repurchase offer activity and the payment of service fees by the Fund to Goldman, Sachs & Co. (“Goldman Sachs”), the Fund’s affiliated distributor. Information was also provided to the Trustees relating to revenue sharing payments made by and services provided by the Investment Adviser and its affiliates to intermediaries that promote the sale, distribution and/or servicing of Fund shares.
The presentations made at the Board and Committee meetings and at the Annual Meeting encompassed the Fund and mutual fund portfolios for which the Board of Trustees has responsibility. In evaluating the Management Agreement at the Annual Meeting, the Trustees relied upon their knowledge, resulting from their meetings and other interactions throughout the year, of the Investment Adviser, its affiliates, their services and the Fund. In conjunction with these meetings, the Trustees received written materials and oral presentations on the topics covered, and were advised by their independent legal counsel regarding their responsibilities and other regulatory requirements related to the approval and continuation of registered fund investment management agreements under applicable law. In addition, the Investment Adviser and its affiliates provided the Independent Trustees with a written response to a formal request for information sent on behalf of the Independent Trustees by their independent legal counsel. During the course of their deliberations, the Independent Trustees met in executive sessions with their independent legal counsel, without representatives of the Investment Adviser or its affiliates present. The Independent Trustees also discussed the broad range of other investment choices that are available to Fund investors, including the availability of comparable funds managed by other advisers.
Nature, Extent and Quality of the Services Provided Under the Management Agreement
As part of their review, the Trustees considered the nature, extent and quality of the services provided by the Investment Adviser. In this regard, the Trustees considered both the investment advisory services, and the other, non-advisory services, that are provided to the Fund by the Investment Adviser and its affiliates. The Trustees noted the transition in the leadership and changes in personnel of various of the Investment Adviser’s portfolio management teams that had occurred in recent periods, and the potential benefit to the Fund of the ongoing recruitment efforts aimed at bringing high quality investment talent to the Investment Adviser. The Independent Trustees concluded that the Investment Adviser continued to commit substantial financial and operational resources to the Fund and expressed confidence that the Investment Adviser would continue to do so in the future. The Trustees also observed that the Investment Adviser had made significant commitments to address regulatory compliance requirements applicable to the Fund and the Investment Adviser.
33
GOLDMAN SACHS CREDIT STRATEGIES FUND
Statement Regarding Basis for Approval of Management Agreement (Unaudited) (continued)
Investment Performance
The Trustees also considered the investment performance of the Fund and the Investment Adviser. In this regard, they compared the investment performance of the Fund to its peers using the rankings compiled by the Outside Data Provider for the one-year period ended December 31, 2011. The Trustees also reviewed updated information prepared by the Investment Adviser comparing the Fund’s investment performance to that of its performance benchmark as of March 31, 2012. In addition, they reviewed the investment performance of the Fund in light of its investment objective and policies, market conditions and credit and duration parameters.
In addition, the Trustees considered materials prepared and presentations made by the Investment Adviser’s senior management and portfolio management personnel, in which Fund performance was assessed. The Trustees also considered the Investment Adviser’s periodic reports with respect to the Fund’s risk profile, and how the Investment Adviser’s approach to risk monitoring and management influences portfolio management. The Independent Trustees also noted that the Fund had a total return in excess of LIBOR for the one-year period ended March 31, 2012. They noted the addition of certain key hires to the Fixed Income Team in 2011, and that the Fixed Income Team had adjusted its investment process and scenario analysis in 2011 in an effort to provide stronger investment performance.
Costs of Services Provided and Competitive Information
The Trustees considered the contractual fee rate payable by the Fund under the Management Agreement. In this regard, the Trustees considered information on the services rendered by the Investment Adviser to the Fund, which included both advisory and administrative services that were directed to the needs and operations of the Fund as a registered closed-end interval fund.
In particular, the Trustees reviewed an analysis prepared by the Outside Data Provider regarding the expense rankings of the Fund. The analysis provided a comparison of the Fund’s management fees and breakpoints to those of a relevant peer group and category universe; an expense analysis which compared the Fund’s overall net and gross expenses to a peer group and a category universe; and a two-year history comparing the Fund’s net expenses to the peer and category medians. The analysis also compared the Fund’s transfer agency, custody and distribution and service fees, other expenses and fee waivers/reimbursements to those of other funds in the peer group and the peer group and category median. The Trustees concluded that the comparisons provided by the Outside Data Provider were useful in evaluating the reasonableness of the management fees and total expenses paid by the Fund.
In addition, the Trustees considered the Investment Adviser’s undertaking to limit certain expenses of the Fund that exceed a specified level. They also noted that the Investment Adviser did not manage institutional accounts or collective investment vehicles having investment objectives and policies similar to those of the Fund, and therefore this type of fee comparison was not possible.
In addition, the Trustees noted that shareholders are periodically allowed to tender all or a portion of their Fund shares for repurchase by the Fund, subject to certain limitations imposed by the Fund, if they believe that the Fund fees and expenses are too high or if they are dissatisfied with the performance of the Fund.
Profitability
The Trustees reviewed the Investment Adviser’s revenues and pre-tax profit margins with respect to the Fund. In this regard the Trustees noted that they had received, among other things, profitability analyses and summaries, revenue and expense schedules by Fund and by function (i.e., investment management, transfer agency and distribution and service) and the Investment Adviser’s expense allocation methodology. They observed that the profitability and expense figures are substantially similar to those used by the Investment Adviser for many internal purposes, including compensation decisions among various business groups, and are thus subject to a vigorous internal debate about how certain revenue and expenses should be allocated. The Trustees also reviewed the report of the internal audit group within the Goldman Sachs organization, which included an assessment of the reasonableness and consistency of the Investment Adviser’s expense allocation methodology and an evaluation of the
34
GOLDMAN SACHS CREDIT STRATEGIES FUND
Statement Regarding Basis for Approval of Management Agreement (Unaudited) (continued)
accuracy of the Investment Adviser’s profitability analysis calculations. Profitability data for the Fund were provided for 2011 and 2010, and the Trustees considered this information in relation to the Investment Adviser’s overall profitability. The Trustees considered the Investment Adviser’s revenues and pre-tax profit margins both in absolute terms and in comparison to information on the reported pre-tax profit margins earned by certain other asset management firms.
Economies of Scale
The Trustees considered the information that had been provided regarding the Investment Adviser’s profitability. The Trustees also considered the breakpoints in the fee rate payable under the Management Agreement at the following annual percentage rates of the average daily net assets of the Fund:
| | | | |
Average Daily
Net Assets | | Management Fee
Annual Rate | |
| First $1 billion | | | 1.00 | % |
| Next $1 billion | | | 0.90 | |
| Next $3 billion | | | 0.86 | |
| Next $3 billion | | | 0.84 | |
| Over $8 billion | | | 0.82 | |
The Trustees noted that the breakpoints were meant to share potential economies of scale, if any, with the Fund and its shareholders as assets under management reach those asset levels. The Trustees considered the amounts of assets in the Fund; the Fund’s recent share purchase and repurchase activity; the information provided by the Investment Adviser relating to the costs of the services provided by the Investment Adviser and its affiliates and their realized profits; information comparing fee rates charged by the Investment Adviser with fee rates charged to other funds in the peer group; and the Investment Adviser’s undertaking to limit certain expenses of the Fund that exceed a specified level. Upon reviewing these matters at the Annual Meeting, the Trustees concluded that the fee breakpoints represented a means of assuring that benefits of scalability, if any, would be passed along to shareholders at the specified asset levels.
Other Benefits to the Investment Adviser and Its Affiliates
The Trustees also considered the other benefits derived by the Investment Adviser and its affiliates from their relationship with the Fund as stated above, including: (a) transfer agency fees received by Goldman Sachs; (b) futures commissions earned by Goldman Sachs for executing futures transactions on behalf of the Fund; (c) trading efficiencies resulting from aggregation of orders of the Fund with those for other funds or accounts managed by the Investment Adviser; (d) the Investment Adviser’s ability to leverage the infrastructure designed to service the Fund on behalf of its other clients; (e) the Investment Adviser’s ability to cross-market other products and services to Fund shareholders; (f) Goldman Sachs’ retention of certain fees as Fund Distributor; (g) the Investment Adviser’s ability to negotiate better pricing with custodians on behalf of its other clients, as a result of the relationship with the Fund; and (h) the possibility that the working relationship between the Investment Adviser and the Fund’s third party service providers may cause those service providers to be open to doing business with other areas of Goldman Sachs. In the course of considering the foregoing, the Independent Trustees requested and received further information quantifying certain of these fall-out benefits.
Other Benefits to the Fund and Its Shareholders
The Trustees also noted that the Fund receives certain potential benefits as a result of its relationship with the Investment Adviser, including: (a) trading efficiencies resulting from aggregation of orders of the Fund with those of other funds or accounts managed by the Investment Adviser; (b) improved servicing and pricing from vendors because of the volume of business generated by the Investment Adviser and its affiliates; (c) improved servicing from broker-dealers because of the volume of business generated by the Investment Adviser and its affiliates; (d) the Investment Adviser’s ability to negotiate favorable terms with
35
GOLDMAN SACHS CREDIT STRATEGIES FUND
derivatives counterparties as a result of the size and reputation of the Goldman Sachs organization; (e) the Investment Adviser’s knowledge and experience gained from managing other accounts and products; (f) the Investment Adviser’s ability to hire and retain qualified personnel to provide services to the Fund because of the reputation of the Goldman Sachs organization; (g) the Fund’s access, through the Investment Adviser, to certain firmwide resources (e.g., proprietary risk management systems and databases), subject to certain restrictions; and (h) the Fund’s access to certain affiliated distribution channels. The Trustees noted the competitive nature of the registered fund marketplace, and noted further that many of the Fund’s shareholders invested in the Fund in part because of the Fund’s relationship with the Investment Adviser and that those shareholders have a general expectation that the relationship will continue.
Conclusion
In connection with their consideration of the Management Agreement, the Trustees gave weight to each of the factors described above, but did not identify any particular factor as controlling their decision. After deliberation and consideration of all of the information provided, including the factors described above, the Trustees concluded, in the exercise of their business judgment, that the management fees paid by the Fund were reasonable in light of the services provided to it by the Investment Adviser, the Investment Adviser’s costs and the Fund’s current and reasonably foreseeable asset levels. The Trustees unanimously concluded that the Investment Adviser’s continued management likely would benefit the Fund and its shareholders and that the Management Agreement should be approved and continued with respect to the Fund until June 30, 2013.
36
FUNDS PROFILE
Goldman Sachs Funds

Goldman Sachs is a premier financial services firm, known since 1869 for creating thoughtful and customized investment solutions in complex global markets.
Today, the Investment Management Division of Goldman Sachs serves a diverse set of clients worldwide, including private institutions, public entities and individuals. With approximately $735.5 billion in assets under management as of September 30, 2012, Goldman Sachs Asset Management (“GSAM”) has portfolio management teams located around the world and our investment professionals bring firsthand knowledge of local markets to every investment decision. GSAM’s assets under management includes assets managed by Goldman Sachs Asset Management, LP and its Investment Advisory Affiliates.
|
| OVERVIEW OF GOLDMAN SACHS FUNDS |

Money Market1
Financial Square FundsSM
| n | | Financial Square Tax-Exempt Funds |
| n | | Financial Square Federal Fund |
| n | | Financial Square Government Fund |
| n | | Financial Square Money Market Fund |
| n | | Financial Square Prime Obligations Fund |
| n | | Financial Square Treasury Instruments Fund |
| n | | Financial Square Treasury Obligations Fund |
Fixed Income
Short Duration and Government
| n | | High Quality Floating Rate Fund2 |
| n | | Short Duration Government Fund |
| n | | Short Duration Income Fund |
| n | | Inflation Protected Securities Fund |
Multi-Sector
| n | | Core Plus Fixed Income Fund |
Municipal and Tax-Free
| n | | High Yield Municipal Fund |
| n | | Short Duration Tax-Free Fund |
Single Sector
| n | | Investment Grade Credit Fund |
| n | | High Yield Floating Rate Fund |
| n | | Emerging Markets Debt Fund |
| n | | Local Emerging Markets Debt Fund |
Corporate Credit
Fundamental Equity
| n | | Small/Mid Cap Growth Fund |
| n | | Flexible Cap Growth Fund |
| n | | Concentrated Growth Fund |
| n | | Technology Tollkeeper Fund |
| n | | Growth Opportunities Fund |
| n | | Rising Dividend Growth Fund |
Structured Equity
| n | | Structured Small Cap Equity Fund |
| n | | Structured U.S. Equity Fund |
| n | | Structured Small Cap Growth Fund |
| n | | Structured Large Cap Growth Fund |
| n | | Structured Large Cap Value Fund |
| n | | Structured Small Cap Value Fund |
| n | | Structured Tax-Managed Equity Fund |
| n | | Structured International Tax-Managed Equity Fund |
| n | | U.S. Equity Dividend and Premium Fund |
| n | | International Equity Dividend and Premium Fund |
| n | | Structured International Small Cap Fund |
| n | | Structured International Equity Fund |
| n | | Structured Emerging Markets Equity Fund |
Fundamental Equity International4
| n | | Strategic International Equity Fund |
| n | | Concentrated International Equity Fund |
| n | | International Small Cap Fund |
| n | | Emerging Markets Equity Fund |
| n | | BRIC Fund (Brazil, Russia, India, China) |
Select Satellite5
| n | | Real Estate Securities Fund |
| n | | International Real Estate Securities Fund |
| n | | Commodity Strategy Fund |
| n | | Dynamic Allocation Fund |
| n | | Absolute Return Tracker Fund |
| n | | Managed Futures Strategy Fund |
| n | | Retirement Portfolio Completion Fund |
Total Portfolio Solutions5
| n | | Balanced Strategy Portfolio |
| n | | Growth and Income Strategy Portfolio |
| n | | Growth Strategy Portfolio |
| n | | Equity Growth Strategy Portfolio |
| n | | Income Strategies Portfolio |
| n | | Satellite Strategies Portfolio |
| n | | Retirement Strategies Portfolios6 |
| n | | Enhanced Dividend Global Equity Portfolio |
| n | | Tax Advantaged Global Equity Portfolio |
| 1 | | An investment in a money market fund is neither insured nor guaranteed by the Federal Deposit Insurance Corporation (“FDIC”) or any other government agency. Although the Funds seek to preserve the value of your investment at $1.00 per share, it is possible to lose money by investing in the Funds. |
| 2 | | Effective at the close of business on July 27, 2012, the Goldman Sachs Ultra-Short Duration Government Fund was renamed the Goldman Sachs High Quality Floating Rate Fund. |
| 3 | | Effective at the close of business on June 29, 2012, the Goldman Sachs Balanced Fund was renamed the Goldman Sachs Income Builder Fund. |
| 4 | | Since October 18, 2012, shares of the Goldman Sachs Brazil Equity, India Equity and Korea Equity Funds (each, a “Fund,” and collectively, the “Funds”) have not been available for purchase by investors. Each Fund will be liquidated pursuant to a Board-approved Plan of Liquidation on or about November 30, 2012 (the “Liquidation Date”). At any time prior to the Liquidation Date, shareholders may redeem their shares of the Funds and receive the net asset value thereof in cash or in kind, as provided in the Prospectus. |
| 5 | | Individual Funds within the Total Portfolio Solutions and Select Satellite categories will have various placement on the risk/return spectrum and may have greater or lesser risk than that indicated by the placement of the general Total Portfolio Solutions or Select Satellite category. |
| 6 | | Since July 28, 2012, shares of each of the Goldman Sachs Retirement Strategy Portfolios (the “Portfolios”) have not been available for purchase except to participants within certain Retirement Plans (as defined in the Prospectus). As of the close of business on December 6, 2012, shares of the Portfolios will no longer be available for purchase by any investors. |
Financial Square FundsSM is a registered service mark of Goldman, Sachs & Co.
| | |
TRUSTEES Ashok N. Bakhru, Chairman Donald C. Burke John P. Coblentz, Jr. Diana M. Daniels Joseph P. LoRusso James A. McNamara Jessica Palmer Alan A. Shuch Richard P. Strubel | | OFFICERS James A. McNamara, President George F. Travers, Principal Financial Officer Caroline Kraus, Secretary Scott M. McHugh, Treasurer |
| |
GOLDMAN, SACHS & CO. Distributor and Transfer Agent | | GOLDMAN SACHS ASSET MANAGEMENT, L.P. Investment Adviser |
Visit our Web site at www.goldmansachsfunds.com to obtain the most recent month-end returns.
Goldman Sachs Asset Management, L.P. 200 West Street, New York, New York 10282
The reports concerning the Fund included in this shareholder report may contain certain forward-looking statements about the factors that may affect the performance of the Fund in the future. These statements are based on Fund management’s predictions and expectations concerning certain future events and their expected impact on the Fund, such as performance of the economy as a whole and of specific industry sectors, changes in the levels of interest rates, the impact of developing world events, and other factors that may influence the future performance of the Fund. Management believes these forward-looking statements to be reasonable, although they are inherently uncertain and difficult to predict. Actual events may cause adjustments in portfolio management strategies from those currently expected to be employed.
A description of the policies and procedures that the Fund uses to determine how to vote proxies relating to portfolio securities and information regarding how the Fund voted proxies relating to portfolio securities for the most recent 12-month period ended June 30, are available (I) without charge, upon request by calling 1-800-526-7384; and (II) on the Securities and Exchange Commission (“SEC”) web site at http://www.sec.gov.
The Fund files its complete schedule of portfolio holdings with the SEC for the first and third quarters of each fiscal year on Form N-Q. The Fund’s Form N-Q will be available on the SEC’s web site at http://www.sec.gov within 60 days after the Fund’s first and third fiscal quarters. The Fund’s Form N-Q may be reviewed and copied at the SEC’s Public Reference Room in Washington, D.C., and information on the operation of the Public Reference Room may also be obtained by calling 1-800-SEC-0330. Forms N-Q may be obtained upon request and without charge by calling 1-800-526-7384 (for Retail Shareholders) or 1-800-621-2550 (for Institutional Shareholders).
Economic and market forecasts presented herein reflect our judgment as of the date of this presentation and are subject to change without notice. These forecasts do not take into account the specific investment objectives, restrictions, tax and financial situation or other needs of any specific client. Actual data will vary and may not be reflected here. These forecasts are subject to high levels of uncertainty that may affect actual performance. Accordingly, these forecasts should be viewed as merely representative of a broad range of possible outcomes. These forecasts are estimated, based on assumptions, and are subject to significant revision and may change materially as economic and market conditions change. Goldman Sachs has no obligation to provide updates or changes to these forecasts. Case studies and examples are for illustrative purposes only.
Holdings and allocations shown are as of September 30, 2012 and may not be representative of future investments. Fund holdings should not be relied on in making investment decisions and should not be construed as research or investment advice regarding particular securities.
This material is not authorized for distribution to prospective investors unless preceded or accompanied by a current Prospectus or summary prospectus, if applicable. Investors should consider a Fund’s objective, risks, and charges and expenses, and read the summary prospectus, if available, and/or the Prospectus carefully before investing or sending money. The summary prospectus, if available, and the Prospectus contain this and other information about a Fund and may be obtained from your authorized dealer or from Goldman, Sachs & Co. by calling (retail – 1-800-526-7384) (institutional – 1-800-621-2550).
© 2012 Goldman Sachs. All rights reserved. 86384.MF.MED.TMPL / 11/2012 CRSTRSAR12 / 1K
The information required by this Item is only required in an annual report on this Form N-CSR.
| ITEM 3. | AUDIT COMMITTEE FINANCIAL EXPERT. |
The information required by this Item is only required in an annual report on this Form N-CSR.
| ITEM 4. | PRINCIPAL ACCOUNTANT FEES AND SERVICES. |
The information required by this Item is only required in an annual report on this Form N-CSR.
| ITEM 5. | AUDIT COMMITTEE OF LISTED REGISTRANTS. |
Not applicable.
| ITEM 6. | SCHEDULE OF INVESTMENTS. |
The Schedule of Investments is included as part of the Report to Stockholders filed under Item 1.
| ITEM 7. | DISCLOSURE OF PROXY VOTING POLICIES AND PROCEDURES FOR CLOSED-END MANAGEMENT INVESTMENT COMPANIES. |
Not applicable.
| ITEM 8. | PORTFOLIO MANAGERS OF CLOSED-END MANAGEMENT INVESTMENT COMPANIES. |
Not applicable.
| ITEM 9. | PURCHASES OF EQUITY SECURITIES BY CLOSED-END MANAGEMENT INVESTMENT COMPANY AND AFFILIATED PURCHASERS. |
Not applicable.
| ITEM 10. | SUBMISSION OF MATTERS TO A VOTE OF SECURITY HOLDERS. |
There have been no material changes to the procedures by which shareholders may recommend nominees to the registrant’s board of trustees.
| ITEM 11. | CONTROLS AND PROCEDURES. |
| | (a) | The registrant’s principal executive and principal financial officers, or persons performing similar functions have concluded that the registrant’s disclosure controls and procedures (as defined in Rule 30a-3(c) under the Investment Company Act of 1940, as amended (the “1940 Act”)) are effective as of a date within 90 days of the filing of this report that includes the disclosure required by this paragraph, based on the evaluation of these controls and procedures required by Rule 30a-3(b) under the 1940 Act and 15d-15(b) under the Securities Exchange Act of 1934, as amended. |
| | (b) | There were no changes in the registrant’s internal control over financial reporting (as defined in Rule 30a-3(d) under the 1940 Act) that occurred during the registrant’s second fiscal quarter of the period covered by this report that have materially affected, or are reasonably likely to materially affect, the registrant’s internal control over financial reporting. |
| | | | | | |
| | (a)(1) | | | | The information required by this Item is only required in connection with an annual report on this Form N-CSR. |
| | | |
| | (a)(2) | | Exhibit 99.CERT | | Certifications pursuant to Section 302 of the Sarbanes-Oxley Act of 2002 filed herewith. |
| | | |
| | (b) | | Exhibit 99.906CERT | | Certifications pursuant to Section 906 of the Sarbanes-Oxley Act of 2002 filed herewith. |
SIGNATURES
Pursuant to the requirements of the Securities Exchange Act of 1934 and the Investment Company Act of 1940, the registrant has duly caused this report to be signed on its behalf by the undersigned, thereunto duly authorized.
|
| Goldman Sachs Credit Strategies Fund |
|
| /s/ James A. McNamara |
| By: James A. McNamara |
| President/Principal Executive Officer |
| Goldman Sachs Credit Strategies Fund |
Date: November 19, 2012
Pursuant to the requirements of the Securities Exchange Act of 1934 and the Investment Company Act of 1940, this report has been signed below by the following persons on behalf of the registrant and in the capacities and on the dates indicated.
|
| /s/ James A. McNamara |
| By: James A. McNamara |
| President/Principal Executive Officer |
| Goldman Sachs Credit Strategies Fund |
Date: November 19, 2012
|
| /s/ George F. Travers |
| By: George F. Travers |
| Principal Financial Officer |
| Goldman Sachs Credit Strategies Fund |
Date: November 16, 2012