FILED BY BECTON, DICKINSON AND COMPANY
PURSUANT TO RULE 425 UNDER THE SECURITIES ACT OF 1933 AND
DEEMED FILED PURSUANT TO RULE 14A-12 OF THE SECURITIES EXCHANGE ACT OF 1934
SUBJECT COMPANY: CAREFUSION CORP
COMMISSION FILE NO. 001-34273
The following Fourth Quarter and Full-Year Results for Fiscal Year of 2014 and Fiscal Year 2015 Guidance communication was made available by Becton, Dickinson and Company.
 Fourth Quarter and Full-Year Results Fiscal Year 2014 Fiscal Year 2015 Guidance November 4, 2014 |
 2 FXN = Estimated foreign exchange-neutral currency growth. $ = Dollars in millions except per share data. Note: All figures on accompanying slides are rounded. Totals may not add due to rounding. Percentages are based on un-rounded figures. These materials include forward-looking statements and it’s possible that actual results could differ from our expectations. Factors that could cause such differences appear in our fourth quarter earnings release and in our recent SEC filings. Forward-Looking Statements Non-GAAP Financial Measures These materials also include Non-GAAP financial measures. A reconciliation to the comparable GAAP measures can be found herein, or in our earnings release and the financial schedules attached thereto. A copy of the release, including the financial schedules, is posted on the “Investors” section of the BD.com website. Results from Continuing Operations The following financial information represents results from continuing operations. Certain financial information excludes the impact of the following items: 1. Foreign currency translation. 2. The medical device excise tax, which began January 1, 2013, in conjunction with the U.S. healthcare reform act. 3. Amortization of acquisition-related intangibles is excluded from our Earnings Per Share metric. Unless otherwise noted, when we refer to Earnings Per Share, we are referring to the adjusted basis (commonly referred to as “Cash EPS”), excluding acquisition-related intangibles. 4. All adjustments to current and prior year noted on the “Total Year Reconciliation of Non-GAAP Financial Measures” schedule in the appendix of this presentation. |
 3 Executive Overview Vincent A. Forlenza Chairman, CEO and President |
 4 Strong revenue growth of 5.2% Launched an array of new products bringing new products as a percentage of sales to 15% Emerging Market investments continue to fuel growth Operating effectiveness and efficiency initiatives continued to drive underlying margin expansion 42 nd consecutive year of dividend increases Proactively adapting to the dynamic healthcare environment by transitioning to a customer-focused provider of healthcare solutions Our Strategy Continued to Deliver Results 2014 Key Achievements: |
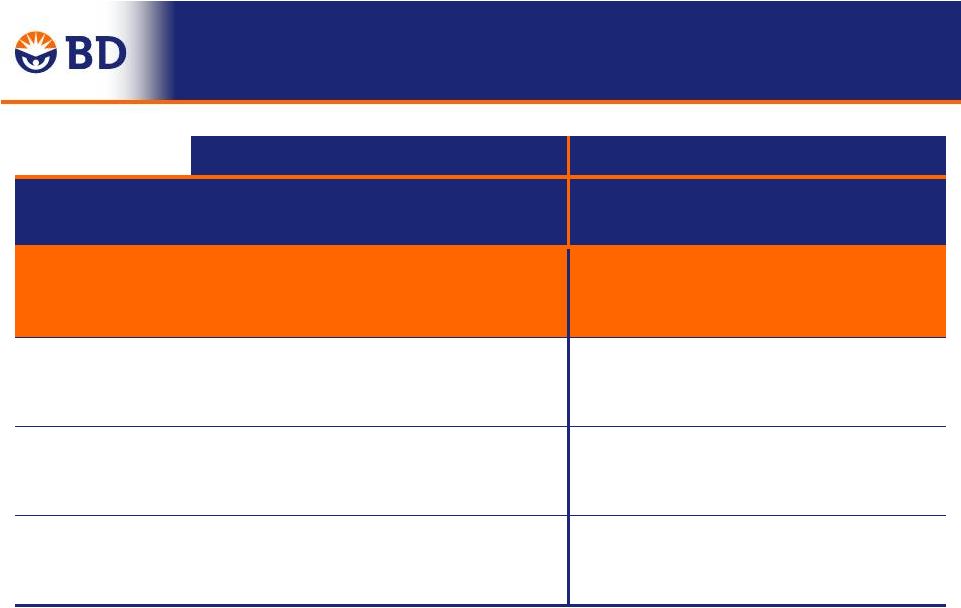
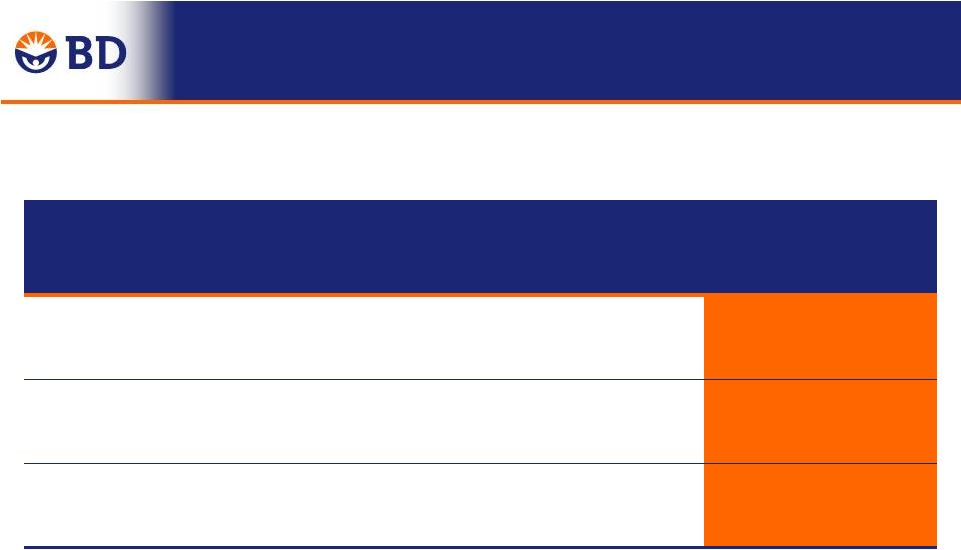 5 FY 2015 Guidance Overview 1 Beginning in fiscal year 2015, adjusted EPS will exclude the amortization of acquisition-related intangibles, net of tax. FY 2014 FY 2014 “Cash” EPS 1 FY 2015 Guidance Revenues (FXN) 5.2% 4.5% to 5% Adjusted EPS $ $6.25 $6.50 $6.76 to $6.83 Adjusted EPS Growth (FXN) 11.4% 10.9% 8% to 9% |
 6 Financial Update Christopher Reidy Chief Financial Officer and Executive Vice President of Administration |
 7 Strong revenue growth of 5.2% Revenue growth of 4.6% FXN, driven by Medical and Diagnostics Bioscience growth impacted by an unfavorable comparison to the prior year, as expected Emerging markets and international safety sales continue to drive robust growth Continued tax rate improvement Strong EPS growth of 13.0% FXN Q4 FY 2014 Highlights |
 8 FY 2014 Revenues by Segment Fourth Quarter Total Year $ Reported Growth % FXN Growth% $ Reported Growth % FXN Growth% Total Revenues $2,202 4.8% 4.6% $8,446 4.9% 5.2% Medical 1,193 6.5% 6.1% 4,573 6.2% 6.3% Diagnostics 708 4.2% 4.2% 2,713 2.5% 3.3% Biosciences 301 0.2% 0.1% 1,159 5.2% 5.5% |
 9 FY 2014 U.S. and International Revenues Fourth Quarter Total Year $ Reported Growth % FXN Growth% $ Reported Growth % FXN Growth% U.S. $871 2.3% 2.3% $3,417 1.9% 1.9% Medical 456 3.4% 3.4% 1,799 4.2% 4.2% Diagnostics 319 0.0% 0.0% 1,251 -1.7% -1.7% Biosciences 96 4.4% 4.4% 366 3.5% 3.5% International $1,331 6.6% 6.2% $5,029 7.0% 7.6% Medical 737 8.4% 7.8% 2,774 7.6% 7.8% Diagnostics 389 7.9% 7.8% 1,462 6.4% 7.8% Biosciences 205 -1.7% -1.8% 793 6.0% 6.5% |
 10 Note: Emerging markets include Eastern Europe, Middle East, Africa, Latin America, and Asia Pacific (excluding Japan) Emerging Markets financial highlights for FY 2014: Fourth quarter growth in key markets and platforms (FXN) China 21.4% Emerging Markets Safety 18.6% Double-digit growth in all emerging markets in Q4 and Total Year Emerging Markets FXN Growth % % of BD Revenues Q4 13.2% 26.4% Total Year 12.3% 25.1% |
 11 FY 2014 Safety Revenues Fourth Quarter Total Year $ Reported Growth % FXN Growth% $ Reported Growth % FXN Growth% Total Safety $566 5.7% 5.5% $2,223 5.9% 6.6% By Geography U.S. 301 -0.8% -0.8% 1,207 2.1% 2.1% International 265 14.1% 13.7% 1,016 10.8% 12.3% By Segment Medical 287 6.6% 6.4% 1,119 7.1% 7.8% Diagnostics 279 4.8% 4.6% 1,104 4.7% 5.4% |
 -0.9% 51.9% 51.0% 12 ReLoCo, Continuous Improvement, Pension +60 bps Mix, Price, Start-up Costs, Raw Materials -70 bps Performance 50% 51% 52% Q4 FY2013 Currency Performance Q4 FY 2014 0.8% 0.1% $1,089 $1,123 % of Revenue Q4 FY 2014 Adjusted Gross Margin Change Year-Over-Year |
 13 Q4 FY 2014 Income Statement Favorable (Unfavorable) Adjusted Q4 FY 2014 Adjusted Q4 FY 2013 $ Change % Change FXN % Change Revenues $2,202 $2,101 101 4.8% 4.6% Gross Profit 1,123 1,089 34 3.1% 4.6% % of Revenues 51.0% 51.9% SSG&A 542 533 (9) -1.7% -1.3% % of Revenues 24.6% 25.4% R&D 133 133 (0) -0.3% -0.2% % of Revenues 6.0% 6.3% Operating Income 448 423 25 5.8% 10.1% % of Revenues 20.3% 20.1% Tax Rate 21.9% 24.7% EPS $1.68 $1.54 $0.14 9.1% 13.0% |
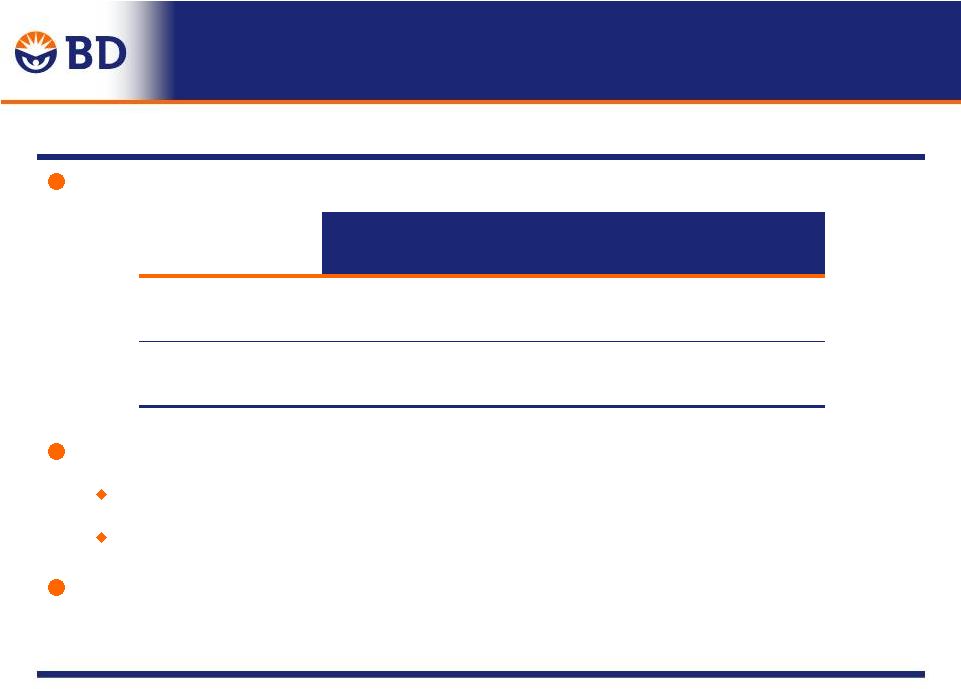
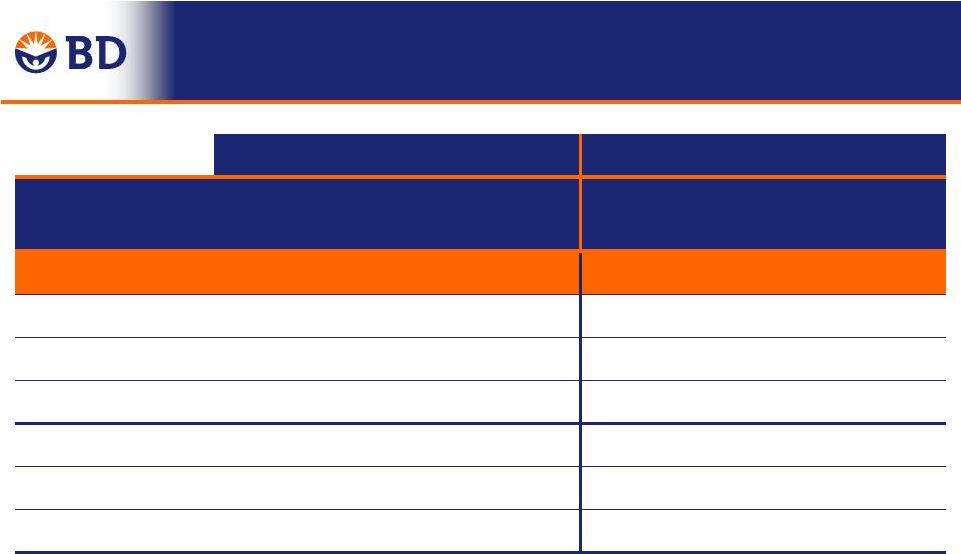
 14 Growth % (FXN) FY 2015 Revenue Guidance 2014 Actual November Guidance Total BD Revenues 5.2% 4.5% to 5.0% Medical 6.3% 4.5% to 5.0% Life Sciences 3.9% ~ 4.5% Diagnostics 3.3% ~ 4.0% to 4.5% Biosciences 5.5% ~4.5% to 5.0% |
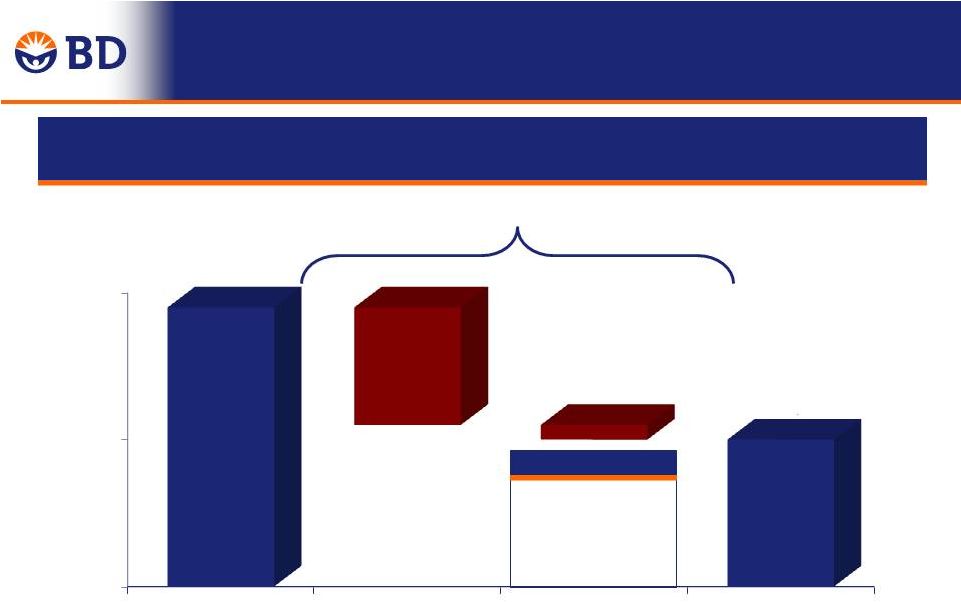
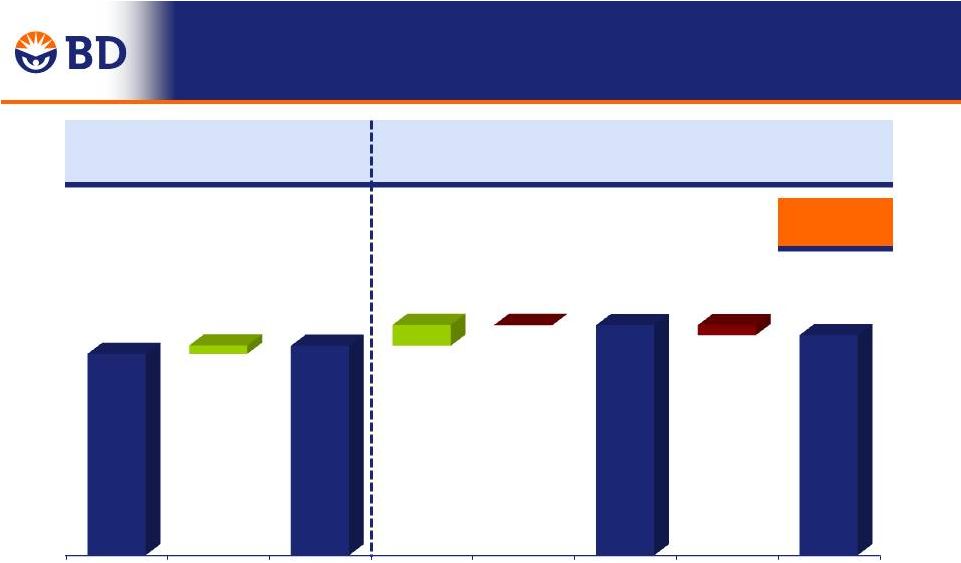 15 FY15 Adjusted EPS Guidance 1 FY 2015 share repurchase program has been suspended due to the pending CareFusion acquisition. Estimates are based on what the impact of a $450 repurchase program could have on diluted earnings per share. Estimated EPS impact is ~1 percent, or $0.07 to $0.09. $6.76 to $6.83 1 FY14 Adjusted EPS Amortization of Acquisition - Related Intangibles FY14 Adjusted Cash EPS Underlying Performance FXN Suspension of FY15 Adjusted FXN Cash EPS Estimated Foreign Currency Impact FY15 Adjusted Cash EPS $6.25 $6.50 8% to 9% FXN Growth 4% to 5% Adjusted Growth $0.26 9% to 10% (~1%) (~4%) FY 2015 FY 2014 Buybacks |
 FY 2015 Guidance Adjusted FY 2014 Adjusted FY 2014 1 for “Cash” EPS FY 2015 1,2 Guidance Gross Profit 1 51.2% 52.0% ~52% SSG&A 25.0% 25.0% ~25% R&D 6.1% 6.1% ~6% Operating Income 1 20.0% 20.9% 20.5% to 21.0% Effective Tax Rate 1 22.8% 23.2% 21.5% to 22.5% EPS 1 $6.25 $6.50 $6.76 to $6.83 EPS – FXN 1,3 11.4% 10.9% 8.0% to 9.0% Operating Cash Flow $1.75B $1.75B ~$1.85B Share Repurchase 3 $400M $400M EPS headwind of ~1%, or ($0.07) to ($0.09) Capital Expenditures $592M $592M ~$625M 16 1 Beginning in fiscal year 2015, adjusted values will exclude the amortization of acquisition-related intangibles. This impacts Gross Profit, Operating Income, Effective Tax Rate and Earnings Per Share. FY 2015 guidance excludes the pending CareFusion acquisition. Any material changes to guidance related to the acquisition will be provided upon closing. BD’s share repurchase program has been suspended in FY2015. 2 3 |
 17 Executive Overview Vincent A. Forlenza Chairman, CEO and President |
 18 Medical Program/Product Launch Date BD Simplist ™ Prefilled Injectables Morphine Sulfate Injection, USP Launched Midazolam Injection, USP Approved FY 2014 in Review Program and Product Launch Updates New Biosciences Program/Product Launch Date BD FACSPresto ™ Launched BD OneFlow ™ Solution - Clinical Reagents Q4 FY 2014 Sirigen Dyes 6 Dyes Launched (3 New in Q4 FY 2014) New New |
 19 Diagnostics Program/Product Launch Date BD Veritor ™ System Strep A, RSV Launched WW BD MAX ™ Staph SR, MRSA XT Launched WW Enteric Bacteria Launched WW Enteric Parasite Launched EU BD Totalys ™ Launched EU BD Viper ™ LT BD Onclarity ™ HPV-GT Launched EU GC/CT Launched WW FY 2014 in Review Program and Product Launch Updates |
 20 New Program and Product Launch Updates Medical Program/Product Planned Launch Date BD Insulin Infusion Sets FY 2015 FDA Clearance Expected BD Simplist ™ Prefilled Injectables Heparin Sodium Injection, USP FY 2016 Hydromorphone Hydrochloride Injection, USP FY 2016 Biosciences Program/Product Planned Launch Date BD Horizon ™ (Sirigen) Dyes FY 2015 – 3 Dyes Expected BD X-14 Research Instrument 2H FY 2015 BD FACSVia ™ FY 2015 / FY 2016 |
 21 New Program and Product Launch Updates Diagnostics Program/Product Planned Launch Date BD MAX ™ Enteric Parasite Launched EU / Q3 FY 2015 U.S. (1 Q Delay) GC/CT and GC/CT/Trich Q3 FY 2015 EU Extended Enteric Bacterial Late FY 2015 / Early FY 2016 EU Enteric Viral Late FY 2015 / Early FY 2016 EU Vaginitis / Vaginosis FY 2016 BD Totalys ™ Launched EU / Q4 FY 2015 U.S. |
 22 Key Takeaways Pleased with our strong fiscal year 2014 results Exceeded financial and operational goals Revenue growth of 5.2%, EPS growth of 11.4% Strong foundation for continued growth Continue to evolve into a customer focused provider of complete solutions Looking forward to fiscal year 2015 with confidence |
 23 Q & A BD, BD Logo and all other trademarks are the property of Becton, Dickinson and Company. |
 24 FY 2014 Financial Highlights Fourth Quarter Total Year $ Growth % FXN Growth % $ Growth % FXN Growth % Revenues $2,202 4.8% 4.6% $8,446 4.9% 5.2% EPS $1.53 NM NM $5.99 28.3% 33.0% Adjusted EPS $1.68 9.1% 13.0% $6.25 7.6% 11.4% Adjusted EPS Ex-MDT NM NM NM $6.29 8.3% 12.0% |
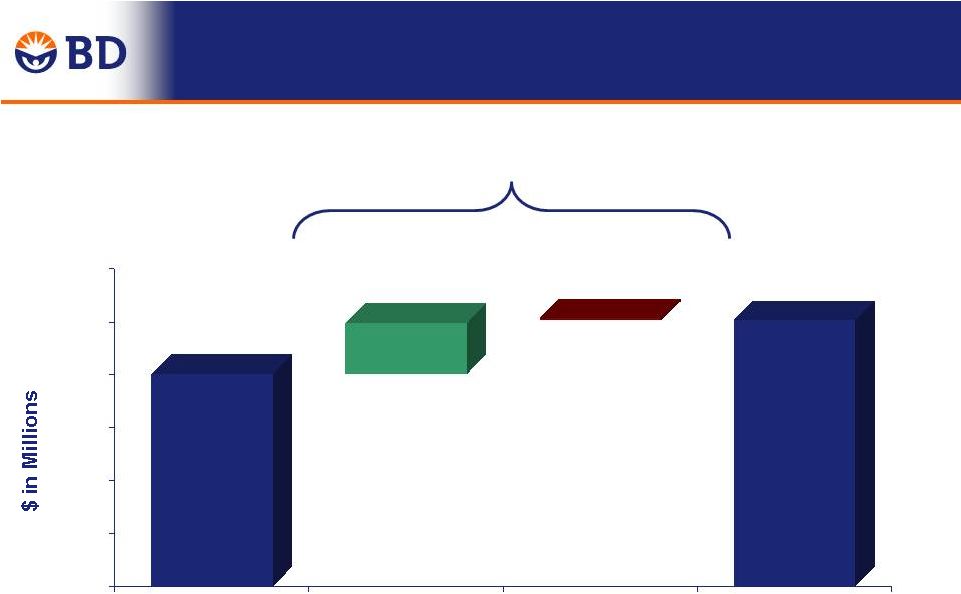 25 Q4 FY 2014 Revenue Growth Year-Over-Year -0.7% 4.6% 1,700 1,800 1,900 2,000 2,100 2,200 2,300 Q4 FY 2013 Performance Currency Q4 FY 2014 $2,202 $2,101 4.8% -0.2% |
 26 Q4 FY 2014 Adjustment Reconciliation (Unaudited; Amounts in millions, except per share data) Pension Carrying Workforce Acquisition Program Reported Settlement Amount Reduction Related Termination Adjusted FY 2014 Charge (1) Adjustment (2) Charge (3) Items (4) Charge (5) FY 2014 REVENUES $ 2,202 - - - - - $ 2,202 Gross Profit 1,103 $ 2 $ 5 $ 14 - - 1,123 % of Revenues 50.1% 51.0% Selling and administrative 561 (2) - (11) $ (6) - 542 % of Revenues 25.5% 24.6% Research and development 140 - - (11) - $ 4 133 % of Revenues 6.4% 6.0% OPERATING INCOME 401 3 5 36 6 (4) 448 % of Revenues 18.2% 20.3% Other income, net 1 - - - - - 1 Income tax provision 76 1 2 13 2 (1) 93 Effective Tax Rate 20.1% 21.9% INCOME FROM CONTINUING OPERATIONS 301 2 3 23 4 (2) 330 % of Revenues 13.7% 15.0% Diluted Earnings per Share from Continuing Operations $ 1.53 $ 0.01 $ 0.02 $ 0.12 $ 0.02 $ (0.01) $ 1.68 (2) Represents an adjustment to the carrying amount of an asset that is being held for sale. (3) Represents employee termination costs associated with a workforce reduction. (4) Represents acquisition-related transaction costs incurred in connection with the GenCell Biosystems and pending CareFusion acquisitions. Three Months Ended September 30, (1) Primarily represents non-cash pension settlement charges associated with lump sum benefit payments made from the Company’s U.S. supplemental pension plan, as such payments exceeded the service and interest components of the plan’s pension cost in each year. The charges also included settlement losses associated with certain foreign pension plans. (5) Represents a revision to the estimated probable loss previously recorded as a result of the decision to terminate a research and development program in the Medical segment. |
 27 Q4 FY 2014 Reconciliation – FX Impact (Unaudited; Amounts in millions, except per share data) Adjusted Adjusted Adjusted Growth Adjusted Growth Foreign Currency FXN FXN FY 2014 FY 2013 $ % Translation Change Growth REVENUES $ 2,202 $ 2,101 $ 101 4.8% $ 4 $ 97 4.6% Gross Profit 1,123 1,089 34 3.1% (16) 50 4.6% % of Revenues 51.0% 51.9% Selling and administrative 542 533 (9) -1.7% (2) (7) -1.3% % of Revenues 24.6% 25.4% Research and development 133 133 - -0.3% - - -0.2% % of Revenues 6.0% 6.3% OPERATING INCOME 448 423 25 5.8% (18) 43 10.1% % of Revenues 20.3% 20.1% Other income, net 1 3 (2) -65.9% (1) (1) -30.8% Income tax provision 93 100 8 NM 7 1 NM Effective Tax Rate 21.9% 24.7% INCOME FROM CONTINUING OPERATIONS 330 306 24 7.8% (13) 37 12.0% % of Revenues 15.0% 14.6% Diluted Earnings per Share from Continuing Operations $ 1.68 $ 1.54 $ 0.14 9.1% $ (0.06) $ 0.20 13.0% NM - Not Meaningful FXN = Foreign Currency Neutral Three Months Ended September 30, |
 28 Q4 FY 2014 Reconciliation of Non-GAAP Financial Measures (Unaudited) 2014 2013 Growth Foreign Currency Translation Foreign Currency Neutral Change Growth % Foreign Currency Neutral Growth % Reported Diluted Earnings per Share from Continuing Operations $ 1.53 $ 0.46 $ 1.07 $ (0.06) $ 1.13 NM NM Non-cash pension settlement charges associated with lump sum benefit payments made primarily from the Company’s U.S. supplemental pension plan, as such payments exceeded the service and interest components of the plan’s pension cost in each year. The charges also included settlement losses associated with certain foreign pension plans. ($3 million or $2 million after-tax and $6 million or $4 million after- tax, respectively) 0.01 0.02 Adjustment to the carrying amount of an asset that is being held for sale ($5 million or $3 million after-tax) 0.02 - Employee termination costs associated with a workforce reduction ($36 million or $23 million after-tax) 0.12 - Acquisition-related transaction costs incurred in connection with the GenCell Biosystems and pending CareFusion acquisitions ($6 million or $4 million after-tax) 0.02 - Revision to the estimated probable loss previously recorded as a result of the decision to terminate a research and development program in the Medical segment ($4 million or $2 million after-tax) (0.01) - Charge associated with the unfavorable verdict returned in the antitrust and false advertising lawsuit filed against the Company by RTI ($341 million or $211 million after-tax) - 1.06 Adjusted Diluted Earnings per Share from Continuing Operations $ 1.68 $ 1.54 $ 0.14 $ (0.06) $ 0.20 9.1% 13.0% Three Months Ended September 30, |
 29 FY 2014 Reconciliation - FX Impact Emerging Markets and China (Unaudited; Amounts in millions) 2014 2013 Reported FXN FX Impact Total Emerging Markets Revenues $ 582 $ 514 13.3% 13.2% 0.1% Total Emerging Markets Safety Revenues $ 129 $ 109 18.7% 18.6% 0.1% China Revenues $ 133 $ 110 20.4% 21.4% -1.0% 2014 2013 Reported FXN FX Impact Total Emerging Markets Revenues $ 2,123 $ 1,943 9.3% 12.3% -3.0% All figures rounded. Totals may not add due to rounding. % Change Three Months Ended September 30, Twelve Months Ended September 30, % Change |
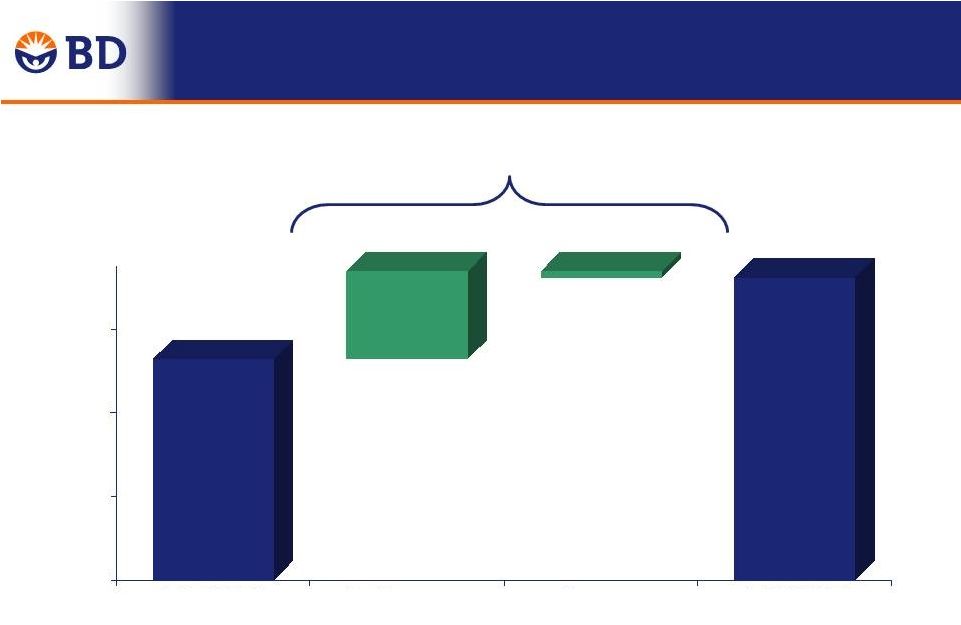 30 FY 2014 Total Year Revenue Growth Year-Over-Year 4.9% 0.3% 5.2% $ in Millions $8,054 $8,446 7,000 7,400 7,800 8,200 Q4 FY 2013 Performance Currency Q4 FY 2014 |
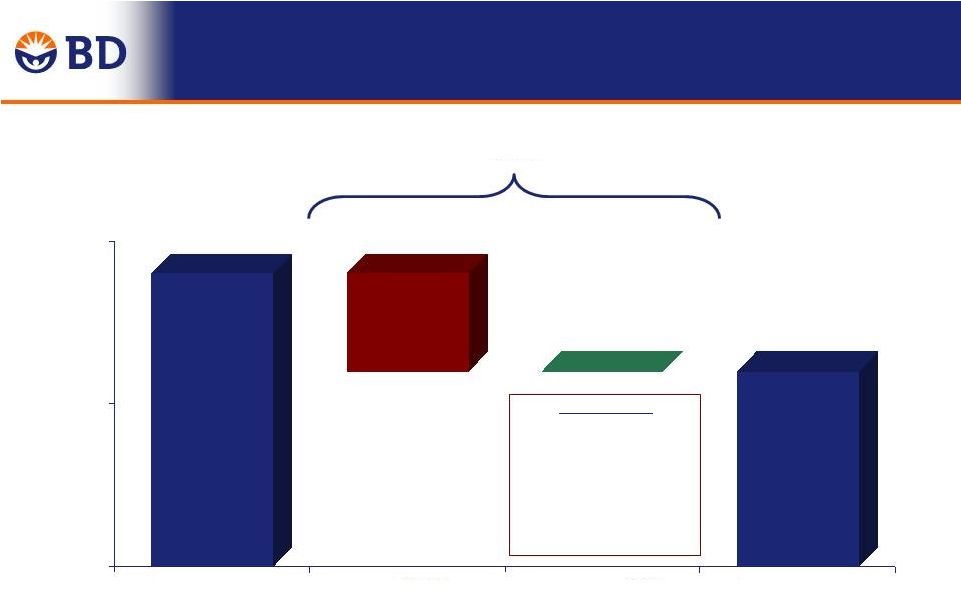 FY 2014 Total Year Adjusted Gross Margin Change Year-Over-Year -0.6% $4,174 $4,322 $ in Millions -0.6% 0.0% 51.8% 51.2% 50% 51% 52% Q4 FY 2013 Currency Performance Q4 FY 2014 31 Performance: ReLoCo, Continuous Improvement, Pension +80 bps Mix, Start-up Costs, Raw Materials -80 bps |
 FY 2014 Total Year Adjustment Reconciliation 32 (Unaudited; Amounts in millions, except per share data) Contract Program Pension Carrying Workforce Acquisition Amortization Adjusted Reported Asset Termination Gain on Termination Settlement Amount Reduction Related Adjusted of Acquired FY 2014 (10) FY 2014 Write-Offs Charge (2) Investment (3) Charge (4) Charge (5) Adjustment Charge (7) Items (8) FY 2014 Intangibles (9) for "Cash" EPS REVENUES $ 8,446 - - - - - - - - $ 8,446 - $ 8,446 Gross Profit 4,301 - - - - $ 2 $ 5 $ 14 - 4,322 $ 74 4,396 % of Revenues 50.9% 51.2% 52.0% Selling and administrative 2,145 - $ (11) - - (2) - (11) $ (6) 2,115 - 2,115 % of Revenues 25.4% 25.0% 25.0% Research and development 550 $ (20) - - $ (6) - - (11) - 514 - 514 % of Revenues 6.5% 6.1% 6.1% OPERATING INCOME 1,606 20 11 - 6 3 5 36 6 1,693 74 1,767 % of Revenues 19.0% 20.0% 20.9% Other income (expense), net 5 - - $ (8) - - - - - (3) - (3) Income tax provision 337 8 3 (3) 2 1 2 13 2 365 23 388 Effective Tax Rate 22.1% 22.8% 23.2% INCOME FROM CONTINUING OPERATIONS 1,185 12 8 (5) 4 2 3 23 4 1,235 51 1,286 % of Revenues 14.0% 14.6% 15.2% Diluted Earnings per Share from Continuing Operations $ 5.99 $ 0.06 $ 0.04 $ (0.03) $ 0.02 $ 0.01 $ 0.02 $ 0.12 $ 0.02 $ 6.25 $ 0.26 $ 6.50 (1) Represents a write-off of capitalized product software and, to a lesser extent, fixed assets primarily resulting from the discontinuance of an instrument product development program in the Biosciences segment. (2) Represents the cost associated with the decision to early terminate a European distributor arrangement in the Diagnostics segment. (3) Represents a gain from a cash distribution received from the sale of company, in which BD had a small equity ownership. (4) Represents a charge associated with the decision to terminate a research and development program in the Medical segment; the charge relates to program asset write-offs and obligations. exceeded the service and interest components of the plan’s pension cost in each year. The charges also included settlement losses associated with certain foreign pension plans. (6) Represents an adjustment to the carrying amount of an asset that is being held for sale. (7) Represents employee termination costs associated with a workforce reduction. (8) Represents acquisition-related transaction costs incurred in connection with the GenCell Biosystems and pending CareFusion acquisitions. (9) Represents non-cash expenses associated with the amortization of acquisition related intangibles. (10) Beginning in fiscal year 2015, adjusted values will exclude the amortization of acquisition related intangibles. Twelve Months Ended September 30, (5) Primarily represents non-cash pension settlement charges associated with lump sum benefit payments made from the Company’s U.S. supplemental pension plan, as such payments |
 33 (Unaudited; Amounts in millions, except per share data) Adjusted FY 2014 Adjusted FY 2013 Adjusted Growth Adjusted Growth Foreign Currency FXN FXN EPS EPS $ % Translation Change Growth REVENUES $ 8,446 $ 8,054 $ 392 4.9% $ (29) $ 421 5.2% Gross Profit 4,396 4,247 149 3.5% (69) 217 5.1% % of Revenues 52.0% 52.7% Selling and administrative 2,115 2,056 (59) -2.9% 12 (71) -3.4% % of Revenues 25.0% 25.5% Research and development 514 494 (20) -3.9% (1) (19) -3.8% % of Revenues 6.1% 6.1% OPERATING INCOME 1,767 1,696 70 4.2% (57) 128 7.5% % of Revenues 20.9% 21.1% Other (expense) income, net (3) 9 (13) NM (8) (5) -55.2% Income tax provision 388 399 11 NM 23 (12) NM Effective Tax Rate 23.2% 24.8% INCOME FROM CONTINUING OPERATIONS 1,286 1,208 78 6.4% (43) 121 10.0% % of Revenues 15.2% 15.0% Diluted Earnings per Share from Continuing Operations $ 6.50 $ 6.06 $ 0.44 7.3% $ (0.22) $ 0.66 10.9% NM - Not Meaningful FXN = Foreign Currency Neutral Twelve Months Ended September 30, FY 2014 Total Year Reconciliation – FX Impact |
 34 Total Year Reconciliation of Non-GAAP Financial Measures (Unaudited) 2014 2013 Growth Foreign Currency Translation Foreign Currency Neutral Change Growth % Foreign Currency Neutral Growth % Reported Diluted Earnings per Share from Continuing Operations $ 5.99 $ 4.67 $ 1.32 $ (0.22) $ 1.54 28.3% 33.0% Write-off of capitalized product software and, to a lesser extent, fixed assets primarily resulting from the discontinuance of an instrument product development program in the Biosciences segment ($20 million or $12 million after-tax) 0.06 - Cost associated with the decision to early terminate a European distributor arrangement in the Diagnostics segment ($11 million or $8 million after-tax) 0.04 - Gain from a cash distribution received from the sale of company, in which BD had a small equity ownership ($8 million or $5 million after-tax) (0.03) - Charge associated with the decision to terminate a research and development program in the Medical segment; the charge relates to program asset write-offs and obligations ($6 million or $4 million after-tax) 0.02 - Non-cash pension settlement charges associated with lump sum benefit payments made primarily from the Company’s U.S. supplemental pension plan, as such payments exceeded the service and interest components of the plan’s pension cost in each year. The charges also included settlement losses associated with certain foreign pension plans. ($3 million or $2 million after-tax and $6 million or $4 million after-tax, respectively) 0.01 0.02 Adjustment to the carrying amount of an asset that is being held for sale ($5 million or $3 million after-tax) 0.02 - Employee termination costs associated with a workforce reduction ($36 million or $23 million after-tax) 0.12 - Acquisition-related transaction costs incurred in connection with the GenCell Biosystems and pending CareFusion acquisitions ($6 million or $4 million after-tax) 0.02 - Charge associated with the litigation settlement related to indirect purchaser antitrust class action cases ($22 million or $14 million after-tax) - 0.07 Charge associated with the unfavorable verdict returned in the antitrust and false advertising lawsuit filed against the Company by RTI ($341 million or $211 million after-tax) - 1.06 Adjusted Diluted Earnings per Share from Continuing Operations (1) $ 6.25 $ 5.81 $ 0.44 $ (0.22) $ 0.66 7.6% 11.4% Non-cash expenses associated with the amortization of acquisition related intangibles ($74 million or $51 million after-tax and $73 million or $50 million after-tax, respectively) 0.26 0.25 Adjusted Diluted Earnings per Share from Continuing Operations for "Cash" EPS $ 6.50 $ 6.06 $ 0.44 $ (0.22) $ 0.66 7.3% 10.9% (1) The total of specified items adjusted from fiscal year 2014 Diluted Earnings per Share from Continuing Operations per the details above is $0.25. (2) The incremental first quarter fiscal year 2014 impact of the medical device excise tax (which went into effect in January 2013 under the U.S. Patient Protection and Affordable Care Act) was $0.05. Excluding this impact, adjusted diluted earnings per share from continuing operations grew, on a foreign currency-neutral basis, by 12.0% to $6.29. Twelve Months Ended September 30, |
 Q4 FY 2013 Adjustment Reconciliation (Unaudited; Amounts in millions, except per share data) Pension Reported Verdict Settlement Adjusted FY 2013 Charge (1) Charge (2) FY 2013 REVENUES $ 2,101 - - $ 2,101 Gross Profit 1,086 - $ 3 1,089 % of Revenues 51.7% 51.9% Selling and administrative 877 $ (341) (3) 533 % of Revenues 41.8% 25.4% Research and development 133 - - 133 % of Revenues 6.3% 6.3% OPERATING INCOME 76 341 6 423 % of Revenues 3.6% 20.1% Other income, net 3 - - 3 Income tax (benefit) provision (31) 129 2 100 Effective Tax Rate -52.5% 24.7% INCOME FROM CONTINUING OPERATIONS 91 211 4 306 % of Revenues 4.3% 14.6% Diluted Earnings per Share from Continuing Operations $ 0.46 $ 1.06 $ 0.02 $ 1.54 Three Months Ended September 30, (1) Represents a charge associated with the unfavorable verdict returned in the antitrust and false advertising lawsuit filed against the Company by RTI. (2) Primarily represents non-cash pension settlement charges associated with lump sum benefit payments made from the Company’s U.S. supplemental pension plan, as such payments exceeded the service and interest components of the plan’s pension cost in each year. The charges also included settlement losses associated with certain foreign pension plans. 35 |
 36 FY 2013 Total Year Adjustment Reconciliation (Unaudited; Amounts in millions, except per share data) Litigation Pension Amortization Adjusted Reported Settlement Verdict Settlement Adjusted of Acquired FY 2013 (5) FY 2013 Charge (1) Charge (2) Charge (3) FY 2013 Intangibles (4) for "Cash" EPS REVENUES $ 8,054 - - - $ 8,054 - $ 8,054 Gross Profit 4,171 - - $ 3 4,174 $ 73 4,247 % of Revenues 51.8% 51.8% 52.7% Selling and administrative 2,422 $ (22) $ (341) (3) 2,056 - 2,056 % of Revenues 30.1% 25.5% 25.5% Research and development 494 - - - 494 - 494 % of Revenues 6.1% 6.1% 6.1% OPERATING INCOME 1,254 22 341 6 1,623 73 1,696 % of Revenues 15.6% 20.2% 21.1% Other income, net 9 - - - 9 - 9 Income tax provision 236 8 129 2 376 23 399 Effective Tax Rate 20.2% 24.5% 24.8% INCOME FROM CONTINUING OPERATIONS 929 14 211 4 1,158 50 1,208 % of Revenues 11.5% 14.4% 15% Diluted Earnings per Share from Continuing Operations $ 4.67 $ 0.07 $ 1.06 $ 0.02 $ 5.81 $ 0.25 $ 6.06 (1) Represents a charge associated with the litigation settlement related to indirect purchaser antitrust class action cases. (2) Represents a charge associated with the unfavorable verdict returned in the antitrust and false advertising lawsuit filed against the Company by RTI. (4) Represents non-cash expenses associated with the amortization of acquisition related intangibles. (5) Beginning in fiscal year 2015, adjusted values will exclude the amortization of acquisition related intangibles. Twelve Months Ended September 30, (3) Primarily represents non-cash pension settlement charges associated with lump sum benefit payments made from the Company’s U.S. supplemental pension plan, as such payments exceeded the service and interest components of the plan’s pension cost in each year. The charges also included settlement losses associated with certain foreign pension plans. |
 FY 2015 Outlook Reconciliation Reported Basis FX Impact FXN Basis Revenues - Full Year 2015 estimated growth 2.0% - 2.5% (2.5%) 4.5% - 5.0% Full Year Full Year 2015 2014 % Increase (estimated) Reported Fully Diluted Earnings per Share from Continuing Operations $ 6.47 - 6.54 $ 5.99 NM Amortization of acquisition related intangibles, net of tax 0.29 0.26 Other specified items adjusted from 2014 results, as detailed in the schedule titled "Total Year Reconciliation of Non-GAAP Financial Measures" - 0.25 Adjusted Fully Diluted Earnings per Share from Continuing Operations $ 6.76 - 6.83 $ 6.50 4.0% - 5.0% FX Impact (4.0%) Adjusted FXN Growth 8.0% - 9.0% NM - Not Meaningful FXN = Foreign Currency Neutral 37 |
***
Forward-Looking Statements
This communication contains certain estimates and other forward-looking statements (as defined under Federal securities laws). Forward looking statements generally are accompanied by words such as “will”, “expect”, “outlook” or other similar words, phrases or expressions. These forward-looking statements include statements regarding the estimated or anticipated future results of BD, and of the combined company following BD’s proposed acquisition of CareFusion, the anticipated benefits of the proposed combination, including estimated synergies, the expected timing of completion of the transaction and other statements that are not historical facts. These statements are based on the current expectations of BD and CareFusion management and are not predictions of actual performance. These statements are subject to a number of risks and uncertainties regarding BD and CareFusion’s respective businesses and the proposed acquisition, and actual results may differ materially. These risks and uncertainties include, but are not limited to, the ability of the parties to successfully close the proposed acquisition, including the risk that the required regulatory approvals are not obtained, are delayed or are subject to unanticipated conditions that could adversely affect the combined company or the expected benefits of the transaction; risks relating to the integration of CareFusion’s operations, products and employees into BD and the possibility that the anticipated synergies and other benefits of the proposed acquisition will not be realized or will not be realized within the expected timeframe; the outcome of any legal proceedings related to the proposed merger; access to available financing for the refinancing of BD’s or CareFusion’s debt on a timely basis and reasonable terms; the ability to market and sell CareFusion’s products in new markets, including the ability to obtain necessary regulatory product registrations and clearances; the loss of key senior management or other associates; the anticipated demand for BD’s and CareFusion’s products, including the risk of future reductions in government healthcare funding, changes in reimbursement rates or changes in healthcare practices that could result in lower utilization rates or pricing pressures; the impact of competition in the medical device industry; the risks of fluctuations in interest or foreign currency exchange rates; product liability claims; difficulties inherent in product development, including the timing or outcome of product development efforts, the ability to obtain regulatory approvals and clearances and the timing and market success of product launches; risks relating to fluctuations in the cost and availability of raw materials and other sourced products and the ability to maintain favorable supplier arrangements and relationships; successful compliance
38
with governmental regulations applicable to BD, CareFusion and the combined company; changes in regional, national or foreign economic conditions; uncertainties of litigation, as well as other factors discussed in BD’s and CareFusion’s respective filings with the Securities Exchange Commission (SEC). BD and CareFusion do not intend to update any forward-looking statements to reflect events or circumstances after the date hereof, except as required by applicable laws or regulations.
IMPORTANT INFORMATION FOR INVESTORS
In connection with the proposed transaction, on November 4, 2014, BD filed with the SEC a registration statement on Form S-4 that constitutes a preliminary prospectus of BD and includes a preliminary proxy statement of CareFusion. The registration statement has not yet become effective. After the registration statement has been declared effective by the SEC, the definitive proxy statement/prospectus will be delivered to stockholders of CareFusion. BD and CareFusion also plan to file other relevant documents with the SEC regarding the proposed transaction. INVESTORS ARE URGED TO READ THE DEFINITIVE PROXY STATEMENT/PROSPECTUS (INCLUDING ALL AMENDMENTS AND SUPPLEMENTS THERETO) AND OTHER DOCUMENTS RELATING TO THE MERGER THAT WILL BE FILED WITH THE SEC CAREFULLY AND IN THEIR ENTIRETY WHEN THEY BECOME AVAILABLE BECAUSE THEY WILL CONTAIN IMPORTANT INFORMATION. You may obtain a free copy of the registration statement and the definitive proxy statement/prospectus (when available) and other relevant documents filed by BD and CareFusion with the SEC at the SEC’s website at www.sec.gov. In addition, you will be able to obtain free copies of these documents by phone, e-mail or written request by contacting the investor relations department of BD or CareFusion at the following: Monique N. Dolecki, Investor Relations – 201-847-5378 Monique_Dolecki@bd.com or Jim Mazzola, Investor Relations – 858-617-1203 Jim.Mazzola@CareFusion.com
PARTICIPANTS IN THE SOLICITATION
BD and CareFusion and their respective directors and executive officers and other members of management and employees may be deemed to be participants in the solicitation of proxies in respect of the proposed transaction. Information about BD’s directors and executive officers is available in BD’s proxy statement dated December 19, 2013, for its 2014 Annual Meeting of Shareholders and subsequent SEC filings. Information about CareFusion’s directors and executive officers is available in CareFusion’s proxy statement dated September 25, 2014, for its 2014 Annual Meeting of Stockholders. Other information regarding the participants in the proxy solicitation and a description of their direct and indirect interests, by security holdings or otherwise, will be contained in the proxy statement/prospectus and other relevant materials to be filed with the SEC regarding the merger when they become available. Investors should read the proxy statement/prospectus carefully when it becomes available before making any voting or investment decisions. You may obtain free copies of these documents from BD or CareFusion as indicated above. This communication shall not constitute an offer to sell or the solicitation of an offer to buy any securities, nor shall there be any sale of securities in any jurisdiction in which such offer, solicitation or sale would be unlawful prior to registration or qualification under the securities laws of any such jurisdiction. No offering of securities shall be made except by means of a prospectus meeting the requirements of Section 10 of the U.S. Securities Act of 1933, as amended.
39