Table of Contents
FORM 6-K
U.S. SECURITIES AND EXCHANGE COMMISSION
Washington, D.C. 20549
Report of Foreign Private Issuer
Pursuant to Rule 13a-16 or 15d-16 of
the Securities Exchange Act of 1934
Commission File Number: 333-163336
For the month of February 2010.
SOMPO JAPAN INSURANCE INC.
(Translation of registrant’s name into English)
26-1, Nishi-Shinjuku 1-chome
Shinjuku-ku, Tokyo 160-8338
Japan
(Address of principal executive offices)
Indicate by check mark whether the registrant files or will file annual reports under cover Form 20-F or Form 40-F.
Form 20-F x Form 40-F ¨
Indicate by check mark if the registrant is submitting the Form 6-K in paper as permitted by Regulation S-T Rule 101(b)(1):
Indicate by check mark if the registrant is submitting the Form 6-K in paper as permitted by Regulation S-T Rule 101(b)(7):
Indicate by check mark whether by furnishing the information contained in this Form, the registrant is also thereby furnishing the information to the Commission pursuant to Rule 12g3-2(b) under the Securities Exchange Act of 1934.
Yes ¨ No x
If “Yes” is marked, indicate below the file number assigned to the registrant in connection with Rule 12g3-2(b): 82-
Table of Contents
Information furnished on this form:
| 1. | [English Translation] |
Summary of Consolidated Financial Results for the nine months ended December 31, 2009
| 2. | [English Summary] |
Quarterly Securities Report for the three months ended December 31, 2009
Table of Contents
SIGNATURES
Pursuant to the requirements of the Securities Exchange Act of 1934, the registrant has duly caused this report to be signed on its behalf by the undersigned, thereunto duly authorized.
| SOMPO JAPAN INSURANCE INC. | ||||||
Date: February 17, 2010 | ||||||
| By: | /S/ SHIMPEI AIDA | |||||
| Shimpei Aida | ||||||
| Manager of Corporate Planning Department | ||||||
Table of Contents
Summary of Consolidated Financial Results for the nine months ended December 31, 2009
Table of Contents
UNOFFICIAL TRANSLATION The official press release document is in Japanese. |
February 12, 2010
SOMPO JAPAN INSURANCE INC.
Summary of Consolidated Financial Results for the nine months ended December 31, 2009
| Company Name: | SOMPO JAPAN INSURANCE INC. (“Sompo Japan”) | |
| Listed on: | Tokyo, Osaka, Nagoya, Sapporo, and Fukuoka Stock Exchange | |
| Stock Code Number: | 8755 | |
| URL: | http://www.sompo-japan.co.jp/ | |
| Representative Director: | Masatoshi Sato, President & CEO | |
| Contact: | Hiroyuki Akiho, Manager, Accounting Department | |
| Scheduled date to file Quarterly Securities Report: February 12, 2010 | ||
1. Consolidated Financial Results for the nine months ended December 31, 2009
(April 1 to December 31, 2009)
(1) Consolidated Results of Operations Note) Any amounts less than one million yen are rounded down, unless otherwise noted.
| Ordinary income | Ordinary profit | Net income | ||||||||||||
| millions of yen | % | millions of yen | % | millions of yen | % | |||||||||
Nine months ended December 31, 2009 | 1,353,038 | 0.4 | 26,387 | —— | 21,401 | —— | ||||||||
Nine months ended December 31, 2008 | 1,347,080 | —— | (3,213 | ) | —— | (594 | ) | —— | ||||||
Note) The percentages are changes from corresponding period of previous fiscal year.
| Net income per share | Diluted net income per share | ||||
| yen | yen | ||||
Nine months ended December 31, 2009 | 21.73 | 21.72 | |||
Nine months ended December 31, 2008 | (0.60 | ) | —— |
(2) Consolidated Financial Conditions
| Total assets | Total net assets | Equity ratio | Total net assets per share | |||||
| millions of yen | millions of yen | % | yen | |||||
As of December 31, 2009 | 6,091,817 | 748,588 | 12.2 | 756.75 | ||||
As of March 31, 2009 | 5,913,379 | 594,946 | 10.0 | 602.30 |
| Reference) Equity capital: | As of December 31, 2009 : 745,123 million yen | |||
| As of March 31, 2009 : 593,000 million yen | ||||
2. Dividends
| Dividends per share | ||||||||||
| First quarter-end | Second quarter-end | Third quarter-end | Fiscal year-end | Annual | ||||||
| yen | yen | yen | yen | yen | ||||||
Fiscal year ended March 31, 2009 | — | — | — | 20.00 | 20.00 | |||||
Fiscal year ending March 31, 2010 | — | — | — | —— | —— | |||||
Fiscal year ending March 31, 2010 (Forecast) | —— | —— | —— | 20.00 | 20.00 | |||||
Note) Revision to the forecasts for dividends during the third quarter : None
Table of Contents
3. Consolidated Forecasts for the fiscal year ending March 31, 2010 (April 1, 2009 to March 31, 2010)
| Ordinary income | Ordinary profit | Net income | Net income per share | |||||||||||
| millions of yen | % | millions of yen | % | millions of yen | % | yen | ||||||||
Fiscal year ending March 31, 2010 | 1,820,000 | 2.9 | 46,000 | —— | 32,000 | —— | 32.49 | |||||||
Notes) 1. Revision to the forecasts for the fiscal year during the third quarter : None
2. The percentages are changes from corresponding period of previous fiscal year.
4. Others
| (1) | Changes in significant subsidiaries during the period (changes in specified subsidiaries resulting in the change in the scope of consolidation): None |
| (2) | Adoption of simplified accounting methods or accounting methods used specifically for the quarterly consolidated financial statements: Yes |
Note) Please refer to “4. Others” in Qualitative Information and Financial Statements on next page for details.
| (3) | Changes in accounting policies, procedures and methods of presentation for preparing the quarterly consolidated financial statements during the period: |
Changes due to revisions to accounting standards | : None | |
‚ Changes due to other reasons | : None |
| (4) | Number of shares outstanding (Common stock): |
Total shares outstanding including treasury stock: |
| As of December 31, 2009 | : 987,733,424 shares | |
| As of March 31, 2009 | : 987,733,424 shares |
‚ Treasury stock: |
| As of December 31, 2009 | : 3,109,910 shares | |
| As of March 31, 2009 | : 3,188,703 shares |
ƒ Average number of shares outstanding: |
| For the nine months ended December 31, 2009 | : 984,627,680 shares | |
| For the nine months ended December 31, 2008 | : 984,541,645 shares |
(Note for using forecasted information etc.)
The forecasts included in this document are based on the currently available information and certain assumptions that we believe reasonable. Accordingly, the actual results may differ materially from those projected herein depending on various factors.
Table of Contents
Qualitative Information and Financial Statements
1. Qualitative Information related to the Consolidated Results of Operations
Underwriting income was 1,277.2 billion yen, investment income was 68.6 billion yen and other ordinary income was 7.1 billion yen. In total, ordinary income was 1,353.0 billion yen.
Underwriting expenses were 1,075.3 billion yen, investment expenses were 25.8 billion yen, operating, general and administrative expenses were 216.4 billion yen and other ordinary expenses were 8.9 billion yen. In total, ordinary expenses were 1,326.6 billion yen.
As a result, ordinary profit for nine months ended December 31, 2009 increased by 29.6 billion yen to 26.3 billion yen, compared with the same period in 2008. Net income for nine months ended December 31, 2009 increased by 21.9 billion yen to 21.4 billion yen, compared with the same period in 2008.
2. Qualitative Information related to the Consolidated Financial Conditions
Total assets as of December 31, 2009 increased by 178.4 billion yen from March 31, 2009 to 6,091.8 billion yen, due to the increase in securities by the rise of stock prices and the issue of subordinated debt.
Total net assets as of December 31, 2009 increased by 153.6 billion yen from March 31, 2009 to 748.5 billion yen, due to the increase in unrealized gains on securities available for sale by the increase in unrealized gains on stocks.
3. Qualitative Information related to the Consolidated Forecasts
There is no change on the forecasts for the fiscal year ending March 31, 2010 at present as disclosed on November 19, 2009.
4. Others
| (1) | Changes in significant subsidiaries during the period (changes in specified subsidiaries resulting in the change in the scope of consolidation): None |
| (2) | Adoption of simplified accounting methods or accounting methods used specifically for the quarterly consolidated financial statements: |
Income taxes are calculated by applying a reasonably estimated effective tax rate to income before income taxes. The estimated effective tax rate is determined by estimating the effective tax rate after applying deferred tax accounting for the fiscal year, including the third quarter of this fiscal year. When it is remarkably unreasonable to adopt this accounting method, income taxes are calculated by the statutory effective tax rate.
| (3) | Changes in accounting policies, procedures and methods of presentation for preparing the quarterly consolidated financial statements during the period: None |
Table of Contents
5. Quarterly Consolidated Financial Statements
(1) Quarterly Consolidated Balance Sheets
(Millions of yen)
| ||||||
| As of December 31, 2009 | As of March 31, 2009 | |||||
Assets: | ||||||
Cash and deposits | 116,210 | 151,781 | ||||
Call loans | 66,400 | 73,600 | ||||
Receivables under resale agreements | 89,981 | 81,978 | ||||
Monetary receivables bought | 35,783 | 40,160 | ||||
Money trusts | 10,539 | 9,715 | ||||
Securities | 4,457,369 | 4,125,568 | ||||
Loans | 499,168 | 517,894 | ||||
Tangible fixed assets | 215,411 | 219,047 | ||||
Intangible fixed assets | 26,831 | 26,456 | ||||
Other assets | 422,701 | 434,189 | ||||
Deferred tax assets | 168,350 | 249,507 | ||||
Allowance for possible loan losses | (16,930 | ) | (16,520 | ) | ||
Total assets | 6,091,817 | 5,913,379 | ||||
Liabilities: | ||||||
Underwriting funds: | 4,926,383 | 4,998,577 | ||||
Reserve for outstanding losses and claims | 757,016 | 818,052 | ||||
Underwriting reserves | 4,169,366 | 4,180,524 | ||||
Bonds | 128,000 | — | ||||
Other liabilities | 192,381 | 199,019 | ||||
Reserve for retirement benefits | 79,964 | 99,342 | ||||
Reserve for retirement benefits to directors | 82 | 31 | ||||
Reserve for bonus payments | 4,945 | 14,679 | ||||
Reserve for price fluctuation | 10,878 | 6,487 | ||||
Deferred tax liabilities | 593 | 295 | ||||
Total liabilities | 5,343,229 | 5,318,432 | ||||
Net assets: | ||||||
Shareholders’ equity: | ||||||
Common stock | 70,000 | 70,000 | ||||
Capital surplus | 24,229 | 24,229 | ||||
Retained earnings | 320,588 | 320,381 | ||||
Treasury stock | (2,740 | ) | (2,839 | ) | ||
Total shareholders’ equity | 412,077 | 411,771 | ||||
Valuation and translation adjustments: | ||||||
Unrealized gains on securities available for sale, net of tax | 356,669 | 207,503 | ||||
Foreign currency translation adjustments | (23,623 | ) | (26,274 | ) | ||
Total valuation and translation adjustments | 333,045 | 181,228 | ||||
Stock acquisition rights | 1,302 | 984 | ||||
Non-controlling interests | 2,161 | 962 | ||||
Total net assets | 748,588 | 594,946 | ||||
Total liabilities and net assets | 6,091,817 | 5,913,379 | ||||
Table of Contents
(2) Quarterly Consolidated Statements of Income
(Millions of yen)
| ||||||
| Nine months ended December 31, 2008 (April 1 to December 31, 2008) | Nine months ended December 31, 2009 (April 1 to December 31, 2009) | |||||
Ordinary income: | 1,347,080 | 1,353,038 | ||||
Underwriting income: | 1,246,881 | 1,277,248 | ||||
Net premiums written | 1,004,442 | 973,918 | ||||
Deposits of premiums by policyholders | 111,753 | 87,194 | ||||
Interest and dividend income on deposits of premiums, etc. | 34,292 | 31,706 | ||||
Life insurance premiums written | 90,029 | 90,433 | ||||
Reversal of reserve for outstanding losses and claims | 6,004 | 67,628 | ||||
Reversal of underwriting reserves | — | 24,854 | ||||
Investment income: | 93,768 | 68,677 | ||||
Interest and dividend income | 95,528 | 82,482 | ||||
Investment gains on money trusts | — | 0 | ||||
Investment gains on trading securities | 41 | 126 | ||||
Realized gains on sales of securities | 15,992 | 13,639 | ||||
Transfer of interest and dividend income on deposits of premiums, etc. | (34,292 | ) | (31,706 | ) | ||
Other ordinary income | 6,430 | 7,112 | ||||
Ordinary expenses: | 1,350,294 | 1,326,651 | ||||
Underwriting expenses: | 1,021,307 | 1,075,329 | ||||
Net claims paid | 600,682 | 660,328 | ||||
Loss adjustment expenses | 57,463 | 59,045 | ||||
Net commissions and brokerage fees | 175,764 | 176,933 | ||||
Maturity refunds to policyholders | 151,628 | 139,194 | ||||
Life insurance claims paid | 29,853 | 32,356 | ||||
Provision for underwriting reserves | 855 | — | ||||
Investment expenses: | 107,200 | 25,898 | ||||
Investment losses on money trusts | 10,606 | 1,130 | ||||
Realized losses on sales of securities | 1,343 | 5,554 | ||||
Impairment losses on securities | 82,495 | 7,360 | ||||
Operating, general and administrative expenses | 220,537 | 216,463 | ||||
Other ordinary expenses: | 1,248 | 8,959 | ||||
Interest paid | 92 | 4,286 | ||||
Ordinary profit (loss) | (3,213 | ) | 26,387 | |||
Extraordinary gains: | 33,043 | 15,870 | ||||
Reversal of price fluctuation reserve | 32,431 | — | ||||
Others | 612 | 15,870 | ||||
Extraordinary losses: | 653 | 5,028 | ||||
Provision for price fluctuation reserve | — | 4,383 | ||||
Others | 653 | 645 | ||||
Income before income taxes and non-controlling interests | 29,176 | 37,229 | ||||
Income taxes and deferred income taxes | 29,835 | 16,166 | ||||
Non-controlling interests | (64 | ) | (338 | ) | ||
Net income (loss) | (594 | ) | 21,401 | |||
Table of Contents
(3) Notes on Going-Concern Assumption
None.
(4) Notes for Material Changes in Shareholders’ Equity
None.
Table of Contents
6. Other Information
Key Figures of the Consolidated and Non-consolidated Results of Operations
(Millions of yen)
| |||||||||||||||||||||||||||
| Nine months ended December 31, 2008 (April 1 to December 31, 2008) | Nine months ended December 31, 2009 (April 1 to December 31, 2009) | ||||||||||||||||||||||||||
| Consolidated | Non-consolidated | Consolidated/ Non-consolidated balance | Consolidated | Non-consolidated | Consolidated/ Non-consolidated balance | ||||||||||||||||||||||
| Amount | Rate of change | Amount | Rate of change | Amount | Rate of change | Amount | Rate of change | ||||||||||||||||||||
| % | % | % | % | ||||||||||||||||||||||||
Ordinary income | 1,347,080 | (5.4 | ) | 1,245,695 | (2.9 | ) | 101,385 | 1,353,038 | 0.4 | 1,246,139 | 0.0 | 106,899 | |||||||||||||||
Net premiums written | 1,004,442 | (3.3 | ) | 986,779 | (3.3 | ) | 17,662 | 973,918 | (3.0 | ) | 951,167 | (3.6 | ) | 22,750 | |||||||||||||
Ordinary profit | (3,213 | ) | (104.0 | ) | (11,887 | ) | (118.0 | ) | 8,674 | 26,387 | — | 27,989 | — | (1,601 | ) | ||||||||||||
Net income | (594 | ) | (101.2 | ) | (6,646 | ) | (116.1 | ) | 6,052 | 21,401 | — | 24,152 | — | (2,750 | ) | ||||||||||||
Consolidated/ | — | 0.89 | |||||||||||||||||||||||||
| Notes) | 1. | “Consolidated/Non-consolidated balance” represents the difference between consolidated amounts and non-consolidated amounts. | ||
2. 3. | “Consolidated/Non-consolidated ratio” represents the proportion of consolidated amounts to non-consolidated amounts. Consolidated/non-consolidated ratio for nine months ended December 31, 2008 is not shown due to net loss on the non-consolidated basis. |
(Consolidated) Summary of Results of Operations
(Millions of yen)
| ||||||||||||
| Nine months ended December 31, 2008 (April 1 to December 31, 2008) | Nine months ended December 31, 2009 (April 1 to December 31, 2009) | Increase (decrease) | Rate of change | |||||||||
| % | ||||||||||||
Ordinary income and expenses: | ||||||||||||
Underwriting income: | 1,246,881 | 1,277,248 | 30,366 | 2.4 | ||||||||
Net premiums written | 1,004,442 | 973,918 | (30,523 | ) | (3.0 | ) | ||||||
Deposits of premiums by policyholders | 111,753 | 87,194 | (24,559 | ) | (22.0 | ) | ||||||
Life insurance premiums written | 90,029 | 90,433 | 403 | 0.4 | ||||||||
Underwriting expenses: | 1,021,307 | 1,075,329 | 54,021 | 5.3 | ||||||||
Net claims paid | 600,682 | 660,328 | 59,646 | 9.9 | ||||||||
Loss adjustment expenses | 57,463 | 59,045 | 1,582 | 2.8 | ||||||||
Net commissions and brokerage fees | 175,764 | 176,933 | 1,169 | 0.7 | ||||||||
Maturity refunds to policyholders | 151,628 | 139,194 | (12,433 | ) | (8.2 | ) | ||||||
Life insurance claims paid | 29,853 | 32,356 | 2,502 | 8.4 | ||||||||
Investment income: | 93,768 | 68,677 | (25,090 | ) | (26.8 | ) | ||||||
Interest and dividend income | 95,528 | 82,482 | (13,045 | ) | (13.7 | ) | ||||||
Realized gains on sales of securities | 15,992 | 13,639 | (2,353 | ) | (14.7 | ) | ||||||
Investment expenses: | 107,200 | 25,898 | (81,301 | ) | (75.8 | ) | ||||||
Realized losses on sales of securities | 1,343 | 5,554 | 4,210 | 313.5 | ||||||||
Impairment losses on securities | 82,495 | 7,360 | (75,135 | ) | (91.1 | ) | ||||||
Operating, general and administrative expenses | 220,537 | 216,463 | (4,073 | ) | (1.8 | ) | ||||||
Other ordinary income and expenses | 5,181 | (1,846 | ) | (7,027 | ) | (135.6 | ) | |||||
Ordinary profit (loss) | (3,213 | ) | 26,387 | 29,601 | — | |||||||
Extraordinary gains and losses: | ||||||||||||
Extraordinary gains | 33,043 | 15,870 | (17,172 | ) | (52.0 | ) | ||||||
Extraordinary losses | 653 | 5,028 | 4,375 | 669.7 | ||||||||
Net extraordinary gains | 32,390 | 10,841 | (21,548 | ) | (66.5 | ) | ||||||
Income before income taxes and non-controlling interests | 29,176 | 37,229 | 8,052 | 27.6 | ||||||||
Income taxes and deferred income taxes | 29,835 | 16,166 | (13,669 | ) | (45.8 | ) | ||||||
Non-controlling interests | (64 | ) | (338 | ) | (273 | ) | — | |||||
Net income (loss) | (594 | ) | 21,401 | 21,996 | — | |||||||
Table of Contents
(Consolidated) Premiums Written and Claims Paid by Lines of Business
Direct premiums written (including deposits of premiums by policyholders)
(Millions of yen)
| ||||||||||||||
| Nine months ended December 31, 2008 (April 1 to December 31, 2008) | Nine months ended December 31, 2009 (April 1 to December 31, 2009) | |||||||||||||
Business line | Amount | % of total amount | Rate of change | Amount | % of total amount | Rate of change | ||||||||
| % | % | % | % | |||||||||||
Fire and allied insurance | 173,405 | 14.6 | 0.6 | 172,105 | 15.3 | (0.7 | ) | |||||||
Marine insurance | 35,965 | 3.0 | 1.2 | 27,842 | 2.5 | (22.6 | ) | |||||||
Personal accident insurance | 187,650 | 15.8 | 7.2 | 164,218 | 14.6 | (12.5 | ) | |||||||
Voluntary automobile insurance | 499,724 | 42.2 | (0.6 | ) | 491,689 | 43.6 | (1.6 | ) | ||||||
Compulsory automobile liability insurance | 148,033 | 12.5 | (18.9 | ) | 132,457 | 11.8 | (10.5 | ) | ||||||
Others | 139,358 | 11.8 | (0.1 | ) | 138,198 | 12.3 | (0.8 | ) | ||||||
Total | 1,184,136 | 100.0 | (1.9 | ) | 1,126,512 | 100.0 | (4.9 | ) | ||||||
Deposits of premiums by policyholders | 111,753 | 9.4 | 9.7 | 87,194 | 7.7 | (22.0 | ) | |||||||
Net premiums written | ||||||||||||||
(Millions of yen)
| ||||||||||||||
| Nine months ended December 31, 2008 (April 1 to December 31, 2008) | Nine months ended December 31, 2009 (April 1 to December 31, 2009) | |||||||||||||
Business line | Amount | % of total amount | Rate of change | Amount | % of total amount | Rate of change | ||||||||
| % | % | % | % | |||||||||||
Fire and allied insurance | 112,524 | 11.2 | 2.5 | 111,380 | 11.4 | (1.0 | ) | |||||||
Marine insurance | 28,853 | 2.9 | (1.2 | ) | 22,078 | 2.3 | (23.5 | ) | ||||||
Personal accident insurance | 97,771 | 9.7 | (1.1 | ) | 97,865 | 10.0 | 0.1 | |||||||
Voluntary automobile insurance | 497,938 | 49.6 | (0.5 | ) | 491,948 | 50.5 | (1.2 | ) | ||||||
Compulsory automobile liability insurance | 140,158 | 14.0 | (18.7 | ) | 123,293 | 12.7 | (12.0 | ) | ||||||
Others | 127,195 | 12.7 | (0.5 | ) | 127,350 | 13.1 | 0.1 | |||||||
Total | 1,004,442 | 100.0 | (3.3 | ) | 973,918 | 100.0 | (3.0 | ) | ||||||
Net claims paid | ||||||||||||||
(Millions of yen)
| ||||||||||||||
| Nine months ended December 31, 2008 (April 1 to December 31, 2008) | Nine months ended December 31, 2009 (April 1 to December 31, 2009) | |||||||||||||
Business line | Amount | % of total amount | Rate of change | Amount | % of total amount | Rate of change | ||||||||
| % | % | % | % | |||||||||||
Fire and allied insurance | 42,961 | 7.2 | (4.7 | ) | 47,959 | 7.3 | 11.6 | |||||||
Marine insurance | 12,562 | 2.1 | (2.1 | ) | 11,873 | 1.8 | (5.5 | ) | ||||||
Personal accident insurance | 50,444 | 8.4 | 14.9 | 51,366 | 7.8 | 1.8 | ||||||||
Voluntary automobile insurance | 305,492 | 50.9 | 0.5 | 302,708 | 45.8 | (0.9 | ) | |||||||
Compulsory automobile liability insurance | 121,983 | 20.3 | 0.5 | 117,942 | 17.9 | (3.3 | ) | |||||||
Others | 67,237 | 11.2 | (6.9 | ) | 128,477 | 19.5 | 91.1 | |||||||
Total | 600,682 | 100.0 | 0.2 | 660,328 | 100.0 | 9.9 | ||||||||
Note to the above three tables:
The above figures represent amounts after offsetting internal transactions among consolidated segments.
Table of Contents
(Consolidated) Life Insurance Business
Life insurance premiums
| (Millions of yen) | |||||||||
| Nine months ended December 31, 2008 (April 1 to December 31, 2008) | Nine months ended December 31, 2009 (April 1 to December 31, 2009) | ||||||||
| Amount | Rate of change | Amount | Rate of change | ||||||
| % | % | ||||||||
Life insurance premiums | 90,029 | (24.3 | ) | 90,433 | 0.4 | ||||
Note) The above figures represent amounts after offsetting internal transactions among consolidated segments.
Total amount of policies in force
| (Millions of yen) | |||||||
| As of December 31, 2009 | As of March 31, 2009 | ||||||
| Amount | Rate of change | Amount | |||||
| % | |||||||
Individual insurance | 10,926,460 | 6.6 | 10,254,286 | ||||
Individual annuities | 80,163 | (1.6 | ) | 81,435 | |||
Group insurance | 1,847,574 | (9.2 | ) | 2,033,965 | |||
Group annuities | — | — | — | ||||
Notes)
| 1. | The above figures represent amounts before offsetting internal transactions among consolidated segments. |
| 2. | Amount of “Individual annuities” represents the sum of annuity fund at the beginning of annuity payment of contracts before the beginning of annuity payment and underwriting reserves for the contracts after the beginning of annuity payment. |
Total amount of new business
| (Millions of yen) | ||||||||||||
| Nine months ended December 31, 2008 (April 1 to December 31, 2008) | Nine months ended December 31, 2009 (April 1 to December 31, 2009) | |||||||||||
| Net increase by new business and conversion | New business | Net increase by conversion | Net increase by new business and conversion | New business | Net increase by conversion | |||||||
Individual insurance | 1,242,153 | 1,242,153 | — | 1,622,960 | 1,622,960 | — | ||||||
Individual annuities | 1,588 | 1,588 | — | 1,536 | 1,536 | — | ||||||
Group insurance | 7,025 | 7,025 | — | 43,504 | 43,504 | — | ||||||
Group annuities | — | — | — | — | — | — | ||||||
Notes)
| 1. | The above figures represent amounts before offsetting internal transactions among consolidated segments. |
| 2. | Amount of “Net increase by new business and conversion” for “Individual annuities” represents annuity fund at the beginning of annuity payment. |
Annualized premiums of new business (individual insurance and individual annuities)
| (Millions of yen) | ||||||||
| Nine months ended December 31, 2008 (April 1 to December 31, 2008) | Nine months ended December 31, 2009 (April 1 to December 31, 2009) | |||||||
| Amount | Rate of change | Amount | Rate of change | |||||
| % | % | |||||||
Annualized premiums of new business | 16,119 | 19.6 | 17,967 | 11.5 | ||||
Note) The above figures represent amounts before offsetting internal transactions among consolidated segments.
Table of Contents
(Consolidated) Securities
1. Bonds held to maturity (which have readily determinable fair value)
(Millions of yen)
| ||||||||||||||
| As of December 31, 2009 | As of March 31, 2009 | |||||||||||||
| Carrying amount on balance sheet | Fair value | Unrealized gains (losses) | Carrying amount on balance sheet | Fair value | Unrealized gains (losses) | |||||||||
Domestic bonds | 761,593 | 784,047 | 22,453 | 737,681 | 755,445 | 17,764 | ||||||||
Foreign securities | 100,774 | 100,620 | (153 | ) | 96,266 | 92,599 | (3,666 | ) | ||||||
Total | 862,367 | 884,667 | 22,299 | 833,948 | 848,045 | 14,097 | ||||||||
2. Securities available for sale (which have readily determinable fair value)
(Millions of yen)
| ||||||||||||||
| As of December 31, 2009 | As of March 31, 2009 | |||||||||||||
| Cost | Carrying amount on balance sheet | Unrealized gains (losses) | Cost | Carrying amount on balance sheet | Unrealized gains (losses) | |||||||||
Domestic bonds | 1,605,292 | 1,646,939 | 41,646 | 1,522,020 | 1,548,938 | 26,917 | ||||||||
Domestic stocks | 504,231 | 1,029,550 | 525,318 | 532,137 | 871,127 | 338,990 | ||||||||
Foreign securities | 721,625 | 705,061 | (16,563 | ) | 695,264 | 654,768 | (40,495 | ) | ||||||
Others | 76,804 | 80,569 | 3,764 | 79,708 | 79,991 | 282 | ||||||||
Total | 2,907,953 | 3,462,120 | 554,166 | 2,829,131 | 3,154,825 | 325,694 | ||||||||
Notes)
As of December 31, 2009 | As of March 31, 2009 | |||||
1. | Beneficial interests in the loan trusts, which are classified as monetary receivables bought in the quarterly consolidated balance sheet, are included in “Others” above. | 1. | Beneficial interests in the loan trusts, which are classified as monetary receivables bought in the consolidated balance sheet, are included in “Others” above. | |||
2. | Impairment losses on securities available for sale amount to 7,168 million yen. Of this amount, impairment losses on beneficial interests in the loan trusts, which are classified as other investment expenses in the quarterly consolidated statement of income, amount to 29 million yen.
Sompo Japan and its domestic consolidated subsidiaries recognize impairment losses on securities available for sale if fair value is declined by 30% or more of their cost at the end of the third quarter. | 2. | Impairment losses on securities available for sale amount to 71,487 million yen.
Sompo Japan and its domestic consolidated subsidiaries recognize impairment losses on securities available for sale if fair value is declined by 30% or more of their cost at the end of the fiscal year. | |||
Table of Contents
(Consolidated) Derivatives
(Millions of yen)
| ||||||||||||||||||
| As of December 31, 2009 | As of March 31, 2009 | |||||||||||||||||
Type | Transaction | Notional amount | Fair value | Unrealized gains (losses) | Notional amount | Fair value | Unrealized gains (losses) | |||||||||||
Currency derivatives | Forward foreign exchange: | |||||||||||||||||
Short | 172,408 | 176,657 | (4,248 | ) | 144,452 | 154,584 | (10,131 | ) | ||||||||||
Long | 28,253 | 29,172 | 919 | 46,949 | 48,395 | 1,445 | ||||||||||||
Equity derivatives | Equity index futures: | |||||||||||||||||
Short | 28,504 | 29,512 | (1,008 | ) | — | — | — | |||||||||||
Others | Credit derivatives: | |||||||||||||||||
Long | 5,000 | �� | 5,000 | |||||||||||||||
| 235 | * | 509 | 274 | 235 | * | 785 | 550 | |||||||||||
Weather derivatives: | ||||||||||||||||||
Short | 615 | 308 | ||||||||||||||||
| 16 | * | 18 | (2 | ) | 14 | * | 17 | (3 | ) | |||||||||
Long | 217 | 30 | ||||||||||||||||
| 0 | * | 6 | 6 | — | * | — | — | |||||||||||
Earthquake derivatives: | ||||||||||||||||||
Short | 3,450 | 4,150 | ||||||||||||||||
| 101 | * | 10 | 90 | 129 | * | 0 | 129 | |||||||||||
Long | 3,096 | 3,726 | ||||||||||||||||
| 307 | * | 138 | (168 | ) | 388 | * | 238 | (149 | ) | |||||||||
Other forward: | ||||||||||||||||||
Long | 294 | 306 | 11 | 742 | 765 | 22 | ||||||||||||
Total | (4,125 | ) | (8,137 | ) | ||||||||||||||
Notes)
| 1. | Derivative transactions to which hedge accounting is applied are excluded. |
| 2. | Amounts with an asterisk (*) represent the amount of the option premiums booked in the quarterly consolidated balance sheet or the consolidated balance sheet as of each balance sheet date. |
Table of Contents
(Non-consolidated) Summary of Results of Operations
| (Millions of yen) | ||||||||||||
| Nine months ended December 31, 2008 (April 1 to December 31, 2008) | Nine months ended December 31, 2009 (April 1 to December 31, 2009) | Increase (decrease) | Rate of change | |||||||||
| % | ||||||||||||
Direct premiums written (including deposits of premiums by policyholders) | 1,151,312 | 1,089,326 | (61,986 | ) | (5.4 | ) | ||||||
Direct premiums written | 1,039,558 | 1,002,501 | (37,056 | ) | (3.6 | ) | ||||||
Ordinary income and expenses: | ||||||||||||
Underwriting income: | 1,164,664 | 1,191,885 | 27,221 | 2.3 | ||||||||
Net premiums written | 986,779 | 951,167 | (35,611 | ) | (3.6 | ) | ||||||
Deposits of premiums by policyholders | 111,753 | 86,824 | (24,929 | ) | (22.3 | ) | ||||||
Underwriting expenses: | 969,337 | 1,011,802 | 42,464 | 4.4 | ||||||||
Net claims paid | 592,173 | 647,426 | 55,253 | 9.3 | ||||||||
Loss adjustment expenses | 56,637 | 57,887 | 1,249 | 2.2 | ||||||||
Net commissions and brokerage fees | 163,876 | 160,338 | (3,537 | ) | (2.2 | ) | ||||||
Maturity refunds to policyholders | 151,628 | 138,682 | (12,945 | ) | (8.5 | ) | ||||||
Investment income: | 76,247 | 49,818 | (26,429 | ) | (34.7 | ) | ||||||
Interest and dividend income | 79,060 | 66,092 | (12,967 | ) | (16.4 | ) | ||||||
Realized gains on sales of securities | 15,256 | 12,538 | (2,717 | ) | (17.8 | ) | ||||||
Investment expenses: | 103,996 | 25,018 | (78,977 | ) | (75.9 | ) | ||||||
Realized losses on sales of securities | 1,155 | 5,528 | 4,372 | 378.5 | ||||||||
Impairment losses on securities | 81,324 | 6,642 | (74,681 | ) | (91.8 | ) | ||||||
Operating, general and administrative expenses | 182,519 | 173,990 | (8,528 | ) | (4.7 | ) | ||||||
Operating, general and administrative expenses related to underwriting | 171,925 | 165,097 | (6,827 | ) | (4.0 | ) | ||||||
Other ordinary income and expenses | 3,054 | (2,903 | ) | (5,957 | ) | (195.1 | ) | |||||
Ordinary profit (loss) | (11,887 | ) | 27,989 | 39,876 | — | |||||||
Underwriting profit | 20,919 | 13,125 | (7,793 | ) | (37.3 | ) | ||||||
Extraordinary gains and losses: | ||||||||||||
Extraordinary gains | 32,888 | 15,857 | (17,031 | ) | (51.8 | ) | ||||||
Extraordinary losses | 620 | 4,909 | 4,289 | 691.7 | ||||||||
Net extraordinary gains | 32,268 | 10,947 | (21,321 | ) | (66.1 | ) | ||||||
Income before income taxes | 20,381 | 38,936 | 18,555 | 91.0 | ||||||||
Income taxes and deferred income taxes | 27,028 | 14,784 | (12,243 | ) | (45.3 | ) | ||||||
Net income (loss) | (6,646 | ) | 24,152 | 30,799 | — | |||||||
Ratios: | ||||||||||||
Net loss ratio | 65.8 | % | 74.2 | % | 8.4 | % | ||||||
Net expense ratio | 34.0 | 34.2 | 0.2 | |||||||||
Underwriting result ratio | 0.2 | (8.4 | ) | (8.6 | ) | |||||||
Notes)
| 1. | Underwriting profit = Underwriting income - (Underwriting expenses + Operating, general and administrative expenses related to underwriting) ± Other income and expenses |
* Other income and expenses include, but not limited to, income tax expenses for compulsory automobile liability insurance.
| 2. | Net loss ratio = (Net claims paid + Loss adjustment expenses) / Net premiums written × 100 |
| 3. | Net expense ratio = (Net commissions and brokerage fees + Operating, general and administrative expenses related to underwriting) / Net premiums written × 100 |
| 4. | Underwriting result ratio = (Net premiums written - Net claims paid - Loss adjustment expenses - Operating expenses) / Net premiums written × 100 |
* Operating expenses = Net commissions and brokerage fees + Operating, general and administrative expenses related to underwriting
Table of Contents
(Non-consolidated) Premiums Written and Claims Paid by Lines of Business
Direct premiums written (excluding deposits of premiums by policyholders)
| (Millions of yen) | ||||||||||||||||
| Nine months ended December 31, 2008 (April 1 to December 31, 2008) | Nine months ended December 31, 2009 (April 1 to December 31, 2009) | |||||||||||||||
Business line | Amount | % of total amount | Rate of change | Amount | % of total amount | Rate of change | ||||||||||
| % | % | % | % | |||||||||||||
Fire and allied insurance | 138,419 | 13.3 | 3.1 | 137,276 | 13.7 | (0.8 | ) | |||||||||
Marine insurance | 28,513 | 2.7 | 4.6 | 21,570 | 2.2 | (24.3 | ) | |||||||||
Personal accident insurance | 98,688 | 9.5 | (1.1 | ) | 97,573 | 9.7 | (1.1 | ) | ||||||||
Voluntary automobile insurance | 495,575 | 47.7 | (0.5 | ) | 482,910 | 48.2 | (2.6 | ) | ||||||||
Compulsory automobile liability insurance | 148,033 | 14.2 | (18.9 | ) | 132,319 | 13.2 | (10.6 | ) | ||||||||
Others | 130,328 | 12.5 | 0.8 | 130,852 | 13.1 | 0.4 | ||||||||||
Total | 1,039,558 | 100.0 | (2.9 | ) | 1,002,501 | 100.0 | (3.6 | ) | ||||||||
Deposits of premiums by policyholders | 111,753 | — | 9.7 | 86,824 | — | (22.3 | ) | |||||||||
Net premiums written
| ||||||||||||||||
| (Millions of yen) | ||||||||||||||||
| Nine months ended December 31, 2008 (April 1 to December 31, 2008) | Nine months ended December 31, 2009 (April 1 to December 31, 2009) | |||||||||||||||
Business line | Amount | % of total amount | Rate of change | Amount | % of total amount | Rate of change | ||||||||||
| % | % | % | % | |||||||||||||
Fire and allied insurance | 108,896 | 11.0 | 2.3 | 107,253 | 11.3 | (1.5 | ) | |||||||||
Marine insurance | 24,013 | 2.4 | (0.1 | ) | 17,924 | 1.9 | (25.4 | ) | ||||||||
Personal accident insurance | 97,532 | 9.9 | (1.3 | ) | 96,435 | 10.1 | (1.1 | ) | ||||||||
Voluntary automobile insurance | 493,976 | 50.1 | (0.5 | ) | 483,336 | 50.8 | (2.2 | ) | ||||||||
Compulsory automobile liability insurance | 140,158 | 14.2 | (18.7 | ) | 123,076 | 12.9 | (12.2 | ) | ||||||||
Others | 122,201 | 12.4 | (0.3 | ) | 123,141 | 12.9 | 0.8 | |||||||||
Total | 986,779 | 100.0 | (3.3 | ) | 951,167 | 100.0 | (3.6 | ) | ||||||||
Net claims paid
| ||||||||||||||||
(Millions of yen) | ||||||||||||||||
| Nine months ended December 31, 2008 (April 1 to December 31, 2008) | Nine months ended December 31, 2009 (April 1 to December 31, 2009) | |||||||||||||||
Business line | Amount | Rate of change | Net loss ratio | Amount | Rate of change | Net loss ratio | ||||||||||
| % | % | % | % | |||||||||||||
Fire and allied insurance | 41,642 | (5.7 | ) | 39.7 | 46,329 | 11.3 | 44.7 | |||||||||
Marine insurance | 10,786 | 1.0 | 48.2 | 10,031 | (7.0 | ) | 60.6 | |||||||||
Personal accident insurance | 50,338 | 14.9 | 56.2 | 50,541 | 0.4 | 57.6 | ||||||||||
Voluntary automobile insurance | 302,872 | 0.6 | 68.5 | 296,905 | (2.0 | ) | 68.7 | |||||||||
Compulsory automobile liability insurance | 121,983 | 0.5 | 93.9 | 117,742 | (3.5 | ) | 104.0 | |||||||||
Others | 64,550 | (6.0 | ) | 56.4 | 125,875 | 95.0 | 106.3 | |||||||||
Total | 592,173 | 0.4 | 65.8 | 647,426 | 9.3 | 74.2 | ||||||||||
Note) Net loss ratio = (Net claims paid + Loss adjustment expenses) / Net premiums written × 100
Table of Contents
[Reference]
(Non-consolidated) Solvency Margin Ratio
| (Millions of yen) | ||||||
| As of December 31, 2009 | As of March 31, 2009 | |||||
(A) Total Solvency Margin | 1,626,474 | 1,264,786 | ||||
Capital and funds, etc. | 415,583 | 391,013 | ||||
Reserve for price fluctuation | 10,074 | 5,779 | ||||
Contingency reserve | 611 | 611 | ||||
Catastrophic loss reserve | 452,012 | 446,019 | ||||
General allowance for possible loan losses | 1,187 | 899 | ||||
Unrealized gains on securities (before tax effect deductions) | 491,517 | 285,244 | ||||
Net unrealized gains/losses on real estate | 52,384 | 63,450 | ||||
Excess amount of reserve for maturity refunds | — | — | ||||
Subordinated debt, etc. | 128,000 | — | ||||
Deductions | 91,768 | 81,480 | ||||
Others | 166,872 | 153,248 | ||||
(B) Total Risks | 409,468 | 404,892 | ||||
| ||||||
Underwriting risk (R1) | 86,165 | 86,313 | ||||
Underwriting risk for third-sector insurance products including accident, sickness and nursing-care insurance (R2) | — | — | ||||
Guaranteed interest rate risk (R3) | 5,545 | 5,572 | ||||
Investment risk (R4) | 172,152 | 161,758 | ||||
Business management risk (R5) | 9,330 | 13,696 | ||||
Major catastrophe risk (R6) | 202,650 | 202,915 | ||||
(C) Solvency Margin Ratio [(A) / {(B) × 1/2}] × 100 | 794.4 | % | 624.7 | % | ||
Note)
The above figures are calculated based on Articles 86 and 87 of the Ordinance for Enforcement of the Insurance Business Law and the provisions of Notification No. 50 of the Ministry of Finance (1996). The figures as of December 31, 2009 are partly calculated on the simplified method, for example, some bases for the major catastrophe risk calculation are deemed same as the figures as of September 30, 2009.
< Solvency Margin Ratio >
| • | In addition to reserves to cover claims payments and payments for maturity refunds of saving type insurance policies, etc., it is necessary for insurance companies to maintain sufficient solvency in order to cover against risks which may exceed their normal estimates, i.e. the occurrence of major catastrophes, a big decline in value of assets held by insurance companies, etc. |
| • | Solvency margin ratio (C) above, which is calculated in accordance with the Insurance Business Law, is the ratio of “solvency margin of insurance companies by means of their capital, reserves, etc.” (total solvency margin: (A) above) to “risks which will exceed their normal estimates” (total risks: (B) above). |
| • | “Risks which will exceed their normal estimates” are composed of risks described below. |
| <1> | Underwriting risk, underwriting risk for third-sector insurance products including accident, sickness and nursing-care insurance: Risks of occurrence of insurance claims in excess of normal estimates (excluding risks relating to major catastrophes). |
| <2> | Guaranteed interest rate risk: Risks of invested assets failing to yield assumed interest rates due to the aggravation of investment conditions than expected. |
| <3> | Investment risk: Risks of retained securities and other assets fluctuating in prices in excess of normal estimates. |
| <4> | Business management risk: Risks beyond normal estimates arising from business management. (That does not fall under other categories.) |
| <5> | Major catastrophe risk: Risks of the occurrence of major catastrophic losses in excess of normal estimates. (risks such as the Great Kanto Earthquake or Isewan typhoon) |
| • | “Solvency margin of insurance companies by means of their capital, reserves, etc.” (total solvency margin ) is the sum of total net assets (excluding planned outflows), certain reserves (reserve for price fluctuation and catastrophic loss reserve, etc.) and parts of net unrealized gains/losses on real estate, etc. |
| • | Solvency margin ratio is one of the indicators for the regulatory authorities to monitor financial soundness of insurance companies. Solvency margin ratio exceeding 200% would indicate adequate capability to meet payments of possible insurance claims. |
Table of Contents
|
Exposure to Structured Finance
As of December 31, 2009
February 12, 2010
Table of Contents
|

Summary of Exposure to Structured Finance (Updated as of December 31, 2009)
Structured Finance Exposure in Investment Portfolio <Appendix 1>
Total exposure:
54.0 billion yen -Decreased by 9.6 billion yen since March 31, 2009.
Gains/Losses for the nine months ended December 31, 2009:
0.9 billion yen losses -Impairment losses: 0.0 billion yen, Unrealized losses: 0.9 billion yen.
Financial Guarantee Insurance (Running off, No new business since FY2008) <Appendix 2 to 4>
Total insured amount:
593.8 billion yen (Decreased by 233.7 billion yen since March 31, 2009)
- Net exposure to ABS CDOs: 51.1 billion yen. (Decreased by 27.8 billion yen since March 31, 2009)
Gains/Losses for the nine months ended December 31, 2009:
1.3 billion yen losses
1
Table of Contents
|
<Appendix 1> Structured Finance Exposure in Our Investment Portfolio
(As of December 31, 2009, Unit: billions of yen, USD/JPY=92.07)
Gains/Losses for the nine months
Categories Outstanding ended December 31, 2009
Balance Gains/Losses Unrealized Total
Charged to P/L Gains/Losses
ABS CDOs (backed by pools of asset backed securities) (*1) 0.0 0.0 0.0 0.0
CDOs Corporate CDOs (backed by pools of single corporate credits) (*2)
CDOs Total 0.0 0.0 0.0 0.0
RMBS (*3)
Global RMBS 2.5 (0.4) (0.4)
Domestic RMBS 30.1 0.0 0.3 0.3
RMBS Total 32.6 0.0 0.0 0.0
CMBS (*4)
Global CMBS 1.6 (0.2) (0.2)
ABS Domestic CMBS 15.7 0.0 (0.5) (0.5)
CMBS Total 17.4 0.0 (0.8) (0.8)
Other ABS
Global ABS 0.6 0.0 0.0
Domestic ABS
Other ABS Total 0.6 0.0 0.0
ABS Total 50.7 0.0 (0.9) (0.9)
Investment in SIV
Leveraged Finance (*5) 3.2
Total—54.0 0.0 (0.9) (0.9)
Reference: Hedge funds (U.S. subprime loans related exposure) 1.3 Net of the long position and the short position
*1 ABS CDOs (backed by pools of asset backed securities): The securities backed by securitized assets such as the RMBS, CDOs and CLOs. Global transactions only (Below BBB).
*2 Corporate CDOs (backed by pools of single corporate credits): The securities backed by assets such as corporate bonds, loans and CDS. Excluding public finance CLO.
*3 RMBS: Asset Backed Securities where underlying assets are residential mortgages (Excluding RMBS issued by government sponsored enterprises). Most of the RMBS are rated investment grade (BBB or above), and 83% are rated AAA. Exposure to U.S. housing related government-sponsored enterprises (GSEs)’s RMBS and Agency Bonds amounted to 56.6 billion yen (Decreased by 3.3 billion yen since March 31, 2009). No impairment losses were recognized for the nine months ended December 31, 2009.
*4 CMBS: Asset-backed securities where underlying assets are commercial mortgage loans.
*5 Leveraged Finance: Finance where funding are provided for corporate mergers and acquisitions, mainly based on cash flows of acquired companies. Domestic transactions only.
- - - - - - - - - - - - - - - - - - -
2
Table of Contents
|
<Appendix 2> Financial Guarantee Insurance
(As of December 31, 2009, Unit: billions of yen, USD/JPY=92.07)
Gains/Losses
Insured Amount for the nine
Categories Insured months ended
Direct Insurance Treaty Reinsurance Outstanding December 31,
Total Amount Net of
(*3) (*4) Loss Reserve Loss Reserves 2009 (*5)
ABS CDOs (backed by pools of asset backed securities) 123.4 0.6 124.0 72.8 51.1 (1.0)
CDOs Corporate CDOs (backed by pools of single corporate credits) 171.0 4.0 175.1 175.1
CDOs Total 294.5 4.6 299.1 72.8 226.3 (1.0)
RMBS (*1)
Global RMBS 12.2 12.2 0.3 11.9 (0.2)
Domestic RMBS 39.6 39.6 39.6
RMBS Total 39.6 12.2 51.9 0.3 51.6 (0.2)
ABS CMBS
Other ABS
Global ABS (*2) 3.9 29.8 33.8 0.5 33.2 0.0
Domestic ABS 10.9 10.9 10.9
Other ABS Total 14.8 29.8 44.7 0.5 44.2 0.0
ABS Total 54.5 42.1 96.7 0.8 95.8 (0.3)
Public Finance 197.9 197.9 0.0 197.9 0.0
Total 349.0 244.7 593.8 73.7 520.1 (1.3)
*1 93% of RMBS are rated investment grade (BBB or above) including AAA ratings for 78%.
*2 8% of global ABS are U.S. consumer loan related ABS, while others are mainly related to corporate credit (e.g., leasing receivables).
*3 “Direct Insurance” includes facultative reinsurance policies and 10.3 billion yen of Direct Insurance to cover U.S. monoline guaranteed notes.
*4 “Treaty Reinsurance” is a portfolio based reinsurance where certain parts of policies underwritten by an original insurer are ceded automatically to the reinsurer, Sompo Japan, in accordance with the conditions agreed by the original insurer and the reinsurer.
*5 Total amount of 1.3 billion yen losses is comprised of 63.7 billion yen of loss payment (including 47.5 billion yen of lump sum payment for commutation) offset by 66.4 billion yen of reversal of loss reserve and 4.0 billion yen losses of foreign exchange hedge transaction for loss reserve. Financial Guarantee Insurance is not supposed to book mark to market unrealized gains/losses through income statement as it is an insurance policy.
- - - - - - - - - - - - - - - - -
3
Table of Contents
|
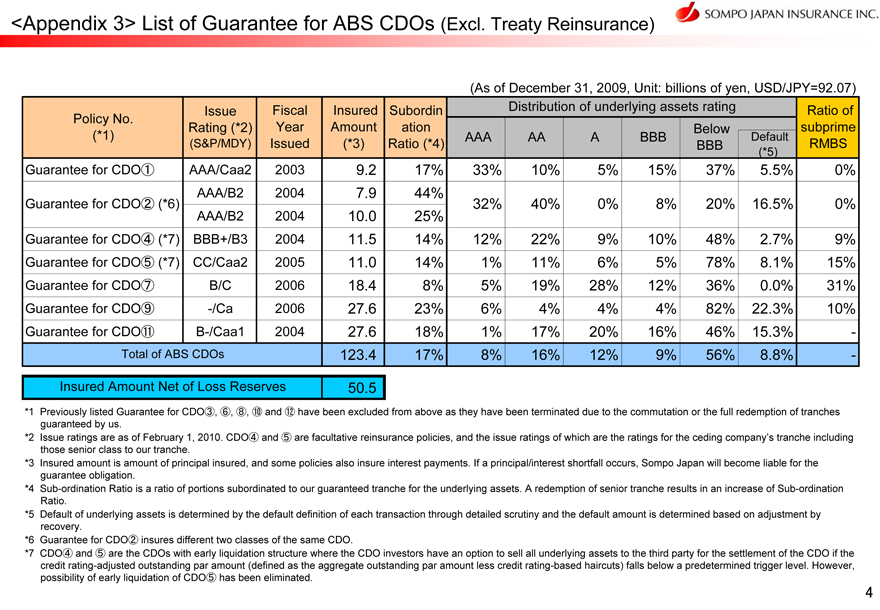
<Appendix 3> List of Guarantee for ABS CDOs (Excl. Treaty Reinsurance)
(As of December 31, 2009, Unit: billions of yen, USD/JPY=92.07)
Policy No. Issue Fiscal Insured Subordin Distribution of underlying assets rating Ratio of
Rating (*2) Year Amount ation Below subprime
(*1) AAA AA A BBB Default
(S&P/MDY) Issued (*3) Ratio (*4) BBB RMBS
(*5)
Guarantee for CDO1 AAA/Caa2 2003 9.2 17% 33% 10% 5% 15% 37% 5.5% 0%
AAA/B2 2004 7.9 44%
Guarantee for CDO2 (*6) 32% 40% 0% 8% 20% 16.5% 0%
AAA/B2 2004 10.0 25%
Guarantee for CDO4 (*7) BBB+/B3 2004 11.5 14% 12% 22% 9% 10% 48% 2.7% 9%
Guarantee for CDO5 (*7) CC/Caa2 2005 11.0 14% 1% 11% 6% 5% 78% 8.1% 15%
Guarantee for CDO7 B/C 2006 18.4 8% 5% 19% 28% 12% 36% 0.0% 31%
Guarantee for CDO9 -/Ca 2006 27.6 23% 6% 4% 4% 4% 82% 22.3% 10%
Guarantee for CDO11 B-/Caa1 2004 27.6 18% 1% 17% 20% 16% 46% 15.3% -
Total of ABS CDOs 123.4 17% 8% 16% 12% 9% 56% 8.8% -
Insured Amount Net of Loss Reserves 50.5
*1 Previously listed Guarantee for CDO3, 6, 8, 10 and 12 have been excluded from above as they have been terminated due to the commutation or the full redemption of tranches guaranteed by us.
*2 Issue ratings are as of February 1, 2010. CDO4 and 5 are facultative reinsurance policies, and the issue ratings of which are the ratings for the ceding company’s tranche including those senior class to our tranche.
*3 Insured amount is amount of principal insured, and some policies also insure interest payments. If a principal/interest shortfall occurs, Sompo Japan will become liable for the guarantee obligation.
*4 Sub-ordination Ratio is a ratio of portions subordinated to our guaranteed tranche for the underlying assets. A redemption of senior tranche results in an increase of Sub-ordination Ratio.
*5 Default of underlying assets is determined by the default definition of each transaction through detailed scrutiny and the default amount is determined based on adjustment by recovery.
*6 Guarantee for CDO2 insures different two classes of the same CDO.
*7 CDO4 and 5 are the CDOs with early liquidation structure where the CDO investors have an option to sell all underlying assets to the third party for the settlement of the CDO if the credit rating-adjusted outstanding par amount (defined as the aggregate
outstanding par amount less credit rating-based haircuts) falls below a predetermined trigger level. However, possibility of early liquidation of CDO5 has been eliminated.
4
Table of Contents
|
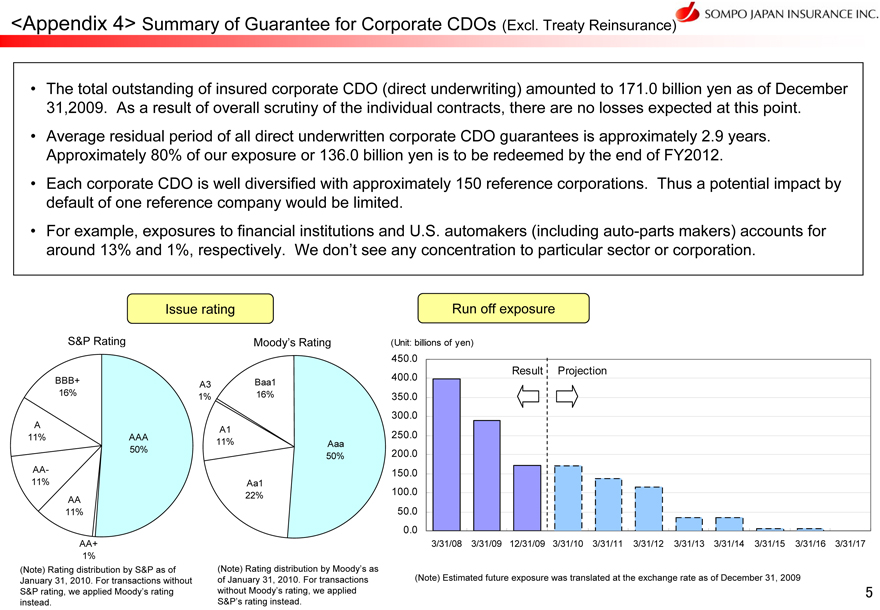
<Appendix 4> Summary of Guarantee for Corporate CDOs (Excl. Treaty Reinsurance)
The total outstanding of insured corporate CDO (direct underwriting) amounted to 171.0 billion yen as of December 31,2009. As a result of overall scrutiny of the individual contracts, there are no losses expected at this point.
Average residual period of all direct underwritten corporate CDO guarantees is approximately 2.9 years. Approximately 80% of our exposure or 136.0 billion yen is to be redeemed by the end of FY2012.
Each corporate CDO is well diversified with approximately 150 reference corporations. Thus a potential impact by default of one reference company would be limited.
For example, exposures to financial institutions and U.S. automakers (including auto-parts makers) accounts for around 13% and 1%, respectively. We don’t see any concentration to particular sector or corporation.
Issue rating
S&P Rating
BBB+ 16%
A
11% AAA 50%
AA-11% AA
11%
AA+ 1%
(Note) Rating distribution by S&P as of January 31, 2010. For transactions without S&P rating, we applied Moody’s rating instead.
Moody’s Rating
A3 Baa1
1% 16%
A1
11% Aaa 50%
Aa1 22%
(Note) Rating distribution by Moody’s as of January 31, 2010. For transactions without Moody’s rating, we applied S&P’s rating instead.
Run off exposure
(Unit: billions of yen)
450.0 400.0 350.0 300.0 250.0 200.0 150.0 100.0 50.0 0.0
3/31/08 3/31/09 12/31/09 3/31/10 3/31/11 3/31/12 3/31/13 3/31/14 3/31/15 3/31/16 3/31/17
Result Projection
(Note) Estimated future exposure was translated at the exchange rate as of December 31, 2009
5
Table of Contents
Note Regarding Forward-looking Statements
This document includes “forward-looking statements” that reflect the information in relation to the SOMPO JAPAN INSURANCE INC. (“Sompo Japan”). To the extent that statements in this document do not relate to historical or current facts, they constitute forward-looking statements. These forward-looking statements are based on the current assumptions and beliefs of Sompo Japan in light of the information currently available to it, and involve known and unknown risks, uncertainties and other factors. Such risks, uncertainties and other factors may cause the actual results, performance, achievements or financial position of Sompo Japan to be materially different from any future results, performance, achievements or financial position expressed or implied by these forward-looking statements. We undertake no obligation to publicly update any forward-looking statements after the date of this document. Investors are advised to consult any further disclosures by Sompo Japan in their subsequent domestic filings in Japan and filings with, or submissions to, the U.S. Securities Exchange Commission pursuant to the U.S. Securities Exchange Act of 1934.
The risks, uncertainties and other factors referred to above include, but are not limited to, those below. The risks, uncertainties and other factors are also referred to in our domestic Annual Securities Reports and Quarterly Securities Reports.
| (1) | Effects of deterioration of economic and business conditions in Japan |
| (2) | Effects of intensified competition in the non-life insurance business |
| (3) | Changes to laws and systems |
| (4) | Risk of natural disasters |
| (5) | Occurrence of unpredictable damages |
| (6) | Reinsurance risk |
| (7) | Overseas business risk |
| (8) | Life insurance business risk |
| (9) | Effects of declining stock price |
| (10) | Effects of fluctuation in exchange rate |
| (11) | Effects of fluctuation in interest rate |
| (12) | Liquidity risk |
| (13) | Effects of decline in creditworthiness of investment and/or loan counterparties |
| (14) | Credit rating downgrade |
| (15) | Litigation risk |
| (16) | Occurrence of personal information leak |
| (17) | Risk concerning business integration |
| (18) | Other risks |
Table of Contents
Quarterly Securities Report for the three months ended December 31, 2009
Part 1: Corporate Information
Section 1: Information on the company
| 1. | Trends in major business indexes |
| 2. | Business overview |
| 3. | Subsidiaries and affiliates |
| 4. | Employees |
Section 2: Business Conditions
| 1. | Insurance operation |
| 2. | Business risks |
| 3. | Significant contracts on management |
| 4. | Financial positions, results of operations, and cash flows |
Section 3: Information on the facilities
Section 4: Information of the reporting company
| 1. | Information on shares |
| 2. | Changes in stock prices |
| 3. | Directors |
Section 5: Financial Conditions
| 1. | Quarterly Consolidated Financial Statements |
| 2. | Others |
Part 2: Information on party(ies) providing guaranty to the Reporting Company
Table of Contents
Part 1: Corporate Information
Section 1: Information on the company
1. Trends in major business indexes
(Omitted.)
2. Business overview
(Omitted.)
3. Subsidiaries and affiliates
(Omitted.)
4. Employees
(Omitted.)
Table of Contents
Section 2: Business Conditions
1. Insurance operation
(Omitted.)
2. Business risks
During the three months ended December 31, 2009 (fiscal third quarter), there were no unusual changes to the Company’s consolidated financial condition, operating performance, or cash flow situation. Material changes (shown below) were made to the disclosure in “Part 1 Corporate Information—Section 2 Business Conditions—4 Business Risks—(17) Business Integration Risk” in the Company’s Annual Business Report for the fiscal year ended March 31, 2009. Statements about the future in that subsection made by the Group speak as of the date of submission (February 12, 2010) of the Company’s Quarterly Business Report for the fiscal third quarter.
(17) Business Integration Risk
The Company and NIPPONKOA Insurance Company, Limited (NIPPONKOA) entered into an agreement to integrate their businesses under a joint holding company to be established via a share exchange. On October 30, 2009, both companies’ Boards of Directors passed resolutions approving the Share Exchange Plan and the Business Integration Agreement (“Final Agreement”), and subsequently entered into the Final Agreement.
The Company received the shareholders’ approval for the Share Exchange Plan at an extraordinary shareholder meeting held on December 22, 2009. NIPPONKOA received the shareholders’ approval for the Share Exchange Plan at an extraordinary shareholder meeting held on December 30, 2009. Subject to regulatory approval(s), the business integration is scheduled to be effected on April 1, 2010.
Both companies are currently preparing for the business integration. Pursuit of the business integration may involve risks including the following risks, which may materially and adversely affect such matters as business operations, operating performance, and financial condition of the Company.
| • | The risk that any or all necessary regulatory approval or permission cannot be obtained at all or in a timely manner. |
| • | The risk that the details of the business integration are changed for any reason. |
| • | The risk that the business integration does not proceed as planned due to factors such as financial market turmoil and deterioration in global economic conditions. |
| • | The risk that the expected synergies of the business integration are not achieved. |
3. Significant contracts on management
(Omitted.)
4. Financial positions, results of operations, and cash flows
(Omitted.)
Section 3: Information on the facilities
(Omitted.)
Section 4: Information of the reporting company
1. Information on shares
(Omitted.)
2. Changes in stock prices
(Omitted.)
3. Directors
(Omitted.)
Table of Contents
Section 5: Financial Conditions
| 1 | Basis of Preparation of the Quarterly Consolidated Financial Statements |
SOMPO JAPAN INSURANCE INC. (“Sompo Japan”) prepares its quarterly consolidated financial statements in accordance with the “Regulations concerning the Terminology, Forms and Preparation Methods of the Quarterly Consolidated Financial Statements” (Cabinet Ordinance No. 64, 2007) and the “Ordinance for Enforcement of the Insurance Business Law” (Ministry of Finance Ordinance No. 5, 1996) pursuant to the provision of Articles 61 and 82 of the “Regulations concerning the Terminology, Forms and Preparation Methods of the Quarterly Consolidated Financial Statements.”
The quarterly consolidated financial statements for the nine months ended December 31, 2008 (April 1 to December 31, 2008) are based on the “Regulations concerning the Terminology, Forms and Preparation Methods of the Quarterly Consolidated Financial Statements” and the “Ordinance for Enforcement of the Insurance Business Law” before revision. The quarterly consolidated financial statements for the three months ended December 31, 2009 (October 1 to December 31, 2009) and the nine months ended December 31, 2009 (April 1 to December 31, 2009) are based on the “Regulations concerning the Terminology, Forms and Preparation Methods of the Quarterly Consolidated Financial Statements” and the “Ordinance for Enforcement of the Insurance Business Law” after revision.
| 2 | Results of Operations for the Quarterly Consolidated Accounting Period |
Results of operations for the third quarter consolidated accounting period is shown in “2 Others”, since Sompo Japan conducts business defined in the provision of Article 17-15 Paragraph 2 of the “Cabinet Office Ordinance on Disclosure of Corporate Information, etc.”
| 3 | Audit Certification |
In accordance with the provision of Article 193-2 Paragraph 1 of the Financial Instruments and Exchange Act, the quarterly consolidated financial statements for the nine months ended December 31, 2008 (April 1 to December 31, 2008), the three months ended December 31, 2009 (October 1 to December 31, 2009) and the nine months ended December 31, 2009 (April 1 to December 31, 2009) have been reviewed by Ernst & Young ShinNihon LLC.
Table of Contents
1. Quarterly Consolidated Financial Statements
(1) Quarterly Consolidated Balance Sheets
| (Millions of yen) | ||||||||||
| As of December 31, 2009 | As of March 31, 2009 | |||||||||
Assets: | ||||||||||
Cash and deposits | 116,210 | 151,781 | ||||||||
Call loans | 66,400 | 73,600 | ||||||||
Receivables under resale agreements | 89,981 | 81,978 | ||||||||
Monetary receivables bought | 35,783 | 40,160 | ||||||||
Money trusts | 10,539 | 9,715 | ||||||||
Securities | 4,457,369 | 4,125,568 | ||||||||
Loans | 499,168 | 517,894 | ||||||||
Tangible fixed assets | *1 | 215,411 | *1 | 219,047 | ||||||
Intangible fixed assets | 26,831 | 26,456 | ||||||||
Other assets | 422,701 | 434,189 | ||||||||
Deferred tax assets | 168,350 | 249,507 | ||||||||
Allowance for possible loan losses | (16,930 | ) | (16,520 | ) | ||||||
Total assets | 6,091,817 | 5,913,379 | ||||||||
Liabilities: | ||||||||||
Underwriting funds: | 4,926,383 | 4,998,577 | ||||||||
Reserve for outstanding losses and claims | 757,016 | 818,052 | ||||||||
Underwriting reserves | 4,169,366 | 4,180,524 | ||||||||
Bonds | 128,000 | — | ||||||||
Other liabilities | 192,381 | 199,019 | ||||||||
Reserve for retirement benefits | 79,964 | 99,342 | ||||||||
Reserve for retirement benefits to directors | 82 | 31 | ||||||||
Reserve for bonus payments | 4,945 | 14,679 | ||||||||
Reserve for price fluctuation | 10,878 | 6,487 | ||||||||
Deferred tax liabilities | 593 | 295 | ||||||||
Total liabilities | 5,343,229 | 5,318,432 | ||||||||
Net assets: | ||||||||||
Shareholders’ equity: | ||||||||||
Common stock | 70,000 | 70,000 | ||||||||
Capital surplus | 24,229 | 24,229 | ||||||||
Retained earnings | 320,588 | 320,381 | ||||||||
Treasury stock | (2,740 | ) | (2,839 | ) | ||||||
Total shareholders’ equity | 412,077 | 411,771 | ||||||||
Valuation and translation adjustments: | ||||||||||
Unrealized gains on securities available for sale, net of tax | 356,669 | 207,503 | ||||||||
Foreign currency translation adjustments | (23,623 | ) | (26,274 | ) | ||||||
Total valuation and translation adjustments | 333,045 | 181,228 | ||||||||
Stock acquisition rights | 1,302 | 984 | ||||||||
Non-controlling interests | 2,161 | 962 | ||||||||
Total net assets | 748,588 | 594,946 | ||||||||
Total liabilities and net assets | 6,091,817 | 5,913,379 | ||||||||
Table of Contents
(2) Quarterly Consolidated Statements of Income
| (Millions of yen) | ||||||||||
| Nine months ended December 31, 2008 (April 1 to December 31, 2008) | Nine months ended December 31, 2009 (April 1 to December 31, 2009) | |||||||||
Ordinary income: | 1,347,080 | 1,353,038 | ||||||||
Underwriting income: | 1,246,881 | 1,277,248 | ||||||||
Net premiums written | 1,004,442 | 973,918 | ||||||||
Deposits of premiums by policyholders | 111,753 | 87,194 | ||||||||
Interest and dividend income on deposits of premiums, etc. | 34,292 | 31,706 | ||||||||
Life insurance premiums written | 90,029 | 90,433 | ||||||||
Reversal of reserve for outstanding losses and claims | 6,004 | 67,628 | ||||||||
Reversal of underwriting reserves | — | 24,854 | ||||||||
Investment income: | 93,768 | 68,677 | ||||||||
Interest and dividend income | 95,528 | 82,482 | ||||||||
Investment gains on money trusts | — | 0 | ||||||||
Investment gains on trading securities | 41 | 126 | ||||||||
Realized gains on sales of securities | 15,992 | 13,639 | ||||||||
Transfer of interest and dividend income on deposits of premiums, etc. | (34,292 | ) | (31,706 | ) | ||||||
Other ordinary income | 6,430 | 7,112 | ||||||||
Ordinary expenses: | 1,350,294 | 1,326,651 | ||||||||
Underwriting expenses: | 1,021,307 | 1,075,329 | ||||||||
Net claims paid | 600,682 | 660,328 | ||||||||
Loss adjustment expenses | *1 | 57,463 | *1 | 59,045 | ||||||
Net commissions and brokerage fees | *1 | 175,764 | *1 | 176,933 | ||||||
Maturity refunds to policyholders | 151,628 | 139,194 | ||||||||
Life insurance claims paid | 29,853 | 32,356 | ||||||||
Provision for underwriting reserves | 855 | — | ||||||||
Investment expenses: | 107,200 | 25,898 | ||||||||
Investment losses on money trusts | 10,606 | 1,130 | ||||||||
Realized losses on sales of securities | 1,343 | 5,554 | ||||||||
Impairment losses on securities | 82,495 | 7,360 | ||||||||
Operating, general and administrative expenses | *1 | 220,537 | *1 | 216,463 | ||||||
Other ordinary expenses: | 1,248 | 8,959 | ||||||||
Interest paid | 92 | 4,286 | ||||||||
Ordinary profit (loss) | (3,213 | ) | 26,387 | |||||||
Extraordinary gains: | 33,043 | 15,870 | ||||||||
Reversal of price fluctuation reserve | 32,431 | — | ||||||||
Others | *2 | 612 | *2 | 15,870 | ||||||
Extraordinary losses: | 653 | 5,028 | ||||||||
Provision for price fluctuation reserve | — | 4,383 | ||||||||
Others | *3 | 653 | *3 | 645 | ||||||
Income before income taxes and non-controlling interests | 29,176 | 37,229 | ||||||||
Income taxes and deferred income taxes | 29,835 | 16,166 | ||||||||
Non-controlling interests | (64 | ) | (338 | ) | ||||||
Net income (loss) | (594 | ) | 21,401 | |||||||
Table of Contents
(3) Quarterly Consolidated Statements of Cash Flows
| (Millions of yen) | ||||||||||
| Nine months ended December 31, 2008 (April 1 to December 31, 2008) | Nine months ended December 31, 2009 (April 1 to December 31, 2009) | |||||||||
Cash flows from operating activities: | ||||||||||
Income before income taxes | 29,176 | 37,229 | ||||||||
Depreciation | 7,926 | 8,545 | ||||||||
Amortization of goodwill | 1,404 | 2,033 | ||||||||
Increase (decrease) in reserve for outstanding losses and claims | (6,015 | ) | (68,263 | ) | ||||||
Increase (decrease) in underwriting reserves | (698 | ) | (26,159 | ) | ||||||
Increase (decrease) in allowance for possible loan losses | 170 | 401 | ||||||||
Increase (decrease) in reserve for retirement benefits | 4,595 | (20,088 | ) | |||||||
Increase (decrease) in reserve for retirement benefits to directors | (2,477 | ) | 21 | |||||||
Increase (decrease) in reserve for bonus payments | (9,497 | ) | (9,847 | ) | ||||||
Increase (decrease) in reserve for price fluctuation | (32,431 | ) | 4,383 | |||||||
Interest and dividend income | (95,528 | ) | (82,482 | ) | ||||||
Losses (gains) on investment in securities | 67,957 | 1,542 | ||||||||
Interest expenses | 92 | 4,286 | ||||||||
Foreign exchange losses (gains) | 1,164 | 3,921 | ||||||||
Losses (gains) related to tangible fixed assets | 172 | (211 | ) | |||||||
Losses (gains) related to loans | 37 | — | ||||||||
Investment losses (gains) on the equity method | (794 | ) | 19 | |||||||
Decrease (increase) in other assets | 23,398 | 3,187 | ||||||||
Increase (decrease) in other liabilities | (44,428 | ) | (25,263 | ) | ||||||
Others | 9,317 | 20,080 | ||||||||
Subtotal | (46,458 | ) | (146,661 | ) | ||||||
Interest and dividend received | 96,172 | 82,349 | ||||||||
Interest paid | (94 | ) | (3,593 | ) | ||||||
Income taxes paid | (71,116 | ) | 19,763 | |||||||
Cash flows from operating activities | (21,496 | ) | (48,141 | ) | ||||||
Cash flows from investing activities: | ||||||||||
Net decrease (increase) in deposits | 3,105 | (19,224 | ) | |||||||
Purchase of monetary receivables bought | (5,897 | ) | (1,362 | ) | ||||||
Proceeds from sales and redemption of monetary receivables bought | 3,923 | 3,785 | ||||||||
Increase in money trusts | — | (164 | ) | |||||||
Decrease in money trusts | 12,000 | 3,002 | ||||||||
Purchase of securities | (472,880 | ) | (522,072 | ) | ||||||
Proceeds from sales and redemption of securities | 468,601 | 421,355 | ||||||||
Loans made | (118,520 | ) | (102,066 | ) | ||||||
Collection of loans | 98,286 | 112,350 | ||||||||
Others | 16,045 | (8,169 | ) | |||||||
Subtotal | 4,665 | (112,567 | ) | |||||||
Total of operating activities and investment transactions as above | (16,830 | ) | (160,709 | ) | ||||||
Acquisition of tangible fixed assets | (6,518 | ) | (4,104 | ) | ||||||
Proceeds from sales of tangible fixed assets | 1,064 | 1,333 | ||||||||
Proceeds related to acquisition of stocks of subsidiaries resulting in changes in the scope of consolidation | — | 64 | ||||||||
Cash flows from investing activities | (788 | ) | (115,275 | ) | ||||||
Cash flows from financing activities: | ||||||||||
Proceeds from issuance of bonds | — | 128,000 | ||||||||
Proceeds from issuance of stocks | 568 | — | ||||||||
Proceeds from sales of treasury stock | 168 | 164 | ||||||||
Acquisition of treasury stock | (196 | ) | (66 | ) | ||||||
Dividends paid | (19,871 | ) | (19,796 | ) | ||||||
Dividends paid to non-controlling shareholders | (4 | ) | — | |||||||
Others | (171 | ) | (2,465 | ) | ||||||
Cash flows from financing activities | (19,505 | ) | 105,835 | |||||||
Effect of exchange rate changes on cash and cash equivalents | (1,999 | ) | 1,931 | |||||||
Net Increase (decrease) in cash and cash equivalents | (43,790 | ) | (55,649 | ) | ||||||
Cash and cash equivalents at the beginning of the period | 319,998 | 299,497 | ||||||||
Net increase in cash and cash equivalents due to newly consolidated subsidiaries | — | 467 | ||||||||
Cash and cash equivalents at the end of the period | *1 | 276,207 | *1 | 244,315 | ||||||
Table of Contents
[Changes in significant accounting policies for preparing the quarterly consolidated financial statements]
Nine months ended December 31, 2009 (April 1 to December 31, 2009) | ||
1 Changes in the scope of consolidation | (1) Changes in the scope of consolidation
Healthcare Frontier Japan Inc. is included in the consolidation from the first quarter of this fiscal year due to the increase in materiality.
Saison Automobile and Fire Insurance Company, Limited, which was formerly an affiliate accounted for under the equity method, is included in the consolidation from the second quarter of this fiscal year as it became Sompo Japan’s subsidiary through additional acquisition of shares. Its results of operations are consolidated from the second quarter of this fiscal year, while its results of operations for the first quarter of this fiscal year are accounted for under the equity method as the date of the additional acquisition of shares is deemed to be the beginning of the second quarter of this fiscal year.
(2) Number of consolidated subsidiaries after changes:
12 companies | |
2 Changes in application of the equity method | (1) Changes in affiliates accounted for under the equity method
Investments in Maritima Seguros S.A. and Maritima Saude Seguros S.A. are accounted for under the equity method from the second quarter of this fiscal year as they became affiliates through the acquisition of shares.
(2) Number of affiliates accounted for under the equity method after changes:
6 companies | |
[Adoption of accounting methods used specifically for the quarterly consolidated financial statements]
Nine months ended December 31, 2009 (April 1 to December 31, 2009) | ||
Calculation of income taxes | Income taxes are calculated by applying a reasonably estimated effective tax rate to income before income taxes. The estimated effective tax rate is determined by estimating the effective tax rate after applying deferred tax accounting for the fiscal year, including the third quarter of this fiscal year. When it is remarkably unreasonable to adopt this accounting method, income taxes are calculated by the statutory effective tax rate. |
Table of Contents
[Notes to the quarterly consolidated financial statements]
(Notes to the quarterly consolidated balance sheets)
As of December 31, 2009 | As of March 31, 2009 | |
*1 Accumulated depreciation of tangible fixed assets amounts to 240,661 million yen. | *1 Accumulated depreciation of tangible fixed assets amounts to 236,040 million yen. |
(Notes to the quarterly consolidated statements of income)
Nine months ended December 31, 2008 (April 1 to December 31, 2008) | Nine months ended December 31, 2009 (April 1 to December 31, 2009) | |||||
*1 Major components of operating expenses | *1 Major components of operating expenses | |||||
Agency commissions, etc. | 177,059 million yen | Agency commissions, etc. | 176,810 million yen | |||
Salaries | 108,409 million yen | Salaries | 108,340 million yen | |||
Operating expenses represent the sum of loss adjustment expenses, net commissions and brokerage fees and operating, general and administrative expenses included in the quarterly consolidated statement of income. | Operating expenses represent the sum of loss adjustment expenses, net commissions and brokerage fees and operating, general and administrative expenses included in the quarterly consolidated statement of income. | |||||
*2 The components of others in extraordinary gains are 481 million yen of gains on sales of fixed assets of Sompo Japan and its consolidated subsidiaries and 131 million yen of gains on changes in interests in the consolidated subsidiaries. | *2 The major component of others in extraordinary gains is 15,013 million yen of gains on contribution to an employee retirement benefits trust of Sompo Japan. | |||||
*3 The major component of others in extraordinary losses is 539 million yen of losses on sales of fixed assets of Sompo Japan and its consolidated subsidiaries. | *3 The component of others in extraordinary losses is 645 million yen of losses on sales of fixed assets of Sompo Japan and its consolidated subsidiaries. | |||||
Table of Contents
(Notes to the quarterly consolidated statements of cash flows)
Nine months ended December 31, 2008 (April 1 to December 31, 2008) | Nine months ended December 31, 2009 (April 1 to December 31, 2009) | |||||||||||
*1 Reconciliation of cash and cash equivalents to the line items disclosed in the quarterly consolidated balance sheet as of December 31, 2008 | *1 Reconciliation of cash and cash equivalents to the line items disclosed in the quarterly consolidated balance sheet as of December 31, 2009 | |||||||||||
Cash and deposits | 150,611 | million yen | Cash and deposits | 116,210 | million yen | |||||||
Call loans | 68,400 | million yen | Call loans | 66,400 | million yen | |||||||
Receivables under resale agreements | 70,451 | million yen | Receivables under resale agreements | 89,981 | million yen | |||||||
Monetary receivables bought | 44,051 | million yen | Securities | 4,457,369 | million yen | |||||||
Securities | 4,211,042 | million yen | Time deposit with an original maturity of more than 3 months | (34,125 | ) | million yen | ||||||
Time deposit with an original maturity of more than 3 months | (16,945 | ) | million yen | Securities other than cash equivalents | (4,451,520 | ) | million yen | |||||
Monetary receivables bought other than cash equivalents | (44,051 | ) | million yen | Cash and cash equivalents | 244,315 | million yen | ||||||
Securities other than cash equivalents | (4,207,352 | ) | million yen | |||||||||
Cash and cash equivalents | 276,207 | million yen | ||||||||||
2 Cash flows from investing activities include cash flows from investment activities conducted as a part of insurance business. |
2 Cash flows from investing activities include cash flows from investment activities conducted as a part of insurance business. | |||||||||||
Table of Contents
(Shareholders’ Equity)
As of December 31, 2009 and the nine months ended December 31, 2009 (April 1 to December 31, 2009)
| 1 | Type and number of shares outstanding: |
Common stock: 987,733 thousand shares
| 2 | Type and number of treasury stock: |
Common stock: 3,109 thousand shares
| 3 | Stock acquisition rights as of December 31, 2009: |
Stock acquisition rights for stock option: 1,302 million yen (Sompo Japan 1,302 million yen)
| 4 | Dividends |
(1) Dividends paid
Resolution | Type of share | Total amount | Dividend per share | Date of record | Effective date | Source of dividend | ||||||
General meeting of stockholders held on June 25, 2009 | Common stock | 19,690 million yen | 20 yen | March 31, 2009 | June 26, 2009 | Retained earnings |
(2) Of dividends with record date within the nine months ended December 31, 2009, dividends with the effective date after December 31, 2009
None.
Table of Contents
(Segment Information)
[Segment information by lines of business]
Nine months ended December 31, 2008 (April 1 to December 31, 2008)
| (Millions of yen) | |||||||||||||
| Property and casualty | Life | Total | Elimination | Consolidated | |||||||||
Ordinary income | |||||||||||||
(1) Ordinary income from transactions with external customers | 1,243,004 | 104,076 | 1,347,080 | — | 1,347,080 | ||||||||
(2) Ordinary income arising from internal segment | 2,199 | 10 | 2,210 | 2,210 | — | ||||||||
Total | 1,245,203 | 104,087 | 1,349,291 | 2,210 | 1,347,080 | ||||||||
Ordinary profit (loss) | (7,476 | ) | 4,262 | (3,213 | ) | — | (3,213 | ) | |||||
Notes)
| 1 | The segments are classified based on the conditions of operation of Sompo Japan and its consolidated subsidiaries. |
| 2 | Major operations of each segment are as follows: |
| (1) | Property and casualty: Underwriting of property and casualty insurance and related investment activities |
| (2) | Life: Underwriting of life insurance and related investment activities |
Nine months ended December 31, 2009 (April 1 to December 31, 2009)
| (Millions of yen) | |||||||||||
| Property and casualty | Life | Total | Elimination | Consolidated | |||||||
Ordinary income | |||||||||||
(1) Ordinary income from transactions with external customers | 1,275,387 | 77,651 | 1,353,038 | — | 1,353,038 | ||||||
(2) Ordinary income arising from internal segment | 1,242 | 12 | 1,255 | 1,255 | — | ||||||
Total | 1,276,629 | 77,664 | 1,354,294 | 1,255 | 1,353,038 | ||||||
Ordinary profit (loss) | 27,996 | (1,608 | ) | 26,387 | — | 26,387 | |||||
Notes)
| 1 | The segments are classified based on the conditions of operation of Sompo Japan and its consolidated subsidiaries. |
| 2 | Major operations of each segment are as follows: |
| (1) | Property and casualty: Underwriting of property and casualty insurance and related investment activities |
| (2) | Life: Underwriting of life insurance and related investment activities |
Table of Contents
[Segment information by geographic area]
Nine months ended December 31, 2008 (April 1 to December 31, 2008)
Geographic segment information is omitted because the “business in Japan” constitutes more than 90 percent of the total amount of the ordinary income of all segments.
Nine months ended December 31, 2009 (April 1 to December 31, 2009)
Geographic segment information is omitted because the “business in Japan” constitutes more than 90 percent of the total amount of the ordinary income of all segments.
[Overseas sales]
Nine months ended December 31, 2008 (April 1 to December 31, 2008)
Information on overseas sales is omitted because the overseas ordinary income constitutes less than 10 percent of the consolidated ordinary income.
Nine months ended December 31, 2009 (April 1 to December 31, 2009)
Information on overseas sales is omitted because the overseas ordinary income constitutes less than 10 percent of the consolidated ordinary income.
Table of Contents
(Securities)
| 1 | Bonds held to maturity (which have readily determinable fair value) |
| (Millions of yen) | ||||||||||||||
| As of December 31, 2009 | As of March 31, 2009 | |||||||||||||
| Carrying amount on balance sheet | Fair value | Unrealized gains (losses) | Carrying amount on balance sheet | Fair value | Unrealized gains (losses) | |||||||||
Domestic bonds | 761,593 | 784,047 | 22,453 | 737,681 | 755,445 | 17,764 | ||||||||
Foreign securities | 100,774 | 100,620 | (153 | ) | 96,266 | 92,599 | (3,666 | ) | ||||||
Total | 862,367 | 884,667 | 22,299 | 833,948 | 848,045 | 14,097 | ||||||||
| 2 | Securities available for sale (which have readily determinable fair value) |
| (Millions of yen) | ||||||||||||||
| As of December 31, 2009 | As of March 31, 2009 | |||||||||||||
| Cost | Carrying amount on balance sheet | Unrealized gains (losses) | Cost | Carrying amount on balance sheet | Unrealized gains (losses) | |||||||||
Domestic bonds | 1,605,292 | 1,646,939 | 41,646 | 1,522,020 | 1,548,938 | 26,917 | ||||||||
Domestic stocks | 504,231 | 1,029,550 | 525,318 | 532,137 | 871,127 | 338,990 | ||||||||
Foreign securities | 721,625 | 705,061 | (16,563 | ) | 695,264 | 654,768 | (40,495 | ) | ||||||
Others | 76,804 | 80,569 | 3,764 | 79,708 | 79,991 | 282 | ||||||||
Total | 2,907,953 | 3,462,120 | 554,166 | 2,829,131 | 3,154,825 | 325,694 | ||||||||
Notes)
As of December 31, 2009 | As of March 31, 2009 | |
1 Beneficial interests in the loan trusts, which are classified as monetary receivables bought in the quarterly consolidated balance sheet, are included in “Others” above. | 1 Beneficial interests in the loan trusts, which are classified as monetary receivables bought in the consolidated balance sheet, are included in “Others” above. | |
2 Impairment losses on securities available for sale amount to 7,168 million yen. Of this amount, impairment losses on beneficial interests in the loan trusts, which are classified as other investment expenses in the quarterly consolidated statement of income, amount to 29 million yen.
Sompo Japan and its domestic consolidated subsidiaries recognize impairment losses on securities available for sale if fair value is declined by 30% or more of their cost at the end of the third quarter. | 2 Impairment losses on securities available for sale amount to 71,487 million yen.
Sompo Japan and its domestic consolidated subsidiaries recognize impairment losses on securities available for sale if fair value is declined by 30% or more of their cost at the end of the fiscal year. | |
Table of Contents
(Money trusts)
| 1 | Money trusts held to maturity |
None.
| 2 | Money trusts classified as other than trading purposes or held to maturity |
| (Millions of yen) | |||||||||||||
| As of December 31, 2009 | As of March 31, 2009 | ||||||||||||
| Cost | Carrying amount on balance sheet | Unrealized gains (losses) | Cost | Carrying amount on balance sheet | Unrealized gains (losses) | ||||||||
Money trusts | 9,161 | 9,244 | 83 | 11,708 | 9,715 | (1,992 | ) | ||||||
Notes)
As of December 31, 2009 | As of March 31, 2009 | |
| Impairment losses on securities in money trusts classified as other than trading purposes or held to maturity are not recognized. | Impairment losses on securities in money trusts classified as other than trading purposes or held to maturity amount to 202 million yen. | |
| Sompo Japan and its domestic consolidated subsidiaries recognize impairment losses on money trusts classified as other than trading purposes or held to maturity if the fair value of the underlying securities is declined by 30% or more of their cost at the end of the third quarter. | Sompo Japan and its domestic consolidated subsidiaries recognize impairment losses on money trusts classified as other than trading purposes or held to maturity if the fair value of underlying securities is declined by 30% or more of their cost at the end of the fiscal year. | |
Table of Contents
(Derivatives)
(Millions of yen)
| ||||||||||||||||||
| As of December 31, 2009 | As of March 31, 2009 | |||||||||||||||||
Type | Transaction | Notional amount | Fair value | Unrealized gains (losses) | Notional amount | Fair value | Unrealized gains (losses) | |||||||||||
Currency derivatives | Forward foreign exchange: | |||||||||||||||||
| Short | 172,408 | 176,657 | (4,248 | ) | 144,452 | 154,584 | (10,131 | ) | ||||||||||
Long | 28,253 | 29,172 | 919 | 46,949 | 48,395 | 1,445 | ||||||||||||
Equity derivatives | Equity index futures: | |||||||||||||||||
| Short | 28,504 | 29,512 | (1,008 | ) | — | — | — | |||||||||||
Others | Credit derivatives: | |||||||||||||||||
| Long | 5,000 | 5,000 | ||||||||||||||||
| 235 | * | 509 | 274 | 235 | * | 785 | 550 | |||||||||||
| Weather derivatives: | ||||||||||||||||||
| Short | 615 | 308 | ||||||||||||||||
| 16 | * | 18 | (2 | ) | 14 | * | 17 | (3 | ) | |||||||||
| Long | 217 | 30 | ||||||||||||||||
| 0 | * | 6 | 6 | — | * | — | — | |||||||||||
| Earthquake derivatives: | ||||||||||||||||||
| Short | 3,450 | 4,150 | ||||||||||||||||
| 101 | * | 10 | 90 | 129 | * | 0 | 129 | |||||||||||
| Long | 3,096 | 3,726 | ||||||||||||||||
| 307 | * | 138 | (168 | ) | 388 | * | 238 | (149 | ) | |||||||||
| Other forward: | ||||||||||||||||||
| Long | 294 | 306 | 11 | 742 | 765 | 22 | ||||||||||||
Total | (4,125 | ) | (8,137 | ) | ||||||||||||||
Notes)
| 1 | Derivative transactions to which hedge accounting is applied are excluded. |
| 2 | Amounts with an asterisk (*) represent the amount of the option premiums booked in the quarterly consolidated balance sheet or the consolidated balance sheet as of each balance sheet date. |
Table of Contents
(Per share information)
1 Total net assets per share
As of December 31, 2009 | As of March 31, 2009 | |||||||||
Total net assets per share | 756.75 yen | Total net assets per share | 602.30 yen | |||||||
Note) Calculation of total net assets per share is based on the following figures.
| (Millions of yen) | ||||||
| As of December 31, 2009 | As of March 31, 2009 | |||||
Total net assets | 748,588 | 594,946 | ||||
Amount to be deducted from total net assets: | (3,464 | ) | (1,946 | ) | ||
Stock acquisition rights | (1,302 | ) | (984 | ) | ||
Non-controlling interests | (2,161 | ) | (962 | ) | ||
Total net assets attributable to common stocks | 745,123 | 593,000 | ||||
Number of common stocks used for calculation of total net assets per share | thousand shares 984,623 | | thousand shares 984,544 | | ||
2 Net income (loss) per share
Nine months ended December 31, 2008 (April 1 to December 31, 2008) | Nine months ended December 31, 2009 (April 1 to December 31, 2009) | |||||||||
Net income (loss) per share—Basic | (0.60) yen | Net income (loss) per share—Basic | 21.73 yen | |||||||
Net income per share—Diluted | —— | Net income per share—Diluted | 21.72 yen | |||||||
Notes)
| 1 | Diluted net income per share for the nine months ended December 31, 2008 is not shown due to basic net loss per share. |
| 2 | Calculation of basic net income (loss) per share and diluted net income per share is based on the following figures. |
| (Millions of yen) | |||||
Nine months ended December 31, 2008 | Nine months ended December 31, 2009 | ||||
| (April 1 to December 31, 2008) | (April 1 to December 31, 2009) | ||||
(1) Net income (loss) per share—Basic | |||||
Net income (loss) | (594 | ) | 21,401 | ||
Net income (loss) not attributable to common stockholders | — | — | |||
Net income (loss) attributable to common stocks | (594 | ) | 21,401 | ||
Average number of common stocks | thousand shares 984,541 | | thousand shares 984,627 | ||
(2) Net income per share—Diluted | |||||
Adjustment of net income | —— | — | |||
Increase of common stocks | thousand shares —— | | thousand shares 707 | ||
(Significant subsequent events)
None.
Table of Contents
2. Others
(1) Quarterly Consolidated Statements of Income for the third quarter consolidated accounting period
The quarterly consolidated statements of income for the third quarter consolidated accounting period are not reviewed, since Sompo Japan conducts business defined in the provision of Article17-15 Paragraph 2 of the “Cabinet Office Ordinance on Disclosure of Corporate Information, etc.”
| (Millions of yen) | ||||||
| Three months ended December 31, 2008 (October 1 to December 31, 2008) | Three months ended December 31, 2009 (October 1 to December 31, 2009) | |||||
Ordinary income: | 485,874 | 450,678 | ||||
Underwriting income: | 444,481 | 425,649 | ||||
Net premiums written | 315,224 | 317,009 | ||||
Deposits of premiums by policyholders | 37,802 | 32,787 | ||||
Interest and dividend income on deposits of premiums, etc. | 11,187 | 10,543 | ||||
Life insurance premiums written | 23,000 | 31,703 | ||||
Reversal of reserve for outstanding losses and claims | 8,671 | — | ||||
Reversal of underwriting reserves | 48,289 | 32,002 | ||||
Investment income: | 39,841 | 23,158 | ||||
Interest and dividend income | 28,612 | 25,226 | ||||
Investment gains on money trusts | — | 135 | ||||
Investment gains on trading securities | — | 11 | ||||
Realized gains on sales of securities | 3,199 | 8,121 | ||||
Transfer of interest and dividend income on deposits of premiums, etc. | (11,187 | ) | (10,543 | ) | ||
Other ordinary income | 1,551 | 1,870 | ||||
Ordinary expenses: | 526,153 | 456,168 | ||||
Underwriting expenses: | 361,756 | 370,120 | ||||
Net claims paid | 203,487 | 211,315 | ||||
Loss adjustment expenses | 18,931 | 20,022 | ||||
Net commissions and brokerage fees | 56,934 | 59,109 | ||||
Maturity refunds to policyholders | 65,904 | 64,316 | ||||
Life insurance claims paid | 10,898 | 11,658 | ||||
Provision for reserve for outstanding losses and claims | — | 3,298 | ||||
Investment expenses: | 92,592 | 12,096 | ||||
Investment losses on money trusts | 7,859 | 2 | ||||
Investment losses on trading securities | 268 | — | ||||
Realized losses on sales of securities | 651 | 2,121 | ||||
Impairment losses on securities | 74,206 | 2,495 | ||||
Operating, general and administrative expenses | 71,230 | 70,223 | ||||
Other ordinary expenses: | 572 | 3,727 | ||||
Interest paid | 14 | 1,766 | ||||
Ordinary profit (loss) | (40,278 | ) | (5,489 | ) | ||
Extraordinary gains: | 34,853 | 663 | ||||
Reversal of price fluctuation reserve | 34,666 | — | ||||
Others | 187 | 663 | ||||
Extraordinary losses: | 171 | 1,782 | ||||
Provision for price fluctuation reserve | — | 1,432 | ||||
Others | 171 | 349 | ||||
Income (loss) before income taxes and non-controlling interests | (5,595 | ) | (6,607 | ) | ||
Income taxes and deferred income taxes | 17,797 | 1,582 | ||||
Non-controlling interests | (63 | ) | (246 | ) | ||
Net income (loss) | (23,329 | ) | (7,943 | ) | ||
Table of Contents
(Segment Information)
[Segment information by lines of business]
Three months ended December 31, 2008 (October 1 to December 31, 2008)
| (Millions of yen) | ||||||||||||||
| Property and casualty | Life | Total | Elimination | Consolidated | ||||||||||
Ordinary income | ||||||||||||||
(1) Ordinary income from transactions with external customers | 457,554 | 28,320 | 485,874 | — | 485,874 | |||||||||
(2) Ordinary income arising from internal segment | 844 | 2 | 847 | 847 | — | |||||||||
Total | 458,399 | 28,322 | 486,721 | 847 | 485,874 | |||||||||
Ordinary profit (loss) | (40,053 | ) | (224 | ) | (40,278 | ) | — | (40,278 | ) | |||||
Three months ended December 31, 2009 (October 1 to December 31, 2009)
| (Millions of yen) | ||||||||||||||
| Property and casualty | Life | Total | Elimination | Consolidated | ||||||||||
Ordinary income | ||||||||||||||
(1) Ordinary income from transactions with external customers | 424,404 | 26,273 | 450,678 | — | 450,678 | |||||||||
(2) Ordinary income arising from internal segment | 416 | 2 | 419 | 419 | — | |||||||||
Total | 424,821 | 26,276 | 451,098 | 419 | 450,678 | |||||||||
Ordinary profit (loss) | (4,243 | ) | (1,246 | ) | (5,489 | ) | — | (5,489 | ) | |||||
Table of Contents
[Segment information by geographic area]
Three months ended December 31, 2008 (October 1 to December 31, 2008)
Geographic segment information is omitted because the “business in Japan” constitutes more than 90 percent of the total amount of the ordinary income of all segments.
Three months ended December 31, 2009 (October 1 to December 31, 2009)
Geographic segment information is omitted because the “business in Japan” constitutes more than 90 percent of the total amount of the ordinary income of all segments.
[Overseas sales]
Three months ended December 31, 2008 (October 1 to December 31, 2008)
Information on overseas sales is omitted because the overseas ordinary income constitutes less than 10 percent of the consolidated ordinary income.
Three months ended December 31, 2009 (October 1 to December 31, 2009)
Information on overseas sales is omitted because the overseas ordinary income constitutes less than 10 percent of the consolidated ordinary income.
Table of Contents
(Per share information)
Three months ended December 31, 2008 (October 1 to December 31, 2008) | Three months ended December 31, 2009 (October 1 to December 31, 2009) | |||||
Net income (loss) per share—Basic | (23.69) yen | Net income (loss) per share—Basic | (8.06) yen | |||
Notes)
| 1 | Diluted net income per share is not shown due to basic net loss per share. |
| 2 | Calculation of basic net income (loss) per share is based on the following figures. |
| (Millions of yen) | ||||||
| Three months ended December 31, 2008 (October 1 to December 31, 2008) | Three months ended December 31, 2009 (October 1 to December 31, 2009) | |||||
Net income (loss) | (23,329 | ) | (7,943 | ) | ||
Net income (loss) not attributable to common stockholders | — | — | ||||
Net income (loss) attributable to common stocks | (23,329 | ) | (7,943 | ) | ||
Average number of common stocks | thousand shares 984,534 | | thousand shares 984,622 | | ||
(2) Others
None.
Table of Contents
Part 2: Information on party(ies) providing guaranty to the Reporting Company
(Omitted.)
Table of Contents
Note Regarding Forward-looking Statements
This document includes “forward-looking statements” that reflect the information in relation to the SOMPO JAPAN INSURANCE INC. (“Sompo Japan”). To the extent that statements in this document do not relate to historical or current facts, they constitute forward-looking statements. These forward-looking statements are based on the current assumptions and beliefs of Sompo Japan in light of the information currently available to it, and involve known and unknown risks, uncertainties and other factors. Such risks, uncertainties and other factors may cause the actual results, performance, achievements or financial position of Sompo Japan to be materially different from any future results, performance, achievements or financial position expressed or implied by these forward-looking statements. We undertake no obligation to publicly update any forward-looking statements after the date of this document. Investors are advised to consult any further disclosures by Sompo Japan in their subsequent domestic filings in Japan and filings with, or submissions to, the U.S. Securities Exchange Commission pursuant to the U.S. Securities Exchange Act of 1934.
The risks, uncertainties and other factors referred to above include, but are not limited to, those below. The risks, uncertainties and other factors are also referred to in our domestic Annual Securities Reports and Quarterly Securities Reports.
| (1) | Effects of deterioration of economic and business conditions in Japan |
| (2) | Effects of intensified competition in the non-life insurance business |
| (3) | Changes to laws and systems |
| (4) | Risk of natural disasters |
| (5) | Occurrence of unpredictable damages |
| (6) | Reinsurance risk |
| (7) | Overseas business risk |
| (8) | Life insurance business risk |
| (9) | Effects of declining stock price |
| (10) | Effects of fluctuation in exchange rate |
| (11) | Effects of fluctuation in interest rate |
| (12) | Liquidity risk |
| (13) | Effects of decline in creditworthiness of investment and/or loan counterparties |
| (14) | Credit rating downgrade |
| (15) | Litigation risk |
| (16) | Occurrence of personal information leak |
| (17) | Risk concerning business integration |
| (18) | Other risks |