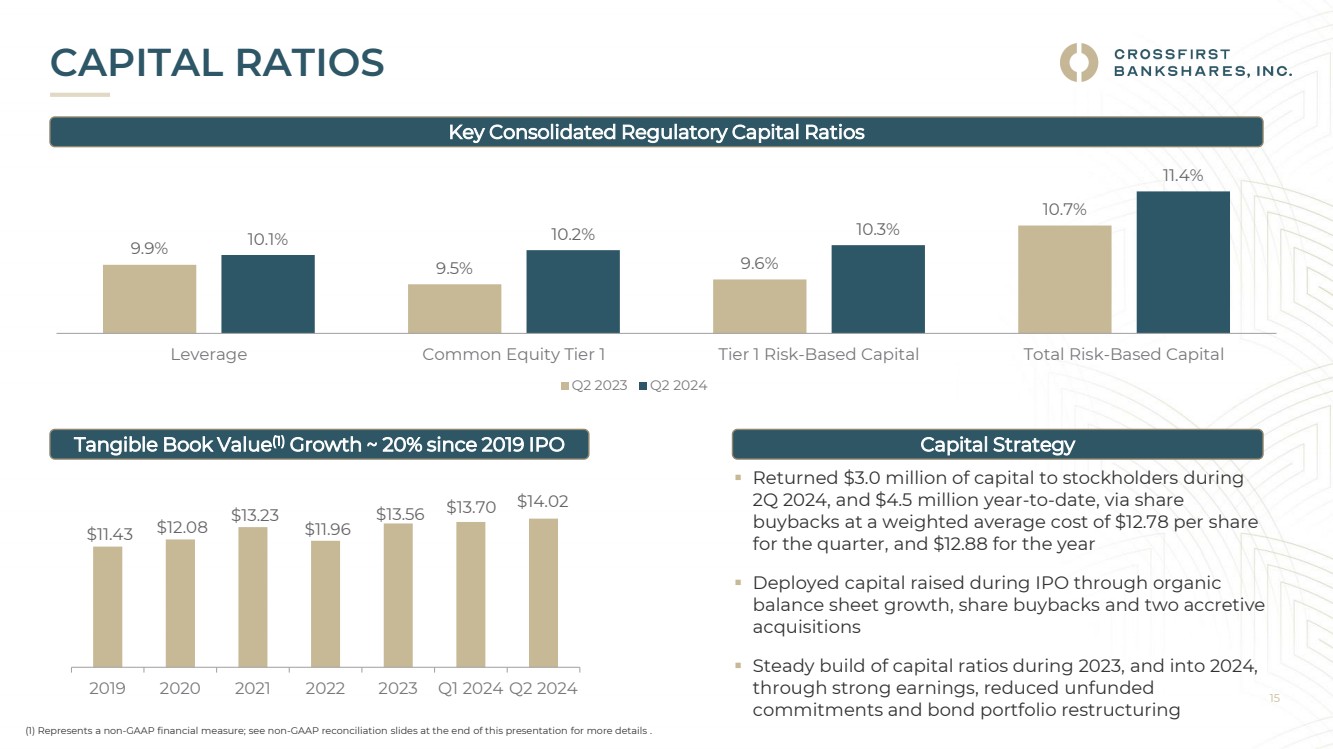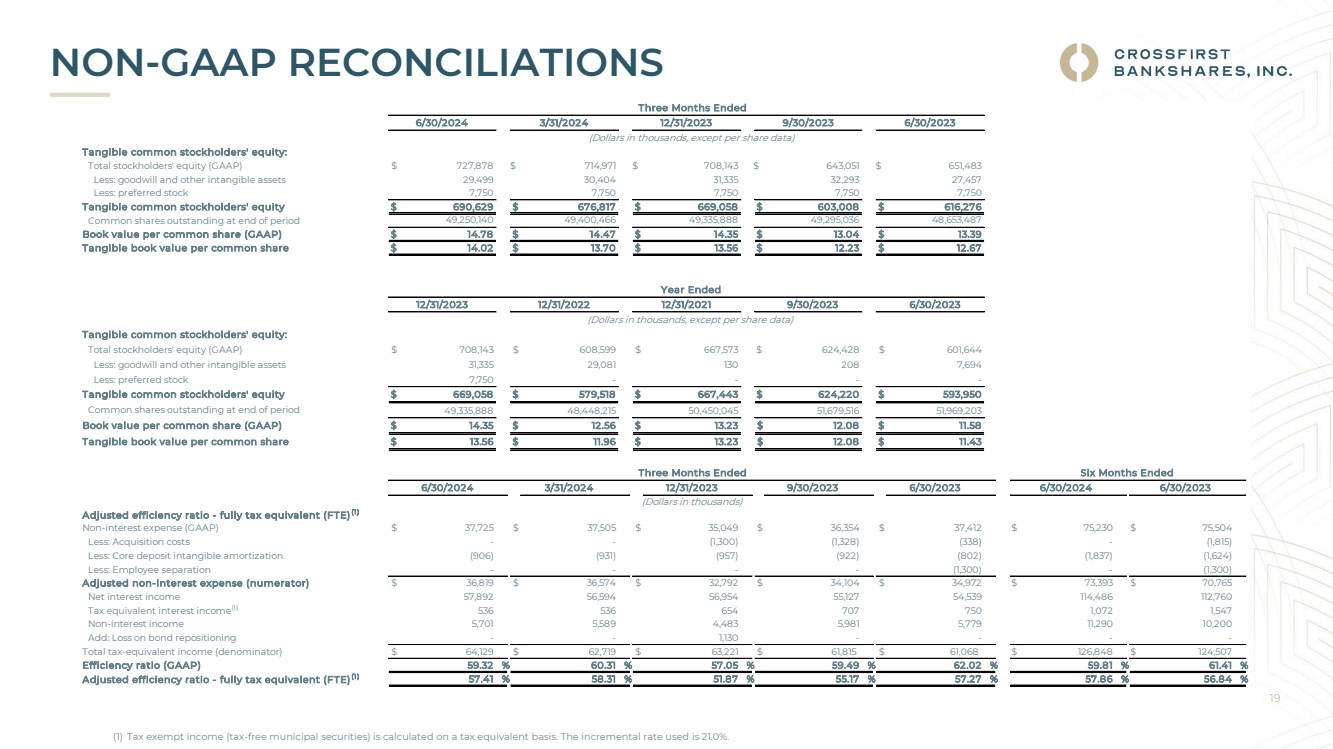
| 19 NON-GAAP RECONCILIATIONS (1) Tax exempt income (tax-free municipal securities) is calculated on a tax equivalent basis. The incremental rate used is 21.0%. Tangible common stockholders' equity: Total stockholders' equity (GAAP) $ 727,878 $ 714,971 $ 708,143 $ 643,051 $ 651,483 Less: goodwill and other intangible assets 29,499 30,404 31,335 32,293 27,457 Less: preferred stock 7,750 7,750 7,750 7,750 7,750 Tangible common stockholders' equity $ 690,629 $ 676,817 $ 669,058 $ 603,008 $ 616,276 Common shares outstanding at end of period 49,250,140 49,400,466 49,335,888 49,295,036 48,653,487 Book value per common share (GAAP) $ 14.78 $ 14.47 $ 14.35 $ 13.04 $ 13.39 Tangible book value per common share $ 14.02 $ 13.70 $ 13.56 $ 12.23 $ 12.67 9/30/2023 6/30/2023 Tangible common stockholders' equity: Total stockholders' equity (GAAP) $ 708,143 $ 608,599 $ 667,573 $ 624,428 $ 601,644 Less: goodwill and other intangible assets 31,335 29,081 130 208 7,694 Less: preferred stock 7,750 - - - - Tangible common stockholders' equity $ 669,058 $ 579,518 $ 667,443 $ 624,220 $ 593,950 Common shares outstanding at end of period 49,335,888 48,448,215 50,450,045 51,679,516 51,969,203 Book value per common share (GAAP) $ 14.35 $ 12.56 $ 13.23 $ 12.08 $ 11.58 Tangible book value per common share $ 13.56 $ 11.96 $ 13.23 $ 12.08 $ 11.43 6/30/2024 3/31/2024 12/31/2023 9/30/2023 6/30/2023 6/30/2024 6/30/2023 Adjusted efficiency ratio - fully tax equivalent (FTE)(1 ) Non-interest expense (GAAP) $ 37,725 $ 37,505 $ 35,049 $ 36,354 $ 37,412 $ 75,230 $ 75,504 Less: Acquisition costs - - (1,300) (1,328) (338) - (1,815) Less: Core deposit intangible amortization (906) (931) (957) (922) (802) (1,837) (1,624) Less: Employee separation - - - - (1,300) - (1,300) Adjusted non-interest expense (numerator) $ 36,819 $ 36,574 $ 32,792 $ 34,104 $ 34,972 $ 73,393 $ 70,765 Net interest income 57,892 56,594 56,954 55,127 54,539 114,486 112,760 Tax equivalent interest income(1) 536 536 654 707 750 1,072 1,547 Non-interest income 5,701 5,589 4,483 5,981 5,779 11,290 10,200 Add: Loss on bond repositioning - - 1,130 - - - - Total tax-equivalent income (denominator) $ 64,129 $ 62,719 $ 63,221 $ 61,815 $ 61,068 $ 126,848 $ 124,507 Efficiency ratio (GAAP) 59.32 % 60.31 % 57.05 % 59.49 % 62.02 % 59.81 % 61.41 % Adjusted efficiency ratio - fully tax equivalent (FTE)(1 ) 57.41 % 58.31 % 51.87 % 55.17 % 57.27 % 57.86 % 56.84 % 12/31/2023 9/30/2023 6/30/2023 Six Months Ended Three Months Ended (Dollars in thousands, except per share data) (Dollars in thousands, except per share data) Three Months Ended 6/30/2024 3/31/2024 Year Ended 12/31/2023 12/31/2022 12/31/2021 (Dollars in thousands) |