
Exhibit 99.2
CROSSFIRST BANKSHARES, INC. NASDAQ: CFB 3rd Quarter 2022 Earnings Presentation October 18, 2022
Legal disclaimer CROSSFIRST BANKSHARES, INC. FORWARD -LOOKING STATEMENTS. The financial results in this presentation reflect preliminary, unaudited results, which are not final until the Company’s Quarterly Report on Form 10 -Q is filed. This presentation and oral statements made during this meeting contain forward-looking statements. These forward- looking statements reflect our current views with respect to, among other things, future events and our financial performance . These forward-looking statements include, but are not limited to, statements regarding our business plans, the acquisition of Central,* expansion targets and opportunities, and future financial performance. These statements are often, but not always, made through the use of words or phrases such as "positioning," "would," "could," "optimistic," "potential," "believe," "expect," "will make," "will," "anticipate," "looking forward," "growth," "intend," "plan," "position," "future," "goal," "target," "focus," "uncertainty,“ “strategy,” and "assuming" or the negative version of those words or other comparable words or phrases of a future or forward-looking nature. These forward -looking statements are not historical facts, and are based on current expectations, estimates and projections about our industry, management’s beliefs and certain assumptions made by management, many of which, by their nature, are inherently uncertain and beyond our control. Accordingly, we caution you that any such forward -looking statements are not guarantees of future performance and are subject to risks, assumptions, estimates and uncertainties that are difficult to predict. Although we believe that the expectations reflected in these forward-looking statements are reasonable as of the date made, actual results may prove to be materially different from the results expressed or implied by the forward-looking statements. There are or will be
important factors that could cause our actual results to differ materially from those indicated in these forward-looking statements, including, but not limited to, the following: risks relating to the ongoing COVID-19 pandemic; risks related to general business and economic conditions and any regulatory responses to such conditions; our ability to effectively execute our growth strategy and manage our growth, including identifying and consummating suitable mergers and acquisitions; the geographic concentration of our markets; fluctuation of the fair value of our investment securities due to factors outside our control; our ability to successfully manage our credit risk and the sufficiency of our allowance; regulatory restrictions on our ability to grow due to our concentration in commercial real estate lending; our ability to attract, hire and retain key personnel; interest rate fluctuations; our ability to raise or maintain sufficient capital; competition from banks, credit unions and other financial services providers; the effectiveness of our risk management framework in mitigating risks and losses; our ability to maintain effective internal control over financial reporting; our ability to keep pace with technological changes; system failures and interruptions, cyber-attacks and security breaches; employee error, fraudulent activity by employees or clients and inaccurate or incomplete information about our clients and counterparties; our ability to maintain our reputation; costs and effects of litigation, investigations or similar matters; risk exposure from transactions with financial counterparties; compliance with governmental and regulatory requirements; and changes in the laws, rules, regulations, interpretations or policies relating to financial institutions, accounting, tax, trade, monetary and fiscal matters. These and other factors that could cause results to differ materially from those described in the forward -looking
statements, as well as a discussion of the risks and uncertainties that may affect our business, can be found in our Annual Report on Form 10-K, our Quarterly Reports on Form 10-Q and in other filings we make with the Securities and Exchange Commission. These forward-looking statements are made as of the date of this communication, and we disclaim any obligation to update any forward -looking statement or to publicly announce the results of any revisions to any of the forward-looking statements included herein, except as required by law. MARKET AND INDUSTRY DATA. This presentation references certain market, industry and demographic data, forecasts and other statistical information. We have obtained this data, forecasts and information from various independent, third party industry sources and publications. Nothing in the data, forecasts or information used or derived from third party sources should be construed as advice. Some data and other information are also based on our good faith estimates, which are derived from our review of industry publications and surveys and independent sources. We believe that these sources and estimates are reliable but have not independently verified them. Statements as to our market position are based on market data currently available to us. Although we are not aware of any misstatements regarding the economic, employment, industry and other market data presented herein, these estimates involve inherent risks and uncertainties and are based on assumptions that are subject to change. * CrossFirst announced its plans to acquire Farmers & Stockmens Bank (“Central”) on June 13, 2022. The closing of the merger is subject to regulatory approval. 2
About non-gaap financial measures CROSSFIRST BANKSAHRES, INC. Certain of the financial measures and ratios we present, including “tangible common stockholders’ equity”, “tangible book value per share”, “non-GAAP core operating income”, “non-GAAP core operating return on average assets”, “non-GAAP loan growth, excluding PPP loans” and “non-GAAP core operating efficiency ratio – fully tax equivalent (FTE)” metrics, are supplemental measures that are not required by, or are not presented in accordance with, U.S. generally accepted accounting principles (GAAP). We refer to these financial measures and ratios as “non-GAAP financial measures.” We consider the use of select non-GAAP financial measures and ratios to be useful for financial and operational decision making and useful in evaluating period-to-period comparisons. We believe that these non-GAAP financial measures provide meaningful supplemental information regarding our performance by excluding certain expenditures or assets that we believe are not indicative of our primary business operating results or by presenting certain metrics on a fully taxable equivalent basis. We believe that management and investors benefit from referring to these non-GAAP financial measures in assessing our performance and when planning, forecasting, analyzing and compari ng past, present and future periods. These non-GAAP financial measures should not be considered a substitute for financial information presented in accordance with GAAP and you should not rely on non-GAAP financial measures alone as measures of our performance. The non-GAAP financial measures we present may differ from non-GAAP financial measures used by our peers or other companies. We compensate for these limitations by providing the equivalent GAAP measures whenever we present the non-GAAP financial measures and by including a
reconciliation of the impact of the components adjusted for in the non -GAAP financial measure so that both measures and the individual components may be considered when analyzing our performance. CrossFirst does not provide a reconciliation of forward-looking non-GAAP financial measures to its comparable GAAP financial measures because it could not do so without unreasonable effort due to the unavailability of the information needed to calculate reconciling items and the variability, complexity and limited visibility of the adjusting items that would be excluded from the non-GAAP financial measures in future periods. When planning, forecasting and analyzing future periods, CrossFirst does so primarily on a non-GAAP basis without preparing a GAAP analysis as that would require estimates for various cash and non-cash reconciling items (including items such as expected credit losses, acquisition - and disposition-related expenses, and restructuring costs) that would be difficult to predict with reasonable accuracy. For example, future expectations for credit losses depend on a variety of factors including general economic conditions that make estimation on a GAAP basis impractical. It is also difficult to anticipate the need for or magnitude of presently unforeseen one-time restructuring expenses. As a result, CrossFirst does not believe that a GAAP reconciliation to forward-looking non-GAAP financial measures would provide meaningful supplemental information about CrossFirst’s forward-looking measures. 3
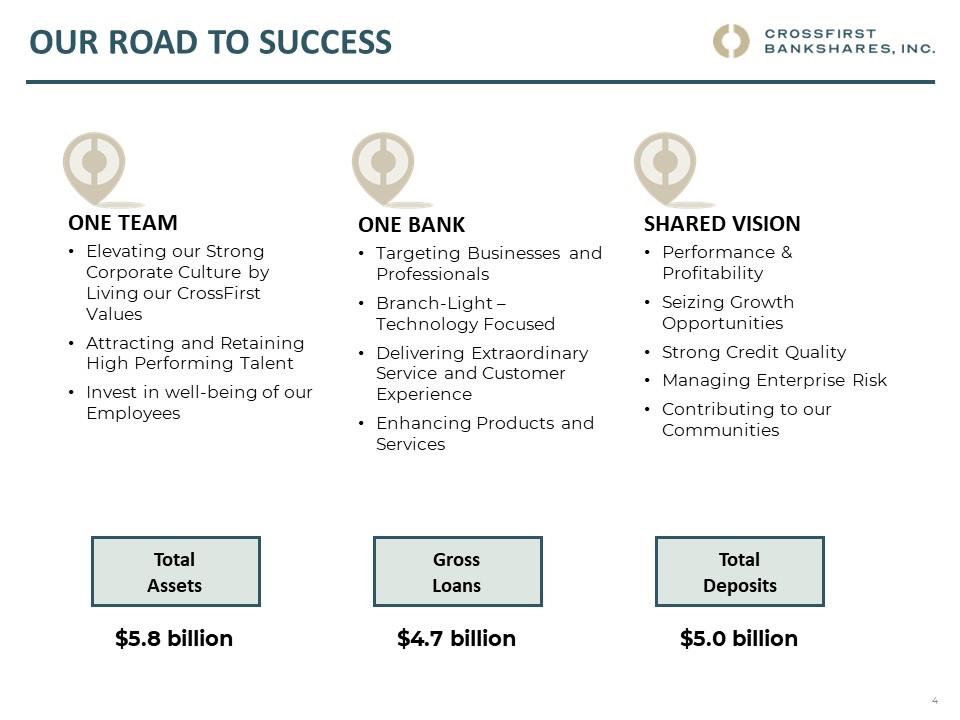
Our Road to Success CROSSFIRST BANKSAHRES, INC. ONE TEAM Elevating our Strong Corporate Culture by Living our CrossFirst Values Attracting and Retaining High Performing Talent Invest in well-being of our Employees Total Assets $5.8 billion ONE BANK Targeting Businesses and Professionals Branch-Light – Technology Focused Delivering Extraordinary Service and Customer Experience Enhancing Products and Services Gross Loans $4.7 billion SHARED VISION Performance & Profitability Seizing Growth Opportunities Strong Credit Quality Managing Enterprise Risk Contributing to our Communities Total Deposits $5.0 billion 4
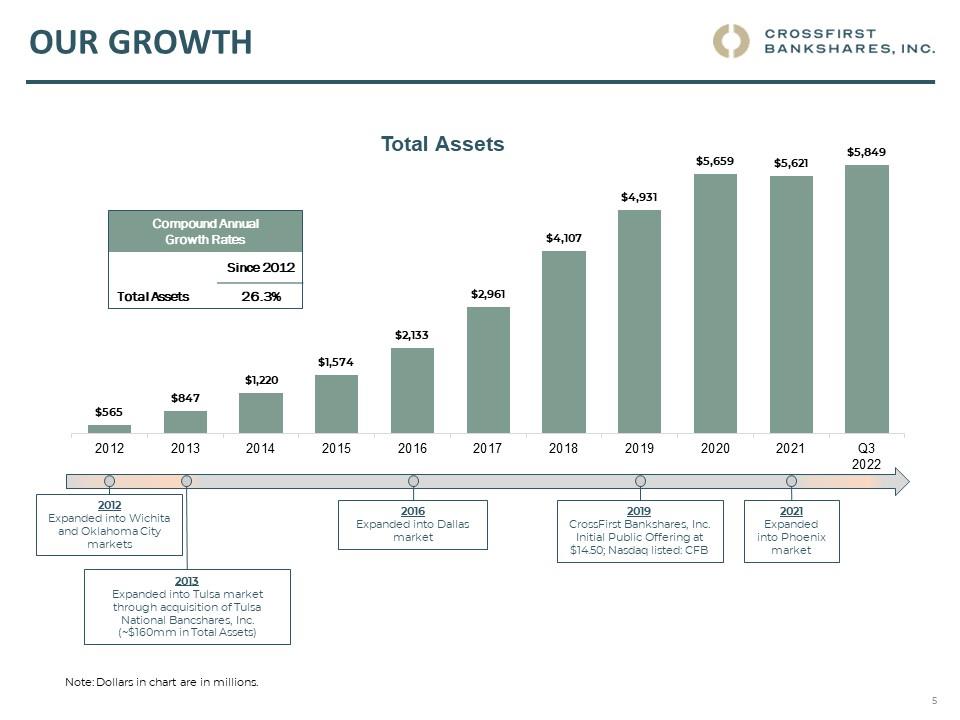
Our Growth CROSSFIRST BANKSAHRES, INC. Total Assets Compound Annual Growth Rates Since 2012 Total Assets 26.3% $565 $847 $1,120 $1,574 $2,133 $2,961 $4,107 $4,931 $5,659 $5,621 $5,849 2012 2013 2014 2015 2016 2017 2018 2019 2020 2021 Q3 2022 2012 Expanded into Wichita and Oklahoma City markets 2013 Expanded into Tulsa market through acquisition of Tulsa National Bancshares, Inc. (~$160mm in Total Assets) 2016 Expanded into Dallas market 2019 CrossFirst Bankshares, Inc. Initial Public Offering at $14.50; Nasdaq listed: CFB 2021 Expanded into Phoenix market Note: Dollars in chart are in millions. 5
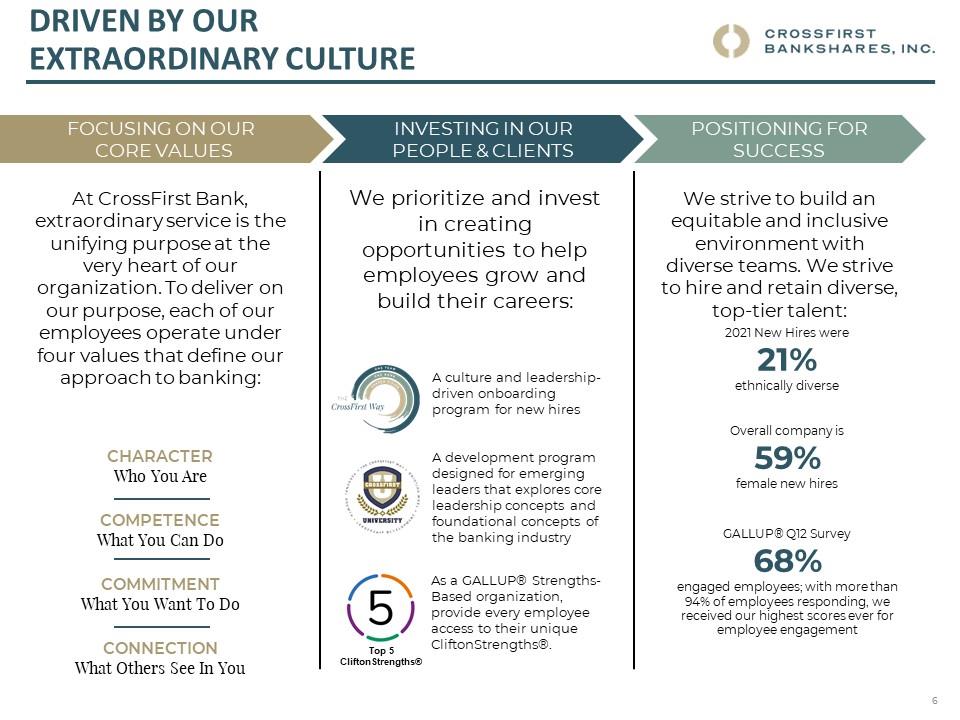
DRIVEN BY OUR EXTRAORDINARY CULTURE CROSSFIRST BANKSHARES, INC. FOCUSING ON OUR CORE VALUES At CrossFirst Bank, extraordinary service is the unifying purpose at the very heart of our organization. To deliver on our purpose, each of our employees operate under four values that define our approach to banking: CHARACTER Who You Are COMPETENCE What You Can Do COMMITMENT What You Want To Do CONNECTION What Others See In You INVESTING IN OUR PEOPLE & CLIENTS We prioritize and invest in creating opportunities to help employees grow and build their careers: A culture and leadership-driven onboarding program for new hires A development program designed for emerging leaders that explores core leadership concepts and foundational concepts of the banking industry As a GALLUP® Strengths-Based organizati on, provide every employee access to their unique CliftonStrengths®. POSITIONING FOR SUCCESS We strive to build an equitable and inclusive environment with diverse teams. We strive to hire and retain diverse, top-tier talent: 2021 New Hires were 21% ethnically diverse Overall company is 59% female new hires GALLUP® Q12 Survey 68% engaged employees; with more than 94% of employee s responding, we received our highest scores ever for employee engagement 6

EXPANDING OUR FOOTPRINT CROSSFIRST BANKSHARES, INC. AREAS OF FOCUS Continue to execute our organic growth strategy in new and existing markets Focus new expansion in target markets where we currently have client business Evaluate expansion strategies in key target markets: De Novo Expansion: Hire experien ced talent to expand in key growth markets Strategic Acquisition*: Provides operational scale and synergies Adds new lines of business Adds fee income opportunities CURRENT AND POTENTIAL TARGET MARKETS Austin, Texas Houston, Texas San Antonio, Texas Nashville, Tennessee Omaha, Nebraska Legend: Current CFB Location Planned CFB Location* Target CFB Locations * Anticipated benefits as transaction closing is subject to regulatory approval. 7
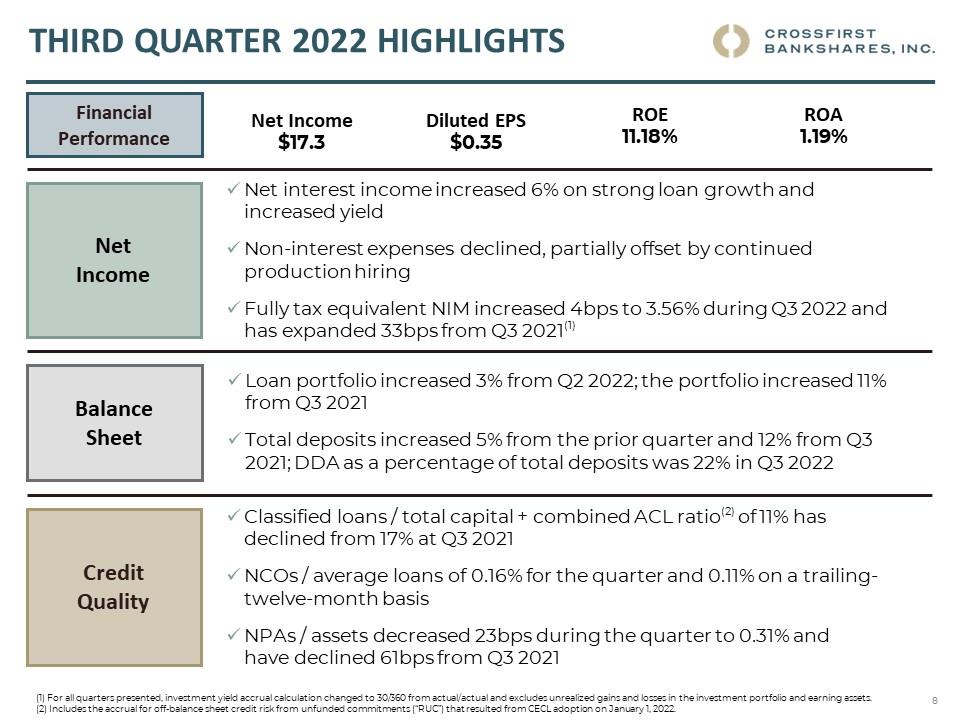
THIRD Quarter 2022 Highlights CROSSFIRST BANKSAHRES, INC. Financial Performance Net Income $17.3 Diluted EPS $0.35 ROE 11.18% ROA 1.19% Net Income Net interest income increased 6% on strong loan growth and increased yield Non-interest expenses declined, partially offset by continued production hiring Fully tax equivalent NIM increased 4bps to 3.56% during Q3 2022 and has expanded 33bps from Q3 2021(1) Balance Sheet Loan portfolio increased 3% from Q2 2022; the portfolio increased 11% from Q3 2021 Total deposits increased 5% from the prior quarter and 12% from Q3 2021; DDA as a percentage of total deposits was 22% in Q3 2022 Credit Quality Classified loans / total capital + combined ACL ratio(2) of 11% has declined from 17% at Q3 2021 NCOs / average loans of 0.16% for the quarter and 0.11% on a trailing-twelve-month basis NPAs / assets decreased 23bps during the quarter to 0.31% and have declined 61bps from Q3 2021 (1) For all quarters presented, investment yield accrual calculation changed to 30/360 from actual/actual and excludes unrealized gains and losses in the investment portfolio and earning assets. (2) Includes the accrual for off-balance sheet credit risk from unfunded commitments (“RUC”) that resulted from CECL adoption on January 1, 2022. 8
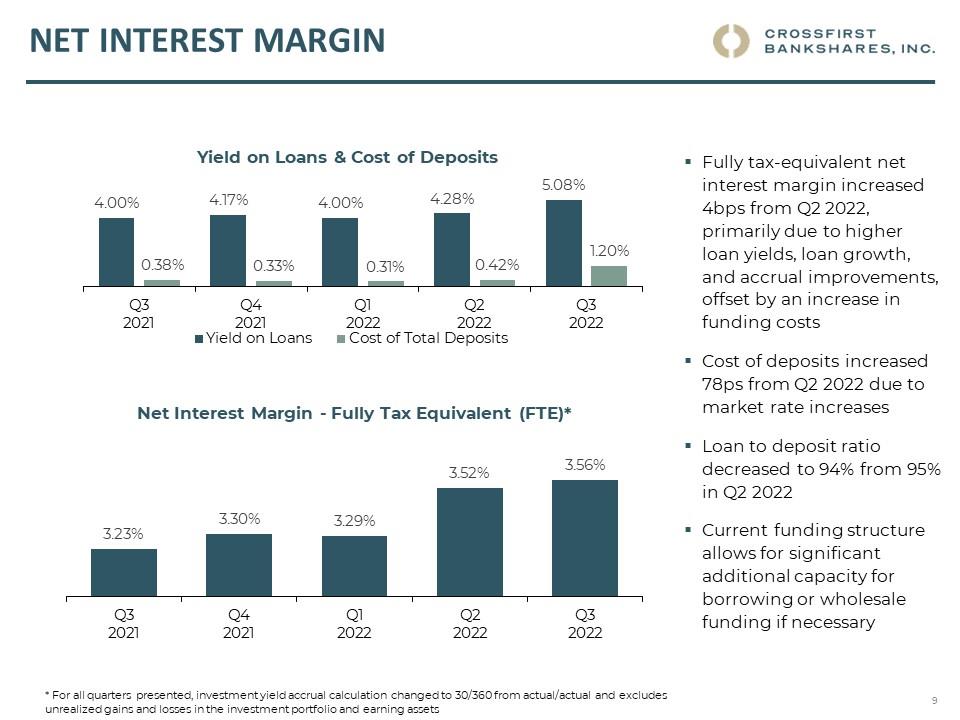
Net Interest Margin CROSSFIRST BANKSAHRES, INC. Yield on Loans & Cost of Deposits 4.00% 0.38% 4.17% 0.33% 4.00% 0.31% 4.28% 0.42% 5.08% 1.20% Q3 Q4 Q1 Q2 Q3 2021 2021 2022 2022 2022 Yield on Loans Cost of Total Deposits Net Interest Margin - Fully Tax Equivalent (FTE)* 2.30% 3.00% 3.29% 5.20% 3.56% Q3 Q4 Q1 Q2 Q3 2021 2021 2022 2022 2022 Fully tax-equivalent net interest margin increased 4bps from Q2 2022, primarily due to higher loan yields, loan growth, and accrual improvements, offset by an increase in funding costs Cost of deposits increased 78ps from Q2 2022 due to market rate increases Loan to deposit ratio decreased to 94% from 95% in Q2 2022 Current funding structure allows for significant additional capacity for borrowing or wholesale funding if necessary * For all quarters presented, investment yield accrual calculation changed to 30/360 from actual/actual and excludes unrealized gains and losses in the investment portfolio and earning assets 9
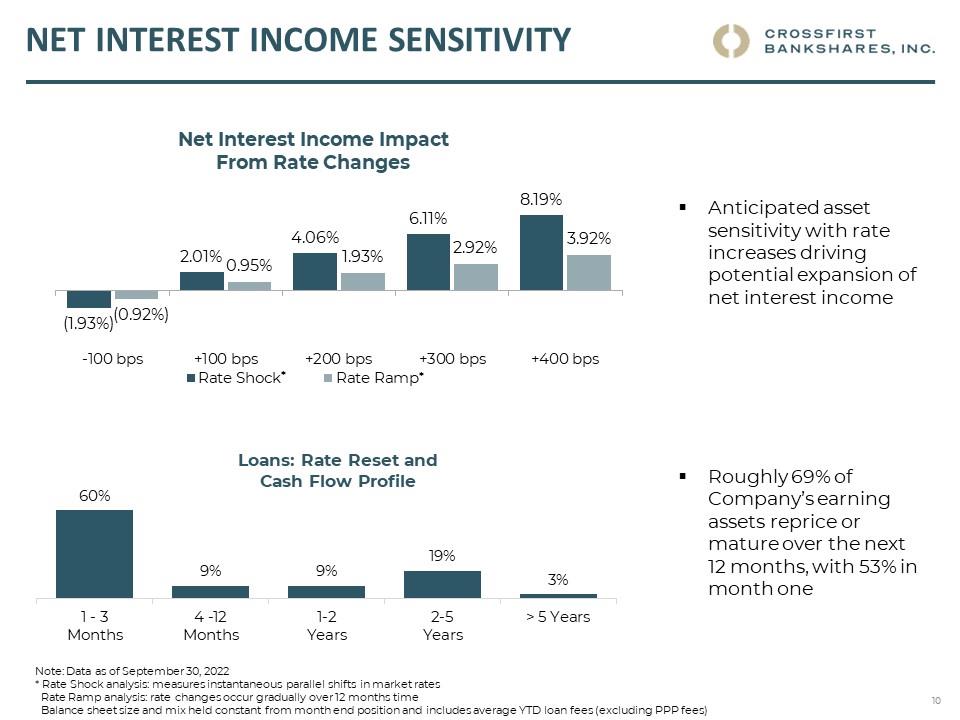
Net Interest Income Sensitivity CROSSFIRST BANKSAHRES, INC. Net Interest Income Impact From Rate Changes (1.93%) (0.92%) 0.20% 0.95% 4.06% 1.93% 6.11% 2.92% 8.19% 3.92% -100 pbs +100 bps +200 bps +300 bps +400 bps Rate Shock* Rate Ramp* Anticipated asset sensitivity with rate increases driving potential expansion of net interest income Loans: Rate Reset and Cash Flow Profile 60% 9% 9% 19% 3% 3-Jan 12-Apr 2-Jan 5-Feb >5 years Months Months Years Years Roughly 69% of Company’s earning assets reprice or mature over the next 12 months, with 53% in month one Note: Data as of September 30, 2022 * Rate Shock analysis: measures instantaneous parallel shifts in market rates Rate Ramp analysis: rate changes occur gradually over 12 months time Balance sheet size and mix held constant from month end position and includes average YTD loan fees (excluding PPP fees) 10
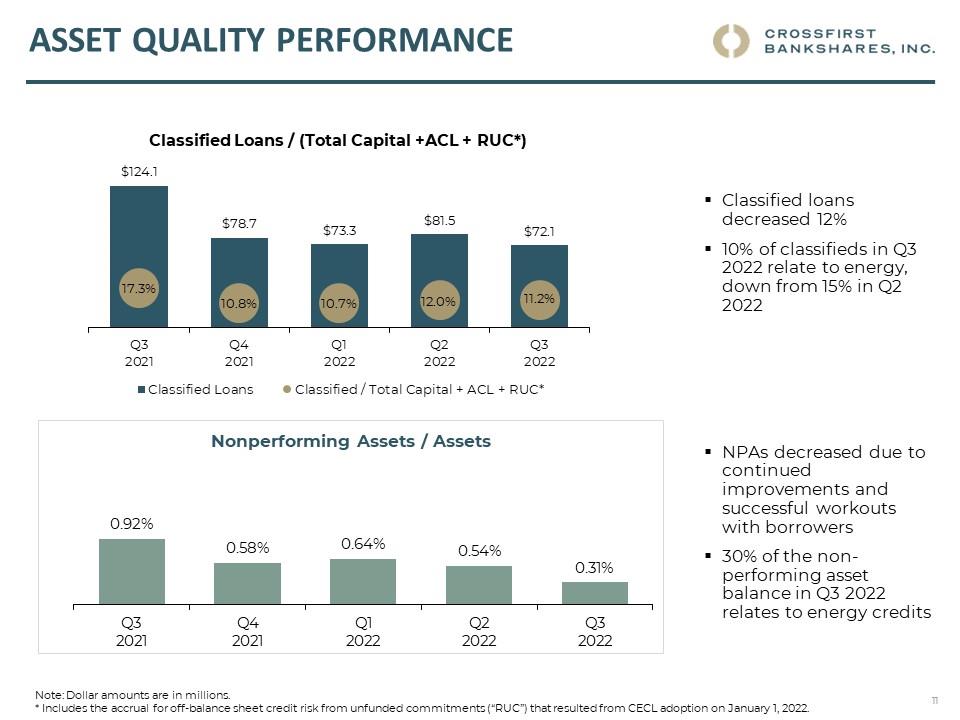
Asset Quality Performance CROSSFIRST BANKSHARES, INC. Classified Loans / (Total Capital +ACL + RUC*) $124.1 $78.7 $73.3 $81.5 $72.1 17.3% 10.8% 10.7% 12.0% 11.2% Q3 Q4 Q1 Q2 Q3 2021 2021 2022 2022 2022 Classified loans decreased 12% 10% of classifieds in Q3 2022 relate to energy, down from 15% in Q2 2022 Nonperforming Assets / Assets 0.92% 0.58% 0.64% 0.54% 0.31% Q3 Q4 Q1 Q2 Q3 2021 2021 2022 2022 2022 NPAs decreased due to continued improvements and successful workouts with borrowers 30% of the non-performing asset balance in Q3 2022 relates to energy credits Note: Dollar amounts are in millions. * Includes the accrual for off-balance sheet credit risk from unfunded commitments (“RUC”) that resulted from CECL adoption on January 1, 2022. 11
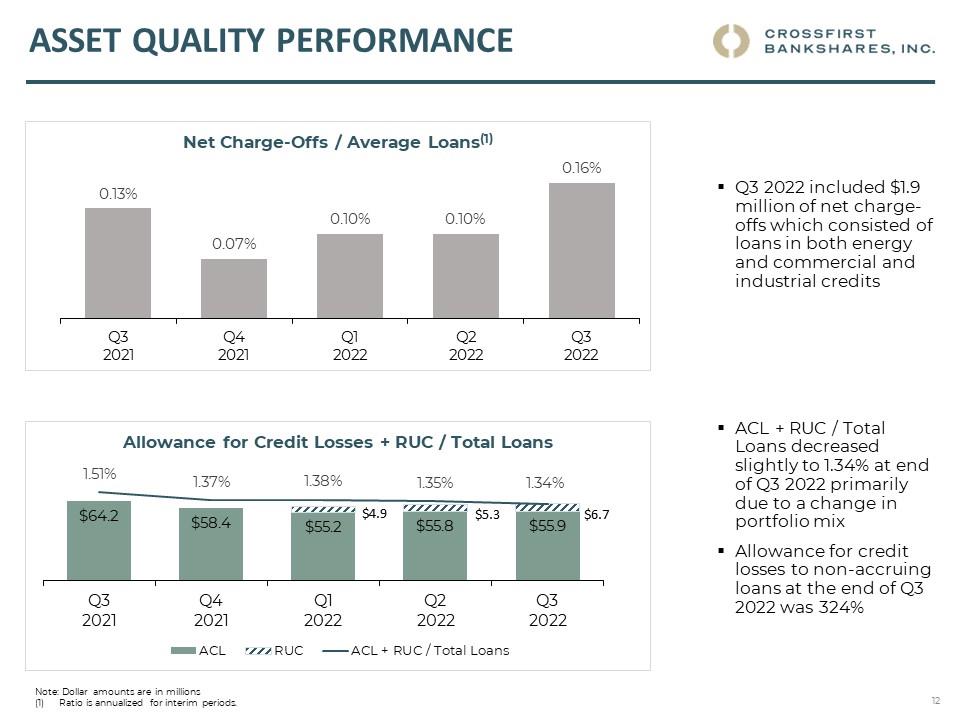
Asset Quality Performance CROSSFIRST BANKSAHRES, INC. Net Charge-Offs / Average Loans(1) 0.13% 0.07% 0.10% 0.10% 0.16% Q3 Q4 Q1 Q2 Q3 2021 2021 2022 2022 2022 Q3 2022 included $1.9 million of net charge-offs which consisted of loans in both energy and commercial and industrial credits Allowance for Credit Losses + RUC / Total Loans 1.51% 1.37% 1.38% 1.35% 1.34% $64.2 $58.4 $55.2 $4.9 $55.8 $5.3 $55.9 $6.7 Q3 Q4 Q1 Q2 Q3 2021 2021 2022 2022 2022 AcL RUC AcL + RUC / Total Loans ACL + RUC / Total Loans decreased slightly to 1.34% at end of Q3 2022 primarily due to a change in portfolio mix Allowance for credit losses to non-accruing loans at the end of Q3 2022 was 324% Note: Dollar amounts are in millions Ratio is annualized for interim periods. 12
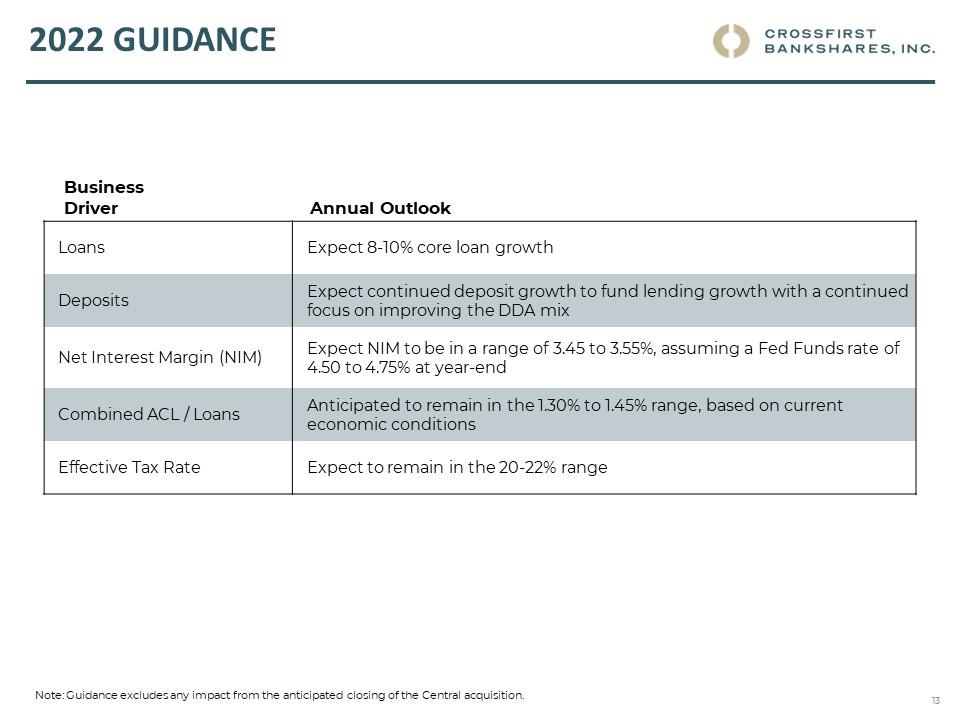
2022 Guidance CROSSFIRST BANKSHARES, INC. Business Driver Annual Outlook Loans Expect 8-10% core loan growth Deposits Expect continued deposit growth to fund lending growth with a continued focus on improving the DDA mix Net Interest Margin (NIM) Expect NIM to be in a range of 3.45 to 3.55%, assuming a Fed Funds rate of 4.50 to 4.75% at year-end Combined ACL / Loans Anticipated to remain in the 1.30% to 1.45% range, based on current economic conditions Effective Tax Rate Expect to remain in the 20-22% range Note: Guidance excludes any impact from the anticipated closing of the Central acquisition. 13
CROSSFIRST BANKSAHRES, INC. Supplemental information 14
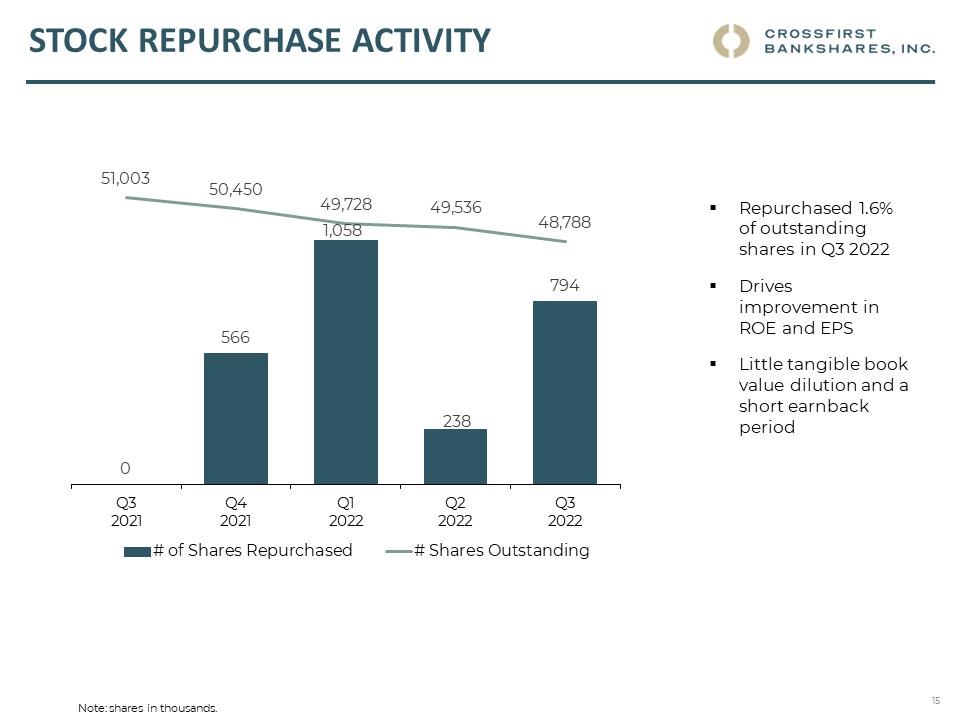
Stock Repurchase Activity CROSSFIRST BANKSAHRES, INC. 51,003 50,450 49,728 4,953 48,788 0 566 1058 238 794 Q3 Q4 Q1 Q2 Q3 2021 2021 2022 2022 2022 # of Shares Purchased # Shares Outstanding Repurchased 1.6% of outstanding shares in Q3 2022 Drives improvement in ROE and EPS Little tangible book value dilution and a short earnback period Note: shares in thousands. 15
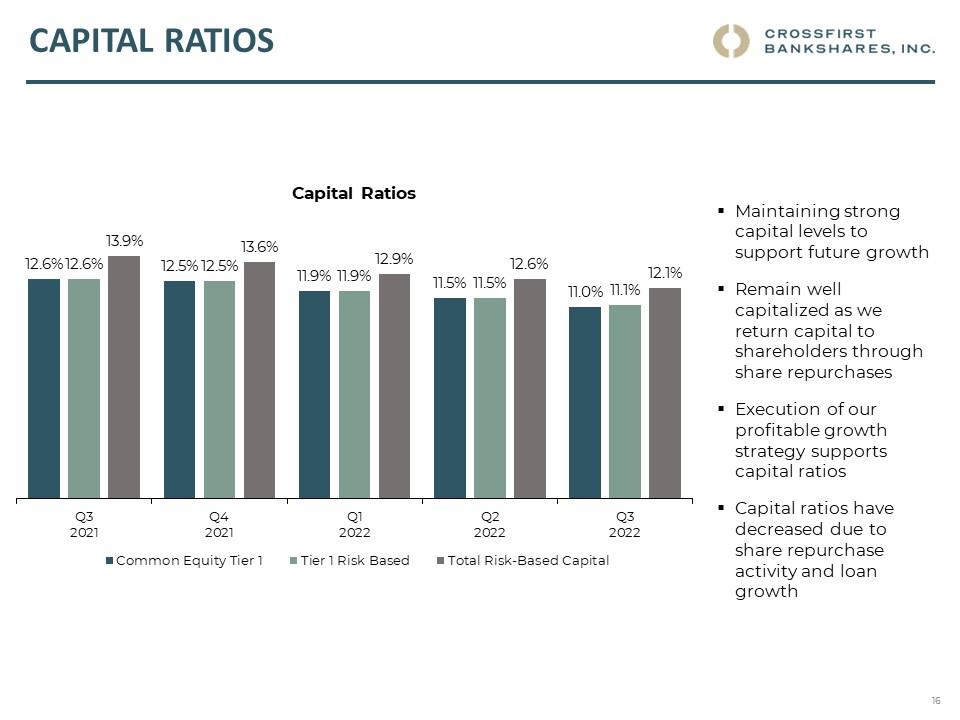
capital Ratios CROSSFIRST BANKSAHRES, INC. Capital Ratios 12.6% 12.6% 13.9% 12.5% 12.5% 13.6% 11.9% 11.9% 12.9% 11.5% 11.5% 12.6% 11.0% 11.1% 12.1% Q3 Q4 Q1 Q2 Q3 2021 2021 2022 2022 2022 Common Euqity Tear 1 Tier 1 Risk Based Total Risk-Baed Capital Maintaining strong capital levels to support future growth Remain well capitalized as we return capital to shareholders through share repurchases Execution of our profitable growth strategy supports capital ratios Capital ratios have decreased due to share repurchase activity and loan growth 16
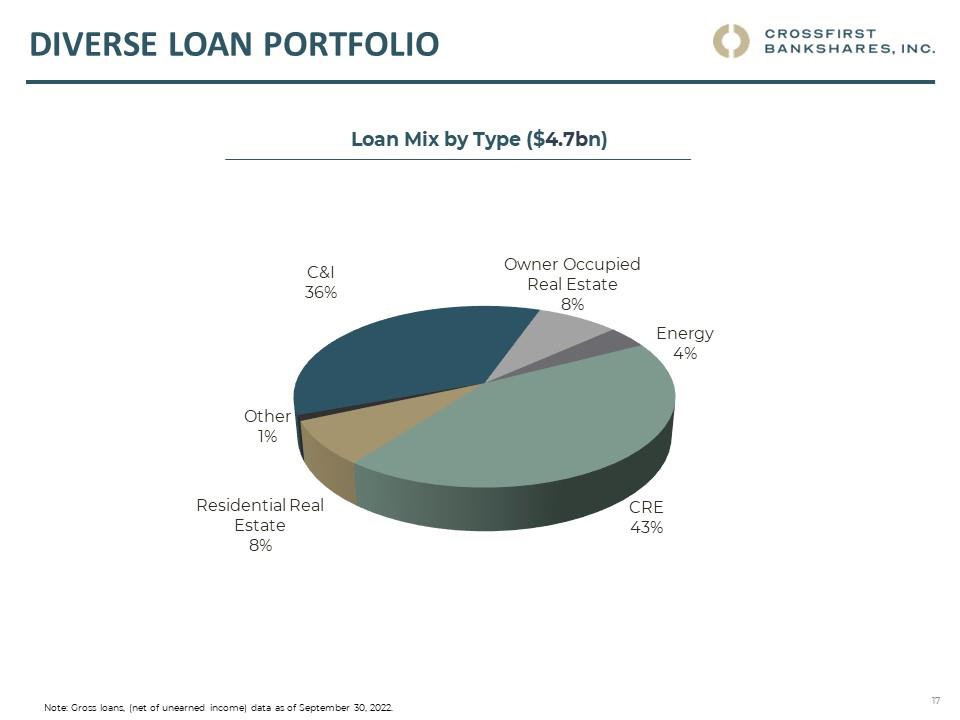
Diverse loan portfolio CROSSFIRST BANKSAHRES, INC. Loan Mix by Type ($4.7bn) Owner Occupied Real Estate 8% Energy 4% CRE 43% Residential Real Estate 8% Other 1% C&I 36% Note: Gross loans, (net of unearned income) data as of September 30, 2022. 17
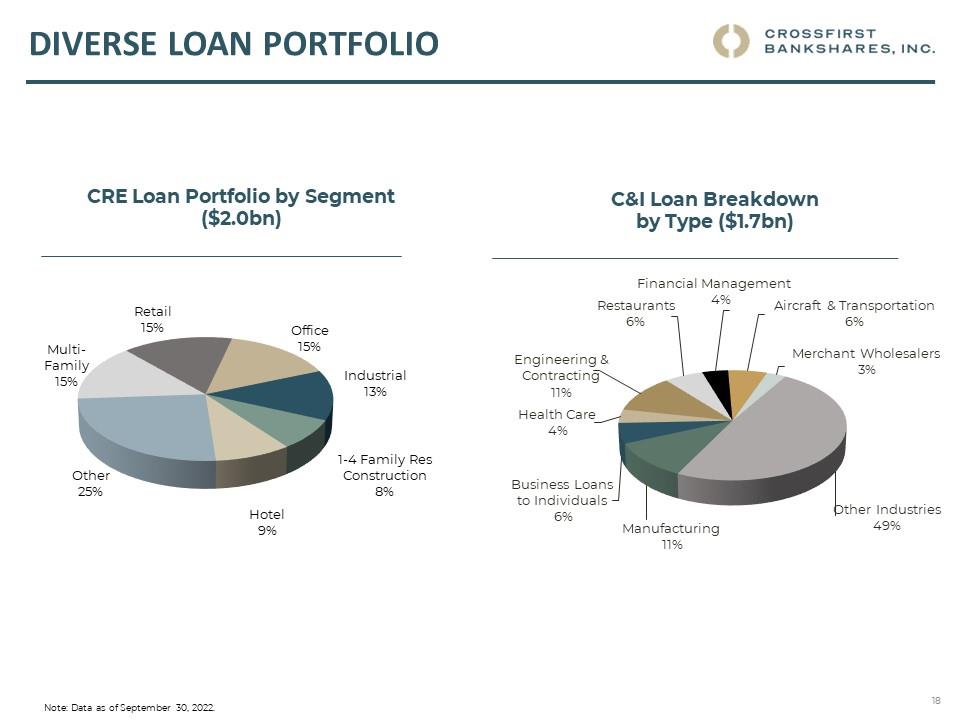
Diverse loan portfolio CROSSFIRST BANKSAHRES, INC. CRE Loan Portfolio by Segment ($2.0bn) Retail 15% Office 15% Industrial 13% 1-4 Family Res Construction 8% Hotel 9% Other 25% Multi -Family 15% C&I Loan Breakdown by Type ($1.7bn) Financial Management 4% Aircraft & Transportation 6% Merchant Wholesalers 3% Other Industries 49% Manufacturing 11% Business Loans to Individuals 6% Health Care 4% Engineering & Contracting 11% Restaurants 6% Note: Data as of September 30, 2022. 18
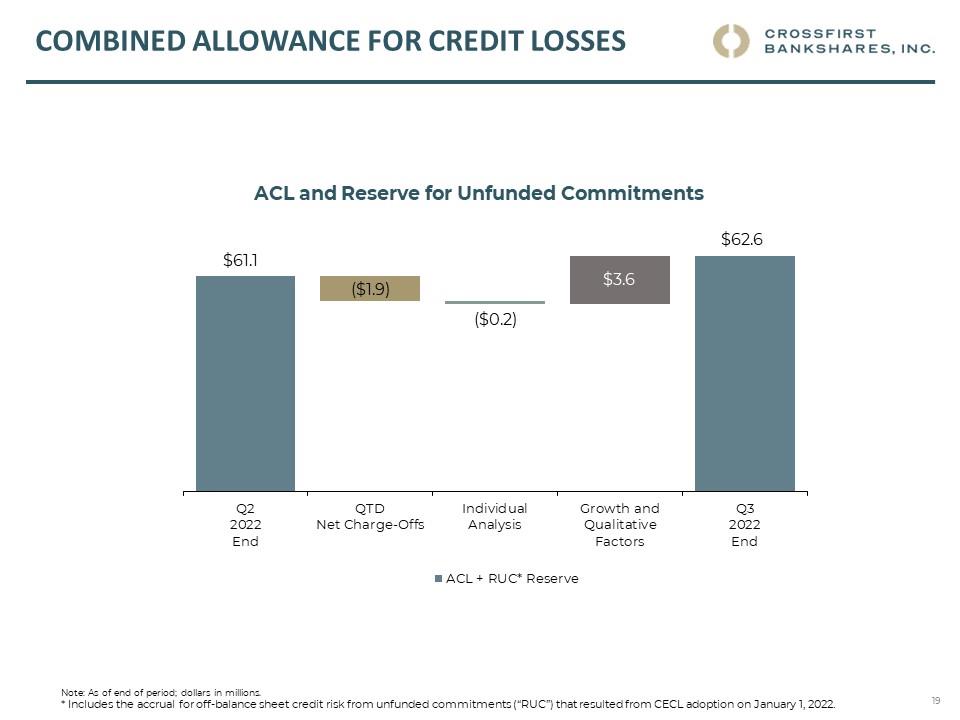
Combined Allowance for Credit Losses CROSSFIRST BANKSHARES, INC. ACL and Reserve for Unfunded Commitments $61.1 ($1.9) ($0.2) $3.6 $62.6 Q2 QTD Individual Growth and Q3 2022 Net Charge-Offs Analysis Qualitative Factors 2022 End #nd ALC + RUC*Reserve Note: As of end of period; dollars in millions. * Includes the accrual for off-balance sheet credit risk from unfunded commitments (“RUC”) that resulted from CECL adoption on January 1, 2022. 19
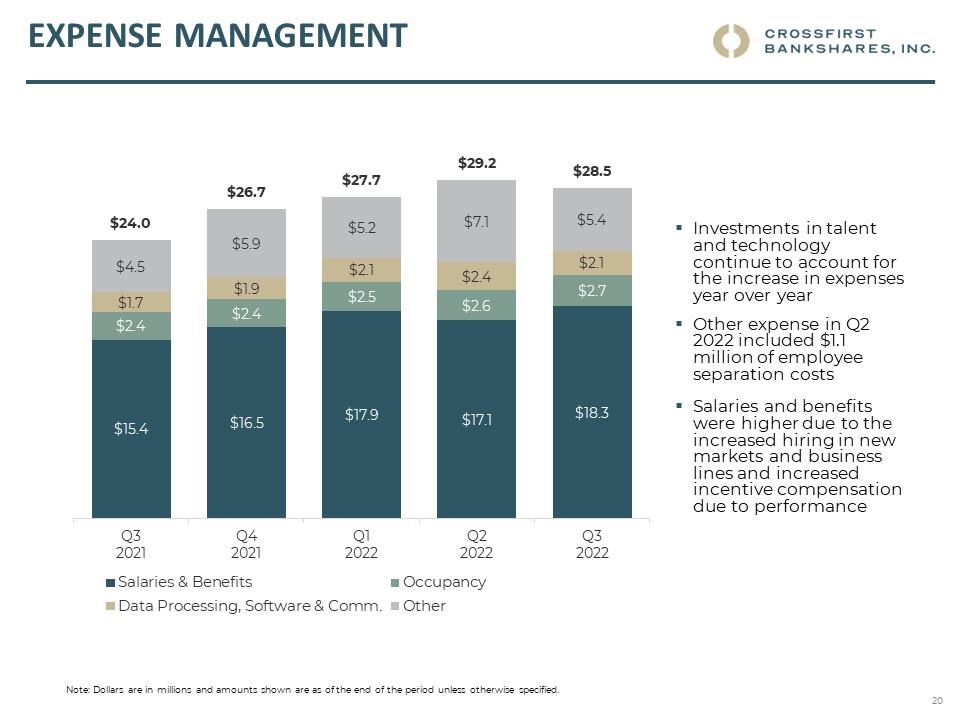
expense management CROSSFIRST BANKSHARES, INC. $24.0 $26.7 $27.7 $29.2 $28.5 $4.5 $5.9 $5.2 $7.1 $5.4 $1.7 $1.9 $2.1 $2.4 $2.1 $2.4 $2.4 $2.5 $2.6 $2.7 $15.4 $16.5 $17.9 $17.1 $18.3 Q3 Q4 Q1 Q2 Q3 2021 2021 2022 2022 2022 Salaries & Benefits Occupancy Data Processing, Software & Comm. Other Investments in talent and technology continue to account for the increase in expenses year over year Other expense in Q2 2022 included $1.1 million of employee separation costs Salaries and benefits were higher due to the increased hiring in new markets and business lines and increased incentive compensation due to performance Note: Dollars are in millions and amounts shown are as of the end of the period unless otherwise specified. 20
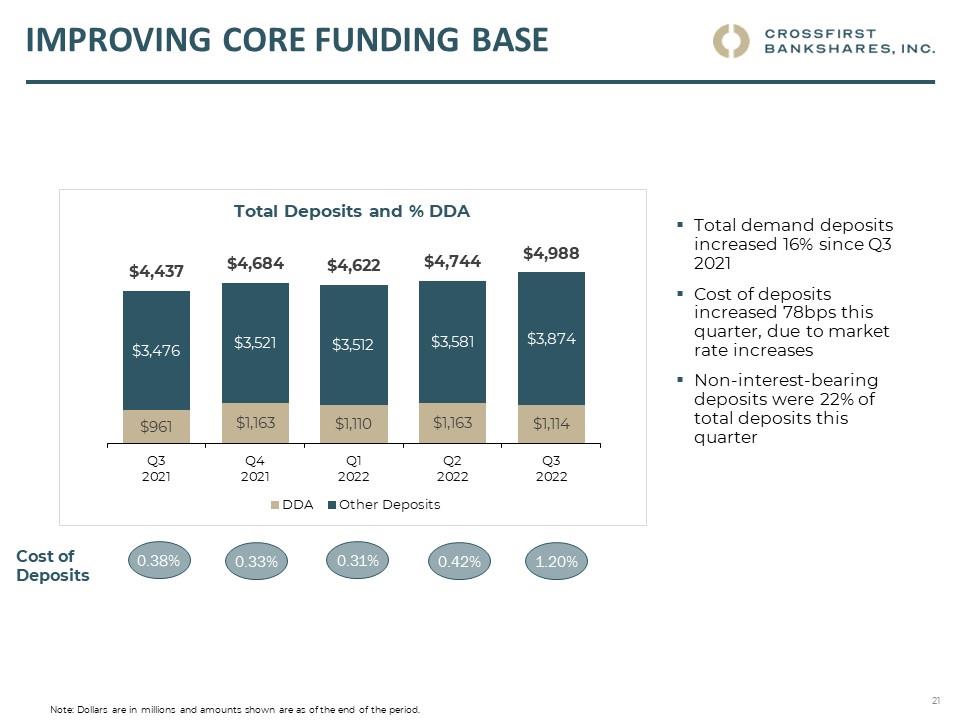
Improving Core Funding Base CROSSFIRST BANKSAHRES, INC. Total Deposits and % DDA $4,437 $4,684 $4,622 $4,744 $4,988 $3,476 $3,521 $3,512 $3,581 $3,874 $961 $1,163 $1,110 $1,163 $1,114 Q3 Q4 Q1 Q2 Q3 2021 2021 2022 2022 2022 DDA Other Deposits Cost of Deposits 0.38% 0.33% 0.31% 0.42% 1.20% Total demand deposits increased 16% since Q3 2021 Cost of deposits increased 78bps this quarter, due to market rate increases Non-interest-bearing deposits were 22% of total deposits this quarter Note: Dollars are in millions and amounts shown are as of the end of the period. 21
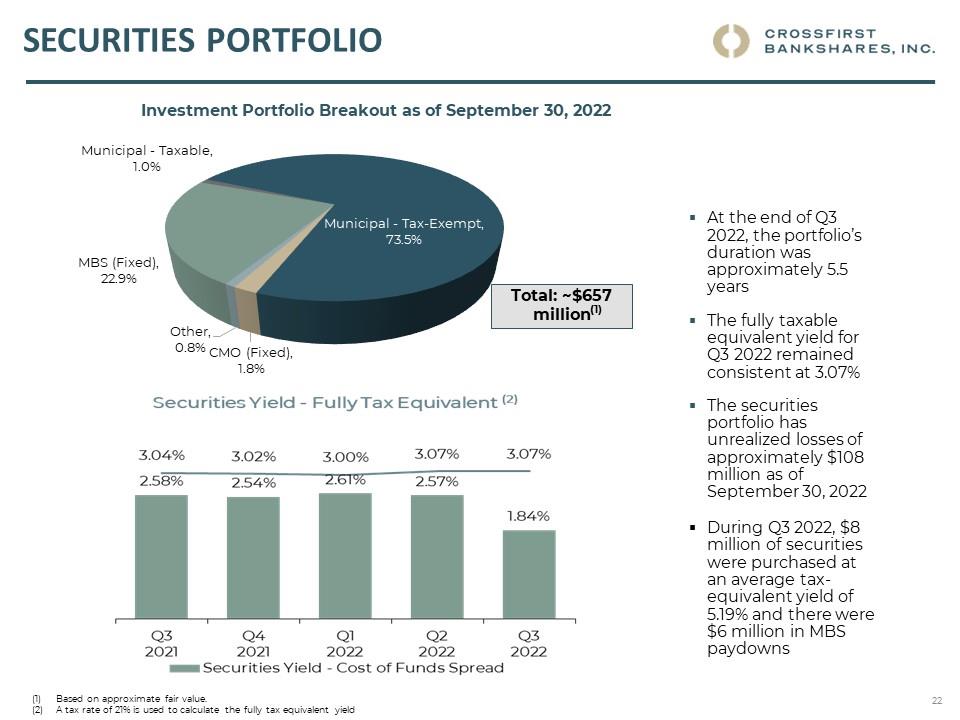
Securities portfolio CROSSFIRST BANKSHARES, INC. Investment Portfolio Breakout as of September 30, 2022 Municipal - Taxable, 1.0% Municipal - Tax-Exempt, 73.5% CMO (Fixed), 1.8% Other, 0.8% MBS (Fixed), 22.9% Total: ~$657 million At the end of Q3 2022, the portfolio’s duration was approximately 5.5 years The fully taxable equivalent yield for Q3 2022 remained consistent at 3.07% The securities portfolio has unrealized losses of approximately $108 million as of September 30, 2022 During Q3 2022, $8 million of securities were purchased at an average tax-equivalent yield of 5.19% and there were $6 million in MBS paydowns Securities Yield – Fully Tax Equivalent (2) 3.04% 3.02% 3.00% 3.07% 3.07% 2.58% 2.54% 2.61% 2.57% 1.84% Q3 Q4 Q1 Q2 Q3 2021 2021 2022 2022 2022 Securities Yield - Cost of Funds Spread Based on approximate fair value. A tax rate of 21% is used to calculate the fully tax equivalent yield 22
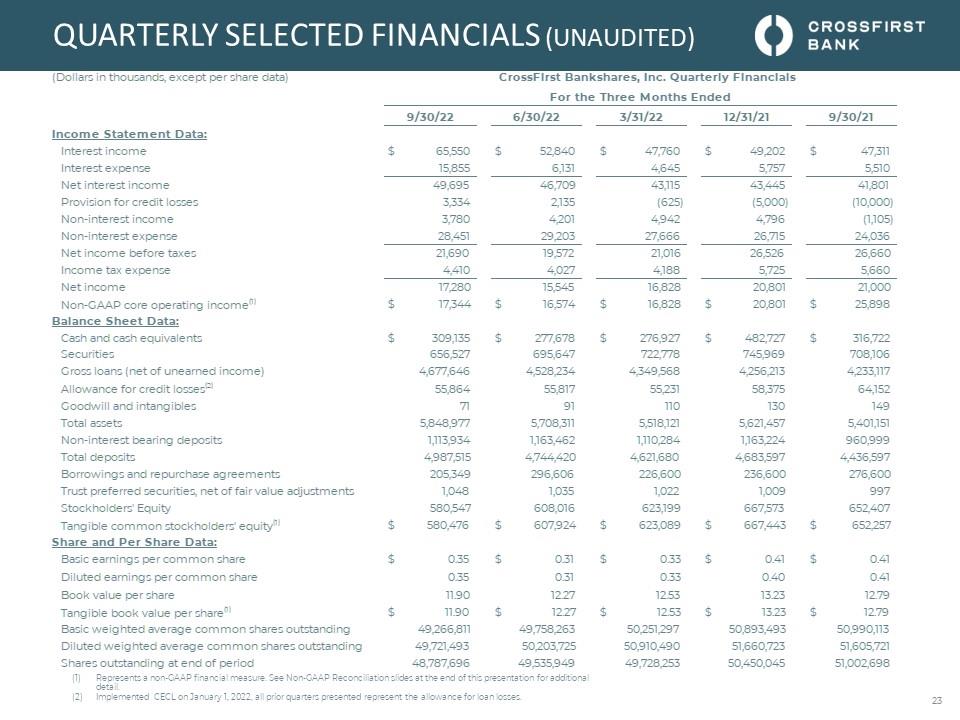
Quarterly selected financials (unaudited) CROSSFIRST BANKSAHRES, INC. (Dollar; in thousands except perchare data: CrossFIrst Bankshares, Inc. Quarterly Financials For the Three Months Ended 9/30/22 6/30/22 3/31/22 12/31/21 9/30/21 Income Statement Data: Interest income Interest expense s 65,550 15.855 s 52840 6131 s 47,760 4,645 s 49202 5757 s 475n 5510 Net interest income 49.695 46.709 43,115 43,445 41,801 Provision for credit losses 3354 2.155 (625) (5.000) (10.000) Non-interest income 3780 4201 4,942 4,796 0105) Non-interest expense 28.451 29203 27666 26.715 24.036 Net income before taxes 21690 19372 21016 26.526 26.660 Income tax expense 4,410 4,027 4.188 5725 5660 Net income 17280 15545 16,828 20.801 21.000 Non-GAAP core operating income'1 s 17344 s 16374 s 16,828 s 20.801 s 25898 Balance Sheet Data: Cash and cash equivalents s 309135 s 277,678 s 276.927 s 482727 s 316,722 Securities 656.527 695647 722778 745.969 708.106 ) Gross loans (net of unearned income) 4,677,646 4,528254 4349568 4256215 4233,117 Allowance for credit losses1 55.864 55.817 55251 58375 64152 Goodwill and intangibles 71 91 no 130 149 Total assets 5.848.977 5708311 5518,121 5621,457 5401,151 Non-interest bearing deposits 1115.934 1.163.462 1,110284 1,163224 960.999 Total deposits 4987515 4,744,420 4,621680 4683597 4.436.597 Borrowings and repurchase agreements 205349 296.606 226.600 236.600 276.600 Trust preferred securities net of fair value adjustments 1048 1035 1022 1.009 997 Stockholders Equity 580.547 608.016 623.199 667573 652407 Tangible common stockholders'equity11 s 580.476 s 607,924 s 623.089 s 667,443 s 652257 Share and Per Share Data: Basic earnings per com mon share s 035 s 031 s 033 s 0.41 s 0.41 Diluted earnings per common share 035 031 033 0.40 0.41 Book value per share 1190 1227 1253 1323 1279 Tangible
book value per share s 1190 s 1227 s 1253 s 1523 s 1279 Basic weighted average common shares outstanding 49266.811 49.758263 50251297 50893.493 50990.113 Diluted weighted average common shares outstanding 49,721,493 50203.725 50.910,490 51660723 51605.721 Shares outstanding at end of period 48787696 _ 49.555949 49.728253 50450045 51.002698 Represents a non-GAAP financial measure. See Non-GAAP Reconciliation slides at the end of this presentation for additional detail. Implemented CECL on January 1, 2022, all prior quarters presented represent the allowance for loan losses. 23
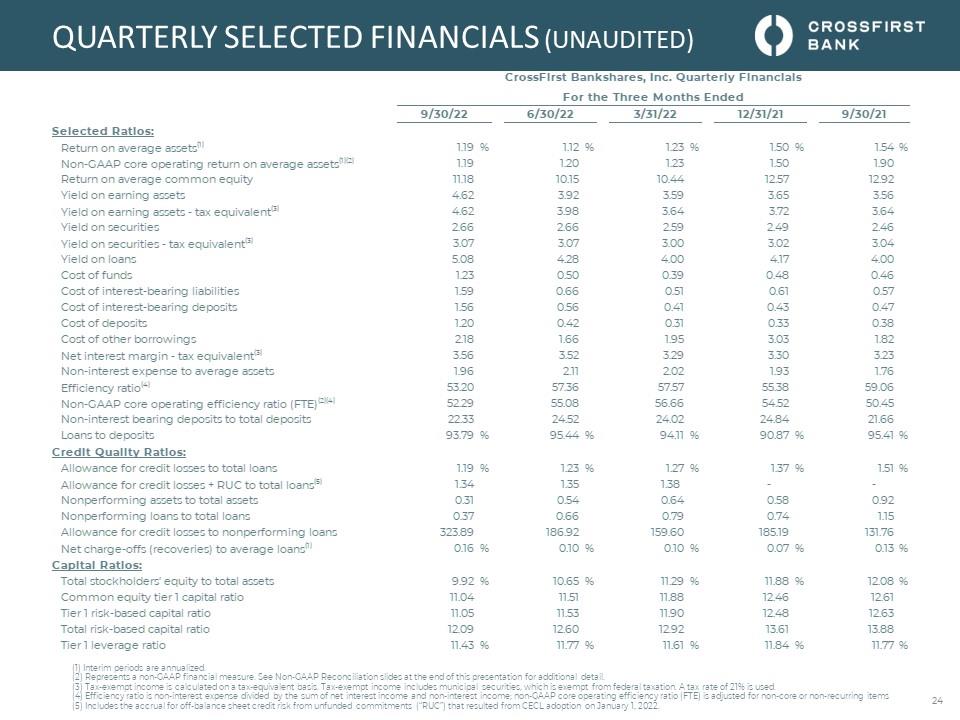
Quarterly selected financials (unaudited) CROSSFIRST BANKSAHRES, INC. 9/30/22 Selected-RaUQs; Return or average assets1: 1-19% Non-GAAP core operating return on average assetS1);: 119 Return on average common equity 11.18 Yield on earning assets 462 Yield on earning assets - tax equivalent^ 4.62 Yield on securities 266 Yield on securities - tax equivale nt’3 3.07 Yield on bans 508 Cost of funds 125 Cos tof interest-bearing liabilities 159 Cost of interest-bearing deposits 156 Cost of de posits 120 Cost of other borrowings 2.13 Net interest margin - tax equivalent3 3.56 Non-interest expense to average assets 1.96 Efficiency ratio ’1 5520 Non-GAAR core operating efficiency ratio {FTE)ow 5229 Non-iinterest bearing de posits to total de posits 2255 Loans to deposits 9579 % Credit Quality Ratios; Allowance for credit losses to total loans 1.19 % Allowance for credit losses * RUC to total loartí51 154 Non performing assets to total assets 051 Nonperforming bans to total loans 057 Allowance for credit losses to nonperforming loans 523.89 Net charge -offs (recoveries) to average loans11 0.16 % Capital Patios: Total stockholders' equity to total assets 9.92 % Common equity tier 1 capital ratio 11.04 Tier 1 risk-based capital ratio Ï105 Total risk-based capital ratio 1209 Tier 1 leverage ratio T1.45 % CrossFIrst Bankshares, Inc. Quarterly Financials For the Three Months Ended 6/30/22 3/31/22 12/31/21 9/30/21 1.12 % 123 % 150 % 154 % 120 123 150 1.90 10.15 10.44 1257 12.92 592 559 365 3.56 3.98 364 3.72 3.64 266 259 2.49 246 507 300 302 304 428 400 4.17 4.00 050 059 0.48 0.46 0.66 051 0.61 057 0.56 0.41 0.43 0.47 0.42 051 033 058 166 195 303 1.82 552 529 330 323 2.n 202 193 1.76 5756 5757 5538 59.06 5508 5666 5452 50.45 2452 24.02 24.84 21.66 9544 % 94.11 % 9087 % 95.41 % 125 % 127 % 157 % 151 % 155 158 - - 054 064 058 0.92 0.66 0.79 0.74 115 186.92 15960
18519 131.76 0.10 % 0.10 % 007 % 013 % 10.65 % 1129 % 11.88 % 1208 % 1151 1188 12.46 12.61 1155 1190 12.48 12.63 1260 1292 1361 13.88 11.77 % 1161 % 11.84 % 1177 % (1) Interim periods are annualized. (2) Represents a non-GAAP financial measure. See Non-GAAP Reconciliation slides at the end of this presentation for additional detail. (3) Tax-exempt income is calculated on a tax-equivalent basis. Tax-exempt income includes municipal securities, which is exempt from federal taxation. A tax rate of 21% is used. (4) Efficiency ratio is non-interest expense divided by the sum of net interest income and non-interest income; non-GAAP core operating efficiency ratio (FTE) is adjusted for non-core or non-recurring items (5) Includes the accrual for off-balance sheet credit risk from unfunded commitments (“RUC”) that resulted from CECL adoption on January 1, 2022. 24
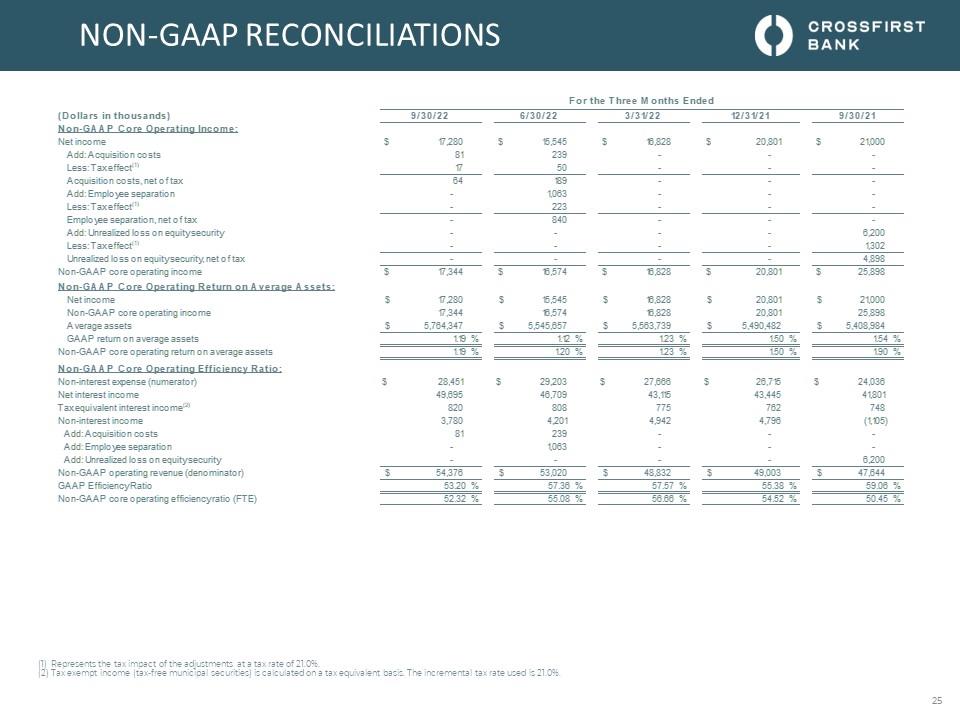
Non-gaap reconciliations CROSSFIRST BANKSAHRES, INC. For the Three Months Ended (Dollars in thousand!) 9/30/22 6/30/22 3/3*22 12/31/21 9/30/21 Net income s 17.2» s 15.545 s «828 s 20»1 s 210» Add Acquisition costs 81 239 less:Taxeffect"’ 17 M Acquisition costs. ne 1 o ( 1 a« 64 B9 Add Em Uo.tc separation 1063 - - • LessiTaiefect"1 223 Em doyee separalion.nf* ol la« 840 Add Lbirmiral loss on ojiitysocnity • • 62» Less: Taxefecl"1 1302 Lbirmirod losson mutysccLnty.netofla* 4898 Non GAAP core operating income non-GAAP CoreQwiatna Return on A vana* A »9tt: s 17.3« s «.574 s «828 s 20»1 s 26898 Nel Income s 17.2» s «545 s «828 s 20»1 s 210» Non GAAP coreoperat'ngincome Avnagcassebs s 17.3« 5.764347 s «574 5.545657 s «828 6563739 s 20»1 5.490482 s 26898 6406984 GAAP return on average assets 119 % 112 9i 123 % 150 % 154 9b Non GAAP co re opnabng return onaacrageassets IS 9i 120 9i 123 % 150 9i 190 9» Non -GAAP core Qreiatina Ernenne» Ratio: Non Irenes! rapense (rumeraor) s 28.451 s 29203 s 278» s 26.7« s 24036 Nelireeiea income 49.695 46709 4216 42445 41801 Taxcgjivalere interns! income1'' 820 808 775 762 748 Non Irenes! ficome a7» 4201 4342 4796 <4*35» Add.AcgUsitian costs 81 239 Add: Em^ta yec separation • 1063 - - • Add. Jrrmliaid loss o n ajuty secuiily 62» Non GAAP opnabngre»nje (deromirntor) s 54376 s 53020 s 48832 s 49003 s 47.6« GAAP DfidmcyRalo 5320 % 5736 % 57.57 % 5638 % 5906 % Non GAAP core opnabng eiidency ratio (FTE) 5232 % 5508 % 56.» % 5452 % »45 96 Represents the tax impact of the adjustments at a tax rate of 21.0%. Tax exempt income (tax-free municipal securities) is calculated on a tax equivalent basis. The incremental tax rate used is 21.0%. 25
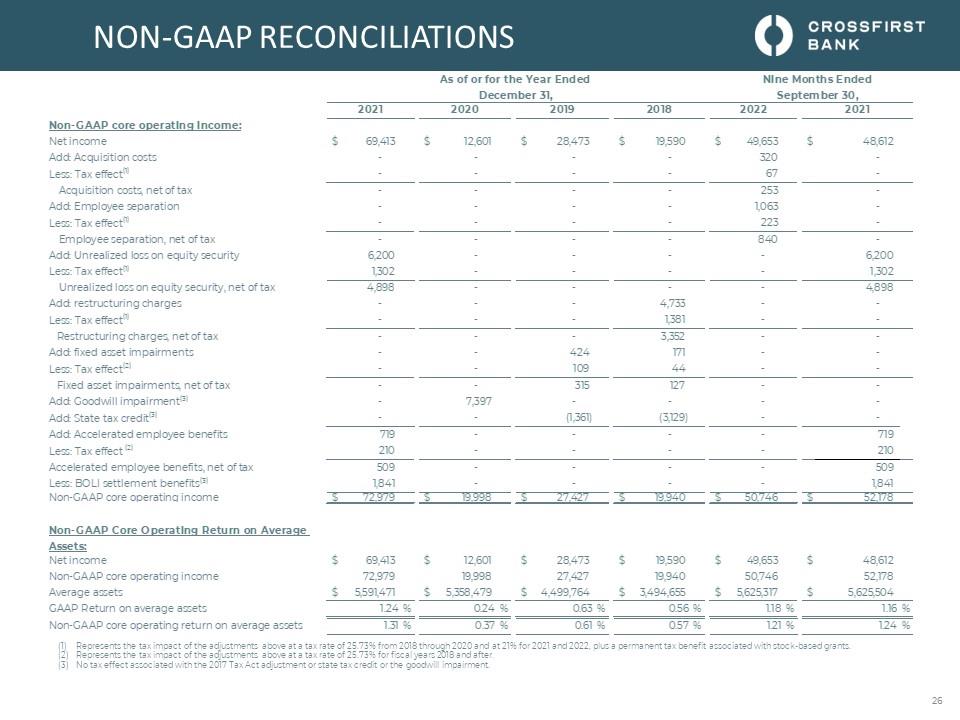
NON-GAAP RECONCILIATIONS CROSSFIRST BANKSHARES, INC. As of or for the Year Ended December 31, Nine Months Ended September 30, 2021 2020 2019 2018 2022 2021 Non-GAAP core Operating income: Net income Add: Acquisition costs Less Tax effect" s 69.413 s 12601 S 28.473 S 19.590 s 49.655 320 67 s 48.612 Acquisition costs net of tax - - - - 255 - Add: Employee separation - - - - 1.063 - Less Tax effect" - - - - 223 - Employee separation, net of tax - - - - 840 - Add: Unrealized loss on equity security 6200 - - - - 6200 Less Tax effect*1 1302 - - - - 1.302 Unrealized loss on equity security, net of tax 4.898 - - - - 4.898 Add: restructuring charges - - - 4.735 - - Less Tax effect1 - - - 1381 - - Restructuring charges net of tax - - - 3352 - - Add: fixed asset impairments - - 424 171 - - Less Tax effect5* - - 109 44 - - Fixed asset impairments net of tax - - 315 127 - - Add: Goodwill impairments* - 7.397 - - - - Add: State tax credit 3 - - (1261) (3329) - - Add: Accelerated employee benefits 719 - - - - 719 Less Tax effect ~* 210 - - - - 210 Accelerated employee benefits net of tax 509 - - - - 509 Less BOU settlement benefits5* 1.841 - - - - 1841 Non-GAAP core operating income l 72979 * '9993 5 27.A27 5 19.940 50.7-6 V 52178 Non-GAAP Core Operating Return on Average. Assets: Net income s 69.413 s 12601 S 28.473 S 19.590 s 49.655 s 48.612 Non-GAAP core operating income 72979 19998 27.427 19.940 50.746 52178 Average assets s 5.591.471 s 5.358.479 S 4. ¿99.764 S 3.494.655 s 5625.317 s 5.625.304 GAAP Return on average assets 124 % 024 % 0.63 % 0.56 % 1.18 % 1.16 % Non-GAAP core operating return on average assets 121 % 0.37 % 0.61 % 0.57 % 121 % 124 % Represents the tax impact of the adjustments above at a tax rate of 25.73% from 2018 through 2020 and at 21% for 2021 and 2022, plus a permanent tax benefit associated with stock -based grants. Represents
the tax impact of the adjustments above at a tax rate of 25.73% for fiscal years 2018 and after. No tax effect associated with the 2017 Tax Act adjustment or state tax credit or the goodwill impairment. 26
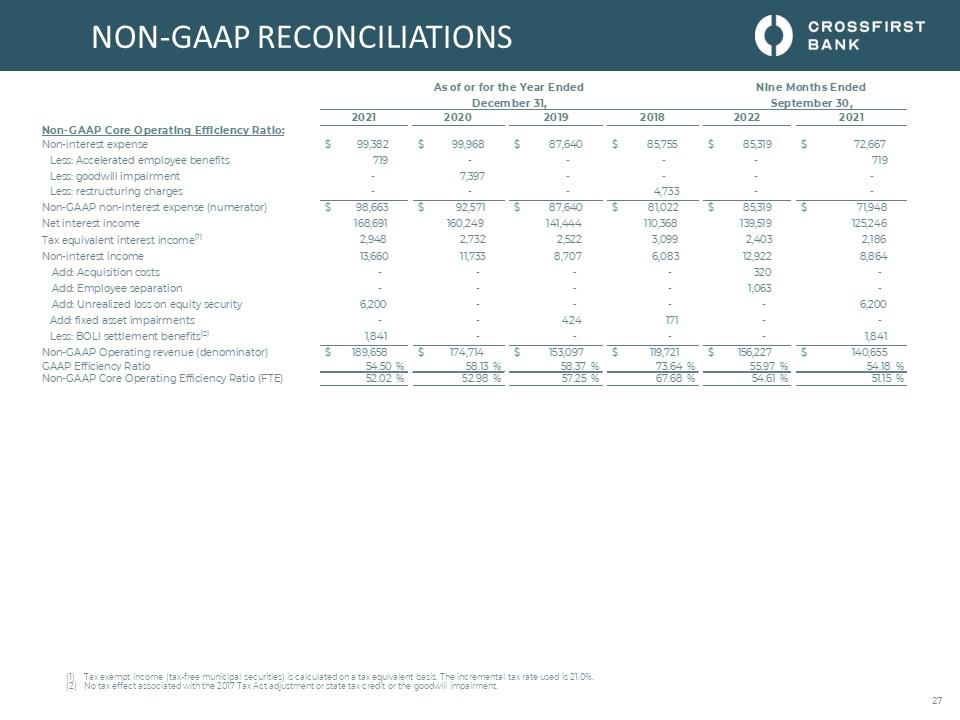
NON-GAAP RECONCILIATIONS CROSSFIRST BANKSHARES, INC. As of or for the Year Ended Nine Months Ended December 31,September 30, 2021 2020 —I 2019 2018 2022 — X 2021 Non-CAAP Core Operating Efficiency Ratio: Non-interest expense S 99382 S 99,968 s 87,640 S 85,755 S 85,319 S 72,667 Less: Accelerated employee benefits 719 - - - - 719 Less: goodwill impairment - 7,397 - - - - Less: restructuring charges - - - 4,733 - - Non-CAAP non-interest expense (numerator) s 98,663 s 92371 s 87,640 $ 81,022 s 85,319 s 71,948 Net interest income 168,691 160,249 141,444 110,368 139,519 125,246 Tax equivalent interest income1' 2,948 2,732 2,522 3,099 2,403 2,186 Non-interest income 13,660 11,733 8,707 6,083 12,922 8,864 Add: Acquisition costs - - - - 320 - Add: Employee separation - - - - 1,063 - Add: Unrealized loss on equity security 6,200 - - - - 6,200 Add: fixed asset impairments - - 424 171 - - Less: BOU settlement benefits21 1,841 - - - - 1,841 Non-CAAP Operating revenue (denominator) S 189,658 s 174,714 s 153,097 $ 119,721 s 156227 s 140,655 CAAP Efficiency Ratio 54.50 % 58.13 % 5837 % 73.64 % 55.97 % 54.18 % Non-CAAP Core Operating Efficiency Ratio (FTE) 52.02 % 52.98 % 5725 % 67.68 % 54.61 % 51.15 % Tax exempt income (tax-free municipal securities) is calculated on a tax equivalent basis. The incremental tax rate used is 21.0%. No tax effect associated with the 2017 Tax Act adjustment or state tax credit or the goodwill impairment. 27
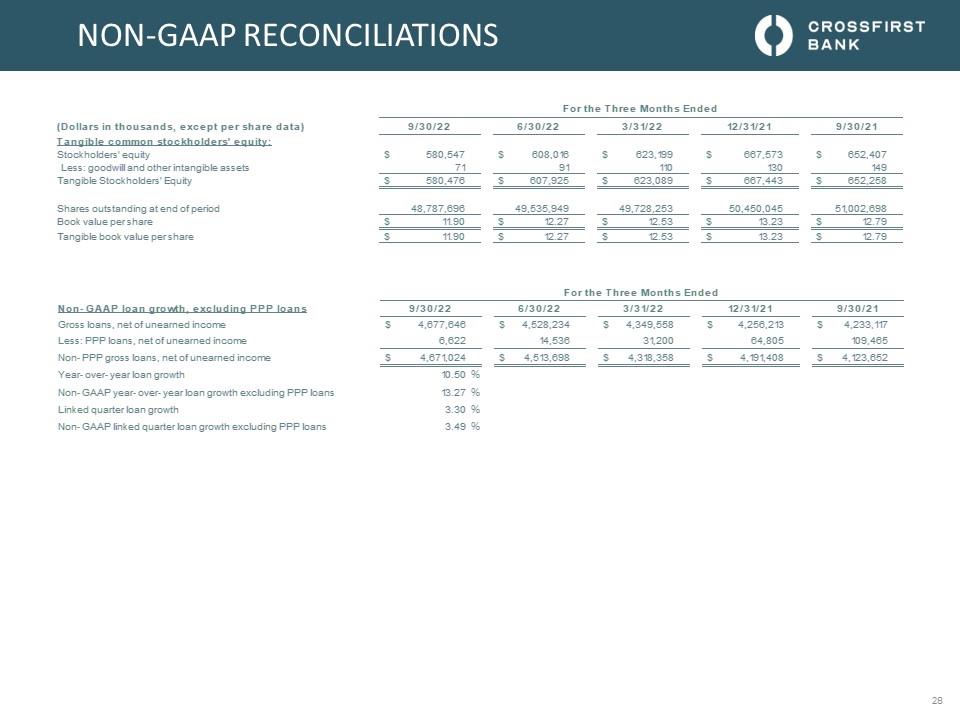
Non-gaap reconciliations CROSSFIRST BANKSAHRES, INC. 9/30/22 (Dollars in thousands, except per share data) Stockholders equity Less: Goodwill and other intangible assets s 580.547 71 Tangible Stockholders Equity 580.476 Share outstanding at end of period 48.787.69 6 Book value per share s 1190 Tangible book value per sha e $ 1190 For the Three Months Ended 6/30/22 3/3V22 s 608.016 91 s 623.199 It) s 607 925 $ 623.089 49.535.949 49.728253 s 2.27 s 12.53 s 2.27 5 12.53 12/31/21 9/30/21 s 667.573 CO s 652.407 149 s 667.443 s 652 2 58 50.450.045 51.002.698 s G23 s 12.79 s G23 s 12.79 28