Exhibit 99.2
CROSSFIRST BANKSHARES, INC. NASDAQ: CFB 4th Quarter and Full Year 2022 Earnings Presentation January 23, 2023
LEGAL DISCLAIMER CROSSFIRST BANKSHARES, INC. FORWARD -LOOKING STATEMENTS. The financial results in this presentation reflect preliminary, unaudited results, which are not final until the Company’s Annual Report on Form 10-K is filed. This presentation and oral statements made relating to this presentation contain forward-looking statements. These forward- looking statements reflect our current views with respect to, among other things, future events and our financial performance. These forward -looking statements include, but are not limited to, statements regarding our 
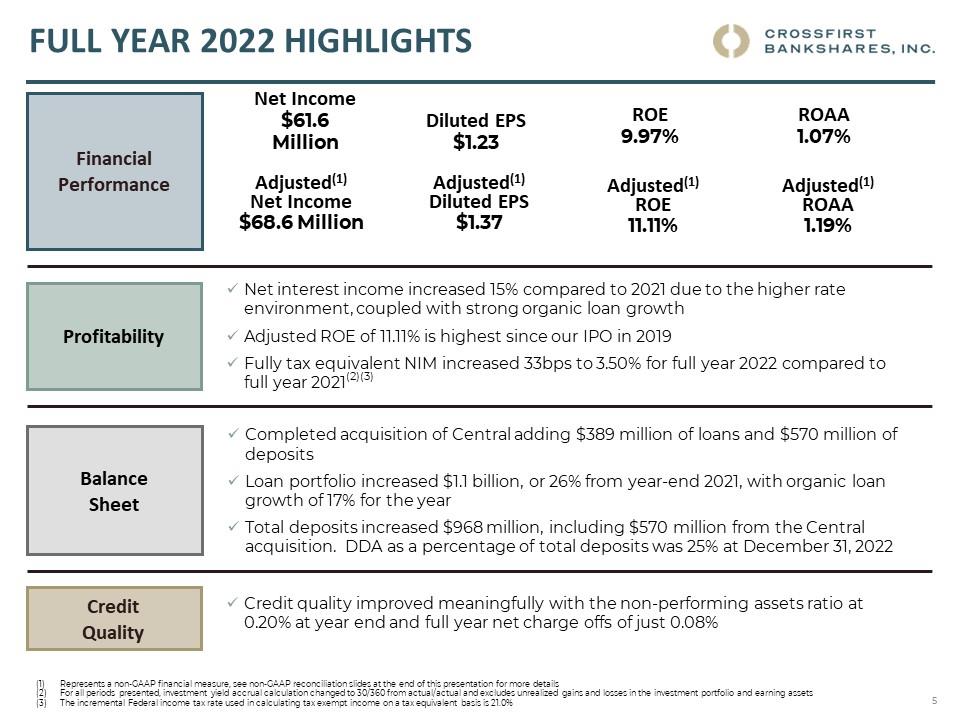
business plans, the impacts of the acquisition of Central,* expansion targets and opportunities, and future financial performance. These statements are often, but not always, made through the use of words or phrases such as "positioned," "optimistic," "potential," "believe," "expect," "will make," "will," "anticipate," "growth," "intend," "plan," "future," "goal," "target," "uncertainty,“ “strategy,” “opportunities,” “feel,” “expectations,”and "assuming" or the negative version of those words or other comparable words or ph rases of a future or forward-looking nature. These forward-looking statements are not historical facts, and are based on current expectations, estimates and projections about our industry, management’s beliefs and certain assumptions made by management, many of which, by their nature, are inherently uncertain and beyond our control. Accordingly, we caution you that any such forward -looking statements are not guarantees of future performance and are subject to risks, assumptions, estimates and uncertainties that are difficult to predict. Although we believe that the expectations reflected in these forward-looking statements are reasonable as of the date made, actual results may prove to be materially different from the results expressed or implied by the forward-looking statements. There are or will
be important factors that could cause our actual results to differ materially from those indicated in these forward-looking statements, including, but not limited to, the following: risks related to general business and economic conditions and any regulatory responses to such conditions; interest rate fluctuations, our ability to effectively execute our growth strategy and manage our growth, including identifying and consummating suitable mergers and acquisitions; the geographic concentration of our markets; fluctuation of the fair value of our investment securities due to factors outside our control; our ability to successfully manage our credit risk and the sufficiency of our allowance; regulatory restrictions on our ability to grow due to our concentratio n in commercial real estate lending; our ability to attract, hire and retain key personnel; our ability to raise or maintain sufficient capital; competition from banks, credit unions and other financial services providers; the effectiveness of our risk management framework in mitigating risks and losses; our ability to maintain effective internal control over financial reporting; our ability to keep pace with technological changes; system failures and interruptions, cyber-attacks and security breaches; employee error, fraudulent activity by employees or clients and inaccurate or incomplete information about our clients and counterparties; our ability to maintain our reputation; costs and effects of litigation, investigations or similar matters; risk exposure from transactions with financial counterparties; risks relating to the ongoing COVID-19 pandemic; compliance with governmental and regulatory requirements; and changes in the laws, rules, regulations, interpretations or policies relating to financial institutions, accounting, tax, trade, monetary and fiscal matters. These and other factors that could cause results to differ materially from those described in the forward-looking
statements, as well as a discussion of the risks and uncertainties that may affect our business, can be found in our Annual Report on Form 10-K, our Quarterly Reports on Form 10-Q and in other filings we make with the Securities and Exchange Commission. These forward-looking statements are made as of the date hereof, and we disclaim any obligation to update any forward-looking statement or to publicly announce the results of any revisions to any of the forward-looking statements included herein, except as required by law. MARKET AND INDUSTRY DATA. This presentation references certain market, industry and demographic data, forecasts and other statistical information. We have obtained this data, forecasts and information from various independent, third party industry sources and publications. Nothing in the data, forecasts or information used or derived from third party sources should be construed as advice. Some data and other information are also based on our good faith estimates, which are derived from our review of industry publications and surveys and independent sources. We believe that these sources and estimates are reliable but have not independently verified them. Statements as to our market position are based on market data currently available to us. Although we are not aware of any misstatements regarding the economic, employment, industry and other market data presented herein, these estimates involve inherent risks and uncertainties and are based on assumptions 
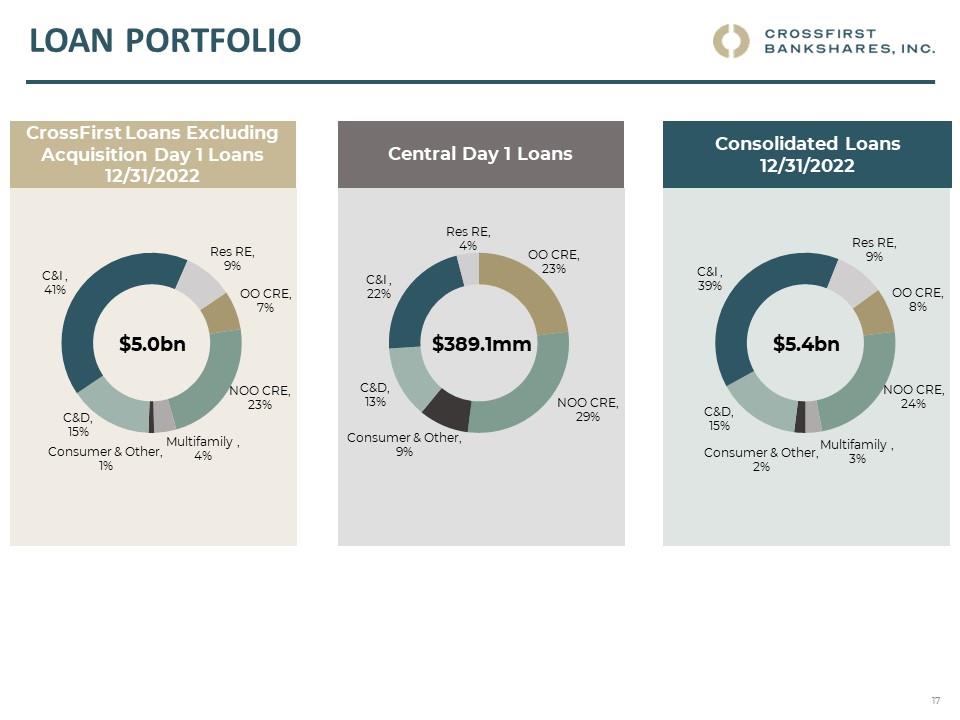
that are subject to change. * CrossFirst acquired Farmers & Stockmens Bank (referred to herein as “Central”) on November 22, 2022. 2
ABOUT NON-GAAP FINANCIAL MEASURES CROSSFIRST BANKSHARES, INC. In addition to disclosing financial measures determined in accordance with U.S. generally accepted accounting principles (GAAP), we disclose non-GAAP financial measures, including “adjusted net income”, “adjusted diluted earnings per share”, “pre-tax pre-provision profit”, “tangible common stockholders’ equity”, “tangible book value per share”, “adjusted return on average assets (ROAA)”, “adjusted return on common equity (ROE)” and “adjusted efficiency ratio – fully tax equivalent (FTE).” We consider the use of select non-GAAP financial measures and ratios to be useful for financial and operational decision making and useful in evaluating period-to-period comparisons. We believe that these non-GAAP financial measures provide meaningful supplemental information regarding our performance by excluding certain expenditures or gains that we believe are not indicative of our primary business operating results. We believe that management and investors benefit from referring to these non-GAAP financial measures in assessing our performance and when planning, forecasting, analyzing and comparing past, present and future periods. These non-GAAP financial measures should not be considered a substitute for financial information presented in accordance with GAAP and should not be relied on alone as measures of our performance. The non-GAAP financial measures we present may differ from non-GAAP financial measures used by our peers or other companies. We compensate for these limitations by providing the equivalent GAAP measures wheneve r we present the non-GAAP financial measures and by including a reconciliation of the impact of the components adjusted for in the non-GAAP financial measure so that both measures and the individual components may be considered when analyzing
our performance. A reconciliation of non-GAAP financial measures to the comparable GAAP financial measures is provided at the end of this presentation. 3
EXECUTING STRATEGIC INITIATIVES CROSSFIRST BANKSHARES, INC. Net Income $19.6 $28.5 $12.6 $69.4 $61.6 Operating Revenue(1) $116.5 $150.2 $172.0 $182.4 $21.8 $6.1 $8.7 $11.7 $13.7 $17.3 $110.4 $141.5 $160.3 $168.7 $193.5 Net Interest Income Non-Interest Income Adjusted Net Income(2) & PTPP Profit(2) $19.9 $30.7 $27.4 $62.5 $20.0 $72.0 $73.0 $83.0 $68.6 $89.1 Adjusted Net Income Pretax, Pre-Provision Profit Non-performing Assets / Total Assets 0.43% 0.97% 1.39% 0.58% 2.00% Note: Dollar amounts are in millions, other than per share amounts Defined as net interest income plus non-interest income Represents a non-GAAP financial measure, see non-GAAP reconciliation slides at the end of this presentation for more details 4
FULL YEAR 2022 HIGHLIGHTS CROSSFIRST BANKSHARES, INC. Financial Performance Net Income $61.6 Million Adjusted(1) Net Income $68.6 Million Diluted EPS $1.23 Adjusted(1) Diluted EPS $1.37 ROE 9.97% Adjusted(1) ROE 11.11% ROAA 1.07% Adjusted(1) ROAA 1.19% Profitability Net interest income increased 15% compared to 2021 due to the higher rate environment, coupled with strong organic loan growth Adjusted ROE of 11.11% is highest since our IPO in 2019 Fully tax equivalent NIM increased 33bps to 3.50% for full year 2022 compared to full year 2021(2)(3) Balance Sheet Completed acquisition of Central adding $389 million of loans and $570 million of deposits Loan portfolio increased $1.1 billion, or 26% from year-end 2021, with organic loan growth of 17% for the year Total deposits increased $968 million, including $570 million from the Central acquisition. DDA as a percentage of total deposits was 25% at December 31, 2022 Credit Quality Credit quality improved meaningfully with the non-performing assets ratio at 0.20% at year end and full year net charge offs of just 0.08% Represents a non-GAAP financial measure, see non-GAAP reconciliation slides at the end of this presentation for more details For all periods presented, investment yield accrual calculation changed to 30/360 from actual/actual and excludes unrealized gains and losses in the investment portfolio and earning assets The incremental Federal income tax rate used in calculating tax exempt income on a tax equivalent basis is 21.0% 5
OUR ROAD TO SUCCESS CROSSFIRST BANKSHARES, INC. ONE TEAM Elevating our Strong Corporate Culture by Living our CrossFirst Values Attracting and Retaining High Performing Talent Invest in well-being of our Employees Total Assets $6.6 billion ONE BANK Targeting Businesses and Professionals Branch-Light – Technology Focused Delivering Extraordinary Service and Customer Experience Enhancing Products and Services Gross Loans $5.4 billion SHARED VISION Performance & Profitability Seizing Growth Opportunities Strong Credit Quality Managing Enterprise Risk Contributing to our Communities Total Deposits $5.7 billion Note: Data as of December 31, 2022 6
OUR GROWTH CROSSFIRST BANKSHARES, INC. Total Assets Compound Annual Growth Rates Since 2012 Total Assets 27.9% $565 $847 $1,220 $1,574 $2,133 $2,961 $4,107 $4,931 $5,659 $5,621 $6,601 2012 Expanded into Wichita and Oklahoma City markets 2013 Expanded into Tulsa market through acquisition of Tulsa National Bancshares, Inc. (~$160mm in Total Assets) 2016 Expanded into Dallas market 2019 CrossFirst Bankshares, Inc. Initial Public Offering at $14.50; Nasdaq listed: CFB 2021 Expanded into Phoenix market 2022 Expanded into Colorado and New Mexico markets through acquisition of Central (~$666mm in Total Assets) Note: Dollars in chart are in millions. 7
DRIVEN BY OUR EXTRAORDINARY CULTURE CROSSFIRST BANKSHARES, INC. FOCUSING ON OUR CORE VALUES At CrossFirst Bank, extraordinary service is the unifying purpose at the very heart of our organization. To deliver on our purpose, each of our employees operates under four values that define our approach to banking: character, competence, commitment, and connection. These are not just words at CrossFirst. They are core values that guide our actions, decisions, and vision. They define who we are. CHARACTER Who You Are COMPETENCE What You Can Do COMMITMENT What You Want To Do CONNECTION What Others See In You INVESTING IN OUR PEOPLE & CLIENTS We prioritize and invest in creating opportunities to help employees grow and build their careers using a variety of training and development programs. These include online, classroom, and on-the-job learning formats. Our CrossFirst Training programs include: A culture and leadership-driven onboarding program for new hires A development program designed for emerging leaders that explores core leadership concepts and foundational concepts of the banking industry As a GALLUP® Strengths-Based organization, our very first commitment to every new employee is that we will value them and provide access to their unique CliftonStrengths®. POSITIONING FOR SUCCESS We strive to build an equitable and inclusive environment with diverse teams who support our core values and strategic initiatives. We strive to hire and retain top-tier talent to drive top-tier growth and extraordinary service. 22% of 2022 new hires were ethnically diverse 61% of workforce is female, following new hires 68% GALLUP® Q12 Survey engaged employees; with more than 89% of employees responding 8
FOOTPRINT AND OPERATING STRUCTURE CROSSFIRST BANKSHARES, INC. METRO MARKETS Kansas City Dallas Fort -Worth Phoenix Denver COMMUNITY MARKETS Wichita Oklahoma City Tulsa Colorado Springs Clayton INDUSTRY VERTICALS Private & Relationship Banking Enterprise Value Financial Institutions Restaurant Franchise Group Commercial Real Estate Energy Mortgage Small Business (SBA) 9
FOURTH QUARTER 2022 HIGHLIGHTS CROSSFIRST BANKSHARES, INC. Financial Performance Net Income $11.9 Million Adjusted(1) Net Income $17.9 Million Diluted EPS $0.24 Adjusted(1) Diluted EPS $0.36 ROE 8.04% Adjusted(1) ROE 12.03% ROA 0.77% Adjusted(1) ROA 1.15% Profitability Net interest income increased 9% from Q3 2022 and 24% from Q4 2021 due to the higher rate environment, coupled with strong organic loan growth Fully tax equivalent NIM increased 5bps to 3.61% during Q4 2022 and has expanded 31bps from Q4 2021(2)(3) Balance Sheet Completed acquisition of Central adding $389 million of loans and $570 million of deposits Loan portfolio increased 26% annualized, excluding $389 million from the acquisition of Central Total deposits increased $664 million, including $570 million from the Central acquisition. DDA as a percentage of total deposits was 25% at December 31, 2022 Credit Quality Provisioned $4.4 million on acquired Central loans under the CECL model NCOs / average loans of (0.02%) annualized for the quarter compared to 0.07% for Q4 2021 NPAs / assets decreased 11bps during the quarter to 0.20% and have declined 38bps from year-end 2021 Represents a non-GAAP financial measure, see non-GAAP reconciliation slides at the end of this presentation for more details For all periods presented, investment yield accrual calculation changed to 30/360 from actual/actual and excludes unrealized gains and losses in the investment portfolio and earning assets The incremental Federal income tax rate used in calculating tax exempt income on a tax equivalent basis is 21.0% 10
NET INTEREST MARGIN CROSSFIRST BANKSHARES, INC. Yield on Loans & Cost of Deposits 4.17% 0.33% 4.00% 0.31% 4.28% 0.42% 5.08% 1.20% 5.93% 2.03% Yield on Loans Cost of Total Deposits Net Interest Margin – Fully Tax Equivalent (FTE)(1)(2) 3.30% 3.29% 3.52% 3.56% 3.61% Fully tax-equivalent net interest margin increased 5bps from Q3 2022, as increases in earning asset yields outpaced cost of funds Loan yields increased 85bps in the quarter due to repricing of existing loans and organic growth Cost of deposits increased 83bps from Q3 2022 due to market rate increases Loan to deposit ratio increased to 95% from 94% in Q3 2022 Current funding structure allows for significant additional capacity for borrowing or wholesale funding if necessary For all quarters presented, investment yield accrual calculation changed to 30/360 from actual/actual and excludes unrealized gains and losses in the investment portfolio and earning assets The incremental Federal income tax rate used in calculating tax exempt income on a tax equivalent basis is 21.0% 11
ASSET QUALITY PERFORMANCE CROSSFIRST BANKSHARES, INC. Classified Loans / Capital + ACL + RUC(1) $78.7 $73.3 $81.5 $72.1 $67.7 10.8% 10.7% 12.0% 11.2% 10.0% Classified Loans Classified / Capital + ACL +RUC Classified loans decreased 6% and included the addition of $5.7 million from Central during Q4 2022 Without the impact of Central, classified loans decreased 19.2% in Q4 2022 Non-performing Assets / Total Assets 0.58% 0.64% 0.54% 0.31% 0.20% NPAs decreased due to continued improvements and successful workouts with borrowers 9% of the non -performing asset balance in Q4 2022 relates to energy credits Note: Dollar amounts are in millions. Beginning in 2022, includes the accrual for off-balance sheet credit risk from unfunded commitments (“RUC”) that resulted from CECL adoption on January 1, 2022 12
ASSET QUALITY PERFORMANCE CROSSFIRST BANKSHARES, INC. Net (Recoveries) Charge-offs / Average Loans(1) 0.07% 0.10% 0.10% 0.16% -0.02% Q4 2022 included $0.3 million of net recoveries Full year 2022 net charge-offs to average loans was 0.08% compared to 0.30% for 2021 Allowance for Credit Losses / Total Loans 1.37% 1.38% 1.35% 1.34% 1.31% $58.4 $55.2 $55.8 $55.9 $61.8 ACL RUC ACL + RUC/ Total Loans ACL + RUC / Total Loans decreased slightly to 1.31% at end of Q4 2022 primarily due to improvements in qualitative adjustments for improved credit indicators Allowance for credit losses to non-accruing loans at the end of Q4 2022 was 548% Note: Dollar amounts are in millions Ratio is annualized for interim periods. 13
SUPPLEMENTAL INFORMATION CROSSFIRST BANKSHARES, INC. 14
STOCK REPURCHASE ACTIVITY CROSSFIRST BANKSHARES, INC. 50,450 49,728 49,536 48,788 48,448 566 1,058 238 794 358 # of Shares Repurchased # Shares Outstanding Repurchased 4.9% of outstanding shares in 2022 and 0.7% of outstanding shares in Q4 2022 Drives improvement in ROE and EPS Little tangible book value dilution and a short earnback period Note: shares in thousands. 15
CAPITAL RATIOS CROSSFIRST BANKSHARES, INC. 12.5% 12.5% 13.6% 11.9% 11.9% 12.9% 11.5% 11.5% 12.6% 11.0% 11.1% 12.1% 9.5% 9.5% 10.5% Common Equity Tier 1 Tier 1 Risk Based Total Risk-Based Capital Capital deployed during Q4 2022 with the closing of the Central acquisition on November 22, 2022 and through significant organic loan growth Maintaining strong capital levels to support future growth Remain well capitalized as we return capital to shareholders through share repurchases 16
LOAN PORTFOLIO CROSSFIRST BANKSHARES, INC. CrossFirst Loans Excluding Acquisition Day 1 Loans 12/31/2022 C&I , 41% Res RE, 9% OO CRE, 7% NOO CRE, 23% Multifamily , 4% Consumer & Other, 1% C&D, 15% $5.0bn Central Day 1 Loans Res RE, 4% OO CRE, 23% NOO CRE, 29% Consumer & Other, 9% C&D, 13% C&I , 22% $389.1mm Consolidated Loans 12/31/2022 Res RE, 9% OO CRE, 8% NOO CRE, 24% Multifamily , 3% Consumer & Other, 2% C&D, 15% C&I , 39% $5.4bn 17
DIVERSE LOAN PORTFOLIO CROSSFIRST BANKSHARES, INC. CRE Loan Portfolio by Segment(1) ($2.1bn) Office 15% Industrial 13% 1-4 Family Res Construction 7% Hotel 9% Other 28% Multi-Family 12% Retail 16% C&I Loan Breakdown (1) by Type ($2.2bn) Financial Management 5% Aircraft & Transportation 7% Merchant Wholesalers 3% Other Industries 43% Manufacturing 11% Real Estate Activity 5% Business Loans to Individuals 6% Health Care 5% Engineering & Contracting 10% Restaurants 5% Note: Data as of December 31, 2022. (1) Portfolio breakdown by type includes loans originated by CrossFirst Bank legacy locations and excludes loans originated by the newly acquired Central locations 18
COMBINED ALLOWANCE FOR CREDIT LOSSES CROSSFIRST BANKSHARES, INC. ACL and Reserve for Unfunded Commitments $62.6 $4.4 $0.3 $3.2 $70.5 ALC + RUC*Reserve ACL and Reserve for Unfunded Commitments $58.4 $3.4 $61.8 $4.4 ($3.8) ($5.4) $13.5 $70.5 ALC + RUC*Reserve Note: As of end of period; dollars in millions. * Includes the accrual for off-balance sheet credit risk from unfunded commitments (“RUC”) that resulted from CECL adoption on January 1, 2022. 19
EXPENSE MANAGEMENT CROSSFIRST BANKSHARES, INC. $26.7 $27.7 $9.2 $28.5 $36.4 $5.9 $5.2 $7.1 $5.4 $8.3 $1.9 $2.1 $2.4 $2.1 $3.3 $2.4 $2.5 $2.6 $2.7 $2.8 $16.5 $17.9 $17.1 $18.3 $22.0 Salaries & Benefits Occupancy Data Processing, Software & Comm. Other Investments in talent and technology continue to account for the increase in expenses year over year, driven by impacts from the Central acquisition Expenses in Q4 2022 included $3.6 million of acquisition-related items, compared to $80 thousand in Q3 2022 Salaries and benefits were higher due to the Central acquisition, coupled with increased hiring in new markets and business lines and increased performance-based incentive compensation Note: Dollars are in millions and amounts shown are as of the end of the period unless otherwise specified. 20
DEPOSIT COMPOSITION CROSSFIRST BANKSHARES, INC. CrossFirst Deposits Excluding Acquisition Day 1 Deposits 12/31/2022 NOW & Other, 3% MMDA & Sav., 56% Retail Time, 12% Jumbo Time, 6% DDA, 23% $5.1bn Central Day 1 Deposits NOW & Other, 3% MMDA & Sav., 51% Retail Time, 2% Jumbo Time, 1% DDA, 43% $570mm Consolidated Deposits 12/31/2022 NOW & Other, 3% MMDA & Sav., 56% Retail Time, 11% Jumbo Time, 5% DDA, 25% 21
IMPROVING CORE DEPOSIT BASE CROSSFIRST BANKSHARES, INC. Total Deposits and % DDA $4,684 $4,622 $4,744 $4,988 $5,651 $3,521 $3,512 $3,581 $3,874 $4,251 $1,163 $1,110 $1,163 $1,114 $1,400 DDA Interest-bearing Deposits Cost of Deposits 0.33% 0.31% 0.42% 1.20% 2.03% Total demand deposits increased 26% since Q3 2022, including $225 million as part of the Central acquisition Cost of deposits increased 83bps this quarter, due to market rate increases Non-interest-bearing deposits were 25% of total deposits this quarter Note: Dollars are in millions and amounts shown are as of the end of the period. 22
SECURITIES PORTFOLIO CROSSFIRST BANKSHARES, INC. Investment Portfolio Breakout as of December 31, 2022 Municipal - Tax-Exempt, 71.0% CMO (Fixed), 1.3% Other, 3.1% MBS (Fixed), 23.7% Municipal - Taxable, 0.9% Total: ~$687 million Securities Yield – Fully Tax Equivalent(2) 3.02% 3.00% 3.07% 3.07% 3.19% 2.54% 2.61% 2.57% 1.84% 1.14% Securities Yield – Cost of Funds Spread Securities Yield At the end of Q4 2022, the portfolio’s duration was approximately 5.2 years The fully taxable equivalent yield for Q4 2022 increased 12bps to 3.19% The securities portfolio has net unrealized losses of approximately $83 million as of December 31, 2022 During Q4 2022, $30 million of securities were purchased at an average tax-equivalent yield of 5.11% and there were $5 million in MBS paydowns Based on approximate fair value. A tax rate of 21.0% is used to calculate the fully tax equivalent yield 23
NON-GAAP RECONCILIATIONS CROSSFIRST BANKSHARES, INC. A & Twelve Months Ended 12/51/2021 12/31/2020 12/31/2019 (Dollars in thousands, except per shore data) Adjusted net Income: Net income S 61.599 s 69.415 s 12601 s 28.475 s 19.590 Add: Acquisition costs 5.890 - * - * Add: Acquisition – Day l CECL provision 4.400 * * * * Add: Employee separation 1.065 * * * * Add: Unrealized loss on equity security - 6200 - - - Add: Accelerated employee benefits - 719 * - * Add: Goodwill impairment111 - * 7597 - * Add: Fixed asset impairment - * * 424 17 Less: State tax credit1" - * * 0-361) (3129) Aid: Restructuring charges - - - - 4.755 Less: BOLI settlement benefits11 - (1.841) - - * Less: Tax effect2 (2555) H - YOQ) (1,425) Adjusted net Income Diluted weighted average common shares outstanding 37,492,567 f1 Diluted earnings per share Adjusted diluted earnings per share Quarter Ended 9/30/2022 6/30/2022 3/31/2022 (Dollars in thousands, except per shore data) Adjusted net Income: Net income S 11946 s T7.280 s 15.545 s 16.828 s 20.801 Add: Acquisition costs 5.570 81 259 * * Add: Acquisition – Day l CECL provision 4.400 * * * * Add: Employee separation - - 1.065 - * Less: Tax effect2 (2045) (17) (275) - - Adjusted net Income Diluted weighted average common shares outstanding Diluted earnings per share Adjusted diluted earnings per share o No tax effect Represents the tax impact of the adjustments at a tax rate of 21.0%, plus permanent tax expense associated with merger related transactions and permanent tax benefit associated with stock-based grants 24
NON-GAAP RECONCILIATIONS CROSSFIRST BANKSHARES, INC. > o Twelve Months Ended 12/51/2022 12/31/2021 12/31/2020 12/31/2019 12/31/2018 (Dollars in thousands) Pre-Tax Pre-Provision Profit: Net income before taxes Acid: Provision for credit losses $ 77572 11501 $ 86,969 (4,000) $ 15,314 56,700 $ 32,611 29,900 $ 17,196 13,500 Pre-Tax Pre-Provision Profit Quarter Ended Twelve Months Ended 3/31/2022 (Dollars in thousands) Adjusted return on average assets: Net income $ 11,946 $ 17,280 $ 15545 $ 16,828 $ 20,801 $ 61,599 $ 69,413 ^ Adjusted net income 17,871 17544 16574 16,828 20,801 68,617 72,979 c Average assets $ 6,159,783 $ 5,764,347 $ 5545,657 $ 5,563,738 $ 5,490,482 $ 5,760,031 $ 5591,471 Return on average assets Adjusted return on average assets Quarter Ended Twelve Months Ended 3/31/2022 (Dollars in thousands) Adjusted return on common equity: Net income $ 11,946 $ 17,280 $ 15545 $ 16,828 $ 20,801 $ 61,599 $ 69,413 Adjusted net income 17,871 17544 16574 16,828 20,801 68,617 72,979 Average common equity $ 589,587 $ 613,206 $ 614,541 $ 653,747 $ 656,415 $ 617,582 $ 656,415 Return on average common equity CO b > Adjusted return on common equity 25
NON-GAAP RECONCILIATIONS CROSSFIRST BANKSHARES, INC. Quarter Ended 9/30/2022 6/30/2022 3/31/2022 (Dollars in thousands except per share data) Tangible common stockholders' equity: Total stockholders' equity $ 608,599 $ 580547 $ 608,016 $ 623,199 $ 667,573 Less: goodwill and other intangible assets 29,081 71 91 no 130 Tangible common stockholders' equity Tangible book value per share: Tangible common stockholders' equity $ 579,518 $ 580,476 $ 607,925 $ 623,089 $ 667,443 Shares outstanding at end of period 48,448215 48,787,696 49535,949 49,728253 50,450,045 Book value per share Tangible book value per share Quarter Ended Twelve Months Ended 6/30/2022 3/31/2022 (Dollars in thousands) Adjusted Efficiency Ratio - Fully Tax Equivalent (FTE)rt: Non-interest expense $ 36,423 $ 28,451 $ 29,203 $ 27,666 $ 26,715 $ 121,742 $ 99582 Less: Acquisition costs (3.570) (81) (239) - - (3,890) - Less: Core deposit intangible amortization (291) - - - - (291) - Less: Employee separation - - (1.063) - - 0.063) - Less: Accelerated employee benefits - - - - - - (719) Adjusted Non-interest expense (numerator) $ 32,562 $ 28570 $ 27,901 $ 27,666 $ 26,715 $ 116,498 $ 98,663 Net interest income 54,015 49,695 46,709 43,115 43,445 193534 168,691 Tax equivalent interest income 11 818 820 808 775 762 3,221 2,948 Non-interest income 4,359 3,780 4201 4,942 4,796 17,281 13,660 Add: Unrealized loss on equity security - - - - - - 6,200 Less: BOLI settlement benefits - - - - - - 0.841) Total tax-equivalent income (denominator) Efficiency Ratio Adjusted Efficiency Ratio - Fully Tax Equivalent (FTE)1’1 55.01 % 53.95 % 56.66 % 54.43 % 5202 % Tax exempt income (tax-free municipal securities) is calculated on a tax equivalent basis. The incremental tax rate used is 21.0%. 26