Filed by Noble Corporation plc pursuant to Rule 425 under the Securities Act of 1933, as amended
Subject Company: Noble Corporation (File No. 001-36211)
Commission File No. for Registration Statement on Form S-4: 333-261780
September 7, 2022
Investor Presentation September 2022 1
Disclaimer Forward-Looking Statements This presentation contains “forward-looking statements” about Noble Corporation’s (“Noble” or the “Company”) business, financial performance and position, contracts and prospects. Words such as anticipate, believe, could, estimate, expect, intend, may, might, plan, project, should, shall, “target,” and will and similar expressions are intended to be among the statements that identify forward-looking statements. Statements regarding strategic rationale, transaction rationale (including but not limited to estimate run-rate annual cost synergies and free cash flow potential), reductions of NOx emissions, CO2 storage, capital investment requirements, pro forma financial, scale and utilization expectations following the pending business combination with Maersk Drilling, offshore macro perspectives, LLD% growth rate, free cash flow and EBITDA potential and projections, return of capital policy, contract backlog, costs, financial position, capital structure, debt, fleet strategy, bidding activity, rig demand, contract commencements and durations, dayrates, impact of future regulations, fleet condition, capabilities or performance, industry fundamentals, shareholder value, as well as any other statements that are not historical facts in this release, are forward- looking statements that involve certain risks, uncertainties and assumptions. These include but are not limited to risk, uncertainties and assumption surrounding the pending business combination with Maersk Drilling, actions by regulatory authorities or other third parties, market conditions, factors affecting the level of activity in the oil and gas industry, supply and demand of drilling rigs, factors affecting the duration of contracts, the actual amount of downtime, factors that reduce applicable dayrates, violations of anti-corruption laws, hurricanes and other weather conditions, the future price of oil and gas and other factors detailed in Noble’s most recent Annual Report on Form 10-K, Quarterly Reports Form 10-Q and other filings with the U.S. Securities and Exchange Commission. Should one or more of these risks or uncertainties materialize, or should underlying assumptions prove incorrect, actual results may vary materially from those indicated. The Company disclaims any duty to update the information presented here. Non-GAAP Measures Certain anticipated pro-forma non-GAAP performance measures have been provided for meaningful comparisons between current results and expected future operating periods. The Company defines pro forma “Net Debt” as pro forma consolidated debt less pro forma cash and cash equivalents, defines pro forma “Net Debt Leverage” as pro forma net debt divided by pro forma Annualized Adjusted EBITDA and defines pro forma “Free Cash Flow” as pro forma net cash provided by operating activities less pro forma cash paid for capital expenditures. Pro forma Annualized Adjusted EBITDA as used in this presentation means the Company's pro forma Adjusted EBITDA expectations for the third and fourth quarters of 2022, annualized for two quarters. These non-GAAP measures should be considered in addition to, and not as a substitute for, or superior to, measures of financial performance prepared in accordance with GAAP. Due to the forward-looking nature of these pro forma non-GAAP financial measures, management cannot reliably predict certain of the necessary components of the most directly comparable forward-looking GAAP measure. Accordingly, the Company is unable to present a quantitative reconciliation of such forward-looking non-GAAP financial measure to the most directly comparable forward-looking GAAP financial measure without unreasonable effort. 2
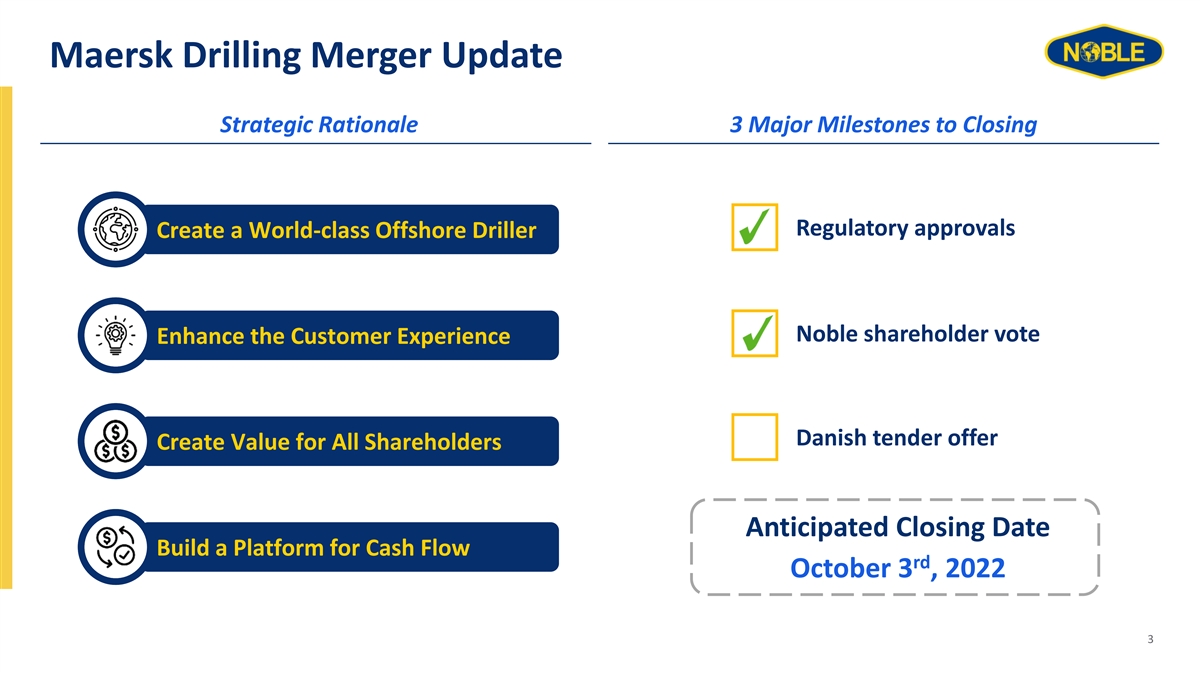
Maersk Drilling Merger Update Strategic Rationale 3 Major Milestones to Closing Regulatory approvals Create a World-class Offshore Driller Noble shareholder vote Enhance the Customer Experience Danish tender offer Create Value for All Shareholders Anticipated Closing Date Build a Platform for Cash Flow rd October 3 , 2022 3

Anticipated Key Financial Statistics at Closing 2H22 Annualized (1) Market Cap (2) Adj. EBITDA ~$4.2 bn $0.8 – 0.9 bn (4) Net Debt / 2H22 (3) Backlog (2) Annualized Adj. EBITDA ~$4.1 bn ~0.5x nd (1): Based on share price as of September 2 , 2022 ; illustratively assumes $50 million cash election is fully utilized and 5% of DRLCO shares are squeezed-out (2): Annualized Adjusted EBITDA is based on 2H 2022 estimates, derived from respective NE and DRLCO FY ’22 guidance, plus $125M targeted synergies, excluding costs to achieve synergies 4 (3): As of NE and DRLCO August fleet status reports (4): Net debt illustratively assumes $50 million cash election is fully utilized and 5% of DRLCO shares are squeezed-out
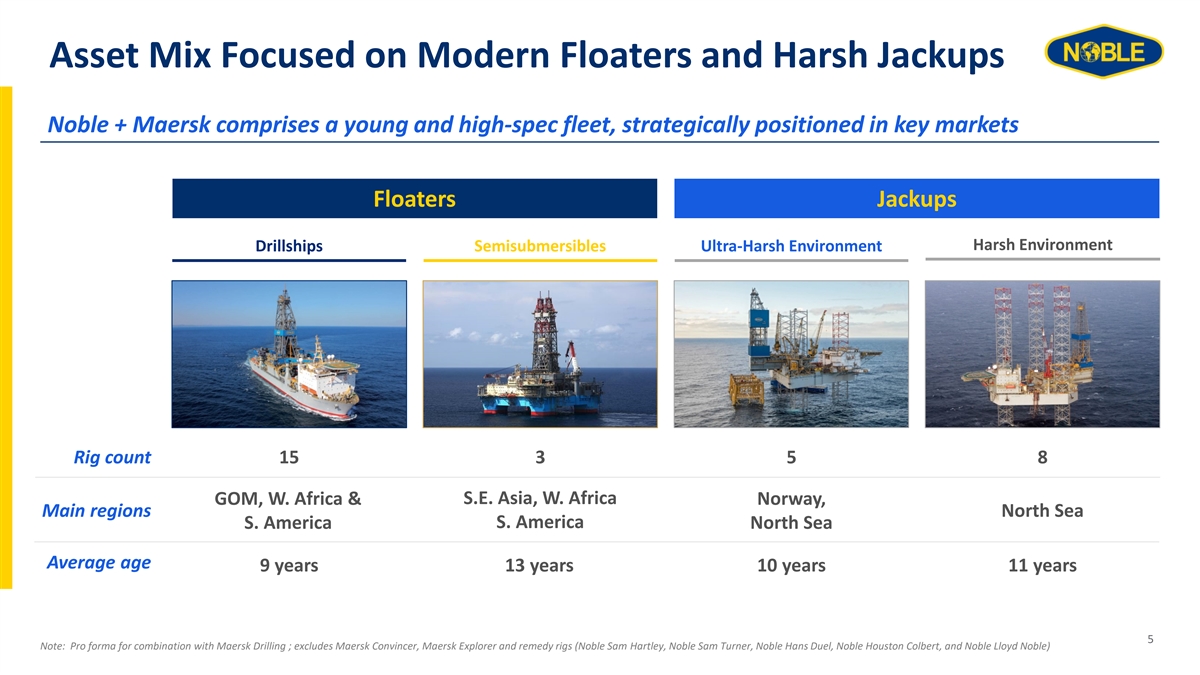
Asset Mix Focused on Modern Floaters and Harsh Jackups Noble + Maersk comprises a young and high-spec fleet, strategically positioned in key markets Floaters Jackups Harsh Environment Drillships Semisubmersibles Ultra-Harsh Environment Rig count 15 3 5 8 S.E. Asia, W. Africa GOM, W. Africa & Norway, Main regions North Sea S. America S. America North Sea Average age 9 years 13 years 10 years 11 years 5 Note: Pro forma for combination with Maersk Drilling ; excludes Maersk Convincer, Maersk Explorer and remedy rigs (Noble Sam Hartley, Noble Sam Turner, Noble Hans Duel, Noble Houston Colbert, and Noble Lloyd Noble)
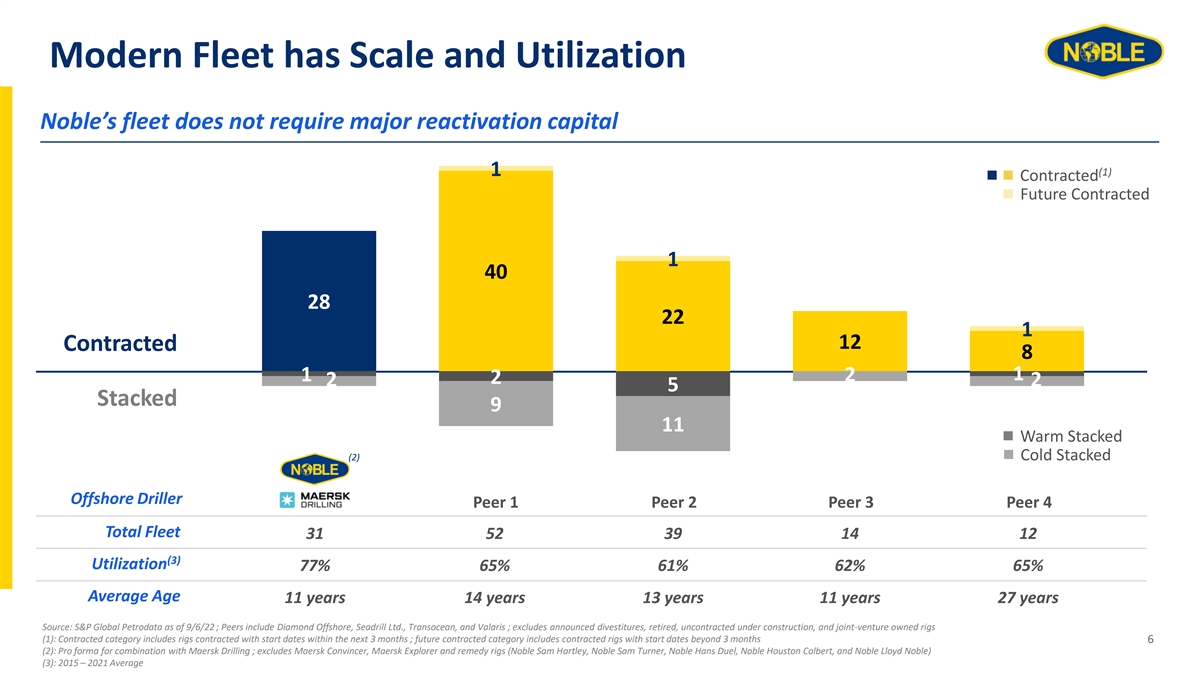
Modern Fleet has Scale and Utilization Noble’s fleet does not require major reactivation capital 1 (1) Contracted Future Contracted 1 40 28 22 1 12 Contracted 8 1 1 2 2 2 2 5 Stacked 9 11 Warm Stacked Cold Stacked (2) Offshore Driller Peer 1 Peer 2 Peer 3 Peer 4 Total Fleet 31 52 39 14 12 (3) Utilization 77% 65% 61% 62% 65% Average Age 11 years 14 years 13 years 11 years 27 years Source: S&P Global Petrodata as of 9/6/22 ; Peers include Diamond Offshore, Seadrill Ltd., Transocean, and Valaris ; excludes announced divestitures, retired, uncontracted under construction, and joint-venture owned rigs (1): Contracted category includes rigs contracted with start dates within the next 3 months ; future contracted category includes contracted rigs with start dates beyond 3 months 6 (2): Pro forma for combination with Maersk Drilling ; excludes Maersk Convincer, Maersk Explorer and remedy rigs (Noble Sam Hartley, Noble Sam Turner, Noble Hans Duel, Noble Houston Colbert, and Noble Lloyd Noble) (3): 2015 – 2021 Average
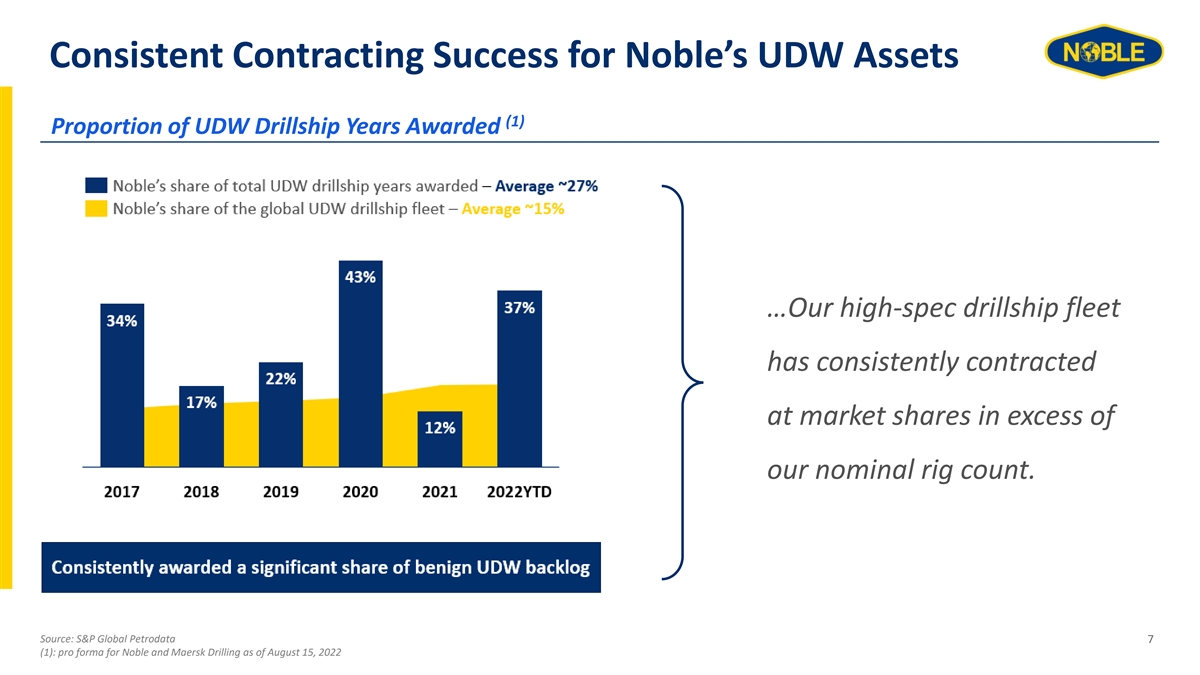
Consistent Contracting Success for Noble’s UDW Assets (1) Proportion of UDW Drillship Years Awarded …Our high-spec drillship fleet has consistently contracted at market shares in excess of our nominal rig count. Source: S&P Global Petrodata 7 (1): pro forma for Noble and Maersk Drilling as of August 15, 2022

Leading the Way in Sustainability & Innovation Utilizing best-in-class innovation to drive sustainability and long-term differentiation Hybrid Upgrades on Norwegian Jackups ▪ Combining hybrid power, data intelligence and cleaning technology (SCR), the company’s hybrid jackups will push the boundaries for low- emission drilling on conventionally powered offshore drilling rigs. Selective Catalytic Reduction (SCR) ▪ Captures NOx exhausts and use ammonia injections to convert the gas into water and nitrogen. By installing SCR units on all the rig’s engine exhaust pipes, the company expects to be able to reduce NOx emissions by up to 98%, while also reducing soot emissions significantly. Project Greensand – Carbon Storage ▪ As part of a consortium, the company is targeting up to 8 million tons of CO stored annually by 2030 through use of the strong innovation and 2 engineering capacity behind one of the most promising carbon-reduction projects in Europe. World’s First Shore-Powered Jackup ▪ Launched in 2017, the Maersk Invincible was the world’s first harsh environment jackup drilling rig to operate entirely on shore-power. The rig was powered entirely by Norwegian hydropower via a 294 km cable. This resulted in reduced emissions, along with maintenance cost savings. 8
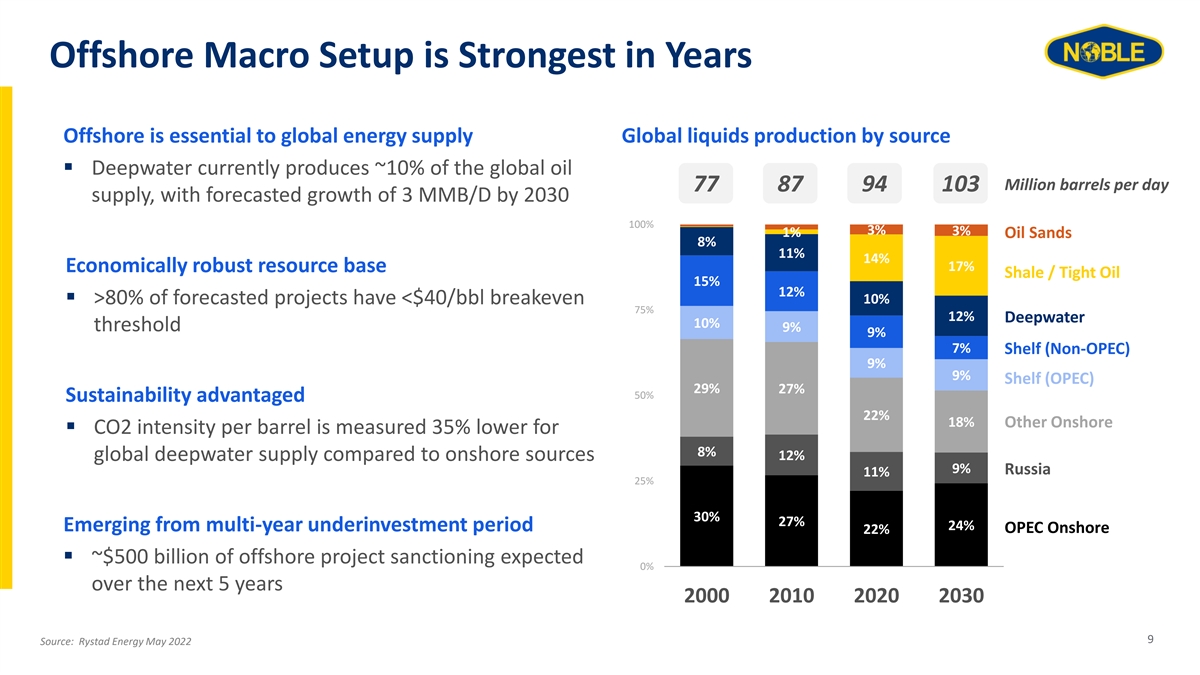
Offshore Macro Setup is Strongest in Years Offshore is essential to global energy supply Global liquids production by source ▪ Deepwater currently produces ~10% of the global oil Million barrels per day 77 87 94 103 supply, with forecasted growth of 3 MMB/D by 2030 100% 3% 3% 1% Oil Sands 8% 11% 14% 17% Economically robust resource base Shale / Tight Oil 15% 12% 10% ▪ >80% of forecasted projects have <$40/bbl breakeven billion 75% 12% Deepwater 10% threshold 9% 9% billion 7% Shelf (Non-OPEC) 9% 9% Shelf (OPEC) 29% 27% 50% Sustainability advantaged 22% 18% Other Onshore ▪ CO2 intensity per barrel is measured 35% lower for 8% 12% global deepwater supply compared to onshore sources billion 9% Russia 11% 25% 30% 27% 24% Emerging from multi-year underinvestment period 22% OPEC Onshore ▪ ~$500 billion of offshore project sanctioning expected 0% over the next 5 years 2000 2010 2020 2030 9 Source: Rystad Energy May 2022
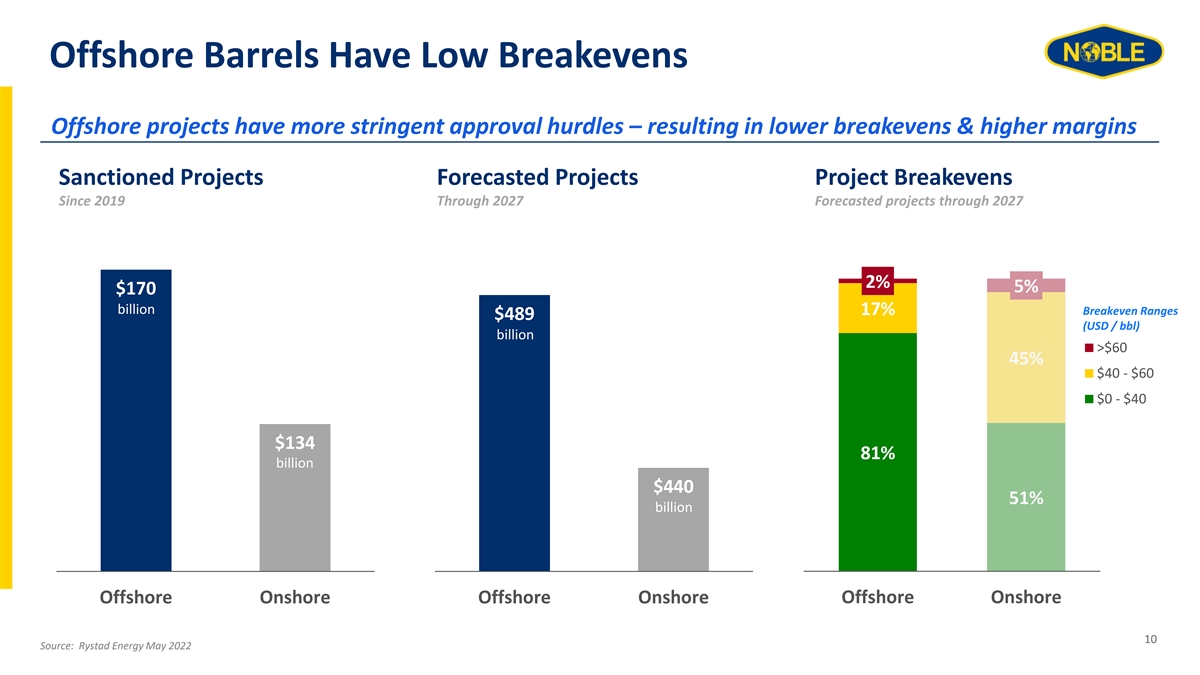
Offshore Barrels Have Low Breakevens Offshore projects have more stringent approval hurdles – resulting in lower breakevens & higher margins Sanctioned Projects Forecasted Projects Project Breakevens Since 2019 Through 2027 Forecasted projects through 2027 2% 5% $170 billion 17% Breakeven Ranges $489 (USD / bbl) billion >$60 45% $40 - $60 $0 - $40 $134 81% billion $440 51% billion Offshore Onshore Offshore Onshore Offshore Onshore 10 Source: Rystad Energy May 2022
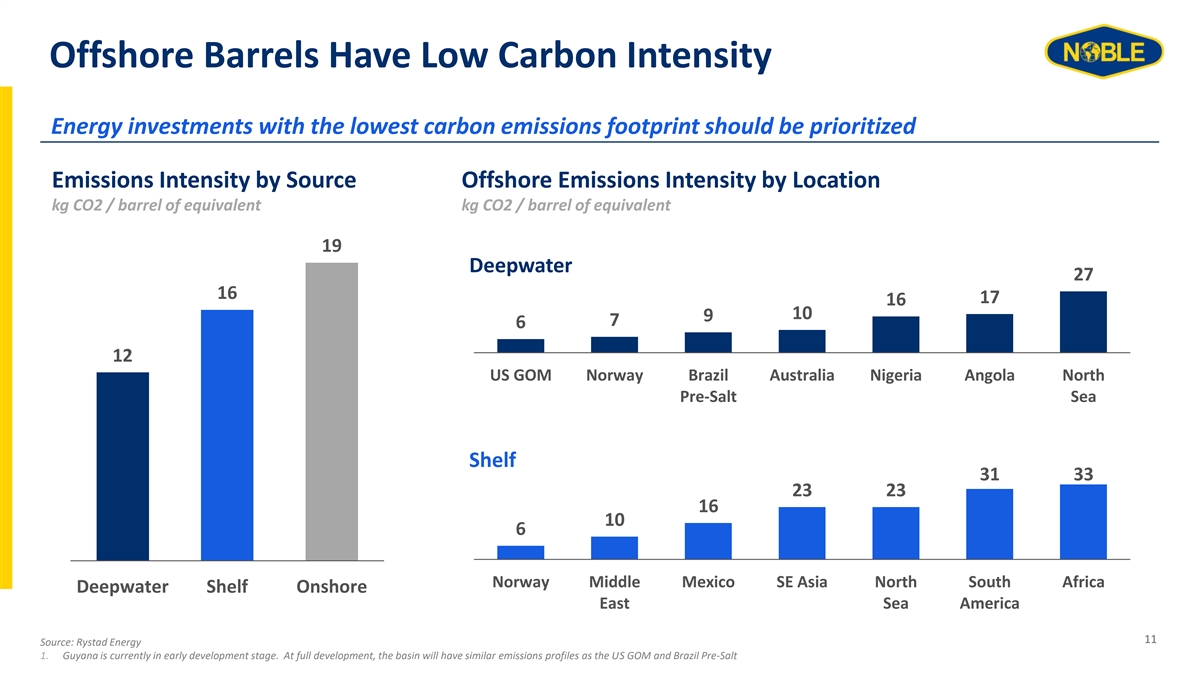
Offshore Barrels Have Low Carbon Intensity Energy investments with the lowest carbon emissions footprint should be prioritized Emissions Intensity by Source Offshore Emissions Intensity by Location kg CO2 / barrel of equivalent kg CO2 / barrel of equivalent 19 Deepwater 27 16 17 16 10 9 7 6 12 US GOM Norway Brazil Australia Nigeria Angola North Pre-Salt Sea Shelf 31 33 23 23 16 10 6 Norway Middle Mexico SE Asia North South Africa Deepwater Shelf Onshore East Sea America 11 Source: Rystad Energy 1. Guyana is currently in early development stage. At full development, the basin will have similar emissions profiles as the US GOM and Brazil Pre-Salt
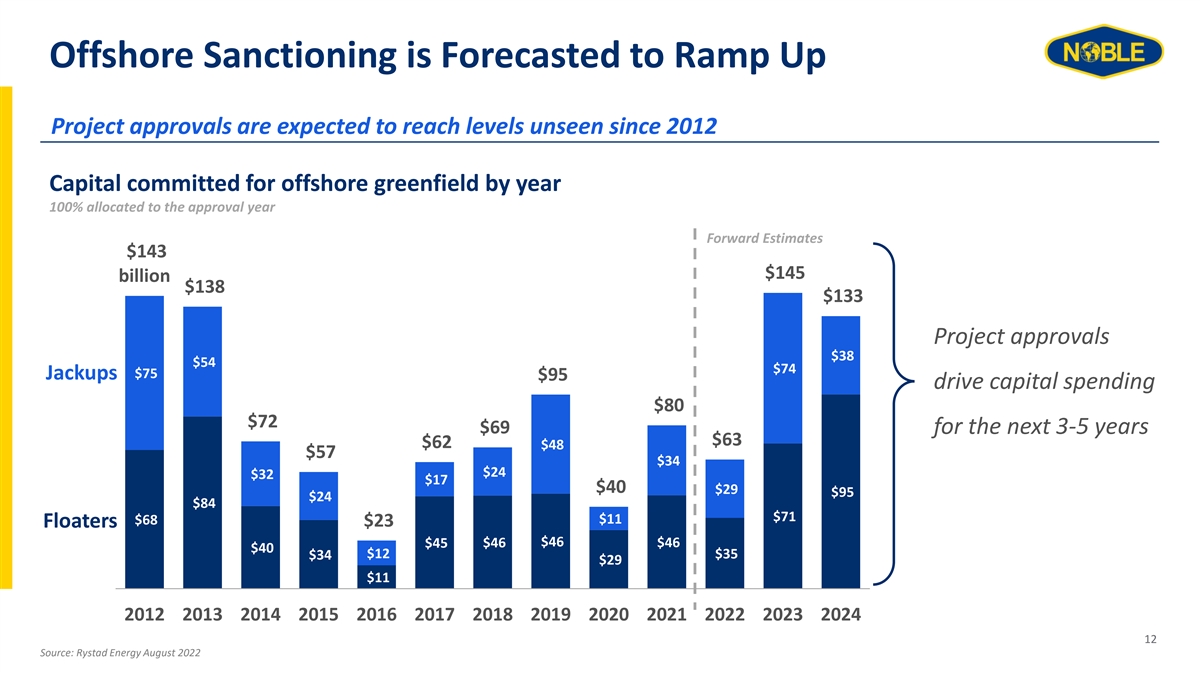
Offshore Sanctioning is Forecasted to Ramp Up Project approvals are expected to reach levels unseen since 2012 Capital committed for offshore greenfield by year 100% allocated to the approval year Forward Estimates $143 $145 billion $138 $133 Project approvals $38 $54 $74 $75 Jackups $95 drive capital spending $80 $72 $69 for the next 3-5 years $63 $62 $48 $57 $34 $24 $32 $17 $40 $29 $95 $24 $84 $71 $11 $68 $23 Floaters $46 $45 $46 $46 $40 $12 $35 $34 $29 $11 2012 2013 2014 2015 2016 2017 2018 2019 2020 2021 2022 2023 2024 12 Source: Rystad Energy August 2022
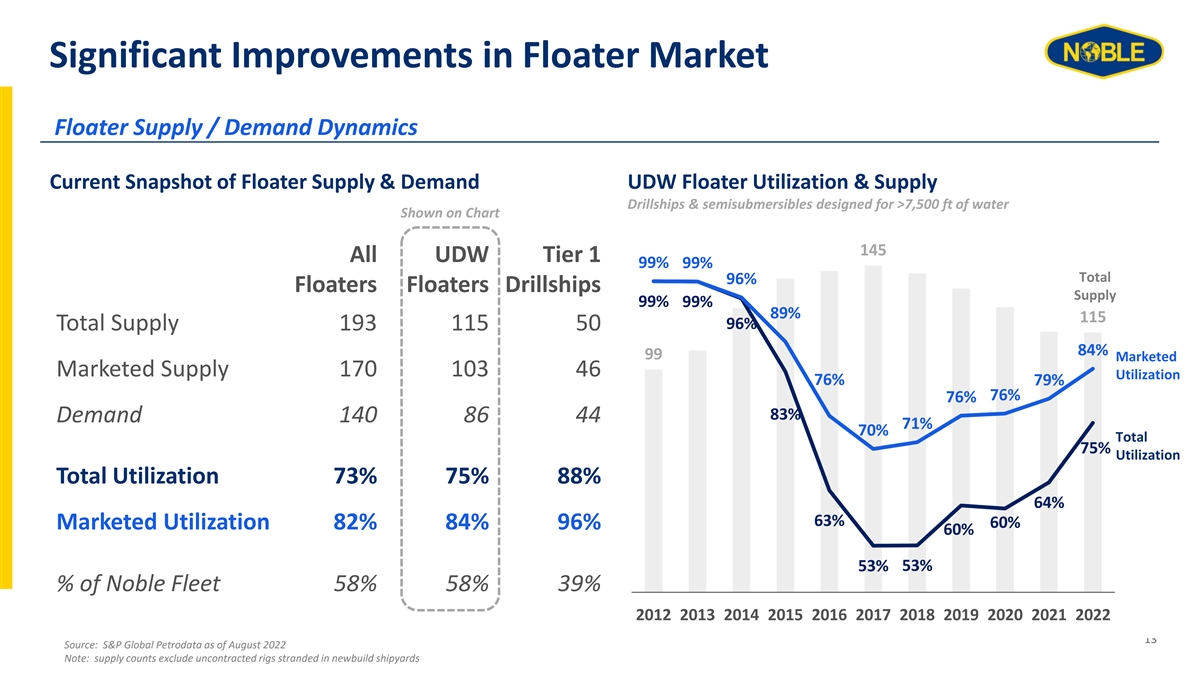
Significant Improvements in Floater Market Floater Supply / Demand Dynamics Current Snapshot of Floater Supply & Demand UDW Floater Utilization & Supply Drillships & semisubmersibles designed for >7,500 ft of water Shown on Chart 145 All UDW Tier 1 99% 99% Total 96% Floaters Floaters Drillships Supply 99% 99% 89% 115 96% Total Supply 193 115 50 84% 99 Marketed Marketed Supply 170 103 46 Utilization 76% 79% 76% 76% 83% Demand 140 86 44 71% 70% Total 75% Utilization Total Utilization 73% 75% 88% 64% 63% 60% Marketed Utilization 82% 84% 96% 60% 53% 53% % of Noble Fleet 58% 58% 39% 2012 2013 2014 2015 2016 2017 2018 2019 2020 2021 2022 13 Source: S&P Global Petrodata as of August 2022 Note: supply counts exclude uncontracted rigs stranded in newbuild shipyards
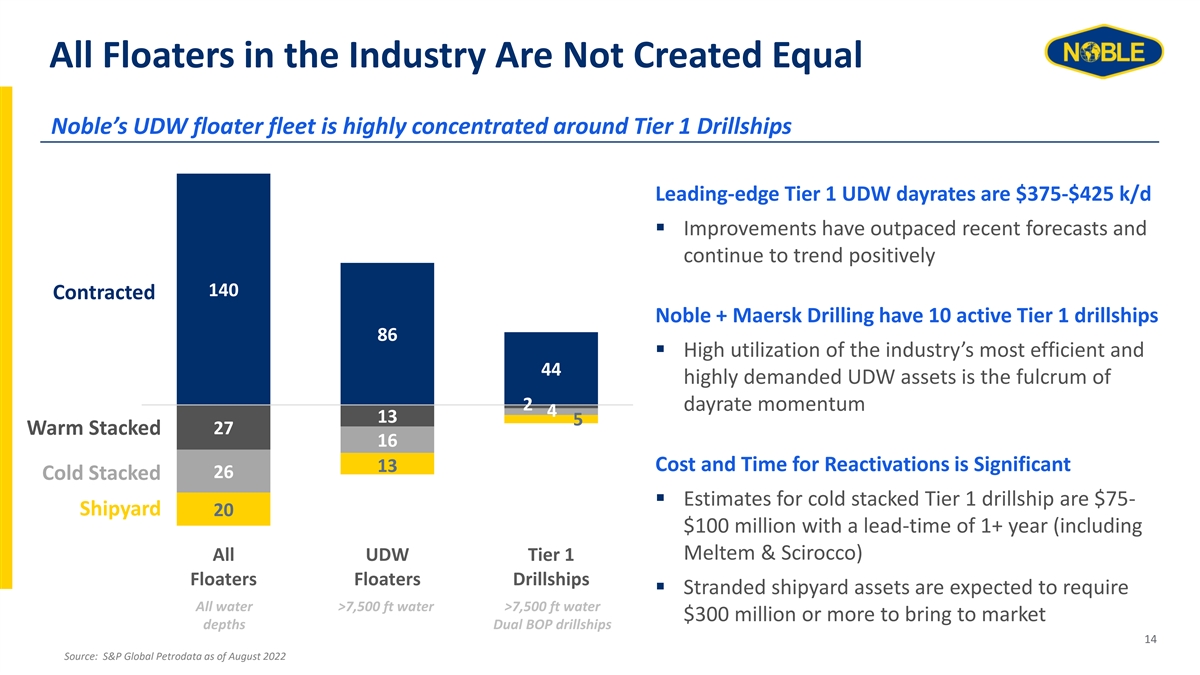
All Floaters in the Industry Are Not Created Equal Noble’s UDW floater fleet is highly concentrated around Tier 1 Drillships Leading-edge Tier 1 UDW dayrates are $375-$425 k/d ▪ Improvements have outpaced recent forecasts and continue to trend positively 140 Contracted Noble + Maersk Drilling have 10 active Tier 1 drillships 86 ▪ High utilization of the industry’s most efficient and 44 highly demanded UDW assets is the fulcrum of 2 dayrate momentum 4 13 5 Warm Stacked 27 16 Cost and Time for Reactivations is Significant 13 26 Cold Stacked ▪ Estimates for cold stacked Tier 1 drillship are $75- Shipyard 20 $100 million with a lead-time of 1+ year (including Meltem & Scirocco) All UDW Tier 1 Floaters Floaters Drillships ▪ Stranded shipyard assets are expected to require All water >7,500 ft water >7,500 ft water $300 million or more to bring to market depths Dual BOP drillships 14 Source: S&P Global Petrodata as of August 2022
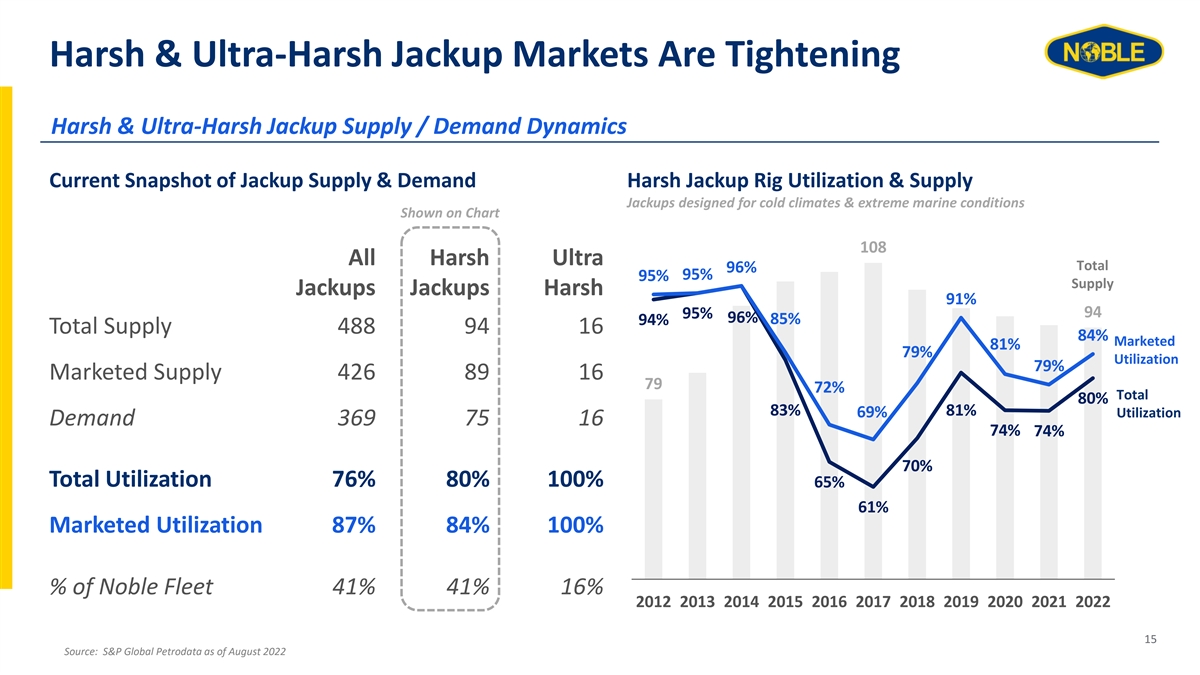
Harsh & Ultra-Harsh Jackup Markets Are Tightening Harsh & Ultra-Harsh Jackup Supply / Demand Dynamics Current Snapshot of Jackup Supply & Demand Harsh Jackup Rig Utilization & Supply Jackups designed for cold climates & extreme marine conditions Shown on Chart 108 All Harsh Ultra Total 96% 95% 95% Supply Jackups Jackups Harsh 91% 94 95% 96% 85% 94% Total Supply 488 94 16 84% Marketed 81% 79% Utilization 79% Marketed Supply 426 89 16 79 72% Total 80% 83% 81% 69% Utilization Demand 369 75 16 74% 74% 70% Total Utilization 76% 80% 100% 65% 61% Marketed Utilization 87% 84% 100% % of Noble Fleet 41% 41% 16% 2012 2013 2014 2015 2016 2017 2018 2019 2020 2021 2022 15 Source: S&P Global Petrodata as of August 2022
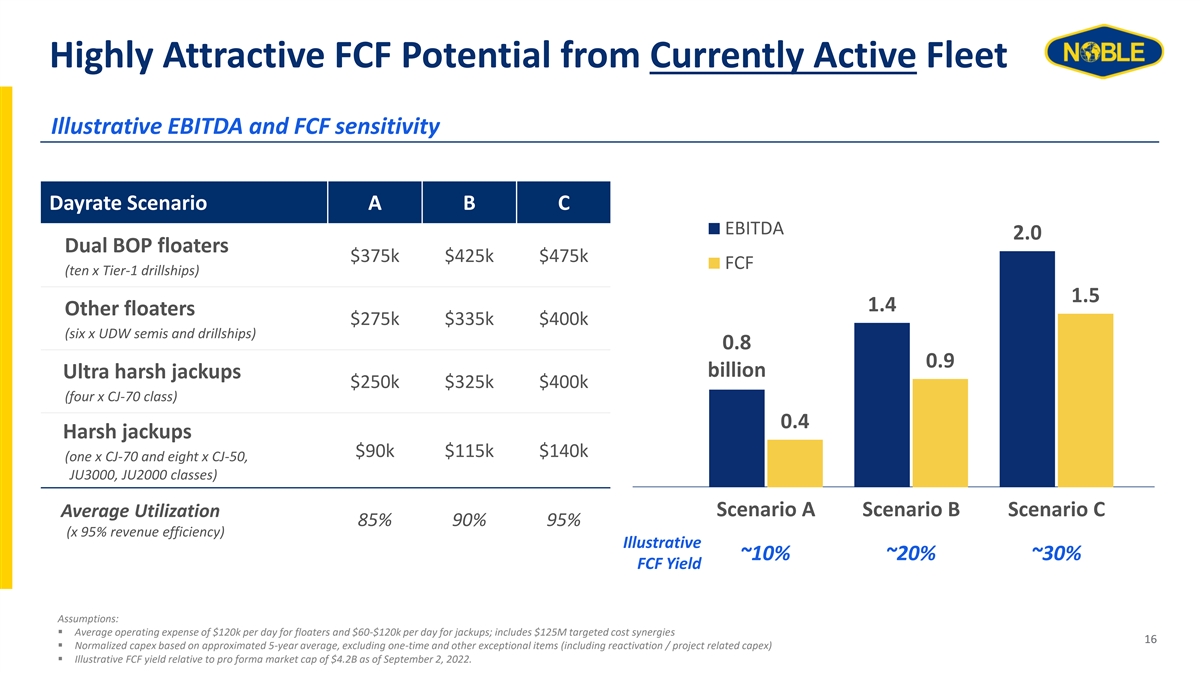
Highly Attractive FCF Potential from Currently Active Fleet Illustrative EBITDA and FCF sensitivity Dayrate Scenario A B C EBITDA 2.0 Dual BOP floaters $375k $425k $475k FCF (ten x Tier-1 drillships) 1.5 1.4 Other floaters $275k $335k $400k (six x UDW semis and drillships) 0.8 0.9 billion Ultra harsh jackups $250k $325k $400k (four x CJ-70 class) 0.4 Harsh jackups $90k $115k $140k (one x CJ-70 and eight x CJ-50, JU3000, JU2000 classes) Scenario A Scenario B Scenario C Average Utilization 85% 90% 95% (x 95% revenue efficiency) Illustrative ~10% ~20% ~30% FCF Yield Assumptions: ▪ Average operating expense of $120k per day for floaters and $60-$120k per day for jackups; includes $125M targeted cost synergies 16 ▪ Normalized capex based on approximated 5-year average, excluding one-time and other exceptional items (including reactivation / project related capex) ▪ Illustrative FCF yield relative to pro forma market cap of $4.2B as of September 2, 2022.
The Noble Platform - Leading the Way A new and dynamic leader in offshore drilling Leader in sustainability & innovation High-spec, highly utilized fleet Global scale with diversification Conservative & flexible balance sheet Increasingly favorable market conditions Attractive FCF with a priority to return capital 17
www.noblecorp.com