
Exhibit 99.2
Disclaimer 2
Disclaimer (cont’d) 3

1 • • • • • • 2 • • • • • • 4

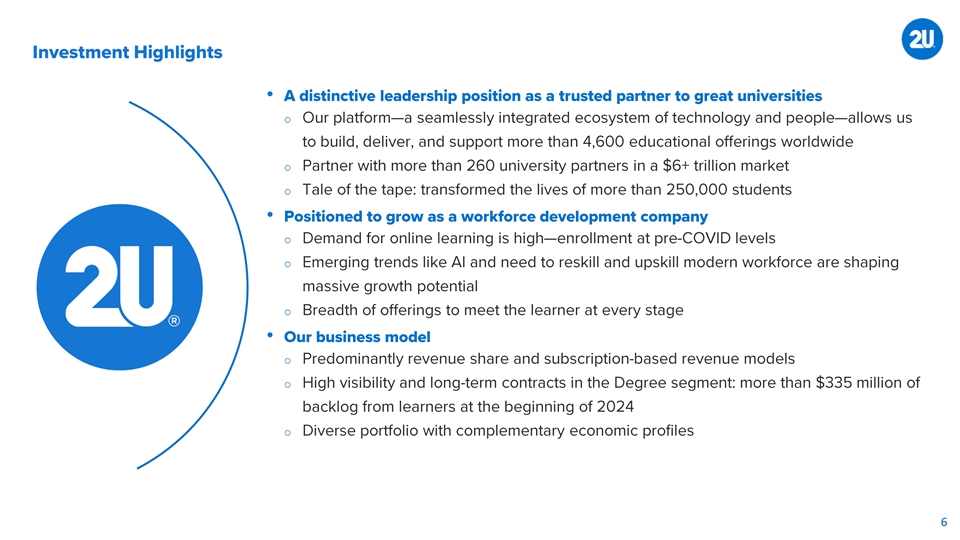
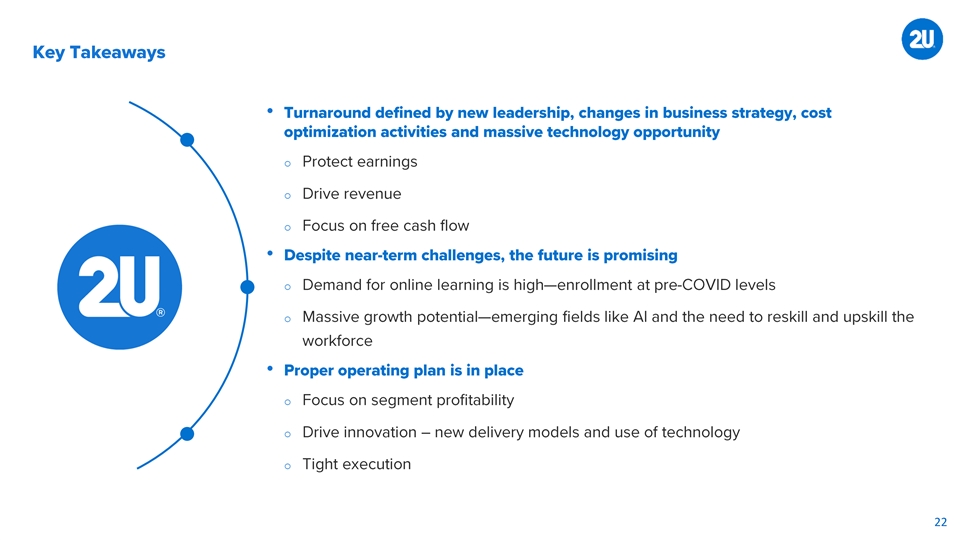
• o o o • o o o • o o o 6
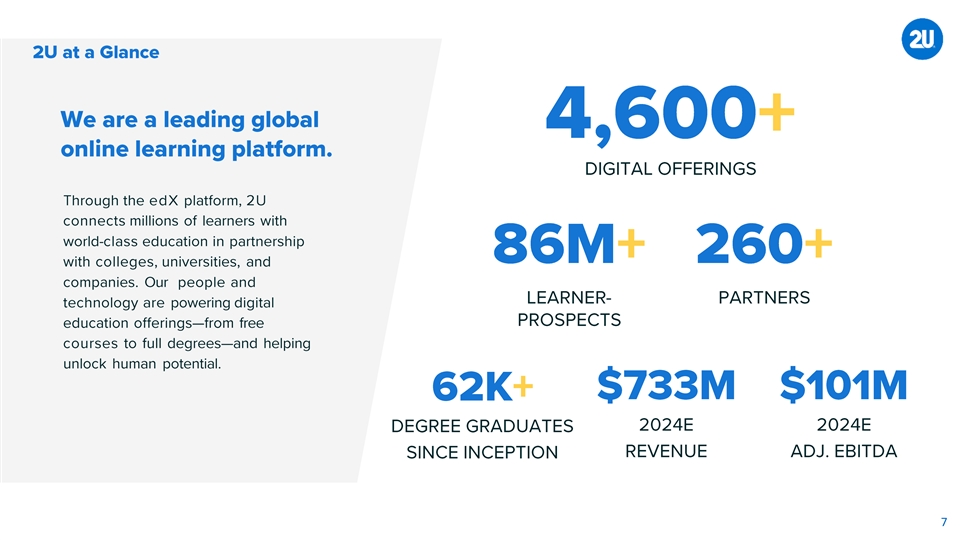
$ in millions 7
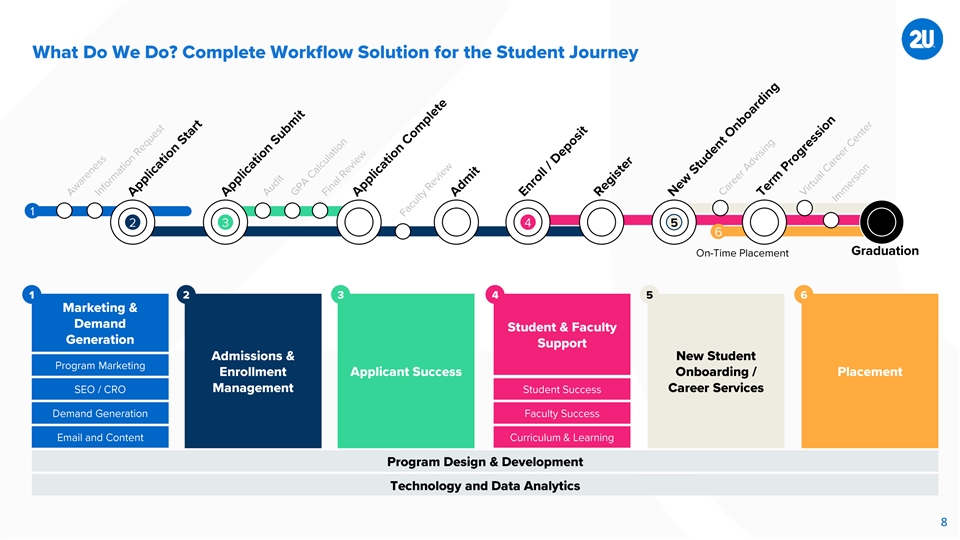
8
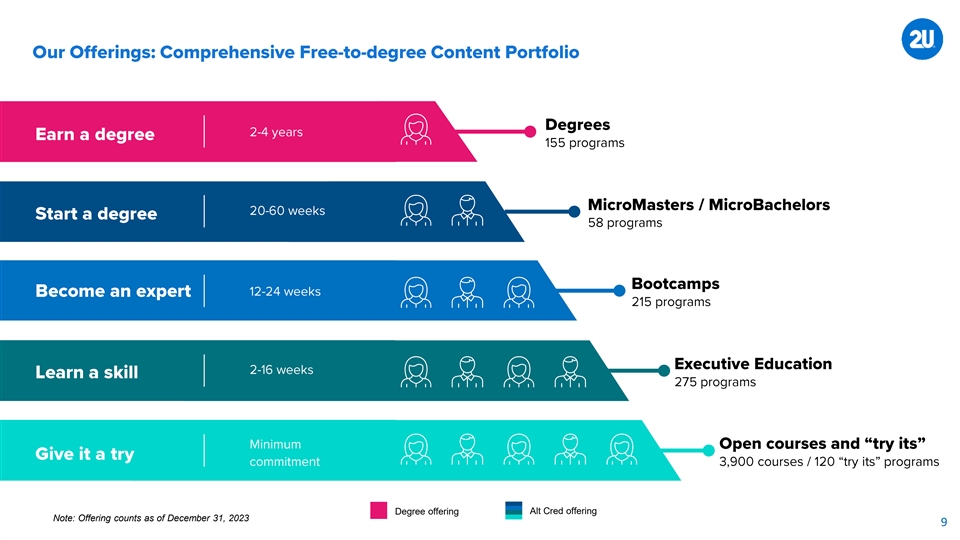
Degree offering Alt Cred offering Note: Offering counts as of December 31, 2023 9
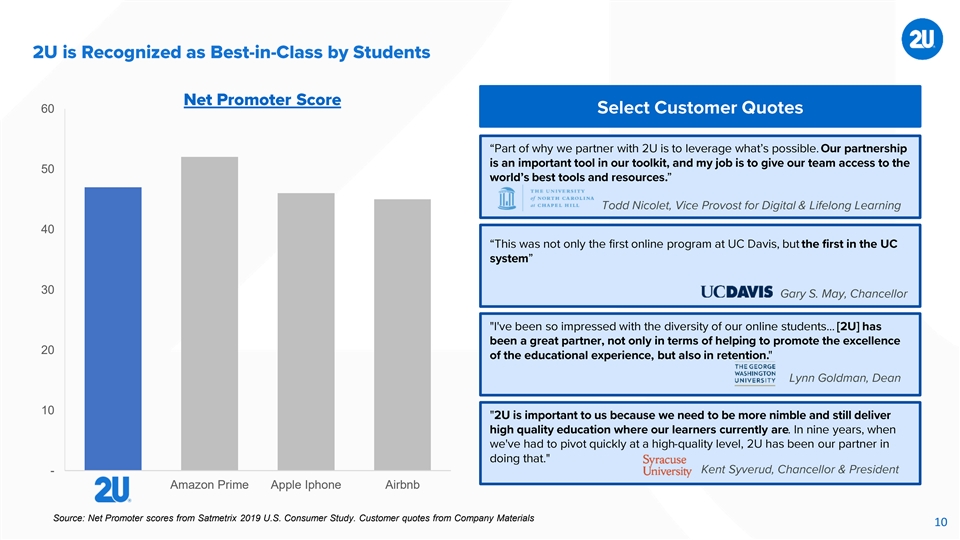
60 50 40 30 20 10 - Amazon Prime Apple Iphone Airbnb Source: Net Promoter scores from Satmetrix 2019 U.S. Consumer Study. Customer quotes from Company Materials 10
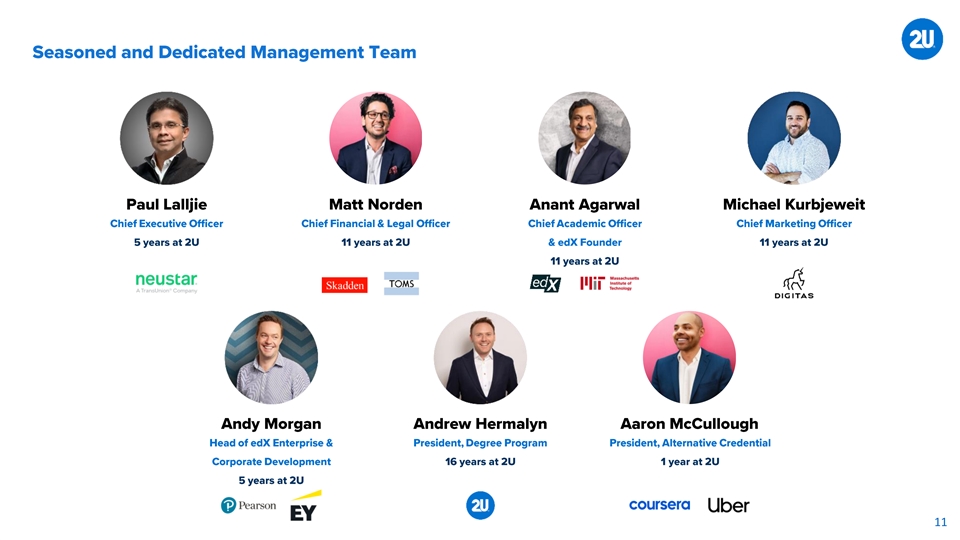
11
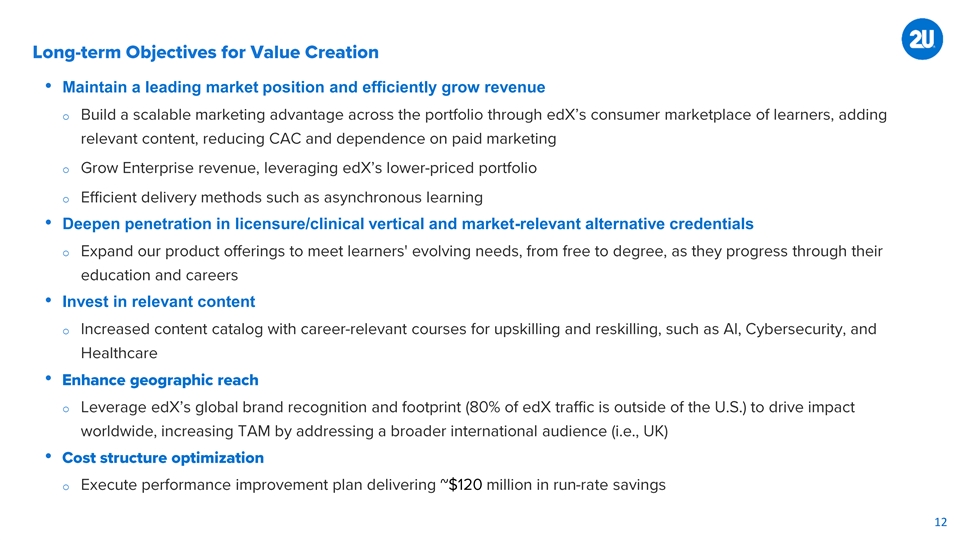
• Maintain a leading market position and efficiently grow revenue o o o • Deepen penetration in licensure/clinical vertical and market-relevant alternative credentials o • Invest in relevant content o • o • o 12
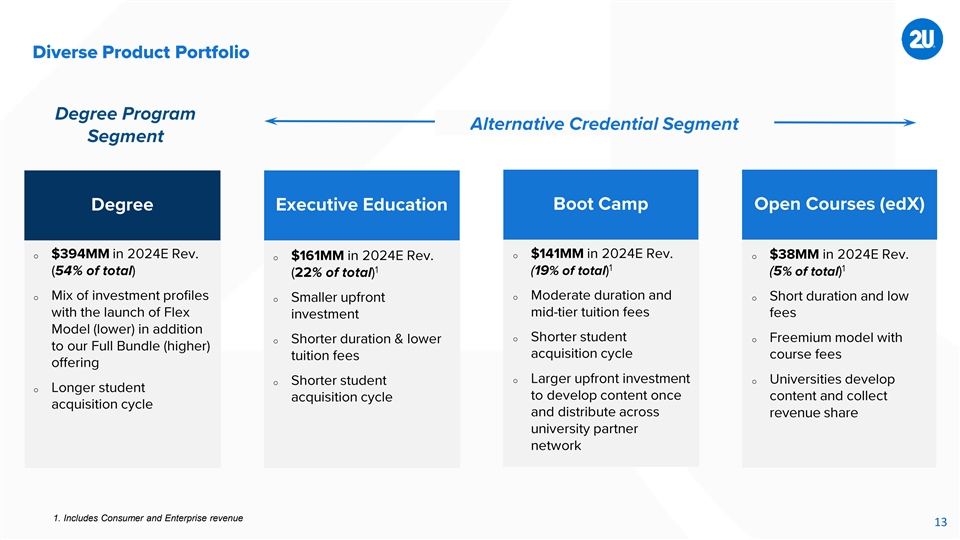
o o o o o o o o o o o o o o o 1. Includes Consumer and Enterprise revenue 13
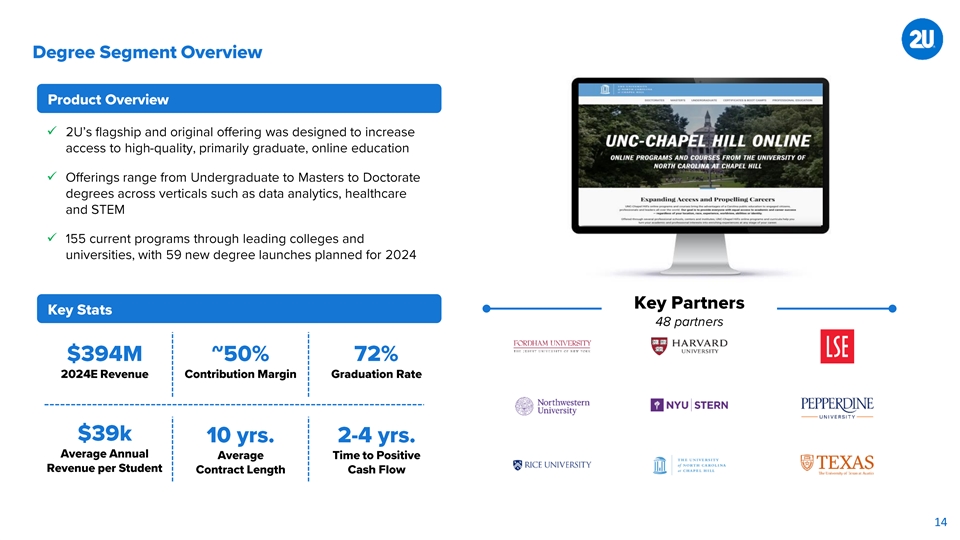
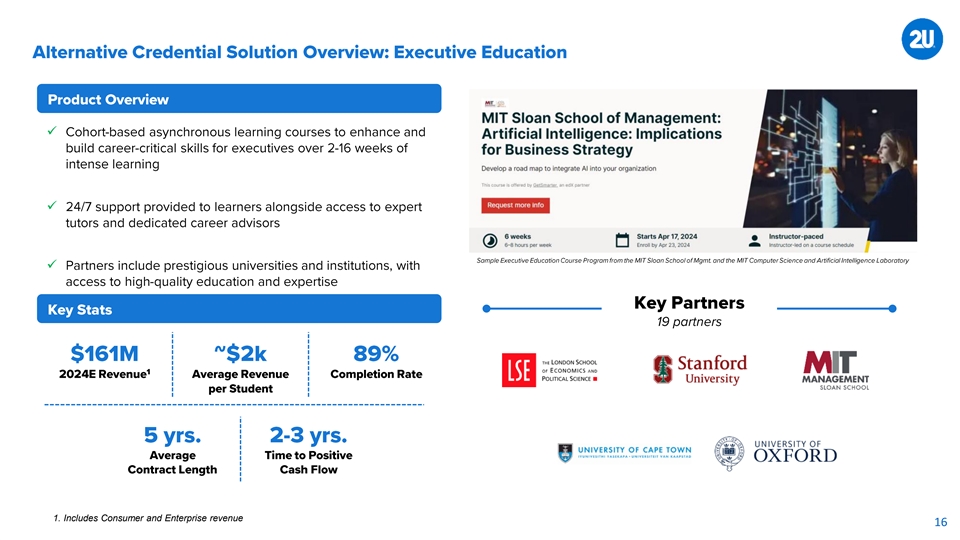
✓ ✓ ✓ 14
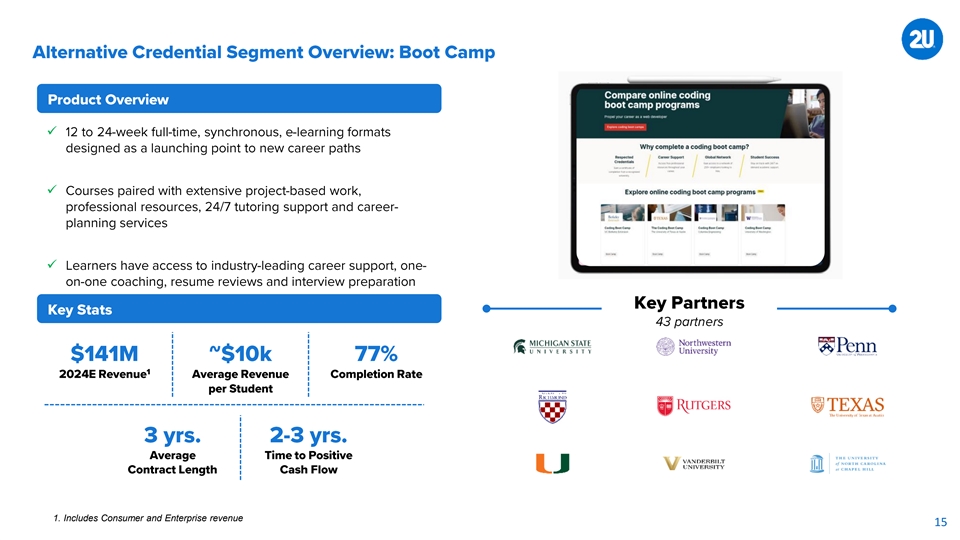
✓ ✓ ✓ 1. Includes Consumer and Enterprise revenue 15
✓ ✓ ✓ 1. Includes Consumer and Enterprise revenue 16
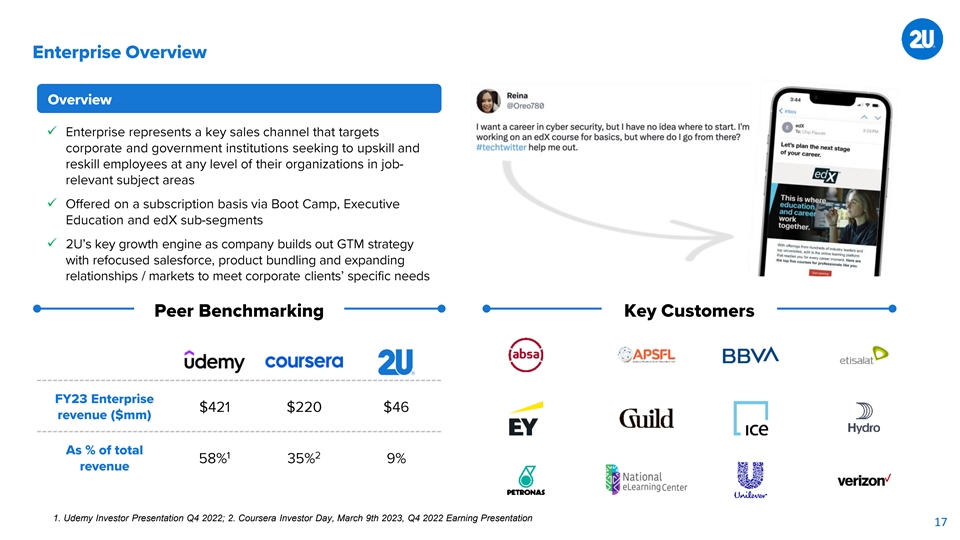
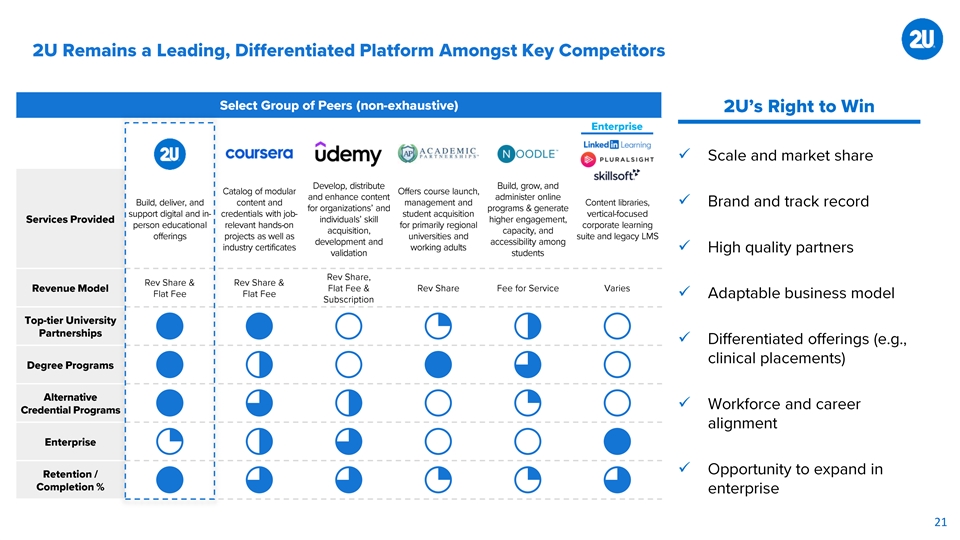
✓ ✓ ✓ 1. Udemy Investor Presentation Q4 2022; 2. Coursera Investor Day, March 9th 2023, Q4 2022 Earning Presentation 17
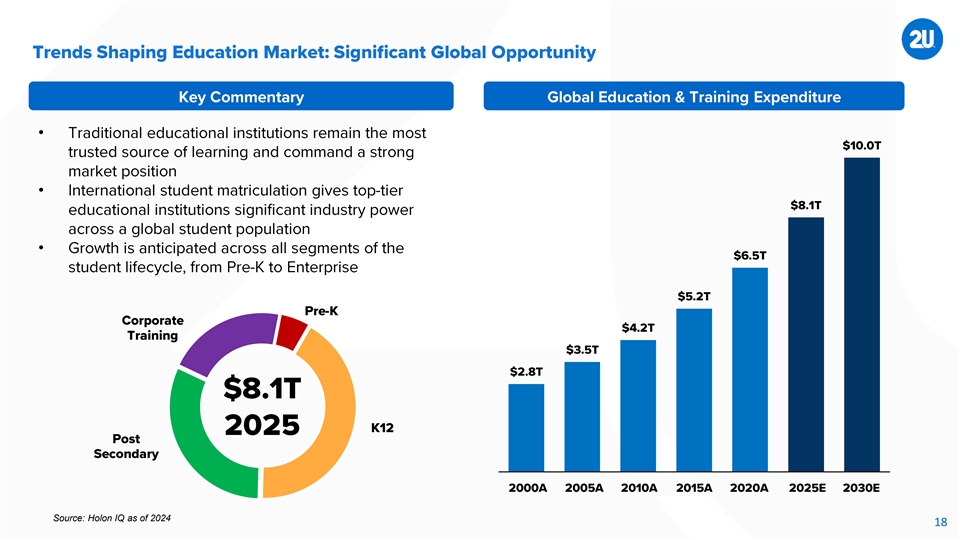
• • • 2000A 2005A 2010A 2015A 2020E 2025E 2030E Source: Holon IQ as of 2024 18
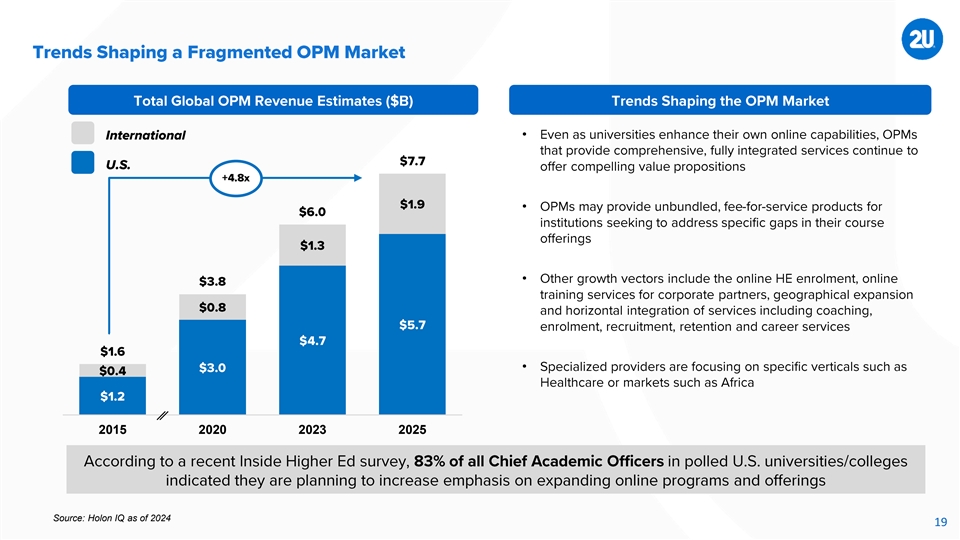
• • • • 2015 2020 2023 2025 Source: Holon IQ as of 2024 19
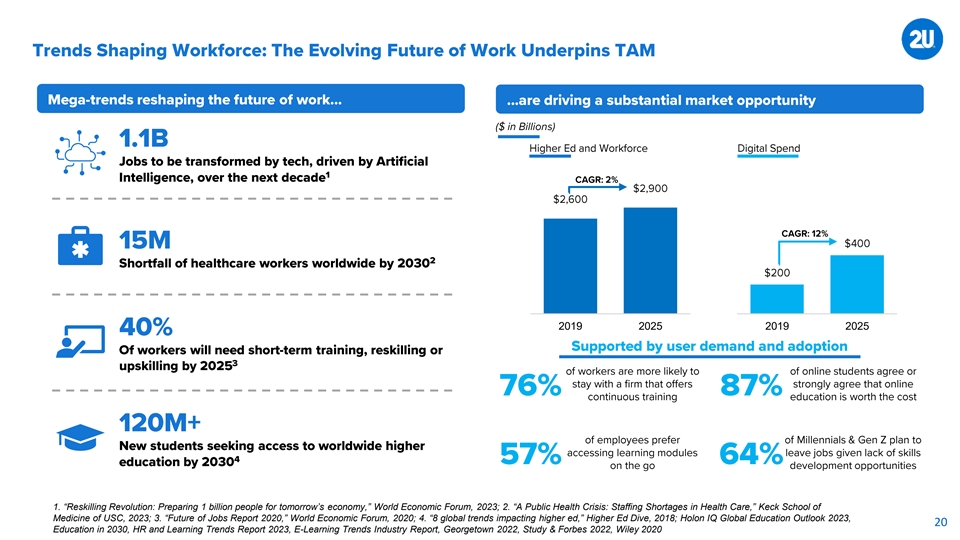
2019 2025 2019 2025 1. “Reskilling Revolution: Preparing 1 billion people for tomorrow’s economy,” World Economic Forum, 2023; 2. “A Public Health Crisis: Staffing Shortages in Health Care,” Keck School of Medicine of USC, 2023; 3. “Future of Jobs Report 2020,” World Economic Forum, 2020; 4. “8 global trends impacting higher ed,” Higher Ed Dive, 2018; Holon IQ Global Education Outlook 2023, 20 Education in 2030, HR and Learning Trends Report 2023, E-Learning Trends Industry Report, Georgetown 2022, Study & Forbes 2022, Wiley 2020
✓ ✓ ✓ ✓ ✓ ✓ ✓ 21
• o o o • o o • o o o 22

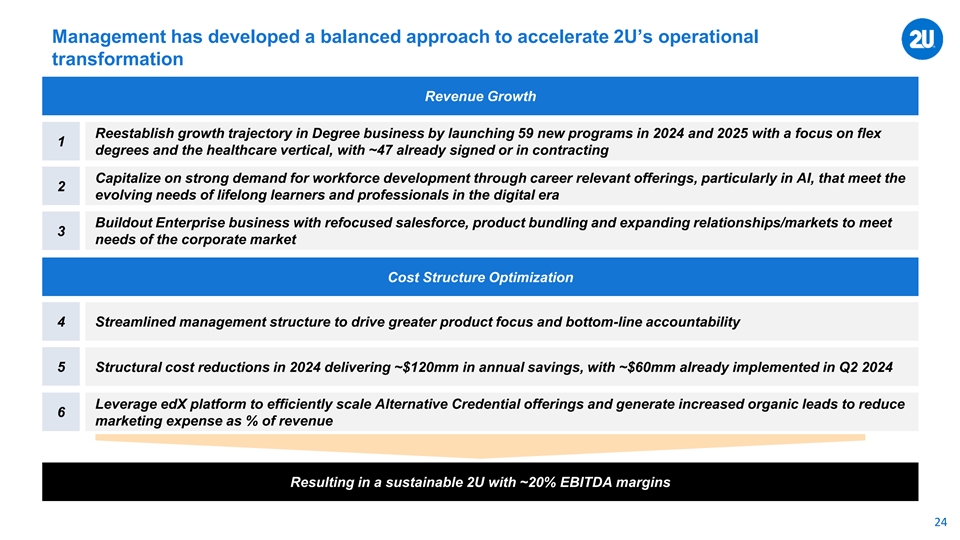
Management has developed a balanced approach to accelerate 2U’s operational transformation Revenue Growth Reestablish growth trajectory in Degree business by launching 59 new programs in 2024 and 2025 with a focus on flex 1 degrees and the healthcare vertical, with ~47 already signed or in contracting Capitalize on strong demand for workforce development through career relevant offerings, particularly in AI, that meet the 2 evolving needs of lifelong learners and professionals in the digital era Buildout Enterprise business with refocused salesforce, product bundling and expanding relationships/markets to meet 3 needs of the corporate market Cost Structure Optimization 4 Streamlined management structure to drive greater product focus and bottom-line accountability 5 Structural cost reductions in 2024 delivering ~$120mm in annual savings, with ~$60mm already implemented in Q2 2024 Leverage edX platform to efficiently scale Alternative Credential offerings and generate increased organic leads to reduce 6 marketing expense as % of revenue Resulting in a sustainable 2U with ~20% EBITDA margins 24
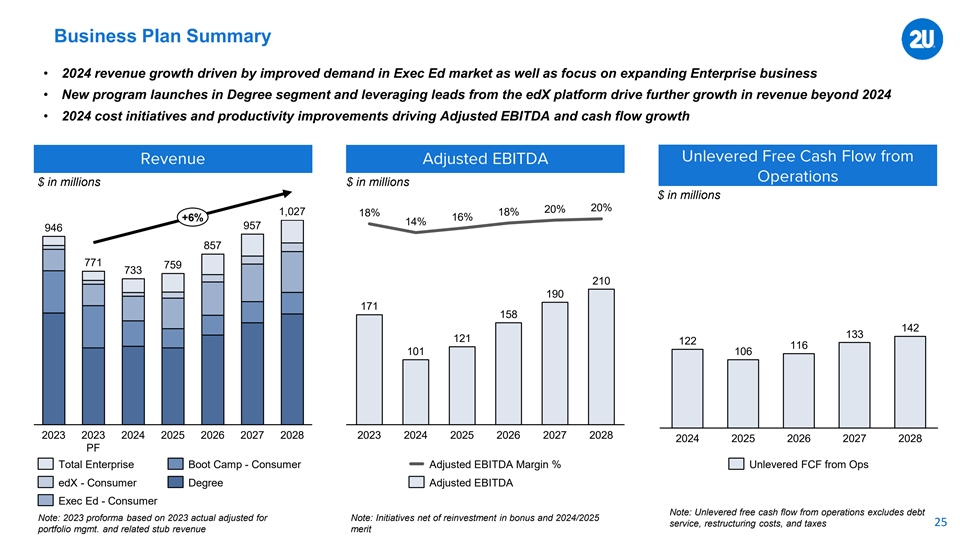
Business Plan Summary • 2024 revenue growth driven by improved demand in Exec Ed market as well as focus on expanding Enterprise business • New program launches in Degree segment and leveraging leads from the edX platform drive further growth in revenue beyond 2024 • 2024 cost initiatives and productivity improvements driving Adjusted EBITDA and cash flow growth $ in millions $ in millions $ in millions 350 30 20% 20% 1,027 18% 18% +6% 16% 20 14% 957 946 300 10 857 0 771 250 759 733 210 190 200 -20 171 158 -30 150 142 133 121 122 -40 116 101 106 100 -50 -60 50 -70 0 -80 2023 2023 2024 2025 2026 2027 2028 2023 2024 2025 2026 2027 2028 2024 2025 2026 2027 2028 PF Total Enterprise Boot Camp - Consumer Adjusted EBITDA Margin % Unlevered FCF from Ops edX - Consumer Degree Adjusted EBITDA Exec Ed - Consumer Note: Unlevered free cash flow from operations excludes debt Note: 2023 proforma based on 2023 actual adjusted for Note: Initiatives net of reinvestment in bonus and 2024/2025 service, restructuring costs, and taxes 25 portfolio mgmt. and related stub revenue merit
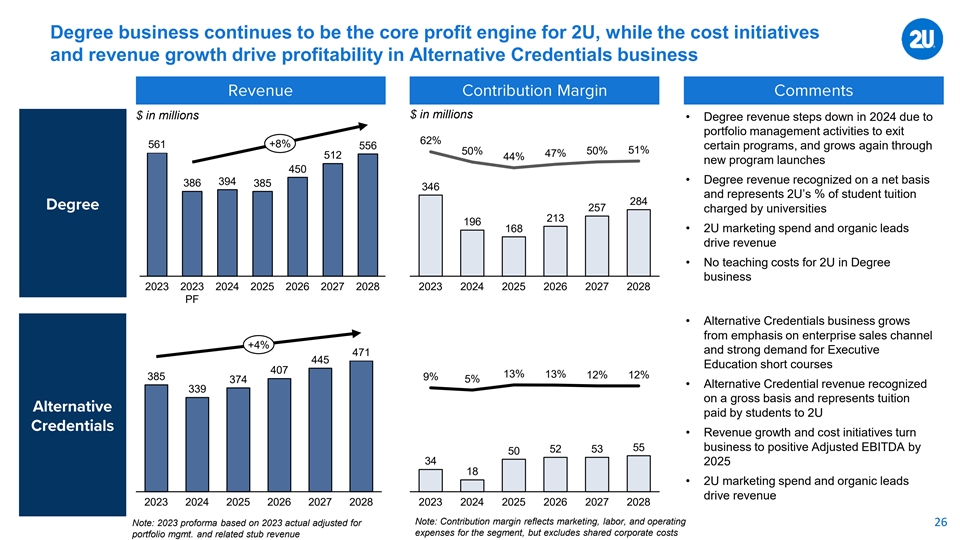
Degree business continues to be the core profit engine for 2U, while the cost initiatives and revenue growth drive profitability in Alternative Credentials business $ in millions $ in millions • Degree revenue steps down in 2024 due to portfolio management activities to exit 600 80 62% 561 +8% 556 certain programs, and grows again through 51% 50% 50% 47% 60 512 44% 500 new program launches 450 40 • Degree revenue recognized on a net basis 394 386 385 400 346 20 and represents 2U’s % of student tuition 284 300 0 257 charged by universities 213 196 -20 168 • 2U marketing spend and organic leads 200 -40 drive revenue 100 -60 • No teaching costs for 2U in Degree 0 -80 business 2023 2023 2024 2025 2026 2027 2028 2023 2024 2025 2026 2027 2028 PF • Alternative Credentials business grows from emphasis on enterprise sales channel +4% and strong demand for Executive 471 445 200 50 Education short courses 407 13% 13% 12% 12% 385 9% 374 5% • Alternative Credential revenue recognized 339 150 0 on a gross basis and represents tuition paid by students to 2U 100 -50 • Revenue growth and cost initiatives turn 55 business to positive Adjusted EBITDA by 52 53 50 50 -100 34 2025 18 • 2U marketing spend and organic leads 0 -150 drive revenue 2023 2024 2025 2026 2027 2028 2023 2024 2025 2026 2027 2028 Note: Contribution margin reflects marketing, labor, and operating Note: 2023 proforma based on 2023 actual adjusted for 26 expenses for the segment, but excludes shared corporate costs portfolio mgmt. and related stub revenue
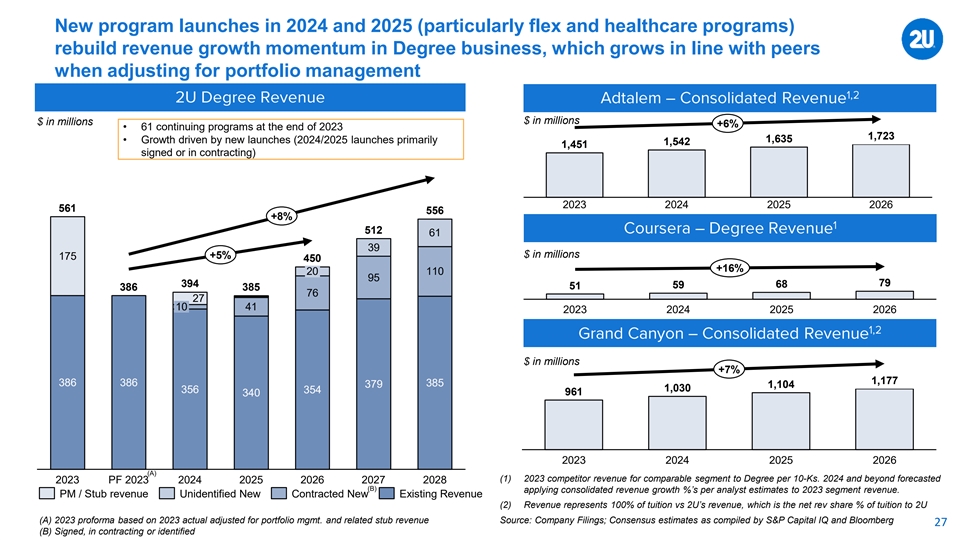
New program launches in 2024 and 2025 (particularly flex and healthcare programs) rebuild revenue growth momentum in Degree business, which grows in line with peers when adjusting for portfolio management $ in millions $ in millions +6% • 61 continuing programs at the end of 2023 1,723 1,635 • Growth driven by new launches (2024/2025 launches primarily 1,542 1,451 signed or in contracting) 2023 2024 2025 2026 561 556 +8% 512 61 39 +5% $ in millions 175 450 +16% 20 110 95 79 394 68 51 59 386 385 76 27 10 41 2023 2024 2025 2026 $ in millions +7% 1,177 386 386 385 379 1,104 1,030 356 354 961 340 2023 2024 2025 2026 (A) (1) 2023 competitor revenue for comparable segment to Degree per 10-Ks. 2024 and beyond forecasted 2023 PF 2023 2024 2025 2026 2027 2028 (B) applying consolidated revenue growth %’s per analyst estimates to 2023 segment revenue. PM / Stub revenue Unidentified New Contracted New Existing Revenue (2) Revenue represents 100% of tuition vs 2U’s revenue, which is the net rev share % of tuition to 2U (A) 2023 proforma based on 2023 actual adjusted for portfolio mgmt. and related stub revenue Source: Company Filings; Consensus estimates as compiled by S&P Capital IQ and Bloomberg 27 (B) Signed, in contracting or identified
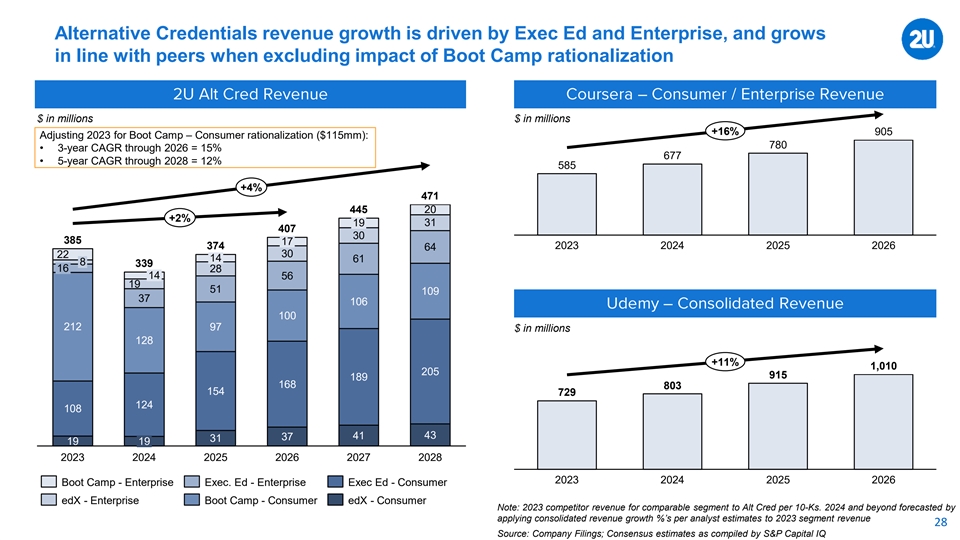
Alternative Credentials revenue growth is driven by Exec Ed and Enterprise, and grows in line with peers when excluding impact of Boot Camp rationalization $ in millions $ in millions +16% 905 Adjusting 2023 for Boot Camp – Consumer rationalization ($115mm): 780 • 3-year CAGR through 2026 = 15% 677 • 5-year CAGR through 2028 = 12% 585 +4% 471 445 20 +2% 19 31 407 30 385 17 374 2023 2024 2025 2026 64 30 22 14 61 8 339 16 28 14 56 19 51 109 37 106 100 212 97 $ in millions 128 +11% 1,010 205 915 189 168 803 154 729 124 108 43 37 41 31 19 19 2023 2024 2025 2026 2027 2028 2023 2024 2025 2026 Boot Camp - Enterprise Exec. Ed - Enterprise Exec Ed - Consumer edX - Enterprise Boot Camp - Consumer edX - Consumer Note: 2023 competitor revenue for comparable segment to Alt Cred per 10-Ks. 2024 and beyond forecasted by applying consolidated revenue growth %’s per analyst estimates to 2023 segment revenue 28 Source: Company Filings; Consensus estimates as compiled by S&P Capital IQ
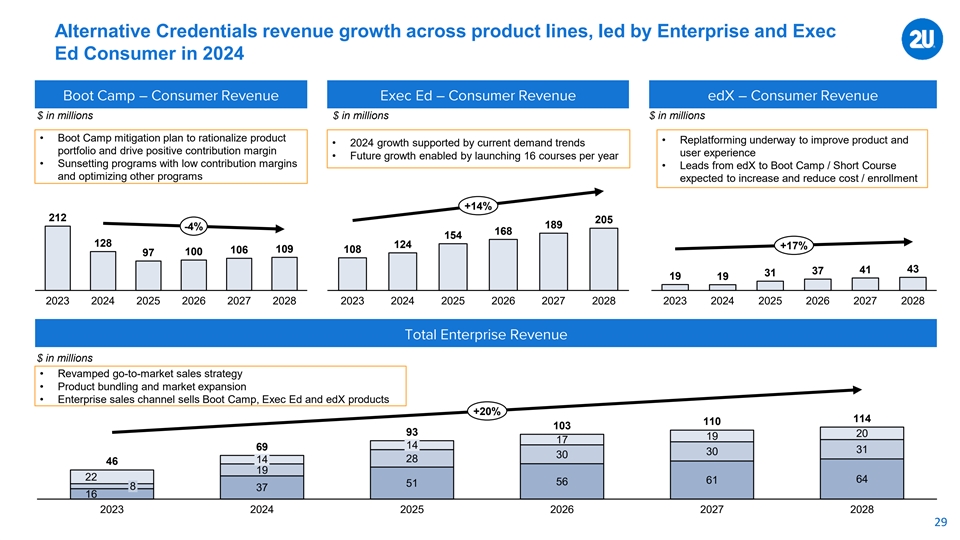
Alternative Credentials revenue growth across product lines, led by Enterprise and Exec Ed Consumer in 2024 $ in millions $ in millions $ in millions • Boot Camp mitigation plan to rationalize product • Replatforming underway to improve product and • 2024 growth supported by current demand trends portfolio and drive positive contribution margin user experience • Future growth enabled by launching 16 courses per year • Sunsetting programs with low contribution margins • Leads from edX to Boot Camp / Short Course and optimizing other programs expected to increase and reduce cost / enrollment +14% 212 205 189 -4% 168 154 128 124 +17% 106 109 108 97 100 41 43 37 31 19 19 2023 2024 2025 2026 2027 2028 2023 2024 2025 2026 2027 2028 2023 2024 2025 2026 2027 2028 $ in millions • Revamped go-to-market sales strategy • Product bundling and market expansion • Enterprise sales channel sells Boot Camp, Exec Ed and edX products +20% 114 110 103 93 20 19 17 14 69 31 30 30 28 14 46 19 22 64 61 56 51 8 37 16 2023 2024 2025 2026 2027 2028 29
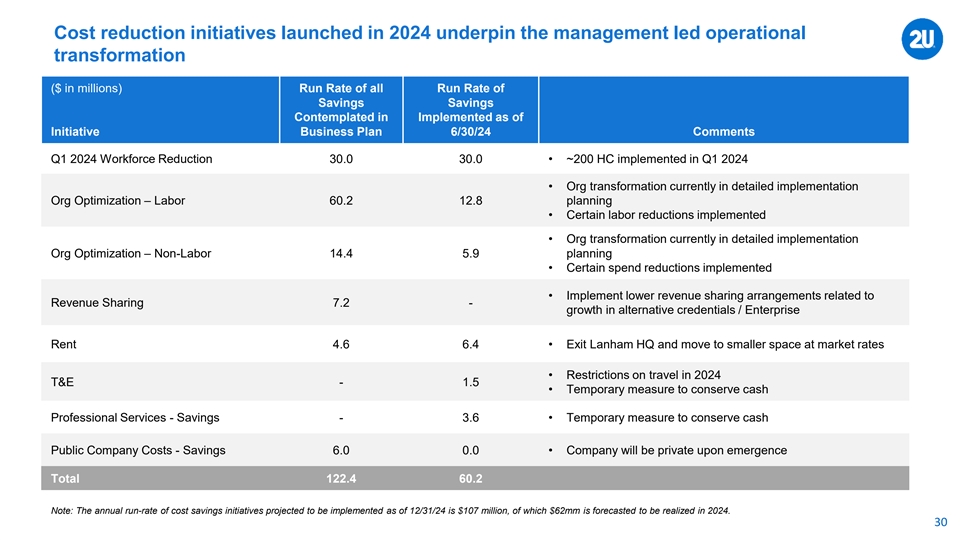
Cost reduction initiatives launched in 2024 underpin the management led operational transformation ($ in millions) Run Rate of all Run Rate of Savings Savings Contemplated in Implemented as of Initiative Business Plan 6/30/24 Comments Q1 2024 Workforce Reduction 30.0 30.0 • ~200 HC implemented in Q1 2024 • Org transformation currently in detailed implementation Org Optimization – Labor 60.2 12.8 planning • Certain labor reductions implemented • Org transformation currently in detailed implementation Org Optimization – Non-Labor 14.4 5.9 planning • Certain spend reductions implemented • Implement lower revenue sharing arrangements related to Revenue Sharing 7.2 - growth in alternative credentials / Enterprise Rent 4.6 6.4 • Exit Lanham HQ and move to smaller space at market rates • Restrictions on travel in 2024 T&E - 1.5 • Temporary measure to conserve cash Professional Services - Savings - 3.6 • Temporary measure to conserve cash Public Company Costs - Savings 6.0 0.0 • Company will be private upon emergence Total 122.4 60.2 Note: The annual run-rate of cost savings initiatives projected to be implemented as of 12/31/24 is $107 million, of which $62mm is forecasted to be realized in 2024. 30
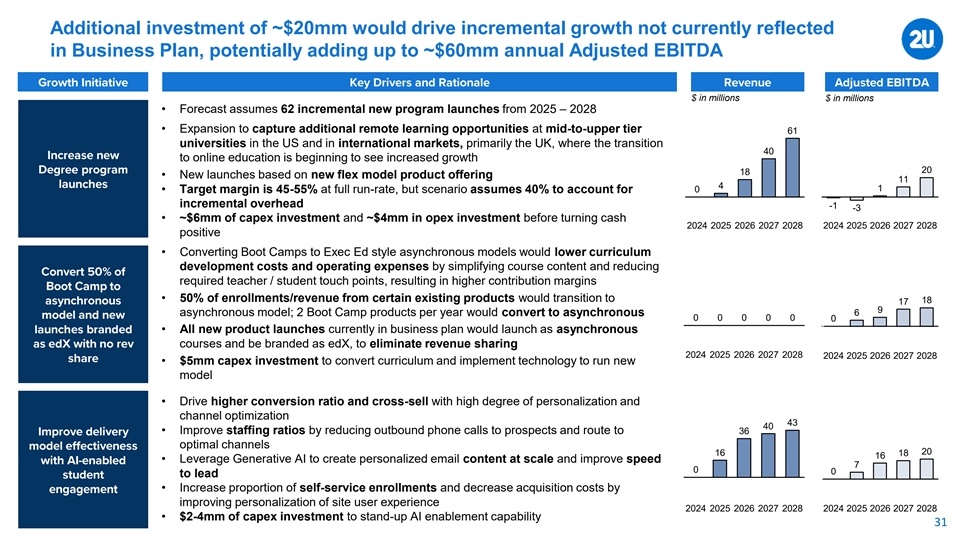
Additional investment of ~$20mm would drive incremental growth not currently reflected in Business Plan, potentially adding up to ~$60mm annual Adjusted EBITDA $ in millions $ in millions • Forecast assumes 62 incremental new program launches from 2025 – 2028 80 800 0 • Expansion to capture additional remote learning opportunities at mid-to-upper tier 61 60 60 universities in the US and in international markets, primarily the UK, where the transition -20 -20 40 to online education is beginning to see increased growth 40 40 -40 -40 20 18 • New launches based on new flex model product offering 20 20 11 4 0 1 • Target margin is 45-55% at full run-rate, but scenario assumes 40% to account for -60 -60 0 0 incremental overhead -1 -3 -20 -20-80 -80 • ~$6mm of capex investment and ~$4mm in opex investment before turning cash 2024 2025 2026 2027 2028 2024 2025 2026 2027 2028 positive 80 801.0 1.0 • Converting Boot Camps to Exec Ed style asynchronous models would lower curriculum 60 600.8 0.8 development costs and operating expenses by simplifying course content and reducing required teacher / student touch points, resulting in higher contribution margins 40 400.6 0.6 • 50% of enrollments/revenue from certain existing products would transition to 18 17 20 200.4 0.4 9 asynchronous model; 2 Boot Camp products per year would convert to asynchronous 6 0 0 0 0 0 0 0 00.2 0.2 • All new product launches currently in business plan would launch as asynchronous courses and be branded as edX, to eliminate revenue sharing -20 -200.0 0.0 2024 2025 2026 2027 2028 2024 2025 2026 2027 2028 • $5mm capex investment to convert curriculum and implement technology to run new model 80 1.0 80 1.0 • Drive higher conversion ratio and cross-sell with high degree of personalization and 60 0.8 channel optimization 60 0.8 43 40 • Improve staffing ratios by reducing outbound phone calls to prospects and route to 36 40 0.6 40 0.6 optimal channels 20 16 18 20 0.4 16 • Leverage Generative AI to create personalized email content at scale and improve speed 20 0.4 7 0 0 to lead 0 0.2 0 0.2 • Increase proportion of self-service enrollments and decrease acquisition costs by -20 -200.0 0.0 improving personalization of site user experience 2024 2025 2026 2027 2028 2024 2025 2026 2027 2028 • $2-4mm of capex investment to stand-up AI enablement capability 31
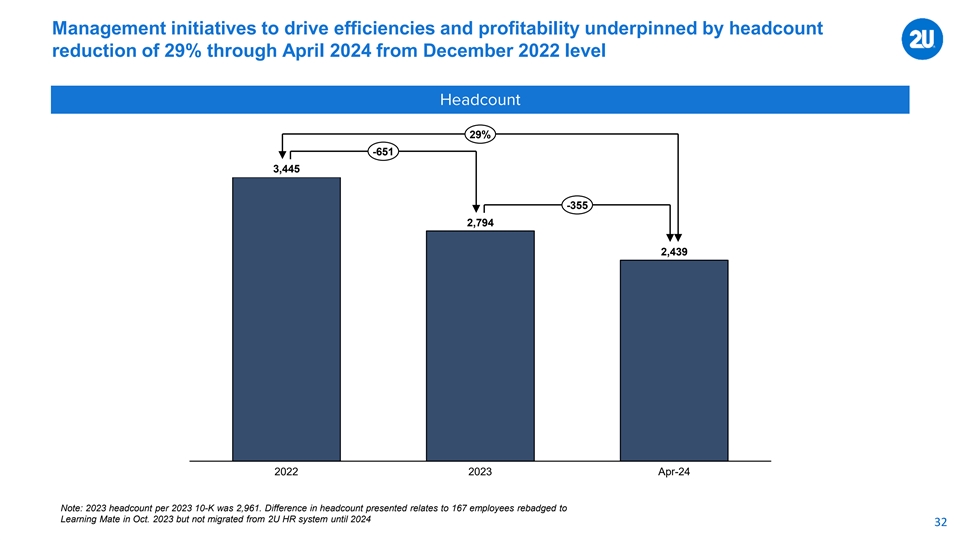
Management initiatives to drive efficiencies and profitability underpinned by headcount reduction of 29% through April 2024 from December 2022 level 29% -651 3,445 -355 2,794 2,439 2022 2023 Apr-24 Note: 2023 headcount per 2023 10-K was 2,961. Difference in headcount presented relates to 167 employees rebadged to Learning Mate in Oct. 2023 but not migrated from 2U HR system until 2024 32
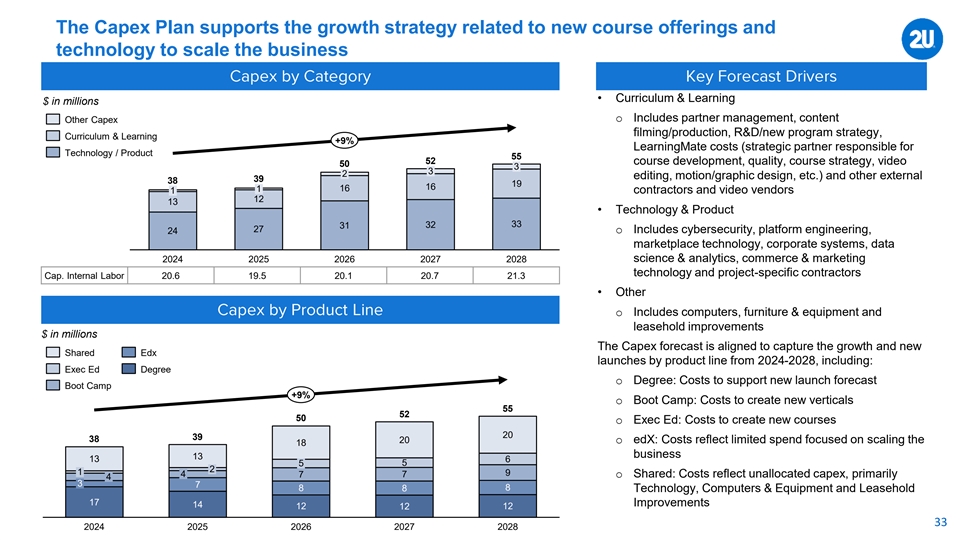
The Capex Plan supports the growth strategy related to new course offerings and technology to scale the business • Curriculum & Learning $ in millions Other Capex o Includes partner management, content filming/production, R&D/new program strategy, Curriculum & Learning +9% LearningMate costs (strategic partner responsible for Technology / Product 55 52 course development, quality, course strategy, video 50 3 3 2 editing, motion/graphic design, etc.) and other external 39 38 19 16 1 16 1 contractors and video vendors 12 13 • Technology & Product 32 33 31 27 o Includes cybersecurity, platform engineering, 24 marketplace technology, corporate systems, data 2024 2025 2026 2027 2028 science & analytics, commerce & marketing technology and project-specific contractors Cap. Internal Labor 20.6 19.5 20.1 20.7 21.3 • Other o Includes computers, furniture & equipment and leasehold improvements $ in millions The Capex forecast is aligned to capture the growth and new Shared Edx launches by product line from 2024-2028, including: Exec Ed Degree o Degree: Costs to support new launch forecast Boot Camp +9% o Boot Camp: Costs to create new verticals 55 52 50 o Exec Ed: Costs to create new courses 20 39 38 20 o edX: Costs reflect limited spend focused on scaling the 18 business 13 13 6 5 5 2 1 9 4 7 7 o Shared: Costs reflect unallocated capex, primarily 4 3 7 8 8 8 Technology, Computers & Equipment and Leasehold 17 Improvements 14 12 12 12 33 2024 2025 2026 2027 2028
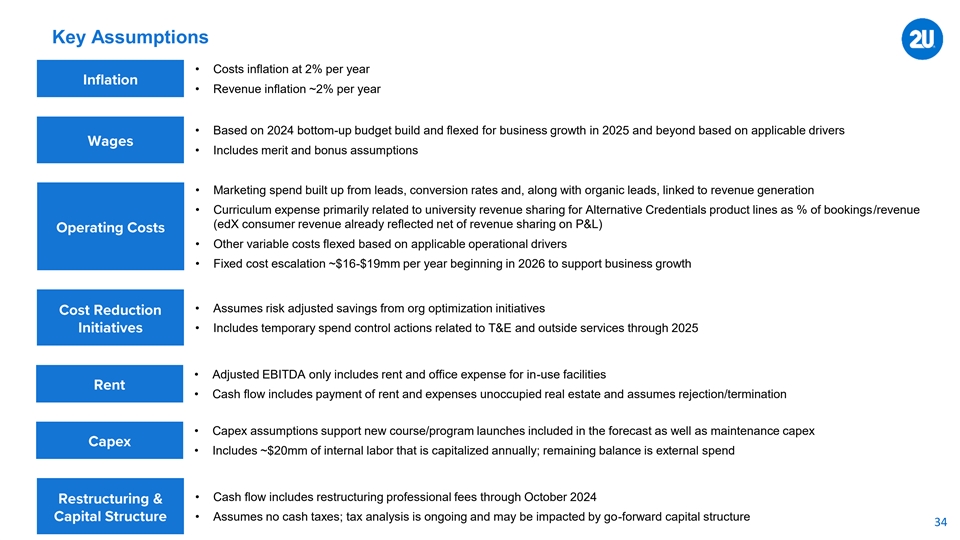
Key Assumptions • Costs inflation at 2% per year • Revenue inflation ~2% per year • Based on 2024 bottom-up budget build and flexed for business growth in 2025 and beyond based on applicable drivers • Includes merit and bonus assumptions • Marketing spend built up from leads, conversion rates and, along with organic leads, linked to revenue generation • Curriculum expense primarily related to university revenue sharing for Alternative Credentials product lines as % of bookings/revenue (edX consumer revenue already reflected net of revenue sharing on P&L) • Other variable costs flexed based on applicable operational drivers • Fixed cost escalation ~$16-$19mm per year beginning in 2026 to support business growth • Assumes risk adjusted savings from org optimization initiatives • Includes temporary spend control actions related to T&E and outside services through 2025 • Adjusted EBITDA only includes rent and office expense for in-use facilities • Cash flow includes payment of rent and expenses unoccupied real estate and assumes rejection/termination • Capex assumptions support new course/program launches included in the forecast as well as maintenance capex • Includes ~$20mm of internal labor that is capitalized annually; remaining balance is external spend • Cash flow includes restructuring professional fees through October 2024 • Assumes no cash taxes; tax analysis is ongoing and may be impacted by go-forward capital structure 34
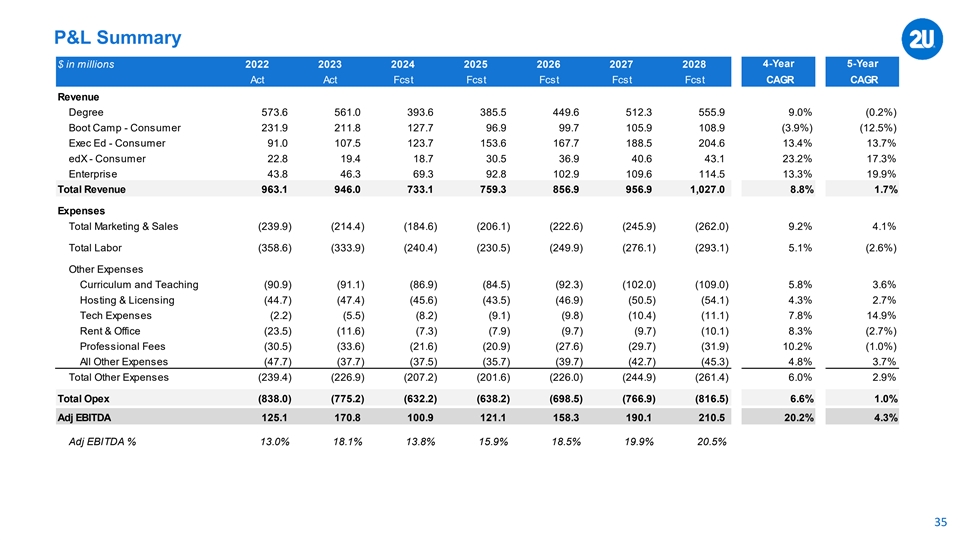
P&L Summary 4-Year 5-Year $ in millions 2022 2023 2024 2025 2026 2027 2028 Act Act Fcst Fcst Fcst Fcst Fcst CAGR CAGR Revenue Degree 573.6 561.0 393.6 385.5 449.6 512.3 555.9 9.0% (0.2%) Boot Camp - Consumer 231.9 211.8 127.7 9 6.9 9 9.7 105.9 108.9 (3.9%) (12.5%) Exec Ed - Consumer 91.0 107.5 123.7 153.6 167.7 188.5 204.6 13.4% 13.7% edX - Consumer 2 2.8 19.4 1 8.7 3 0.5 3 6.9 4 0.6 4 3.1 23.2% 17.3% Enterprise 4 3.8 4 6.3 6 9.3 9 2.8 102.9 109.6 114.5 13.3% 19.9% Total Revenue 963.1 946.0 733.1 759.3 856.9 956.9 1,027.0 8.8% 1.7% Expenses Total Marketing & Sales (239.9) (214.4) (184.6) (206.1) (222.6) (245.9) (262.0) 9.2% 4.1% Total Labor (358.6) (333.9) (240.4) (230.5) (249.9) (276.1) (293.1) 5.1% (2.6%) Other Expenses Curriculum and Teaching (90.9) (91.1) (86.9) (84.5) (92.3) (102.0) (109.0) 5.8% 3.6% Hosting & Licensing (44.7) (47.4) (45.6) (43.5) (46.9) (50.5) (54.1) 4.3% 2.7% Tech Expenses (2.2) (5.5) (8 .2) (9 .1) (9 .8) (10.4) (11.1) 7.8% 14.9% Rent & Office (23.5) (11.6) (7.3) (7 .9) (9.7) (9.7) (10.1) 8.3% (2.7%) Professional Fees (30.5) (33.6) (21.6) (20.9) (27.6) (29.7) (31.9) 10.2% (1.0%) All Other Expenses (47.7) (37.7) (37.5) (35.7) (39.7) (42.7) (45.3) 4.8% 3.7% Total Other Expenses (239.4) (226.9) (207.2) (201.6) (226.0) (244.9) (261.4) 6.0% 2.9% Total Opex (838.0) (775.2) (632.2) (638.2) (698.5) (766.9) (816.5) 6.6% 1.0% Adj EBITDA 125.1 170.8 100.9 121.1 158.3 190.1 210.5 20.2% 4.3% Adj EBITDA % 13.0% 18.1% 13.8% 15.9% 18.5% 19.9% 20.5% 35
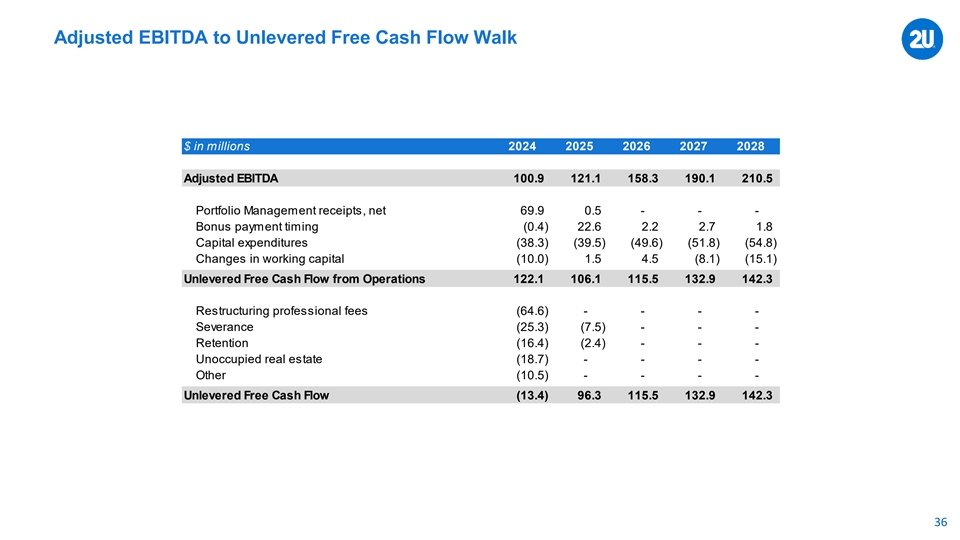
Adjusted EBITDA to Unlevered Free Cash Flow Walk $ in millions 2024 2025 2026 2027 2028 Adjusted EBITDA 100.9 121.1 158.3 190.1 210.5 Portfolio Management receipts, net 69.9 0.5 - - - Bonus payment timing (0.4) 22.6 2 .2 2.7 1.8 Capital expenditures (38.3) (39.5) (49.6) (51.8) (54.8) Changes in working capital (10.0) 1 .5 4.5 (8.1) (15.1) Unlevered Free Cash Flow from Operations 122.1 106.1 115.5 132.9 142.3 Restructuring professional fees (64.6) - - - - Severance (25.3) (7.5) - - - Retention (16.4) (2.4) - - - Unoccupied real estate (18.7) - - - - Other (10.5) - - - - Unlevered Free Cash Flow (13.4) 96.3 115.5 132.9 142.3 36

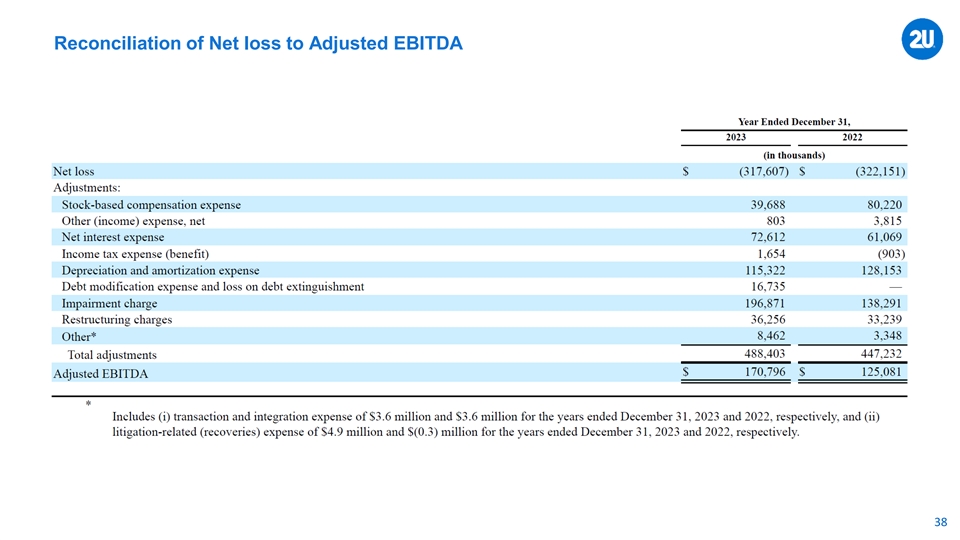
Reconciliation of Net loss to Adjusted EBITDA 38
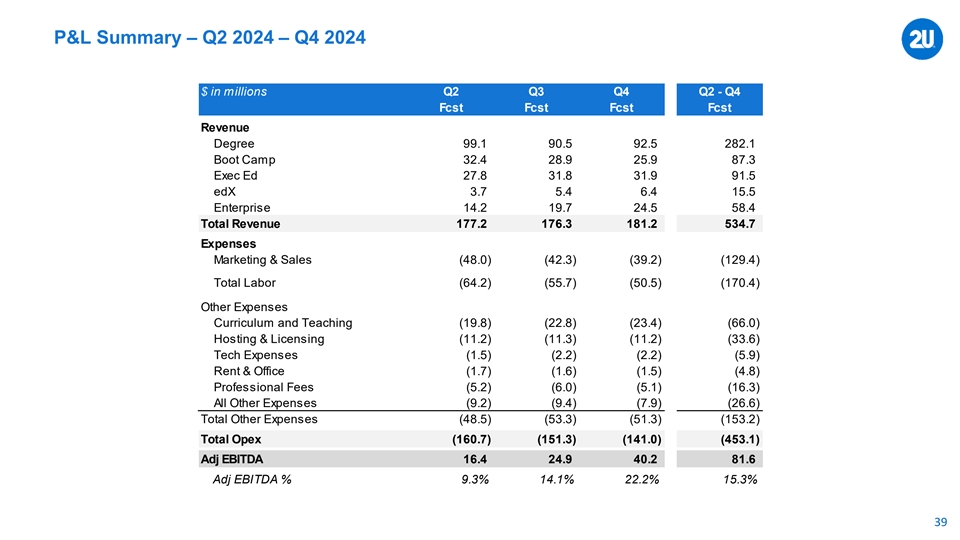
P&L Summary – Q2 2024 – Q4 2024 $ in millions Q2 Q3 Q4 Q2 - Q4 Fcst Fcst Fcst Fcst Revenue Degree 99.1 90.5 92.5 282.1 Boot Camp 3 2.4 2 8.9 25.9 87.3 Exec Ed 2 7.8 3 1.8 31.9 91.5 edX 3.7 5.4 6.4 15.5 Enterprise 1 4.2 19.7 24.5 58.4 Total Revenue 177.2 176.3 181.2 534.7 Expenses Marketing & Sales (48.0) (42.3) (39.2) (129.4) Total Labor (64.2) (55.7) (50.5) (170.4) Other Expenses Curriculum and Teaching (19.8) (22.8) (23.4) (66.0) Hosting & Licensing (11.2) (11.3) (11.2) (33.6) Tech Expenses (1.5) (2 .2) (2.2) (5.9) Rent & Office (1.7) (1.6) (1.5) (4 .8) Professional Fees (5.2) (6.0) (5.1) (16.3) All Other Expenses (9.2) (9.4) (7.9) (26.6) Total Other Expenses (48.5) (53.3) (51.3) (153.2) Total Opex (160.7) (151.3) (141.0) (453.1) Adj EBITDA 1 6.4 24.9 40.2 8 1.6 Adj EBITDA % 9.3% 14.1% 22.2% 15.3% 39
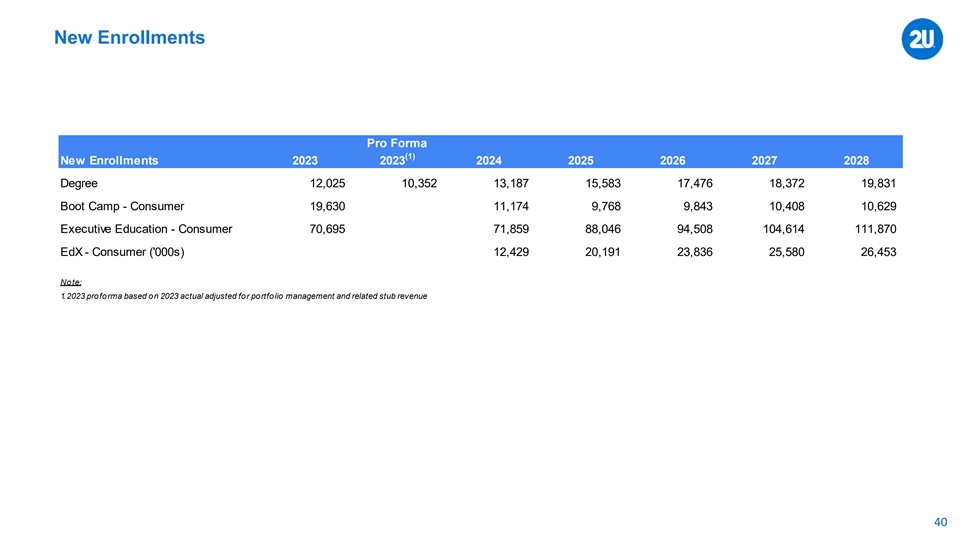
New Enrollments Pro Forma (1) New Enrollments 2023 2023 2024 2025 2026 2027 2028 Degree 12,025 10,352 13,187 15,583 17,476 18,372 19,831 Boot Camp - Consumer 19,630 11,174 9 ,768 9,843 10,408 10,629 Executive Education - Consumer 70,695 71,859 88,046 94,508 104,614 111,870 EdX - Consumer ('000s) 12,429 20,191 23,836 25,580 26,453 Note: 1. 2023 proforma based on 2023 actual adjusted for portfolio management and related stub revenue 40