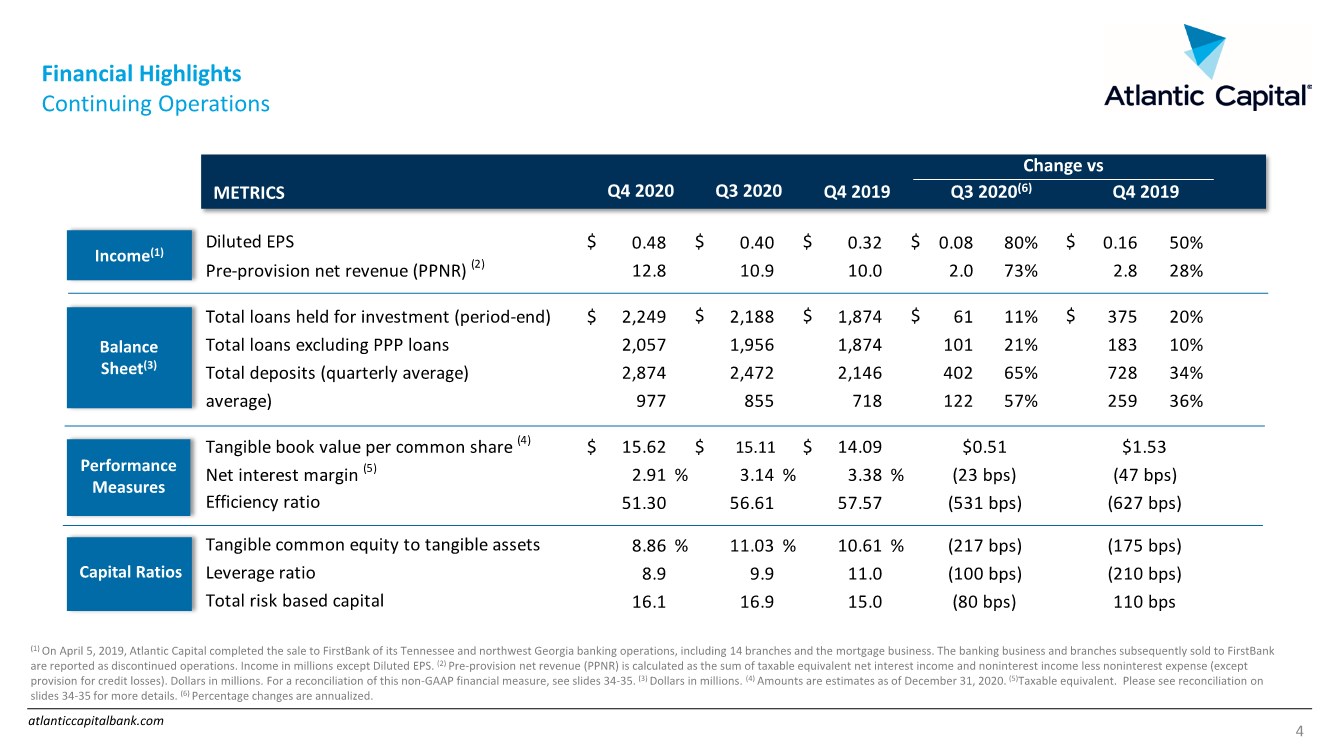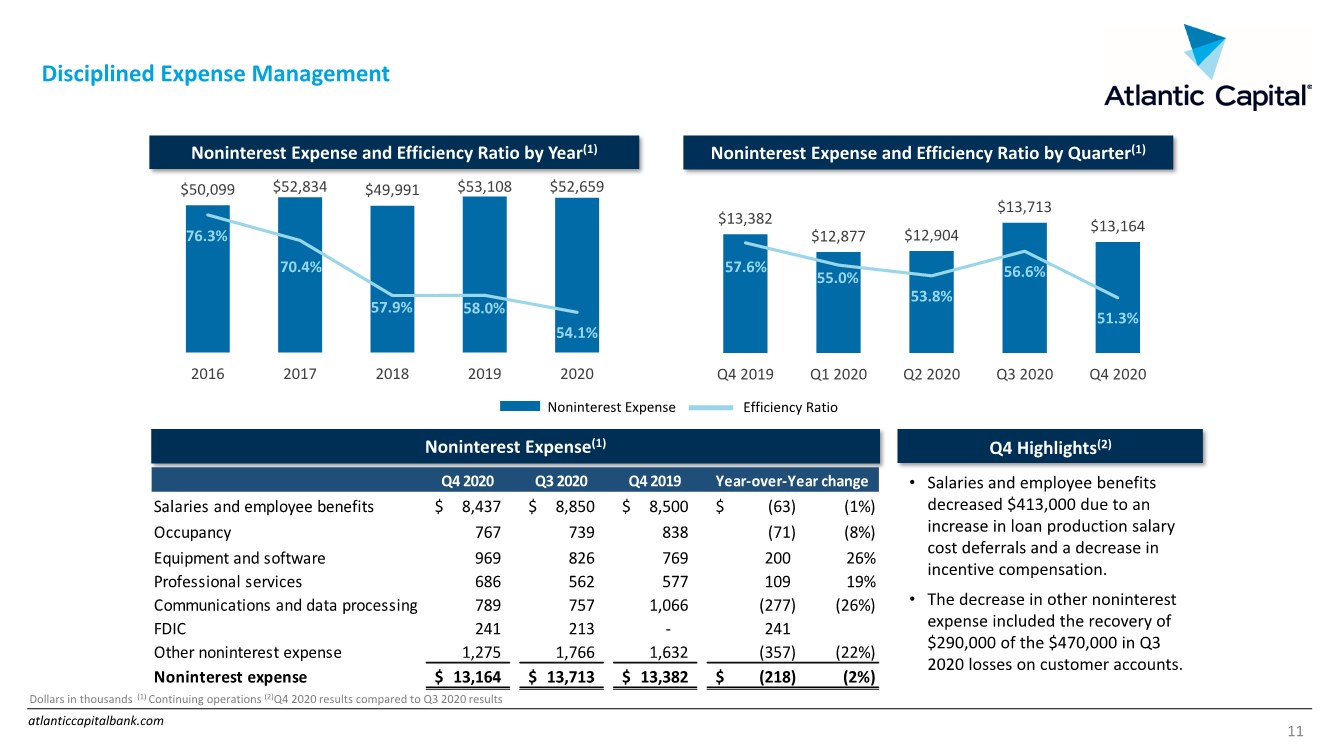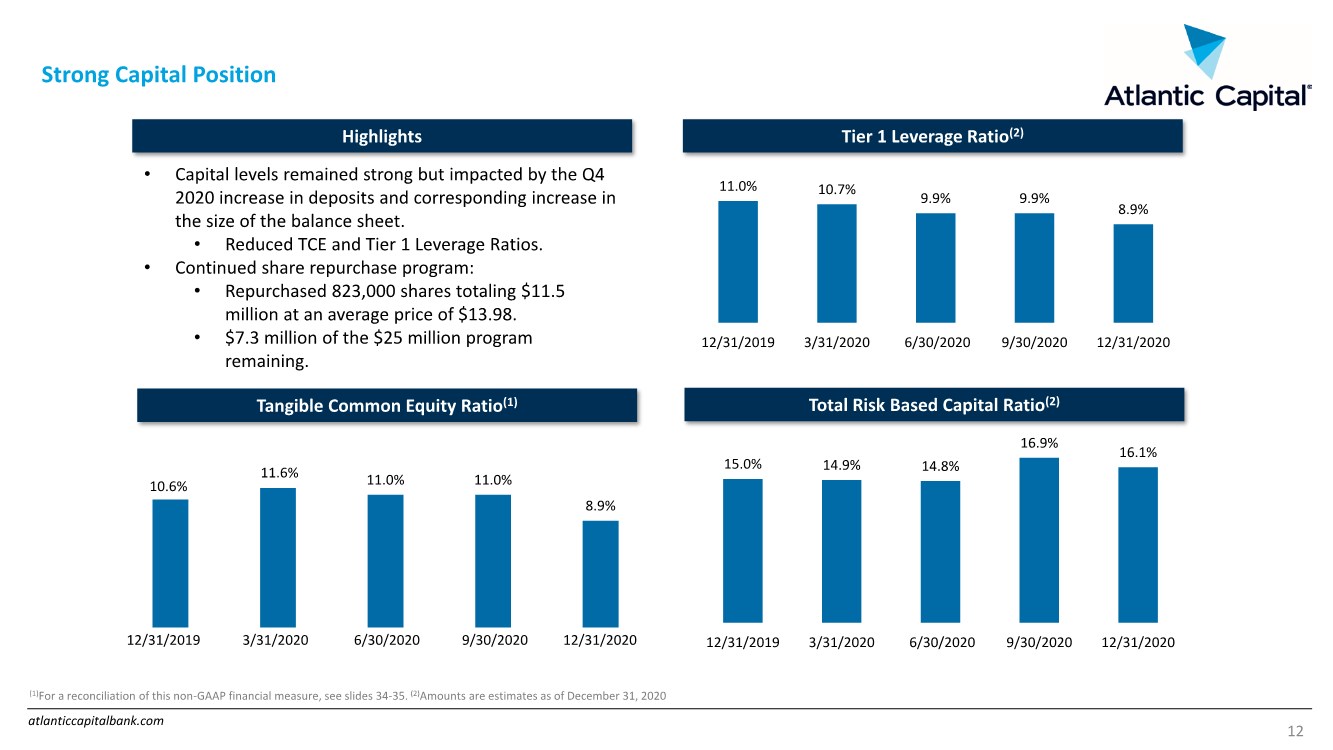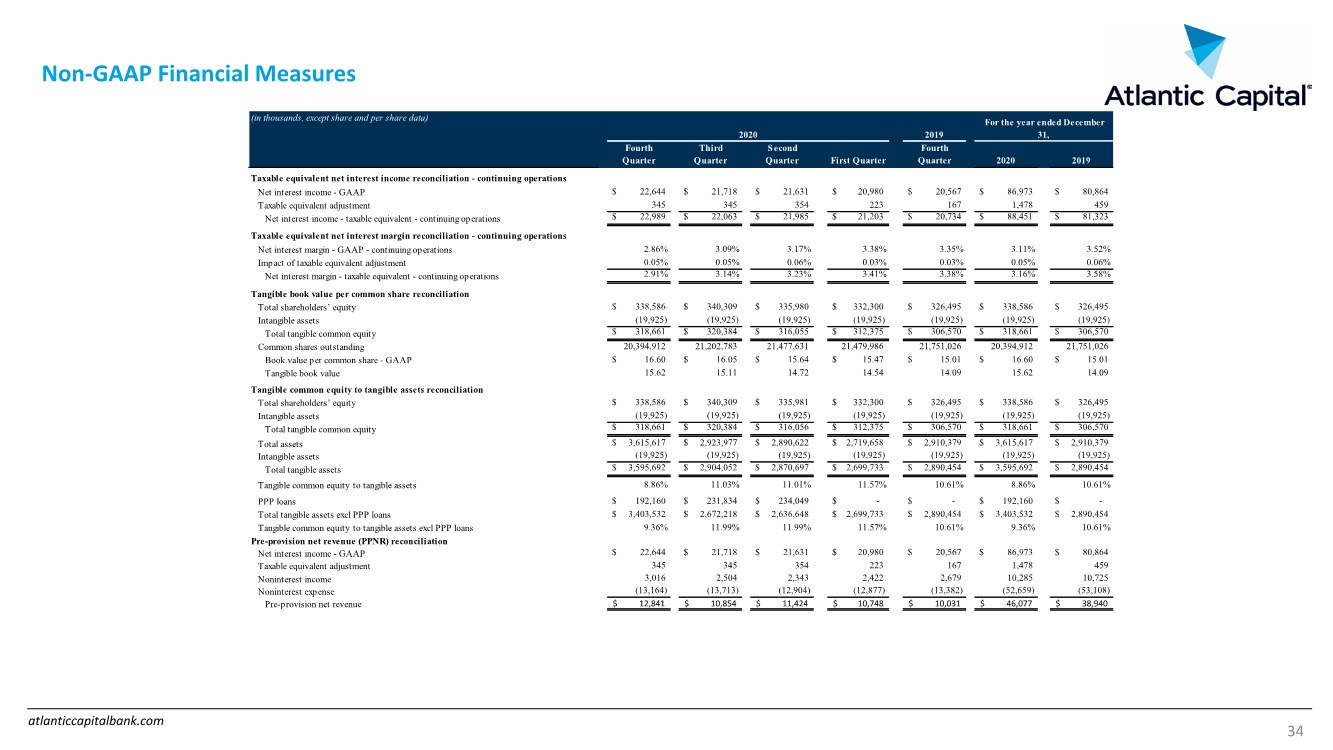
| atlanticcapitalbank.com Non-GAAP Financial Measures 34 (in thousands, except share and per share data) Fourth Quarter Third Quarter S econd Quarter First Quarter Fourth Quarter 2020 2019 Taxable equivalent net interest income reconciliation - continuing operations Net interest income - GAAP $ 22,644 $ 21,718 $ 21,631 $ 20,980 $ 20,567 $ 86,973 $ 80,864 Taxable equivalent adjustment 345 345 354 223 167 1,478 459 Net interest income - taxable equivalent - continuing operations $ 22,989 $ 22,063 $ 21,985 $ 21,203 $ 20,734 $ 88,451 $ 81,323 Taxable equivalent net interest margin reconciliation - continuing operations Net interest margin - GAAP - continuing operations 2.86% 3.09% 3.17% 3.38% 3.35% 3.11% 3.52% Impact of taxable equivalent adjustment 0.05% 0.05% 0.06% 0.03% 0.03% 0.05% 0.06% Net interest margin - taxable equivalent - continuing operations 2.91% 3.14% 3.23% 3.41% 3.38% 3.16% 3.58% Tangible book value per common share reconciliation Total shareholders’ equity $ 338,586 $ 340,309 $ 335,980 $ 332,300 $ 326,495 $ 338,586 $ 326,495 Intangible assets (19,925) (19,925) (19,925) (19,925) (19,925) (19,925) (19,925) Total tangible common equity $ 318,661 $ 320,384 $ 316,055 $ 312,375 $ 306,570 $ 318,661 $ 306,570 Common shares outstanding 20,394,912 21,202,783 21,477,631 21,479,986 21,751,026 20,394,912 21,751,026 Book value per common share - GAAP $ 16.60 $ 16.05 $ 15.64 $ 15.47 $ 15.01 $ 16.60 $ 15.01 Tangible book value 15.62 15.11 14.72 14.54 14.09 15.62 14.09 Tangible common equity to tangible assets reconciliation Total shareholders’ equity $ 338,586 $ 340,309 $ 335,981 $ 332,300 $ 326,495 $ 338,586 $ 326,495 Intangible assets (19,925) (19,925) (19,925) (19,925) (19,925) (19,925) (19,925) Total tangible common equity $ 318,661 $ 320,384 $ 316,056 $ 312,375 $ 306,570 $ 318,661 $ 306,570 Total assets $ 3,615,617 $ 2,923,977 $ 2,890,622 $ 2,719,658 $ 2,910,379 $ 3,615,617 $ 2,910,379 Intangible assets (19,925) (19,925) (19,925) (19,925) (19,925) (19,925) (19,925) Total tangible assets $ 3,595,692 $ 2,904,052 $ 2,870,697 $ 2,699,733 $ 2,890,454 $ 3,595,692 $ 2,890,454 Tangible common equity to tangible assets 8.86% 11.03% 11.01% 11.57% 10.61% 8.86% 10.61% PPP loans $ 192,160 $ 231,834 $ 234,049 $ - $ - $ 192,160 $ - Total tangible assets excl PPP loans $ 3,403,532 $ 2,672,218 $ 2,636,648 $ 2,699,733 $ 2,890,454 $ 3,403,532 $ 2,890,454 Tangible common equity to tangible assets excl PPP loans 9.36% 11.99% 11.99% 11.57% 10.61% 9.36% 10.61% Pre-provision net revenue (PPNR) reconciliation Net interest income - GAAP $ 22,644 $ 21,718 $ 21,631 $ 20,980 $ 20,567 $ 86,973 $ 80,864 Taxable equivalent adjustment 345 345 354 223 167 1,478 459 Noninterest income 3,016 2,504 2,343 2,422 2,679 10,285 10,725 Noninterest expense (13,164) (13,713) (12,904) (12,877) (13,382) (52,659) (53,108) Pre-provision net revenue 12,841 $ 10,854 $ 11,424 $ 10,748 $ 10,031 $ 46,077 $ 38,940 $ 2020 2019 For the year ended December 31, |