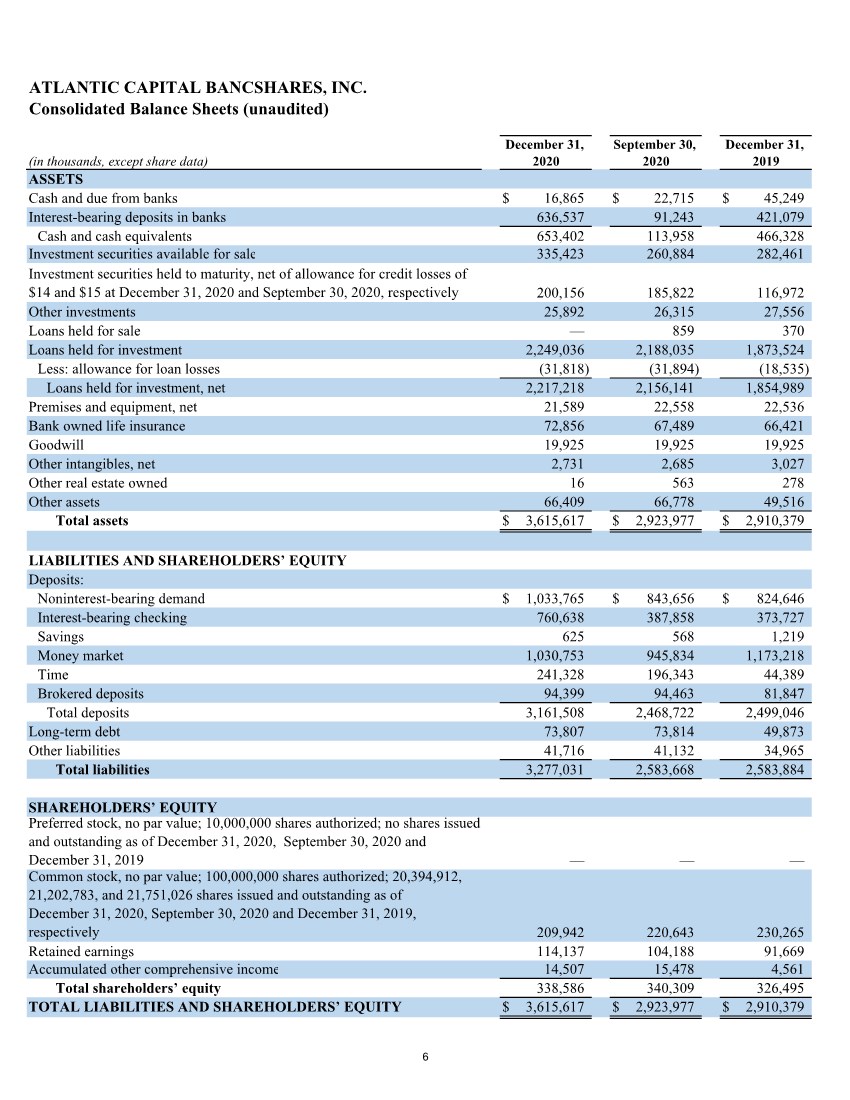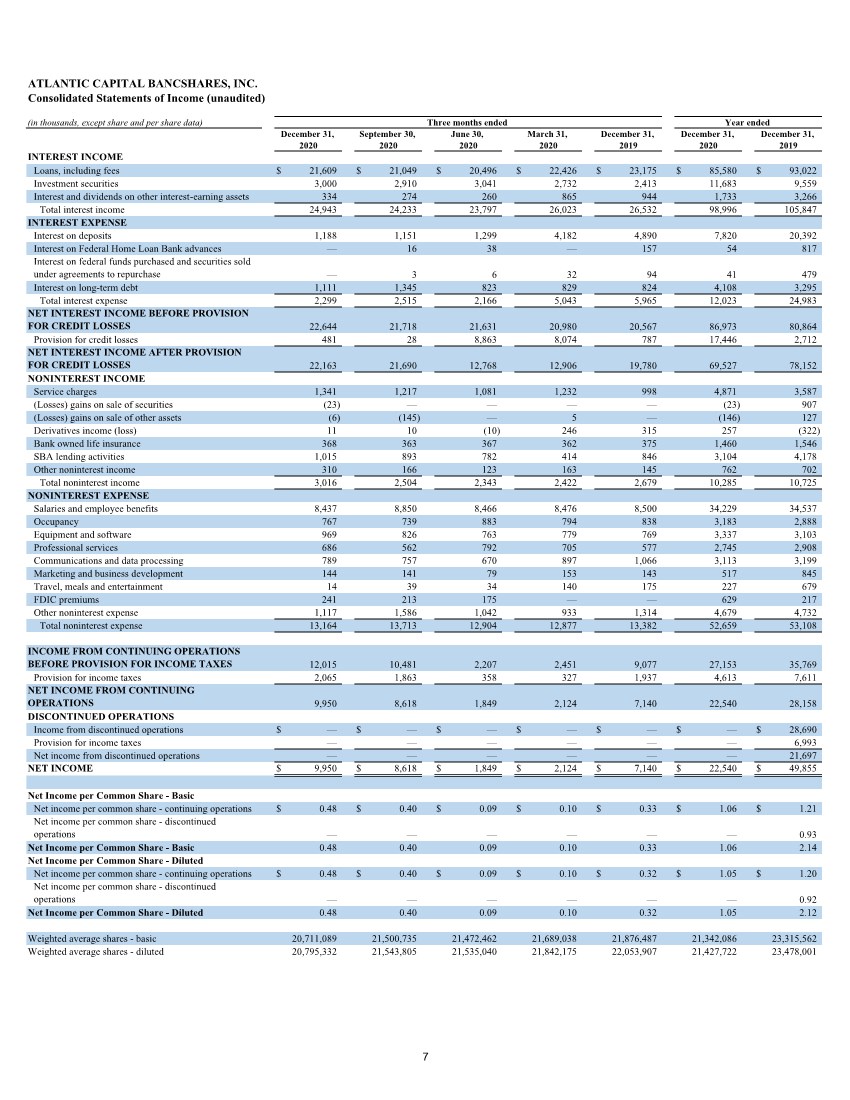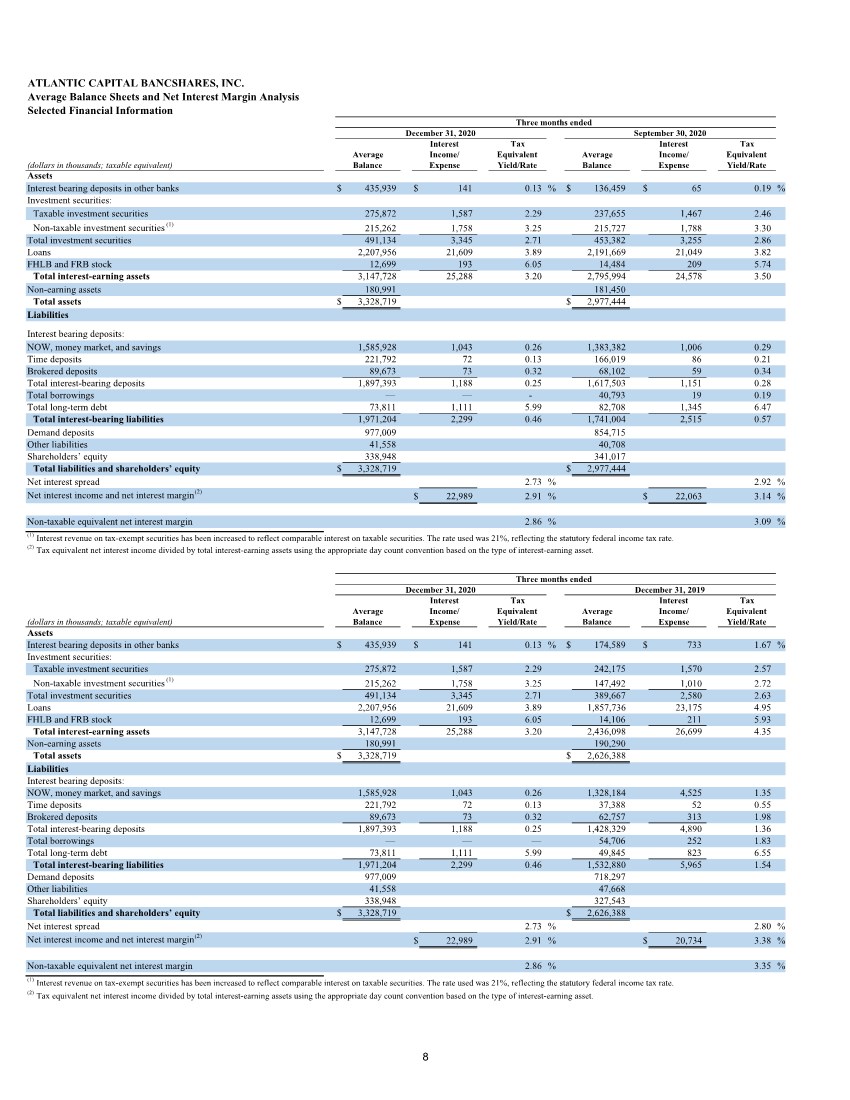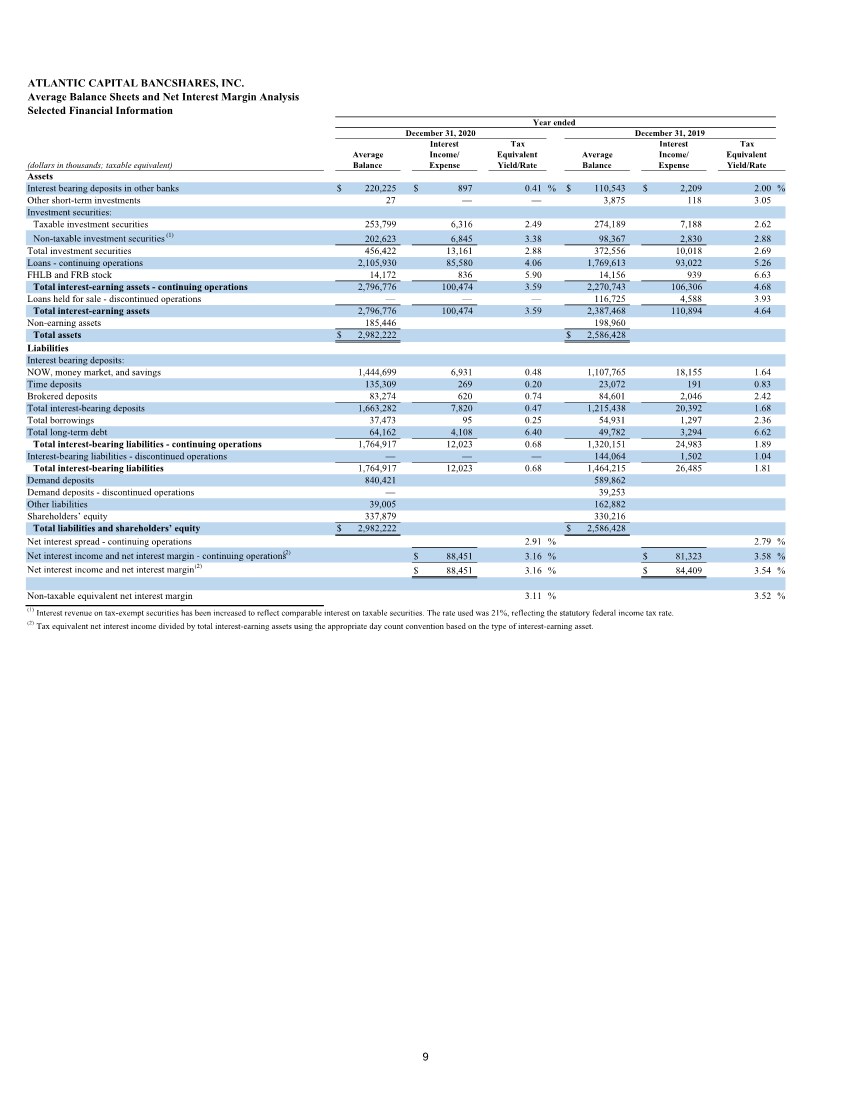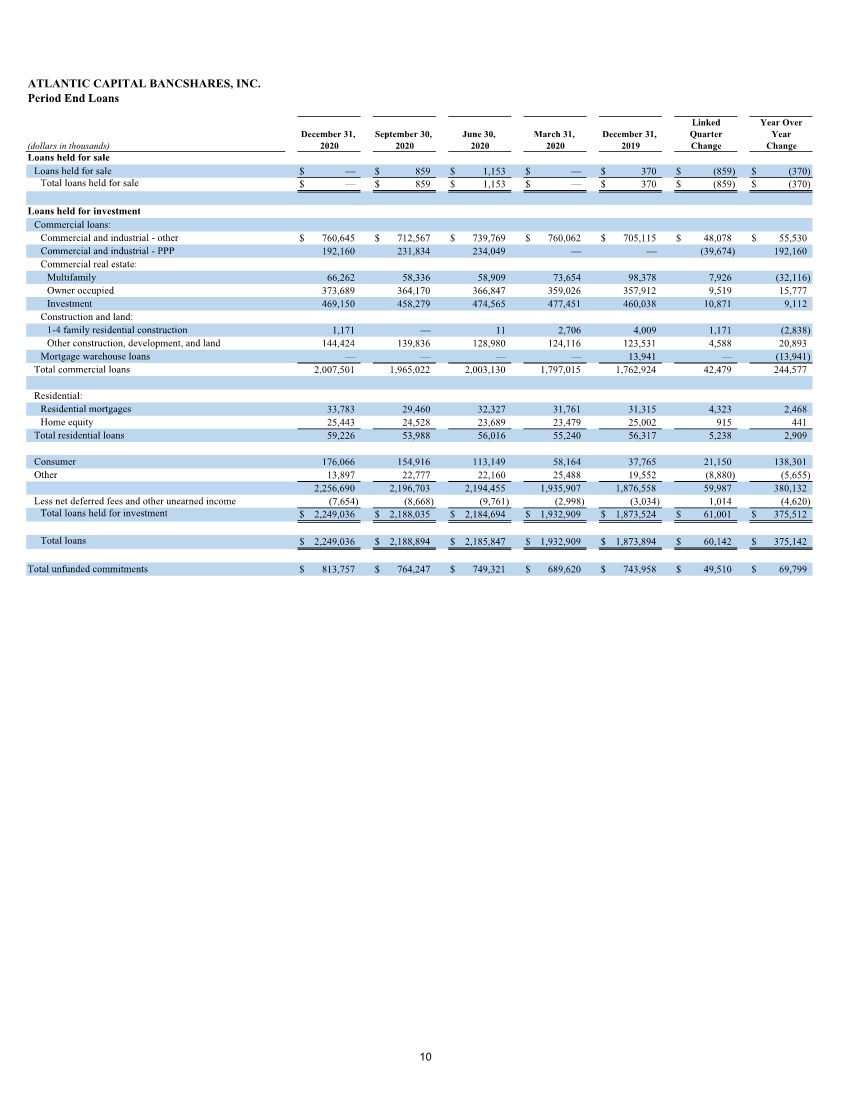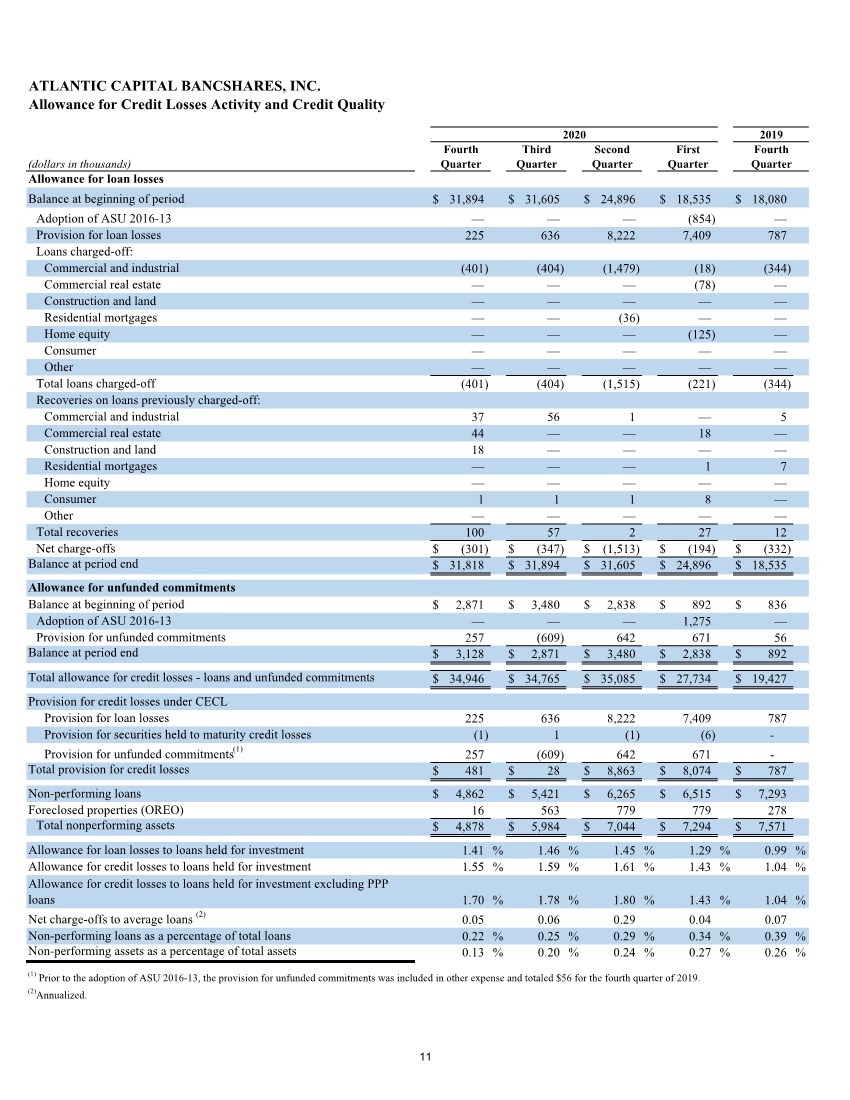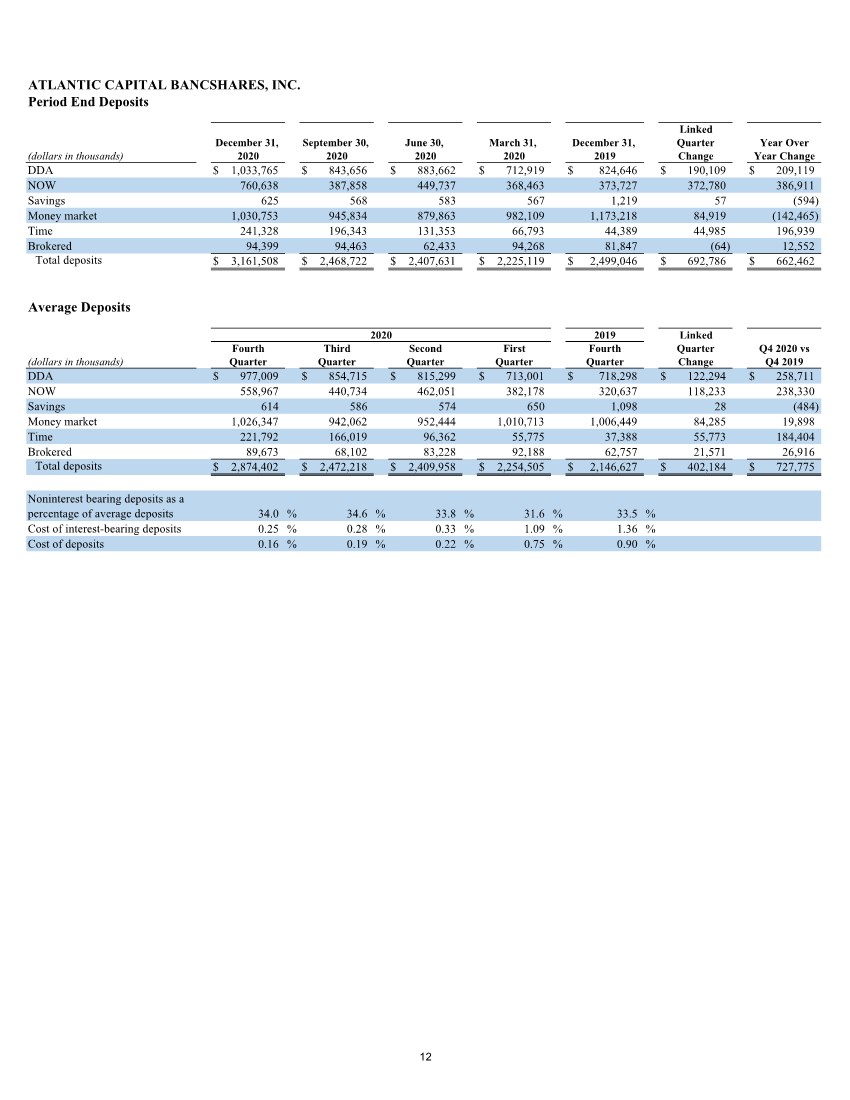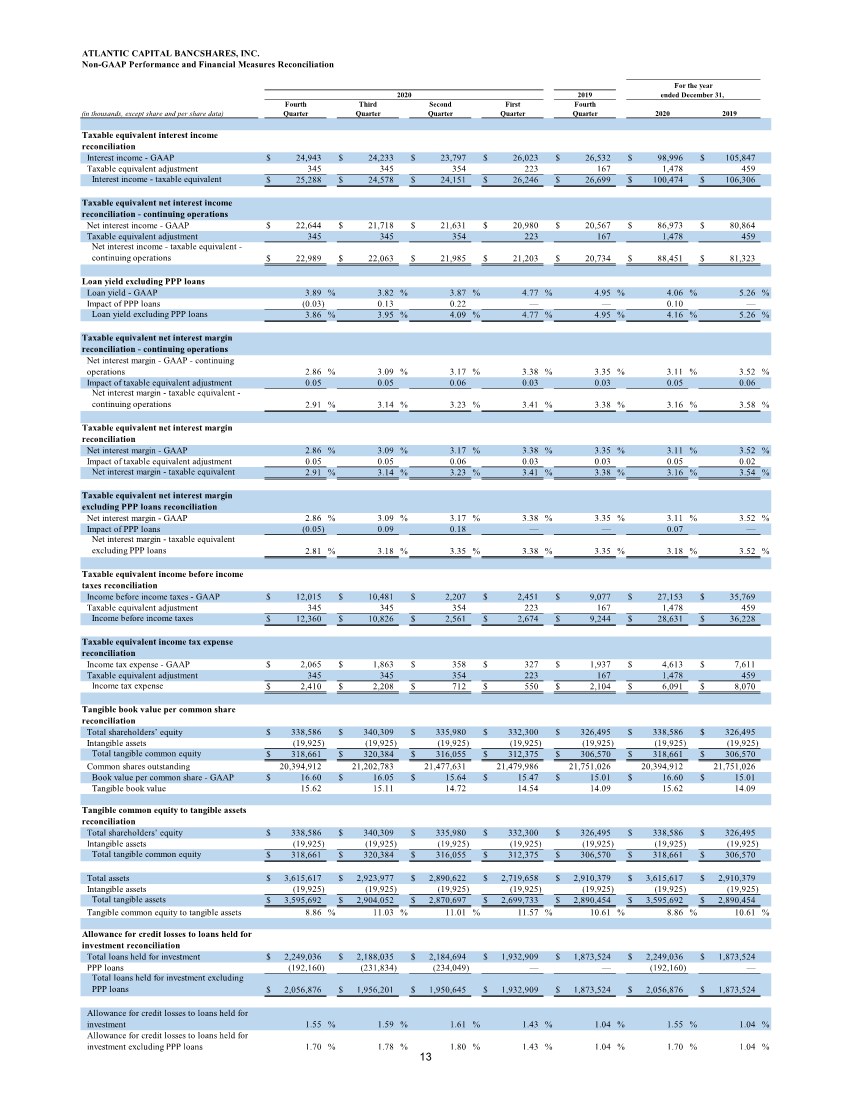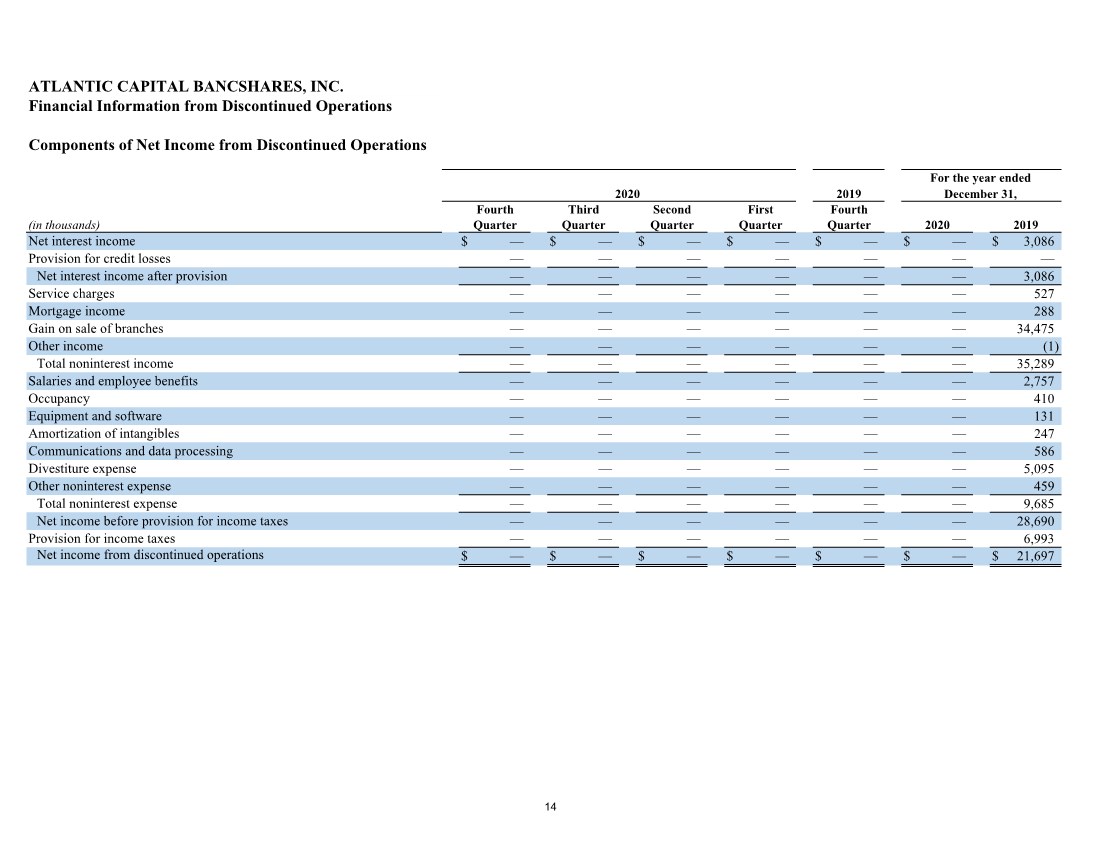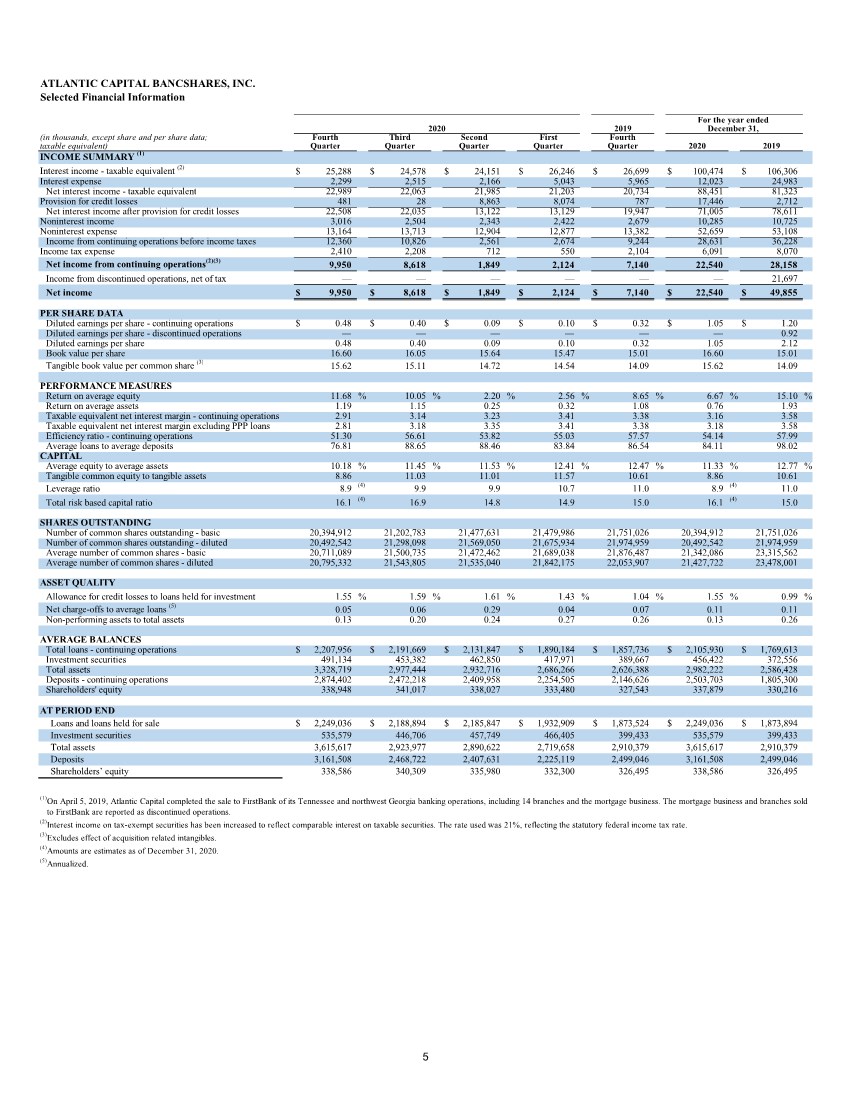
| ATLANTIC CAPITAL BANCSHARES, INC. Selected Financial Information (in thousands, except share and per share data; taxable equivalent) INCOME SUMMARY (1) Interest income - taxable equivalent (2) $ 25,288 $ 24,578 $ 24,151 $ 26,246 $ 26,699 $ 100,474 $ 106,306 Interest expense 2,299 2,515 2,166 5,043 5,965 12,023 24,983 Net interest income - taxable equivalent 22,989 22,063 21,985 21,203 20,734 88,451 81,323 Provision for credit losses 481 28 8,863 8,074 787 17,446 2,712 Net interest income after provision for credit losses 22,508 22,035 13,122 13,129 19,947 71,005 78,611 Noninterest income 3,016 2,504 2,343 2,422 2,679 10,285 10,725 Noninterest expense 13,164 13,713 12,904 12,877 13,382 52,659 53,108 Income from continuing operations before income taxes 12,360 10,826 2,561 2,674 9,244 28,631 36,228 Income tax expense 2,410 2,208 712 550 2,104 6,091 8,070 Net income from continuing operations(2)(3) 9,950 8,618 1,849 2,124 7,140 22,540 28,158 Income from discontinued operations, net of tax — — — — — — 21,697 Net income $ 9,950 $ 8,618 $ 1,849 $ 2,124 $ 7,140 $ 22,540 $ 49,855 PER SHARE DATA Diluted earnings per share - continuing operations $ 0.48 $ 0.40 $ 0.09 $ 0.10 $ 0.32 $ 1.05 $ 1.20 Diluted earnings per share - discontinued operations — — — — — — 0.92 Diluted earnings per share 0.48 0.40 0.09 0.10 0.32 1.05 2.12 Book value per share 16.60 16.05 15.64 15.47 15.01 16.60 15.01 Tangible book value per common share (3) 15.62 15.11 14.72 14.54 14.09 15.62 14.09 PERFORMANCE MEASURES Return on average equity 11.68 % 10.05 % 2.20 % 2.56 % 8.65 % 6.67 % 15.10 % Return on average assets 1.19 1.15 0.25 0.32 1.08 0.76 1.93 Taxable equivalent net interest margin - continuing operations 2.91 3.14 3.23 3.41 3.38 3.16 3.58 Taxable equivalent net interest margin excluding PPP loans 2.81 3.18 3.35 3.41 3.38 3.18 3.58 Efficiency ratio - continuing operations 51.30 56.61 53.82 55.03 57.57 54.14 57.99 Average loans to average deposits 76.81 88.65 88.46 83.84 86.54 84.11 98.02 CAPITAL Average equity to average assets 10.18 % 11.45 % 11.53 % 12.41 % 12.47 % 11.33 % 12.77 % Tangible common equity to tangible assets 8.86 11.03 11.01 11.57 10.61 8.86 10.61 Leverage ratio 8.9 (4) 9.9 9.9 10.7 11.0 8.9 (4) 11.0 Total risk based capital ratio 16.1 (4) 16.9 14.8 14.9 15.0 16.1 (4) 15.0 SHARES OUTSTANDING Number of common shares outstanding - basic 20,394,912 21,202,783 21,477,631 21,479,986 21,751,026 20,394,912 21,751,026 Number of common shares outstanding - diluted 20,492,542 21,298,098 21,569,050 21,675,934 21,974,959 20,492,542 21,974,959 Average number of common shares - basic 20,711,089 21,500,735 21,472,462 21,689,038 21,876,487 21,342,086 23,315,562 Average number of common shares - diluted 20,795,332 21,543,805 21,535,040 21,842,175 22,053,907 21,427,722 23,478,001 ASSET QUALITY Allowance for credit losses to loans held for investment 1.55 % 1.59 % 1.61 % 1.43 % 1.04 % 1.55 % 0.99 % Net charge-offs to average loans (5) 0.05 0.06 0.29 0.04 0.07 0.11 0.11 Non-performing assets to total assets 0.13 0.20 0.24 0.27 0.26 0.13 0.26 AVERAGE BALANCES Total loans - continuing operations $ 2,207,956 $ 2,191,669 $ 2,131,847 $ 1,890,184 $ 1,857,736 $ 2,105,930 $ 1,769,613 Investment securities 491,134 453,382 462,850 417,971 389,667 456,422 372,556 Total assets 3,328,719 2,977,444 2,932,716 2,686,266 2,626,388 2,982,222 2,586,428 Deposits - continuing operations 2,874,402 2,472,218 2,409,958 2,254,505 2,146,626 2,503,703 1,805,300 Shareholders' equity 338,948 341,017 338,027 333,480 327,543 337,879 330,216 AT PERIOD END Loans and loans held for sale $ 2,249,036 $ 2,188,894 $ 2,185,847 $ 1,932,909 $ 1,873,524 $ 2,249,036 $ 1,873,894 Investment securities 535,579 446,706 457,749 466,405 399,433 535,579 399,433 Total assets 3,615,617 2,923,977 2,890,622 2,719,658 2,910,379 3,615,617 2,910,379 Deposits 3,161,508 2,468,722 2,407,631 2,225,119 2,499,046 3,161,508 2,499,046 Shareholders’ equity 338,586 340,309 335,980 332,300 326,495 338,586 326,495 (1)On April 5, 2019, Atlantic Capital completed the sale to FirstBank of its Tennessee and northwest Georgia banking operations, including 14 branches and the mortgage business. The mortgage business and branches sold to FirstBank are reported as discontinued operations. (2)Interest income on tax-exempt securities has been increased to reflect comparable interest on taxable securities. The rate used was 21%, reflecting the statutory federal income tax rate. (3)Excludes effect of acquisition related intangibles. (4)Amounts are estimates as of December 31, 2020. (5)Annualized. December 31, Fourth Third First For the year ended 2019 2020 2020 2019 Quarter Quarter Quarter Quarter Second Quarter Fourth 5 |