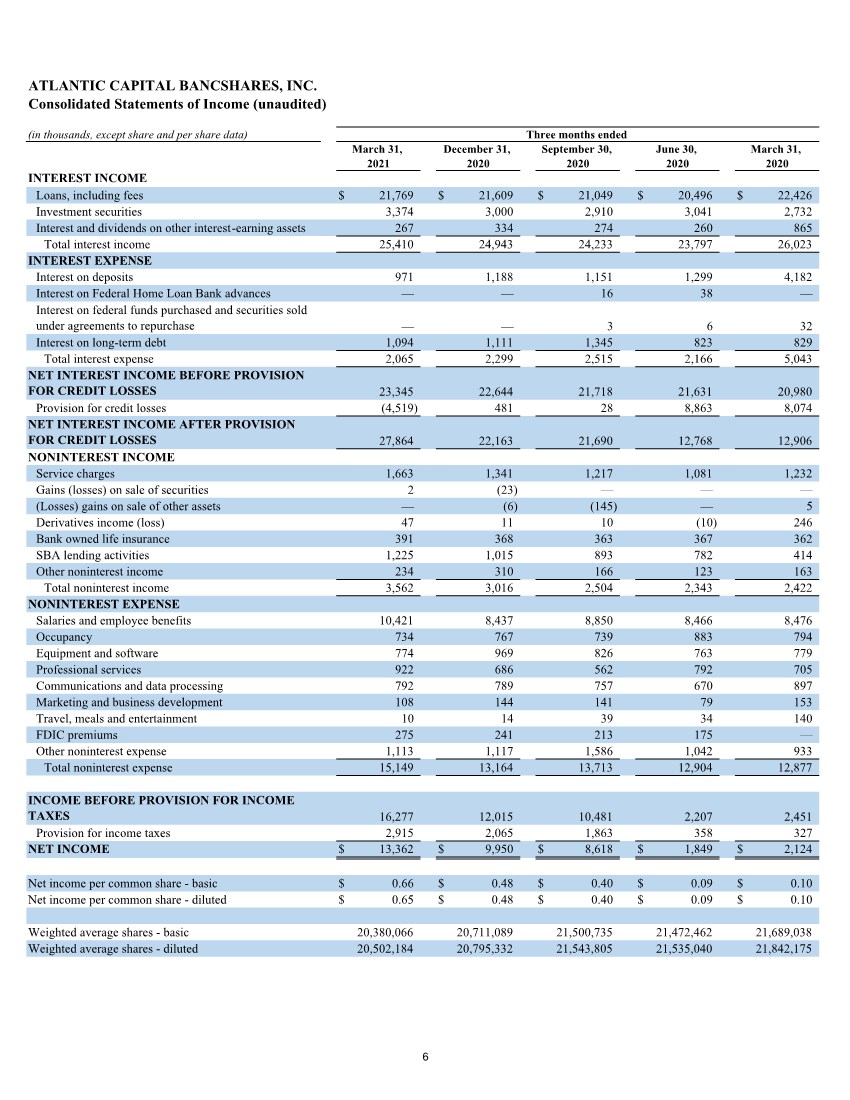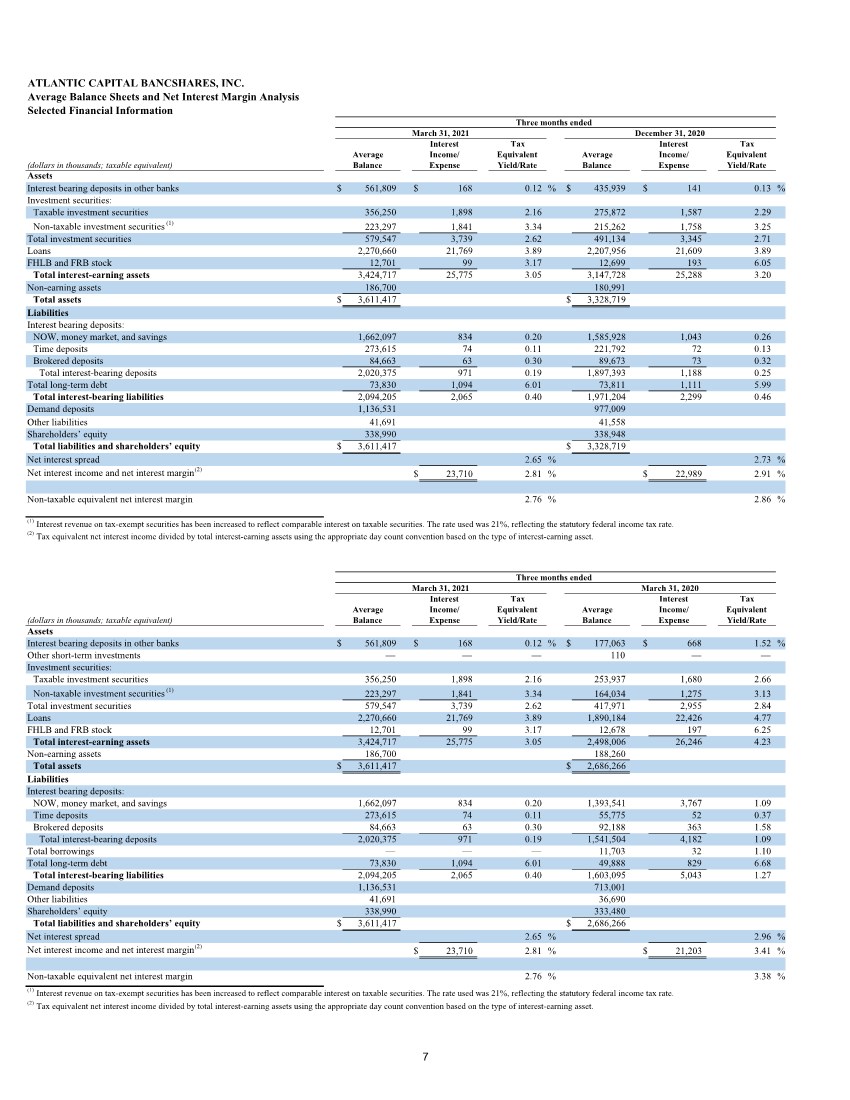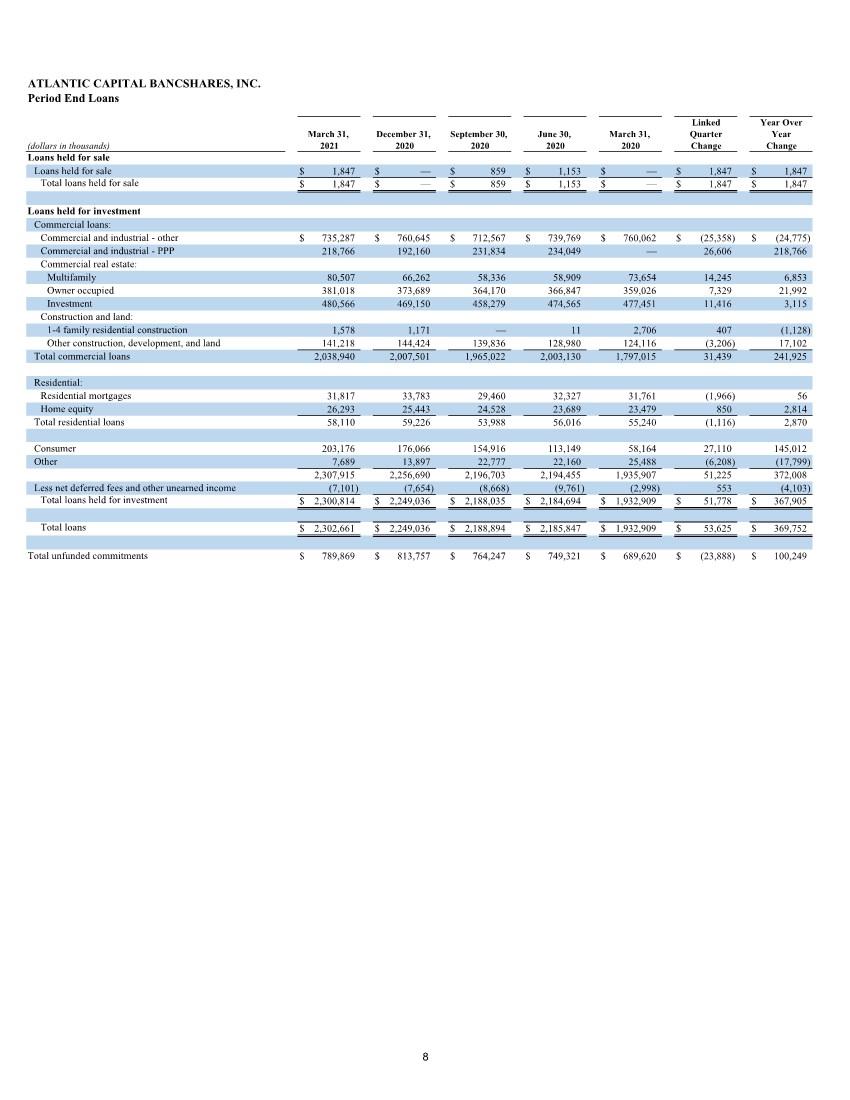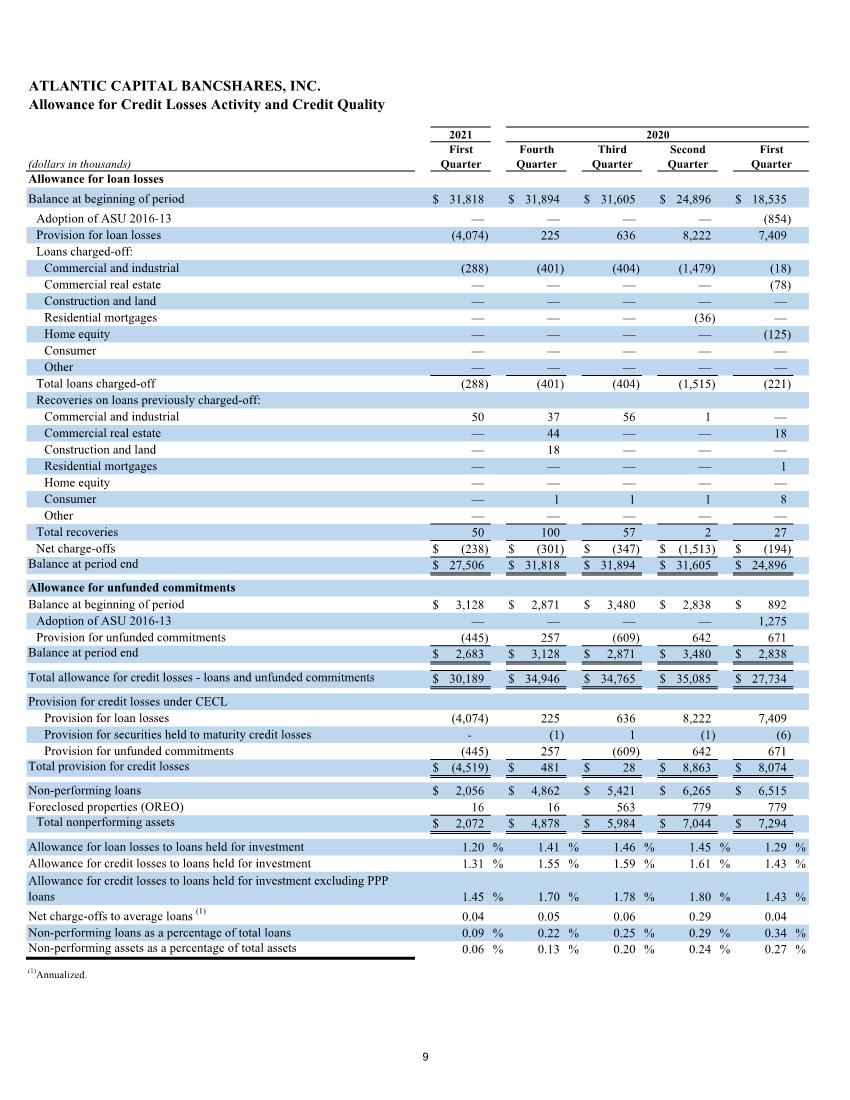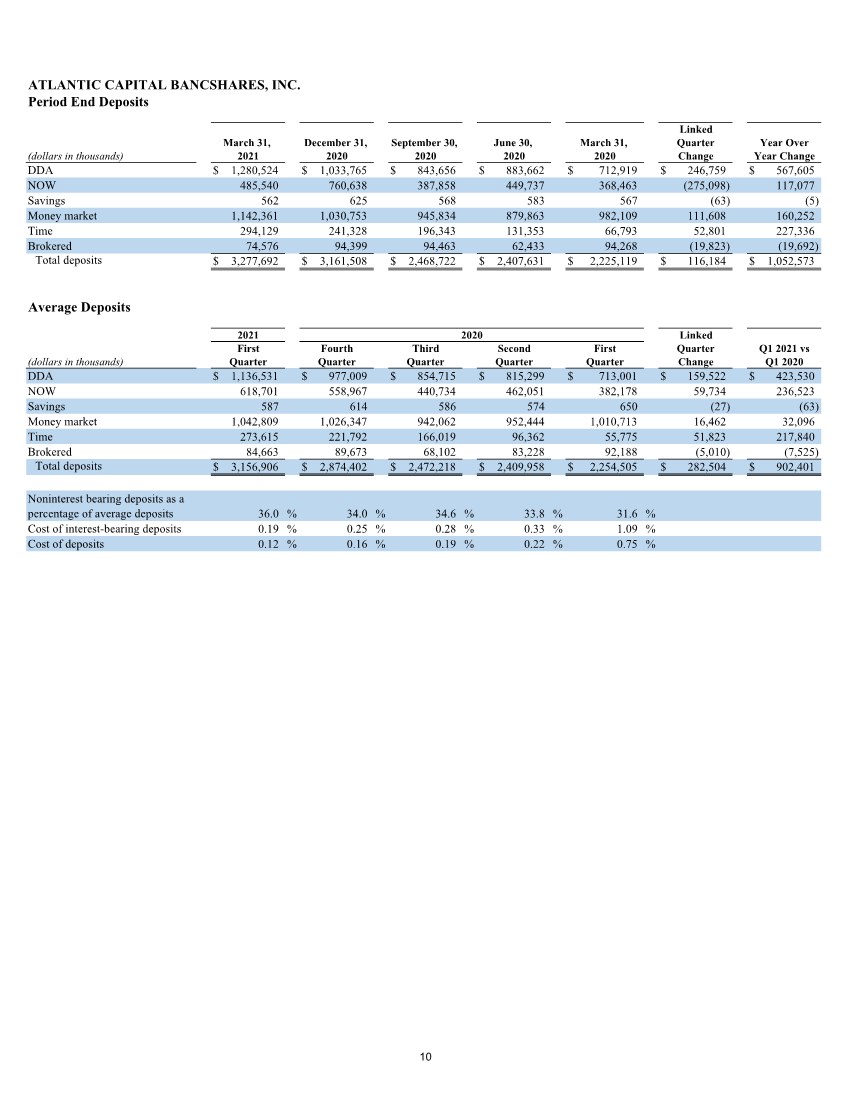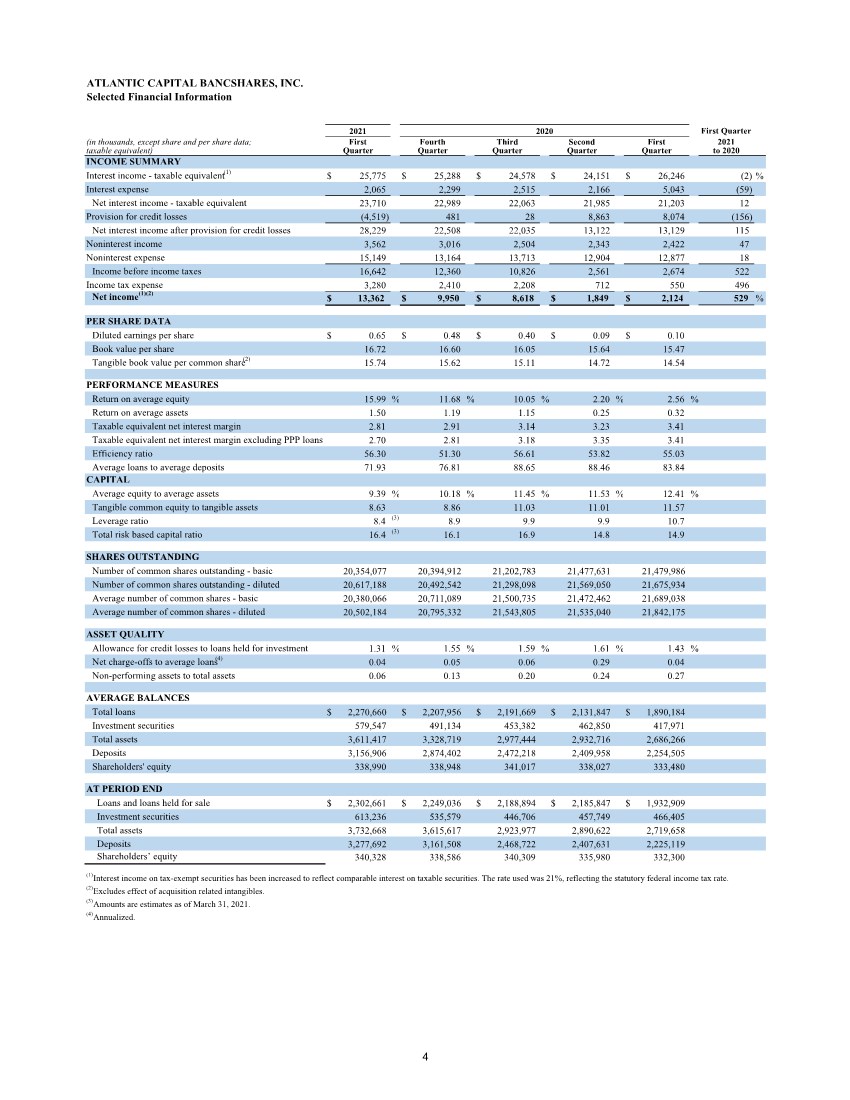
| ATLANTIC CAPITAL BANCSHARES, INC. Selected Financial Information (in thousands, except share and per share data; taxable equivalent) INCOME SUMMARY Interest income - taxable equivalent (1) $ 25,775 $ 25,288 $ 24,578 $ 24,151 $ 26,246 (2) % Interest expense 2,065 2,299 2,515 2,166 5,043 (59) Net interest income - taxable equivalent 23,710 22,989 22,063 21,985 21,203 12 Provision for credit losses (4,519) 481 28 8,863 8,074 (156) Net interest income after provision for credit losses 28,229 22,508 22,035 13,122 13,129 115 Noninterest income 3,562 3,016 2,504 2,343 2,422 47 Noninterest expense 15,149 13,164 13,713 12,904 12,877 18 Income before income taxes 16,642 12,360 10,826 2,561 2,674 522 Income tax expense 3,280 2,410 2,208 712 550 496 Net income(1)(2) $ 13,362 $ 9,950 $ 8,618 $ 1,849 $ 2,124 529 % PER SHARE DATA Diluted earnings per share $ 0.65 $ 0.48 $ 0.40 $ 0.09 $ 0.10 Book value per share 16.72 16.60 16.05 15.64 15.47 Tangible book value per common share (2) 15.74 15.62 15.11 14.72 14.54 PERFORMANCE MEASURES Return on average equity 15.99 % 11.68 % 10.05 % 2.20 % 2.56 % Return on average assets 1.50 1.19 1.15 0.25 0.32 Taxable equivalent net interest margin 2.81 2.91 3.14 3.23 3.41 Taxable equivalent net interest margin excluding PPP loans 2.70 2.81 3.18 3.35 3.41 Efficiency ratio 56.30 51.30 56.61 53.82 55.03 Average loans to average deposits 71.93 76.81 88.65 88.46 83.84 CAPITAL Average equity to average assets 9.39 % 10.18 % 11.45 % 11.53 % 12.41 % Tangible common equity to tangible assets 8.63 8.86 11.03 11.01 11.57 Leverage ratio 8.4 (3) 8.9 9.9 9.9 10.7 Total risk based capital ratio 16.4 (3) 16.1 16.9 14.8 14.9 SHARES OUTSTANDING Number of common shares outstanding - basic 20,354,077 20,394,912 21,202,783 21,477,631 21,479,986 Number of common shares outstanding - diluted 20,617,188 20,492,542 21,298,098 21,569,050 21,675,934 Average number of common shares - basic 20,380,066 20,711,089 21,500,735 21,472,462 21,689,038 Average number of common shares - diluted 20,502,184 20,795,332 21,543,805 21,535,040 21,842,175 ASSET QUALITY Allowance for credit losses to loans held for investment 1.31 % 1.55 % 1.59 % 1.61 % 1.43 % Net charge-offs to average loans (4) 0.04 0.05 0.06 0.29 0.04 Non-performing assets to total assets 0.06 0.13 0.20 0.24 0.27 AVERAGE BALANCES Total loans $ 2,270,660 $ 2,207,956 $ 2,191,669 $ 2,131,847 $ 1,890,184 Investment securities 579,547 491,134 453,382 462,850 417,971 Total assets 3,611,417 3,328,719 2,977,444 2,932,716 2,686,266 Deposits 3,156,906 2,874,402 2,472,218 2,409,958 2,254,505 Shareholders' equity 338,990 338,948 341,017 338,027 333,480 AT PERIOD END Loans and loans held for sale $ 2,302,661 $ 2,249,036 $ 2,188,894 $ 2,185,847 $ 1,932,909 Investment securities 613,236 535,579 446,706 457,749 466,405 Total assets 3,732,668 3,615,617 2,923,977 2,890,622 2,719,658 Deposits 3,277,692 3,161,508 2,468,722 2,407,631 2,225,119 Shareholders’ equity 340,328 338,586 340,309 335,980 332,300 (1)Interest income on tax-exempt securities has been increased to reflect comparable interest on taxable securities. The rate used was 21%, reflecting the statutory federal income tax rate. (2)Excludes effect of acquisition related intangibles. (3)Amounts are estimates as of March 31, 2021. (4)Annualized. Quarter Quarter Quarter Third Quarter First 2021 2020 to 2020 Quarter First Quarter 2021 First Fourth Second 4 |