Exhibit 99.1
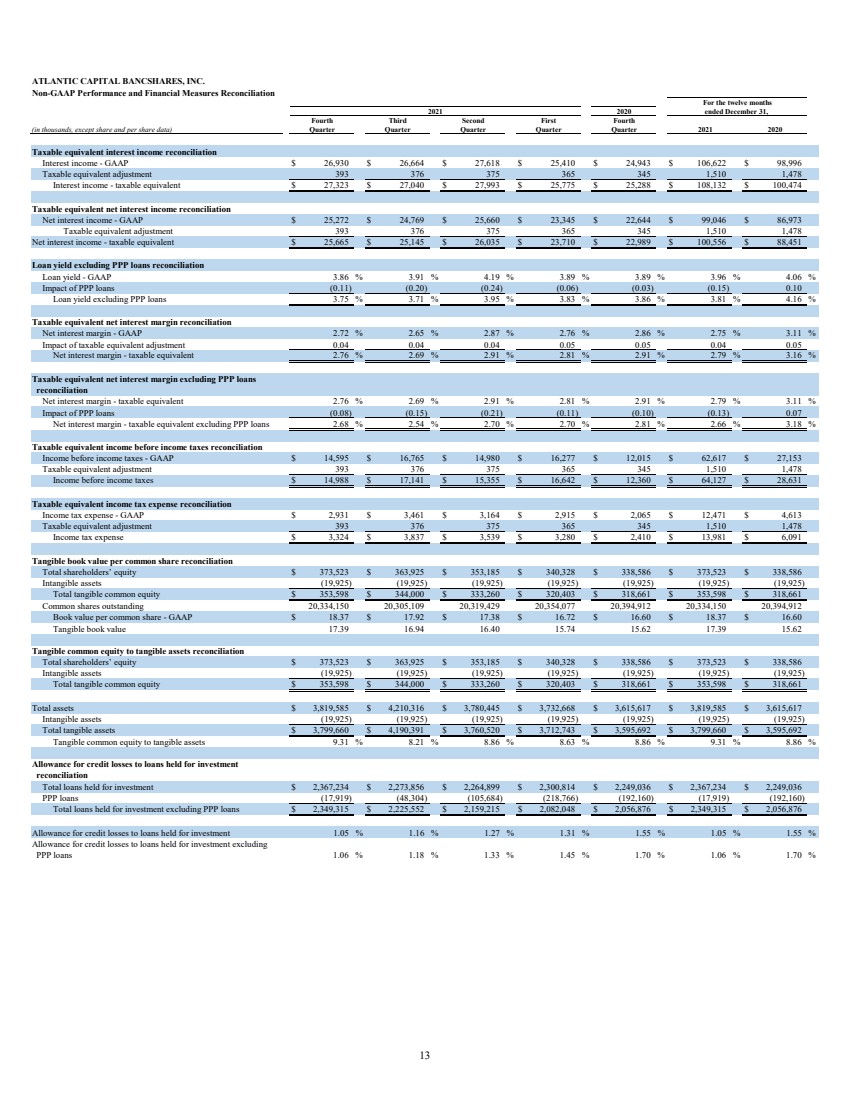
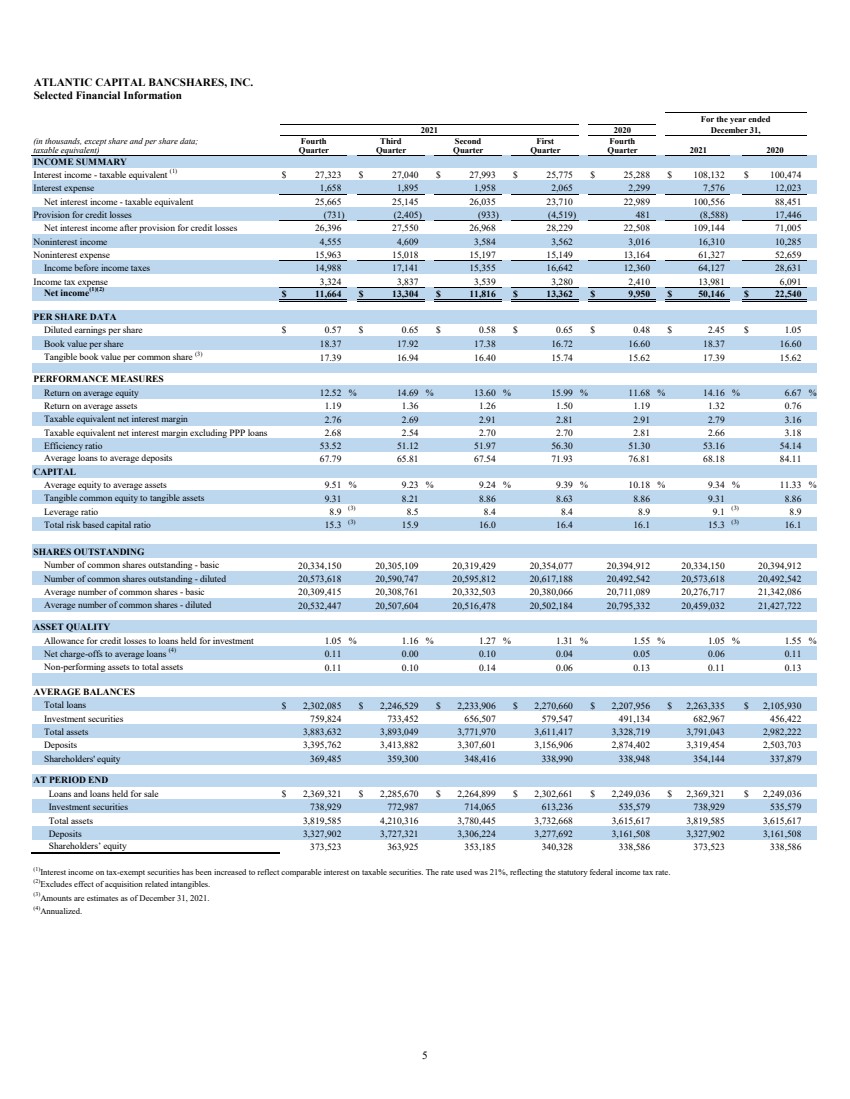
| (1)Commentary is on a fully taxable-equivalent basis unless otherwise noted. Consistent with SEC guidance inIndustry Guide 3 that contemplates the calculation of tax-exempt income on a tax equivalent basis, net interestincome and net interest margin are provided on a fully taxable-equivalent basis, which generally assumes a21% marginal tax rate. We provide detailed reconciliations in the Non-GAAP Performance and FinancialMeasures Reconciliation table on page 13.Exhibit 99.1 PRESS RELEASE ATLANTIC CAPITAL BANCSHARES, INC. REPORTS FOURTH QUARTER 2021 RESULTS Atlanta, GA – January 24, 2022 – Atlantic Capital Bancshares, Inc. (NASDAQ: ACBI) announced net income for the quarter ended December 31, 2021, of $11.7 million, or $0.57 per diluted share, compared to $10.0 million, or $0.48 per diluted share, for the fourth quarter of 2020 and $13.3 million, or $0.65 per diluted share, for the third quarter of 2021. “Atlantic Capital reported another quarter of solid operating results despite disruptions to economic activity from the Omicron variant and historically low interest rates. All of our businesses contributed to these solid results and credit quality remained strong. New business pipelines are robust in all of our businesses and we anticipate carrying strong momentum into our pending merger with SouthState Corporation,” remarked Douglas Williams, President and Chief Executive Officer. Fourth Quarter Highlights(1) •Total assets were $3.8 billion, compared to $4.2 billion at September 30, 2021 and $3.6 billion at December31, 2020.•Return on average assets totaled 1.19% and return on average equity was 12.52% in the fourth quarter of2021.•Loans held for investment, excluding Paycheck Protection Program (“PPP”) loans, increased $123.8million, or 22.2% annualized, from September 30, 2021, and increased $292.4 million, or 14.2%, fromDecember 31, 2020.•Quarterly average demand deposit accounts increased $112.3 million, or 32.7% annualized, compared tothe third quarter of 2021 and increased $510.4 million, or 52.2%, compared to the fourth quarter of 2020.•Cost of deposits decreased to 0.07% from 0.08% in the third quarter of 2021 and from 0.16% in the fourthquarter of 2020.•Tangible book value per share increased to $17.39 from $16.94 at September 30, 2021 and from $15.62 atDecember 31, 2020.•Annualized net charge-offs to average loans totaled 0.11% for the fourth quarter of 2021 and 0.06% for thefull year 2021. Non-performing assets to total assets were 0.11% at December 31, 2021.•The allowance for credit losses was 1.05% of total loans held for investment at December 31, 2021,compared to 1.16% at September 30, 2021 and 1.55% at December 31, 2020.•On November 16, 2021, ACBI shareholders approved the announced merger with SouthState Corporation(“SouthState”), which is expected to close in 2022, subject to regulatory approval. Income Statement Taxable equivalent net interest income totaled $25.7 million for the fourth quarter of 2021, compared to $23.0 million in the fourth quarter of 2020 and $25.1 million in the third quarter of 2021. The fourth quarter of 2021 included $929,000 in PPP loan income, compared to $2.3 million in the fourth quarter of 2020 and $1.9 million in the third quarter of 2021. |
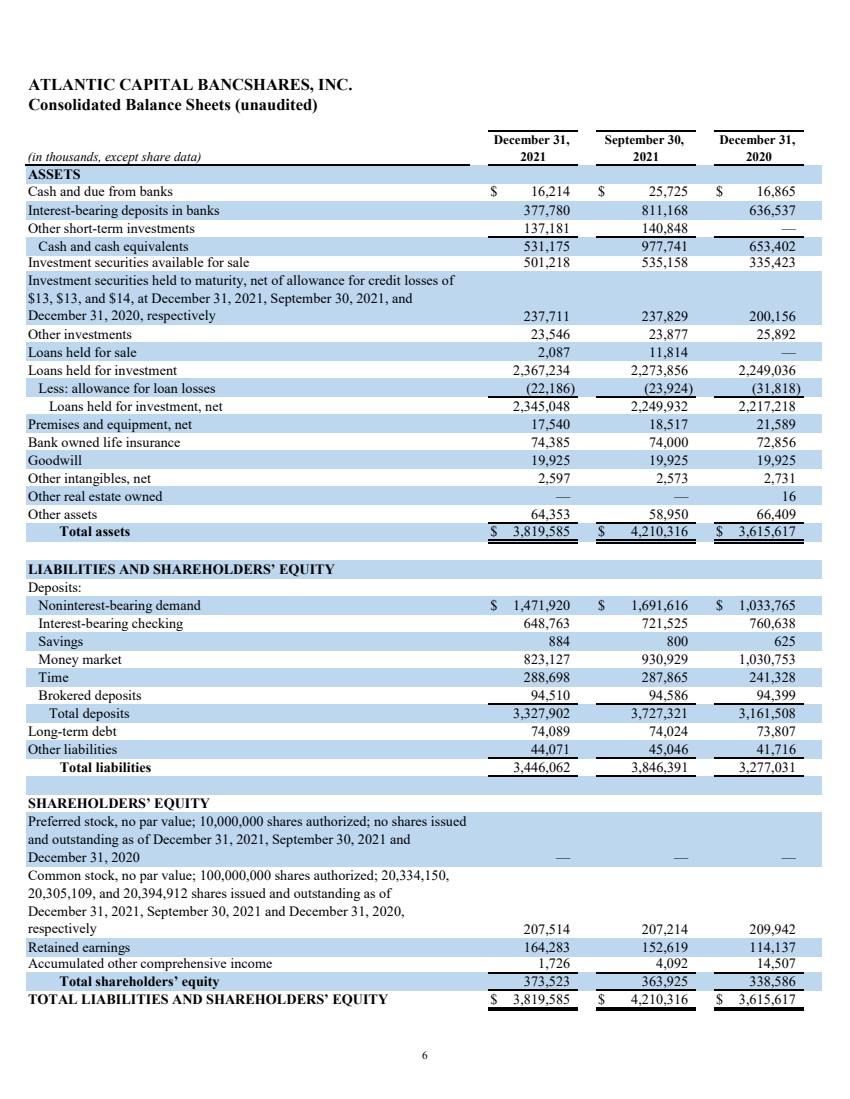
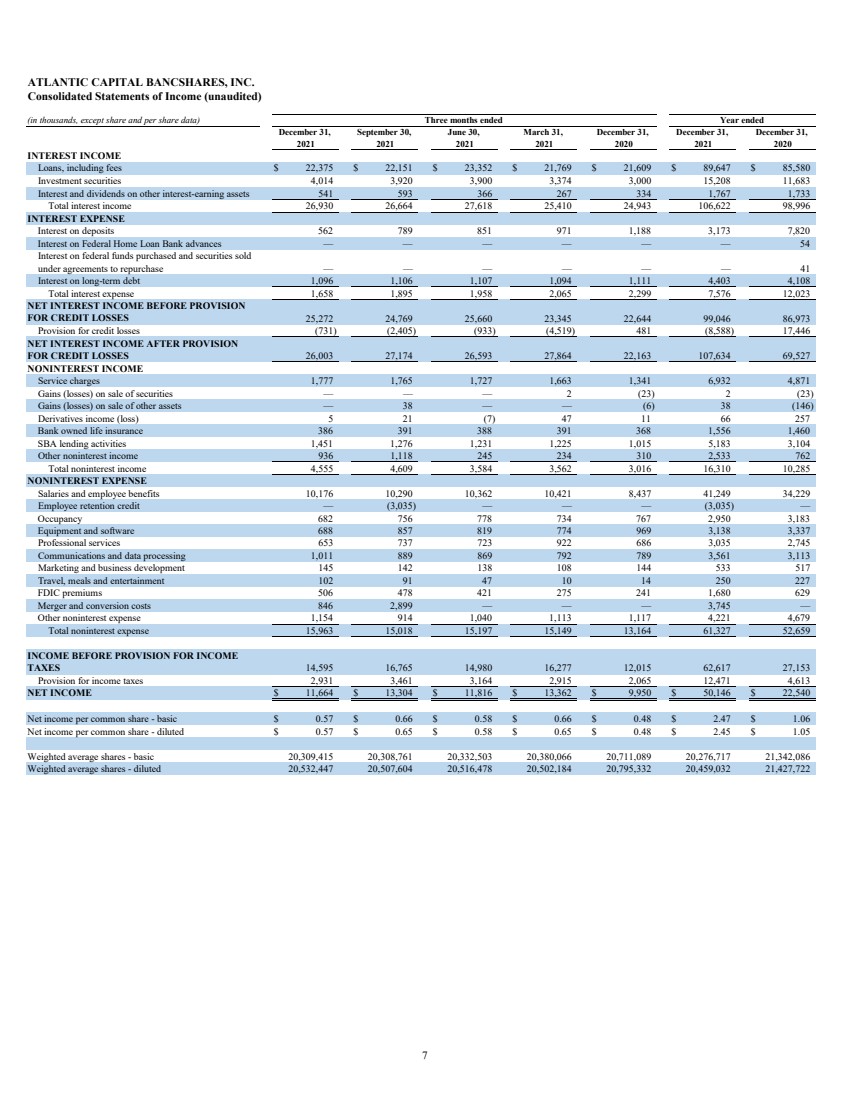
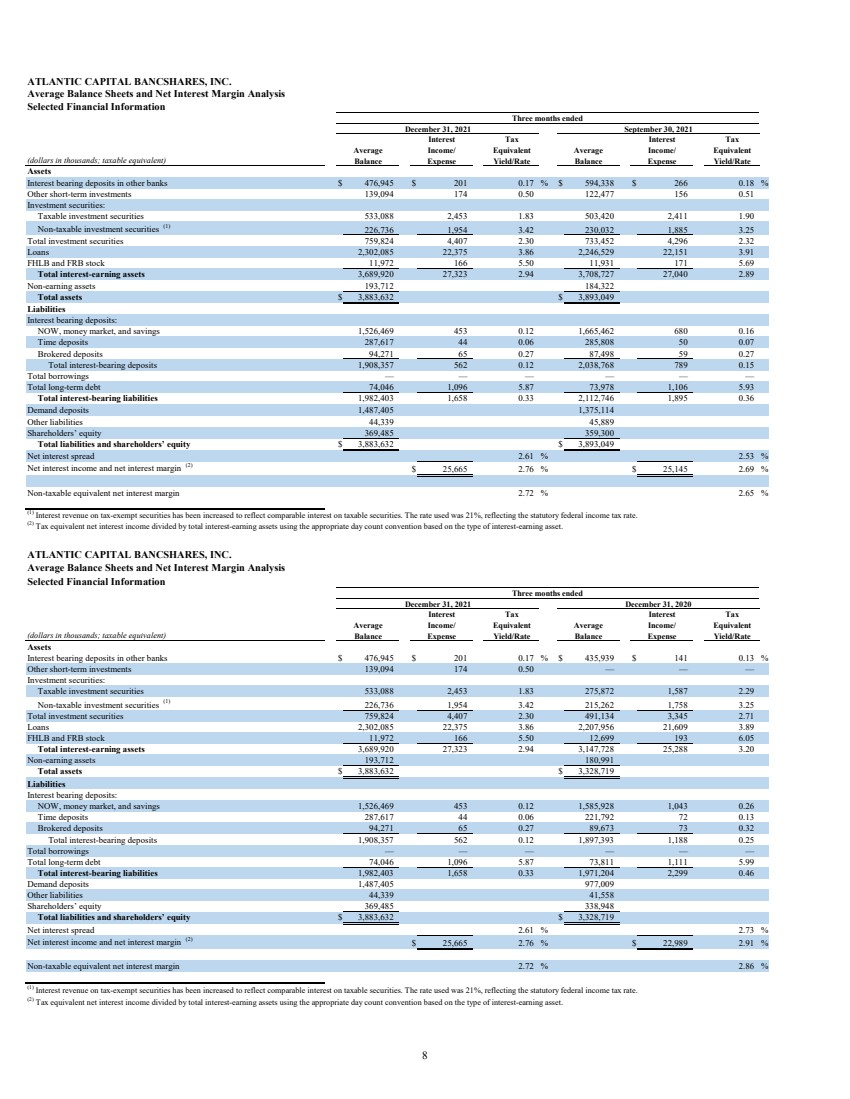
| Taxable equivalent net interest margin was 2.76% in the fourth quarter of 2021, compared to 2.91% in the fourth quarter of 2020 and 2.69% in the third quarter of 2021. The taxable equivalent net interest margin excluding PPP loans was 2.68% for the fourth quarter of 2021, compared to 2.54% for the third quarter of 2021. The yield on loans in the fourth quarter of 2021 was 3.86%, a decrease of 3 basis points from the fourth quarter of 2020 and a decrease of 5 basis points from the third quarter of 2021. Excluding PPP loans, the fourth quarter of 2021 loan yield was 3.75%, up 4 basis points from the third quarter of 2021. The cost of deposits in the fourth quarter of 2021 was 0.07%, a decrease of 9 basis points from the fourth quarter of 2020 and a decrease of 1 basis point from the third quarter of 2021. The cost of interest-bearing deposits decreased 13 basis points to 0.12% from the fourth quarter of 2020 and decreased 3 basis points from the third quarter of 2021. In the fourth quarter of 2021, we recorded a negative provision for credit losses of $731,000, compared to a provision for credit losses of $481,000 in the fourth quarter of 2020 and a negative provision for credit losses of $2.4 million in the third quarter of 2021. Noninterest income totaled $4.6 million in the fourth quarter of 2021, compared to $3.0 million in the fourth quarter of 2020 and $4.6 million in the third quarter of 2021. Noninterest expense totaled $16.0 million in the fourth quarter of 2021, compared to $13.2 million in the fourth quarter of 2020 and $15.0 million in the third quarter of 2021. The fourth quarter of 2021 included $846,000 in merger related expenses compared to $2.9 million in the third quarter of 2021. The third quarter of 2021 also included an expense reduction of $3.0 million as a result of the employee retention payroll tax credit pursuant to the CARES Act. Balance Sheet Total loans held for investment were $2.4 billion at December 31, 2021, an increase of $118.2 million from December 31, 2020 and an increase of $93.4 million from September 30, 2021. Loans held for investment, excluding PPP loans, increased $123.8 million, or 22.2% annualized, from September 30, 2021, and increased $292.4 million, or 14.2%, from December 31, 2020. The allowance for credit losses was 1.05% of total loans held for investment at December 31, 2021, compared to 1.16% at September 30, 2021. The decrease in the allowance was primarily a result of an improvement in our current expected credit losses, or CECL, economic forecast. Excluding the impact of PPP loans, the allowance for credit losses at December 31, 2021 was 1.06%, compared to 1.18% at September 30, 2021. Total average deposits were $3.4 billion for the fourth quarter of 2021, an increase of $521.4 million, or 18.1%, from the fourth quarter of 2020 and a decrease of $18.1 million, or 2.1% annualized, from the third quarter of 2021. Average noninterest bearing deposits were $1.5 billion for the fourth quarter of 2021, an increase of $510.4 million, or 52.2%, from the fourth quarter of 2020 and an increase of $112.3 million, or 32.7% annualized, from the third quarter of 2021. Noninterest bearing deposits were 43.8% of total average deposits in the fourth quarter of 2021, compared to 34.0% in the fourth quarter of 2020 and 40.3% in the third quarter of 2021. Merger Update On July 22, 2021, Atlantic Capital and SouthState entered into an Agreement and Plan of Merger, pursuant to which Atlantic Capital will merge with and into SouthState, with SouthState as the surviving corporation in the merger. The merger remains subject to approval by the Board of Governors of the Federal Reserve System. Approval of the merger has been received from shareholders and the Office of the Comptroller of the Currency. 2 |
| Non-GAAP Financial Measures Statements included in this press release include non-GAAP financial measures and should be read along with the accompanying tables, which provide a reconciliation of non-GAAP financial measures to GAAP financial measures. Atlantic Capital management uses non-GAAP financial measures, including: (i) taxable equivalent interest income; (ii) taxable equivalent net interest income; (iii) loans held for investment excluding PPP loans (iv) loan yield excluding PPP loans; (v) taxable equivalent net interest margin; (vi) taxable equivalent net interest margin excluding PPP loans; (vii) taxable equivalent income before income taxes; (viii) taxable equivalentincome tax expense; (ix) tangible common equity to tangible assets; (x) tangible book value per share, and (xi)allowance for credit losses to loans held for investment excluding PPP loans, in our analysis of the Company'sperformance. Tangible common equity excludes goodwill from shareholders' equity. Management believes that non-GAAP financial measures provide a greater understanding of ongoing performance and operations and enhance comparability with prior periods. Non-GAAP financial measures should not be considered as an alternative to any measure of performance or financial condition as determined in accordance with GAAP, and investors should consider Atlantic Capital’s performance and financial condition as reported under GAAP and all other relevant information when assessing the performance or financial condition of the Company. Non-GAAP financial measures have limitations as analytical tools, and investors should not consider them in isolation or as a substitute for analysis of the results or financial condition as reported under GAAP. Non-GAAP financial measures may not be comparable to non- GAAP financial measures presented by other companies. Forward-Looking Statements This press release contains “forward-looking statements” within the meaning of Section 27A of the Securities Act of 1933, as amended and Section 21E of the Securities Exchange Act of 1934, as amended. These forward-looking statements represent plans, estimates, objectives, goals, guidelines, expectations, intentions, projections and statements of our beliefs concerning future events, business plans, objectives, expected operating results and the assumptions upon which those statements are based. Forward-looking statements include without limitation, any statement that may predict, forecast, indicate or imply future results, performance or achievements, and are typically identified with words such as “may,” “could,” “should,” “will,” “would,” “believe,” “anticipate,” “estimate,” “project,” “expect,” “intend,” “plan,” “strive,” or words or phases of similar meaning. Forward-looking statements may include, among other things, statements about the proposed merger with SouthState, Atlantic Capital’s confidence in its strategies and its expectations about financial performance, the impact of COVID-19 on operations, market growth, market and regulatory trends and developments, acquisitions and divestitures, new technologies, services and opportunities and earnings. The forward-looking statements are based largely on Atlantic Capital’s expectations and are subject to a number of known and unknown risks and uncertainties that are subject to change based on factors which are, in many instances, beyond Atlantic Capital’s control. Atlantic Capital undertakes no obligation to publicly update any forward-looking statement to reflect developments occurring after the statement is made, except as otherwise required by law. Actual results, performance or achievements could differ materially from those contemplated, expressed, or implied by the forward-looking statements as a result of, among other factors, the risks and uncertainties described in “Risk Factors” and “Management’s Discussion and Analysis of Financial Condition and Results of Operations” in Atlantic Capital’s Annual Report on Form 10-K. Additional information and other factors that could affect future financial results are included in Atlantic Capital’s subsequent filings with the SEC. Please refer to the SEC’s website at www.sec.gov where you can review those documents. About Atlantic Capital Bancshares Atlantic Capital Bancshares, Inc. is a $3.8 billion publicly traded bank holding company headquartered in Atlanta, Georgia. Atlantic Capital offers commercial and not-for-profit banking services, specialty corporate financial services, private banking services and commercial real estate finance solutions to privately held companies and individuals in the Atlanta area, as well as payments and other specialized financial services for select clients nationally. 3 |
| Media Contact: Ashley Carson Email: ashley.carson@atlcapbank.com Phone: 404-995-6050 (ACB-ER) Financial Contact: Patrick Oakes Email: patrick.oakes@atlcapbank.com Phone: 404-995-6050 4 |

| ATLANTIC CAPITAL BANCSHARES, INC. Selected Financial Information (in thousands, except share and per share data; taxable equivalent) INCOME SUMMARY Interest income - taxable equivalent (1) $27,323 $27,040 $27,993 $25,775 $25,288 $108,132 $100,474 Interest expense 1,658 1,895 1,958 2,065 2,299 7,576 12,023 Net interest income - taxable equivalent 25,665 25,145 26,035 23,710 22,989 100,556 88,451 Provision for credit losses (731) (2,405) (933) (4,519) 481 (8,588) 17,446 Net interest income after provision for credit losses 26,396 27,550 26,968 28,229 22,508 109,144 71,005 Noninterest income 4,555 4,609 3,584 3,562 3,016 16,310 10,285 Noninterest expense 15,963 15,018 15,197 15,149 13,164 61,327 52,659 Income before income taxes 14,988 17,141 15,355 16,642 12,360 64,127 28,631 Income tax expense 3,324 3,837 3,539 3,280 2,410 13,981 6,091 Net income(1)(2) $11,664 $13,304 $11,816 $13,362 $9,950 $50,146 $22,540 PER SHARE DATA Diluted earnings per share $0.57 $0.65 $0.58 $0.65 $0.48 $2.45 $1.05 Book value per share 18.37 17.92 17.38 16.72 16.60 18.37 16.60 Tangible book value per common share (3) 17.39 16.94 16.40 15.74 15.62 17.39 15.62 PERFORMANCE MEASURES Return on average equity 12.52 % 14.69 % 13.60 % 15.99 % 11.68 % 14.16 % 6.67 % Return on average assets 1.19 1.36 1.26 1.50 1.19 1.32 0.76 Taxable equivalent net interest margin 2.76 2.69 2.91 2.81 2.91 2.79 3.16 Taxable equivalent net interest margin excluding PPP loans 2.68 2.54 2.70 2.70 2.81 2.66 3.18 Efficiency ratio 53.52 51.12 51.97 56.30 51.30 53.16 54.14 Average loans to average deposits 67.79 65.81 67.54 71.93 76.81 68.18 84.11 CAPITAL Average equity to average assets 9.51 9.23 9.24 9.39 10.18 9.34 11.33 Tangible common equity to tangible assets 9.31 8.21 8.86 8.63 8.86 9.31 8.86 Leverage ratio 8.9 (3) 8.5 8.4 8.4 8.9 9.1 (3) 8.9 Total risk based capital ratio 15.3 (3) 15.9 16.0 16.4 16.1 15.3 (3) 16.1 SHARES OUTSTANDING Number of common shares outstanding - basic 20,334,150 20,305,109 20,319,429 20,354,0 20,394,912 20,334,150 20,394,912 Number of common shares outstanding - diluted 20,53,618 20,590,4 20,595,812 20,61,188 20,492,542 20,53,618 20,492,542 Average number of common shares - basic 20,309,415 20,308,61 20,332,503 20,380,066 20,11,089 20,26,1 21,342,086 Average number of common shares - diluted 20,532,44 20,50,604 20,516,48 20,502,184 20,95,332 20,459,032 21,42,22 ASSET QUALITY Allowance for credit losses to loans held for investment 1.05 1.16 1.2 1.31 1.55 1.05 1.55 Net charge-offs to average loans (4) 0.11 0.00 0.10 0.04 0.05 0.06 0.11 Non-performing assets to total assets 0.11 0.10 0.14 0.06 0.13 0.11 0.13 AVERAGE BALANCES Total loans $2,302,085 $2,246,529 $2,233,906 $2,20,660 $2,20,956 $2,263,335 $2,105,930 Investment securities 59,824 33,452 656,50 59,54 491,134 682,96 456,422 Total assets 3,883,632 3,893,049 3,1,90 3,611,41 3,328,19 3,91,043 2,982,222 Deposits 3,395,62 3,413,882 3,30,601 3,156,906 2,84,402 3,319,454 2,503,03 Shareholders equity 369,485 359,300 348,416 338,990 338,948 354,144 33,89 AT PERIOD END Loans and loans held for sale $2,369,321 $2,285,60 $2,264,899 $2,302,661 $2,249,036 $2,369,321 $2,249,036 Investment securities 38,929 2,98 14,065 613,236 535,59 38,929 535,59 Total assets 3,819,585 4,210,316 3,80,445 3,32,668 3,615,61 3,819,585 3,615,61 Deposits 3,32,902 3,2,321 3,306,224 3,2,692 3,161,508 3,32,902 3,161,508 Shareholders’ equity 33,523 363,925 353,185 340,328 338,586 33,523 338,586 (1)Interest income on tax-exempt securities has been increased to reflect comparable interest on taxable securities. The rate used was 21, reflecting the statutory federal income tax rate. (2)Excludes effect of acquisition related intangibles. (3)Amounts are estimates as of December 31, 2021. (4)Annualied. For the year ended 2021 2020 Quarter December 31, Fourth 2020 2021 First Quarter Quarter Quarter Second Quarter Fourth Third 5 |
| ATLANTIC CAPITAL BANCSHARES, INC. Consolidated Balance Sheets (unaudited) (in thousands, except share data) ASSETS Cash and due from banks $16,214 $25,725 $16,865 Interest-bearing deposits in banks 377,780 811,168 636,537 Other short-term investments 137,181 140,848 — Cash and cash equivalents 531,175 977,741 653,402 Investment securities available for sale 501,218 535,158 335,423 Investment securities held to maturity, net of allowance for credit losses of $13, $13, and $14, at December 31, 2021, September 30, 2021, and December 31, 2020, respectively 237,711 237,829 200,156 Other investments 23,546 23,877 25,892 Loans held for sale 2,087 11,814 — Loans held for investment 2,367,234 2,273,856 2,249,036 Less: allowance for loan losses (22,186) (23,924) (31,818) Loans held for investment, net 2,345,048 2,249,932 2,217,218 Premises and equipment, net 17,540 18,517 21,589 Bank owned life insurance 74,385 74,000 72,856 Goodwill 19,925 19,925 19,925 Other intangibles, net 2,597 2,573 2,731 Other real estate owned — — 16 Other assets 64,353 58,950 66,409 Total assets $3,819,585 $4,210,316 $3,615,617 LIABILITIES AND SHAREHOLDERS’ EQUITY Deposits: Noninterest-bearing demand$1,471,920 $1,691,616 $1,033,765 Interest-bearing checking 648,763 721,525 760,638 Savings 884 800 625 Money market 823,127 930,929 1,030,753 Time 288,698 287,865 241,328 Brokered deposits 94,510 94,586 94,399 Total deposits 3,327,902 3,727,321 3,161,508 Long-term debt 74,089 74,024 73,807 Other liabilities 44,071 45,046 41,716 Total liabilities 3,446,062 3,846,391 3,277,031 SHAREHOLDERS’ EQUITY Preferred stock, no par value; 10,000,000 shares authorized; no shares issued and outstanding as of December 31, 2021, September 30, 2021 and December 31, 2020 — — — Common stock, no par value; 100,000,000 shares authorized; 20,334,150, 20,305,109, and 20,394,912 shares issued and outstanding as of December 31, 2021, September 30, 2021 and December 31, 2020, respectively 207,514 207,214 209,942 Retained earnings 164,283 152,619 114,137 Accumulated other comprehensive income 1,726 4,092 14,507 Total shareholders’ equity 373,523 363,925 338,586 TOTAL LIABILITIES AND SHAREHOLDERS’ EQUITY $3,819,585 $4,210,316 $3,615,617 December 31, 2021 December 31, 2020 September 30, 2021 6 |
| ATLANTIC CAPITAL BANCSHARES, INC. Consolidated Statements of Income (unaudited) (in thousands, except share and per share data) INTEREST INCOME Loans, including fees $22,375 $22,151 $23,352 $21,769 $21,609 $89,647 $85,580 Investment securities 4,014 3,920 3,900 3,374 3,000 15,208 11,683 Interest and dividends on other interest‑earning assets 541 593 366 267 334 1,767 1,733 Total interest income 26,930 26,664 27,618 25,410 24,943 106,622 98,996 INTEREST EXPENSE Interest on deposits 562 789 851 971 1,188 3,173 7,820 Interest on Federal Home Loan Bank advances — — — — — — 54 Interest on federal funds purchased and securities sold under agreements to repurchase — — — — — — 41 Interest on long-term debt 1,096 1,106 1,107 1,094 1,111 4,403 4,108 Total interest expense 1,658 1,895 1,958 2,065 2,299 7,576 12,023 NET INTEREST INCOME BEFORE PROVISION FOR CREDIT LOSSES 25,22 24,69 25,660 23,345 22,644 99,046 86,93 Provision for credit losses (31) (2,405) (933) (4,519) 481 (8,588) 1,446 NET INTEREST INCOME AFTER PROVISION FOR CREDIT LOSSES 26,003 2,14 26,593 2,864 22,163 10,634 69,52 NONINTEREST INCOME Service charges 1,777 1,765 1,727 1,663 1,341 6,932 4,871 Gains (losses) on sale of securities — — — 2 (23) 2 (23) Gains (losses) on sale of other assets — 38 — — (6) 38 (146) Derivatives income (loss) 5 21 (7) 47 11 66 257 Bank owned life insurance 386 391 388 391 368 1,556 1,460 SBA lending activities 1,451 1,276 1,231 1,225 1,015 5,183 3,104 Other noninterest income 936 1,118 245 234 310 2,533 762 Total noninterest income 4,555 4,609 3,584 3,562 3,016 16,310 10,285 NONINTEREST EXPENSE Salaries and employee benefits 10,176 10,290 10,362 10,421 8,437 41,249 34,229 Employee retention credit — (3,035) — — — (3,035) — Occupancy 682 756 778 734 767 2,950 3,183 Equipment and software 688 857 819 774 969 3,138 3,337 Professional services 653 737 723 922 686 3,035 2,745 Communications and data processing 1,011 889 869 792 789 3,561 3,113 Marketing and business development 145 142 138 108 144 533 517 Travel, meals and entertainment102 91 47 10 14 250 227 FDIC premiums 506 478 421 275 241 1,680 629 Merger and conversion costs846 2,899 — — — 3,745 — Other noninterest expense 1,154 914 1,040 1,113 1,117 4,221 4,679 Total noninterest expense 15,963 15,018 15,197 15,149 13,164 61,327 52,659 INCOME BEFORE PROVISION FOR INCOME TAXES 14,595 16,65 14,980 16,2 12,015 62,61 2,153 Provision for income taxes 2,931 3,461 3,164 2,915 2,065 12,41 4,613 NET INCOME $11,664 $13,304 $11,816 $13,362 $9,950 $50,146 $22,540 Net income per common share - basic$0.57 $0.66 $0.58 $0.66 $0.48 $2.47 $1.06 Net income per common share - diluted$0.57 $0.65 $0.58 $0.65 $0.48 $2.45 $1.05 Weighted average shares - basic 20,309,415 20,308,761 20,332,503 20,380,066 20,711,089 20,276,717 21,342,086 Weighted average shares - diluted 20,532,447 20,507,604 20,516,478 20,502,184 20,795,332 20,459,032 21,427,722 2021 March 31, September 30, 2021 December 31, 2020 Year ended Three months ended 2020 December 31, 2021 December 31, 2021 June 30, 2021 December 31, 7 |
| ATLANTIC CAPITAL BANCSHARES, INC. Average Balance Sheets and Net Interest Margin Analysis Selected Financial Information Tax Tax Equivalent Equivalent (dollars in thousands; taxable equivalent) Yield/RateYield/Rate Assets Interest bearing deposits in other banks$476,945 $201 0.17 %$594,338 $266 0.18 %Other short-term investments 139,094 174 0.50 122,477 156 0.51 Investment securities: Taxable investment securities 533,088 2,453 1.83 503,420 2,411 1.90 Non-taxable investment securities (1) 226,736 1,954 3.42 230,032 1,885 3.25 Total investment securities 759,824 4,407 2.30 733,452 4,296 2.32 Loans 2,302,085 22,375 3.86 2,246,529 22,151 3.91 FHLB and FRB stock 11,972 166 5.50 11,931 171 5.69 Total interest-earning assets 3,689,920 27,323 2.94 3,708,727 27,040 2.89 Non-earning assets 193,712 184,322 Total assets $3,883,632 $3,893,049 Liabilities Interest bearing deposits: NOW, money market, and savings 1,526,469 453 0.12 1,665,462 680 0.16 Time deposits 287,617 44 0.06 285,808 50 0.07 Brokered deposits 94,271 65 0.27 87,498 59 0.27 Total interest-bearing deposits 1,908,357 562 0.12 2,038,768 789 0.15 Total borrowings— — — — — — Total long-term debt 74,046 1,096 5.87 73,978 1,106 5.93 Total interest-bearing liabilities 1,982,403 1,658 0.33 2,112,746 1,895 0.36 Demand deposits 1,487,405 1,375,114 Other liabilities 44,339 45,889 Shareholders’ equity 369,485 359,300 Total liabilities and shareholders’ equity $3,883,632 $3,893,049 Net interest spread 2.61 % 2.53 % Net interest income and net interest margin (2) $25,665 2.76 % $25,145 2.69 % Non-taxable equivalent net interest margin 2.72 % 2.65 %ATLANTIC CAPITAL BANCSHARES, INC.Average Balance Sheets and Net Interest Margin Analysis Selected Financial Information Tax Tax Equivalent Equivalent (dollars in thousands; taxable equivalent) Yield/RateYield/Rate Assets Interest bearing deposits in other banks$476,945 $201 0.17 % $435,939 $141 0.13 %Other short-term investments 139,094 174 0.50 — — — Investment securities: Taxable investment securities 533,088 2,453 1.83 275,872 1,587 2.29 Non-taxable investment securities (1) 226,736 1,954 3.42 215,262 1,758 3.25 Total investment securities 759,824 4,407 2.30 491,134 3,345 2.71 Loans 2,302,085 22,375 3.86 2,207,956 21,609 3.89 FHLB and FRB stock 11,972 166 5.50 12,699 193 6.05 Total interest-earning assets 3,689,920 27,323 2.94 3,147,728 25,288 3.20 Non-earning assets 193,712 180,991 Total assets $3,883,632 $3,328,719 Liabilities Interest bearing deposits: NOW, money market, and savings 1,526,469 453 0.12 1,585,928 1,043 0.26 Time deposits 287,617 44 0.06 221,792 72 0.13 Brokered deposits 94,271 65 0.27 89,673 73 0.32 Total interest-bearing deposits 1,908,357 562 0.12 1,897,393 1,188 0.25 Total borrowings — — — — — — Total long-term debt 74,046 1,096 5.87 73,811 1,111 5.99 Total interest-bearing liabilities 1,982,403 1,658 0.33 1,971,204 2,299 0.46 Demand deposits 1,487,405 977,009 Other liabilities 44,339 41,558 Shareholders’ equity 369,485 338,948 Total liabilities and shareholders’ equity $3,883,632 $3,328,719 Net interest spread 2.61 % 2.73 % Net interest income and net interest margin (2) $25,665 2.76 % $22,989 2.91 % Non-taxable equivalent net interest margin 2.72 % 2.86 % (1) Interest revenue on tax-exempt securities has been increased to reflect comparable interest on taxable securities. The rate used was 21%, reflecting the statutory federal income tax rate. (2) Tax equivalent net interest income divided by total interest-earning assets using the appropriate day count convention based on the type of interest-earning asset. (1) Interest revenue on tax-exempt securities has been increased to reflect comparable interest on taxable securities. The rate used was 21%, reflecting the statutory federal income tax rate. (2) Tax equivalent net interest income divided by total interest-earning assets using the appropriate day count convention based on the type of interest-earning asset. Balance Three months ended September 30, 2021 Interest Income/ Expense Interest Income/ Expense December 31, 2021 Average Balance Average Balance Interest Income/ Expense Three months ended December 31, 2021 December 31, 2020 Interest Income/ Expense Average Balance Average 8 |
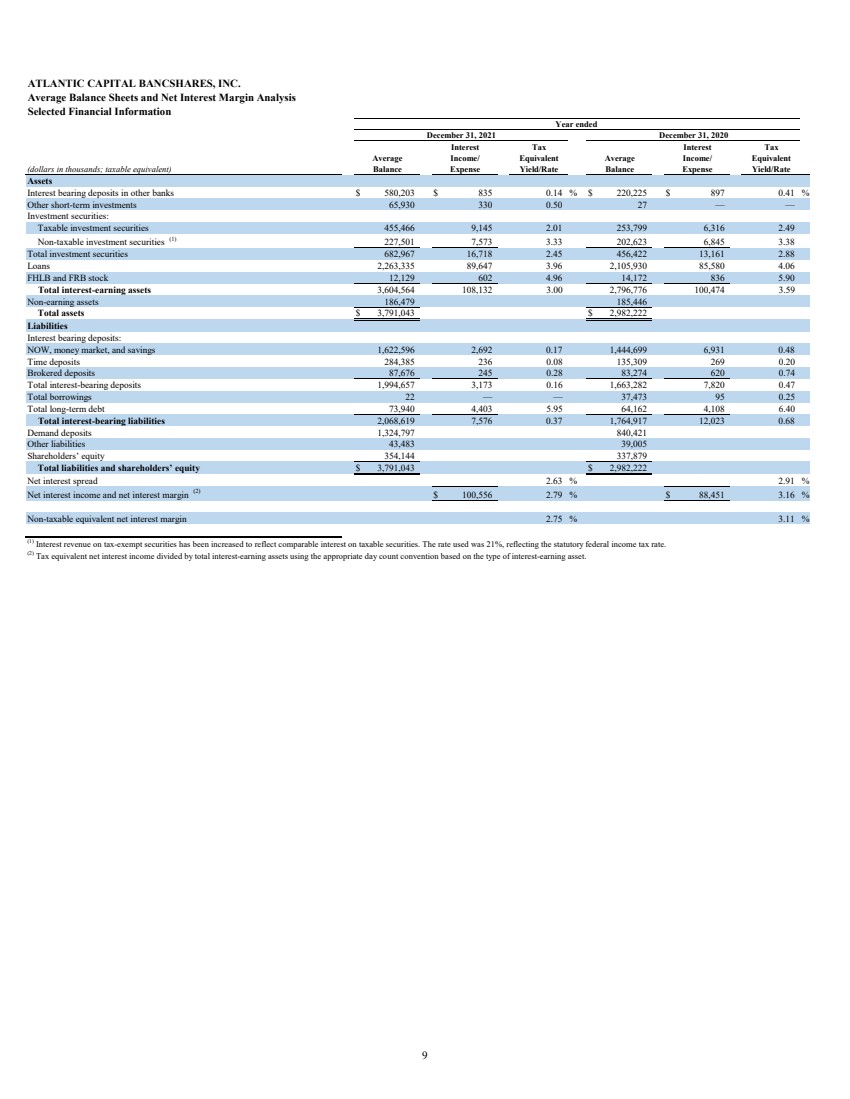
| ATLANTIC CAPITAL BANCSHARES, INC. Average Balance Sheets and Net Interest Margin AnalysisSelected Financial Information Tax TaxEquivalentEquivalent (dollars in thousands; taxable equivalent) Yield/RateYield/Rate Assets Interest bearing deposits in other banks$580,203 $835 0.14 % $220,225 $897 0.41 %Other short-term investments 65,930 330 0.50 27 — — Investment securities: Taxable investment securities 455,466 9,145 2.01 253,799 6,316 2.49 Non-taxable investment securities (1) 227,501 7,573 3.33 202,623 6,845 3.38 Total investment securities 682,967 16,718 2.45 456,422 13,161 2.88 Loans 2,263,335 89,647 3.96 2,105,930 85,580 4.06 FHLB and FRB stock 12,129 602 4.96 14,172 836 5.90 Total interest-earning assets 3,604,564 108,132 3.00 2,796,776 100,474 3.59 Non-earning assets 186,479 185,446 Total assets $3,791,043 $2,982,222 Liabilities Interest bearing deposits: NOW, money market, and savings 1,622,596 2,692 0.17 1,444,699 6,931 0.48 Time deposits 284,385 236 0.08 135,309 269 0.20 Brokered deposits 87,676 245 0.28 83,274 620 0.74 Total interest-bearing deposits 1,994,657 3,173 0.16 1,663,282 7,820 0.47 Total borrowings 22 — — 37,473 95 0.25 Total long-term debt 73,940 4,403 5.95 64,162 4,108 6.40 Total interest-bearing liabilities 2,068,619 7,576 0.37 1,764,917 12,023 0.68 Demand deposits 1,324,797 840,421 Other liabilities 43,483 39,005 Shareholders’ equity 354,144 337,879 Total liabilities and shareholders’ equity $3,791,043 $2,982,222 Net interest spread 2.63 % 2.91 % Net interest income and net interest margin (2) $100,556 2.79 % $88,451 3.16 % Non-taxable equivalent net interest margin 2.75 % 3.11 % Interest (2) Tax equivalent net interest income divided by total interest-earning assets using the appropriate day count convention based on the type of interest-earning asset. Expense (1) Interest revenue on tax-exempt securities has been increased to reflect comparable interest on taxable securities. The rate used was 21, reflecting the statutory federal income tax rate. Year ended December 31, 2020 Interest Income/ Expense December 31, 2021 Average Balance Average Balance Income/ 9 |
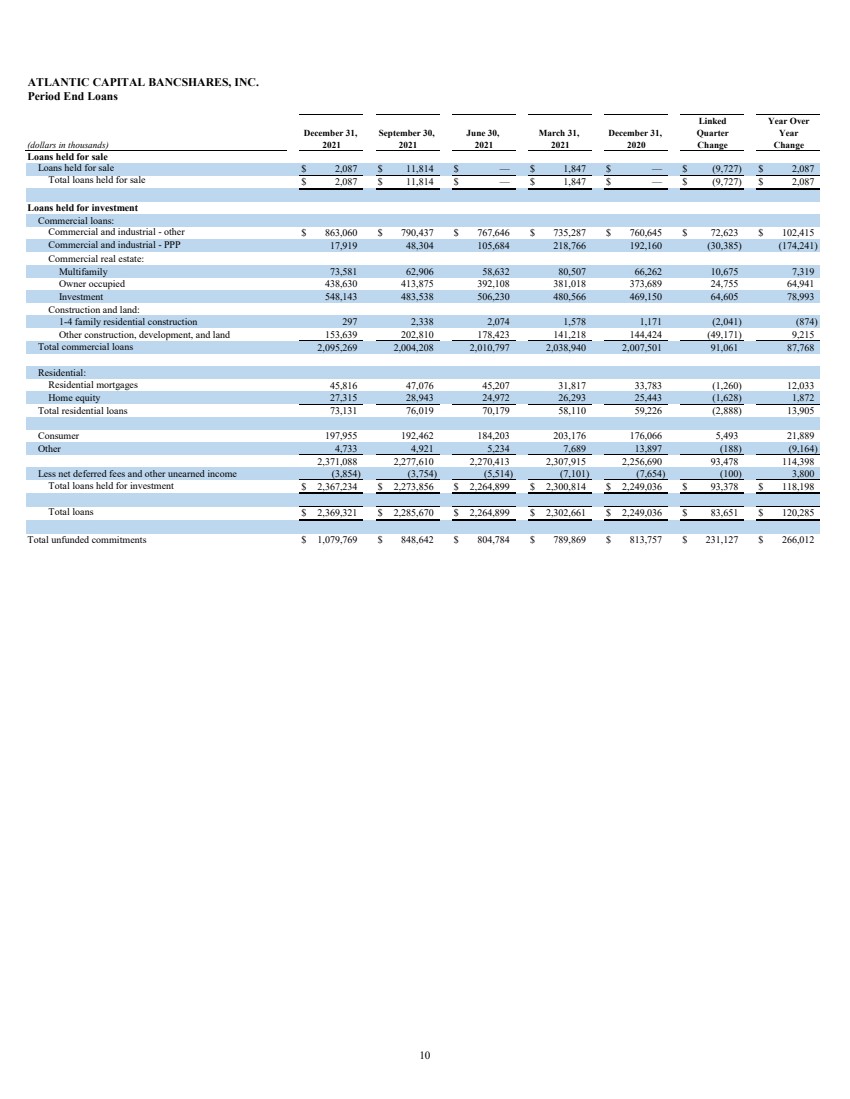
| ATLANTIC CAPITAL BANCSHARES, INC. Period End Loans (dollars in thousands) Loans held for sale Loans held for sale $2,087 $11,814 $— $1,847 $— $(9,727) $2,087 Total loans held for sale $2,087 $11,814 $— $1,847 $— $(9,727) $2,087 Loans held for investment Commercial loans: Commercial and industrial - other $863,060 $790,437 $767,646 $735,287 $760,645 $72,623 $102,415 Commercial and industrial - PPP 17,919 48,304 105,684 218,766 192,160 (30,385) (174,241) Commercial real estate: Multifamily 73,581 62,906 58,632 80,507 66,262 10,675 7,319 Owner occupied 438,630 413,875 392,108 381,018 373,689 24,755 64,941 Investment 548,143 483,538 506,230 480,566 469,150 64,605 78,993 Construction and land: 1‑4 family residential construction 297 2,338 2,074 1,578 1,171 (2,041) (874) Other construction, development, and land 153,639 202,810 178,423 141,218 144,424 (49,171) 9,215 Total commercial loans 2,095,269 2,004,208 2,010,797 2,038,940 2,007,501 91,061 87,768 Residential: Residential mortgages 45,816 47,076 45,207 31,817 33,783 (1,260) 12,033 Home equity 27,315 28,943 24,972 26,293 25,443 (1,628) 1,872 Total residential loans 73,131 76,019 70,179 58,110 59,226 (2,888) 13,905 Consumer 197,955 192,462 184,203 203,176 176,066 5,493 21,889 Other 4,733 4,921 5,234 7,689 13,897 (188) (9,164) 2,371,088 2,277,610 2,270,413 2,307,915 2,256,690 93,478 114,398 Less net deferred fees and other unearned income (3,854) (3,754) (5,514) (7,101) (7,654) (100) 3,800 Total loans held for investment $2,367,234 $2,273,856 $2,264,899 $2,300,814 $2,249,036 $93,378 $118,198 Total loans $2,369,321 $2,285,670 $2,264,899 $2,302,661 $2,249,036 $83,651 $120,285 Total unfunded commitments $1,079,769 $848,642 $804,784 $789,869 $813,757 $231,127 $266,012 Year Over Year Change 2020 Linked Quarter Change December 31, December 31, 2021 June 30, 2021 March 31, 2021 September 30, 2021 10 |
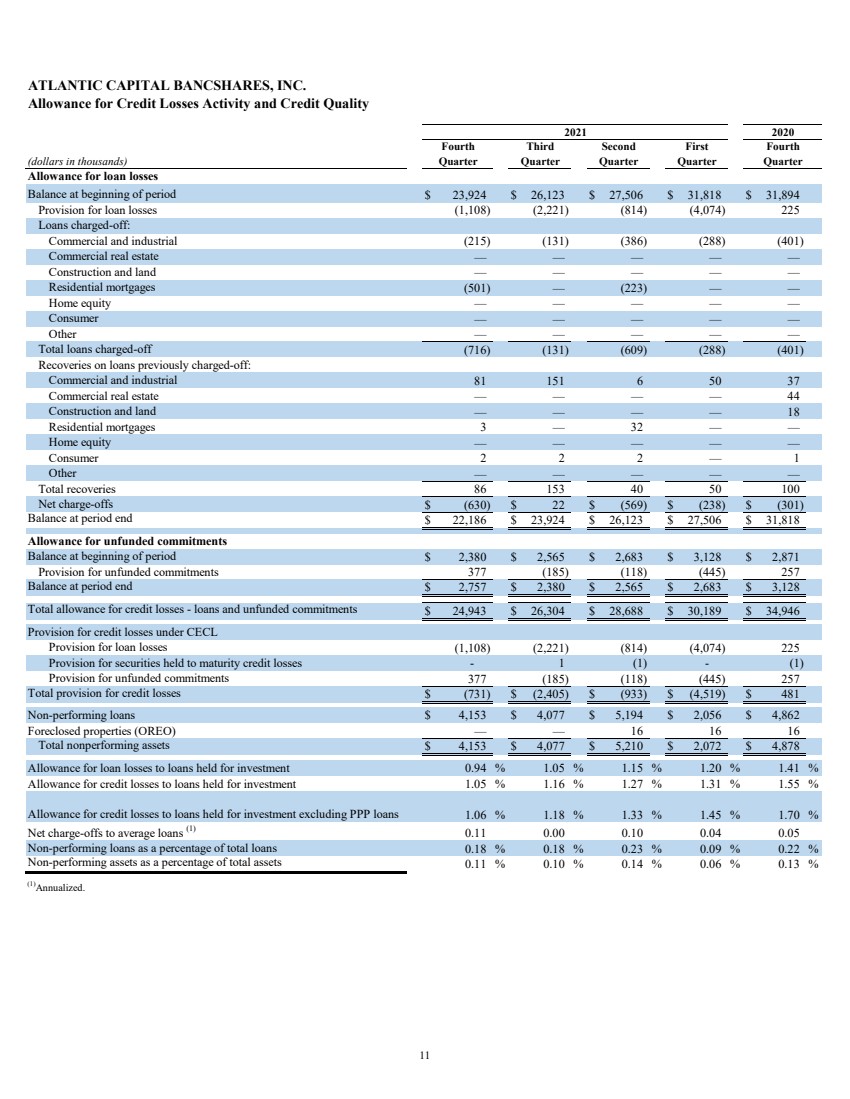
| ATLANTIC CAPITAL BANCSHARES, INC. Allowance for Credit Losses Activity and Credit Quality (dollars in thousands) lloance or loan losses Balance at beginning of period $23,924 $26,123 $27,506 $31,818 $31,894 Provision for loan losses (1,108) (2,221) (814) (4,074) 225 Loans charged-off: Commercial and industrial (215) (131) (386) (288) (401) Commercial real estate — — — — — Construction and land — — — — — Residential mortgages (501) — (223) — — Home equity — — — — — Consumer — — — — — Other — — — — — Total loans charged-off (716) (131) (609) (288) (401) Recoveries on loans previously charged-off: Commercial and industrial 81 151 6 50 37 Commercial real estate — — — — 44 Construction and land — — — — 18 Residential mortgages 3 — 32 — — Home equity — — — — — Consumer 2 2 2 — 1 Other — — — — — Total recoveries 86 153 40 50 100 Net charge-offs $(630) $22 $(569) $(238) $(301) Balance at period end $22,186 $23,924 $26,123 $27,506 $31,818 Allowance for unfunded commitments Balance at beginning of period $2,380 $2,565 $2,683 $3,128 $2,871 Provision for unfunded commitments 377 (185) (118) (445) 257 Balance at period end $2,757 $2,380 $2,565 $2,683 $3,128 Total allowance for credit losses - loans and unfunded commitments $24,943 $26,304 $28,688 $30,189 $34,946 Provision for credit losses under CECL Provision for loan losses (1,108) (2,221) (814) (4,074) 225 Provision for securities held to maturity credit losses - 1 (1) - (1) Provision for unfunded commitments 377 (185) (118) (445) 257 Total provision for credit losses $(731) $(2,405) $(933) $(4,519) $481 Non-performing loans $4,153 $4,077 $5,194 $2,056 $4,862 Foreclosed properties (OREO) — — 16 16 16 Total nonperforming assets $4,153 $4,077 $5,210 $2,072 $4,878 Allowance for loan losses to loans held for investment 0.94 % 1.05 % 1.15 % 1.20 % 1.41 % Allowance for credit losses to loans held for investment 1.05 % 1.16 % 1.27 % 1.31 % 1.55 % Allowance for credit losses to loans held for investment excluding PPP loans 1.06 % 1.18 % 1.33 % 1.45 % 1.70 % Net charge-offs to average loans (1) 0.11 0.00 0.10 0.04 0.05 Non-performing loans as a percentage of total loans 0.18 % 0.18 % 0.23 % 0.09 % 0.22 % Non-performing assets as a percentage of total assets 0.11 % 0.10 % 0.14 % 0.06 % 0.13 % (1)Annualized. Quarter Fourth 2020 2021 Fourth Quarter Third Quarter Second Quarter First Quarter 11 |
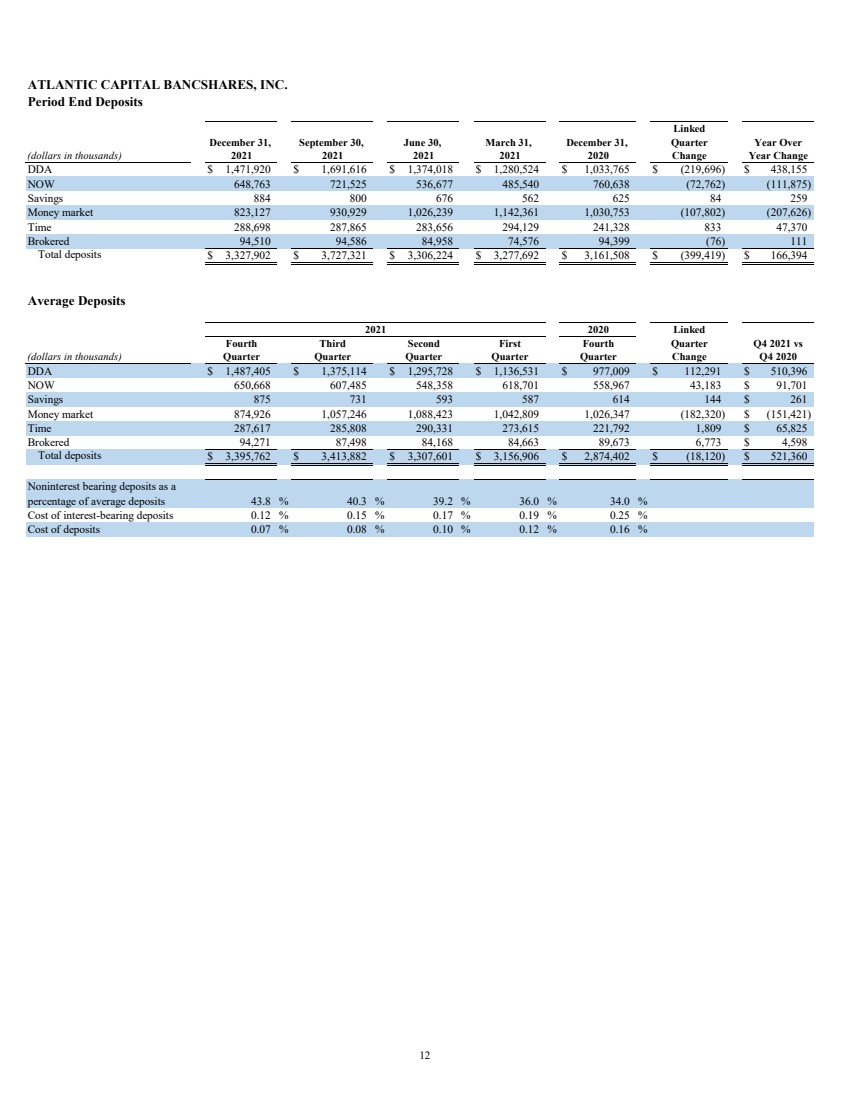
| ATLANTIC CAPITAL BANCSHARES, INC. Period End Deposits (dollars in thousands) DDA $1,471,920 $1,691,616 $1,374,018 $1,280,524 $1,033,765 $(219,696) $438,155 NOW 648,763 721,525 536,677 485,540 760,638 (72,762) (111,875) Savings 884 800 676 562 625 84 259 Money market 823,127 930,929 1,026,239 1,142,361 1,030,753 (107,802) (207,626) Time 288,698 287,865 283,656 294,129 241,328 833 47,370 Brokered 94,510 94,586 84,958 74,576 94,399 (76) 111 Total deposits $3,327,902 $3,727,321 $3,306,224 $3,277,692 $3,161,508 $(399,419) $166,394 Average Deposits (dollars in thousands) DDA $1,487,405 $1,375,114 $1,295,728 $1,136,531 $977,009 $112,291 $510,396 NOW 650,668 607,485 548,358 618,701 558,967 43,183 $91,701 Savings 875 731 593 587 614 144 $261 Money market 874,926 1,057,246 1,088,423 1,042,809 1,026,347 (182,320) $(151,421) Time 287,617 285,808 290,331 273,615 221,792 1,809 $65,825 Brokered 94,271 87,498 84,168 84,663 89,673 6,773 $4,598 Total deposits $3,395,762 $3,413,882 $3,307,601 $3,156,906 $2,874,402 $(18,120) $521,360 Noninterest bearing deposits as a percentage of average deposits 43.8 % 40.3 % 39.2 % 36.0 % 34.0 % Cost of interest-bearing deposits 0.12 % 0.15 % 0.17 % 0.19 % 0.25 % Cost of deposits 0.07 % 0.08 % 0.10 % 0.12 % 0.16 % Change Q4 2020 Quarter Quarter Quarter Quarter Quarter Quarter Q4 2021 vs Fourth Third Second First Fourth Linked 2020 2021 December 31, 2021 Year Over Year Change 2021 September 30, March 31, 2021 2020 December 31, June 30, 2021 Linked Quarter Change 12 |
| ATLANTIC CAPITAL BANCSHARES, INC. Non-GAAP Performance and Financial Measures Reconciliation (in thousands, except share and per share data) axable equivalent interest incoe reconciliation Interest income - GAAP $26,930 $26,664 $27,618 $25,410 $24,943 $106,622 $98,996 Taxable equivalent adjustment 393 376 375 365 345 1,510 1,478 Interest income - taxable equivalent $27,323 $27,040 $27,993 $25,775 $25,288 $108,132 $100,474 Taxable equivalent net interest income reconciliation Net interest income - GAAP $25,272 $24,769 $25,660 $23,345 $22,644 $99,046 $86,973 Taxable equivalent adjustment 393 376 375 365 345 1,510 1,478 Net interest income - taxable equivalent $25,665 $25,145 $26,035 $23,710 $22,989 $100,556 $88,451 Loan yield excluding PPP loans reconciliation Loan yield - GAAP3.86 % 3.91 % 4.19 % 3.89 % 3.89 % 3.96 % 4.06 % Impact of PPP loans(0.11) (0.20) (0.24) (0.06) (0.03) (0.15) 0.10 Loan yield excluding PPP loans3.75 % 3.71 % 3.95 % 3.83 % 3.86 % 3.81 % 4.16 % Taxable equivalent net interest margin reconciliation Net interest margin - GAAP 2.72 % 2.65 % 2.87 % 2.76 % 2.86 % 2.75 % 3.11 %Impact of taxable equivalent adjustment 0.04 0.04 0.04 0.05 0.05 0.04 0.05 Net interest margin - taxable equivalent 2.76 % 2.69 % 2.91 % 2.81 % 2.91 % 2.79 % 3.16 % Taxable equivalent net interest margin excluding PPP loans reconciliation Net interest margin - taxable equivalent 2.6 2.69 2.91 2.81 2.91 2.9 3.11 Impact of PPP loans (0.08) (0.15) (0.21) (0.11) (0.10) (0.13) 0.0 Net interest margin - taxable equivalent excluding PPP loans 2.68 2.54 2.0 2.0 2.81 2.66 3.18 Taxable equivalent income before income taxes reconciliation Income before income taxes - GAAP $14,595 $16,765 $14,980 $16,277 $12,015 $62,617 $27,153 Taxable equivalent adjustment 393 376 375 365 345 1,510 1,478 Income before income taxes$14,988 $17,141 $15,355 $16,642 $12,360 $64,127 $28,631 Taxable equivalent income tax expense reconciliation Income tax expense - GAAP $2,931 $3,461 $3,164 $2,915 $2,065 $12,471 $4,613 Taxable equivalent adjustment 393 376 375 365 345 1,510 1,478 Income tax expense$3,324 $3,837 $3,539 $3,280 $2,410 $13,981 $6,091 Tangible book value per common share reconciliation Total shareholders’ equity$373,523 $363,925 $353,185 $340,328 $338,586 $373,523 $338,586 Intangible assets (19,925) (19,925) (19,925) (19,925) (19,925) (19,925) (19,925) Total tangible common equity$353,598 $344,000 $333,260 $320,403 $318,661 $353,598 $318,661 Common shares outstanding 20,334,150 20,305,109 20,319,429 20,354,077 20,394,912 20,334,150 20,394,912 Book value per common share - GAAP $18.37 $17.92 $17.38 $16.72 $16.60 $18.37 $16.60 Tangible book value 17.39 16.94 16.40 15.74 15.62 17.39 15.62 Tangible common equity to tangible assets reconciliation Total shareholders’ equity$373,523 $363,925 $353,185 $340,328 $338,586 $373,523 $338,586 Intangible assets (19,925) (19,925) (19,925) (19,925) (19,925) (19,925) (19,925) Total tangible common equity$353,598 $344,000 $333,260 $320,403 $318,661 $353,598 $318,661 Total assets$3,819,585 $4,210,316 $3,780,445 $3,732,668 $3,615,617 $3,819,585 $3,615,617 Intangible assets (19,925) (19,925) (19,925) (19,925) (19,925) (19,925) (19,925) Total tangible assets$3,799,660 $4,190,391 $3,760,520 $3,712,743 $3,595,692 $3,799,660 $3,595,692 Tangible common equity to tangible assets 9.31 % 8.21 % 8.86 % 8.63 % 8.86 % 9.31 % 8.86 % Allowance for credit losses to loans held for investment reconciliation Total loans held for investment$2,36,234 $2,23,856 $2,264,899 $2,300,814 $2,249,036 $2,36,234 $2,249,036 PPP loans(1,919) (48,304) (105,684) (218,66) (192,160) (1,919) (192,160) Total loans held for investment excluding PPP loans$2,349,315 $2,225,552 $2,159,215 $2,082,048 $2,056,86 $2,349,315 $2,056,86 Allowance for credit losses to loans held for investment1.05 1.16 1.2 1.31 1.55 1.05 1.55 Allowance for credit losses to loans held for investment excluding PPP loans 1.06 1.18 1.33 1.45 1.0 1.06 1.0 Second Fourth Quarter First Quarter Quarter 2020 2021 Third Quarter Fourth Quarter For the twelve months ended December 31, 2021 2020 13 |