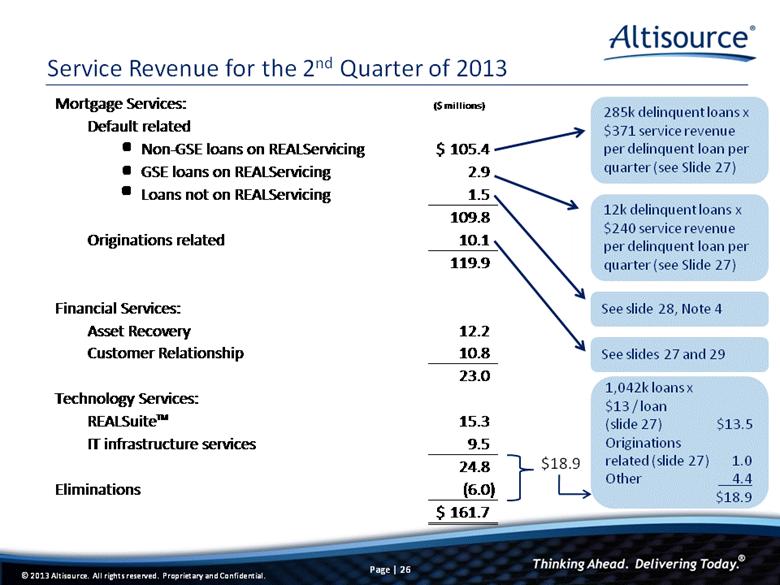
| Service Revenue Scenarios: Assumptions Portfolio acquisition assumptions Scenario 1 Scenario 2 Annual non-GSE portfolio acquisitions by Ocwen in 2014, 2015 and 2016 (no non-GSE portfolio acquisitions in 2017) None $100 billion This presentation was first provided in Q1’13. It reflects all servicing rights acquisitions announced by Ocwen through July 31, 2013. Unless otherwise indicated, it has not otherwise been updated to reflect current business conditions. 1 Delinquency rate is calculated as the average % of total number of loans that are delinquent for more than 30 days, including loans in bankruptcy, foreclosure and REO 2 Delinquency rates are projected to decline at the same rate as projected by Moodys’ CreditForecast.com (March 2013) 3 U.S. loan origination projections for 2013 and 2014 based on Mortgage Bankers Association March 22, 2013 forecast. U.S. loan origination projections from 2015 to 2017 based on Moodys’ Analytics 4 Consists of Ally Bank portfolio expected to be boarded in 2014 and loans originated by Ocwen’s origination platform 5 Revised to reflect the delay in the launch of the direct-to-broker program Assumptions applicable to all scenarios 2013 2014 2015 2016 2017 Actual 2Q’13 YTD Default related Non-GSE delinquency rate1, 2 28% 24% 20% 19% 19% 30% GSE delinquency rate1, 2 on legacy portfolios acquired by Ocwen through March 31, 2013 20% 17% 14% 13% 13% 21% GSE delinquency rate1 on new portfolios acquired or originated by Ocwen subsequent to March 31, 2013 0% 0% 0% 0% 0% 0% Originations related U.S. loan originations ($bn) 3 1,410 1,061 900 1,100 1,300 976 Lenders One and Ocwen share of U.S. loan origination market 11% 13% 14% 15% 15% 12% Origination related services revenue expressed as basis points of loans originated by Lenders One and Ocwen 4 6 10 13 16 2 Technology Services Number of performing GSE loans on REALServicing (related to Ocwen PMSR acquisitions or new originations occurring subsequent to March 31, 2013) that generates Technology Services revenue only 4 - 386,000 409,000 479,000 581,000 - Residential asset business - average rental homes under management 113 1,600 5,700 13,600 24,100 3 Hubzu – non-Ocwen properties sold 2,5005 17,000 26,000 36,000 49,000 2 Financial Services - annual revenue growth rate 25% 18% 10% 10% 10% 16% |