| UNITED STATES |
| SECURITIES AND EXCHANGE COMMISSION |
| Washington, D.C. 20549 |
| |
FORM N-CSR |
| |
CERTIFIED SHAREHOLDER REPORT OF REGISTERED |
MANAGEMENT INVESTMENT COMPANIES |
| |
| |
| |
| Investment Company Act File Number: 811-22293 |
|
| |
| T. Rowe Price U.S. Large-Cap Core Fund, Inc. |
|
| (Exact name of registrant as specified in charter) |
| |
| 100 East Pratt Street, Baltimore, MD 21202 |
|
| (Address of principal executive offices) |
| |
| David Oestreicher |
| 100 East Pratt Street, Baltimore, MD 21202 |
|
| (Name and address of agent for service) |
| |
| |
| Registrant’s telephone number, including area code: (410) 345-2000 |
| |
| |
| Date of fiscal year end: December 31 |
| |
| |
| Date of reporting period: June 30, 2010 |
Item 1: Report to Shareholders| U.S. Large-Cap Core Fund | June 30, 2010 |
The views and opinions in this report were current as of June 30, 2010. They are not guarantees of performance or investment results and should not be taken as investment advice. Investment decisions reflect a variety of factors, and the managers reserve the right to change their views about individual stocks, sectors, and the markets at any time. As a result, the views expressed should not be relied upon as a forecast of the fund’s future investment intent. The report is certified under the Sarbanes-Oxley Act, which requires mutual funds and other public companies to affirm that, to the best of their knowledge, the information in their financial reports is fairly and accurately stated in all material respects.
REPORTS ON THE WEB
Sign up for our E-mail Program, and you can begin to receive updated fund reports and prospectuses online rather than through the mail. Log in to your account at troweprice.com for more information.
Manager’s Letter
Fellow Shareholders
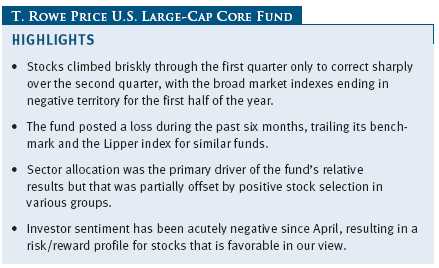
The fund celebrated its first anniversary on June 26, 2010. After getting off to a good start in 2009 through the first quarter of the year, the equity market pulled back sharply and ended with losses for the first half of 2010. Equities have been a tale of two markets so far this year, with stocks climbing briskly through the first quarter only to correct sharply over the second. All sectors were negative during the past six months. Industrials and business services, consumer discretionary, and consumer staples, while down, were the top-performing sectors. Energy, materials, and information technology were the weakest areas.
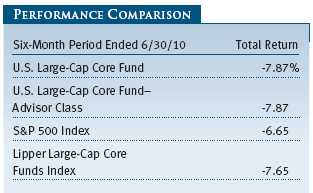
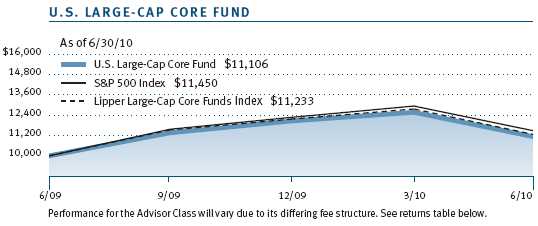
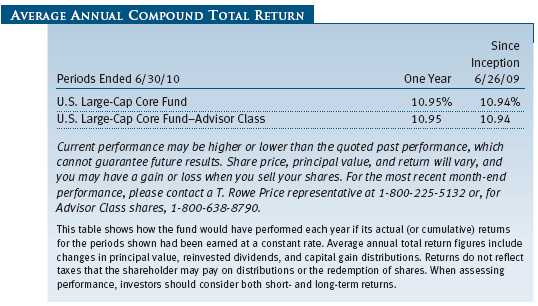
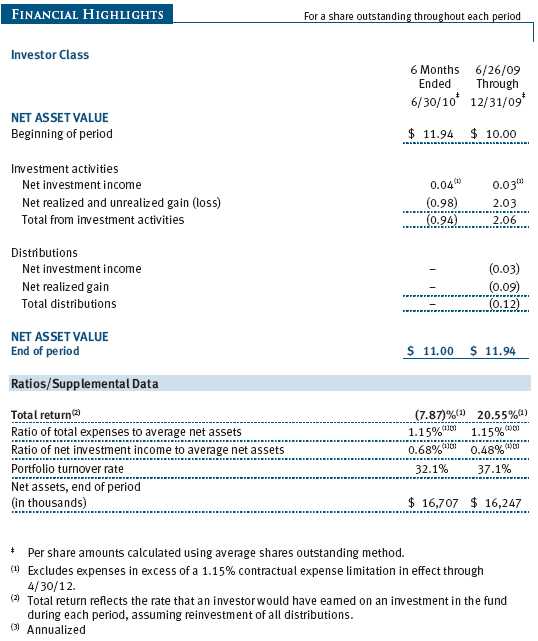
Your fund returned -7.87% during the first half of 2010 as equity markets sold off across the board. The fund’s six-month return compares with -6.65% for the broad S&P 500 Index and -7.65% for its Lipper peer group, the Lipper Large-Cap Core Funds Index. Our allocation to various sectors accounted for most of the fund’s slight shortfall versus the benchmarks, but positive stock selection made up part of the difference as our holdings held up reasonably well during the sell-off.
INVESTMENT APPROACH
The U.S. Large-Cap Core Fund seeks long-term capital appreciation by investing in a concentrated portfolio of domestic large-cap growth and value stocks. The fund uses a fundamental, bottom-up analysis that also relies on a rigorous valuation assessment to find the stocks with the most potential for appreciation.
In selecting the stocks for the portfolio, the fund generally starts with companies of more than $4 billion market capitalization that carry “buy” ratings from T. Rowe Price analysts. In our analysis of these companies, we focus on four key elements: understanding a company’s business model and strategy, developing a relationship with the company’s management, determining the company’s standing within its industry, and assessing the company’s valuation.

The fund focuses on high-quality companies that have opportunities to increase their market share or have barriers to entry around their business that protect them and allow them to grow organically. We invest in well-managed firms with great products and services within an industry that may be in a cyclical trough. Lastly, we favor companies with characteristics that we believe can drive equity appreciation, such as pricing power, new product cycles, improving margins, and a strategy to earn better returns on their invested capital.
Beyond good fundamentals, we look for management teams that can create value by executing well and improving the business. We also pay close attention to free cash flow and management’s effectiveness in redeploying its capital. We like managements that invest in their business when there is the potential for attractive returns or return capital to shareholders if conditions warrant.
We also have in place a disciplined sell process. After stocks are added to the portfolio, they are subject to continued scrutiny. Criteria for selling stocks include a downgrade by a T. Rowe Price analyst, deterioration in the company’s fundamentals or management, the discovery of a better investment idea, or the fulfillment of our investment thesis when a stock becomes fully valued.
MARKET ENVIRONMENT
The year to date has been a Jekyll and Hyde performance for equities. Stocks gained steadily through the first quarter and into the early weeks of the second, only to pull back sharply as the second quarter progressed. The peak in April saw the broad S&P 500 Index pushing above 1,200 only to endure a correction, dropping it below 1,050.
Starting in late April, a number of factors began to cloud the atmosphere. China embraced initiatives to avoid overheating. The sovereign debt crisis emanated from Greece and spilled into developed Europe, resulting in austerity measures and threatening growth in the U.S. The oil spill in the Gulf of Mexico, followed by the deepwater drilling moratorium and its legal and economic ramifications, further dimmed investor confidence. And softer economic data, particularly related to jobs and housing, restrained investors’ appetite for riskier assets. As if the combined effect of these developments was not enough, the market also faced the prospects for declining corporate profits because of the weakening euro, higher U.S. tax rates in 2011, and the absence of new stimulus programs to drive growth.
In the U.S., inventories held by wholesalers rose during the period while retail sales fell in May for the first time in more than a year, suggesting that the economy is still struggling to gain some traction. Weak sales could discourage businesses from increasing their orders and result in a slowdown in production. Nevertheless, we do not believe the economy is heading back into a recession. Sharp increases in productivity as a result of cost-cutting appear to be coming to an end, setting the stage for an eventual improvement in job gains and household spending.
Through it all, the U.S. Federal Reserve adopted a cautious stance, stating that “economic conditions, including low rates of resource utilization, subdued inflation trends, and stable inflation expectations, are likely to warrant exceptionally low levels of the federal funds rate for an extended period.” With inflation below the Fed’s comfort zone of 1% to 2% a year, the central bank is unlikely to start raising short-term rates until clear signs emerge that the battle is over and core inflation is accelerating from its current level.
PORTFOLIO HIGHLIGHTS
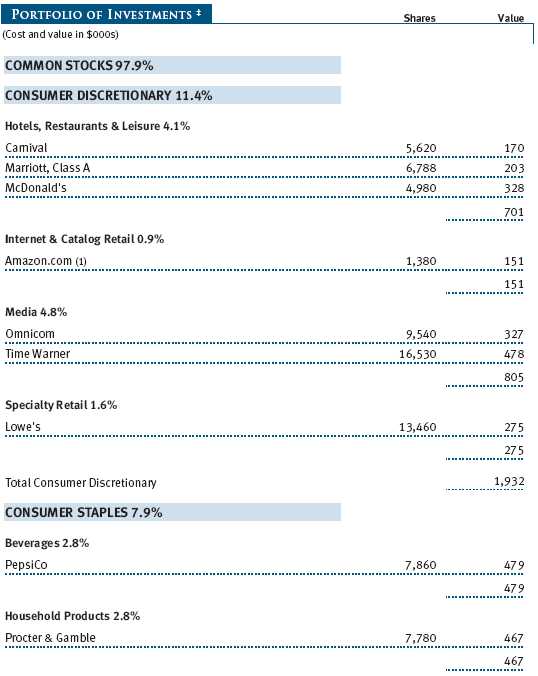
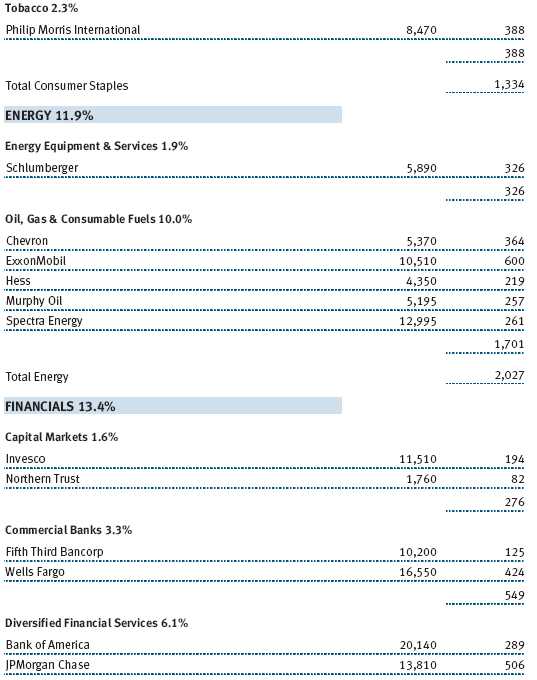
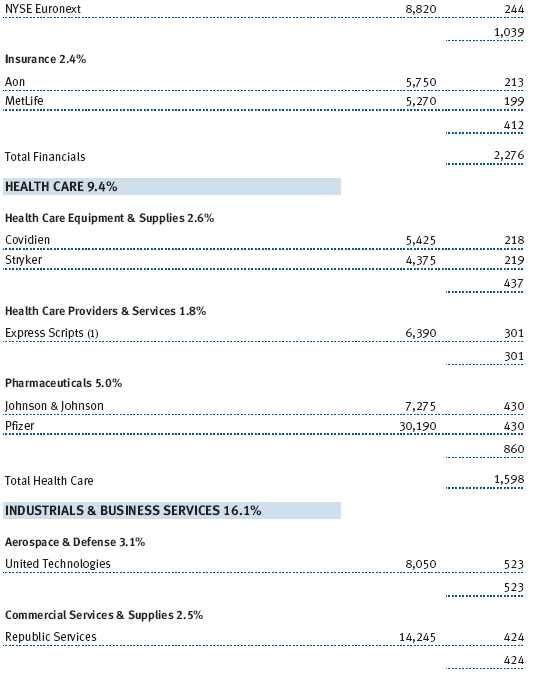
While our sector weights were a drag on the fund’s relative return, good stock selection in various sectors made back part of the shortfall versus the benchmarks. Our health care holdings were particularly beneficial during the reporting period, thanks to our focus on Express Scripts, which was also a top contributor to absolute performance, and McKesson. (Please refer to the fund’s portfolio of investments for a complete listing of holdings and the amount each represents in the portfolio.)
Stock selection and an overweight in industrials, one of the better-performing groups in the index, helped relative performance. Republic Services, which did well on an absolute basis, also enhanced results relative to the broad market. The fund benefited from its energy holdings, particularly Spectra Energy, which is one of North America’s leading providers of natural gas infrastructure—an increasingly important area of energy sources.

On a negative note, the portfolio also contained its weaker areas. Stock selection and an overweight in information technology, one of the worst-performing groups during the period, were the largest detractors from relative performance because of an overweight in Google and an underweight in Apple. Despite the underweight, Apple was the top absolute contributor for the six-month period.
Google was one of the losers in the group, as the company was buffeted by a range of issues: the emergence of social media as a competitor in online advertising, Apple’s plans to enter mobile media advertising, management’s highly publicized battle with the Chinese government, and some lesser issues including the early success of Microsoft’s Bing offering. We believe the stock more than reflects these concerns. The core search business continues to grow even in the U.S. and U.K.—its most mature markets. Google’s mobile position is strong, given the building success of its Android operating system, and the company has made dramatic progress in display advertising. We continue to maintain a large position in the stock.
Stock selection and an underweight in financials, one of the stronger groups, detracted from results. Shares of Goldman Sachs fell sharply after the SEC filed fraud charges against the company, and we eliminated the stock because of regulatory challenges. In the case of JPMorgan Chase, a major detractor from absolute results, we believe improving credit quality and finalization of regulatory reform will provide greater clarity on the earnings power of the company.
PORTFOLIO STRATEGY
The portfolio’s holdings are focused on companies that have strong brands, a worldwide presence, and less reliance on the strength of the U.S. economy to drive their revenues and earnings. Heading into the second half of 2010, the portfolio has its heaviest exposure to information technology (IT) and industrials and business services.
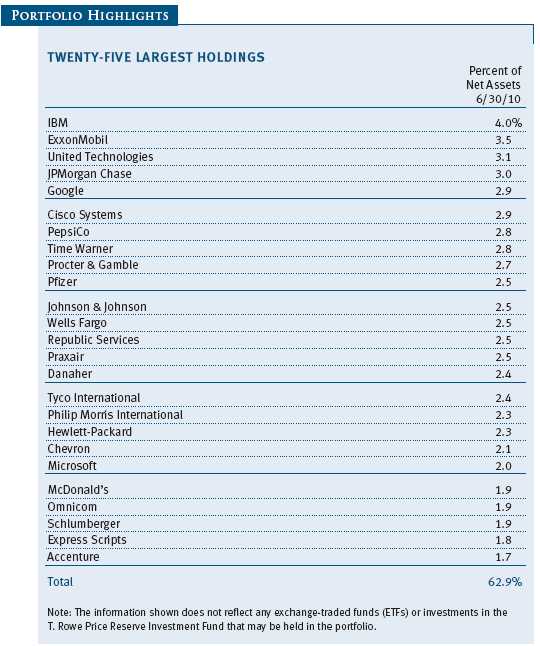
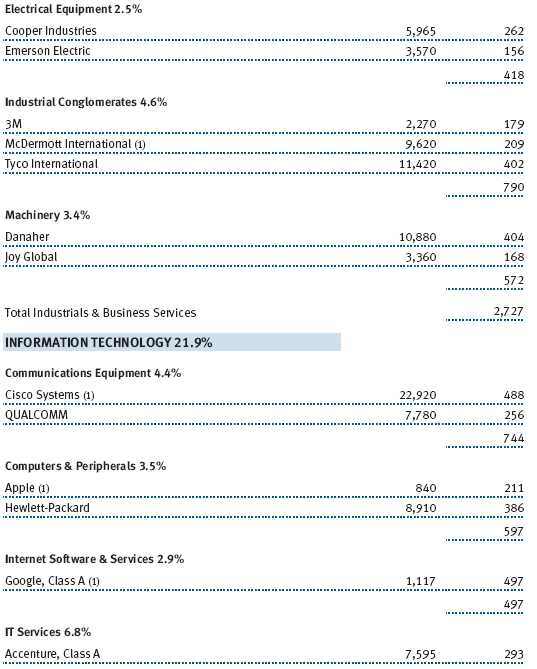
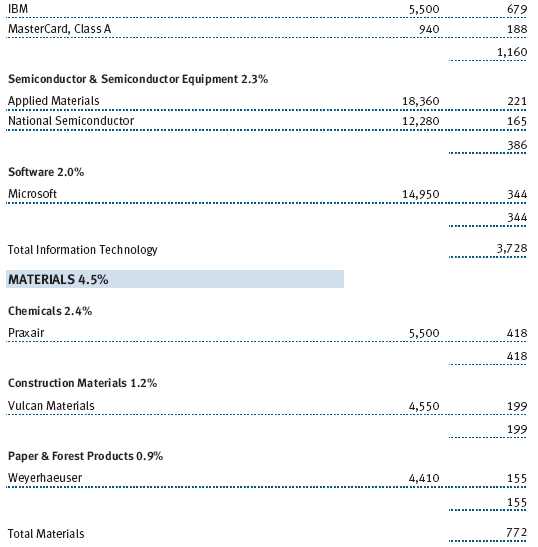
We believe IT has superior growth prospects compared with less dynamic sectors. Our confidence in IT stems from the rapid growth of mobile computing, which we believe is still in its early stages. The rising availability of wireless Internet and soaring smartphone use exemplify secular trends that point to mobile computing becoming increasingly widespread. We look for high-quality information technology names with solid balance sheets and compelling valuations, as is reflected in our large positions in IBM and Cisco Systems.
We are overweight in industrials and business services, the second-largest allocation in the fund. We have a favorable view of the sector, which is generally benefiting from a cyclical recovery as the economy strengthens. Many companies in this space undertook hefty cost cuts during the downturn and are reporting impressive gains in margins and earnings. We favor companies with diversified operations, a global presence, and strong long-term secular growth characteristics that will thrive even after the cyclical upturn fades.
We continue to hold Danaher, an industrial tools and technology company that sells products worldwide. The company is well managed and has historically carried a premium multiple when compared with its industrial peers. Based on our estimate of the company’s cash flow potential over the course of the next cycle, Danaher still looks undervalued to us. The firm has demonstrated an ability to create shareholder value through acquisitions, and it enjoys a well-capitalized balance sheet with considerable reserves available for potential acquisitions.
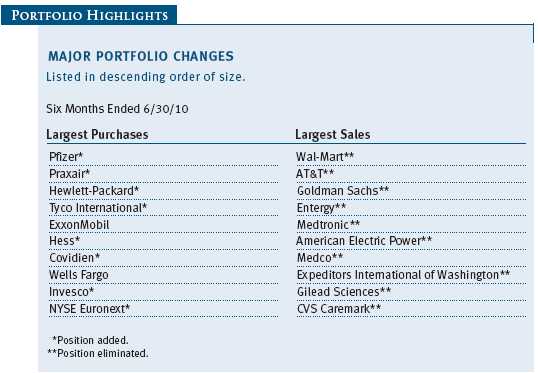
Stocks we added to the portfolio during the period include cruise line operator Carnival and Praxair, a worldwide provider of industrial gases, including atmospheric, process, and specialty gases. In both instances, we believe these companies offer the potential for above-average growth during a gradual economic recovery. We eliminated Wal-Mart because of weak consumer demand, Goldman Sachs for reasons discussed earlier, Gilead Sciences and other companies where our investment thesis appears fully reflected in the share prices, such as Allergan and Medco.
We are underweight in financial and health care stocks. The recent passage of the health care overhaul bill has lifted some of the uncertainty over the sector, but we seek companies that can generate strong and consistent growth regardless of government reform efforts or the overall economy. We favor companies that offer unique therapeutic benefits, cater to an aging population, or sell products and services that can reduce health care costs. Within financials, we have concerns about the impact of financial regulatory reform on the earnings power of banks going forward. We are also concerned about a lack of loan demand until U.S. consumers pay down their debt loads.
OUTLOOK
Mixed economic data suggest that the recovery may prove to be less robust than expected. On the positive side, surveys of business plans have stayed largely positive despite the debt turmoil in Europe. Capital goods demand is rising, and productivity gains have lifted the competitiveness of U.S. exports. Other reports have been more disappointing. Confidence among U.S. consumers sank in June more than forecast, erasing the previous two months’ gains as people turned pessimistic about the economic outlook. Additionally, manufacturers’ hiring and capital spending plans declined in June. Whether the current expansion is stabilizing at a sustainable pace or retreating into a midcycle pullback remains to be seen.
Fallout from the 2008–2009 global financial crisis remains an important theme in our economic outlook. We continue to expect modest growth. If the economy loses momentum, we would envision a period of stagnation in output and jobs growth but not outright recession. We expect real gross domestic product growth to be around 2.5% for the rest of the year, as a higher savings rate restrains consumption and the impact from the fiscal stimulus fades. Despite credit market turmoil in Europe, we think that the transition from a stimulus-driven recovery to an expansion spurred by improving private demand will continue. We view Europe’s fiscal problems as aftershocks of the global financial crisis and believe a gradual recovery will continue following the deepest recession since World War II.
We think that talk about a double-dip recession is overblown. While we agree that financial turmoil in Europe and the absence of consistent job growth are troubling, we would argue that recent economic data have not been uniformly negative, corporate earnings have been strong, and the current interest rate environment is favorable. Investor sentiment has been acutely negative, and the risk/reward profile for stocks in general is favorable in our view. We have taken advantage of the prevailing uncertainty to buy high-quality companies with solid fundamentals at attractive valuations, and we believe our holdings have the potential to perform well in any market environment.
We will continue to search for high-quality companies with strong balance sheets, seasoned management teams, and superior growth and value characteristics that we believe will successfully weather even a sluggish recovery. We are confident that our philosophy—which is focused on bottom-up stock selection, rigorous fundamental research, and adherence to our investment process despite short-term market swings—can continue to benefit our investors over the long term.
Once again, we welcome shareholders to the fund and look forward to helping you achieve your long-term investment objectives.
Respectfully submitted,

Jeffrey Rottinghaus
Chairman of the fund’s Investment Advisory Committee
July 19, 2010
The committee chairman has day-to-day responsibility for managing the
portfolio and works with committee members in developing and executing
the fund’s investment program.
RISKS OF STOCK INVESTING
The fund’s share price can fall because of weakness in the stock markets, a particular industry, or specific holdings. Stock markets can decline for many reasons, including adverse political or economic developments, changes in investor psychology, or heavy institutional selling. The prospects for an industry or company may deteriorate because of a variety of factors, including disappointing earnings or changes in the competitive environment. In addition, the investment manager’s assessment of companies held in a fund may prove incorrect, resulting in losses or poor performance even in rising markets.
GLOSSARY
Free cash flow: The excess cash a company is generating from its operations that can be taken out of the business for the benefit of shareholders, such as dividends, share repurchases, investments, and acquisitions.
Lipper indexes: Fund benchmarks that consist of a small number (10 to 30) of the largest mutual funds in a particular category as tracked by Lipper Inc.
S&P 500 Index: Tracks the stocks of 500 mostly large U.S. companies.
Performance and Expenses
This table shows the value of a hypothetical $10,000 investment in the fund over the past 10 fiscal year periods or since inception (for funds lacking 10-year records). The result is compared with benchmarks, which may include a broad-based market index and a peer group average or index. Market indexes do not include expenses, which are deducted from fund returns as well as mutual fund averages and indexes.

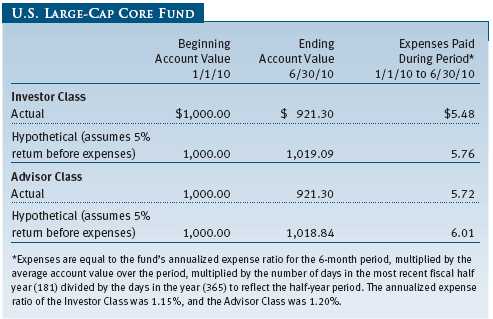
As a mutual fund shareholder, you may incur two types of costs: (1) transaction costs, such as redemption fees or sales loads, and (2) ongoing costs, including management fees, distribution and service (12b-1) fees, and other fund expenses. The following example is intended to help you understand your ongoing costs (in dollars) of investing in the fund and to compare these costs with the ongoing costs of investing in other mutual funds. The example is based on an investment of $1,000 invested at the beginning of the most recent six-month period and held for the entire period.
Please note that the fund has two share classes: The original share class (“investor class”) charges no distribution and service (12b-1) fee, and the Advisor Class shares are offered only through unaffiliated brokers and other financial intermediaries and charge a 0.25% 12b-1 fee. Each share class is presented separately in the table.
Actual Expenses
The first line of the following table (“Actual”) provides information about actual account values and expenses based on the fund’s actual returns. You may use the information in this line, together with your account balance, to estimate the expenses that you paid over the period. Simply divide your account value by $1,000 (for example, an $8,600 account value divided by $1,000 = 8.6), then multiply the result by the number in the first line under the heading “Expenses Paid During Period” to estimate the expenses you paid on your account during this period.
Hypothetical Example for Comparison Purposes
The information on the second line of the table (“Hypothetical”) is based on hypothetical account values and expenses derived from the fund’s actual expense ratio and an assumed 5% per year rate of return before expenses (not the fund’s actual return). You may compare the ongoing costs of investing in the fund with other funds by contrasting this 5% hypothetical example and the 5% hypothetical examples that appear in the shareholder reports of the other funds. The hypothetical account values and expenses may not be used to estimate the actual ending account balance or expenses you paid for the period.
Note: T. Rowe Price charges an annual small-account maintenance fee of $10, generally for accounts with less than $2,000 ($500 for UGMA/UTMA). The fee is waived for any investor whose T. Rowe Price mutual fund accounts total $25,000 or more, accounts employing automatic investing, and IRAs and other retirement plan accounts that utilize a prototype plan sponsored by T. Rowe Price (although a separate custodial or administrative fee may apply to such accounts). This fee is not included in the accompanying table. If you are subject to the fee, keep it in mind when you are estimating the ongoing expenses of investing in the fund and when comparing the expenses of this fund with other funds.
You should also be aware that the expenses shown in the table highlight only your ongoing costs and do not reflect any transaction costs, such as redemption fees or sales loads. Therefore, the second line of the table is useful in comparing ongoing costs only and will not help you determine the relative total costs of owning different funds. To the extent a fund charges transaction costs, however, the total cost of owning that fund is higher.
Unaudited
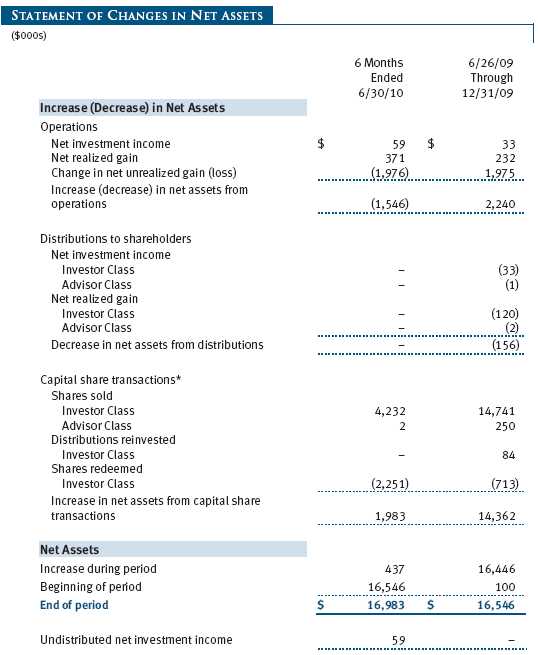
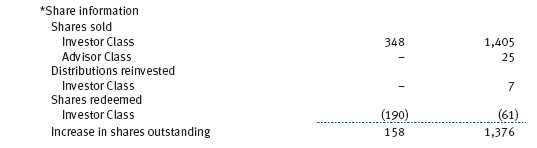
The accompanying notes are an integral part of these financial statements.
Unaudited

The accompanying notes are an integral part of these financial statements.
Unaudited

The accompanying notes are an integral part of these financial statements.
Unaudited
The accompanying notes are an integral part of these financial statements.
Unaudited
The accompanying notes are an integral part of these financial statements.
Unaudited
The accompanying notes are an integral part of these financial statements.
Unaudited
| NOTES TO FINANCIAL STATEMENTS |
T. Rowe Price U.S. Large-Cap Core Fund, Inc. (the fund), is registered under the Investment Company Act of 1940 (the 1940 Act) as a diversified, open-end management investment company. The fund seeks to provide long-term capital growth. The fund has two classes of shares: the U.S. Large-Cap Core Fund original share class, referred to in this report as the Investor Class, offered since June 26, 2009, and the U.S. Large-Cap Core Fund – Advisor Class (Advisor Class), offered since June 26, 2009. Advisor Class shares are sold only through unaffiliated brokers and other unaffiliated financial intermediaries that are compensated by the class for distribution, shareholder servicing, and/or certain administrative services under a Board-approved Rule 12b-1 plan. Each class has exclusive voting rights on matters related solely to that class; separate voting rights on matters that relate to both classes; and, in all other respects, the same rights and obligations as the other class.
NOTE 1 - SIGNIFICANT ACCOUNTING POLICIES
Basis of Preparation The accompanying financial statements were prepared in accordance with accounting principles generally accepted in the United States of America (GAAP), which require the use of estimates made by fund management. Fund management believes that estimates and valuations are appropriate; however, actual results may differ from those estimates, and the valuations reflected in the accompanying financial statements may differ from the value ultimately realized upon sale of securities.
Investment Transactions, Investment Income, and Distributions Income and expenses are recorded on the accrual basis. Dividends received from mutual fund investments are reflected as dividend income; capital gain distributions are reflected as realized gain/loss. Dividend income and capital gain distributions are recorded on the ex-dividend date. Income tax-related interest and penalties, if incurred, would be recorded as income tax expense. Investment transactions are accounted for on the trade date. Realized gains and losses are reported on the identified cost basis. Distributions to shareholders are recorded on the ex-dividend date. Income distributions are declared and paid by each class annually. Capital gain distributions, if any, are generally declared and paid by the fund annually.
Class Accounting The Advisor Class pays distribution, shareholder servicing, and/or certain administrative expenses in the form of Rule 12b-1 fees, in an amount not exceeding 0.25% of the class’s average daily net assets; no such fees were incurred during the period ended June 30, 2010. Shareholder servicing, prospectus, and shareholder report expenses incurred by each class are charged directly to the class to which they relate. Expenses common to both classes, investment income, and realized and unrealized gains and losses are allocated to the classes based upon the relative daily net assets of each class.
Rebates and Credits Subject to best execution, the fund may direct certain security trades to brokers who have agreed to rebate a portion of the related brokerage commission to the fund in cash. Commission rebates are reflected as realized gain on securities in the accompanying financial statements. Additionally, the fund earns credits on temporarily uninvested cash balances held at the custodian, which reduce the fund’s custody charges. Custody expense in the accompanying financial statements is presented before reduction for credits.
New Accounting Pronouncement On January 1, 2010, the fund adopted new accounting guidance that requires enhanced disclosures about fair value measurements in the financial statements. Adoption of this guidance had no impact on the fund’s net assets or results of operations.
NOTE 2 - VALUATION
The fund’s investments are reported at fair value as defined by GAAP. The fund determines the values of its assets and liabilities and computes its net asset value per share at the close of the New York Stock Exchange (NYSE), normally 4 p.m. ET, each day that the NYSE is open for business.
Valuation Methods Equity securities listed or regularly traded on a securities exchange or in the over-the-counter (OTC) market are valued at the last quoted sale price or, for certain markets, the official closing price at the time the valuations are made, except for OTC Bulletin Board securities, which are valued at the mean of the latest bid and asked prices. A security that is listed or traded on more than one exchange is valued at the quotation on the exchange determined to be the primary market for such security. Listed securities not traded on a particular day are valued at the mean of the latest bid and asked prices for domestic securities and the last quoted sale price for international securities.
Investments in mutual funds are valued at the mutual fund’s closing net asset value per share on the day of valuation.
Other investments, including restricted securities, and those financial instruments for which the above valuation procedures are inappropriate or are deemed not to reflect fair value are stated at fair value as determined in good faith by the T. Rowe Price Valuation Committee, established by the fund’s Board of Directors.
Valuation Inputs Various inputs are used to determine the value of the fund’s financial instruments. These inputs are summarized in the three broad levels listed below:
Level 1 – quoted prices in active markets for identical financial instruments
Level 2 – observable inputs other than Level 1 quoted prices (including, but not limited to, quoted prices for similar financial instruments, interest rates, prepayment speeds, and credit risk)
Level 3 – unobservable inputs
Observable inputs are those based on market data obtained from sources independent of the fund, and unobservable inputs reflect the fund’s own assumptions based on the best information available. The input levels are not necessarily an indication of the risk or liquidity associated with financial instruments at that level. On June 30, 2010, all of the fund’s investments were classified as Level 1, based on the inputs used to determine their values.
NOTE 3 - OTHER INVESTMENT TRANSACTIONS
Purchases and sales of portfolio securities other than short-term securities aggregated $7,587,000 and $5,421,000, respectively, for the six months ended June 30, 2010.
NOTE 4 - FEDERAL INCOME TAXES
No provision for federal income taxes is required since the fund intends to continue to qualify as a regulated investment company under Subchapter M of the Internal Revenue Code and distribute to shareholders all of its taxable income and gains. Distributions determined in accordance with federal income tax regulations may differ in amount or character from net investment income and realized gains for financial reporting purposes. Financial reporting records are adjusted for permanent book/tax differences to reflect tax character but are not adjusted for temporary differences. The amount and character of tax-basis distributions and composition of net assets are finalized at fiscal year-end; accordingly, tax-basis balances have not been determined as of the date of this report.
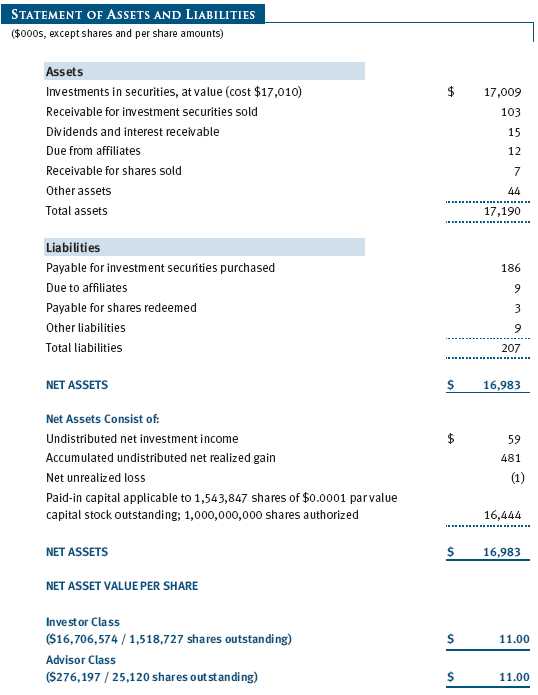
At June 30, 2010, the cost of investments for federal income tax purposes was $17,010,000. Net unrealized loss aggregated $1,000 at period-end, of which $884,000 related to appreciated investments and $885,000 related to depreciated investments.
NOTE 5 - RELATED PARTY TRANSACTIONS
The fund is managed by T. Rowe Price Associates, Inc. (the manager or Price Associates), a wholly owned subsidiary of T. Rowe Price Group, Inc. The investment management agreement between the fund and the manager provides for an annual investment management fee, which is computed daily and paid monthly. The fee consists of an individual fund fee, equal to 0.25% of the fund’s average daily net assets, and a group fee. The group fee rate is calculated based on the combined net assets of certain mutual funds sponsored by Price Associates (the group) applied to a graduated fee schedule, with rates ranging from 0.48% for the first $1 billion of assets to 0.285% for assets in excess of $220 billion. The fund’s group fee is determined by applying the group fee rate to the fund’s average daily net assets. At June 30, 2010, the effective annual group fee rate was 0.30%.
The Investor Class and Advisor Class are also subject to a contractual expense limitation through the limitation dates indicated in the table below. During the limitation period, the manager is required to waive its management fee and/ or reimburse expenses, excluding interest, taxes, brokerage commissions, and extraordinary expenses that would otherwise cause the class’s ratio of annualized total expenses to average net assets (expense ratio) to exceed its expense limitation. For a period of three years after the date of any reimbursement or waiver, each class is required to repay the manager for expenses previously reimbursed and management fees waived to the extent the class’s net assets have grown or expenses have declined sufficiently to allow repayment without causing the class’s expense ratio to exceed its expense limitation.

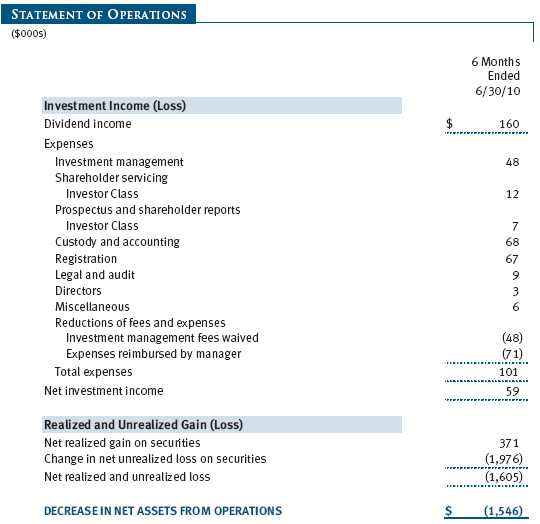
Pursuant to this agreement, management fees in the amount of $48,000 were waived and expenses in the amount of $71,000 were reimbursed by the manager during the six months ended June 30, 2010. Including these amounts, management fees waived and expenses previously reimbursed by the manager in the amount of $242,000 remain subject to repayment at June 30, 2010.
In addition, the fund has entered into service agreements with Price Associates and a wholly owned subsidiary of Price Associates (collectively, Price). Price Associates computes the daily share prices and provides certain other administrative services to the fund. T. Rowe Price Services, Inc., provides shareholder and administrative services in its capacity as the fund’s transfer and dividend disbursing agent. For the six months ended June 30, 2010, expenses incurred pursuant to these service agreements were $50,000 for Price Associates and $9,000 for T. Rowe Price Services, Inc. The total amount payable at period-end pursuant to these service agreements is reflected as Due to Affiliates in the accompanying financial statements.
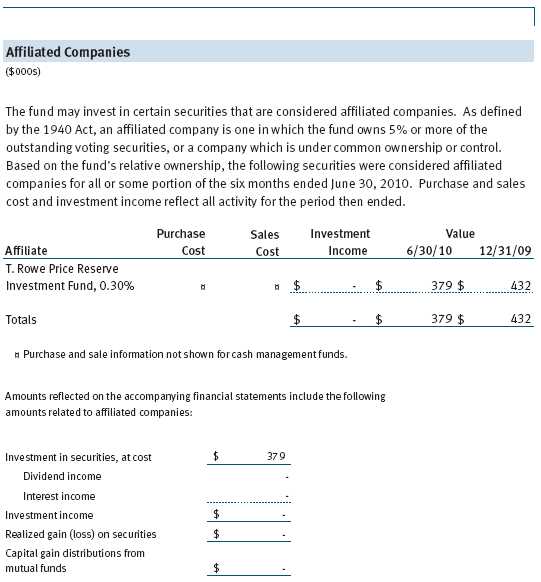
The fund may invest in the T. Rowe Price Reserve Investment Fund and the T. Rowe Price Government Reserve Investment Fund (collectively, the T. Rowe Price Reserve Investment Funds), open-end management investment companies managed by Price Associates and considered affiliates of the fund. The T. Rowe Price Reserve Investment Funds are offered as cash management options to mutual funds, trusts, and other accounts managed by Price Associates and/or its affiliates and are not available for direct purchase by members of the public. The T. Rowe Price Reserve Investment Funds pay no investment management fees.
As of June 30, 2010, T. Rowe Price Group, Inc., and/or its wholly owned subsidiaries owned 575,000 shares of the Investor Class, and 25,000 shares of the Advisor Class, aggregating 39% of the fund’s net assets.
| INFORMATION ON PROXY VOTING POLICIES, PROCEDURES, AND RECORDS |
A description of the policies and procedures used by T. Rowe Price funds and portfolios to determine how to vote proxies relating to portfolio securities is available in each fund’s Statement of Additional Information, which you may request by calling 1-800-225-5132 or by accessing the SEC’s Web site, www.sec.gov. The description of our proxy voting policies and procedures is also available on our Web site, www.troweprice.com. To access it, click on the words “Our Company” at the top of our corporate homepage. Then, when the next page appears, click on the words “Proxy Voting Policies” on the left side of the page.
Each fund’s most recent annual proxy voting record is available on our Web site and through the SEC’s Web site. To access it through our Web site, follow the directions above, then click on the words “Proxy Voting Records” on the right side of the Proxy Voting Policies page.
| HOW TO OBTAIN QUARTERLY PORTFOLIO HOLDINGS |
The fund files a complete schedule of portfolio holdings with the Securities and Exchange Commission for the first and third quarters of each fiscal year on Form N-Q. The fund’s Form N-Q is available electronically on the SEC’s Web site (www.sec.gov); hard copies may be reviewed and copied at the SEC’s Public Reference Room, 450 Fifth St. N.W., Washington, DC 20549. For more information on the Public Reference Room, call 1-800-SEC-0330.
| APPROVAL OF INVESTMENT MANAGEMENT AGREEMENT |
On March 9, 2010, the fund’s Board of Directors (Board) unanimously approved the continuation of the investment advisory contract (Contract) between the fund and its investment manager, T. Rowe Price Associates, Inc. (Adviser). The Board considered a variety of factors in connection with its review of the Contract, also taking into account information provided by the Adviser during the course of the year, as discussed below:
Services Provided by the Adviser
The Board considered the nature, quality, and extent of the services provided to the fund by the Adviser. These services included, but were not limited to, management of the fund’s portfolio and a variety of related activities, as well as financial and administrative services, reporting, and communications. The Board also reviewed the background and experience of the Adviser’s senior management team and investment personnel involved in the management of the fund. The Board concluded that it was satisfied with the nature, quality, and extent of the services provided by the Adviser.
Investment Performance of the Fund
The Board reviewed the fund’s returns over the three-month and since-inception periods and compared these returns with a wide variety of previously agreed upon comparable performance measures and market data, including those supplied by Lipper and Morningstar, which are independent providers of mutual fund data. On the basis of this evaluation and the fund’s limited operating history, and factoring in the severity of the market turmoil during 2009, the Board concluded that the fund’s performance was satisfactory.
Costs, Benefits, Profits, and Economies of Scale
The Board reviewed detailed information regarding the revenues received by the Adviser under the Contract and other benefits that the Adviser (and its affiliates) may have realized from its relationship with the fund, including research received under “soft dollar” agreements and commission-sharing arrangements with broker-dealers. The Board considered that the Adviser may receive some benefit from its soft-dollar arrangements pursuant to which it receives research from broker-dealers that execute the applicable fund’s portfolio transactions. The Board also received information on the estimated costs incurred and profits realized by the Adviser and its affiliates from advising T. Rowe Price mutual funds. The Board did not review information regarding profits realized from managing the fund in particular because the fund had not achieved sufficient scale in terms of portfolio asset size to produce meaningful profit margin percentages. The Board concluded that the Adviser’s profits from advising T. Rowe Price mutual funds were reasonable in light of the services provided to the fund. The Board also considered whether the fund or other funds benefit under the fee levels set forth in the Contract from any economies of scale realized by the Adviser. Under the Contract, the fund pays a fee to the Adviser composed of two components—a group fee rate based on the aggregate assets of certain T. Rowe Price mutual funds (including the fund) that declines at certain asset levels and an individual fund fee rate that is assessed on the assets of the fund. The Board concluded that the advisory fee structure for the fund continued to provide for a reasonable sharing of benefits from any economies of scale with the fund’s investors.
Fees
The Board reviewed the fund’s management fee rate, operating expenses, and total expense ratio (for the Investor Class and Advisor Class) and compared them with fees and expenses of other comparable funds based on information and data supplied by Lipper. The information provided to the Board indicated that the fund’s management fee rate (including any reductions of the management fee rate as a result of any applicable fee waivers or expenses paid by the Adviser) was below the median for comparable funds. The information also indicated that the fund’s total expense ratio for the Investor Class was above the median for certain groups of comparable funds but below the median for other groups of comparable funds, and the total expense ratio for the Advisor Class was at or below the median for comparable funds. The Board also reviewed the fee schedules for institutional accounts of the Adviser and its affiliates with smaller mandates. Management informed the Board that the Adviser’s responsibilities for institutional accounts are more limited than its responsibilities for the fund and other T. Rowe Price mutual funds that it or its affiliates advise and that the Adviser performs significant additional services and assumes greater risk for the fund and other T. Rowe Price mutual funds that it advises than it does for institutional accounts. On the basis of the information provided, the Board concluded that the fees paid by the fund under the Contract were reasonable.
Item 2. Code of Ethics.
A code of ethics, as defined in Item 2 of Form N-CSR, applicable to its principal executive officer, principal financial officer, principal accounting officer or controller, or persons performing similar functions is filed as an exhibit to the registrant’s annual Form N-CSR. No substantive amendments were approved or waivers were granted to this code of ethics during the registrant’s most recent fiscal half-year.
Item 3. Audit Committee Financial Expert.
Disclosure required in registrant’s annual Form N-CSR.
Item 4. Principal Accountant Fees and Services.
Disclosure required in registrant’s annual Form N-CSR.
Item 5. Audit Committee of Listed Registrants.
Not applicable.
Item 6. Investments.
(a) Not applicable. The complete schedule of investments is included in Item 1 of this Form N-CSR.
(b) Not applicable.
Item 7. Disclosure of Proxy Voting Policies and Procedures for Closed-End Management Investment Companies.
Not applicable.
Item 8. Portfolio Managers of Closed-End Management Investment Companies.
Not applicable.
Item 9. Purchases of Equity Securities by Closed-End Management Investment Company and Affiliated Purchasers.
Not applicable.
Item 10. Submission of Matters to a Vote of Security Holders.
Not applicable.
Item 11. Controls and Procedures.
(a) The registrant’s principal executive officer and principal financial officer have evaluated the registrant’s disclosure controls and procedures within 90 days of this filing and have concluded that the registrant’s disclosure controls and procedures were effective, as of that date, in ensuring that information required to be disclosed by the registrant in this Form N-CSR was recorded, processed, summarized, and reported timely.
(b) The registrant’s principal executive officer and principal financial officer are aware of no change in the registrant’s internal control over financial reporting that occurred during the registrant’s second fiscal quarter covered by this report that has materially affected, or is reasonably likely to materially affect, the registrant’s internal control over financial reporting.
Item 12. Exhibits.
(a)(1) The registrant’s code of ethics pursuant to Item 2 of Form N-CSR is filed with the registrant’s annual Form N-CSR.
(2) Separate certifications by the registrant's principal executive officer and principal financial officer, pursuant to Section 302 of the Sarbanes-Oxley Act of 2002 and required by Rule 30a-2(a) under the Investment Company Act of 1940, are attached.
(3) Written solicitation to repurchase securities issued by closed-end companies: not applicable.
(b) A certification by the registrant's principal executive officer and principal financial officer, pursuant to Section 906 of the Sarbanes-Oxley Act of 2002 and required by Rule 30a-2(b) under the Investment Company Act of 1940, is attached.
| | |
SIGNATURES |
| |
| | Pursuant to the requirements of the Securities Exchange Act of 1934 and the Investment |
| Company Act of 1940, the registrant has duly caused this report to be signed on its behalf by the |
| undersigned, thereunto duly authorized. |
| |
| T. Rowe Price U.S. Large-Cap Core Fund, Inc. |
| |
| |
| |
| By | /s/ Edward C. Bernard |
| | Edward C. Bernard |
| | Principal Executive Officer |
| |
| Date | August 17, 2010 |
| |
| |
| |
| | Pursuant to the requirements of the Securities Exchange Act of 1934 and the Investment |
| Company Act of 1940, this report has been signed below by the following persons on behalf of |
| the registrant and in the capacities and on the dates indicated. |
| |
| |
| By | /s/ Edward C. Bernard |
| | Edward C. Bernard |
| | Principal Executive Officer |
| |
| Date | August 17, 2010 |
| |
| |
| |
| By | /s/ Gregory K. Hinkle |
| | Gregory K. Hinkle |
| | Principal Financial Officer |
| |
| Date | August 17, 2010 |