UNITED STATES
SECURITIES AND EXCHANGE COMMISSION
Washington, D.C. 20549
FORM 20-F
¨REGISTRATION STATEMENT PURSUANT TO SECTION 12(b) OR (g) OF THE SECURITIES EXCHANGE ACT OF 1934
OR
x ANNUAL REPORT PURSUANT TO SECTION 13 OR 15(d) OF THE SECURITIES EXCHANGE ACT OF 1934
For the fiscal year ended August 31, 2013
OR
¨ TRANSITION REPORT PURSUANT TO SECTION 13 OR 15(d) OF THE SECURITIES EXCHANGE ACT OF 1934
OR
¨SHELL COMPANY REPORT PURSUANT TO SECTION 13 OR 15(d) OF THE SECURITIES EXCHANGE ACT OF 1934
Date of event requiring this shell company report ____________________________
For the transition period from_________________to______________
Commission File Number: 0-53646
EAGLEFORD ENERGY INC.
(Exact name of Registrant as specified in its charter)
Ontario, Canada
(Jurisdiction of incorporation or organization)
1 King Street West, Suite 1505
Toronto, Ontario, Canada, M5H 1A1
(Address of principal executive offices)
James Cassina, Telephone (416) 364-4039, Fax (416) 364-8244
1 King Street West, Suite 1505, Toronto, Ontario, Canada, M5H 1A1
(Name, telephone, e-mail and/or facsimile number and address of company contact person)
Securities registered or to be registered pursuant to section 12(b) of the Act: None
Securities registered or to be registered pursuant to Section 12(g) of the Act: Common Stock, no par value
(Title of Class)
Securities for which there is a reporting obligation pursuant to Section 15(d) of the Act: None
(Title of Class)
The number of outstanding shares of the issuer’s common stock as of August 31, 2013 was 122,620,026 shares.
Indicate by check mark if the registrant is a well-known seasoned issuer, as defined in Rule 405 of the Securities Act. Yes¨ Nox
If this report is an annual or a transition report, indicate by check mark if the registrant is not required to file reports pursuant to Section 13 or 15(d) of the Securities Exchange Act of 1934. Yes¨ Nox
Indicate by check mark whether the registrant (1) has filed all reports required to be filed by Section 13 or 15(d) of the Securities Exchange Act of 1934 during the preceding 12 months (or for such shorter period that the registrant was required to file such reports), and (2) has been subject to such filing requirements for the past 90 days. Yesx No£
Indicate by check mark whether the registrant has submitted electronically and posted on its corporate Web site, if any, every Interactive Data File required to be submitted and posted pursuant to Rule 405 of Regulation S-T (§232.405 of this chapter) during the preceding 12 months (or for such shorter period that the registrant was required to submit and post such files). Yesx No¨
Indicate by check mark whether the registrant is a large accelerated filer, an accelerated filer, or a non-accelerated filer. See definition of “accelerated filer and large accelerated filer” in Rule 12b-2 of the Exchange Act. (Check one):
| Large accelerated filer¨ | Accelerated filer¨ | Non-accelerated filerx |
Indicate by check mark which basis of accounting the registrant has used to prepare the financial statements included in this filing:
| U.S. GAAP¨ | International Financial Reporting Standards by the International Accounting Standards Boardx | Other ¨ |
If “Other” has been checked in response to the previous question, indicate by check mark which financial statement item the registrant has elected to follow. ‘
Item 17¨ Item 18¨
If this is an annual report, indicate by check mark whether the registrant is a shell company (as defined in Rule 12b-2 of the Exchange Act). Yes¨ Nox
Table of Contents
| GENERAL | 1 |
| NOTE REGARDING FORWARD-LOOKING STATEMENTS | 1 |
| PART I | | 1 |
| ITEM 1 | IDENTITY OF DIRECTORS, SENIOR MANAGEMENT AND ADVISORS | 1 |
| A. | DIRECTORS AND SENIOR MANAGEMENT | 1 |
| B. | ADVISERS | 1 |
| C. | AUDITORS | 1 |
| ITEM 2 | OFFER STATISTICS AND EXPECTED TIMETABLE | 2 |
| A. | OFFER STATISTICS | 2 |
| B. | METHOD AND EXPECTED TIMETABLE | 2 |
| ITEM 3 | KEY INFORMATION | 2 |
| A. | SELECTED FINANCIAL DATA | 2 |
| B. | CAPITALIZATION AND INDEBTEDNESS | 4 |
| C. | REASONS FOR THE OFFER AND USE OF PROCEEDS | 4 |
| D. | RISK FACTORS | 4 |
| ITEM 4 | INFORMATION ON THE COMPANY | 11 |
| A. | HISTORY AND DEVELOPMENT OF THE COMPANY | 11 |
| B. | BUSINESS OVERVIEW | 16 |
| C. | ORGANIZATIONAL STRUCTURE | 17 |
| D. | PROPERTY, PLANTS AND EQUIPMENT | 17 |
| ITEM 4A | UNRESOLVED STAFF COMMENTS | 24 |
| ITEM 5 | OPERATING AND FINANCIAL REVIEW AND PROSPECTS | 24 |
| A. | OPERATING RESULTS | 44 |
| B. | LIQUIDITY AND CAPITAL RESOURCES | 49 |
| C. | RESEARCH AND DEVELOPMENT, PATENTS AND LICENSES, ETC. | 50 |
| D. | TREND INFORMATION | 50 |
| E. | OFF-BALANCE SHEET ARRANGEMENTS | 51 |
| F. | TABULAR DISCLOSURE OF CONTRACTUAL OBLIGATIONS | 51 |
| G. | SAFE HARBOR | 54 |
| ITEM 6. | DIRECTORS, SENIOR MANAGEMENT AND EMPLOYEES | 55 |
| A. | DIRECTORS AND SENIOR MANAGEMENT | 55 |
| B. | COMPENSATION | 56 |
| C. | BOARD PRACTICES | 59 |
| D. | EMPLOYEES | 65 |
| E. | SHARE OWNERSHIP | 65 |
| ITEM 7 | MAJOR SHAREHOLDERS AND RELATED PARTY TRANSACTIONS | 66 |
| A. | MAJOR SHAREHOLDERS | 66 |
| B. | RELATED PARTY TRANSACTIONS | 67 |
| C. | INTERESTS OF EXPERTS AND COUNSEL | 69 |
| ITEM 8 | FINANCIAL INFORMATION | 69 |
| A. | CONSOLIDATED STATEMENTS AND OTHER FINANCIAL INFORMATION | 69 |
| B. | SIGNIFICANT CHANGES | 70 |
| ITEM 9 | THE OFFER AND LISTING | 70 |
| A. | OFFER AND LISTING DETAILS | 70 |
| B. | PLAN OF DISTRIBUTION | 71 |
| C. | MARKETS | 71 |
| D. | SELLING SHAREHOLDERS | 71 |
| E. | DILUTION | 71 |
| F. | EXPENSES OF THE ISSUE | 71 |
| ITEM 10 | ADDITIONAL INFORMATION | 71 |
| A. | SHARE CAPITAL | 71 |
| B. | MEMORANDUM AND ARTICLES OF ASSOCIATION | 71 |
| C. | MATERIAL CONTRACTS | 74 |
| D. | EXCHANGE CONTROLS | 77 |
| E. | TAXATION | 77 |
| F. | DIVIDENDS AND PAYING AGENTS | 81 |
| G. | STATEMENT BY EXPERTS | 81 |
| H. | DOCUMENTS ON DISPLAY | 81 |
| I. | SUBSIDIARY INFORMATION | 81 |
| ITEM 11 | QUANTITATIVE AND QUALITATIVE DISCLOSURES ABOUT MARKET RISK | 81 |
| ITEM 12 | DESCRIPTION OF SECURITIES OTHER THAN EQUITY SECURITIES | 85 |
| A. | DEBT SECURITIES | 85 |
| B. | WARRANTS AND RIGHTS | 85 |
| C. | OTHER SECURITIES | 85 |
| D. | AMERICAN DEPOSITORY SHARES | 85 |
| PART II | | 85 |
| ITEM 13 | DEFAULTS, DIVIDENDS ARREARAGES AND DELINQUENCIES | 85 |
| ITEM 14 | MATERIAL MODIFICATIONS TO THE RIGHTS OF SECURITY HOLDERS AND USE OF PROCEEDS | 85 |
| ITEM 15 | CONTROLS AND PROCEDURES | 85 |
| ITEM 16 | [RESERVED] | 86 |
| ITEM 16A | AUDIT COMMITTEE FINANCIAL EXPERT | 86 |
| ITEM 16B | CODE OF ETHICS | 87 |
| ITEM 16C | PRINCIPAL ACCOUNTANT FEES AND SERVICES | 87 |
| ITEM 16D | EXEMPTIONS FROM THE LISTING STANDARDS FOR AUDIT COMMITTEES | 88 |
| ITEM 16E | PURCHASES OF EQUITY SECURITIES BY THE ISSUER AND AFFILIATED PURCHASERS | 88 |
| ITEM 16F | CHANGE IN REGISTRANT’S CERTIFYING ACCOUNTANT | 88 |
| ITEM 16G | CORPORATE GOVERNANCE | 88 |
| ITEM 16H | MINE SAFETY DISCLOSURE | 88 |
| PART III | | 89 |
| ITEM 17 | FINANCIAL STATEMENTS | 89 |
| ITEM 18 | FINANCIAL STATEMENTS | 89 |
| ITEM 19 | EXHIBITS | 89 |
GENERAL
In this Annual Report, references to “we”, “us”, “our”, the “Company”, and “Eagleford” mean Eagleford Energy Inc., and its subsidiaries, unless the context requires otherwise.
We use the Canadian dollar as our reporting and presentation currency and our consolidated financial statements are prepared in accordance with International Financial Reporting Standards (“IFRS”), as issued by the International Accounting Standards Board (“IASB”). All monetary references in this document are to Canadian dollars, unless otherwise indicated. All references in this document to “dollars” or “$” or “CDN$” mean Canadian dollars, unless otherwise indicated, and references to “US$” mean United States dollars.
Except as noted, the information set forth in this Annual Report is as of November 29, 2013 and all information included in this document should only be considered accurate as of such date. Our business, financial condition or results of operations may have changed since that date.
NOTE REGARDING FORWARD-LOOKING STATEMENTS
Much of the information included in this Annual Report is based upon estimates, projections or other “forward-looking statements”. Such forward-looking statements include any projections or estimates made by us and our management in connection with our business operations. These statements relate to future events or our future financial performance. In some cases you can identify forward-looking statements by terminology such as “may”, “should”, “expects”, “plans”, “anticipates”, “believes”, “estimates”, “predicts”, “potential” or “continue” or the negative of those terms or other comparable terminology. While these forward-looking statements, and any assumptions upon which they are based, are made in good faith and reflect our current judgment regarding the direction of our business, actual results will almost always vary, sometimes materially, from any estimates, predictions, projections, assumptions or other future performance suggested herein. Such estimates, projections or other forward-looking statements involve various risks and uncertainties and other factors, including the risks in the section titled “Risk Factors” below, which may cause our actual results, levels of activities, performance or achievements to be materially different from any future results, levels of activity, performance or achievements expressed or implied by these forward-looking statements. We caution the reader that important factors in some cases have affected and, in the future, could materially affect actual results and cause actual results to differ materially from the results expressed in any such estimates, projections or other forward-looking statements. Although we believe that the expectations reflected in the forward-looking statements are reasonable, we cannot guarantee future results, levels of activity, performance or achievements. Except as required by applicable law, including the securities laws of the United States, we do not intend to update any of the forward-looking statements to conform those statements to actual results.
The statements contained in Item 4 – “Information on the Company”, Item 5 – “Operating and Financial Review and Prospects” and Item 11 – “Quantitative and Qualitative Disclosures About Market Risk” are inherently subject to a variety of risks and uncertainties that could cause actual results, performance or achievements to differ significantly.
PART I
| ITEM 1 | IDENTITY OF DIRECTORS, SENIOR MANAGEMENT AND ADVISORS |
| A. | DIRECTORS AND SENIOR MANAGEMENT |
Not applicable. This Form 20-F is being filed as an Annual Report under the Exchange Act.
Not applicable. This Form 20-F is being filed as an Annual Report under the Exchange Act.
Not applicable. This Form 20-F is being filed as an Annual Report under the Exchange Act.
| ITEM 2 | OFFER STATISTICS AND EXPECTED TIMETABLE |
Not applicable. This Form 20-F is being filed as an Annual Report under the Exchange Act.
| B. | METHOD AND EXPECTED TIMETABLE |
Not applicable. This Form 20-F is being filed as an Annual Report under the Exchange Act.
| A. | SELECTED FINANCIAL DATA |
The following table presents selected financial data derived from our Audited Consolidated Financial Statements for the fiscal years ended August 31, 2013 and 2012. You should read this information in conjunction with our Audited Consolidated Financial Statements and related notes (See Item 18: “Financial Statements”), as well as (Item 4: “Information on the Company” and Item 5: “Operating and Financial Review and Prospects”) of this Annual Report.
Our consolidated financial statements have been prepared in accordance International Financial Reporting Standards (“IFRS”), as issued by the International Accounting Standards Board (“IASB”). The selected consolidated statement of operations data set forth below for the years ended August 31, 2013, 2012 and 2011 and the selected consolidated statement of financial position information set forth below as of August 31, 2013, 2012 and 2011 is derived from our consolidated financial statements, which have been audited by Schwartz Levitsky Feldman LLP, Chartered Accountants, Toronto, Canada all of which are attached to and forming part of this Annual Report under Item 18 – Financial Statements.
EAGLEFORD ENERGY INC.
Prepared in accordance with International Financial Reporting Standards (“IFRS”), as issued by the
International Accounting Standards Board (“IASB”)
(STATED IN CANADIAN DOLLARS)
Except share and per share data
CONSOLIDATED STATEMENT OF FINANCIAL POSITION INFORMATION
| | | YEARS ENDED AUGUST 31, | |
| | | 2013 | | | 2012 | | | 2011 | |
| Cash | | $ | 196,837 | | | $ | 330,003 | | | $ | 165,266 | |
| Total assets | | $ | 6,918,197 | | | $ | 8,998,016 | | | $ | 9,575,976 | |
| Total liabilities | | $ | 6,776,052 | | | $ | 6,047,663 | | | $ | 6,848,676 | |
| Total shareholders’ equity | | $ | 142,144 | | | $ | 2,950,353 | | | $ | 2,727,300 | |
CONSOLIDATED STATEMENT OF OPERATIONS INFORMATION
| | | YEARS ENDED AUGUST 31, | |
| | | 2013 | | | 2012 | | | 2011 | |
| Revenue | | | | | | | | | | | | |
| Natural gas sales, net of royalties | | $ | 30,062 | | | $ | 39,218 | | | $ | 56,916 | |
| Expenses | | | | | | | | | | | | |
| Operating costs | | | 9,234 | | | | 28,471 | | | | 52,190 | |
| Depletion and accretion | | | 13,283 | | | | 20,509 | | | | 23,912 | |
| General and administrative | | | 583,577 | | | | 705,591 | | | | 502,474 | |
| Marketing and public relations | | | 25,763 | | | | 46,272 | | | | 88,569 | |
| Impairment loss on property and equipment | | | 168,954 | | | | 50,774 | | | | 48,249 | |
| Impairment loss on exploration and evaluation | | | 2,690,568 | | | | - | | | | - | |
| Interest expense | | | 76,763 | | | | 88,789 | | | | 68,199 | |
| Loss (gain) loss on derivative warrant liabilities | | | 128,041 | | | | 46,655 | | | | (126,410 | ) |
| Loss on settlement of debt | | | 402,264 | | | | 1,465,465 | | | | - | |
| Loss (gain) on foreign exchange | | | 197,640 | | | | 36,283 | | | | (161,340 | ) |
| Impairment loss on marketable securities | | | 1 | | | | - | | | | - | |
| Stock based compensation | | | - | | | | 95,910 | | | | - | |
| Stock based compensation-non employees | | | - | | | | 75,062 | | | | - | |
| Compensation expense on re-pricing of units | | | - | | | | 188,625 | | | | - | |
| Gain on disposal of marketable securities | | | - | | | | - | | | | (8,000 | ) |
| | | | 4,296,108 | | | | 2,848,406 | | | | 487,843 | |
| | | | | | | | | | | | | |
| Net loss | | $ | (4,266,046 | ) | | $ | (2,809,188 | ) | | $ | (430,927 | ) |
| | | | | | | | | | | | | |
| Foreign currency translation | | | 314,120 | | | | (160 | ) | | | (109,303 | ) |
| | | | | | | | | | | | | |
| Comprehensive loss | | $ | (3,951,926 | ) | | $ | (2,809,348 | ) | | $ | (540,230 | ) |
| | | | | | | | | | | | | |
| Loss per share, basic and diluted | | $ | (0.041 | ) | | $ | (0.034 | ) | | $ | (0.007 | ) |
| | | | | | | | | | | | | |
| Weighted average shares outstanding, basic and diluted * | | | 104,774,283 | | | | 81,769,733 | | | | 63,854,456 | |
*Reflects March 16, 2012 two-for-one stock split
Exchange Rate Information
The exchange rate between the Canadian dollar and the U.S. dollar was CDN$1.00 per US$0.9403 (or US$1.00 per CDN$1.0597) as of November 29, 2013.
The average exchange rates for the periods indicated below (based on the daily noon buying rate for cable transfers in New York City certified for customs purposes by the Federal Reserve Bank of New York) are as follows:
| | | | | | YEARS ENDED AUGUST 31, | |
| | | 2013 | | | 2012 | | | 2011 | | | 2010 | | | 2009 | |
| Average exchange rate CDN$ per US$1.00 | | | 0.9839 | | | | 0.9925 | | | | 0.9783 | | | | 1.0640 | | | | 1.0967 | |
| Average exchange rate US$ per CDN$1.00 | | | 1.0161 | | | | 1.0075 | | | | 1.0217 | | | | 0.9360 | | | | 0.9033 | |
The high and low exchange rates between the Canadian dollar and the U.S. dollar for each of the six months ended November 29, 2013 are as follows:
| | | Exchange rate CDN$ per US$1.00 | |
| Month | | Low | | | High | |
| November 2013 | | | 1.0414 | | | | 1.0597 | |
| October 2013 | | | 1.0282 | | | | 1.0454 | |
| September 2013 | | | 1.0237 | | | | 1.0532 | |
| August 2013 | | | 1.0297 | | | | 1.0554 | |
| July 2013 | | | 1.0259 | | | | 1.0578 | |
| June 2013 | | | 1.0170 | | | | 1.0530 | |
| B. | CAPITALIZATION AND INDEBTEDNESS |
Not Applicable. This Form 20-F is being filed as an Annual Report under the Exchange Act.
| C. | REASONS FOR THE OFFER AND USE OF PROCEEDS |
Not Applicable. This Form 20-F is being filed as an Annual Report under the Exchange Act.
Our securities are highly speculative and subject to a number of risks. You should not consider an investment in our securities unless you are capable of sustaining an economic loss of the entire investment. In addition to the other information presented in this Annual Report, the following risk factors should be given special consideration when evaluating an investment in our securities.
General Risk Factors
We require additional capital which may not be available to us on acceptable terms, or at all. Both the exploration and development of oil and gas reserves can be capital-intensive businesses. We have accumulated significant losses and negative cash flows from operations in recent years which raises doubt as to the validity of the going concern assumption. As at August 31, 2013, we had a working capital deficiency of $4,985,312 and an accumulated deficit of $9,212,561. We do not have sufficient funds to meet our liabilities for the ensuing twelve months as they become due. In assessing whether the going concern assumption is appropriate, we take into account all available information about the future, which is at least, but not limited to, twelve months from August 31, 2013. Our ability to continue operations and fund our liabilities is dependent on our ability to secure additional financing and cash flow. We are pursuing such additional sources of financing and cash flow to fund our operations and obligations and while we have been successful in doing so in the past, there can be no assurance we will be able to do so in the future. We intend to satisfy any additional working capital requirements from cash flow and by raising capital through public or private sales of debt or equity securities, debt financing or short-term loans, or a combination of the foregoing. We have no current arrangements for obtaining additional capital, and may not be able to secure additional capital, or on terms which will not be objectionable to us or our shareholders. Under such circumstances, our failure or inability to obtain additional capital on acceptable terms or at all could have a material adverse effect on us.
We have a history of losses and a limited operating history as an oil and gas exploration and development company which makes it more difficult to evaluate our future prospects. To date, we have incurred significant losses. We have a limited operating history upon which any evaluation of us and our long-term prospects might be based. We are subject to the risks inherent in the oil and gas industry, as well as the more general risks inherent to the operation of an established business. We and our prospects must be considered in light of the risks, expenses and difficulties encountered by all companies engaged in the extremely volatile and competitive oil and gas markets. Any future success we might achieve will depend upon many factors, including factors, which may be beyond our control. These factors may include changes in technologies, price and product competition, developments and changes in the international oil and gas market, changes in our strategy, changes in expenses, fluctuations in foreign currency exchange rates, general economic conditions, and economic and regulatory conditions specific to the areas in which we compete. To address these risks, we must, among other things, comply with environmental regulations; expand our portfolio of proven oil and gas properties and negotiate additional working interests and prospect participations; and expand and replace depleting oil and gas reserves.
We have a pending litigation which could have a material effect on our financial condition or profitability.A vendor of ours filed a claim in the District Court of Zavala County, Texas seeking payment of US$169,196 for services. We are disputing the amount on the basis of negligence by the vendor. If the final outcome of such claim differs adversely from that expected, it would result in an impairment loss on the consolidated statement of operations and a reduction in exploration and evaluation assets, when determined. In addition, in December 2011, a vendor of Dyami Energy filed a claim in the District Court of Harris County, (Case No. 2011-74035/Court: 113) seeking payment of US$62,800. Dyami Energy disputed the claim on the basis of excessive charges. In December 2013 an agreed final judgment in favor of the vendor was entered into court in the amount of $42,803 and post judgment interest at 5% per annum until paid in full. (See -Item 8.A “Consolidated Financial Statements and Other Financial Information – Litigation”).
We have significant shareholder loans payable and a secured note payable which may make it difficult to service our debts, adversely affect our ability to obtain additional financing, engage in any business combinations or negatively affect our operations.At August 31, 2013we had 10% per annum shareholder loans payable on demand in the amount of $2,108,205 and a 10% per annum secured promissory note payable in the amount of US$960,000. The secured note and all unpaid and accrued interest was due on or before August 31, 2013, or within 15 days of written demand to the Company, or upon the Company closing a cash financing or series of cash financings in excess of US$2,500,000 in which case fifty cents of every one dollar exceeding US$2,500,000 will be allocated to the secured note until paid in full. The secured noteis secured by Zavala Inc’s interest in the Matthews Lease and Dyami Energy’s interest in the Murphy Lease, Zavala County, Texas. As of the date of this Annual Report, the Company had not received written demands for payment. If in the future we are unable to service our debt obligations we may, among other things, need to refinance all or a portion of our debt at an increased borrowing cost, obtain additional financing, delay capital expenditures or sell material assets. If we are not able to re-finance our debt as necessary, obtain additional financing or sell assets on commercially terms or at all, we may not be able to satisfy our debt obligations. In the event that shareholder loans or the secured note become payable on demand we may not have sufficient funds to re-pay all of the debt.
We have significant debt which may make it more difficult for us to obtain future financing or engage in business combination transactions. We have significant debt obligations. The degree to which this indebtedness could have consequences on our future prospects includes the effect of such debts on our ability to obtain financing for working capital, capital expenditures or acquisitions. The portion of available cash flow that will need to be dedicated to repayment of indebtedness will reduce funds available for expansion. If we are unable to meet our debt obligations through cash flow from operations, we may be required to refinance or adopt alternative strategies to reduce or delay capital expenditures, or seek additional equity capital.
Our future operating results are subject to fluctuation based upon factors outside of our control. Our operating results may in the future fluctuate significantly depending upon a number of factors including industry conditions, oil and gas prices, rate of drilling success, rates of production from completed wells and the timing of capital expenditures. Such variability could have a material adverse effect on our business, financial condition and results of operations. In addition, any failure or delay in the realization of expected cash flows from operating activities could limit our future ability to participate in exploration or to participate in economically attractive oil and gas projects.
Our operating results will be affected by foreign exchange rates. Since energy commodity prices are primarily priced in US dollars, a portion of our revenue stream and a portion of our expenses are incurred in US dollars and they are affected by U.S./Canadian dollar exchange rates. We do not hedge this exposure. While to date this exposure has not been material, it may become so in the future.
Our inability to manage our expected growth could have a material adverse effect on our business operations and prospects. We may be subject to growth-related risks including capacity constraints and pressure on our internal systems and controls. The ability to manage growth effectively will require us to continue to implement and improve our operational and financial systems and to expend, train and manage our employee base. The inability to deal with this growth could have a material adverse impact on our business, operations and prospects.
To compete in our industry, we must attract and retain qualified personnel. Our ability to continue our business and to develop a competitive edge in the marketplace depends, in large part, on our ability to attract and retain qualified management and personnel. Competition for such personnel is intense, and we may not be able to attract and retain such personnel which may negatively impact our share price. We do not have key-man insurance on any of our employees, directors or senior officers and we do not have written employment agreements with any of our employees, directors or senior officers.
We must continue to institute procedures designed to avoid potential conflicts involving our officers and directors. Some of our directors and officers are or may serve on the board of directors of other companies from time to time. Pursuant to the provisions of the Business Corporations Act (Ontario), our directors and senior officers must disclose material interests in any contract or transaction (or proposed contract or transaction) material to us. To avoid the possibility of conflicts of interest which may arise out of their fiduciary responsibilities to each of the boards, all such directors have agreed to abstain from voting with respect to a conflict of interest between the applicable companies. In appropriate cases, we will establish a special committee of independent directors to review a matter in which several directors, or members of management, may have a conflict.
We rely on the expertise of certain persons and must insure that these relationships are developed and maintained. We are dependent on the advice and project management skills of various consultants and joint venture partners contracted by us from time to time. Our failure to develop and maintain relationships with qualified consultants and joint venture partners will have a material adverse effect on our business and operating results.
We must indemnify our officers and directors against certain actions. Our articles contain provisions that state, subject to applicable law, we must indemnify every director or officer, subject to the limitations of the Business Corporations Act (Ontario), against all losses or liabilities that our directors or officers may sustain or incur in the execution of their duties. Our articles further state that no director or officer will be liable for any loss, damage or misfortune that may happen to, or be incurred by us in the execution of his duties if he acted honestly and in good faith with a view to our best interests. Such limitations on liability may reduce the likelihood of litigation against our officers and directors and may discourage or deter our shareholders from suing our officers and directors based upon breaches of their duties to us, though such an action, if successful, might otherwise benefit us and our shareholders.
We do not currently maintain a permanent place of business within the United States. A majority of our directors and officers are nationals or residents of countries other than the United States, and all or a substantial portion of such persons' assets are located outside the United States. As a result, it may be difficult for investors to enforce within the United States any judgments obtained against our company or our officers or directors, including judgments predicated upon the civil liability provisions of the securities laws of the United States or any state thereof.
The global financial crisis is expected to cause petroleum and natural gas prices to remain volatile for the near future. Recent market events and conditions, including disruptions in the international credit markets and other financial systems and the deterioration of global economic conditions, have caused significant volatility to commodity prices. These conditions are continuing, causing a loss of confidence in the broader U.S. and global credit and financial markets and resulting in the collapse of, and government intervention in, major banks, financial institutions and insurers and creating a climate of greater volatility, less liquidity, widening of credit spreads, a lack of price transparency, increased credit losses and tighter credit conditions. Notwithstanding various actions by governments, concerns about the general condition of the capital markets, financial instruments, banks, investment banks, insurers and other financial institutions caused the broader credit markets to further deteriorate and stock markets to decline substantially. These factors have negatively impacted company valuations and will impact the performance of the global economy going forward. Petroleum and natural gas prices are expected to remain volatile for the near future as a result of market uncertainties over the supply and demand of these commodities due to the current state of the world economies, OPEC actions and the ongoing global credit and liquidity concerns.
Since our sole executive officer does not devote his full time to the performance of his Company duties, he may engage in other work activities to our detriment. James Cassina, our sole executive officer, devotes approximately 75% of his work time to the performance of his Company duties. Although he has an obligation to perform his duties in a manner consistent with our best interests and through his stock ownership in the Company, is incentivized to do so, may encounter conflicts regarding the availability and use of his work time. Although there are no such present conflicts, the development thereof could have a material adverse effect on us.
Risks Factors Relating to Our Common Stock
Our stockholders may have difficulty selling shares of our common stock as there is a limited public trading market for such stock. There is only a limited public market for our common stock, and no assurance can be given that a broad or active public trading market will develop in the future or, if developed, that it will be sustained. Our common stock trades on the Over-the-Counter Bulletin Board. In addition, our common stock has not been qualified under any applicable state blue-sky laws, and we are under no obligation to so qualify or register our common stock, or otherwise take action to improve the public market for such securities. Our common stock could have limited marketability due to the following factors, each of which could impair the timing, value and market for such securities: (i) lack of profits, (ii) need for additional capital, (ii) limited public market for such securities; (iii) the applicability of certain resale requirements under the Securities Act; and (iv) applicable blue sky laws and the other factors discussed in this Risk Factors section.
Possible volatility of stock price.The market price for our common stock may be volatile and is subject to significant fluctuations in response to a variety of factors, including the liquidity of the market for the common stock, variations in our quarterly operating results, regulatory or other changes in the oil and gas industry generally, announcements of business developments by us or our competitors, litigation, changes in operating costs and variations in general market conditions. Because we have a limited operating history, the market price for our common stock may be more volatile than that of a seasoned issuer. Changes in the market price of our securities may have no connection with our operating results. No predictions or projections can be made as to what the prevailing market price for our common stock will be at any time.
We do not anticipate paying dividends on our common stock. We presently plan to retain all available funds for use in our business, and therefore do not plan to pay any cash dividends with respect to our securities in the foreseeable future. Hence, investors in our common stock should not expect to receive any distribution of cash dividends with respect to such securities for the foreseeable future.
Our shareholders may experience dilution of their ownership interests because of our future issuance of additional shares of common stock. Our constating documents authorize the issuance of an unlimited number of shares of common stock, without par value. In the event that we are required to issue additional shares of common stock or securities exercisable for or convertible into additional shares of common stock, enter into private placements to raise financing through the sale of equity securities or acquire additional oil and gas property interests in the future from the issuance of shares of our common stock to acquire such interests, the interests of our existing shareholders will be diluted and existing shareholders may suffer dilution in their net book value per share depending on the price at which such securities are sold. If we do issue additional shares, it will cause a reduction in the proportionate ownership and voting power of all existing shareholders.As of the date of this Annual report we have 1,050,000 common share purchase options outstanding to purchase 1,050,000 common shares and 49,348,558 warrants outstanding to purchase 49,348,558 common shares (See Item 5: “Operating and Financial Review and Prospects – Share Capital and Reserves and Derivative Warrant Liabilities”).
Prospective investors in our Company are urged to seek independent investment advice. Independent legal, accounting or business advisors (i) have not been appointed by, and have not represented or held themselves out as representing the interests of prospective investors in connection with this Annual Report, and (ii) have not “expertized” or held themselves out as “expertizing” any portion of this Annual Report, nor is our legal counsel providing any opinion in connection with us, our business or the completeness or accuracy of this Annual Report. Neither we nor any of our respective officers, directors, employees or agents, including legal counsel, make any representation or expresses any opinion (i) with respect to the merits of an investment in our common stock, including without limitation the proposed value of our common stock; or (ii) that this Annual Report provides a complete or exhaustive description of us, our business or relevant risk factors which an investor may now or in the future deem pertinent in making his, her or its investment decision. Any prospective investor in our common stock is therefore urged to engage independent accountants, appraisers, attorneys and other advisors to (a) conduct such due diligence review as such investor may deem necessary and advisable, and (b) to provide such opinions with respect to the merits of an investment in our Company and applicable risk factors upon which such investor may deem necessary and advisable to rely. We will fully cooperate with any investor who desires to conduct such an independent analysis so long as we determine, in our sole discretion, that such cooperation is not unduly burdensome.
Applicable SEC rules governing the trading of “penny stocks” will limit the trading and liquidity of our common stock and may affect the trade price for our common stock. The Securities and Exchange Commission (“SEC”) has adopted rules which generally define "penny stock" to be any equity security that has a market price (as defined) of less than US$5.00 per share or an exercise price of less than $5.00 per share, subject to certain exceptions. Our securities will be covered by the penny stock rules, which impose additional sales practice requirements on broker-dealers who sell to persons other than established customers and "accredited investors". The term "accredited investor" refers generally to institutions with assets in excess of US$5,000,000 or individuals with a net worth in excess of US$1,000,000 or annual income exceeding US$200,000 or US$300,000 jointly with their spouse.
The penny stock rules require a broker-dealer, prior to a transaction in a penny stock not otherwise exempt from the rules, to deliver a standardized risk disclosure document in a form prepared by the SEC which provides information about penny stocks and the nature and level of risks in the penny stock market. The broker-dealer also must provide the customer with current bid and offer quotations for the penny stock, the compensation of the broker-dealer and its salesperson in the transaction and monthly account statements showing the market value of each penny stock held in the customer's account. The bid and offer quotations, and the broker-dealer and salesperson compensation information, must be given to the customer orally or in writing prior to effecting the transaction and must be given to the customer in writing before or with the customer's confirmation.
In addition, the penny stock rules require that prior to a transaction in a penny stock not otherwise exempt from these rules, the broker-dealer must make a special written determination that the penny stock is a suitable investment for the purchaser and receive the purchaser's written agreement to the transaction. These disclosure requirements may have the effect of reducing the level of trading activity in the secondary market for the shares that are subject to these penny stock rules. Consequently, these penny stock rules may affect the ability of broker-dealers to trade our securities. We expect that the penny stock rules will discourage investor interest in and limit the marketability of our common shares.
In addition to the "penny stock" rules described above, The Financial Industry Regulatory Authority (“FINRA”) has adopted rules that require that in recommending an investment to a customer, a broker-dealer must have reasonable grounds for believing that the investment is suitable for that customer. Prior to recommending speculative low priced securities to their non-institutional customers, broker-dealers must make reasonable efforts to obtain information about the customer's financial status, tax status, investment objectives and other information. Under interpretations of these rules, the FINRA believes that there is a high probability that speculative low priced securities will not be suitable for at least some customers. The FINRA requirements will make it more difficult for broker-dealers to recommend that their customers buy our common shares, which may limit your ability to buy and sell our shares and have an adverse effect on the market for our shares.
Risks Factors Relating to Our Business
Our future success is dependent upon our ability to locate, obtain and develop commercially viable oil and gas deposits. Our future success is dependent upon our ability to economically locate commercially viable oil and gas deposits. We may not be able to consistently identify viable prospects, and such prospects, if identified, may not be commercially exploitable. Our inability to consistently identify and exploit commercially viable hydrocarbon deposits would have a material and adverse effect on our business and financial position.
Exploratory drilling activities are subject to substantial risks. Our expected revenues and cash flows will be principally dependent upon the success of any drilling and production from prospects in which we participate. The success of such prospects will be determined by the economical location, development and production of commercial quantities of hydrocarbons. Exploratory drilling is subject to numerous risks, including the risk that no commercially productive oil and gas reservoirs will be encountered. The cost of drilling, completing and operating wells is often uncertain, and drilling operations may be curtailed, delayed or canceled as a result of a variety of factors, including unexpected formation and drilling conditions, pressure or other irregularities in formations, blowouts, equipment failures or accidents, as well as weather conditions, compliance with governmental requirements or shortages or delays in the delivery of equipment. Our inability to successfully locate and drill wells that will economically produce commercial quantities of oil and gas could have a material adverse effect on our business and, financial position.
Our drilling and exploration plans will be subject to factors beyond our control. A prospect is a property that has been identified based on available geological and geophysical information that indicates the potential for hydrocarbons. Whether we ultimately drill a property may depend on a number of factors including funding; the receipt of additional seismic data or reprocessing of existing data; material changes in oil or gas prices; the costs and availability of drilling equipment; the success or failure of wells drilled in similar formations or which would use the same production facilities; changes in estimates of costs to drill or complete wells; our ability to attract industry partners to acquire a portion of our working interest to reduce exposure to drilling and completion costs; decisions of our joint working interest owners; and restrictions under provincial regulators.
Our operating results are subject to oil and natural gas price volatility. Our profitability, cash flow and future growth will be affected by changes in prevailing oil and gas prices. Oil and gas prices have been subject to wide fluctuations in recent years in response to changes in the supply and demand for oil and natural gas, market uncertainty, competition, regulatory developments and other factors which are beyond our control. It is impossible to predict future oil and natural gas price movements with any certainty. We do not engage in hedging activities. As a result, we may be more adversely affected by fluctuations in oil and gas prices than other industry participants that do engage in such activities. An extended or substantial decline in oil and gas prices would have a material adverse effect on our access to capital, and our financial position and results of operations.
Unforeseen title defects may result in a loss of entitlement to production and reserves. Although we conduct title reviews in accordance with industry practice prior to any purchase of resource assets, such reviews do not guarantee that an unforeseen defect in the chain on title will not arise and defeat our title to the purchased assets. If such a defect were to occur, our entitlement to the production from such purchased assets could be jeopardized.
Estimates of reserves and predictions of future events are subject to uncertainties. Certain statements included in this Annual Report contain estimates of our oil and gas reserves and the discounted future net revenues from those reserves, as prepared by independent petroleum engineers or us. There are numerous uncertainties inherent in such estimates including many factors beyond our control. The estimates are based on a number of assumptions including constant oil and gas prices, and assumptions regarding future production, revenues, taxes, operating expenses, development expenditures and quantities of recoverable oil and gas reserves. Such estimates are inherently imprecise indications of future net revenues, and actual results might vary substantially from the estimates based on these assumptions. Any significant variance in these assumptions could materially affect the estimated quantity and value of reserves. In addition, our reserves might be subject to revisions based upon future production, results of future exploration and development, prevailing oil and gas prices and other factors. Moreover, estimates of the economically recoverable oil and gas reserves, classifications of such reserves and estimates of future net cash flows prepared by independent engineers at different times may vary substantially. Information about reserves constitutes forward-looking statements.
The success of our business is dependent upon our ability to replace reserves. Our future success depends upon our ability to find, develop and acquire oil and gas reserves that are economically recoverable. As a result we must locate, acquire and develop new oil and gas reserves to replace those being depleted by production. Without successful funding for acquisitions and exploration and development activities, our reserves will decline. We may not be able to find and develop or acquire additional reserves at an acceptable cost.
Most of our competitors have substantially greater financial, technical, sales, marketing and other resources than we do. We engage in the exploration for and production of oil and gas, industries which are highly competitive. We compete directly and indirectly with oil and gas companies in our exploration for and development of desirable oil and gas properties. Many companies and individuals are engaged in the business of acquiring interests in and developing oil and gas properties in the United States and Canada, and the industry is not dominated by any single competitor or a small number of competitors. Many of such competitors have substantially greater financial, technical, sales, marketing and other resources, as well as greater historical market acceptance than we do. We will compete with numerous industry participants for the acquisition of land and rights to prospects, and for the equipment and labor required to operate and develop such prospects. Competition could materially and adversely affect our business, operating results and financial condition. Such competitive disadvantages could adversely affect our ability to participate in projects with favorable rates of return.
Shortages of supplies and equipment could delay our operations and result in higher operating and capital costs. Our ability to conduct operations in a timely and cost effective manner is subject to the availability of natural gas and crude oil field supplies, rigs, equipment and service crews. Although none are expected currently, any shortage of certain types of supplies and equipment could result in delays in our operations as well as in higher operating and capital costs.
Our business is subject to interruption from severe weather. Presently, our operations are conducted principally in the central region of Alberta, Canada and in Southwest Texas. The weather in these areas and other areas in which we may operate in the future can be extreme and can cause interruption or delays in our drilling and construction operations.
We are dependent on third-party pipelines and would experience a material adverse effect on our operations were our access to such pipelines be curtailed or the rates charged for use thereof materially increased. Substantially all our sales of natural gas production are effected through deliveries to local third-party gathering systems to processing plants. In addition, we rely on access to inter-provincial pipelines for the sale and distribution of substantially all of our gas. As a result, a curtailment of our sale of natural gas by pipelines or by third-party gathering systems, an impairment of our ability to transport natural gas on inter-provincial pipelines or a material increase in the rates charged to us for the transportation of natural gas by reason of a change in federal or provincial regulations or for any other reason, could have a material adverse effect upon us. In such event, we would have to obtain other transportation arrangements. We may not have economical transportation alternatives and it may not be feasible for us to construct pipelines. In the event such circumstances were to occur, our operating netbacks from the affected wells would be suspended until, and if, such circumstances could be resolved.
Our business is subject to operating hazards and uninsured risks. The oil and gas business involves a variety of operating risks, including fire, explosion, pipe failure, casing collapse, abnormally pressured formations, adverse weather conditions, governmental and political actions, premature reservoir declines, and environmental hazards such as oil spills, gas leaks and discharges of toxic gases. The occurrence of any of these events with respect to any property operated or owned (in whole or in part) by us could have a material adverse impact on us. Insurance coverage is not always economically feasible and is not obtained to cover all types of operational risks. The occurrence of a significant event that is not insured or insured fully could have a material adverse effect on our financial condition.
Our business is subject to restoration, safety and environmental risk. Our present operations are primarily in western Canada and southwest Texas and certain laws and regulations exist that require companies engaged in petroleum activities to obtain necessary safety and environmental permits to operate. Such legislation may restrict or delay us from conducting operations in certain geographical areas. Further, such laws and regulations may impose liabilities on us for remedial and clean-up costs, or for personal injuries related to safety and environmental damages, such liabilities collectively referred to as “decommissioning obligations”. While our safety and environmental activities have been prudent in managing such risks, we may not always be successful in protecting us from the impact of all such risks.
The termination or expiration of any of our licenses and leases may have a material adverse effect on our results of operations. Our properties are held in the form of licenses and leases and working interests in licenses and leases. If we, or the holder of the license or lease, fail to meet the specific requirement of a license or lease, the license or lease may terminate or expire. We may not meet the obligations required to maintain each license or lease. The termination or expiration of our licenses or leases or the working interests relating to a license or lease may have a material adverse effect on our results of operations and business (SeeItem 4.B: “Information on the Company – History and Development of the Company”).
Compliance with new or modified environmental laws or regulations could have a materially adverse impact on us. We are subject to various Canadian and US laws and regulations relating to the environment. We believe that we are currently in compliance with such laws and regulations. However, such laws and regulations may change in the future in a manner which will increase the burden and cost of compliance. In addition, we could incur significant liability under such laws for damages, clean-up costs and penalties in the event of certain discharges into the environment. In addition, environmental laws and regulations may impose liability on us for personal injuries, clean-up costs, environmental damage and property damage as well as administrative, civil and criminal penalties. We maintain limited insurance coverage for accidental environmental damages, but do not maintain insurance for the full potential liability that could be caused by such environmental damage. Accordingly, we may be subject to significant liability, or may be required to cease production in the event of the noted liabilities.
| ITEM 4 | INFORMATION ON THE COMPANY |
We are amalgamated under the laws of the Province of Ontario. Our primary activities are investment in, exploration and development and production of oil and gas.
We hold a 0.5% non-convertible gross overriding royalty in a natural gas well located in the Haynes area in the Province of Alberta, Canada carried on the consolidated statement of financial position at Nil.
We hold a 5.1975% working interest held in trust through a joint venture partner in a natural gas unit located in the Botha area in the Province of Alberta, Canada carried on the consolidated statement of financial position at Nil.
Through Eagleford Energy, Zavala Inc., we hold an 85% working interest before payout which reduces to a 70% working interest after payout of $15,000,000 of production revenue in the Matthews lease. The Matthews lease comprises approximately 2,629 gross acres of land in Zavala County, Texas (SeeItem 4.B: “Information on the Company – History and Development of the Company”).
Through Dyami Energy LLC we hold a 100% working interest in the Murphy Lease comprising approximately 2,637 acres of land in Zavala County, Texas subject to a 10% carried interest on the drilling costs from surface to base of the Austin Chalk formation, and a 3% carried interest on the drilling costs from the top of the Eagle Ford shale formation to basement on the first well drilled into a serpentine plug and for the first well drilled into a second serpentine plug, if discovered.
Our registered office and management office is located at 1 King Street West, Suite 1505, Toronto, Ontario, M5H 1A1, Telephone (416) 364-4039, Facsimile (416) 364-8244. Our books and financial records are located in the registered office and management office. Our Canadian public filings can be accessed and viewed via the System for Electronic Data Analysis and Retrieval (“SEDAR”) at www.sedar.com. Readers can also access and view our Canadian public insider trading reports via the System for Electronic Disclosure by Insiders at www.sedi.ca. Our Registrar and Transfer Agent is Equity Financial Trust Company located at Suite 400, 200 University Avenue, Toronto, Ontario, M5H 4H1. Our U.S. public filings are available at the public reference room of the U.S. Securities and Exchange Commission (“SEC”) located at 100 F Street, N.E., Room 1580, Washington, DC 20549 and at the website maintained by the SEC at www.sec.gov.
| A. | HISTORY AND DEVELOPMENT OF THE COMPANY |
We were incorporated in Ontario, Canada on September 22, 1978, under the Business Corporations Act (Ontario), under the name Bonanza Red Lake Explorations Inc. (“Bonanza Red Lake”). By prospectus dated November 20, 1978 and a further amendment to the Prospectus dated January 10, 1979 we became a reporting issuer in the Province of Ontario and raised $250,000 to acquire interests in and to explore and develop certain mineral lands located near the Town of Red Lake, Ontario, Canada. In 1987, we optioned our mineral lands in Red Lake, Ontario to Pure Gold Resources Inc., who expended sufficient funds during 1988 and 1989 to earn an 85% interest in our eight patented mineral claims, and then discontinued its exploration program on the property. Bonanza Red Lake had subsequently written the carrying amount of these mineral claims down to $1.
On March 29, 2000, Bonanza Red Lake entered into a Share Exchange Agreement with 1406768 Ontario Inc. (“1406768 Ontario”). 1406768 Ontario is a company incorporated under the laws of the Province of Ontario by articles of incorporation dated effective March 13, 2000. The purpose of the transaction was to allow Bonanza Red Lake to acquire a company, 1406768 Ontario, which resulted in our owning part of an operating business. At an Annual and Special Meeting of shareholders held on May 10, 2000 we received shareholder approval for the acquisition of 1406768 Ontario; the consolidation of Bonanza Red Lake’s issued and outstanding common shares on a one new common share for every three old common shares basis; a name change from Bonanza Red Lake to Eugenic Corp; a new stock option plan (the “Plan”) authorizing 1,275,000 common shares to be set aside for issuance under the Plan; and authorizing the directors to determine or vary the number of directors of the Company from time to time which pursuant to our Articles provide for a minimum of three and a maximum of ten.
By Articles of Amendment dated August 15, 2000, Bonanza Red Lake consolidated its issued and outstanding common shares on a one new common share for every three old common shares basis and changed the name of the company to Eugenic Corp.
We completed the acquisition of 1406768 Ontario on October 12, 2000 and acquired all of the issued and outstanding shares of 1406768 Ontario for $290,000. The purchase price was satisfied by our issuance of 5,800,000 company units at $0.05 per unit. Each unit consisted of one common share and one common share purchase warrant entitling the holder to purchase one common share of ours at an exercise price of $0.25 per common share until October 12, 2003. As a result of this transaction, the original shareholders of 1406768 Ontario owned 90.7% of our issued shares. The acquisition resulted in a change in business and an introduction of new management for us. The acquisition was accounted for as a reverse take-over of us by 1406768 Ontario. Our net assets acquired at fair value as at October 12, 2000 resulted in a deficiency of assets over liabilities in the amount of $123,170 which was charged to share capital. All of the 5,800,000 outstanding warrants expired on October 12, 2003.
On February 5, 2009, we completed a non-brokered private placement of 2,600,000 units (each a “Unit”) at a purchase price of $0.05 per Unit for gross proceeds of $130,000. Each Unit was comprised of one common share (each a “Unit Share”) and one purchase warrant (each a “Warrant”). Each Warrant is exercisable until February 5, 2014 to purchase one additional share of our common stock (each a “Warrant Share”) at a purchase price of $0.07 per share. 1407271 Ontario Inc. purchased 1,600,000 units. 1407271 Ontario Inc. is owned 100% by our former President, Ms. Sandra Hall. Ms. Hall is also the sole director and officer of 1407271.
On February 25, 2009, we completed a non-brokered private placement of 1,000,256 units (each a “Unit”) at a purchase price of $0.05 per Unit for gross proceeds of approximately $50,013. Each Unit was comprised of one common share (each a “Unit Share”) and one purchase warrant (each a “Warrant”). Each Warrant is exercisable until February 25, 2014 to purchase one additional share of our common stock (each a “Warrant Share”) at a purchase price of $0.07 per share. Sandra Hall, our former president and former director, and Milton Klyman, a director, purchased 600,000 Units and 50,000 Units, respectively.
On February 27, 2009, we purchased all of the issued and outstanding shares issued in the capital stock of 1354166 Alberta Ltd. (“1354166 Alberta”), a company incorporated on October 3, 2007 in the Province of Alberta Canada (the "Transaction") under the Business Corporations Act (Alberta). In connection therewith, we issued to the shareholders of 1354166 an aggregate of 8,910,564 units (each a "Unit") at $0.05 per unit or an aggregate of $445,528 and following the closing repaid $118,000 of shareholders’ loans in 1354166 by cash payment. . Each unit is comprised of one share of our common stock (each a "Share") and one purchase warrant (each a "Warrant"). Each Warrant is exercisable until February 27, 2014 to purchase one additional share of our common stock at a purchase price of $0.07 per share. 1354166 is a private company that has a 5.1975% working interest held in trust through a joint venture partner in a natural gas unit located in the Botha area of Alberta, Canada.
On February 27, 2009, we entered into an agreement with a non-related party, to convert debt in the amount of $62,500 through the issuance of a total of 1,250,000 units at an attributed value of $0.05 per unit (the "Debt Settlement"). Each Unit was comprised of one common share (each a “Unit Share”) and one purchase warrant (each a “Warrant”). Each Warrant is exercisable until February 27, 2014 to purchase one additional share of our common stock (each a “Warrant Share”) at a purchase price of $0.07 per share.
By Articles of Amendment dated November 12, 2009, 1406768 Ontario changed its name to Eagleford Energy Inc. By Articles of Amalgamation dated November 30, 2009 we amalgamated with Eagleford Energy Inc. and upon the amalgamation the amalgamated entity's name became Eagleford Energy Inc.
Effective June 10, 2010, we retained Gar Wood Securities, LLC (“Gar Wood”) to act as Investment Banker/Financial Advisor to the Company for a period of two years. Under the terms of the Gar Wood engagement, we agreed to pay a fee of 6% of the gross proceeds raised and issue 1,500,000 common share purchase warrants. On November 5, 2010 we terminated the agreement with Gar Wood dated June 10, 2010. As a result 36,430 warrants were cancelled out of the 333,333 warrants issued exercisable at $1.00 expiring December 10, 2011 and 18,215 warrants were cancelled out of the 166,667 warrants issued exercisable at $1.50 expiring June 10, 2012. On December 10, 2011 296,903 warrants exercisable at US $1.00 expired. During the year ended August 31, 2012 all of the remaining warrants expired unexercised.
During the fiscal year ended August 31, 2010, 1,100,000 of our common share purchase warrants were exercised at $0.07 expiring February 5, 2014 for proceeds of $77,000 and 1,000,000 of our common share purchase warrants were exercised at $0.07 expiring February 27, 2014 for proceeds of $70,000.
On August 31, 2010 we acquired a 10% working interest before payout and a 7.5% working interest after payout of production revenue of $15 million in the Matthews lease comprising approximately 2,629 gross acres of land in Zavala County, Texas (the “Lease Interest”). As consideration for the Lease Interest we paid on closing $212,780 (US$200,000), satisfied by US$25,000 in cash and $186,183 (US$175,000) satisfied by the issuance of a 5% secured promissory note.US$100,000 of principal together with accrued interest was due and payable on February 28, 2011(paid) and US$75,000 of principal together with accrued interest was due and payable on August 31, 2011 (paid). The note was secured by the Lease Interest.
On August 31, 2010, we acquired 100% of the issued and outstanding membership interests of Dyami Energy LLC, a Texas limited liability corporation for consideration of $4,218,812. (US$3,965,422) satisfied by (i) the issuance of 3,418,467 units of the Company. Each unit is comprised of one common share and one-half a purchase warrant. Each full warrant is exercisable into one additional common share at US$1.00 per share on or before August 31, 2014 (the “Units’) and (ii) the assumption of $1,021,344 (US$960,000) of Dyami Energy debt by way of a secured promissory note payable to Benchmark Enterprises LLC (“Benchmark”). The 6% per annum note was secured by Dyami’s interest in the Matthews and Murphy leases and was payable on December 31, 2011 or upon the Company closing a financing or series of financings in excess of US$4,500,000. Commencing January 1, 2012 the interest rate increased from 6% to 10% and the due date of the note was extended to August 31, 2013, or within 15 days of written demand to us, or upon us closing of a cash financing or series of cash financings closing after the date of this agreement in excess of US$2,500,000 (Two Million, Five Hundred Thousand USA dollars), (the “Funding Threshold”) in which case fifty cents of every one dollar exceeding the Funding Threshold will be allocated to the Note until paid in full or upon an Event of Default. On January 3, 2012 we issued 515,406 pre forward split common shares to shares Benchmark as full settlement of interest due at December 31, 2011 in the amount of $103,028.
Dyami Energy held a 75% working interest before payout and a 61.50% working interest after payout of production revenue of $12.5 million in the Matthews Lease comprising approximately 2,629 gross acres of land in Zavala County, Texas and a 100% working interest in a mineral lease comprising approximately 2,637 acres of land in Zavala County, Texas (the “Murphy Lease”) subject to a 10% carried interest on the drilling costs from surface to base of the Austin Chalk formation, and a 3% carried interest on the drilling costs from the top of the Eagle Ford shale formation to basement on the first well drilled into a serpentine plug and for the first well drilled into a second serpentine plug, if discovered (collectively the “Leases”) (SeeItem 4.B: “Information on the Company – History and Development of the Company”).
The Members of Dyami entered into lock up agreements on closing and placed 50% of the Units in escrow (1,709,234 common shares and 854,617 purchase warrants) until such time that we receive a National Instrument 51-101 compliant report from an independent engineering firm indicating at least 100,000 boe of proven reserves on either the Murphy Lease or any formation below the San Miguel on the Matthews Lease (the “Report”). The Report was not received by Dyami Energy within two years of the closing date of the acquisition andthe escrow units were to be returned to us for cancellation. On August 31, 2012 we cancelled the 50% of Units held in escrow as the conditions precedent had not been satisfied and the time allowed for performance expired.
In connection with the Dyami Energy acquisition, we entered into a one year employment agreement with Eric Johnson and reserved 850,000 common share purchase warrants, exercisable on an earn-out basis, for the purchase of 850,000 common shares of our stock at a price of US$1.00 per share during a period of five years from the date of issuance. On April 13, 2011 the employment agreement was terminated and no warrants were issued or issuable
During the fiscal year ended August 31, 2010 we spent $10,046 on exploration expenditures related to the Matthews Lease.
On March 31, 2011 we entered into a Farmout Agreement (the “Farmout”) from surface to the base of the San Miguel formation (the “San Miguel”) on the Matthews Lease located in Zavala County, Texas. Under the Farmout, the farmee may spend up to US$1,050,000 on exploration and development of the San Miguel to earn a maximum of 42.50% working interest (31.875% net revenue interest). Under the terms of the Farmout, the farmee may earn an initial 25% of the Company’s working interest in the San Miguel by paying 100% of the costs to drill, complete, equip and perform an injection operation on a test well to a depth of approximately 3,500 feet (the “Initial Test Well”). After the performance of the Initial Test Well, the farmee may increase its working interest to 50% of the Company’s working interest by spending the entire $1,050,000 on additional operations on the San Miguel in a good faith effort to produce hydrocarbons. We received US$647,536 from the farmee against costs of $711,395 related to the drilling, completion and injection operation of the Matthews/Dyami #3 well. As of the date of this Annual Report we have not assigned any interest to the farmee in the San Miguel formation.
During the fiscal year ended August 31, 2011 we drilled four wells and recorded additions of $3,262,782 to exploration and evaluation assets related to the Matthews and Murphy Leases.
During the year ended August 31, 2011, 500,000 of our common share purchase warrants were exercised at $0.07 expiring February 5, 2014 for proceeds of $35,000; 625,247 of our common share purchase warrants were exercised at $0.07 expiring February 27, 2014 for proceeds of $44,475; and 2,575,000 of our common share purchase warrants were exercised at $0.20 expiring April 14, 2011 for proceeds of $515,000.
During the year ended August 31, 2011 we received $2,878,736 and issued demand promissory notes bearing interest at 10% per annum. Interest is payable annually on the anniversary date of the notes.
During the year ended August 31, 2011 we paid a $110,000 loan payable.
As of the close of business on March 16, 2012, we completed a two-for-one forward stock split, pursuant to which one (1) newly-issued share of the Company’s common stock was issued to each holder of a share of common stock.
During the year ended August 31, 2012 we completed a financing of 12,575,000 units in the capital of the Company for net proceeds of $2,086,718.
During the year ended August 31, 2012, we issued 17,150,000 units as full settlement of debt and shareholders’ loans in the amount of $857,500 and issued 3,278,392 common shares as full settlement of interest due on a secured note and shareholders’ loans in the amount of $369,885.
During the year ended August 31, 2012, we received cash of $321,845 and US$175,000 and issued demand promissory notes bearing interest at 10% per annum.
During the twelve months ended August 31, 2012, we paid US$480,000 of shareholders’ loans.
For the twelve months ended August 31, 2012, we recorded additions of $1,559,763 to exploration and evaluation assets related to the leases in Zavala County, Texas.
During the year ended August 31, 2012, the lessors of the Matthews Lease expressed their belief that the lease had terminated and filed a petition in the District Court, Zavala County, Texas, seeking a declaration that the lease has terminated. We disagreed and believed that we were in compliance with the terms of the lease. We defended the allegation and countersued the lessors for repudiation of the lease and sought damages. On August 29, 2013 we incorporated a wholly owned subsidiary, Eagleford Energy, Zavala Inc. a Nevada company (“Zavala Inc.”). During the year ended August 31, 2013, we entered into an agreement with the lessors of the Matthews Property, OGR Energy Corporation (“OGR Energy”) and Texas Onshore Energy, Inc. (“Texas Onshore”) together holding a 15% working interest in the Matthews Property with back in rights to earn an additional 15% working interest after production achieved $15.0 million of revenue. A new lease was signed with our subsidiary, Zavala Inc. effective September 1, 2013 (the “New Matthews Lease”).
The New Matthews Lease has a primary term expiring January 31, 2014 (the “Primary Term”) (subject to certain extensions) and can be maintained through the provision of certain royalty payments and the implementation of a continuous drilling program as follows.
A) We agreed to a minimum annual royalty of $323.30 per acre retained on the Matthews Property to the Lessors payable as follows:
(1) US$150,000 upon execution of the Lease (paid); and
(2) US$150,000 by the earliest of the following to occur:
(a) on or before 95 days from the Effective Date of the Lease (paid); or
(b) immediately prior to commencing a new operation under the terms of the Lease.
B) US$60,000 to Lessors upon commencement of the first new operation.
C) We have two (2) separate options to extend the Primary Term of the Matthews Lease. If the we elect to extend the Primary Term of the Matthews Lease through February 28, 2014 (the “First Extension”) we shall provide written notice and tender an additional pre-payment of royalties to Lessors in the amount of US$30,000 on or before January 26, 2013. If, after the First Extension has been exercised by us, and we elect to extend the Primary Term of the Matthews Lease through March 31, 2014 (the “Second Extension”), we shall provide written notice and tender an additional pre-payment of royalties to Lessors in the amount of US$30,000 on or before February 23, 2014.
D) Prior to the expiration of the Primary Term, we shall perform a new operation satisfied by either drilling a new well to a targeted depth deemed capable of production or the hydraulic fracturing of the existing Matthews #1H well (the “New Operation”).
E) Beginning in the second lease year and continuing thereafter for each succeeding lease year drill at least 2 wells per year before the expiration of each lease year.
Upon us satisfying the New Operation, OGR Corporation and Texas Offshore will assign their working interests to Zavala Inc. and Zavala Inc’s interest will increase to a 100% working interest in the Matthews Property from a 75% working interest before payout and a 61.50% working interest after payout of production revenue of $12.5 million previously held by Dyami Energy and a 10% working interest before payout and a 7.5% working interest after payout of production revenue of $15 million previously held by Eagleford with the balance held by OGR Energy and Texas Onshore. The royalties payable under the Matthews Lease are 25%.
During the year ended August 31, 2013 we completed a financing of 2,249,790 units in the capital of our Company for net proceeds of $405,650. Each unit is comprised of one common share and one-half of one common share purchase warrant with each full warrant entitling the holder to acquire one common share of ours at US$0.50 or a period of three years from the date of issue.
During the year ended August 31, 2013, we issued 23,662,569 common shares as full settlement of shareholder loans and interest due on shareholders’ loans of $198,333 and $345,906 respectively.
For the twelve months ended August 31, 2013, we recorded additions of $404,818 to exploration and evaluation assets related to the leases in Zavala County, Texasand an impairment of $2,690,568 on the Murphy Lease.
On December 3, 2013, the Company entered into an agreement with Stratex Oil and Gas Holdings Inc., (“Stratex”) to develop the Matthews Lease in Zavala County, Texas (the “Joint Development Agreement”). Under the terms of the Joint Development Agreement, Stratex may earn a 66.67% working interest before payout (50% working interest after payout) in the Matthews #1 well by
| 1) | completing a hydraulic fracture no later than March 31, 2014; |
| 2) | delivering US $150,000 to the lessors of the Matthews Lease upon execution of the Joint Development Agreement (paid); |
| 3) | delivering US $50,000 to the Company upon execution of the Joint Development Agreement (paid); and |
| 4) | delivering US $100,000 to the Company on or before December 31, 2013. |
Following the completion of the above, the Stratex will earn a 50% working interest in the 2,629 acre Matthews Lease excluding 80 acres surrounding the Matthews #3 well. As of the date of this Annual Report we have not assigned any interest to the Stratex in the Matthews Lease.
We intend to apply additional capital to further enhance our property interests. As part of our oil and gas development program, management of the Company anticipates further expenditures to expand its existing portfolio of proved reserves. Amounts expended on future exploration and development is dependent on the nature of future opportunities evaluated by us. These expenditures could be funded through cash held by the Company or through cash flow from operations. Any expenditure which exceeds available cash will be required to be funded by additional share capital or debt issued by us, or by other means. Our long-term profitability will depend upon our ability to successfully implement our business plan.
Our past primary source of liquidity and capital resources has been proceeds from the issuance of share capital, loans and advances and cash flow from our oil and gas operations.
Our registered office and principal place of business in Ontario is located at 1 King Street West, Suite 1505, Toronto, Ontario M5H 1A1. Our telephone number at that address is (416) 364-4039.
Directly and through our wholly owned subsidiaries 1354166 Alberta, Dyami Energy and Zavala Inc. we are primarily engaged in the development, acquisition and production of oil and gas interests located in Alberta, Canada and Texas, USA.
We have a 0.5% Non Convertible Overriding Royalty (“NCOR”) in a natural gas well located in Haynes, Alberta, Canada a 5.1975% working interest in a natural gas unit located in Alberta, Canada both of which are carried on our consolidated statement of financial position at Nil.
We hold an 85% working interest before payout which reduces to a 70% working interest after payout of $15,000,000 of production revenue in the Matthews lease. The Matthews lease comprises approximately 2,629 gross acres of land in Zavala County, Texas (SeeItem 4.B: “Information on the Company – History and Development of the Company”).
In addition, we hold a 100% working interest in the Murphy lease comprising approximately 2,637 acres of land in Zavala County, Texas subject to a 10% carried interest on the drilling costs from surface to base of the Austin Chalk formation, and a 3% carried interest on the drilling costs from the top of the Eagle Ford shale formation to basement on the first well drilled into a serpentine plug and for the first well drilled into a second serpentine plug, if discovered.
We have a 0.3% Net Smelter Return Royalty on 8 patented mining claims located in Red Lake, Ontario, Canada carried on our consolidated statement of financial position at Nil.
For the three fiscal years ending August 31, 2013, 2012 and 2011 the total revenue, net of royalties derived from the sale of our natural gas interests in Canada was as follows:
| Year | | Total Net Revenue | |
| August 31, 2013 | | $ | 30,062 | |
| August 31, 2012 | | $ | 39,218 | |
| August 31, 2011 | | $ | 56,916 | |
We sell our natural gas production to integrated oil and gas companies and marketing agencies. Sales prices are generally set at market prices available in Canada or the United States.
The level of activity in the Canadian oil and gas industry is influenced by seasonal weather patterns. Wet weather and spring thaw make the ground unstable and municipalities and provincial transportation departments enforce road bans that may restrict the level of activity. Seasonal factors and unexpected weather patterns may lead to declines in production activity and increased consumer demand or changes in supply during certain months of the year may influence the commodity prices.
There is an existing and available market for the oil and gas produced from the properties. However, the prices obtained for production are subject to market fluctuations, which are affected by many factors, including supply and demand. Numerous factors beyond our control, which could affect pricing include:
| • | the level of consumer product demand; |
| • | the foreign supply of oil and gas; |
| • | the price of foreign imports; |
| • | volatility in market prices for oil and natural gas; |
| • | ability to raise financing; |
| • | reliance on third party operators; |
| • | ability to find or produce commercial quantities of oil and natural gas; |
| • | liabilities inherent in oil and natural gas operations; |
| • | dilution of interests in oil and natural gas properties; |
| • | general business and economic conditions; |
| • | the ability to attract and retain skilled staff; |
| • | uncertainties associated with estimating oil and natural gas reserves; |
| • | competition for, among other things, financings, acquisitions of reserves, undeveloped lands and skilled personnel; and |
| • | governmental regulation and environmental legislation (See, Item 3.D Key Information - Risk Factors). |
We caution that the foregoing list of important factors is not exhaustive. Investors and others who base themselves on our forward-looking statements should carefully consider the above factors as well as the uncertainties they represent and the risk they entail. We also caution readers not to place undue reliance on these forward-looking statements. Moreover, the forward-looking statements may not be suitable for establishing strategic priorities and objectives, future strategies or actions, financial objectives and projections other than those mentioned above.
We do not have a reliance on raw materials, as we operate in an extractive industry.
We do not have a reliance on any significant patents.
The oil and gas business is highly competitive in every phase. Many of our competitors have greater financial and technical resources, and have established multi-national operations, secured land rights and licenses, which we may not have. As a result, we may be prevented from participating in drilling and acquisition programs (See, Item 3.D Key Information - Risk Factors).
Governmental Regulation/Environmental Issues
Our oil and gas operations are subject to various United States and Canadian governmental regulations including those imposed by the Texas Railroad Commission and Alberta Energy Resources Conversation Board and Alberta Utilities Commission. Matters subject to regulation include discharge permits for drilling operations, drilling and abandonment bonds, reports concerning operations, the spacing of wells, and pooling of properties and taxation. From time to time, regulatory agencies have imposed price controls and limitations on production by restricting the rate of flow of oil and gas wells below actual production capacity in order to conserve supplies of oil and gas. The production, handling, storage, transportation and disposal of oil and gas, by-products thereof, and other substances and materials produced or used in connection with oil and gas operations are also subject to regulation under federal, state, provincial and local laws and regulations relating primarily to the protection of human health and the environment. To date, expenditures related to complying with these laws, and for remediation of existing environmental contamination, have not been significant in relation to the results of operations of our company. The requirements imposed by such laws and regulations are frequently changed and subject to interpretation, and we are unable to predict the ultimate cost of compliance with these requirements or their effect on our operations. These regulations may adversely affect our operations and cost of doing business. It is likely that these laws and regulations will become more stringent in the future (See,Item 3.D Key Information - Risk Factors).
| C. | ORGANIZATIONAL STRUCTURE |
We have three wholly owned subsidiaries. 1354166 Alberta Ltd. is a company incorporated under the Business Corporations Act (Alberta) and Dyami Energy LLC is a Texas Limited Liability company and Eagleford Energy, Zavala Inc. is a Nevada company.
| D. | PROPERTY, PLANTS AND EQUIPMENT |
Our executive offices consist of approximately 140 square feet of office space and are rented at $1,500 per month on a month to month basis. The address of our executive offices is 1 King Street West, Suite 1505, Toronto, Ontario Canada.
Canada
We hold directly a 0.5% NCOR in a natural gas well located in Haynes, Alberta, Canada.
We hold through our wholly owned subsidiary 1354166 Alberta a 5.1975% working interest in a natural gas unit located in Botha, Alberta, Canada.
We have a 0.3% Net Smelter Return Royalty on eight patented mining claims located in Red Lake, Ontario, Canada.
United States
We hold an 85% working interest before payout which reduces to a 70% working interest after payout of $15,000,000 of production revenue in the Matthews lease. The Matthews lease comprises approximately 2,629 gross acres of land in Zavala County, Texas (SeeItem 4.B: “Information on the Company – History and Development of the Company”).
We hold through our wholly owned subsidiary Dyami Energy, a 100% working interest in the Murphy lease comprising approximately 2,637 acres of land in Zavala County, Texas subject to a 10% carried interest on the drilling costs from surface to base of the Austin Chalk formation, and a 3% carried interest on the drilling costs from the top of the Eagle Ford shale formation to basement on the first well drilled into a serpentine plug and for the first well drilled into a second serpentine plug, if discovered. The Matthews and Murphy Leases are subject to royalties payable of 25%.
Our Matthews Lease is situated in Zavala County, Texas and is part of the Maverick Basin of Southwest Texas and downdip from the United States Geological Studies north boundary of the Smackover-Austin-Eagle Ford total petroleum system.
The map below indicates the location of our Matthews Lease and Murphy Lease located in Zavala County, Texas.
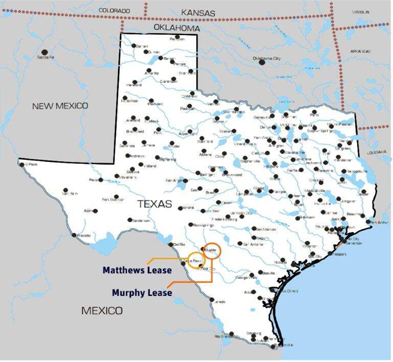
The table below is a glossary of terms and abbreviations that may be used in this Item.
GLOSSARY OF TERMS
| Natural Gas | | Mcf | | 1,000 cubic feet |
| | | MMcf | | 1,000,000 cubic feet |
| | | Mcf/d | | 1,000 cubic feet per day |
| | | | | |
| Oil and Natural Gas Liquids | | Bbl | | Barrel |
| | | Mbbls | | 1,000 barrels |
| | | Blpd | | Barrels of liquid per day |
| | | Boe | | Barrel of oil equivalent (1) |
| | | Bpd | | Barrels per day |
| | | Boepd | | Barrels of oil equivalent per day |
| | | Bopd | | Barrels of oil per day |
| | | NGLs | | Natural gas liquids |
(1) Disclosure provided herein in respect of BOEs may be misleading, particularly if used in isolation. A BOE conversion ratio of 6 Mcf: 1 Bbl is based on an energy equivalency conversion method primarily applicable at the burner tip and does not represent a value equivalency at the wellhead.
The following table sets forth certain standard conversions between Standard Imperial Units and the International System of Units (or metric units).
| To Convert From | | To | | Multiply By | |
| | | | | | |
| Mcf | | Cubic metres | | | 28.174 | |
| Cubic metres | | Cubic feet | | | 35.494 | |
| Bbls | | Cubic metres | | | 0.159 | |
| Cubic metres | | Bbls | | | 6.289 | |
| Feet | | Metres | | | 0.305 | |
| Metres | | Feet | | | 3.281 | |
| Miles | | Kilometers | | | 1.609 | |
| Kilometers | | Miles | | | 0.621 | |
| Acres (Alberta) | | Hectares | | | 0.405 | |
| Hectares (Alberta) | | Acres | | | 2.471 | |
Reserve Information: The process of evaluating reserves is inherently complex. It requires significant judgments and decisions based on available geological, geophysical, engineering and economics data. These estimates may change substantially as additional data from ongoing development activities and production performance becomes available and as economic conditions impacting oil and gas prices and costs changes. The reserve estimates contained herein are based on current production forecasts, prices and economic conditions. These factors and assumptions include among others (i) historical production in the area compared with production rates from analogous producing areas; (ii) initial production rates, (iii) production decline rates, (iv) ultimate recovery of reserves; (v) success of future development activities; (vi) marketability of production, (vii) effects of government regulation; and (viii) other government levies imposed over the life of the reserves.
As circumstances change and additional data becomes available, reserves estimates also change. Estimates are reviewed and revised, either upward or downward, as warranted by the new information. Revisions are often required for changes in well performance, prices, economic conditions and governmental restrictions. Revisions to reserve estimates can arise from changes in year–end prices, reservoir performance and geological conditions or production. These revisions can be either positive or negative (" 3.D: “ Key Information – Risk Factors”).
Proved reserves are those reserves that can be estimated with a high degree of certainty to be recoverable. It is likely that the actual remaining quantities recovered will exceed the estimated proved reserves.
Probable reserves are those additional reserves that are less certain to be recovered than proved reserves. It is equally likely that the actual remaining quantities recovered will be greater or less than the sum of the estimated proved plus probable reserves.
The qualitative certainty levels contained in the definitions in proved, probable and possible reserves are applicable to individual reserves entities, which refers to the lowest level at which reserves estimates are made, and to reported reserves, which refers to the highest level sum of individual entity estimates for which reserve estimates are made.
Reported total reserves estimated by deterministic or probabilistic methods, whether comprised of a single reserves entity or an aggregate estimate for multiple entities, should target the following levels of certainty under a specific set of economic conditions:
a. There is a 90% probability that at least the estimated proved reserves will be recovered.
b. There is a 50% probability that at least the sum of the estimated proved reserves plus probable reserves will be recovered.
c. There is a 10% probability that at least the sum of the estimated proved reserves plus probable reserves plus possible reserves will be recovered.
A quantitative measure of the probability associated with a reserves estimate is generated only when a probabilistic estimate is conducted. The majority of reserves estimates will be performed using deterministic methods that do not provide a quantitative measure of probability. In principle, there should be no difference between estimates prepared using probabilistic or deterministic methods.
Additional clarification of certainty levels associated with reserves estimates and the effect of aggregation is provided in Section 5.5.3 of the COGE Handbook. Whether deterministic or probabilistic methods are used, evaluators are expressing their professional judgement as to what are reasonable estimates.
The crude oil and natural gas industry commonly applies a conversion factor to production and estimated proved reserve volumes of natural gas in order to determine an “all commodity equivalency” referred to as barrels of oil equivalent (“boe”). The conversion factor we have applied in this Report is the current convention used by many oil and gas companies, where six thousand cubic feet (“mcf”) is equal to one barrel (“bbl”). A boe is based on an energy equivalency conversion method primarily applicable at the burner tip. It may not represent equivalency at the wellhead and may be misleading if used in isolation.
Internal Controls for Reserves Reporting: For the year ended August 31, 2013 we had no reserves or future net revenue. For the years ended August 31, 2012 and 2011 a significant component of our internal controls in our reserve estimation effort is our practice of using an independent third-party reserve engineering firm to prepare 100% of our year-end proved and probable reserves. The qualifications of this firm are discussed below under “Independence and Qualifications of Reserve Preparer.” The Board of Directors of the Company has reviewed the reserves estimates and procedures prior to acceptance of the reports. The Board of Directors has sufficient technical training and experience to review and approve the reports.
Our director Mr. McNeil, chair of our petroleum and natural gas committee maintains oversight and compliance responsibility for the internal reserve estimate process and provides appropriate data to our independent third party reserve engineers to estimate our year-end reserves. Mr. McNeil is a self-employed oil and gas consultant and has been a geophysicist since 1972. Mr. McNeil is a member of the Association of Professional, Engineers, Geologists and Geophysicists of Alberta, Society of Exploration Geophysicists, Canadian Society of Exploration Geophysicists, American Association of Petroleum Geologists and the Canadian Society of Petroleum Geologists.
Independence and Qualifications of Reserve Preparer: For the year ended August 31, 2013 the Company recorded an impairment loss of $168,954 on its Botha, Alberta property as a result of no reserves and no future net revenue being assigned. During the year ended August 31, 2013, the producing wells in the Botha property watered out, are shut in and the operator does not intend on reactivating or remediating the wells. At August 31, 2013, our developed properties include a 5.1975% working interest in a natural gas unit located in the Botha area Northwest, Alberta near the town of Manning, Canada held through our wholly owned subsidiary 1354166 Alberta which is carried on the consolidated statement of financial position at nil. As we had no reserves or future net revenue at August 31, 2013, we did not retain an independent reserves evaluator.
We engaged Sproule Associates Limited (“Sproule”), third-party reserve engineers, to prepare our reserve estimates as of the effective date August 31, 2012 and August 31, 2011 completed on October 11, 2012 and October 7, 2011 respectively, in accordance with reserves definitions, standards and procedures contained in the Canadian Oil and Gas Evaluation Handbook (COGE), the Canadian Securities Administrators National Instrument 51-101 (NI 51-101) using Forecast Pricing Assumptions and, for the Securities and Exchange Commission, using Constant Pricing Assumptions. The technical person responsible for our reserve estimates at Sproule meets the requirements regarding qualifications, independence, objectivity and confidentiality set forth by The Association of Professional Engineers, Geologists and Geophysicists of Alberta (APEGGA). Sproule is an independent firm of petroleum engineers, geologists, geophysicists and petrophysicists; they do not own any interest in our properties and are not employed on a contingent fee basis.
Year-end reserves quantities for the years ended August 31, 2012 and August 31, 2011 shown in the following Constant Prices and Cost tables were calculated using the unweighted arithmetic average of the first-day-of-the-month price for each month within the 12 month period prior to the end of the reporting period.
Appropriate adjustments have been made to account for quality and transportation, to the constant natural gas prices, and to the constant natural gas by-products prices to reflect historical prices received for each area. It should not be assumed that the discounted net present value estimated by Sproule represents the fair market value of the reserves. Where the present value is based on constant price and cost assumptions, there is no assurance that such price and cost assumptions will be attained and variances could be material.
The table below sets out in CDN dollars the constant prices and the exchange rate used at August 31, 2013, 2012 and 2011. As of August 31, 2012 and August 31, 2011 all of our reserves were located in Alberta, Canada.
| August 31, 2013 | | Natural Gas Alberta AECO-C Exchange Rate: | | N/A N/A |
| | | | | |
| August 31, 2012 | | Natural Gas Alberta AECO-C Exchange Rate: | | $2.57/MMbtu 0.99 $US/$ CDN |
| | | | | |
| August 31, 2011 | | Natural Gas Alberta AECO-C Exchange Rate: | | $3.77/MMbtu 1.01$ US/$ CDN |
Proved and Probable Reserve Quantity Estimates: The following table reflects estimates of our proved and probable developed reserves as at August 31, 2013, 2012, and 2011 stated in CDN dollars. All of our gas reserves were located in Canada. The following table represents our gross and net interest in reserves (after crown royalties, freehold royalties and overriding royalties and interests owned by others). Numbers may not add due to rounding.
Summary of Oil and Gas Reserves
Constant Prices and Costs |
| Remaining Reserves |
| | | Natural Gas (non-associated & associated) | |
| Reserves Category | | Gross (MMcf) | | | Net (MMcf) | |
| August 31, 2013 | | | - | | | | - | |
| Proved Developed Producing | | | - | | | | - | |
| Probable Developed Producing | | | - | | | | - | |
| Total Proved Plus Probable | | | - | | | | - | |
| August 31, 2012 | | | | | | | | |
| Proved Developed Producing | | | 116 | | | | 100 | |
| Probable Developed Producing | | | 41 | | | | 35 | |
| Total Proved Plus Probable | | | 157 | | | | 135 | |
| August 31, 2011 | | | | | | | | |
| Proved Developed Producing | | | 153 | | | | 128 | |
| Probable Developed Producing | | | 42 | | | | 34 | |
| Total Proved Plus Probable | | | 195 | | | | 161 | |
The following table represents the summary of our Net Revenue based on Constant Prices and costs before income taxes. Numbers may not add due to rounding.
Summary of Net Revenue
Constant Prices and Costs
(Undiscounted) |
| Reserves Category | | Revenue
(M$) | | | Royalties
(M$) | | | Operating
Costs
(M$) | | | Well
Abandonment
and
Reclamation
Costs (M$) | | | Net
Revenue
(M$) | |
| August 31, 2013 | | | - | | | | - | | | | - | | | | - | | | | - | |
| Proved Developed Producing | | | - | | | | - | | | | - | | | | - | | | | - | |
| Probable Developed Producing | | | - | | | | - | | | | - | | | | - | | | | - | |
| Total Proved Plus Probable | | | - | | | | - | | | | - | | | | - | | | | - | |
| August 31, 2012 | | | | | | | | | | | | | | | | | | | | |
| Proved Developed Producing | | | 263 | | | | 33 | | | | 224 | | | | 3 | | | | 3 | |
| Probable Developed Producing | | | 92 | | | | 12 | | | | 79 | | | | - | | | | 2 | |
| Total Proved Plus Probable | | | 356 | | | | 43 | | | | 303 | | | | 3 | | | | 6 | |
| August 31, 2011 | | | | | | | | | | | | | | | | | | | | |
| Proved Developed Producing | | | 599 | | | | 77 | | | | 414 | | | | 4 | | | | 103 | |
| Probable Developed Producing | | | 165 | | | | 27 | | | | 116 | | | | - | | | | 23 | |
| Total Proved Plus Probable | | | 764 | | | | 104 | | | | 530 | | | | 4 | | | | 126 | |
The following table represents the summary of our net present value of Future Net Revenue based on Constant Prices and costs before income taxes and discounted as follows. Numbers may not add due to rounding.
Summary of Net Present Values of
Future Net Revenue
Constant Prices and Costs |
| | | Net Present Values of Future Net Revenue | |
| | | Before Income Taxes Discounted at (%/Year) | |
| Reserves Category | | 0 (M$) | | | 5 (M$) | | | 10 (M$) | | | 15 (M$) | | | 20 (M$) | |
| August 31, 2013 | | | - | | | | - | | | | - | | | | - | | | | - | |
| Proved Developed Producing | | | - | | | | - | | | | - | | | | - | | | | - | |
| Probable Developed Producing | | | - | | | | - | | | | - | | | | - | | | | - | |
| Total Proved Plus Probable | | | - | | | | - | | | | - | | | | - | | | | - | |
| August 31, 2012 | | | | | | | | | | | | | | | | | | | | |
| Proved Developed Producing | | | 3 | | | | 4 | | | | 4 | | | | 3 | | | | 3 | |
| Probable Developed Producing | | | 2 | | | | 2 | | | | 2 | | | | 1 | | | | 1 | |
| Total Proved Plus Probable | | | 6 | | | | 6 | | | | 5 | | | | 5 | | | | 4 | |
| August 31, 2011 | | | | | | | | | | | | | | | | | | | | |
| Proved Developed Producing | | | 103 | | | | 86 | | | | 73 | | | | 63 | | | | 56 | |
| Probable Developed Producing | | | 23 | | | | 15 | | | | 11 | | | | 8 | | | | 7 | |
| Total Proved Plus Probable | | | 126 | | | | 101 | | | | 84 | | | | 72 | | | | 63 | |
Production Volume: The following table sets forth the net quantities of natural gas produced during the fiscal years ended August 31, 2013, 2012 and 2011.
| August 31, | | 2013 | | | 2012 | | | 2011 | |
| Natural Gas (Mcf) | | | 13,431 | | | | 19,593 | | | | 19,500 | |
Historical Production: The following table sets out our net share of production, average sales prices, average royalties, production costs and average net back per unit of production for the fiscal years ended August 31, 2013, 2012 and 2011.
| | | For the Years Ended | |
| Historical Production | | August 31, 2013 | | | August 31, 2012 | | | August 31, 2011 | |
| Natural Gas – Mcf/d | | | 37 | | | | 54 | | | | 53 | |
| Natural Gas Prices- $/Mcf | | $ | 2.15 | | | $ | 2.24 | | | $ | 3.68 | |
| Royalty Costs - $/Mcf | | | 0.62 | | | | 0.57 | | | | 0.76 | |
| Production Costs - $/Mcf | | | 0.62 | | | | 0.55 | | | | 2.68 | |
| Net Back - $/Mcf | | $ | 0.89 | | | $ | 1.16 | | | $ | 0.24 | |
Producing and Non Producing Wells: The following table sets out the number of gross and net producing oil and natural gas wells and the number of gross and net non-producing oil and natural gas wells that we have an interest in by location at August 31, 2013, 2012 and 2011. A gross well is a well in which we own an interest. A net well represents the fractional interest we own in gross wells.
| August 31 | | 2013 | | | 2012 | | | 2011 | |
| Alberta, Canada | | Gross | | | Net | | | Gross | | | Net | | | Gross | | | Net | |
| Natural Gas Wells-Producing | | | - | | | | - | | | | 3.0 | | | | .15525 | | | | 3.0 | | | | .15525 | |
| Natural Gas Wells-Non Producing | | | 9.0 | | | | .4657 | | | | 6.0 | | | | .3105 | | | | 6.0 | | | | .3105 | |
| Texas, USA | | | | | | | | | | | | | | | | | | | | | | | | |
| Oil Wells – Non Producing | | | 7 | | | | 6.6 | | | | 7 | | | | 6.6 | | | | 4.0 | | | | 3.80 | |
Acreage: The following table sets forth the developed and undeveloped acreage of the projects in which the Company holds an interest, on a gross and a net basis as of August 31, 2013, 2012 and 2011. The developed acreage is stated on the basis of spacing units designated by provincial authorities and typically on the basis of 160 acre spacing unit for oil production and 640 acre spacing unit for gas production in Alberta. Our developed acreage is located in Alberta, Canada. Our undeveloped acreage is located in Zavala County, Texas.
| August 31, | | 2013 | | | 2012 | | | 2011 | |
| | | Gross | | | Net | | | Gross | | | Net | | | Gross | | | Net | |
| Developed Acreage, Canada | | | 8,320 | | | | 432 | | | | 8,320 | | | | 432 | | | | 8,320 | | | | 432 | |
| Undeveloped Acreage, USA | | | 5,266 | | | | 4,793 | | | | 5,266 | | | | 4,793 | | | | 5,266 | | | | 4,872 | |
Additional Information Concerning Abandonment and Reclamation Costs: We base our estimates for costs of abandonment and reclamation of surface leases and wells on previous experience with similar well site locations and terrain, estimates obtained from area operators and various regulatory abandonment guidelines and requirements.
We believe that our range of estimates for abandonment and reclamation costs are reasonable and applicable to our wells. Ultimately all wells in which the Company has an interest will require abandonment and reclamation.
The Company’s abandonment and reclamation obligations result from its ownership interests in petroleum and natural gas assets including well sites, gathering systems and processing facilities. The total obligation is estimated based on the Company’s net ownership interest in 7.07 net wells. The Company has estimated the net present value of these obligations to be $119,742 at August 31, 2013 based on an undiscounted total future liability of $166,578. These payments are expected to be incurred between fiscal 2014 and 2031.
Capitalized Costs related to oil and gas activities:The following table summarizes the costs incurred in our oil and gas interests for acquisition, exploration, and development activities for the three years ended August 31, 2013, 2012 and 2011.
| Property, Plant and Equipment | | 2013 | | | 2012 | | | 2011 | |
| Net book value at September 1 | | $ | 175,000 | | | $ | 243,000 | | | $ | 314,000 | |
| Depletion | | | (10,212 | ) | | | (18,045 | ) | | | (23,136 | ) |
| Change in decommissioning obligation estimates | | | (4,166 | ) | | | 819 | | | | 1,600 | |
| Impairment | | | (168,954 | ) | | | (50,774 | ) | | | (49,464 | ) |
| Total Property, Plant and Equipment | | | - | | | | 175,000 | | | | 243,000 | |
| Exploration and Evaluation Assets | | | | | | | | | | $ | 314,000 | |
| Net book value at September 1 | | | 8,995,878 | | | | 8,995,878 | | | | 5,695,290 | |
| Additions to exploration expenditures | | | 404,818 | | | | 1,559,763 | | | | 3,262,782 | |
| Change in decommissioning obligation estimates | | | (9,268 | ) | | | 6,546 | | | | 4,332 | |
| Impairment | | | (2,690,568 | ) | | | | | | | | |
| Foreign Exchange | | | 354,809 | | | | (36,327 | ) | | | (19,167 | ) |
| Decommissioning obligations | | | - | | | | 41,243 | | | | 52,641 | |
| Units cancelled | | | - | | | | (2,091,616 | ) | | | - | |
| Acquisition of Dyami Energy | | | - | | | | - | | | | - | |
| Acquisition of oil and gas interests | | | - | | | | - | | | | - | |
| Total Exploration and Evaluation Assets | | | 6,535,278 | | | | 8,475,487 | | | | 8,995,878 | |
| Total Capitalized | | $ | 6,535,278 | | | $ | 8,650,487 | | | $ | 9,238,878 | |
As at and for the year ended August 31, 2013 we record an impairment of $2,690,568 on our Murphy Lease, Zavala County, Texas based on the amount for which management believes the assets could be sold or farmed out in an arms length transaction, less estimated costs to sell (August 31, 2012 and 2011 Nil). Included in the above additions for the year ended August 31, 2013, the Company capitalized borrowing costs interest of $240,092 to exploration and evaluation assets (August 31, 2012: $289,650, August 31, 2011: $197,690).
Present Activities, Results of Exploration and Drilling: During the fiscal year ended August 31, 2013, we drilled no exploratory wells on its leases located in Zavala County, Texas USA. To date the Company has not completed these wells.
The following table sets forth the number of Eagleford’s gross and net exploratory wells drilled in Texas, USA during the years ended August 31, 2013, 2012 and 2011. A gross well is a well in which the Company owns an interest. A net well represents the fractional interest the Company owns in gross wells
| August 31 | | 2013 | | | 2012 | | | 2011 | |
| Texas, USA | | Gross | | | Net | | | Gross | | | Net | | | Gross | | | Net | |
| Oil Wells – Non Producing | | | - | | | | - | | | | 3.0 | | | | 2.7 | | | | 4.0 | | | | 3.80 | |
Governmental Regulation/Environmental Issues: Our oil and gas operations are subject to various Canadian and US governmental regulations. Matters subject to regulation include discharge permits for drilling operations, drilling and abandonment bonds, reports concerning operations, the spacing of wells, and pooling of properties and taxation. From time to time, regulatory agencies have imposed price controls and limitations on production by restricting the rate of flow of oil and gas wells below actual production capacity in order to conserve supplies of oil and gas. The production, handling, storage, transportation and disposal of oil and gas, by-products thereof, and other substances and materials produced or used in connection with oil and gas operations are also subject to regulation under federal, state, provincial and local laws and regulations relating primarily to the protection of human health and the environment. To date, expenditures related to complying with these laws, and for remediation of existing environmental contamination, have not been significant in relation to the results of operations of our company. The requirements imposed by such laws and regulations are frequently changed and subject to interpretation, and we are unable to predict the ultimate cost of compliance with these requirements or their effect on our operations (See, Item 3.D Key Information - Risk Factors).
| ITEM 4A | UNRESOLVED STAFF COMMENTS |
Not Applicable
| ITEM 5 | OPERATING AND FINANCIAL REVIEW AND PROSPECTS |
The following discussion should be read in conjunction with our “Selected Financial Data” under Item 3 above, our Audited Consolidated Financial Statements for the fiscal years ended August 31, 2013 and 2012 and notes thereto included under Item 18. We adopted IFRS in accordance with IFRS 1 First-time Adoption of International Financial Reporting Standards (“IFRS 1”) with a transition date of September 1, 2010.
Non-IFRS Measurements –Certain measures in this Discussion and Analysis do not have any standardized meaning as prescribed by IFRS including "Operating net back" are considered Non-IFRS measures. Therefore, these measures may not be comparable to similar measures presented by other issuers. These measures are common with the oil and gas industry and have been described and presented in this Management’s Discussion and Analysis in order to provide shareholders and potential investors with additional information regarding the company's liquidity and its ability to generate funds to finance its operations. These terms are commonly used in the oil and gas industry and are therefore presented here to provide balances comparable to other oil and gas production companies.
Certain statements made in this Item are forward-looking statements under the Reform Act. Forward- looking statements are based on current expectations that involve a numbers of risks and uncertainties, which could cause actual events or results to differ materially from those reflected herein. See, Item 3.D Key Information - Risk Factors for discussion of important factors, which could cause results to differ materially from the forward-looking statements below.
Overview
Eagleford Energy Inc. is amalgamated under the laws of the Province of Ontario. We are a reporting issuer with the United States Securities and Exchange Commission and our common shares trade on the Over-the-Counter Bulletin Board (OTCBB) under the symbol EFRDF.
Our business focus consists of acquiring, exploring and developing oil and gas interests. The recoverability of the amount shown for these properties is dependent upon the existence of economically recoverable reserves, the ability of the Company to obtain the necessary financing to complete exploration and development, and future profitable production or proceeds from disposition of such property.Our oil and gas interests are locatedin Alberta, Canada and Zavala County, Texas. We also holds a 0.3% net smelter return royalty on eight mining claims located in Red Lake Ontario which is carried on the Consolidated Statements of Financial Position at $Nil.We completed a 2-for-1 forward stock split, pursuant to which one (1) newly-issued share of the Company’s common stock was issued to each holder of a share of common stock as of the close of business on March 16, 2012.
Our Audited Consolidated Financial Statements for the year ended August 31, 2013 include the accounts of the Company, and our wholly owned subsidiaries 1354166 Alberta Ltd., Dyami Energy LLC and Eagleford Energy, Zavala Inc., effective August 29, 2013.
Capital Management
Our objectives when managing capital are to ensure we will have sufficient financial capacity, liquidity and flexibility to funds our operations, growth and ongoing exploration and development commitments on our oil and gas interests. We are dependent on funding these activities through debt and equity financings. Due to long lead cycles of our exploration activities, our capital requirements currently exceed our operational cash flow generated. As such we are dependent upon future financings in order to maintain its flexibility and liquidity and may from time to time be required to issue equity, issue debt, adjust capital spending or seek joint venture partners.
We manage the capital structure and make adjustments to it in light of changes in economic conditions and the risk characteristics of any underlying assets in order to meet current and upcoming obligations. Current plans for the development commitments of our Texas leases include debt or equity financing or seeking and obtaining a joint venture partner.
The board of directors does not establish quantitative return on capital criteria for management, but rather relies on the expertise of our management and favorable market conditions to sustain future development of the business.
As at August 31, 2013 and August 31, 2012 we considered our capital structure to comprise of shareholders equity and long-term debt.
Management reviews our capital management approach on an ongoing basis and believes that this approach, given the relative size of us, is reasonable.
There were no changes in our capital management during the year ended August 31, 2013.
We are not subject to any externally imposed restrictions on our capital requirements.
SUMMARY OF SIGNIFICANT ACCOUNTING POLICIES AND FUTURE ACCOUNTING PRONOUNCEMENTS
Our consolidated financial statements for the years ended August 31, 2013 and 2012 have been prepared in accordance with International Financial Reporting Standards (“IFRS”), as issued by the International Accounting Standards Board (“IASB”) (See Item 18– Financial Statements). We adopted IFRS in accordance with IFRS 1 First-time Adoption of International Financial Reporting Standards (“IFRS 1”) with a transition date of September 1, 2010.
Going Concern
These consolidated financial statements have been prepared on a going concern basis which contemplates the realization of assets and the payment of liabilities in the ordinary course of business. The Company plans to obtain additional financing by way of debt or the issuance of common shares or some other means to service its current working capital requirements, any additional or unforeseen obligations or to implement any future opportunities. Should the Company be unable to continue as a going concern, it may be unable to realize the carrying value of its assets and to meet its liabilities as they become due. These consolidated financial statements do not include any adjustments for this uncertainty.
The Company has accumulated significant losses and negative cash flows from operations in recent years which raise doubt as to the validity of the going concern assumption. At August 31, 2013, the Company had a working capital deficiency of $4,985,312 (August 31, 2012 $3,819,056) and an accumulated deficit of $9,212,561 (August 31, 2012 $4,946,515). The Company does not have sufficient funds to meet its liabilities for the ensuing twelve months as they fall due. In assessing whether the going concern assumption is appropriate, management takes into account all available information about the future, which is at least, but not limited to, twelve months from the end of the reporting period. The Company's ability to continue operations and fund its liabilities is dependent on its ability to secure additional financing and cash flow. During the year ended August 31, 2013 the Company extinguished $544,239 of debt through the issuance of share capital in the Company. In addition, the Company raised net proceeds of $405,650 through the issuance of share capital. Management is pursuing such additional sources of financing and cash flow to fund its operations and while it has been successful in doing so in the past, there can be no assurance it will be able to do so in the future. Management is aware, in making its assessment, of material uncertainties related to events or conditions that may cast significant doubt upon the Company's ability to continue as a going concern. Accordingly, they do not give effect to adjustments that would be necessary should the Company be unable to continue as a going concern and therefore realize its assets and liquidate its liabilities and commitments in other than the normal course of business and at amounts different from those in the accompanying consolidated financial statements.
BASIS OF PREPARATION
Statement of Compliance
These consolidated financial statements have been prepared in accordance with International Financial Reporting Standards (“IFRS”) as issued by the International Accounting Standards Board (“IASB”).
The consolidated financial statements of the Company were approved by the Board of Directors on December 19, 2013.
Basis of Preparation
These consolidated financial statements have been prepared in accordance with IFRS as issued by the International Accounting Standards Board (the “IASB”) which is incorporated in the Chartered Professional Accountants of Canada (“CPA Canada”) Handbook-Accounting.
The accounting policies applied in these consolidated financial statements are based on IFRS effective for the period ended August 31, 2013, as issued and outstanding as of the date the Board of Directors approved the consolidated financial statements.
Principles of Consolidation
Subsidiaries are all entities (including special purpose entities) controlled by the Company. Control exists when the Company has the power to govern the financial and operating policies of an entity so as to obtain benefits from its activities. In assessing control, potential voting rights that currently are exercisable are taken into account. The financial statements of subsidiaries are included in the consolidated financial statements from the date that control commences until the date that control ceases.
The consolidated financial statements include the accounts of Eagleford, the legal parent, together with its wholly-owned subsidiaries, 1354166 Alberta Ltd. an Alberta operating company (“1354166 Alberta”), Dyami Energy LLC a Texas limited liability company (“Dyami Energy”) and Eagleford Energy, Zavala Inc. a Nevada company (“Zavala Inc.”) effective August 29, 2013. All Intercompany balances and transactions have been eliminated on consolidation.
SUMMARY OF SIGNIFICANT ACCOUNTING POLICIES
The accounting policies set out below have been applied consistently to all years presented in these consolidated financial statements and have been applied consistently by the Company and its subsidiaries.
Cash
Cash includes banks balances.
Revenue Recognition
Revenues from the production of oil and gas properties in which the Company has an interest are recognized, on the basis of the Company’s working interest in those properties, when the significant risks and rewards of ownership of the product is transferred to the buyer, which is usually when legal title passes to an external party.
Foreign Currencies
The functional and presentation currency of the Company is the Canadian dollar. The functional currency of the Company’s wholly-owned Alberta subsidiary, 1354166 Alberta is Canadian dollars and the functional currency of the Company’s wholly-owned Texas subsidiary, Dyami Energy and the Company’s wholly-owned Nevada subsidiary, Zavala Inc., is United States dollars.
Items included in the consolidated financial statements of each entity are measured using the currency of the primary economic environment in which the entity operates (the "functional currency"). Foreign currency transactions are translated into the functional currency using the exchange rates prevailing at the dates of the transaction. Foreign exchange gains and losses resulting from the settlement of such transactions and from the translation of monetary assets and liabilities not denominated in the functional currency of an entity are recognized in the consolidated statements of operations.
Assets and liabilities of entities with functional currencies other than Canadian dollars are translated at the period end rates of exchange, and the results of their operations are translated at average rates of exchange for the period. The resulting translation adjustments are included in the foreign currency translation reserve under the equity section of the consolidated statement of financial position. Additionally, foreign exchange gains and losses related to certain intercompany loans that are permanent in nature are also included in the foreign currency translation reserve.
Loss per Share
The basic loss per share is calculated by dividing net loss by the weighted average number of common shares outstanding during the period. The diluted loss per share reflects the dilution that would occur if outstanding stock options and share purchase warrants were exercised or converted into common shares using the treasury stock method and are calculated by dividing net loss applicable to common shares by the sum of the weighted average number of common shares outstanding and all additional common shares that would have been outstanding if potentially dilutive common shares had been issued.
The inclusion of the Company’s stock options and share purchase warrants in the computation of diluted loss per share would have an anti-dilutive effect on loss per share and are therefore excluded from the computation.
Marketable Securities
At each financial reporting period, the Company estimates the fair value of investments which are held-for-trading, based on quoted closing bid prices at the consolidated statements of financial position date or the closing bid price on the last day the security traded if there were no trades at the consolidated statements of financial position date and such valuations are reflected in the consolidated financial statements. The resulting values for unlisted securities whether of public or private issuers, may not be reflective of the proceeds that could be realized by the Company upon their disposition. The fair value of the securities at August 31, 2013 was written down to Nil (August 31, 2012 - $1) (see Note 6 to the consolidated financial statements).
Financial Instruments
Classification and Measurement
Financial instruments are measured at fair value on initial recognition of the instrument. Measurement in subsequent periods depends on whether the financial instrument has been classified as “fair value through profit and loss”, “loans and receivables”, “available-for-sale”, “held-to-maturity”, or “other financial liability” as defined by IAS 39, “Financial Instruments: Recognition and Measurement”.
Financial assets and financial liabilities at “fair value through profit or loss” are either classified as “held for trading” or “designated at fair value through profit or loss” and are measured at fair value with changes in fair value recognized in the statement of comprehensive income. Transaction costs are expensed when incurred. The Company has classified cash, marketable securities and derivative warrant liabilities as “fair value through profit and loss”.
Financial instruments classified as “loans and receivables”, “held-to-maturity”, or “financial liabilities” are measured at amortized cost using the effective interest method of amortization. “Loans and receivables” are non-derivative financial assets with fixed or determinable payments that are not quoted in an active market. “Held-to-maturity” financial assets are non-derivative investments that an entity has the positive intention and ability to hold to maturity.
“Other financial liabilities measured at amortized cost” are those financial liabilities that are not designated as “fair value through profit or loss” and that are not derivatives. The Company has classified trade and other receivables as “loans and receivables” and trade and other payables, secured notes payable, loans payable, provisions and shareholders’ loans as “other financial liabilities”.
Financial assets classified as “available-for-sale” are measured at fair value, with changes in fair value recognized in other comprehensive income. Available-for-sale financial assets are non-derivatives that are either designated in this category or not classified in any of the other categories. The Company currently has no assets classified as “available for sale”.
Derivative Financial Instruments
The Company’s derivative instruments consist of derivative liabilities in relation to its share purchase warrants. In prior years the Company had issued share purchase warrants in conjunction with offerings for the purchase of common shares of the Company. These share purchase warrants were issued with an exercise price in US dollars, rather than Canadian dollars (the presentation and functional currency of the Company). Such share purchase warrants are considered to be derivative instruments and the Company is required to re-measure the fair value of these at each reporting date. The fair value of these share purchase warrants are re-measured at each statement of financial position date using the Black Scholes model. Adjustments to the fair value of the share purchase warrants at the financial position date are recorded to the statement of operations.
Property and Equipment and Exploration and Evaluation Assets
Exploration and Evaluation Assets (“E&E”)
Pre-acquisition expenditures on oil and gas assets are recognized as an expense in the consolidated statements of operations when incurred. In accordance with IFRS 6, exploration and evaluation costs are capitalized within intangible assets until the success or otherwise of the well or project has been established and subject to an impairment review. The costs of unsuccessful wells in an area are written off to statement of operations.
Exploration and evaluation costs, including the costs of acquiring licenses and directly attributable general and administrative costs, initially are capitalized either as tangible or intangible E&E assets according to the nature of the assets acquired. The costs are accumulated in cost centers by well, field or exploration area pending determination of technical feasibility and commercial viability.
When E&E assets are determined to be technically feasible and commercially viable, the accumulated costs are transferred to property and equipment. When E&E assets are determined not to be technically feasible and commercially viable or the Company decides not to continue with its activity, the unrecoverable costs are charged to statement of operations as exploration and evaluation expense.
E&E assets are assessed for impairment in any circumstances where sufficient data exists to determine technical feasibility and commercial viability, and facts and circumstances suggest that the carrying amount exceeds the recoverable amount. For purposes of impairment testing, E&E assets are allocated to cash-generating units (“CGUs”).
Development and Production Costs
Items of property and equipment, which include petroleum and natural gas development and production assets, are measured at cost less accumulated depletion and depreciation and accumulated impairment losses. Development and production assets are grouped into CGUs for impairment testing.
When significant parts of an item of property and equipment, including petroleum and natural gas interests, have different useful lives, they are accounted for as separate items (major components).
Gains and losses on disposal of an item of property and equipment, including petroleum and natural gas interests, are determined by comparing the proceeds from disposal with the carrying amount of property and equipment and are recognized in profit or loss.
Subsequent Costs
Costs incurred subsequent to the determination of technical feasibility and commercial viability and the costs of replacing parts of property and equipment are recognized as exploration and evaluation assets only when they increase the future economic benefits embodied in the specific asset to which they relate. All other expenditures are recognized in profit or loss as incurred. Such capitalized exploration and evaluation assets generally represent costs incurred in developing proved and/or probable reserves and bringing in or enhancing production from such reserves, and are accumulated on a field or geotechnical area basis. The carrying amount of any replaced or sold component is derecognized. The costs of the day-to-day servicing of property and equipment are recognized in profit or loss as incurred.
Depletion and Depreciation
The net carrying value of development or production assets is depleted using the units-of-production method by reference to the ratio of production in the period to the related proved plus probable reserves, taking into account estimated future development costs necessary to bring those reserves into production. Future development costs are estimated taking into account the level of development required to produce the reserves. These estimates are reviewed by independent reserve engineers at least annually for developed properties.
Proved and probable reserves are estimated using independent reserve engineer reports for developed properties only and represent the estimated quantities of crude oil, natural gas and natural gas liquids which geological, geophysical and engineering data demonstrate with a specified degree of certainty to be recoverable in future years from known reservoirs and which are considered commercially producible.
Reserves may be considered commercially producible if management has the intention of developing and producing them and such intention is based upon:
| • | a reasonable assessment of the future economic benefit of such production; |
| • | a reasonable expectation that there is a market for all or substantially all the expected oil and natural gas production; and |
| • | evidence that the necessary production, transmission and transportation facilities are available or can be made available. |
Reserves may only be considered proved and probable if they are supported by either actual production or conclusive formation tests. The area of reservoir considered proved includes: (a) that portion delineated by drilling and defined by gas-oil and/or oil-water contacts, if any, or both; and (b) the immediately adjoining portions not yet drilled, but which can be reasonably judged as economically productive on the basis of available geophysical, geological and engineering data. In the absence of information on fluid contacts, the lowest known structural occurrence of oil and natural gas controls the lower proved limit of the reservoir.
Depreciation methods, useful lives and residual values are reviewed at each reporting date.
Impairment
Financial Assets
A financial asset is assessed at each reporting date to determine whether there is any objective evidence that it is impaired. A financial asset is considered to be impaired if objective evidence indicates that one or more events have had a negative effect on the estimated future cash flows of that asset.
An impairment loss in respect of a financial asset measured at amortized cost is calculated as the difference between its carrying amount and the present value of the estimated future cash flows discounted at the original effective interest rate.
Individually significant financial assets are tested for impairment on an individual basis. Remaining financial assets are assessed collectively in groups that share similar credit risk characteristics.
All impairment losses are recognized in the profit or loss.
An impairment loss is reversed if the reversal can be related objectively to an event occurring after the impairment loss was recognized. For financial assets measured at amortized cost the reversal is recognized in profit or loss.
Non-financial Assets
The carrying amounts of the Company’s non-financial assets, other than E&E assets are reviewed at each reporting date to determine whether there is any indication of impairment. If any such indication exists, the asset’s recoverable amount is estimated. E&E assets are assessed for impairment when they are reclassified to property and equipment as petroleum and natural gas interests, and also if facts and circumstances suggest that their carrying amount exceeds the recoverable amount.
For the purpose of impairment testing, assets are grouped together into the smallest group of assets that generate cash inflows from continuing use that are largely independent of the cash inflows of other assets or groups of assets (the “cash-generating unit” or “CGU”). The recoverable amount of an asset or a CGU is the greater of its value in use and its fair value less costs to sell.
In assessing value in use, the estimated future cash flows are discounted to their present value using a pre-tax discount rate that reflects current market assessments of the time value of money and the risks specific to the asset. Value in use is generally computed by reference to the present value of the future cash flows expected to be derived from production of proved and probable reserves.
E&E assets are allocated to related CGUs when they are assessed for impairment, both at the time of any triggering facts and circumstances as well as upon their eventual reclassification to producing assets (petroleum and natural gas interests in property and equipment).
An impairment loss is recognized if the carrying amount of an asset or its CGU exceeds its estimated recoverable amount. Impairment losses are recognized in profit or loss. Impairment losses recognized in respect of CGUs are allocated first to reduce the carrying amount of any goodwill allocated to the units and then to reduce the carrying amounts of the other assets in the unit (group of units) on a pro rata basis.
In respect of assets other than goodwill, impairment losses recognized in prior years are assessed at each reporting date for any indications that the loss has decreased or no longer exists. An impairment loss is reversed if there has been a change in the estimates used to determine the recoverable amount. An impairment loss is reversed only to the extent that the asset’s carrying amount does not exceed the carrying amount that would have been determined, net of depletion and depreciation or amortization, if no impairment loss had been recognized.
Provisions
A provision is recognized if, as a result of a past event, the Company has a present legal or constructive obligation that can be estimated reliably, and it is probable that an outflow of economic benefits will be required to settle the obligation.
Provisions are determined by discounting the expected future cash flows at a pre-tax rate that reflects current market assessments of the time value of money and the risks specific to the liability. Provisions are not recognized for future operating losses.
Decommissioning Obligations
The Company’s activities give rise to dismantling, decommissioning and site disturbance remediation activities. Provision is made for the estimated cost of site restoration and capitalized in the relevant asset category.
Decommissioning obligations are measured at the present value of management’s best estimate of the expenditure required to settle the present obligation at the period-end date. Subsequent to initial measurement, the obligation is adjusted at the end of each period to reflect the passage of time and changes in the estimated future cash flows underlying the obligation. The increase in the provision due to the passage of time is recognized as finance costs whereas increases/decreases due to changes in the estimated future cash flows and changes to discount rate are capitalized. Actual costs incurred upon settlement of the decommissioning obligations are charged against the provision to the extent the provision was established.
Borrowing Costs
Borrowing costs incurred for the construction of qualifying assets are capitalized during the period of time that is required to complete and prepare the assets for their intended use or sale. All other borrowing costs are recognized in profit or loss using the effective interest method. Interest income is recognized as it accrues in profit or loss, using the effective interest method.
Taxes
Tax expense comprises current and deferred tax. Tax is recognized in the consolidated statements of operations except to the extent it relates to items recognized in other comprehensive income or directly in equity.
Current Income tax
Current tax expense is based on the results for the year as adjusted for items that are not taxable or not deductible. Current tax is calculated using tax rates and laws that were enacted or substantively enacted at the end of the reporting period. Management periodically evaluates positions taken in tax returns with respect to situations in which applicable tax regulation is subject to interpretation. Provisions are established where appropriate on the basis of amounts expected to be paid to the tax authorities.
Deferred tax
Deferred tax assets and liabilities are recognized for the future income tax consequences attributable to differences between the financial statement carrying amounts of existing assets and liabilities and their respective tax bases. Deferred tax assets and liabilities are measured using enacted or substantively enacted tax rates expected to apply to taxable income in the years in which these temporary differences are expected to be recovered or settled. Deferred tax assets and liabilities are offset if there is a legally enforceable right to offset current tax liabilities and asset and they relate to the income taxes levied by the same authority on the same taxable entity, or on different tax entities where these entities intend to settle current tax liabilities and asset on a net basis or their tax assets and liabilities will be realized simultaneously.
Deferred tax assets and liabilities are not recognized in respect of temporary differences that arise on initial recognition of assets and liabilities acquired other than in a business combination.
Share-Based Compensation
The Company has a share-based compensation plan that grants stock options to employees and non-employees. This plan is an equity settled plan. The company uses the fair value method for accounting for stock-based awards to employees and non-employees.
The fair value determined at the grant date of the equity-settled share-based payments is expensed on a straight-line basis over the vesting period, based on the Company’s estimate of equity instruments that will eventually vest. At the end of each reporting period, the Company revises its estimate of the number of equity instruments expected to vest. The impact of the revision of the original estimates, if any, is recognized in profit or loss such that the cumulative expense reflects the revised estimate, with a corresponding adjustment to contributed surplus.
Equity-settled share-based payment transactions with parties other than employees are measured at the fair value of the goods or services received, except where that fair value cannot be estimated reliably, in which case they are measured at the fair value of the equity instruments granted, measured at the date the Company obtains the goods or the counterparty renders the service.
Warrants
When the Company issues units comprising common shares and warrants, the Company follows the relative fair value method of accounting for warrants attached to and issued with common shares of the Company. Under this method, the fair value of warrants issued is estimated using a Black-Scholes option price model. The fair value is then related to the total of the net proceeds received on issuance of the common shares and the fair value of the warrants issued therewith. The resultant relative fair value is allocated to warrants from the net proceeds and the balance of the net proceeds is allocated to the common shares issued.
Critical Accounting Estimates and Judgments
The timely preparation of the consolidated financial statements in accordance with IFRS requires that management make estimates and assumptions and use judgment regarding the measured amounts of assets, liabilities and contingent liabilities at the date of the consolidated financial statements and reported amounts of revenue and expenses during the reporting period. Such estimates and judgments are continuously evaluated and are based on management’s experience and other factors, including expectations of future events that are believed to be reasonable under the circumstances. Actual outcomes may differ from these estimates.
The key sources of estimation uncertainty that have a significant risk of causing material adjustment to the amounts recognized in the consolidated financial statements are:
Valuation and classification of exploration and evaluation assets
The value of exploration and evaluation assets are dependent upon the discovery of economically recoverable reserves which in turn is dependent on future oil and natural gas prices, future capital expenditures and environmental and regulatory restrictions. The decision to transfer exploration and evaluation assets to property and equipment is based upon management’s determination of an area’s technical feasibility and commercial viability based on proved and/or probable reserve estimates.
Stock Based Compensation
The Company measures the cost of equity-settled transactions to the relative fair value of the equity instruments at the date at which they are issued. Estimating relative fair value for share-based payment transactions requires determining the most appropriate valuation model, which is dependent on the terms and conditions of the instrument. This estimate also requires determining and making assumptions about the most appropriate inputs to the valuation model including the expected life, volatility, discount rates and dividend yield.
Decommissioning Liabilities
Decommissioning liabilities consist of asset retirement obligations that are based, in part, on estimates of future costs to settle the obligation, in addition to estimates of the useful life of the underlying assets, the rate of inflation and the risk-free discount rate.
Fair Value of Financial Instruments
The estimated fair value of financial assets and liabilities, by their very nature, are subject to measurement uncertainty.
Assessment of Commercial Reserves
Management is required to assess the level of the Company’s commercial reserves together with the future expenditures to access those reserves, which are utilized in determining the depletion charge for the period, assessing whether any impairment charge is required against producing and developed, and the determination of the deferred tax liability. By their nature, these estimates of discovered proved and probable crude oil and natural gas reserves, including the estimates of future prices, costs, related future cash flows and the selection of a pre-tax risked discount rate relevant to the asset in question are subject to measurement uncertainty.
The Company employs an independent reserves evaluator who periodically assesses the Company’s level of commercial reserves by reference to data sets including geological, geophysical and engineering data together with reports, presentation and financial information pertaining to the contractual and fiscal terms applicable to the Company’s assets. Significant judgment is involved when determining whether there have been any significant changes in the Company’s reserves.
Income taxes
Income taxes liability is estimated for the Company, including an assessment of temporary differences. Any temporary differences will generally result in the recognition of deferred tax assets and liabilities in the financial statements. Management’s judgment is required in the calculation of current and deferred taxes, as well as the likelihood of realization.
Provisions
Considerable judgment is used in measuring and recognizing provisions and the exposure to contingent liabilities. Judgment is necessary to determine the likelihood that a pending litigation or other claim will succeed, or a liability will arise and to quantify the possible range of the final settlement.
Significant changes in the assumptions, including those with respect to future business plan and cash flows, could materially change the recorded carrying amounts.
RECENT ACCOUNTING PRONOUNCEMENTS
The following are new IFRS pronouncements that have been issued, although not yet effective and have not been early adopted, and may have an impact on the Company in the future as discussed below.
IFRS 7, “Financial Instruments”: Disclosures”, which requires disclosure of both gross and net information about financial instruments eligible for offset in the statement of financial position and financial instruments subject to master netting agreements. Concurrent with the amendments to IFRS 7, the IASB also amended IAS 32, “Financial Instruments: Presentation” to clarify the exiting requirements for offsetting financial instruments in the statement of financial position. The amendments to IAS 32 are effective as of January 1, 2014. The Company does not expect it to have a significant impact on its consolidated financial statements.
IFRS 10, “Consolidated Financial Statements” replaces the consolidation requirements of SIC-12 Consolidation Special Purpose Entities and IAS 27 “Consolidated Separate Financial Statements”. It introduces a new principle-based definition of control, applicable to all investees to determine the scope of consolidation. The standard provides the framework for consolidated financial statements and their preparation based on the principle of control. This new standard is effective for the Company’s Interim and Consolidated financial statements commencing September 1, 2013. The Company does not expect it to have a significant impact on its consolidated financial statements.
IFRS 11 “Joint Arrangements” which replaces IAS 31, “Interests in Joint Ventures”. IFRS 11 divides joint arrangements into two types, each having its own accounting model. A “joint operation” continues to be accounted for using proportionate consolidation, whereas a “joint venture” must be accounted for using equity accounting. This differs from IAS 31, where there was the choice to use proportionate consolidation or equity accounting for joint ventures. A “joint operation” is defined as the joint operators having rights to the assets, and obligations for the liabilities, relating to the arrangement. In a “joint venture”, the joint ventures partners have rights to the net assets of the arrangement, typically through their investment in a separate joint venture entity. This new standard is effective for the Company’s Interim and Consolidated financial statements commencing September 1, 2013. The Company does not expect it to have a significant impact on its consolidated financial statements.
IFRS 12 “Disclosure of Interests in Other Entities” is a new standard, which combines all of the disclosure requirements for subsidiaries, associates and joint arrangements, as well as unconsolidated structured entities. This new standard is effective for the Company’s Interim and Consolidated financial statements commencing September 1, 2013. The Company does not expect it to have a significant impact on its consolidated financial statements.
IFRS 13 “Fair Value Measurement” replaces the fair value guidance contained in individual IFRS with a single source of fair value measurement guidance. The standard also requires disclosures which enable users to assess the methods and inputs used to develop fair value measurements. This new standard is effective for the Company’s Interim and Consolidated financial statements commencing September 1, 2013. The Company does not expect it to have a significant impact on its consolidated financial statements.
IAS 1 “Presentation of Financial Statements” was amended by the IASB in order to align the presentation of items in comprehensive income with US GAAP standards. Items in other comprehensive income will be required to be presented in two categories: items that will be reclassified into profit or loss and those that will not be reclassified. The flexibility to present a statement of comprehensive income remains unchanged. The amendments to IAS 1 are effective for annual periods beginning on or after July 1, 2012. This new standard is effective for the Company’s Interim and Consolidated financial statements commencing September 1, 2013. The Company does not expect it to have a significant impact on its consolidated financial statements.
IAS 27 “Separate Financial Statements”. In May 2011, the IASB amended IAS 27, Separate Financial Statements (“IAS 27”). This amendment removes the requirements for consolidated statements from IAS 27, and moves it over to IFRS 10 “Consolidated Financial Statements”. The amendment mandates that when a company prepares separate financial statements, investment in subsidiaries, associates, and jointly controlled entities are to be accounted for using either the cost method or in accordance with IFRS 9 “Financial Instruments”. In addition, this amendment determines the treatment for recognizing dividends, the treatment of certain group reorganizations, and some disclosure requirements. This amendment is effective for the Company’s interim and annual consolidated financial statements commencing September 1, 2013. The Company is assessing the impact of this amended standard on its consolidated financial statements.
IAS 28 “Investments in Associates and Joint Ventures”. In May 2011, the IASB amended IAS 28, investments in Associates and Joint Ventures (“IAS 28”). This amendment requires any retained portion of an investment in an associate or joint venture that has not been classified as held for sale to be measured using the equity method until disposal. After disposal, if the retained interest continues to be an associate or joint venture, the amendment requires for it to be continued to be accounted for under the equity method. The amendment also disallows the re measurement of any retained interest in an investment upon the cessation of significant influence or joint control. This amended standard is effective for the Company’s interim and annual consolidated financial statements commencing September 1, 2013. The Company is assessing the impact of this amended standard on its consolidated financial statements.
IAS 32 “Financial Instruments: Presentation” In December 2011, the IASB issued an amendment to clarify the meaning of the offsetting criterion and the principle behind net settlement, including identifying when some gross settlement systems may be considered equivalent to net settlement. This amendment is effective for the Company’s interim and annual consolidated financial statements commencing September 1, 2014. Earlier application is permitted when applied with corresponding amendment to IFRS 7.
IAS 36 “Impairment of Assets” In May 2013, the IASB issued an amendment to address the disclosure of information about the recoverable amount of the impaired assets if that amount is based on fair value less costs of disposal. This amendment is effective for the Company’s interim and annual consolidated financial statements commencing September 1, 2014. The Company is assessing the impact of this amended standard on its consolidated financial statements.
IAS 39 “Financial Instruments: Recognition and Measurement” In June 2013, the IASB issued a narrow scope amendment to IAS 39. Under the amendment, there would be no need to discontinue hedge accounting if a hedging derivative was novated, provided that certain criteria are met. This amendment is effective for the Company’s interim and annual consolidated financial statements commencing September 1, 2014. The Company is assessing the impact of this amended standard on its consolidated financial statements.
IFRAC 21 “levies” Issued in May 2013, this interpretation provides guidance on when to recognize a liability for a levy imposed by a government, both for levies that are accounted for in accordance with IAS 37Provisions, Contingent Liabilities and Contingent Assetsand those where the timing and amount of the levy is certain. This is effective for the Company’s interim and annual consolidated financial statements commencing September 1, 2014. The Company is assessing the impact of this amended standard on its consolidated financial statements.
IFRS 9 “Financial Instruments”. In October 2010, the IASB issued IFRS 9, Financial Instruments (“IFRS 9”). IFRS 9, which replaces IAS 39, Financial Instruments: Recognition and Measurement, establishes principles for the financial reporting of financial assets and financial liabilities that will present relevant and useful information to users of financial statements for their assessment of the amounts, timing and uncertainty of an entity’s future cash flows. This new standard is effective for the Company’s interim and annual consolidated financial statements commencing September 1, 2015. The Company is assessing the impact of this new standard on its consolidated financial statements.
Segmented Information
The Company’s reportable and geographical segments are Canada and the United States. The accounting policies used for the reportable segments are the same as the Company’s accounting policies.
For the purposes of monitoring segment performance and allocating resources between segments, the Company’s executive officer monitors the tangible, intangible and financial assets attributable to each segment.
All assets are allocated to reportable segments. The following tables show information regarding the Company’s reportable segments.
| For the year ended August 31, 2013 | | Canada | | | United States | | | Total | |
| Net revenue | | $ | 30,062 | | | | - | | | $ | 30,062 | |
| Net loss | | $ | (4,123,966 | ) | | | (142,080 | ) | | $ | (4,266,046 | ) |
| For the year ended August 31, 2012 | | | | | | | | | |
| Net revenue | | $ | 39,218 | | | | - | | | $ | 39,218 | |
| Net loss | | $ | (2,588,298 | ) | | | (220,890 | ) | | $ | (2,809,188 | ) |
| For the year ended August 31, 2011 | | | | | | | | | |
| Net revenue | | $ | 56,916 | | | | - | | | $ | 56,916 | |
| Net loss | | $ | (371,361 | ) | | | (59,566 | ) | | $ | (430,927 | ) |
| As at August 31, 2013 | | | | | | | | | |
| Total Assets | | $ | 3,914,928 | | | | 3,003,268 | | | $ | 6,918,196 | |
| Total Liabilities | | $ | 6,029,577 | | | | 746,475 | | | $ | 6,776,052 | |
| As at August 31, 2012 | | | | | | | | | |
| Total Assets | | $ | 3,983,791 | | | | 5,014,225 | | | $ | 8,998,016 | |
| Total Liabilities | | $ | 5,478,773 | | | | 568,890 | | | $ | 6,047,663 | |
Other Information
Additional information relating to us may be obtained or viewed from the System for Electronic Data Analysis and Retrieval at www.sedar.com and our future United States Securities and Exchange Commission filings can be viewed through the Electronic Data Gathering Analysis and Retrieval System (EDGAR) atwww.sec.gov.
SHARE CAPITAL AND RESERVES
On March 16, 2012, the Company completed a 2-for-1 stock split, pursuant to which one (1) newly-issued share of the Company’s common stock was issued to each holder of a share of common stock as of the close of business. The forward stock split has been applied retrospectively for all periods presented.
Authorized:
Unlimited number of common shares of no par value
Unlimited non-participating, non-dividend paying, voting redeemable preference shares
Issued:
The following table sets out the changes in common shares during the respective periods:
| Common Shares | | Number* | | | Amount | |
| Balance August 31, 2011 | | | 67,122,743 | | | $ | 4,635,556 | |
| Debt settlement (note a) | | | 3,107,006 | | | | 395,589 | |
| Debt settlement (note b) | | | 6,000,000 | | | | 522,856 | |
| Debt settlement (note c) | | | 11,150,000 | | | | 627,511 | |
| Private placement (note d) | | | 2,000,000 | | | | 32,459 | |
| Private placement (note e) | | | 3,750,000 | | | | 342,786 | |
| Private placement (note f) | | | 6,825,000 | | | | 702,528 | |
| Debt settlement (note g) | | | 171,386 | | | | 44,547 | |
| Cancelled (note h) | | | (3,418,468 | ) | | | (1,397,199 | ) |
| Balance August 31, 2012 | | | 96,707,667 | | | | 5,906,633 | |
| Private Placement of units( note i) | | | 2,249,790 | | | | 197,214 | |
| Debt settlement (note j) | | | 23,662,569 | | | | 946,503 | |
| Balance August 31, 2013 | | | 122,620,026 | | | $ | 7,050,350 | |
* Reflects the March 16, 2012 two-for-one stock split
The following table sets out the changes in warrants during the respective periods:
| | | August 31, 2013 | | | August 31, 2012 | |
| Warrants | | Number
of Warrants* | | | Weighted
Average Price* | | | Number
of Warrants* | | | Weighted
Average Price* | |
| Outstanding, beginning of year | | | 40,200,948 | | | $ | 0.04 | | | | 21,050,948 | | | $ | 0.04 | |
| Debt settlement (note b) | | | - | | | | - | | | | 6,000,000 | | | $ | 0.05 | |
| Debt settlement (note c) | | | - | | | | - | | | | 11,150,000 | | | $ | 0.05 | |
| Private placement (note d) | | | - | | | | - | | | | 2,000,000 | | | $ | 0.05 | |
| Balance, end of year | | | 40,200,948 | | | $ | 0.04 | | | | 40,200,948 | | | $ | 0.04 | |
* Reflects the March 16, 2012 two-for-one stock split
(a) During the year ended August 31, 2012, the Company issued 3,107,006 common shares as full settlement of interest due on shareholders’ loans in the amount of $325,903. The amount allocated to common shares based on fair value was $395,589 and $69,686 was recorded as a loss on settlement of debt in the statement of operations and comprehensive loss.
(b) On January 24, 2012, the Company converted shareholders’ loans in the aggregate amount of $300,000 through the issuance of a total of 6,000,000 units in the capital of the Company at a price of $0.05 per unit. Each unit is comprised of one (1) common share and one (1) purchase warrant exercisable until January 24, 2015 to purchase one (1) additional common share of the Company at a purchase price of $0.05 per share. The fair value of the common shares issued on the settlement date was $522,856 and the amount allocated to warrants based on relative fair value using the Black Scholes model was $507,038 and $729,894 was recorded as a loss on settlement of debt.
(c) On February 17, 2012, the Company converted debt and shareholders’ loans in the aggregate amount of $557,500 through the issuance of a total of 11,150,000 units in the capital of the Company at a price of $0.05 per unit. Each unit is comprised of one (1) common share and one (1) purchase warrant exercisable until February 17, 2015 to purchase one (1) additional common share of the Company at a purchase price of $0.05 per share. The fair value of the common shares issued on the settlement date was $627,511 and the amount allocated to warrants based on relative fair value using the Black Scholes model was $595,310 and $665,321 was recorded as a loss on settlement of debt.
(d) On February 17, 2012, the Company completed a non-brokered private placement of a total of 2,000,000 units in the capital of the Company at a price of $0.05 per unit for net proceeds of $100,000. Each unit is comprised of one (1) common share and one (1) purchase warrant exercisable until February 17, 2015 to purchase one (1) additional common share of the Company at a purchase price of $0.05 per share. The amount allocated to warrants based on relative fair value using the Black Scholes model was $67,541.
(e) On April 13, 2012, the Company completed private placements for gross proceeds of $748,425 of equity capital from arm’s length private placement funding through the issuance of 3,000,000 units at a price of US$0.25 per unit. Each unit is comprised of one common share and one-half a common share purchase warrant, with each whole warrant entitling the holder to acquire one common share of the Company at US$0.50 for a period of three years from the date of issuance. The amount allocated to derivative warrant liabilities for warrants based on fair value using the Black Scholes model was $282,604. In connection with the private placement, the Company paid cash commissions and other expenses of $45,030 and issued an aggregate of 240,000 broker warrants. Each broker warrant entitles the holder to acquire one common share of the Company at an exercise price of US$0.25 for a period of three years from the date of issuance. The amount allocated to derivative warrant liabilities based on fair value using the Black Scholes model was $78,005 with a corresponding decrease in common shares. The Company subsequently re-priced the offering at US$0.20 and issued an additional 750,000 units on July 27, 2012. The fair value of the units based on the new offering price was determined to be $188,625. The amount allocated to contributed surplus was $132,616 and the amount allocated to derivative warrant liabilities based on fair value using the Black Scholes model was $56,009. In addition, the Company issued an additional 60,000 broker warrants. Each broker warrant entitles the holder to acquire one common share of the Company at an exercise price of US$0.25 for a period of three years from the date of issuance. The amount allocated to derivative warrant liabilities based on fair value using the Black Scholes model for broker warrants was $14,109 with a corresponding decrease in contributed surplus (see Note 13)
(f) On July 20, 2012 and August 7, 2012 the Company completed private placements for gross proceeds of $1,365,561 of equity capital from arm’s length private placement funding through the issuance of 6,825,000 units at a price of US$0.20 per unit. Each unit is comprised of one common share and one-half a common share purchase warrant, with each whole warrant entitling the holder to acquire one common share of the Company at US$0.50 for a period of three years from the date of issuance. The amount allocated to derivative warrant liabilities for warrants based on fair value using the Black Scholes model was $460,907. In connection with the private placement, the Company paid cash commissions and other expenses of $82,239 and issued an aggregate of 546,000 broker warrants. Each broker warrant entitles the holder to acquire one common share of the Company at an exercise price of US$0.25 for a period of three years from the date of issuance. The amount allocated to derivative warrant liabilities based on fair value using the Black Scholes model was $119,887 with a corresponding decrease in common shares (see Note 13).
(g) On May 8, 2012, the Company issued 171,385 common shares as full settlement of interest due on shareholders’ loans in the amount of $43,983. The amount allocated to common shares based on fair value was $44,547 and $564 was recorded as a loss on settlement of debt in the statement of operations and comprehensive loss.
(h) On August 31, 2012 the Company cancelled 3,418,468 common shares and 1,709,234 common shares purchase warrants exercisable at US$0.50 until August 31, 2014. The common shares and warrants had been issued August 31, 2010 as partial consideration of the purchase price for Dyami Energy and held in escrow pending the satisfaction of certain conditions precedent to their release on August 31, 2012. The conditions precedent had not been satisfied and the time allowed for performance expired. The Company recorded a reduction in exploration and evaluation assets of $2,091,616, a reduction in common shares of $1,397,199, a reduction of derivative warrant liabilities of $675,487 and a reduction in contributed surplus of $18,930 (see Note 13).
(i) On September 25, 2012 the Company completed private placements for gross proceeds of $441,004 of equity capital from arm’s length private placement funding through the issuance of 2,249,790 units at a price of US$0.20 per unit. Each unit is comprised of one common share and one-half a common share purchase warrant, with each whole warrant entitling the holder to acquire one common share of the Company at US$0.50 for a period of three years from the date of issuance. The amount allocated to derivative warrant liabilities for warrants based on fair value using the Black Scholes model was $163,541 (retranslated as $176,087 at August 31, 2013). In connection with the private placement, the Company paid cash commissions and other expenses of $35,354 and issued an aggregate of 179,983 broker warrants. Each broker warrant entitles the holder to acquire one common share of the Company at an exercise price of US$0.25 for a period of three years from the date of issuance. The amount allocated to derivative warrant liabilities based on fair value using the Black Scholes model was $44,895 (retranslated as $48,340 at August 31, 2013) with a corresponding decrease in common shares (see Note 13).
(j) On June 1, 2013, the Company issued 23,662,569 common shares as full settlement of shareholders’ loans in the amount of $198,333 and interest due on shareholders’ loans in the amount of $345,906. The amount allocated to common shares based on fair value was $946,503 and $402,264 was recorded as a loss on settlement of debt in the statement of operations and comprehensive loss.
The following table summarizes the outstanding warrants as at August 31, 2013:
| Number of | | | Exercise | | | Expiry | | Weighted Average | | | Warrant | |
| Warrants* | | | Price* | | | Date | | Remaining Life (Years) | | | Value ($) | |
| | 2,000,000 | | | $ | 0.04 | | | February 5, 2014 | | | 0.43 | | | $ | 24,000 | |
| | 800,512 | | | $ | 0.04 | | | February 25, 2014 | | | 0.49 | | | | 9,606 | |
| | 18,250,436 | | | $ | 0.04 | | | February 27, 2014 | | | 0.49 | | | | 219,031 | |
| | 6,000,000 | | | $ | 0.05 | | | January 24, 2015 | | | 1.40 | | | | 507,038 | |
| | 11,150,000 | | | $ | 0.05 | | | February 17, 2015 | | | 1.47 | | | | 595,310 | |
| | 2,000,000 | | | $ | 0.05 | | | February 17, 2015 | | | 1.47 | | | | 67,541 | |
| | 40,200,948 | | | $ | 0.04 | | | | | | 0.94 | | | $ | 1,422,526 | |
* Reflects the March 16, 2012 two-for-one stock split
The following table summarizes the outstanding warrants as at August 31, 2012:
| Number of | | | Exercise | | | Expiry | | Weighted Average | | | Warrant | |
| Warrants* | | | Price* | | | Date | | Remaining Life (Years) | | | Value ($) | |
| | 2,000,000 | | | $ | 0.04 | | | February 5, 2014 | | | 1.43 | | | $ | 24,000 | |
| | 800,512 | | | $ | 0.04 | | | February 25, 2014 | | | 1.49 | | | | 9,606 | |
| | 18,250,436 | | | $ | 0.04 | | | February 27, 2014 | | | 1.49 | | | | 219,031 | |
| | 6,000,000 | | | $ | 0.05 | | | January 24, 2015 | | | 2.40 | | | | 507,038 | |
| | 11,150,000 | | | $ | 0.05 | | | February 17, 2015 | | | 2.47 | | | | 595,310 | |
| | 2,000,000 | | | $ | 0.05 | | | February 17, 2015 | | | 2.47 | | | | 67,541 | |
| | 40,200,948 | | | $ | 0.04 | | | | | | 1.94 | | | $ | 1,422,526 | |
* Reflects the March 16, 2012 two-for-one stock split
The fair value of the warrants issued during the year ended August 31, 2012, were estimated using the Black-Scholes pricing model with the following assumptions:
| Black-Scholes Assumptions used | | | | |
| Risk-free interest rate | | | 1 | % |
| Expected volatility | | | 218 | % |
| Expected life (years) | | | 3 | |
| Dividend yield | | | - | |
The following table summarizes the weighted average shares outstanding:
| Weighted Average Shares Outstanding* | | August 31, 2013 | | | August 31, 2012 | |
| Weighted average shares outstanding, basic and diluted | | | 104,774,293 | | | | 81,769,733 | |
* Reflects the March 16, 2012 two-for-one stock split
The effects of any potential dilutive instruments on loss per share are anti-dilutive and therefore have been excluded from the calculation of diluted loss per share.
Share Purchase Options
The Company has a stock option plan to provide incentives for directors, officers, employees and consultants of the Company. The maximum number of shares, which may be set aside for issuance under the stock option plan, is 20% of the issued and outstanding common shares of the Company on a rolling basis.
The following table is a summary of the status of the Company’s stock options and changes during the period:
| | | Number | | | Weighted Average | |
| | | of Options* | | | Exercise Price | |
| Balance, August 31, 2011 | | | - | | | $ | - | |
| Granted | | | 1,050,000 | | | | 0.16 | |
| Balance, August 31, 2012 | | | 1,050,000 | | | | 0.16 | |
| Granted | | | - | | | | - | |
| Balance, August 31, 2013 | | | 1,050,000 | | | $ | 0.16 | |
* Reflects the March 16, 2012 two-for-one stock split
The following table is a summary of the Company's stock options outstanding and exercisable at August 31, 2013:
| Options Outstanding | | | Options Exercisable | |
Exercise
Price | | | Number
of Options | | | Weighted Average
Exercise Price | | | Weighted Average
Remaining Life
(Years) | | | Number
of Options* | | | Weighted Average
Exercise Price | |
| $ | 0.16 | | | | 1,000,000 | | | $ | 0.16 | | | | 3.50 | | | | 1,000,000 | | | $ | 0.16 | |
| $ | 0.25 | | | | 50,000 | | | $ | 0.25 | | | | 3.90 | | | | 50,000 | | | $ | 0.25 | |
| | | | | | 1,050,000 | | | $ | 0.16 | | | | 3.52 | | | | 1,050,000 | | | $ | 0.16 | |
The following table is a summary of the Company's stock options outstanding and exercisable at August 31, 2012:
| Options Outstanding | | | Options Exercisable | |
Exercise
Price | | | Number
of Options | | | Weighted Average
Exercise Price | | | Weighted Average
Remaining Life
(Years) | | | Number
of Options* | | | Weighted Average
Exercise Price | |
| $ | 0.16 | | | | 1,000,000 | | | $ | 0.16 | | | | 4.50 | | | | 1,000,000 | | | $ | 0.16 | |
| $ | 0.25 | | | | 50,000 | | | $ | 0.25 | | | | 4.90 | | | | 50,000 | | | $ | 0.25 | |
| | | | | | 1,050,000 | | | $ | 0.16 | | | | 4.52 | | | | 1,050,000 | | | $ | 0.16 | |
* Reflects the March 16, 2012 two-for-one stock split
Stock Based Compensation
On March 1, 2012, the Company granted options to purchase 600,000 common shares to directors. These options are exercisable at $0.16 per share, vesting immediately and expire on February 28, 2017. The Company recorded non-cash stock based compensation expense of $95,910.
Stock Based Compensation – Non Employees
On March 1, 2012, the Company granted options to purchase 400,000 common shares to a consultant. These options are exercisable at $0.16 per share, vesting immediately and expire on February 28, 2017. The Company recorded non-cash stock based compensation expense of $63,940.
On July 24, 2012, the Company granted options to purchase 50,000 stock options to a consultant of the Company. These options are exercisable at $0.25 per share, vest immediately and expire on July 23, 2017. The Company recorded non-cash share based compensation expense of $11,122.
The fair value of the stock options granted were estimated on the date of the grant using the Black Scholes option pricing model with the following weighted average assumptions used.
| | | March 1, 2012 | | | July 24, 2012 | |
| Weighted average fair value per option | | $ | 0.16 | | | $ | 0.22 | |
| Weighted average risk free interest rate | | | 1.44 | % | | | 1.12 | % |
| Forfeiture rate | | | 0 | % | | | 0 | % |
| Weighted average expected volatility | | | 213 | % | | | 233 | % |
| Expected life (years) | | | 5 | | | | 5 | |
| Dividend yield | | | Nil | | | | Nil | |
Transactions for the respective periods are as follows:
| | | Amount | |
| Balance, August 31, 2011 | | $ | - | |
| Stock based compensation | | | 170,972 | |
| Balance August 31, 2012 and August 31, 2013 | | $ | 170,972 | |
Compensation Expense on Re-pricing Units
On April 13, 2012, the Company completed private placements of equity capital for gross proceeds of $748,425 from arm’s length private placement funding through the issuance of 3,000,000 units at a price of US$0.25 per unit. The Company subsequently re-priced the offering at US$0.20 and issued an additional 750,000 units on July 27, 2012. The fair value of the additional units issued based on the new offering price was determined to be $188,625 and was expensed to the statement of operations.
| Black-Scholes Assumptions used | | | | |
| Risk-free interest rate | | | 1.16 | % |
| Expected volatility | | | 192 | % |
| Expected life (years) | | | 2.9 | |
| Dividend yield | | | - | |
Contributed Surplus
Contributed surplus transactions for the respective periods are as follows:
| | | Amount | |
| Balance, August 31, 2011 | | $ | 85,737 | |
| Imputed interest | | | 2,334 | |
| Warrants expired (Note 13) | | | 318,552 | |
| Warrants cancelled (note h) | | | (18,930 | ) |
| Compensation expense on re-pricing of units (note e) | | | 118,507 | |
| Balance, August 31, 2012 | | $ | 506,200 | |
| Transactions during the year | | | - | |
| Balance, August 31, 2013 | | $ | 506,200 | |
OVERALL PERFORMANCE
Revenue, net of royalties for the year ended August 31, 2013 was down $9,156 to $30,062 compared to $39,218 for the year ended August 31, 2012. The decrease in net revenue during 2013 is primarily attributed to declines in natural gas production volume and prices received from the Company’s Botha, Alberta property. Net loss for the year ended August 31, 2013 was $4,266,046 compared to a net loss of $2,809,188 for the year ended August 31, 2012. The increase in net loss during 2013 was primarily related to an impairment of exploration and evaluation assets in the amount of $2,690,568 partially offset by a reduction in loss on settlement of debt in the amount of $1,063,201 to $402,264 compared to a loss on settlement of debt in the amount of $1,465,465 in 2012, a reduction in general and administrative costs of $122,014 to $583,577 compared to general and administrative costs of $705,591 during 2012, stock based compensation expense of Nil compared to $170,972 in 2012 and compensation expense on re-pricing units in the amount of Nil compared to o$188,625 in 2012.
During the year ended August 31, 2013 the Company completed financings through the issuance of 2,249,790 units in the capital of the Company for net proceeds of $405,650.
During the year ended August 31, 2013, the Company issued 23,662,569 common shares as full settlement of shareholder loans and interest due on shareholders’ loans of $198,333 and $345,906 respectively.
For the twelve months ended August 31, 2013, the Company recorded additions of $404,818 in exploration and evaluation assets and an impairment of $2,690,568 on the Murphy Lease.
During the year ended August 31, 2013, the Company entered into an agreement with the lessors of the Matthews Property, OGR Energy Corporation (“OGR Energy”) and Texas Onshore Energy, Inc. (“Texas Onshore”) together holding a 15% working interest in the Matthews Property with back in rights to earn an additional 15% working interest after production achieved $15.0 million of revenue. A new lease was signed with our subsidiary, Zavala Inc. effective September 1, 2013 (the “New Matthews Lease”). The New Matthews Lease has a primary term expiring January 31, 2014 (the “Primary Term”) (subject to certain extensions) and can be maintained through the provision of certain royalty payments and the implementation of a continuous drilling program.
As part of the Company’s oil and gas development program, management of the Company anticipates further expenditures to expand its existing portfolio of proved reserves. Amounts expended on future exploration and development is dependent on the nature of future opportunities evaluated by the Company. Any expenditure which exceeds available cash will be required to be funded by additional share capital or debt issued by the Company, or by other means. The Company’s long-term profitability will depend upon its ability to successfully implement its business plan.
The Company’s past primary source of liquidity and capital resources has been proceeds from the issuance of share capital, shareholders’ loans and cash flow from oil and gas operations.
Selected Financial Information
The following table reflects the summary of results for the years set out.
| | | For the Years Ended | |
| | | August 31 | |
| | | 2013 | | | 2012 | | | 2011 | |
| Revenue, net of royalties | | $ | 30,062 | | | $ | 39,218 | | | $ | 56,916 | |
| Net loss | | | (4,266,046 | ) | | $ | (2,809,188 | ) | | $ | (430,927 | ) |
| Loss per share, basic and diluted | | $ | (0.041 | ) | | $ | (0.034 | ) | | $ | (0.007 | ) |
| Assets | | $ | 6,918,197 | | | $ | 8,998,016 | | | $ | 9,575,976 | |
| Long term liabilities | | $ | 1,407,822 | | | $ | 1,881,078 | | | $ | 1,403,052 | |
August 31, 2013 – 2012
For the year ended August 31, 2013 revenue, net of royalties was primarily attributed to declines in natural gas production volume and prices received from the Company’s Botha, Alberta property. Net loss for the year ended August 31, 2013 was $4,266,046 compared to a net loss of $2,809,188 for the year ended August 31, 2012. The increase in net loss during 2013 was primarily related to an impairment of exploration and evaluation assets in the amount of $2,690,568 partially offset by a reduction in loss on settlement of debt in the amount of $1,063,201 to $402,264 compared to a loss on settlement of debt in the amount of $1,465,465 in 2012, a reduction in general and administrative costs of $122,014 to $583,577 compared to general and administrative costs of $705,591 during 2012, stock based compensation expense of Nil compared to $170,972 in 2012. For the year ended August 31, 2013 assets decreased by $2,079,820 compared to assets of $8,998,016 for the year ended August 31, 2012. The decrease in assets for the year ended August 31, 2013 was primarily as result of an impairment in exploration and evaluation assets of $2,690,568 to $6,535,278 compared to $8,475,487 for the same period in 2012, an impairment of property and equipment of $168,954 in 2013 compared to $50,774 in 2012 and a decrease in cash during 2013 of $133,166 to $196,837 compared to cash of $330,003 in 2012. These decreases were offset by an increase in prepaid expenses and deposits of $158,295 compared to Nil in 2012 and an increase of $10,261 in accounts receivable to $27,786 compared to $17,525 in 2012. Long term liabilities decreased in fiscal 2013 by $473,256 to $1,407,822 compared to $1,881,078 in 2012. These decreases are primarily a result of a reallocation of derivative warrant liabilities in the amount of $688,803 to current liabilities and a reallocation $178,553 of long term provisions to current liabilities. During fiscal 2013 the Company issued 1,124,895 common share purchase warrants exercisable at US$0.50 and 179,983 common share purchase broker warrants exercisable at US$0.25 expiring September 25, 2015. The amounts allocated to long term derivative warrant liabilities based on fair value using the Black Scholes model was $163,541 and $44,895, respectively.
August 31, 2012 – 2011
For the year ended August 31, 2012 revenue decreased compared to revenue in the prior period as a result of lower natural gas prices received from the Company’s Botha, Alberta property. Net loss for the year ended August 31, 2012 was $2,809,188 compared to a net loss of $430,927 for the year ended August 31, 2011. The increase in net loss during 2012 was primarily related to a loss on settlement of debt in the amount of $1,465,465 compared to Nil in 2011, stock based compensation expenses of $170,972 compared to Nil in 2011, an unrealized loss on derivative warrant liabilities of $46,655 versus a gain of $126,410 for the year ended August 31, 2011 and higher administrative costs of $705,591 compared to 502,474 in the prior period in 2011. For the year ended August 31, 2012 assets decreased by $577,960 to $8,998,016 compared to $9,575,976 for the same period in 2011. The decrease in assets is primarily a result of a decrease in exploration and evaluation assets of $520,391 and a decrease of $68,000 in property and equipment. The decreases in exploration and evaluation assets are attributed to the cancellation of 3,418,468 common shares and 1,709,234 common shares purchase warrants that had been issued August 31, 2010 as partial consideration of the purchase price for Dyami Energy and held in escrow pending the satisfaction of certain conditions precedent to their release on August 31, 2012. The conditions precedent had not been satisfied and the time allowed for performance expired and the Company recorded a reduction of $2,091,616 in exploration and evaluation assets. In addition, the company incurred expenditures of $1,559,763 versus $3,262,782 in 2011 on the leases in Zavala County, Texas. Long term liabilities increased in fiscal 2012 by $478,026 to $1,881,078 compared to $1,403,052 in 2011 as a result of increases in provisions and derivative warrant liabilities.
RESULTS OF OPERATIONS
| | | For the Years Ended | |
| Historical | | August 31 | |
| Production | | 2013 | | | 2012 | | | 2011 | |
| Natural gas – mcf/d | | | 37 | | | | 54 | | | | 53 | |
| Historical Prices | | | | | | | | | | | | |
| Natural Gas - $/mcf | | $ | 2.15 | | | $ | 2.24 | | | $ | 3.68 | |
| Royalties costs - $/mcf | | $ | 0.62 | | | $ | 0.57 | | | $ | 0.76 | |
| Production costs - $/mcf | | $ | 0.62 | | | $ | .055 | | | $ | 2.68 | |
| Net back - $/mcf | | $ | 0.89 | | | $ | 1.16 | | | $ | 0.24 | |
| Operations | | | | | | | | | | | | |
| Revenue, net of royalties | | $ | 30,062 | | | $ | 39,218 | | | $ | 56,916 | |
| Net loss | | $ | (4,266,046 | ) | | $ | (2,809,188 | ) | | $ | (430,927 | ) |
| Loss per share, basic and diluted | | $ | (0.041 | ) | | $ | (0.034 | ) | | $ | (0.007 | ) |
Production Volume
For the year ended August 31, 2013 average natural gas sales volumes decreased by 17 mcf/d to 37 mcf/d compared to 54 mcf/d for the same period in 2012. Total production volume for the year ended August 31, 2013 was 13,431 mcf compared to 19,593 mcf for the twelve month period ended August 31, 2012.
For the year ended August 31, 2012 average natural gas sales volumes remained relatively consistent at 54 mcf/d compared to 53 mcf/d for the same period in 2011. Total production volume for the year ended August 31, 2012 was 19,593 mcf compared to 19,500 mcf for the same twelve month period in 2011.
Commodity Prices
For the year ended August 31, 2013 average natural gas prices received per mcf decreased by 4% to $2.15 compared to $2.24 for the year ended August 31, 2012.
For the year ended August 31, 2012 average natural gas prices received per mcf decreased by 39% to $2.24 compared to $3.68 for the year ended August 31, 2011.
The decrease in average natural gas prices received was attributed to lower commodity prices for natural gas and the shut in of the wells for the twelve months ended August 31, 2013.
| Revenue, Net of Royalties | | For the Years Ended | |
| | | August 31, | |
| | | 2013 | | | 2012 | | | 2011 | |
| Natural gas sales | | $ | 38,620 | | | $ | 44,408 | | | $ | 71,786 | |
| Royalties | | | (8,558 | ) | | | (5,190 | ) | | | (14,870 | ) |
| Revenue, net of royalties | | $ | 30,062 | | | $ | 39,218 | | | $ | 56,916 | |
Natural gas sales for the year ended August 31, 2013 was down $5,788 to $38,620 compared to $44,408 for the year ended August 31, 2012.
Natural gas sales for the year ended August 31, 2012 was down $27,378 to $44,408 compared to $71,786 for the year ended August 31, 2011.
The decrease in sales for the twelve month period ended August 31, 2013 and 2012 was attributed to lower commodity prices received for natural gas and lower production volume.
Royalties for the year ended August 31, 2013 were up $3,368 to $8,558 versus $5,190 for the same twelve month period in 2012. The increase during fiscal 2013 was attributed to receipt of royalty credits in fiscal 2012.
Royalties for the year ended August 31, 2012 were $5,190 versus $14,870 for the comparable twelve month period in 2011. The decrease in royalties for the year ended August 31, 2012 was primarily attributed to receipt of royalty credits in the current year.
Revenue, net of royalties for the year ended August 31, 2013 decreased by 23% to $30,062 compared to $39,218 for the same twelve month period in 2012
Revenue, net of royalties for the year ended August 31, 2012 decreased by 31% to $39,218 compared to $56,916 for the same twelve month period in 2011.
Operating Costs
For year ended August 31, 2013 operating costs were $9,234 down $19,237 compared to operating costs of $28,471 for the year ended August 31, 2012. The decrease in operating costs for the year ended August 31, 2013 was primarily a result of lower production volume and the shut in of the Company’s Botha, Alberta wells.
For year ended August 31, 2012 operating costs were $28,471 down $23,719 compared to operating costs of $52,190 for the year ended August 31, 2011. The decrease in operating costs twelve months ended August 31, 2012 was attributed to credits for gas processing charges.
Depletion and Accretion
Depletion and accretion for the year ended August 31, 2013 decreased by $7,226 to $13,283 compared to $20,509 for the year ended August 31, 2012. The decrease in depletion and accretion for the twelve months ended August 31, 2013 was primarily attributed to lower production volume and the shut in of the Company’s Botha, Alberta wells.
Depletion and accretion for the year ended August 31, 2012 decreased by $3,403 to $20,509 compared to $23,912 for the year ended August 31, 2011. The decrease in depletion and accretion for the twelve months ended August 31, 2012 was primarily attributed to lower carrying costs for the Company’s Botha, Alberta property.
| General and Administrative Expenses | | For the Years
August 31, | |
| | | 2013 | | | 2012 | | | 2011 | |
| Professional fees | | $ | 251,165 | | | $ | 352,315 | | | $ | 210,633 | |
| Head office costs | | | 48,850 | | | | 55,500 | | | | 46,499 | |
| Management fees | | | 75,000 | | | | 75,000 | | | | 56,250 | |
| Transfer and registrar costs | | | 7,591 | | | | 29,172 | | | | 15,380 | |
| Shareholders information | | | 33,017 | | | | 39,708 | | | | 46,181 | |
| Office and general costs | | | 5,179 | | | | 16,385 | | | | 16,141 | |
| Advisory fees | | | 65,724 | | | | 46,192 | | | | - | |
| Directors fees | | | 3,200 | | | | 4,100 | | | | 2,100 | |
| Salaries and wages | | | - | | | | - | | | | 44,061 | |
| Reserve report fees | | | 10,059 | | | | 5,655 | | | | 7,011 | |
| Consulting fees and expenses | | | 83,792 | | | | 81,564 | | | | 58,218 | |
| Total | | $ | 583,577 | | | $ | 705,591 | | | $ | 502,474 | |
General and administrative expenses for the year ended August 31, 2013 were $122,014 lower to $583,577 compared to $705,591 for the year ended August 31, 2012. The decrease in expenses during fiscal 2013 was primarily attributed to a decrease in professional fees of $101,150 to $251,165 compared to $352,315 in 2012. In addition, during fiscal 2013 the Company recorded a decrease in transfer and registrar costs of $21,581 to $7,591 compared to $29,172 for the year ended August 31, 2012. During fiscal 2012 the Company completed a forward stock split which resulted in higher costs incurred during the year ended August 31, 2012. During the year ended August 31, 2013 advisory fees increased by $19,532 to $65,724 compared to $46,192 for the same twelve month period in 2012.
General and administrative expenses for the year ended August 31, 2012 were $203,117 higher to $705,591 compared to $502,474 for the year ended August 31, 2011. The increase in expenses during 2012 was primarily attributed to an increase in professional fees of $141,682 to $352,315 compared to $210,633 in 2011. These professional fee increases are primarily related to litigation costs incurred related to the Matthews Lease, Texas. In addition, the Company recorded an increase of $23,346 in consulting fees compared to Nil in the prior period, an increase in advisory fees of $46,192 compared to Nil in 2011, Also, during fiscal 2012 management fees increased by $18,750 transfer and registrar costs increased by $13,792. For the year ended August 31, 2011 salaries and wages were $44,061 compared to Nil in the current year.
Marketing and Public Relations
For the year ended August 31, 2013, the Company incurred marketing and public relations costs of $25,763 versus $46,272 for the year ended August 31, 2012.
For the year ended August 31, 2012, the Company incurred marketing and public relations costs of $46,272 compared to $88,569 in the comparable twelve month period ended August 31, 2011.
Impairment Loss on Property and Equipment
For the year ended August 31, 2013 the Company recorded an impairment loss of $168,954 on its Alberta, Canada property as a result of no reserves or value being assigned by an independent reserves evaluator versus an impairment loss of $50,774 in 2012. During fiscal 2013, the remaining wells in the gas unit watered out and were shut in and the operator of the natural gas unit does not intend on reactivating or remediating the wells.
For the twelve months ended August 31, 2012 the Company recorded an impairment loss of $50,774 on its Alberta, Canada property as a result of an evaluation prepared by an independent reserves evaluator versus an impairment loss of $48,249 for the twelve months ended August 31, 2011. The evaluations were based on future pre-tax cash flows of the proved and probable reserves using forecast prices and discounted by 10%.
Impairment Loss on Exploration and Evaluation Assets
As at and for the year ended August 31, 2013, the Company record an impairment of $2,690,568 on its Murphy Lease, Zavala County, Texas based on the amount for which management believes the assets could be sold or farmed out in an arms’ length transaction, less estimated costs to sell compared to Nil in the prior period in 2012.
Interest Expense
For the year ended August 31, 2013 the Company recorded interest costs of $76,783 versus interest costs of $88,789 for the year ended August 31, 2011. The decrease in interest costs during the year ended August 31, 2013 was attributed to decreases in shareholders’ loans.
For the year ended August 31, 2012 the Company incurred interest of $88,789 versus interest costs of $68,199 for the year ended August 31, 2011. The overall increase in interest for fiscal 2012 was attributed to increases in shareholders’ loans.
Loss (Gain) on Derivative Warrant Liabilities
For the year ended August 31, 2013, the Company recorded an unrealized loss on derivative warrant liabilities of $128,041 compared to an unrealized loss of $46,655 for the year ended August 31, 2012.
For the year ended August 31, 2012, the Company recorded an unrealized loss on derivative warrant liabilities of $46,655 compared to an unrealized gain of $126,410 for the year ended August 31, 2011.
The Company has warrants issued with an exercise price in US dollars which is different to the functional currency of the Company (Canadian Dollars) and accordingly the warrants are treated as a derivative financial liability and the fair value movement during the period is recognized in the statement of operations.
Loss (Gain) on Foreign Exchange
For the year ended August 31, 2013 the Company recorded a loss on foreign exchange of $197,640 versus a loss on foreign exchange of $36,283 for year ended August 31, 2012.
For the year ended August 31, 2012 the Company recorded a loss on foreign exchange of $36,283 versus a gain on foreign exchange of $161,340 for the same twelve month period in 2011.
These foreign exchange gains and losses are attributed to the translation of monetary assets and liabilities not denominated in the functional currency of the Company.
Loss on Settlement of Debt
For the year endedAugust 31, 2013 the Company recorded a loss on settlement of debt in the amount of $402,264 compared to $1,465,465 for the same twelve month period in 2012. During fiscal 2013, the Company issued 23,662,569 common shares as full settlement of shareholders’ loans in the amount of $198,333 and interest due on shareholders’ loans in the amount of $345,906. The amount allocated to common shares based on fair value was $946,503 and $402,264 was recorded as a loss on settlement of debt.
For the year endedAugust 31, 2012 the Company recorded a loss on settlement of debt in the amount of $1,465,465 compared to Nil for the same twelve month period in 2011. During the year ended August 31, 2012, the Company issued 3,278,392 common shares as full settlement of interest due on shareholders’ loans in the amount of $369,886. The amount allocated to common shares based on fair value was $440,136 and $70,250 was recorded as a loss on settlement of debt. In addition, the Company converted debt and shareholders’ loans of $857,500 through the issuance of 17,150,000 units in the capital of the Company. The fair value of the units issued on the settlement date was $2,252,715 and $1,395,215 was recorded as a loss on settlement of debt.
Write down of Marketable Securities
For the year endedAugust 31, 2013 the fair value of the securities was written down to Nil (August 31, 2012 and 2011 fair value - $1).
Compensation Expense on Re-pricing Units
For the year ended August 31, 2013 the Company recorded compensation expense on re-pricing units of Nil compared to $188,625 in the prior year 2012.
For the year ended August 31, 2012 the Company recorded compensation expense on re-pricing units of $188,625 compared to Nil in the prior year 2011. On April 13, 2012, the Company completed private placements for gross proceeds of $748,425 through the issuance of 3,000,000 units at a price of US$0.25 per unit. The Company re-priced the offering at US$0.20 and issued an additional 750,000 units on July 27, 2012. The fair value of the 750,000 units based on the new offering price was determined to be $188,625 and was recorded on the statement of operations.
Stock Based Compensation Expense
For the year ended August 31, 2013 the Company recorded stock based compensation of Nil compared to $95,910 for the same period in 2012.
For the year ended August 31, 2012 the Company recorded stock based compensation of $95,910 compared to Nil for the same period in 2011. On March 1, 2012, the Company granted options to purchase 600,000 common shares to directors and recorded non-cash stock based compensation expense of $95,910.
Stock Based Compensation-Non Employees
For the year ended August 31, 2013 the Company recorded stock based compensation to non-employees of Nil compared to $75,062 for the same period in 2012.
For the year ended August 31, 2012 the Company recorded stock based compensation to non-employees of $75,062 compared to Nil for the same period in 2011. On March 1, 2012, the Company granted options to purchase 400,000 common shares to a consultant and recorded non-cash stock based compensation expense of $63,940 and on July 24, 2012, the Company granted options to purchase 50,000 stock options to a consultant of the Company and recorded non-cash share based compensation expense of $11,122.
Gain on Disposal of Marketable Securities
For the year ended August 31, 2013 the Company recorded a gain on disposal of marketable securities of Nil compared to Nil for the same twelve month period in 2012.
For the year ended August 31, 2012 the Company recorded a gain on disposal of marketable securities of Nil compared to $8,000 for the same twelve month period in 2011.
Net Loss
Net loss for the year ended August 31, 2013 was $4,266,046 compared to a net loss of $2,809,188 for the year ended August 31, 2012. The increase in net loss was primarily related to an impairment of exploration and evaluation assets in the amount of $2,690,568 compared to Nil in 2012 and an impairment of property and equipment of $168,954 compared to $50,774 in 2012. These increases were partially offset by a reduction in loss on settlement of debt in the amount of $1,063,201 to $402,264 compared to a loss on settlement of debt in the amount of $1,465,465 in 2012, a reduction in general and administrative costs of $122,014 to $583,577 compared to general and administrative costs of $705,591 during 2012 and a reduction stock based compensation expense of Nil compared to $170,972 in 2012.
Net loss for the year ended August 31, 2012 was $2,809,188 compared to a net loss of $430,927 for the year ended August 31, 2011. The increase in net loss during 2012 was primarily related to a loss on settlement of debt in the amount of $1,465,465 compared to Nil in 2011, stock based compensation expenses of $170,972 compared to Nil in 2011 an unrealized loss on derivative warrant liabilities of $46,655 versus a gain of $126,410 for the year ended August 31, 2011 and compensation expense on re-pricing units of $188,625 compared to Nil in 2011. During fiscal 2012, general and administrative costs increased by $203,117 to $705,591 compared to $502,474 for the same period in 2011.
Gain (Loss) on Translation or Foreign Subsidiary
For the year ended August 31, 2013 the Company recorded a gain on translation of foreign subsidiary of $314,120 versus a loss of $160 for the year ended August 31, 2012.
For the year ended August 31, 2012 the Company incurred a loss on translation of foreign subsidiary of $160 versus a loss of $109,303 for the year ended August 31, 2011.
These losses are related to translation differences between Dyami Energy’s and Zavala Inc’s US dollar functional currency converted into Canadian dollars at the period end exchange rates, and the results operations converted at average rates of exchange for the period.
Comprehensive Loss
Comprehensive loss for the year ended August 31, 2013 was $3,951,926 compared to a comprehensive loss of $2,809,348 for the year ended August 31, 2012.
Comprehensive loss for the year ended August 31, 2012 was $2,809,348 compared to a comprehensive loss of $540,230 for the year ended August 31, 2011.
Loss per Share, Basic and Diluted
Basic and diluted net loss per share for the year ended August 31, 2013 was $0.041 compared to a basic and diluted net loss per share of $0.034 for the same period in 2012.
Basic and diluted net loss per share for the year ended August 31, 2012 was $0.034 compared to a basic and diluted net loss per share of $0.007 for the same period in 2011.
SUMMARY OF QUARTERLY RESULTS
The following tables reflect the summary of quarterly results for the periods set out.
| | | 2013 | | | 2013 | | | 2013 | | | 2012 | |
| For the quarter ending | | August 31 | | | May 31 | | | February 29 | | | November 30 | |
| Revenue, net of royalties | | $ | 171 | | | $ | 10,206 | | | $ | 9,787 | | | $ | 9,898 | |
| Net loss for the period | | $ | (3,557,922 | ) | | $ | (116,520 | ) | | $ | (374,673 | ) | | $ | (216,931 | ) |
| Loss per share, basic and diluted | | $ | (0.034 | ) | | $ | (0.001 | ) | | $ | (0.004 | ) | | $ | (0.002 | ) |
Fiscal 2013
Revenue, net of royalties for the four quarters fluctuated as a result of changes in production volume and commodity prices. In addition during fiscal 2013 the remaining wells in the Company’s Botha, Alberta property watered were shut in. During the quarter ended August 31, 2013, the Company recorded an impairment of exploration and evaluation assets in the amount of $2,690,568, an impairment of property and equipment of $168,954 and a loss on settlement of debt in the amount of $402,264. During the three months ended February 2013 the Company recorded a loss on foreign exchange of $111,369. Other changes in net loss during the quarters were primarily related to increases in general and administrative costs, gain or loss on foreign exchange and the fair value movement of derivative warrant liabilities during the respective periods.
| | | 2012 | | | 2012 | | | 2012 | | | 2011 | |
| For the quarter ending | | August 31 | | | May 31 | | | February 29 | | | November 30 | |
| Revenue, net of royalties | | $ | 5,764 | | | $ | 13,275 | | | $ | 8,377 | | | $ | 11,802 | |
| Net loss for the period | | $ | (354,808 | ) | | $ | (646,429 | ) | | $ | (1,466,298 | ) | | $ | (341,653 | ) |
| Loss per share, basic and diluted | | $ | (0.005 | ) | | $ | (0.008 | ) | | $ | (0.040 | ) | | $ | (0.010 | ) |
Fiscal 2012
Revenue, net of royalties for the four quarters fluctuated as a result of changes in production volume and commodity prices. The material changes in net income or loss during the quarters is primarily related to increases in general and administrative costs, gain or loss on foreign exchange and the fair value movement of derivative warrant liabilities during the respective periods. During the quarter ended February, 2012 the Company recorded a loss on settlement of debt of $1,448,361. During the quarter ended May 31, 2012 the Company recorded $159,850 in stock based compensation expenses. During the year ended August 31, 2012, the Company recorded compensation expense on re-pricing units of $188,625 and an impairment of property and equipment in the amount of $50,744.
FOURTH QUARTER RESULTS
| Historical | | For the Three Months Ended | |
| Production | | August 31 | |
| | 2013 | | | 2012 | |
| Natural gas – mcf/d | | | - | | | | 54 | |
| Historical Prices | | | | | | | | |
| Natural Gas - $/mcf | | $ | - | | | $ | 1.92 | |
| Royalties costs - $/mcf | | $ | - | | | $ | 0.38 | |
| Production costs - $/mcf | | $ | - | | | $ | 0.54 | |
| Net back - $/mcf | | $ | - | | | $ | 1.00 | |
| Operations | | | | | | | | |
| Revenue, net of royalties | | $ | - | | | $ | 5,764 | |
| Net loss | | $ | (3,557,922 | ) | | $ | (354,808 | ) |
| Loss per share, basic and diluted | | $ | (0.034 | ) | | $ | (0.005 | ) |
Production Volume
For the three months ended August 31, 2013 average natural gas sales volumes Nil mcf/d compared to 54 mcf/d for the same period in 2012. Total production volume for the three months ended August 31, 2013 was Nil mcf compared to 5,008 mcf for the same twelve month period in 2012. During the three months ended August 31, 2013, the Company’s wells in the Botha Property, Alberta watered out and were shut in. The operator does not intend on reactivating or remediating the wells.
Commodity Prices
For the three months ended August 31, 2013 average natural gas prices received per mcf was Nil compared to $1.92 for the three months ended August 31, 2012. The decrease in average natural gas prices received was attributed to lower commodity prices for natural gas and the shut in of the wells for the three months ended August 31, 2013.
| Revenue, Net of Royalties | | For the Three Months Ended | |
| | | August 31, | |
| | | 2013 | | | 2012 | |
| Natural gas sales | | $ | 1,395 | | | $ | 9,670 | |
| Royalties | | | (1,224 | ) | | | (3,906 | ) |
| Revenue, net of royalties | | $ | 171 | | | $ | 5,764 | |
Natural gas sales for the three months ended August 31, 2013 was down $8,275 to $1,395 compared to $$9,670 for the three months ended August 31, 2012. The decrease in sales for the three month period ended August 31, 2013 was attributed to lower production volume primarily due to the shut in of the Company’s Botha, Alberta wells.
Royalties for the three months ended August 31, 2013 were $1,224 versus $3,906 for the comparable three month period in 2012. The decrease in royalties for the three months ended August 31, 2013 was primarily attributed to receipt of royalty credits in the prior three month period in 2011.
As a result of the above, revenue, net of royalties for the three months ended August 31, 2013 decreased by 97% to $171 compared to $5,764 for the same three month period in 2012.
Operating Costs
For three months ended August 31, 2013 the Company incurred operating costs of $1,473 versus a recovery of operating costs of in the amount of $31,277 for the same three month period ended August 31, 2012. The recovery of operating costs during three months ended August 31, 2012 was attributed to credits for gas processing charges. Reduced operating costs for the three months ended August 31, 2013 was primarily a result of the shut in of the Company’s Botha, Alberta wells.
Depletion and Accretion
Depletion and accretion for the three months ended August 31, 2013 decreased by $4,396 to $990 compared to $5,386 for the three months ended August 31, 2012. The decrease in depletion and accretion for the three months ended August 31, 2013 was primarily attributed to lower production volume from the Company’s Botha, Alberta property.
| General and Administrative Expenses | | For the Three Months | |
| | | August 31 | |
| | | 2013 | | | 2012 | |
| Professional fees | | $ | 80,208 | | | $ | 190,656 | |
| Head office costs | | | 11,250 | | | | 19,500 | |
| Management fees | | | 18,750 | | | | 18,750 | |
| Transfer and registrar costs | | | 2,629 | | | | 2,116 | |
| Shareholders information | | | 933 | | | | 3,063 | |
| Office and general costs | | | 523 | | | | 2,092 | |
| Directors fees | | | 700 | | | | 700 | |
| Reserve report fees | | | 5,500 | | | | 4,000 | |
| Consulting fees and expenses | | | 43,211 | | | | 28,733 | |
| Advisory fees | | | - | | | | 46,192 | |
| Total | | $ | 163,704 | | | $ | 315,802 | |
General and administrative expenses for the three months ended August 31, 2013 were $152,096 lower to $163,704 compared to $315,802 for the year ended August 31, 2012. The decrease in expenses during 2013 was primarily attributed to a decrease in professional fees of $110,448 to $80,208 compared to $190,656 in 2012. Higher professional fees in 2012 were primarily attributed to litigation costs related to the Matthews Lease, Texas. In 2013, the Company incurred advisory fees of Nil compared to $46,192 in 2012. During the three month period in fiscal 2013, head office costs decreased by $8,250 to $11,250 compared to $19,500 for the three months ended in fiscal 2012. During the three months ended August 31, 2013 consulting fees and expenses increased by $14,478 to $43,211 compared to $28,733 in the prior three month period.
Marketing and Public Relations
For the three months ended August 31, 2013, the Company incurred marketing and public relations costs of $13,085 compared to Nil in the comparable three month period in 2012.
Impairment Loss on Property and Equipment
For the three months ended August 31, 2013 the Company recorded an impairment loss of $168,954 on its Alberta, Canada property as a result of no reserves or value being assigned by an independent reserves evaluator versus an impairment loss of $50,774 in 2012. During the quarter in fiscal 2013, the remaining wells watered out and were shut in and the operator of the wells does not intend on reactivating or remediating the wells. The evaluations were based on future pre-tax cash flows of the proved and probable reserves using forecast prices and discounted by 10%.
Impairment Loss on Exploration and Evaluation Assets
For the three month ended August 31, 2013, the Company record an impairment of $2,690,568 on its Murphy Lease, Zavala County, Texas based on the amount for which management believes the assets could be sold or farmed out in an arms length transaction, less estimated costs to sell compared to Nil in the prior period in 2012.
Interest Expense
For the three months ended August 31, 2013 the Company incurred interest of $15,412 versus interest costs of $22,931 for the three months ended August 31, 2012. The decrease in interest for the quarter in 2013 was attributed to decreases in shareholders’ loans.
Loss (Gain) on Derivative Warrant Liabilities
For the three months ended August 31, 2013, the Company recorded an unrealized loss on derivative warrant liabilities of $38,375 compared to an unrealized loss of $46,604 for the three months ended August 31, 2012.
The Company has warrants issued with an exercise price in US dollars which is different to the functional currency of the Company (Canadian Dollars) and accordingly the warrants are treated as a derivative financial liability and the fair value movement during the period is recognized in the statement of operations.
Loss (Gain) on Foreign Exchange
For the three months ended August 31, 2013, the Company recorded a loss on foreign exchange of $197,643 versus a gain on foreign exchange of $156,186 for the same three month period in 2012.
These foreign exchange gains and losses are attributed to the translation of monetary assets and liabilities not denominated in the functional currency of the Company.
Loss on Settlement of Debt
For the three months ended August 31, 2013 the Company recorded a loss on settlement of debt in the amount of $ 402,264 compared to Nil for the same three month period in 2012.
During the quarter in fiscal 2013, the Company issued 23,662,569 common shares as full settlement of shareholders’ loans in the amount of $198,333 and interest due on shareholders’ loans in the amount of $345,906. The amount allocated to common shares based on fair value was $946,503 and $402,264 was recorded as a loss on settlement of debt.
Write down of Marketable Securities
For the three months endedAugust 31, 2013 the fair value of the securities was written down to Nil (August 31, 2012 fair value - $1).
Stock Based Compensation-Non Employees
For the three months ended August 31, 2013 the Company recorded stock based compensation of Nil compared to $11,122 for the same period in 2012.
On July 24, 2012, the Company granted options to purchase 50,000 stock options to a consultant of the Company and recorded non-cash share based compensation expense of $11,122.
Compensation Expense on Re-pricing Units
For the three months ended August 31, 2013 the Company recorded compensation expense on re-pricing units of Nil compared to $188,625 for the same three month period in 2012.
On April 13, 2012, the Company completed private placements for gross proceeds of $748,425 through the issuance of 3,000,000 units at a price of US$0.25 per unit. The Company re-priced the offering at US$0.20 and issued an additional 750,000 units on July 27, 2012. The fair value of the 750,000 units based on the new offering price was determined to be $188,625 and was recorded on the statement of operations.
Net Loss
Net loss for the three months ended August 31, 2013 increased by $3,203,115 to $3,557,922compared to a net loss of $354,808 for the three ended August 31, 2012. The increase in net loss during 2013 was primarily related to an impairment of exploration and evaluation assets in the amount of $2,690,568 versus Nil in the 2012 period, a loss on settlement of debt in the amount of $402,264 compared to Nil in the 2012 period, an increase in foreign exchange loss of $219,451 to $63,265 versus a foreign exchange gain of $156,186 during 2012, and an increase in impairment of property and equipment of $118,180 to $168,954 compared to an impairment of $50,774 for the same period in 2012. The increases during three month period in 2013 were partially offset by a decrease in compensation expense on re-pricing of unit of $188,625 to Nil compared to $188,625 in 2012 and a decrease in general and administrative costs of $152,096 to $163,706 compared to $315,802 for the same three month period in the 2012 period.
Gain (Loss) on Translation of Foreign Subsidiary
For the three months ended August 31, 2013 the Company incurred a gain on translation of foreign subsidiary of $98,027 versus a loss of $96,043 for the same period in 2012.
These losses are related to translation differences between Dyami Energy’s and Eagleford Zavala’s US dollar functional currency converted into Canadian dollars at the period end exchange rates, and the results operations converted at average rates of exchange for the period.
Comprehensive Loss
Comprehensive loss for the three months ended August 31, 2013 was $3,459,895 compared to a comprehensive loss of $$450,851 for the three months August 31, 2012.
Loss per Share, Basic and Diluted
Basic and diluted net loss per share for the three months ended August 31, 2013 was $0.034 compared to basic and diluted net loss per share of $0.005 for the same period in 2012.
CAPITAL EXPENDITURES
For the year ended August 31, 2013, the Company recorded additions to exploration and evaluation assets of $404,818 on its Leases located in Zavala County, Texas ($1,559,763 August 31, 2012).
The Company expects that its capital expenditures will increase in future reporting periods as the Company incurs costs to explore and develop its oil and gas properties.
FINANCING ACTIVITIES
During the year ended August 31, 2013 the Company completed financings through the issuance of 2,249,790 units in the capital of the Company for net proceeds of $405,650.
During the year ended August 31, 2012, the Company issued 23,662,569 common shares as full settlement of shareholder loans and interest due on shareholders’ loans of $198,333 and $345,906 respectively.
B. LIQUIDITY AND CAPITAL RESOURCES
Cash as of August 31, 2013 was $196,837 compared to cash of $330,003 at August 31, 2012. During the year ended August 31, 2013 the Company raised net proceeds of $405,650 through the issuance of share capital.
For the year ended August 31, 2013 the primary use of funds was related to exploration expenditures incurred on the Company’s leases located in Zavala County, Texas and administrative expenses. The Company’s working capital deficiency at August 31, 2013 was $4,985,312 compared to a working capital deficiency of $3,819,056 at August 31, 2012.
Our current assets of $382,918 as at August 31, 2013, ($347,529 as of August 31, 2012) include the following items: cash $196,837 ($330,003 as of August 31, 2012); marketable securities Nil ($1 as of August 31, 2012); trade and other receivables $27,786 ($17,525 as of August 31, 2012); and prepaid expenses and deposits of $158,295 (Nil as of August 31, 2012).
Our current liabilities of $5,368,230 as of August 31, 2013($4,166,585 as of August 31, 2012) include the following items: trade and other payables $1,379,581 ($1,039,959 as of August 31, 2012); shareholders’ loans $2,108,205 ($2,179,778 as of August 31, 2012); secured note payable of $1,013,088 ($946,848 as of August 31, 2012); and derivative warrant liabilities of $688,803 (Nil as of August 31, 2012); and provisions $178,553 (Nil as of August 31, 2012).
At August 31, 2013 the Company had outstanding the following common share purchase warrants: 21,050,948 warrants exercisable at $0.04 per share; 19,150,000 warrants exercisable at $0.05 per share; 8,121,627 warrants exercisable at US$0.50 per share; and 1,025,983 warrants exercisable at US$0.25. If any of these common share purchase warrants are exercised it would generate additional capital for us.
Management of the Company recognizes that cash flow from operations is not sufficient to expand its oil and gas operations and reserves or meet its working capital requirements. The Company has liquidity risk which necessitates the Company to obtain debt financing, enter into joint venture arrangements, or raise equity. There is no assurance the Company will be able to obtain the necessary financing in a timely manner.
The Company’s past primary source of liquidity and capital resources has been proceeds from the issuance of share capital, shareholders’ loans and cash flow from oil and gas operations.
If the Company issued additional common shares from treasury it would cause the current shareholders of the Company dilution.
Outlook and Capital Requirements
A part of our oil and gas development program, we anticipate further expenditures to expand our existing portfolio of proved reserves. Amounts expended on future exploration and development is dependent on the nature of future opportunities evaluated by us. Any expenditure which exceeds available cash will be required to be funded by additional share capital or debt issued by us, or by other means. Our long-term profitability will depend upon our ability to successfully implement our business plan.
C. RESEARCH AND DEVELOPMENT, PATENTS AND LICENSES
We do not engage in research and development activities.
D. TREND INFORMATION
Seasonality
Our oil and gas operations is not a seasonal business, but increased consumer demand or changes in supply in certain months of the year can influence the price of produced hydrocarbons, depending on the circumstances. Production from our oil and gas properties is the primary determinant for the volume of sales during the year.
There are a number of trends that have been developing in the oil and gas industry during the past several years that appear to be shaping the near future of the business.
The first trend is the volatility of commodity prices. Natural gas is a commodity influenced by factors within North America. A tight supply demand balance for natural gas causes significant elasticity in pricing, whereas higher than average storage levels tend to depress natural gas pricing. Drilling activity, weather, fuel switching and demand for electrical generation are all factors that affect the supply-demand balance. Recently, liquefied natural gas shipments to North America have also resulted in natural gas supply and natural gas pricing being based more on factors other than supply and demand in North America. Changes to any of these or other factors create price volatility.
Crude oil is influenced by the world economy, Organization of the Petroleum Exporting Countries' ("OPEC") ability to adjust supply to world demand and weather. Political events also trigger large fluctuations in price levels. The current global financial crisis has reduced liquidity in financial markets thereby restricting access to financing and has caused significant volatility to commodity prices. Petroleum prices are expected to remain volatile for at least the near term as a result of market uncertainties over the supply and demand of these commodities due to the current state of the world economies, OPEC actions and the ongoing global credit and liquidity concerns.
The impact on the oil and gas industry from commodity price volatility is significant. During periods of high prices, producers generate sufficient cash flows to conduct active exploration programs without external capital. Increased commodity prices frequently translate into very busy periods for service suppliers triggering premium costs for their services. Purchasing land and properties similarly increase in price during these periods. During low commodity price periods, acquisition costs drop, as do internally generated funds to spend on exploration and development activities. With decreased demand, the prices charged by the various service suppliers also decline.
World oil and gas prices are quoted in United States dollars and the price received by Canadian producers is therefore effected by the Canadian/U.S. dollar exchange rate, which will fluctuate over time. Material increases in the value of the Canadian dollar may negatively impact production revenues from Canadian producers. Such increases may also negatively impact the future value of such entities' reserves as determined by independent evaluators. In recent years, the Canadian dollar has increased materially in value against the United States dollar although the Canadian dollar has recently decreased from such levels.
A second trend within the Canadian oil and gas industry is the "renewal" of private and small junior oil and gas companies starting up business. These companies often have experienced management teams from previous industry organizations that have disappeared as a part of the ongoing industry consolidation. Many are able to raise capital and recruit well qualified personnel. To the extent that this trend continues, we will have to compete with these companies and others to attract qualified personnel.
A third trend currently affecting the oil and gas industry is the impact on capital markets caused by investor uncertainty in the global economy. Market events and conditions in recent years including disruptions in the international credit markets and other financial systems and the deterioration of global economic conditions have caused significant volatility to commodity prices. These conditions caused a loss of confidence in the global credit and financial markets. Notwithstanding various actions by governments, concerns about the general condition of the capital markets, financial instruments, banks, investment banks, insurers and other financial institutions caused the broader credit markets to further deteriorate and stock markets to decline substantially. These factors have negatively impacted company valuations and may impact the performance of the global economy going forward. The recovery from the recession has been slow in various jurisdictions including in Europe and the United States and has been impacted by various ongoing factors including sovereign debt levels and high levels of unemployment which continue to impact commodity prices and result in high volatility in the stock market.
E. OFF-BALANCE SHEET ARRANGEMENTS
There are no off-balance sheet arrangements that have or are reasonably likely to have a current or future effect on our financial condition, changes of financial condition, revenues, or expenses, results of operations, liquidity, capital expenditures or capital resources, which individually or in the aggregate are material to our investors.
F. TABULAR DISCLOSURE OF CONTRACTUAL OBLIGATIONS
The following table illustrates the contractual maturities of financial liabilities:
| August 31, 2013 | | Payments Due by Period | |
| | | Total | | | Less than
1 year | | | 1-3 years | | | 4-5 years | | | After
5 years | |
| Trade and others payables | | $ | 1,379,581 | | | $ | 1,379,581 | | | | - | | | | - | | | | - | |
| Secured note payable (1) | | | 1,013,088 | | | | 1,013,088 | | | | - | | | | - | | | | - | |
| Shareholders loans (1) | | | 2,108,205 | | | | 2,108,205 | | | | - | | | | - | | | | - | |
| Total | | $ | 4,500,874 | | | $ | 4,500,874 | | | | - | | | | - | | | | - | |
Secured Notes Payable
At August 31, 2011 the Company had a secured promissory note payable to Source Re Work Program, Inc. (“Source”) in the amount of US$75,000. On September 1, 2011 the Company paid the secured promissory note of US$75,000 together with accrued interest to August 31, 2011 of US$6,250.
At August 31, 2013, the Company had a US$960,000, 10% per annum secured promissory note payable to Benchmark Enterprises LLC (August 31, 2012 US$960,000). The note and all unpaid and accrued interest was due on or before August 31, 2013, or within 15 days of written demand to the Company, or upon the Company closing a cash financing or series of cash financings in excess of US$2,500,000 in which case fifty cents of every one dollar exceeding US$2,500,000 will be allocated to the secured note until paid in full. As of the date of the consolidated financial statements, the Company had not received written demand for payment. For the year ended August 31, 2013 the Company recorded interest of $101,309 (August 31, 2012 $83,947). At August 31, 2013 included in trade and other payables is interest of $169,033 (August 31, 2012 $63,296). During the year ended August 31, 2012 the Company issued 1,030,812 common shares as full settlement of interest due in the amount of $103,021. The noteis secured by Zavala Inc’s interest in the Matthews Lease and Dyami Energy’s interest in the Murphy Lease, Zavala County, Texas (the “Leases”). The carrying value of their interests in the Leases at August 31, 2013 was $2,829,830 (August 31, 2012 $4,645,534). The Company may, in its sole discretion, prepay any portion of the principal amount.
Provisions
| | | Decommissioning
Provisions (Note a) | | | Other Provisions
(Note b) | | | Total Provisions | |
| Balance, August 31, 2011 | | $ | 64,688 | | | $ | 61,144 | | | $ | 125,832 | |
| Accretion expense | | | 2,464 | | | | - | | | | 2,464 | |
| Additions | | | 41,243 | | | | 64,866 | | | | 106,109 | |
| Change in estimate | | | 7,365 | | | | - | | | | 7,365 | |
| Foreign exchange | | | (1,005 | ) | | | (93 | ) | | | (1,098 | ) |
| Balance, August 31, 2012 | | | 114,755 | | | | 125,917 | | | | 240,672 | |
| Accretion expense | | | 3,071 | | | | - | | | | 3,071 | |
| Change in estimate | | | (5,104 | ) | | | - | | | | (5,104 | ) |
| Additions | | | - | | | | 169,196 | | | | 169,196 | |
| Reductions | | | - | | | | (125,917 | ) | | | (125,917 | ) |
| Foreign exchange | | | 7,020 | | | | 9,357 | | | | 16,377 | |
| Balance, August 31, 2013 | | $ | 119,742 | | | $ | 178,553 | | | $ | 298,295 | |
| a) | Decommissioning Obligations |
The Company’s decommissioning obligations result from its ownership interests in petroleum and natural gas assets including well sites, gathering systems and processing facilities. The total decommissioning obligation is estimated based on the Company’s net ownership interest in all wells and facilities, estimated costs to reclaim and abandon these wells and facilities, and the estimated timing of the costs to be incurred in future years. The Company has estimated the net present value of decommissioning obligations to be $119,742 at August 31, 2013 (August 31, 2012 $114,755) based on an undiscounted total future liability of $166,578 (August 31, 2012 $158,974). These payments are expected to be incurred between fiscal 2014 and 2031. The discount factor, being the risk free rate related to the liability is 3.09% (August 31, 2012 2.37%).
The above amounts have been classified as long term.
In February 2013, a vendor of Dyami Energy applied a lien on the Murphy #4 well and filed a claim in the District Court of Zavala County, Texas (Case No. 13-02-12941-ZCV) seeking payment of US$169,196 for services. Dyami Energy is disputing the amount on the basis of negligence by the vendor and he Company filed a counter claim. The full amount of the provision has been recorded and any legal costs will be expensed as incurred. The outcome of this claim is uncertain at this time.
The above amount has been classified as short term, however not discounted as the impact to the consolidated financial statements is considered immaterial.
In May 2012 a vendor of Dyami Energy filed a claim in the District Court of Harris County, Texas seeking payment of US$64,866. Dyami Energy was disputing the amount charged due to faulty equipment. The full amount of the provision which was accrued in the prior year 2012 has been reversed in 2013 as the vendor is no longer in good standing as a Texas corporation and the vendor’s attorney filed in the District Court of Harris County, Texas a motion to withdraw as counsel.
In December 2011, a vendor of Dyami Energy filed a claim in the District Court of Harris County, (Case No. 2011-74035/Court: 113) seeking payment of US$62,800. Dyami Energy disputed the claim on the basis of excessive charges. In December 2013 an agreed final judgment in favor of the vendor was entered into court in the amount of $42,803 and post judgment interest at 5% per annum until paid in full.
Derivative Warrant Liabilities
The Company has warrants issued with an exercise price in US dollars which are different from the functional currency of the Company (Canadian Dollars) and accordingly the warrants are treated as a financial liability and the fair value movement during the period is recognized in the profit or loss.
The following table sets out the changes in derivative warrant liabilities during the respective periods.
| | | Number of
Warrants* | | | Fair Value
Assigned | | | Average Exercise
Price US $ | |
| As at August 31, 2011 | | | 4,409,178 | | | $ | 1,576,269 | | | $ | 0.52 | |
| Warrants expired | | | (990,712 | ) | | | (318,552 | ) | | | 0.58 | |
| Warrants issued | | | 5,287,500 | | | | 799,520 | | | | 0.50 | |
| Broker warrants issued | | | 846,000 | | | | 212,001 | | | | 0.25 | |
| Warrants cancelled | | | (1,709,234 | ) | | | (675,487 | ) | | | 0.50 | |
| Change in fair value estimates | | | - | | | | 46,655 | | | | - | |
| As at August 31, 2012 | | | 7,842,732 | | | | 1,640,406 | | | | 0.47 | |
| Warrants issued | | | 1,124,895 | | | | 163,541 | | | | 0.50 | |
| Broker warrants issued | | | 179,983 | | | | 44,895 | | | | 0.25 | |
| Change in fair value estimates | | | - | | | | 128,041 | | | | - | |
| As at August 31, 2013 | | | 9,147,610 | | | | 1,976,883 | | | $ | 0.50 | |
* Reflects the March 16, 2012 two-for-one stock split
On August 31, 2010, the Company issued 3,418,468 common share purchase warrants exercisable at US$0.50 per common share until August 31, 2014. On August 31, 2012 1,709,234 common share purchase warrants were cancelled and the fair value measured using the Black Scholes valuation model was $675,487. The remaining 1,709,232 warrants, translated at the current exchange rate have been reclassified as short term.
On December 10, 2011 593,808 warrants expired and the fair value measured using the Black Scholes valuation model of $179,113 was recorded as an increase to contributed surplus.
On June 10, 2012 296,904 warrants expired and the fair value measured using the Black Scholes valuation model of $99,999 was recorded as an increase to contributed surplus.
On May 4, 2012, 100,000 expired and the fair value measured using the Black Scholes valuation model of $39,440 was recorded as an increase to contributed surplus.
On April 13, 2012 and July 27, 2012 the Company issued 1,875,000 common share purchase warrants exercisable at US$0.50 and 300,000 common share purchase broker warrants exercisable at US$0.25 expiring April 13, 2015. The fair value measured using the Black Scholes valuation model was $338,813 and $92,114, respectively.
On July 20, 2012 the Company issued 912,500 common share purchase warrants exercisable at US$0.50 and 146,000 common share purchase broker warrants exercisable at US$0.25 expiring July 20, 2015. The fair value measured using the Black Scholes valuation model was $124,288 and $33,454, respectively.
On August 7, 2012 the Company issued 2,500,000 common share purchase warrants exercisable at US$0.50 and 400,000 common share purchase broker warrants exercisable at US$0.25 expiring August 7, 2015. The fair value measured using the Black Scholes valuation model was $336,419 and $86,433, respectively.
On September 25, 2012 the Company issued 1,124,895 common share purchase warrants exercisable at US$0.50 and 179,983 common share purchase broker warrants exercisable at US$0.25 expiring September 25, 2015. The fair value measured using the Black Scholes valuation model was $163,541 and $45, 895, respectively.
The following tables sets out the number of derivative warrant liabilities outstanding at August 31, 2013:
Number of
Warrants* | | | Exercise Price
US ($)* | | | Expiry
Date | | Weighted Average
Remaining
Life (Years) | | | Fair Value
CDN ($) | |
| | 1,709,232 | | | $ | 0.50 | | | August 31, 2014 | | | 1.00 | | | $ | 688,803 | |
| | 1,875,000 | | | $ | 0.50 | | | April 13, 2015 | | | 1.62 | | | | 355,208 | |
| | 300,000 | | | $ | 0.25 | | | April 13, 2015 | | | 1.62 | | | | 96,629 | |
| | 912,500 | | | $ | 0.50 | | | July 20, 2015 | | | 1.88 | | | | 129,683 | |
| | 146,000 | | | $ | 0.25 | | | July 20, 2015 | | | 1.88 | | | | 34,906 | |
| | 2,500,000 | | | $ | 0.50 | | | August 7, 2015 | | | 1.93 | | | | 355,685 | |
| | 400,000 | | | $ | 0.25 | | | August 7, 2015 | | | 1.93 | | | | 91,542 | |
| | 1,124,895 | | | $ | 0.50 | | | September 25, 2015 | | | 2.07 | | | | 176,087 | |
| | 179,983 | | | $ | 0.25 | | | September 25, 2015 | | | 2.07 | | | | 48,340 | |
| | 9,147,610 | | | | | | | | | | 1.70 | | | | 1,976,883 | |
The following tables sets out the number of derivative warrant liabilities outstanding at August 31, 2012:
Number of
Warrants* | | | Exercise
Price US
($)* | | | Expiry
Date | | Weighted Average
Remaining
Life (Years) | | | Fair Value
CDN ($) | |
| | 1,709,232 | | | $ | 0.50 | | | August 31, 2014 | | | 2.00 | | | $ | 643,766 | |
| | 1,875,000 | | | $ | 0.50 | | | April 13, 2015 | | | 2.62 | | | | 333,975 | |
| | 300,000 | | | $ | 0.25 | | | April 13, 2015 | | | 2.62 | | | | 90,852 | |
| | 912,500 | | | $ | 0.50 | | | July 20, 2015 | | | 2.88 | | | | 121,203 | |
| | 146,000 | | | $ | 0.25 | | | July 20, 2015 | | | 2.88 | | | | 32,624 | |
| | 2,500,000 | | | $ | 0.50 | | | August 7, 2015 | | | 2.93 | | | | 332,428 | |
| | 400,000 | | | $ | 0.25 | | | August 7, 2015 | | | 2.93 | | | | 85,558 | |
| | 7,842,732 | | | | | | | | | | 2.20 | | | $ | 1,640,406 | |
* Reflects the March 16, 2012 two-for-one stock split
The fair value of the warrants issued during the year ended August 31, 2013 and 2012, were estimated using the Black-Scholes pricing model with the following assumptions:
| Black-Scholes Assumptions used | | 2013 | | | 2012 | |
| Risk-free interest rate | | | 1.5 | % | | | 1%-1.3% | |
| Expected volatility | | | 217 | % | | | 192%-199% | |
| Expected life (years) | | | 3 | | | | 3 | |
| Dividend yield | | | - | | | | - | |
G. SAFE HARBOR
Certain statements in Sections 5.E and 5.F of this Annual Report may constitute "forward looking statements" within the meaning of the United States Private Securities Litigation Reform Act of 1995, Section 21E of the United States Securities Exchange Act of 1934, as amended, and Section 27A of the United States Securities Act of 1933, as amended. Such statements are generally identifiable by the terminology used such as "plans", "expects", "estimates", "budgets", "intends", "anticipates", "believes", "projects", "indicates", "targets", "objective", "could", "may", or other similar words. The forward-looking statements are subject to known and unknown risks and uncertainties and other factors that may cause actual results, levels of activity and achievements to differ materially from those expressed or implied by such statements. Readers should not place undue reliance on any forward-looking statement and should recognize that the statements are predictions of future results, which may not occur as anticipated.
ITEM 6. DIRECTORS, SENIOR MANAGEMENT AND EMPLOYEES
A. DIRECTORS AND SENIOR MANAGEMENT
The following table sets forth the names of all of our directors and executive officers as of the date of the filing of this Annual Report, with each position and office held by them in our Company, and the period of their service as a director or as an officer.
| Name | | Age | | Position with the Company | | Date First Elected as Director |
| James Cassina | | | 57 | | President, Chief Executive Officer, Chief Financial Officer and Director | | February 9, 2010 |
| Milton Klyman | | | 88 | | Director | | November 15, 1996 |
| Colin McNeil | | | 67 | | Director | | June 18, 2010 |
| Alan D. Gaines | | | 58 | | Director | | January 25, 2012 |
All of our directors serve until our next Annual General Meeting or until a successor is duly elected, unless the office is vacated in accordance with our Articles or Bylaws. Subject to the terms of their employment agreements, if any, executive officers are appointed by the Board of Directors to serve until the earlier of their resignation or removal, with or without cause by the directors. James Cassina, our sole executive officer, devotes approximately 75% of his work time to his duties as an officer and director.
There are no family relationships between any of our directors or executive officers. There are no arrangements or understandings between any two or more directors or executive officers.
Mr. Cassina has been an officer since June 18, 2010 a director of ours since February 9, 2010. Mr. Cassina is an officer of Dyami Energy LLC our Texas subsidiary. As Chairman of Assure Energy, Inc. (“Assure”) (OTCBB: ASUR), an oil and gas exploration and production company, Mr. Cassina led Assure’s merger in September 2005 with Geocan Energy Inc. (TSX: GCA) (“Geocan”), an oil and gas company which then grew to daily production of over 3,700 barrels of oil or gas equivalents. Mr. Cassina thereafter served as a Director of Geocan and later Chairperson of its Board appointed Special Advisory Committee formed to seek strategic alternatives to enhance shareholder value. Subsequently Geocan merged with Arsenal Energy Inc. in October 2008. Mr. Cassina served in various senior capacities, including President, and Director from 1999 to 2002 and then Chairman until March 2007 of EnerNorth Industries Inc. (AMEX: ENY), an international enterprise engaged in engineering and offshore fabrication, oil and gas exploration and production, and in India, independent power project development.
Mr. Milton Klyman has been a director of ours since November 15, 1996. Mr. Klyman was also our Treasurer from December 31, 2003 to December 28, 2007. From February 27, 2009 to present, Mr. Klyman has been a director of 1354166 Alberta Ltd., our Alberta subsidiary. Mr. Klyman is a self-employed financial consultant and has been a Chartered Accountant since 1952. Mr. Klyman is a Life Member of the Canadian Institute of Chartered Accountants. Mr. Klyman serves as a director on the board of Western Troy Capital Resources Inc Mr. Klyman served as a director of the EnerNorth from April 2001 until March 21, 2007.
On March 20, 2007 EnerNorth filed an Assignment in Bankruptcy under the Bankruptcy and Insolvency Act (Canada).
Mr. Colin McNeil has been a director of ours since June 18, 2010. Mr. McNeil is a self-employed oil and gas consultant and has been a geophysicist since 1972. Mr. McNeil has managed exploration programs and structured technical assessments for companies in the Middle East, Africa, Asia, Central and South America, the Arctic, and Canada.Mr. McNeil is a member of the Association of Professional, Engineers, Geologists and Geophysicists of Alberta, Society of Exploration Geophysicists, Canadian Society of Exploration Geophysicists, American Association of Petroleum Geologists and the Canadian Society of Petroleum Geologists.
Mr. Alan D. Gaines, B.B.A, M.B.A was appointed to the Board of Directors of Eagleford Energy on January 25, 2012. Mr. Gaines has approximately 30 years of experience as an energy investment and merchant banker, and has participated in raising significant debt and equity during his career. The notable experience of Mr. Gaines extends to operations as well. Mr. Gaines founded and served as CEO of Dune Energy from inception in May 2001 through May 2007. In May 2007, Dune Energy completed the acquisition of Goldking Energy Corporation for $327 million, raising total proceeds of $540 million in senior notes and convertible preferred stock, as well as refinancing existing indebtedness in conjunction with the acquisition. Concurrent with the closing of the Goldking transaction, new operating management, including a new CEO, was hired by Dune Energy to oversee day to day operations. Mr. Gaines retained his title of Chairman of the Board.
B. COMPENSATION
Executive Compensation
The following table presents a summary of all annual and long-term compensation paid or accrued by us including our subsidiaries, for services rendered to us by our executive officers and directors in any capacity for the year ended August 31, 2013.
| Summary Compensation Table (CDN$) |
Name and Principal
Position | | Year | | | Salary(1) | | | Option
Based
Awards(2) | | | All Other
Compensation(3) | | | Total
Compensation | |
| | | | | | ($) | | | ($) | | | ($) | | | ($) | |
James Cassina, Chief Executive Officer, President and Director(4) | | | 2013 | | | $ | 75,000 | | | | - | | | $ | 1,000 | | | $ | 76,000 | |
| Milton Klyman, Director | | | 2013 | | | | - | | | | - | | | $ | 900 | | | $ | 900 | |
| Colin McNeil, Director | | | 2013 | | | | - | | | | - | | | $ | 900 | | | $ | 900 | |
| Alan D. Gaines, Director | | | 2013 | | | | - | | | | - | | | $ | 400 | | | $ | 400 | |
| | | | | | | | | | | | | | | | | | | | | |
| (2) | These amounts represent the value of stock options granted. The fair value of the option grated is estimated on the date of grant using the Black Scholes option pricing model taking into account the following assumptions: (i) risk free interest rate (%); (ii) expected life (years); (iii) expected volatility (%). This is consistent with the accounting values used in the Company’s consolidated financial statements. The dollar amount in the column represents the total value ascribed to the stock options. |
| (3) | Accrued on account of directors fees at a rate of $100 per meeting. |
Outstanding Option-Based Awards
The following table sets forth the outstanding option-based awards for the Company held by executive officers and directors at August 31, 2013.
| | | Option-based Awards (CDN$) | |
| Name | | Number of
Securities
underlying
unexercised options
(#) (1) | | | Option
exercise price | | | Option expiration
date | | Value of in-the-
money options (2)
(3) | |
| James Cassina, Chief Executive Officer, President and Director | | | 200,000 | | | $ | 0.16 | | |
February 28, 2017 | | $ | - | |
| Milton Klyman, Director | | | 200,000 | | | $ | 0.16 | | | February 28, 2017 | | $ | - | |
| Colin McNeil, Director | | | 200,000 | | | $ | 0.16 | | | February 28, 2017 | | $ | - | |
| (1) | On March 1, 2012, the Company granted options to purchase 600,000 common shares to directors. These options are exercisable at $0.16 per share, vest immediately and expire on February 28, 2017. |
| (2) | Calculated using the closing price of the Company’s common shares of the OTCBB on August 30, 2013 of US$0.03 and subtracting the exercise price of in-the-money stock options. |
| (3) | Converted to Canadian dollars using the Bank of Canada noon exchange rate on August 30, 2013. |
Compensation Discussion and Analysis
Objective of the Compensation Program
The objectives of the Company's compensation program are to attract, hold and inspire performance of its named executive officers (“NEOs”) of a quality and nature that will enhance the sustainable profitability and growth of the Company. The Company views it as an important objective of the Company's compensation program to ensure staff retention.
The Compensation Review Process
To determine compensation payable, the compensation committee of the Company (the "Compensation Committee") determines an appropriate compensation reflecting the need to provide incentive and compensation for the time and effort expended by the NEOs of the Company while taking into account the financial and other resources of the Company.
The Company’s Compensation Committee is comprised of Milton Klyman (Chair) and Colin McNeil. The Compensation Committee is comprised entirely of independent directors. Compensation is determined in the context of our strategic plan, our growth, shareholder returns and other achievements and considered in the context of position descriptions, goals and the performance of each NEO. With respect to directors’ compensation, the Compensation Committee reviews the level and form of compensation received by the directors, members of each committee, the board chair and the chair of each board committee, considering the duties and responsibilities of each director, his or her past service and continuing duties in service to us. The compensation of directors, the CEO and executive officers of competitors are considered, to the extent publicly available, in determining compensation and the Compensation Committee has the power to engage a compensation consultant or advisor to assist in determining appropriate compensation.
Elements of Executive Compensation
The Company's NEO compensation program is based on the objectives of: (a) recruiting and retaining the executives critical to the success of the Company; (b) providing fair and competitive compensation; (c) balancing the interests of management and shareholders of the Company; and (d) rewarding performance, on the basis of both individual and corporate performance.
For the financial year ended August 31, 2013, the Company's NEO compensation program consisted of the following elements:
| (a) | a management fee (the "Short-Term Incentive"). |
| (b) | a long-term equity compensation consisting of stock options granted under the Company's stock incentive plan ("Long-Term Incentive"). |
The specific rationale and design of each of these elements are outlined in detail below.
Short-Term Incentive
Salaries form an essential element of the Company's compensation mix as they are the first base measure to compare and remain competitive relative to peer groups. Base salaries are fixed and therefore not subject to uncertainty and are used as the base to determine other elements of compensation and benefits. The base salary provides an immediate cash incentive for the Named Executive Officers. The Compensation Committee and the Board review salaries at least annually.
Base salary/management fees of the Named Executive Officers is set by the Compensation Committee on the basis of the applicable officer’s responsibilities, experience and past performance. In determining the base salary to be paid to a particular Named Executive Officer, the Compensation Committee considers the particular responsibilities related to the position, the experience level of the officer, and his or her past performance at the Company and the current financial position of the Company.
Long-Term Incentive
The granting of stock options is a variable component of compensation intended to reward the Company's Named Executive Officers for their success in achieving sustained, long-term profitability and increases in stock value. Stock options ensure that the Named Executive Officers are motivated to achieve long-term growth of the Company and continuing increases in shareholder value. In terms of relative emphasis, the Company places more importance on stock options.
The Company provides long-term incentive compensation through its stock option plan. The Compensation Committee recommends the granting of stock options from time to time based on its assessment of the appropriateness of doing so in light of the long-term strategic objectives of the Company, its current stage of development, the need to retain or attract particular key personnel, the number of stock options already outstanding and overall market conditions. The Compensation Committee views the granting of stock options as a means of promoting the success of the Company and higher returns to its shareholders. The Board grants stock options after reviewing recommendations made by the Compensation Committee.
Stock Option Plan
The Company’s Amended Stock Option Plan (the "Plan") was adopted by the board of directors on January 20, 2012 and approved by a majority of our shareholders voting at the Annual and Special Meeting held on February 24, 2012. The Plan was adopted in order that we may be able to provide incentives for directors, officers, employees, consultants and other persons (an "Eligible Individual") to participate in our growth and development by providing us with the opportunity through share options to acquire an ownership interest in us. Directors and officers currently are not remunerated for their services except as stated in "Executive Compensation" above.
The maximum number of common shares which may be set aside for issue under the Plan is an amount not to exceed 20% of the total shares issued and outstanding of the Company as of the date of each Option grant provided that the board has the right, from time to time, to increase such number subject to the approval of our shareholders and any relevant stock exchange or other regulatory authority. Any common shares subject to an option, which are not exercised, will be available for subsequent grant under the Plan. The option price of any common shares is to be determined by the Board in its sole discretion.
Options granted under the Plan may be exercised during a period no exceeding five years, subject to earlier termination upon the optionee ceasing to be an Eligible Individual, or, in accordance with the terms of the grant of the option. The options are non-transferable and non-assignable except between an Eligible Individual and a related corporation controlled by such Eligible Individual upon the consent of the board of directors. The Plan contains provisions for adjustment in the number of shares issuable there under in the event of subdivision, consolidation, reclassification, reorganization or change in the number of common shares, a merger or other relevant change in the Company’s capitalization. The board of directors may from time to time amend or revise the terms of the Plan or may terminate the Plan at any time. The Company does not have any other long-term incentive plans, including any supplemental executive retirement plans.
Overview of How the Compensation Program Fits with Compensation Goals
The compensation package is designed to meet the goal of attracting, holding and motivating key talent in a highly competitive oil and gas exploration environment through salary and providing an opportunity to participate in the Company’s growth through stock options. Through the grant of stock options, if the price of the Company shares increases over time, both the Named Executive Officer and shareholders will benefit.
Incentive Plan Awards
At August 31, 2013 the Company has outstanding 600,000 stock options exercisable at $0.16 until February 28, 2017 to Named Executive Officers and directors.
Pension Plan Benefits
The Company does not currently provide pension plan benefits to its Named Executive Officers.
Termination and Change of Control Benefits
The Company does not currently have executive employment agreements in place with any of its Named Executive Officers.
The Company has no compensatory plan, contract or arrangement where a named executive officer or director is entitled to receive compensation in the event of resignation, retirement, termination, change of control or a change in responsibilities following a change in control.
Director Compensation
Each director of the Company is entitled to receive the sum of $100 for each meeting of the directors, meeting of a committee of the directors or meeting of the shareholders attended. During the fiscal year ended August 31, 2013 no amount was paid by the Company with respect to such fees.
Retirement Policy for Directors
The Company does not have a retirement policy for its directors.
Directors’ and Officers’ Liability Insurance
The Company does not maintain directors’ and officers’ liability insurance.
Board of Directors
The mandate of our board of directors, prescribed by the Business Corporations Act (Ontario), is to manage or supervise the management of our business and affairs and to act with a view to our best interests. In doing so, the board oversees the management of our affairs directly and through its committees.
The term of Mr. Klyman as a director began on August 10, 2000. Mr. Cassina was appointed as a director on February 9, 2010, Mr. McNeil who was appointed on June 18, 2010 and Mr. Gaines was appointed as a director on January 25, 2012. Our directors’ serve until our next Annual General Meeting or until a successor is duly elected, unless the office is vacated in accordance with our Articles or Bylaws. Our sole executive officer was appointed by our Board of Directors to serve until the earlier of his resignation or removal, with or without cause by the directors. There was no compensation paid by us to our directors during the fiscal year ended August 31, 2013 for their services in their capacity as directors or any compensation paid to committee members.
As of the date of this Annual Report our board of directors consists of four directors, three of which are "independent directors" in that they are "independent from management and free from any interest and any business or other relationship which could, or could reasonably be perceived to, materially interfere with the directors ability to act with a view to our best interests, other than interests and relationships arising from shareholding". The independent directors are Milton Klyman, Colin McNeil and Mr. Gaines. It is our practice to attempt to maintain a diversity of professional and personal experience among our directors.
The independent directors of the Company do not hold regularly scheduled meetings at which non-independent directors and members of management are not in attendance. The Company holds meetings as required, at which the opinions of the independent directors are sought and duly acted upon for all material matters relating to the Company.
Directorships
The following directors of ours are directors of other Canadian or United States reporting issuers as follows:
| Milton Klyman | Western Troy Capital Resources Inc. |
Board and Committee Meetings
The board of directors has met at least once annually or otherwise as circumstances warrant to review our business operations, corporate governance and financial results. The table below reflects the attendance of each director of ours at each Board and committee meeting of the Board during the fiscal year ended August 31, 2013.
| Name | | Board of
Directors
Meetings | | Audit
Committee
Meetings | | Compensation
Committee
Meetings | | Petroleum and
Natural Gas
Committee
Meetings | | Disclosure
Committee
Meetings |
| Milton Klyman | | 4 | | 4 | | Nil | | 1 | | Nil |
| James Cassina | | 4 | | 4 | | Nil | | 1 | | Nil |
| Colin McNeil | | 4 | | 4 | | Nil | | 1 | | Nil |
| Alan D. Gaines | | 4 | | Nil | | Nil | | Nil | | Nil |
Board Mandate
The Board assumes responsibility for stewardship of the Company, including overseeing all of the operation of the business, supervising management and setting milestones for the Company. The Board reviews the statements of responsibilities for the Company including, but not limited to, the code of ethics and expectations for business conduct.
The Board approves all significant decisions that affect the Company and its subsidiaries and sets specific milestones towards which management directs their efforts.
The Board ensures, at least annually, that there are long-term goals and a strategic planning process in place for the Company and participates with management directly or through its committees in developing and approving the mission of the business of the Company and the strategic plan by which it proposes to achieve its goals, which strategic plan takes into account, among other things, the opportunities and risks of the Company's business. The strategic planning process is carried out at each Board meeting where there are regularly reviewed specific milestones for the Company.
The strategic planning process incorporates identifying the main risks to the Company's objectives and ensuring that mitigation plans are in place to manage and minimize these risks. The Board also takes responsibility for identifying the principal risks of the Company's business and for ensuring these risks are effectively monitored and mitigated to the extent practicable. The Board appoints senior management.
The Company adheres to regulatory requirements with respect to the timeliness and content of its disclosure. The Board approves all of the Company's major communications, including annual and quarterly reports and press releases. The Chief Executive Officer authorizes the issuance of news releases. The Chief Executive Officer is generally the only individual authorized to communicate with analysts, the news media and investors about information concerning the Company.
The Board and the audit committee of the Company (the"Audit Committee") examines the effectiveness of the Company's internal control processes and information systems.
The Board as a whole, given its small size, is involved in developing the Company's approach to corporate governance. The number of scheduled board meetings varies with circumstances. In addition, special meetings are called as necessary. The Chief Executive Officer establishes the agenda at each Board meeting and submits a draft to each director for their review and recommendation for items for inclusion on the agenda. Each director has the ability to raise subjects that are not on the agenda at any board meeting. Meeting agendas and other materials to be reviewed and/or discussed for action by the Board are distributed to directors in time for review prior to each meeting. Board members have full and free access to senior management and employees of the Company.
Position Descriptions
The Board has not developed written position descriptions for the Chairman of the Board or the Chief Executive Officer. The Board is currently of the view that the respective corporate governance roles of the Board and management, as represented by the Chief Executive Officer, are clear and that the limits to management's responsibility and authority are well-defined.
Each of the Audit Committee, Compensation Committee, Disclosure Committee and a Petroleum and Natural Gas Committee has a chair and a mandate.
Orientation and Continuing Education
We have developed an orientation program for new directors including a director’s manual ("Director’s Manual") which contains information regarding the roles and responsibilities of the board, each board committee, the board chair, the chair of each board committee and our president. The Director’s Manual contains information regarding its organizational structure, governance policies including the Board Mandate and each Board committee charter, and our code of business conduct and ethics. The Director’s Manual is updated as our business, governance documents and policies change. We update and inform the board regarding corporate developments and changes in legal, regulatory and industry requirements affecting us.
Ethical Business Conduct
We have adopted a written code of business conduct and ethics (the "Code") for our directors, officers and employees. The board encourages following the Code by making it widely available. It is distributed to directors in the Director’s Manual and to officers, employees and consultants at the commencement of their employment or consultancy. The Code reminds those engaged in service to us that they are required to report perceived or actual violations of the law, violations of our policies, dangers to health, safety and the environment, risks to our property, and accounting or auditing irregularities to the chair of the Audit Committee who is an independent director of ours. In addition, to requiring directors, officers and employees to abide by the Code, we encourage consultants, service providers and all parties who engage in business with us to contact the chair of the Audit Committee regarding any perceived and all actual breaches by our directors, officers and employees of the Code. The chair of our Audit Committee is responsible for investigating complaints, presenting complaints to the applicable board committee or the board as a whole, and developing a plan for promptly and fairly resolving complaints. Upon conclusion of the investigation and resolution of a complaint, the chair of our Audit Committee will advise the complainant of the corrective action measures that have been taken or advise the complainant that the complaint has not been substantiated. The Code prohibits retaliation by us, our directors and management, against complainants who raise concerns in good faith and requires us to maintain the confidentiality of complainants to the greatest extent practical. Complainants may also submit their concerns anonymously in writing. In addition to the Code, we have an Audit Committee Charter and a Policy of Procedures for Disclosure Concerning Financial/Accounting Irregularities.
Since the beginning of our most recently completed financial year, no material change reports have been filed that pertain to any conduct of a director or executive officer that constitutes a departure from the Code. The board encourages and promotes a culture of ethical business conduct by appointing directors who demonstrate integrity and high ethical standards in their business dealings and personal affairs. Directors are required to abide by the Code and expected to make responsible and ethical decisions in discharging their duties, thereby setting an example of the standard to which management and employees should adhere. The board is required by the Board Mandate to satisfy our CEO and other executive officers are acting with integrity and fostering a culture of integrity throughout the Company. The board is responsible for reviewing departures from the Code, reviewing and either providing or denying waivers from the Code, and disclosing any waivers that are granted in accordance with applicable law. In addition, the board is responsible for responding to potential conflict of interest situations, particularly with respect to considering existing or proposed transactions and agreements in respect of which directors or executive officers advise they have a material interest. The Board Mandate requires that directors and executive officers disclose any interest and the extent, no matter how small, of their interest in any transaction or agreement with us, and that directors excuse themselves from both board deliberations and voting in respect of transactions in which they have an interest. By taking these steps the board strives to ensure that directors exercise independent judgment, unclouded by the relationships of the directors and executive officers to each other and us, in considering transactions and agreements in respect of which directors and executive officers have an interest.
Nomination of Directors
The Board has not appointed a nominating committee and does not believe that such a committee is warranted at the present time. The entire Board determines new nominees to the Board, although a formal process has not been adopted. The nominees are generally the result of recruitment efforts by the Board members, including both formal and informal discussions among Board members and officers. The Board generally looks for the nominee to have direct experience in the oil and gas business and significant public company experience. The nominee must not have a significant conflicting public company association.
Compensation
The Board determines director and executive officer compensation by recommendation of the Compensation Committee. The Company's Compensation Committee reviews the amounts and effectiveness of compensation. Each of the members of the Compensation Committee are independent. The Board reviews the adequacy and form of compensation and compares it to other companies of similar size and stage of development. There is no minimum share ownership requirement of directors.
The Compensation Committee generally convenes at least once annually to review director and officer compensation and status of stock options. The Compensation Committee also responds to requests from management and the Board to review recommendations of management for new senior employees and their compensation. The Compensation Committee has the power to approve and/or amend these recommendations.
The Company has felt no need to retain any compensation consultants or advisors at any time since the beginning of the Company's most recently completed financial year.
Committees of the Board
Our board of directors discharges its responsibilities directly and through committees of the board of directors, currently consisting of the Audit Committee, a compensation committee (the "Compensation Committee"), a disclosure committee (the "Disclosure Committee") and a petroleum and natural gas committee (the "Petroleum and Natural Gas Committee").
Each of the Audit Committee, Disclosure Committee and the Petroleum and Natural Gas Committee consists of a majority of independent directors, while the Compensation Committee consists of independent directors. Each Committee has a specific mandate and responsibilities, as reflected in the charters for each committee.
Audit Committee
The mandate of the Audit Committee is formalized in a written charter. The members of the Audit Committee are James Cassina, Milton Klyman (Chair) and Colin McNeil. Based on his professional certification and experience, the board has determined that Milton Klyman is an Audit Committee Financial Expert and that James Cassina and Colin McNeil are financially literate. The Audit Committee's primary duties and responsibilities are to serve as an independent and objective party to monitor our financial reporting process and control systems, review and appraise the audit activities of our independent auditors, financial and senior management, and the lines of communication among the independent auditors, financial and senior management, and the board of directors for financial reporting and control matters including investigating fraud, illegal acts or conflicts of interest.
Compensation Committee
The mandate of the Compensation Committee is formalized in a written charter. The members of the Compensation Committee are Colin McNeil and Milton Klyman (Chair). The Compensation Committee is comprised entirely of independent directors. Compensation is determined in the context of our strategic plan, our growth, shareholder returns and other achievements and considered in the context of position descriptions, goals and the performance of each individual director and officer. With respect to directors’ compensation, the Compensation Committee reviews the level and form of compensation received by the directors, members of each committee, the board chair and the chair of each board committee, considering the duties and responsibilities of each director, his or her past service and continuing duties in service to us. The compensation of directors, the CEO, CFO and executive officers of competitors are considered, to the extent publicly available, in determining compensation and the Compensation Committee has the power to engage a compensation consultant or advisor to assist in determining appropriate compensation.
Disclosure Committee
The mandate of the Disclosure Committee is formalized in a written charter. The members of the Disclosure Committee are Milton Klyman, Colin McNeil and James Cassina (Chair). The Committee's duties and responsibilities include, but are not limited to, review and revise our controls and other procedures ("Disclosure and Controls Procedures") to ensure that (i) information required by us to be disclosed to the applicable regulatory authorities and other written information that we will disclose to the public is reported accurately and on a timely basis, and (ii) such information is accumulated and communicated to management, as appropriate to allow timely decisions regarding required disclosure; assist in documenting and monitoring the integrity and evaluating the effectiveness of the Disclosure and Control Procedures; the identification and disclosure of material information about us, the accuracy completeness and timeliness of our financial reports and all communications with the investing public are timely, factual and accurate and are conducted in accordance with applicable legal and regulatory requirements.
Petroleum and Natural Gas Committee
The members of the Petroleum and Natural Gas Committee are Milton Klyman, James Cassina and Colin McNeil (Chair). The Petroleum and Natural Gas Committee has the responsibility of meeting with the independent engineering firms commissioned to conduct the reserves evaluation on our oil and natural gas assets and to discuss the results of such evaluation with each of the independent engineers and management. Specifically, the Petroleum and Natural Gas Committee’s responsibilities include, but are not limited to, a review of management’s recommendations for the appointment of independent engineers, review of the independent engineering reports and considering the principal assumptions upon which such reports are based, appraisal of the expertise of the independent engineering firms retained to evaluate our reserves, review of the scope and methodology of the independent engineers’ evaluations, reviewing any problems experienced by the independent engineers in preparing the reserve evaluation, including any restrictions imposed by management or significant issues on which there was a disagreement with management and a review of reserve additions and revisions which occur from one report to the next.
Assessments
The board assesses, on an annual basis, the contributions of the board as a whole, the Audit Committee and each of the individual directors, in order to determine whether each is functioning effectively. The board monitors the adequacy of information given to directors, communication between the board and management and the strategic direction and processes of the board and committees. The Audit Committee will annually review the Audit Committee Charter and recommend, if any, revisions to the board as necessary.
Relevant Education and Experience of Audit Committee Members
Milton Klyman is the Chairman of the Audit Committee. He is a self-employed financial consultant and has been a Chartered Accountant since 1952. Milton Klyman is a Life Member of the Institute of Chartered Accountants of Ontario, a Life member of the Canadian Institute of Mining Metallurgy and Petroleum and a Fellow of the Institute of Chartered Secretaries and Administrators.
James Cassina is a consultant in business development, mergers and acquisitions and corporate finance. James Cassina has served as a director and held various executive positions with public companies.
Colin McNeil is an independent consulting geophysicist and has managed exploration programs and structured technical assessments for companies in the Middle East, Africa, Asia, Central and South America, the Arctic, and Canada Colin McNeil has served as a director and held various positions with public and private companies.
Audit Committee Charter
| • | Our Audit Committee Charter (the “Charter”) has been adopted by our board of directors. The Audit Committee of the board (the “Committee”) will review and reassess this charter annually and recommend any proposed changes to the board for approval. The Audit Committee’s primary duties and responsibilities are to: |
| • | Oversee (i) the integrity of our financial statements; (ii) our compliance with legal and regulatory requirements; and (iii) the independent auditors’ qualifications and independence. |
| • | Serve as an independent and objective party to monitor our financial reporting processes and internal control systems. |
| • | Review and appraise the audit activities of our independent auditors and the internal auditing functions. |
| • | Provide open lines of communication among the independent auditors, financial and senior management, and the board for financial reporting and control matters. |
Role and Independence: Organization
The Committee assists the board on fulfilling its responsibility for oversight of the quality and integrity of our accounting, auditing, internal control and financial reporting practices. It may also have such other duties as may from time to time be assigned to it by the board.
The Audit Committee is to be comprised of at least three directors. The majority of the Committee members must be independent from management and free from any relationship that, in the opinion of the Board, would interfere with the exercise of his or her independent judgment as a member of the Committee.
All members shall, to the satisfaction of the board, be financially literate (i.e. will have the ability to read and understand a balance sheet, an income statement, a cash flow statement and the notes attached thereto), and at least one member shall have accounting or related financial management expertise to qualify as “financially sophisticated”. A person will qualify as “financially sophisticated” if an individual who possesses the following attributes:
| • | an understanding of financial statements and generally accepted accounting principles; |
| • | an ability to assess the general application of such principles in connection with the accounting for estimates, accruals and reserves; |
| • | experience preparing, auditing, analyzing or evaluating financial statements that present a breadth and level of complexity of accounting issues that are generally comparable to the breadth and complexity of issues that can reasonably be expected to be raised by our financial statements, or experience actively supervising one or more persons engaged in such activities; |
| • | an understanding of internal controls and procedures for financial reporting; and |
| • | an understanding of audit committee functions. |
Colin McNeil and Milton Klyman are “independent” as defined by the Securities and Exchange Commission, and the Board has determined that Milton Klyman is an “audit committee financial expert” as defined in Item 401(h) of Regulation S-K promulgated by the Securities and Exchange Commission.
The Committee members will be elected annually at the first meeting of the Board following the annual meeting of shareholders. Each member of the Committee serves during the pleasure of the Board and, in any event, only so long as he or she is a director.
One member of the Committee shall be appointed as chair. The chair shall be responsible for leadership of the Committee, including scheduling and presiding over meetings and making regular reports to the Board. The chair will also maintain regular liaison with the CEO, CFO, and the lead independent audit partner.
Responsibilities and Powers
Although the Committee may wish to consider other duties from time to time, the general recurring activities of the Committee in carrying out its oversight role are described below.
| · | Annual review and revision of the Charter as necessary with the approval of the board. |
| · | Review and obtain from the independent auditors a formal written statement delineating all relationships between the auditor and us, consistent with Independence Standards Board Standard 1. |
| · | Recommending to the board the independent auditors to be retained (or nominated for shareholder approval) to audit our financial statements. Such auditors are ultimately accountable to the board and the Committee, as representatives of the shareholders. |
| · | Evaluating, together with the board and management, the performance of the independent auditors and, where appropriate, replacing such auditors. |
| · | Obtaining annually from the independent auditors a formal written statement describing all relationships between the auditors and us. The Committee shall actively engage in a dialogue with the independent auditors with respect to any relationship that may impact the objectivity and the independence of the auditors and shall take, or recommend that the board take, appropriate actions to oversee and satisfy itself as to the auditors’ independence. |
| · | Ensuring that the independent auditors are prohibited from providing the following non-audit services and determining which other non-audit services the independent auditors are prohibited from providing: |
| o | Bookkeeping or other services related to our accounting records or consolidated financial statements; |
| o | Financial information systems design and implementation; |
| o | Appraisal or valuation services, fairness opinions, or contribution-in-kind reports; |
| o | Internal audit outsourcing services; |
| o | Management functions or human resources; |
| o | Broker or dealer, investment advisor or investment banking services; |
| o | Legal services and expert services unrelated to the audit; and |
| o | Any other services which the Public Company Accounting Oversight Board determines to be impermissible. |
| · | Approving any permissible non-audit engagements of the independent auditors. |
| · | Meeting with our auditors and management to review the scope of the proposed audit for the current year, and the audit procedures to be used, and to approve audit fees. |
| · | Reviewing the audited consolidated financial statements and discussing them with management and the independent auditors. Consideration of the quality our accounting principles as applied in its financial reporting. Based on such review, the Committee shall make its recommendation to the Board as to the inclusion of our audited consolidated financial statement in our Annual Report to Shareholders. |
| · | Discussing with management and the independent auditors the quality and adequacy of and compliance with our internal controls. |
| · | Establishing procedures: (i) for receiving, handling and retaining of complaints received by us regarding accounting, internal controls, or auditing matters, and (ii) for employees to submit confidential anonymous concerns regarding questionable accounting or auditing matters. |
| · | Review and discuss all related party transactions involving us. |
| · | Engaging independent counsel and other advisors if the Committee determines that such advisors are necessary to assist the Committee in carrying out its duties. |
| · | Publicly disclose the receipt of warning about any violations of corporate governance rules. |
Authority
The Committee will have the authority to retain special legal, accounting or other experts for advice, consultation or special investigation. The Committee may request any officer or employee of ours, our outside legal counsel, or the independent auditor to attend a meeting of the Committee, or to meet with any member of, or consultants to, the Committee. The Committee will have full access to our books, records and facilities.
Meetings
The Committee shall meet at least yearly, or more frequently as the Committee considers necessary. Opportunities should be afforded periodically to the external auditor and to senior management to meet separately with the independent members of the Committee. Meetings may be with representatives of the independent auditors, and appropriate members of management, all either individually or collectively as may be required by the Chairman of the Committee.
The independent auditors will have direct access to the Committee at their own initiative.
The Chairman of the Committee will report periodically the Committee’s findings and recommendations to the board of directors.
As of August 31, 2013 and the date of the filing of this Annual Report we did not have any employees other than our sole executive officer.
Our common shares are owned by Canadian residents, United States residents and residents of other countries. The only class of our securities, which is outstanding as of the date of the filing of this Annual Report, is common stock. All holders of our common stock have the same voting rights with respect to their ownership of our common stock.
The following table sets forth as of November 29, 2013, certain information with respect to the amount and nature of beneficial ownership of the common stock held by (i) each person known to our management to be the beneficial owner of more than 5% of our outstanding shares of common stock; (ii) each person who is a director or an executive officer of ours; and (iii) all directors and executive officers of ours, as a group. Shares of our common stock subject to options, warrants, or convertible securities currently exercisable or convertible or exercisable or convertible within 60 days of the date of filing of this Annual Report are deemed outstanding for computing the share ownership and percentage of the person holding such options, warrants, or convertible securities but are not deemed outstanding for computing the percentage of any other person.
| Name and Owner | | Identity | | Amount and Nature ofBeneficial Ownership of Common Stock(1) | | | Note | | Percentage | |
| Alan D. Gaines | | Director | | | 8,000,000 | | | (2) | | | 6.32 | % |
| Milton Klyman | | Director | | | 400,000 | | | (3) | | | 0.33 | % |
| Colin McNeil | | Director | | | 200,000 | | | (4) | | | 0.16 | % |
| James Cassina | | Officer/Director and Principal Shareholder | | | 24,537,704 | | | (5) | | | 18.76 | % |
| Core Energy Enterprise Inc.(6) | | Principal Shareholder | | | 8,146,704 | | | (7) | | | 6.79 | % |
| All officers and directors as a group (4 persons) | | | | | 33,137,704 | | | (2) (3) (4) (5) | | | 27.02 | % |
| (1) | Unless otherwise indicated, the persons named have sole ownership, voting and investment power with respect to their stock, subject to applicable laws relative to rights of spouses. Percentage ownership is based on 122,622,025 shares of common stock outstanding as of the date of filing of this Annual Report. |
| (2) | Includes 4,000,000 outstanding shares and 4,000,000 shares underlying 4,000,000 presently exercisable warrants. |
| (3) | Includes 100,000 outstanding shares, 100,000 shares underlying 100,000 presently exercisable warrants and 200,000 shares underlying 200,000 presently exercisable stock options. |
| (4) | Includes 200,000 shares underlying 200,000 presently exercisable stock options. |
| (5) | Includes 4,073,208 outstanding shares and 4,073,208 shares underlying 4,073,208 presently exercisable warrants owned by Core Energy Enterprises Inc. Also includes 8,199,450 outstanding shares and 7,991,838 shares underlying 7,991,838 presently exercisable warrants and 200,000 shares underlying 200,000 presently exercisable stock options owned directly by James Cassina. |
| (6) | James Cassina has voting and investment power with respect to the shares owned by Core Energy Enterprises Inc. |
| (7) | Includes 4,073,208 outstanding shares underlying 4,073,208 shares underlying presently exercisable warrants. |
As of the date of the filing of this Annual Report, to the knowledge of our management, there are no arrangements which, could at a subsequent date result in a change in control of us. As of such date, and except as disclosed herein, our management has no knowledge that we are owned or controlled directly or indirectly by another company or any foreign government.
| ITEM 7 | MAJOR SHAREHOLDERS AND RELATED PARTY TRANSACTIONS |
There are 122,622,025 issued and outstanding shares of our common stock as of November 29, 2013. As of November 29, 2013, to the best of our knowledge, no persons hold directly or indirectly or exercise control or direction over, shares of our common stock carrying 5% or more of the voting rights attached to all issued and outstanding shares of the common stock except as stated under Item 6.E above or set out in the table below. The shares of our common stock, owned by our major shareholders have identical voting rights as those owned by our other shareholders.
| Name | | Amount and Nature
of Beneficial Ownership
of Common Stock | | | Note | | | Percentage | |
| Alan D. Gaines | | | 8,000,000 | | | | (1 | ) | | | 6.32 | % |
| James Cassina | | | 24,537,704 | | | | (2 | ) | | | 18.76 | % |
| Core Energy Enterprise Inc.(3) | | | 8,146,704 | | | | (4 | ) | | | 6.43 | % |
| Gerald Hickson | | | 8,500,000 | | | | (5 | ) | | | 6.79 | % |
| (1) | Includes 4,000,000 outstanding shares and 4,000,000 shares underlying 4,000,000 presently exercisable warrants. |
| (2) | Includes 4,073,208 outstanding shares and 4,073,208 shares underlying 4,073,208 presently exercisable warrants owned by Core Energy Enterprises Inc. Also includes 8,199,450 outstanding shares and 7,991,838 shares underlying 7,991,838 presently exercisable warrants and 200,000 shares underlying 200,000 presently exercisable stock options owned directly by James Cassina. |
| (3) | James Cassina has voting and investment power with respect to the shares owned by Core Energy Enterprises Inc. |
| (4) | Includes 4,073,208 outstanding shares underlying 4,073,208 shares underlying presently exercisable warrants. |
| (5) | Includes 2,500,000 outstanding shares underlying shares underlying presently exercisable warrants. |
The following table discloses the geographic distribution of the majority of the holders of record of our common stock as of date of November 29, 2013.
| Country | | Number
of
Shareholders | | | Number
of
Shares | | | Percentage
of
Shareholders | | | Percentage
of
Shares | |
| Canada | | | 1,076 | | | | 31,294,676 | | | | 93.57 | % | | | 25.52 | % |
| USA | | | 47 | | | | 39,454,816 | | | | 4.08 | % | | | 32.18 | % |
| All Other | | | 27 | | | | 51,870,533 | | | | 2.35 | % | | | 42.30 | % |
| Total | | | 1,150 | | | | 122,622,025 | | | | 100.00 | % | | | 100.00 | % |
We are not directly or indirectly owned or controlled by another corporation, by any foreign government or by any other natural or legal person. There are no arrangements known to us, the operation of which may at a subsequent date result in a change in the control of us.
| B. | RELATED PARTY TRANSACTIONS |
The following transactions with individuals related to the Company arose in the normal course of business have been accounted for at the exchange amount being the amount agreed to by the related parties, which approximates the arm’s length equivalent value.
Compensation of Key Management Personnel
The remuneration of directors and other members of key management personnel during the years ended were as follows:
| | | August 31, 2013 | | | August 31, 2012 | | | August 31, 2011 | |
| Short term employee benefits (1) | | $ | 75,000 | | | $ | 75,000 | | | $ | 56,250 | |
| Directors stock based compensation (2) | | | - | | | | 95,910 | | | | - | |
| | | $ | 75,000 | | | $ | 170,910 | | | $ | 56,250 | |
The following balances owing to the President of the Company are included in trade and other payables and are unsecured, non-interest bearing and due on demand:
| | | August 31, 2013 | | | August 31, 2012 | |
| Short term employee benefits (1) | | $ | 206,250 | | | $ | 131,250 | |
| Expenses paid on behalf of the Company | | | 1,747 | | | | 1,896 | |
| | | $ | 207,997 | | | $ | 133,146 | |
| (1) | The Company accrues management fees for the President of the Company at a rate of $6,250 per month. |
| (2) | On March 1, 2012, the Company granted 600,000 share purchase options to directors with an exercise price of $0.16 per share expiring on February 28, 2017. |
At August 31, 2013 the amount of directors’ fees included in trade and other payables was $16,100 (August 31, 2012 $12,900).
At August 31, 2013 we had promissory notes payable to the President of $28,845 and US$300,000 (August 31, 2012 $28,845 and US$300,000). For the year ended August 31, 2013 the Company recorded interest of $35,324 (August 31, 2012 $32,538). At August 31, 2013, included in trade and other payables is interest of $65,826 (August 31, 2012 $28,687). During the year ended August 31, 2012 we issued 207,612 common shares to the President as full settlement of interest due in the amount of $30,195. The notes are due on demand and bear interest at 10% per annum. Interest is payable annually on the anniversary date of the notes.
On September 1, 2011 we paid to Source Re Work Program, Inc. (“Source”) the secured promissory note in full in the amount of US$75,000 together with accrued interest of US$6,250. Eric Johnson was the President of Source and a shareholder of ours and was the Vice President of Operations for Dyami Energy until April 13, 2011 (see Note 12 to the consolidated financial statements).
At August 31, 2013 and 2012 we had a US$960,000, 10% per annum secured promissory note payable to Benchmark Enterprises LLC (“Benchmark”). Benchmark is a shareholder of ours. For the year ended August 31, 2013 we recorded interest of $101,309 (August 31, 2012 $83,947. At August 31, 2013 included in trade and other payables is interest of $169,033 (August 31, 2012 $63,296). During the year ended August 31, 2012 we issued 1,030,812 common shares as full settlement of interest due in the amount of $103,021 (see Note 12 to the consolidated financial statements).
At August 31, 2013 included in trade and other payables is $3,509 due to Gottbetter & Partners LLP for legal fees (August 31, 2012 $14,649). During the year ended August 31, 2013 we completed private placements of 2,249,790 units in the capital of our Company for gross proceeds of $441,004 and paid to Gottbetter Capital Markets, LLC, placement agent fees of $35,280 and issued 179,983 common share purchase warrants exercisable at US$0.25 for a period of three years from the date of issue. During the year ended August 31, 2012 we completed private placements of 10,575,000 units in the capital of our Company for gross proceeds of $2,113,986 and paid to Gottbetter Capital Markets, LLC, placement agent fees of $99,326 and issued 846,000 common share purchase warrants exercisable at US$0.25 for a period of three years from the date of issue. On February 17, 2012 we converted $50,000 of debt into 1,000,000 units of our Company at $0.05 per unit. Gottbetter Capital Group, Inc. is a shareholder of the Company. Adam Gottbetter is the managing and principal partner of Gottbetter & Partners LLP, and the beneficial owner of Gottbetter Capital Group, Inc., and Gottbetter Capital Markets, LLC.
At August 31, 2013 and 2012 we had no unsecured, non-interest bearing and repayable on demand shareholder loan (August 31, 2011 $57,500). For the year ended August 31, 2012 interest was imputed at a rate of 10% per annum and interest of $2,334 was recorded and included in contributed surplus. On January 24, 2012 we converted $50,000 of the loan into 1,000,000 units and on February 17, 2012 we converted the balance of the loan, $7,500 into 150,000 units in the capital of our Company at $0.05 per unit.
During the year ended August 31, 2013, we received no funds and issued no promissory notes to shareholders (August 31, 2012 US$175,000 and $293,000). During the year ended August 31, 2013 we paid Nil in promissory notes (August 31, 2012 US$480,000). At August 31, 2013, we had shareholders’ loans payable of US$1,433,500 and $250,000 (August 31, 2012 US$1,583,740 and $293,000). The notes are payable on demand and bear interest at 10% per annum. Interest is payable annually on the anniversary date of the notes. For the year ended August 31, 2013 we recorded interest of $183,490 (August 31, 2012 $254,117). At August 31, 2013, included in trade and other payables is interest of $47,037 (August 31, 2012 $190,484). During the year ended August 31, 2013 we issued 23,662,569 common shares as full settlement of shareholders’ loans in the amount of $198,333 and interest due on shareholders’ loans in the amount of $345,906. During the year ended August 31, 2012 we issued 2,039,969 common shares as full settlement of interest due on shareholder notes in the amount of $236,669.
On January 24, 2012 we converted $250,000 of shareholders’ loans into 5,000,000 units in the capital of our Company at $0.05 per unit and on February 17, 2012 we converted $500,000 into 10,000,000 units in the capital of our Company at $0.05 per unit.
Inter-Company Balances
As at August 31, 2013, the inter-company balance due from our wholly owned subsidiary 1354166 Alberta was $68,000. As at August 31, 2013, the inter-company balance due from our wholly owned subsidiary Dyami Energy was $5,398,238. As at August 31, 2013, the inter-company balance due from our wholly owned subsidiary Zavala Inc. was $157,244. As of November 29, 2013, the inter-company balance due from 1354166 Alberta was $68,000, the inter-company balance due from Dyami Energy was $5,433,729 and the inter-company balance due from Zavala Inc. was $159,824.
| C. | INTERESTS OF EXPERTS AND COUNSEL |
Not Applicable. This Form 20-F is being filed as an Annual Report under the Exchange Act.
| ITEM 8 | FINANCIAL INFORMATION |
| A. | CONSOLIDATED STATEMENTS AND OTHER FINANCIAL INFORMATION |
The Company's Audited Consolidated Financial Statements for the fiscal years ended August 31, 2013 and 2012 and the notes thereto required as part of this Annual Report are filed under Item 18 of this Annual Report.
Litigation
Except as discussed below there are no pending legal proceedings to which we or our subsidiary is a party or of which any of our property is the subject. There are no legal proceedings to which any of the directors, officers or affiliates or any associate of any such directors, officers or affiliates of either our company or our subsidiary is a party or has a material interest adverse to us except for the following:
Matthews Lease Litigation
During the year ended August 31, 2012 the lessors of the Matthews lease, a property comprising approximately 2,629 gross acres of land in Zavala County, Texas (the “Matthews Property”), expressed their belief that the lease had terminated and filed a petition in the District Court, Zavala County, Texas, seeking a declaration that the lease had terminated. We disagreed and defended the action and countersued the lessors for repudiation of the lease seeking damages. During the year ended August 31, 2013, we entered into an agreement with the lessors of the Matthews Property, OGR Energy Corporation and Texas Onshore Energy, Inc. together holding a 15% working interest in the Matthews Property with back in rights to earn an additional 15% working interest after production achieved $15.0 million of revenue. A new lease was signed with our subsidiary, Zavala Inc. effective September 1, 2013 (the “New Matthews Lease”). The New Matthews Lease has a primary term expiring January 31, 2014 subject to certain extensions and can be maintained through the provision of certain royalty payments and the implementation of a continuous drilling program(SeeItem 4.B: “ Information on the Company – History and Development of the Company”).
Other Litigation
In February 2013, a vendor of Dyami Energy applied a lien on the Murphy #4 well and filed a claim in the District Court of Zavala County, Texas (Case No. 13-02-12941-ZCV) seeking payment of US$169,196 for services. Dyami Energy is disputing the amount on the basis of negligence by the vendor and the Company filed a counter claim. The full amount of the provision has been recorded and any legal costs will be expensed as incurred. The outcome of this claim is uncertain at this time.
In May 2012 a vendor of Dyami Energy filed a claim in the District Court of Harris County, Texas seeking payment of US$64,866. Dyami Energy was disputing the amount charged due to faulty equipment. The full amount of the provision which was accrued in the prior year 2012 has been reversed in 2013 as the vendor is no longer in good standing as a Texas corporation and the vendor’s attorney filed in the District Court of Harris County, Texas a motion to withdraw as counsel.
In December 2011, a vendor of Dyami Energy filed a claim in the District Court of Harris County, (Case No. 2011-74035/Court: 113) seeking payment of US$62,800. Dyami Energy disputed the claim on the basis of excessive charges. In December 2013 an agreed final judgment in favor of the vendor was entered into court in the amount of $42,803 and post judgment interest at 5% per annum until paid in full.
Dividends
We have not paid any dividends on our common stock during the past five years. We do not intend to pay dividends on shares of common stock in the foreseeable future as we anticipate that our cash resources will be used to finance growth.
There have been no significant changes that have occurred since the date of our annual financial statements included with this Annual Report except as disclosed in the Annual Report.
| ITEM 9 | THE OFFER AND LISTING |
Common Shares
Our authorized capital consists of an unlimited number of common shares without par value, of which 122,620,026 were issued and outstanding as of November 29, 2013. All shares are initially issued in registered form. There are no restrictions on the transferability of our common shares imposed by our constating documents. Holders of our common shares are entitled to one vote for each common share held of record on all matters to be acted upon by our shareholders. Holders of common shares are entitled to receive such dividends as may be declared from time to time by our board of directors, in their discretion. In addition we are authorized to issue an unlimited number of preferred shares, with such rights, preferences and privileges as may be determined from time to time by our board of directors. There were no preferred shares outstanding at November 29, 2013.
Our common shares entitle their holders to: (i) vote at all meetings of our shareholders except meetings at which only holders of specified classes of shares are entitled to vote, having one vote per common share, (ii) receive dividends at the discretion of our board of directors; and (iii) receive our remaining property on liquidation, dissolution or winding up.
| A. | OFFER AND LISTING DETAILS |
Our common stock became eligible for trading on October 22, 2009 on the Over the Counter Bulletin Board ("OTCBB") under the symbol (“EGNKF”). Following the amalgamation on November 30, 2009 with our wholly owned subsidiary 1406768 Ontario, we changed our name to Eagleford Energy Inc. and commenced trading under the symbol (“EFRDF”). Prior to our common stock being listed on the OTCBB, our common stock had not publicly traded since 1990.We completed a 2-for-1 forward stock split, pursuant to which one (1) newly-issued share of the Company’s common stock was issued to each holder of a share of common stock as of the close of business on March 16, 2012.
The following table set forth the reported high and low bid prices for shares of our common stock on the OTCBB in US dollars for the periods indicated.
| | | Period (1) | | High (3) | | | Low(3) | |
| Fiscal Year August 31, 2013 | | Year Ended August 31, 2013 | | $ | 0.40 | | | $ | 0.01 | |
| Fiscal Year August 31, 2012 | | Year Ended August 31, 2012 | | $ | 0.51 | | | $ | 0.10 | |
| Fiscal Year August 31, 2011 | | Year Ended August 31, 2011 | | $ | 1.02 | | | $ | 0.35 | |
| Fiscal Year August 31, 2010 | | Year Ended August 31, 2010 | | $ | 0.65 | | | $ | 0.03 | |
| | | | | | | | | | | |
| Fiscal Year 2014 by Quarter | | First Quarter ended 11/30/2013 | | $ | 0.07 | | | $ | 0.02 | |
| | | | | | | | | | | |
| Fiscal Year 2013 by Quarter | | First Quarter ended 11/30/2012 | | $ | 0.40 | | | $ | 0.13 | |
| | | Second Quarter Ended 02/29/2013 | | $ | 0.20 | | | $ | 0.07 | |
| | | Third Quarter Ended 05/31/2013 | | $ | 0.15 | | | $ | 0.01 | |
| | | Fourth Quarter Ended 08/31/2013 | | $ | 0.06 | | | $ | 0.02 | |
| | | | | | | | | | | |
| Fiscal Year 2012 By Quarter | | First Quarter ended 11/30/2011 | | $ | 0.35 | | | $ | 0.10 | |
| | | Second Quarter Ended 02/29/2012 | | $ | 0.30 | | | $ | 0.10 | |
| | | Third Quarter Ended 05/31/2012 | | $ | 0.50 | | | $ | 0.42 | |
| | | Fourth Quarter Ended 08/31/2012 | | $ | 0.51 | | | $ | 0.35 | |
| | | | | | | | | | | |
| Calendar Year 2013 by Month | | June | | $ | 0.06 | | | $ | 0.04 | |
| | | July | | $ | 0.05 | | | $ | 0.03 | |
| | | August | | $ | 0.05 | | | $ | 0.02 | |
| | | September | | $ | 0.12 | | | $ | 0.03 | |
| | | October | | $ | 0.07 | | | $ | 0.03 | |
| | | November | | $ | 0.04 | | | $ | 0.02 | |
Notes
| (1) | Our stock commenced trading on the OTCBB on October 22, 2009. |
| (2) | The closing price on the OTCBB for our common stock on November 29, 2013 was $0.03. |
| (3) | Adjusted for 2-for-1 forward stock split on March 16, 2012. |
There is currently only a limited public market for the common stock in the United States. There can be no assurance that a more active market will develop in the future.
Not Applicable. This Form 20-F is being filed as an Annual Report under the Exchange Act.
See Item 9.A.
Not Applicable. This Form 20-F is being filed as an Annual Report under the Exchange Act.
Not Applicable. This Form 20-F is being filed as an Annual Report under the Exchange Act.
Not Applicable. This Form 20-F is being filed as an Annual Report under the Exchange Act.
| ITEM 10 | ADDITIONAL INFORMATION |
Not Applicable. This Form 20-F is being filed as an Annual Report under the Exchange Act.
| B. | MEMORANDUM AND ARTICLES OF ASSOCIATION |
Certificate of Incorporation
We were incorporated under the Business Corporations Act (Ontario) on September 22, 1978 under the name Bonanza Red Lake Explorations Inc. The corporation number as assigned by Ontario is 396323.
Articles of Amendment dated January 14, 1985
By Articles of Amendment dated January 14, 1985, our Articles were amended as follows:
1. The minimum number of directors of the Company shall be 3 and the maximum number of directors of the Company shall be 10.
2. (a) Delete the existing objects clauses and provide that there are no restrictions on the business we may carry on or on the powers that we may exercise;
(b) Delete the term "head office" where it appears in the articles and substitute therefor the term "registered office";
(c) Delete the existing special provisions contained in the articles and substitute therefor the following:
The following special provisions shall be applicable to the Company:
Subject to the provisions of the Business Corporations Act, as amended or re-enacted from time to time, the directors may, without authorization of the shareholders:
| (i) | borrow money on the credit of the Company; |
| (ii) | issue, re-issue, sell or pledge debt obligations of the Company; |
| (iii) | give a guarantee on behalf of the Company to secure performance of an obligation of any person; |
| (iv) | mortgage, hypothecate, pledge or otherwise create a security interest in all or any property of the Company owned or subsequently acquired, to secure any obligation of the Company; and |
| (v) | by resolution, delegate any or all such powers to a director, a committee of directors or an officer of the Company. |
3. (a) Provide that the Company is authorized to issue an unlimited number of shares;
(b) Provide that the Company is authorized to issue an unlimited number of preference shares.
Articles of Amendment dated August 16, 2000
By Articles of Amendment dated August 16, 2000 our articles were amended to consolidate our issued and outstanding common shares on the basis on one common share for every three issued and outstanding common shares in our capital, and change our name from Bonanza Red Lake Explorations Inc. to Eugenic Corp.
Our Articles of Amendment state that there are no restrictions on the business that may carry on, but do not contain a stated purpose or objective.
Articles of Amalgamation dated November 30, 2009
By Articles of Amalgamation dated November 30, 2009 we amalgamated with our wholly owned subsidiary Eagleford Energy Inc., (formerly: 1406768 Ontario Inc.) and changed the entity’s name to Eagleford Energy Inc.
Our Articles of Amalgamation state that there are no restrictions on the business that may carry on or on the powers the Company may exercise.
We are authorized to issue an unlimited number of common shares and an unlimited number of preference shares of which Nil were outstanding as of the date of this Annual Report (the “Preference Shares”).
A description of the rights, preferences and privileges relating to the Company's Preference Shares is as follows:
(a) Our Preference Shares have a par value of one-tenth of one cent (1/10) and are redeemable, voting, non-participating shares.
(b) No dividends at any time shall be declared, set aside or paid on our Preference Shares.
(c) In the event of a liquidation, dissolution or winding of the Company or other distribution of assets or property of the Company among shareholders for the purpose of winding up its affairs, the holders of the Preference Shares shall be entitled to received from the assets and property of the Company a sum equivalent to the aggregate par value of the Preference Shares held by them respectively before any amount shall be paid or any property or assets of the Company distributed to holders of any common shares or shares of any other class ranking junior to the Preference Shares. After payment to the holders of the Preference Shares of the amount so payable to them as above provided, they shall not be entitled to share in any further distribution of the assets or property of the Company.
(d) The Company may not redeem the Preference Shares prior to the expiration of five years from the respective dates of issuance thereof, without the prior consent of the holders of the Preference Shares to be redeemed. The Company shall redeem all of the then outstanding Preference Shares five years from the respective dates of issue
(e) The Company may at any time or times purchase for cancellation all or any part of the Preference Shares outstanding from time to time from the holders thereof, at a price not exceeding the par value thereof, with the consent of the holders thereof.
(f) The holders of the Preference Shares shall be entitled to receive notice of and attend all meetings of shareholders of the Company and shall have one (1) vote for each Preference Share held at all meetings of the shareholders of the Company.
Other Provisions
The following special provisions shall be applicable to the Company:
Subject to the provisions of the Business Corporations Act, as amended or re-enacted from time to time, the directors may, without authorization of the shareholders:
(i) borrow money on the credit of the Company;
(ii) issue, re-issue, sell or pledge debt obligations of the Company;
(iii) give a guarantee on behalf of the Company to secure performance of an obligation of any person;
(iv) mortgage, hypothecate, pledge or otherwise create a security interest in all or any property of the Company owned or subsequently acquired, to secure any obligation of the Company; and
(v) by resolution, delegate any or all such powers to a director, a committee of directors or an officer of the Company.
Articles of Amendment dated effective March 16, 2012
By Articles of Amendment dated effective March 16, 2012 our articles were amendedto
a) To change each issued and outstanding common share in the capital of the Corporation into two (2) common share of the Corporation (the "Stock Split") effective as of the close of business on March 16, 2012; and
b) To provide that no fractional shares shall be issued as a result of the Stock Split, and if any fractional share would otherwise result from the Stock Split, such fractional share shall be rounded up to the nearest whole share and distributed to the holder of the fractional interest as his or her interest appears
Bylaws
At the Annual and Special Meeting of Shareholders held on February 24, 2012, shareholders approved a resolution to repeal and replace the Company's By-Law No. 1 and Special By-Law No. 1 (the "Old By-Laws") with a new By-Law No. 1 (the "New By-Laws") in order to reflect the current circumstances and practices of the Company and certain amendments to theBusiness Corporations Act(Ontario) (the "OBCA"), which came into force on August 1, 2007.
No director of ours is permitted to vote on any resolution to approve a material contract or transaction in which such director has a material interest (Bylaws, Article 3.17).
Neither our Articles nor our Bylaws limit the directors’ power, in the absence of an independent quorum, to vote compensation to themselves or any members of their body. The Bylaws provide that directors shall receive remuneration as the board of directors shall determine from time to time (Bylaws, Article 3.19).
Under our Articles and Bylaws, our board of directors may, without the authorization of our shareholders, (i) borrow money upon our credit; (ii) issue, reissue, sell or pledge debt obligations of ours; whether secured or unsecured (iii) give a guarantee on behalf of us to secure performance of obligations; and (iv) charge, mortgage, hypothecate, pledge or otherwise create a security interest in all currently owned or subsequently acquired real or personal, movable or immovable, tangible or intangible, property of ours to secure obligations(Bylaws, Article 13.1).
The annual meeting of shareholders shall be held at such time in each year as the board, the Chairman of the Board (if any), The Chief Executive Officer, or the President may from time to time determine, for the purpose of considering the financial statements and reports required by the Act to be placed before the annual meeting, electing directors, appointing an auditor and for the transaction of such other business as may properly be brought before the meeting (Bylaws, Article 9.1).
The board, the Chairman of the Board (if any) or the President shall have power to call a special meeting of shareholders at any time (Bylaws, Article 9.2).
Shareholders of record must be given notice of any meeting not less than 21 days or more than 50 days before the date of the meeting or as otherwise prescribed by applicable laws. Notice of a meeting of shareholders called for any purpose other than consideration of the financial statements and auditors’ report, election of directors and reappointment of the incumbent auditor shall state or be accompanied by a statement of the nature of such business in sufficient detail to permit the shareholder to form a reasoned judgment thereon and the text of any special resolution or by-law to be submitted to the meeting (Bylaws, Article 9.4). Our board of directors is permitted to fix a record date for any meeting of the shareholders that is between 30 and 60 days prior to such meeting or as otherwise prescribed by applicable laws. (Bylaws, Article 9.6). The only persons entitled to be present at a meeting of shareholders shall be those entitled to vote thereat, the directors and the auditor of the Company and others who, although not entitled to vote are entitled or required under any provision of the Act or the articles or the by-laws to be present at the meeting. Any other person may be admitted only on the invitation of the chairman of the meeting or with the consent of the meeting (Bylaws, Article 9.9).
Neither our Articles nor our Bylaws discuss limitations on the rights to own securities or exercise voting rights thereon, and there is no provision of our Articles or Bylaws that would delay, defer or prevent a change in control of us, or that would operate only with respect to a merger, acquisition, or corporate restructuring involving us or any of its subsidiaries. Our Bylaws do not contain a provision indicating an ownership threshold above which shareholder ownership must be disclosed.
Other Provisions
Neither our Articles nor our Bylaws discuss the retirement or non-retirement of directors under an age limit requirement or the number of shares required for director qualification.
Neither our Articles nor our Bylaws require that a director hold a share in the capital of the Company as qualification for his/her office.
Neither our Articles nor our Bylaws contain sinking fund provisions, provisions allowing us to make further capital calls with respect to any shareholder of ours, or provisions which discriminate against any holders of securities as a result of such shareholder owning a substantial number of shares.
During the two year period preceding the filing date of this Annual Report, we entered into no material contracts other than contracts entered into in the ordinary course except for the following:
On December 31, 2011 we entered into an agreement with Benchmark Enterprises LLC (“Benchmark”) to amend the terms of the US$960,000 Secured Note payable to Benchmark, to extend the Maturity Date from December 31, 2011 to June 30, 2012 and to provide for the accrual of interest on the outstanding principal amount at a rate of 10% per annum through the Maturity Date.
On March 12, 2012 we entered into an Agreement with Gottbetter Capital Markets, LLC (“Placement Agent”) to act as a non-exclusive Placement Agent in connection with a private placement (the “Offering”) of units (“Units”) in the capital of the Company. Each Unit consisted of (i) one (1) share of the Company’s Common Stock (the “Common Stock”) and (ii) a three (3) year warrant (each, an “Investor Warrant” and collectively, the “Investor Warrants”) to purchase one half (1/2) of one (1) share of Common Stock at an exercise price of Fifty Cents ($0.50 USD) per full share (the “Investor Warrant Shares”). The Offering Price for the Units was Twenty Cents ($0.20 USD) per Unit. The Company raised gross proceeds of US$2,564,958 through the issuance of 12,824,790 Units, paid cash commissions to the Placement Agent of $136,197 and issued Placement Agent warrants to purchase 1,025,983 shares of Common Stock at an exercise price of Twenty Five Cents ($0.25 USD) for a period of three years from the date of issue.
On June 1, 2012 we retained The PrinceRidge Group LLC (“PrinceRidge”) to act as exclusive Financial Advisor to the Company for a period of six months, to assist the Company in identifying and evaluating potential transactions to enhance the future growth and expansion of the Company (the “Advisory Agreement”).Under the terms of the Advisory Agreement, upon request by the Company, PrinceRidge will assist the Company in various matters including, as appropriate:
| a. | familiarizing itself, to the extent it deems appropriate and feasible, with the business, operations, assets, financial condition, management and prospects of the Company, |
| b. | conducting an examination of the documents and records pertaining to the Company, interviewing Company personnel and consultants engaged by the Company, and making such other reasonable investigations as PrinceRidge deems necessary and appropriate under the circumstances, |
| c. | performing financial analysis of the Company and comparisons with other companies in its industry, |
| d. | working with the Company to document financial projections for the Company including capital requirements and prospective cash flow and earnings, |
| e. | developing and organizing information for presentation to potential Investors or Buyers, including marketing brochures, |
| f. | identifying, screening and contacting prospective Investors or Buyers, as appropriate, and advising the Company on how to effectively access, attract and communicate with such potential Investors or Buyers, |
| g. | evaluating and recommending financial terms with respect to a Transaction, |
| h. | providing advice relating to capital markets activities and general market conditions, |
| i. | assisting the Company in negotiating the financial aspects of any Transaction, and |
| j. | providing such other financial advisory and investment banking services as are normal and customary for similar transactions and as may be mutually agreed upon by the Company and PrinceRidge. |
In return for PrinceRidge's services, the Company paid to PrinceRidge an engagement fee of US$15,000, and is paying a monthly advisory fee equal to US$10,000. The Company may also pay success fees equal to:
| (a) | in the case of any Placement with one or more Investors, a cash fee equal to 8.0% of the transaction amount receivable by the Company for equity or equity linked securities and 4.0% of the transaction amount for any debt securities; |
| (b) | in the case of any sale transaction with one or more buyers, a cash fee equal to 4.0% of the transaction amount) paid to the Company in any such sale transaction; |
| (c) | in the case of any PIPE transaction, a cash fee equal to 8.0% of the transaction amount raised by such PIPE transaction; and |
| (d) | in the case of any business combination, a cash fee equal to 4.0% of the transaction amount payable, receivable or retained by the Company, as applicable |
On June 30, 2012 we entered into an agreement with Benchmark to further amend the terms of the US$960,000 Secured Note payable to Benchmark, to extend the Maturity Date from June 30, 2012 to November 30, 2012 and to provide for the interest on the outstanding principal amount at a rate of 10% per annum through the Maturity Date.
On November 14, 2012 we entered into a letter agreement to amend the terms of the Advisory Agreement dated June 1, 2012 with PrinceRidge to extend the terms of the Advisory Agreement for an additional three month term and in return for PrinceRidge’s advisory services the Company will pay an additional US$30,000 in advisory fees due and payable on March 1, 2013.
On November 23, 2012 we entered into an agreement with Benchmark to further amend the terms of the US$960,000 Secured Note payable to Benchmark, to extend the Maturity Date from November 30, 2012 to March 1, 2013 and to provide for the interest on the outstanding principal amount at a rate of 10% per annum through the Maturity Date.
On March 1, 2013 we entered into an agreement with Benchmark Enterprises LLC (“Benchmark”) to amend the terms of the 10% per annum, US$960,000 Secured Note payable to Benchmark, to extend the Maturity Date from March1, 2013 to August 31, 2013, or within 15 days of written demand to us, or upon us closing of a cash financing or series of cash financings closing after the date of this agreement in excess of US$2,500,000 (Two Million, Five Hundred Thousand USA dollars), (the “Funding Threshold”) in which case fifty cents of every one dollar exceeding the Funding Threshold will be allocated to the Note until paid in full or upon an Event of Default.
During the year ended August 31, 2013, the Company entered into an agreement with the lessors of the Matthews Property, OGR Energy Corporation (“OGR Energy”) and Texas Onshore Energy, Inc. (“Texas Onshore”) together holding a 15% working interest in the Matthews Property with back in rights to earn an additional 15% working interest after production achieved $15.0 million of revenue. A new lease was signed with the Company’s subsidiary, Zavala Inc. effective September 1, 2013 (the “New Matthews Lease”).
The New Matthews Lease has a primary term expiring January 31, 2014 (the “Primary Term”) (subject to certain extensions) and can be maintained through the provision of certain royalty payments and the implementation of a continuous drilling program as follows.
| A) | The Company has agreed to a minimum annual royalty of $323.30 per acre retained on the Matthews Property to the Lessors payable as follows: |
(1) US$150,000 upon execution of the Lease (paid); and
(2) US$150,000 by the earliest of the following to occur:
(a) on or before 95 days from the Effective Date of the Lease (paid); or
(b) immediately prior to commencing a new operation under the terms of the Lease.
B) US$60,000 to Lessors upon commencement of the first new operation.
C) The Company has two (2) separate options to extend the Primary Term of the Matthews Lease. If the Company elects to extend the Primary Term of the Matthews Lease through February 28, 2014 (the “First Extension”) the Company shall provide written notice and tender an additional pre-payment of royalties to Lessors in the amount of US$30,000 on or before January 26, 2013. If, after the First Extension has been exercised by the Company, and the Company elects to extend the Primary Term of the Matthews Lease through March 31, 2014 (the “Second Extension”), the Company shall provide written notice and tender an additional pre-payment of royalties to Lessors in the amount of US$30,000 on or before February 23, 2014.
D) Prior to the expiration of the Primary Term, the Company shall perform a new operation satisfied by either drilling a new well to a targeted depth deemed capable of production or the hydraulic fracturing of the existing Matthews #1H well (the “New Operation”).
E) Beginning in the second lease year and continuing thereafter for each succeeding lease year drill at least 2 wells per year before the expiration of each lease year.
Upon the Company satisfying the New Operation, OGR Corporation and Texas Offshore will assign their working interests to Zavala Inc. and Zavala Inc’s interest will increase to a 100% working interest in the Matthews Property from a 75% working interest before payout and a 61.50% working interest after payout of production revenue of $12.5 million held by Dyami Energy and a 10% working interest before payout and a 7.5% working interest after payout of production revenue of $15 million held by Eagleford with the balance held by OGR Energy and Texas Onshore. The royalties payable under the Matthews Lease are 25%.
On September 10, 2013 we terminated the agreements with PrinceRidge. As of the date of filing this report the Company has not paid any success fees to PrinceRidge.
On December 3, 2013, the Company entered into an agreement with Stratex Oil and Gas Holdings Inc., (“Stratex”) to develop the Matthews Lease in Zavala County, Texas (the “Joint Development Agreement”). Under the terms of the Joint Development Agreement, Stratex may earn a 66.67% working interest before payout (50% working interest after payout) in the Matthews #1 well by:
| a) | completing a hydraulic fracture no later than March 31, 2014; |
| b) | delivering US $150,000 to the lessors of the Matthews Lease upon execution of the Joint Development Agreement (paid); |
| c) | delivering US $50,000 to the Company upon execution of the Joint Development Agreement (paid); and |
| d) | delivering US $100,000 to the Company on or before December 31, 2013. |
Following the completion of the above, the Stratex will earn a 50% working interest in the 2,629 acre Matthews Lease excluding 80 acres surrounding the Matthews #3 well. As of the date of this Annual Report we have not assigned any interest to the Stratex in the Matthews Lease.
There are no governmental laws, decrees or regulations in Canada that restrict the export or import of capital, or affect the remittance of dividends, interest or other payments to a non-resident holder of our common stock, other than withholding tax requirements (See "Taxation" below).
Except as provided in the Investment Canada Act, there are no limitations imposed under the laws of Canada, the Province of Ontario, or by our constituent documents on the right of a non-resident to hold or vote our common stock.
The Investment Canada Act (the "ICA"), which became effective on June 30, 1985, regulates the acquisition by non-Canadians of control of a Canadian business enterprise. In effect, the ICA requires review by Investment Canada, the agency which administers the ICA, and approval by the Canadian government, in the case of an acquisition of control of a Canadian business by a non-Canadian where: (i) in the case of a direct acquisition (for example, through a share purchase or asset purchase), the assets of the business are CDN $5 million or more in value; or (ii) in the case of an indirect acquisition (for example, the acquisition of the foreign parent of the Canadian business) where the Canadian business has assets of CDN $5 million or more in value or if the Canadian business represents more than 50% of the assets of the original group and the Canadian business has assets of CDN $5 million or more in value. Review and approval are also required for the acquisition or establishment of a new business in areas concerning "Canada's cultural heritage or national identity" such as book publishing, film production and distribution, television and radio production and distribution of music, and the oil and natural gas industry, regardless of the size of the investment.
As applied to an investment in us, three methods of acquiring control of a Canadian business would be regulated by the ICA: (i) the acquisition of all or substantially all of the assets used in carrying on the Canadian business; (ii) the acquisition, directly or indirectly, of voting shares of a Canadian corporation carrying on the Canadian business; or (iii) the acquisition of voting shares of an entity which controls, directly or indirectly, another entity carrying on a Canadian business. An acquisition of a majority of the voting interests of an entity, including a corporation, is deemed to be an acquisition of control under the ICA. An acquisition of less than one-third of the voting shares of a corporation is deemed not to be an acquisition of control. An acquisition of less than a majority, but one-third or more, of the voting shares of a corporation is presumed to be an acquisition of control unless it can be established that on the acquisition the corporation is not, in fact, controlled by the acquirer through the ownership of voting shares. For partnerships, trusts, joint ventures or other unincorporated entities, an acquisition of less than a majority of the voting interests is deemed not to be an acquisition of control.
In 1988, the ICA was amended, pursuant to the Free Trade Agreement dated January 2, 1988 between Canada and the United States, to relax the restrictions of the ICA.�� As a result of these amendments, except where the Canadian business is in the cultural, oil and gas, uranium, financial services or transportation sectors, the threshold for direct acquisition of control by US investors and other foreign investors acquiring control of a Canadian business from US investors has been raised from CDN $5 million to CDN $150 million of gross assets, and indirect acquisitions are not reviewable.
In addition to the foregoing, the ICA requires that all other acquisitions of control of Canadian businesses by non-Canadians are subject to formal notification to the Canadian government. These provisions require a foreign investor to give notice in the required form, which notices are for information, as opposed to review, purposes.
Certain Canadian Federal Income Tax Consequences
The following discussion describes the principal Canadian federal income tax consequences applicable to a holder of our common shares which are traded on the OTCBB, who, at all material times, is a resident of the United States for purposes of the Canada-United States Income Tax Convention (the "Treaty") entitled to the full benefit of the Treaty and is not a resident, or deemed to be a resident, of Canada, deals at arm's length and is not affiliated with the Company, did not acquire our common shares by virtue of employment, is not a financial institution, specified financial institution, registered non-resident insurer, authorized foreign bank, partnership or a trust as defined in the Income Tax Act (Canada) (the "ITA"), holds our common shares as capital property and as beneficial owner, and does not use or hold, is not deemed to use or hold, his or her common shares in connection with carrying on a business in Canada and, did not, does not and will not have a fixed base or permanent establishment in Canada within the meaning of the Treaty (a "non-resident holder").
This description is based upon the current provisions of the ITA, the regulations thereunder (the "Regulations"), management's understanding of the current publicly announced administration and assessing policies of Canada Revenue Agency, and all specific proposals (the "Tax Proposals") to amend the ITA and Regulations announced by the Minister of Finance (Canada) prior to the date hereof. This description is not exhaustive of all possible Canadian federal income tax consequences and, except for the Tax Proposals, does not take into account or anticipate any changes in law, whether by legislative, governmental or judicial action, nor does it take into account any income tax laws or considerations of any province or territory of Canada or foreign tax considerations which may differ significantly from those discussed below.
The following discussion is for general information only and is not intended to be, nor should it be construed to be, legal or tax advice to any holder of common shares of the Company, and no opinion or representation with respect to the Canadian Federal Income Tax consequences to any such holder or prospective holder is made. Accordingly, holders and prospective holders of common shares are urged to consult with their own tax advisors about the federal, provincial and foreign tax consequences of purchasing, owning and disposing of common shares.
Dividends
Dividends paid on our common shares to a non-resident holder will be subject to a 25% withholding tax pursuant to the provision of the ITA. The Treaty provides that the normal 25% withholding tax rate is generally reduced to 15% on dividends paid on shares of a corporation resident in Canada (such as the Company) to beneficial owners who are residents of the United States. However, if the beneficial owner is a resident of the United States and is a corporation which owns at least 10% of the voting stock of the Company, the withholding tax rate on dividends is reduced to 5%.
Capital Gains
A non-resident of Canada is subject to tax under the ITA in respect of a capital gain realized upon the disposition of a share of a corporation if the shares are considered to be "taxable Canadian property" of the holder within the meaning of the ITA and no relief is afforded under an applicable tax treaty. For purposes of the ITA, a common share of the Company will be taxable Canadian property to a non-resident holder if more than 50% of the fair market value of the common share during the 60 month period immediately preceding the disposition of the common share, was derived directly or indirectly from real or immovable property situated in Canada, Canadian resource properties or any options or interests in such properties.
In the case of a non-resident holder to whom shares of our common stock represent taxable Canadian property and who is a resident in the United States and not a former resident of Canada, no Canadian taxes will be payable on a capital gain realized on such shares by reason of the Treaty unless the value of such shares is derived principally from real property situated in Canada within the meaning of the Treaty at the time of the disposition.
Certain United States Federal Income Tax Consequences
The following is a general discussion of certain possible United States Federal income tax consequences, under current law, generally applicable to a US Holder (as defined below) of our common shares. This discussion does not address all potentially relevant Federal income tax matters and does not address consequences peculiar to persons subject to special provisions of Federal income tax law, such as those described below as excluded from the definition of a US Holder. In addition, this discussion does not cover any state, local or foreign tax consequences (See “Certain Canadian Federal Income Tax Consequences” above).
The following discussion is based upon the sections of the Internal Revenue Code of 1986, as amended (the “Code”), Treasury Regulations, published Internal Revenue Service (“IRS”) rulings, published administrative positions of the IRS and court decisions that are currently applicable, any or all of which could be materially and adversely changed, possibly on a retroactive basis, at any time. In addition, this discussion does not consider the potential effects, both adverse and beneficial, of recently proposed legislation which, if enacted, could be applied, possibly on a retroactive basis, at any time. The following discussion is for general information only and it is not intended to be, nor should it be construed to be, legal or tax advice to any holder or prospective holder of common shares, and no opinion or representation with respect to the United States Federal income tax consequences to any such holder or prospective holder is made. Accordingly, holders and prospective holders of common shares are urged to consult their own tax advisors about the Federal, state, local, and foreign tax consequences of purchasing, owning and disposing of common shares.
U.S. Holders
As used herein, a “U.S. Holder” means a holder of common shares who is a citizen or individual resident (as defined under United States tax laws) of the United States; a corporation created or organized in or under the laws of the United States or of any political subdivision thereof; an estate the income of which is taxable in the United States irrespective of source; or a trust if (a) a court within the United States is able to exercise primary supervision over the trust’s administration and one or more United States persons have the authority to control all of its substantial decisions or (b) the trust was in existence on August 20, 1996 and has properly elected to continue to be treated as a United States person. This summary does not address the United States tax consequences to, and U.S. Holder does not include, persons subject to specific provisions of federal income tax law, including but not limited to tax-exempt organizations, qualified retirement plans, individual retirement accounts and other tax-deferred accounts, financial institutions, insurance companies, real estate investment trusts, regulated investment companies, broker-dealers, non-resident alien individuals, persons or entities that have a “functional currency” other than the U.S. dollar, persons who hold common shares as part of a straddle, hedging or a conversion transaction, and persons who acquire their common shares as compensation for services. This discussion is limited to U.S. Holders who own common shares as capital assets and who hold the common shares directly (e.g., not through an intermediary entity such as a corporation, partnership, limited liability company, or trust). This discussion does not address the consequences to a person or entity of the ownership, exercise or disposition of any options, warrants or other rights to acquire common shares.
Distributions on Our Common Shares
Subject to the discussion below regarding passive foreign investment companies (“PFICs”), the gross amount of any distribution (including non-cash property) by us (including any Canadian taxes withheld therefrom) with respect to common shares generally should be included in the gross income of a U.S. Holder as foreign source dividend income to the extent such distribution is paid out of current or accumulated earnings and profits of ours, as determined under United States Federal income tax principles. Distributions received by non-corporate U.S. Holders may be subject to United States Federal income tax at lower rates than other types of ordinary income (generally 15%) in taxable years beginning on or before December 31, 2010 if certain conditions are met. These conditions include the Company not being classified as a PFIC, it being a “qualified foreign corporation,” the U.S. Holder’s satisfaction of a holding period requirement, and the U.S. Holder not treating the distribution as “investment income” for purposes of the investment interest deduction rules. To the extent that the amount of any distribution exceeds our current and accumulated earnings and profits for a taxable year, the distribution first will be treated as a tax-free return of capital to the extent of the U.S. Holder’s adjusted tax basis in our common shares and to the extent that such distribution exceeds the Holder’s adjusted tax basis in our common shares, will be taxed as capital gain. In the case of U.S. Holders that are corporations, such dividends generally will not be eligible for the dividends received deduction.
If a U.S. Holder receives a dividend in Canadian dollars, the amount of the dividend for United States federal income tax purposes will be the U.S. dollar value of the dividend (determined at the spot rate on the date of such payment) regardless of whether the payment is later converted into U.S. dollars. In such case, the U.S. Holder may recognize additional ordinary income or loss as a result of currency fluctuations between the date on which the dividend is paid and the date the dividend amount is converted into U.S. dollars.
Disposition of Common Shares
Subject to the discussion below regarding PFIC’s, gain or loss, if any, realized by a U.S. Holder on the sale or other disposition of our common shares (including, without limitation, a complete redemption of our common shares) generally will be subject to United States Federal income taxation as capital gain or loss in an amount equal to the difference between the U.S. Holder’s adjusted tax basis in our common shares and the amount realized on the disposition. Net capital gain (i.e., capital gain in excess of capital loss) recognized by a non-corporate U.S. Holder (including an individual) upon a sale or other disposition of our common shares that have been held for more than one year will generally be subject to a maximum United States federal income tax rate of 15% subject to the PFIC rules below. Deductions for capital losses are subject to certain limitations. If the U.S. Holder receives Canadian dollars on the sale or disposition, it will have a tax basis in such dollars equal to the U.S. dollar value. Generally, any gain or loss realized on a subsequent disposition of the Canadian dollars will be U.S. source ordinary income or loss.
U.S. “Anti-Deferral” Rules
Passive Foreign Investment Company (“PFIC”) Regime. If we, or a non-U.S. entity directly or indirectly owned by us (“Related Entity”), has 75% or more of its gross income as “passive” income, or if the average value during a taxable year of ours or the Related Entity’s “passive assets” (generally, assets that generate passive income) is 50% or more of the average value of all assets held by us or the Related Entity, then the United States PFIC rules may apply to U.S. Holders. If we or a Related Entity is classified as a PFIC, a U.S. Holder will be subject to increased tax liability in respect of gain recognized on the sale of his, her or its common shares or upon the receipt of certain distributions, unless such person makes a “qualified electing fund” election to be taxed currently on itspro rata portion of our income and gain, whether or not such income or gain is distributed in the form of dividends or otherwise, and we provide certain annual statements which include the information necessary to determine inclusions and assure compliance with the PFIC rules. As another alternative to the foregoing rules, a U.S. Holder may make a mark-to-market election to include in income each year as ordinary income an amount equal to the increase in value of its common shares for that year or to claim a deduction for any decrease in value (but only to the extent of previous mark-to-market gains). We or a related entity can give no assurance as to its status as a PFIC for the current or any future year. U.S. Holders should consult their own tax advisors with respect to the PFIC issue and its applicability to their particular tax situation.
Controlled Foreign Corporation Regime (“CFC”). If a U.S. Holder (or person defined as a U.S. persons under Section 7701(aX301 of the Code) owns 10% or more of the total combined voting power of all classes of our stock (, a “U. S. Shareholder”) and U.S. Shareholders own more than 50% of the vote or value of our Company, we would be a “controlled foreign corporation”. This classification would result in many complex consequences, including the required inclusion into income by such U. S. Shareholders of their pro rata shares of “Subpart F income” of our Company (as defined by the Code) and our earnings invested in “US property” (as defined by the Code). In addition, under Section 1248 of the Code, gain from the sale or exchange of our common shares by a US person who is or was a U. S. Shareholder at any time during the five year period before the sale or exchange may be treated as ordinary income to the extent of earnings and profits of ours attributable to the stock sold or exchanged. It is not clear the CFC regime would apply to the U.S. Holders of our common shares, and is outside the scope of this discussion.
Foreign Tax Credit
A U.S. Holder who pays (or has withheld from distributions) Canadian income tax with respect to us may be entitled to either a deduction or a tax credit for such foreign tax paid or withheld, at the option of the U.S. Holder. Generally, it will be more advantageous to claim a credit because a credit reduces United States federal income tax on a dollar-for-dollar basis, while a deduction merely reduces the taxpayer’s income subject to tax. This election is made on a year-by-year basis and generally applies to all foreign taxes paid by (or withheld from) the U.S. Holder during that year.
There are significant and complex limitations which apply to the credit, among which is the general limitation that the credit cannot exceed the proportionate share of the U.S. Holder’s United States income tax liability that the U.S. Holder’s foreign source income bears to its worldwide taxable income. This limitation is designed to prevent foreign tax credits from offsetting United States source income. In determining this limitation, the various items of income and deduction must be classified into foreign and domestic sources. Complex rules govern this classification process.
In addition, this limitation is calculated separately with respect to specific “baskets” of income such as passive income, high withholding tax interest, financial services income, shipping income, and certain other classifications of income. Foreign taxes assigned to a particular class of income generally cannot offset United States tax on income assigned to another class. Under the American Jobs Creation Act of 2004 (the “Act”), this basket limitation will be modified significantly after 2006.
Unused foreign tax credits can generally be carried back one year and carried forward ten years. U.S. Holders should consult their own tax advisors concerning the ability to utilize foreign tax credits, especially in light of the changes made by the Act.
Backup Withholding
Payment of dividends and sales proceeds that are made within the United States or through certain U.S.-related financial intermediaries generally are subject to information reporting requirement and to backup withholding unless the US Holder (i) is a corporation or other exempt recipient or (ii) in the case of backup withholding, provides a correct taxpayer identification number and certifies that no loss of exemption from backup withholding has occurred
The amount of any backup withholding from a payment to a US Holder will be allowed as a credit against the US Federal income tax liability of the US Holder and may entitle the US Holder to a refund, provided that the required information is furnished to the IRS.
F. DIVIDENDS AND PAYING AGENTS
Not Applicable. This Form 20-F is being filed as an Annual Report filed under the Exchange Act.
G. STATEMENT BY EXPERTS
Not Applicable. This Form 20-F is being filed as an Annual Report filed under the Exchange Act.
H. DOCUMENTS ON DISPLAY
The documents and exhibits referred to in this Annual Report are available for inspection at the registered and management office at 1 King Street West, Suite 1505, Toronto, Ontario M5H 1A1 during normal business hours.
I. SUBSIDIARY INFORMATION
Not Applicable. This Form 20-F is being filed as an Annual Report filed under the Exchange Act.
ITEM 11 QUANTITATIVE AND QUALITATIVE DISCLOSURE ABOUT MARKET RISK
The Company is exposed in varying degrees of risks arising from its financial instruments.The Company has entered into certain financial derivative contracts. These instruments are not used for trading or speculative purposes. The Company has not designated its financial derivative contracts as effective accounting hedges, and thus has not applied hedge accounting. As a result, all financial derivative contracts are classified as fair value through “fair value through profit or loss” and are recorded on the statement of financial position at fair value.
The Board approves and monitors the risk management processes. The Board’s main objectives for managing risks are to ensure liquidity, the fulfillment of obligations and limited exposure to credit and market risks while ensuring greater returns on any surplus funds.
Financial Instruments and Concentration of Risks
The Company has classified its financial instruments as follows:
| Financial Instrument | | Category | | Measurement method |
| Cash | | Fair value through profit or loss | | Fair value |
| Marketable securities | | Fair value through profit or loss | | Fair value |
| Derivative warrant liabilities | | Fair value through profit or loss | | Fair value |
| Trade and other receivables | | Loans and receivables | | Amortized cost |
| Trade and other payables | | Other financial liabilities | | Amortized cost |
| Provisions | | Other financial liabilities | | Amortized cost |
| Secured note payable and shareholders’ loans | | Other financial liabilities | | Amortized cost |
The types of risk exposure and the ways in which such exposures are managed are as follows:
Credit Risk
Credit risk is primarily related to the Company’s receivables from joint venture partners and the risk of financial loss if a partner or counterparty to a financial instrument fails to meet its contractual obligations. Receivables from joint venture partners are normally collected within one to three months of the joint venture bill being issued to the partner. The Company historically has not experienced any collection issues with its joint venture partners to date. The Company attempts to mitigate the risk from joint venture receivables by obtaining partner approval of significant capital expenditures prior to expenditure. The Company establishes an allowance for doubtful accounts as determined by management based on their assessed collectability; therefore, the carrying amount of trade and other receivables generally represents the maximum credit exposure. The Company believes that its counterparties currently have the financial capacity to settle outstanding obligations in the normal course of business.
Concentration risks exist in cash because significant balances are maintained with one financial institution. The risk is mitigated because the financial institution is an international bank.
The Company’s maximum exposure to credit risk is as follows:
| | | August 31, 2013 | | | August 31, 2013 | |
| Cash | | $ | 196,837 | | | $ | 330,003 | |
| Trade and other receivables | | | 27,786 | | | | 17,525 | |
| Prepaid expenses and deposits | | | 158,295 | | | | - | |
| Balance | | $ | 382,918 | | | $ | 347,528 | |
Liquidity Risk
The Company monitors its liquidity position regularly to assess whether it has the funds necessary to fulfill planned exploration commitments on its oil and gas properties or that viable options are available to fund such commitments from new equity issuances or alternative sources such as farm-out agreements. However, as an exploration company at an early stage of development and without significant internally generated cash flow, there are inherent liquidity risks, including the possibility that additional financing may not be available to the Company, or that actual exploration expenditures may exceed those planned. The current uncertainty in global markets could have an impact on the Company’s future ability to access capital on terms that are acceptable to the Company. The Company has so far been able to raise the required financing to meet its obligations however, there can be no assurance that it will continue to do so in the future.
The following table illustrates the contractual maturities of financial liabilities:
| August 31, 2013 | | Payments Due by Period | |
| | | Total | | | Less than
1 year | | | 1-3 years | | | 4-5 years | | | After
5 years | |
| Trade and others payables | | $ | 1,379,581 | | | $ | 1,379,581 | | | | - | | | | - | | | | - | |
| Secured note payable (1) | | | 1,013,088 | | | | 1,013,088 | | | | - | | | | - | | | | - | |
| Shareholders loans (1) | | | 2,108,205 | | | | 2,108,205 | | | | - | | | | - | | | | - | |
| Total | | $ | 4,500,874 | | | $ | 4,500,874 | | | | - | | | | - | | | | - | |
| August 31, 2012 | | Payments Due by Period | |
| | | Total | | | Less than
1 year | | | 1-3 years | | | 4-5 years | | | After
5 years | |
| Trade and others payables | | $ | 1,039,959 | | | $ | 1,039,959 | | | | - | | | | - | | | | - | |
| Secured note payable (1) | | | 946,848 | | | | 946,848 | | | | - | | | | - | | | | - | |
| Shareholders loans (1) | | | 2,179,778 | | | | 2,179,778 | | | | - | | | | - | | | | - | |
| Total | | $ | 4,166,585 | | | $ | 4,166,585 | | | | - | | | | - | | | | - | |
| (1) | Translated at current exchange rate. |
Market Risk
Market risk represents the risk of loss that may impact the Company’s financial position, results of operations, or cash flows due to adverse changes in financial market prices, including interest rate risk, foreign currency exchange rate risk, commodity price risk, and other relevant market or price risks. The Company does not use derivative financial instruments or derivative commodity instruments to mitigate this risk.
The oil and gas industry is exposed to a variety of risks including the uncertainty of finding and recovering new economic reserves, the performance of hydrocarbon reservoirs, securing markets for production, commodity prices, interest rate fluctuations, potential damage to or malfunction of equipment and changes to income tax, royalty, environmental or other governmental regulations.
Market events and conditions in recent years including disruptions in the international credit markets and other financial systems and the deterioration of global economic conditions have caused significant volatility to commodity prices. These conditions caused a loss of confidence in the broader U.S. and global credit and financial markets. Notwithstanding various actions by governments, concerns about the general condition of the capital markets, financial instruments, banks, investment banks, insurers and other financial institutions caused the broader credit markets to further deteriorate and stock markets to decline. These factors have negatively impacted company valuations and may impact the performance of the global economy going forward. Although economic conditions improved towards the latter portion of 2009, the recovery has been slow in various jurisdictions including in Europe and the United States and has been impacted by various ongoing factors including sovereign debt levels and high levels of unemployment which continue to impact commodity prices and to result in volatility in the stock market.
The Company mitigates these risks by:
| • | utilizing competent, professional consultants as support to company staff. |
| • | performing geophysical, geological or engineering analyses of prospects. |
| • | focusing on a limited number of core properties. |
Commodity price risk is the risk that the fair value or future cash flows will fluctuate as a result of changes in commodity prices. Commodity prices for petroleum and natural gas are impacted by world economic events that dictate the levels of supply and demand.
The Company believes that movement in commodity prices that are reasonably possible over the next twelve month period will not have a significant impact on the Company.
Commodity Price Sensitivity
The following table summarizes the sensitivity of the fair value of the Company’s risk management position for the year ended August 31, 2013 and 2012 to fluctuations in natural gas prices, with all other variables held constant. When assessing the potential impact of these price changes, the Company believes that 10 percent volatility is a reasonable measure. Fluctuations in natural gas prices potentially could have resulted in unrealized gains (losses) impacting net income as follows:
| | | 2013 | | | 2012 | |
| | | Increase 10% | | | Decrease 10% | | | Increase 10% | | | Decrease 10% | |
| Net revenue | | $ | 32,946 | | | $ | 27,178 | | | $ | 43,764 | | | $ | 34,672 | |
| Net loss | | $ | (4,263,162 | ) | | $ | (4,268,930 | ) | | $ | (2,804,642 | ) | | $ | (2,813,374 | ) |
The Company is exposed to the fluctuations in foreign exchange rates. The prices received by the Company for the production of natural gas and natural gas liquids are primarily determined in reference to United States dollars but are settled with the Company in Canadian dollars. The Company’s cash flow for commodity sales will therefore be impacted by fluctuations in foreign exchange rates.
The Company operates in Canada and a portion of its expenses are incurred in U.S. dollars. A significant change in the currency exchange rates between the Canadian dollar relative to US dollar could have an effect on the Company’s financial instruments. The Company does not hedge its foreign currency exposure.
The following assets and liabilities are denominated in US dollars at August 31, 2013 and August 31, 2012:
| | | August 31, 2013 | | | August 31, 2012 | |
| Cash | | $ | 150,901 | | | $ | 311,318 | |
| Trade and other receivables | | | 14,349 | | | | - | |
| Exploration and evaluation assets | | | 2,681,541 | | | | 5,083,874 | |
| Prepaid expenses and deposits | | | 150,000 | | | | - | |
| Trade and other payables | | | (821,787 | ) | | | (402,633 | ) |
| Provisions | | | (265,117 | ) | | | (226,494 | ) |
| Derivative warrant liabilities | | | (1,873,290 | ) | | | (1,614,996 | ) |
| Shareholders’ loans | | | (1,733,500 | ) | | | (1,883,740 | ) |
| Secured notes payable | | | (960,000 | ) | | | (960,000 | ) |
| Net assets denominated in US$ | | $ | (2,656,903 | ) | | $ | 307,329 | |
| Net asset CDN dollar equivalent at period end(1) | | $ | (2,803,830 | ) | | $ | 303,120 | |
(1) Translated at the exchange rate in effect at August 31, 2013 $1.0553 (August 31, 2012 $0.9863)
The following table shows the estimated sensitivity of the Company’s total comprehensive loss for the periods set out from a change in the U.S dollar exchange rate in which the Company has exposure with all other variables held constant.
| | | | August 31, 2013 | | | August 31, 2012 | |
| | | | Increase | | | Decrease | | | Increase | | | Decrease | |
Percentage change in
US Dollar | | | In total comprehensive loss from a
change in % in the US Exchange Rate ($) | | | In total comprehensive loss from a change
in % in the US Exchange Rate ($) | |
| | 2 | % | | | (59,178 | ) | | | 59,178 | | | | (6,062 | ) | | | 6,062 | |
| | 4 | % | | | (118,355 | ) | | | 118,355 | | | | (12,125 | ) | | | 12,125 | |
| | 6 | % | | | (177,533 | ) | | | 177,533 | | | | (18,187 | ) | | | 18,187 | |
| | 8 | % | | | (236,711 | ) | | | 236,711 | | | | (24,250 | ) | | | 24,250 | |
| | 10 | % | | | (295,888 | ) | | | 295,888 | | | | (30,312 | ) | | | 30,312 | |
Interest rate risk refers to the risk that the value of a financial instrument or cash flows associated with the instrument will fluctuate due to changes in market interest rates. The majority of the Company’s debt is short-term in nature with fixed rates.
Based on management's knowledge and experience of the financial markets, the Company believes that the movements in interest rates that are reasonably possible over the next twelve month period will not have a significant impact on the Company.
| (iv) | Fair Value of Financial Instruments |
The Company’s financial instruments included on the consolidated statement of financial position as at August 31, 2013 and 2012 are comprised of cash, marketable securities, trade and other receivables, prepaid expenses and deposits, trade and other payables, secured note payable, shareholders’ loans, provisions, and derivative warrant liabilities.
The Company classifies the fair value of financial instruments measured at fair value according to the following hierarchy based on the amount of observable inputs used to value the instrument.
• Level 1 – Quoted prices are available in active markets for identical assets or liabilities as of the reporting date. Active markets are those in which transactions occur in sufficient frequency and volume to provide pricing information on an ongoing basis.
• Level 2 – Pricing inputs are other than quoted prices in active markets included in Level 1. Prices in Level 2 are either directly or indirectly observable as of the reporting date. Level 2 valuations are based on inputs, including quoted forward prices for commodities, time value and volatility factors, which can be substantially observed or corroborated in the marketplace.
• Level 3 – Valuations in this level are those with inputs for the asset or liability that are not based on observable market data.
| | | August 31, 2013 | | | August 31, 2012 | |
Financial Instrument
Classification | | Carrying
Value $ | | | Fair
Value $ | | | Carrying
Value $ | | | Fair
Value $ | |
| Fair value through profit or loss: | | | | | | | | | | | | |
| Cash | | | 196,837 | | | | 196,837 | | | | 330,003 | | | | 330,003 | |
| Marketable securities | | | - | | | | - | | | | 1 | | | | 1 | |
| Derivative warrant liabilities | | | 1,976,883 | | | | 1,976,883 | | | | 1,640,406 | | | | 1,640,406 | |
| Loans and receivables: | | | | | | | | | | | | | | | | |
| Trade and other receivables | | | 27,786 | | | | 27,786 | | | | 17,525 | | | | 17,525 | |
| Other financial liabilities: | | | | | | | | | | | | | | | | |
| Trade and other payables | | | 1,379,581 | | | | 1,379,581 | | | | 1,039,959 | | | | 1,039,959 | |
| Secured note payable | | | 1,013,088 | | | | 1,013,088 | | | | 946,848 | | | | 946,848 | |
| Shareholders’ loans | | | 2,108,205 | | | | 2,108,205 | | | | 2,179,778 | | | | 2,179,778 | |
| Provisions | | | 298,295 | | | | 298,295 | | | | 240,672 | | | | 240,672 | |
Cash, derivative warrant liabilities and marketable securities are stated at fair value (Level 1 measurement). The carrying value of trade and other receivables, trade and other payables, secured notes payable, shareholders’ loans and provisions approximate their fair value due to the short-term maturity of these financial instruments (Level 3 measurement).
ITEM 12 DESCRIPTION OF SECURITIES OTHER THAN EQUITY SECURITIES
A. DEBT SECURITIES
Not applicable.
B. WARRANTS AND RIGHTS
Not applicable.
C. OTHER SECURITIES
Not Applicable.
D. AMERICAN DEPOSITORY SHARES
Not Applicable.
PART II
ITEM 13 DEFAULTS, DIVIDENDS ARREARAGES AND DELINQUENCIES
At November 29, 2013, we had a US$960,000, 10% per annum secured promissory note payable to Benchmark Enterprises LLC. The note and all unpaid and accrued interest was due on or before August 31, 2013, or within 15 days of written demand to us, or upon us closing a cash financing or series of cash financings in excess of US$2,500,000 in which case fifty cents of every one dollar exceeding US$2,500,000 will be allocated to the secured note until paid in full. At November 29, 2013 included in trade and other payables is interest of $192,704 (August 31, 2013 $169,033). The noteis secured by Zavala Inc.’s interest in the Matthews Lease and Dyami Energy’s interest in the Murphy Lease, Zavala County, Texas (the “Leases”). The carrying value of their interests in the Leases at August 31, 2013 was $2,829,830 (August 31, 2012 $4,645,534). We may, in our sole discretion, prepay any portion of the principal amount. As at the date of this Annual Report we had not received any written demand for payment.
| ITEM 14 | MATERIAL MODIFICATIONS TO THE RIGHTS OF SECURITY HOLDERS AND USE OF PROCEEDS |
Not applicable.
ITEM 15 CONTROLS AND PROCEDURES
Disclosure Controls and Procedures
Under the supervision and with the participation of our senior management, including our chief executive officer and chief financial officer, James Cassina, we conducted an evaluation of the effectiveness of the design and operation of our disclosure controls and procedures, as defined in Rules 13a-15(e) and 15d-15(e) under the Securities Exchange Act of 1934, as amended (the “Exchange Act”), as of the end of the period covered by this annual report (the “Evaluation Date”). Based on this evaluation, our chief executive officer and chief financial officer concluded as of the Evaluation Date that our disclosure controls and procedures were effective such that the information relating to us, required to be disclosed in our Securities and Exchange Commission (“SEC”) reports (i) is recorded, processed, summarized and reported within the time periods specified in SEC rules and forms, and (ii) is accumulated and communicated to our management, including our chief executive officer and chief financial officer, as appropriate to allow timely decisions regarding required disclosure.
Management’s Annual Report on Internal Control over Financial Reporting
Our management is responsible for establishing and maintaining adequate internal control over financial reporting. Our internal control over financial reporting is a process designed to provide reasonable assurance regarding the reliability of financial reporting and the preparation of financial statements for external reporting purposes in accordance with generally accepted accounting principles.
Our internal control over financial reporting includes those policies and procedures that (i) pertain to the maintenance of records that, in reasonable detail, accurately and fairly reflect transactions and dispositions of assets; (ii) provide reasonable assurances that transactions are recorded as necessary to permit preparation of financial statements in accordance with generally accepted accounting principles and that receipts and expenditures are being made only in accordance with authorizations of management and the directors of the Company; and (iii) provide reasonable assurance regarding prevention or timely detection of unauthorized acquisition, use or disposition of the Company's assets that could have a material effect on our financial statements. Because of its inherent limitations, internal control over financial reporting may not prevent or detect misstatements.
Management assessed the effectiveness of our internal control over financial reporting as of August 31, 2013 based on the framework established in Internal Control—Integrated Framework issued by the Committee of Sponsoring Organizations of the Treadway Commission (COSO). Based on that assessment, management concluded that, as of August 31, 2013, our internal control over financial reporting was effective based on the criteria established in Internal Control—Integrated Framework.
Limitations on Effectiveness of Controls and Procedures
Our management, including our Chief Executive Officer (Principal Executive Officer) and Chief Financial Officer (Principal Financial Officer), does not expect that our disclosure controls and procedures or our internal controls will prevent all errors and all fraud. A control system, no matter how well conceived and operated, can provide only reasonable, not absolute, assurance that the objectives of the control system are met. Our control systems are designed to provide such reasonable assurance of achieving their objectives. Further, the design of a control system must reflect the fact that there are resource constraints and the benefits of controls must be considered relative to their costs. Because of the inherent limitations in all control systems, no evaluation of controls can provide absolute assurance that all control issues and instances of fraud, if any, within our Company have been detected. These inherent limitations include, but are not limited to, the realities that judgments in decision-making can be faulty and that breakdowns can occur because of simple error or mistake. Additionally, controls can be circumvented by the individual acts of some persons, by collusion of two or more people, or by management override of the control. The design of any system of controls also is based in part upon certain assumptions about the likelihood of future events and there can be no assurance that any design will succeed in achieving its stated goals under all potential future conditions. Over time, controls may become inadequate because of changes in conditions, or the degree of compliance with the policies or procedures may deteriorate. Because of the inherent limitations in a cost-effective control system, misstatements due to error or fraud may occur and not be detected.
Changes in Internal Control over Financial Reporting
There have been no changes in our internal control over financial reporting that occurred during the quarter ended August 31, 2013 that have materially affected or are reasonably likely to materially affect our internal control over financial reporting.
ITEM 16 [RESERVED]
A. AUDIT COMMITTEE FINANCIAL EXPERT
Our Board of Directors has determined that Mr. Milton Klyman is an "audit committee financial expert", as defined in Item 16A of Form 20-F and is independent. Milton Klyman is the Chairman of the Audit Committee. He is a self-employed financial consultant and has been a Chartered Accountant since 1952. Milton Klyman is a Life Member of the Institute of Chartered Accountants of Ontario, a Life member of the Canadian Institute of Mining Metallurgy and Petroleum and a Fellow of the Institute of Chartered Secretaries and Administrators.
B. CODE OF ETHICS
We have adopted a written code of business conduct and ethics (the "Code") for our directors, officers and employees. The board encourages following the Code by making it widely available. It is distributed to directors in the Director’s Manual and to officers, employees and consultants at the commencement of their employment or consultancy. The Code reminds those engaged in service to us that they are required to report perceived or actual violations of the law, violations of our policies, dangers to health, safety and the environment, risks to our property, and accounting or auditing irregularities to the chair of the Audit Committee who is an independent director of ours. In addition, to requiring directors, officers and employees to abide by the Code, we encourage consultants, service providers and all parties who engage in business with us to contact the chair of the Audit Committee regarding any perceived and all actual breaches by our directors, officers and employees of the Code. The chair of our Audit Committee is responsible for investigating complaints, presenting complaints to the applicable board committee or the board as a whole, and developing a plan for promptly and fairly resolving complaints. Upon conclusion of the investigation and resolution of a complaint, the chair of our Audit Committee will advise the complainant of the corrective action measures that have been taken or advise the complainant that the complaint has not been substantiated. The Code prohibits retaliation by us, our directors and management, against complainants who raise concerns in good faith and requires us to maintain the confidentiality of complainants to the greatest extent practical. Complainants may also submit their concerns anonymously in writing. In addition to the Code, we have an Audit Committee Charter and a Policy of Procedures for Disclosure Concerning Financial/Accounting Irregularities.
Since the beginning of our most recently completed financial year, no material change reports have been filed that pertain to any conduct of a director or executive officer that constitutes a departure from the Code. The board encourages and promotes a culture of ethical business conduct by appointing directors who demonstrate integrity and high ethical standards in their business dealings and personal affairs. Directors are required to abide by the Code and expected to make responsible and ethical decisions in discharging their duties, thereby setting an example of the standard to which management and employees should adhere. The board is required by the Board Mandate to satisfy our CEO and other executive officers are acting with integrity and fostering a culture of integrity throughout the Company. The board is responsible for reviewing departures from the Code, reviewing and either providing or denying waivers from the Code, and disclosing any waivers that are granted in accordance with applicable law. In addition, the board is responsible for responding to potential conflict of interest situations, particularly with respect to considering existing or proposed transactions and agreements in respect of which directors or executive officers advise they have a material interest. The Board Mandate requires that directors and executive officers disclose any interest and the extent, no matter how small, of their interest in any transaction or agreement with us, and that directors excuse themselves from both board deliberations and voting in respect of transactions in which they have an interest. By taking these steps the board strives to ensure that directors exercise independent judgment, unclouded by the relationships of the directors and executive officers to each other and us, in considering transactions and agreements in respect of which directors and executive officers have an interest. Our Code applies to our directors, officers and employees, including our principal executive officer, principal financial officer, principal accounting officer or persons performing similar functions of the Company. There have been no waivers of our Code granted to our principal executive officer, principal financial officer, principal accounting officer or controller, or similar persons during the period covered by this Annual Report.
Upon written request to us at our registered and management office, attention: the President, we will provide by mail, to any person without charge a copy of our Code of Ethics.
C. PRINCIPAL ACCOUNTANT FEES AND SERVICES
It is the policy of the Audit Committee that all audit and non-audit services are pre-approved prior to engagement. Before the initiation of each audit, the principal accountant submits a budget of the expected range of expenditures to complete their audit engagement (including Audit Fees, Audit-Related Fees and Tax Fees) to the Audit Committee for approval. In the event that the principal accountant exceeds these parameters, the individual auditor is expected to communicate to management the reasons for the variances, so that such variances can be ratified by the Audit Committee. As a result, 100% of expenditures within the scope of the noted budget are approved by the Audit Committee.
During fiscal 2013 and 2012 there were no hours performed by any person other than the primary accountant’s fulltime permanent employees.
Since the commencement of the Company's most recently completed financial year, no recommendations were made by the Audit Committee to nominate or compensate an external auditor.
External Auditor Service Fees (By Category)
The aggregate fees billed or accrued for professional fees rendered by Schwartz Levitsky Feldman llp, Chartered Accountants for the years ended August 31, 2013 and August 31, 2012 are as follows:
| Nature of Services | | Fees Paid to Auditor for Year-
ended
August 31, 2013 | | | Fees Paid to Auditor for Year-
ended
August 31, 2012 | |
| Audit Fees(1) | | $ | 55,000 | | | $ | 58,500 | |
| Audit-Related Fees(2) | | | Nil | | | | 4,200 | |
| Tax Fees(3) | | | 5,000 | | | | 6,650 | |
| All Other Fees(4) | | | Nil | | | | Nil | |
| TOTALS | | $ | 60,000 | | | $ | 69,350 | |
Notes:
| 1. | "Audit Fees" include fees necessary to perform the annual audit and any quarterly reviews of the Company's financial statements management discussion and analysis. This includes fees for the review of tax provisions and for accounting consultations on matters reflected in the financial statements. This also includes audit or other attest services required by legislation or regulation, such as comfort letters, consents, reviews of securities filings and statutory audits. |
| 2. | "Audit-Related Fees" include fees for assurance and related services that are reasonably related to the performance of the audit or review of the Company's financial statements and that are not included in "Audit Fees". |
| 3. | "Tax Fees" include fees for all professional services rendered by the Company's auditors for tax compliance, tax advice and tax planning. |
| 4. | "All Other Fees" include all fees for products and services provided by the Company's auditors not included in "Audit Fees", "Audit-Related Fees" and "Tax Fees". |
D. EXEMPTIONS FROM THE LISTING STANDARDS FOR AUDIT COMMITTEES
Not Applicable.
E. PURCHASES OF EQUITY SECURITIES BY THE ISSUER AND AFFILIATED PURCHASERS
Not applicable.
F. CHANGE IN REGISTRANT’S CERTIFYING ACCOUNTANT
Not Applicable.
G. CORPORATE GOVERNANCE
Not Applicable.
H. MINE SAFETY DISCLOSURE
Not applicable.
PART III
ITEM 17 FINANCIAL STATEMENTS
Not applicable.
ITEM 18 FINANCIAL STATEMENTS
The following attached Consolidated Financial Statements are included in this Annual Report on Form 20-F beginning with page F-1:
| 1. | Audited Consolidated Financial Statements of Eagleford Energy Inc. for the years ended August 31, 2013 and 2012, comprised of the following: |
| (a) | Independent Auditor’s Report of Schwartz Levitsky Feldman LLP, Chartered Accountants for the years ended August 31, 2013 and 2012; |
| (b) | Consolidated Statements of Financial Position as at August 31, 2013, 2012 and 2011; |
| (c) | Consolidated Statements of Operations and Comprehensive Loss for the years ended August 31, 2013, 2012 and 2011; |
| (d) | Consolidated Statements of Shareholders’ Equity for the years ended August 31, 2013, 2012 and 2011; |
| (e) | Consolidated Statements of Cash Flows for the years ended August 31, 2013, 2012 and 2011; |
| (f) | Notes to the Consolidated Financial Statements. |
ITEM 19 EXHIBITS
The following exhibits are included in the Annual Report on Form 20-F:
| Exhibit # | | Description |
| 1.1 | | Certificate of Incorporation of Bonanza Red Lake Explorations Inc. (presently known as Eagleford Energy Inc.) dated September 22, 1978 (1) |
| 1.2 | | Articles of Amendment dated January 14, 1985 (1) |
| 1.3 | | Articles of Amendment dated August 16, 2000 (1) |
| 1.4 | | Bylaw No 1 of Bonanza Red Lake Explorations Inc. (presently known as Eagleford Energy Inc.) (1) |
| 1.5 | | Special By-Law No 1 – Respecting the borrowing of money and the issue of securities of Bonanza Red Lake Explorations Inc. (presently known as Eagleford Energy Inc.) (1) |
| 1.6 | | Articles of Amalgamation dated November 30, 2009 (3) |
| 4.1 | | 2000 Stock Option Plan (1) |
| 4.2 | | Code of Business Conduct and Ethics (1) |
| 4.3 | | Audit Committee Charter (1) |
| 4.4 | | Petroleum and Natural Gas Committee Charter (1) |
| 4.5 | | Compensation Committee Charter (1) |
| 4.6 | | Purchase and Sale Agreement dated February 5, 2008 among Eugenic Corp., 1354166 Alberta Ltd., and the Vendors of 1354166 Alberta Ltd. (1) |
| 4.7 | | Amended Audit Committee Charter (3) |
| 4.8 | | Amended Stock Option Plan (4) |
| 4.9 | | Asset Purchase Agreement between Eagleford Energy Inc., and Source Re-Work Program Inc., dated May 12, 2010 (6) |
| 4.10 | | Addendum dated June 10, 2010 to the Asset Purchase Agreement between Eagleford Energy Inc. and Source Re-Work Program Inc., dated May 12, 2010 (6) |
| 4.11 | | Addendum 2 dated June 30, 2010 to the Asset Purchase Agreement between Eagleford Energy Inc. and Source Re-Work Program Inc., dated May 12, 2010 (6) |
| 4.12 | | Acquisition Agreement among Eagleford Energy Inc., Dyami Energy LLC and the Members of Dyami Energy LLC dated August 10, 2010 (5) |
| 4.13 | | Financial Advisory Services Agreement between Eagleford Energy Inc. and GarWood Securities, LLC dated June 10, 2010 (6) |
| 4.14 | | Amended Stock Option Plan, February 24, 2011 (7) |
| 4.15 | | Amendment dated December 31, 2011 to 6% Secured Promissory Note between Eagleford Energy Inc. and Benchmark Enterprises LLC (8) |
| 4.16 | | Consent of Sproule Associates Limited dated February 16, 2012 (9) |
| 4.17 | | Evaluation of P&NG Reserves of Eagleford Energy Inc., at August 31, 2011 (11) |
| 4.18 | | Amended Stock Option Plan, February 24, 2012 (8) |
| 4.19 | | By-Law No. 1, February 24, 2012 (8) |
| 4.20 | | Articles of Amendment, effective March 16, 2012 (10) |
| 4.21 | | 2nd Amendment dated June 30, 2012 to 6% Secured Promissory Note between Eagleford Energy Inc. and Benchmark Enterprises LLC (12) |
| 4.22 | | Evaluation of P&NG Reserves of Eagleford Energy Inc., at August 31, 2012 (12) |
| 4.23 | | Consent of Sproule Associates Limited dated (12) |
| 4.24 | | Placement Agency Agreement dated March 12, 2012 between Eagleford Energy Inc. and Gottbetter Capital Markets, LLC(12) |
| 4.25 | | Amendment dated April 13, 2012 to Placement Agency Agreement dated March 12, 2012 between Eagleford Energy Inc. and Gottbetter Capital Markets, LLC (12) |
| 4.26 | | Amendment No. 2 dated July 17, 2012 to Placement Agency Agreement dated March 12, 2012 between Eagleford Energy Inc. and Gottbetter Capital Markets, LLC (12) |
| 4.27 | | Amendment No. 3 dated August 14, 2012 to Placement Agency Agreement dated March 12, 2012 between Eagleford Energy Inc. and Gottbetter Capital Markets, LLC (12) |
| 4.28 | | Amendment No. 4 dated August 31, 2012 to Placement Agency Agreement dated March 12, 2012 between Eagleford Energy Inc. and Gottbetter Capital Markets, LLC (12) |
| 4.29 | | 3rd Amendment dated November 23, 2012 to Secured Promissory Note between Eagleford Energy Inc. and Benchmark Enterprises LLC (12) |
| 4.30 | | 4th Amendment dated March 1, 2013 to Secured Promissory Note between Eagleford Energy Inc. and Benchmark Enterprises LLC (13) |
| 4.31 | | Eagleford Energy, Zavala Inc., Certificate of Incorporation dated August 29, 2013 (13) |
| 4.32 | | Rule 14 Agreement among The Matthews Family Mineral Account, LP, Delta Star Holdings, LLC, Dyami Energy, LLC, Eagleford Energy, Inc.,OGR Energy Corporation, OGR 2000 Ltd., and Texas Onshore Energy, Inc. (13) |
| 4.33 | | Termination of Financial Advisory Agreement between Eagleford Energy Inc. and The PrinceRidge Group LLC dated September 5, 2013 (13) |
| 4.34 | | Joint Development Agreement between Eagleford Energy Inc., Eagleford Energy, Zavala Inc., and Stratex Oil and Gas Holdings, Inc. (13) |
| | | |
| 8.1 | | Subsidiaries of Eagleford Energy Inc. (13) |
| 12.1/12.2 | | Section 302 Certification of Chief Executive and Financial Officer (13) |
| 13.1/13.2 | | Section 906 Certification of Chief Executive and Financial Officer (13) |
| Reference # | | Incorporated by Reference |
| (1) | | Previously filed on April 29, 2009 by Registrant as part of Registration Statement on Form 20-F (SEC File No. 0-53646) |
| (2) | | Previously Filed by Registrant as part of Amendment #2 to Registration Statement on Form 20F/A on July 14, 2009 |
| (3) | | Previously Filed by Registrant on Form 6 K on December 1, 2009 |
| (4) | | Previously filed by Registrant on Form 20F/A on March 12, 2010 |
| (5) | | Previously filed by Registrant on Form 6-K on September 16, 2010 |
| (6) | | Previously Filed by Registrant on Form 20F on February 11, 2011 |
| (7) | | Previously filed by Registrant on Form 6-K on January 27, 2011 |
| (8) | | Previously filed by Registrant on Form 6-K on February 1, 2012 |
| (9) | | Previously filed by Registrant on Form 20F on February 16, 2012 |
| (10) | | Previously filed by Registrant on Form 6-K on March 9, 2012 |
| (11) | | Previously filed by Registrant on Form 20F/A on April 26, 2012 |
| (12) | | Previously filed by Registrant on Form 20F December 31, 2012 |
| (13) | | Filed as an Exhibit hereto |
The registrant hereby certifies that it meets all of the requirements for filing on Form 20-F and that it has duly caused and authorized the undersigned to sign this Annual Report on its behalf.
| | EAGLEFORD ENERGY INC. |
| | | |
| | By: | /s/ James Cassina |
| | | Name: James Cassina |
| | | Title: President and Chief Executive Officer |
Date: December 24, 2013
INDEX TO FINANCIAL STATEMENTS
Audited Consolidated Financial Statements of Eagleford Energy Inc. for the years ended August 31, 2013 and 2012, comprised of the following:
| (a) | Independent Auditor’s Report of Schwartz Levitsky Feldman LLP, Chartered Accountants for the years ended August 31, 2013 and 2012; | F-1 |
| (b) | Consolidated Statements of Financial Position for the years ended August 31, 2013 and 2012; | F-2 |
| (c) | Consolidated Statements of Operations and Comprehensive Loss for the years ended August 31, 2013, 2012 and 2011; | F-3 |
| (d) | Consolidated Statements of Shareholders’ Equity for the years ended August 31, 2013, 2012 and 2011; | F-4 |
| (e) | Consolidated Statements of Cash Flows for the years ended August 31, 2013, 2012 and 2011; | F-5 |
| (f) | Notes to the Consolidated Financial Statements. | F6-F37 |
ITEM 1

Consolidated Financial Statements
For the years ended August 31, 2013, 2012 and 2011
(Expressed in Canadian Dollars)

Consolidated Financial Statements
For the years ended August 31, 2013, 2012 and 2011
(Expressed in Canadian Dollars)
Contents
| Independent Auditor’s Report | |
| | |
| Consolidated Financial Statements | |
| | |
| Consolidated Statements of Financial Position | F-2 |
| | |
| Consolidated Statements of Operations and Comprehensive Loss | F-3 |
| | |
| Consolidated Statements of Shareholders’ Equity | F-4 |
| | |
| Consolidated Statements of Cash Flows | F-5 |
| | |
| Notes to Consolidated Financial Statements | F-6– F-37 |
Schwartz Levitsky Feldman llp
CHARTERED ACCOUNTANTS
LICENSED PUBLIC ACCOUNTANTS
TORONTO· MONTREAL
INDEPENDENT AUDITOR’S REPORT
To the Shareholders of Eagleford Energy Inc. and its subsidiaries
We have audited the accompanying consolidated financial statements of Eagleford Energy Inc. and its subsidiaries (the “Company”), which comprise the consolidated statements of financial position as at August 31, 2013 and 2012, and the consolidated statements of operations and comprehensive loss, changes in shareholders’ equity and cash flows for the years then ended, and a summary of significant accounting policies and other explanatory information.
Management's Responsibility for the Consolidated Financial Statements
Management is responsible for the preparation and fair presentation of these consolidated financial statements in accordance with International Financial Reporting Standards as issued by the International Accounting Standards Board, and for such internal control as management determines is necessary to enable the preparation of the consolidated financial statements that are free from material misstatement, whether due to fraud or error.
Auditor's Responsibility
Our responsibility is to express an opinion on these consolidated financial statements based on our audits. We conducted our audits in accordance with Canadian generally accepted auditing standards and the Standards of the Public Company Accounting Oversight Board (United States). Those standards require that we comply with ethical requirements and plan and perform the audit to obtain reasonable assurance about whether the consolidated financial statements are free from material misstatement.
An audit involves performing procedures to obtain audit evidence about the amounts and disclosures in the consolidated financial statements. The procedures selected depend on the auditor's judgment, including the assessment of the risks of material misstatement of the consolidated financial statements, whether due to fraud or error. In making those risk assessments, the auditor considers internal control relevant to the entity's preparation and fair presentation of the consolidated financial statements in order to design audit procedures that are appropriate in the circumstances, but not for the purpose of expressing an opinion on the effectiveness of the entity's internal control. An audit also includes evaluating the appropriateness of accounting policies used and the reasonableness of accounting estimates made by management, as well as evaluating the overall presentation of the consolidated financial statements.
We believe that the audit evidence we have obtained in our audits is sufficient and appropriate to provide a basis for our audit opinion.
Opinion
In our opinion, the consolidated financial statements present fairly, in all material respects, the financial position of Eagleford Energy Inc. and its subsidiaries as at August 31, 2013 and 2012, and their financial performance and its cash flows for the years then ended in accordance with International Financial Reporting Standards as issued by the International Accounting Standards Board.
Emphasis of Matter
Without qualifying our opinion, we draw attention to Note 1 in the consolidated financial statements which indicates that the Company incurred a net loss of $4,266,046 during the year ended August 31, 2013 and, as of that date its current liabilities exceeded its current assets by $4,985,312. These conditions, along with other matters as set forth in Note 1, raise substantial doubt about the Company's ability to continue as a going concern. Management’s plans in regard to these matters are also described in Note 1. The consolidated financial statements do not include any adjustments that might result from the outcome of this uncertainty.
| | /s/ Schwartz Levitsky Feldman, llp |
| | “Schwartz Levitsky Feldman, llp” |
| Toronto, Ontario, Canada | Chartered Accountants |
| December 23, 2013 | Licensed Public Accountants |
| | 2300 Yonge Street, Suite 1500 |
| | Toronto, Ontario M4P 1E4 |
| | Tel: 416 785 5353 |
| | Fax: 416 785 5663 |

| Consolidated Statements of Financial Position |
| (Expressed in Canadian Dollars) |
| | | August 31, 2013 | | | August 31, 2012 | |
| Assets | | | | | | | | |
| Current assets | | | | | | | | |
| Cash | | $ | 196,837 | | | $ | 330,003 | |
| Marketable securities (Note 6) | | | - | | | | 1 | |
| Trade and other receivables | | | 27,786 | | | | 17,525 | |
| Prepaid expenses and deposits | | | 158,295 | | | | - | |
| Total current assets | | | 382,918 | | | | 347,529 | |
| Non-current assets | | | | | | | | |
| Property and equipment (Note 8) | | | - | | | | 175,000 | |
| Exploration and evaluation assets (Note 7) | | | 6,535,278 | | | | 8,475,487 | |
| Total non-current assets | | | 6,535,278 | | | | 8,650,487 | |
| | | | | | | | | |
| Total Assets | | $ | 6,918,196 | | | $ | 8,998,016 | |
| | | | | | | | | |
| Liabilities and Shareholders’ Equity | | | | | | | | |
| Current liabilities | | | | | | | | |
| Trade and other payables | | $ | 1,379,581 | | | $ | 1,039,959 | |
| Secured note payable (Note 12) | | | 1,013,088 | | | | 946,848 | |
| Shareholders’ loans (Note 11) | | | 2,108,205 | | | | 2,179,778 | |
| Provisions (Note 9) | | | 178,553 | | | | - | |
| Derivative warrant liabilities (Note 13) | | | 688,803 | | | | - | |
| Total current liabilities | | | 5,368,230 | | | | 4,166,585 | |
| Non-current liabilities | | | | | | | | |
| Derivative warrant liabilities (Note 13) | | | 1,288,080 | | | | 1,640,406 | |
| Provisions (Note 9) | | | 119,742 | | | | 240,672 | |
| Total non-current liabilities | | | 1,407,822 | | | | 1,881,078 | |
| | | | | | | | | |
| Total Liabilities | | | 6,776,052 | | | | 6,047,663 | |
| | | | | | | | | |
| Shareholders’ Equity | | | | | | | | |
| Share capital (Note 10) | | | 7,050,350 | | | | 5,906,633 | |
| Share purchase warrants (Note 10) | | | 1,422,526 | | | | 1,422,526 | |
| Share purchase options (Note 10) | | | 170,972 | | | | 170,972 | |
| Contributed surplus (Note 10) | | | 506,200 | | | | 506,200 | |
| Foreign currency translation reserve | | | 204,657 | | | | (109,463 | ) |
| Accumulated Deficit | | | (9,212,561 | ) | | | (4,946,515 | ) |
| Total Shareholders’ Equity | | | 142,144 | | | | 2,950,353 | |
| | | | | | | | | |
| Total Liabilities and Shareholders’ Equity | | $ | 6,918,196 | | | $ | 8,998,016 | |
Going Concern (Note 1)
Related Party Transactions and Balances (Note 11)
Commitments and Contingencies (Note 17)
Subsequent Event (Note 19)
Approved by the Board of Directors
| /s/ James Cassina | | /s/ Milton Klyman |
| James Cassina, Director | | Milton Klyman, Director |
The accompanying notes are an integral part of these consolidated financial statements
| |
| Consolidated Statements of Operations and Comprehensive Loss | | | | | | | | | |
For the years ended August 31,
(Expressed in Canadian Dollars) | | 2013 | | | 2012 | | | 2011 | |
| | | | | | | | | | |
| Revenue | | | | | | | | | | | | |
| Natural gas sales, net of royalties | | $ | 30,062 | | | $ | 39,218 | | | $ | 56,916 | |
| Expenses | | | | | | | | | | | | |
| Operating costs | | | 9,234 | | | | 28,471 | | | | 52,190 | |
| Depletion and accretion | | | 13,283 | | | | 20,509 | | | | 23,912 | |
| General and administrative | | | 583,577 | | | | 705,591 | | | | 502,474 | |
| Marketing and public relations | | | 25,763 | | | | 46,272 | | | | 88,569 | |
| Impairment loss on property and equipment (Note 8) | | | 168,954 | | | | 50,774 | | | | 48,249 | |
| Impairment loss on exploration and evaluation assets (Note 7) | | | 2,690,568 | | | | - | | | | - | |
| Interest expense | | | 76,783 | | | | 88,789 | | | | 68,199 | |
| Loss (gain) on derivative warrant liabilities (Note 13) | | | 128,041 | | | | 46,655 | | | | (126,410 | ) |
| Loss on settlement of debt (Note 10) | | | 402,264 | | | | 1,465,465 | | | | - | |
| Unrealized loss (gain) on foreign exchange | | | 197,640 | | | | 36,283 | | | | (161,340 | ) |
| Impairment loss on marketable securities | | | 1 | | | | - | | | | - | |
| Stock based compensation - non employees (Note 10) | | | - | | | | 75,062 | | | | - | |
| Stock based compensation (Note 10) | | | - | | | | 95,910 | | | | - | |
| Compensation expense on re-pricing of units (Note 10) | | | - | | | | 188,625 | | | | - | |
| Gain on disposal of marketable securities | | | - | | | | - | | | | (8,000 | ) |
| | | | 4,296,108 | | | | 2,848,406 | | | | 487,843 | |
| | | | | | | | | | | | | |
| Net loss | | | (4,266,046 | ) | | | (2,809,188 | ) | | | (430,927 | ) |
| | | | | | | | | | | | | |
| Foreign currency translation | | | 314,120 | | | | (160 | ) | | | (109,303 | ) |
| | | | | | | | | | | | | |
| Comprehensive loss | | $ | (3,951,926 | ) | | $ | (2,809,348 | ) | | $ | (540,230 | ) |
| | | | | | | | | | | | | |
| Loss per share, basic and diluted | | $ | (0.041 | ) | | $ | (0.034 | ) | | $ | (0.007 | ) |
| | | | | | | | | | | | | |
| Weighted average shares outstanding, basic and diluted * | | | 104,774,293 | | | | 81,769,733 | | | | 63,854,456 | |
* Reflects the March 16, 2012 two-for-one stock split (Refer to Note 10)
The accompanying notes are an integral part of these consolidated financial statements
Consolidated Statements of Changes in Shareholders’ Equity
For the years ended August 31, 2013, 2012 and 2011
(Expressed in Canadian Dollars)
| | | SHARE
CAPITAL
Number of
shares* | | | SHARE
CAPITAL
Amount
$ | | | SHARE
PURCHASE
WARRANTS
$ | | | SHARE
PURCHASE
OPTIONS
$ | | | CONTRI-
BUTED
SURPLUS
$ | | | FOREIGN
CURRENCY
TRANS-
LATION
RESERVE
$ | | | ACCUMULATED
DEFICIT
$ | | | TOTAL
SHARE-
HOLDERS’
EQUITY
$ | |
| Balance, September 1, 2010 | | | 59,502,051 | | | | 3,817,184 | | | | 380,734 | | | | - | | | | 43,750 | | | | - | | | | (1,706,400 | ) | | | 2,535,268 | |
Issuance of units as
compensation | | | 200,000 | | | | 95,800 | | | | - | | | | - | | | | - | | | | - | | | | - | | | | 95,800 | |
| Warrants exercised | | | 7,420,692 | | | | 722,572 | | | | (128,097 | ) | | | - | | | | - | | | | - | | | | - | | | | 594,475 | |
| Warrants cancelled | | | - | | | | - | | | | - | | | | - | | | | 36,237 | | | | - | | | | - | | | | 36,237 | |
| Imputed Interest | | | - | | | | - | | | | - | | | | - | | | | 5,750 | | | | - | | | | - | | | | 5,750 | |
Foreign currency
translation | | | - | | | | - | | | | - | | | | - | | | | - | | | | (109,303 | ) | | | - | | | | (109,303 | ) |
| Net loss for the year | | | - | | | | - | | | | - | | | | - | | | | - | | | | - | | | | (430,927 | ) | | | (430,927 | ) |
| Balance, August 31, 2011 | | | 67,122,743 | | | | 4,635,556 | | | | 252,637 | | | | - | | | | 85,737 | | | | (109,303 | ) | | | (2,137,327 | ) | | | 2,727,300 | |
| Issuance of shares as debt settlement | | | 3,107,006 | | | | 395,589 | | | | - | | | | - | | | | - | | | | - | | | | - | | | | 395,589 | |
| Issuance of units as debt settlement | | | 17,150,000 | | | | 1,150,367 | | | | 1,102,348 | | | | - | | | | - | | | | - | | | | - | | | | 2,252,715 | |
| Private placement of units | | | 2,000,000 | | | | 32,459 | | | | 67,541 | | | | - | | | | - | | | | - | | | | - | | | | 100,000 | |
| Private placement of units | | | 3,000,000 | | | | 342,786 | | | | - | | | | - | | | | - | | | | - | | | | - | | | | 342,786 | |
| Compensation expense on re-pricing units | | | 750,000 | | | | - | | | | - | | | | - | | | | 118,507 | | | | - | | | | - | | | | 118,507 | |
| Private placement of units | | | 6,825,000 | | | | 702,528 | | | | | | | | | | | | | | | | | | | | | | | | 702,528 | |
| Warrants expired | | | - | | | | - | | | | - | | | | - | | | | 318,552 | | | | - | | | | - | | | | 318,552 | |
| Issuance of shares as debt settlement | | | 171,386 | | | | 44,547 | | | | - | | | | - | | | | - | | | | - | | | | - | | | | 44,547 | |
| Imputed interest | | | - | | | | - | | | | - | | | | - | | | | 2,334 | | | | - | | | | - | | | | 2,334 | |
| Stock based compensation | | | - | | | | - | | | | | | | | 170,972 | | | | - | | | | - | | | | - | | | | 170,972 | |
| Units cancelled | | | (3,418,468 | ) | | | (1,397,199 | ) | | | - | | | | - | | | | (18,930 | ) | | | - | | | | - | | | | (1,416,129 | ) |
Foreign currency
translation | | | - | | | | - | | | | - | | | | - | | | | - | | | | (160 | ) | | | - | | | | (160 | ) |
| Net loss for the year | | | - | | | | - | | | | - | | | | - | | | | - | | | | - | | | | (2,809,188 | ) | | | (2,809,188 | ) |
| Balance, August 31, 2012 | | | 96,707,667 | | | | 5,906,633 | | | | 1,422,526 | | | | 170,972 | | | | 506,200 | | | | (109,463 | ) | | | (4,946,515 | ) | | | 2,950,353 | |
| Private placement of units | | | 2,249,790 | | | | 197,214 | | | | - | | | | - | | | | - | | | | - | | | | - | | | | 197,214 | |
| Issuance of shares as debt settlement | | | 23,662,569 | | | | 946,503 | | | | - | | | | - | | | | - | | | | - | | | | - | | | | 946,503 | |
Foreign currency
translation | | | - | | | | - | | | | - | | | | - | | | | - | | | | 314,120 | | | | - | | | | 314,120 | |
| Net loss for the year | | | - | | | | - | | | | - | | | | - | | | | - | | | | - | | | | (4,266,046 | ) | | | (4,266,046 | ) |
| Balance, August 31, 2013 | | | 122,620,026 | | | | 7,050,350 | | | | 1,422,526 | | | | 170,972 | | | | 506,200 | | | | 204,657 | | | | (9,212,561 | ) | | | 142,144 | |
* Reflects the March 16, 2012 two-for-one stock split (Refer to Note 10)
The accompanying notes are an integral part of these consolidated financial statements
| Consolidated Statements of Cash Flows | | | | | | | | | |
For the years ended August 31,
(Expressed in Canadian Dollars) | | 2013 | | | 2012 | | | 2011 | |
| | | | | | | | | | |
| Cash provided by (used in ) | | | | | | | | | | | | |
| Operating activities | | | | | | | | | | | | |
| Net loss for the period | | $ | (4,266,046 | ) | | $ | (2,809,188 | ) | | $ | (430,927 | ) |
| Items not involving cash: | | | | | | | | | | | | |
| Depletion and accretion | | | 13,283 | | | | 20,509 | | | | 23,912 | |
| Unrealized loss (gain) on derivative warrant liabilities | | | 128,041 | | | | 46,655 | | | | (126,410 | ) |
| Impairment loss on property and equipment | | | 168,954 | | | | 50,774 | | | | 48,249 | |
| Impairment loss on exploration and evaluation assets | | | 2,690,568 | | | | - | | | | - | |
| Loss on settlement of debt | | | 402,264 | | | | 1,465,465 | | | | - | |
| Shares and warrants issue for services | | | - | | | | 44,285 | | | | 88,569 | |
| Impairment loss on marketable securities | | | 1 | | | | - | | | | - | |
| Compensation expense on re-pricing of units | | | - | | | | 188,625 | | | | - | |
| Stock based compensation | | | - | | | | 170,972 | | | | - | |
| Imputed interest | | | - | | | | 2,334 | | | | 5,750 | |
| Gain on disposal of marketable securities | | | - | | | | - | | | | (8,000 | ) |
| Net changes in non-cash working capital (Note 15) | | | 569,428 | | | | 436,943 | | | | 696,937 | |
| | | | (293,507 | ) | | | (382,626 | ) | | | 298,080 | |
| Investing activities | | | | | | | | | | | | |
| Additions to exploration and evaluations assets | | | (404,818 | ) | | | (1,559,763 | ) | | | (3,262,782 | ) |
| Proceeds on disposal of marketable securities | | | - | | | | - | | | | 8,000 | |
| | | | (404,818 | ) | | | (1,559,763 | ) | | | (3,254,782 | ) |
| Financing activities | | | | | | | | | | | | |
| Private placement of units, net of share issue costs | | | 405,650 | | | | 2,086,718 | | | | - | |
| Secured notes payable, net | | | 66,240 | | | | (65,796 | ) | | | (194,883 | ) |
| Shareholders’ loans, net | | | 126,763 | | | | 50,042 | | | | 2,878,736 | |
| Repayment of loan payable | | | - | | | | - | | | | (110,000 | ) |
| Warrants exercised | | | - | | | | - | | | | 594,475 | |
| | | | 598,653 | | | | 2,070,964 | | | | 3,168,328 | |
| | | | | | | | | | | | | |
| Increase (decrease) in cash for the year | | | (99,672 | ) | | | 128,575 | | | | 211,626 | |
| Effect of exchange rate changes on cash | | | (33,494 | ) | | | 36,162 | | | | (90,136 | ) |
| Cash, beginning of year | | | 330,003 | | | | 165,266 | | | | 43,776 | |
| Cash, end of year | | $ | 196,837 | | | $ | 330,003 | | | $ | 165,266 | |
Supplemental Cash Flow Information and Non-cash Transactions (Note 15)
The accompanying notes are an integral part of these consolidated financial statements
|
| Notes to the Consolidated Financial Statements |
| (Expressed In Canadian Dollars) |
| For The Years Ended August 31, 2013 and 2012 and 2011 |
| 1. | Nature of Business and Going Concern |
Eagleford Energy Inc. (“Eagleford” or the “Company”) was amalgamated under the Business Corporations Act (Ontario) on November 30, 2009. The principal activities of the Company consist of exploration, development and production of petroleum and natural gas properties. In addition, the Company holds a 0.3% net smelter return royalty on 8 mining claim blocks located in Red Lake, Ontario which is carried on the consolidated statement of financial position at nil.
The company's registered office is 1 King Street West, Suite 1505, Toronto, Ontario, M5H 1A1.
The Company’s common shares trade on the Over-the-Counter Bulletin Board (OTCBB) under the symbol EFRDF.
These consolidated financial statements have been prepared on a going concern basis which contemplates the realization of assets and the payment of liabilities in the ordinary course of business. The Company plans to obtain additional financing by way of debt or the issuance of common shares or some other means to service its current working capital requirements, any additional or unforeseen obligations or to implement any future opportunities. Should the Company be unable to continue as a going concern, it may be unable to realize the carrying value of its assets and to meet its liabilities as they become due. These consolidated financial statements do not include any adjustments for this uncertainty.
The Company has accumulated significant losses and negative cash flows from operations in recent years which raise doubt as to the validity of the going concern assumption. At August 31, 2013, the Company had a working capital deficiency of $4,985,312 (August 31, 2012 $3,819,056) and an accumulated deficit of $9,212,561 (August 31, 2012 $4,946,515). The Company does not have sufficient funds to meet its liabilities for the ensuing twelve months as they fall due. In assessing whether the going concern assumption is appropriate, management takes into account all available information about the future, which is at least, but not limited to, twelve months from the end of the reporting period. The Company's ability to continue operations and fund its liabilities is dependent on its ability to secure additional financing and cash flow. During the year ended August 31, 2013 the Company extinguished $544,239 of debt through the issuance of share capital in the Company. In addition, the Company raised net proceeds of $405,650 through the issuance of share capital. Management is pursuing such additional sources of financing and cash flow to fund its operations and while it has been successful in doing so in the past, there can be no assurance it will be able to do so in the future. Management is aware, in making its assessment, of material uncertainties related to events or conditions that may cast significant doubt upon the Company's ability to continue as a going concern. Accordingly, they do not give effect to adjustments that would be necessary should the Company be unable to continue as a going concern and therefore realize its assets and liquidate its liabilities and commitments in other than the normal course of business and at amounts different from those in the accompanying consolidated financial statements.
Statement of Compliance
These consolidated financial statements have been prepared in accordance with International Financial Reporting Standards (“IFRS”) as issued by the International Accounting Standards Board (“IASB”).
These consolidated financial statements of the Company were approved by the Board of Directors on December 19, 2013.
Basis of Preparation
These consolidated financial statements have been prepared in accordance with IFRS as issued by the International Accounting Standards Board (the “IASB”) which is incorporated in the Chartered Professional Accountants of Canada (“CPA Canada”) Handbook-Accounting.
|
| Notes to the Consolidated Financial Statements |
| (Expressed In Canadian Dollars) |
| For The Years Ended August 31, 2013 and 2012 and 2011 |
| 2. | Basis of Preparation (cont’d) |
The accounting policies applied in these consolidated financial statements are based on IFRS effective for the period ended August 31, 2013, as issued and outstanding as of the date the Board of Directors approved the consolidated financial statements.
Principles of Consolidation
Subsidiaries are all entities (including special purpose entities) controlled by the Company. Control exists when the Company has the power to govern the financial and operating policies of an entity so as to obtain benefits from its activities. In assessing control, potential voting rights that currently are exercisable are taken into account. The financial statements of subsidiaries are included in the consolidated financial statements from the date that control commences until the date that control ceases.
The consolidated financial statements include the accounts of Eagleford, the legal parent, together with its wholly-owned subsidiaries, 1354166 Alberta Ltd. an Alberta operating company (“1354166 Alberta”), Dyami Energy LLC a Texas limited liability company (“Dyami Energy”) and Eagleford Energy, Zavala Inc. a Nevada company (“Zavala Inc.”) effective August 29, 2013. All Intercompany balances and transactions have been eliminated on consolidation.
| 3. | Summary of Significant Accounting Policies |
The accounting policies set out below have been applied consistently to all years presented in these consolidated financial statements and have been applied consistently by the Company and its subsidiaries.
Cash
Cash includes bank balances.
Revenue Recognition
Revenues from the production of oil and gas properties in which the Company has an interest are recognized, on the basis of the Company’s working interest in those properties, when the significant risks and rewards of ownership of the product is transferred to the buyer, which is usually when legal title passes to an external party.
Foreign Currencies
The functional and presentation currency of the Company is the Canadian dollar. The functional currency of the Company’s wholly-owned Alberta subsidiary, 1354166 Alberta is Canadian dollars and the functional currency of the Company’s wholly-owned Texas subsidiary, Dyami Energy and the Company’s wholly-owned Nevada subsidiary, Zavala Inc. is United States dollars.
Items included in the consolidated financial statements of each entity are measured using the currency of the primary economic environment in which the entity operates (the "functional currency"). Foreign currency transactions are translated into the functional currency using the exchange rates prevailing at the dates of the transaction. Foreign exchange gains and losses resulting from the settlement of such transactions and from the translation of monetary assets and liabilities not denominated in the functional currency of an entity are recognized in the consolidated statements of operations.
Assets and liabilities of entities with functional currencies other than Canadian dollars are translated at the period end rates of exchange, and the results of their operations are translated at average rates of exchange for the period. The resulting translation adjustments are included in the foreign currency translation reserve under the equity section of the consolidated statement of financial position. Additionally, foreign exchange gains and losses related to certain intercompany loans that are permanent in nature are also included in the foreign currency translation reserve.
|
| Notes to the Consolidated Financial Statements |
| (Expressed In Canadian Dollars) |
| For The Years Ended August 31, 2013 and 2012 and 2011 |
| 3. | Summary of Significant Accounting Policies (cont’d) |
Loss per Share
The basic loss per share is calculated by dividing net loss by the weighted average number of common shares outstanding during the period. The diluted loss per share reflects the dilution that would occur if outstanding stock options and share purchase warrants were exercised or converted into common shares using the treasury stock method and are calculated by dividing net loss applicable to common shares by the sum of the weighted average number of common shares outstanding and all additional common shares that would have been outstanding if potentially dilutive common shares had been issued.
The inclusion of the Company’s stock options and share purchase warrants in the computation of diluted loss per share would have an anti-dilutive effect on loss per share and are therefore excluded from the computation.
Marketable Securities
At each financial reporting period, the Company estimates the fair value of investments which are held-for-trading, based on quoted closing bid prices at the consolidated statements of financial position date or the closing bid price on the last day the security traded if there were no trades at the consolidated statements of financial position date and such valuations are reflected in the consolidated financial statements. The resulting values for unlisted securities whether of public or private issuers, may not be reflective of the proceeds that could be realized by the Company upon their disposition. The fair value of the securities at August 31, 2013 was written down to Nil (August 31, 2012 - $1) (see Note 6).
Financial Instruments
Classification and Measurement
Financial instruments are measured at fair value on initial recognition of the instrument. Measurement in subsequent periods depends on whether the financial instrument has been classified as “fair value through profit and loss”, “loans and receivables”, “available-for-sale”, “held-to-maturity”, or “other financial liability” as defined by IAS 39, “Financial Instruments: Recognition and Measurement”.
Financial assets and financial liabilities at “fair value through profit or loss” are either classified as “held for trading” or “designated at fair value through profit or loss” and are measured at fair value with changes in fair value recognized in the statement of comprehensive income. Transaction costs are expensed when incurred. The Company has classified cash, marketable securities and derivative warrant liabilities as “fair value through profit and loss”.
Financial instruments classified as “loans and receivables”, “held-to-maturity”, or “financial liabilities” are measured at amortized cost using the effective interest method of amortization. “Loans and receivables” are non-derivative financial assets with fixed or determinable payments that are not quoted in an active market. “Held-to-maturity” financial assets are non-derivative investments that an entity has the positive intention and ability to hold to maturity.
“Other financial liabilities measured at amortized cost” are those financial liabilities that are not designated as “fair value through profit or loss” and that are not derivatives. The Company has classified trade and other receivables as “loans and receivables” and trade and other payables, secured notes payable, loans payable, provisions and shareholders’ loans as “other financial liabilities”.
Financial assets classified as “available-for-sale” are measured at fair value, with changes in fair value recognized in other comprehensive income. Available-for-sale financial assets are non-derivatives that are either designated in this category or not classified in any of the other categories. The Company currently has no assets classified as “available for sale”.
|
| Notes to the Consolidated Financial Statements |
| (Expressed In Canadian Dollars) |
| For The Years Ended August 31, 2013 and 2012 and 2011 |
| 3. | Summary of Significant Accounting Policies (cont’d) |
Derivative Financial Instruments
The Company’s derivative instruments consist of derivative liabilities in relation to its share purchase warrants. In prior years the Company had issued share purchase warrants in conjunction with offerings for the purchase of common shares of the Company. These share purchase warrants were issued with an exercise price in US dollars, rather than Canadian dollars (the presentation and functional currency of the Company). Such share purchase warrants are considered to be derivative instruments and the Company is required to re-measure the fair value of these at each reporting date. The fair value of these share purchase warrants are re-measured at each statement of financial position date using the Black Scholes model. Adjustments to the fair value of the share purchase warrants at the financial position date are recorded to the statement of operations.
Property and Equipment and Exploration and Evaluation Assets
Exploration and Evaluation Assets (“E&E”)
Pre-acquisition expenditures on oil and gas assets are recognized as an expense in the consolidated statements of operations when incurred. In accordance with IFRS 6, exploration and evaluation costs are capitalized within intangible assets until the success or otherwise of the well or project has been established and subject to an impairment review. The costs of unsuccessful wells in an area are written off to statement of operations.
Exploration and evaluation costs, including the costs of acquiring licenses and directly attributable general and administrative costs, initially are capitalized either as tangible or intangible E&E assets according to the nature of the assets acquired. The costs are accumulated in cost centers by well, field or exploration area pending determination of technical feasibility and commercial viability.
When E&E assets are determined to be technically feasible and commercially viable, the accumulated costs are transferred to property and equipment. When E&E assets are determined not to be technically feasible and commercially viable or the Company decides not to continue with its activity, the unrecoverable costs are charged to statement of operations as exploration and evaluation expense.
E&E assets are assessed for impairment in any circumstances where sufficient data exists to determine technical feasibility and commercial viability, and facts and circumstances suggest that the carrying amount exceeds the recoverable amount. For purposes of impairment testing, E&E assets are allocated to cash-generating units (“CGUs”).
Development and Production Costs
Items of property and equipment, which include petroleum and natural gas development and production assets, are measured at cost less accumulated depletion and depreciation and accumulated impairment losses. Development and production assets are grouped into CGUs for impairment testing.
When significant parts of an item of property and equipment, including petroleum and natural gas interests, have different useful lives, they are accounted for as separate items (major components).
Gains and losses on disposal of an item of property and equipment, including petroleum and natural gas interests, are determined by comparing the proceeds from disposal with the carrying amount of property and equipment and are recognized in profit or loss.
|
| Notes to the Consolidated Financial Statements |
| (Expressed In Canadian Dollars) |
| For The Years Ended August 31, 2013 and 2012 and 2011 |
| 3. | Summary of Significant Accounting Policies (cont’d) |
Subsequent Costs
Costs incurred subsequent to the determination of technical feasibility and commercial viability and the costs of replacing parts of property and equipment are recognized as exploration and evaluation assets only when they increase the future economic benefits embodied in the specific asset to which they relate. All other expenditures are recognized in profit or loss as incurred. Such capitalized exploration and evaluation assets generally represent costs incurred in developing proved and/or probable reserves and bringing in or enhancing production from such reserves, and are accumulated on a field or geotechnical area basis. The carrying amount of any replaced or sold component is derecognized. The costs of the day-to-day servicing of property and equipment are recognized in profit or loss as incurred.
Depletion and Depreciation
The net carrying value of development or production assets is depleted using the units-of-production method by reference to the ratio of production in the period to the related proved plus probable reserves, taking into account estimated future development costs necessary to bring those reserves into production. Future development costs are estimated taking into account the level of development required to produce the reserves. These estimates are reviewed by independent reserve engineers at least annually for developed properties.
Proved and probable reserves are estimated using independent reserve engineer reports for developed properties only and represent the estimated quantities of crude oil, natural gas and natural gas liquids which geological, geophysical and engineering data demonstrate with a specified degree of certainty to be recoverable in future years from known reservoirs and which are considered commercially producible.
Reserves may be considered commercially producible if management has the intention of developing and producing them and such intention is based upon:
| • | a reasonable assessment of the future economic benefit of such production; |
| • | a reasonable expectation that there is a market for all or substantially all the expected oil and natural gas production; and |
| • | evidence that the necessary production, transmission and transportation facilities are available or can be made available. |
Reserves may only be considered proved and probable if they are supported by either actual production or conclusive formation tests. The area of reservoir considered proved includes: (a) that portion delineated by drilling and defined by gas-oil and/or oil-water contacts, if any, or both; and (b) the immediately adjoining portions not yet drilled, but which can be reasonably judged as economically productive on the basis of available geophysical, geological and engineering data. In the absence of information on fluid contacts, the lowest known structural occurrence of oil and natural gas controls the lower proved limit of the reservoir.
Depreciation methods, useful lives and residual values are reviewed at each reporting date.
Impairment
Financial Assets
A financial asset is assessed at each reporting date to determine whether there is any objective evidence that it is impaired. A financial asset is considered to be impaired if objective evidence indicates that one or more events have had a negative effect on the estimated future cash flows of that asset.
An impairment loss in respect of a financial asset measured at amortized cost is calculated as the difference between its carrying amount and the present value of the estimated future cash flows discounted at the original effective interest rate.
Individually significant financial assets are tested for impairment on an individual basis. Remaining financial assets are assessed collectively in groups that share similar credit risk characteristics.
All impairment losses are recognized in the profit or loss.
|
| Notes to the Consolidated Financial Statements |
| (Expressed In Canadian Dollars) |
| For The Years Ended August 31, 2013 and 2012 and 2011 |
| 3. | Summary of Significant Accounting Policies (cont’d) |
An impairment loss is reversed if the reversal can be related objectively to an event occurring after the impairment loss was recognized. For financial assets measured at amortized cost the reversal is recognized in profit or loss.
Non-financial Assets
The carrying amounts of the Company’s non-financial assets, other than E&E assets are reviewed at each reporting date to determine whether there is any indication of impairment. If any such indication exists, the asset’s recoverable amount is estimated. E&E assets are assessed for impairment when they are reclassified to property and equipment as petroleum and natural gas interests, and also if facts and circumstances suggest that their carrying amount exceeds the recoverable amount.
For the purpose of impairment testing, assets are grouped together into the smallest group of assets that generate cash inflows from continuing use that are largely independent of the cash inflows of other assets or groups of assets (the “cash-generating unit” or “CGU”). The recoverable amount of an asset or a CGU is the greater of its value in use and its fair value less costs to sell.
In assessing value in use, the estimated future cash flows are discounted to their present value using a pre-tax discount rate that reflects current market assessments of the time value of money and the risks specific to the asset. Value in use is generally computed by reference to the present value of the future cash flows expected to be derived from production of proved and probable reserves.
E&E assets are allocated to related CGUs when they are assessed for impairment, both at the time of any triggering facts and circumstances as well as upon their eventual reclassification to producing assets (petroleum and natural gas interests in property and equipment).
An impairment loss is recognized if the carrying amount of an asset or its CGU exceeds its estimated recoverable amount. Impairment losses are recognized in profit or loss. Impairment losses recognized in respect of CGUs are allocated first to reduce the carrying amount of any goodwill allocated to the units and then to reduce the carrying amounts of the other assets in the unit (group of units) on a pro rata basis.
In respect of assets other than goodwill, impairment losses recognized in prior years are assessed at each reporting date for any indications that the loss has decreased or no longer exists. An impairment loss is reversed if there has been a change in the estimates used to determine the recoverable amount. An impairment loss is reversed only to the extent that the asset’s carrying amount does not exceed the carrying amount that would have been determined, net of depletion and depreciation or amortization, if no impairment loss had been recognized.
Provisions
A provision is recognized if, as a result of a past event, the Company has a present legal or constructive obligation that can be estimated reliably, and it is probable that an outflow of economic benefits will be required to settle the obligation.
Provisions are determined by discounting the expected future cash flows at a pre-tax rate that reflects current market assessments of the time value of money and the risks specific to the liability. Provisions are not recognized for future operating losses.
|
| Notes to the Consolidated Financial Statements |
| (Expressed In Canadian Dollars) |
| For The Years Ended August 31, 2013 and 2012 and 2011 |
| 3. | Summary of Significant Accounting Policies (cont’d) |
Decommissioning Obligations
The Company’s activities give rise to dismantling, decommissioning and site disturbance remediation activities. Provision is made for the estimated cost of site restoration and capitalized in the relevant asset category.
Decommissioning obligations are measured at the present value of management’s best estimate of the expenditure required to settle the present obligation at the period-end date. Subsequent to initial measurement, the obligation is adjusted at the end of each period to reflect the passage of time and changes in the estimated future cash flows underlying the obligation. The increase in the provision due to the passage of time is recognized as finance costs whereas increases/decreases due to changes in the estimated future cash flows and changes to discount rate are capitalized. Actual costs incurred upon settlement of the decommissioning obligations are charged against the provision to the extent the provision was established.
Borrowing Costs
Borrowing costs incurred for the construction of qualifying assets are capitalized during the period of time that is required to complete and prepare the assets for their intended use or sale. All other borrowing costs are recognized in profit or loss using the effective interest method. Interest income is recognized as it accrues in profit or loss, using the effective interest method.
Taxes
Tax expense comprises current and deferred tax. Tax is recognized in the consolidated statements of operations except to the extent it relates to items recognized in other comprehensive income or directly in equity.
Current Income tax
Current tax expense is based on the results for the year as adjusted for items that are not taxable or not deductible. Current tax is calculated using tax rates and laws that were enacted or substantively enacted at the end of the reporting period. Management periodically evaluates positions taken in tax returns with respect to situations in which applicable tax regulation is subject to interpretation. Provisions are established where appropriate on the basis of amounts expected to be paid to the tax authorities.
Deferred tax
Deferred tax assets and liabilities are recognized for the future income tax consequences attributable to differences between the financial statement carrying amounts of existing assets and liabilities and their respective tax bases. Deferred tax assets and liabilities are measured using enacted or substantively enacted tax rates expected to apply to taxable income in the years in which these temporary differences are expected to be recovered or settled. Deferred tax assets and liabilities are offset if there is a legally enforceable right to offset current tax liabilities and asset and they relate to the income taxes levied by the same authority on the same taxable entity, or on different tax entities where these entities intend to settle current tax liabilities and asset on a net basis or their tax assets and liabilities will be realized simultaneously.
Deferred tax assets and liabilities are not recognized in respect of temporary differences that arise on initial recognition of assets and liabilities acquired other than in a business combination.
|
| Notes to the Consolidated Financial Statements |
| (Expressed In Canadian Dollars) |
| For The Years Ended August 31, 2013 and 2012 and 2011 |
| 3. | Summary of Significant Accounting Policies (cont’d) |
Share-Based Compensation
The Company has a share-based compensation plan that grants stock options to employees and non-employees. This plan is an equity settled plan. The company uses the fair value method for accounting for stock-based awards to employees and non-employees.
The fair value determined at the grant date of the equity-settled share-based payments is expensed on a straight-line basis over the vesting period, based on the Company’s estimate of equity instruments that will eventually vest. At the end of each reporting period, the Company revises its estimate of the number of equity instruments expected to vest. The impact of the revision of the original estimates, if any, is recognized in profit or loss such that the cumulative expense reflects the revised estimate, with a corresponding adjustment to contributed surplus.
Equity-settled share-based payment transactions with parties other than employees are measured at the fair value of the goods or services received, except where that fair value cannot be estimated reliably, in which case they are measured at the fair value of the equity instruments granted, measured at the date the Company obtains the goods or the counterparty renders the service.
Warrants
When the Company issues units comprising common shares and warrants, the Company follows the relative fair value method of accounting for warrants attached to and issued with common shares of the Company. Under this method, the fair value of warrants issued is estimated using a Black-Scholes option price model. The fair value is then related to the total of the net proceeds received on issuance of the common shares and the fair value of the warrants issued therewith. The resultant relative fair value is allocated to warrants from the net proceeds and the balance of the net proceeds is allocated to the common shares issued.
Critical Accounting Estimates and Judgments
The timely preparation of the consolidated financial statements in accordance with IFRS requires that management make estimates and assumptions and use judgment regarding the measured amounts of assets, liabilities and contingent liabilities at the date of the consolidated financial statements and reported amounts of revenue and expenses during the reporting period. Such estimates and judgments are continuously evaluated and are based on management’s experience and other factors, including expectations of future events that are believed to be reasonable under the circumstances. Actual outcomes may differ from these estimates.
The key sources of estimation uncertainty that have a significant risk of causing material adjustment to the amounts recognized in the consolidated financial statements are:
Valuation and classification of exploration and evaluation assets
The value of exploration and evaluation assets are dependent upon the discovery of economically recoverable reserves which in turn is dependent on future oil and natural gas prices, future capital expenditures and environmental and regulatory restrictions. The decision to transfer exploration and evaluation assets to property and equipment is based upon management’s determination of an area’s technical feasibility and commercial viability based on proved and/or probable reserve estimates.
Stock Based Compensation
The Company measures the cost of equity-settled transactions to the relative fair value of the equity instruments at the date at which they are issued. Estimating relative fair value for share-based payment transactions requires determining the most appropriate valuation model, which is dependent on the terms and conditions of the instrument. This estimate also requires determining and making assumptions about the most appropriate inputs to the valuation model including the expected life, volatility, discount rates and dividend yield.
|
| Notes to the Consolidated Financial Statements |
| (Expressed In Canadian Dollars) |
| For The Years Ended August 31, 2013 and 2012 and 2011 |
| 3. | Summary of Significant Accounting Policies (cont’d) |
Decommissioning Liabilities
Decommissioning liabilities consist of asset retirement obligations that are based, in part, on estimates of future costs to settle the obligation, in addition to estimates of the useful life of the underlying assets, the rate of inflation and the risk-free discount rate.
Fair Value of Financial Instruments
The estimated fair value of financial assets and liabilities, by their very nature, are subject to measurement uncertainty.
Assessment of Commercial Reserves
Management is required to assess the level of the Company’s commercial reserves together with the future expenditures to access those reserves, which are utilized in determining the depletion charge for the period, assessing whether any impairment charge is required against producing and developed, and the determination of the deferred tax liability. By their nature, these estimates of discovered proved and probable crude oil and natural gas reserves, including the estimates of future prices, costs, related future cash flows and the selection of a pre-tax risked discount rate relevant to the asset in question are subject to measurement uncertainty.
The Company employs an independent reserves evaluator who periodically assesses the Company’s level of commercial reserves by reference to data sets including geological, geophysical and engineering data together with reports, presentation and financial information pertaining to the contractual and fiscal terms applicable to the Company’s assets. Significant judgment is involved when determining whether there have been any significant changes in the Company’s reserves.
Income taxes
Income taxes liability is estimated for the Company, including an assessment of temporary differences. Any temporary differences will generally result in the recognition of deferred tax assets and liabilities in the financial statements. Management’s judgment is required in the calculation of current and deferred taxes, as well as the likelihood of realization.
Provisions
Considerable judgment is used in measuring and recognizing provisions and the exposure to contingent liabilities. Judgment is necessary to determine the likelihood that a pending litigation or other claim will succeed, or a liability will arise and to quantify the possible range of the final settlement.
Significant changes in the assumptions, including those with respect to future business plan and cash flows, could materially change the recorded carrying amounts.
| 4. | Recent Accounting Pronouncements |
The following are new IFRS pronouncements that have been issued, although not yet effective and have not been early adopted, and may have an impact on the Company in the future as discussed below.
IFRS 7, “Financial Instruments”: Disclosures”, which requires disclosure of both gross and net information about financial instruments eligible for offset in the statement of financial position and financial instruments subject to master netting agreements. Concurrent with the amendments to IFRS 7, the IASB also amended IAS 32, “Financial Instruments: Presentation” to clarify the exiting requirements for offsetting financial instruments in the statement of financial position. The amendments to IAS 32 are effective as of January 1, 2014. The Company does not expect to have a significant impact on its consolidated financial statements.
|
| Notes to the Consolidated Financial Statements |
| (Expressed In Canadian Dollars) |
| For The Years Ended August 31, 2013 and 2012 and 2011 |
| 4. | Recent Accounting Pronouncements (cont’d) |
IFRS 10, “Consolidated Financial Statements” replaces the consolidation requirements of SIC-12 Consolidation Special Purpose Entities and IAS 27 “Consolidated Separate Financial Statements”. It introduces a new principle-based definition of control, applicable to all investees to determine the scope of consolidation. The standard provides the framework for consolidated financial statements and their preparation based on the principle of control. This new standard is effective for the Company’s Interim and Consolidated financial statements commencing September 1, 2013. The Company does not expect to have a significant impact on its consolidated financial statements.
IFRS 11 “Joint Arrangements” which replaces IAS 31, “Interests in Joint Ventures”. IFRS 11 divides joint arrangements into two types, each having its own accounting model. A “joint operation” continues to be accounted for using proportionate consolidation, whereas a “joint venture” must be accounted for using equity accounting. This differs from IAS 31, where there was the choice to use proportionate consolidation or equity accounting for joint ventures. A “joint operation” is defined as the joint operators having rights to the assets, and obligations for the liabilities, relating to the arrangement. In a “joint venture”, the joint ventures partners have rights to the net assets of the arrangement, typically through their investment in a separate joint venture entity. This new standard is effective for the Company’s Interim and Consolidated financial statements commencing September 1, 2013. The Company does not expect to have a significant impact on its consolidated financial statements.
IFRS 12 “Disclosure of Interests in Other Entities” is a new standard, which combines all of the disclosure requirements for subsidiaries, associates and joint arrangements, as well as unconsolidated structured entities. This new standard is effective for the Company’s Interim and Consolidated financial statements commencing September 1, 2013. The Company does not expect to have a significant impact on its consolidated financial statements.
IFRS 13 “Fair Value Measurement” replaces the fair value guidance contained in individual IFRS with a single source of fair value measurement guidance. The standard also requires disclosures which enable users to assess the methods and inputs used to develop fair value measurements. This new standard is effective for the Company’s Interim and Consolidated financial statements commencing September 1, 2013. The Company does not expect to have a significant impact on its consolidated financial statements.
IAS 1 “Presentation of Financial Statements” was amended by the IASB in order to align the presentation of items in comprehensive income with US GAAP. Items in other comprehensive income will be required to be presented in two categories: items that will be reclassified into profit or loss and those that will not be reclassified. The flexibility to present a statement of comprehensive income remains unchanged. The amendments to IAS 1 are effective for annual periods beginning on or after July 1, 2012. This new standard is effective for the Company’s Interim and Consolidated financial statements commencing September 1, 2013. The Company does not expect to have a significant impact on its consolidated financial statements.
IAS 27 “Separate Financial Statements”. In May 2011, the IASB amended IAS 27, Separate Financial Statements (“IAS 27”). This amendment removes the requirements for consolidated statements from IAS 27, and moves it over to IFRS 10 “Consolidated Financial Statements”. The amendment mandates that when a company prepares separate financial statements, investment in subsidiaries, associates, and jointly controlled entities are to be accounted for using either the cost method or in accordance with IFRS 9 “Financial Instruments”. In addition, this amendment determines the treatment for recognizing dividends, the treatment of certain group reorganizations, and some disclosure requirements. This amendment is effective for the Company’s interim and annual consolidated financial statements commencing September 1, 2013. The Company is assessing the impact of this amended standard on its consolidated financial statements.
|
| Notes to the Consolidated Financial Statements |
| (Expressed In Canadian Dollars) |
| For The Years Ended August 31, 2013 and 2012 and 2011 |
| 4. | Recent Accounting Pronouncements (cont’d) |
IAS 28 “Investments in Associates and Joint Ventures”. In May 2011, the IASB amended IAS 28, investments in Associates and Joint Ventures (“IAS 28”). This amendment requires any retained portion of an investment in an associate or joint venture that has not been classified as held for sale to be measured using the equity method until disposal. After disposal, if the retained interest continues to be an associate or joint venture, the amendment requires for it to be continued to be accounted for under the equity method. The amendment also disallows the re measurement of any retained interest in an investment upon the cessation of significant influence or joint control. This amended standard is effective for the Company’s interim and annual consolidated financial statements commencing September 1, 2013. The Company is assessing the impact of this amended standard on its consolidated financial statements.
IAS 32 “Financial Instruments: Presentation”. In December 2011, the IASB issued an amendment to clarify the meaning of the offsetting criterion and the principle behind net settlement, including identifying when some gross settlement systems may be considered equivalent to net settlement. This amendment is effective for the Company’s interim and annual consolidated financial statements commencing September 1, 2014. Earlier application is permitted when applied with corresponding amendment to IFRS 7.
IAS 36 “Impairment of Assets”. In May 2013, the IASB issued an amendment to address the disclosure of information about the recoverable amount of the impaired assets if that amount is based on fair value less costs of disposal. This amendment is effective for the Company’s interim and annual consolidated financial statements commencing September 1, 2014. The Company is assessing the impact of this amended standard on its consolidated financial statements.
IAS 39 “Financial Instruments: Recognition and Measurement”. In June 2013, the IASB issued a narrow scope amendment to IAS 39. Under the amendment, there would be no need to discontinue hedge accounting if a hedging derivative was novated, provided that certain criteria are met. This amendment is effective for the Company’s interim and annual consolidated financial statements commencing September 1, 2014. The Company is assessing the impact of this amended standard on its consolidated financial statements.
IFRAC 21 “levies”. Issued in May 2013, this interpretation provides guidance on when to recognize a liability for a levy imposed by a government, both for levies that are accounted for in accordance with IAS 37Provisions, Contingent Liabilities and Contingent Assetsand those where the timing and amount of the levy is certain. This is effective for the Company’s interim and annual consolidated financial statements commencing September 1, 2014. The Company is assessing the impact of this amended standard on its consolidated financial statements.
IFRS 9 “Financial Instruments”. In October 2010, the IASB issued IFRS 9, Financial Instruments (“IFRS 9”). IFRS 9, which replaces IAS 39, Financial Instruments: Recognition and Measurement, establishes principles for the financial reporting of financial assets and financial liabilities that will present relevant and useful information to users of financial statements for their assessment of the amounts, timing and uncertainty of an entity’s future cash flows. This new standard is effective for the Company’s interim and annual consolidated financial statements commencing September 1, 2015. The Company is assessing the impact of this new standard on its consolidated financial statements.
The Company’s reportable and geographical segments are Canada and the United States. The accounting policies used for the reportable segments are the same as the Company’s accounting policies.
For the purposes of monitoring segment performance and allocating resources between segments, the Company’s executive officer monitors the tangible, intangible and financial assets attributable to each segment.
|
| Notes to the Consolidated Financial Statements |
| (Expressed In Canadian Dollars) |
| For The Years Ended August 31, 2013 and 2012 and 2011 |
| 5. | Segmented Information (cont’d) |
All assets are allocated to reportable segments. The following tables show information regarding the Company’s reportable segments.
| For the year ended August 31, 2013 | | Canada | | | United States | | | Total | |
| Net revenue | | $ | 30,062 | | | | - | | | $ | 30,062 | |
| Net loss | | $ | (4,123,966 | ) | | | (142,080 | ) | | $ | (4,266,046 | ) |
| For the year ended August 31, 2012 | | | | | | | | Total | |
| Net revenue | | $ | 39,218 | | | | - | | | $ | 39,218 | |
| Net loss | | $ | (2,588,298 | ) | | | (220,890 | ) | | $ | (2,809,188 | ) |
| For the year ended August 31, 2011 | | | | | | | | Total | |
| Net revenue | | $ | 56,916 | | | | - | | | $ | 56,916 | |
| Net loss | | $ | (371,361 | ) | | | (59,566 | ) | | $ | (430,927 | ) |
| As at August 31, 2013 | | | | | | | | Total | |
| Total Assets | | $ | 3,914,928 | | | | 3,003,268 | | | $ | 6,918,196 | |
| Total Liabilities | | $ | 6,029,577 | | | | 746,475 | | | $ | 6,776,052 | |
| As at August 31, 2012 | | | | | | | | Total | |
| Total Assets | | $ | 3,983,791 | | | | 5,014,225 | | | $ | 8,998,016 | |
| Total Liabilities | | $ | 5,478,773 | | | | 568,890 | | | $ | 6,047,663 | |
| | | August 31, 2013 | |
| Investments in quoted company security (see Note 3) (August 31, 2012 - $1) | | $ | - | |
| 7. | Exploration and Evaluation Assets |
| Cost | | | | |
| Balance August 31, 2011 | | $ | 8,995,878 | |
| Additions | | | 1,559,763 | |
| Units cancelled | | | (2,091,616 | ) |
| Decommissioning obligations | | | 41,243 | |
| Change in decommissioning obligation estimates | | | 6,546 | |
| Foreign exchange | | | (36,327 | ) |
| Balance August 31, 2012 | | | 8,475,487 | |
| Additions | | | 404,818 | |
| Change in decommissioning obligation estimates | | | (9,268 | ) |
| Impairment | | | (2,690,568 | ) |
| Foreign exchange | | | 354,809 | |
| Balance August 31, 2013 | | $ | 6,535,278 | |
The Company’s exploration and evaluation assets are located in Texas, USA. As at and for the year ended August 31, 2013 the Company record an impairment of $2,690,568 on its Murphy Lease, Zavala County, Texas based on the amount for which management believes the assets could be sold or farmed out in an arms’ length transaction, less estimated costs to sell. Included in the above additions for the year ended August 31, 2013, the Company capitalized borrowing costs interest of $240,092 to exploration and evaluation assets (August 31, 2012: $289,650).
|
| Notes to the Consolidated Financial Statements |
| (Expressed In Canadian Dollars) |
| For The Years Ended August 31, 2013 and 2012 and 2011 |
| 7. | Exploration and Evaluation Assets (cont’d) |
Matthews Lease, Zavala County, Texas, USA
During the year ended August 31, 2012 the lessors of the Matthews lease, a property comprising approximately 2,629 gross acres of land in Zavala County, Texas (the “Matthews Property”), expressed their belief that the lease had terminated and filed a petition in the District Court, Zavala County, Texas, seeking a declaration that the lease had terminated. The Company disagreed and defended the action and countersued the lessors for repudiation of the lease seeking damages. During the year ended August 31, 2013, the Company entered into an agreement with the lessors of the Matthews Property, OGR Energy Corporation (“OGR Energy”) and Texas Onshore Energy, Inc. (“Texas Onshore”) together holding a 15% working interest in the Matthews Property with back in rights to earn an additional 15% working interest after production achieved $15.0 million of revenue. A new lease was signed with the Company’s subsidiary, Zavala Inc. effective September 1, 2013 (the “New Matthews Lease”).
The New Matthews Lease has a primary term expiring January 31, 2014 (the “Primary Term”) (subject to certain extensions) and can be maintained through the provision of certain royalty payments and the implementation of a continuous drilling program as follows.
| A) | On August 28, 2013, the Company has agreed to a minimum annual royalty of $323.30 per acre retained on the Matthews Property to the Lessors payable as follows: |
(1) US$150,000 upon execution of the Lease (paid); and
(2) US$150,000 by the earliest of the following to occur:
| (a) | on or before 95 days from the Effective Date of the Lease (paid); or |
| (b) | immediately prior to commencing a new operation under the terms of the Lease. |
B) US$60,000 to Lessors upon commencement of the first new operation.
| C) | The Company has two (2) separate options to extend the Primary Term of the Matthews Lease. If the Company elects to extend the Primary Term of the Matthews Lease through February 28, 2014 (the “First Extension”) the Company shall provide written notice and tender an additional pre-payment of royalties to Lessors in the amount of US$30,000 on or before January 26, 2013. If, after the First Extension has been exercised by the Company, and the Company elects to extend the Primary Term of the Matthews Lease through March 31, 2014 (the “Second Extension”), the Company shall provide written notice and tender an additional pre-payment of royalties to Lessors in the amount of US$30,000 on or before February 23, 2014. |
| D) | Prior to the expiration of the Primary Term, the Company shall perform a new operation satisfied by either drilling a new well to a targeted depth deemed capable of production or the hydraulic fracturing of the existing Matthews #1H well (the “New Operation”). |
| E) | Beginning in the second lease year and continuing thereafter for each succeeding lease year drill at least 2 wells per year before the expiration of each lease year. |
Upon the Company satisfying the New Operation, OGR Corporation and Texas Onshore will assign their working interests to Zavala Inc. and Zavala Inc’s interest will increase to a 100% working interest in the Matthews Property from a 75% working interest before payout and a 61.50% working interest after payout of production revenue of $12.5 million and a 10% working interest before payout and a 7.5% working interest after payout of production revenue of $15 million held by Eagleford with the balance held by OGR Energy and Texas Onshore. The royalties payable under the Matthews Lease are 25% (See Note 19).
|
| Notes to the Consolidated Financial Statements |
| (Expressed In Canadian Dollars) |
| For The Years Ended August 31, 2013 and 2012 and 2011 |
| 7. | Exploration and Evaluation Assets (cont’d) |
Murphy Lease, Zavala County, Texas, USA
Dyami Energy holds a 100% working interest in a mineral lease comprising approximately 2,637 acres of land in Zavala County, Texas (the “Murphy Lease”) subject to a 10% carried interest on the drilling costs from surface to base of the Austin Chalk formation, and a 3% carried interest on the drilling costs from the top of the Eagle Ford shale formation to basement on the first well drilled into a serpentine plug and for the first well drilled into a second serpentine plug, if discovered. Thereafter Dyami Energy’s working interests range from 90% to 97%. The royalties payable under the Murphy Lease are 25%.
Dyami Energy is required to drill a well every six months in order to maintain the Murphy Lease. Three years after the cessation of continuous drilling, all rights below the deepest producing horizon in each unit then being held by production, shall be released and re-assigned to the lessor, unless the drilling of another well has been proposed on said unit, approved in writing by lessor, and timely commenced. Dyami Energy has received an extension of the Murphy Lease until January 31, 2014 to perform its obligations thereunder.
| | | Petroleum and Natural
Gas Properties | |
| Cost or deemed cost | | | | |
| Balance August 31, 2011 | | $ | 314,302 | |
| Change in decommissioning obligation estimates | | | 819 | |
| Balance August 31, 2012 | | | 315,121 | |
| Change in decommissioning obligation estimates | | | 4,166 | |
| Balance August 31, 2013 | | $ | 319,287 | |
| | | | | |
| Accumulated depletion and impairment | | | | |
| Balance August 31, 2011 | | $ | (71,302 | ) |
| Depletion | | | (18,045 | ) |
| Impairment | | | (50,774 | ) |
| Balance August 31, 2012 | | | (140,121 | ) |
| Depletion | | | (10,212 | ) |
| Impairment | | | (168,954 | ) |
| Balance August 31, 2013 | | | (319,287 | ) |
| | | | | |
| Carrying Value | | | | |
| At August 31, 2011 | | $ | 243,000 | |
| At August 31, 2012 | | $ | 175,000 | |
| At August 31, 2013 | | $ | - | |
As at and for the years ended August 31, 2013 and 2012, no general and administrative costs were capitalized. For the year ended August 31, 2013, the Company recorded an impairment loss of $168,954 (August 31, 2012 impairment $50,774) on its Botha, Alberta, Canada property as a result of no reserves or future net revenue being assigned. The remaining wells on the Botha property watered out, are shut in and the operator of the property does not intend on reactivating or remediating the wells. The evaluation by an independent reserves evaluator dated August 31, 2012 was based on future pre-tax cash flows of the proved and probable reserves using forecast prices and discounted by 10%.
Alberta, Canada
The Company has a 0.5% non-convertible gross overriding royalty in a natural gas well located in the Haynes area of Alberta and a 5.1975% interest in a natural gas unit located in the Botha area of Alberta, Canada.
|
| Notes to the Consolidated Financial Statements |
| (Expressed In Canadian Dollars) |
| For The Years Ended August 31, 2013 and 2012 and 2011 |
| | | Decommissioning
Provisions (Note a) | | | Other Provisions
(Note b) | | | Total Provisions | |
| Balance, August 31, 2011 | | $ | 64,688 | | | $ | 61,144 | | | $ | 125,832 | |
| Accretion expense | | | 2,464 | | | | - | | | | 2,464 | |
| Additions | | | 41,243 | | | | 64,866 | | | | 106,109 | |
| Change in estimate | | | 7,365 | | | | - | | | | 7,365 | |
| Foreign exchange | | | (1,005 | ) | | | (93 | ) | | | (1,098 | ) |
| Balance, August 31, 2012 | | | 114,755 | | | | 125,917 | | | | 240,672 | |
| Accretion expense | | | 3,071 | | | | - | | | | 3,071 | |
| Change in estimate | | | (5,104 | ) | | | - | | | | (5,104 | ) |
| Additions | | | - | | | | 169,196 | | | | 169,196 | |
| Reductions | | | - | | | | (125,917 | ) | | | (125,917 | ) |
| Foreign exchange | | | 7,020 | | | | 9,357 | | | | 16,377 | |
| Balance, August 31, 2013 | | $ | 119,742 | | | $ | 178,553 | | | $ | 298,295 | |
| a) | Decommissioning Obligations |
The Company’s decommissioning obligations result from its ownership interests in petroleum and natural gas assets including well sites, gathering systems and processing facilities. The total decommissioning obligation is estimated based on the Company’s net ownership interest in all wells and facilities, estimated costs to reclaim and abandon these wells and facilities, and the estimated timing of the costs to be incurred in future years. The Company has estimated the net present value of decommissioning obligations to be $119,742 at August 31, 2013 (August 31, 2012 $114,755) based on an undiscounted total future liability of $166,578 (August 31, 2012 $158,974). These payments are expected to be incurred between fiscal 2014 and 2031. The discount factor, being the risk free rate related to the liability is 3.09% (August 31, 2012 2.37%).
The above amounts have been classified as long term.
In February 2013, a vendor of Dyami Energy applied a lien on the Murphy #4 well and filed a claim in the District Court of Zavala County, Texas (Case No. 13-02-12941-ZCV) seeking payment of US$169,196 for services. Dyami Energy is disputing the amount on the basis of negligence by the vendor and the Company filed a counter claim. The full amount of the provision has been recorded and any legal costs will be expensed as incurred. The outcome of this claim is uncertain at this time.
The above amount has been classified as short term, however not discounted as the impact to the consolidated financial statements is considered immaterial.
In May 2012 a vendor of Dyami Energy filed a claim in the District Court of Harris County, Texas seeking payment of US$64,866. Dyami Energy was disputing the amount charged due to faulty equipment. The full amount of the provision which was accrued in the prior year 2012 has been reversed in 2013 as the vendor is no longer in good standing as a Texas corporation and the vendor’s attorney filed in the District Court of Harris County, Texas a motion to withdraw as counsel.
In December 2011, a vendor of Dyami Energy filed a claim in the District Court of Harris County, Texas (Case No. 2011-74035/Court: 113) seeking payment of US$62,800. Dyami Energy disputed the claim on the basis of excessive charges. In December 2013 an agreed final judgement in favour of the vendor was entered into court in the amount of $42,803 and post judgement interest at 5% per annum until paid in full.
|
| Notes to the Consolidated Financial Statements |
| (Expressed In Canadian Dollars) |
| For The Years Ended August 31, 2013 and 2012 and 2011 |
| 10. | Share Capital and reserves |
On March 16, 2012, the Company completed a 2-for-1 stock split, pursuant to which one (1) newly-issued share of the Company’s common stock was issued to each holder of a share of common stock as of the close of business. The forward stock split has been applied retrospectively for all periods presented.
Authorized:
Unlimited number of common shares at no par value
Unlimited non-participating, non-dividend paying, voting redeemable preference shares
Issued:
The following table sets out the changes in common shares during the respective periods:
| Common Shares | | Number* | | | Amount | |
| Balance August 31, 2011 | | | 67,122,743 | | | $ | 4,635,556 | |
| Debt settlement (note a) | | | 3,107,006 | | | | 395,589 | |
| Debt settlement (note b) | | | 6,000,000 | | | | 522,856 | |
| Debt settlement (note c) | | | 11,150,000 | | | | 627,511 | |
| Private placement (note d) | | | 2,000,000 | | | | 32,459 | |
| Private placement (note e) | | | 3,750,000 | | | | 342,786 | |
| Private placement (note f) | | | 6,825,000 | | | | 702,528 | |
| Debt settlement (note g) | | | 171,386 | | | | 44,547 | |
| Cancelled (note h) | | | (3,418,468 | ) | | | (1,397,199 | ) |
| Balance August 31, 2012 | | | 96,707,667 | | | | 5,906,633 | |
| Private Placement of units( note i) | | | 2,249,790 | | | | 197,214 | |
| Debt settlement (note j) | | | 23,662,569 | | | | 946,503 | |
| Balance August 31, 2013 | | | 122,620,026 | | | $ | 7,050,350 | |
* Reflects the March 16, 2012 two-for-one stock split
The following table sets out the changes in warrants during the respective periods:
| | | August 31, 2013 | | | August 31, 2012 | |
| Warrants | | Number
of Warrants* | | | Weighted Average
Price* | | | Number
of Warrants* | | | Weighted Average
Price* | |
| Outstanding, beginning of year | | | 40,200,948 | | | $ | 0.04 | | | | 21,050,948 | | | $ | 0.04 | |
| Debt settlement (note b) | | | - | | | | - | | | | 6,000,000 | | | $ | 0.05 | |
| Debt settlement (note c) | | | - | | | | - | | | | 11,150,000 | | | $ | 0.05 | |
| Private placement (note d) | | | - | | | | - | | | | 2,000,000 | | | $ | 0.05 | |
| Balance, end of year | | | 40,200,948 | | | $ | 0.04 | | | | 40,200,948 | | | $ | 0.04 | |
* Reflects the March 16, 2012 two-for-one stock split
| (a) | During the year ended August 31, 2012, the Company issued 3,107,006 common shares as full settlement of interest due on shareholders’ loans in the amount of $325,903. The amount allocated to common shares based on fair value was $395,589 and $69,686 was recorded as a loss on settlement of debt in the statement of operations and comprehensive loss. |
| (b) | On January 24, 2012, the Company converted shareholders’ loans in the aggregate amount of $300,000 through the issuance of a total of 6,000,000 units in the capital of the Company at a price of $0.05 per unit. Each unit is comprised of one (1) common share and one (1) purchase warrant exercisable until January 24, 2015 to purchase one (1) additional common share of the Company at a purchase price of $0.05 per share. The fair value of the common shares issued on the settlement date was $522,856 and the amount allocated to warrants based on relative fair value using the Black Scholes model was $507,038 and $729,894 was recorded as a loss on settlement of debt. |
|
| Notes to the Consolidated Financial Statements |
| (Expressed In Canadian Dollars) |
| For The Years Ended August 31, 2013 and 2012 and 2011 |
| 10. | Share Capital and reserves (cont’d) |
| (c) | On February 17, 2012, the Company converted debt and shareholders’ loans in the aggregate amount of $557,500 through the issuance of a total of 11,150,000 units in the capital of the Company at a price of $0.05 per unit. Each unit is comprised of one (1) common share and one (1) purchase warrant exercisable until February 17, 2015 to purchase one (1) additional common share of the Company at a purchase price of $0.05 per share. The fair value of the common shares issued on the settlement date was $627,511 and the amount allocated to warrants based on relative fair value using the Black Scholes model was $595,310 and $665,321 was recorded as a loss on settlement of debt. |
| (d) | On February 17, 2012, the Company completed a non-brokered private placement of a total of 2,000,000 units in the capital of the Company at a price of $0.05 per unit for net proceeds of $100,000. Each unit is comprised of one (1) common share and one (1) purchase warrant exercisable until February 17, 2015 to purchase one (1) additional common share of the Company at a purchase price of $0.05 per share. The amount allocated to warrants based on relative fair value using the Black Scholes model was $67,541. |
| (e) | On April 13, 2012, the Company completed private placements for gross proceeds of $748,425 of equity capital from arm’s length private placement funding through the issuance of 3,000,000 units at a price of US$0.25 per unit. Each unit is comprised of one common share and one-half a common share purchase warrant, with each whole warrant entitling the holder to acquire one common share of the Company at US$0.50 for a period of three years from the date of issuance. The amount allocated to derivative warrant liabilities for warrants based on fair value using the Black Scholes model was $282,604. In connection with the private placement, the Company paid cash commissions and other expenses of $45,030 and issued an aggregate of 240,000 broker warrants. Each broker warrant entitles the holder to acquire one common share of the Company at an exercise price of US$0.25 for a period of three years from the date of issuance. The amount allocated to derivative warrant liabilities based on fair value using the Black Scholes model was $78,005 with a corresponding decrease in common shares. The Company subsequently re-priced the offering at US$0.20 and issued an additional 750,000 units on July 27, 2012. The fair value of the units based on the new offering price was determined to be $188,625. The amount allocated to contributed surplus was $132,616 and the amount allocated to derivative warrant liabilities based on fair value using the Black Scholes model was $56,009. In addition, the Company issued an additional 60,000 broker warrants. Each broker warrant entitles the holder to acquire one common share of the Company at an exercise price of US$0.25 for a period of three years from the date of issuance. The amount allocated to derivative warrant liabilities based on fair value using the Black Scholes model for broker warrants was $14,109 with a corresponding decrease in contributed surplus (see Note 13). |
| (f) | On July 20, 2012 and August 7, 2012 the Company completed private placements for gross proceeds of $1,365,561 of equity capital from arm’s length private placement funding through the issuance of 6,825,000 units at a price of US$0.20 per unit. Each unit is comprised of one common share and one-half a common share purchase warrant, with each whole warrant entitling the holder to acquire one common share of the Company at US$0.50 for a period of three years from the date of issuance. The amount allocated to derivative warrant liabilities for warrants based on fair value using the Black Scholes model was $460,907. In connection with the private placement, the Company paid cash commissions and other expenses of $82,239 and issued an aggregate of 546,000 broker warrants. Each broker warrant entitles the holder to acquire one common share of the Company at an exercise price of US$0.25 for a period of three years from the date of issuance. The amount allocated to derivative warrant liabilities based on fair value using the Black Scholes model was $119,887 with a corresponding decrease in common shares (see Note 13). |
| (g) | On May 8, 2012, the Company issued 171,385 common shares as full settlement of interest due on shareholders’ loans in the amount of $43,983. The amount allocated to common shares based on fair value was $44,547 and $564 was recorded as a loss on settlement of debt in the statement of operations and comprehensive loss. |
|
| Notes to the Consolidated Financial Statements |
| (Expressed In Canadian Dollars) |
| For The Years Ended August 31, 2013 and 2012 and 2011 |
| 10. | Share Capital and reserves (cont’d) |
| (h) | On August 31, 2012 the Company cancelled 3,418,468 common shares and 1,709,234 common shares purchase warrants exercisable at US$0.50 until August 31, 2014. The common shares and warrants had been issued August 31, 2010 as partial consideration of the purchase price for Dyami Energy and held in escrow pending the satisfaction of certain conditions precedent to their release on August 31, 2012. The conditions precedent had not been satisfied and the time allowed for performance expired. The Company recorded a reduction in exploration and evaluation assets of $2,091,616, a reduction in common shares of $1,397,199, a reduction of derivative warrant liabilities of $675,487 and a reduction in contributed surplus of $18,930 (see Note 13). |
| (i) | On September 25, 2012 the Company completed private placements for gross proceeds of $441,004 of equity capital from arm’s length private placement funding through the issuance of 2,249,790 units at a price of US$0.20 per unit. Each unit is comprised of one common share and one-half a common share purchase warrant, with each whole warrant entitling the holder to acquire one common share of the Company at US$0.50 for a period of three years from the date of issuance. The amount allocated to derivative warrant liabilities for warrants based on fair value using the Black Scholes model was $163,541 (retranslated as $176,087 at August 31, 2013). In connection with the private placement, the Company paid cash commissions and other expenses of $35,354 and issued an aggregate of 179,983 broker warrants. Each broker warrant entitles the holder to acquire one common share of the Company at an exercise price of US$0.25 for a period of three years from the date of issuance. The amount allocated to derivative warrant liabilities based on fair value using the Black Scholes model was $44,895 (retranslated as $48,340 at August 31, 2013) with a corresponding decrease in common shares (see Note 13). |
| (j) | On June 1, 2013, the Company issued 23,662,569 common shares as full settlement of shareholders’ loans in the amount of $198,333 and interest due on shareholders’ loans in the amount of $345,906. The amount allocated to common shares based on fair value was $946,503 and $402,264 was recorded as a loss on settlement of debt in the statement of operations and comprehensive loss. |
The following table summarizes the outstanding warrants as at August 31, 2013:
| Number of | | | Exercise | | | Expiry | | | Weighted Average | | | Warrant | |
| Warrants* | | | Price* | | | Date | | | Remaining Life (Years) | | | Value ($) | |
| | 2,000,000 | | | $ | 0.04 | | | | February 5, 2014 | | | | 0.43 | | | $ | 24,000 | |
| | 800,512 | | | $ | 0.04 | | | | February 25, 2014 | | | | 0.49 | | | | 9,606 | |
| | 18,250,436 | | | $ | 0.04 | | | | February 27, 2014 | | | | 0.49 | | | | 219,031 | |
| | 6,000,000 | | | $ | 0.05 | | | | January 24, 2015 | | | | 1.40 | | | | 507,038 | |
| | 11,150,000 | | | $ | 0.05 | | | | February 17, 2015 | | | | 1.47 | | | | 595,310 | |
| | 2,000,000 | | | $ | 0.05 | | | | February 17, 2015 | | | | 1.47 | | | | 67,541 | |
| | 40,200,948 | | | $ | 0.04 | | | | | | | | 0.94 | | | $ | 1,422,526 | |
* Reflects the March 16, 2012 two-for-one stock split
|
| Notes to the Consolidated Financial Statements |
| (Expressed In Canadian Dollars) |
| For The Years Ended August 31, 2013 and 2012 and 2011 |
| 10. | Share Capital and reserves (cont’d) |
The following table summarizes the outstanding warrants as at August 31, 2012:
| Number of | | | Exercise | | | Expiry | | | Weighted Average | | | Warrant | |
| Warrants* | | | Price* | | | Date | | | Remaining Life (Years) | | | Value ($) | |
| | 2,000,000 | | | $ | 0.04 | | | | February 5, 2014 | | | | 1.43 | | | $ | 24,000 | |
| | 800,512 | | | $ | 0.04 | | | | February 25, 2014 | | | | 1.49 | | | | 9,606 | |
| | 18,250,436 | | | $ | 0.04 | | | | February 27, 2014 | | | | 1.49 | | | | 219,031 | |
| | 6,000,000 | | | $ | 0.05 | | | | January 24, 2015 | | | | 2.40 | | | | 507,038 | |
| | 11,150,000 | | | $ | 0.05 | | | | February 17, 2015 | | | | 2.47 | | | | 595,310 | |
| | 2,000,000 | | | $ | 0.05 | | | | February 17, 2015 | | | | 2.47 | | | | 67,541 | |
| | 40,200,948 | | | $ | 0.04 | | | | | | | | 1.94 | | | $ | 1,422,526 | |
* Reflects the March 16, 2012 two-for-one stock split
The fair value of the warrants issued during the year ended August 31, 2012, were estimated using the Black-Scholes pricing model with the following assumptions:
| Black-Scholes Assumptions used | | | |
| Risk-free interest rate | | | 1 | % |
| Expected volatility | | | 218 | % |
| Expected life (years) | | | 3 | |
| Dividend yield | | | - | |
The following table summarizes the weighted average shares outstanding:
| Weighted Average Shares Outstanding* | | August 31, 2013 | | | August 31, 2012 | |
| Weighted average shares outstanding, basic and diluted | | | 104,774,293 | | | | 81,769,733 | |
* Reflects the March 16, 2012 two-for-one stock split
The effects of any potential dilutive instruments on loss per share are anti-dilutive and therefore have been excluded from the calculation of diluted loss per share.
Share Purchase Options
The Company has a stock option plan to provide incentives for directors, officers, employees and consultants of the Company. The maximum number of shares, which may be set aside for issuance under the stock option plan, is 20% of the issued and outstanding common shares of the Company on a rolling basis.
The following table is a summary of the status of the Company’s stock options and changes during the period:
| | | Number | | | Weighted Average | |
| | | of Options* | | | Exercise Price | |
| Balance, August 31, 2011 | | | - | | | $ | - | |
| Granted | | | 1,050,000 | | | | 0.16 | |
| Balance, August 31, 2012 | | | 1,050,000 | | | $ | 0.16 | |
| Granted | | | - | | | | - | |
| Balance August 31, 2013 | | | 1,050,000 | | | $ | 0.16 | |
* Reflects the March 16, 2012 two-for-one stock split
|
| Notes to the Consolidated Financial Statements |
| (Expressed In Canadian Dollars) |
| For The Years Ended August 31, 2013 and 2012 and 2011 |
| 10. | Share Capital and reserves (cont’d) |
The following table is a summary of the Company's stock options outstanding and exercisable at August 31, 2013:
| Options Outstanding | | | Options Exercisable | |
Exercise
Price | | | Number
of Options | | | Weighted
Average
Exercise Price | | | Weighted
Average
Remaining Life
(Years) | | | Number
of Options* | | | Weighted
Average
Exercise Price | |
| $ | 0.16 | | | | 1,000,000 | | | $ | 0.16 | | | | 3.50 | | | | 1,000,000 | | | $ | 0.16 | |
| $ | 0.25 | | | | 50,000 | | | $ | 0.25 | | | | 3.90 | | | | 50,000 | | | $ | 0.25 | |
| | | | | | 1,050,000 | | | $ | 0.16 | | | | 3.52 | | | | 1,050,000 | | | $ | 0.16 | |
The following table is a summary of the Company's stock options outstanding and exercisable at August 31, 2012:
| Options Outstanding | | | Options Exercisable | |
Exercise
Price | | | Number
of Options | | | Weighted
Average
Exercise Price | | | Weighted
Average
Remaining Life
(Years) | | | Number
of Options* | | | Weighted
Average
Exercise Price | |
| $ | 0.16 | | | | 1,000,000 | | | $ | 0.16 | | | | 4.50 | | | | 1,000,000 | | | $ | 0.16 | |
| $ | 0.25 | | | | 50,000 | | | $ | 0.25 | | | | 4.90 | | | | 50,000 | | | $ | 0.25 | |
| | | | | | 1,050,000 | | | $ | 0.16 | | | | 4.52 | | | | 1,050,000 | | | $ | 0.16 | |
* Reflects the March 16, 2012 two-for-one stock split
Stock Based Compensation
On March 1, 2012, the Company granted options to purchase 600,000 common shares to directors. These options are exercisable at $0.16 per share, vesting immediately and expire on February 28, 2017. The Company recorded non-cash stock based compensation expense of $95,910.
Stock Based Compensation – Non Employees
On March 1, 2012, the Company granted options to purchase 400,000 common shares to a consultant. These options are exercisable at $0.16 per share, vesting immediately and expire on February 28, 2017. The Company recorded non-cash stock based compensation expense of $63,940.
On July 24, 2012, the Company granted options to purchase 50,000 stock options to a consultant of the Company. These options are exercisable at $0.25 per share, vest immediately and expire on July 23, 2017. The Company recorded non-cash share based compensation expense of $11,122.
The fair value of the stock options granted were estimated on the date of the grant using the Black Scholes option pricing model with the following weighted average assumptions used.
| | | March 1, 2012 | | | July 24, 2012 | |
| Weighted average fair value per option | | $ | 0.16 | | | $ | 0.22 | |
| Weighted average risk free interest rate | | | 1.44% | | | | 1.12% | |
| Forfeiture rate | | | 0% | | | | 0% | |
| Weighted average expected volatility | | | 213% | | | | 233% | |
| Expected life (years) | | | 5 | | | | 5 | |
| Dividend yield | | | Nil | | | | Nil | |
|
| Notes to the Consolidated Financial Statements |
| (Expressed In Canadian Dollars) |
| For The Years Ended August 31, 2013 and 2012 and 2011 |
| 10. | Share Capital and reserves (cont’d) |
Transactions for the respective periods are as follows:
| | | Amount | |
| Balance, August 31, 2011 | | $ | - | |
| Stock based compensation | | | 170,972 | |
| Balance, August 31, 2012 | | | 170,972 | |
| Stock based compensation | | | - | |
| Balance, August 31, 2013 | | $ | 170,972 | |
Compensation Expense on Re-pricing Units
On April 13, 2012, the Company completed private placements of equity capital for gross proceeds of $748,425 from arm’s length private placement funding through the issuance of 3,000,000 units at a price of US$0.25 per unit. The Company subsequently re-priced the offering at US$0.20 and issued an additional 750,000 units on July 27, 2012. The fair value of the additional units issued based on the new offering price was determined to be $188,625 and was expensed to the statement of operations.
| Black-Scholes Assumptions used | | | | |
| Risk-free interest rate | | | 1.16% | |
| Expected volatility | | | 192% | |
| Expected life (years) | | | 2.9 | |
| Dividend yield | | | - | |
Contributed Surplus
Contributed surplus transactions for the respective periods are as follows:
| | | Amount | |
| Balance, August 31, 2011 | | $ | 85,737 | |
| Imputed interest | | | 2,334 | |
| Warrants expired (Note 13) | | | 318,552 | |
| Warrants cancelled (note h) | | | (18,930 | ) |
| Compensation expense on re-pricing of units (note e) | | | 118,507 | |
| Balance, August 31, 2012 | | $ | 506,200 | |
| Transactions during the year | | | - | |
| Balance, August 31, 2013 | | $ | 506,200 | |
| 11. | Related Party Transactions and Balances |
The following transactions with individuals related to the Company arose in the normal course of business have been accounted for at the exchange amount being the amount agreed to by the related parties, which approximates the arm’s length equivalent value.
Compensation of Key Management Personnel
The remuneration of directors and other members of key management personnel during the years ended were as follows:
| | | August 31, 2013 | | | August 31, 2012 | | | August 31, 2011 | |
| Short term employee benefits (1) | | $ | 75,000 | | | $ | 75,000 | | | $ | 56,250 | |
| Directors stock based compensation (2) | | | - | | | | 95,910 | | | | - | |
| | | $ | 75,000 | | | $ | 170,910 | | | $ | 56,250 | |
|
| Notes to the Consolidated Financial Statements |
| (Expressed In Canadian Dollars) |
| For The Years Ended August 31, 2013 and 2012 and 2011 |
| 11. | Related Party Transactions and Balances (cont’d) |
The following balances owing to the President of the Company are included in trade and other payables and are unsecured, non-interest bearing and due on demand:
| | | August 31, 2013 | | | August 31, 2012 | |
| Short term employee benefits (1) | | $ | 206,250 | | | $ | 131,250 | |
| Expenses paid on behalf of the Company | | | 1,747 | | | | 1,896 | |
| | | $ | 207,997 | | | $ | 133,146 | |
| (1) | The Company accrues management fees for the President of the Company at a rate of $6,250 per month. |
| (2) | On March 1, 2012, the Company granted 600,000 share purchase options to directors with an exercise price of $0.16 per share expiring on February 28, 2017. |
At August 31, 2013 the amount of directors’ fees included in trade and other payables was $16,100 (August 31, 2012 $12,900).
At August 31, 2013 the Company had promissory notes payable to the President of $28,845 and US$300,000 (August 31, 2012 $28,845 and US$300,000). For the year ended August 31, 2013 the Company recorded interest of $35,324 (August 31, 2012 $32,538). At August 31, 2013, included in trade and other payables is interest of $65,826 (August 31, 2012 $28,687). During the year ended August 31, 2012 the Company issued 207,612 common shares to the President as full settlement of interest due in the amount of $30,195. The notes are due on demand and bear interest at 10% per annum. Interest is payable annually on the anniversary date of the notes.
On September 1, 2011 the Company paid to Source Re Work Program, Inc. (“Source”) the secured promissory note in full in the amount of US$75,000 together with accrued interest of US$6,250. Eric Johnson was the President of Source and a shareholder of the Company and was the Vice President of Operations for Dyami Energy until April 13, 2011 (see Note 12).
At August 31, 2013 and 2012 the Company has a US$960,000, 10% per annum secured promissory note payable to Benchmark Enterprises LLC (“Benchmark”). Benchmark is a shareholder of the Company. For the year ended August 31, 2013 the Company recorded interest of $101,309 (August 31, 2012 $83,947. At August 31, 2013 included in trade and other payables is interest of $169,033 (August 31, 2012 $63,296). During the year ended August 31, 2012 the Company issued 1,030,812 common shares as full settlement of interest due in the amount of $103,021 (see Note 12).
At August 31, 2013 included in trade and other payables is $3,509 due to Gottbetter & Partners LLP for legal fees (August 31, 2012 $14,649). During the year ended August 31, 2013 the Company completed private placements of 2,249,790 units in the capital of the Company for gross proceeds of $441,004 and paid to Gottbetter Capital Markets, LLC, placement agent fees of $35,280 and issued 179,983 common share purchase warrants exercisable at US$0.25 for a period of three years from the date of issue. During the year ended August 31, 2012 the Company completed private placements of 10,575,000 units in the capital of the Company for gross proceeds of $2,113,986 and paid to Gottbetter Capital Markets, LLC, placement agent fees of $99,326 and issued 846,000 common share purchase warrants exercisable at US$0.25 for a period of three years from the date of issue. On February 17, 2012 the Company converted $50,000 of debt into 1,000,000 units of the Company at $0.05 per unit. .Gottbetter Capital Group, Inc. is a shareholder of the Company. Adam Gottbetter is the managing and principal partner of Gottbetter & Partners LLP, and the beneficial owner of Gottbetter Capital Group, Inc., and Gottbetter Capital Markets, LLC.
|
| Notes to the Consolidated Financial Statements |
| (Expressed In Canadian Dollars) |
| For The Years Ended August 31, 2013 and 2012 and 2011 |
| 11. | Related Party Transactions and Balances (cont’d) |
At August 31, 2013 and 2012 the Company had an unsecured, non-interest bearing and repayable on demand shareholder loan in the amount of Nil (August 31, 2011 $57,500). For the year ended August 31, 2012 interest was imputed at a rate of 10% per annum and interest of $2,334 was recorded and included in contributed surplus. On January 24, 2012 the Company converted $50,000 of the loan into 1,000,000 units and on February 17, 2012 the Company converted the balance of the loan, $7,500 into 150,000 units in the capital of the Company at $0.05 per unit.
During the year ended August 31, 2013, the Company received Nil (August 31, 2012 US$175,000 and $293,000) and issued promissory notes to shareholders. During the year ended August 31, 2013 the Company paid Nil in promissory notes (August 31, 2012 US$480,000). At August 31, 2013, the Company had shareholders’ loans payable of US$1,433,500 and $250,000 (August 31, 2012 US$1,583,740 and $293,000). The notes are payable on demand and bear interest at 10% per annum. Interest is payable annually on the anniversary date of the notes. For the year ended August 31, 2013 the Company recorded interest of $183,490 (August 31, 2012 $254,117). At August 31, 2013, included in trade and other payables is interest of $47,037 (August 31, 2012 $190,484). During the year ended August 31, 2013 the Company issued 23,662,569 common shares as full settlement of shareholders’ loans in the amount of $198,333 and interest due on shareholders’ loans in the amount of $345,906. During the year ended August 31, 2012 the Company issued 2,039,969 common shares as full settlement of interest due on shareholder notes in the amount of $236,669.
On January 24, 2012 the Company converted $250,000 of shareholders’ loans into 5,000,000 units in the capital of the Company at $0.05 per unit and on February 17, 2012 the Company converted $500,000 into 10,000,000 units in the capital of the Company at $0.05 per unit.
At August 31, 2011 the Company had a secured promissory note payable to Source Re Work Program, Inc. (“Source”) in the amount of US$75,000. On September 1, 2011 the Company paid the secured promissory note of US$75,000 together with accrued interest to August 31, 2011 of US$6,250.
At August 31, 2013 and 2012, the Company had a US$960,000, 10% per annum secured promissory note payable to Benchmark Enterprises LLC (August 31, 2012 US$960,000). The note and all unpaid and accrued interest was due on or before August 31, 2013, or within 15 days of written demand to the Company, or upon the Company closing a cash financing or series of cash financings in excess of US$2,500,000 in which case fifty cents of every one dollar exceeding US$2,500,000 will be allocated to the secured note until paid in full. As of the date of the consolidated financial statements, the Company had not received written demand for payment. For the year ended August 31, 2013 the Company recorded interest of $101,309 (August 31, 2012 $83,947). At August 31, 2013 included in trade and other payables is interest of $169,033 (August 31, 2012 $63,296). During the year ended August 31, 2012 the Company issued 1,030,812 common shares as full settlement of interest due in the amount of $103,021. The noteis secured by Zavala Inc.’s interest in the Matthews Lease and Dyami Energy’s interest in the Murphy Lease, Zavala County, Texas (the “Leases”). The carrying value of their interests in the Leases at August 31, 2013 was $2,829,830 (August 31, 2012 $4,645,534). The Company may, in its sole discretion, prepay any portion of the principal amount.
|
| Notes to the Consolidated Financial Statements |
| (Expressed In Canadian Dollars) |
| For The Years Ended August 31, 2013 and 2012 and 2011 |
| 13. | Derivative Warrant Liabilities |
The Company has warrants issued with an exercise price in US dollars which are different from the functional currency of the Company (Canadian Dollars) and accordingly the warrants are treated as a financial liability and the fair value movement during the period is recognized in the profit or loss.
The following table set out the changes in derivative warrant liabilities during the respective periods.
| | | Number of
Warrants* | | | Fair Value
Assigned | | | Average Exercise
Price US $ | |
| As at August 31, 2011 | | | 4,409,178 | | | $ | 1,576,269 | | | $ | 0.52 | |
| Warrants expired | | | (990,712 | ) | | | (318,552 | ) | | | 0.58 | |
| Warrants issued | | | 5,287,500 | | | | 799,520 | | | | 0.50 | |
| Broker warrants issued | | | 846,000 | | | | 212,001 | | | | 0.25 | |
| Warrants cancelled | | | (1,709,234 | ) | | | (675,487 | ) | | | 0.50 | |
| Change in fair value estimates | | | - | | | | 46,655 | | | | - | |
| As at August 31, 2012 | | | 7,842,732 | | | | 1,640,406 | | | | 0.47 | |
| Warrants issued | | | 1,124,895 | | | | 163,541 | | | | 0.50 | |
| Broker warrants issued | | | 179,983 | | | | 44,895 | | | | 0.25 | |
| Change in fair value estimates | | | - | | | | 128,041 | | | | - | |
| As at August 31, 2013 | | | 9,147,610 | | | | 1,976,883 | | | $ | 0.50 | |
* Reflects the March 16, 2012 two-for-one stock split
On August 31, 2010, the Company issued 3,418,468 common share purchase warrants exercisable at US$0.50 per common share until August 31, 2014. On August 31, 2012 1,709,234 common share purchase warrants were cancelled and the fair value measured using the Black Scholes valuation model was $675,487. The remaining 1,709,232 warrants, translated at the current exchange rate have been reclassified as short term.
On December 10, 2011 593,808 warrants expired and the fair value measured using the Black Scholes valuation model of $179,113 was recorded as an increase to contributed surplus.
On June 10, 2012 296,904 warrants expired and the fair value measured using the Black Scholes valuation model of $99,999 was recorded as an increase to contributed surplus.
On May 4, 2012, 100,000 expired and the fair value measured using the Black Scholes valuation model of $39,440 was recorded as an increase to contributed surplus.
On April 13, 2012 and July 27, 2012 the Company issued 1,875,000 common share purchase warrants exercisable at US$0.50 and 300,000 common share purchase broker warrants exercisable at US$0.25 expiring April 13, 2015. The fair value measured using the Black Scholes valuation model was $338,813 and $92,114, respectively.
On July 20, 2012 the Company issued 912,500 common share purchase warrants exercisable at US$0.50 and 146,000 common share purchase broker warrants exercisable at US$0.25 expiring July 20, 2015. The fair value measured using the Black Scholes valuation model was $124,288 and $33,454, respectively.
On August 7, 2012 the Company issued 2,500,000 common share purchase warrants exercisable at US$0.50 and 400,000 common share purchase broker warrants exercisable at US$0.25 expiring August 7, 2015. The fair value measured using the Black Scholes valuation model was $336,419 and $86,433, respectively.
On September 25, 2012 the Company issued 1,124,895 common share purchase warrants exercisable at US$0.50 and 179,983 common share purchase broker warrants exercisable at US$0.25 expiring September 25, 2015. The fair value measured using the Black Scholes valuation model was $163,541 and $45,895, respectively.
|
| Notes to the Consolidated Financial Statements |
| (Expressed In Canadian Dollars) |
| For The Years Ended August 31, 2013 and 2012 and 2011 |
| 13. | Derivative Warrant Liabilities (cont’d) |
The following tables set out the number of derivative warrant liabilities outstanding at August 31, 2013 and 2012:
Number of
Warrants* | | | Exercise Price
US ($)* | | | Expiry
Date | | Weighted Average
Remaining
Life (Years) | | | Fair Value
CDN ($) | |
| | 1,709,232 | | | $ | 0.50 | | | August 31, 2014 | | | 1.00 | | | $ | 688,803 | |
| | 1,875,000 | | | $ | 0.50 | | | April 13, 2015 | | | 1.62 | | | | 355,208 | |
| | 300,000 | | | $ | 0.25 | | | April 13, 2015 | | | 1.62 | | | | 96,629 | |
| | 912,500 | | | $ | 0.50 | | | July 20, 2015 | | | 1.88 | | | | 129,683 | |
| | 146,000 | | | $ | 0.25 | | | July 20, 2015 | | | 1.88 | | | | 34,906 | |
| | 2,500,000 | | | $ | 0.50 | | | August 7, 2015 | | | 1.93 | | | | 355,685 | |
| | 400,000 | | | $ | 0.25 | | | August 7, 2015 | | | 1.93 | | | | 91,542 | |
| | 1,124,895 | | | $ | 0.50 | | | September 25, 2015 | | | 2.07 | | | | 176,087 | |
| | 179,983 | | | $ | 0.25 | | | September 25, 2015 | | | 2.07 | | | | 48,340 | |
| | 9,147,610 | | | | | | | | | | 1.70 | | | | 1,976,883 | |
Number of
Warrants* | | | Exercise Price
US ($)* | | | Expiry
Date | | Weighted Average
Remaining
Life (Years) | | | Fair Value
CDN ($) | |
| | 1,709,232 | | | $ | 0.50 | | | August 31, 2014 | | | 2.00 | | | $ | 643,766 | |
| | 1,875,000 | | | $ | 0.50 | | | April 13, 2015 | | | 2.62 | | | | 333,975 | |
| | 300,000 | | | $ | 0.25 | | | April 13, 2015 | | | 2.62 | | | | 90,852 | |
| | 912,500 | | | $ | 0.50 | | | July 20, 2015 | | | 2.88 | | | | 121,203 | |
| | 146,000 | | | $ | 0.25 | | | July 20, 2015 | | | 2.88 | | | | 32,624 | |
| | 2,500,000 | | | $ | 0.50 | | | August 7, 2015 | | | 2.93 | | | | 332,428 | |
| | 400,000 | | | $ | 0.25 | | | August 7, 2015 | | | 2.93 | | | | 85,558 | |
| | 7,842,732 | | | | | | | | | | 2.20 | | | $ | 1,640,406 | |
* Reflects the March 16, 2012 two-for-one stock split
The fair value of the warrants issued during the year ended August 31, 2013 and 2012, were estimated using the Black-Scholes pricing model with the following assumptions:
| Black-Scholes Assumptions used | | 2013 | | | 2012 | |
| Risk-free interest rate | | | 1.5% | | | | 1%-1.3% | |
| Expected volatility | | | 217% | | | | 192%-199% | |
| Expected life (years) | | | 3 | | | | 3 | |
| Dividend yield | | | - | | | | - | |
| 14. | Financial Instruments and Concentration of Risks |
The Company has classified its financial instruments as follows:
| Financial Instrument | | Category | | Measurement method |
| Cash | | Fair value through profit or loss | | Fair value |
| Marketable securities | | Fair value through profit or loss | | Fair value |
| Derivative warrant liabilities | | Fair value through profit or loss | | Fair value |
| Trade and other receivables | | Loans and receivables | | Amortized cost |
| Trade and other payables | | Other financial liabilities | | Amortized cost |
| Provisions | | Other financial liabilities | | Amortized cost |
| Secured note payable and shareholders’ loans | | Other financial liabilities | | Amortized cost |
The types of risk exposure and the ways in which such exposures are managed are as follows:
|
| Notes to the Consolidated Financial Statements |
| (Expressed In Canadian Dollars) |
| For The Years Ended August 31, 2013 and 2012 and 2011 |
| 14. | Financial Instruments and Concentration of Risks (cont’d) |
Credit Risk
Credit risk is primarily related to the Company’s receivables from joint venture partners and the risk of financial loss if a partner or counterparty to a financial instrument fails to meet its contractual obligations. Receivables from joint venture partners are normally collected within one to three months of the joint venture bill being issued to the partner. The Company historically has not experienced any collection issues with its joint venture partners to date. The Company attempts to mitigate the risk from joint venture receivables by obtaining partner approval of significant capital expenditures prior to expenditure. The Company establishes an allowance for doubtful accounts as determined by management based on their assessed collectability; therefore, the carrying amount of trade and other receivables generally represents the maximum credit exposure. The Company believes that its counterparties currently have the financial capacity to settle outstanding obligations in the normal course of business.
Concentration risks exist in cash because significant balances are maintained with one financial institution. The risk is mitigated because the financial institution is an international bank.
The Company’s maximum exposure to credit risk is as follows:
| | | August 31, 2013 | | | August 31, 2012 | |
| Cash | | $ | 196,837 | | | $ | 330,003 | |
| Trade and other receivables | | | 27,786 | | | | 17,525 | |
| Prepaid expenses and deposits | | | 158,295 | | | | - | |
| Balance | | $ | 382,918 | | | $ | 347,528 | |
Liquidity Risk
The Company monitors its liquidity position regularly to assess whether it has the funds necessary to fulfill planned exploration commitments on its oil and gas properties or that viable options are available to fund such commitments from new equity issuances or alternative sources such as farm-out agreements. However, as an exploration company at an early stage of development and without significant internally generated cash flow, there are inherent liquidity risks, including the possibility that additional financing may not be available to the Company, or that actual exploration expenditures may exceed those planned. The current uncertainty in global markets could have an impact on the Company’s future ability to access capital on terms that are acceptable to the Company. The Company has so far been able to raise the required financing to meet its obligations however, there can be no assurance that it will continue to do so in the future.
The following table illustrates the contractual maturities of financial liabilities:
| August 31, 2013 | | Payments Due by Period | |
| | | Total | | | Less than
1 year | | | 1-3 years | | | 4-5 years | | | After
5 years | |
| Trade and others payables | | $ | 1,379,581 | | | $ | 1,379,581 | | | | - | | | | - | | | | - | |
| Secured note payable (1) | | | 1,013,088 | | | | 1,013,088 | | | | - | | | | - | | | | - | |
| Shareholders’ loans (1) | | | 2,108,205 | | | | 2,108,205 | | | | - | | | | - | | | | - | |
| Total | | $ | 4,500,874 | | | $ | 4,500,874 | | | | - | | | | - | | | | - | |
| August 31, 2012 | | Payments Due by Period | |
| | | Total | | | Less than
1 year | | | 1-3 years | | | 4-5 years | | | After
5 years | |
| Trade and others payables | | $ | 1,039,959 | | | $ | 1,039,959 | | | | - | | | | - | | | | - | |
| Secured note payable (1) | | | 946,848 | | | | 946,848 | | | | - | | | | - | | | | - | |
| Shareholders’ loans (1) | | | 2,179,778 | | | | 2,179,778 | | | | - | | | | - | | | | - | |
| Total | | $ | 4,166,585 | | | $ | 4,166,585 | | | | - | | | | - | | | | - | |
| (1) | Translated at current exchange rate. |
|
| Notes to the Consolidated Financial Statements |
| (Expressed In Canadian Dollars) |
| For The Years Ended August 31, 2013 and 2012 and 2011 |
| 14. | Financial Instruments and Concentration of Risks (cont’d) |
Market Risk
Market risk represents the risk of loss that may impact the Company’s financial position, results of operations, or cash flows due to adverse changes in financial market prices, including interest rate risk, foreign currency exchange rate risk, commodity price risk, and other relevant market or price risks. The Company does not use derivative financial instruments or derivative commodity instruments to mitigate this risk.
The oil and gas industry is exposed to a variety of risks including the uncertainty of finding and recovering new economic reserves, the performance of hydrocarbon reservoirs, securing markets for production, commodity prices, interest rate fluctuations, potential damage to or malfunction of equipment and changes to income tax, royalty, environmental or other governmental regulations.
Market events and conditions in recent years including disruptions in the international credit markets and other financial systems and the deterioration of global economic conditions have caused significant volatility to commodity prices. These conditions caused a loss of confidence in the broader U.S. and global credit and financial markets. Notwithstanding various actions by governments, concerns about the general condition of the capital markets, financial instruments, banks, investment banks, insurers and other financial institutions caused the broader credit markets to further deteriorate and stock markets to decline. These factors have negatively impacted company valuations and may impact the performance of the global economy going forward. Although economic conditions improved towards the later portion of 2009, the recovery has been slow in various jurisdictions including in Europe and the United States and has been impacted by various ongoing factors including sovereign debt levels and high levels of unemployment which continue to impact commodity prices and to result in volatility in the stock market.
The Company mitigates these risks by:
| • | utilizing competent, professional consultants as support to company staff. |
| • | performing geophysical, geological or engineering analyses of prospects. |
| • | focusing on a limited number of core properties. |
(i) Commodity Price Risk
Commodity price risk is the risk that the fair value or future cash flows will fluctuate as a result of changes in commodity prices. Commodity prices for petroleum and natural gas are impacted by world economic events that dictate the levels of supply and demand.
The Company believes that movement in commodity prices that are reasonably possible over the next twelve month period will not have a significant impact on the Company.
Commodity Price Sensitivity
The following table summarizes the sensitivity of the fair value of the Company’s risk management position for the year ended August 31, 2013 and 2012 to fluctuations in natural gas prices, with all other variables held constant. When assessing the potential impact of these price changes, the Company believes that 10 percent volatility is a reasonable measure. Fluctuations in natural gas prices potentially could have resulted in unrealized gains (losses) impacting net income as follows:
| | | 2013 | | | 2012 | |
| | | Increase 10% | | | Decrease 10% | | | Increase 10% | | | Decrease 10% | |
| Net revenue | | $ | 32,946 | | | $ | 27,178 | | | $ | 43,764 | | | $ | 34,672 | |
| Net loss | | $ | (4,263,162 | ) | | $ | (4,268,930 | ) | | $ | (2,804,642 | ) | | $ | (2,813,374 | ) |
|
| Notes to the Consolidated Financial Statements |
| (Expressed In Canadian Dollars) |
| For The Years Ended August 31, 2013 and 2012 and 2011 |
| 14. | Financial Instruments and Concentration of Risks (cont’d) |
(ii) Currency Risk
The Company is exposed to the fluctuations in foreign exchange rates. The prices received by the Company for the production of natural gas and natural gas liquids are primarily determined in reference to United States dollars but are settled with the Company in Canadian dollars. The Company’s cash flow for commodity sales will therefore be impacted by fluctuations in foreign exchange rates.
The Company operates in Canada and a portion of its expenses are incurred in U.S. dollars. A significant change in the currency exchange rates between the Canadian dollar relative to US dollar could have an effect on the Company’s financial instruments. The Company does not hedge its foreign currency exposure.
The following assets and liabilities are denominated in US dollars at August 31, 2013 and August 31, 2012:
| | | August 31, 2013 | | | August 31, 2012 | |
| Cash | | $ | 150,901 | | | $ | 311,318 | |
| Trade and other receivables | | | 14,349 | | | | - | |
| Exploration and evaluation assets | | | 2,681,541 | | | | 5,083,874 | |
| Prepaid expenses and deposits | | | 150,000 | | | | - | |
| Trade and other payables | | | (821,787 | ) | | | (402,633 | ) |
| Provisions | | | (265,117 | ) | | | (226,494 | ) |
| Derivative warrant liabilities | | | (1,873,290 | ) | | | (1,614,996 | ) |
| Shareholders’ loans | | | (1,733,500 | ) | | | (1,883,740 | ) |
| Secured notes payable | | | (960,000 | ) | | | (960,000 | ) |
| Net assets denominated in US$ | | $ | (2,656,903 | ) | | $ | 307,329 | |
| Net asset CDN dollar equivalent at period end(1) | | $ | (2,803,830 | ) | | $ | 303,120 | |
(1) Translated at the exchange rate in effect at August 31, 2013 $1.0553 (August 31, 2012 $0.9863)
The following table shows the estimated sensitivity of the Company’s total comprehensive loss for the periods set out from a change in the U.S dollar exchange rate in which the Company has exposure with all other variables held constant.
| | | | August 31, 2013 | | | August 31, 2012 | |
| | | | Increase | | | Decrease | | | Increase | | | Decrease | |
Percentage change
in US Dollar | | | In total comprehensive loss from a
change in % in the US Exchange Rate ($) | | | In total comprehensive loss from a
change in % in the US Exchange Rate ($) | |
| | 2 | % | | | (59,178 | ) | | | 59,178 | | | | (6,062 | ) | | | 6,062 | |
| | 4 | % | | | (118,355 | ) | | | 118,355 | | | | (12,125 | ) | | | 12,125 | |
| | 6 | % | | | (177,533 | ) | | | 177,533 | | | | (18,187 | ) | | | 18,187 | |
| | 8 | % | | | (236,711 | ) | | | 236,711 | | | | (24,250 | ) | | | 24,250 | |
| | 10 | % | | | (295,888 | ) | | | 295,888 | | | | (30,312 | ) | | | 30,312 | |
(iii) Interest Rate Risk
Interest rate risk refers to the risk that the value of a financial instrument or cash flows associated with the instrument will fluctuate due to changes in market interest rates. The majority of the Company’s debt is short-term in nature with fixed rates.
Based on management's knowledge and experience of the financial markets, the Company believes that the movements in interest rates that are reasonably possible over the next twelve month period will not have a significant impact on the Company.
|
| Notes to the Consolidated Financial Statements |
| (Expressed In Canadian Dollars) |
| For The Years Ended August 31, 2013 and 2012 and 2011 |
| 14. | Financial Instruments and Concentration of Risks (cont’d) |
(iv) Fair Value of Financial Instruments
The Company’s financial instruments included on the consolidated statement of financial position as at August 31, 2013 and 2012 are comprised of cash, marketable securities, trade and other receivables, trade and other payables, secured note payable, shareholders’ loans, provisions, and derivative warrant liabilities.
The Company classifies the fair value of financial instruments measured at fair value according to the following hierarchy based on the amount of observable inputs used to value the instrument.
• Level 1 – Quoted prices are available in active markets for identical assets or liabilities as of the reporting date. Active markets are those in which transactions occur in sufficient frequency and volume to provide pricing information on an ongoing basis.
• Level 2 – Pricing inputs are other than quoted prices in active markets included in Level 1. Prices in Level 2 are either directly or indirectly observable as of the reporting date. Level 2 valuations are based on inputs, including quoted forward prices for commodities, time value and volatility factors, which can be substantially observed or corroborated in the marketplace.
• Level 3 – Valuations in this level are those with inputs for the asset or liability that are not based on observable market data.
| | | August 31, 2013 | | | August 31, 2012 | |
Financial Instrument
Classification | | Carrying
Value $ | | | Fair
Value $ | | | Carrying
Value $ | | | Fair
Value $ | |
| Fair value through profit or loss: | | | | | | | | | | | | | | | | |
| Cash | | | 196,837 | | | | 196,837 | | | | 330,003 | | | | 330,003 | |
| Marketable securities | | | - | | | | - | | | | 1 | | | | 1 | |
| Derivative warrant liabilities | | | 1,976,883 | | | | 1,976,883 | | | | 1,640,406 | | | | 1,640,406 | |
| | | | | | | | | | | | | | | | | |
| Loans and receivables: | | | | | | | | | | | | | | | | |
| Trade and other receivables | | | 27,786 | | | | 27,786 | | | | 17,525 | | | | 17,525 | |
| | | | | | | | | | | | | | | | | |
| Other financial liabilities: | | | | | | | | | | | | | | | | |
| Trade and other payables | | | 1,379,581 | | | | 1,379,581 | | | | 1,039,959 | | | | 1,039,959 | |
| Secured note payable | | | 1,013,088 | | | | 1,013,088 | | | | 946,848 | | | | 946,848 | |
| Shareholders’ loans | | | 2,108,205 | | | | 2,108,205 | | | | 2,179,778 | | | | 2,179,778 | |
| Provisions | | | 298,295 | | | | 298,295 | | | | 240,672 | | | | 240,672 | |
Cash, derivative warrant liabilities and marketable securities are stated at fair value (Level 1 measurement). The carrying value of trade and other receivables, trade and other payables, secured note payable, shareholders’ loans and provisions approximate their fair value due to the short-term maturity of these financial instruments (Level 3 measurement).
|
| Notes to the Consolidated Financial Statements |
| (Expressed In Canadian Dollars) |
| For The Years Ended August 31, 2013 and 2012 and 2011 |
| 14. | Financial Instruments and Concentration of Risks (cont’d) |
Capital Management
The Company’s objectives when managing capital are to ensure the Company will have sufficient financial capacity, liquidity and flexibility to funds its operations, growth and ongoing exploration and development commitments on its oil and gas interests. The Company is dependent on funding these activities through debt and equity financings. Due to long lead cycles of the Company’s exploration activities, the Company’s capital requirements currently exceed its operational cash flow generated. As such the Company is dependent upon future financings in order to maintain its flexibility and liquidity and may from time to time be required to issue equity, issue debt, adjust capital spending or seek joint venture partners.
The Company manages the capital structure and makes adjustments to it in light of changes in economic conditions and the risk characteristics of any underlying assets in order to meet current and upcoming obligations. Current plans for the development commitments of the Company’s Texas leases include debt or equity financing or seeking and obtaining a joint venture partner.
The board of directors does not establish quantitative return on capital criteria for management, but rather relies on the expertise of the Company's management and favourable market conditions to sustain future development of the business.
As at August 31, 2013 and August 31, 2012 and the Company considered its capital structure to comprise of shareholders equity and long-term debt.
Management reviews its capital management approach on an ongoing basis and believes that this approach, given the relative size of the Company, is reasonable.
There were no changes in the Company’s capital management during the period ended August 31, 2013.
The Company is not subject to any externally imposed restrictions on its capital requirements.
| 15. | Supplemental cash flow information and Non-Cash Transactions |
The following table summarizes the non-cash transactions for the periods set out:
| | | Years Ended | |
| Non-cash transactions | | August 31,
2013 | | | August 31,
2012 | | | August 31,
2011 | |
| Shares issued for interest on secured note and shareholders’ loans | | $ | 601,576 | | | $ | 440,136 | | | $ | - | |
| Broker warrants issued | | | 44,895 | | | | 212,001 | | | | - | |
| Shares issued to settle debt | | | 344,927 | | | | - | | | | - | |
| Warrants expired | | | - | | | | (318,552 | ) | | | - | |
| Units issued to settle debt | | | - | | | | 2,252,715 | | | | - | |
| Units cancelled | | | - | | | | (2,091,616 | ) | | | - | |
| Prepaid portion of shares for services | | | - | | | | (44,285 | ) | | | 44,285 | |
| Warrants cancelled | | | - | | | | - | | | | (36,237 | ) |
| Issuance of units as compensation | | | - | | | | 44,285 | | | | 88,569 | |
| Compensation expense on re-pricing of units | | | - | | | | 188,625 | | | | - | |
|
| Notes to the Consolidated Financial Statements |
| (Expressed In Canadian Dollars) |
| For The Years Ended August 31, 2013 and 2012 and 2011 |
| 15. | Supplemental cash flow information and Non-Cash Transactions (cont’d) |
The following table summarizes the changes in non-cash working capital for the periods set out:
| | | Years Ended | |
| Changes in non-cash working capital | | August 31, 2013 | | | August 31, 2012 | | | August 31, 2011 | |
| Trade and other receivables | | $ | (10,261 | ) | | $ | 110,021 | | | $ | (74,486 | ) |
| Trade and other payables | | | 339,622 | | | | 262,149 | | | | 775,767 | |
| Prepaid expenses and deposits | | | (158,295 | ) | | | - | | | | - | |
| Due from related party | | | - | | | | - | | | | 1,325 | |
| Provisions | | | 398,362 | | | | 64,773 | | | | (5,669 | ) |
| Net change | | $ | 569,428 | | | $ | 436,943 | | | $ | 696,937 | |
The Company has unused capital losses in the amount of approximately $195,852 (2012 - $195,852) which may be carried forward indefinitely to offset future capital gains, and unused non capital losses in the amount of approximately $3,055,152 (2012 - $2,225,622) available to reduce income in future years expiring as follows:
| 2014 | | $ | 46,501 | |
| 2015 | | | 47,434 | |
| 2026 | | | 55,415 | |
| 2027 | | | 42,337 | |
| 2028 | | | 49,166 | |
| 2029 | | | 268,782 | |
| 2030 | | | 286,991 | |
| 2031 | | | 648,310 | |
| 2032 | | | 780,686 | |
| 2033 | | | 829,530 | |
| | | $ | 3,055,152 | |
A reconciliation between income taxes provided at actual rates and at the basic rate ranging from 26.5% to 34% (2012 - 28% to 34%) for federal and provincial taxes is as follows:
| | | 2013 | | | 2012 | |
| Net Loss | | $ | 4,266,046 | | | $ | 2,809,188 | |
| Taxes at statutory rates | | | (1,130,502 | ) | | | (786,573 | ) |
| Non-taxable items and others | | | 888,466 | | | | 491,099 | |
| Change in unrecognized deferred tax asset | | | 242,036 | | | | 295,474 | |
| | | $ | - | | | $ | - | |
The significant components of the Company's unrecognized deferred income tax asset are summarized as follows:
| | | 2013 | | | 2012 | |
| Operating loss carry forwards | | $ | 808,519 | | | $ | 599,202 | |
| Share issue costs | | | 29,616 | | | | 31,611 | |
| Marketable securities | | | 777 | | | | 792 | |
| Capital losses carry forwards | | | 28,070 | | | | 28,600 | |
| Oil and gas interests | | | 69,042 | | | | 33,603 | |
| Cumulative eligible capital | | | 1,186 | | | | 1,366 | |
| Unrecognized deferred tax asset | | $ | 937,210 | | | $ | 695,174 | |
|
| Notes to the Consolidated Financial Statements |
| (Expressed In Canadian Dollars) |
| For The Years Ended August 31, 2013 and 2012 and 2011 |
| 17. | Commitments and Contingencies |
The Company has certain commitments on its Leases located in Zavala County, Texas, USA (see Note 7).
Certain comparative figures have been reclassified to conform to current period presentation under IFRS.
On December 3, 2013, the Company entered into an agreement with Stratex Oil and Gas Holdings, Inc. (“Stratex”) to develop the Matthews Lease in Zavala County, Texas (the “Joint Development Agreement”). Under the terms of the Joint Development Agreement, Stratex may earn a 66.67% working interest before payout (50% working interest after payout) in the Matthews #1 well by:
| 1) | completing a hydraulic fracture no later than March 31, 2014; |
| 2) | delivering US$150,000 to the lessors of the Matthews Lease upon execution of the Joint Development Agreement (paid); |
| 3) | delivering US$50,000 to the Company upon execution of the Joint Development Agreement (paid); and |
| 4) | delivering US$100,000 to the Company on or before December 31, 2013. |
Following the completion of the above, Stratex will earn a 50% working interest in the 2,629 acre Matthews Lease excluding 80 acres surrounding the Matthews #3 well.
INDEX TO EXHIBITS
| Exhibit # | | Description |
| 1.1 | | Certificate of Incorporation of Bonanza Red Lake Explorations Inc. (presently known as Eagleford Energy Inc.) dated September 22, 1978 (1) |
| 1.2 | | Articles of Amendment dated January 14, 1985 (1) |
| 1.3 | | Articles of Amendment dated August 16, 2000 (1) |
| 1.4 | | Bylaw No 1 of Bonanza Red Lake Explorations Inc. (presently known as Eagleford Energy Inc.) (1) |
| 1.5 | | Special By-Law No 1 – Respecting the borrowing of money and the issue of securities of Bonanza Red Lake Explorations Inc. (presently known as Eagleford Energy Inc.) (1) |
| 1.6 | | Articles of Amalgamation dated November 30, 2009 (3) |
| 4.1 | | 2000 Stock Option Plan (1) |
| 4.2 | | Code of Business Conduct and Ethics (1) |
| 4.3 | | Audit Committee Charter (1) |
| 4.4 | | Petroleum and Natural Gas Committee Charter (1) |
| 4.5 | | Compensation Committee Charter (1) |
| 4.6 | | Purchase and Sale Agreement dated February 5, 2008 among Eugenic Corp., 1354166 Alberta Ltd., and the Vendors of 1354166 Alberta Ltd. (1) |
| 4.7 | | Amended Audit Committee Charter (3) |
| 4.8 | | Amended Stock Option Plan (4) |
| 4.9 | | Asset Purchase Agreement between Eagleford Energy Inc., and Source Re-Work Program Inc., dated May 12, 2010 (6) |
| 4.10 | | Addendum dated June 10, 2010 to the Asset Purchase Agreement between Eagleford Energy Inc. and Source Re-Work Program Inc., dated May 12, 2010 (6) |
| 4.11 | | Addendum 2 dated June 30, 2010 to the Asset Purchase Agreement between Eagleford Energy Inc. and Source Re-Work Program Inc., dated May 12, 2010 (6) |
| 4.12 | | Acquisition Agreement among Eagleford Energy Inc., Dyami Energy LLC and the Members of Dyami Energy LLC dated August 10, 2010 (5) |
| 4.13 | | Financial Advisory Services Agreement between Eagleford Energy Inc. and GarWood Securities, LLC dated June 10, 2010 (6) |
| 4.14 | | Amended Stock Option Plan, February 24, 2011 (7) |
| 4.15 | | Amendment dated December 31, 2011 to Secured Promissory Note between Eagleford Energy Inc. and Benchmark Enterprises LLC (8) |
| 4.16 | | Consent of Sproule Associates Limited dated February 16, 2012 (9) |
| 4.17 | | Evaluation of P&NG Reserves of Eagleford Energy Inc., at August 31, 2011 (11) |
| 4.18 | | Amended Stock Option Plan, February 24, 2012 (8) |
| 4.19 | | By-Law No. 1, February 24, 2012 (8) |
| 4.20 | | Articles of Amendment, effective March 16, 2012 (10) |
| 4.21 | | 2nd Amendment dated June 30, 2012 to Secured Promissory Note between Eagleford Energy Inc. and Benchmark Enterprises LLC (12) |
| 4.22 | | Evaluation of P&NG Reserves of Eagleford Energy Inc., at August 31, 2012 (12) |
| 4.23 | | Consent of Sproule Associates Limited dated (12) |
| 4.24 | | Financial Advisory Agreement between Eagleford Energy Inc. and The PrinceRidge Group LLC dated June 1, 2012 (12) |
| 4.25 | | Amendment dated April 13, 2012 to Placement Agency Agreement dated March 12, 2012 between Eagleford Energy Inc. and Gottbetter Capital Markets, LLC (12) |
| 4.26 | | Amendment No. 2 dated July 17, 2012 to Placement Agency Agreement dated March 12, 2012 between Eagleford Energy Inc. and Gottbetter Capital Markets, LLC (12) |
| 4.27 | | Amendment No. 3 dated August 14, 2012 to Placement Agency Agreement dated March 12, 2012 between Eagleford Energy Inc. and Gottbetter Capital Markets, LLC (12) |
| 4.28 | | Amendment No. 4 dated August 31, 2012 to Placement Agency Agreement dated March 12, 2012 between Eagleford Energy Inc. and Gottbetter Capital Markets, LLC (12) |
| 4.29 | | 3rd Amendment dated November 23, 2012 to Secured Promissory Note between Eagleford Energy Inc. and Benchmark Enterprises LLC (12) |
| 4.30 | | 4th Amendment dated March 1, 2013 to Secured Promissory Note between Eagleford Energy Inc. and Benchmark Enterprises LLC (13) |
| 4.31 | | Eagleford Energy, Zavala Inc., Certificate of Incorporation dated August 29, 2013 (13) |
| 4.32 | | Rule 14 Agreement among The Matthews Family Mineral Account, LP, Delta Star Holdings, LLC, Dyami Energy, LLC, Eagleford Energy, Inc.,OGR Energy Corporation, OGR 2000 Ltd., and Texas Onshore Energy, Inc. (13) |
| 4.33 | | Termination of Financial Advisory Agreement between Eagleford Energy Inc. and The PrinceRidge Group LLC dated September 5, 2013 (13) |
| 4.34 | | Joint Development Agreement between Eagleford Energy Inc., Eagleford Energy, Zavala Inc., and Stratex Oil and Gas Holdings, Inc. (13) |
| | | |
| 8.1 | | Subsidiaries of Eagleford Energy Inc. (13) |
| 12.1/12.2 | | Section 302 Certification of Chief Executive and Financial Officer (13) |
| 13.1/13.2 | | Section 906 Certification of Chief Executive and Financial Officer (13) |
| Reference # | | Incorporated by Reference |
| (1) | | Previously filed on April 29, 2009 by Registrant as part of Registration Statement on Form 20-F (SEC File No. 0-53646) |
| (2) | | Previously Filed by Registrant as part of Amendment #2 to Registration Statement on Form 20F/A on July 14, 2009 |
| (3) | | Previously Filed by Registrant on Form 6 K on December 1, 2009 |
| (4) | | Previously filed by Registrant on Form 20F/A on March 12, 2010 |
| (5) | | Previously filed by Registrant on Form 6-K on September 16, 2010 |
| (6) | | Previously Filed by Registrant on Form 20F on February 11, 2011 |
| (7) | | Previously filed by Registrant on Form 6-K on January 27, 2011 |
| (8) | | Previously filed by Registrant on Form 6-K on February 1, 2012 |
| (9) | | Previously filed by Registrant on Form 20F on February 16, 2012 |
| (10) | | Previously filed by Registrant on Form 6-K on March 9, 2012 |
| (11) | | Previously filed by Registrant on Form 20F/A on April 26, 2012 |
| (12) | | Previously filed by Registrant on Form 20F December 31, 2012 |
| (13) | | Filed as an Exhibit hereto |