UNITED STATES
SECURITIES AND EXCHANGE COMMISSION
Washington, D.C. 20549
Form 10-K
(Mark One)
☒ ANNUAL REPORT PURSUANT TO SECTION 13 OR 15(d) OF THE SECURITIES EXCHANGE ACT OF 1934
For the fiscal year ended December 31, 2024
or
☐ TRANSITION REPORT PURSUANT TO SECTION 13 OR 15(d) OF THE SECURITIES EXCHANGE ACT OF 1934
For the transition period from to
Commission File Number: 001-35480
Enphase Energy, Inc.
(Exact name of registrant as specified in its charter)
| | | | | |
| Delaware | 20-4645388 |
(State or other jurisdiction of incorporation or organization) | (I.R.S. Employer Identification No.) |
47281 Bayside Parkway
Fremont, CA 94538
(Address of principal executive offices, including zip code)
(707) 774-7000
(Registrant’s telephone number, including area code)
Securities registered pursuant to Section 12(b) of the Act:
| | | | | | | | |
| Title of each class: | Trading Symbol(s) | Name of each exchange on which registered |
| Common Stock, $0.00001 par value per share | ENPH | Nasdaq Global Market |
Securities registered pursuant to Section 12(g) of the Act: None
Indicate by check mark if the registrant is a well-known seasoned issuer, as defined in Rule 405 of the Securities Act. Yes ☒ No ☐
Indicate by check mark if the registrant is not required to file reports pursuant to Section 13 or Section 15(d) of the Act. Yes ☐ No ☒
Indicate by check mark whether the registrant (1) has filed all reports required to be filed by Section 13 or 15(d) of the Securities Exchange Act of 1934 during the preceding 12 months (or for such shorter period that the registrant was required to file such reports), and (2) has been subject to such filing requirements for the past 90 days. Yes ☒ No ☐
Indicate by check mark whether the registrant has submitted electronically every Interactive Data File required to be submitted pursuant to Rule 405 of Regulation S-T (§232.405 of this chapter) during the preceding 12 months (or for such shorter period that the registrant was required to submit such files). Yes x No ☐
Indicate by check mark whether the registrant is a large accelerated filer, an accelerated filer, a non-accelerated filer, a smaller reporting company, or an emerging growth company. See definitions of “large accelerated filer,” “accelerated filer,” “smaller reporting company,” and “emerging growth company” in Rule 12b-2 of the Exchange Act.
| | | | | | | | | | | |
| Large accelerated filer | ☒ | Accelerated filer | ☐ |
| Non-accelerated filer | ☐ | Smaller reporting company | ☐ |
| | Emerging growth company | ☐ |
If an emerging growth company, indicate by checkmark if the registrant has elected not to use the extended transition period for complying with any new or revised financial accounting standards provided pursuant to Section 13(a) of the Exchange Act. ☐
Indicate by check mark whether the registrant has filed a report on and attestation to its management’s assessment of the effectiveness of its internal control over financial reporting under Section 404(b) of the Sarbanes-Oxley Act (15 U.S.C. 7262(b)) by the registered public accounting firm that prepared or issued its audit report. ☒
If securities are registered pursuant to Section 12(b) of the Act, indicate by check mark whether the financial statements of the registrant included in the filing reflect the correction of an error to previously issued financial statements. ☐
Indicate by check mark whether any of those error corrections are restatements that require a recovery analysis of incentive-based compensation received by any of the registrant’s executive officers during the relevant recovery period pursuant to § 240.10D-1(b). ☐
Indicate by check mark whether the registrant is a shell company (as defined in Rule 12b-2 of the Exchange Act). Yes ☐ No ☒
The aggregate market value of the voting stock held by non-affiliates of the registrant on June 30, 2024, based upon the closing price of $99.71 of the registrant’s common stock as reported on the Nasdaq Global Market, was approximately $9.9 billion.
As of February 3, 2025, there were 132,470,505 shares of the registrant’s common stock outstanding.
DOCUMENTS INCORPORATED BY REFERENCE
Portions of the registrant’s Proxy Statement for the 2025 Annual Meeting of Stockholders to be filed with the Securities and Exchange Commission within 120 days after the end of the registrant’s fiscal year ended December 31, 2024 are incorporated by reference into Part III of this Annual Report on Form 10-K.
Enphase Energy, Inc.
Cautionary Note Regarding Forward-Looking Statements
This Annual Report on Form 10-K contains “forward-looking” statements within the meaning of Section 27A of the Securities Act of 1933, as amended (the “Securities Act”), and Section 21E of the Securities Exchange Act of 1934, as amended (the “Exchange Act”), about us and our industry that involve substantial risks and uncertainties. All statements other than statements of historical facts in this Annual Report on the Form 10-K are forward-looking statements. In some cases, forward-looking statements can be identified by terms such as “anticipates,” “believes,” “could,” “seeks,” “estimates,” “expects,” “intends,” “may,” “plans,” “potential,” “predicts, “projects,” “should,” “will,” “would” or similar expressions and the negatives of those terms. These forward-looking statements are contained principally in Part I, Item 1, Business; Part I, Item 1A, Risk Factors; Part II, Item 7, Management’s Discussion and Analysis of Financial Condition and Results of Operations; and other sections of this Annual Report on Form 10-K. Such statements include, but are not limited to, statements concerning the following:
•our expectations as to our future financial performance, including revenue, cost of revenue, expenses, liquidity, cash requirements and our ability to maintain and grow our profitability;
•the capabilities, performance and competitive advantage of our technology and products and planned changes;
•timing of new product releases, and the anticipated marketing adoption of our current and future products;
•our expectations regarding, and our ability to meet, demand for our products;
•our business strategies, including anticipating trends and operating conditions;
•growth of and development in markets in which we target; and our expansion into new and existing markets;
•our performance in operations, including component supply management and manufacturing timelines;
•our product quality and customer service;
•our expectations regarding the effects on our business and financial performance of compliance with applicable laws and regulations;
•the impact of changes to tax incentives and tax laws;
•our expectations regarding qualification of our products for domestic content credit under U.S. tax laws;
•our expectations about the number of microinverter units that can be produced per quarter;
•our expectations regarding macroeconomic events, geopolitical developments, supply chain disruptions and inflationary pressures and their impact on our business operations, financial performance and the markets in which we, our supplier, manufacturers and installers operate;
•market risks associated with financial instruments and foreign currency exchange rates; and
•the anticipated benefits and risks relating to acquisitions and investments.
Our actual results or experience could differ significantly from the forward-looking statements. Factors that could cause or contribute to these differences include those discussed in Part I, Item 1A, Risk Factors and Part II, Item 7, Management’s Discussion and Analysis of Financial Condition and Results of Operations, as well as those discussed elsewhere in this Annual Report on Form 10-K.
Forward-looking statements are inherently uncertain, and you should not place undue reliance on these statements, which speak only as of the date that they were made. These cautionary statements should be considered in connection with any written or oral forward-looking statements that we may issue in the future. We do not undertake any obligation to release publicly any revisions to these forward-looking statements after completion of the filing of this Annual Report on Form 10-K to reflect later events or circumstances or to reflect the occurrence of unanticipated events. The forward-looking statements in this Annual Report on Form 10-K are intended to be subject to protection afforded by the safe harbor for forward-looking statements contained in the Private Securities Litigation Reform Act of 1995.
In this Annual Report on Form 10-K, unless otherwise indicated or the context otherwise requires, “Enphase Energy,” “Enphase,” “the Company,” “we,” “us,” and “our” refer to Enphase Energy, Inc., a Delaware corporation, and its subsidiaries.
Enphase Energy, Inc. | 2024 Form 10-K | 4
Risk Factors Summary
Investing in our securities involves a high degree of risk. The following is a summary of the principal factors that make an investment in our securities speculative or risky, as more fully described below in the section titled “Risk Factors.” This summary should be read in conjunction with the “Risk Factors” section and should not be relied upon as an exhaustive summary of the material risks facing our business. In addition to this summary, you should consider the information set forth in the “Risk Factors” section and the other information contained in this Annual Report on Form 10-K before investing in our securities:
Risk Related to our Business, Operations and Our Industry
•The reduction, elimination or expiration of government subsidies and economic incentives for on-grid solar electricity applications could reduce demand for solar photovoltaic systems and harm our business.
•Unfavorable macroeconomic and market conditions may adversely affect our industry, business and financial results.
•If demand for solar energy solutions does not grow or grows at a slower rate than we anticipate, our business will suffer.
•The solar industry is highly competitive, and we expect to face increased competition as new and existing competitors introduce products or develop alternative technologies.
•Our recent and planned expansion into existing and new markets could subject us to additional business, financial and competitive risks.
•We may fail to capture customers as we design and develop new products, and update existing products.
•We depend upon a small number of outside contract manufacturers, and our business and operations could be disrupted if we encounter problems with these contract manufacturers.
•We rely primarily on distributors, installers and providers of solar financing to assist in selling our products to customers, and the failure of these customers to perform at the expected level, or at all, would have an adverse effect on our business, financial condition and results of our operations.
•We depend on limited-source suppliers for key components and products. If we are unable to source these components and products on a timely basis, we will not be able to deliver our products to our customers.
•If we or our contract manufacturers are unable to obtain raw materials in a timely manner or if the price of raw materials increases significantly, production time and product costs could increase, which may adversely affect our business.
•Manufacturing problems could result in delays in product shipments, which would adversely affect our revenue, competitive position and reputation.
•Challenges relating to supply chain constraints, including with respect to raw materials, semiconductors and integrated circuits, could adversely impact our revenue, gross margins and results of operations.
•The loss of, or events affecting, one of our major customers could reduce our sales and have an adverse effect on our business, financial condition and results of operations.
•If our products contain manufacturing or software defects, our business and financial results could be harmed.
•If we fail to retain our key personnel or if we fail to attract additional qualified personnel, we may not be able to achieve our anticipated level of growth and our business could suffer.
•Restructuring activities could disrupt our business and adversely affect our results of operations.
Enphase Energy, Inc. | 2024 Form 10-K | 5
Risk Related to our Intellectual Property and Technology
•We are dependent on information technology systems, infrastructure and data. We or third parties upon which we rely could be subject to breaches of our information technology systems caused by system security risks, failure of our data protection, cyber-attacks and erroneous or non-malicious actions or failures to act by our employees or others with authorized access to our networks, which could cause significant reputational, legal and financial damages.
•The software we use in providing system configuration recommendations or potential energy savings estimates to customers relies in part on third-party information that may not be accurate or up-to-date; this may therefore generate inaccurate recommendations or estimates, resulting in a loss of reputation and customer confidence.
•We are subject to stringent and evolving data privacy and security laws, contractual obligations, information security policies and other obligations governing the use, processing and transfer of personal information and any unauthorized access to, or disclosure or theft of personal information we gather, store or use could harm our reputation and subject us to claims or litigation.
•If we fail to protect, or incur significant costs in enforcing, our intellectual property and other proprietary rights, our business and results of operations could be materially harmed.
•We may be subject to disruptions or failures in information technology systems and network infrastructures that could have a material adverse effect on our business and financial condition.
•Third parties may assert that we are infringing upon their intellectual property rights, which could divert management’s attention, cause us to incur significant costs, and prevent us from selling or using the technology to which such rights relate.
Risk Related to Legal Proceedings and Regulations
•Changes in current laws or regulations or the imposition of new laws or regulations, or new interpretations thereof, in the solar energy sector, by federal or state agencies in the United States or foreign jurisdictions could impair our ability to compete, and could materially harm our business, financial condition and results of operations.
•Changes in the United States trade environment, including the recent imposition of import tariffs, could adversely affect the amount or timing of our revenue, results of operations or cash flows.
•Our significant international operations subject us to additional risks that could adversely affect our business, results of operations and financial condition.
Risk Related to our Financial Condition and Liquidity
•Our gross profit may fluctuate over time, which could impair our ability to achieve or maintain profitability.
•We are under continuous pressure to reduce the prices of our products, which has adversely affected, and may continue to adversely affect, our gross margins.
•If we do not forecast demand for our products accurately, we may experience product shortages, delays in product shipment or excess product inventory, any of which will adversely affect our business and financial condition.
•A drop in the retail price of electricity derived from the utility grid or from alternative energy sources, or a change in utility pricing structures, may harm our business, financial condition and results of operations.
Risk Related to our Acquisition Activity
•As part of growing our business, we have made and expect to continue to make acquisitions. If we fail to successfully select, execute or integrate our acquisitions, then our business and operating results could be harmed.
Risk Related to our Debt and Equity Securities
•Our financial results may vary significantly from quarter to quarter due to a number of factors.
•Conversion of our Convertible Notes may dilute the ownership interest of existing stockholders or may adversely affect our financial condition and operating results.
Enphase Energy, Inc. | 2024 Form 10-K | 6
PART I
Item 1. Business
Our Company
We are a global energy technology company originally founded in March 2006. We deliver smart, easy-to-use solutions that manage solar generation, storage and communication on one platform. Our intelligent microinverters work with virtually every solar panel made, and when paired with our smart technology, result in one of the industry’s best-performing clean energy systems.
For the first time in the evolution of our centuries-old grid, people can get paid for the clean energy they produce and share with their communities, helping to build a new energy future that harnesses the sun. This clean, free, abundant source of energy can power our lives and ultimately help greatly reduce our dependence on fossil fuels. As of December 31, 2024, we have shipped approximately 80.0 million microinverters, and approximately 4.7 million Enphase residential and commercial systems have been deployed in more than 160 countries.
We design, develop, manufacture and sell home energy solutions that manage energy generation, energy storage, and control and communications on one intelligent platform. We have revolutionized the solar industry by bringing a systems approach to solar technology and by pioneering a semiconductor-based microinverter that converts energy at the individual solar module level and, combined with our proprietary networking and software technologies, provides advanced energy monitoring and control. This is vastly different than a string inverter system using string modules, whether with or without an optimizer, which only converts the energy of the entire array of solar modules from a single high voltage electrical unit and lacks intelligence about the energy producing capacity of the solar array.
The Enphase® Energy System brings a high technology, networked approach to solar generation plus energy storage, by leveraging our design expertise across power electronics, semiconductors and cloud-based software technologies. Our integrated approach to energy solutions maximizes a home’s energy potential while providing advanced monitoring and remote maintenance capabilities. The Enphase Energy System uses a single technology platform for seamless management of the whole solution, including IQ® Microinverters, IQ® Batteries, IQ® EV Chargers, IQ® Combiner (with embedded IQ® Gateway), and other hardware. Installers use the Enphase® Installer App to rapidly commission system components, and system owners may use the Enlighten cloud-based monitoring services provided through Enphase® App to monitor their energy production, consumption, and storage. We have a built-in system redundancy in both photovoltaic (“PV”) generation and energy storage, eliminating the risk that comes with a single-point of failure. Further, the nature of our cloud-based, monitored system allows for remote firmware and software updates, that allows cost-effective remote maintenance and ongoing utility compliance.
We have transitioned from solar only systems to complete energy management solutions, which consist of solar, batteries, load control, electrical vehicle (“EV”) charging, compatibility with third-party generators, and grid services. This transition has contributed to the rising global interest in the full electrification of homes and businesses through renewable sources of energy.
Our Strategy
Our objective is to build best-in-class home energy systems and deliver them to homeowners through our installer and distribution partners, enabled by a comprehensive digital platform. Key elements of our strategy include:
•Best-in-class customer experience. Our value proposition is to deliver products that are productive, reliable, smart, simple and safe, with superior customer service, to enable homeowners’ storage and energy independence. On the service front, our installer, distributor and module partners are our first line of association with our ultimate customer, the homeowner and business user. Our goals are to partner better with these service providers so that we can provide exceptional, high quality service to homeowners who have installed our products. We are convinced that continued reinforcement of customer experience improvements by providing 24x7 support can be a competitive advantage for us.
Enphase Energy, Inc. | 2024 Form 10-K | 7
•Grow market share worldwide. We intend to capitalize on our market leadership in the microinverter category and our momentum with installers and homeowners to expand our market share position in our core markets. In addition, we hope to further increase our market share in the Europe, Asia Pacific and Latin America regions. Further, we intend to continue our expansion into new markets, including emerging markets, with new and existing products and local go-to-market capabilities.
•Expand our product offerings. We distinguish ourselves from other inverter companies with our systems-based and high technology approach, as we continue to invest in research and development to develop all components of our home energy management systems and remain committed to providing our customers and partners with best-in-class power electronics, storage solutions, communications and load control, all managed by a cloud-based home energy management system.
•Increase power and efficiency and reduce cost per watt. Our engineering team is focused on continuing to increase average power conversion efficiency and alternating current (“AC”) output power in order to pair with higher rated direct current (“DC”) modules while reducing costs per watt.
•Increase storage energy density and reduce installation time and cost per kWh. Our engineering team is focused on increasing the energy density of our battery capacity, quality and reducing installation time and cost per kilowatt hour (“kWh”) to make solar-plus-storage resilient, sustainable and affordable for the masses.
•Focus on the homeowner, distributor and installer partners. We are focused on making it easier for our distributors, installers and customers to do business and generating revenue through digitalization of the business-to-business and business-to-customer process of the distributor, installer and customer journey. Our key focus is to expand our digital presence through enhancing our array of tools on our digital platform to keep us continually connected with our installers and homeowners, as well as increasing the use of the online store significantly.
Products
The Enphase Energy System, powered by IQ Microinverters, IQ Batteries and other products and services, is an integrated solar, storage and energy management offering that enables self-consumption and delivers our core value proposition of yielding more energy, simplifying design and installation, and improving system uptime and reliability.
IQ Microinverters. We ship IQ8™ series microinverters into 57 countries worldwide. We are also shipping IQ8 Microinverters with peak output power of 480 watts (“W”) AC for the small-commercial market in North America, and grid-tied applications in South Africa, Mexico, Brazil, India, Thailand, the Philippines, France, Spain, Columbia, Panama, Costa Rica, Vietnam, Malaysia and 13 Caribbean countries. The new IQ8 Microinverters are designed to maximize energy production and can manage a continuous DC current of 14 amperes, supporting higher powered solar modules through increased energy harvesting.
Our new IQ8 Microinverter, the IQ8P-3P for the small commercial solar market in North America, enables a peak output power of up to 480 W, supporting small three-phase commercial applications and newer, high-powered solar panels.
We now ship the IQ8HC™ Microinverters, IQ8X™ Microinverters, IQ8P-3P Commercial Microinverters and IQ® Battery 5Ps supplied from our contract manufacturing facilities in the United States with higher domestic content than previous models that, when paired with other U.S.-made solar equipment, are expected to help certain solar projects qualify for the domestic content bonus tax credit under the Inflation Reduction Act of 2022 (“IRA”).
The Enphase IQ8 microinverter-based system has been certified by UL, a global safety science leader, to a UL certification that meets the new North American safety and grid interconnection standards for connecting solar inverters, energy storage systems and distributed energy resources to the grid in compliance with IEEE 1547-2018 and IEEE 1547-1 2020.
IQ Batteries. Our Enphase IQ Battery storage systems, with usable and scalable capacity of 10.1 kWh and 3.4 kWh for the United States, and 10.5 kWh and 3.5 kWh for Europe and other international countries, are based on our Ensemble OS™ software, which powers our grid-independent microinverter-based storage systems. We currently ship our Enphase IQ Battery storage systems to customers in the United States, Puerto Rico, Canada, Mexico, Australia, New Zealand, Belgium, Germany, the United Kingdom, Italy, Austria, France, the Netherlands, Luxembourg, Finland, Switzerland, Spain, Portugal, Sweden, Denmark and Greece. Enphase IQ Batteries in
Enphase Energy, Inc. | 2024 Form 10-K | 8
Europe can be installed with both single-phase and three-phase third-party solar energy inverters, enabling homeowners to upgrade their existing home solar systems with a residential battery storage solution that reduces costs while providing increased self-reliance.
Our latest Enphase Energy System features the IQ Battery 5P, IQ8 Microinverters, IQ™ System Controller 3/3G and IQ™ Combiner 5/5G, is designed to offer an improved experience for homeowners and installers as a result of more power, resilient wired communication, and an improved commissioning experience. The IQ Battery 5P is modular by design and is designed to deliver 3.84 kW continuous power and 7.68 kW peak power, which allows homeowners to start heavy loads like air conditioners easily during power outages. The IQ Battery 5P is available for customers in Australia, New Zealand, India, the United States, Puerto Rico, Mexico, Canada, the United Kingdom, Italy, France, Germany, Austria, Switzerland, the Netherlands, Luxembourg, Belgium and Romania.
The IQ™ Gateway is embedded in the IQ Combiner, which can be connected to the internet to enable over-the-air updates and connect to the Enphase® App monitoring platform. The IQ Gateway and IQ® Microinverters enable industry-leading monitoring capabilities at the solar module level, supporting critical insights for ongoing system operations and maintenance for homeowners and small businesses.
Our IQ® Load Controller for our Enphase IQ Battery storage systems allow homeowners to decide what gets power in their home in the event of a grid outage, with the ability to choose up to four loads. These loads will be on when the grid is present and shed automatically in the event of a grid failure. This product makes installation simpler and saves time for installers.
In January 2025, we introduced IQ® Battery 5P with FlexPhase, for customers in Germany, Austria and Switzerland. The IQ Battery 5P with FlexPhase is an all-in-one AC-coupled system that delivers reliable backup power and supports both single-phase and three-phase applications.
EV Chargers. The increasing penetration of EVs has implications for home energy management, as households not only consume significantly more power with an EV, but also have a large battery that can be used for both backup and grid service.
Our EV Chargers are compatible with most EVs sold in North America. Customers are able to purchase Enphase-branded EV chargers, which support both J1772 and North American Charging Standard (“NACS”) connectors with a charging power range between 32 amperes and 64 amperes.
Our smart IQ® EV Chargers sold in the United States and Canada are Wi-Fi-equipped and include smart control and monitoring capabilities. The IQ EV Charger is designed to seamlessly integrate into our solar and battery system to help homeowners maximize electricity cost savings by charging directly from solar energy.
The CS-100™ EV Charger, our most powerful EV charger to date providing up to 19.2 kW of continuous power, is available for customers with commercial fleet EVs in the United States.
In January 2025, we introduced our newest EV charger, the IQ® EV Charger 2, in 14 European markets. The IQ EV Charger 2 is a next-generation smart charger designed to work seamlessly with our solar and battery systems or as a powerful standalone charger.
Our team is developing a bi-directional EV charger that is designed to enable vehicle-to-home and vehicle-to-grid capabilities as part of the Enphase Energy System.
Home Energy Management. We have introduced the IQ® Energy Router™ family of devices in Germany and Austria to enable the integration of select third-party EV chargers and heat pumps into Enphase solar and battery systems. The IQ Energy Router family of devices monitors and controls energy usage between an Enphase solar and battery system, EV chargers and heat pumps. The devices work in coordination with the Enphase Energy System and deploy artificial intelligence-based solar production forecasting, consumption forecasting, and an optimization engine to maximize self-consumption.
IQ® PowerPack 1500. In November 2024, we announced the availability of our new portable energy system, the IQ PowerPack 1500 in the United States and Canada. This product is a 1,500 Wh smart, go-anywhere portable energy system that can power most small appliances in the home, at work, or outdoors. It is designed to provide battery backup, helping to ensure essential electronics stay up and running during power outages.
Enphase Energy, Inc. | 2024 Form 10-K | 9
Grid Services. Grid services programs are managed by regional utilities and use energy stored in home batteries to help power communities when it is needed most, like during periods of peak electricity demand. This reduces reliance on costly and polluting power plants for electricity and, in return, provides incentives to homeowners from their own utilities. Incentive programs may serve as a discount on the purchase of an Enphase Energy System with IQ Batteries or as ongoing payments to participating homeowners. We are currently participating in incentive programs across the United States, Canada and Europe.
Solargraf. We are now offering our Solargraf® platform, our cloud-based solar and battery design, proposal software and permitting services for both residential and commercial customers. Solargraf is offered in the United States, Canada, Brazil, Germany, Austria and the Netherlands for residential customers and in select regions for commercial customers.
We also offer a predictive software platform dedicated to simplifying the cleantech service landscape by matching cleantech asset owners to a local and on-demand workforce of service providers. In addition, we offer another software platform designed to provide high quality leads to solar installers, with the objective of increasing lead volumes and conversion rates to help drive down the customer acquisition costs for installers.
Customers and Sales
We currently offer solutions targeting the residential and commercial markets in the United States, Canada, Mexico, Europe, Australia, New Zealand, India, Brazil, the Philippines, Thailand, South Africa, Central America, the Caribbean and certain Asian countries. We sell primarily to solar distributors who combine our products with others, including solar module products and racking systems, and resell to installers in each target region. In addition to our solar distributors, we sell directly to select large installers, original equipment manufacturers (“OEM”) and strategic partners. Our OEM customers include solar module manufacturers who integrate our microinverters with their solar module products and resell to both distributors and installers. Strategic partners include a variety of companies, including industrial equipment suppliers and providers of solar financing solutions. We also sell certain products and services to homeowners, primarily in support of our warranty services and legacy product upgrade programs, via our online store. In the years ended December 31, 2024, 2023 and 2022, one customer accounted for approximately 48%, 40% and 37%, respectively, of our net revenues. Our revenue generated from the United States market has represented 70%, 64% and 76% of our net revenues for the annual periods ended on December 31, 2024, 2023 and 2022, respectively.
Competition
The markets for our products are highly competitive and we compete with central and string inverter manufacturers, storage system manufacturers and new technologies that compete with our business. The principal areas in which we compete with other companies include:
•product performance and features;
•total cost of ownership;
•breadth of product line;
•local sales and distribution capabilities;
•module compatibility and interoperability;
•reliability and duration of product warranty;
•technological expertise;
•brand recognition;
•customer service and support;
•compliance with industry standards and certifications;
•compliance with current and planned local electrical codes;
•integration with storage offerings;
•size and financial stability of operations;
•size of installed base; and
Enphase Energy, Inc. | 2024 Form 10-K | 10
•local manufacturing and product content.
In an installation consisting of a traditional central inverter, the solar PV modules are connected in series strings. In a large installation, there are multiple series strings connected in parallel. The aggregated voltage from each of these strings is then fed into a large central inverter. We believe that traditional string inverters have a number of design and performance challenges limiting innovation and their ability to reduce the cost of solar power systems, including the following:
•Productivity limits. If solar modules are wired using a traditional central inverter—a group or “string” of modules are wired in series, and an entire string’s output is limited by the output of the lowest-performing module. Because of its string design, there is a single point of failure risk with the traditional string inverter approach.
•Reliability issues. Traditional string inverters are the single most common component of solar installations to fail, resulting in system downtime and adversely impacting total energy output. As a result, string inverters typically carry warranties of only 5 to 12 years.
•Complex design and installation requirements. The string inverter-based solar PV installation requires greater effort on the part of the installer, both in terms of design and on-site labor. String inverter installations require string design and calculations for safe and reliable operation, as well as specialized equipment such as DC combiners, conduits and disconnects. In addition, the use of high-voltage DC requires specialized knowledge and training and safety precautions to install string inverter technology.
•Safety issues. String inverter solar PV installations have a wide distribution of high-voltage (600 volts to 1,000 volts) DC wiring. If damaged, DC wires can generate sustained electrical arcs, reaching temperatures of more than 5,000°F. This creates the risk of fire for solar PV installation owners and injury for installers and maintenance personnel.
These challenges of traditional string inverters have a direct impact on the cost and expected return on investment of solar installations to both installers and system owners:
•Installer. Solar PV installers aim for simple installation design, fast installation times and maximum system performance and predictability. The installation of high-voltage DC string inverter technology, however, requires significant preparation, precautionary safety measures, time-consuming string calculations, extensive design expertise and specialized installation equipment, training and knowledge. Together, these factors significantly increase complexity and cost of installation and limit overall productivity for the installer.
•System owner. Solar power system owners aim for high energy production, low cost, high reliability, and low maintenance requirements, as well as reduced fire risks. With traditional string inverters, owners often are unable to optimize the size or shape of their solar PV installations due to string design limitations. As such, they experience performance loss from shading and other obstructions, can face frequent system failures and lack the ability to effectively monitor the performance of their solar PV installation. In addition, string inverter installations operate at high-voltage DC, which bears significant fire risks. Further, due to their large size, string inverter installations can affect architectural aesthetics of the house or commercial building.
Several of our existing and potential competitors are significantly larger than us and may have greater financial, marketing, distribution and customer support resources and may have significantly broader brand recognition, especially in certain markets. In addition, some of our competitors have more resources and experience in developing or acquiring new products and technologies and in creating market awareness for these offerings.
Competitors in the inverter market include, among others, SolarEdge Technologies, Inc. (“SolarEdge”), Huawei Technologies Co. Ltd., (“Huawei”), Tesla, Inc. (“Tesla”), Sungrow Power Supply Co., Ltd., Growatt New Energy Co., Ltd and other companies offering microinverters and/or string inverters with and without solar optimizers. We believe that our microinverter solutions offer significant advantages and competitive differentiation relative to traditional central or string inverter technology, even when supplemented by DC-to-DC optimizers on the roof.
Competitors in the storage market include Tesla, SolarEdge, Huawei, BYD, Franklin Solar Battery and other producers of battery cells and integrated storage systems. Competitors in the EV charger market include Wallbox, ChargePoint Holdings, Inc., Tesla, JuiceBox and EVBox, among others.
Enphase Energy, Inc. | 2024 Form 10-K | 11
Manufacturing, Quality Control and Supply Chain Management
We utilize a sourcing strategy that emphasizes global procurement of materials and product manufacturing in lower cost regions. We outsource the manufacturing of our products to third-party contract manufacturers. Flex Ltd. and affiliates (“Flex”), Salcomp Plc. and affiliates (“Salcomp”), and Sunwoda Electric Co. Ltd. (“Sunwoda”) to assemble and test our IQ microinverters, IQ Battery storage systems, EV chargers and IQ Gateway products. Prices for such services are agreed to by the parties on a quarterly basis, and we are obligated to purchase manufactured products and raw materials that cannot be resold upon the termination of the corresponding agreement. Flex also provides receiving, kitting, storage, transportation, inventory visibility and other value-added logistics services at locations managed by Flex. In addition, we rely on several unaffiliated companies to supply certain components used in the fabrication of our products.
Our relationships with Flex and Salcomp provide us with strategic manufacturing capabilities and flexibility in the United States. We are now shipping IQ Microinverters from our U.S.-based contract manufacturing facilities in South Carolina and Texas, offering several new production lines across the two sites. Moving manufacturing to the United States allows us to take advantage of the benefits of the IRA as well as help us better serve our customers by cutting down delivery times and diversifying our supply chain. During the year ended December 31, 2024, we also began shipping residential and commercial microinverters, and batteries, with higher domestic content from our United States contract manufacturers, which are expected to help certain solar projects qualify for the Domestic Content Bonus Credit.
In the fourth quarter of 2024, we implemented a restructuring plan (the “2024 Restructuring Plan”) to better align our workforce and cost structure with our business needs, strategic priorities and ongoing commitment to profitable growth, while increasing operational efficiencies and reducing operating costs, which included the plan to cease operations at our contract manufacturing location in Mexico in the first half of 2025.
Customer Service
We continue to cultivate an organizational focus on customer satisfaction and are committed to providing a best-in-class customer experience. We maintain high levels of customer engagement through our customer support group, Enphase community, and the Enphase App. We continue to provide 24/7 support for installers and Enphase system owners globally across our phone, online chat and email communications channel. We continue to train our customer service agents with a goal of reducing average customer wait times to under two minutes, and we continue to expand our network of field service technicians in the United States, Europe and Australia to provide direct homeowner assistance. Our Net Promoter Score (commonly referred to as “NPS”) improved to 78% in 2024 from 76% in 2023 as a result of multiple customer service initiatives.
Research and Development
We plan to continue to devote substantial resources to research and development with the objective of developing new products and systems and increasing the value or reducing the cost of existing products and systems. Our research and development roadmap identifies new product features and defines improvement targets for existing products that enhance the benefit of our energy management solutions to our customers and support our growth plans. We measure the effectiveness of our research and development using metrics that include product cost, performance and reliability, homeowner and installer experience, as well as development cost and performance to schedule.
Intellectual Property
We operate in an industry in which innovation, investment in new ideas and protection of our intellectual property rights are critical for success. We protect our technology through a variety of means, including through patent, trademark, copyright and trade secrets laws in the United States and similar laws in other countries, confidentiality agreements and other contractual arrangements. As of December 31, 2024, we have approximately 406 global patents and 255 pending patent applications. Our patents are expiring on an ongoing basis between the present and approximately 2045, but there is not a material portion of our patent portfolio expiring in the near future.
Enphase Energy, Inc. | 2024 Form 10-K | 12
We have licensed certain technologies for application in hardware and software in our products. Such licenses are generally fully-paid, royalty-free licenses. Given the volume and pace of new patents worldwide, it may become necessary in the future to license intellectual property on terms that are yet unknown to us, and that may be less favorable than licenses in the past. In addition, we license open source software from various third parties for use in hardware and software. Such open source software is licensed under open source licenses, and we take efforts to maintain compliance with such licenses.
We continually assess the need for patent protection for those aspects of our technology that we believe provide significant competitive advantages. A majority of our patents relate to DC to AC power conversion, energy storage devices and related energy environments.
With respect to proprietary know-how that is not patentable and processes for which patents are difficult to enforce, we rely on trade secret protection and confidentiality agreements to safeguard our interests. We believe that many elements of our microinverter and storage manufacturing processes involve proprietary know-how, technology or data that are not covered by patents or patent applications, including technical processes, test equipment designs, algorithms and procedures.
We own or have rights to various trademarks and service marks in the United States and in other countries, including Enphase, the Enphase “e”, IQ, and many other marks. We rely on both registration of our marks as well as common law protection where available.
All of our research and development personnel have entered into confidentiality and proprietary information agreements with us. These agreements address intellectual property protection and require our employees to assign to us all of the inventions, designs and technologies they develop during the course of employment with us.
We also require our customers and business partners to enter into confidentiality agreements before we disclose any sensitive aspects of our technology or business plans.
As part of our overall strategy to protect our intellectual property, we may take legal actions to prevent third parties from infringing or misappropriating our intellectual property or from otherwise gaining access to our technology.
Government Regulations
Our business activities are subject to a changing patchwork of laws and regulations that prevail at the federal, state, regional and local levels as well as in foreign jurisdictions. For example, substantially all of our import operations are subject to complex trade and customs laws, regulations and tax requirements such as sanctions orders or tariffs set by governments through mutual agreements or unilateral actions. In addition, countries may from time to time adversely modify or impose additional duties, tariffs or other restrictions on the import or export of our fully manufactured products or the material components needed to make our products. Changes in tax policies or trade regulations, the disallowance of tax deductions on imported merchandise, or the imposition of new tariffs on imported products, could have an adverse effect on our business and results of operations.
We are also subject to other complex foreign and U.S. laws and regulations related to anti-bribery and corruption, antitrust or competition, and data privacy and security, such as the EU General Data Protection Regulation, among others. In addition, our business and operations are currently subject to environmental laws in various jurisdictions around the world, including the Waste Electrical and Electronic Equipment and Restriction of the Use of Certain Hazardous Substances in Electrical and Electronic Equipment regulations adopted by the EU. We are also subject to disclosure and related requirements that apply to the presence of “conflict minerals” in our products or supply chain. We have policies and procedures in place to promote compliance with these laws and regulations. To date, our compliance actions and costs relating to these laws, rules and regulations have not resulted in a material cost or effect on our capital expenditures, earnings or competitive position. Government regulations are subject to change, and accordingly we are unable to assess the possible effect of compliance with future requirements or whether our compliance with existing regulations will materially impact our business in the future.
Enphase Energy, Inc. | 2024 Form 10-K | 13
Government Incentives
U.S. federal, state and local government bodies, as well as non-U.S. government bodies provide supportive policies and incentives to owners, distributors, system integrators and manufacturers of solar energy and battery storage systems to promote the use of these resources in the form of rebates, tax credits, lower VAT rate and other financial incentives, such as system performance payments, payments for renewable energy credits associated with renewable energy generation and exclusion of solar energy systems from property tax assessments. The market for on‑grid rooftop solar applications, where solar power, possibly coupled with battery storage, is used to supplement a customer’s electricity purchased from the utility network or sold to a utility under tariff, often depends in large part on the availability and size of these government-issued subsidies and economic incentives, which help to catalyze customer acceptance of solar energy as an alternative to utility-provisioned power. The modifications to, or disallowance of, government subsidies or economic incentives could have an adverse effect on our business and results of operations. Among other government-established incentives, net energy metering (“NEM”) and related policies have supported the growth of on-grid rooftop solar and storage products, and changes to such policies may significantly reduce demand for electricity from our solar and storage service offerings. NEM tariffs provide customers with compensation for exporting excess solar generation to the electrical grid.
In August 2022, the investment tax credit (“ITC”) was extended and a new advanced manufacturing production tax credit (“AMPTC”) was created, to incentivize clean energy component sourcing and production, including for the production of microinverters. This included a 10% ITC adder for solar system components that are manufactured with a minimum threshold of domestic content. The IRA provides an AMPTC of 11 cents per alternating current watt for microinverters, which has favorably impacted our results of operations in the years ended December 31, 2024 and 2023. The AMPTC for microinverters decreases by 25% each year beginning in 2030 through the end of 2032. Under the IRA, the ITC was also extended until 2032 to allow a qualifying homeowner to deduct 30% of the cost of installing residential solar and battery systems from their U.S. federal income taxes, thereby returning a material portion of the system’s purchase price to homeowners. Under the terms of the IRA’s extension, the ITC for residential solar systems will remain at 30% through the end of 2032, reduce to 26% for 2033, reduce to 22% for 2034, and further reduce to 0% after the end of 2034, unless it is extended before that time. We believe the enactment of the IRA is favorable to our overall business.
In December 2022, the California Public Utilities Commission (“CPUC”) approved a NEM policy, called Net Energy Metering 3.0 (“NEM 3.0”), which went into effect starting April 15, 2023. The new policy substantially reduces the compensation that solar customers can earn by selling excess solar energy to the electric grid. The average hourly export rate in California under NEM 3.0 is approximately $0.05/kWh to $0.08/kWh compared to the prior average of $0.25/kWh to $0.35/kWh under Net Energy Metering 2.0 (“NEM 2.0”). In November 2023, the CPUC also adopted changes to its “Virtual NEM” and “NEM Aggregation” programs that prohibit multi-meter commercial or agricultural property owners from netting solar energy generated at or adjacent to those properties against import charges recorded on the meters at the property, except for residential account holders in a multi-family residential property. Both of these policy changes in California reduced demand for solar PV systems in the years ended December 31, 2024 and 2023 and may continue to do so. However, the reduction in export compensation under NEM 3.0, coupled with rising utility rates, may encourage deployment of battery energy storage with solar PV systems and mitigate some of the demand reductions.
Seasonality
Historically, the majority of our revenue are from the North American and European regions which experience higher sales of our products in the second, third and fourth quarters and have been affected by seasonal customer demand trends, including weather patterns and construction cycles. The first quarter historically has had softer customer demand in our industry, due to these same factors. Although these seasonal factors are common in the solar sector, historical patterns should not be considered a reliable indicator of our future sales activity or performance.
Environment and Climate Change
We have understood the climate change threat from the beginning and have been creating clean energy technologies needed to directly combat it, protect our environment and enable sustainable development. We recognize our ability to do so rests on our capacity to understand, anticipate and successfully navigate various types of climate risk. Our strategy is advancing solutions to meet any number of climate risk mitigation opportunities – solar energy equipment, battery storage, EV charging, smart load management and integration with grid modernization efforts.
Enphase Energy, Inc. | 2024 Form 10-K | 14
We align our risk assessment and climate strategy with the recommendations of the Taskforce for Climate-Related Financial Disclosures (“TCFD”), as all existing and emerging climate risk disclosure regulations are modeled on this framework. We issued our fourth TCFD aligned Environmental, Social and Governance Report in 2024 and plan to follow up with another aligned report in 2025.
We believe that sound corporate governance is critical to helping us achieve our goals, including with respect to designing products that address both energy generation and consumption. We continue to evolve a governance framework that exercises appropriate oversight of responsibilities at all levels throughout the company and manages its affairs consistent with high principles of business ethics and advancing a sustainable future for all.
Human Capital Resources
As of December 31, 2024, we had 2,781 full-time employees. Of the full-time employees, 1,171 were engaged in sales and marketing, 1,077 in research and development, 263 in general and administration, 159 in manufacturing and operations and 111 in solar system configuration design and permitting services. Of these employees, 1,502 were in India, 830 in the United States, 231 in Europe, 119 in New Zealand, 23 in Australia, 23 in China, 21 in Mexico, 16 in Canada, and 16 in Brazil. In November 2024, we announced the 2024 Restructuring Plan, which includes a reduction of our workforce of full-time employees and contractors by approximately 17 percent, which will continue to be implemented until the first half of 2025. Refer to Note 12. “Restructuring and Asset Impairment Charges,” of the notes to consolidated financial statements in Part II, Item 8 of this Annual Report on Form 10-K for additional information. None of our employees are represented by a labor union; however, our employees in France are represented by a collective bargaining agreement. We have not experienced any employment-related work stoppages, and we consider our relations with our employees to be good.
Culture
Supporting our purpose of “Advancing a sustainable future for all,” all employees are expected to uphold the following core values that drive our culture:
•Customer First
•Integrity
•Innovation
•Teamwork
•Quality
These core values are represented by how we work together, how we perform and how we all get rewarded. Values are reinforced in new hire training, culture workshops and everyday interactions.
Talent
Our talent and culture are critical to our success. Our human capital management philosophy and objectives focus on creating a high-performance culture in which our employees deliver, succeed and lead. We achieve our objectives through various employee engagement and talent development efforts. Our employee engagement efforts include our quarterly all-employee town hall meetings, through which we aim to keep our employees well-informed and to increase transparency, and employee engagement events, through which we foster teamwork, networking, and enhance our workplace culture. We have established relationships with top universities worldwide, professional associations and industry groups to build a talent pipeline and established the Enphase Learning Academy to provide employees with regularly scheduled and on demand relevant technical and professional programs.
We are committed to promoting and cultivating an inclusive and diverse culture that welcomes and celebrates everyone without bias. In addition, we look to actively engage within our communities to foster and attain social equity. We became a corporate sponsor of the non-profit Women in Cleantech and Sustainability and our Chief Executive Officer signed the CEO Action for Diversity & Inclusion pledge. This shows our commitment to advancing diversity and inclusion in the workplace.
Compensation Philosophy
Enphase Energy, Inc. | 2024 Form 10-K | 15
Our compensation philosophy creates the framework for our rewards strategy. We have a pay-for-performance culture that ties compensation to the performance of the individual and our company. We provide competitive compensation programs that focus on the following five key elements:
•Pay-for-performance: Reward and recognize leading contributors and high potential employees by paying market competitive total direct compensation, which includes base salary, quarterly bonus or commission, and stock-based compensation
•External market-based research: Pay levels that are competitive with respect to the labor markets and industries in which we compete for talent
•Internal equity: Maintaining internally consistent and non-discriminatory pay and pay practices
•Fiscal responsibility: Providing programs in line with economic conditions and our company’s financial health
•Legal compliance: Ensure the organization is legally compliant with employee compensation laws in all states and countries in which we operate
Health and Wellness
We invest in our employees through high-quality benefits and various health and wellness initiatives. Our benefits packages provide a balance of protection along with the flexibility to meet the individual needs of our employees. Our global flexible workplace policy introduced in response to COVID-19 pandemic allows employees in certain countries and locations to work in a remote or hybrid mode as business necessitates. Our focus remains on the safety of our employees and business partners, and we strive to protect the health and well-being of the communities in which we operate, in part, by providing technology to our employees, end-customers and business partners to help them do their best work while remote. We expect these business operating conditions will substantially remain in effect throughout 2025. We will continue to monitor the global workplace practices, and will make further changes to our business operations as may be permitted by federal, state, or local authorities and that we determine are in the best interests of our employees, end-customers, partners, suppliers and stockholders.
Available Information
We file electronically with the U.S. Securities and Exchange Commission (“SEC”), our Annual Reports on Form 10-K, Quarterly Reports on Form 10-Q, Current Reports on Form 8-K and amendments to those reports filed pursuant to Section 13(a) or 15(d) of the Exchange Act can be accessed on our Investor Relations website at investor.enphase.com. Alternatively, you may access these reports at the SEC’s website at www.sec.gov. We make available, free of charge, copies of these reports as soon as reasonably practicable after filing these reports with the SEC or otherwise furnishing it to the SEC. The contents of our websites are not incorporated by reference into this Annual Report on Form 10-K or in any other report or document we file with the SEC, and any references to our websites are intended to be inactive textual references only.
Item 1A. Risk Factors
We have identified the following risks and uncertainties that may have a material adverse effect on our business, financial condition or results of operations. The risks described below are not the only ones we face. Additional risks not presently known to us or that we currently believe are not material may also significantly impair our business operations. Our business could be harmed by any of these risks. The trading price of our common stock could decline due to any of these risks, and you may lose all or part of your investment. In assessing these risks, you should also refer to the other information contained in this Annual Report on Form 10-K, including our consolidated financial statements and related notes. See also “Forward-Looking Statements” in the forepart of this Annual Report on Form 10-K.
Enphase Energy, Inc. | 2024 Form 10-K | 16
Risks Related to our Business, Operations and Our Industry
The reduction, elimination or expiration of government subsidies and economic incentives for on-grid solar electricity applications could reduce demand for solar PV systems and harm our business.
The market for on-grid applications, where solar power, on a standalone basis or paired with energy storage systems, is used to supplement a customer’s electricity purchased from the utility network or sold to a utility under tariff, depends in large part on the availability and size of government-issued subsidies and economic incentives that vary by geographic market. Because our customers’ sales of solar power are typically into the on-grid market, the reduction, elimination or expiration of government subsidies and economic incentives for on-grid solar electricity may negatively affect the competitiveness of rooftop solar electricity relative to centralized sources of electricity (including from conventional thermal or utility-scale renewable generation) and could harm or halt the growth of the solar electricity industry and our business.
National, state and local government bodies in many countries, including the United States, have provided incentives in the form of feed-in tariffs (“FiTs”), NEM tariffs and related policies, rebates, tax credits, tax incentives and others to system owners, distributors, system integrators and manufacturers of solar PV systems and battery energy storage systems to bolster the cost competitiveness of solar electricity in on-grid applications relative to the cost of utility power, and to reduce dependency on other forms of energy. Many of these government incentives expire, phase out over time, have limited funding allocations, that require renewal by the applicable jurisdictional authority, or are being changed by governments due to changing market circumstances or changes to national, state or local energy policy. Further, if the ITC, AMPTC, or any other existing tax credits or incentives are reduced or eliminated as part of futures changes to the U.S. Internal Revenue Code, or changes to state law or regulatory reform initiatives by subsequent legislative or executive actions, sales of our products in North America and other markets could be adversely affected.
In addition, several European countries, including Germany, Belgium, Italy, the Netherlands and the United Kingdom, have adopted reductions in or ended their NEM or FiT programs. Certain countries have proposed or enacted taxes levied on renewable energy. These and related developments have significantly impacted the solar industry in Europe and may adversely affect the future demand for solar energy solutions in Europe, which could adversely impact our results of operations.
Among other government-established incentives, NEM and related policies have supported the growth of on-grid rooftop solar products, and changes to such policies may reduce demand for electricity from our solar service offerings. NEM is a tariffed utility rate program that permits a consumer to sell the excess solar energy that the consumer’s solar panels produce to the electric utility company at a predetermined price. The most basic type of NEM tariff pays consumers the retail rate for electricity that their solar panels export to the grid, less certain “non-bypassable” fees paid by the consumer. However, certain states have sought to move away from retail rate NEM crediting for compensating excess solar generation. For example, in December 2022, the CPUC adopted a “NEM 3.0” policy, also known as the Net Billing Tariff, that unbundles export compensation from retail rates and instead bases it on a tool called the Avoided Cost Calculator (“ACC”), which estimates the utility costs that are avoided by exports from distributed generation for each hour of the year. The CPUC did seek to ease the transition for the solar market by adopting small “adders” to the hourly ACC export values for the first several years of the tariff. Nevertheless, these ACC-based export compensation values are significantly lower than retail rates for most hours of the year and may therefore increase payback periods, and thereby reduce demand, for solar-only systems. Similarly, in November 2023, the CPUC adopted changes to its “Virtual NEM” and “NEM Aggregation” programs that prohibit multi-meter commercial or agricultural property owners from netting solar energy generated at or adjacent to those properties against import charges recorded on the meters at the property, except for residential account holders in a multi-family residential property. These types of modifications to NEM policies have impacted and could further harm our business, both in California, where we have derived a significant portion of historical revenues in the United States, and in other state and national jurisdictions, if pursued there.
Reductions in, or eliminations or expirations of, governmental incentives (including the ITC) or NEM policies in regions where we focus our sales efforts could result in decreased demand for and lower revenue from solar PV systems, which would adversely affect sales of our products. In addition, our ability to successfully penetrate new geographic markets may depend on new countries adopting and maintaining tax credits, tax incentives, NEM policies, or other programs to promote solar electricity and storage, to the extent such incentives or programs are not currently in place. Furthermore, electric utility companies may establish rate structures or interconnection requirements that could be harmful to the solar industry and adversely affect our sales.
Enphase Energy, Inc. | 2024 Form 10-K | 17
Unfavorable macroeconomic and market conditions may adversely affect our industry, business and financial results.
Our business depends on the overall demand for our solar energy products and on the economic health and willingness of our customers and potential customers to make capital commitments to purchase our products and services. As we have a growing global footprint, we are subject to risk and exposure from the evolving macroeconomic environment, including the effects of increased global inflationary pressures, tariffs and interest rates, fluctuations in foreign currency exchange rates, potential economic slowdowns or recessions, geopolitical pressures and potential regulatory changes through future legislative or executive action, which may cause, and has caused, customers to delay purchasing our products and services or to not purchase at all. In addition, a number of the risks associated with our business, which are disclosed in these risk factors, may increase in likelihood, magnitude or duration, and we may face new risks that we have not yet identified.
Unfavorable macroeconomic and market conditions can result and have previously resulted in sustained periods of decreased demand. Macroeconomic and market conditions could be adversely affected by a variety of political, economic or other factors in the United States and international markets, which could, in turn, adversely affect spending levels of installers and end users and could create volatility or deteriorating conditions in the markets in which we operate. Macroeconomic uncertainty or weakness could result in:
•reduced demand for our products as a result of constraints on capital spending for residential solar energy systems by our customers;
•increased price competition for our products that may adversely affect revenue, gross margin and profitability;
•decreased ability to forecast operating results and make decisions about budgeting, planning and future investments;
•business and financial difficulties faced by our suppliers, distributors or other partners, including impacts to material costs, sales, liquidity levels, ability to continue investing in their businesses, ability to import or export goods, ability to meet development commitments and manufacturing capability; and
•increased overhead and production costs as a percentage of revenue.
Reductions in customer spending in response to unfavorable or uncertain macroeconomic and market conditions, globally or in a particular region where we operate, as well as uncertainty in the regulatory landscape, would adversely affect our business, results of operations and financial condition.
If demand for solar energy solutions does not grow or grows at a slower rate than we anticipate, our business will suffer.
Our IQ Microinverters and IQ Battery storage systems are utilized in solar PV installations, which provide on-site distributed power generation. As a result, our future success depends on continued demand for solar energy solutions and the ability of solar equipment vendors to meet this demand. The solar industry is an evolving industry that has experienced substantial changes over the years, and we cannot be certain that consumers and businesses will adopt solar PV systems as an alternative energy source at levels sufficient to continue to grow our business. Traditional electricity distribution is based on the regulated industry model under which businesses and consumers obtain their electricity from a government regulated utility. For alternative methods of distributed power to succeed, businesses and consumers must adopt new purchasing practices. The viability and continued growth in demand for solar energy solutions and, in turn, our products, may be impacted by many factors outside of our control, including:
•market acceptance of solar PV systems based on our product platform;
•availability and amount of government subsidies and incentives to support the development and deployment of solar energy solutions;
•cost competitiveness, reliability and performance of solar PV systems compared to conventional and non-solar renewable energy sources and products;
•our ability to timely introduce and complete new designs and timely qualify and certify our products;
•the extent to which the electric power industry and broader energy industries are deregulated to permit broader adoption of solar electricity generation;
Enphase Energy, Inc. | 2024 Form 10-K | 18
•the cost and availability of key raw materials and components used in the production of solar PV systems;
•prices of traditional utility-provided energy sources;
•whether installers, system owners and solar financing providers will adopt our solutions;
•the ability of prospective system owners to obtain long-term financing for solar PV installations based on our product platform on acceptable terms or at all;
•levels of investment by end-users of solar energy products, which tend to decrease when economic growth slows; and
•the emergence, continuance or success of, or increased government support for, other alternative energy generation technologies and products.
If demand for solar energy solutions does not grow, demand for our customers’ products from residential homeowners and commercial businesses will decrease, which would have an adverse impact on our ability to increase our revenue and grow our business.
Further, our success depends on continued demand for solar energy solutions and the ability of solar equipment vendors to meet this demand. Supply chain disruptions, increased interest rates and higher inflation, have caused and may continue to cause various negative effects, including an inability to meet the needs of our existing or potential end customers. If demand for solar energy solutions decreases or does not grow, demand for our customers’ products as well as demand for our products will decrease, which would have an adverse impact on our ability to increase our revenue and grow our business.
The solar industry is highly competitive, and we expect to face increased competition as new and existing competitors introduce products or develop alternative technologies, which could negatively impact our business, financial condition and results of operations.
We compete primarily against central and string inverter manufacturers, as well as against new solutions and emerging technologies that directly compete with our business. A number of companies have developed or are developing microinverters and other products that will compete directly with our solutions in the module-level power electronics market. We also compete against manufacturers of energy storage systems and EV chargers for our solutions in these markets.
Competitors in the inverter market include, among others, SolarEdge, Huawei, Tesla, Sungrow Power Supply Co., Ltd., Growatt New Energy Co., Ltd and other companies offering string inverters with and without solar optimizers. Competitors in the storage market include Tesla, SolarEdge, Huawei, BYD, Franklin Solar Battery, and other producers of battery cells and integrated storage systems market. Competitors in the EV charger market include Wallbox, ChargePoint, Tesla, JuiceBox and EVBox, among others.
Several of our existing and potential competitors are significantly larger than we are and may have greater financial, marketing, distribution and customer support resources and may have significantly broader brand recognition, especially in certain markets. In addition, some of our competitors have more resources and experience in developing or acquiring new products and technologies and creating market awareness for these offerings. Further, certain competitors may be able to develop new products more quickly than we can and may be able to develop products that are more reliable or that provide more functionality than ours. In addition, some of our competitors have the financial resources to offer competitive products at aggressive or below-market pricing levels, which could cause us to lose sales or market share or require us to lower prices of our products in order to compete effectively. Suppliers of solar products, particularly solar modules, have experienced eroding prices over the last several years and as a result many have faced margin compression and declining revenues. If we have to reduce our prices, or if we are unable to offset any future reductions in our average selling prices (“ASPs”) by increasing our sales volume, reducing our costs and expenses or introducing new products, our revenue and gross profit would suffer.
Significant developments in alternative technologies, such as advances in other forms of distributed solar PV power generation, storage solutions such as batteries, the widespread use or adoption of fuel cells for residential or commercial properties or improvements in other forms of centralized power production may have a material adverse effect on our business and prospects. Any failure by us to adopt new or enhanced technologies or processes, or to react to changes in existing technologies, could result in product obsolescence, the loss of competitiveness of our products, decreased revenue and a loss of market share to competitors.
Enphase Energy, Inc. | 2024 Form 10-K | 19
We also may face competition from some of our customers or potential customers who evaluate our capabilities against the merits of manufacturing products internally. Other solar module manufacturers could also develop or acquire competing inverter technology or attempt to develop components that directly perform DC-to-AC conversion in the module itself. Due to the fact that such customers may not seek to make a profit directly from the manufacture of these products, they may have the ability to manufacture competitive products at a lower cost than we would charge such customers. As a result, these customers or potential customers may purchase fewer of our systems or sell products that compete with our systems, which would negatively impact our revenue and gross profit.
Our recent and planned expansion into existing and new markets could subject us to additional business, financial and competitive risks.
We currently offer solar energy systems targeting the residential and commercial markets throughout the world, and we intend to expand into other international markets. Our success in new geographic and product markets will depend on a number of factors, such as:
•acceptance of microinverters, batteries and EV chargers in markets in which they have not traditionally been used;
•our ability to compete in new product markets to which we are not accustomed;
•availability of government subsidies and economic incentives for solar energy solutions;
•accurate forecasting and effective management of inventory levels in line with anticipated product demand;
•our ability to manage manufacturing capacity and production;
•willingness of our potential customers to incur a higher upfront capital investment than may be required for competing solutions;
•timely qualification and certification of new products, and ability to comply with local regulations;
•our ability to reduce production costs in order to price our products competitively;
•our customer service capabilities and responsiveness; and
•timely hiring of skilled employees and the efficient execution of our project plan.
Failure to address these new markets successfully, to generate sufficient revenue from these markets to offset associated research and development, marketing, and manufacturing and regulatory costs, or to otherwise effectively anticipate and manage the risks and challenges associated with our potential expansion into new product and geographic markets, could adversely affect our revenue and our ability to achieve or sustain profitability.
We may fail to capture customers as we design and develop new products and update existing products.
We are pursuing opportunities in energy management and energy storage that are highly competitive markets. We have made investments in our infrastructure, increased our operating costs and forgone other business opportunities in order to seek opportunities in these areas and will continue to do so. Any new product is subject to certain risks, including component sourcing, strategic partner selection and execution, customer acceptance, competition, product differentiation, market timing, challenges relating to economies of scale in component sourcing and the ability to attract and retain qualified personnel. There can be no assurance that we will be able to develop and grow these or any other new concepts to a point where they will become profitable or generate positive cash flow. If we fail to execute on our plan with respect to new product introductions, or fail to adequately update our legacy products, we may fail to generate revenue in the quantities or timeline projected, thus, having a materially adverse impact on our operating results and financial stability.
We continue to develop new generations of our IQ Microinverters, IQ Batteries and EV charging products. Developing new products or next generation products is complex and requires significant preparation, precautionary safety measures, time-consuming string calculations, extensive design expertise and specialized installation equipment, training and knowledge. Together, these factors significantly increase complexity and cost of installation and limit overall productivity for the installer. Our installers may not have sufficient resources or expertise necessary to sell our products at the prices, in the volumes and within the time frames that we expect, which could hinder our ability to expand our operations and harm our revenue and operating results.
Enphase Energy, Inc. | 2024 Form 10-K | 20
We depend upon a small number of outside contract manufacturers, and our business and operations could be disrupted if we encounter problems with these contract manufacturers.
We do not have internal manufacturing capabilities and rely upon a small number of contract manufacturers to build our products. In particular, we outsource the manufacturing of our products to third-party contract manufacturers. Flex, Salcomp and Sunwoda assemble and test our IQ Microinverter, IQ Battery storage systems, EV chargers and IQ Gateway products. Prices for such services are agreed to by the parties on a quarterly basis, and we are obligated to purchase manufactured products and raw materials that cannot be resold upon the termination of the related agreement. As of December 31, 2024, our related purchase obligations (including amounts related to component inventory procured by our primary contract manufacturers on our behalf) were approximately $130.9 million. The timing of purchases in future periods could differ materially from our estimates due to fluctuations in demand requirements related to varying sales levels as well as changes in economic conditions.
Flex also provides receiving, kitting, storage, transportation, inventory visibility and other value-added logistics services at locations managed by Flex. In addition, we rely on several unaffiliated companies to supply certain components used in the fabrication of our products.
Our reliance on a small number of contract manufacturers makes us vulnerable to possible capacity constraints and reduced control over component availability, delivery schedules, manufacturing yields and costs. We do not have long-term supply contracts with our contract manufacturing partners. Consequently, these manufacturers are not obligated to supply products to us for any period, in any specified quantity or at any certain price. If any of these suppliers reduce or eliminate the supply of the components to us in the future, our revenue, business, financial condition and results of operations would be adversely impacted.
Further, the revenue that our contract manufacturers generate from our orders may represent a relatively small percentage of their overall revenue. As a result, fulfilling our orders may not be considered a priority in the event of constrained ability to fulfill all of their customer obligations in a timely manner. In addition, some of our products continue to be manufactured outside of the United States. We believe that the location of these facilities outside of the United States increases our supply risk, including the risk of supply interruptions or reductions in manufacturing quality or controls.
If any of our contract manufacturers were unable or unwilling to manufacture our products in required volumes and at high quality levels or renew existing terms under supply agreements, we would have to identify, qualify and select acceptable alternative contract manufacturers, which may not be available to us on favorable terms, if at all. An alternative contract manufacturer may not be available to us when needed or may not be in a position to satisfy our quality or production requirements on commercially reasonable terms. Any significant interruption in manufacturing would require us to reduce our supply of products to our customers, which in turn would reduce our revenue, harm our relationships with our customers and cause us to forgo potential revenue opportunities.
We rely primarily on distributors, installers and providers of solar financing to assist in selling our products to customers, and the failure of these customers to perform at the expected level, or at all, would have an adverse effect on our business, financial condition and results of our operations.
We sell our solutions primarily through distributors, as well as through direct sales to solar equipment installers and developers of third-party solar finance offerings. We do not have exclusive arrangements with these third parties. As a result, many of these third parties, or customers, also use or market and sell products from our competitors, which may reduce our sales. These customers may generally terminate their relationships with us at any time, or with short notice, and further may fail to devote the resources necessary to sell our products at the prices, in the volumes and within the time frames that we expect, or may focus their marketing and sales efforts on products of our competitors. In addition, participants in the solar industry are becoming increasingly focused on vertical integration of the solar financing and installation process, which may lead to an overall reduction in the number of potential parties who may purchase and install our products.
We typically provide our distributors and installers with training and other programs, including accreditations and certifications; however, these programs may not be effective or utilized consistently. Further, newer distributors and installers may require extensive training and may take significant time and resources to achieve productivity. Our distributors and installers may subject us to lawsuits, potential liability and reputational harm if, for example, any were to misrepresent the functionality of our platform or products to customers, fail to perform services to our customers’ expectations, or violate laws or our policies. In addition, our distributors and installers may utilize our platform to develop products and services that could potentially compete with products and services that we offer
Enphase Energy, Inc. | 2024 Form 10-K | 21
currently or in the future. Concerns over competitive matters or intellectual property ownership could constrain the growth and development of these relationships or result in the termination of one or more relationships. If we fail to effectively manage and grow our network of distributors and installers, or properly monitor the quality and efficacy of their service delivery, our ability to sell our products and efficiently provide our services may be impacted, and our operating results may be harmed.
Our future performance depends on our ability to effectively manage our relationships with our existing customers, as well as to attract additional customers that will be able to market and support our products effectively, especially in markets in which we have not previously distributed our products. Termination of agreements with current customers, failure by customers to perform as expected, bankruptcies of our customers or their installer customers, or failure by us to cultivate new customer relationships, could hinder our ability to expand our operations and harm our revenue and operating results.
We depend on limited-source suppliers for key components and products. If we are unable to source these components and products on a timely basis, we will not be able to deliver our products to our customers.
We depend on sole-source and limited-source suppliers for key components of our products, such as our ASICs and lithium-ion batteries. Any of the sole-source and limited-source suppliers upon whom we rely could experience quality and reliability issues, stop producing our components, cease operations, face climate-related disruptions, or be acquired by, or enter into exclusive arrangements with, our competitors. We generally do not have long-term supply agreements with our suppliers, and our purchase volumes may currently be too low for us to be considered a priority customer by most of our suppliers. As a result, most of these suppliers could stop selling to us at commercially reasonable prices, or at all. Any such quality or reliability issue, or interruption or delay may force us to seek similar components or products from alternative sources, which may not be available on commercially reasonable terms, in a timely manner, or at all. Switching suppliers may require that we redesign our products to accommodate new components and may potentially require us to re-qualify our products, which would be costly and time-consuming. Any interruption in the quality or supply of sole-source or limited-source components for our products would adversely affect our ability to meet scheduled product deliveries to our customers and could result in lost revenue or higher expenses and would harm our business.
If we or our contract manufacturers are unable to obtain raw materials in a timely manner or if the price of raw materials increases significantly, production time and product costs could increase, which may adversely affect our business.
The manufacturing and packaging processes used by our contract manufacturers depend on raw materials such as copper, aluminum, silicon and petroleum-based products. From time to time, suppliers may extend lead times, limit supplies or increase prices due to capacity constraints or other factors. Certain of our suppliers have the ability to pass along to us directly or through our contract manufacturers any increases in the price of raw materials. If the prices of these raw materials rise significantly, we may be unable to pass on the increased cost to our customers. While we may from time to time enter into hedging transactions to reduce our exposure to wide fluctuations in the cost of raw materials, the availability and effectiveness of these hedging transactions may be limited. Due to all these factors, our results of operations could be adversely affected if we or our contract manufacturers are unable to obtain adequate supplies of raw materials in a timely manner or at reasonable cost. In addition, from time to time, we or our contract manufacturers may need to reject raw materials that do not meet our specifications, resulting in potential delays or declines in output. Furthermore, problems with our raw materials may give rise to compatibility or performance issues in our products, which could lead to an increase in product warranty claims. Errors or defects may arise from raw materials supplied by third parties that are beyond our detection or control, which could lead to additional product warranty claims that may adversely affect our business and results of operations.
Enphase Energy, Inc. | 2024 Form 10-K | 22
Manufacturing problems could result in delays in product shipments, which would adversely affect our revenue, competitive position and reputation.
We have in the past and may in the future experience delays, disruptions or quality control problems in our manufacturing operations. Our product development, manufacturing and testing processes are complex and require significant technological and production process expertise. Such processes involve a number of precise steps from design to production. Any change in our processes could cause one or more production errors, requiring a temporary suspension or delay in our production line until the errors can be researched, identified and properly addressed and rectified. This may occur particularly as we introduce new products, modify our engineering and production techniques and expand our capacity. In addition, our failure to maintain appropriate quality assurance processes could result in increased product failures, loss of customers, increased production costs and delays. Any of these developments could have a material adverse effect on our business, financial condition and results of operations.
A disruption could also occur in one of our contract manufacturers’ facilities due to any number of reasons, such as equipment failure contaminated materials, process deviations, the effects of climate change and related extreme weather events, or social, geopolitical or health factors, including pandemics or widespread health epidemics such as the COVID-19 pandemic, which could adversely impact manufacturing yields or delay product shipments. As a result, we could incur additional costs that would adversely affect our gross profit, and product shipments to our customers could be delayed beyond the schedules requested, which would negatively affect our revenue, competitive position and reputation.
Additionally, manufacturing yields depend on a number of factors, including the stability and manufacturability of the product design, manufacturing improvements gained over cumulative production volumes, and the quality and consistency of component parts. Capacity constraints, raw materials shortages, logistics issues, labor shortages and changes in customer requirements, manufacturing facilities or processes have historically caused, and may in the future cause, reduced manufacturing yields, negatively impacting the gross profit on, and our production capacity for, those products. Moreover, an increase in the rejection and rework rate of products during the quality control process before, during or after manufacture would result in our experiencing lower yields, gross profit and production capacity. Furthermore, counterfeit parts in our supply chain have been and continue to be a concern, since any counterfeit part can be a lower quality product, which may affect our system reliability.
The risks of these types of manufacturing problems are further increased during the introduction of new product lines, which has from time to time caused, and may in the future cause, temporary suspension of product lines while problems are addressed or corrected. Since our business is substantially dependent on a limited number of product lines, any prolonged or substantial suspension of an individual product line could result in a material adverse effect on our revenue, gross profit and competitive position as well as our distributor and customer relationships.
Challenges relating to supply chain constraints, including with respect to raw materials, semiconductors and integrated circuits, could adversely impact our revenue, gross margins and results of operations.
In times of increased demand, the global supply market for certain raw materials and components, including, in particular, semiconductors, integrated circuits and other electronic components used in some of our products, has experienced significant constraint and disruption. A constrained supply environment could affect component availability, lead times and cost and could increase the likelihood of unexpected cancellations or delays of previously committed supply of key components. To mitigate these risks, we may in the future and have in the past incurred higher costs to secure available inventory, have extended our purchase commitments and placed non-cancellable, advanced orders with or through suppliers, particularly for long lead time components. Our efforts to expand our manufacturing capacity and multi-source and pre-order components may fail to reduce the impact of these adverse supply chain conditions on our business.
Despite any mitigation efforts, constrained supply conditions may adversely impact our revenue and results of operations. At the same time, increased costs associated with supply premiums, labor, expediting fees and freight and logistics may adversely impact our gross margin, profitability and ability to reduce the cost to manufacture our products in a manner consistent with prior periods. In the past, the COVID-19 pandemic and regional conflicts and wars has also contributed to and exacerbated the strain on our supply chain, and there can be no assurance that these types of impacts will not continue, or worsen, in the future. Increased supply chain challenges could also result in increased use of cash, engineering design changes and delays in new product introductions, each of which
Enphase Energy, Inc. | 2024 Form 10-K | 23
could adversely impact our business and financial results. In the event of any persistent supply chain challenges, these challenges would adversely impact our revenue, gross margins and results of operations.
The loss of, or events affecting, one of our major customers could reduce our sales and have an adverse effect on our business, financial condition and results of operations.
We sell primarily to solar distributors who combine our products with others, including solar modules products and racking systems, and resell to installers in each target region. In addition to our solar distributors, we sell directly to select large installers, OEMs and strategic partners.
Our customers’ decisions to purchase our products are influenced by a number of factors outside of our control, including, among others, retail energy prices, the macroeconomic environment, government regulation, incentives and liquidity constraints of solar installers. Although we have agreements with our customers, these agreements generally do not have long-term purchase commitments and are generally terminable by either party after a relatively short notice period. In addition, these customers may decide to no longer use, or to reduce the use of, our products and services for other reasons that may be out of our control. We may also be affected by events impacting our large customers that result in them decreasing their orders with us or impairing their ability to pay for our products, whether due to a decrease in demand from the end markets they serve or the deterioration in the financial condition or bankruptcy of any such customer or the solar installers they resell to, or a significant decrease in their business. During the year ended December 31, 2024, one of our customers filed for bankruptcy under Chapter 11 of the United States Bankruptcy Code. We evaluated the carrying amount of a customer intangible asset related to that customer and determined that the carrying amount of the asset as of December 31, 2024 is recoverable. Additionally, net of allowance for credit losses as of December 31, 2024, included $6.2 million that relates to the one customer. We regularly monitor and evaluate the credit status of our customers and attempt to adjust sales terms as appropriate, which may not be successful. The loss of, or events affecting, any of our large customers has had from time to time, and could in the future have a material adverse effect on our business, financial condition and results of operations.
If our products contain manufacturing or software defects, our business and financial results could be harmed.
We design and make complex products and they may contain undetected or latent errors or defects. Complex hardware and software systems, such as our products, can often contain undetected errors when first introduced or as new versions are released. In the past, we have experienced latent defects only discovered once the microinverters or batteries are deployed in the field. Changes in our supply chain or the failure of our suppliers to otherwise provide our third-party contract manufacturers with components or materials that meet our specifications could introduce defects into our products. As we grow our product volumes, the chance of manufacturing defects could increase. In addition, new product introductions or design changes made for the purpose of cost reduction, performance improvement or improved reliability could introduce new design defects that may impact the performance and life of our products. Any design or manufacturing defects or other failures of our products to perform as expected could cause us to incur significant service and re-engineering costs, divert the attention of our engineering personnel from product development efforts and significantly and adversely affect installer and customer satisfaction, market acceptance and our business reputation. Furthermore, if we are unable to correct manufacturing defects or other failures of products in a manner satisfactory to our customers, our results of operations, customer satisfaction and our business reputation could be adversely affected.
Since some of our products are electricity-producing devices, it is possible that our systems could result in injury, whether by product malfunctions, defects, improper installation, or other causes. We rely on third party installers to install our products according to our installation guides and with local laws. Any significant installation problems could cause us significant harm, including, the occurrence of significant service costs, diverting the attention of our engineering personnel from product development efforts and adversely affecting installer and customer satisfaction, market acceptance and our business reputation, and could subject us to litigation and regulatory costs.
In addition, due to the high energy density of lithium-ion cells, mishandling, inappropriate storage or delivery, non-compliance with safety instructions or field failures can potentially cause a battery cell to rapidly release its stored energy, which may in turn cause a thermal event that can ignite nearby materials, including other lithium-ion cells. As the use of lithium-ion batteries becomes more widespread, these events may occur more often, causing damage to property, injury, lawsuits and adverse publicity, which may adversely affect our reputation, results of operations or financial condition.
Enphase Energy, Inc. | 2024 Form 10-K | 24
If we fail to retain our key personnel or if we fail to attract additional qualified personnel, we may not be able to achieve our anticipated level of growth and our business could suffer.
Our future success and ability to implement our business strategy depends, in part, on our ability to attract and retain key personnel, and on the continued contributions of members of our senior management team and key personnel in areas such as engineering, marketing and sales, any of whom would be difficult to replace. For example, we are highly dependent on our president and chief executive officer, Badrinarayanan Kothandaraman. Mr. Kothandaraman possesses technical knowledge of our business, operations and strategy, and he has substantial experience and contacts that help us implement our goals, strategy and plan. If we lose his services or if he decides to join a competitor or otherwise compete directly or indirectly with us, our business, operating results and financial condition could be materially harmed.
All of our employees, including our senior management, are free to terminate their employment relationships with us at any time. Competition for highly skilled executives and employees in the technology industry is intense, and our competitors have targeted individuals in our organization that have desired skills and experience. If we are not able to continue to attract, train and retain our leadership team and our qualified employees necessary for our business, the progress of our product development programs could be hindered, and we could be materially adversely affected. To help attract, retain and motivate our executives and qualified employees, we use stock-based incentive awards, including restricted stock units. If the value of such stock awards does not appreciate as measured by the performance of the price of our common stock, or if our share-based compensation otherwise ceases to be viewed as a valuable benefit, our ability to attract, retain and motivate our executives and employees could be weakened, which could harm our business and results of operations. Also, if the value of our stock awards increases substantially, this could potentially create substantial personal wealth for our executives and employees and affect our ability to retain our personnel. In addition, any restructuring plans may adversely impact our ability to attract and retain key employees.
Additionally, our ability to attract qualified personnel, including senior management and key technical personnel, is critical to the execution of our growth strategy. Competition for qualified senior management personnel and highly skilled individuals with technical expertise is extremely intense, and we face challenges identifying, hiring and retaining qualified personnel in all areas of our business. In addition, integrating new employees into our team could prove disruptive to our operations, require substantial resources and management attention and ultimately prove unsuccessful. Our failure to attract and retain qualified senior management and other key technical personnel could limit or delay our strategic efforts, which could have a material adverse effect on our business, financial condition, results of operations and prospects.
Restructuring activities could disrupt our business and adversely affect our results of operations.
We have taken steps, including reducing our global workforce, streamlining our operations and internal reorganizations, to increase operational efficiencies and execution, reduce operating costs, and better align our workforce and cost structure with current market condition. We may take similar steps in the future as we seek to realize operating synergies, meet our strategic priorities and profitability objectives, or to reflect more closely changes in our business needs. These changes could be disruptive to our business, including our research and development efforts, and could result in significant expense, including accounting charges for inventory and technology-related write-offs, workforce reduction costs and charges relating to consolidation of excess facilities. Substantial expense or charges resulting from restructuring activities could adversely affect our results of operations and use of cash in those periods in which we undertake such actions.
Any failure by management to properly manage growth could have a material adverse effect on our business, operating results and financial condition.
Our business has experienced periods of rapid growth, and in the future, we may continue to grow our business rapidly. Growth in our business could place significant demands on our management, operations, systems, accounting, internal controls and financial resources, and it may also negatively impact our ability to retain key personnel. If we experience difficulties in any of these or other areas, we may not be able to expand our business successfully or effectively manage our growth. Any failure by management to manage our growth and to respond to changes in our business could have a material adverse effect on our business, financial condition and results of operations.
Enphase Energy, Inc. | 2024 Form 10-K | 25
Our business has been and could continue to be affected by seasonal trends and construction cycles.
We have been and could continue to be subject to industry-specific seasonal fluctuations. Historically, the majority of our revenue are from the North American and European regions, which experience higher sales of our products in the second, third and fourth quarters and have been affected by seasonal customer demand trends, including weather patterns and construction cycles. The first quarter historically has had softer customer demand in our industry, due to these same factors. In the United States, customers will sometimes make purchasing decisions towards the end of the year in order to take advantage of tax credits or for budgetary reasons. In addition, construction levels are typically slower in colder and wetter months. In European countries with FiTs, the construction of solar PV systems may be concentrated during the second half of the calendar year, largely due to the annual reduction of the applicable minimum FiT and the fact that the coldest winter months are January through March. Accordingly, our business and quarterly results of operations could be affected by seasonal fluctuations in the future.
If we are unsuccessful in continuing to expand our direct-to-consumer sales channel by driving purchases through our website, our business and results of operation could be harmed.
Although we primarily sell our solutions and products directly to solar distributors, who resell to installers and integrators, who then in turn integrate our products into complete solar PV installations for residential and commercial system owners, we have recently invested significant resources in our direct-to-consumer sales channel through our website, and our future growth relies, in part, on our ability to attract consumers through this channel. Expanding our direct-to-consumer sales model will require significant expenditures in marketing, software development and infrastructure. Further, the success of direct-to-consumer sales through our website is also subject to general business regulations and laws, as well as federal, state, foreign and provincial regulations and laws specifically governing the internet and e-commerce. These regulations and laws may cover taxation, tariffs, privacy, data protection, pricing, distribution, electronic contracts and other communications, consumer protection and intellectual property. These laws and regulations can be complex, difficult to interpret and may change over time. Continued regulatory limitations and other obstacles interfering with our ability to sell our products directly to consumers could have a negative and material impact our business, prospects, financial condition and results of operations.
Further, the expansion of our direct-to-consumer channel could alienate some of our existing distributors and installers and cause a reduction in sales from these third parties. Our existing distributors and installers may perceive themselves to be at a disadvantage based on the direct-to-consumer sales offered through our website. Due to these and other factors, conflicts in our sales channels could arise and cause our existing distributors and installers to divert resources away from the promotion and sale of our products. If we are unable to successfully continue to drive traffic to, and increase sales through, our website, our business and results of operations could be harmed.
Risks Related to our Intellectual Property and Technology
We are dependent on information technology systems, infrastructure and data. We or third parties upon which we rely could be subject to breaches of our information technology systems caused by system security risks, failure of our data protection, cyber-attacks and erroneous or non-malicious actions or failures to act by our employees or others with authorized access to our networks, which could cause significant reputational, legal and financial damages.
Like many companies, in the ordinary course of business we process, use transfer, generate, disclose, secure, transmit and store a wide variety of confidential and proprietary information including personal information and other sensitive information relating to our business, products and services. The secure maintenance of this information is critical to our business and reputation. Despite our implementation of security measures, our systems are vulnerable to damages from computer viruses, computer denial-of-service attacks, ransomware, supply chain attacks, worms and other malicious software programs or other attacks, covert introduction of malware to computers and networks, unauthorized access, including impersonation of authorized users, social-engineering attacks (including through deep fakes, which may be increasingly more difficult to identify as fake, and phishing attacks), efforts to discover and exploit any security vulnerabilities or securities weaknesses and other similar issues and disruptions. In particular, severe ransomware attacks are becoming increasingly prevalent – particularly for companies like ours that interact with critical infrastructure or manufacturing – and can lead to significant interruptions in our operations, and ability to provide our products or services. Although we make significant efforts to maintain the security, availability, integrity and confidentiality of our information technology and related systems
Enphase Energy, Inc. | 2024 Form 10-K | 26
and have implemented measures to manage the risk of a security breach or disruption, there can be no assurance that our security efforts and measures will be effective, or that attempted security breaches or disruptions would not be successful or damaging.
Remote work has become more common and has increased risks to our information technology and related systems, as more of our employees utilize network connections, computers and devices outside our premises or network, including working at home, while in transit and in public locations.
The techniques used in attempted cyber-attacks and intrusions are sophisticated and constantly evolving and may be difficult to detect for long periods of time. We may be unable to anticipate these techniques or implement adequate preventative measures. Although to date we have not experienced any material breaches of our systems that could have material adverse effect on our business, attacks and intrusions on our systems will continue and we may experience a breach of our systems that compromises sensitive company information or customer data including personal information. In addition, hardware, software, or applications we develop or procure from third parties may contain defects in design or manufacture or other problems that could unexpectedly compromise information security. Intentional or non-malicious breaches by employees or others may pose a risk that sensitive data, including our intellectual property, trade secrets or personal information of our employees, customers or users, or other business partners may be exposed to unauthorized persons or to the public, or that risks of loss or misuse of this information could occur. Furthermore, if we experience a significant data security breach, we could be exposed to reputational damage and significant costs, including to rebuild our systems, modify our products and services, defend litigation, respond to government enforcement actions, pay damages or take other remedial steps, any of which could adversely affect our business, results of operations and financial condition. In addition, we may be required to incur significant costs to protect against damage caused by these disruptions or security breaches in the future. These risks, as well as the number and frequency of cybersecurity events globally, may also be heightened during times of geopolitical tension or instability.
Future or past business transactions (such as acquisitions or integrations) could expose us to additional cybersecurity risks and vulnerabilities, as our systems could be negatively affected by vulnerabilities present in acquired or integrated entities’ systems and technologies.
We may also rely on and share information with contractors and third-party providers to conduct our business and provide our products and services. Although such contractors and third-party providers take steps designed to secure data and prevent security incidents, our ability to monitor these third-parties’ information security practices and potential security incidents is limited, and these third-parties may not have adequate information security measures in place. These third-party providers may experience a significant data security breach, which may also detrimentally affect our business, ability to provide our products and services, results of operations and financial condition.
The cost and operational consequences of implementing further data protection measures could be significant and theft of our intellectual property or proprietary business information could require substantial expenditures to remedy. Further, we cannot be certain that (a) our liability insurance will be sufficient in type or amount to cover us against claims related to security breaches, cyberattacks and other related breaches; (b) such coverage will cover any indemnification claims against us relating to any incident, will continue to be available to us on economically reasonable terms, or at all; and (c) any insurer will not deny coverage as to any future claim. The successful assertion of one or more large claims against us that exceed available insurance coverage, or the occurrence of changes in our insurance policies, including premium increases or the imposition or large deductible or co-insurance requirements, could adversely affect our reputation, business, financial condition and results of operations.
Unauthorized use or disclosure of, or access to, any personal information maintained by us or on our behalf, whether through breach of our systems, breach of the systems of our suppliers or vendors by an unauthorized party, or through employee or contractor error, theft or misuse, or otherwise, could harm our business. If any such unauthorized use or disclosure of, or access to, such personal information was to occur, our operations could be seriously disrupted, and we could be subject to demands, claims and litigation by private parties and investigations, related actions and penalties by regulatory authorities. In addition, we could incur significant costs in notifying affected persons and entities and otherwise complying with the multitude of foreign, federal, state and local laws and regulations relating to the unauthorized access to, or use or disclosure of, personal information. Finally, any perceived or actual unauthorized access to, or use or disclosure of, such information could harm our reputation, substantially impair our ability to attract and retain customers and have an adverse impact on our business, financial condition and results of operations.
Enphase Energy, Inc. | 2024 Form 10-K | 27
The software we use in providing system configuration recommendations or potential energy savings estimates to customers relies in part on third-party information that may not be accurate or up-to-date; this may therefore generate inaccurate recommendations or estimates, resulting in a loss of reputation and customer confidence.
We provide our customers online tools to help them determine proper system sizing and configurations, estimates of bill savings and potential revenues resulting from executing a specific curtailment strategy. These estimates are in turn based on a number of factors such as customer tariff structures, estimated wholesale electricity prices, future economic conditions and estimates of the reduction in electricity usage as a result of a curtailment activity. If the estimates we provide prove to be significantly different from actual payments or savings received by our customers, it may result in the loss of reputation and/or customer confidence.
We are subject to stringent and evolving data privacy and security laws, contractual obligations, information security policies and other obligations governing the use, processing and transfer of personal information, and any unauthorized access to, or disclosure or theft of, personal information we gather, store or use could harm our reputation and subject us to claims or litigation.
We receive, store and use certain personal information of our customers, and the end-users of our customers’ energy systems, including names, addresses, e-mail addresses, energy system details and performance information. We also store and use personal information of our employees. We take steps to protect the security, integrity and confidentiality of the personal information we collect, store and transmit, but there is no guarantee that inadvertent or unauthorized use or disclosure will not occur or that third parties will not gain unauthorized access to this information despite our efforts. Because techniques used to obtain unauthorized access or sabotage systems change frequently and generally are not identified until they are launched against a target, we and our suppliers or vendors may be unable to anticipate these techniques or to implement adequate preventative or mitigation measures.
We are subject to a variety of local, state, national and international laws, directives and regulations that apply to the collection, use, retention, protection, disclosure, transfer and other processing of personal data in the different jurisdictions in which we operate, including, for example, comprehensive regulatory systems in the United States, Europe and Brazil. It remains unclear what additional requirements will be codified in future laws, how those laws will be enforced, and how these legal shifts impact our operations and risk. We may be required to modify our data practices and policies, at potentially substantial additional costs and expenses. Complying with these forthcoming and future laws, regulations, amendments to or re-interpretations of existing laws and regulations, and contractual or other obligations relating to privacy, data protection, data transfers, data localization, or information security may require us to make changes to our services to enable us or our customers to meet new legal requirements, incur substantial operational costs, modify our data practices and policies, and restrict our business operations. Additionally, certain privacy and other laws impose obligations to provide notification of security breaches of computer databases that contain personal information to affected individuals, state officers and others. Any actual or perceived failure by us to comply with these laws, regulations or other obligations may lead to significant fines, penalties, regulatory investigations, lawsuits, significant costs for remediation, damage to our reputation, or other liabilities.
If we fail to protect, or incur significant costs in enforcing, our intellectual property and other proprietary rights, our business and results of operations could be materially harmed.
Our success depends to a significant degree on our ability to protect our intellectual property and other proprietary rights. We rely on a combination of patent, trademark, copyright, trade secret and unfair competition laws, as well as confidentiality and license agreements and other contractual provisions, to establish and protect our intellectual property and other proprietary rights. We have applied for patent and trademark registrations in the United States and in other countries, many of which have been issued. We cannot guarantee that any of our pending applications will be approved or that our existing and future intellectual property rights will be sufficiently broad to protect our proprietary technology, and any failure to obtain such approvals or finding that our intellectual property rights are invalid or unenforceable could force us to, among other things, rebrand or re-design our affected products. This includes an inherent risk that our registered or unregistered trademarks or trade-names that we own or use may be challenged, infringed, circumvented, declared generic, lapsed or determined to be infringing on or dilutive of other marks, and that we may not be able to protect our rights, all of which may cause material adverse impact on our marketing abilities. Our patent protection depends on compliance with various required procedures, document submissions, fee payments, and other requirements imposed by national patent offices, and our patent
Enphase Energy, Inc. | 2024 Form 10-K | 28
protection could be reduced or eliminated for non-compliance with these requirements, despite our engagement of reputable law firms and other professionals to help us comply with such requirements. Even where we do comply with such requirements and enjoy the full length of patent protection, patent terms are finite in length – generally 20 years from the earliest U.S. non-provisional priority filing date – which may be inadequate to protect our competitive position on our products. In countries where we have not applied for patent protection or where effective intellectual property protection is not available to the same extent as in the U.S., we may be at greater risk that our proprietary rights will be misappropriated, infringed or otherwise violated.
To protect our unregistered intellectual property, including our trade secrets and know-how, we rely in part on trade secret laws and confidentiality and invention assignment agreements with our employees and independent contractors. We also require other third parties who may have access to our proprietary technologies and information to enter into non-disclosure agreements. Such measures, however, provide only limited protection, and we cannot assure that our confidentiality and non-disclosure agreements will prevent unauthorized disclosure or use of our confidential information, especially after our employees or third parties end their employment or engagement with us, or provide us with an adequate remedy in the event of such disclosure. Furthermore, competitors or other third parties may independently discover our trade secrets, copy or reverse engineer our products or portions thereof, or develop similar technology. If we fail to protect our intellectual property and other proprietary rights, or if such intellectual property and proprietary rights are infringed, misappropriated or otherwise violated, our business, results of operations or financial condition could be materially harmed.
In the future, we may need to take legal action to prevent third parties from infringing upon or misappropriating our intellectual property or from otherwise gaining access to our technology. Protecting and enforcing our intellectual property rights and determining their validity and scope could result in significant litigation costs and require significant time and attention from our technical and management personnel, which could significantly harm our business. In addition, we may not prevail in such proceedings. An adverse outcome of any such proceeding may reduce our competitive advantage or otherwise harm our financial condition and our business.
We may be subject to disruptions or failures in information technology systems and network infrastructures that could have a material adverse effect on our business and financial condition.
We rely on the efficient and uninterrupted operation of complex information technology systems and network infrastructures to operate our business. In addition, our cloud-based monitoring service, which our installers and end-user customers use to track and monitor the performance of their energy systems, is dependent on cloud-based hosting services, along with the availability of internet or cellular data services at end-user premises. Despite testing by us, real or perceived errors, failures or bugs in our customer solutions, software or technology or the technology or software we license from third parties, including open source software, may not be found until our customers use our products. Real or perceived errors, failures or bugs in our products could result in negative publicity, loss of or delay in market acceptance of our products, harm to our brand, weakening of our competitive position or claims by customers for losses sustained by them. A disruption, infiltration or failure of our information technology systems, third-party cloud hosting platforms or end-user data services as a result of software or hardware malfunctions, system implementations or upgrades, computer viruses, cyber-attacks, third-party security breaches, employee/human error, theft or misuse, malfeasance, power disruptions, natural disasters or accidents could cause breaches of data security, failure of our service, loss of intellectual property and critical data and the release and misappropriation of sensitive competitive information and partner, customer and employee personal data. We have been and may in the future be subject to fraud attempts from outside parties through our electronic systems (such as “phishing” e-mail communications to our finance, technical or other personnel), which could put us at risk for harm from fraud, theft or other loss if our internal controls do not operate as intended. Any such future events could further harm our competitive position, result in a loss of customer confidence, cause us to incur significant costs to remedy any damages and ultimately materially adversely affect our business and financial condition.
Enphase Energy, Inc. | 2024 Form 10-K | 29
Third parties may assert that we are infringing upon their intellectual property rights, which could divert management’s attention, cause us to incur significant costs, and prevent us from selling or using the technology to which such rights relate.
Our competitors and other third parties hold numerous patents related to technology used in our industry, and claims of patent or other intellectual property right infringement or violation have been litigated against our competitors. We may also be subject to such claims and litigation. Regardless of their merit, responding to such claims can be time consuming, divert management’s attention and resources, and may cause us to incur significant expenses. While we believe that our products and technology do not infringe upon any intellectual property rights of third parties, we cannot be certain that we would be successful in defending against any such claims. Furthermore, patent applications in the United States and most other countries are confidential for a period of time before being published, so we cannot be certain that we are not infringing third parties’ patent rights or that we were the first to conceive or protect inventions covered by our patents or patent applications. An adverse outcome with respect to any intellectual property claim could invalidate our proprietary rights and force us to do one or more of the following:
•obtain from a third-party claiming infringement a license to sell or use the relevant technology, which may not be available on reasonable terms, or at all;
•stop manufacturing, selling, incorporating or using products that embody the asserted intellectual property;
•pay substantial monetary damages;
•indemnify our customers under some of our customer contracts; or
•expend significant resources to redesign the products that use the infringing technology, or to develop or acquire non-infringing technology.
Any of these actions could result in a substantial reduction in our revenue and could result in losses over an extended period of time.
Our failure to obtain the right to use necessary third-party intellectual property rights on reasonable terms, or our failure to maintain, and comply with the terms and conditions applicable to these rights, could harm our business and prospects.
We have licensed, and in the future we may choose or be required to license, technology or intellectual property from third parties in connection with the development and marketing of our products. We cannot assure you that such licenses will be available to us on commercially reasonable terms, or at all, and our inability to obtain such licenses could require us to substitute technology of lower quality or of greater cost.
Further, such licenses may be non-exclusive, which could result in our competitors gaining access to the same intellectual property. The licensing or acquisition of third-party intellectual property rights is a competitive area, and other established companies may pursue strategies to license or acquire third-party intellectual property rights that we may consider attractive or necessary. These established companies may have a competitive advantage over us due to their size, capital resources or greater development or commercialization capabilities. In addition, companies that perceive us to be a competitor may be unwilling to assign or license rights to us. We could encounter delays and incur significant costs, in product or service introductions while we attempt to develop alternative products or services, or redesign our products or services, to avoid infringing third-party patents or proprietary rights. Failure to obtain any such licenses or to develop a workaround could prevent us from commercializing products or services, and the prohibition of sale or the threat of the prohibition of sale of any of our products or services could materially affect our business and our ability to gain market acceptance for our products or services.
In addition, we incorporate open source software code in our proprietary software. Use of open source software can lead to greater risks than use of third-party commercial software, since open source licensors generally do not provide warranties or controls with respect to origin, functionality or other features of the software. Further, companies that incorporate open source software into their products have, from time to time, faced claims challenging their use of open source software and compliance with open source license terms. As a result, we could be subject to lawsuits by parties claiming ownership of what we believe to be open source software or claiming noncompliance with open source licensing terms. Some open source software licenses require users who distribute open source software as part of their products to publicly disclose all or part of the source code in their software and make any derivative works of the open source code available for limited fees or at no cost. Although we monitor our use of open source software, open source license terms may be ambiguous, and many of the risks associated with
Enphase Energy, Inc. | 2024 Form 10-K | 30
the use of open source software cannot be eliminated. If we were found to have inappropriately used open source software, we may be required to release our proprietary source code, re-engineer our software, discontinue the sale of certain products in the event re-engineering cannot be accomplished on a timely basis, or take other remedial action. Furthermore, if we are unable to obtain or maintain licenses from third parties or fail to comply with open source licenses, we may be subject to costly third-party claims of intellectual property infringement or ownership of our proprietary source code. There is little legal precedent in this area and any actual or claimed requirement to disclose our proprietary source code or pay damages for breach of contract could harm our business and could help third parties, including our competitors, develop products and services that are similar to or better than ours. Any of the above could harm our business and put us at a competitive disadvantage.
Emerging issues related to the development and use of artificial intelligence could give rise to legal or regulatory action, damage our reputation, or otherwise materially harm of our business.
Our development and use of artificial intelligence (“AI”) technology in our products and operations remains in the early phases. While we aim to develop and use AI responsibly and attempt to mitigate ethical and legal issues presented by its use, we may ultimately be unsuccessful in identifying or resolving issues before they arise. AI technologies are complex and rapidly evolving, and the technologies that we develop or use may ultimately be flawed. Moreover, AI technology is subject to rapidly evolving domestic and international laws and regulations, which could impose significant costs and obligations on us. This includes actual and pending orders and laws by the U.S. federal government, the European Union and other jurisdictions in which we operate. Emerging regulations may also pertain to data privacy, data protection, and the ethical use of AI, as well as clarifying intellectual property considerations. Our use of AI could give rise to legal or regulatory action or increased scrutiny or liability, and may damage our reputation or otherwise materially harm our business.
Risks related to Legal Proceedings and Regulations
Changes in current laws or regulations or the imposition of new laws or regulations, or new interpretations thereof, in the solar energy sector, by federal or state agencies in the United States or foreign jurisdictions could impair our ability to compete and could materially harm our business, financial condition and results of operations.
There has been, and will continue to be, regulatory uncertainty in the clean energy sector generally and the solar energy sector in particular. Changes in current laws or regulations, or the imposition of new laws and regulations in the United States and around the world, could materially and adversely affect our business, financial condition and results of operations. In addition, any changes to the laws and implementing regulations affecting the clean energy sector may create delays in the introduction of new products, prevent our customers from deploying our products or, in some cases, require us to redesign our products.
For example, several states or territories, including California, Hawaii and Queensland, Australia, have either implemented or are considering implementing rules regulating the installation of solar power systems, and we may not be able to adequately evolve our products and services to accommodate such new policies and regulations, which may result in new rates and tariffs. If we cannot comply with these or other new regulations or implement a solution to such noncompliance as they arise, the total market available for our microinverter and battery products in such states, and our business as a result, may be adversely impacted.
Additionally, if the federal or state agencies in the United States takes action to eliminate or reduce laws, regulations and incentives supporting solar energy, such actions may result in a decrease in demand for solar energy in the United States and other geographical markets, it would harm our business, financial condition and results of operations.
Changes in the United States trade environment, including the imposition of import tariffs, could adversely affect the amount or timing of our revenue, results of operations or cash flows.
Escalating trade tensions between the U.S. and China have led to increased tariffs and trade restrictions, including tariffs applicable to certain of our products. For example, in September 2018, the U.S. began assessing 10% tariffs on certain solar products manufactured in China, including our microinverter products and related accessories which are manufactured in China. These tariffs increased to 25% in May 2019, and on January 2020, the United States and China entered into an initial trade deal which preserves the bulk of the tariffs imposed in 2018 and maintains a threat of additional sanctions should China breach the terms of the deal.
It is unknown whether and to what extent additional new tariffs or other new laws or regulations will be adopted that increase the cost of manufacturing in China and/or importing components from China to the United
Enphase Energy, Inc. | 2024 Form 10-K | 31
States. Further, it is unknown what effect that any such new tariffs or retaliatory actions would have on us or our industry and customers. Our lithium-ion phosphate (“LFP”) battery cells for our storage products are supplied solely via our two suppliers in China. Although we are in the process of searching for other suppliers outside of China for future supplies, the expertise and industry for the LFP battery cell is primarily in China and we cannot be certain that we will locate additional qualified suppliers with the right expertise to develop our battery cells outside of China, if at all.
In response to the tensions in U.S.-China trade relations and increased tariffs, we had focused efforts and resources on attaining manufacturers outside of China, primarily in Mexico and India, but more recently have moved a significant portion of our manufacturing to the United States. However, some components necessary for our products still are required to be imported from outside the United States. Existing tariffs and the possibility of additional tariffs in the future have created uncertainty in the solar industry. If the price of solar power systems in the United States increases, as well as the cost of manufacturing our products in the United States, the use of solar power systems could become less economically feasible and could reduce our gross margins or reduce the demand of solar power systems manufactured and sold, which in turn may decrease demand for our products. Additionally, existing or future tariffs may negatively affect key partners, suppliers, and manufacturers. Such outcomes could adversely affect the amount or timing of our revenue, results of operations or cash flows, and continuing uncertainty could cause sales volatility, price fluctuations or supply shortages or cause our customers to advance or delay their purchase of our products. It is difficult to predict what further trade-related actions governments may take, which may include additional or increased tariffs and trade restrictions, and we may be unable to quickly and effectively react to such actions. As additional new tariffs, legislation and/or regulations are implemented, or if existing trade agreements are renegotiated or if China or other affected countries take retaliatory trade actions, such changes could have a material adverse effect on our business, financial condition, results of operations or cash flows.
In addition, while we are not aware of any other current or proposed export or import regulations that would materially restrict our ability to sell our products in countries where we offer our products for sale, any change in export or import regulations or related legislation, shift in approach to the enforcement or scope of existing regulations, or change in the countries, persons or technologies targeted by these regulations, could result in decreased use of our products by, or in our decreased ability to export or sell our products to, existing or potential customers with international operations. In such event, our business and results of operations could be adversely affected.
Our significant international operations subject us to additional risks that could adversely affect our business, results of operations and financial condition.
We have significant international operations, including in emerging markets such as India, and we are continuing to expand our international operations as part of our growth strategy. As of December 31, 2024, approximately 54% of our total employees were located in India, where we primarily conduct our research and development activities, procurement, customer support services, and other general and administrative support functions.
In addition, during 2024, we continued to expand our operations into Europe, although revenue from our operations in Europe declined year over year, approximately 23% of our net revenues derived from Europe for the year ended December 31, 2024, as compared to approximately 31% of our net revenues from the same region for the year ended December 31, 2023. Our current international operations and our ongoing plans to expand our international operations have placed, and will continue to place, a strain on our employees, management systems and other resources.
Our international operations may fail to succeed due to risks inherent in operating businesses internationally, such as:
•adverse social, political and economic conditions, such as inflation and rising interest rates;
•our lack of familiarity with commercial and social norms and customs in countries which may adversely affect our ability to recruit, retain and manage employees in these countries;
•difficulties and costs associated with staffing and managing foreign operations;
•the potential diversion of management’s attention to oversee and direct operations that are geographically distant from our U.S. headquarters;
Enphase Energy, Inc. | 2024 Form 10-K | 32
•compliance with multiple, conflicting and changing governmental laws and regulations, including environmental, employment, tax, privacy and data protection laws and other regulatory requirements;
•legal systems in which our ability to enforce and protect our rights may be different or less effective than in the United States and in which the ultimate result of dispute resolution is more difficult to predict;
•tariffs, export controls and other non-tariff barriers such as quotas and local content rules;
•more limited protection for intellectual property rights in some countries;
•adverse tax consequences, including as a result of transfer pricing adjustments involving our foreign operations;
•effects of adverse changes in currency exchange rates;
•higher incidence of corruption or unethical business practices;
•restrictions on the transfer of funds;
•natural disasters (including as a result of climate change), acts of war or terrorism, and public health emergencies, including the COVID-19 pandemic; and
•uncertain economic, legal and political conditions in Europe, Asia and other regions where we do business, including, for example, as a result of the ongoing military conflicts in Ukraine, the Gaza Strip and nearby areas, and any changes in China-Taiwan and U.S.-China relations.
We also rely on some third-party contract manufacturers outside the United States to manufacture, support and ship our products. Physical, regulatory, technological, market, reputational, and legal risks related to climate change in these regions and globally are increasing in impact and diversity and the magnitude of any short-term or long-term adverse impact on our business or results of operations remains unknown. The physical impacts of climate change, including as a result of certain types of natural disasters occurring more frequently or with more intensity or changing weather patterns, could disrupt our supply chain, result in damage to or closures of our facilities, and could otherwise have an adverse impact on our business, operating results, and financial condition.
The success of our international sales and operations will depend, in large part, on our ability to anticipate and manage these risks effectively. Our failure to manage any of these risks could harm our international operations, reduce our international sales, and could give rise to liabilities, costs or other business difficulties that could adversely affect our operations and financial results.
From time to time we are involved in a number of legal proceedings and, while we cannot predict the outcomes of such proceedings and other contingencies with certainty, some of these outcomes could adversely affect our business and financial condition.
We are, or may become, involved in legal proceedings, government and agency investigations, and consumer, employment, tort and other litigation. We cannot predict with certainty the outcomes of these legal proceedings. For example, in 2024 and early 2025, we and certain of our officers and directors were named as defendants in putative securities class action lawsuits purportedly brought on behalf of holders of our common stock as well as related shareholder derivative lawsuits purportedly filed on our behalf. These lawsuits, which are discussed further in Part I, Item 3 of this Annual Report on Form 10-K, are currently pending. We anticipate that we may be a target for lawsuits in the future, as we have been in the past. Any litigation to which we are a party may result in an onerous or unfavorable judgment that may not be reversed on appeal, or we may decide to settle lawsuits on similarly unfavorable terms. Any such negative outcome could result in payments of substantial monetary damages and accordingly our business could be seriously harmed. The results of lawsuits and claims cannot be predicted with certainty. Regardless of the final outcome, defending these claims, and associated indemnification obligations, are costly and can impose a significant burden on management and employees, and we may receive unfavorable preliminary, interim, or final rulings in the course of litigation, which could seriously harm our business.
Expectations relating to ESG considerations and related reporting obligations may expose the business to potential liabilities, increased costs, and reputational harm.
Many stakeholders including governments, regulators, investors, employees and business partners are increasingly focused on corporate environmental, social and governance (“ESG”) considerations such as greenhouse gas emissions, natural resource management, human rights and human capital management practices.
Enphase Energy, Inc. | 2024 Form 10-K | 33
Any failure, perceived or otherwise, to comply with existing and emerging ESG-related laws and regulations in the United States, Europe and elsewhere, or to meet varied and evolving stakeholder expectations or standards with respect to ESG issues could result in legal and regulatory proceedings and may harm our business, reputation, financial condition and results of operations.
We could be adversely affected by any violations of the FCPA, the U.K. Bribery Act, and other foreign anti-bribery laws.
The U.S. FCPA generally prohibits companies and their intermediaries from making improper payments to non-U.S. government officials for the purpose of obtaining or retaining business. Other countries in which we operate also have anti-bribery laws and regulations, including the EU and Brazil, some of which prohibit improper payments to government and non-government persons and entities, and others (e.g., the FCPA, the U.K. Bribery Act) extend their application to activities outside of their country of origin. Our policies mandate compliance with all applicable anti-bribery laws. We currently operate in, and may further expand into, key parts of the world that have experienced governmental corruption to some degree and, in certain circumstances, strict compliance with anti-bribery laws may conflict with local customs and practices. In addition, due to the level of regulation in our industry, our entry into new jurisdictions through internal growth or acquisitions requires substantial government contact where norms can differ from U.S. standards. Additionally, the costs of complying with these laws (including the costs of investigations, auditing and monitoring) could adversely affect our current or future business. Although, we implement policies and procedures and conduct training designed to facilitate compliance with these anti-bribery laws, thereby mitigating the risk of violations of such laws, our employees, subcontractors, agents and partners may take actions in violation of our policies and anti-bribery laws. Any such violation, even if prohibited by our policies, could subject us to criminal or civil penalties or other sanctions, which could have a material adverse effect on our business, financial condition, cash flows, and reputation.
Risks Related to our Financial Condition and Liquidity
Our gross profit may fluctuate over time, which could impair our ability to achieve or maintain profitability.
Our gross profit has varied in the past and is likely to continue to vary significantly from period to period. Our gross profit may be adversely affected by numerous factors, some of which are beyond our control, including:
•changes in customer, geographic or product mix;
•increased price competition, including the impact of customer and competitor discounts and rebates;
•the impact of inflation and higher interest rates;
•the reduction, elimination or expiration of government subsidies and economic incentives for on-grid solar electricity applications;
•our ability to reduce and control product costs, including our ability to make product cost reductions in a timely manner to offset declines in our product prices;
•warranty costs and reserves, including warranty claim rates, proactive steps to address certain component defects in specific products, and changes resulting from changes in estimates related to the long-term performance of our products, product replacement costs and warranty claim rates, as well as changes in the discount rates;
•loss of cost savings due to changes in component or raw material pricing or charges incurred due to inventory holding periods if product demand is not correctly anticipated;
•introduction of new products;
•ordering patterns from our distributors;
•price reductions on older products to sell remaining inventory;
•component shortages and related expedited shipping costs;
•our ability to reduce production costs, such as through technology innovations, in order to offset price declines in our products over time;
•changes in shipment volume;
•changes in distribution channels;
Enphase Energy, Inc. | 2024 Form 10-K | 34
•excess and obsolete inventory and inventory holding charges;
•expediting costs incurred to meet customer delivery requirements;
•tariffs imposed on components imported to the United States and necessary for the manufacture of our products; and
•fluctuations in foreign currency exchange rates.
Fluctuations in gross profit may adversely affect our ability to manage our business or achieve or maintain profitability.
We are under continuous pressure to reduce the prices of our products, which has adversely affected, and may continue to adversely affect, our gross margins.
The solar power industry has been characterized by declining product prices over time. We have reduced the prices of our products in the past, and we expect to continue to experience pricing pressure for our products in the future, including from our major customers. When seeking to maintain or increase their market share, our competitors may also reduce the prices of their products. In addition, our customers may have the ability or seek to internally develop and manufacture competing products at a lower cost than we would otherwise charge, which would add additional pressure on us to lower our selling prices. If we are unable to offset any future reductions in our ASPs by increasing our sales volume, reducing our costs and expenses or introducing new products, our gross margins will be adversely affected.
Given the general downward pressure on prices for our products driven by competitive pressure and technological change, a principal component of our business strategy is reducing the costs to manufacture our products to remain competitive. If our competitors are able to drive down their manufacturing costs faster than we can or increase the efficiency of their products, or decide to lower prices of their products to try to win market share, our products may become less competitive even when adjusted for efficiency, and we may be forced to sell our products at a price lower than our cost. Further, if raw materials costs and other third-party component costs were to increase, we may not meet our cost reduction targets. If we cannot effectively remain price competitive, this could result in lost market share and lower gross margins.
If we do not forecast demand for our products accurately, we may experience product shortages, delays in product shipment or excess product inventory, any of which will adversely affect our business and financial condition.
We manufacture our products according to our estimates of customer demand. This process requires us to make multiple forecasts and assumptions relating to the demand of our distributors, their end customers and general market conditions. Because we sell most of our products to distributors, who in turn sell to their end customers, we have limited visibility as to end-customer demand. We depend significantly on our distributors to provide us visibility into their end-customer demand, and we use these forecasts to make our own forecasts and planning decisions. If the information from our distributors turns out to be incorrect, then our own forecasts may also be inaccurate. Furthermore, we do not have long-term purchase commitments from our distributors, installers or end customers, and our sales are generally made by purchase orders that may be canceled, changed or deferred without notice to us or penalty. As a result, it is difficult to forecast future customer demand to plan our operations.
If we overestimate demand for our products, or if purchase orders are canceled or shipments are delayed, we may have excess inventory that we cannot sell. We may have to make significant provisions for inventory write-downs based on events that are currently not known, and such provisions or any adjustments to such provisions could be material. We may also become involved in disputes with our suppliers who may claim that we failed to fulfill forecast or minimum purchase requirements. Conversely, if we underestimate demand, we may not have sufficient inventory to meet end-customer demand, and we may lose market share, damage relationships with our distributors and end customers and forgo potential revenue opportunities. Obtaining additional supply in the face of product shortages may be costly or impossible, particularly in the event of supply chain disruptions and our outsourced manufacturing processes, which could prevent us from fulfilling orders in a timely and cost-efficient manner or at all. In addition, if we overestimate our production requirements, our contract manufacturers may purchase excess components and build excess inventory. If our contract manufacturers, at our request, purchase excess components that are unique to our products and are unable to recoup the costs of such excess through resale or return or build excess products, we could be required to pay for these excess parts or products and recognize related inventory write-downs.
Enphase Energy, Inc. | 2024 Form 10-K | 35
In addition, we plan our operating expenses, including research and development expenses, hiring needs and inventory investments, in part on our estimates of customer demand and future revenue. If customer demand or revenue for a particular period is lower than we expect, we may not be able to proportionately reduce our fixed operating expenses for that period, which would harm our operating results for that period.
A drop in the retail price of electricity derived from the utility grid or from alternative energy sources, or a change in utility pricing structures, may harm our business, financial condition and results of operations.
We believe that a system owner’s decision to purchase a solar PV system is strongly influenced by the cost of electricity generated by solar PV installations relative to the retail price of electricity from the utility grid and the cost of other renewable energy sources, including electricity from solar PV installations using central inverters. Decreases in the retail prices of electricity from the utility grid would make it more difficult for all solar PV systems to compete. In particular, growth in unconventional natural gas production and an increase in global liquefied natural gas capacity are expected to keep natural gas prices relatively low for the foreseeable future. Persistent low natural gas prices, lower prices of electricity produced from other energy sources, such as nuclear power or coal-fired plants, or improvements to the utility infrastructure could reduce the retail price of electricity from the utility grid, making the purchase of solar PV systems less economically attractive and depressing sales of our products. In addition, energy conservation technologies and public initiatives to reduce demand for electricity also could cause a fall in the retail price of electricity from the utility grid.
Moreover, technological developments by our competitors in the solar industry, including manufacturers of central inverters and DC-to-DC optimizers, could allow these competitors or their partners to offer electricity at costs lower than those that can be achieved from solar PV installations based on our product platform, which could result in reduced demand for our products. Additionally, as increasing adoption of distributed generation places pressure on traditional utility business models or utility infrastructure, utilities may change their pricing structures to increase the cost of installation or operation of solar distributed generation. Such measures can include grid access fees, costly or lengthy interconnection studies, limitations on distributed generation penetration levels, or other measures. If the cost of electricity generated by solar PV installations incorporating our solutions is high relative to the cost of electricity from other sources, our business, financial condition and results of operations may be harmed.
Our portfolio of marketable securities is subject to market, interest and credit risk that may reduce its value.
As of December 31, 2024, we had approximately $1,253.5 million in debt security investments. These investments consisted primarily of money market funds, U.S. Treasuries, U.S. government securities, commercial paper and debt securities of corporations. We currently do not use derivative financial instruments to adjust our investment portfolio risk or income profile. These investments, as well as any cash deposited in bank accounts, are subject to general credit, liquidity, market and interest rate risks, which may be exacerbated by unusual events, such as the COVID-19 pandemic and the U.S. debt ceiling crisis, which affected various sectors of the financial markets and led to global credit and liquidity issues. If the global credit market experiences volatility or deteriorates, our investment portfolio may be impacted and some or all of our investments may experience other-than-temporary impairment, which could adversely impact our operating results and position.
Risks Related to our Acquisition Activity
We have made and expect to continue to make acquisitions. If we fail to successfully select, execute or integrate our acquisitions, then our business and operating results could be harmed and our stock price could decline.
From time to time, we will undertake acquisitions to add new product lines and technologies, gain new sales channels or enter new sales territories. For example, in 2021, we acquired Sofdesk, the solar design business of DIN, 365 Pronto, and ClipperCreek, Inc., and in 2022, we acquired SolarLeadFactory, LLC and GreenCom Networks AG. Acquisitions involve numerous risks and challenges, including but not limited to the following:
•integrating the companies, assets, systems, products, sales channels and personnel that we acquire;
•higher than anticipated acquisition and integration costs and expenses;
•reliance on third parties to provide transition services for a period of time after closing to ensure an orderly transition of the business;
•growing or maintaining revenues to justify the purchase price and the increased expenses associated with acquisitions;
Enphase Energy, Inc. | 2024 Form 10-K | 36
•entering into territories or markets with which we have limited or no prior experience;
•establishing or maintaining business relationships with customers, vendors and suppliers who may be new to us;
•overcoming the employee, customer, vendor and supplier turnover that may occur as a result of the acquisition;
•disruption of, and demands on, our ongoing business as a result of integration activities including diversion of management's time and attention from running the day to day operations of our business;
•inability to implement uniform standards, disclosure controls and procedures, internal controls over financial reporting and other procedures and policies in a timely manner;
•inability to realize the anticipated benefits of or successfully integrate with our existing business the businesses, products, technologies or personnel that we acquire; and
•potential post-closing disputes.
As part of undertaking an acquisition, we may also significantly revise our capital structure or operational budget, such as issuing common stock that would dilute the ownership percentage of our stockholders, assuming liabilities or debt, utilizing a substantial portion of our cash resources to pay for the acquisition or significantly increasing operating expenses. Our acquisitions have resulted and may in the future result in charges being taken in an individual quarter as well as future periods, which results in variability in our quarterly earnings. In addition, our effective tax rate in any particular quarter may also be impacted by acquisitions. Following the closing of an acquisition, we may also have disputes with the seller regarding contractual requirements and covenants, purchase price adjustments, contingent payments or for indemnifiable losses. Any such disputes may be time consuming and distract management from other aspects of our business. In addition, if we increase the pace or size of acquisitions, we will have to expend significant management time and effort into the transactions and integrations, and we may not have the proper human resources bandwidth to ensure successful integrations and accordingly, our business could be harmed or the benefits of our acquisitions may not be realized.
As part of the terms of an acquisition, we may commit to pay additional contingent consideration if certain revenue or other performance milestones are met. We are required to evaluate the fair value of such commitments at each reporting date and adjust the amount recorded if there are changes to the fair value.
We cannot ensure that we will be successful in selecting, executing and integrating acquisitions. Failure to manage and successfully integrate acquisitions could materially harm our business and operating results. In addition, if stock market analysts or our stockholders do not support or believe in the value of the acquisitions that we choose to undertake, our stock price may decline.
We invest in companies for both strategic and financial reasons but may not realize a return on our investments.
We have made, and continue to seek to make, investments in companies around the world to further our strategic objectives and support our key business initiatives. These investments may include equity or debt instruments of public or private companies and may be non-marketable at the time of our initial investment. We do not restrict the types of companies in which we seek to invest. These companies may range from early-stage companies that are often still defining their strategic direction to more mature companies with established revenue streams and business models. If any company in which we invest fails, we could lose all or part of our investment in that company. If we determine that an other-than-temporary decline in the fair value exists for an equity or debt investment in a public or private company in which we have invested, we will have to write down the investment to its fair value and recognize the related write-down as an investment loss. The performance of any of these investments could result in significant impairment charges and gains (losses) on other equity investments. For example, we recorded an impairment charge of $23.0 million within “Other income, net” on the consolidated statement of operations for the year ended December 31, 2024 as we determined that the carrying values of two investments were not recoverable. We must also analyze accounting and legal issues when making these investments. If we do not structure these investments properly, we may be subject to certain unfavorable accounting impact, such as potential consolidation of financial results.
Furthermore, if the strategic objectives of an investment have been achieved, or if the investment or business diverges from our strategic objectives, we may seek to dispose of the investment. Our non-marketable equity
Enphase Energy, Inc. | 2024 Form 10-K | 37
investments in private companies are not liquid, and we may not be able to dispose of these investments on favorable terms or at all. The occurrence of any of these events could harm our results. Gains or losses from equity securities could vary from expectations depending on gains or losses realized on the sale or exchange of securities and impairment charges related to debt instruments as well as equity and other investments.
An impairment in the carrying value of goodwill or other intangible and long-lived assets could negatively affect our operating results.
We record goodwill from the purchase consideration paid in excess of the fair value of the net assets recorded in connection with a business acquisition. We may not realize all the economic benefit from our business acquisitions, which could result in an impairment of goodwill or intangible assets. As of December 31, 2024, goodwill and intangible assets, net, were approximately $211.6 million and $42.4 million, respectively. We test goodwill and intangible assets, net, for impairment at least annually during the fourth quarter of each fiscal year or between annual tests if an event occurs or circumstances change that would indicate the carrying amount may be impaired. Goodwill is tested at the reporting unit level, which we have determined to be the same as the entity as a whole (entity level). We first perform a qualitative assessment to determine whether it is more likely than not that the fair value of our reporting unit is less than its carrying value. If, after assessing the qualitative factors, we determine that it is more likely than not that the fair value of our reporting unit is less than it’s carrying value, an impairment analysis will be performed. For example, we recorded an impairment charge of $3.5 million and $3.8 million in the years ended December 31, 2024 and 2023, respectively, as management has evaluated that the carrying amount of certain intangible assets were not recoverable.
Qualitative factors include industry and market consideration, overall financial performance, share price trends and market capitalization and company-specific events. We may be required to record a significant charge in our financial statements during the period in which any impairment of our goodwill or amortizable intangible assets is determined, which would negatively impact our operating results.
Risks Related to our Debt and Equity Securities
Our financial results may vary significantly from quarter to quarter due to a number of factors, which may lead to volatility in our stock price.
Our quarterly revenue and results of operations have varied in the past and may continue to vary significantly from quarter to quarter. As a result, the trading price of our common stock has been, and is likely to continue to be, volatile and could be subject to wide fluctuations in response to various factors, some of which are beyond our control. We have been subject to securities class action litigation as a result of our stock price volatility, which could result in substantial cost and diversion of our management’s attention from other business concerns, which could seriously harm our business. In addition, the trading prices of the securities of solar companies in general have been highly volatile, and the volatility in market price and trading volume of securities is often unrelated or disproportionate to the financial performance of the companies issuing the securities.
Other factors affecting the market price of our common stock, some of which are beyond our control, include:
•seasonal and other fluctuations in demand for our products;
•the timing, volume and product mix of sales of our products, which may have different ASPs or profit margins;
•changes in our pricing and sales policies or the pricing and sales policies of our competitors;
•changes in laws, regulations and policies applicable to our business and products, particularly those relating to government incentives for solar energy applications;
•our ability to design, manufacture and deliver products to our customers in a timely and cost-effective manner and that meet customer requirements;
•our ability to manage our relationships with our contract manufacturers, customers and suppliers;
•quality control or yield problems in our manufacturing operations;
•the impact of supply chain disruptions on our business, sales and results of operations;
•the anticipation, announcement or introductions of new or enhanced products by our competitors and ourselves;
Enphase Energy, Inc. | 2024 Form 10-K | 38
•reductions in the retail price of electricity;
•our exposure to the credit risks of our customers, particularly in light of the fact that some of our customers are relatively new entrants to the solar market without long operating or credit histories, and the impact of inflation and higher interest rates;
• the failure by any major customer to pay for orders, whether due to liquidity issues, bankruptcy or otherwise;
•the impact of tariffs on the solar industry in general and our products in particular;
•the amount and timing of operating costs and capital expenditures related to the maintenance and expansion of our business operations;
•the impact of government-sponsored programs on our customers;
•our ability to estimate future warranty obligations due to product failure rates, claim rates or replacement costs;
•our ability to forecast our customer demand and manufacturing requirements, and manage our inventory;
•fluctuations in foreign currency exchange rates;
•announcement of acquisitions or dispositions of our assets or business operations;
•issuances of our common stock or equity-linked securities such as the Convertible Notes;
•changes in our management;
•technical factors in the public trading market for our common stock that may produce price movements that may or may not comport to macro, industry or company-specific fundamentals, including, without limitation, the sentiment of retail investors (including as may be expressed on financial trading and other social media sites), the amount and status of short interest in our securities, rising interest rates, inflation, access to margin debt, trading in options and other derivatives on our common stock and any related hedging or other technical trading factors; and
•general social, geopolitical, environmental or health factors, including pandemics or widespread health epidemics such as the COVID-19 pandemic.
The above factors are difficult to forecast, and these, as well as other factors, could materially and adversely affect our quarterly and annual results of operations. Any failure to adjust spending quickly enough to compensate for a revenue shortfall could magnify the adverse impact of this revenue shortfall on our results of operations. Moreover, our results of operations may not meet our announced guidance or the expectations of research analysts or investors, in which case the price of our common stock could decrease significantly. There can be no assurance that we will be able to successfully address these risks.
Conversion of our Convertible Notes may dilute the ownership interest of existing stockholders or may otherwise depress the price of our common stock, adversely affect our financial condition and operating results.
In March 2021, we issued and sold a total of $575.0 million aggregate principal amount of our 0.0% convertible senior notes due 2028 (the “Notes due 2028”) and $632.5 million aggregate principal amount of our 0.0% convertible senior notes due 2026 (the “Notes due 2026”).
In March 2020, we issued and sold a total of $320.0 million aggregate principal amount of our 0.25% convertible senior notes due 2025 (the “Notes due 2025”).
The conversion of some or all of the Convertible Notes may dilute the ownership interests of existing stockholders. Any sales in the public market of the common stock issuable upon such conversion could adversely affect prevailing market prices of our common stock. In addition, the existence of the Convertible Notes may encourage short selling by market participants because the conversion of the Convertible Notes could be used to satisfy short positions. In addition, the anticipated conversion of the Convertible Notes into shares of our common stock could depress the price of our common stock.
Enphase Energy, Inc. | 2024 Form 10-K | 39
Servicing our debts requires a significant amount of cash, and we may not have sufficient cash flow from our business to pay our debts.
Our ability to make scheduled payments of the principal of, to pay interest on or to refinance our indebtedness, including the Convertible Notes, depends on our future performance, which is subject to economic, financial, competitive and other factors beyond our control. Our business may not continue to generate cash flow from operations in the future sufficient to service our debts, including the Convertible Notes, and make necessary capital expenditures. If we are unable to generate cash flow, we may be required to adopt one or more alternatives, such as selling assets, restructuring debt or obtaining additional equity capital on terms that may be onerous or highly dilutive. Our ability to refinance our indebtedness, including the Convertible Notes, will depend on the capital markets and our financial condition at such time. We may not be able to engage in any of those activities or engage in these activities on desirable terms, which could result in a default on our debt obligations, including our obligations under the Convertible Notes.
We may not have the ability to raise the funds necessary to settle conversions of the Convertible Notes or repurchase the Convertible Note upon a fundamental change, and our future debt may contain limitations on our ability to pay cash upon conversion or repurchase of the Convertible Notes.
Holders of our Convertible Notes will have the right to require us to repurchase their Convertible Notes upon the occurrence of a fundamental change at a fundamental change repurchase price equal to 100% of the principal amount of the Convertible Notes to be repurchased, plus accrued and unpaid interest, if any. Fundamental change is defined in the Convertible Notes Indenture entered into in connection with the financing and consists of events such as an acquisition of a majority of our outstanding common stock, an acquisition of our company or substantially all of our assets, the approval by our stockholders of a plan of liquidation or dissolution, or our common stock no longer being listed on the Nasdaq Global Select Market or the Nasdaq Global Market. Upon conversion of the Convertible Notes, unless we elect to deliver solely shares of our common stock to settle such conversion (other than paying cash in lieu of delivering any fractional share), we will be required to make cash payments in respect of the Convertible Notes being converted. However, we may not have enough available cash or be able to obtain financing at the time we are required to make such repurchase of the Convertible Notes. In addition, our ability to repurchase the Convertible Notes or to pay cash upon conversion of the Convertible Notes may be limited by law, by regulatory authority or by agreements governing our future indebtedness. Our failure to repurchase notes at a time when the repurchase is required by the relevant indenture or to pay any cash payable on future conversions of the notes as required by the relevant indenture would constitute a default under the relevant indenture. A default under the indenture or a fundamental change itself could also lead to a default under agreements governing our future indebtedness. If the repayment of the related indebtedness were to be accelerated after any applicable notice or grace periods, we may not have sufficient funds to repay the indebtedness and repurchase the Convertible Notes or make cash payments upon conversion of the Convertible Notes.
The convertible note hedge and warrant transactions and/or their early termination may affect the value of our common stock.
In connection with the offering of the Notes due 2028, Notes due 2026 and Notes due 2025, we entered into privately negotiated convertible note hedge transactions pursuant to which we have the option to purchase approximately the same number of shares of our common stock initially issuable upon conversion of the Notes due 2028, Notes due 2026 and Notes due 2025, at a price approximately the same as the initial conversion price of the Notes due 2028, Notes due 2026 and Notes due 2025. These transactions are expected to reduce the potential dilution with respect to our common stock upon conversion of the Notes due 2028, Notes due 2026 and Notes due 2025. Separately, we also entered into privately negotiated warrant transactions to acquire the same number of shares of our common stock initially issuable upon conversion of the Notes due 2028, Notes due 2026 and Notes due 2025 (subject to customary anti-dilution adjustments) at an initial strike price of approximately $370.33, $397.91 and $106.94 per share for Notes due 2028, Notes due 2026 and Notes due 2025, respectively. If the market value per share of our common stock, as measured under the warrants, exceeds the strike price of the warrants, the warrants will have a dilutive effect on the ownership interests of existing stockholders and on our earnings per share, unless we elect, subject to certain conditions, to settle the warrants in cash. However, we may not have enough available cash or be able to obtain financing at the time of settlement.
In addition, the existence of the convertible note hedge and warrant transactions may encourage purchasing and selling share of our common stock, or other of our securities and instruments, in open market and/or privately negotiated transactions in order to modify hedge positions. Any of these activities could adversely affect the value of our common stock and the value of the Notes due 2028, Notes due 2026 and Notes due 2025.
Enphase Energy, Inc. | 2024 Form 10-K | 40
Changes in current accounting methods, standards, or regulations applicable to the Convertible Notes due 2028, Notes due 2026 and Notes due 2025 could have a material impact on our reported financial results, future financial results, future cash flows, and/or our stock price.
Under Accounting Standards Codification (“ASC”) 470-20, “Debt with Conversion and Other Options,” an entity must separately account for the host contract and conversion option associated with convertible debt instruments, such as the Notes due 2025, that may be settled entirely or partially in cash upon conversion, in a manner that reflects the issuer’s economic interest cost. We are required to amortize the debt discount as non-cash interest expense over the term of the Notes due 2025, which could adversely affect our reported or future financial results or the trading price of our common stock.
In August 2020, the FASB issued Account Standard Update (“ASU”) 2020-06, “Debt - Debt with Conversion and Other Options (subtopic 470-20),” effective January 1, 2022, the Notes due 2028 and the Notes due 2026 were accounted for as a single liability measured at its amortized cost. Interest expense associated with the Notes due 2028 and the Notes due 2026 recorded in the consolidated statements of operations is close to the coupon rate interest expense. Further, for the diluted earnings per share calculation, treasury stock method is no longer permitted for the Notes due 2028, Notes due 2026 and Notes due 2025. The if-converted method is used for the calculation of the diluted earnings per share calculation, when accounting for the shares issuable upon conversion of the Notes due 2028, Notes due 2026 and Notes due 2025, which will adversely affect our diluted earnings per share. However, if the principal amount of the Notes due 2028, Notes due 2026 and Notes due 2025 being converted is required to be paid in cash and only the excess is permitted to be settled in shares, the if-converted method will produce a similar result as the “treasury stock” method which was applied prior to the adoption of ASU 2020-06.
ASU 2016-15, “Statement of Cash Flows (Topic 230): Classification of Certain Cash Receipts and Cash Payments,” clarifies how certain cash receipts and payments should be classified in the statement of cash flows, including the cash settlement for the Notes due 2025. Upon cash settlement, repayment of the principal amount of the Notes due 2025 will be bifurcated between cash outflows for operating activities for the portion related to accreted interest attributable to debt discounts arising from the difference between the coupon interest rate and the effective interest rate, and financing activities for the remainder. This will require us to classify remainder of the debt discount of $5.6 million for the Notes due 2025 of accreted interest as cash used in operating activities in our consolidated statement of cash flows upon cash settlement, which could adversely affect our future cash flow from operations.
We may not be able to raise additional capital to execute on our current or future business opportunities on favorable terms, if at all, or without dilution to our stockholders.
We believe that our existing cash and cash equivalents and cash flows from our operating activities will be sufficient to meet our anticipated cash needs for at least the next 12 months. However, we may need to raise additional capital or debt financing to execute on our current or future business strategies, including to:
•provide additional cash reserves to support our operations;
•invest in our research and development efforts;
•expand our operations into new product markets and new geographies;
•acquire complementary businesses, products, services or technologies; or
•otherwise pursue our strategic plans and respond to competitive pressures, including adjustments to our business to mitigate the effects of any tariffs that might apply to us or our industry.
We do not know what forms of financing, if any, will be available to us. If financing is not available on acceptable terms, if and when needed, our ability to fund our operations, enhance our research and development and sales and marketing functions, develop and enhance our products, respond to unanticipated events and opportunities, or otherwise respond to competitive pressures would be significantly limited. In any such event, our business, financial condition and results of operations could be materially harmed, and we may be unable to continue our operations. Moreover, if we raise additional funds through the issuance of equity or convertible debt securities, the percentage ownership of our stockholders could be significantly diluted, and these newly issued securities may have rights, preferences or privileges senior to those of existing stockholders.
Enphase Energy, Inc. | 2024 Form 10-K | 41
We currently do not intend to pay dividends on our common stock and, consequently, your only opportunity to achieve a return on your investment is if the price of our common stock appreciates.
We have never declared or paid any dividends on our common stock. We do not anticipate paying cash dividends in the foreseeable future. Consequently, an investor’s only opportunity to achieve a return on its investment in our company will be if the market price of our common stock appreciates and the investor sells its shares at a profit.
General Risk Factors
Natural disasters, public health events, significant disruptions of information technology systems, data security breaches, or other catastrophic events could adversely affect our operations.
Our worldwide operations could be subject to natural disasters (including as a result of climate change), public health events, significant disruptions of information technology systems, data security breaches and other catastrophic business disruptions, which could harm our future revenue and financial condition and increase our costs and expenses. For example, our corporate headquarters in Fremont, California is located near major earthquake fault lines and our Petaluma, California facility is near fault lines and the sites of recent catastrophic wildfires. We rely on third-party manufacturing facilities, including for all product assembly and final testing of our products, which are performed at third-party manufacturing facilities, in China, Mexico and India. There may be conflict or uncertainty in the countries in which we operate, including public health issues (for example, an outbreak of contagious diseases or health epidemics, such as COVID-19), safety issues, natural disasters, fire, disruptions of service from utilities, nuclear power plant accidents, regional wars, or general economic or political factors. Such risks could result in an increase in the cost of components, production delays, general business interruptions, delays from difficulties in obtaining export licenses for certain technology, tariffs and other barriers and restrictions, longer payment cycles, increased taxes, restrictions on the repatriation of funds and the burdens of complying with a variety of foreign laws, any of which could ultimately have a material adverse effect on our business.
In the event that natural disasters (including as a result of climate change), public health epidemics or technical catastrophes were to damage or destroy any part of our facilities or those of our contract manufacturer, destroy or disrupt vital infrastructure systems or interrupt our operations or services for any extended period of time, our business, financial condition and results of operations would be materially and adversely affected.
If we fail to maintain an effective system of internal controls or are unable to remediate any deficiencies in our internal controls, we might not be able to report our financial results accurately or prevent fraud; in that case, our stockholders could lose confidence in our financial reporting, which would harm our business and could negatively impact the price of our stock.
Effective internal controls are necessary for us to provide reliable financial reports and prevent fraud. In addition, Section 404 of the Sarbanes-Oxley Act of 2002, as amended (the “Sarbanes-Oxley Act”), requires us to establish and maintain internal control over financial reporting and disclosure controls procedures. The process of implementing our internal controls and complying with Section 404 of the Sarbanes-Oxley Act has required, and will continue to require, significant attention of management. If we or our independent registered public accounting firm discover a material weakness in our internal controls over financial reporting, the disclosure of that fact, even if quickly remedied, could reduce the market’s confidence in our financial statements and harm our stock price. To the extent any material weaknesses in our internal control over financial reporting are identified, we could be required to expend significant management time and financial resources to correct such material weaknesses or to respond to any resulting regulatory investigations or proceedings.
Enphase Energy, Inc. | 2024 Form 10-K | 42
Our business is subject to tax liabilities.
We are subject to income tax, indirect tax or other tax claims by tax agencies in jurisdictions in which we conduct business. Significant judgment is required in determining our worldwide provision for income taxes. Tax laws are dynamic and subject to change as new laws are passed and new interpretations of the law are issued or applied. The IRA included significant changes to the U.S. federal income tax laws, the consequences of which could increase our future U.S. income tax expense. As additional guidance is issued by the applicable taxing authorities and as new accounting treatment is clarified, we may report additional adjustments in the period if new information becomes available. We have deferred tax assets related to net operating losses or tax credits that could be subject to limitations under IRS Code Sections 382 or 383, and State separate return limitation year rules. The limitations could reduce our ability to utilize our net operating losses or tax credits before the expiration of the tax attributes. Tax law changes or the limitations could be material and could materially affect our tax obligations and effective tax rate.
In the ordinary course of our business, there are many transactions and calculations where the ultimate income tax, indirect tax, or other tax determination is uncertain. Although we believe our tax estimates are reasonable, we cannot be certain that the final determination of our tax audits and litigation will not be materially different from that which is reflected in historical tax provisions and accruals. Should additional taxes be assessed as a result of an audit, assessment or litigation, there could be a material adverse effect on our cash, tax provisions and net income in the period or periods for which that determination is made.
Our charter documents and Delaware law could prevent a takeover that stockholders consider favorable and could also reduce the market price of our stock.
Our certificate of incorporation and our bylaws contain provisions that could delay or prevent a change in control of our company. These provisions could also make it more difficult for stockholders to elect directors and take other corporate actions, including effecting changes in our management. These provisions include:
•providing for a classified board of directors with staggered, three-year terms, which could delay the ability of stockholders to change the membership of a majority of our board of directors;
•not providing for cumulative voting in the election of directors, which limits the ability of minority stockholders to elect director candidates;
•authorizing our board of directors to issue, without stockholder approval, preferred stock rights senior to those of common stock, which could be used to significantly dilute the ownership of a hostile acquiror;
•prohibiting stockholder action by written consent, which forces stockholder action to be taken at an annual or special meeting of our stockholders;
•requiring the affirmative vote of holders of at least 66 2/3% of the voting power of all of the then outstanding shares of voting stock, voting as a single class, to amend provisions of our certificate of incorporation relating to the management of our business, our board of directors, stockholder action by written consent, advance notification of stockholder nominations and proposals, forum selection and the liability of our directors, or to amend our bylaws, which may inhibit the ability of stockholders or an acquiror to effect such amendments to facilitate changes in management or an unsolicited takeover attempt;
•requiring special meetings of stockholders may only be called by our chairman of the board, if any, our chief executive officer, our president or a majority of our board of directors, which could delay the ability of our stockholders to force consideration of a proposal or to take action, including the removal of directors; and
•requiring advance notification of stockholder nominations and proposals, which may discourage or deter a potential acquiror from conducting a solicitation of proxies to elect the acquiror’s own slate of directors or otherwise attempting to obtain control of us.
In addition, the provisions of Section 203 of the Delaware General Corporate Law may prohibit large stockholders, in particular those owning 15% or more of our outstanding common stock, from engaging in certain business combinations, without approval of substantially all of our stockholders, for a certain period of time.
These provisions in our certificate of incorporation, our bylaws and under Delaware law could discourage potential takeover attempts, reduce the price that investors might be willing to pay for shares of our common stock in the future and result in the market price being lower than it would be without these provisions.
Enphase Energy, Inc. | 2024 Form 10-K | 43
Item 1B. Unresolved Staff Comments
None.
Item 1C. Cybersecurity
Risk management and Strategy
We rely on information technology and data to operate our business and develop, market and deliver our products and services to our customers. Our critical information technology includes certain computer networks, third-party hosted services, communications systems, software, personal computers and servers (collectively, “Information Technology"), and our critical data includes certain confidential, personal, proprietary and sensitive data (collectively “Confidential Data”). Accordingly, we maintain risk assessment processes designed to identify cybersecurity threats relating to such Information Technology and Confidential Data, and assess potential material impact to our business that may result from such threats. Based on our assessment, we implement and maintain risk management processes designed to protect the confidentiality, integrity and availability of our Information Technology and Confidential Data and mitigate material harm to our business.
We identify such threats by, among other methods, monitoring the threat environment using manual and automated tools, subscribing to reports and services that identify cybersecurity threats, analyzing reports of threats and actors, conducting scans of the threat environment, evaluating our and our industry’s risk profile, evaluating threats reported to us, conducting threat assessments for internal and external threats, and conducting vulnerability assessments.
In the event a threat results in a cybersecurity incident, we have a process for escalating certain cybersecurity incidents from our security team up through our security leadership and ultimately to management.
Based on our risk assessment process, we implement and maintain various technical, physical and organizational processes designed to manage and mitigate cybersecurity risks that could affect our Information Technology and Confidential Data, and potential material impacts that may result from such risks. We have implemented measures designed to prevent, detect, respond to, mitigate and recover from identified and significant cybersecurity threats. The cybersecurity risk management processes we maintain for our Information Technology and Confidential Data, depending on the particular environment and system processes, are designed to address cybersecurity threats; incident response; vulnerability management; business continuity; incident detection and response; internal and external evaluations to assess our exposure to cybersecurity threats, environment, compliance with risk mitigation procedures, and effectiveness of relevant controls; documented risk assessments; encryption of data; network security; threat modeling; physical and electronic access; physical security; asset management, tracking and disposal; systems monitoring; vendor risk management; employee security training; penetration testing; cyber insurance; and the maintenance of a dedicated cybersecurity team.
To operate our business, we utilize certain third-party service providers to perform a variety of functions and provide certain security-related services, such as outsourced business critical functions, professional services, SaaS platforms, managed services, cloud-based infrastructure, data center facilities, content delivery to customers, encryption and authentication technology, corporate productivity services, and other functions; as well as third parties that assist us to identify, assess and manage cybersecurity risks, including professional services firms, threat intelligence service providers, cybersecurity software providers, penetration testing firms and other vendors that help to identify, assess or manage cybersecurity risks. For certain vendors, our vendor management process includes evaluating the cybersecurity practices of such provider and contractually imposing obligations on the provider related to the services they provide and/or the information they process.
For a description of the risks from cybersecurity threats that may materially affect the company and how those risks may affect the company, please refer to Part I, Item 1A. Risk Factors—Risks Related to our Intellectual Property and Technology of this Annual Report on Form 10-K for additional information about cybersecurity-related risks.
Governance
Our board of directors oversees our overall risk management strategy. The Audit Committee has general oversight with respect to cybersecurity risk. The Audit Committee has established a cybersecurity subcommittee to discuss issues and risks related to cybersecurity, and it includes one of our board members with cybersecurity experience, and holds regular meetings. This subcommittee has a dedicated agenda during such meetings that are designed to assist the Audit Committee with its cybersecurity oversight and allow it to report to the full Board if
Enphase Energy, Inc. | 2024 Form 10-K | 44
necessary. The meetings involve presentations and reports from our management, security leadership and information security team, including updates on relevant cybersecurity threats faced by the company and steps we are taking to address them.
Our management team is involved with our efforts to prevent, detect, and mitigate cybersecurity incidents by overseeing the implementation and maintenance of our cybersecurity policies and procedures and activities carried out in furtherance of those policies and procedures. The Senior Vice President of Security leads our cybersecurity risk management efforts and helps us assess cybersecurity risks, establish priorities, and determine the scope and details of our cybersecurity program. We have identified certain members of management and relevant employees to oversee our cybersecurity incident response and vulnerability management processes.
Item 2. Properties
The table below presents details for each of our principal properties:
| | | | | | | | | | | | | | | | | | | | | | | | | | |
| Facility | | Location | | Held | | Approximate Square Footage | | Lease end term |
| Corporate headquarters | | Fremont, U.S. | | Leased | | 40,446 | | Aug-2032 |
| Customer service support | | Boise, U.S. | | Leased | | 24,688 | | Jan-2027 |
| Administrative office and R&D facility | | Petaluma, U.S. | | Leased | | 75,334 | | Aug-2032 |
| Administrative office and R&D facility | | Austin, U.S. | | Leased | | 40,082 | | Oct-2034 |
| Marketing and sales support, and R&D facility | | Germany | | Leased | | 15,081 | | May-2034 |
| Global support office | | Bengaluru, India | | Leased | | 173,292 | | May-2027 |
| | | | | | | | |
| | | | | | | | |
| R&D facility | | Christchurch, New Zealand | | Leased | | 66,881 | | Aug-2031 |
| Marketing and sales support | | Melbourne, Australia | | Leased | | 4,478 | | Jul-2026 |
| Marketing and sales support | | s-Hertogenbosch, Netherlands | | Leased | | 6,997 | | Jan-2026 |
| Administrative office and R&D facility | | Puerto Rico | | Leased | | 7,874 | | Jun-2029 |
| | | | | | | | |
| | | | | | | | |
Item 3. Legal Proceedings
From time to time, we might be subject to various legal proceedings relating to claims arising out of our operations. The outcome of litigation is inherently uncertain. If one or more legal matters were resolved against us in a reporting period for amounts above management’s expectations, our business, results of operations, financial position and cash flows for that reporting period could be materially adversely affected. Except as described in this Item 3, we are not currently involved in any material legal proceedings, the ultimate disposition of which could have a material adverse effect on our operations, financial condition or cash flows.
Securities Class Action Lawsuits
On May 29, 2024, a putative securities class action complaint was filed against us, our chief executive officer and our chief financial officer (collectively, the "Defendants") in the United States District Court for the Northern District of California, captioned Bialic v. Enphase Energy, Inc., Case No. 3:24-cv-03216-BLF (the “Bialic Action”), purportedly on behalf of a class of individuals who purchased or otherwise acquired our common stock between February 7, 2023 and April 25, 2023.
On July 15, 2024, a second putative class action complaint was filed naming the same Defendants in the United States District Court for the Northern District of California, captioned Hayes v. Enphase Energy, Inc., Case No. 3:24-cv-04249 (the “Hayes Action” and with the Bialic Action, the “Securities Class Action”), purportedly on behalf of a class of individuals who purchased or otherwise acquired our common stock between December 12, 2022 and April 25, 2023. Both the Bialic Action and the Hayes Actions allege that Defendants made false and/or misleading statements in violation of Sections 10(b) and 20(a) of the Exchange Act and Rule 10b-5 promulgated thereunder. Both plaintiffs seek unspecified monetary damages and other relief.
On or about July 23, 2024, the plaintiff in the Bialic Action voluntarily dismissed the case.
On or about July 29, 2024, six additional stockholders filed motions to be appointed lead plaintiff and have their selection of counsel appointed as lead counsel. The Court held a hearing on the lead plaintiff motions on
Enphase Energy, Inc. | 2024 Form 10-K | 45
September 5, 2024, but has not yet issued a decision. Once a lead plaintiff and lead counsel are appointed, the parties will negotiate a schedule for an anticipated amended complaint and motion to dismiss.
On December 13, 2024, a third putative class action complaint was filed naming us, our chief executive officer and our chief products officer (collectively, “Defendants II”) in the United States District Court for the Northern District of California, captioned Trustees of the Welfare and Pension Funds of Local 464A v. Enphase Energy, Inc., Case No. 3:24-cv-09038 (the “Pension Fund Action”), purportedly on behalf of a class of individuals who purchased or otherwise acquired our common stock between April 25, 2023 and October 22, 2024. The Pension Fund Action alleges that Defendants II made false and/or misleading statements in violation of Sections 10(b) and 20(a) of the Exchange Act and Rule 10b-5 promulgated thereunder. The plaintiff seeks unspecified monetary damages and other relief.
We dispute the allegations in each of the above-referenced lawsuits and intend to defend the matters vigorously.
Shareholder Derivative Lawsuits
On July 16, 2024, a shareholder derivative lawsuit was filed purportedly on our behalf against the Defendants, our non-employee directors and us (as nominal defendant) in the United States District Court for the Northern District of California, captioned Ibarra v. Kothandaraman, et al., Case No. 3:24-cv-04278 (the “Ibarra Action”). The Ibarra Action asserts claims for breaches of fiduciary duty, unjust enrichment, abuse of control, gross mismanagement, waste of corporate assets, and violations of Sections 14(a), 10(b) and 20(a) of the Exchange Act, and contribution under Sections 10(b) and 21D of the Exchange Act based on the purported dissemination of substantially the same allegedly false and misleading statements asserted in the Securities Class Action. The Ibarra Action is seeking unspecified damages and other relief, including reforms and improvements to our corporate governance and internal procedures.
On September 5, 2024, another shareholder derivative lawsuit was filed purportedly on our behalf against the Defendants, our non-employee directors and us (as nominal defendant) in the United States District Court for the Northern District of California, captioned Isaac v. Kothandaraman, et al., Case No. 4:24-cv-06257-KAW (the “Isaac Action” and with the Ibarra Action, the "Derivative Action"), containing substantially the same allegations as those in the Ibarra Action. On September 20, 2024, the Court consolidated the Isaac and Ibarra Actions.
On October 11, 2024, the Court granted the parties’ stipulation to stay the Derivative Action until all motions to dismiss the Securities Class Action are decided.
On December 31, 2024, a shareholder derivative lawsuit was filed purportedly on our behalf against Defendants II, our non-employee directors and us (as nominal defendant) in the United States District Court for the Northern District of California, captioned Hirani v. Kothandaraman, et al., Case No. 4:24-cv-09532 (the “Hirani Action”). The Hirani Action asserts claims for breaches of fiduciary duty, unjust enrichment, abuse of control, gross mismanagement, waste of corporate assets, and violations of Sections 14(a), 10(b) and 20(a) of the Exchange Act, and contribution under Sections 10(b) and 21D of the Exchange Act based on the purported dissemination of substantially the same allegedly false and misleading statements asserted in the Pension Fund Action. The Hirani Action is seeking unspecified damages and other relief, including reforms and improvements to our corporate governance and internal procedures.
On January 17, 2025, a shareholder derivative lawsuit was filed purportedly on our behalf against Defendants II, our non-employee directors and us (as nominal defendant) in the United States District Court for the Northern District of California, captioned Hanowski v. Kothandaraman, et al., Case No. 3:25-cv-000652 (the “Hanowski Action”). The Hanowski Action asserts claims substantially similar to those asserted in the Hirani Action, also based on the same allegedly false and misleading statements asserted in the Pension Fund Action. The Hanowski Action is seeking unspecified damages and other relief, including reforms and improvements to our corporate governance and internal procedures.
On January 31, 2025, the plaintiffs in the Hirani and Hanowski Actions filed a motion to relate their actions to the Pension Fund Action.
We dispute the allegations in each of the above-referenced lawsuits and intend to defend the matters vigorously.
The pending lawsuits and any other related lawsuits are subject to inherent uncertainties, and the actual defense and disposition costs will depend upon many unknown factors. We could be forced to expend significant
Enphase Energy, Inc. | 2024 Form 10-K | 46
resources in the defense of the pending lawsuits and any additional lawsuits, and we may not prevail. In addition, we may incur substantial legal fees and costs in connection with such lawsuits.
Zola Electric International, Ltd. v. Enphase Energy, Inc.
On July 17, 2024, Zola Electric International, Ltd. (“Zola”) filed a complaint in the United States District Court for the Northern District of California against us, alleging breach of contract and breach of the covenant of good faith and fair dealing related to a joint development agreement and master supply agreement between Zola and us. On September 19, 2024, we filed a motion to dismiss the complaint, and all briefing papers were filed with the Court on or before November 8, 2024. We entered into a settlement and mutual release agreement with Zola on November 25, 2024 and Zola filed a stipulation of dismissal with prejudice on December 3, 2024, which was entered by the Court on December 4, 2024.
Item 4. Mine Safety Disclosures
Not applicable.
PART II
Item 5. Market for the Registrant’s Common Equity, Related Stockholder Matters and Issuer Purchases of Equity Securities
Common Stock
Our common stock, $0.00001 par value per share, has traded on The Nasdaq Global Market under the stock symbol “ENPH” since March 30, 2012.
Holders
As of February 3, 2025, there were approximately 16 holders of record of our common stock, one of which was Cede & Co., a nominee for Depository Trust Company (“DTC”). All of the shares of our common stock held by brokerage firms, banks and other financial institutions as nominees for beneficial owners are deposited into participant accounts at DTC and are therefore considered to be held of record by Cede & Co. as one stockholder.
Dividend Policy
We have never paid any cash dividends on our common stock. We currently anticipate that we will retain any available funds to invest in the growth and operation of our business and we do not anticipate paying any cash dividends in the foreseeable future.
Recent Sales of Unregistered Securities
None, except as previously disclosed.
Issuer Repurchases of Securities
In July 2023, our board of directors authorized the 2023 Repurchase Program (the “2023 Repurchase Program”) pursuant to which we may repurchase up to an aggregate of $1.0 billion of our common stock. As of December 31, 2024, we have approximately $398.6 million remaining for repurchase of shares under the 2023 Repurchase Program. Purchases may be completed from time to time in the open market or privately negotiated transactions, including through Rule 10b5-1 plans. The program may be discontinued or amended at any time and expires on July 26, 2026.
Enphase Energy, Inc. | 2024 Form 10-K | 47
The following table provides information about our repurchases of our common stock during the three months ended December 31, 2024 (in thousands, except per share amounts):
| | | | | | | | | | | | | | | | | | | | | | | | | | |
| Period Ended | | Total Number of Shares Purchased | | Average Price Paid per Share(1) | | Total Number of Shares Purchased as Part of Publicly Announced Program | | Approximate Dollar Value of Shares that May Yet Be Purchased Under the Program(2) |
| October 2024 | | 485,168 | | | $ | 82.39 | | | 485,168 | | | $ | 558,333 | |
| November 2024 | | 2,398,270 | | | $ | 66.59 | | | 2,398,270 | | | $ | 398,638 | |
| December 2024 | | — | | | $ | — | | | — | | | $ | 398,638 | |
| | | | | | | | |
| Total | | 2,883,438 | | | | | 2,883,438 | | | |
(1) Average price paid per share includes brokerage commissions
(2) During the three months ended December 31, 2024, we repurchased 2,883,438 shares of our common stock at a weighted average price of $69.25 per share for an aggregate amount of $199.7 million
Stock Performance Graph
This section is not “soliciting material” and is not deemed “filed” for purposes of Section 18 of the Exchange Act or otherwise subject to the liabilities of that section, nor shall it be deemed incorporated by reference in any filing under the Securities Act or the Exchange Act, as amended, regardless of any general incorporation language in such filing.
The graph depicted below shows a comparison of cumulative total stockholder returns for our common stock, the S&P 500 Index and the Invesco Solar ETF for the period from December 31, 2019 to December 31, 2024. An investment of $100 is assumed to have been made in our common stock and in each index on December 31, 2019, all dividends were reinvested, and the relative performance of the investments are tracked through December 31, 2024. The information shown is historical and stockholder returns over the indicated period should not be considered indicative of future stockholder returns or future performance.
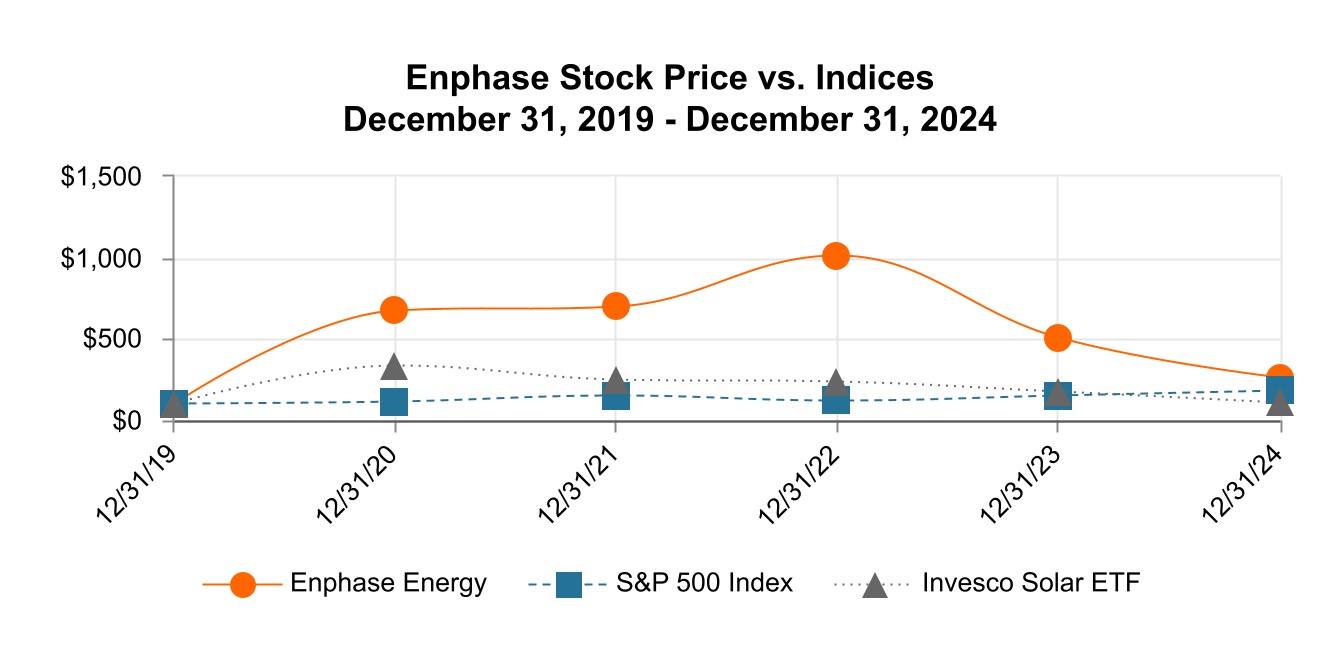
| | | | | | | | | | | | | | | | | | | | | | | | | | | | | | | | | | | | | |
| December 31, 2019 | | December 31, 2020 | | December 31, 2021 | | December 31, 2022 | | December 31, 2023 | | December 31, 2024 | | |
| Enphase Energy, Inc. | $ | 100 | | | $ | 672 | | | $ | 700 | | | $ | 1,014 | | | $ | 506 | | | $ | 263 | | | |
| S&P 500 Index | $ | 100 | | | $ | 116 | | | $ | 148 | | | $ | 119 | | | $ | 148 | | | $ | 182 | | | |
| Invesco Solar ETF | $ | 100 | | | $ | 334 | | | $ | 250 | | | $ | 237 | | | $ | 173 | | | $ | 108 | | | |
Enphase Energy, Inc. | 2024 Form 10-K | 48
Item 6. [Reserved]
Item 7. Management’s Discussion and Analysis of Financial Condition and Results of Operations
The following section generally discusses 2024 results compared to 2023 results. Discussion of 2023 results compared to 2022 results to the extent not included in this report can be found in Part II, Item 7 of our Annual Report on Form 10-K for the year ended December 31, 2023. Business Overview and 2024 Highlights
We are a global energy technology company. We deliver smart, easy-to-use solutions that manage solar generation, storage and communication on one platform. Our intelligent microinverters work with virtually every solar panel made, and when paired with our smart technology, result in one of the industry’s best-performing clean energy systems. As of December 31, 2024, we have shipped approximately 80.0 million microinverters, and approximately 4.7 million Enphase residential and commercial systems have been deployed in more than 160 countries.
We sell primarily to solar distributors who combine our products with others, including solar module products and racking systems, and resell to installers in each target region. In addition to our solar distributors, we sell directly to select large installers, OEMs and strategic partners. Our OEM customers include solar module manufacturers who integrate our microinverters with their solar module products and resell to both distributors and installers. Strategic partners include providers of solar financing solutions. We also sell certain products and services to homeowners primarily in support of our warranty services and legacy product upgrade programs, via our online store.
During the fiscal year 2024, our priorities included providing great customer service, scaling business processes, increasing efficiencies, reducing operating costs and the ongoing development of hardware and software to enhance our Enphase Energy System offering. Quality, customer service and innovation are cornerstones of our strategy, and we believe our focus on these priorities will continue to help drive our success going forward.
To reduce supply chain risk and take advantage of new incentives for domestic manufacturing, we expanded our operations with contract manufacturers in the United States with a capacity to produce five million microinverters per quarter. Beginning in the second half of 2024, we began shipping residential and commercial microinverters, and batteries, with higher domestic content from our U.S. contract manufacturers, which are expected to help certain solar and battery projects qualify for the domestic content bonus tax credit. The domestic content bonus tax credit is only available to commercial asset owners, which includes commercial businesses adding solar and PPA/lease providers who own residential solar projects.
We also expanded deployments of our IQ8 series Microinverters into many new regions globally, including shipments of IQ8 Microinverters with higher peak output AC power to support newer, high-powered solar modules. We began shipping our third-generation Enphase Energy System with IQ Battery 5P in several new markets globally. We also launched IQ Battery 5P in India with the IQ System Controller, enabling backup power in a region with frequent outages.
Global Events Affecting our Business and Operations
As we have a growing global footprint, we are subject to risk and exposure from the evolving macroeconomic environment, including the effects of increased global inflationary pressures, tariffs and interest rates, fluctuations in foreign currency exchange rates, potential economic slowdowns or recessions, geopolitical pressures and potential regulatory changes, including the unknown impacts of current and future trade regulations. We continuously monitor the direct and indirect impacts of these circumstances on our business and financial results.
Demand for Products. The demand environment for our products experienced a broad-based slowdown beginning in the second quarter of 2023 in the United States and in the third quarter of 2023 in Europe that continued into 2024. This demand environment has negatively impacted several distributors and installers, resulting in reduced liquidity, bankruptcy and business closures, which has affected our revenue and profitability, days sales outstanding and allowances for credit losses. The slower demand environment also resulted in elevated inventory with distributors and installers in late 2023 and the first half of 2024, and as a result we sold fewer microinverters to distributors and installers during the year ended December 31, 2024 compared to the same period in 2023.
Enphase Energy, Inc. | 2024 Form 10-K | 49
In the United States, this slowdown was primarily the result of higher interest rates, high channel inventory and the transition from NEM 2.0 to NEM 3.0 in California. Higher interest rates resulted in larger monthly costs and longer pay-back periods for those customers who financed their systems. In Europe, this slowdown was primarily driven by a softer customer demand as utility rates dropped and policy changes were implemented. This resulted in oversupply, financial stresses throughout the industry and the resulting channel inventory correction. In addition, there has been increased uncertainty in NEM policies and solar export penalties in a key European market. The phase out of NEM in that market was ultimately not approved but solar export penalties are still causing uncertainty among consumers. While we believe we have made the appropriate corrections to our channel inventory, some of the foregoing trends in the United States and Europe could continue to have an adverse effect on our results of operations in 2025.
Components of Consolidated Statements of Operations
Net Revenues
We generate revenue from sale of our various solutions, which include microinverter units and related accessories, IQ Battery and related accessories, IQ PowerPack 1500 and related accessories, IQ Gateway and IQ Energy Router, cloud-based monitoring services, EV charging solutions, design, proposal, permitting, installation and lead generation services, as well as a platform matching cleantech asset owners to a local and on-demand workforce of service providers, distributors, large installers, OEMs and strategic partners.
Our revenue is affected by changes in the volume and average selling prices (“ASPs”) of our various solutions and related accessories, supply and demand, sales incentives, government incentives and competitive product offerings. Our revenue growth is dependent on our ability to compete effectively in the marketplace by remaining cost competitive, macroeconomic conditions, favorable regulatory environment, developing and introducing new products that meet the changing technology, and performance requirements of our customers, the diversification and expansion of our revenue base, and our ability to market our products in a manner that increases awareness for microinverter technology and differentiates us in the marketplace.
Cost of Revenues and Gross Profit
Cost of revenues is comprised primarily of product costs, warranty, manufacturing and installation services support personnel, logistics costs, freight costs, inventory write-downs, hosting services costs related to our cloud-based monitoring services, depreciation of manufacturing test equipment, amortization of capitalized software development costs related to our cloud-based monitoring services, lead acquisition costs and design and proposal services, employee-related expenses associated with proposal and permitting services and design and proposal service customer support. AMPTC earned under the IRA for U.S. manufactured microinverters shipped to customers in the years ended December 31, 2024 and 2023 are treated as a reduction to cost of revenues.
Our product costs are impacted by technological innovations, such as advances in semiconductor integration and new product introductions, economies of scale resulting in lower component costs, and improvements in production processes and automation. Certain costs, primarily personnel and depreciation and amortization of test equipment and capitalized software development costs, are not directly affected by sales volume.
We outsource our manufacturing to third-party contract manufacturers and generally negotiate product pricing with them on a quarterly basis. We believe our contract manufacturing partners have sufficient production capacity to meet the anticipated demand for our products for the foreseeable future. However, shortages in the supply of certain key raw materials could adversely affect our ability to meet customer demand for our products. We contract with third parties, including one of our contract manufacturers, to serve as our logistics providers by warehousing and delivering our products in the United States, Canada, Mexico, Europe, Australia, New Zealand, India, Brazil, the Philippines, Thailand, South Africa, and certain other Central American and Asian countries.
Gross profit may vary from quarter to quarter and is primarily affected by our ASPs, product cost, product mix, customer mix, AMPTC, shipping costs, warranty costs and sales volume fluctuations.
Operating Expenses
Operating expenses consist of research and development, sales and marketing, general and administrative and restructuring and asset impairment charges. Personnel-related costs are the most significant component of each of these expense categories, other than restructuring and asset impairment charges, and include salaries, benefits, payroll taxes, sales commissions, incentive compensation, post-combination expense and stock-based compensation.
Enphase Energy, Inc. | 2024 Form 10-K | 50
Research and development expense includes personnel-related expenses, third-party design and development costs, testing and evaluation costs, depreciation expense and other indirect costs. Research and development employees are primarily engaged in the design and development of power electronics, semiconductors, powerline communications, networking and software functionality, and storage. We devote substantial resources to research and development programs that focus on enhancements to, and cost efficiencies in, our existing products and timely development of new products that utilize technological innovation to drive down product costs, improve functionality, and enhance reliability. We intend to continue to invest appropriate resources in our research and development efforts because we believe they are critical to maintaining our competitive position.
Sales and marketing expense includes personnel-related expenses, travel, trade shows, marketing, customer support and other indirect costs. We expect to continue to make the necessary investments to enable us to execute our strategy to increase our market penetration geographically and enter into new markets by expanding our customer base of distributors, large installers, OEMs and strategic partners. We currently offer solutions targeting the residential and commercial markets in the United States, Canada, Mexico, Europe, Australia, New Zealand, India, Brazil, the Philippines, Thailand, South Africa, Central America, the Caribbean and certain Asian countries. We expect to continue to expand the geographic reach of our product offerings and explore new sales channels in addressable markets in the future.
General and administrative expense includes personnel-related expenses for our executive, finance, human resources, information technology and legal organizations, facilities costs, and fees for professional services. Fees for professional services consist primarily of outside legal, accounting and information technology consulting costs.
Restructuring and asset impairment charges are the net charges resulting from restructuring initiatives implemented in 2022, 2023 and 2024 to increase operational efficiencies and execution, reduce operating costs, and better align our workforce and cost structure with current market conditions, as well as reflect our business needs, strategic priorities and ongoing commitment to profitable growth. Charges from the restructuring initiatives primarily consisted of employee severance and one-time benefits, workforce reorganization charges, contract termination charges, and asset impairment charges. Refer to Note 12. “Restructuring and Asset Impairment Charges,” of the notes to consolidated financial statements included in Part II, Item 8 of this Annual Report on Form 10-K for additional information. Other Income, Net
Other income, net primarily consists of interest income on our cash, cash equivalents, restricted cash and marketable securities, amortization of discount or premium on purchase of cash equivalents and marketable securities, gains or losses upon conversion of foreign currency transactions into U.S. dollars, interest expense, changes in fair value of contingent consideration, non-cash interest expense related to the accretion of debt discount and amortization of deferred financing costs, non-cash charges recognized for loss on partial settlement of convertible notes, and the change in fair value of our debt securities.
Income Tax Provision
We are subject to income taxes in the countries where we sell our products. Historically, we have primarily been subject to taxation in the United States because we have sold the majority of our products to customers in the United States. As we have expanded our global footprint for the sale of products to customers outside the United States, we have become subject to taxation based on the foreign statutory rates in the countries where these sales took place. As sales in foreign jurisdictions increase in the future, our effective tax rate may fluctuate accordingly. We regularly assess the ability to realize deferred tax assets based on the weight of all available evidence, including such factors as the history of recent earnings and expected future taxable income on a jurisdiction by jurisdiction basis.
Enphase Energy, Inc. | 2024 Form 10-K | 51
Summary Consolidated Statements of Operations
The following table sets forth a summary of our consolidated statements of operations for the periods presented:
| | | | | | | | | | | | | | | | | | | | | |
| | | Years Ended December 31, |
| | | | | (In thousands) |
| | | | | 2024 | | 2023 | | 2022 |
| Net revenues | | | | | $ | 1,330,383 | | | $ | 2,290,786 | | | $ | 2,330,853 | |
| Cost of revenues | | | | | 701,245 | | | 1,232,398 | | | 1,356,258 | |
| Gross profit | | | | | 629,138 | | | 1,058,388 | | | 974,595 | |
| Operating expenses: | | | | | | | | | |
| Research and development | | | | | 201,315 | | | 227,336 | | | 168,846 | |
| Sales and marketing | | | | | 206,552 | | | 231,792 | | | 215,102 | |
| General and administrative | | | | | 130,825 | | | 137,835 | | | 140,002 | |
| Restructuring and asset impairment charges | | | | | 13,154 | | | 15,684 | | | 2,384 | |
| Total operating expenses | | | | | 551,846 | | | 612,647 | | | 526,334 | |
| Income from operations | | | | | 77,292 | | | 445,741 | | | 448,261 | |
| Other income, net | | | | | | | | | |
| Interest income | | | | | 77,306 | | | 69,728 | | | 13,656 | |
| Interest expense | | | | | (8,905) | | | (8,839) | | | (9,438) | |
| Other income (expense), net | | | | | (25,534) | | | 6,509 | | | (431) | |
| | | | | | | | | |
| | | | | | | | | |
| Total other income, net | | | | | 42,867 | | | 67,398 | | | 3,787 | |
| Income before income taxes | | | | | 120,159 | | | 513,139 | | | 452,048 | |
| Income tax provision | | | | | (17,501) | | | (74,203) | | | (54,686) | |
| Net income | | | | | $ | 102,658 | | | $ | 438,936 | | | $ | 397,362 | |
| | | | | | | | | |
| | | | | | | | | |
| | | | | | | | | |
| | | | | | | | | |
| | | | | | | | | |
| | | | | | | | | |
Enphase Energy, Inc. | 2024 Form 10-K | 52
Results of Operations
Net Revenues
| | | | | | | | | | | | | | | | | | | | | | | | | | | | | | | |
| | | | | Years Ended December 31, | | Change in |
| | | | | | | | | 2024 | | 2023 | | $ | | % |
| | | | | | | | | | | | | | | |
| | | | | | | | | (In thousands, except percentages) |
| Net revenues | | | | | | | | | $ | 1,330,383 | | | $ | 2,290,786 | | | $ | (960,403) | | | (42) | % |
Net revenues decreased by $960.4 million, or 42%, in the year ended December 31, 2024, as compared to the same period in 2023, driven primarily by a 58% decrease in microinverter units shipped, partially offset by an increase in ASP for our microinverters as we sold more IQ8 microinverters relative to IQ7 microinverters. During the year ended December 31, 2024, we sold approximately 6.5 million microinverter units, as compared to approximately 15.5 million microinverter units in the year ended December 31, 2023. The decrease in net revenues was also partially offset by a 48% increase in IQ Batteries MWh shipped. During the year ended December 31, 2024, we shipped 521.0 MWh of IQ Batteries, as compared to 351.6 MWh shipped in the year ended December 31, 2023.
The overall decrease in net revenues during the year ended December 31, 2024, as compared to the same period in 2023, was due to a broad-based slowdown that began in 2023 in both the United States and Europe. This resulted in elevated inventory with distributors and installers, and as a result we sold fewer microinverters to distributors and installers during the year ended December 31, 2024 to normalize channel inventory, as compared to the same period in 2023. In the United States, this slowdown was primarily the result of higher interest rates, high channel inventory and the transition from NEM 2.0 to NEM 3.0 in California. Higher interest rates resulted in larger monthly costs and longer pay-back periods for those customers who financed their systems. In Europe, this slowdown was primarily driven by a softer customer demand as utility rates dropped and policy changes were implemented. This resulted in oversupply, financial stresses throughout the industry and the resulting channel inventory correction.
Cost of Revenues and Gross Margin
| | | | | | | | | | | | | | | | | | | | | | | | | | | | | | | |
| | | | | Years Ended December 31, | | Change in |
| | | | | | | | | 2024 | | 2023 | | $ | | % |
| | | | | | | | | | | | | | | |
| | | | | | | | | (In thousands, except percentages) |
| Cost of revenues | | | | | | | | | $ | 701,245 | | | $ | 1,232,398 | | | $ | (531,153) | | | (43) | % |
| Gross profit | | | | | | | | | 629,138 | | | 1,058,388 | | | (429,250) | | | (41) | % |
| Gross margin | | | | | | | | | 47.3 | % | | 46.2 | % | | | | |
Cost of revenues decreased by $531.2 million, or 43%, in the year ended December 31, 2024, as compared to the same period in 2023, primarily due to the lower volume of microinverter units sold, as well as from the benefit recognized from tax credits of $157.5 million under the AMPTC for U.S. manufactured microinverters shipped to customers in the year ended December 31, 2024, as compared to cost of revenues of $53.5 million in the same period in 2023. The benefit recognized from the AMPTC was partially offset by $38.3 million and $11.6 million of incremental cost for manufacturing in the United States in the year ended December 31, 2024 and December 31, 2023, respectively, thereby providing a Net IRA benefit of $119.2 million and $41.9 million, respectively.
Gross margin increased by 1.1 percentage points in the year ended December 31, 2024, as compared to the same period in 2023. The increase was primarily due to recognition of a 9.0 percentage point of Net IRA benefit in the year ended December 31, 2024, as compared to a 1.8 percentage point Net IRA benefit in the same period in 2023, and an increase in ASP for microinverters, partially offset by product mix and relatively higher fixed overhead costs.
Enphase Energy, Inc. | 2024 Form 10-K | 53
Research and Development | | | | | | | | | | | | | | | | | | | | | | | | | | | | | | | |
| | | | | Years Ended December 31, | | Change in |
| | | | | | | | | 2024 | | 2023 | | $ | | % |
| | | | | | | | | | | | | | | |
| | | | | | | | | (In thousands, except percentages) |
| Research and development | | | | | | | | | $ | 201,315 | | | $ | 227,336 | | | $ | (26,021) | | | (11) | % |
| Percentage of net revenues | | | | | | | | | 15 | % | | 10 | % | | | | |
Research and development expense decreased by $26.0 million, or 11%, in the year ended December 31, 2024, as compared to the same period in 2023. The decrease was primarily due to actions implemented in connection with the restructuring initiatives implemented in 2023 and 2024 that lowered personnel-related expenses by $16.2 million due to a reduction in headcount and lowered equipment and professional services costs by $9.8 million. The amount of research and development expenses may fluctuate from period to period due to the differing levels and stages of development activity for our products.
Sales and Marketing
| | | | | | | | | | | | | | | | | | | | | | | | | | | | | | | |
| | | | | Years Ended December 31, | | Change in |
| | | | | | | | | 2024 | | 2023 | | $ | | % |
| | | | | | | | | | | | | | | |
| | | | | | | | | (In thousands, except percentages) |
| Sales and marketing | | | | | | | | | $ | 206,552 | | | $ | 231,792 | | | $ | (25,240) | | | (11) | % |
| Percentage of net revenues | | | | | | | | | 16 | % | | 10 | % | | | | |
Sales and marketing expense decreased by $25.2 million, or 11%, in the year ended December 31, 2024, as compared to the same period in 2023. The decrease was primarily due to actions implemented in connection with the restructuring initiatives implemented in 2023 and 2024 that lowered professional services and advertising costs by $14.6 million and personnel-related expenses by $10.6 million due to a reduction in headcount.
General and Administrative | | | | | | | | | | | | | | | | | | | | | | | | | | | | | | | |
| | | | | Years Ended December 31, | | Change in |
| | | | | | | | | 2024 | | 2023 | | $ | | % |
| | | | | | | | | | | | | | | |
| | | | | | | | | (In thousands, except percentages) |
| General and administrative | | | | | | | | | $ | 130,825 | | | $ | 137,835 | | | $ | (7,010) | | | (5) | % |
| Percentage of net revenues | | | | | | | | | 10 | % | | 6 | % | | | | |
General and administrative expense decreased by $7.0 million, or 5%, in the year ended December 31, 2024, as compared to the same period in 2023. The decrease was primarily due to actions implemented in connection with the restructuring initiatives implemented in 2023 and 2024 that lowered professional services and facilities expense by $4.8 million and lowered personnel-related costs by $2.2 million due to a reduction in headcount.
Enphase Energy, Inc. | 2024 Form 10-K | 54
Restructuring and Asset Impairment Charges | | | | | | | | | | | | | | | | | | | | | | | | | | | | | | | |
| | | | | Years Ended December 31, | | Change in |
| | | | | | | | | 2024 | | 2023 | | $ | | % |
| | | | | | | | | | | | | | | |
| | | | | | | | | (In thousands, except percentages) |
| Restructuring and asset impairment charges | | | | | | | | | $ | 13,154 | | | $ | 15,684 | | | $ | (2,530) | | | (16) | % |
| Percentage of net revenues | | | | | | | | | 1.0 | % | | 0.7 | % | | | | |
Restructuring and asset impairment charges are the net charges resulting from restructuring initiatives implemented in 2023 and 2024 to increase operational efficiencies, reduce operating costs, and to better align our workforce and cost structure with current market conditions, our business needs, and strategic priorities. Restructuring charges of $13.2 million in the year ended December 31, 2024, primarily consisted of $6.4 million of employee severance, one-time benefits and other employee related expenses, $2.0 million of contract termination charges and $4.8 million of asset impairment charges. Restructuring charges of $15.7 million in the year ended December 31, 2023, primarily consisted of $9.8 million of asset impairment charges, $3.7 million of contract termination charges, $1.4 million of employee severance and one-time benefits, and $0.8 million of other restructuring charges.
Other Income, Net
| | | | | | | | | | | | | | | | | | | | | | | | | | | | | | | |
| | | | | Years Ended December 31, | | Change in |
| | | | | | | | | 2024 | | 2023 | | $ | | % |
| | | | | | | | | | | | | | | |
| | | | | | | | | (In thousands, except percentages) |
| Interest income | | | | | | | | | $ | 77,306 | | | $ | 69,728 | | | $ | 7,578 | | | 11 | % |
| Interest expense | | | | | | | | | (8,905) | | | (8,839) | | | (66) | | | 1 | % |
| Other income (expense), net | | | | | | | | | (25,534) | | | 6,509 | | | (32,043) | | | (492) | % |
| | | | | | | | | | | | | | | |
| Total other income, net | | | | | | | | | $ | 42,867 | | | $ | 67,398 | | | $ | (24,531) | | | (36) | % |
Interest income of $77.3 million increased in the year ended December 31, 2024, as compared to $69.7 million for the year ended December 31, 2023, primarily due to higher interest rates.
Interest expense of $8.9 million in the year ended December 31, 2024, primarily included $8.9 million for the coupon interest, debt discount amortization with the Notes due 2025, and amortization of debt issuance costs with the Notes due 2025, Notes due 2026 and Notes due 2028. Interest expense of $8.8 million in the year ended December 31, 2023, primarily related to $8.4 million for the coupon interest, debt discount amortization with the Notes due 2025 and amortization of debt issuance costs with the $65.0 million aggregate principal amount of our 4.0% convertible senior notes due 2023 (the “Notes due 2023”), Notes due 2025, Notes due 2026 and Notes due 2028, and $0.4 million interest incurred with the Notes due 2025 and Notes due 2023.
Other expense, net, of $25.5 million in the year ended December 31, 2024, primarily related to $23.0 million impairment of investments in private companies, $5.0 million net loss due to foreign currency denominated monetary assets and liabilities partially offset by a $2.0 million non-cash net gain related to change in the fair value of debt securities, $0.3 million of miscellaneous other income and $0.2 million realized gain from sale of marketable securities. Other income, net, of $6.5 million in the year ended December 31, 2023, primarily related to a $8.7 million non-cash net gain related to change in the fair value of debt securities, partially offset by a $2.1 million net loss due to foreign currency denominated monetary assets and liabilities and $0.1 million in realized loss on investments.
Enphase Energy, Inc. | 2024 Form 10-K | 55
Income Tax Provision
| | | | | | | | | | | | | | | | | | | | | | | | | | | | | | | | | | | | | | | |
| | | | | Years Ended December 31, | | Change in | | | | |
| | | | | | | | | 2024 | | 2023 | | $ | | % | | | | | | | | |
| | | | | | | | | | | | | | | | | | | | | | | |
| | | | | | | | | (In thousands, except percentages) |
| Income tax provision | | | | | | | | | $ | (17,501) | | | $ | (74,203) | | | $ | 56,702 | | | (76) | % | | | | | | | | |
| | | | | | | | | | | | | | | | | | | | | | | |
The income tax provision was $17.5 million in the year ended December 31, 2024, as compared to an income tax provision of $74.2 million in the same period in 2023. The decrease was primarily due to lower projected tax expense as our operations in U.S. and foreign jurisdictions were less profitable in 2024 as compared to the same period in 2023, partially offset by an increase in tax expense from equity compensation shortfalls in 2024 as compared to the same period in 2023.
Liquidity and Capital Resources
Sources of Liquidity
As of December 31, 2024, we had $1.7 billion in net working capital, including cash, cash equivalents, restricted cash and marketable securities, of which approximately $1.6 billion were held in the United States. Our cash, cash equivalents, restricted cash and marketable securities primarily consist of U.S. Government agency securities and treasuries, money market mutual funds, corporate notes, commercial paper and bonds, and both interest-bearing and non-interest-bearing deposits, with the remainder held in various foreign subsidiaries. We consider amounts held outside the United States to be accessible and have provided for the estimated withholding tax liability on the repatriation of our foreign earnings.
| | | | | | | | | | | | | | | | | | | | | | | | | | | | | | | | | | | | | | | |
| | | | | Years Ended December 31, | | Change in | | | | |
| | | | | | | | | 2024 | | 2023 | | $ | | % | | | | | | | | |
| | | | | | | | | | | | | | | | | | | | | | | |
| | | | | | | | | (In thousands, except percentages) |
| Cash, cash equivalents, restricted cash and marketable securities | | | | | | | | | $ | 1,717,596 | | | $ | 1,695,034 | | | $ | 22,562 | | | 1 | % | | | | | | | | |
| Total Debt | | | | | | | | | $ | 1,302,380 | | | $ | 1,293,738 | | | $ | 8,642 | | | 0.7 | % | | | | | | | | |
Our cash, cash equivalents, restricted cash and marketable securities increased by $22.6 million for the year ended December 31, 2024, as compared to the same period in 2023, primarily due to cash generated from operations of $513.7 million, partially offset by $391.4 million in repurchases of common stock pursuant to the 2023 Repurchase Program and $78.8 million in payments of withholding taxes related to net share settlement of employee equity awards.
Total carrying amount of debt increased by $8.6 million for the year ended December 31, 2024, as compared to the same period in 2023, primarily due to accretion of debt discount and issuance costs.
We expect that our principal short-term (over the next 12 months) cash needs related to our operations will be to fund working capital, strategic investments, acquisitions, repurchases of common stock and payments of withholding taxes for net share settlement of employee equity awards, payments on our outstanding debt and purchases of property and equipment. We plan to fund any cash requirements for the next 12 months from our existing cash, cash equivalents and marketable securities on hand, and cash generated from operations. For the long-term period (beyond 12 months), we aim to continue growing cash flows from operations to support our ongoing business operations and strategic investment plans. We regularly evaluate our liquidity position, debt obligations and expected cash requirements. As part of this ongoing assessment, we may pursue additional financing through the issuance of equity or the debt financing, as necessary, to meet our operational and investment needs. We anticipate that access to the debt market will be more limited compared to prior years as interest rates have increased and are expected to remain high. Our ability to obtain debt or any other additional financing that we may choose to, or need to, obtain will depend on, among other things, our development efforts, business plans, operating performance and the condition of the capital markets at the time we seek financing.
Enphase Energy, Inc. | 2024 Form 10-K | 56
Repurchase of Common Stock. In July 2023, our board of directors authorized the 2023 Repurchase Program pursuant to which we were authorized to repurchase up to $1.0 billion of our common stock. The repurchases could be funded from available working capital and could be executed from time to time, subject to general business and market conditions and other investment opportunities, through open market purchases or privately negotiated transactions, including through Rule 10b5-1 plans. The program may be discontinued or amended at any time and expires on July 26, 2026. During the year ended December 31, 2024, we repurchased 4,543,016 shares, for an aggregate amount of $391.4 million. Refer to Note 15. “Stockholders’ Equity,” in Part II, Item 8 of this Annual Report on Form 10-K for more information on our repurchase of common stock. Convertible Notes. As of December 31, 2024, our aggregate principal convertible notes obligations were $1,309.7 million, which primarily consisted of the Notes due 2028 of $575.0 million, Notes due 2026 of $632.5 million and Notes due 2025 of $102.2 million. Upon conversion of the Notes due 2026 and Notes due 2028, we expect to pay cash equal to the aggregate principal amount of the Notes of such series to be converted, and, at our election, will pay or deliver cash and/or shares of our common stock for the amount of our conversion obligation in excess of the aggregate principal amount of the Notes of such series. Holders of Notes due 2025 may now convert their notes at any time until the close of business on the second scheduled trading day immediately preceding the maturity date of March 1, 2025. These conversions will be settled in a combination settlement method with the principal value settled in cash and the remaining value in shares of our common stock. Refer to Note 13. “Debt,” in Part II, Item 8 of this Annual Report on Form 10-K for more information on our outstanding convertible notes. Operating Leases. We have entered into various non-cancelable operating leases primarily for our facilities with original lease periods expiring through the year 2033, with the most significant leases relating to our offices in Petaluma, California and Bengaluru, India. As of December 31, 2024, we had total operating lease obligations of $28.9 million recorded on our consolidated balance sheet.
Other Material Cash Requirements. As of December 31, 2024, we had open purchase obligations of $130.9 million related to component inventory that our primary contract manufacturers procure on our behalf in accordance with our production forecast as well as other inventory related purchase commitments. The timing of purchases in future periods could differ materially from estimates presented above due to fluctuations in demand requirements related to varying sales levels as well as changes in economic conditions.
Cash Flows. The following table summarizes our cash flows for the periods presented:
| | | | | | | | | | | | | |
| Years Ended December 31, |
| 2024 | | 2023 | | |
| | | | | |
| (In thousands) |
| Net cash provided by operating activities | $ | 513,693 | | | $ | 696,780 | | | |
| Net cash provided by (used in) investing activities | 128,267 | | | (366,355) | | | |
| Net cash used in financing activities | (460,269) | | | (516,774) | | | |
| Effect of exchange rate changes on cash, cash equivalents and restricted cash | (6,323) | | | 1,853 | | | |
| Net increase (decrease) in cash and cash equivalents and restricted cash | $ | 175,368 | | | $ | (184,496) | | | |
Enphase Energy, Inc. | 2024 Form 10-K | 57
Cash from operations could be affected by various risks and uncertainties, including, but not limited to, the broad-based slowdown in demand for our products, new regulations and other risk factors discussed in Part I, Item IA, Risk Factors of this Annual Report on Form 10-K.
Cash Flows from Operating Activities
Cash flows from operating activities consisted of our net income adjusted for certain non-cash reconciling items, such as stock-based compensation expense, non-cash interest expense, change in the fair value of debt securities, deferred income taxes, asset impairment, depreciation and amortization, and changes in our operating assets and liabilities. Net cash provided by operating activities decreased by $183.1 million for the year ended December 31, 2024, as compared to the same period in 2023, primarily due to lower net revenues.
Cash Flows from Investing Activities
For the year ended December 31, 2024, net cash provided by investing activities of $128.3 million was primarily from the sales and maturities of marketable securities of $161.9 million, net of purchases, partially offset by $33.6 million used in purchases of test and assembly equipment for U.S. manufacturing, related facility improvements and information technology enhancements, including capitalized costs related to internal-use software.
For the year ended December 31, 2023, net cash used in investing activities of $366.4 million was primarily from the purchase of $241.0 million of marketable securities, net of sale and maturities, $110.4 million used in purchases of test and assembly equipment to expand our supply capacity, related facility improvements and information technology enhancements, including capitalized costs related to internal-use software, and $15.0 million used in the investment of a private company.
Cash Flows from Financing Activities
For the year ended December 31, 2024, net cash used in financing activities of approximately $460.3 million was primarily from $391.4 million used to repurchase our common stock, payment of $78.8 million in employee withholding taxes related to net share settlement of employee equity awards, payment of $2.8 million in excise tax for net stock repurchases, and less than $0.1 million from the partial settlement of the Notes due 2025, partially offset by $12.7 million net proceeds from employee stock option exercises and purchases under our employee stock purchase plan.
For the year ended December 31, 2023, net cash used in financing activities of approximately $516.8 million was primarily from $410.0 million used to repurchase our common stock and the payment of $120.6 million in employee withholding taxes related to net share settlement of employee equity awards, partially offset by $13.9 million net proceeds from employee stock option exercises and purchases under our employee stock purchase plan.
Critical Accounting Policies and Estimates
The preparation of our consolidated financial statements and related notes requires us to make judgments, estimates and assumptions that affect the reported amounts of assets, liabilities, revenue and expenses, fair value of acquired intangible assets and goodwill, useful lives of acquired intangible assets and related disclosure of contingent assets and liabilities. The SEC has defined a company’s critical accounting policies as the ones that are most important to the portrayal of a company’s financial condition and results of operations, and which require a company to make its most difficult and subjective judgments. Based on this definition, we have identified the critical accounting policies and judgments addressed below.
Enphase Energy, Inc. | 2024 Form 10-K | 58
We have based our estimates on historical experience and on various other assumptions that are believed to be reasonable under the circumstances, the results of which form the basis for making judgments about the carrying values of assets and liabilities that are not readily apparent from other sources. Actual results may differ from these estimates due to risks and uncertainties, including uncertainty in the current economic environment due to inflation, interest rates fluctuations and new regulations. As of the date of issuance of these financial statements, we are not aware of any specific event or circumstance that would require us to update our estimates, judgments or revise the carrying value of our assets or liabilities. For a description of our significant accounting policies, refer to Note 2. “Summary of Significant Accounting Policies,” of the notes to consolidated financial statements included in Part II, Item 8 of this Annual Report on Form 10-K. An accounting policy is considered to be critical if it requires an accounting estimate to be made based on assumptions about matters that are highly uncertain at the time the estimate is made, and if different estimates that reasonably could have been used, or changes in the accounting estimates that are reasonably likely to occur periodically, could materially impact the consolidated financial statements. We believe the following critical accounting policies reflect the more significant estimates and assumptions used in the preparation of our consolidated financial statements. Revenue Recognition
We generate revenues from sales of our solutions, which include microinverter units and related accessories, IQ Battery and related accessories, IQ PowerPack 1500 and related accessories, IQ Combiner, IQ Gateway, and IQ Energy Router, our cloud-based monitoring services, EV charging solutions, design, proposal, permitting, installation and lead generation services, as well as a platform matching cleantech asset owners to a local and on-demand workforce of service providers, distributors, large installers, OEMs and strategic partners.
We generally sell our products to our customers pursuant to a customer’s standard purchase order and our customary terms and conditions. We do not offer rights to return our products other than for normal warranty conditions, and as such, revenue is recognized based on the transfer of control. We evaluate the creditworthiness of our customers to determine appropriate credit limits prior to the acceptance and shipment of an order. A description of principal activities from which we generate revenues are as follows.
•Products Delivered at a Point in Time. We sell our products and professional services to customers in accordance with the terms of the related customer contracts. We generate revenues from sales of our solutions, which include microinverter units and related accessories, storage solutions, EV charging solutions, design, proposal, permitting, installation and lead generation services, as well as a platform matching cleantech asset owners to a local and on-demand workforce of service providers to distributors, large installers, OEMs and strategic partners. Microinverter units, microinverter accessories, storage and EV solutions, design proposal, permitting, installation and lead generation services, as well as completed work orders on our platform matching cleantech asset owners to a local and on-demand workforce of service providers, are delivered to customers at a point in time, and we recognize revenue for these products or professional services when we transfer control of the product or professional services to the customer, which is generally upon product shipment or service delivery, respectively.
•Products Delivered Over Time. The sale of IQ Gateway and IQ Energy Router includes our cloud-based monitoring services. The full consideration for these products represents a single performance obligation and is deferred at the sale date and recognized over the estimated service period of 7 years. We also sell certain communication accessories that contain a service performance obligation to be delivered over time. The revenue from these products is recognized over the related service period, which is typically 5 years. The subscription services revenue generated from each customer’s subscription to our design and proposal service is recognized on a ratable basis over the contract term beginning on the date that our service is made available to the customer. The subscription contracts are generally 3 to 12 months in length and billed in advance.
When we sell a product with more than one performance obligation, such as our IQ Combiner, which includes both hardware and the IQ Gateway, the total consideration is allocated to these performance obligations based on their relative standalone selling prices.
Provisions for rebates, sales incentives and discounts are estimated based on promotions offered to customers, customer specific experience and historical product ASPs. We record such revenue promotions as variable consideration and recognize these promotions as a reduction in revenue at the time the related revenue is recorded.
Enphase Energy, Inc. | 2024 Form 10-K | 59
We record upfront contract acquisition costs, such as sales commissions, to be capitalized and amortized over the estimated life of the asset. For contracts that have a duration of less than one year, we follow the Topic 606 practical expedient and expense these costs when incurred. Commissions related to the sale of monitoring hardware and services are capitalized and amortized over the period of the associated revenue.
Refer to Note 3. “Revenue Recognition,” of the notes to consolidated financial statements included in Part II, Item 8 of this Annual Report on Form 10-K for additional information related to revenue recognition. Inventory
Inventory is valued at the lower of cost or market. Market is current replacement cost (by purchase or by reproduction, dependent on the type of inventory). In cases where market exceeds net realizable value (i.e., estimated selling price less reasonably predictable costs of completion and disposal), inventories are stated at net realizable value. Market is not considered to be less than net realizable value reduced by an allowance for an approximately normal profit margin. We determine cost on a first-in first-out basis. Certain factors could affect the realizable value of its inventory, including customer demand and market conditions. Management assesses the valuation on a quarterly basis and writes down the value for any excess and obsolete inventory based upon expected demand, anticipated sales price, effect of new product introductions, product obsolescence, customer concentrations, product merchantability and other factors. Inventory write-downs are equal to the difference between the cost of inventories and market.
Government Grants
Government grants represent benefits provided by federal, state or local governments that are not subject to the scope of ASC 740. We recognize a grant when we have reasonable assurance that we will comply with the grant’s conditions and that the grant will be received. Government grants that are not related to long-lived assets are considered income-based grants, which are recognized as a reduction to the related cost of activities that generated the benefit.
We recognized credits under the AMPTC as a reduction to cost of revenues in the consolidated statement of operations for the microinverters manufactured in the United States and sold to customers in the year ended December 31, 2024 and 2023. Such credit is also reflected as an increase to prepaid income tax within prepaid expenses and other current assets and reduction of income tax payable within accrued liabilities on our consolidated balance sheets within accrued liabilities. There are currently several critical and complex aspects of the IRA that could affect the estimated benefits we have recognized and expect to recognize from the AMPTC. Any modifications to the law or its effects arising, for example, through (i) technical guidance and regulations from the IRS and U.S. Treasury Department, (ii) subsequent amendments to or interpretations of the law, and/or (iii) future laws or regulations rendering certain provisions of the IRA less effective or ineffective, in whole or in part, could result in material adverse changes to the benefits we have recognized and expect to recognize.
Fair Value of Financial Instruments
The fair value of a financial instrument is the price that would be received to sell an asset or paid to transfer a liability in an orderly transaction between market participants at the measurement date. We have investments in debt securities categorized as level three in the fair value hierarchy based on inputs that are unobservable and significant to the overall fair value measurement totaling $64.8 million and $79.9 million as of December 31, 2024 and 2023, respectively, which is included in “Other assets” in the consolidated balance sheets.
The carrying amounts of our cash, cash equivalents, restricted cash, accounts receivable, accounts payable and accrued liabilities approximate fair value because of the short maturity of those instruments. Equity investments with readily determinable fair value are carried at fair value based on quoted market prices or estimated based on market conditions and risks existing at each balance sheet date. Equity investments without readily determinable fair value are measured at cost less impairment, and are adjusted for observable price changes in orderly transactions for an identical or similar investment of the same issuer.
Warranty Obligations
Our warranty accrual provides for the replacement of microinverter units, AC Battery storage solutions and related accessories, EV Chargers, IQ Gateway units and IQ Energy Router units that fail during the product’s warranty term. The warranty term related to microinverter units is 15 years for first and second generation microinverters and up to 25 years for subsequent generation microinverters. The warranty term for AC Battery
Enphase Energy, Inc. | 2024 Form 10-K | 60
storage solutions is 10 to 15 years depending on the generation and 5 years for IQ PowerPack 1500. The warranty term for the IQ Gateway and IQ Energy Router is 5 years, while the warranty term for EV Chargers is 1 to 5 years depending on the product. On a quarterly basis, we employ a consistent, systematic and rational methodology to assess the adequacy of our warranty liability. This assessment includes updating all key estimates and assumptions for each generation of product, based on historical results, trends and the most current data available as of the filing date. The key estimates and assumptions used in the warranty liability are thoroughly reviewed by management on a quarterly basis. The key estimates used by us to estimate our warranty liability are: (1) the number of units expected to fail and repaired or returned for replacement over time (i.e., return rate); and (2) the per unit cost of repair or replacement of units, including outbound shipping and limited labor costs, expected to be incurred to replace failed units over time (i.e., replacement cost).
Estimated Return Rates — Our Quality and Reliability department has primary responsibility to determine the estimated return rates for each generation of product. To establish initial return rate estimates for each generation of product, our quality engineers use a combination of industry standard mean time between failure estimates for individual components contained in that generation of product, third-party data collected on similar equipment deployed in outdoor environments similar to those in which our product are installed, and rigorous long term reliability and accelerated life cycle testing which simulates the service life of the product in a short period of time. As units are deployed into operating environments, we continue to monitor product performance through our cloud-based monitoring services. It typically takes three to nine months between the date of sale and date of end-user installation. Consequently, our ability to monitor actual failures of units sold similarly lags by three to nine months. When a product fails and is returned, we perform diagnostic root cause failure analysis to understand and isolate the underlying mechanism(s) causing the failure. We then use the results of this analysis (combined with the actual, cumulative performance data collected on those units prior to failure) to draw conclusions with respect to how or if the identified failure mechanism(s) will impact the remaining units deployed in the installed base.
As the vast majority of our microinverters have been sold to end users for residential applications, we believe that warranty return rates will be affected by changes over time in residential home ownership because we expect that subsequent homeowners are less likely to file a return than the homeowners who originally purchased the microinverters.
Estimated Replacement Costs — Three factors are considered in our analysis of estimated replacement cost: (1) the estimated cost of replacement products; (2) the estimated cost to ship replacement products to end users; and (3) the estimated labor reimbursement expected to be paid to third-party installers, or estimated labor cost expected to be incurred for field service technicians, performing replacement services for the end user. Because our warranty provides for the replacement of defective products over long periods of time (typically between 5 to 25 years, depending on the product and the generation of that product purchased), the estimated per unit cost of current and future product generations is considered in the estimated replacement cost. Estimated costs to ship replacement units are based on observable, market-based shipping costs paid by us to third-party freight carriers. We have a separate program that allows third-party installers to claim fixed-dollar reimbursements for labor costs they incur to replace failed units for a limited time from the date of original installation. Included in our estimated replacement cost is an analysis of the number of fixed-dollar labor reimbursements expected to be claimed by third-party installers over the limited offering period.
In addition to the key estimates noted above, we also compare actual warranty results to expected results and evaluate any significant differences. We may make additional adjustments to the warranty provision based on performance trends or other qualitative factors. If actual return rates, or replacement costs differ from our estimates in future periods, changes to these estimates may be required, resulting in increases or decreases in our warranty obligations. Such increases or decreases could be material.
Fair Value Option for Microinverters and Other Products Sold Since January 1, 2014
Our warranty obligations related to products sold since January 1, 2014 provide us the right, but not the requirement, to assign our warranty obligations to a third party. Under Accounting Standards Codification 825, “Financial Instruments” (also referred to as the “fair value option”), an entity may choose to elect the fair value option for such warranties at the time it first recognizes the eligible item. We made an irrevocable election to account for all eligible warranty obligations associated with products sold since January 1, 2014 at fair value. This election was made to reflect the underlying economics of the time value of money for an obligation that will be settled over an extended period of up to 25 years.
Enphase Energy, Inc. | 2024 Form 10-K | 61
We estimate the fair value of warranty obligations by calculating the warranty obligations in the same manner as for sales prior to January 1, 2014 and applying an expected present value technique to that result. The expected present value technique, an income approach, converts future amounts into a single current discounted amount. In addition to the key estimates of return rates, and replacement costs, we used certain inputs that are unobservable and significant to the overall fair value measurement. Such additional assumptions included compensation comprised of a profit element and risk premium required of a market participant to assume the obligation and a discount rate based on our credit-adjusted risk-free rate. Refer to Note 11. “Fair Value Measurements,” of the notes to consolidated financial statements included in Part II, Item 8 of this Annual Report on Form 10-K for additional information. Income Taxes
We record income taxes using the asset and liability method, which requires the recognition of deferred tax assets and liabilities for the expected tax consequences of temporary differences between the tax bases of assets and liabilities for financial reporting purposes and amounts recognized for income tax purposes. In estimating future tax consequences, generally all expected future events other than enactments or changes in the tax law or rates are considered. Valuation allowances are provided when necessary to reduce deferred tax assets to the amount expected to be realized.
We assess the realizability of the deferred tax assets to determine release of valuation allowance as necessary. In the event we determine that it is more likely than not that we would be able to realize deferred tax assets in the future in excess of our net recorded amount, an adjustment to the valuation allowance for the deferred tax asset would increase income in the period such determination was made. Likewise, should it be determined that additional amounts of the net deferred tax asset will not be realized in the future, an adjustment to increase the deferred tax asset valuation allowance will be charged to income in the period such determination is made.
We operate in various tax jurisdictions and are subject to audit by various tax authorities. We follow accounting for uncertainty in income taxes, which requires that the tax effects of a position be recognized only if it is “more likely than not” to be sustained based solely on its technical merits as of the reporting date. We consider many factors when evaluating and estimating our tax positions and tax benefits, which may require periodic adjustments, and which may not accurately anticipate actual outcomes.
Item 7A. Quantitative and Qualitative Disclosures About Market Risk
Foreign Currency Exchange Risk
We operate and conduct business in foreign countries where our foreign entities use the local currency as their respective functional currency and, as a result, are exposed to movements in foreign currency exchange rates. More specifically, we face foreign currency exposure primarily from the effect of fluctuating exchange rates on payables and receivables relating to transactions that are denominated in euros, the Indian Rupee, Brazilian real, Mexican peso and the Australian, Canadian and New Zealand dollars. These payables and receivables primarily arise from sales to customers and intercompany transactions. We also face currency exposure that arises from translating the results of our European, Indian, Brazilian, Mexican, Australian, Canadian and New Zealand operations, including sales and marketing and research and development expenses, to the U.S. dollar at exchange rates that have fluctuated from the beginning of a reporting period. We are a net receiver of euros, and therefore negatively affected by a strengthening of the U.S. dollar relative to the euro and, conversely benefit from a weakening of the U.S. dollar relative to the euro. Sales denominated in the euro as a percentage of net revenues was 21%, 28% and 17% during the years ended December 31, 2024, 2023 and 2022, respectively.
The effect of a hypothetical 10% adverse change in foreign exchange rates on monetary assets and liabilities on December 31, 2024 would not be material to our financial condition or results of operations. To date, foreign currency transaction gains and losses and exchange rate fluctuations have not been material to our financial statements, and we have not engaged in any foreign currency hedging transactions.
We do not enter into derivative financial instruments for trading or speculative purposes. We did not enter into any foreign currency forward contracts during 2024, 2023 and 2022. Any foreign currency forward contracts entered in the future will be accounted for as derivatives whereby the fair value of the contracts would be reported as other current assets or current liabilities, and gains and losses resulting from changes in the fair value would be reported in other income (expense), net, in the accompanying consolidated statements of operations.
Enphase Energy, Inc. | 2024 Form 10-K | 62
Credit Risk
Financial instruments that subject us to concentrations of credit risk consist primarily of cash, cash equivalents, marketable securities and accounts receivable. We maintain a substantial portion of our cash balances in non-interest-bearing and interest-bearing marketable securities and money market accounts. We mitigate this credit risk by transacting with major financial institutions with high credit ratings. We are not required to pledge, and are not entitled to receive, cash collateral related to these derivative instruments. We do not enter into derivative contracts for trading or speculative purposes. Our net revenues are primarily concentrated among a limited number of customers. We monitor the financial condition of our customers and perform credit evaluations whenever considered necessary and maintain an allowance for credit losses for estimated potential credit losses.
Interest Rate Risk
We had cash, cash equivalents, restricted cash and marketable securities of $1,717.6 million and $1,695.0 million as of December 31, 2024 and 2023, respectively, consisting of both non-interest bearing and interest-bearing marketable securities and money market accounts. Such interest-earning instruments carry a degree of interest rate risk, but the risk is limited due to the duration of our short term investments. To date, fluctuations in interest income have not been significant. We do not enter into investments for trading or speculative purposes and have not used any derivative financial instruments to manage our interest rate risk exposure. We have not been exposed to, nor do we anticipate being exposed to, material risks due to changes in interest rates with regard to our cash, cash equivalents, restricted cash and marketable securities.
Our cash flow exposure due to changes in interest rates related to our debt is limited, as the Notes due 2025 have a fixed interest rate of 0.25%. Additionally, the Notes due 2028 and Notes due 2026 carry a fixed interest rate of 0%. The fair value of these convertible notes may increase or decrease for various reasons, including fluctuations in the market price of our common stock, fluctuations in market interest rates and fluctuations in general economic conditions. Based upon the quoted market price as of December 31, 2024, the fair value of the Notes due 2028, Notes due 2026 and Notes due 2025 was $472.9 million, $593.8 million and $106.1 million, respectively.
A hypothetical 10% change in interest rates during any of the periods presented would not have had a material impact on our financial statements.
Enphase Energy, Inc. | 2024 Form 10-K | 63
Item 8. Financial Statements and Supplementary Data
ENPHASE ENERGY, INC.
INDEX TO CONSOLIDATED FINANCIAL STATEMENTS
AS OF DECEMBER 31, 2024 AND 2023,
AND FOR THE YEARS ENDED DECEMBER 31, 2024, 2023 AND 2022
Enphase Energy, Inc. | 2024 Form 10-K | 64
REPORT OF INDEPENDENT REGISTERED PUBLIC ACCOUNTING FIRM
To the stockholders and the Board of Directors of Enphase Energy, Inc.
Opinion on the Financial Statements
We have audited the accompanying consolidated balance sheets of Enphase Energy, Inc. and subsidiaries (the "Company") as of December 31, 2024, and 2023, the related consolidated statements of operations, comprehensive income, stockholders' equity, and cash flows, for each of the three years in the period ended December 31, 2024, and the related notes (collectively referred to as the "financial statements"). In our opinion, the financial statements present fairly, in all material respects, the financial position of the Company as of December 31, 2024, and 2023, and the results of its operations and its cash flows for each of the three years in the period ended December 31, 2024, in conformity with accounting principles generally accepted in the United States of America.
We have also audited, in accordance with the standards of the Public Company Accounting Oversight Board (United States) (PCAOB), the Company's internal control over financial reporting as of December 31, 2024, based on criteria established in Internal Control — Integrated Framework (2013) issued by the Committee of Sponsoring Organizations of the Treadway Commission and our report dated February 7, 2025, expressed an unqualified opinion on the Company's internal control over financial reporting.
Basis for Opinion
These financial statements are the responsibility of the Company's management. Our responsibility is to express an opinion on the Company's financial statements based on our audits. We are a public accounting firm registered with the PCAOB and are required to be independent with respect to the Company in accordance with the U.S. federal securities laws and the applicable rules and regulations of the Securities and Exchange Commission and the PCAOB.
We conducted our audits in accordance with the standards of the PCAOB. Those standards require that we plan and perform the audit to obtain reasonable assurance about whether the financial statements are free of material misstatement, whether due to error or fraud. Our audits included performing procedures to assess the risks of material misstatement of the financial statements, whether due to error or fraud, and performing procedures that respond to those risks. Such procedures included examining, on a test basis, evidence regarding the amounts and disclosures in the financial statements. Our audits also included evaluating the accounting principles used and significant estimates made by management, as well as evaluating the overall presentation of the financial statements. We believe that our audits provide a reasonable basis for our opinion.
Critical Audit Matter
The critical audit matter communicated below is a matter arising from the current-period audit of the financial statements that was communicated or required to be communicated to the audit committee and that (1) relates to accounts or disclosures that are material to the financial statements and (2) involved our especially challenging, subjective, or complex judgments. The communication of a critical audit matter does not alter in any way our opinion on the financial statements, taken as a whole, and we are not, by communicating the critical audit matter below, providing a separate opinion on the critical audit matter or on the accounts or disclosures to which it relates.
Warranty Obligations - Refer to Notes 2, 10 and 11 to the consolidated financial statements
Critical Audit Matter Description
The Company’s warranty obligation provides for the repair or replacement of microinverter and storage products that fail during the product’s warranty term, generally of 10 to 25 years. The estimated warranty liability is developed for each generation of product and requires management to estimate, among other factors, (1) the number of units expected to be claimed under the Company’s warranty over time (i.e., return rate); and (2) the per unit cost of repair or replacement of units, including outbound shipping and labor costs, expected to be incurred to repair or replace failed units over time (i.e., replacement cost), all of which consider historical results, trends and the most current data available when the financial statements are available to be issued. The Company’s warranty liability for all microinverter and storage products sold after January 1, 2014, is measured at fair value which incorporates a discount rate based on the Company’s credit adjusted risk free rate.
Given the subjectivity of (1) estimating the number of units expected to be claimed under the Company’s warranty over time; (2) the estimated cost to repair or replace such products, and (3) the specialized valuation skills
Enphase Energy, Inc. | 2024 Form 10-K | 65
required in evaluating discount rates, performing audit procedures to evaluate whether the estimated return rates, repair or replacement costs and discount rate were appropriately determined as of December 31, 2024, required a high degree of auditor judgment and an increased extent of effort.
How the Critical Audit Matter Was Addressed in the Audit
Our audit procedures related to the estimated warranty return rates, estimated repair or replacement costs and discount rate used in determining the warranty obligation included the following, among others:
–We tested the effectiveness of controls utilized in the review of the warranty obligation calculation, including controls over the determination of estimated warranty return rates, estimated repair or replacement costs and discount rate.
–We evaluated the methods and assumptions used by management to estimate warranty return rates, estimated repair or replacement costs and discount rate used as part of the calculation of the warranty obligation by:
•Testing the underlying data that served as the basis for the Company’s estimated warranty return rates analysis, which include historical warranty returns and historical product sales, in order to evaluate the various assumptions and historical data consisting of failure of individual components contained in its microinverters and storage products.
•Comparing management’s prior-year assumptions of estimated warranty return rates to actual warranty returns received during the current year to identify potential bias in the determination of the estimated warranty return rates used in the warranty obligation recorded.
•Testing the relevant inputs into the Company’s per unit repair or replacement costs, including third party vendor quotes.
•Testing the discount rate used in the Company’s warranty obligation, utilizing internal fair value specialists.
/s/ DELOITTE & TOUCHE LLP
San Jose, California
February 7, 2025
We have served as the Company’s auditor since 2010.
Enphase Energy, Inc. | 2024 Form 10-K | 66
REPORT OF INDEPENDENT REGISTERED PUBLIC ACCOUNTING FIRM
To the stockholders and the Board of Directors of Enphase Energy, Inc.
Opinion on Internal Control over Financial Reporting
We have audited the internal control over financial reporting of Enphase Energy, Inc. and subsidiaries (the “Company”) as of December 31, 2024, based on criteria established in Internal Control — Integrated Framework (2013) issued by the Committee of Sponsoring Organizations of the Treadway Commission (COSO). In our opinion, the Company maintained, in all material respects, effective internal control over financial reporting as of December 31, 2024, based on criteria established in Internal Control — Integrated Framework (2013) issued by COSO.
We have also audited, in accordance with the standards of the Public Company Accounting Oversight Board (United States) (PCAOB), the consolidated financial statements as of and for the year ended December 31, 2024, of the Company and our report dated February 7, 2025, expressed an unqualified opinion on those financial statements.
Basis for Opinion
The Company’s management is responsible for maintaining effective internal control over financial reporting and for its assessment of the effectiveness of internal control over financial reporting, included in the accompanying Management’s Report on Internal Control over Financial Reporting. Our responsibility is to express an opinion on the Company’s internal control over financial reporting based on our audit. We are a public accounting firm registered with the PCAOB and are required to be independent with respect to the Company in accordance with the U.S. federal securities laws and the applicable rules and regulations of the Securities and Exchange Commission and the PCAOB.
We conducted our audit in accordance with the standards of the PCAOB. Those standards require that we plan and perform the audit to obtain reasonable assurance about whether effective internal control over financial reporting was maintained in all material respects. Our audit included obtaining an understanding of internal control over financial reporting, assessing the risk that a material weakness exists, testing and evaluating the design and operating effectiveness of internal control based on the assessed risk, and performing such other procedures as we considered necessary in the circumstances. We believe that our audit provides a reasonable basis for our opinion.
Definition and Limitations of Internal Control over Financial Reporting
A company’s internal control over financial reporting is a process designed to provide reasonable assurance regarding the reliability of financial reporting and the preparation of financial statements for external purposes in accordance with generally accepted accounting principles. A company’s internal control over financial reporting includes those policies and procedures that (1) pertain to the maintenance of records that, in reasonable detail, accurately and fairly reflect the transactions and dispositions of the assets of the company; (2) provide reasonable assurance that transactions are recorded as necessary to permit preparation of financial statements in accordance with generally accepted accounting principles, and that receipts and expenditures of the company are being made only in accordance with authorizations of management and directors of the company; and (3) provide reasonable assurance regarding prevention or timely detection of unauthorized acquisition, use, or disposition of the company’s assets that could have a material effect on the financial statements.
Because of its inherent limitations, internal control over financial reporting may not prevent or detect misstatements. Also, projections of any evaluation of effectiveness to future periods are subject to the risk that controls may become inadequate because of changes in conditions, or that the degree of compliance with the policies or procedures may deteriorate.
/s/ DELOITTE & TOUCHE LLP
San Jose, California
February 7, 2025
Enphase Energy, Inc. | 2024 Form 10-K | 67
ENPHASE ENERGY, INC.
CONSOLIDATED BALANCE SHEETS
(In thousands, except par value)
| | | | | | | | | | | |
| As of |
| December 31,
2024 | | December 31,
2023 |
| ASSETS | | | |
| Current assets: | | | |
| Cash and cash equivalents | $ | 369,110 | | | $ | 288,748 | |
| Restricted cash | 95,006 | | | — | |
| Marketable securities | 1,253,480 | | | 1,406,286 | |
| Accounts receivable, net of allowances of $7,788 and $2,502 at December 31, 2024 and December 31, 2023, respectively | 223,749 | | | 445,959 | |
| Inventory | 165,004 | | | 213,595 | |
| Prepaid expenses and other current assets | 220,735 | | | 88,930 | |
| Total current assets | 2,327,084 | | | 2,443,518 | |
| Property and equipment, net | 147,514 | | | 168,244 | |
| Operating lease, right of use asset, net | 24,617 | | | 19,887 | |
| Intangible assets, net | 42,398 | | | 68,536 | |
| Goodwill | 211,571 | | | 214,562 | |
| Other assets | 180,925 | | | 215,895 | |
| Deferred tax assets, net | 315,567 | | | 252,370 | |
| | | |
| Total assets | $ | 3,249,676 | | | $ | 3,383,012 | |
| LIABILITIES AND STOCKHOLDERS’ EQUITY | | | |
| Current liabilities: | | | |
| Accounts payable | $ | 90,032 | | | $ | 116,164 | |
| Accrued liabilities | 196,887 | | | 261,919 | |
| Deferred revenues, current | 237,225 | | | 118,300 | |
| Warranty obligations, current | 34,656 | | | 36,066 | |
| | | |
| Debt, current | 101,291 | | | — | |
| Total current liabilities | 660,091 | | | 532,449 | |
| Long-term liabilities: | | | |
| | | |
| Deferred revenues, non-current | 341,982 | | | 369,172 | |
| Warranty obligations, non-current | 158,233 | | | 153,021 | |
| Other liabilities | 55,265 | | | 51,008 | |
| Debt, non-current | 1,201,089 | | | 1,293,738 | |
| | | |
| Total liabilities | 2,416,660 | | | 2,399,388 | |
| Commitments and contingencies (Note 14) | | | |
| | | |
| Stockholders’ equity: | | | |
| | | |
| Common stock, $0.00001 par value, 300,000 shares authorized; and 132,448 shares and 135,722 shares issued and outstanding at December 31, 2024 and December 31, 2023, respectively | 1 | | | 1 | |
| Additional paid-in capital | 1,084,573 | | | 939,338 | |
| Accumulated earnings (deficit) | (245,206) | | | 46,273 | |
| Accumulated other comprehensive loss | (6,352) | | | (1,988) | |
| | | |
| | | |
| Total stockholders’ equity | 833,016 | | | 983,624 | |
| Total liabilities and stockholders’ equity | $ | 3,249,676 | | | $ | 3,383,012 | |
See Notes to Consolidated Financial Statements.
Enphase Energy, Inc. | 2024 Form 10-K | 68
ENPHASE ENERGY, INC.
CONSOLIDATED STATEMENTS OF OPERATIONS
(In thousands, except per share data)
| | | | | | | | | | | | | | | | | | | | | |
| | | Years Ended December 31, |
| | | | | 2024 | | 2023 | | 2022 |
| Net revenues | | | | | $ | 1,330,383 | | | $ | 2,290,786 | | | $ | 2,330,853 | |
| Cost of revenues | | | | | 701,245 | | | 1,232,398 | | | 1,356,258 | |
| Gross profit | | | | | 629,138 | | | 1,058,388 | | | 974,595 | |
| Operating expenses: | | | | | | | | | |
| Research and development | | | | | 201,315 | | | 227,336 | | | 168,846 | |
| Sales and marketing | | | | | 206,552 | | | 231,792 | | | 215,102 | |
| General and administrative | | | | | 130,825 | | | 137,835 | | | 140,002 | |
| Restructuring and asset impairment charges | | | | | 13,154 | | | 15,684 | | | 2,384 | |
| Total operating expenses | | | | | 551,846 | | | 612,647 | | | 526,334 | |
| Income from operations | | | | | 77,292 | | | 445,741 | | | 448,261 | |
| Other income, net | | | | | | | | | |
| Interest income | | | | | 77,306 | | | 69,728 | | | 13,656 | |
| Interest expense | | | | | (8,905) | | | (8,839) | | | (9,438) | |
| Other income (expense), net | | | | | (25,534) | | | 6,509 | | | (431) | |
| | | | | | | | | |
| | | | | | | | | |
| | | | | | | | | |
| Total other income, net | | | | | 42,867 | | | 67,398 | | | 3,787 | |
| Income before income taxes | | | | | 120,159 | | | 513,139 | | | 452,048 | |
| Income tax provision | | | | | (17,501) | | | (74,203) | | | (54,686) | |
| Net income | | | | | $ | 102,658 | | | $ | 438,936 | | | $ | 397,362 | |
| Net income per share | | | | | | | | | |
| Basic | | | | | $ | 0.76 | | | $ | 3.22 | | | $ | 2.94 | |
| Diluted | | | | | $ | 0.75 | | | $ | 3.08 | | | $ | 2.77 | |
| Shares used in per share calculation: | | | | | | | | | |
| Basic | | | | | 135,167 | | | 136,376 | | | 135,349 | |
| Diluted | | | | | 140,004 | | | 143,290 | | | 144,390 | |
See Notes to Consolidated Financial Statements.
Enphase Energy, Inc. | 2024 Form 10-K | 69
ENPHASE ENERGY, INC.
CONSOLIDATED STATEMENTS OF COMPREHENSIVE INCOME
(In thousands)
| | | | | | | | | | | | | | | | | | | | | | | |
| | | Years Ended December 31, |
| | | | | 2024 | | 2023 | | 2022 | | |
| Net income | | | | | $ | 102,658 | | | $ | 438,936 | | | $ | 397,362 | | | |
| Other comprehensive income: | | | | | | | | | | | |
| Foreign currency translation adjustments | | | | | (4,715) | | | 1,190 | | | (3,185) | | | |
| Marketable securities | | | | | | | | | | | |
| | | | | | | | | | | |
| | | | | | | | | | | |
| | | | | | | | | | | |
| Change in net unrealized gain (loss), net of income tax benefit (provision) of $115, $2,468, and $(1,993) for the year ended December 31, 2024, 2023, and 2022, respectively. | | | | | 351 | | | 7,704 | | | (5,677) | | | |
| Comprehensive income | | | | | $ | 98,294 | | | $ | 447,830 | | | $ | 388,500 | | | |
See Notes to Consolidated Financial Statements.
Enphase Energy, Inc. | 2024 Form 10-K | 70
ENPHASE ENERGY, INC.
CONSOLIDATED STATEMENTS OF STOCKHOLDERS’ EQUITY
(In thousands) | | | | | | | | | | | | | | | | | | | | | | | | | | | | | | | | | | | |
| Common Stock | | Additional Paid-In
Capital | | Accumulated
Earnings (Deficit) | | Accumulated
Other
Comprehensive
Loss | | Total
Stockholders’
Equity |
| Shares | | Amount | | | | |
| Balance at December 31, 2021 | 133,894 | | | $ | 1 | | | $ | 837,924 | | | $ | (405,737) | | | $ | (2,020) | | | $ | 430,168 | |
| | | | | | | | | | | |
| Cumulative-effect adjustment to accumulated deficit related to the adoption of ASU 2020-06 | — | | | — | | | (207,967) | | | 25,710 | | | — | | | (182,257) | |
| Issuance of common stock from exercise of equity awards and employee stock purchase plan | 2,547 | | | — | | | 10,370 | | | — | | | — | | | 10,370 | |
| Payment of withholding taxes related to net share settlement of equity awards | — | | | — | | | (27,496) | | | — | | | — | | | (27,496) | |
| Deferred tax impact on equity component of partial settlement of convertible notes | — | | | — | | | (1,837) | | | — | | | — | | | (1,837) | |
| | | | | | | | | | | |
| | | | | | | | | | | |
| | | | | | | | | | | |
| | | | | | | | | | | |
| | | | | | | | | | | |
| | | | | | | | | | | |
| | | | | | | | | | | |
| | | | | | | | | | | |
| | | | | | | | | | | |
| | | | | | | | | | | |
| Stock-based compensation | — | | | — | | | 208,125 | | | — | | | — | | | 208,125 | |
| Net income | — | | | — | | | — | | | 397,362 | | | — | | | 397,362 | |
| | | | | | | | | | | |
| Foreign currency translation adjustments | — | | | — | | | — | | | — | | | (3,185) | | | (3,185) | |
| Change in net unrealized loss on marketable securities, net of tax | — | | | — | | | — | | | — | | | (5,677) | | | (5,677) | |
| Balance at December 31, 2022 | 136,441 | | | $ | 1 | | | $ | 819,119 | | | $ | 17,335 | | | $ | (10,882) | | | $ | 825,573 | |
| | | | | | | | | | | |
| Issuance of common stock from exercise of equity awards and employee stock purchase plan | 1,613 | | | — | | | 13,870 | | | — | | | — | | | 13,870 | |
| Issuance of common stock related to 365 Pronto, Inc. post combination expense | 52 | | | — | | | 10,307 | | | — | | | — | | | 10,307 | |
| | | | | | | | | | | |
| Payment of withholding taxes related to net share settlement of equity awards | — | | | — | | | (120,646) | | | — | | | — | | | (120,646) | |
| | | | | | | | | | | |
| | | | | | | | | | | |
| | | | | | | | | | | |
| | | | | | | | | | | |
| | | | | | | | | | | |
| | | | | | | | | | | |
| | | | | | | | | | | |
| | | | | | | | | | | |
| | | | | | | | | | | |
| | | | | | | | | | | |
| Settlement of convertible notes due 2023 | 900 | | | — | | | 5,000 | | | — | | | — | | | 5,000 | |
| | | | | | | | | | | |
| Stock-based compensation | — | | | — | | | 211,688 | | | — | | | — | | | 211,688 | |
| Net income | — | | | — | | | — | | | 438,936 | | | — | | | 438,936 | |
| Repurchase of common stock | (3,284) | | | — | | | — | | | (409,998) | | | — | | | (409,998) | |
| Foreign currency translation adjustment | — | | | — | | | — | | | — | | | 1,190 | | | 1,190 | |
| Change in net unrealized gain on marketable securities, net of tax | — | | | — | | | — | | | — | | | 7,704 | | | 7,704 | |
| Balance at December 31, 2023 | 135,722 | | | $ | 1 | | | $ | 939,338 | | | $ | 46,273 | | | $ | (1,988) | | | $ | 983,624 | |
| | | | | | | | | | | |
| Issuance of common stock from exercise of equity awards and employee stock purchase plan | 1,269 | | | — | | | 12,688 | | | — | | | — | | | 12,688 | |
| | | | | | | | | | | |
| Payment of withholding taxes related to net share settlement of equity awards | — | | | — | | | (78,813) | | | — | | | — | | | (78,813) | |
| | | | | | | | | | | |
| | | | | | | | | | | |
| | | | | | | | | | | |
| | | | | | | | | | | |
| | | | | | | | | | | |
| | | | | | | | | | | |
| | | | | | | | | | | |
| | | | | | | | | | | |
| | | | | | | | | | | |
| | | | | | | | | | | |
| | | | | | | | | | | |
| | | | | | | | | | | |
| Stock-based compensation | — | | | — | | | 211,360 | | | — | | | — | | | 211,360 | |
| Net income | — | | | — | | | — | | | 102,658 | | | — | | | 102,658 | |
| | | | | | | | | | | |
| Repurchase of common stock | (4,543) | | | — | | | — | | | (391,364) | | | — | | | (391,364) | |
| Excise tax on net stock repurchases | — | | | — | | | — | | | (2,773) | | | — | | | (2,773) | |
Enphase Energy, Inc. | 2024 Form 10-K | 71
| | | | | | | | | | | | | | | | | | | | | | | | | | | | | | | | | | | |
| Common Stock | | Additional Paid-In
Capital | | Accumulated
Earnings (Deficit) | | Accumulated
Other
Comprehensive
Loss | | Total
Stockholders’
Equity |
| Shares | | Amount | | | | |
| Foreign currency translation adjustment | — | | | — | | | — | | | — | | | (4,715) | | | (4,715) | |
| Change in net unrealized gain on marketable securities, net of tax | — | | | — | | | — | | | — | | | 351 | | | 351 | |
| Balance at December 31, 2024 | 132,448 | | | $ | 1 | | | $ | 1,084,573 | | | $ | (245,206) | | | $ | (6,352) | | | $ | 833,016 | |
| | | | | | | | | | | |
See Notes to Consolidated Financial Statements.
Enphase Energy, Inc. | 2024 Form 10-K | 72
ENPHASE ENERGY, INC.
CONSOLIDATED STATEMENTS OF CASH FLOWS
(In thousands)
| | | | | | | | | | | | | | | | | | | | | | | |
| | | | | Years Ended December 31, |
| | | | | | | 2024 | | 2023 | | 2022 |
| Cash flows from operating activities: | | | | | | | | | | | |
| Net income | | | | | | | $ | 102,658 | | | $ | 438,936 | | | 397,362 | |
| Adjustments to reconcile net income to net cash provided by operating activities: | | | | | | | | | | | |
| Depreciation and amortization | | | | | | | 81,389 | | | 74,708 | | | 58,775 | |
| Net accretion of discount on marketable securities | | | | | | | (8,599) | | | (15,561) | | | (2,632) | |
| Provision for credit losses | | | | | | | 6,677 | | | 1,153 | | | 119 | |
| Asset impairment | | | | | | | 28,843 | | | 10,603 | | | 1,200 | |
| Non-cash interest expense | | | | | | | 8,650 | | | 8,380 | | | 8,167 | |
| | | | | | | | | | | |
| | | | | | | | | | | |
| | | | | | | | | | | |
| | | | | | | | | | | |
| | | | | | | | | | | |
| Net gain from change in fair value of debt securities | | | | | | | (1,967) | | | (8,078) | | | (735) | |
| Stock-based compensation | | | | | | | 211,360 | | | 212,857 | | | 216,802 | |
| | | | | | | | | | | |
| Deferred income taxes | | | | | | | (58,319) | | | (43,348) | | | 3,633 | |
| Changes in operating assets and liabilities: | | | | | | | | | | | |
| Accounts receivable | | | | | | | 211,640 | | | (12,478) | | | (107,556) | |
| Inventory | | | | | | | 48,591 | | | (63,887) | | | (75,273) | |
| Prepaid expenses and other assets | | | | | | | (134,343) | | | (59,777) | | | (68,423) | |
| | | | | | | | | | | |
| Accounts payable, accrued and other liabilities | | | | | | | (85,536) | | | (22,149) | | | 133,416 | |
| Warranty obligations | | | | | | | 3,802 | | | 57,641 | | | 57,773 | |
| Deferred revenues | | | | | | | 98,847 | | | 117,780 | | | 122,189 | |
| Net cash provided by operating activities | | | | | | | 513,693 | | | 696,780 | | | 744,817 | |
| Cash flows from investing activities: | | | | | | | | | | | |
| Purchases of property and equipment | | | | | | | (33,604) | | | (110,401) | | | (46,443) | |
| | | | | | | | | | | |
| Investments in private companies | | | | | | | — | | | (15,000) | | | (16,000) | |
| | | | | | | | | | | |
| Business acquisitions, net of cash acquired | | | | | | | — | | | — | | | (62,162) | |
| Purchases of marketable securities | | | | | | | (1,184,649) | | | (2,081,431) | | | (907,430) | |
| Maturities and sale of marketable securities | | | | | | | 1,346,520 | | | 1,840,477 | | | 660,129 | |
| Net cash provided by (used in) investing activities | | | | | | | 128,267 | | | (366,355) | | | (371,906) | |
| Cash flows from financing activities: | | | | | | | | | | | |
| | | | | | | | | | | |
| | | | | | | | | | | |
| | | | | | | | | | | |
| | | | | | | | | | | |
| Partial settlement of convertible notes | | | | | | | (7) | | | — | | | — | |
| | | | | | | | | | | |
| | | | | | | | | | | |
| | | | | | | | | | | |
| | | | | | | | | | | |
| | | | | | | | | | | |
| | | | | | | | | | | |
| | | | | | | | | | | |
| | | | | | | | | | | |
| Proceeds from issuance of common stock under employee equity plans | | | | | | | 12,688 | | | 13,870 | | | 10,370 | |
| | | | | | | | | | | |
| Payment of withholding taxes related to net share settlement of equity awards | | | | | | | (78,813) | | | (120,646) | | | (27,496) | |
| | | | | | | | | | | |
| Repurchase of common stock | | | | | | | (391,364) | | | (409,998) | | | — | |
| Payment of excise tax on net stock repurchases | | | | | | | (2,773) | | | — | | | — | |
| Net cash used in financing activities | | | | | | | (460,269) | | | (516,774) | | | (17,126) | |
| Effect of exchange rate changes on cash, cash equivalents and restricted cash | | | | | | | (6,323) | | | 1,853 | | | (1,857) | |
| Net increase (decrease) in cash, cash equivalents and restricted cash | | | | | | | 175,368 | | | (184,496) | | | 353,928 | |
| Cash and cash equivalents—Beginning of period | | | | | | | 288,748 | | | 473,244 | | | 119,316 | |
| Cash, cash equivalents and restricted cash—End of period | | | | | | | $ | 464,116 | | | $ | 288,748 | | | $ | 473,244 | |
| | | | | | | | | | | |
Enphase Energy, Inc. | 2024 Form 10-K | 73
| | | | | | | | | | | | | | | | | | | | | | | |
| | | | | Years Ended December 31, |
| | | | | | | 2024 | | 2023 | | 2022 |
| Reconciliation of cash, cash equivalents and restricted cash to the consolidated balance sheets | | | | | | | | | | | |
| Cash and cash equivalents | | | | | | | 369,110 | | | 288,748 | | | 473,244 | |
| Restricted cash | | | | | | | 95,006 | | | — | | | — | |
| Total cash, cash equivalents and restricted cash | | | | | | | $ | 464,116 | | | $ | 288,748 | | | $ | 473,244 | |
| | | | | | | | | | | |
| Supplemental cash flow disclosure: | | | | | | | | | | | |
| Cash paid for interest | | | | | | | $ | 255 | | | $ | 455 | | | $ | 455 | |
| Cash paid for income taxes | | | | | | | $ | 32,660 | | | $ | 74,706 | | | $ | 33,168 | |
| | | | | | | | | | | |
| Supplemental disclosures of non-cash investing and financing activities: | | | | | | | | | | | |
| | | | | | | | | | | |
| | | | | | | | | | | |
| | | | | | | | | | | |
| Purchases of property and equipment included in accounts payable | | | | | | | $ | 11,188 | | | $ | 10,141 | | | $ | 17,396 | |
| Purchases of property and equipment through tenant improvement allowance | | | | | | | $ | — | | | $ | — | | | $ | 748 | |
| | | | | | | | | | | |
| | | | | | | | | | | |
| | | | | | | | | | | |
| | | | | | | | | | | |
| | | | | | | | | | | |
| | | | | | | | | | | |
See Notes to Consolidated Financial Statements.
Enphase Energy, Inc. | 2024 Form 10-K | 74
ENPHASE ENERGY, INC.
NOTES TO CONSOLIDATED FINANCIAL STATEMENTS
1. DESCRIPTION OF BUSINESS AND BASIS OF PRESENTATION
Description of Business
Enphase Energy, Inc. (the “Company”) is a global energy technology company. The Company delivers smart, easy-to-use solutions that manage solar generation, storage and communication on one platform.
Basis of Presentation and Consolidation
The accompanying consolidated financial statements are presented in accordance with accounting principles generally accepted in the United States (“U.S. GAAP”). The consolidated financial statements include the accounts of the Company and its wholly-owned subsidiaries. All intercompany balances and transactions have been eliminated in consolidation.
Use of Estimates
The preparation of financial statements in conformity with U.S. GAAP requires management to make estimates and assumptions that affect the reported amounts of assets and liabilities, disclosure of contingent assets and liabilities at the date of the financial statements and the reported amounts of income and expenses during the reporting period. Significant estimates and assumptions reflected in the financial statements include revenue recognition, allowance for credit losses, stock-based compensation, deferred compensation arrangements, income tax provision, inventory valuation, government grants, accrued warranty obligations, fair value of investments, convertible notes, fair value of acquired intangible assets and goodwill, useful lives of acquired intangible assets and property and equipment, incremental borrowing rate for right-of-use assets and lease liability. These estimates are based on information available as of the date of the financial statements; therefore, actual results could differ materially from those estimates due to risks and uncertainties.
2. SUMMARY OF SIGNIFICANT ACCOUNTING POLICIES
Revenue Recognition
The Company generates revenue from sales of its solutions, which include microinverter units and related accessories, IQ Battery and related accessories, IQ PowerPack 1500 and related accessories, IQ Gateway, and IQ Energy Router, cloud-based monitoring services, Electric Vehicle (“EV”) charging solutions, design, proposal, permitting, installation and lead generation services, as well as a platform matching cleantech asset owners to a local and on-demand workforce of service providers, distributors, large installers, original equipment manufacturers (“OEMs”) and strategic partners.
Revenues are recognized when control of the promised goods or services are transferred to the Company’s customers in an amount that reflects the consideration that is expected to be received in exchange for those goods or services. The Company generates all of its revenues from contracts with its customers. A description of principal activities from which the Company generates revenues follows.
•Products Delivered at a Point in Time. The Company sells its products and professional services to customers in accordance with the terms of the related customer contracts. The Company generates revenues from sales of its solutions, which include microinverter units and related accessories, storage solutions, EV charging solutions, design, proposal, permitting, installation and lead generation services, as well as a platform matching cleantech asset owners to a local and on-demand workforce of service providers to distributors, large installers, OEMs and strategic partners. Microinverter units, microinverter accessories, storage and EV solutions, design, proposal, permitting, installation and lead generation services, as well as completed work orders on a platform matching cleantech asset owners to a local and on-demand workforce of service providers, are delivered to customers at a point in time, and the Company recognizes revenue for these products or professional services when the Company transfers control of the product or professional services to the customer, which is generally upon product shipment or service delivery, respectively.
Enphase Energy, Inc. | 2024 Form 10-K | 75
ENPHASE ENERGY, INC.
NOTES TO CONSOLIDATED FINANCIAL STATEMENTS
•Products Delivered Over Time. The sale of IQ Gateway and IQ Energy Router products includes the Company’s cloud-based monitoring service. The full consideration for these products represents a single performance obligation and is deferred at the sale date and recognized over the estimated service period of 7 years. The Company also sells certain communication accessories that contain a service performance obligation to be delivered over time. The revenue from these products is recognized over the related service period, which is typically 5 years. The subscription services revenue generated from each customer’s subscription to the Company’s design and proposal software is recognized on a ratable basis over the contract term beginning on the date that the Company’s service is made available to the customer. The subscription contracts are generally 3 to 12 months in length and billed in advance.
When the Company sells a product with more than one performance obligation, such as the IQ Combiner, which includes both hardware and IQ Gateway, the total consideration is allocated to these performance obligations based on their relative standalone selling prices.
The Company estimates and records certain revenue promotions as variable consideration and recognizes these promotions as a reduction in revenue at the time the related revenue is recorded.
The Company records upfront contract acquisition costs, such as sales commissions, to be capitalized and amortized over the estimated life of the asset. For contracts that have a duration of less than one year, the Company follows the Topic 606 practical expedient and expenses these costs when incurred. Commissions related to the Company’s sale of monitoring hardware and service are capitalized and amortized over the period of the associated revenue, which is 5 years to 7 years.
Refer to Note 3. “Revenue Recognition,” for additional information related to revenue recognition. Cost of Revenues
The Company includes the following in cost of revenues: product costs, warranty, manufacturing and installation services personnel, logistics costs, freight costs, inventory write-downs, hosting services costs related to the Company’s cloud-based services, credits recognized from the advanced manufacturing production tax credit (“AMPTC”), depreciation of manufacturing test equipment, and amortization of capitalized software development costs related to the Company’s cloud-based services, lead acquisition costs, design and proposal services, and employee-related expenses associated with proposal and permitting services and design and proposal service customer support. A description of principal activities from which the Company recognizes cost of revenue is as follows:
•Products Delivered at a Point in Time. Cost of revenue from these products is recognized when the Company transfers control of the product to the customer, which is generally upon shipment or service delivery.
•Products Delivered Over Time. Cost of revenue from these products is recognized over the related service period.
Government Grants
Government grants represent benefits provided by federal, state, or local governments that are not subject to the scope of Accounting Standards Codification (“ASC”) 740. The Company recognizes a grant when it has reasonable assurance that it will comply with the grant’s conditions and that the grant will be received. Government grants that are not related to long-lived assets are considered income-based grants, which are recognized as a reduction to the related cost of activities that generated the benefit.
In August 2022, the U.S. enacted the Inflation Reduction Act of 2022 (“IRA”), which includes extension of the investment tax credit as well as credits under the AMPTC, to incentivize clean energy component sourcing and production, including for the production of microinverters. The IRA provides for an AMPTC on microinverters of 11 cents per alternating current watt basis. The AMPTC on microinverters decreases by 25% each year beginning in 2030 and ending after 2032. The Company recognized credits under AMPTC as a reduction to cost of revenues in the consolidated statement of operations for the microinverters manufactured in the United States and sold to customers during the years ended December 31, 2024 and 2023. Such credit is also reflected as an increase to prepaid income tax and a reduction of income tax payable on the Company’s consolidated balance sheets within
Enphase Energy, Inc. | 2024 Form 10-K | 76
ENPHASE ENERGY, INC.
NOTES TO CONSOLIDATED FINANCIAL STATEMENTS
prepaid expenses and other current assets and accrued liabilities, respectively, for the years ended December 31, 2024 and December 31, 2023, respectively. For the year ended December 31, 2024 and 2023, benefits recognized from AMPTC of $157.5 million and $53.5 million, respectively, were recorded as a prepaid income tax of $94.9 million (included in Prepaid Expenses and Other Current Assets) and reduction of income tax payable of $62.7 million on the consolidated balance sheet for the year ended December 31, 2024, reduction to income tax payable of $53.5 million (included in Accrued Liabilities) on the consolidated balance sheet for the year ended December 31, 2023, and as a reduction to cost of revenues of $157.5 million and $53.5 million on the consolidated statement of operations for the year ended December 31, 2024 and 2023, respectively. Amounts recognized in the consolidated financial statements are based on management’s judgement and interpretation of the most current guidance.
Cash, Cash Equivalents and Marketable Securities
The Company classifies investments in marketable securities as available-for-sale investments and records these marketable securities at fair value. The Company determines the appropriate classification of marketable securities at the time of purchase and reevaluates such designation at each balance sheet date. All highly liquid investments with original maturities of 90 days or less from the date of purchase are classified as cash equivalents, while all others are presented within current assets since these investments represent funds available for current operations and the Company has the ability and intent, if necessary, to liquidate any of these investments within one year in order to meet liquidity needs or to grow the business, including for potential business acquisitions or other strategic transactions.
Marketable securities are recorded at fair value, with the unrealized gains or losses unrelated to credit loss factors included in accumulated other comprehensive income (loss), net of tax. Realized gains and losses and declines in value determined to be other than temporary based on the specific identification method are reported in other income (expense), net in the consolidated statements of operations.
The Company periodically reviews whether the securities may be other-than-temporarily impaired, including whether or not (i) the Company has the intent to sell the security or (ii) it is more likely than not that the Company will be required to sell the security before its anticipated recovery. If one of these factors is met, the Company records an impairment loss associated with the impaired investment. The impairment loss will be recorded as a write-down of investments in the consolidated balance sheets and a realized loss within other income (expense), net in the consolidated statements of operations. There were no credit-related impairments recognized on the Company’s investments in marketable securities during the periods presented.
For purposes of identifying and measuring impairment, the policy election was made to exclude the applicable accrued interest from both the fair value and amortized cost basis. Applicable accrued interest of $10.1 million and $7.6 million, net of the allowance for credit losses, if any, is recorded in prepaid expenses and other current assets on the consolidated balance sheets as of December 31, 2024 and 2023, respectively.
Restricted Cash
Restricted cash represents cash held as certificates of deposit collateralized under a letter of credit issued to a customer. The letter of credit is required as a performance security in a face amount equal to the aggregate purchase price of the executed sales agreement. The letter of credit was issued per the terms of the executed sales agreement and the Company has collateralized certificates of deposit under this letter of credit in an amount of $95.0 million, which was reflected as restricted cash on the Company’s consolidated balance sheet as of December 31, 2024.
Fair Value of Financial Instruments
The fair value of a financial instrument is the price that would be received to sell an asset or paid to transfer a liability in an orderly transaction between market participants at the measurement date. The carrying amounts of the Company’s cash and cash equivalents and restricted cash, accounts receivable, accounts payable and accrued liabilities approximate fair value because of the short maturity of those instruments. Equity investments with readily determinable fair value are carried at fair value based on quoted market prices or estimated based on market conditions and risks existing at each balance sheet date. Equity investments without readily determinable fair value
Enphase Energy, Inc. | 2024 Form 10-K | 77
ENPHASE ENERGY, INC.
NOTES TO CONSOLIDATED FINANCIAL STATEMENTS
are measured at cost, less impairment and are adjusted for observable price changes in orderly transactions for an identical or similar investment of the same issuer.
Accounts Receivables and Contract Assets
The Company receives payments from customers based upon contractual payment terms. Accounts receivable are recorded when the right to consideration becomes unconditional. Contract assets recorded in prepaid assets and other current assets on the consolidated balance sheet include deferred product costs and commissions associated with the deferred revenue and will be amortized along with the associated revenue.
Allowance for Credit Losses
The Company maintains allowances for credit losses for uncollectible accounts receivable. Management estimates anticipated credit losses based on days past due, customer specific experience, collection history, the financial health of customers including from the impacts of the broad-based slowdown beginning in the second quarter of 2023 in the United States and in the third quarter of 2023 in Europe, among other factors. Accounts receivables are recorded net of allowance for credit losses totaling $7.8 million and $2.5 million as of December 31, 2024 and December 31, 2023, respectively. The $7.8 million allowance for credit losses as of December 31, 2024 includes $6.2 million related to a customer that filed for bankruptcy under Chapter 11 of the United States Bankruptcy Code (“Chapter 11 bankruptcy”) during the year ended December 31, 2024. Management will continue to monitor certain customers experiencing considerable financial difficulties to perform collectability assessment and evaluate the impact to the Company's revenue recognition and allowance for credit losses on its financial statements. Accounts receivable are recorded net of allowance for credit losses. The following table sets forth activities in the allowance for credit losses for the periods indicated.
| | | | | | | | | | | | | | | | | |
| December 31, |
| 2024 | | 2023 | | 2022 |
| | | | | |
| (In thousands) |
| Balance, at beginning of year | $ | 2,502 | | | $ | 979 | | | $ | 1,590 | |
| Net charges to revenue | 4,828 | | | — | | | — | |
| Net charges to expense | 1,849 | | | 1,388 | | | (119) | |
| Write-offs, net of recoveries | (1,391) | | | 135 | | | (492) | |
| Balance, at end of year | $ | 7,788 | | | $ | 2,502 | | | $ | 979 | |
Inventory
Inventory is valued at the lower of cost or market. Market is current replacement cost (by purchase or by reproduction, dependent on the type of inventory). In cases where market exceeds net realizable value (i.e., estimated selling price less reasonably predictable costs of completion and disposal), inventories are stated at net realizable value. Market is not considered to be less than net realizable value reduced by an allowance for an approximately normal profit margin. The Company determines cost on a first-in first-out basis. Certain factors could affect the realizable value of its inventory, including customer demand and market conditions. Management assesses the valuation on a quarterly basis and writes down the value for any excess and obsolete inventory based upon expected demand, anticipated sales price, effect of new product introductions, product obsolescence, customer concentrations, product merchantability and other factors. Inventory write-downs are equal to the difference between the cost of inventories and market.
Long-Lived Assets
Property and equipment are stated at cost less accumulated depreciation. Cost includes amounts paid to acquire or construct the asset as well as any expenditure that substantially adds to the value of or significantly extends the useful life of an existing asset. Repair and maintenance costs are expensed as incurred. Depreciation and amortization are computed using the straight-line method over the estimated useful lives of the assets, which range from 3 to 10 years. Leasehold improvements are amortized over the shorter of the lease term or expected useful life of the improvements.
Enphase Energy, Inc. | 2024 Form 10-K | 78
ENPHASE ENERGY, INC.
NOTES TO CONSOLIDATED FINANCIAL STATEMENTS
Internal-use software, whether purchased or developed, is capitalized at cost and amortized on a straight-line basis over its estimated useful life. Costs associated with internally developed software are expensed until the point at which the project has reached the development stage. Subsequent additions, modifications or upgrades to internal-use software are capitalized only to the extent that they provide additional functionality. Software maintenance and training costs are expensed in the period in which they are incurred. The capitalization of internal-use software requires judgment in determining when a project has reached the development stage and the period over which the Company expects to benefit from the use of that software. Capitalized costs are recorded as part of property and equipment in the consolidated balance sheets. Capitalized internal-use software is amortized on a straight-line basis over its estimated useful life, which is generally three years, and is recorded as cost of revenue in the consolidated statements of operations.
The Company capitalizes implementation costs related to cloud computing (i.e., hosting) arrangements that are accounted for as a service contract that meets the accounting requirement for capitalization as such implementation costs were incurred to develop or utilize internal-use software hosted by a third-party vendor. The capitalized implementation costs are recorded as part of “Other assets” on the consolidated balance sheets and is amortized over the length of the service contract.
Property and equipment, including internal-use software, and capitalized implementation costs related to cloud computing arrangements, are reviewed for impairment whenever events or changes in circumstances indicate that the carrying amount of an asset group may not be recoverable. An impairment loss would be recognized when the carrying amount of an asset group exceeds the estimated undiscounted future cash flows expected to result from the use of the asset group and its eventual disposition. The amount of the impairment loss to be recorded is calculated by the excess of the asset group’s carrying value over its fair value. Fair value is generally determined using an undiscounted cash flow analysis. The Company recorded asset impairment charges of $2.3 million, $5.7 million and zero in the years ended December 31, 2024, 2023 and 2022, respectively, associated with property and equipment, net. There were no events or changes in circumstances that may indicate the carrying amount of the remaining long-lived assets is not recoverable.
Leases
The Company determines if an arrangement is or contains a lease at inception. Operating lease assets represent the Company’s right to use an underlying asset for the lease term and lease liabilities represent the Company’s obligation to make lease payments over the lease term.
The Company does not have any finance leases. Operating lease assets and liabilities are recognized based on the present value of the remaining lease payments over the lease term, discounted using the Company’s incremental borrowing rate. Operating lease assets also include initial direct costs incurred and prepaid lease payments, minus any lease incentives. The Company’s lease terms include options to extend or terminate the lease when it is reasonably certain that the Company will exercise that option. Lease expense is recognized on a straight-line basis over the lease term. Leases with an initial term of one year or less are considered short-term leases and are not recognized as lease assets and liabilities. The Company recognizes the cost of such short-term leases on a straight-line basis over the term of the underlying agreement. The Company combines the lease and non-lease components in determining the operating lease assets and liabilities.
An impairment loss would be recognized when the carrying amount of an asset group exceeds the estimated undiscounted future cash flows expected to result from the use of the asset group. The Company recorded right of use asset impairment charges of less than $0.1 million, $1.1 million and $1.2 million in the years ended December 31, 2024, 2023 and 2022, respectively.
Business Combinations
Assets acquired and liabilities assumed as part of a business acquisition are generally recorded at their fair value at the date of acquisition. The excess of purchase price over the fair value of assets acquired and liabilities assumed is recorded as goodwill. Determining fair value of identifiable assets, particularly intangibles, and liabilities acquired also requires the Company to make estimates, which are based on all available information and in some cases assumptions with respect to the timing and amount of future revenues and expenses associated with an asset. Accounting for business acquisitions requires the Company to make judgments as to whether a purchase transaction is a multiple element contract, meaning that it includes other transaction components. This judgment
Enphase Energy, Inc. | 2024 Form 10-K | 79
ENPHASE ENERGY, INC.
NOTES TO CONSOLIDATED FINANCIAL STATEMENTS
and determination affect the amount of consideration paid that is allocable to assets and liabilities acquired in the business purchase transaction. Additional information existing as of the acquisition date but unknown to the Company may become known during the remainder of the measurement period, not to exceed 12 months from the acquisition date, which may result in changes to the amounts and allocations recorded.
Goodwill
Goodwill results from the purchase consideration paid in excess of the fair value of the net assets recorded in connection with business acquisitions. Goodwill is not amortized but is assessed for potential impairment at least annually during the fourth quarter of each fiscal year or between annual tests if an event occurs or circumstances change that would indicate the carrying amount may be impaired. Goodwill is tested at the reporting unit level, which the Company has determined to be the same as the entity as a whole (entity level). The Company first performs qualitative assessment to determine whether it is more likely than not that the fair value of the Company’s reporting unit is less than its carrying value. If, after assessing the qualitative factors, the Company determines that it is more likely than not that the fair value of its reporting unit is less than its carrying value, an impairment analysis will be performed.
Qualitative factors include industry and market consideration, overall financial performance, share price trends and market capitalization and Company-specific events. The Company determined, after performing a qualitative review of its one reporting unit, that it is more likely than not that the fair value of its reporting unit exceeds its carrying value. Accordingly, there was no indication of impairment in the years ended December 31, 2024, 2023 and 2022 and no quantitative goodwill impairment test was performed.
Intangible Assets
Intangible assets include patents and other purchased intangible assets. Intangible assets with finite lives are amortized on a straight-line basis, with estimated useful lives ranging from 5 to 9 years. Indefinite-lived intangible assets are tested for impairment annually and are also tested for impairment between annual tests if an event occurs or circumstances change that would indicate that the carrying amount may be impaired. Intangible assets with finite lives are tested for impairment whenever events or circumstances indicate that the carrying amount of an asset group may not be recoverable. An impairment loss is recognized when the carrying amount of an asset group exceeds the estimated undiscounted cash flows used in determining the fair value of the asset group. The amount of the impairment loss to be recorded is calculated by the excess of the asset group’s carrying value over its fair value. Fair value is generally determined using a discounted cash flow analysis. The Company recorded asset impairment charges of $3.5 million, $3.8 million and zero in the years ended December 31, 2024, 2023 and 2022, respectively, associated with the developed technology and customer relationship intangible asset. There were no events or changes in circumstances that may indicate the carrying amount of remaining assets is not recoverable.
Contract Liabilities
Contract liabilities are recorded as deferred revenue on the accompanying consolidated balance sheets and include payments received in advance of performance obligations under the contract and are realized when the associated revenue is recognized under the contract.
Warranty Obligations
The Company’s warranty accrual provides for the replacement of microinverter units, AC Battery storage solutions and accessories, EV Chargers, IQ Gateway and IQ Energy Router units that fail during the product’s warranty term. The warranty term related to microinverter units is typically 15 years for first and second generation microinverters and up to 25 years for subsequent generation microinverters. The warranty term for AC Battery storage solutions is 10 to 15 years for IQ Battery depending on the generation and 5 years for IQ PowerPack 1500. The warranty term for the IQ Gateway and IQ Energy Router is 5 years, while the warranty term for EV Chargers is 1 to 5 years depending on the product. On a quarterly basis, the Company employs a consistent, systematic and rational methodology to assess the adequacy of its warranty liability. This assessment includes updating all key estimates and assumptions for each generation of product, based on historical results, trends and the most current data available as of the filing date. The key estimates and assumptions used in the warranty liability are thoroughly reviewed by management on a quarterly basis. The key estimates used by the Company to estimate its warranty liability are: (1) the number of units expected to fail and be repaired or returned for replacement over time
Enphase Energy, Inc. | 2024 Form 10-K | 80
ENPHASE ENERGY, INC.
NOTES TO CONSOLIDATED FINANCIAL STATEMENTS
(i.e., return rate); and (2) the per unit cost of repair or replacement of units, including outbound shipping and labor costs, expected to be incurred to replace failed units over time (i.e., replacement cost).
Estimated Return Rates — The Company’s Quality and Reliability department has primary responsibility to determine the estimated return rates for each generation of product. To establish initial return rate estimates for each generation of product, the Company’s quality engineers use a combination of industry standard mean time between failure estimates for individual components contained in its product, third-party data collected on similar equipment deployed in outdoor environments similar to those in which the Company’s products are installed, and rigorous long term reliability and accelerated life cycle testing which simulates the service life of the product in a short period of time. As units are deployed into operating environments, the Company continues to monitor product performance through its cloud-based monitoring services. It typically takes three to nine months between the date of sale and date of end-user installation. Consequently, the Company’s ability to monitor actual failures of units sold similarly lags by three to nine months. When a product fails and is returned, the Company performs diagnostic root cause failure analysis to understand and isolate the underlying mechanism(s) causing the failure. The Company then uses the results of this analysis (combined with the actual, cumulative performance data collected on those units prior to failure through the Company’s cloud-based monitoring services) to draw conclusions with respect to how or if the identified failure mechanism(s) will impact the remaining units deployed in the installed base.
As the vast majority of the Company’s microinverters have been sold to end users for residential applications, the Company believes that warranty return rates will be affected by changes over time in residential home ownership because the Company expects that subsequent homeowners are less likely to file returns than the homeowners who originally purchase the microinverters.
Estimated Replacement Costs — Three factors are considered in the Company’s analysis of estimated replacement cost: (1) the estimated cost of replacement products; (2) the estimated cost to ship replacement products to end users; and (3) the estimated labor reimbursement expected to be paid to third-party installers, or estimated labor cost expected to be incurred for field service technicians, performing replacement services for the end user. Because the Company’s warranty provides for the replacement of defective microinverters or other products over long periods of time (between 5 years to 25 years, depending on the product and the generation of that product purchased), the estimated per unit cost of current and future product generations is considered in the estimated replacement cost. Estimated costs to ship replacement units are based on observable, market-based shipping costs paid by the Company to third-party freight carriers. The Company has a separate program that allows third-party installers to claim fixed-dollar reimbursements for labor costs they incur to replace failed products for a limited time from the date of original installation. Included in the Company’s estimated replacement cost is an analysis of the number of fixed-dollar labor reimbursements expected to be claimed by third-party installers over the limited offering period.
In addition to the key estimates noted above, the Company also compares actual warranty results to expected results and evaluates any significant differences. Management may make additional adjustments to the warranty provision based on performance trends or other qualitative factors. If actual return rates or replacement costs differ from the Company’s estimates in future periods, changes to these estimates may be required, resulting in increases or decreases in the Company’s warranty obligations. Such increases or decreases could be material.
Fair Value Option for Microinverters and Other Products Sold Since January 1, 2014
The Company’s warranty obligations related to products sold since January 1, 2014 provide the Company the right, but not the requirement, to assign its warranty obligations to a third party. Under ASC 825, “Financial Instruments” (also referred to as “fair value option”), an entity may choose to elect the fair value option for such warranties at the time it first recognizes the eligible item. The Company made an irrevocable election to account for all eligible warranty obligations associated with products sold since January 1, 2014 at fair value. This election was made to reflect the underlying economics of the time value of money for an obligation that will be settled over an extended period of up to 25 years.
Enphase Energy, Inc. | 2024 Form 10-K | 81
ENPHASE ENERGY, INC.
NOTES TO CONSOLIDATED FINANCIAL STATEMENTS
The Company estimates the fair value of warranty obligations by calculating the warranty obligations in the same manner as for sales prior to January 1, 2014 and applying an expected present value technique to that result. The expected present value technique, an income approach, converts future amounts into a single current discounted amount. In addition to the key estimates of return rates and replacement costs, the Company used certain inputs that are unobservable and significant to the overall fair value measurement. Such additional assumptions included compensation comprised of a profit element and risk premium required of a market participant to assume the obligation and a discount rate based on the Company’s credit-adjusted risk-free rate. Refer to Note 11. “Fair Value Measurements,” for additional information. Warranty obligations initially recorded at fair value at the time of sale will be subsequently re-measured to fair value at each reporting date. In addition, the fair value of the liability will be accreted over the corresponding term of the warranty of up to 25 years using the effective interest method.
Commitments and Contingencies
In the normal course of business, the Company is subject to loss contingencies and loss recoveries, such as legal proceedings and claims arising out of its business as well as tariff refunds. An accrual for a loss contingency or loss recovery is recognized when it is probable and the amount of loss or recovery can be reasonably estimated.
Common Stock Repurchase
The Company accounts for repurchase of common stock under ASC 505 and charges the entire cost of repurchase including excise tax accrued pursuant to the repurchase to the accumulated earnings (deficit).
Advertising Costs
Advertising costs, which are expensed and included in sales and marketing expense when incurred, were $1.7 million, $3.8 million and $3.8 million during the years ended December 31, 2024, 2023 and 2022, respectively.
Research and Development Costs
The Company expenses research and development costs as incurred. Research and development expense consists primarily of expensed equipment for product development, personnel costs, including salaries, benefits and stock-based compensation, other professional costs and allocated facilities costs.
Stock-Based Compensation
Share-based payments are required to be recognized in the Company’s consolidated statements of operations based on their fair values and the estimated number of shares expected to vest. The Company measures stock-based compensation expense for all share-based payment awards made to employees and directors, based on the estimated fair values on the date of the grant. The fair value of restricted stock units (“RSUs”) granted is determined based on the price of the Company’s common stock on the date of grant. The fair value of non-market‑based performance stock units (“PSUs”) granted is determined based on the date of grant or when achievement of performance is probable. The fair value of market‑based performance stock units granted is determined using a Monte‑Carlo model based on the date of grant or when achievement of performance is probable.
Stock-based compensation for RSUs is recognized on a straight-line basis over the requisite service period. Stock-based compensation for PSUs without market conditions is recognized when the performance condition is probable of being achieved, and then on a graded basis over the requisite service period. Stock-based compensation for PSUs with market conditions is recognized on a straight-line basis over the requisite service period. Additionally, the Company estimates its forfeiture rate annually based on historical experience and revises the estimates of forfeiture in subsequent periods if actual forfeitures differ from those estimates.
Foreign Currency Translation
The Company and most of its subsidiaries use their respective local currency as their functional currency. Accordingly, foreign currency assets and liabilities are translated using exchange rates in effect at the end of the period. Aggregate exchange gains and losses arising from the translation of foreign assets and liabilities are included in accumulated other comprehensive loss in stockholders' equity. Foreign subsidiaries that use the U.S.
Enphase Energy, Inc. | 2024 Form 10-K | 82
ENPHASE ENERGY, INC.
NOTES TO CONSOLIDATED FINANCIAL STATEMENTS
dollar as their functional currency remeasure monetary assets and liabilities using exchange rates in effect at the end of the period. In addition, transactions that are denominated in non-functional currency are remeasured using exchange rates in effect at the end of the period. Exchange gains and losses arising from the remeasurement of monetary assets and liabilities are included in other income (expense), net, in the consolidated statements of operations. Non-monetary assets and liabilities are carried at their historical values.
Comprehensive Income
Comprehensive income consists of two components, net income and other comprehensive income. Other comprehensive income refers to gains and losses that are recorded as an element of stockholders’ equity but are excluded from net income. The Company’s other comprehensive income consists of foreign currency translation adjustments and changes in net unrealized gain (loss) on marketable securities, net of tax.
Income Taxes
The Company records income taxes using the asset and liability method, which requires the recognition of deferred tax assets and liabilities for the expected tax consequences of temporary differences between the tax bases of assets and liabilities for financial reporting purposes and amounts recognized for income tax purposes. In estimating future tax consequences, generally all expected future events other than enactments or changes in the tax law or rates are considered. Valuation allowances are provided when necessary to reduce deferred tax assets to the amount expected to be realized.
The Company assesses the realizability of the deferred tax assets to determine release of valuation allowance as necessary. In the event the Company determines that it is more likely than not that the Company would be able to realize deferred tax assets in the future in excess of its net recorded amount, an adjustment to the valuation allowance for the deferred tax asset would increase income in the period such determination was made. Likewise, should it be determined that additional amounts of the net deferred tax asset will not be realized in the future, an adjustment to increase the deferred tax asset valuation allowance will reduce income in the period such determination is made.
The Company operates in various tax jurisdictions and is subject to audit by various tax authorities. The Company follows accounting for uncertainty in income taxes which requires that the tax effects of a position be recognized only if it is “more likely than not” to be sustained based solely on its technical merits as of the reporting date. The Company considers many factors when evaluating and estimating its tax positions and tax benefits, which may require periodic adjustments, and which may not accurately anticipate actual outcomes.
Recently Adopted Accounting Pronouncements
In November 2023, the Financial Accounting Standard Board (“FASB”) issued Accounting Standards Update (“ASU”) 2023-07, “Segment Reporting (Topic 280): Improvements to Reportable Segment Disclosures” (“ASU 2023-07”). ASU 2023-07 requires additional disclosures for segment reporting, including disclosure of the title and position of the Chief Operating Decision Maker and requires a public entity that has a single reportable segment to provide all the disclosures required by the amendments in ASU 2023-07, and all existing segment disclosures in Topic 280. ASU 2023-07 is effective for fiscal periods beginning after December 15, 2023, and interim periods within fiscal years beginning after December 15, 2024. The Company adopted ASU 2023-07 effective for its Annual Report on Form 10-K for the year ended December 31, 2024 and subsequent interim periods. Since ASU 2023-07 addresses only disclosures, the adoption of ASU 2023-07 did not have a significant impact on its consolidated financial statements.
Recently Issued Accounting Pronouncements
Not Yet Effective
In December 2023, the FASB issued ASU 2023-09, “Income Taxes (Topic 740): Improvements to Income Tax Disclosures” (“ASU 2023-09”). ASU 2023-09 requires that an entity disclose specific categories in the effective tax rate reconciliation as well as provide additional information for reconciling items that meet a quantitative threshold, certain disclosures of state versus federal income tax expenses and taxes paid. ASU 2023-09 is effective for fiscal years beginning after December 15, 2024. The Company does not expect the adoption of ASU 2023-09 to have a significant impact on its consolidated financial statements and will adopt the standard effective January 1, 2025.
Enphase Energy, Inc. | 2024 Form 10-K | 83
ENPHASE ENERGY, INC.
NOTES TO CONSOLIDATED FINANCIAL STATEMENTS
In November 2024, the FASB issued ASU 2024-03, “Income Statement-Reporting Comprehensive Income-Expense Disaggregation Disclosures” (“ASU 2024-03”), which requires additional disclosure of certain costs and expenses within the notes to the financial statements. ASU 2024-03 is effective for fiscal years beginning after December 15, 2026, and interim periods beginning after December 15, 2027. Early adoption is permitted. The Company is currently evaluating the impact from ASU 2024-03 on its consolidated financial statements disclosures.
3. REVENUE RECOGNITION
Disaggregated Revenue
The Company has one major business activity, which is the design, manufacture and sale of solutions for the solar photovoltaic (“PV”) industry. Disaggregated revenue by primary geographical market and timing of revenue recognition for the Company’s single product line are as follows:
| | | | | | | | | | | | | | | | | | | | | |
| | | Years Ended December 31, |
| | | | | 2024 | | 2023 | | 2022 |
| | | | | | | | | |
| | | | | (In thousands) |
| Primary geographical markets: | | | | | | | | | |
| United States | | | | | $ | 934,690 | | | $ | 1,469,108 | | | $ | 1,761,846 | |
| | | | | | | | | |
| | | | | | | | | |
| | | | | | | | | |
| | | | | | | | | |
International (1) | | | | | 395,693 | | | 821,678 | | | 569,007 | |
| Total | | | | | $ | 1,330,383 | | | $ | 2,290,786 | | | $ | 2,330,853 | |
| | | | | | | | | |
| Timing of revenue recognition: | | | | | | | | | |
| Products delivered at a point in time | | | | | $ | 1,204,367 | | | $ | 2,181,099 | | | $ | 2,253,645 | |
| Products and services delivered over time | | | | | 126,016 | | | 109,687 | | | 77,208 | |
| Total | | | | | $ | 1,330,383 | | | $ | 2,290,786 | | | $ | 2,330,853 | |
(1) Our revenues generated from France has represented 10.6%, less than 10% and less than 10% of our net revenues for the years ended December 31, 2024, 2023 and 2022, respectively. Our net revenues generated from the Netherlands has represented less than 10%, 15.3%, and less than 10% of our net revenues for the years ended December 31, 2024, 2023 and 2022, respectively.
Contract Balances
Accounts receivables, and contract assets and contract liabilities from contracts with customers, are as follows:
| | | | | | | | | | | |
| December 31,
2024 | | December 31,
2023 |
| | | |
| (In thousands) |
| Accounts receivables | $ | 223,749 | | | $ | 445,959 | |
| | | |
| Short-term contract assets (Prepaid expenses and other current assets) | 42,001 | | | 40,241 | |
| Long-term contract assets (Other assets) | 110,954 | | | 124,190 | |
| | | |
| | | |
| Short-term contract liabilities (Deferred revenues, current) | 237,225 | | | 118,300 | |
| Long-term contract liabilities (Deferred revenues, non-current) | 341,982 | | | 369,172 | |
| | | |
The Company receives payments from customers based upon contractual payment terms. Accounts receivables are recorded in an amount that reflects the consideration that is expected to be received in exchange for those goods or services when the right to consideration becomes unconditional.
Contract assets include deferred product costs and commissions associated with the deferred revenue and will be amortized along with the associated revenue. The Company had no asset impairment charges related to contract assets for the year ended December 31, 2024.
Enphase Energy, Inc. | 2024 Form 10-K | 84
ENPHASE ENERGY, INC.
NOTES TO CONSOLIDATED FINANCIAL STATEMENTS
Significant changes in the balances of contract assets (prepaid expenses and other current assets) as of December 31, 2024 are as follows (in thousands):
| | | | | |
| Contract Assets | |
| Contract Assets, beginning of period | $ | 164,431 | |
| Amount recognized | (48,837) | |
| Increased due to billings | 37,361 | |
| Contract Assets, end of period | $ | 152,955 | |
Contract liabilities are recorded as deferred revenue on the accompanying consolidated balance sheets and include payments received in advance of performance obligations under the contract and are realized when the associated revenue is recognized under the contract.
For the year ended December 31, 2024, contract liabilities included $110.3 million of cash prepayments from its customers for products to be delivered in 2025, which represents the amount equal to the aggregate purchase price of the executed sales agreements.
contract liabilities (deferred revenues) as of December 31, 2024 are as follows (in thousands):
| | | | | |
| Contract Liabilities | |
| Contract Liabilities, beginning of period | $ | 487,472 | |
| Revenue recognized | (126,015) | |
| |
| Increased due to billings | 107,477 | |
| Increased due to customer deposits | 110,273 | |
| Contract Liabilities, end of period | $ | 579,207 | |
| |
| |
Remaining Performance Obligations
Estimated revenue expected to be recognized in future periods related to performance obligations that are unsatisfied or partially unsatisfied at the end of the reporting period are as follows:
| | | | | |
| December 31,
2024 |
| (In thousands) |
| Fiscal year: | |
| 2025 | $ | 237,207 | |
| 2026 | 109,619 | |
| 2027 | 89,633 | |
| 2028 | 68,480 | |
| 2029 | 44,332 | |
| Thereafter | 29,936 | |
| Total | $ | 579,207 | |
| |
| |
| |
| |
| |
4. INVENTORY
Inventory consists of the following:
| | | | | | | | | | | |
| |
| December 31,
2024 | | December 31,
2023 |
| | | |
| (In thousands) |
| Raw materials | $ | 38,740 | | | $ | 30,849 | |
| Finished goods | 126,264 | | | 182,746 | |
| Total inventory | $ | 165,004 | | | $ | 213,595 | |
Enphase Energy, Inc. | 2024 Form 10-K | 85
ENPHASE ENERGY, INC.
NOTES TO CONSOLIDATED FINANCIAL STATEMENTS
5. PROPERTY AND EQUIPMENT, NET
Property and equipment, net consist of the following:
| | | | | | | | | | | | | | | | | |
| Estimated Useful
Life | | December 31, |
| | 2024 | | 2023 |
| | | | | |
| (Years) | | (In thousands) |
| Equipment and machinery | 3-10 | | $ | 207,300 | | | $ | 186,298 | |
| Furniture and fixtures | 5-10 | | 3,341 | | | 3,222 | |
| Computer equipment | 3-5 | | 7,241 | | | 7,744 | |
| Capitalized software costs | 3-5 | | 74,558 | | | 61,577 | |
| Building and leasehold improvements | 3-10 | | 19,047 | | | 17,058 | |
| | | | | |
| Construction in process | | | 19,305 | | | 29,752 | |
| Total | | | 330,792 | | | 305,651 | |
| Less: accumulated depreciation and amortization | | | (183,278) | | | (137,407) | |
| Property and equipment, net | | | $ | 147,514 | | | $ | 168,244 | |
Depreciation expense for property and equipment, net, for the years ended December 31, 2024, 2023 and 2022 was $51.5 million, $40.7 million and $27.7 million, respectively.
As of December 31, 2024 and 2023, unamortized capitalized software costs were $22.6 million and $25.2 million, respectively.
During the years ended December 31, 2024 and 2023, the Company determined that a triggering event had occurred as a result of changes to the Company’s long-term projections, accordingly, the Company recorded an impairment charge for the property and equipment, net asset of $2.3 million and $5.7 million, respectively, within “Restructuring and asset impairment charges” on the consolidated statement of operations.
6. BUSINESS COMBINATIONS
Acquisition of GreenCom Networks AG (“GreenCom”)
On October 10, 2022, the Company completed the acquisition of GreenCom, a privately-held company, for paid cash consideration of approximately $34.9 million. GreenCom provided Internet of Things (IoT) software solutions for customers to connect and manage a wide range of distributed energy devices within the home. This acquisition added headcount to the Company’s engineering team in Europe to introduce the IQ Energy Router family of devices in Germany and Austria beginning in June 2023, which are designed to allow the integration of select third-party EV chargers and heat pumps into the Company’s solar and battery systems.
The acquisition has been accounted for as a business combination under the acquisition method, and accordingly, the approximately $34.9 million purchase price is allocated to the tangible and identifiable intangible assets acquired and liabilities assumed based on their respective fair values on the acquisition date.
The following table summarizes the estimated fair values of the assets acquired and liabilities assumed at the acquisition date (in thousands):
| | | | | | | | |
| | |
| Net tangible liabilities acquired | | $ | (118) | |
| Intangible assets | | 13,900 | |
| Deferred tax asset, net | | 4,578 | |
| Goodwill | | 16,536 | |
| Net assets acquired | | $ | 34,896 | |
The excess of the consideration paid over the fair values assigned to the assets acquired and liabilities assumed represents the goodwill resulting from the acquisition. Goodwill is primarily attributable to expected synergies in the Company’s solar offerings and cross-selling opportunities. None of the goodwill is expected to be deductible for German income tax purposes.
Enphase Energy, Inc. | 2024 Form 10-K | 86
ENPHASE ENERGY, INC.
NOTES TO CONSOLIDATED FINANCIAL STATEMENTS
Intangible assets consist primarily of developed technology and customer relationships. Developed technology includes a combination of unpatented technology, trade secrets, computer software and research processes that facilitates home energy management through integration of existing and planned new products in renewable energy sector. Customer relationships relate to GreenCom’s ability to sell current and future offerings, as well as products built around the current offering, to its existing customers.
The following table shows the fair value of the separately identifiable intangible assets at the time of acquisition and the period over which each intangible asset will be amortized:
| | | | | | | | | | | | |
| | Fair Value | | Useful Life |
| | (In thousands) | | (Years) |
| Developed technology | | $ | 8,000 | | | 5 |
| Customer relationships | | 5,900 | | | 5 |
| Total identifiable intangible assets | | $ | 13,900 | | | |
The results of GreenCom have been included in the Company’s consolidated statement of operation since the acquisition date and are not material. Pro forma financial information has not been presented for the GreenCom acquisition as the impact to the Company’s consolidated financial statements was not material.
The Company incurred and accrued costs related to acquisition of $1.8 million that were recorded in general and administrative expenses in the accompanying consolidated statements of operations for the year ended December 31, 2022.
Acquisition of SolarLeadFactory, LLC. (“SolarLeadFactory”)
On March 14, 2022, the Company completed the acquisition of SolarLeadFactory, a privately-held company. SolarLeadFactory provided high quality leads to solar installers. As part of the purchase price, the Company paid approximately $26.1 million in cash on March 14, 2022.
The acquisition has been accounted for as a business combination under the acquisition method, and accordingly, the total purchase price is allocated to the tangible and identifiable intangible assets acquired and liabilities assumed based on their respective fair values on the acquisition date.
The following table summarizes the estimated fair values of the assets acquired and liabilities assumed at the acquisition date (in thousands):
| | | | | | | | |
| | |
| Net tangible assets acquired | | $ | 2,239 | |
| Intangible assets | | 11,200 | |
| | |
| Goodwill | | 12,612 | |
| Net assets acquired | | $ | 26,051 | |
The excess of the consideration paid over the fair values assigned to the assets acquired and liabilities assumed represents the goodwill resulting from the acquisition. Goodwill is primarily attributable to expected synergies in the Company’s solar offerings and cross-selling opportunities. The entire goodwill amount is expected to be deductible for U.S. federal income tax purposes over 15 years.
Intangible assets consist primarily of developed technology and customer relationships. Developed technology includes a combination of unpatented technology, trade secrets, computer software and research processes that represent the foundation for the existing and planned new products to facilitate the generation of
Enphase Energy, Inc. | 2024 Form 10-K | 87
ENPHASE ENERGY, INC.
NOTES TO CONSOLIDATED FINANCIAL STATEMENTS
new content. Customer relationships relate to SolarLeadFactory’s ability to sell current and future offerings, as well as products built around the current offering, to its existing customers.
The following table shows the fair value of the separately identifiable intangible assets at the time of acquisition and the period over which each intangible asset will be amortized:
| | | | | | | | | | | | |
| | Fair Value | | Useful Life |
| | (In thousands) | | (Years) |
| Developed technology | | $ | 3,600 | | | 5 |
| Customer relationships | | 7,600 | | | 5 |
| Total identifiable intangible assets | | $ | 11,200 | | | |
The results of SolarLeadFactory have been included in the Company’s consolidated statement of operations since the acquisition date and are not material. Pro forma financial information has not been presented for the SolarLeadFactory acquisition as the impact to the Company’s consolidated financial statements was not material.
The Company incurred and accrued costs related to acquisition of $0.4 million that were recorded in general and administrative expenses in the accompanying consolidated statements of operations for the year ended December 31, 2022.
7. GOODWILL AND INTANGIBLE ASSETS
The Company’s goodwill as of December 31, 2024 and 2023 was as follows:
| | | | | | | | | | | |
| Goodwill | December 31,
2024 | | December 31,
2023 |
| | | |
| (In thousands) |
| Goodwill, beginning of period | $ | 214,562 | | | $ | 213,559 | |
| | | |
| Currency translation adjustment | (2,991) | | | 1,003 | |
| Goodwill, end of period | $ | 211,571 | | | $ | 214,562 | |
The Company’s purchased intangible assets as of December 31, 2024 and December 31, 2023 were as follows:
| | | | | | | | | | | | | | | | | | | | | | | | | | | | | | | | | | | | | | | | | | | | | | | | | | | | | | | |
| December 31, 2024 | | December 31, 2023 |
| Gross | | | | Accumulated Amortization | | Impairment | | | | Net | | Gross | | | | | | Accumulated Amortization | | Impairment | | Net |
| | | | | | | | | | | | | | | | | | | | | | | |
| (In thousands) |
| | | | | | | | | | | | | | | | | | | | | | | |
| | | | | | | | | | | | | | | | | | | | | | | |
| Intangible assets: | | | | | | | | | | | | | | | | | | | | | | | |
| Indefinite-lived intangibles | $ | 286 | | | | | $ | — | | | $ | — | | | | | $ | 286 | | | $ | 286 | | | | | | | $ | — | | | $ | — | | | $ | 286 | |
| | | | | | | | | | | | | | | | | | | | | | | |
| Intangible assets with finite lives: | | | | | | | | | | | | | | | | | | | | | | | |
| | | | | | | | | | | | | | | | | | | | | | | |
| Developed technology | 51,054 | | | | | (35,903) | | | (3,351) | | | | | 11,800 | | | 51,044 | | | | | | | (27,093) | | | — | | | 23,951 | |
| Customer relationships | 51,306 | | | | | (35,804) | | | (177) | | | | | 15,325 | | | 55,106 | | | | | | | (29,527) | | | (3,807) | | | 21,772 | |
| Trade names | 37,700 | | | | | (22,713) | | | — | | | | | 14,987 | | | 37,700 | | | | | | | (15,173) | | | — | | | 22,527 | |
| | | | | | | | | | | | | | | | | | | | | | | |
| | | | | | | | | | | | | | | | | | | | | | | |
| Total purchased intangible assets | $ | 140,346 | | | | | $ | (94,420) | | | $ | (3,528) | | | | | $ | 42,398 | | | $ | 144,136 | | | | | | | $ | (71,793) | | | $ | (3,807) | | | $ | 68,536 | |
Enphase Energy, Inc. | 2024 Form 10-K | 88
ENPHASE ENERGY, INC.
NOTES TO CONSOLIDATED FINANCIAL STATEMENTS
During the year ended December 31, 2024, intangible assets decreased by less than $0.1 million due to the impact of foreign currency translation.
Amortization expense related to finite-lived intangible assets were as follows:
| | | | | | | | | | | | | | | | | |
| | | Years Ended December 31, |
| | | | | 2024 | | 2023 | | |
| | | | | | | | | |
| | | | | (In thousands) |
| Developed technology | | | | | $ | 8,780 | | | $ | 9,832 | | | |
| Customer relationships | | | | | 6,254 | | | 9,826 | | | |
| Trade-names | | | | | 7,540 | | | 7,540 | | | |
| | | | | | | | | |
| Total amortization expense | | | | | $ | 22,574 | | | $ | 27,198 | | | |
Amortization of developed technology is recorded to cost of revenues, amortization of customer relationships and trade-names are recorded to sales and marketing expense, and amortization of certain customer relationships is recorded as a reduction to revenue.
The expected future amortization expense of intangible assets as of December 31, 2024 is presented below:
| | | | | |
| December 31,
2024 |
| (In thousands) |
| Fiscal year: | |
| 2025 | $ | 19,960 | |
| 2026 | 17,771 | |
| 2027 | 4,381 | |
| 2028 | — | |
| |
| |
| Total | $ | 42,112 | |
| |
| |
| |
| |
| |
During the years ended December 31, 2024 and 2023, the Company determined that a triggering event had occurred as a result of changes to the Company’s long-term projections and performed additional analysis on the valuation of the certain acquired intangible assets and concluded that the fair value was below its carrying amount. Accordingly, the Company recorded a $3.5 million impairment charge for the developed technology and customer relationships for the year ended December 31, 2024 and $3.8 million of impairment for customer relationship for the year ended December 31, 2023, in “Restructuring and asset impairment charges” in the consolidated statements of operations.
8. CASH EQUIVALENTS, RESTRICTED CASH AND MARKETABLE SECURITIES
The cash equivalents, restricted cash and marketable securities consist of the following:
| | | | | | | | | | | | | | | | | | | | | | | | | | | | | | | | | | | | | | | | | |
| As of December 31, 2024 |
| Amortized Cost | | Gross Unrealized Gains | | Gross Unrealized Losses | | Fair Value | | Cash Equivalents | | Marketable Securities | | Restricted Cash |
| | | | | | | | | | | | | |
| (In thousands) |
| Money market funds | $ | 191,410 | | | $ | — | | | $ | — | | | $ | 191,410 | | | $ | 191,410 | | | $ | — | | | $ | — | |
| Certificates of deposit | 125,087 | | | 13 | | | (8) | | | 125,092 | | | — | | | 30,092 | | | 95,000 | |
| Commercial paper | 30,681 | | | 40 | | | (8) | | | 30,713 | | | — | | | 30,713 | | | — | |
| Corporate notes and bonds | 449,612 | | | 1,115 | | | (1,157) | | | 449,570 | | | — | | | 449,570 | | | — | |
| U.S. Treasuries | 111,606 | | | 42 | | | (36) | | | 111,612 | | | — | | | 111,612 | | | — | |
| U.S. Government agency securities | 631,389 | | | 1,241 | | | (1,137) | | | 631,493 | | | — | | | 631,493 | | | — | |
| Total | $ | 1,539,785 | | | $ | 2,451 | | | $ | (2,346) | | | $ | 1,539,890 | | | $ | 191,410 | | | $ | 1,253,480 | | | $ | 95,000 | |
Enphase Energy, Inc. | 2024 Form 10-K | 89
ENPHASE ENERGY, INC.
NOTES TO CONSOLIDATED FINANCIAL STATEMENTS
| | | | | | | | | | | | | | | | | | | | | | | | | | | | | | | | | | | |
| As of December 31, 2023 |
| Amortized Cost | | Gross Unrealized Gains | | Gross Unrealized Losses | | Fair Value | | Cash Equivalents | | Marketable Securities |
| | | | | | | | | | | |
| (In thousands) |
| Money market funds | $ | 132,037 | | | $ | — | | | $ | — | | | $ | 132,037 | | | $ | 132,037 | | | $ | — | |
| Certificates of deposit | 55,863 | | | 58 | | | (9) | | | 55,912 | | | 750 | | | 55,162 | |
| Commercial paper | 71,427 | | | 29 | | | (19) | | | 71,437 | | | 1,694 | | | 69,743 | |
| Corporate notes and bonds | 406,093 | | | 934 | | | (931) | | | 406,096 | | | 462 | | | 405,634 | |
| U.S. Treasuries | 327,773 | | | 152 | | | (34) | | | 327,891 | | | — | | | 327,891 | |
| U.S. Government agency securities | 548,391 | | | 690 | | | (1,225) | | | 547,856 | | | — | | | 547,856 | |
| Total | $ | 1,541,584 | | | $ | 1,863 | | | $ | (2,218) | | | $ | 1,541,229 | | | $ | 134,943 | | | $ | 1,406,286 | |
The following table summarizes the contractual maturities of the Company’s cash equivalents, restricted cash and marketable securities as of December 31, 2024:
| | | | | | | | | | | |
| Amortized Cost | | Fair Value |
| | | |
| (In thousands) |
| Due within one year | $ | 1,095,355 | | | $ | 1,096,565 | |
| Due within one to three years | 444,430 | | | 443,325 | |
| Total | $ | 1,539,785 | | | $ | 1,539,890 | |
9. ACCRUED LIABILITIES
Accrued liabilities consist of the following:
| | | | | | | | | | | | | |
| December 31,
2024 | | December 31,
2023 | | |
| | | | | |
| (In thousands) | | |
| Customer rebates and sales incentives | $ | 96,324 | | | $ | 158,338 | | | |
| Liability due to supply agreements | 42,745 | | | 32,973 | | | |
| Freight | 7,497 | | | 19,262 | | | |
| Salaries, commissions, incentive compensation and benefits | 11,956 | | | 10,316 | | | |
| Income tax payable | 3,540 | | | 8,531 | | | |
| Operating lease liabilities, current | 5,815 | | | 5,220 | | | |
| VAT payable | 1,472 | | | 3,243 | | | |
| | | | | |
| | | | | |
| | | | | |
| | | | | |
| | | | | |
| Liabilities related to restructuring accruals | 3,262 | | | 3,104 | | | |
| Other | 24,276 | | | 20,932 | | | |
| Total accrued liabilities | $ | 196,887 | | | $ | 261,919 | | | |
10. WARRANTY OBLIGATIONS
Enphase Energy, Inc. | 2024 Form 10-K | 90
ENPHASE ENERGY, INC.
NOTES TO CONSOLIDATED FINANCIAL STATEMENTS
The Company’s warranty obligation activities were as follows:
| | | | | | | | | | | | | | | | | | | | | |
| | | Years Ended December 31, |
| | | | | 2024 | | 2023 | | 2022 |
| | | | | | | | | |
| | | | | (In thousands) |
| Warranty obligations, beginning of period | | | | | $ | 189,087 | | | $ | 131,446 | | | $ | 73,377 | |
| Accruals for warranties issued during period | | | | | 27,544 | | | 51,866 | | | 48,703 | |
| | | | | | | | | |
| Expense (benefit) from changes in estimates | | | | | 1,082 | | | (19,176) | | | 29,275 | |
| Settlements | | | | | (27,611) | | | (27,216) | | | (26,257) | |
| Increase due to accretion expense | | | | | 11,010 | | | 13,821 | | | 9,631 | |
Change in discount rate(1) | | | | | (459) | | | 44,422 | | | (9,609) | |
| | | | | | | | | |
| Other | | | | | (7,764) | | | (6,076) | | | 6,326 | |
| Warranty obligations, end of period | | | | | 192,889 | | | 189,087 | | | 131,446 | |
| Less: warranty obligations, current | | | | | (34,656) | | | (36,066) | | | (35,556) | |
| Warranty obligations, non-current | | | | | $ | 158,233 | | | $ | 153,021 | | | $ | 95,890 | |
(1) Refer to Note 11, “Fair Value Measurements” for additional information about the monetary impact for changes in the discount rate.
Changes in Estimates
On a quarterly basis, the Company uses the best and most complete underlying information available, following a consistent, systematic and rational methodology to determine its warranty obligations. The Company considers all available evidence to assess the reasonableness of all key assumptions underlying its estimated warranty obligations for each generation of microinverter. The changes in estimates discussed below resulted from consideration of new or additional information becoming available and subsequent developments. Changes in estimates included in the table above were comprised of the following:
2024
In 2024, the Company recorded $1.1 million in warranty expense from changes in estimates, of which $10.2 million related to the Company proactively addressing certain component defects in a specific population of products that did not meet the Company’s high quality standards, $6.0 million for continuing analysis of field performance data and diagnostic root-cause failure analysis primarily related to prior generation products, $5.8 million from increase in product replacement costs due to increase in freight costs as well as $0.5 million related to increasing the warranty term to 20 years for microinverter units sold in Mexico, Columbia, Panama, Costa Rica and nine Caribbean countries. This expense was partially offset by a benefit from $17.0 million related to a decrease in product replacement costs primarily associated with Enphase IQ Battery storage systems and related accessories as the Company expanded its network of field service technicians in the United States, Europe and Australia to provide direct homeowner assistance, and $4.4 million related to continuing analysis of field performance data and diagnostic root-cause failure analysis for early generations of the IQ Battery.
2023
In 2023, the Company recorded $19.2 million in warranty benefit from changes in estimates, of which $27.3 million related to a decrease in product replacement costs related to Enphase IQ Battery storage systems and accessories as the Company expanded its network of field service technicians in the United States, Europe and Australia to provide direct homeowner assistance, and $8.8 million related to a decrease in product replacement costs for all other products. This benefit was partially offset by $8.6 million related to the Company proactively addressing certain component defects in a specific population of products that did not meet the Company's high quality standards as well as continuing analysis of field performance data and diagnostic root-cause failure analysis primarily for prior generation products and $8.3 million for increasing the warranty period for the IQ Battery from 10 years to 15 years.
Enphase Energy, Inc. | 2024 Form 10-K | 91
ENPHASE ENERGY, INC.
NOTES TO CONSOLIDATED FINANCIAL STATEMENTS
2022
In 2022, the Company recorded $29.3 million in warranty expense from changes in estimates, of which $18.3 million related to continuing analysis of field performance data and diagnostic root-cause failure analysis, primarily for IQ Battery storage systems and prior generation products, $7.0 million related to an increase in expedited freight costs and replacement costs, and $4.0 million due to an increase in labor reimbursement rates.
11. FAIR VALUE MEASUREMENTS
The accounting guidance defines fair value as the price that would be received from selling an asset or paid to transfer a liability in an orderly transaction between market participants at the measurement date. When determining the fair value measurements for assets and liabilities recorded at fair value, the Company considers the principal or most advantageous market in which it would transact and considers assumptions that market participants would use when pricing the asset or liability, such as inherent risk, transfer restrictions, and risk of nonperformance.
The fair value hierarchy requires an entity to maximize the use of observable inputs and minimize the use of unobservable inputs when measuring fair value. An asset’s or liability’s categorization within the fair value hierarchy is based upon the lowest level of input that is significant to the fair value measurement. Three levels of inputs may be used to measure fair value:
•Level 1 - Valuations based on quoted prices in active markets for identical assets or liabilities that the Company is able to access. Since valuations are based on quoted prices that are readily and regularly available in an active market, valuation of such assets or liabilities do not entail a significant degree of judgment.
•Level 2 - Valuations based on one or more quoted prices in markets that are not active or for which all significant inputs are observable, either directly or indirectly.
•Level 3 - Valuations based on inputs that are unobservable and significant to the overall fair value measurement.
Enphase Energy, Inc. | 2024 Form 10-K | 92
ENPHASE ENERGY, INC.
NOTES TO CONSOLIDATED FINANCIAL STATEMENTS
The following table presents assets and liabilities measured at fair value on a recurring basis using the above input categories:
| | | | | | | | | | | | | | | | | | | | | | | | | | | | | | | | | | | |
| December 31, 2024 | | December 31, 2023 |
| | | | | | | | | | | |
| (In thousands) |
| Level 1 | | Level 2 | | Level 3 | | Level 1 | | Level 2 | | Level 3 |
| Assets: | | | | | | | | | | | |
| Cash, cash equivalents and restricted cash: | | | | | | | | | | | |
| Money market funds | $ | 191,410 | | | $ | — | | | $ | — | | | $ | 132,037 | | | $ | — | | | $ | — | |
| Certificates of deposit | 95,000 | | | — | | | — | | | — | | | 750 | | | — | |
| Commercial paper | — | | | — | | | — | | | — | | | 1,694 | | | — | |
| Corporate notes and bonds | | | — | | | — | | | — | | | 462 | | | — | |
| | | | | | | | | | | |
| Marketable securities: | | | | | | | | | | | |
| Certificates of deposit | — | | | 30,092 | | | — | | | — | | | 55,162 | | | — | |
| Commercial paper | — | | | 30,713 | | | — | | | — | | | 69,743 | | | — | |
| Corporate notes and bonds | — | | | 449,570 | | | — | | | — | | | 405,634 | | | — | |
| U.S. Treasuries | — | | | 111,612 | | | — | | | — | | | 327,891 | | | — | |
| U.S. Government agency securities | — | | | 631,493 | | | — | | | — | | | 547,856 | | | — | |
| | | | | | | | | | | |
| Other assets: | | | | | | | | | | | |
| Investments in debt securities | — | | | — | | | 64,834 | | | — | | | — | | | 79,855 | |
| | | | | | | | | | | |
| Total assets measured at fair value | $ | 286,410 | | | $ | 1,253,480 | | | $ | 64,834 | | | $ | 132,037 | | | $ | 1,409,192 | | | $ | 79,855 | |
| | | | | | | | | | | |
| Liabilities: | | | | | | | | | | | |
| | | | | | | | | | | |
| | | | | | | | | | | |
| Warranty obligations: | | | | | | | | | | | |
| Current | $ | — | | | $ | — | | | $ | 27,173 | | | $ | — | | | $ | — | | | $ | 28,667 | |
| Non-current | — | | | — | | | 143,743 | | | — | | | — | | | 133,126 | |
| Total warranty obligations measured at fair value | — | | | — | | | 170,916 | | | — | | | — | | | 161,793 | |
| Total liabilities measured at fair value | $ | — | | | $ | — | | | $ | 170,916 | | | $ | — | | | $ | — | | | $ | 161,793 | |
Notes due 2028, Notes due 2026 and Notes due 2025
The Company carries the Notes due 2028 (as defined in Note 13, “Debt”) and Notes due 2026 (as defined in Note 13, “Debt”) at face value less unamortized debt issuance costs on its consolidated balance sheets. The Company carries the Notes due 2025 (as defined in Note 13, “Debt”) at face value less unamortized debt discount and issuance costs on its consolidated balance sheets. As of December 31, 2024, the fair value of the Notes due 2028, Notes due 2026 and Notes due 2025 was $472.9 million, $593.8 million and $106.1 million, respectively. The fair value as of December 31, 2024 was determined based on the closing trading price per $100 principal amount as of the last day of trading for the period. The Company considers the fair value of the Notes due 2028, Notes due 2026 and Notes due 2025 to be a Level 2 measurement as they are not actively traded.
Equity investments without readily determinable fair value
The Company had previously invested $6.0 million in a privately-held company without a readily determinable fair value, which is included in “Other assets” in the consolidated balance sheet as of December 31, 2023. During the year ended December 31, 2024, the Company determined that the carrying value of the investment was not recoverable. Accordingly, the Company recorded an impairment charge of $6.0 million within “Other income, net” on the consolidated statement of operations for the year ended December 31, 2024.
Investments in debt securities
The Company had previously taken a non-voting participating interest of approximately $15.0 million in a loan held by a privately-held company, which is included in “Other assets” in the consolidated balance sheet as of December 31, 2023. As of December 31, 2024, the Company accreted interest of approximately $2.0 million in “Other income (expense), net” in the consolidated statement of operations. The Company determined that the
Enphase Energy, Inc. | 2024 Form 10-K | 93
ENPHASE ENERGY, INC.
NOTES TO CONSOLIDATED FINANCIAL STATEMENTS
carrying value of the investment was not recoverable as the privately-held company filed for Chapter 11 bankruptcy during the year ended December 31, 2024. Accordingly, the Company recorded an impairment charge of $17.0 million within “Other income, net” on the consolidated statement of operations for the year ended December 31, 2024.
In July 2023, the Company invested approximately $15.0 million in a secured convertible promissory note issued by the stockholders of a privately-held company. The investment qualified as an investment in a debt security and will accrete interest. The principal plus accrued interest is payable upon maturity unless it is converted to equity at a pre-determined price. As the investment includes a conversion option, the Company has elected to account for this investment under the fair value option and any changes in fair value of the investment is recognized in “Other income (expense), net” in the Company’s consolidated statement of operations for that period. Principal plus accrued interest receivable of the investment approximates the fair value.
Investment in debt securities is recorded in “Other assets” on the accompanying consolidated balance sheets as of December 31, 2024 and December 31, 2023. The changes in the balance in investments in debt securities during the period were as follows:
| | | | | | | | | | | | | | | | | |
| | | Years Ended December 31, | | |
| | | | | 2024 | | 2023 | | |
| | | | | | | | | |
| | | | | (In thousands) |
| Balance at beginning of period | | | | | $ | 79,855 | | | $ | 56,777 | | | |
| Investment | | | | | — | | | 15,000 | | | |
| Fair value adjustments included in other income, net | | | | | 1,967 | | | 8,078 | | | |
| Impairment | | | | | (16,988) | | | — | | | |
| Balance at end of period | | | | | $ | 64,834 | | | $ | 79,855 | | | |
Warranty obligations
Fair Value Option for Warranty Obligations Related to Products Sold Since January 1, 2014
The Company estimates the fair value of warranty obligations by calculating the warranty obligations in the same manner as for sales prior to January 1, 2014 and applying an expected present value technique to that result. The expected present value technique, an income approach, converts future amounts into a single current discounted amount. In addition to the key estimates of return rates and replacement costs, the Company used certain Level 3 inputs, which are unobservable and significant to the overall fair value measurement. Such additional assumptions are based on the Company’s credit-adjusted risk-free rate (“discount rate”) and compensation comprised of a profit element and risk premium required of a market participant to assume the obligation.
Enphase Energy, Inc. | 2024 Form 10-K | 94
ENPHASE ENERGY, INC.
NOTES TO CONSOLIDATED FINANCIAL STATEMENTS
The following table provides information regarding changes in nonfinancial liabilities related to the Company’s warranty obligations measured at fair value on a recurring basis using significant unobservable inputs designated as Level 3 for the periods indicated:
| | | | | | | | | | | | | | | | | |
| | | Years Ended December 31, |
| | | | | 2024 | | 2023 | | |
| | | | | | | | | |
| | | | | (In thousands) |
| Balance at beginning of period | | | | | $ | 161,793 | | | $ | 106,489 | | | |
| Accruals for warranties issued during period | | | | | 27,500 | | | 51,716 | | | |
| Changes in estimates | | | | | 625 | | | (22,557) | | | |
| Settlements | | | | | (21,789) | | | (26,022) | | | |
| Increase due to accretion expense | | | | | 11,010 | | | 13,821 | | | |
| Change in discount rate | | | | | (459) | | | 44,422 | | | |
| Other | | | | | (7,764) | | | (6,076) | | | |
| Balance at end of period | | | | | $ | 170,916 | | | $ | 161,793 | | | |
Quantitative and Qualitative Information about Level 3 Fair Value Measurements
As of December 31, 2024 and December 31, 2023, the significant unobservable inputs used in the fair value measurement of the Company’s liabilities designated as Level 3 were as follows, of which the monetary impact for change in discount rate is captured in “Change in discount rate” in the table above:
| | | | | | | | | | | | | | | | | | | | | | | | | | |
| | | | | | Percent Used (Weighted Average) |
| Item Measured at Fair Value | | Valuation Technique | | Description of Significant Unobservable Input | | December 31,
2024 | | December 31,
2023 |
| Warranty obligations for products sold since January 1, 2014 | | Discounted cash flows | | Profit element and risk premium | | 16.8% | | 16.8% |
| | Credit-adjusted risk-free rate | | 7.2% | | 7.2% |
| | | | | | | | |
| | | | | | | | |
Sensitivity of Level 3 Inputs - Warranty Obligations
Each of the significant unobservable inputs is independent of the other. The profit element and risk premium are estimated based on the requirements of a third-party participant willing to assume the Company’s warranty obligations. The discount rate is determined by reference to the Company’s own credit standing at the fair value measurement date, which insignificantly declined during the year December 31, 2024 contributing to a $0.5 million warranty benefit, as compared to same period in 2023 when it improved contributing to the $44.4 million warranty expense, both captured in “Change in discount rate” in the table above. Under the expected present value technique, increasing the profit element and risk premium input by 100 basis points would result in a $1.2 million increase to the liability. Decreasing the profit element and risk premium by 100 basis points would result in a $1.2 million reduction to the liability. Increasing the discount rate by 100 basis points would result in a $11.6 million decrease to the liability. Decreasing the discount rate by 100 basis points would result in a $13.1 million increase to the liability.
12. RESTRUCTURING AND ASSET IMPAIRMENT CHARGES
Restructuring and asset impairment charges consist of the following:
Enphase Energy, Inc. | 2024 Form 10-K | 95
ENPHASE ENERGY, INC.
NOTES TO CONSOLIDATED FINANCIAL STATEMENTS
| | | | | | | | | | | | | | | | | | |
| | | | Years Ended December 31, |
| | | | | | 2024 | | 2023 | | |
| | | | | | | | | | |
| | | | | | (In thousands) | | |
| Employee severance and benefits | | | | | | $ | 6,380 | | | $ | 2,155 | | | |
| Contract termination charges | | | | | | 1,991 | | | 3,700 | | | |
| Asset impairment | | | | | | 4,783 | | | 9,829 | | | |
| Total restructuring and asset impairment charges | | | | | | $ | 13,154 | | | $ | 15,684 | | | |
2022 Restructuring
During the year ended December 31, 2022, the Company implemented restructuring actions to reorganize the global workforce, consolidate facilities and eliminate non-core projects, which was completed in the second quarter of 2023. The Company incurred restructuring costs of $2.4 million and $0.8 million in the years ended December 31, 2022 and 2023, respectively.
2023 Restructuring Plan
In the fourth quarter of 2023, the Company implemented a restructuring plan (the “2023 Restructuring Plan”) designed to increase operational efficiencies and execution, reduce operating costs, and better align the Company’s workforce and cost structure with current market conditions, and the Company’s business needs, strategic priorities and ongoing commitment to profitable growth. The Company completed its restructuring activities under the 2023 Restructuring Plan in the fourth quarter of 2024.
The following table presents the details of the Company’s restructuring and asset impairment charges under the 2023 Restructuring Plan for the years ended December 31, 2024 and 2023:
| | | | | | | | | | | | | | | | | | |
| | | | Years Ended December 31, |
| | | | | | 2024 | | 2023 | | |
| | | | | | | | | | |
| | | | | | (In thousands) | | |
| Employee severance and benefits | | | | | | $ | 1,219 | | | $ | 1,374 | | | |
| Contract termination charges | | | | | | 1,225 | | | 3,700 | | | |
| Asset impairment | | | | | | 881 | | | 9,829 | | | |
| Total restructuring and asset impairment charges | | | | | | $ | 3,325 | | | $ | 14,903 | | | |
The following table provides information regarding changes in the Company’s accrued restructuring balances under the 2023 Restructuring Plan for the periods indicated:
| | | | | | | | | | | | | | | | | | | | | | | |
| Employee Severance and Benefits | | Contract Termination Charges | | Asset Impairment | | Total |
| | | | | | | |
| (In thousands) |
| Balance as of December 31, 2022 | $ | — | | | $ | — | | | $ | — | | | $ | — | |
| Charges | 1,374 | | | 3,700 | | | 9,829 | | | 14,903 | |
| Cash payments | (70) | | | (1,900) | | | — | | | (1,970) | |
| Non-cash settlement and other | — | | | — | | | (9,829) | | | (9,829) | |
| Balance as of December 31, 2023 | $ | 1,304 | | | $ | 1,800 | | | $ | — | | | $ | 3,104 | |
| Charges | 1,219 | | | 1,225 | | | 881 | | | 3,325 | |
| Cash payments | (1,955) | | | (2,132) | | | — | | | (4,087) | |
| Non-cash settlement and other | (292) | | | (893) | | | (881) | | | (2,066) | |
| | | | | | | |
| Balance as of December 31, 2024 | $ | 276 | | | $ | — | | | $ | — | | | $ | 276 | |
| | | | | | | |
| | | | | | | |
| | | | | | | |
| | | | | | | |
Enphase Energy, Inc. | 2024 Form 10-K | 96
ENPHASE ENERGY, INC.
NOTES TO CONSOLIDATED FINANCIAL STATEMENTS
2024 Restructuring Plan
In the fourth quarter of 2024, the Company implemented a restructuring plan (the “2024 Restructuring Plan”) designed to better align its workforce and cost structure with the Company’s business needs, strategic priorities and ongoing commitment to profitable growth, while increasing operational efficiencies and reducing operating cost. The Company plans to complete its restructuring activities under the 2024 Restructuring Plan by June 30, 2025.
The following table presents the details of the Company’s restructuring and asset impairment charges under the 2024 Restructuring Plan for the year ended December 31, 2024:
| | | | | | | | | | | | | | |
| | | | Year Ended December 31, |
| | | | | | 2024 | | | | |
| | | | | | | | | | |
| | | | | | (In thousands) | | |
| Employee severance and benefits | | | | | | $ | 5,161 | | | | | |
| Contract termination charges | | | | | | 766 | | | | | |
| Asset impairment | | | | | | 3,902 | | | | | |
| Total restructuring and asset impairment charges | | | | | | $ | 9,829 | | | | | |
The following table provides information regarding changes in the Company’s accrued restructuring balances under the 2024 Restructuring Plan for the periods indicated:
| | | | | | | | | | | | | | | | | | | | | | | |
| Employee Severance and Benefits | | Contract Termination Charges | | Asset Impairment | | Total |
| | | | | | | |
| (In thousands) |
| | | | | | | |
| | | | | | | |
| | | | | | | |
| | | | | | | |
| Balance as of December 31, 2023 | $ | — | | | $ | — | | | $ | — | | | $ | — | |
| Charges | 5,161 | | | 766 | | | 3,902 | | | 9,829 | |
| Cash payments | (2,941) | | | — | | | — | | | (2,941) | |
| Non-cash settlement and other | — | | | — | | | (3,902) | | | (3,902) | |
| Balance as of December 31, 2024 | $ | 2,220 | | | $ | 766 | | | $ | — | | | $ | 2,986 | |
| | | | | | | |
| | | | | | | |
| | | | | | | |
| | | | | | | |
Enphase Energy, Inc. | 2024 Form 10-K | 97
ENPHASE ENERGY, INC.
NOTES TO CONSOLIDATED FINANCIAL STATEMENTS
13. DEBT
The following table provides information regarding the Company’s debt:
| | | | | | | | | | | |
| December 31,
2024 | | December 31,
2023 |
| | | |
| (In thousands) |
| Convertible notes | | | |
| Notes due 2028 | $ | 575,000 | | | $ | 575,000 | |
| | | |
| Less: unamortized debt issuance costs | (4,102) | | | (5,408) | |
| Carrying amount of Notes due 2028 | 570,898 | | | 569,592 | |
| | | |
| Notes due 2026 | 632,500 | | | 632,500 | |
| | | |
| Less: unamortized debt issuance costs | (2,309) | | | (4,317) | |
| Carrying amount of Notes due 2026 | 630,191 | | | 628,183 | |
| | | |
| Notes due 2025 | 102,168 | | | 102,175 | |
| | | |
| Less: unamortized debt discount | (803) | | | (5,644) | |
| Less: unamortized debt issuance costs | (74) | | | (568) | |
| Carrying amount of Notes due 2025 | 101,291 | | | 95,963 | |
| | | |
| | | |
| | | |
| | | |
| | | |
| | | |
| | | |
| | | |
| | | |
| | | |
| | | |
| | | |
| Total carrying amount of debt | 1,302,380 | | | 1,293,738 | |
| | | |
| Less: debt, current | (101,291) | | | — | |
| Debt, non-current | $ | 1,201,089 | | | $ | 1,293,738 | |
The following tables present the total amount of interest cost recognized in the consolidated statement of operations relating to the Notes:
| | | | | | | | | | | | | | | | | | | | | | | | | | | | | | | | | | | | | | | | | | | |
| Years Ended December 31, |
| 2024 | | 2023 |
| | | | | | | | | | | | | | | |
| Notes due 2028 | | Notes due 2026 | | Notes due 2025 | | | | Notes due 2028 | | Notes due 2026 | | Notes due 2025 | | Convertible Senior Notes due 2023 (the “Notes due 2023”) |
| | | | | | | | | | | | | | | |
| (In thousands) |
| Contractual interest expense | $ | — | | | $ | — | | | $ | 256 | | | | | $ | — | | | $ | — | | | $ | 256 | | | $ | 117 | |
| Amortization of debt discount | — | | | — | | | 4,841 | | | | | — | | | — | | | 4,585 | | | — | |
| Amortization of debt issuance costs | 1,308 | | | 2,006 | | | 490 | | | | | 1,297 | | | 1,990 | | | 486 | | | 23 | |
| Total interest cost recognized | $ | 1,308 | | | $ | 2,006 | | | $ | 5,587 | | | | | $ | 1,297 | | | $ | 1,990 | | | $ | 5,327 | | | $ | 140 | |
| | | | | | | | | | | | | | | |
| | | | | | | | | | | | | | | |
Convertible Senior Notes due 2028
On March 1, 2021, the Company issued $575.0 million aggregate principal amount of its 0.0% convertible senior notes due 2028 (the “Notes due 2028”). The Notes due 2028 will not bear regular interest, and the principal amount of the Notes due 2028 will not accrete. The Notes due 2028 are general unsecured obligations and are governed by an indenture between the Company and U.S. Bank National Association, as trustee. The Notes due 2028 will mature on March 1, 2028, unless earlier repurchased by the Company or converted at the option of the holders. The Company received approximately $566.4 million in net proceeds, after deducting the initial purchasers’ discount, from the issuance of the Notes due 2028.
Enphase Energy, Inc. | 2024 Form 10-K | 98
ENPHASE ENERGY, INC.
NOTES TO CONSOLIDATED FINANCIAL STATEMENTS
The initial conversion rate for the Notes due 2028 is 3.5104 shares of common stock per $1,000 principal amount of the Notes due 2028 (which represents an initial conversion price of approximately $284.87 per share). Upon conversion, the Company will settle conversions of the Notes due 2028 through payment or delivery, as the case may be, of cash, shares of its common stock or a combination of cash and shares of its common stock, at the Company’s election.
The Company may redeem for cash all or any portion of the Notes due 2028, at the Company’s election, on or after September 6, 2024, if the last reported sale price of the Company’s common stock has been greater than or equal to 130% of the conversion price then in effect for the Notes due 2028 (i.e., $370.33, which is 130% of the current conversion price for the Notes due 2028) for at least 20 trading days (whether or not consecutive) during any 30 consecutive trading day period ending on, and including, the trading day immediately preceding the date on which the Company provides notice of redemption. The redemption price will equal 100% of the principal amount of the Notes due 2028 to be redeemed, plus accrued and unpaid special interest, if any to, but excluding, the relevant redemption date. No sinking fund is provided for the Notes due 2028.
The Notes due 2028 may be converted on any day prior to the close of business on the business day immediately preceding September 1, 2027, in multiples of $1,000 principal amount, at the option of the holder only under any of the following circumstances: (1) during any calendar quarter commencing after the calendar quarter ending on June 30, 2021 (and only during such calendar quarter), if the last reported sale price of the Company’s common stock for at least 20 trading days (whether or not consecutive) during a period of 30 consecutive trading days ending on, and including, the last trading day of the immediately preceding calendar quarter is greater than or equal to 130% of the conversion price for the Notes due 2028 on each applicable trading day; (2) during the five business day period after any five consecutive trading day period (the “Measurement Period”) in which the “trading price” (as defined in the relevant indenture) per $1,000 principal amount of notes for each trading day of the Measurement Period was less than 98% of the product of the last reported sale price of the Company’s common stock and the conversion rate for the Notes due 2028 on each such trading day; (3) if the Company calls any or all of the Notes due 2028 for redemption, at any time prior to the close of business on the scheduled trading day immediately preceding the redemption date; or (4) upon the occurrence of specified corporate events. On and after September 1, 2027 until the close of business on the second scheduled trading day immediately preceding the maturity date of March 1, 2028, holders of the Notes due 2028 may convert their notes at any time, regardless of the foregoing circumstances. Upon the occurrence of a fundamental change (as defined in the relevant indenture), holders may require the Company to repurchase all or a portion of their Notes due 2028 for cash at a price equal to 100% of the principal amount of the notes to be repurchased plus any accrued and unpaid special interest, if any, to, but excluding, the fundamental change repurchase date.
As of December 31, 2024, the sales price of the Company’s common stock was not greater than or equal to $370.33 (130% of the notes conversion price) for at least 20 trading days (whether consecutive or not) during a period of 30 consecutive trading days preceding the quarter-ended December 31, 2024. As a result, the Notes due 2028 are not convertible at the holders’ option through December 31, 2024. Accordingly, the Company classified the net carrying amount of the Notes due 2028 of $570.9 million as Debt, non-current on the consolidated balance sheet as of December 31, 2024. As of December 31, 2024, the unamortized deferred issuance cost for the Notes due 2028 was $4.1 million on the consolidated balance sheet.
Notes due 2028 Hedge and Warrant Transactions
In connection with the offering of the Notes due 2028, the Company entered into privately-negotiated convertible note hedge transactions (“Notes due 2028 Hedge”) pursuant to which the Company has the option to purchase a total of approximately 2.0 million shares of its common stock (subject to anti-dilution adjustments), which is the same number of shares initially issuable upon conversion of the Notes due 2028, at a price of $284.87 per share. The total cost of the convertible note hedge transactions was approximately $161.6 million. The convertible note hedge transactions are expected generally to reduce potential dilution to the Company’s common stock upon any conversion of the Notes due 2028 and/or offset any cash payments the Company is required to make in excess of the principal amount of converted notes, as the case may be.
Additionally, the Company separately entered into privately-negotiated warrant transactions (the “2028 Warrants”) whereby the Company sold warrants to acquire approximately 2.0 million shares of the Company’s common stock (subject to anti-dilution adjustments) at an initial strike price of $397.91 per share. The Company
Enphase Energy, Inc. | 2024 Form 10-K | 99
ENPHASE ENERGY, INC.
NOTES TO CONSOLIDATED FINANCIAL STATEMENTS
received aggregate proceeds of approximately $123.4 million from the sale of the 2028 Warrants. If the market value per share of the Company’s common stock, as measured under the 2028 Warrants, exceeds the strike price of the 2028 Warrants, the 2028 Warrants will have a dilutive effect on the Company’s earnings per share, unless the Company elects, subject to certain conditions, to settle the 2028 Warrants in cash. Taken together, the purchase of the Notes due 2028 Hedge and the sale of the 2028 Warrants are intended to reduce potential dilution from the conversion of the Notes due 2028 and to effectively increase the overall conversion price from $284.87 to $397.91 per share. The 2028 Warrants are only exercisable on the applicable expiration dates in accordance with the Notes due 2028 Hedge. Subject to the other terms of the 2028 Warrants, the first expiration date applicable to the Notes due 2028 Hedge is June 1, 2028, and the final expiration date applicable to the Notes due 2028 Hedge is July 27, 2028.
Given that the transactions meet certain accounting criteria, the Notes due 2028 Hedge and the 2028 Warrants transactions are recorded in stockholders’ equity, and they are not accounted for as derivatives and are not remeasured each reporting period.
Convertible Senior Notes due 2026
On March 1, 2021, the Company issued $575.0 million aggregate principal amount of 0.0% convertible senior notes due 2026 (the “Notes due 2026”). In addition, on March 12, 2021, the Company issued an additional $57.5 million aggregate principal amount of the Notes due 2026 pursuant to the initial purchasers’ full exercise of the over-allotment option for additional Notes due 2026. The Notes due 2026 will not bear regular interest, and the principal amount of the Notes due 2026 will not accrete. The Notes due 2026 are general unsecured obligations and are governed by an indenture between the Company and U.S. Bank National Association, as trustee. The Notes due 2026 will mature on March 1, 2026, unless repurchased earlier by the Company or converted at the option of the holders. The Company received approximately $623.0 million in net proceeds, after deducting the initial purchasers’ discount, from the issuance of the Notes due 2026.
The initial conversion rate for the Notes due 2026 is 3.2523 shares of common stock per $1,000 principal amount of the Notes due 2026 (which represents an initial conversion price of approximately $307.47 per share). Upon conversion, the Company will settle conversions of Notes due 2026 through payment or delivery, as the case may be, of cash, shares of its common stock or a combination of cash and shares of its common stock, at the Company’s election.
The Company may redeem for cash all or any portion of the Notes due 2026, at the Company’s election, on or after September 6, 2023, if the last reported sale price of the Company’s common stock has been greater than or equal to 130% of the conversion price then in effect for the Notes due 2026 (i.e., $399.71, which is 130% of the current conversion price for the Notes due 2026) for at least 20 trading days (whether or not consecutive) during a period of 30 consecutive trading day period ending on, and including, the trading day immediately preceding the date on which the Company provides notice of redemption. The redemption price will equal 100% of the principal amount of the Notes due 2026 to be redeemed, plus accrued and unpaid special interest, if any, to, but excluding, the relevant redemption date for the Notes due 2026. The redemption price will be increased as described in the relevant indentures by a number of additional shares of the Company in connection with such optional redemption by the Company. No sinking fund is provided for the Notes due 2026.
The Notes due 2026 may be converted on any day prior to the close of business on the business day immediately preceding September 1, 2025, in multiples of $1,000 principal amount, at the option of the holder only under any of the following circumstances: (1) during any calendar quarter commencing after the calendar quarter ending on June 30, 2021 (and only during such calendar quarter), if the last reported sale price of the Company’s common stock for at least 20 trading days (whether or not consecutive) during a period of 30 consecutive trading days ending on, and including, the last trading day of the immediately preceding calendar quarter is greater than or equal to 130% of the conversion price of the Notes due 2026 on each applicable trading day; (2) during the five business day period after any five consecutive trading day period (the “measurement period”) in which the “trading price” (as defined in the relevant indenture) per $1,000 principal amount of notes for each trading day of the measurement period was less than 98% of the product of the last reported sale price of the Company’s common stock and the conversion rate for Notes due 2026 on each such trading day; (3) if the Company calls any or all of the Notes due 2026 for redemption, at any time prior to the close of business on the scheduled trading day immediately preceding the redemption date; or (4) upon the occurrence of specified corporate events. On and after
Enphase Energy, Inc. | 2024 Form 10-K | 100
ENPHASE ENERGY, INC.
NOTES TO CONSOLIDATED FINANCIAL STATEMENTS
September 1, 2025 until the close of business on the second scheduled trading day immediately preceding the maturity date of March 1, 2026, holders of the Notes due 2026 may convert their notes at any time, regardless of the foregoing circumstances. Upon the occurrence of a fundamental change (as defined in the relevant indenture), holders may require the Company to repurchase all or a portion of their Notes due 2026 for cash at a price equal to 100% of the principal amount of the notes to be repurchased plus any accrued and unpaid special interest, if any, to, but excluding, the fundamental change repurchase date.
As of December 31, 2024, the sale price of the Company’s common stock was not greater than or equal to $399.71 (130% of the notes conversion price) for at least 20 trading days (whether consecutive or not) during a period of 30 consecutive trading days preceding the quarter-ended December 31, 2024. As a result, the Notes due 2026 are not convertible at the holders’ option through December 31, 2024. Accordingly, the Company classified the net carrying amount of the Notes due 2026 of $630.2 million as Debt, non-current on the consolidated balance sheet as of December 31, 2024. As of December 31, 2024, the unamortized deferred issuance cost for the Notes due 2026 was $2.3 million on the consolidated balance sheet.
Notes due 2026 Hedge and Warrant Transactions
In connection with the offering of the Notes due 2026 (including in connection with the issuance of additional Notes due 2026 upon the initial purchasers’ exercise of their over-allotment option), the Company entered into privately-negotiated convertible note hedge transactions (the “Notes due 2026 Hedge”) pursuant to which the Company has the option to purchase a total of approximately 2.1 million shares of its common stock (subject to anti-dilution adjustments), which is the same number of shares initially issuable upon conversion of the Notes due 2026, at a price of $307.47 per share, which is the initial conversion price of the Notes due 2026. The total cost of the Notes due 2026 Hedge was approximately $124.6 million. The Notes due 2026 Hedge are expected generally to reduce potential dilution to the Company’s common stock upon any conversion of the Notes due 2026 and/or offset any cash payments the Company is required to make in excess of the principal amount of converted notes, as the case may be.
Additionally, the Company separately entered into privately-negotiated warrant transactions, including in connection with the issuance of additional Notes due 2026 upon the initial purchasers’ exercise of their over-allotment option (the “2026 Warrants”), whereby the Company sold warrants to acquire approximately 2.1 million shares of the Company’s common stock (subject to anti-dilution adjustments) at an initial strike price of $397.91 per share. The Company received aggregate proceeds of approximately $97.4 million from the sale of the 2026 Warrants. If the market value per share of the Company’s common stock, as measured under the 2026 Warrants, exceeds the strike price of the 2026 Warrants, the 2026 Warrants will have a dilutive effect on the Company’s earnings per share, unless the Company elects, subject to certain conditions, to settle the 2026 Warrants in cash. Taken together, the purchase of the Notes due 2026 Hedge and the sale of the 2026 Warrants are intended to reduce potential dilution from the conversion of the Notes due 2026 and to effectively increase the overall conversion price from $307.47 to $397.91 per share. The 2026 Warrants are only exercisable on the applicable expiration dates in accordance with the 2026 Warrants. Subject to the other terms of the 2026 Warrants, the first expiration date applicable to the Warrants is June 1, 2026, and the final expiration date applicable to the 2026 Warrants is July 27, 2026.
Given that the transactions meet certain accounting criteria, the Notes due 2026 Hedge and the 2026 Warrants transactions are recorded in stockholders’ equity, and they are not accounted for as derivatives and are not remeasured each reporting period.
Convertible Senior Notes due 2025
On March 9, 2020, the Company issued $320.0 million aggregate principal amount of its 0.25% convertible senior notes due 2025 (the “Notes due 2025”). The Notes due 2025 are general unsecured obligations and bear interest at an annual rate of 0.25% per year, payable semi-annually on March 1 and September 1 of each year. The Notes due 2025 are governed by an indenture between the Company and U.S. Bank National Association, as trustee. The Notes due 2025 will mature on March 1, 2025, unless earlier repurchased by the Company or converted at the option of the holders. The Company may not redeem the notes prior to the maturity date, and no sinking fund is provided for the notes. The Notes due 2025 may be converted, under certain circumstances as described below, based on an initial conversion rate of 12.2637 shares of common stock per $1,000 principal amount (which represents an initial conversion price of $81.54 per share). The conversion rate for the Notes due
Enphase Energy, Inc. | 2024 Form 10-K | 101
ENPHASE ENERGY, INC.
NOTES TO CONSOLIDATED FINANCIAL STATEMENTS
2025 will be subject to adjustment upon the occurrence of certain specified events but will not be adjusted for accrued and unpaid interest. In addition, upon the occurrence of a make-whole fundamental change (as defined in the relevant indenture), the Company will, in certain circumstances, increase the conversion rate by a number of additional shares for a holder that elects to convert its notes in connection with such make-whole fundamental change. The Company received approximately $313.0 million in net proceeds, after deducting the initial purchasers’ discount, from the issuance of the Notes due 2025.
The Notes due 2025 may be converted prior to the close of business on the business day immediately preceding September 1, 2024, in multiples of $1,000 principal amount, at the option of the holder only under the following circumstances: (1) during any calendar quarter commencing after the calendar quarter ending on June 30, 2020 (and only during such calendar quarter), if the last reported sale price of the Company’s common stock for at least 20 trading days (whether or not consecutive) during a period of 30 consecutive trading days ending on, and including, the last trading day of the immediately preceding calendar quarter is greater than or equal to 130% of the conversion price on each applicable trading day; (2) during the five business day period after any five consecutive trading day period (the “measurement period”) in which the “trading price” (as defined in the relevant indenture) per $1,000 principal amount of notes for each trading day of the measurement period was less than 98% of the product of the last reported sale price of the Company’s common stock and the conversion rate on each such trading day; or (3) upon the occurrence of specified corporate events. On and after September 1, 2024 until the close of business on the second scheduled trading day immediately preceding the maturity date of March 1, 2025, holders may convert their notes at any time, regardless of the foregoing circumstances. These conversions will be settled in a combination settlement method with the principal value settled in cash and the remaining value in shares of the Company’s common stock. Upon the occurrence of a fundamental change (as defined in the relevant indenture), holders may require the Company to repurchase all or a portion of their Notes due 2025 for cash at a price equal to 100% of the principal amount of the notes to be repurchased plus any accrued and unpaid interest to, but excluding, the fundamental change repurchase date.
As the Notes due 2025 mature in less than a year, the Company classified the net carrying amount of the Notes due 2025 of $101.3 million as Debt, current on the consolidated balance sheet as of December 31, 2024.
Partial repurchase of Notes due 2025
On June 5, 2024, the Company received a request for conversion of $5,000 in the principal amount of the Notes due 2025. In July 2024, the principal amount of the converted Notes due 2025 was repaid in cash. In connection with the conversion, the Company also issued 16 shares of its common stock to the holders of the converted Notes due 2025, with an aggregate fair value of less than $0.1 million, representing the conversion value in excess of the principal amount of the Notes due 2025. These shares were offset by 14 shares the Company received from the corresponding exercise of the notes hedge.
On December 29, 2023, the Company received a request for conversion of $2,000 in the principal amount of the Notes due 2025. In February 2024, the principal amount of the converted Notes due 2025 was repaid in cash. In connection with the conversion, the Company also issued six shares of its common stock to the holders of the converted Notes due 2025, with an aggregate fair value of less than $0.1 million, representing the conversion value in excess of the principal amount of the Notes due 2025. Following the repurchase combined with repurchase in previous years, as of December 31, 2023, $102.2 million aggregate principal amount of the Notes due 2025 remained outstanding.
The derived effective interest rate on the Notes due 2025 host contract was determined to be 5.18%, which remains unchanged from the date of issuance. The remaining unamortized debt discount was $0.8 million as of December 31, 2024, and will be amortized over approximately 0.2 years from December 31, 2024.
Notes due 2025 Hedge and Warrant Transactions
In connection with the offering of the Notes due 2025, the Company entered into privately-negotiated convertible note hedge transactions (the “Notes due 2025 Hedge”) pursuant to which the Company has the option to purchase a total of approximately 3.9 million shares of its common stock (subject to anti-dilution adjustments), which is the same number of shares initially issuable upon conversion of the notes, at a price of $81.54 per share, which is the initial conversion price of the Notes due 2025. The total cost of the convertible note hedge transactions was approximately $89.1 million. The convertible note hedge transactions are expected generally to reduce
Enphase Energy, Inc. | 2024 Form 10-K | 102
ENPHASE ENERGY, INC.
NOTES TO CONSOLIDATED FINANCIAL STATEMENTS
potential dilution to the Company’s common stock upon any conversion of the Notes due 2025 and/or offset any cash payments the Company is required to make in excess of the principal amount of converted notes, as the case may be.
Additionally, the Company separately entered into privately-negotiated warrant transactions in connection with the offering of the Notes due 2025 whereby the Company sold the 2025 Warrants to acquire approximately 3.9 million shares of the Company’s common stock (subject to anti-dilution adjustments) at an initial strike price of $106.94 per share. The Company received aggregate proceeds of approximately $71.6 million from the sale of the 2025 Warrants. If the market value per share of the Company’s common stock, as measured under the 2025 Warrants, exceeds the strike price of the 2025 Warrants, the 2025 Warrants will have a dilutive effect on the Company’s earnings per share, unless the Company elects, subject to certain conditions, to settle the 2025 Warrants in cash. Taken together, the purchase of the convertible note hedges in connection with the Notes due 2025 Hedge and the sale of the 2025 Warrants are intended to reduce potential dilution from the conversion of the Notes due 2025 and to effectively increase the overall conversion price from $81.54 to $106.94 per share. The 2025 Warrants are only exercisable on the applicable expiration dates in accordance with the agreements relating to each of the 2025 Warrants. Subject to the other terms of the 2025 Warrants, the first expiration date applicable to the 2025 Warrants is June 1, 2025, and the final expiration date applicable to the 2025 Warrants is September 23, 2025.
As of December 31, 2024, options to purchase approximately 1.3 million shares of common stock remained outstanding under the Notes due 2025 Hedge, and 2025 Warrants exercisable to purchase approximately 1.3 million shares remained outstanding.
Given that the transactions meet certain accounting criteria, the Notes due 2025 Hedge and the 2025 Warrants transactions are recorded in stockholders’ equity, and they are not accounted for as derivatives and are not remeasured each reporting period.
14. COMMITMENTS AND CONTINGENCIES
Operating Leases
The Company leases office facilities under noncancellable operating leases that expire on various dates through 2034, some of which may include options to extend the leases for up to 12 years.
The components of lease expense are presented as follows:
| | | | | | | | | | | | | | | | | |
| | | Years Ended December 31, |
| | | | | 2024 | | 2023 | | |
| | | | | | | | | |
| | | | | (In thousands) |
| Operating lease costs | | | | | $ | 11,047 | | | $ | 10,406 | | | |
The components of lease liabilities are presented as follows:
| | | | | | | | | | | |
| December 31,
2024 | | December 31,
2023 |
| | | |
| (In thousands except years and percentage data) |
Operating lease liabilities, current (Accrued liabilities) | $ | 5,815 | | | $ | 5,220 | |
| Operating lease liabilities, non-current (Other liabilities) | 23,044 | | | 18,802 | |
| Total operating lease liabilities | $ | 28,859 | | | $ | 24,022 | |
| | | |
| Supplemental lease information: | | | |
| Weighted average remaining lease term | 5.9 years | | 5.8 years |
| Weighted average discount rate | 6.7% | | 7.0% |
Enphase Energy, Inc. | 2024 Form 10-K | 103
ENPHASE ENERGY, INC.
NOTES TO CONSOLIDATED FINANCIAL STATEMENTS
Supplemental cash flow and other information related to operating leases were as follows:
| | | | | | | | | | | | | | | | | |
| | | Years Ended December 31, |
| | | | | 2024 | | 2023 | | |
| | | | | | | | | |
| | | | | (In thousands) |
| Cash paid for amounts included in the measurement of lease liabilities: | | | | | | | | | |
| Operating cash flows from operating leases | | | | | $ | 7,641 | | | $ | 7,225 | | | |
| | | | | | | | | |
| Non-cash investing activities: | | | | | | | | | |
| Lease liabilities arising from obtaining right-of-use assets | | | | | $ | 12,687 | | | $ | 5,005 | | | |
Undiscounted cash flows of operating lease liabilities as of December 31, 2024 were as follows:
| | | | | |
| Lease Amounts |
| (In thousands) |
| Year: | |
| 2025 | $ | 7,629 | |
| 2026 | 7,067 | |
| 2027 | 4,690 | |
| 2028 | 3,688 | |
| 2029 | 3,603 | |
| Thereafter | 9,061 | |
| Total lease payments | 35,738 | |
| Less: imputed lease interest | (6,879) | |
| Total lease liabilities | $ | 28,859 | |
Purchase Obligations
The Company has contractual obligations related to component inventory that its contract manufacturers procure on its behalf in accordance with its production forecast as well as other inventory related purchase commitments. As of December 31, 2024, these purchase obligations totaled approximately $130.9 million.
Litigation
The Company is subject to various legal proceedings and claims that have arisen in the ordinary course of business and that have not been fully resolved. An accrual for a loss contingency or loss recovery is recognized when it is probable and the amount of loss or recovery can be reasonably estimated. The outcome of litigation is inherently uncertain. If one or more legal matters were resolved against the Company in a reporting period for amounts above management’s expectations, the Company’s business, results of operations, financial position and cash flows for that reporting period could be materially adversely affected. As of December 31, 2024 and 2023, in the opinion of management, there was not at least a reasonable possibility the Company may have incurred a material loss, or a material loss greater than a recorded accrual, concerning loss contingencies for asserted legal and other claims.
On July 17, 2024, Zola Electric International, Ltd. (“Zola”) filed a complaint in the United States District Court for the Northern District of California against us, alleging breach of contract and breach of the covenant of good faith and fair dealing related to a joint development agreement and master supply agreement between Zola and the Company. On September 19, 2024, the Company filed a motion to dismiss the complaint, and all briefing papers were filed with the Court on or before November 8, 2024. The Company entered into a settlement and mutual release agreement with Zola on November 25, 2024 and Zola filed a stipulation of dismissal with prejudice on December 3, 2024, which was entered by the Court on December 4, 2024.
Enphase Energy, Inc. | 2024 Form 10-K | 104
ENPHASE ENERGY, INC.
NOTES TO CONSOLIDATED FINANCIAL STATEMENTS
15. STOCKHOLDERS' EQUITY
In May 2021, the board of directors authorized a share repurchase program (the “2021 Repurchase Program”) pursuant to which the Company was authorized to repurchase up to $500.0 million of the Company’s common stock, from time to time in the open market or through structured repurchase agreements with third parties. During the year ended December 31, 2023, the Company repurchased and subsequently retired 1,254,474 shares of common stock from the open market at an average cost of $159.43 per share for a total of $200.0 million. As of December 31, 2024, no amount remains available for share repurchase under the 2021 Repurchase Program.
In July 2023, the board of directors authorized a share repurchase program (the “2023 Repurchase Program”) pursuant to which the Company was authorized to repurchase up to $1.0 billion of the Company’s common stock. The Company may repurchase shares of common stock from time to time through solicited or unsolicited transactions in the open market, in privately negotiated transactions or pursuant to a Rule 10b5-1 plan. During the years ended December 31, 2024 and 2023, the Company repurchased and subsequently retired 4,543,016 and 2,029,894 shares, respectively, of common stock from the open market at an average cost of $86.15 and $103.45 per share, respectively, for a total of $391.4 million and $210.0 million, respectively. As of December 31, 2024, $398.6 million remains available for repurchase of shares under the 2023 Repurchase Program.
16. STOCK-BASED COMPENSATION
2011 Plan
Under the 2011 Equity Incentive Plan (the “2011 Plan”), the Company could initially issue up to 2,643,171 shares of its common stock pursuant to stock options, stock appreciation rights (“SARS”), restricted stock awards (“RSA”), RSUs, PSUs, and other forms of equity compensation, or collectively, stock awards, all of which may be granted to employees, including officers, and to non-employee directors and consultants. Options granted under the 2011 Plan before August 1, 2012 generally expire 10 years after the grant date and options granted thereafter generally expire seven years after the grant date. Equity awards granted under the 2011 Plan generally vested over a four year period from the date of grant based on continued service to the Company. As of May 19, 2021, no further stock options or other stock awards may be granted under the 2011 Plan.
2021 Plan
On May 19, 2021, at the 2021 annual meeting of stockholders of the Company, the stockholders approved the 2021 Equity Incentive Plan (the “2021 Plan”), as the successor to the 2011 Plan. The 2021 Plan provides for the grant of incentive stock options, SARS, RSAs, RSUs, PSUs and other forms of equity compensation. Eligible participants under the 2021 Plan include Company’s employees, directors and consultants. The 2021 Plan provides, among other things, that the number of shares of the Company’s common stock, $0.00001 par value per share, reserved for issuance under the 2021 Plan (subject to adjustment for certain changes in the Company’s capitalization) is equal to: (A) the sum of (i) 9,100,456 newly reserved shares of the Company’s common stock and (ii) 5,256,517 Returning Shares (as defined below) as such shares become available from time to time as set forth in the 2021 Plan. “Returning Shares” means shares subject to any outstanding award granted under the 2011 Plan (“Prior Plan Award”) that are (i) not issued because such Prior Plan Award or any portion thereof expires or otherwise terminates without all of the shares covered by such Prior Plan Award having been issued, or is settled in cash; (ii) forfeited back to or repurchased by the Company because of a failure to vest; or (iii) reacquired or withheld (or not issued) by the Company to satisfy the purchase price of, or a tax withholding obligation in connection with, a Prior Plan Award that is a Full Value Award (as defined in the 2021 Plan). As of December 31, 2024, 4,908,854 shares remained available for issuance under the 2021 Plan.
2011 Employee Stock Purchase Plan
The 2011 Employee Stock Purchase Plan (“ESPP”) became effective immediately upon the execution and delivery of the underwriting agreement for the Company’s initial public offering on March 29, 2012. The ESPP authorized the issuance of 669,603 shares of the Company’s common stock pursuant to purchase rights granted to employees. The number of shares of common stock reserved for issuance will automatically increase, on each January 1, by a lesser of (i) 700,000 shares of the Company’s common stock or (ii) 1.0% of the total number of shares of the Company’s common stock outstanding on December 31 of the preceding calendar year, as determined by the Company’s board of directors. In 2022, the Company’s board of directors waived the automatic increase of 700,000 shares that were to be added on January 1, 2023 for issuance under the 2011 ESPP plan and
Enphase Energy, Inc. | 2024 Form 10-K | 105
ENPHASE ENERGY, INC.
NOTES TO CONSOLIDATED FINANCIAL STATEMENTS
no additional shares were added to the plan on January 1, 2023. As of December 31, 2024, 2,352,769 shares remained available for future issuance under the ESPP. On January 1, 2025, the shares available for issuance under the ESPP automatically increased by 700,000 shares.
The ESPP is implemented by concurrent offering periods and each offering period may contain up to four interim purchase periods. In general, offering periods consist of the 24-month periods commencing on each May 15 and November 15 of a calendar year.
Generally, all full-time employees in the United States and certain other countries in which the Company operates, including executive officers, are eligible to participate in the ESPP. The ESPP permits eligible employees to purchase the Company’s common stock through payroll deductions, which may not exceed 15% of the employee’s total compensation subject to certain limits. Stock may be purchased under the plan at a price equal to 85% of the fair market value of the Company’s common stock on either the date of purchase or the first day of an offering period, whichever is lower. A two‑year look-back feature in the Company’s ESPP causes an offering period to reset if the fair value of the Company’s common stock on a purchase date is less than that on the initial offering date for that offering period. The reset feature, when triggered, will be accounted for as a modification to the original offering, resulting in additional expense to be recognized over the 24-month period of the new offering. During any calendar year, participants may not purchase shares of the Company’s common stock having a value greater than $25,000, based on the fair market value per share of the Company’s common stock at the beginning of an offering period.
Valuation of Equity Awards
Stock Options
No stock options were granted during the years ended December 31, 2024, 2023 and 2022.
Restricted Stock Units
The fair value of the Company’s RSU awards granted is based upon the closing price of the Company’s stock price on the date of grant.
Performance Stock Units
The fair value of the Company’s non-market PSU awards granted was based upon the closing price of the Company’s stock price on the date of grant. The fair value of awards of the Company’s PSU awards containing market conditions was determined using a Monte Carlo simulation model based upon the terms of the conditions, the expected volatility of the underlying security, and other relevant factors.
Stock-based Compensation Expense
Stock-based compensation expense for all stock-based awards, which includes shares purchased under the Company’s ESPP, RSUs and PSUs, expected to vest is measured at fair value on the date of grant and recognized ratably over the requisite service period.
In addition, as part of certain business acquisitions, the Company was obligated to issue shares of common stock of the Company as payment subject to achievement of certain targets. For such payments, the Company recorded stock-based compensation classified as post-combination expense recognized ratably over the measurement period presuming the targets will be met.
The following table summarizes the components of total stock-based compensation expense included in the consolidated statements of operations for the periods presented:
Enphase Energy, Inc. | 2024 Form 10-K | 106
ENPHASE ENERGY, INC.
NOTES TO CONSOLIDATED FINANCIAL STATEMENTS
| | | | | | | | | | | | | | | | | | | | | |
| | | Years Ended December 31, |
| | | | | 2024 | | 2023 | | 2022 |
| | | | | | | | | |
| | | | | (In thousands) |
| Cost of revenues | | | | | $ | 14,538 | | | $ | 13,357 | | | $ | 13,097 | |
| Research and development | | | | | 85,501 | | | 88,367 | | | 69,082 | |
| Sales and marketing | | | | | 65,092 | | | 65,703 | | | 78,819 | |
| General and administrative | | | | | 45,962 | | | 45,430 | | | 55,804 | |
| Restructuring | | | | | 267 | | | — | | | — | |
| Total | | | | | $ | 211,360 | | | $ | 212,857 | | | $ | 216,802 | |
| Income tax benefit (expense) included in the provision for income tax | | | | | $ | (17,958) | | | $ | 20,558 | | | $ | 45,066 | |
The following table summarizes the various types of stock-based compensation expense for the periods presented:
| | | | | | | | | | | | | | | | | | | | | |
| | | Years Ended December 31, |
| | | | | 2024 | | 2023 | | 2022 |
| | | | | | | | | |
| | | | | (In thousands) |
| RSUs and PSUs | | | | | $ | 205,453 | | | $ | 204,238 | | | $ | 200,295 | |
| Employee stock purchase plan | | | | | 5,907 | | | 7,450 | | | 5,475 | |
| Post combination expense | | | | | — | | | 1,169 | | | 11,032 | |
| Total | | | | | $ | 211,360 | | | $ | 212,857 | | | $ | 216,802 | |
As of December 31, 2024, there was approximately $400.2 million of total unrecognized stock-based compensation expense related to unvested equity awards, which are expected to be recognized over a weighted-average period of 2.6 years.
Equity Awards Activity
Stock Options
The following table summarizes stock option activity:
| | | | | | | | | | | | | | | | | | | | | | | |
| Number of
Shares
Outstanding | | Weighted-
Average
Exercise Price
per Share | | Weighted-
Average
Remaining
Contractual
Term | | Aggregate
Intrinsic
Value (1) |
| (In thousands) | | | | (Years) | | (In thousands) |
| Outstanding at December 31, 2021 | 2,264 | | | $ | 1.90 | | | | | |
| | | | | | | |
| Exercised | (799) | | | 2.02 | | | | | $ | 197,334 | |
| Canceled | (1) | | | 8.82 | | | | | |
| Outstanding at December 31, 2022 | 1,464 | | | $ | 1.83 | | | | | |
| | | | | | | |
| Exercised | (772) | | | 1.68 | | | | | $ | 100,390 | |
| Canceled | — | | | — | | | | | |
| Outstanding at December 31, 2023 | 692 | | | $ | 2.01 | | | | | |
| | | | | | | |
| Exercised | (687) | | | 1.79 | | | | | $ | 82,677 | |
| Canceled | — | | | — | | | | | |
| Outstanding at December 31, 2024 | 5 | | | $ | 32.80 | | | 1.2 | | $ | 182 | |
| Vested and expected to vest at December 31, 2024 | 5 | | | $ | 32.80 | | | 1.2 | | $ | 182 | |
| Exercisable at December 31, 2024 | 5 | | | $ | 32.80 | | | 1.2 | | $ | 182 | |
Enphase Energy, Inc. | 2024 Form 10-K | 107
ENPHASE ENERGY, INC.
NOTES TO CONSOLIDATED FINANCIAL STATEMENTS
(1) The intrinsic value of options exercised is based upon the value of the Company’s stock at exercise. The intrinsic value of options outstanding, vested and expected to vest, and exercisable as of December 31, 2024 is based on the closing price of the last trading day during the year ended December 31, 2024. The Company’s stock fair value used in this computation was $68.68 per share.
The following table summarizes information about stock options outstanding at December 31, 2024:
| | | | | | | | | | | | | | | | | | | | | | | | | | | | | | | | |
| | Options Outstanding | | Options Exercisable |
| Range of Exercise Prices | | Number of
Shares | | Weighted-
Average
Remaining
Life | | Weighted-
Average
Exercise
Price | | Number of
Shares | | Weighted-
Average
Exercise
Price |
| | (In thousands) | | (Years) | | | | (In thousands) | | |
| | | | | | | | | | |
| $2.76 —– $2.76 | | 2,585 | | | 0.1 | | $ | 2.76 | | | 2,585 | | | $ | 2.76 | |
| | | | | | | | | | |
| | | | | | | | | | |
| $64.17 —– $64.17 | | 2,475 | | | 2.3 | | 64.17 | | | 2,475 | | | 64.17 | |
| Total | | 5,060 | | | 1.2 | | $ | 32.80 | | | 5,060 | | | $ | 32.80 | |
Restricted Stock Units
The following table summarizes RSU activity:
| | | | | | | | | | | | | | | | | | | | | | | |
| Number of
Shares
Outstanding | | Weighted-
Average
Fair Value
per Share at
Grant Date | | Weighted-
Average
Remaining
Contractual
Term | | Aggregate
Intrinsic
Value (1) |
| (In thousands) | | | | (Years) | | (In thousands) |
| Outstanding at December 31, 2021 | 2,786 | | | $ | 100.73 | | | | | |
| Granted | 1,159 | | | 228.88 | | | | | |
| Vested | (1,500) | | | 72.87 | | | | | $ | 321,274 | |
| Canceled | (192) | | | 150.02 | | | | | |
| Outstanding at December 31, 2022 | 2,253 | | | $ | 181.01 | | | | | |
| Granted | 1,409 | | | 154.63 | | | | | |
| Vested | (1,061) | | | 152.47 | | | | | $ | 185,078 | |
| Canceled | (269) | | | 184.66 | | | | | |
| Outstanding at December 31, 2023 | 2,332 | | | $ | 177.64 | | | | | |
| Granted | 1,309 | | | 101.53 | | | | | |
| Vested | (977) | | | 171.88 | | | | | $ | 107,116 | |
| Canceled | (381) | | | 160.77 | | | | | |
| Outstanding at December 31, 2024 | 2,283 | | | $ | 139.27 | | | 1.4 | | $ | 156,758 | |
| Expected to vest at December 31, 2024 | 2,279 | | | $ | 139.25 | | | 1.4 | | $ | 156,586 | |
(1) The intrinsic value of RSUs vested is based upon the value of the Company’s stock when vested. The intrinsic value of RSUs outstanding and expected to vest as of December 31, 2024 is based on the closing price of the last trading day during the year ended December 31, 2024. The Company’s stock fair value used in this computation was $68.68 per share.
Enphase Energy, Inc. | 2024 Form 10-K | 108
ENPHASE ENERGY, INC.
NOTES TO CONSOLIDATED FINANCIAL STATEMENTS
Performance Stock Units
The following summarizes PSU activity:
| | | | | | | | | | | | | | | | | | | | | | | |
| Number of
Shares
Outstanding | | Weighted-
Average
Fair Value
per Share at
Grant Date | | Weighted-
Average
Remaining
Contractual
Term | | Aggregate
Intrinsic
Value (1) |
| (In thousands) | | | | (Years) | | (In thousands) |
| Outstanding at December 31, 2021 | 445 | | | $ | 169.82 | | | | | |
| Granted | 413 | | | 195.29 | | | | | |
| Vested | (303) | | | 168.88 | | | | | $ | 51,393 | |
| Canceled | (179) | | | 171.32 | | | | | |
| Outstanding at December 31, 2022 | 376 | | | $ | 197.82 | | | | | |
| Granted | 422 | | | 233.90 | | | | | |
| Vested | (380) | | | 196.24 | | | | | $ | 80,113 | |
| Canceled | (22) | | | 229.11 | | | | | |
| Outstanding at December 31, 2023 | 396 | | | $ | 235.99 | | | | | |
| Granted | 724 | | | 127.06 | | | | | |
| Vested | (100) | | | 214.91 | | | | | $ | 12,958 | |
| Canceled | (121) | | | 205.51 | | | | | |
| Outstanding at December 31, 2024 | 899 | | | $ | 154.67 | | | 1.2 | | $ | 61,725 | |
| Expected to vest at December 31, 2024 | 899 | | | $ | 154.67 | | | 1.2 | | $ | 61,725 | |
(1) The intrinsic value of PSUs vested is based upon the value of the Company’s stock when vested. The intrinsic value of PSUs outstanding and expected to vest as of December 31, 2024 is based on the closing price of the last trading day during the year ended December 31, 2024. The Company’s stock fair value used in this computation was $68.68 per share.
Employee Stock Purchase Plan
A summary of ESPP activity for the years presented is as follows (in thousands, except per share data):
| | | | | | | | | | | | | | | | | |
| Years Ended December 31, |
| 2024 | | 2023 | | 2022 |
| Proceeds from common stock issued under ESPP | $ | 11,773 | | | $ | 12,897 | | | $ | 9,570 | |
| Shares of common stock issued | 185 | | | 133 | | | 90 | |
| Weighted-average price per share | $ | 63.54 | | | $ | 97.05 | | | $ | 106.32 | |
17. INCOME TAXES
The domestic and foreign components of income before income taxes consisted of the following:
| | | | | | | | | | | | | | | | | |
| Years Ended December 31, |
| 2024 | | 2023 | | 2022 |
| | | | | |
| (In thousands) |
| United States | $ | 80,903 | | | $ | 465,463 | | | $ | 417,636 | |
| Foreign | 39,256 | | | 47,676 | | | 34,412 | |
| Income before income taxes | $ | 120,159 | | | $ | 513,139 | | | $ | 452,048 | |
Enphase Energy, Inc. | 2024 Form 10-K | 109
ENPHASE ENERGY, INC.
NOTES TO CONSOLIDATED FINANCIAL STATEMENTS
The income tax provision the years presented is as follows:
| | | | | | | | | | | | | | | | | |
| Years Ended December 31, |
| 2024 | | 2023 | | 2022 |
| | | | | |
| (In thousands) |
| Current: | | | | | |
| Federal | $ | 61,256 | | | $ | 96,151 | | | $ | 34,499 | |
| State | 6,319 | | | 13,937 | | | 9,719 | |
| Foreign | 11,137 | | | 11,303 | | | 10,605 | |
| 78,712 | | | 121,391 | | | 54,823 | |
| Deferred: | | | | | |
| Federal | (58,588) | | | (50,211) | | | (6,245) | |
| State | (4,535) | | | 1,287 | | | 3,803 | |
| Foreign | 1,912 | | | 1,736 | | | 2,305 | |
| (61,211) | | | (47,188) | | | (137) | |
| Income tax provision | $ | 17,501 | | | $ | 74,203 | | | $ | 54,686 | |
A reconciliation of the income tax provision and the amount computed by applying the statutory federal income tax rate of 21% to income before income taxes for the years presented is as follows:
| | | | | | | | | | | | | | | | | |
| Years Ended December 31, |
| 2024 | | 2023 | | 2022 |
| | | | | |
| (In thousands) |
| Income tax provision at statutory federal rate | $ | 25,233 | | | $ | 107,760 | | | $ | 94,926 | |
| State taxes, net of federal benefit | 7,406 | | | 18,107 | | | 9,980 | |
| Change in valuation allowance | 1,973 | | | — | | | — | |
| Foreign tax rate and tax law differential | 6,502 | | | 5,965 | | | 4,905 | |
| Tax credits | (7,598) | | | (29,229) | | | (19,864) | |
| Non-taxable income related to Section 45X tax credits | (33,083) | | | (11,229) | | | — | |
| Stock-based compensation | 13,408 | | | (13,969) | | | (45,551) | |
| Other permanent items | 335 | | | (964) | | | 4,149 | |
| Other nondeductible/nontaxable items | (219) | | | (73) | | | 69 | |
| Uncertain tax positions | 2,746 | | | 8,432 | | | 6,073 | |
| Foreign-derived intangible income deduction | (5,188) | | | (15,391) | | | (9,161) | |
| GILTI and other foreign inclusions | 9,101 | | | — | | | — | |
| Section 162(m) | 4,618 | | | 5,445 | | | 9,291 | |
| Unremitted foreign earnings | 1,654 | | | 1,829 | | | 1,837 | |
| Prior year changes in estimates | (9,387) | | | (2,480) | | | (1,968) | |
| Income tax provision | $ | 17,501 | | | $ | 74,203 | | | $ | 54,686 | |
Enphase Energy, Inc. | 2024 Form 10-K | 110
ENPHASE ENERGY, INC.
NOTES TO CONSOLIDATED FINANCIAL STATEMENTS
A summary of significant components of the Company’s deferred tax assets and liabilities as of December 31, 2024 and 2023 is as follows:
| | | | | | | | | | | |
| December 31, |
| 2024 | | 2023 |
| | | |
| (In thousands) |
| Deferred tax assets: | | | |
| Allowances and reserves | $ | 56,819 | | | $ | 53,066 | |
| Accrued liabilities | 30,230 | | | 1,957 | |
| Net operating loss and tax credit carryforwards | 17,945 | | | 23,267 | |
| Stock-based compensation | 17,504 | | | 15,811 | |
| Deferred revenue | 66,353 | | | 53,656 | |
| Fixed assets and intangibles | 1,670 | | | — | |
| | | |
| Convertible notes and related hedges | 27,053 | | | 38,773 | |
| Capitalized research and development expense | 104,002 | | | 83,098 | |
| Capitalized inventory | 13,865 | | | 7,916 | |
| Other | 8,496 | | | 5,441 | |
| Gross deferred tax assets | 343,937 | | | 282,985 | |
| Less valuation allowance | (1,973) | | | — | |
| Total deferred tax assets | 341,964 | | | 282,985 | |
| Deferred tax liabilities: | | | |
| | | |
| Fixed assets and intangibles | — | | | (2,833) | |
| Unremitted foreign earnings | (6,800) | | | (5,189) | |
| Deferred cost of goods sold | (26,397) | | | (27,782) | |
| Other | (208) | | | — | |
| Total deferred tax liabilities | (33,405) | | | (35,804) | |
| Net deferred tax asset | $ | 308,559 | | | $ | 247,181 | |
As of December 31, 2024, the Company recorded a valuation allowance of $2.0 million against certain of its net operating losses on one of its foreign operations, as it is more likely than not that such amounts will not be fully realized.
The Company's accounting for deferred taxes involves the evaluation of a number of factors concerning the realizability of the Company's deferred tax assets. Assessing the realizability of deferred tax assets is dependent upon several factors, including the likelihood and amount, if any, of future taxable income in relevant jurisdictions during the periods in which those temporary differences become deductible. The Company's management forecasts taxable income by considering all available positive and negative evidence including its history of operating income or losses and its financial plans and estimates which are used to manage the business. These assumptions require significant judgment about future taxable income. The amount of deferred tax assets considered realizable is subject to adjustment in future periods if estimates of future taxable income are reduced.
| | | | | | | | | | | |
| Years Ended December 31, |
| 2024 | | 2023 |
| | | |
| (In thousands) |
| Valuation allowance, beginning of period | $ | — | | | $ | — | |
| Additions | 1,973 | | | — | |
| Reversals | — | | | — | |
| Valuation allowance, end of period | $ | 1,973 | | | $ | — | |
Enphase Energy, Inc. | 2024 Form 10-K | 111
ENPHASE ENERGY, INC.
NOTES TO CONSOLIDATED FINANCIAL STATEMENTS
As of December 31, 2024, the Company evaluated its undistributed foreign earnings and identified $79.2 million in earnings that it does not consider to be permanently reinvested that may be subject to withholding taxes in local jurisdictions when they are distributed. The Company has recorded a provision of approximately $6.8 million for the taxes that would fall due when such earnings are repatriated.
The Company has approximately $6.0 million of federal tax credit and $10.3 million of state tax credit carryforwards. The federal credits begin to expire in 2031 and the state credits can be carried forward indefinitely. As of December 31, 2024, the Company has foreign net operating losses of $5.3 million from the acquisition of GreenCom, which can be carried over indefinitely.
Utilization of some of the federal credit carryforwards and state net operating loss and credit carryforwards are subject to annual limitations due to the “change in ownership” provisions of the Internal Revenue Code of 1986, as amended (the “Code”), and similar state provisions. The Company believes that no such change has occurred through December 31, 2024.
Accounting for uncertain tax positions prescribes a recognition threshold and measurement attribute for the financial statement recognition and measurement of a tax position taken or expected to be taken in a tax return. The Company is required to recognize in the financial statements the impact of a tax position, if that position is more-likely than-not of being sustained on audit, based on the technical merits of the position. The Company recorded a net charge for unrecognized tax benefits in 2024 of $0.4 million.
The Company does not have any tax positions for which it is reasonably possible the total amount of gross unrecognized tax benefits will increase or decrease over the next year. The unrecognized tax benefits may increase or change during the next year for items that arise in the ordinary course of business.
As of December 31, 2024, the total amount of gross unrecognized tax benefits was $27.7 million, of which $26.0 million, if recognized, would impact the Company’s effective tax rate.
A tabular reconciliation of the total amounts of unrecognized tax benefits for the years presented is as follows (in thousands):
| | | | | | | | | | | | | | | | | |
| Years Ended December 31, |
| 2024 | | 2023 | | 2022 |
| Unrecognized tax benefits—at beginning of year | $ | 27,218 | | | $ | 21,768 | | | $ | 20,904 | |
| Decreases in balances related to tax positions taken in prior years | (702) | | | (417) | | | (4,786) | |
| | | | | |
| Increases in balances related to tax positions taken in current year | 1,490 | | | 5,985 | | | 6,562 | |
| Settlements | — | | | — | | | (657) | |
| Lapses in statutes of limitations | (346) | | | (118) | | | (255) | |
| Unrecognized tax benefits—at end of year | $ | 27,660 | | | $ | 27,218 | | | $ | 21,768 | |
The Company includes interest and penalties related to unrecognized tax benefits within the income tax provision. In the years ended December 31, 2024, 2023 and 2022, the total amount of gross interest and penalties accrued was $6.1 million, $2.9 million and $0.8 million, respectively. Both the unrecognized tax benefits and the associated interest and penalties that are not expected to result in payment or receipt of cash within one year are classified as other non-current liabilities in the consolidated balance sheets. In connection with tax matters, the Company’s interest and penalty expense recognized in 2024, 2023 and 2022 in the consolidated statements of operations was $2.3 million, $3.8 million and $0.9 million, respectively.
The Company’s tax returns continue to remain effectively subject to examination by U.S. federal authorities for the years 2006 and onwards and by California state authorities for the years 2006 and onwards due to use and carryovers of net operating losses and tax credits. The Company is currently under audit in India and it is reasonably possible that its existing gross unrecognized tax benefits may be reduced by up to $5.1 million within the next 12 months.
In August 2022, the U.S. enacted the IRA, which included revisions to the Code. The IRA introduced a 15% corporate alternative minimum income tax (“CAMT”) for corporations whose average adjusted financial income for any consecutive three-year period ending after December 31, 2021, exceeds $1.0 billion. Further, the IRA also extended the investment tax credits for clean energy and expanded the incentives to clean energy manufacturing.
Enphase Energy, Inc. | 2024 Form 10-K | 112
ENPHASE ENERGY, INC.
NOTES TO CONSOLIDATED FINANCIAL STATEMENTS
For the year ended December 31, 2024, the Company is not subject to the CAMT based on its current operating results and interpretations of the latest IRA guidance. For the years ended December 31, 2024 and 2023, benefits recognized from the AMPTC of $157.5 million and $53.5 million, respectively, were recorded as a prepaid income tax of $94.9 million (included in Prepaid Expenses and Other Current Assets) and reduction of income tax payable of $62.7 million on the consolidated balance sheet for the year ended December 31, 2024, reduction to income tax payable of $53.5 million (included in Accrued Liabilities) on the consolidated balance sheet for the year ended December 31, 2023, and as a reduction to cost of revenues of $157.5 million and $53.5 million on the consolidated statement of operations for the years ended December 31, 2024 and 2023, respectively.
In December 2021, the Organization for Economic Co-operation and Development Inclusive Framework on Base Erosion Profit Shifting released Model Global Anti-Base Erosion rules (“Model Rules”) under Pillar Two. The Model Rules set forth the “common approach” for a Global Minimum Tax at 15 percent for multinational enterprises with a turnover of more than 750 million euros. Rules under Pillar Two were effective from January 1, 2024. The adoption of Pillar Two rules did not have a significant impact on the Company’s consolidated financial statements in 2024.
18. CONCENTRATION OF CREDIT RISK AND MAJOR CUSTOMERS
The Company is potentially subject to financial instrument concentration of credit risk through its cash, cash equivalents, restricted cash, marketable securities and accounts receivable. The Company places its cash, cash equivalents, restricted cash and marketable securities with high quality institutions and performs periodic evaluations of their relative credit standing.
Accounts receivable can be potentially exposed to a concentration of credit risk with its major customers. As of December 31, 2024 and 2023, amounts due from one customer represented approximately 43% and 40%, respectively, of the total accounts receivable balance.
In the years ended December 31, 2024, 2023 and 2022, one customer accounted for approximately 48%, 40% and 37%, respectively, of our net revenues.
19. NET INCOME PER SHARE
Basic net income per share is computed by dividing net income by the weighted average number of shares of common stock outstanding during the period. Diluted net income per share is computed in a similar manner, but it also includes the effect of potential common shares outstanding during the period, when dilutive.
Enphase Energy, Inc. | 2024 Form 10-K | 113
ENPHASE ENERGY, INC.
NOTES TO CONSOLIDATED FINANCIAL STATEMENTS
The following table presents the computation of basic and diluted net income per share for the periods presented:
| | | | | | | | | | | | | | | | | | | | | |
| | | Years Ended December 31, |
| | | | | 2024 | | 2023 | | 2022 |
| | | | | | | | | |
| | | | | (In thousands, except per share data) |
| Numerator: | | | | | | | | | |
| Net income | | | | | $ | 102,658 | | | $ | 438,936 | | | $ | 397,362 | |
| | | | | | | | | |
| | | | | | | | | |
| Convertible senior notes interest and financing costs, net of tax | | | | | 2,486 | | | 2,573 | | | 2,629 | |
| Adjusted net income | | | | | $ | 105,144 | | | $ | 441,509 | | | $ | 399,991 | |
| | | | | | | | | |
| Denominator: | | | | | | | | | |
| Shares used in basic per share amounts: | | | | | | | | | |
| Weighted average common shares outstanding | | | | | 135,167 | | | 136,376 | | | 135,349 | |
| | | | | | | | | |
| Shares used in diluted per share amounts: | | | | | | | | | |
| Weighted average common shares outstanding used for basic calculation | | | | | 135,167 | | | 136,376 | | | 135,349 | |
| Effect of dilutive securities: | | | | | | | | | |
| Employee stock-based awards | | | | | 474 | | | 1,782 | | | 3,407 | |
| Notes due 2023 | | | | | — | | | 638 | | | 900 | |
| | | | | | | | | |
| | | | | | | | | |
| Notes due 2025 | | | | | 288 | | | — | | | — | |
| 2025 Warrants | | | | | — | | | 419 | | | 659 | |
| Notes due 2026 | | | | | 2,057 | | | 2,057 | | | 2,057 | |
| | | | | | | | | |
| Notes due 2028 | | | | | 2,018 | | | 2,018 | | | 2,018 | |
| | | | | | | | | |
| Weighted average common shares outstanding for diluted calculation | | | | | 140,004 | | | 143,290 | | | 144,390 | |
| | | | | | | | | |
| Basic and diluted net income per share | | | | | | | | | |
| Net income per share, basic | | | | | $ | 0.76 | | | $ | 3.22 | | | $ | 2.94 | |
| Net income per share, diluted | | | | | $ | 0.75 | | | $ | 3.08 | | | $ | 2.77 | |
Diluted earnings per share for the year ended December 31, 2024 includes the dilutive effect of potentially dilutive common shares by application of the treasury stock method for stock options, RSUs, PSUs, ESPP, Notes due 2025, and includes potentially dilutive common shares by application of the if-converted method for the Notes due 2026 and Notes due 2028. Potentially dilutive common shares for the year ended December 31, 2023 and 2022 include stock options, RSUs, PSUs, ESPP, Notes due 2023, Notes due 2025, Notes due 2026, Notes due 2028 and the 2025 Warrants. To the extent these potential common shares are antidilutive, they are excluded from the calculation of diluted net income per share.
Further, the Company under the relevant sections of the indentures, irrevocably may elect to settle principal in cash and any excess in cash or shares of the Company’s common stock for the Notes due 2026 and Notes due 2028. If and when the Company makes such election, there will be no adjustment to the net income and the Company will use the average share price for the period to determine the potential number of shares to be issued based upon assumed conversion to be included in the diluted share count.
Holders of the Notes due 2025 may now convert their notes at any time until the close of business on the second scheduled trading day immediately preceding the maturity date of March 1, 2025. These conversions will be settled in a combination settlement method with the principal value settled in cash and the remaining value in shares of the Company’s common stock, as a result there was no adjustment to the net income for the year ended December 31, 2024, and the Company used the average share price for the period to determine the potential number of shares that will be issued and included in the diluted share count for the year ended December 31, 2024.
Enphase Energy, Inc. | 2024 Form 10-K | 114
ENPHASE ENERGY, INC.
NOTES TO CONSOLIDATED FINANCIAL STATEMENTS
The following outstanding shares of common stock equivalents were excluded from the calculation of the diluted net income per share attributable to common stockholders because their effect would have been antidilutive:
| | | | | | | | | | | | | | | | | | | | | |
| | | Years Ended December 31, |
| | | | | 2024 | | 2023 | | 2022 |
| | | | | | | | | |
| | | | | (In thousands) |
| | | | | | | | | |
| | | | | | | | | |
| | | | | | | | | |
| Employee stock-based awards | | | | | 1,359 | | | 1,113 | | | 135 | |
| | | | | | | | | |
| Notes due 2025 | | | | | — | | | 1,253 | | | 1,253 | |
| | | | | | | | | |
| 2026 Warrants | | | | | 5,673 | | | 3,038 | | | 1,577 | |
| | | | | | | | | |
| 2028 Warrants | | | | | 5,566 | | | 2,981 | | | 1,547 | |
| Total | | | | | 12,598 | | | 8,385 | | | 4,512 | |
20. SEGMENT AND GEOGRAPHIC INFORMATION
The Company’s chief operating decision maker is the Chief Executive Officer (the “CEO”). The Company has one business activity, which entails the design, development, manufacture and sale of solutions for the solar PV industry. There are no segment managers who are held accountable for operations, operating results or plans for levels or components below the consolidated unit level. Accordingly, management has determined that the Company has a single operating and reportable segment. The accounting policies related to operating and reportable segments are the same as those described in Note 2, “Summary of Significant Accounting Policies”. The primary measure of segment profit or loss is consolidated net income as presented below and is used the by CEO for the purpose of evaluating segment performance and allocation of budget to support business expansion, new product development and operational efficiencies. | | | | | | | | | | | | | | | | | |
| Years Ended December 31, |
| 2024 | | 2023 | | 2022 |
| | | | | |
| (In thousands) |
| Net revenues | $ | 1,330,383 | | | $ | 2,290,786 | | | $ | 2,330,853 | |
| Less: | | | | | |
Other cost of revenues(1) | 798,425 | | | 1,253,328 | | | 1,336,837 | |
| Income-based government grants | (157,538) | | | (53,470) | | | — | |
Incremental cost for manufacturing in the United States(2) | 38,351 | | | 11,603 | | | — | |
| Stock-based compensation expense | 211,360 | | | 212,857 | | | 216,802 | |
| Acquisition related amortization | 20,380 | | | 22,897 | | | 22,845 | |
Other restructuring and asset impairment charges(3) | 12,887 | | | 15,684 | | | 2,384 | |
Other research and development(4) | 115,814 | | | 138,969 | | | 99,764 | |
Other sales and marketing(5) | 128,549 | | | 150,772 | | | 119,762 | |
Other general and administrative(6) | 84,863 | | | 92,405 | | | 84,198 | |
| Income from operations | 77,292 | | | 445,741 | | | 448,261 | |
| Total other income, net | 42,867 | | | 67,398 | | | 3,787 | |
| Income from income taxes | 120,159 | | | 513,139 | | | 452,048 | |
| Income tax provision | (17,501) | | | (74,203) | | | (54,686) | |
| Net Income | $ | 102,658 | | | $ | 438,936 | | | $ | 397,362 | |
(1) Represents consolidated cost of revenue, excluding stock-based compensation, acquisition related amortization, income-based government grants and incremental costs for manufacturing in the United States.
(2) Represents the incremental manufacturing cost incurred in the U.S. relative to manufacturing in India. This is calculated based on the difference in product cost for manufacturing the product in the U.S. as compared to India for the same or
Enphase Energy, Inc. | 2024 Form 10-K | 115
ENPHASE ENERGY, INC.
NOTES TO CONSOLIDATED FINANCIAL STATEMENTS
similar products. It also includes the portion of the income-based government grants earned that the Company remits to its contract manufacturers.
(3) Represents consolidated restructuring and asset impairment charges, excluding stock-based compensation.
(4) Represents consolidated research and development, excluding stock-based compensation.
(5) Represents consolidated sales and marketing, excluding stock-based compensation and acquisition related amortization.
(6) Represents consolidated general and administrative, excluding stock-based compensation.
See Note 3. “Revenue Recognition,” for the table presenting net revenues (based on the destination of shipments). The following table presents long-lived assets by geographic region as of the periods presented: Long-Lived Assets
| | | | | | | | | | | | | |
| December 31, |
| 2024 | | 2023 | | |
| | | | | |
| (In thousands) |
| United States | $ | 103,823 | | | $ | 107,448 | | | |
| India | 18,153 | | | 22,978 | | | |
| China | 11,619 | | | 12,883 | | | |
| New Zealand | 6,775 | | | 8,959 | | | |
| Mexico | 4,418 | | | 6,028 | | | |
| Romania | — | | | 5,280 | | | |
| Others | 2,726 | | | 4,668 | | | |
| Total | $ | 147,514 | | | $ | 168,244 | | | |
The segment assets are not reviewed by the CODM at a different asset level or category and is reviewed at the consolidated level.
Enphase Energy, Inc. | 2024 Form 10-K | 116
Item 9. Changes in and Disagreements with Accountants on Accounting and Financial Disclosure
None.
Item 9A. Controls and Procedures
Evaluation of Disclosure Controls and Procedures
We carried out an evaluation required by the Exchange Act, under the supervision and with the participation of our principal executive officer and principal financial officer, of the effectiveness of the design and operation of our disclosure controls and procedures, as defined in Rule 13a-15(e) of the Exchange Act, as of December 31, 2024. Based on this evaluation, our principal executive officer and principal financial officer concluded that our disclosure controls and procedures were effective to provide reasonable assurance that information required to be disclosed by us in the reports that we file or submit under the Exchange Act is recorded, processed, summarized and reported within the time periods specified in the SEC’s rules and forms and to provide reasonable assurance that such information is accumulated and communicated to our management, including our principal executive officer and principal financial officer, as appropriate to allow timely decisions regarding required disclosures.
Management’s Report on Internal Control over Financial Reporting
Management is responsible for establishing and maintaining adequate internal control over financial reporting in providing reasonable assurance regarding the reliability of financial reporting and the preparation of financial statements for external purposes in accordance with generally accepted accounting principles, as defined in Rule 13a-15(f) of the Exchange Act. Management has assessed the effectiveness of our internal control over financial reporting based on criteria set forth in Internal Control – Integrated Framework issued by the Committee of Sponsoring Organizations of the Treadway Commission (2013). As a result of this assessment, management concluded that, as of December 31, 2024, our internal control over financial reporting was effective. Our independent registered public accounting firm, Deloitte & Touche LLP, has issued an audit report on our internal control over financial reporting, which appears in Part II, Item 8 of this Annual Report on Form 10-K.
Changes in Internal Control over Financial Reporting
There were no changes in our internal control over financial reporting that occurred during the most recent year ended December 31, 2024 that materially affected, or are reasonably likely to materially affect, our internal control over financial reporting.
Limitations on Controls
Our disclosure controls and procedures and internal control over financial reporting are designed to provide reasonable assurance of achieving their objectives as specified above. Management does not expect, however, that our disclosure controls and procedures or our internal control over financial reporting will prevent or detect all errors and fraud. Any control system, no matter how well designed and operated, is based upon certain assumptions and can provide only reasonable, not absolute, assurance that its objectives will be met. Further, no evaluation of controls can provide absolute assurance that misstatements due to error or fraud will not occur or that all control issues and instances of fraud, if any, have been detected by us.
Item 9B. Other Information
Rule 10b5-1 Trading Plans
Not applicable.
Item 9C. Disclosure Regarding Foreign Jurisdictions that Prevent Inspections
Not applicable.
Enphase Energy, Inc. | 2024 Form 10-K | 117
PART III
Item 10. Directors, Executive Officers and Corporate Governance
The information required regarding our directors is incorporated by reference from the information contained in the section entitled “Election of Directors” in our definitive Proxy Statement for the 2025 Annual Meeting of Stockholders (our “Proxy Statement”), a copy of which will be filed with the SEC on or before April 30, 2025.
The information required regarding our executive officers is incorporated by reference from the information contained in the section entitled “Management” in our Proxy Statement.
The information required regarding Section 16(a) beneficial ownership reporting compliance is incorporated by reference from the information contained in the section entitled “Delinquent Section 16(a) Reports” in our Proxy Statement.
The information required with respect to procedures by which security holders may recommend nominees to our board of directors, and the composition of our Audit Committee, and whether we have an “audit committee financial expert,” is incorporated by reference from the information contained in the section entitled “Information Regarding Committees of the Board” in our Proxy Statement.
Insider Trading Policy
We have adopted a Policy Against Trading on the Basis of Inside Information governing the purchase, sale and/or other dispositions of our securities by our directors, officers and employees. A copy of this policy is filed as an exhibit to this Annual Report on Form 10-K. The information required regarding our insider trading policies and procedures is incorporated by reference from the information contained in the section entitled “Insider Trading Policy” in our Proxy Statement.
Code of Conduct
We have a written code of conduct that applies to all our executive officers, directors and employees. Our Code of Conduct is available on our website at http://investor.enphase.com/corporate-governance. A copy of our Code of Conduct may also be obtained free of charge by writing to our Secretary, Enphase Energy, Inc., 47281 Bayside Parkway, Fremont, CA 94538. If we make any substantive amendments to our Code of Conduct or grant any waiver from a provision of the Code of Conduct to any executive officer or director, we intend to promptly disclose the nature of the amendment or waiver on our website.
Item 11. Executive Compensation
The information required regarding the compensation of our directors and executive officers is incorporated by reference from the information contained in the sections entitled “Executive Compensation,” “Director Compensation,” “Compensation Committee Interlocks and Insider Participation” and “Compensation Committee Report” in our Proxy Statement.
Item 12. Security Ownership of Certain Beneficial Owners and Management and Related Stockholder Matters
The information required regarding security ownership of our 5% or greater stockholders and of our directors and executive officers is incorporated by reference from the information contained in the section entitled “Security Ownership of Certain Beneficial Owners and Management” in our Proxy Statement.
Equity Compensation Plan Information
The information required regarding securities authorized for issuance under our equity compensation plans is incorporated by reference from the information contained in the section entitled “Equity Compensation Plan Information” in our Proxy Statement.
Item 13. Certain Relationships and Related Transactions, and Director Independence
The information required regarding related transactions is incorporated herein by reference from the information contained in the section entitled “Transactions With Related Persons” and, with respect to director independence, the section entitled “Election of Directors” in our Proxy Statement.
Enphase Energy, Inc. | 2024 Form 10-K | 118
Item 14. Principal Accountant Fees and Services
The information required is incorporated by reference from the information contained in the sections entitled “Principal Accountant Fees and Services” and “Pre-Approval Policies and Procedures” in the Proposal entitled “Ratification of Selection of Independent Registered Public Accounting Firm” in our Proxy Statement.
Enphase Energy, Inc. | 2024 Form 10-K | 119
PART IV
Item 15. Exhibits and Financial Statement Schedules
Consolidated Financial Statements
The information concerning our consolidated financial statements, and Report of Independent Registered Public Accounting Firm required by this Item is incorporated by reference herein to the section of this Annual Report on Form 10-K in Part II, Item 8, Consolidated Financial Statements and Supplementary Data.
No schedules are provided because they are not applicable, not required under the instructions, or the requested information is shown in the financial statements or related notes thereto.
Exhibits
The exhibits listed below are filed as part of this Annual Report on Form 10-K or incorporated herein by reference, in each case as indicated below.
| | | | | | | | | | | | | | | | | | | | | | | | | | | | | | | | | | | | | | |
| | | | Incorporation by Reference | | |
| Exhibit Number | | Exhibit Description | | Form | | SEC File No. | | Exhibit | | Filing Date | | Filed Herewith |
| | | | | | | | | | | | |
| | | | 8-K | | 001-35480 | | 3.1 | | 4/6/2012 | | |
| | | | 10-Q | | 001-35480 | | 3.1 | | 8/9/2017 | | |
| | | | 10-Q | | 001-35480 | | 2.1 | | 8/6/2018 | | |
| | | | 8-K | | 001-35480 | | 3.1 | | 5/27/2020 | | |
| | | | S-8 | | 333-256290 | | 4.5 | | 5/19/2021 | | |
| | | | 8-K | | 001-35480 | | 3.1 | | 4/8/2022 | | |
| | | | | | | | | | | | X |
| | | | 8-K | | 001-35480 | | 4.1 | | 3/9/2020 | | |
| | | | 8-K | | 001-35480 | | 4.1 | | 3/9/2020 | | |
| | | | 8-K | | 001-35480 | | 4.1 | | 3/1/2021 | | |
| | | | 8-K | | 001-35480 | | 4.2 | | 3/1/2021 | | |
| | | | 8-K | | 001-35480 | | 4.1 | | 3/1/2021 | | |
| | | | 8-K | | 001-35480 | | 4.2 | | 3/1/2021 | | |
| | | | 10-K | | 001-35480 | | 4.11 | | 2/11/2022 | | |
| | | | S-1/A | | 333-174925 | | 10.1 | | 8/24/2011 | | |
| | | | | | | | | | | | |
| | | | S-8 | | 333-181382 | | 99.1 | | 5/19/2021 | | |
| | | | DEF 14A | | 001-35480 | | Appendix A | | 3/18/2016 | | |
| | | | DEF 14A | | 001-35480 | | Appendix A | | 3/31/2017 | | |
| | | |
| |
| | | |
| | X |
Enphase Energy, Inc. | 2024 Form 10-K | 120
| | | | | | | | | | | | | | | | | | | | | | | | | | | | | | | | | | | | | | |
| | | | 10-Q | | 001-35480 | | 10.4 | | 11/2/2016 | | |
| | | | | | | | | | | | |
| | | |
| |
| | | | | | X |
| | | | 10-K | | 001-35480 | | 10.8 | | 2/13/2023 | | |
| | | | 10-Q | | 001-35480 | | 10.3 | | 4/26/2022 | | |
| | | | | | | | | | | | |
| | | | 10-Q | | 001-35480 | | 10.1 | | 7/27/2023 | | |
| | | | | | | | | | | | X |
| | | | 10-K | | 001-35480 | | 10.11 | | 2/16/2021 | | |
| | | | 8-K | | 001-35480 | | 10.1 | | 12/5/2017 | | |
| | | | 10-Q | | 001-35480 | | 10.5 | | 5/8/2013 | | |
| | | | | | | | | | | | |
| | | | | | | | | | | | |
| | | | | | | | | | | | |
| | | | | | | | | | | | X |
| | | | | | | | | | | | |
| | | | 10-K | | 001-35480 | | 10.16 | | 2/9/2024 | | |
| | | | 10-K | | 001-35480 | | 10.17 | | 2/9/2024 | | |
| | | | 10-K | | 001-35480 | | 10.21 | | 2/16/2021 | | |
| | | | 10-K | | 001-35480 | | 10.22 | | 2/16/2021 | | |
| | | | 10-Q | | 001-35480 | | 10.1 | | 7/26/2022 | | |
| | | | 10-Q | | 001-35480 | | 10.2 | | 7/26/2022 | | |
| | | | 10-K | | 001-35480 | | 10.24 | | 2/13/2023 | | |
| | | | | | | | | | | | |
| | | | 10-K | | 001-35480 | | 10.24 | | 2/16/2021 | | |
| | | | 10-K | | 001-35480 | | 10.45 | | 3/15/2019 | | |
| | | | | | | | | | | | |
| | | | 10-K | | 001-35480 | | 10.26 | | 2/16/2021 | | |
| | | | 10-K | | 001-35480 | | 10.27 | | 2/16/2021 | | |
| | | | | | | | | | | | X |
Enphase Energy, Inc. | 2024 Form 10-K | 121
| | | | | | | | | | | | | | | | | | | | | | | | | | | | | | | | | | | | | | |
| | | | 8-K | | 001-35480 | | 10.2 | | 3/9/2020 | | |
| | | | 8-K | | 001-35480 | | 10.3 | | 3/9/2020 | | |
| | | | 8-K | | 001-35480 | | 10.2 | | 3/1/2021 | | |
| | | | 8-K | | 001-35480 | | 10.3 | | 3/1/2021 | | |
| | | | 8-K | | 001-35480 | | 10.1 | | 3/15/2021 | | |
| | | | 8-K | | 001-35480 | | 10.2 | | 3/15/2021 | | |
| | | | 8-K | | 001-35480 | | 10.1 | | 3/9/2020 | | |
| | | | 8-K | | 001-35480 | | 10.5 | | 3/1/2021 | | |
| | | | 8-K | | 001-35480 | | 10.6 | | 3/1/2021 | | |
| | | | 8-K | | 001-35480 | | 10.7 | | 3/1/2021 | | |
| | | | 8-K | | 001-35480 | | 10.8 | | 3/1/2021 | | |
| | | | 8-K | | 001-35480 | | 10.9 | | 3/1/2021 | | |
| | | | 8-K | | 001-35480 | | 10.1 | | 3/8/2021 | | |
| | | | 10-Q | | 001-35480 | | 10.1 | | 4/26/2022 | | |
| | | | 10-K | | 001-35480 | | 10.42 | | 2/9/2024 | | |
| | | | | | | | | | | | X |
| | | | | | | | | | | | X |
| | | | | | | | | | | | X |
| | | | | | | | | | | | X |
| | | | | | | | | | | | X |
| | | | | | | | | | | | X |
Enphase Energy, Inc. | 2024 Form 10-K | 122
| | | | | | | | | | | | | | | | | | | | | | | | | | | | | | | | | | | | | | |
| | | | | | | | | | | | X |
| | | | 10-K | | 001-35480 | | 97.1 | | 2/9/2024 | | |
| 101.INS | | XBRL Instance Document. | | | | | | | | | | X |
| 101.SCH | | XBRL Taxonomy Extension Schema Document. | | | | | | | | | | X |
| 101.CAL | | XBRL Taxonomy Extension Calculation Linkbase Document. | | | | | | | | | | X |
| 101.DEF | | XBRL Taxonomy Extension Definition Linkbase Document. | | | | | | | | | | X |
| 101.LAB | | XBRL Taxonomy Extension Label Linkbase Document. | | | | | | | | | | X |
| 101.PRE | | XBRL Taxonomy Extension Presentation Document. | | | | | | | | | | X |
| 104 | | Cover Page Interactive Data File (formatted as Inline XBRL and contained in Exhibits 101). | | | | | | | | | | X |
+ Management compensatory plan or arrangement.
# Pursuant to Item 601(b)(10) of Regulation S-K, certain portions of this exhibit have been omitted by means of marking such portions with asterisks because we have determined that the information is both not material and is the type that we treat as private or confidential.
* The certifications attached as Exhibit 32.1 accompany this Quarterly Report on Form 10-Q pursuant to 18 U.S.C. Section 1350, as adopted pursuant to Section 906 of the Sarbanes-Oxley Act, and shall not be deemed “filed” by Enphase Energy, Inc. for purposes of Section 18 of the Securities Exchange Act of 1934, as amended, nor shall they be deemed incorporated by reference in any filing.
Enphase Energy, Inc. | 2024 Form 10-K | 123
Item 16. Form 10-K Summary
None.
Enphase Energy, Inc. | 2024 Form 10-K | 124
SIGNATURES
Pursuant to the requirements of Section 13 or 15(d) of the Securities Exchange Act of 1934, the registrant has duly caused this report to be signed on its behalf by the undersigned, thereunto duly authorized on February 7, 2025.
| | | | | | | | | | | |
| | Enphase Energy, Inc. |
| | | |
| | By: | /s/ BADRINARAYANAN KOTHANDARAMAN |
| | | Badrinarayanan Kothandaraman |
| | | President and Chief Executive Officer |
Enphase Energy, Inc. | 2024 Form 10-K | 125
POWER OF ATTORNEY
KNOW ALL PERSONS BY THESE PRESENTS, that each person whose signature appears below constitutes and appoints Badrinarayanan Kothandaraman and Mandy Yang, jointly and severally, as his or her true and lawful attorneys-in-fact and agents, with full power of substitution and resubstitution, for him or her and in his or her name, place and stead, in any and all capacities, to sign any and all amendments to this Annual Report on Form 10-K and to file the same, with all exhibits thereto, and other documents in connection therewith, with the Securities and Exchange Commission, granting unto said attorneys-in-fact and agents full power and authority to do and perform each and every act and thing requisite or necessary to be done in and about the premises hereby ratifying and confirming all that said attorneys-in-fact and agents, or his or her substitute or substitutes, may lawfully do or cause to be done by virtue hereof.
Pursuant to the requirements of the Securities Exchange Act of 1934, this report has been signed below by the following persons on behalf of the registrant and in the capacities on the dates indicated.
| | | | | | | | | | | | | | |
| Signature | | Title | | Date |
| | | | |
| /s/ BADRINARAYANAN KOTHANDARAMAN | | President and Chief Executive Officer
(Principal Executive Officer) | | February 7, 2025 |
| Badrinarayanan Kothandaraman | | | |
| | | | |
| | | | |
| | | |
| | | | |
| /s/ MANDY YANG | | Executive Vice President and Chief Financial Officer
(Principal Financial Officer) | | February 7, 2025 |
| Mandy Yang | | | |
| | | | |
| | | | |
| /s/ MARY ERGINSOY | | Vice President and Chief Accounting Officer
(Principal Accounting Officer) | | February 7, 2025 |
| Mary Erginsoy | | | |
| | | | |
| /s/ STEVEN J. GOMO | | Director | | February 7, 2025 |
| Steven J. Gomo | | | | |
| | | | |
| /s/ JAMIE HAENGGI | | Director | | February 7, 2025 |
| Jamie Haenggi | | | | |
| | | | |
| /s/ BENJAMIN KORTLANG | | Director | | February 7, 2025 |
| Benjamin Kortlang | | | | |
| | | | |
| /s/ JOESEPH MALCHOW | | Director | | February 7, 2025 |
| Joseph Malchow | | | | |
| | | | |
| /s/ RICHARD MORA | | Director | | February 7, 2025 |
| Richard Mora | | | | |
| | | | |
| /s/ THURMAN JOHN RODGERS | | Director | | February 7, 2025 |
| Thurman John Rodgers | | | | |
| | | | |
| | | | |
| | | | |
Enphase Energy, Inc. | 2024 Form 10-K | 126
