This report and the financial statements contained herein are submitted for the general information of the shareholders of the Goodwood SMID Cap Discovery Fund (the "Fund"). The Fund's shares are not deposits or obligations of, or guaranteed by, any depository institution. The Fund's shares are not insured by the FDIC, Federal Reserve Board or any other agency, and are subject to investment risks, including possible loss of principal amount invested. Neither the Fund nor the Fund's distributor is a bank.
The Goodwood SMID Cap Discovery Fund is distributed by Capital Investment Group, Inc., Member FINRA/SIPC, 17 Glenwood Ave, Raleigh, NC, 27603. There is no affiliation between the Goodwood SMID Cap Discovery Fund, including its principals, and Capital Investment Group, Inc.
This Annual Report was first distributed to shareholders on or about July 30, 2015.
450 Laurel Street
Suite 2105
Baton Rouge, Louisiana 70801
866-841-8060
www.goodwood-funds.com
July 1, 2015
Dear Fellow Shareholders of the Goodwood SMID Cap Discovery Fund:
Enclosed for your review is the Annual Report for the Goodwood SMID Cap Discovery Fund (the "Fund"), a series of the Starboard Investment Trust (the "Trust"), formerly known as the Caritas All-Cap Growth Fund, for the fiscal year ending May 31, 2015. The return for the Fund during this period was 1.36%. This compares to 14.95% for the Russell 3000 Growth Index and 11.81% for the S&P 500 Total Return Index.
Average Annual Total Return for period ended June 30, 2015 | One Year | Since Inception* | Gross Expense Ratio*** |
Goodwood SMID Cap Discovery Fund – Class A Shares (without load) | (6.95)% | 9.80% | 3.97% |
Goodwood SMID Cap Discovery Fund – Class A Shares(with load) | (11.14)% | 8.88% | 3.97% |
| Russell 3000 Growth Index**** | 10.69% | 15.26% | n/a |
| S&P 500 Total Return Index**** | 7.42% | 13.91% | n/a |
The performance data quoted above represents past performance, which is not a guarantee of future results. Investment return and principal value of an investment in the Fund will fluctuate so that an investor's shares, when redeemed, may be worth more or less than their original cost. Current performance may be lower or higher than the performance data quoted. To obtain more current performance data regarding the Fund, including performance data current to the Fund's most recent month‐end, please visit ncfunds.com or call the Fund at (800) 773‐3863. Fee waivers and expense reimbursements have positively impacted Fund performance.
*The Fund's inception date is January 4, 2010.
**The Advisor has entered into an Operating Plan with the Administrator, through October 1, 2015, under which it has agreed to (i) make payments to the administrator based upon the Fund's net assets according to a schedule included in the Operating Plan and (ii) assume certain expenses of the Fund outlined in the Operating Plan. These measures are intended to limit the Fund's operating expenses to 1.70% of the average daily net assets, exclusive of taxes, interest, brokerage fees and commissions, distribution and/or service (12b‐1) fees, acquired fund fees and expenses, and extraordinary expenses. The Operating Plan can only be terminated at the conclusion of the then‐current term by notice of non‐renewal to a party or mutual agreement of the parties. The Advisor cannot recoup from the Fund any amounts paid under the Operating Plan.
***Gross expense ratio is from the Fund's prospectus dated September 29, 2014.
****You cannot invest directly in this index. This index does not have an investment advisor and does not pay any commissions, expenses, or taxes. If this index did pay commissions, expenses, or taxes, its returns would be lower.
In August 2013 Caritas Capital resigned as advisor to the Fund and its holdings were liquidated and capital was held in cash until late September 2013. On September 20, 2013 Goodwood Advisors became the consultant to CV Investment Advisors, the interim advisor to the Fund. Subsequently, on October 31, 2103, the board of the Trust approved an Interim Advisory Agreement with Goodwood Advisors, LLC, an investment advisory firm registered with the U.S. Securities and Exchange Commission under the Investment Advisers Act of 1940. The Fund's name was then changed to the Goodwood SMID Cap Discovery Fund in February 2014. The Fund's shareholders formally approved an Investment Advisory Agreement with Goodwood Advisors, LLC at a Special Meeting held on March 31, 2014.
We wanted to take the opportunity to provide some context around the changes in the Caritas All-Cap Growth Fund's (CTSAX) ("The Fund") Net Asset Value ("NAV") per share in the month of December 2013.
At the end of July 2013, the previous Advisor, Caritas Capital, LLC, sold all of the holdings of the Fund. This liquidation was carried out in anticipation of closing the Fund and returning capital to shareholders. As a result of the sale of securities, long term capital gains were realized. Shortly thereafter, the Board elected to seek out a new Advisor in lieu of closing the Fund. On October 31, 2013 the Board approved an Interim Investment Advisory Agreement with Goodwood Advisors, LLC.
Tax law requires mutual funds pay substantially all net investment income and capital gains to their shareholders, who may elect to receive cash or reinvest in additional shares of the Fund. This typically takes place in December of each year.
The following took place in December 2013:
On December 4, 2013 the Fund's NAV was $15.62.
On December 5, 2013 the Fund distributed $12.16746 per share in Long Term Capital Gains.1
On December 5, 2013 the Fund's NAV was $4.05.
On December 6, 2013 the Fund executed a 1:2.469 reverse share split.2
On December 6, 2013 the Fund's NAV was $10.03.
1 Investors who initially elected to reinvest their capital gains distributions received additional shares of the Fund at the $4.05 NAV equal to the dollar amount of their pro rata share of the capital gain distribution. It is important to remember that the distribution is a tax event and an investor's total return is not impacted by the distribution.
2 In a reverse share split, the investors' share count is reduced, and the NAV per share is increased; however, there is zero change in the dollar amount of their investment. The Fund's Trust elected to execute the reverse share split in order to more closely align the Fund's post-distribution NAV per share with the anticipated approval of a new Institutional Share Class of the Fund.
The Fund's primary objective is capital appreciation, but we strive to achieve this in context of risk-adjusted terms. Portfolio construction is a product of our fundamentally driven, research focused investment process. We take a bottom-up approach to investment selection, marked by deep knowledge of company-specific fundamentals and strict valuation analysis, in an effort to avoid undue risk. Generally, we look for securities that trade at a discount to our estimate of intrinsic value, and seek to invest ahead of catalysts that will cause the gap between current value and our estimate of fair value to dissipate. Availability of these compelling situations varies, and as such, we will use cash and ETF's to provide downside protection when our opportunity set wanes.
The Goodwood SMID Cap Discovery Fund portfolio is focused on the portfolio manager's "best ideas" and will range from forty to fifty individual equities, typically ranging in market capitalization from $100 million to $10 billion at cost. We are agnostic to benchmark weighting, instead focusing our efforts on the Consumer, Healthcare, Industrial and Technology sectors. Based on this, over any given time period, we expect our performance to vary, both positively and negatively, compared the Russell 3000 growth index and S&P 500.
Fiscal 2015 was a challenging year for the Goodwood SMID Cap Discovery Fund. While we do not have any direct exposure to the Energy and Production sector, the 50% plus drawdown in Crude Oil from Summer 2014 through March 2015, had a meaningful knock-on effect to our portfolio. One of the largest themes of our portfolio continues to be the "Gulf Coast Industrial Renaissance". By virtue of our geographic location, we believe that we have unique insight into the significant emerging capital investment opportunity that is unfolding in the region. In our opinion, the cycle is being driven by the availability of cheap and abundant domestic natural resources and the relative cost effectiveness of transporting and producing end products based on this comparative advantage. By some estimates, capital investment will range in the $200-300 billion range over the course of the cycle, focused on Greenfield facility build-outs and expansion, as well as access to established transportation infrastructure. Accordingly, we are investing in Industrial, Service and Transportation equities that will benefit from this cycle.
With the quick and sharp drawdown in the price of Crude Oil, our Industrial-exposed portfolio underperformed relevant benchmarks in Fall 2014 and into Calendar 2015. While we took the opportunity to close out our exposure in more marginal positions, we increased our exposure in our highest-conviction core holdings that were trading at multiples not seen since 2009 in some cases. Stabilization in commodity markets, brought on by right-sizing of production capacity, should support continued capital investment and service activity in the sector. We continue to believe in the thesis over the long-term, and expect that it could emerge as one of the most attractive and underappreciated themes in the equity markets.
While the Gulf Coast opportunity represents a sizeable portion of our portfolio, it represents less than 30% of our overall exposure. Outside of Industrials, we are finding compelling opportunities in several others sectors that we have traditionally targeted, including Healthcare, Technology and Consumer, including several other "mini-themes" that have emerged from our research. We continue to expect the domestic recovery to continue, albeit at a slower pace than historical expansionary cycles. Our "mini-themes" are based on expectations for continued recovery of the housing industry and improving consumer balance sheets. With quantitative easing drawing to a close and the expectation of higher interest rates in the United States, coupled with increasingly easy monetary policy in Europe and Emerging Markets, we believe that the U.S. dollar's multi-year bull run may be coming to a close. Accordingly, we are also increasing our exposure to Mid-Capitalization multinationals, which we believe are set to benefit from improving ex-U.S. economic activity markets and a lessened headwind from foreign currency exchange.
With the underperformance of our portfolio and the lackluster relative returns of the Small and Mid capitalization indices in Fiscal 2015, we are more optimistic today about the prospects for the Goodwood SMID Cap Discovery Fund than we have been since taking over management of the Fund in September 2013. Our confidence is rooted in our understanding of the underlying company drivers and our overall favorable view of the domestic economic environment as discussed above. For the most part, the fundamental outlooks for underlying positions are largely unchanged, meaning that multiple contractions have been the primary driver of underperformance. As confidence in the ongoing economic improvement increases, we see a meaningful opportunity for improved fundamentals and an increase in valuations for our portfolio holdings.
Please call or email us at any time to discuss the Goodwood SMID Cap Discovery Fund and our investment approach.
Respectfully,
Ryan D. Thibodeaux
ryan@goodwoodcapitalmgmt.com
Joshua L. Pesses
josh@goodwoodcapitalmgmt.com
Goodwood Advisors, LLC
The views in the foregoing discussion were those of the Fund's investment advisor as of the date set forth above and may not reflect its views on the date this Annual Report is first published or anytime thereafter. These views are intended to assist shareholders in understanding their investment in the Fund and do not constitute investment advice.
| Goodwood SMID Cap Discovery Fund | | | | | | | | | | | | |
| | | | | | | | | | | | | | | | | | | | |
| Performance Update - Class A Shares | | | | | | | | | | | | |
| (Unaudited) | | | | | | | | | | | | | | |
| | | | | | | | | | | | | | | | | | | | |
| For the period from January 4, 2010 (Date of Initial Public Investment) to May 31, 2015 | | |
| | | | | | | | | | | | | | | | | | | | |
| Comparison of the Change in Value of a $10,000 Investment | | | | | | | | |
| | | | | | | | | | | | | | | | | | | | |
| | 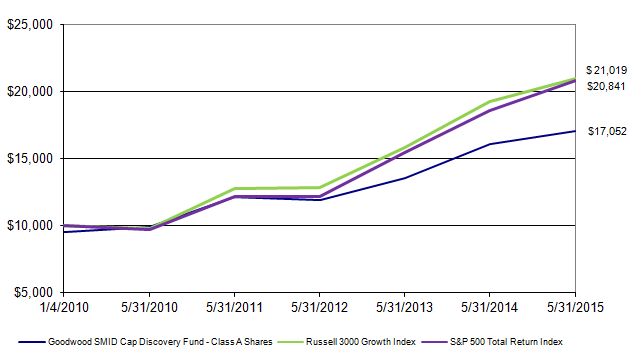 | |
| | | | | | | | | | | | | | | | | | | | |
| This graph assumes an initial investment of $10,000 ($9,550 after maximum sales load of 4.50%) at January 4, 2010 (Date of Initial Public Investment). All dividends and distributions are reinvested. This graph depicts the performance of the Goodwood SMID Cap Discovery Fund - Class A Shares versus the Russell 3000® Growth Index and the S&P 500 Total Return Index. It is important to note that the Fund is a professionally managed mutual fund while the index is not available for investment and is unmanaged. The comparison is shown for illustrative purposes only. |
| | | | | | | | | | | | | | | | | | | | |
| | Average Annual Total Returns | |
| | | | | | | | | | | | | | | | | | Gross | | |
| | | As of | | | | | | | One | | Since | | Inception | | Expense | | |
| | | May 31, 2015 | | | | | | Year | | Inception | | Date | | Ratio* | | |
| | | Goodwood SMID Cap Discovery Fund - No Sales Load | | 1.36% | | 10.38% | | 01/04/10 | | 3.97% | | |
| | | Goodwood SMID Cap Discovery Fund - 4.50% Sales Load | -3.16% | | 9.53% | | 01/04/10 | | 3.97% | | |
| | | S&P 500 Total Return Index | | | | | 11.81% | | 14.55% | | N/A | | N/A | | |
| | | Russell 3000 Growth Index | | | | | 14.95% | | 14.73% | | N/A | | N/A | | |
| | | | | | | | | | | | | | | | | | | | |
| * The gross expense ratio shown is from the Fund's prospectus dated September 29, 2014. | | | | |
| | | | | | | | | | | | | | | | | | | | |
| Performance quoted above represents past performance, which is no guarantee of future results. Investment return and principal value will fluctuate so that shares, when redeemed, may be worth more or less than their original cost. Current performance may be lower or higher than the performance data quoted. An investor may obtain performance data, current to the most recent month-end, by visiting goodwood-funds.com. |
| | | | | | | | | | | | | | | | | | | | |
| The graph and table do not reflect the deduction of taxes that a shareholder would pay on Fund distributions or the redemption of Fund shares. Average annual total returns are historical in nature and measure net investment income and capital gain or loss from portfolio investments assuming reinvestment of distributions. |
| | | | | | | | | | | | | | | | | | | | |
| | | | | | | | | | | | | | | | | | | | |
The Goodwood SMID Cap Discovery Fund ("Fund") is a series of the Starboard Investment Trust ("Trust"). The Trust is organized as a Delaware statutory trust and is registered under the Investment Company Act of 1940, as amended (the "1940 Act"), as an open-end management investment company. The Fund is a separate diversified series of the Trust.
The Fund commenced operations on January 4, 2010. The investment objective of the Fund is to seek capital appreciation. In order to achieve its investment objective, Goodwood Advisors, LLC ("Advisor") will seek to invest primarily in a portfolio of common stocks of companies that the Advisor believes have above-average future growth potential relative to their peers, using risk adjusted metrics as a comparative baseline.
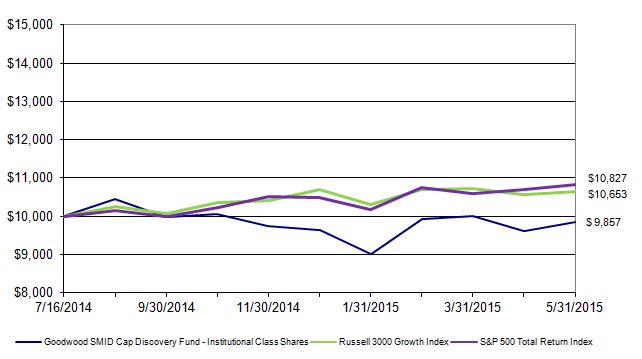
The Fund currently has an unlimited number of authorized shares, which are divided into two classes - Class A Shares and Institutional Class Shares. Each class of shares has equal rights as to assets of the Fund, and the classes are identical except that the Class A Shares are subject to distribution and service fees which are further discussed in Note 3. Income, expenses (other than distribution and service fees), and realized and unrealized gains or losses on investments are allocated to each class of shares based upon its relative net assets. All classes have equal voting privileges, except where otherwise required by law or when the Trustees determine that the matter to be voted on affects only the interests of the shareholders of a particular class. The Date of Initial Public Investment for the Class A Shares was January 4, 2010. The Date of Initial Public Investment for the Institutional Class Shares was July 16, 2014.
The following is a summary of significant accounting policies consistently followed by the Fund. The policies are in conformity with accounting principles generally accepted in the United States of America ("GAAP"). The Fund follows the specialized accounting and reporting requirements under GAAP that are applicable to investment companies.
Investment Valuation
The Fund's investments in securities are carried at fair value. Securities listed on an exchange or quoted on a national market system are valued at the last sales price as of 4:00 p.m. Eastern Time. Securities traded in the NASDAQ over-the-counter market are generally valued at the NASDAQ Official Closing Price. Price information on listed securities is taken from the composite exchange listing for securities traded on multiple exchanges. Other securities traded in the over-the-counter market and listed securities for which no sale was reported on that date are valued at the most recent bid price. Securities and assets for which representative market quotations are not readily available (e.g., if the exchange on which the portfolio security is principally traded closes early or if trading of the particular portfolio security is halted during the day and does not resume prior to the Fund's net asset value calculation) or which cannot be accurately valued using the Fund's normal pricing procedures are valued at fair value as determined in good faith under policies approved by the Trustees. A portfolio security's "fair value" price may differ from the price next available for that portfolio security using the Fund's normal pricing procedures. Instruments with maturities of 60 days or less are valued at amortized cost, which approximates market value.
Fair Value Measurement
Various inputs are used in determining the value of the Fund's investments. These inputs are summarized in the three broad levels listed below:
Level 1: quoted prices in active markets for identical securities
Level 2: other significant observable inputs (including quoted prices for similar securities and identical securities in inactive markets, interest rates, credit risk, etc.)
Level 3: significant unobservable inputs (including the Fund's own assumptions in determining fair value of investments)
The availability of observable inputs can vary from security to security and is affected by a wide variety of factors, including, for example, the type of security, whether the security is new and not yet established in the marketplace, the liquidity of markets, and other characteristics particular to the security. To the extent that valuation is based on models or inputs that are less observable or unobservable in the market, the determination of fair value requires more judgment. Accordingly, the degree of judgment exercised in determining fair value is greatest for instruments categorized in Level 3.
(Continued)
Goodwood SMID Cap Discovery Fund
Notes to Financial Statements
May 31, 2015
The inputs used to measure fair value may fall into different levels of the fair value hierarchy. In such cases, for disclosure purposes, the level in the fair value hierarchy within which the fair value measurement falls in its entirety, is determined based on the lowest level input that is significant to the fair value measurement in its entirety.
The inputs or methodology used for valuing securities are not necessarily an indication of the risk associated with investing in those securities. The following table summarizes the inputs as of May 31, 2015 for the Fund's assets measured at fair value:
| Investments in Securities (a) | | Total | | Level 1 | | Level 2 | | Level 3 |
| Common Stocks* | $ | 13,247,690 | $ | 13,247,690 | $ | - | $ | - |
| Call Options Purchased | | 41,000 | | 41,000 | | - | | - |
| Total | $ | 13,288,690 | $ | 13,288,690 | $ | - | $ | - |
*Refer to Schedule of Investments for breakdown by Industry
(a) The Fund had no significant transfers into or out of Level 1, 2, or 3 during the year ended May 31, 2015. It is the Fund's policy to recognize transfers at the end of the reporting period.
Purchased Options
When the Fund purchases an option, an amount equal to the premium paid by the fund is recorded as an investment and is subsequently adjusted to the current value of the option purchased. If an option expires on the stipulated expiration date or if the Fund enters into a closing sale transaction, a gain or loss is realized. If a call option is exercised, the cost of the security acquired is increased by the premium paid for the call. If a put option is exercised, a gain or loss is realized from the sale of the underlying security, and the proceeds from such sale are decreased by the premium originally paid. Purchased options are non-income producing securities.
Derivative Financial Instruments
The Fund may invest in derivative financial instruments (derivatives) in order to manage risk or gain exposure to various other investments or markets. Derivatives may contain various risks including the potential inability of the counterparty to fulfill their obligations under the terms of the contract, the potential for an illiquid secondary market, and the potential for market movements which may expose the Fund to gains or losses in excess of the amounts shown on the Statement of Assets and Liabilities.
Derivatives are marked to market daily based upon quotations from market makers or the Fund's independent pricing services and the Fund's net benefit or obligation under the contract, as measured by the fair market value of the contract, is included in Investments, at value on the Statement of Assets and Liabilities. Net realized gains and losses and net change in unrealized appreciation and depreciation on these contracts for the year are included in the Realized and Unrealized Loss on Investments on the Statement of Operations.
The derivative instruments outstanding as of May 31, 2015 are disclosed below and the amounts of realized and changes in unrealized gains and losses on derivative instruments during the period as disclosed below serve as indicators of the volume of derivative activity for the Fund.
The following table sets forth the effect of the derivative instruments on the Statement of Assets and Liabilities as of May 31, 2015:
Derivative Type | Location | Value |
| Equity Contracts – purchased options | Assets-Investments, at value | $ 41,000 |
(Continued)
Goodwood SMID Cap Discovery Fund
Notes to Financial Statements
May 31, 2015
The following table sets forth the effect of the derivative instruments on the Statement of Operations for the fiscal year ended May 31, 2015:
| Derivative Type | Location | Gains |
| Equity Contracts – purchased options | Net realized loss from investments | $ | 31,583 |
| | | | |
| Equity Contracts – purchased options | Net change in unrealized appreciation on investments | $ | 7,846 |
| | | | |
Investment Transactions and Investment Income
Investment transactions are accounted for as of the date purchased or sold (trade date). Dividend income is recorded on the ex-dividend date. Certain dividends from foreign securities will be recorded as soon as the Fund is informed of the dividend if such information is obtained subsequent to the ex-dividend date. Interest income is recorded on the accrual basis and includes amortization of discounts and premiums. Gains and losses are determined on the identified cost basis, which is the same basis used for federal income tax purposes.
Expenses
The Fund bears expenses incurred specifically on its behalf as well as a portion of general expenses, which are allocated according to methods reviewed annually by the Trustees.
Distributions
The Fund may declare and distribute dividends from net investment income (if any) quarterly. Distributions from capital gains (if any) are generally declared and distributed annually. Dividends and distributions to shareholders are recorded on ex-date.
Estimates
The preparation of financial statements in conformity with GAAP requires management to make estimates and assumptions that affect the reported amounts of assets and liabilities and disclosure of contingent assets and liabilities at the date of the financial statements and the reported amounts of increases and decreases in the net assets from operations during the reported period. Actual results could differ from those estimates.
Federal Income Taxes
No provision for income taxes is included in the accompanying financial statements, as the Fund intends to distribute to shareholders all taxable investment income and realized gains and otherwise comply with Subchapter M of the Internal Revenue Code applicable to regulated investment companies.
| 2. | Transactions with Related Parties & Service Providers |
Advisor
As full compensation for the investment advisory services provided to the Fund, the Advisor receives a monthly fee based on the Fund's average daily net assets. The Advisor shall receive an investment advisory fee equal to an annualized rate of 1.25% of the average daily net assets of the Fund. In accordance with these terms, the Fund incurred $161,835 in advisory fees for the fiscal year ended May 31, 2015.
The Advisor has entered into an Operating Plan with the Administrator, under which it has agreed to (i) make payments to the administrator based upon the Fund's net assets according to a schedule included in the Operating Plan and (ii) assume certain expenses of the Fund outlined in the Operating Plan through October 1, 2015. These measures are intended to limit the Fund's operating expenses to 1.70% of the average daily net assets, exclusive of brokerage fees and commissions, taxes, borrowing costs (such as interest or dividend expenses on securities sold short), acquired fund fees and expenses, extraordinary expenses and distribution and/or service (12b-1) fees. The Fund's net expense ratio will be higher than 1.70% to the extent the Fund incurs expenses excluded from this arrangement. The Operating Plan can only be terminated prior to the conclusion of the current term with the approval of the Fund's Board of Trustees.
(Continued)
Administrator
The Nottingham Company ("Administrator") assists the Trust in the performance of its administrative responsibilities to the Fund, coordinates and pays for the services of each vendor and the operating expenses to the Fund, and provides the Fund with certain administrative, fund accounting, and compliance services. As part of its services and consolidated fee arrangement, the Administrator receives compensation based on the Fund's average daily net assets. The annual rate is 0.45% if the average daily net assets are under $40 million and gradually decreases to an annual rate of 0.094% once the average daily net assets reach $1.82 billion or more.
The fee paid to the Administrator is calculated by multiplying the average daily net assets of the Fund by the highest applicable annual rate. The Administrator pays all expenses not assumed by the Advisor, including, without limitation: the fees and expenses of its independent accountants, of its legal counsel, and of its Trustees; the costs of printing and mailing to shareholders annual and semi-annual reports, proxy statements, prospectuses, statements of additional information and supplements thereto; the costs of printing registration statements; bank transaction charges and custodian's fees; any proxy solicitors' fees and expenses; ongoing filing fees; any interest; any membership fees of the Investment Company Institute and similar organizations; fidelity bond and Trustees' liability insurance premiums. The Fund incurred $58,260 in administration fees for the fiscal year ended May 31, 2015.
Compliance Services
Cipperman Compliance Services, LLC provides services as the Trust's Chief Compliance Officer. Cipperman Compliance Services, LLC is entitled to receive customary fees from the Administrator for their services pursuant to the Compliance Services agreement with the Fund.
Transfer Agent
Nottingham Shareholder Services, LLC ("Transfer Agent") serves as transfer, dividend paying, and shareholder servicing agent for the Fund. For its services, the Transfer Agent is entitled to receive compensation from the Administrator pursuant to the Administrator's fee arrangements with the Fund.
Distributor
Capital Investment Group, Inc. (the "Distributor") serves as the Fund's principal underwriter and distributor. For its services, the Distributor is entitled to receive compensation from the Administrator pursuant to the Distributor's fee arrangements with the Fund.
Certain Trustees and officers of the Trust are also officers of the Advisor or the Administrator.
| 3. | Distribution and Service Fees |
The Trustees, including a majority of the Trustees who are not "interested persons" of the Trust as defined in the 1940 Act and who have no direct or indirect financial interest in such plan or in any agreement related to such plan, adopted a distribution plan pursuant to Rule 12b-1 of the 1940 Act (the "Plan"). The 1940 Act regulates the manner in which a regulated investment company may assume expenses of distributing and promoting the sales of its shares and servicing of its shareholder accounts. The Plan provides that the Fund may incur certain expenses, which may not exceed 0.25% per annum of the Fund's average daily net assets for each year elapsed subsequent to adoption of the Plan, for payment to the Distributor and others for items such as advertising expenses, selling expenses, commissions, travel or other expenses reasonably intended to result in sales of shares of the Fund or support servicing of shareholder accounts. For the fiscal year ended May 31, 2015, $25,595 in fees were incurred by the Fund.
| 4. | Purchases and Sales of Investment Securities |
The aggregate cost of purchases and proceeds from sales of investment securities (excluding short-term securities) were as follows:
| Fiscal Year Ended | Purchases of Securities | Proceeds from Sales of Securities |
| May 31, 2015 | $46,607,206 | $40,567,610 |
(Continued)
Goodwood SMID Cap Discovery Fund
Notes to Financial Statements
May 31, 2015
There were no long-term purchases or sales of U.S Government Obligations during the fiscal year ended May 31, 2015.
Distributions are determined in accordance with Federal income tax regulations, which differ from GAAP, and, therefore, may differ significantly in amount or character from net investment income and realized gains for financial reporting purposes. Financial reporting records are adjusted for permanent book/tax differences to reflect tax character but are not adjusted for temporary differences.
Management reviewed the Fund's tax positions on federal income tax returns for the open tax years of 2012, 2013, and 2014, and determined that the Fund does not have a liability for uncertain tax positions. The Fund recognizes interest and penalties, if any, related to unrecognized tax benefits as income tax expense in the Statement of Operations. During the fiscal year ended May 31, 2015, the Fund did not incur any interest or penalties.
Reclassifications to the capital accounts relate primarily to differing book/tax treatment of ordinary net investment losses. For the fiscal year ended May 31, 2015, the following reclassifications were made:
| Accumulated Net Investment Loss | $ 87,140 |
| Accumulated Net Realized Loss on Investments | (67,727) |
| Paid in Interest | | (19,413) |
Distributions during the fiscal years ended were characterized for tax purposes as follows:
| | Distributions from |
For the Fiscal Years Ended | | Ordinary Income | Long-Term- Capital Gains |
| 05/31/2015 | | $ 208,703 | $ - |
| 05/31/2014 | | $ 1,383 | $ 670,799 |
The difference between components of distributable earnings on a tax basis and the amounts reflected in the Statement of Assets and Liabilities are primarily due to late year loss deferrals and wash sale losses. The Fund elects to defer to its fiscal year ending May 31, 2016, $74,205 of Ordinary Loss recognized during the period from January 1, 2015 to May 31, 2015.
At May 31, 2015, the tax-basis cost of investments and components of distributable earnings were as follows:
| Cost of Investments | $ | 13,394,092 |
| | | |
| Unrealized Appreciation | $ | 636,282 |
| Unrealized Depreciation | | (741,684) |
| Net Unrealized Depreciation | | (105,402) |
| Accumulated Net Realized Gain on Investments | | 41,749 |
| Other Book/Tax Differences | | (74,205) |
| | | |
| Distributable Earnings | $ | (137,858) |
| | | | | | |
6. Commitments and Contingencies
Under the Trust's organizational documents, its officers and Trustees are indemnified against certain liabilities arising out of the performance of their duties to the Fund. In addition, in the normal course of business, the Trust entered into contracts with its service providers, on behalf of the Fund, and others that provide for general indemnifications. The Fund's maximum exposure under these arrangements is unknown, as this would involve future claims that may be made against the Fund. The Fund expects risk of loss to be remote.
(Continued)
Goodwood SMID Cap Discovery Fund
Notes to Financial Statements
May 31, 2015
7. Subsequent Events
The Fund has evaluated the need for disclosures and/or adjustments resulting from subsequent events through the date of issuance of these financial statements. This evaluation did not result in any additional subsequent events that necessitated disclosures and/or adjustments in addition to the disclosure above.
REPORT OF INDEPENDENT REGISTERED PUBLIC ACCOUNTING FIRM
To the Board of Trustees of Starboard Investment Trust
and the Shareholders of Goodwood SMID Cap Discovery Fund
We have audited the accompanying statement of assets and liabilities of the Goodwood SMID Cap Discovery Fund (the "Fund"), a series of shares of beneficial interest in the Starboard Investment Trust, including the schedule of investments, as of May 31, 2015, and the related statement of operations for the year then ended, the statements of changes in net assets for each of the years in the two-year period then ended and the financial highlights for each of the years or period in the three-year period then ended. These financial statements and financial highlights are the responsibility of the Fund's management. Our responsibility is to express an opinion on these financial statements and financial highlights based on our audits. The financial highlights for each of the years in the two-year period ended May 31, 2012 have been audited by other auditors, whose report dated July 26, 2012, expressed an unqualified opinion on such financial highlights.
We conducted our audits in accordance with the standards of the Public Company Accounting Oversight Board (United States). Those standards require that we plan and perform the audits to obtain reasonable assurance about whether the financial statements and financial highlights are free of material misstatement. An audit includes examining, on a test basis, evidence supporting the amounts and disclosures in the financial statements. Our procedures included confirmation of securities owned as of May 31, 2015 by correspondence with the custodian and brokers. An audit also includes assessing the accounting principles used and significant estimates made by management, as well as evaluating the overall financial statement presentation. We believe that our audits provide a reasonable basis for our opinion.
In our opinion, the financial statements and financial highlights referred to above present fairly, in all material respects, the financial position of the GoodWood SMID Cap Discovery Fund as of May 31, 2015, and the results of its operations for the year then ended, the changes in its net assets for each of the years in the two-year period then ended and its financial highlights for each of the years or period in the three-year period then ended, in conformity with accounting principles generally accepted in the United States of America.
BBD, LLP
Philadelphia, Pennsylvania
July 28, 2015
| 1. | Proxy Voting Policies and Voting Record |
A copy of the Trust's Proxy Voting and Disclosure Policy and the Advisor's Disclosure Policy are included as Appendix B to the Fund's Statement of Additional Information and are available, without charge, upon request, by calling 800-773-3863, and on the website of the Security and Exchange Commission ("SEC") at sec.gov. Information regarding how the Fund voted proxies relating to portfolio securities during the most recent period ended June 30, is available (1) without charge, upon request, by calling the Fund at the number above and (2) on the SEC's website at sec.gov.
| 2. | Quarterly Portfolio Holdings |
The Fund files its complete schedule of portfolio holdings with the SEC for the first and third quarters of each fiscal year on Form N-Q. The Fund's Forms N-Q are available on the SEC's website at sec.gov. You may review and make copies at the SEC's Public Reference Room in Washington, D.C. Information on the operation of the Public Reference Room may be obtained by calling the SEC at 800-SEC-0330. You may also obtain copies without charge, upon request, by calling the Fund at 800-773-3863.
We are required to advise you within 60 days of the Fund's fiscal year-end regarding the federal tax status of certain distributions received by shareholders during each fiscal year. The following information is provided for the Fund's fiscal year ended May 31, 2015.
During the fiscal year, the fund paid no long-term capital gain distributions.
Dividend and distributions received by retirement plans such as IRAs, Keogh-type plans and 403(b) plans need not be reported as taxable income. However, many retirement plans may need this information for their annual information meeting.
| 4. | Schedule of Shareholder Expenses |
As a shareholder of the Fund, you incur two types of costs: (1) transaction costs, which may include sales charges (loads) on purchase payments and (2) ongoing costs, including investment advisory fees; distribution (12b-1) fees; and other Fund expenses. This example is intended to help you understand your ongoing costs (in dollars) of investing in the Fund and to compare these costs with the ongoing costs of investing in other mutual funds. The example is based on an investment of $1,000 invested at the beginning of the period and held for the entire period as indicated below.
Actual Expenses – The first line of the table below provides information about the actual account values and actual expenses. You may use the information in this line, together with the amount you invested, to estimate the expenses that you paid over the period. Simply divide your account value by $1,000 (for example, an $8,600 account value divided by $1,000 = 8.6), then multiply the result by the number in the first line under the heading entitled "Expenses Paid During Period" to estimate the expenses you paid on your account during this period.
Hypothetical Example for Comparison Purposes – The last line of the table below provides information about hypothetical account values and hypothetical expenses based on the Fund's actual expense ratio and an assumed annual rate of return of 5% before expenses, which is not the Fund's actual return. The hypothetical account values and expenses may not be used to estimate the actual ending account balance or expenses you paid for the period. You may use this information to compare the ongoing costs of investing in the Fund and other funds by comparing this 5% hypothetical example with the 5% hypothetical examples that appear in the shareholder reports of other funds.
(Continued)
Goodwood SMID Cap Discovery Fund
Additional Information
(Unaudited)
| Class A Shares | Beginning Account Value December 1, 2014 | Ending Account Value May 31, 2015 | Expenses Paid During Period* |
Actual Hypothetical (5% annual return before expenses) | | | |
| $1,000.00 | $1,011.57 | $9.80 |
| $1,000.00 | $1,015.19 | $9.82 |
*Expenses are equal to the average account value over the period multiplied by the Fund's annualized expense ratio, multiplied by the number of days in the most recent period divided by the number of days in the fiscal year (to reflect the six month period).
| Institutional Class Shares | Beginning Account Value December 1, 2014 | Ending Account Value May 31, 2015 | Expenses Paid During Period* |
Actual Hypothetical (5% annual return before expenses) | | | |
| $1,000.00 | $1,011.99 | $8.53 |
| $1,000.00 | $1,016.45 | $8.55 |
*Expenses are equal to the average account value over the period multiplied by the Fund's annualized expense ratio, multiplied by the number of days in the most recent period divided by the number of days in the fiscal year (to reflect the six month period).
| 5. | Information about Trustees and Officers |
The business and affairs of the Fund and the Trust are managed under the direction of the Board of Trustees of the Trust. Information concerning the Trustees and officers of the Trust and Fund is set forth below. Generally, each Trustee and officer serves an indefinite term or until certain circumstances such as their resignation, death, or otherwise as specified in the Trust's organizational documents. Any Trustee may be removed at a meeting of shareholders by a vote meeting the requirements of the Trust's organizational documents. The Statement of Additional Information of the Fund includes additional information about the Trustees and officers and is available, without charge, upon request by calling the Fund toll-free at 800-773-3863. The address of each Trustee and officer, unless otherwise indicated below, is 116 South Franklin Street, Rocky Mount, North Carolina 27804. The Independent Trustees each received aggregate compensation of $2,000 during the fiscal year ended May 31, 2015 for their services to the Fund and Trust.
Name, Age
and Address | Position
held with
Fund or Trust | Length of Time Served | Principal Occupation
During Past 5 Years | Number of Portfolios in Fund Complex Overseen by Trustee | Other Directorships
Held by Trustee
During Past 5 Years |
| Independent Trustees |
Michael G. Mosley
Age: 62 | Independent Trustee | Since 7/10 | Owner of Commercial Realty Services (real estate) since 2004. | 28 | None. |
Theo H. Pitt, Jr.
Age: 79 | Independent Trustee | Since 9/10 | Senior Partner, Community Financial Institutions Consulting (financial consulting) since 1999; Partner, Pikar Properties (real estate) since 2001. | 28 | Independent Trustee of World Funds Trust for its twelve series, Gardner Lewis Investment Trust for its two series, Vertical Capital Investors Trust for its two series and Hillman Capital Management Investment Trust for its one series (all registered investment companies). |
(Continued)
Goodwood SMID Cap Discovery Fund
Additional Information
(Unaudited)
Name, Age
and Address | Position
held with
Fund or Trust | Length of Time Served | Principal Occupation
During Past 5 Years | Number of Portfolios in Fund Complex Overseen by Trustee | Other Directorships
Held by Trustee
During Past 5 Years |
James H. Speed, Jr.
Age: 61 | Independent Trustee, Chairman | Trustee since 7/09, Chair since 5/12 | President and CEO of NC Mutual Insurance Company (insurance company) since 2003. | 28 | Independent Trustee of the Brown Capital Management Mutual Funds for its three series, Hillman Capital Management Investment Trust for its one series, and Centaur Mutual Funds Trust for its one series (all registered investment companies). Member of Board of Directors of NC Mutual Life Insurance Company. Member of Board of Directors of M&F Bancorp. Previously, Independent Trustee of Nottingham Investment Trust II for its four series from 2000 until 2010 and New Providence Investment Trust for its one series from 2009 until 2011 (registered investment company). |
J. Buckley Strandberg
Age: 55 | Independent Trustee | Since 7/09 | President of Standard Insurance and Realty (insurance and property management) since 1982. | 28 | None. |
| Other Officers |
Ryan D. Thibodeaux Age: 36 | President and Treasurer (Goodwood SMID Cap Discovery Fund) | Since 10/13 | President and Managing Member of Goodwood Capital Management, LLC | n/a | n/a |
Katherine M. Honey
Age: 41 | President and Principal Executive Officer | Since 05/15 | EVP of The Nottingham Company since 2008. | n/a | n/a |
Matthew J. Beck
Age: 26 | Secretary | Since 05/15 | Legal Counsel at The Nottingham Company since 2014. | n/a | n/a |
Ashley E. Harris
Age: 31 | Treasurer, Assistant Secretary, and Principal Financial Officer | Since 05/15 | Fund Accounting Manager and Financial Reporting, The Nottingham Company since 2008. | n/a | n/a |
John Canning
Age: 43 | Chief Compliance Officer | Since 8/14 | Managing Director, Cipperman Compliance Services, LLC (2011-present). Formerly, Director of Mutual Fund Administration of Nationwide Fund Group (2008-2011). | n/a | n/a |