This report and the financial statements contained herein are submitted for the general information of the shareholders of the Matisse Discounted Closed-End Fund Strategy (the “Fund”). The Fund’s shares are not deposits or obligations of, or guaranteed by, any depository institution. The Fund’s shares are not insured by the FDIC, Federal Reserve Board or any other agency, and are subject to investment risks, including possible loss of principal amount invested. Neither the Fund nor the Fund’s distributor is a bank.
The Matisse Discounted Closed-End Fund Strategy is distributed by Capital Investment Group, Inc., Member FINRA/SIPC, 100 E. Six Forks Road, Suite 200, Raleigh, NC, 27609. There is no affiliation between the Matisse Discounted Closed-End Fund Strategy, including its principals, and Capital Investment Group, Inc.
(Unaudited)
Dear MDCEX Shareholder:
Enclosed please find the Annual Report for the Matisse Discounted Closed‐End Fund Strategy (“MDCEX” or the “Fund”) for the year ending March 31, 2023. The Fund launched on October 31, 2012.
Despite the stock market’s recovery here in 2023, Closed‐End Fund discounts are the widest they’ve been since 2020. Inflation seems to be cooling somewhat, but investors are still worried about the economy, bank stability, and geopolitical tensions. The average discount in the CEF universe is wider than 8%, and we’re seeing excellent opportunities in many sectors.
Despite over 3 percentage points of CEF universe discount widening, the Fund outperformed most of its benchmarks (other than the MSCI EAFE) over the past 12 months. The general market decline, however, led to a loss in absolute terms. Here are some of the factors that contributed to our results. From 4/1/22 to 3/31/23:
1. Closed‐end Fund discounts widened in nearly all sectors, by 338 bps on average, a headwind to our returns. Our trading and fund selection (which has led our discount‐movement‐attributed performance to exceed the closed‐end fund universe’s in 76% of rolling quarters since we launched the Fund) helped to offset part of this negative impact, but discount movement/capture within the Fund still detracted 166 bps from our total return.
2. Offsetting the discount‐related headwind, our exposures to Foreign and Value were beneficial, as the Russell 1000 Value beat the Russell 1000 Growth by about 5 percentage points, and the MSCI EAFE index beat the S&P 500 by about 5 percentage points for the period 4/1/22 - 3/31/23 (see table below). Ballpark, our overweight to these areas was worth approximately 2 percentage points of relative performance.
3. Our exposure to the Energy sector, just as in our last fiscal year, was a major positive factor. Even though oil prices pulled back 25% during the period, large‐cap energy names rose 13% and MLPs gained 9% from 4/1/22‐3/31/23. Even with continued gains in MLP prices, discounts on our MLP CEFs remained extremely attractive at around an 18% discount. Our energy and commodity holdings as a group contributed approximately 2 percentage points to our return for the 12 months.
Over the longer term, the Fund has outperformed its benchmarks (other than the S&P 500) on the strength of our disciplined approach which aims to capture alpha from beneficial discount movement.
Average Annual Total Returns
Period ended March 31, 2023 | One Year | Five Year Annualized | Ten Year Annualized | Annualized Since Inception 10/31/2012 |
MDCEX
| ‐3.66% | +5.62% | +6.38% | +6.73% |
S&P 500 Index
| ‐7.73% | +11.19% | +12.24% | +12.97% |
S‐Network Composite Closed‐ End Fund Total Return Index
| ‐10.16% | +3.29% | +4.61% | +5.01% |
S&P Target Risk Moderate Index
| ‐5.06% | +3.55% | +4.42% | +4.76% |
MSCI EAFE Total
Return Index
| ‐2.37% | +3.57% | +5.00% | +5.86% |
Bloomberg US Aggregate Bond Total Return Index
| ‐4.72% | +0.91% | +1.36% | +1.30% |
The performance information quoted represents past performance, which is not a guarantee of future results. Investment return and principal value of an investment will fluctuate so that an investor’s shares, when redeemed, may be worth more or less than their original cost. Current performance may be lower or higher than the performance data quoted. An investor may obtain performance data current to the most recent month‐end by calling 1‐800‐773‐3863. Total return measures net investment income and capital gain or loss from portfolio investments. All performance shown assumes reinvestment of dividends and capital gains distributions.
The Total Annual Fund Operating Expense for the Fund as disclosed in the prospectus dated August 1, 2022 is 2.48%. The Total Annual Fund Operating Expense is required to include expenses incurred indirectly by the Fund through its investments in closed‐end funds and other investment companies. The Advisor has entered into an expense limitation agreement with the Fund under which it has agreed to waive or reduce its fees and to assume other expenses of the Fund, if necessary, in an amount that limits the Fund’s annual operating expenses (exclusive of (i) any 12b‐1 fees; (ii) any front‐end or contingent deferred loads; (iii) brokerage fees and commissions, (iv) acquired fund fees and expenses; (v) fees and expenses associated with investments in other collective investment vehicles or derivative instruments (including, for example, option and swap fees and expenses); (vi) borrowing costs (such as interest and dividend expense on securities sold short); (vii) taxes; and (viii) extraordinary expenses, such as litigation expenses (which may include indemnification of Fund officers and Trustees and contractual indemnification of Fund service providers (other than the Advisor)) to not more than 1.25% of the average daily net assets of the Fund. The Expense Limitation Agreement runs through July 31, 2023 and may be terminated by the Board of Trustees of the Fund at any time. “Acquired Fund Fees and Expenses” include expenses incurred indirectly by the Fund through its investments in closed‐end funds and other investment companies, do not affect a Fund’s actual operating costs, and therefore are not included in the Fund’s financial statements, which provide a clearer picture of a Fund’s actual operating costs. The Advisor cannot recoup from the fund any amounts paid to the Advisor under the expense limitation agreement. However, net annual operating expenses for the Fund may exceed those contemplated by the waiver due to expenses that are not waived under the Expense Limitation Agreement.
Management Outlook
We are very optimistic about the current portfolio of MDCEX. As of 3/31/23 month‐end, the weighted average discount to NAV of our underlying CEF holdings stood at 27.7%, compared to an average 17.1% discount since the inception of MDCEX.
Given the widespread discount opportunities, we have modest leverage at the Fund level. As of 3/31/23, we have a highly diversified underlying portfolio with 36 holdings. Our exposure to energy remains our largest weighting at 24% of the overall portfolio. Technology, Consumer Cyclical, and Financial Services are our next largest equity sectors, each at 10‐12% of our portfolio. Overall, our equity exposure is at 96%, with about 30% of that foreign.
Current Market Environment
The stock market, the bond market, and the CEF market have all been grappling with uncertainty recently, as inflation, the economy, the financial sector, and the Fed create crosscurrents. The CEF market tends to respond to this kind of environment with large discounts, and this year has been no exception. At quarter end, discounts on all closed‐end funds had widened to 8.1% on average, 1.2 standard deviations wider than the normal level closer to 5% (average since 2006). International Equity CEFs (13% discount = 1.6 standard deviations) and Municipal Bond CEFs (9% discount = 1.7 standard deviations) are the standouts in terms of cheapness.
As is normally the case, over the past twelve months, even though most closed‐end funds suffered from discount widening, highly discounted closed‐end funds (those starting the period in the bottom quintile of discounts) suffered less. Discounts on these CEFs widened by 161 bps on average, while discounts on all other closed‐end funds widened by 397 basis points on average. A core piece of our investment thesis is the outperformance that often goes along with more discount narrowing (or less discount widening).
In a universe full of bargains, some sectors stand out to us as even better bargains. As of 3/31/23 for example, the average discount on all MLP closed‐end funds was approximately 15.2%, about 12 percentage points wider than the average discount since 2006 on these funds. In our opinion, MLP closed‐end funds remain the most attractive closed‐end fund sector as a group, and they feature prominently in our portfolio.
We appreciate your interest in, and investment in, the Fund. We’ll continue to keep you updated on the important developments we see in the misunderstood, retail‐dominated world of closed‐end funds. Check out https://www.matissecap.com/funds/ for updates, and feel free to contact us at 503‐210‐3005 to discuss the Matisse Discounted Closed‐End Fund Strategy (MDCEX) and our investment approach.
Sign Up for Matisse Funds Emails
To receive future communications on our funds (including performance updates and market commentary) make sure to sign up for our email list here.
Sincerely,
Eric Boughton, CFA Bryn Torkelson
Portfolio Manager Founder & CIO
Matisse Funds Matisse Funds
(RCMAT0423008)
Matisse Discounted Closed-End Fund Strategy
Notes to Financial Statements
As of March 31, 2023
1. Organization and Significant Accounting Policies
The Matisse Discounted Closed-End Fund Strategy (“Fund”) is a series of the Starboard Investment Trust (“Trust”). The Trust is organized as a Delaware statutory trust and is registered under the Investment Company Act of 1940, as amended (the “1940 Act”), as an open-end management investment company. The Fund is a separate diversified series of the Trust.
The Fund’s investment advisor, Deschutes Portfolio Strategies, LLC, dba Matisse Capital, (the “Advisor”), seeks to achieve the Fund’s investment objective of long-term capital appreciation and income by investing in unaffiliated closed-end funds that pay regular periodic cash distributions, the interests of which typically trade at substantial discounts relative to their underlying net asset values. The Fund will invest, under normal circumstances, at least 80% of net assets, plus borrowings, for investment purposes, in discounted closed-end funds.
The following is a summary of significant accounting policies consistently followed by the Fund. The policies are in conformity with accounting principles generally accepted in the United States of America (“GAAP”). The Fund follows the accounting and reporting guidance in the Financial Accounting Standards Board (“FASB”) Accounting Standards Codification 946 “Financial Services – Investment Companies,” and Financial Accounting Standards Update (“ASU”) 2013-08.
Investment Valuation
The Fund’s investments in securities are carried at fair value. Securities listed on an exchange or quoted on a national market system are valued at the last sales price as of 4:00 p.m. Eastern Time. Securities traded in the NASDAQ over-the-counter market are generally valued at the NASDAQ Official Closing Price. Other securities traded in the over-the-counter market and listed securities for which no sale was reported on that date are valued at the mean of the most recent bid and ask prices. Instruments with maturities of 60 days or less are valued at amortized cost, which approximates market value. Investments in open-end investment companies are valued at their respective net asset values as reported by such investment companies. Securities and assets for which representative market quotations are not readily available (e.g., if the exchange on which the security is principally traded closes early or if trading of the particular security is halted during the day and does not resume prior to the Fund’s net asset value calculation) or which cannot be accurately valued using the Fund’s normal pricing procedures are valued at fair value as determined in good faith under policies approved by the Trustees. A security’s “fair value” price may differ from the price next available for that security using the Fund’s normal pricing procedures. The shares of many closed-end investment companies, after their initial public offering, frequently trade at a price per share, which is different than the net asset value per share. The difference represents a market premium or market discount of such shares. There can be no assurances that the market discount or market premium on shares of any closed-end investment company purchased by the Funds will not change.
Fair Value Measurement
Various inputs are used in determining the value of the Fund's investments. These inputs are summarized in the three broad levels listed below:
Level 1: Unadjusted quoted prices in active markets for identical securities
Level 2: Other significant observable inputs (including quoted prices for similar securities, interest rates, credit risk, etc.)
Level 3: Significant unobservable inputs (including the Fund’s own assumptions in determining fair value of investments)
The availability of observable inputs can vary from security to security and is affected by a wide variety of factors, including, for example, the type of security, whether the security is new and not yet established in the marketplace, the liquidity of markets, and other characteristics particular to the security. To the extent that valuation is based on models or inputs that are less observable or unobservable in the market, the determination of fair value requires more judgment. Accordingly, the degree of judgment exercised in determining fair value is greatest for instruments categorized in Level 3.
The inputs used to measure fair value may fall into different levels of the fair value hierarchy. In such cases, for disclosure purposes, the level in the fair value hierarchy within which the fair value measurement falls in its entirety, is determined based on the lowest level input that is significant to the fair value measurement in its entirety.
(Continued)
Matisse Discounted Closed-End Fund Strategy
Notes to Financial Statements
As of March 31, 2023
The inputs or methodology used for valuing securities are not necessarily an indication of the risk associated with investing in those securities. The following table summarizes the inputs as of March 31, 2023 for the Fund’s investments measured at fair value:
| | | |
| Investments in Securities (a) | | Total | | Level 1 | | Level 2 | | Level 3 |
| Closed-End Funds | $ | 43,844,642 | $ | 43,844,642 | $ | - | $ | - |
| Short-Term Investment | | 32,708 | | 32,708 | | - | | - |
| Total Assets | $ | 43,877,350 | $ | 43,877,350 | $ | - | $ | - |
| | | | | | | | | |
| (a) | The Fund had no Level 3 securities as of the fiscal year ended March 31, 2023. |
Investment Transactions and Investment Income
Investment transactions are accounted for as of the date purchased or sold (trade date). Dividend income is recorded on the ex-dividend date. Certain dividends from foreign securities will be recorded as soon as the Fund is informed of the dividend if such information is obtained subsequent to the ex-dividend date. Gains and losses are determined on the identified cost basis, which is the same basis used for federal income tax purposes. The character of distributions received from certain investments may be comprised of investment income, capital gains, and return of capital. It is the Fund’s policy to estimate the character of distributions received from these investments based on the historical data if the actual amounts are not available. After each calendar year end, these investments report the tax character of these distributions. Differences between the estimated and actual amounts are reflected in the Fund’s records in the year in which they are reported, by adjusting the related cost basis of investments, capital gains, and income as necessary.
Distributions
The Fund may declare and distribute dividends from net investment income, if any, quarterly. Distributions from capital gains, if any, are generally declared and distributed annually. Dividends and distributions to shareholders are recorded on ex-date.
Expenses
The Fund bears expenses incurred specifically on its behalf as well as a portion of general expenses, which are allocated according to methods reviewed annually by the Trustees.
Because the underlying funds have varied expense and fee levels and the Fund may own different proportions of underlying funds at different times, the amount of fees and expense incurred indirectly by the Fund will vary.
Estimates
The preparation of financial statements in conformity with GAAP requires management to make estimates and assumptions that affect the reported amounts of assets and liabilities and disclosure of contingent assets and liabilities at the date of the financial statements and the reported amounts of increases and decreases in the net assets from operations during the reporting period. Actual results could differ from those estimates.
Federal Income Taxes
No provision for income taxes is included in the accompanying financial statements, as the Fund intends to distribute to shareholders all taxable investment income and realized gains and otherwise comply with Subchapter M of the Internal Revenue Code applicable to regulated investment companies.
2. Transactions with Related Parties and Service Providers
Advisor
The Fund pays a monthly fee to the Advisor calculated at the annual rate of 0.99% of the Fund’s average daily net assets. For the fiscal year ended March 31, 2023, $383,417 in advisory fees were incurred, $134,954 of which were waived by the Advisor.
The Advisor has entered into a contractual agreement (the “Expense Limitation Agreement”) with the Trust, on behalf of the Fund, under which it has agreed to waive or reduce its fees and to assume other expenses of the Fund, if necessary, in amounts that limit the Fund’s total operating expenses (exclusive of (i) any front-end or contingent deferred loads; (ii) brokerage fees and commissions; (iii) acquired fund fees and expenses; (iv) fees and expenses associated with investments in other collective investment vehicles or derivative instruments (including, for example, option and swap fees and expenses); (v) borrowing costs (such as interest and dividend expense on securities sold short); (vi) taxes and (vii) extraordinary expenses, such as litigation expenses (which may include indemnification of Fund officers and Trustees and contractual indemnification of Fund service providers (other than the Advisor)) to not more than 1.25% of the average daily net assets of the Fund. The current term of the Expense Limitation Agreement remains in effect until July 31, 2023. While there can be no assurance that the Expense Limitation Agreement will continue after that date, it is expected to continue from year-to-year thereafter. The Advisor cannot recoup from the Fund any expenses paid by the Advisor under the Expense Limitation Agreement.
Matisse Discounted Closed-End Fund Strategy
Notes to Financial Statements
As of March 31, 2023
Administrator
The Fund pays a monthly fee to the Fund’s administrator, The Nottingham Company (“the Administrator”), based upon the average daily net assets of the Fund and calculated at the annual rates as shown in the schedule below which is subject to a minimum of $2,000 per month. The Administrator also receives a fee to procure and pay the Fund’s custodian, additional compensation for fund accounting and recordkeeping services, and additional compensation for certain costs involved with the daily valuation of securities and as reimbursement for out-of-pocket expenses. The Administrator receives a portfolio compliance services fee for oversight of post-trade portfolio compliance totaling $625 per month. The Administrator also receives a miscellaneous compensation fee for peer group, comparative analysis, and compliance support totaling $350 per month. As of March 31, 2023, the Administrator received $4,195 in miscellaneous expenses.
A breakdown of these fees is provided in the following table:
| Administration Fees* |
Custody Fees* | (Average monthly) | Fund Accounting Fees (asset-based fee) | Blue Sky Administration Fees (annual) |
|
Average
Net Assets | Annual Rate | Average Net Assets | Annual Rate | Net Assets | Annual Rate | Per state |
| First $100 million | 0.100% | First $200 million | 0.020% | $2,250 | First $50 million | 0.02% | $150 |
| Next $100 million | 0.090% | Over $200 million | 0.009% | $500/ additionalclass | Next $50 million | 0.015% | |
| Next $100 million | 0.080% | | | | Over $100 million | 0.01% | |
| Next $100 million | 0.070% | | *Minimum monthly fees of $2,000 and $417 for Administration and Custody, respectively. |
| Next $100 million | 0.060% | |
| Over $500 million | 0.050% | |
| Over $750 million | 0.040% | | |
| Over $1 billion | 0.030% | | |
The Fund incurred $43,692 in administration fees, $17,518 in custody fees, and $34,735 in fund accounting fees for the fiscal year ended March 31, 2023.
Compliance Services
The Nottingham Company, Inc. serves as the Trust’s compliance services provider including services as the Trust’s Chief Compliance Officer. The Nottingham Company, Inc. is entitled to receive customary fees from the Fund for its services pursuant to the Compliance Services Agreement with the Fund. The Fund incurred $19,205 in compliance fees for the fiscal year ended March 31, 2023.
Transfer Agent
Nottingham Shareholder Services, LLC (“Transfer Agent”) serves as transfer, dividend paying, and shareholder servicing agent for the Fund. For its services, the Transfer Agent is entitled to receive customary fees from the Fund pursuant to the Transfer Agent’s fee arrangements with the Fund. The Fund incurred $21,088 in transfer agent fees for the fiscal year ended March 31, 2023.
Matisse Discounted Closed-End Fund Strategy
Notes to Financial Statements
As of March 31, 2023
Distributor
Capital Investment Group, Inc. (the “Distributor”) serves as the Fund’s principal underwriter and distributor. For its services, the Distributor receives $6,500 per year paid in monthly installments. This expense is included in the shareholder fulfillment expenses on the Statement of Operations.
3. Trustees and Officers
The Trust is governed by the Board of Trustees, which is responsible for the management and supervision of the Fund. The Trustees meet periodically throughout the year to review contractual agreements with companies that furnish services to the Fund; review performance of the Advisor and the Fund; and oversee activities of the Fund. Officers of the Trust and Trustees who are interested persons of the Trust or the Advisor will receive no salary or fees from the Trust. Each Trustee who is not an “interested person” of the Trust or the Advisor within the meaning of the Investment Company Act of 1940, as amended (the “Independent Trustee”) receives $2,000 per series per year, $200 per meeting attended, and $500 per series per special meeting related to contract renewal issues. The Trust reimburses each Trustee and officer of the Trust for his or her travel and other expenses related to attendance of Board meetings. Additional fees were incurred during the year as special meetings were necessary in addition to the regularly scheduled meetings of the Board of Trustees. Certain officers of the Trust may also be officers of the Administrator.
4. Purchases and Sales of Investment Securities
For the fiscal year ended March 31, 2023, the aggregate cost of purchases and proceeds from sales of investment securities (excluding short-term securities) were as follows:
| Purchases of Securities | Proceeds from Sales of Securities |
| $16,668,644 | $12,013,172 |
5. Federal Income Tax
Distributions are determined in accordance with Federal income tax regulations, which may differ from GAAP, and, therefore, may differ significantly in amount or character from net investment income and realized gains for financial reporting purposes. The general ledger is adjusted for permanent book/tax differences to reflect tax character but is not adjusted for temporary differences.
Management has reviewed the Fund’s tax positions to be taken on the federal income tax returns during the open years ended March 31, 2020 through March 31, 2023 and determined that the Fund does not have a liability for uncertain tax positions. The Fund recognizes interest and penalties, if any, related to unrecognized tax benefits as income tax expense in the Statement of Operations. During the fiscal year, the Fund did not incur any interest or penalties.
Distributions during the years ended were characterized for tax purposes as follows:
| | March 31, 2023
| March 31, 2022 |
Ordinary Income
| $
| 1,208,348
| $
| 29,772,933
|
Tax-Exempt Income
| | -
|
| -
|
Return of Capital
|
| 2,052,043
|
| -
|
Long-Term Capital Gain
|
| -
|
| 72,112,451
|
Total Distribution
| $
| 3,260,391
| $
| 116,328,624
|
The following reclassification relates primarily to differing book/tax treatment of prior year equalization and has no impact on the net assets of the Fund:
Accumulated Losses
| $(5,377,612)
|
Paid in Capital
| 5,377,612
|
Matisse Discounted Closed-End Fund Strategy
Notes to Financial Statements
As of March 31, 2023
At March 31, 2023, the tax-basis cost of investments and components of distributable earnings were as follows:
| Cost of Investments | $ | 45,967,159 |
| | | |
| Unrealized Appreciation | | 3,190,815 |
| Unrealized Depreciation | | (5,280,624) |
| Net Unrealized Depreciation | $ | (2,089,809) |
| | | |
| Capital Loss Carryforward | | (243,413) |
| Accumulated Losses | $ | (2,333,222) |
| | | |
The differences between look-basis and tax-basis unrealized appreciation and depreciation are primarily attributable to the passive foreign investment companies and tax deferral of losses on wash sales.
Capital Loss Carryforwards
Accumulated capital losses noted above represent net capital loss carryovers as of March 31, 2023 that are available to offset future realized capital gains, if any, and thereby reduce future taxable gain distributions. Fund has a capital loss carryforward of $243,413, of which $104,571 is short-term in nature and $138,842 is long-term in nature. The capital loss carryforwards have no expiration date.
6. Risks
Closed-End Fund Risk. Closed-end funds involve investment risks different from those associated with other investment companies. First, the shares of closed-end funds frequently trade at a premium or discount relative to their net asset value. When the Fund purchases shares of a closed-end fund at a discount to its net asset value, there can be no assurance that the discount will decrease, and it is possible that the discount may increase and affect whether the Fund will a realize gain or loss on the investment. Second, many closed-end funds use leverage, or borrowed money, to try to increase returns. Leverage is a speculative technique and its use by a closed-end fund entails greater risk and leads to a more volatile share price. If a close-end fund uses leverage, increases and decreases in the value of its share price will be magnified. The closed-end fund will also have to pay interest or dividends on its leverage, reducing the closed-end fund's return. Third, many closed-end funds have a policy of distributing a fixed percentage of net assets regardless of the fund’s actual interest income and capital gains. Consequently, distributions by a closed-end fund may include a return of capital, which would reduce the fund’s net asset value and its earnings capacity. Finally, closed-end funds are allowed to invest in a greater amount of illiquid securities than open-end mutual funds. Investments in illiquid securities pose risks related to uncertainty in valuations, volatile market prices, and limitations on resale that may have an adverse effect on the ability of the fund to dispose of the securities promptly or at reasonable prices.
Fund of Funds Risk. The Fund is a “fund of funds.” The term “fund of funds” is typically used to describe investment companies, such as the Fund, whose principal investment strategy involves investing in other investment companies, including closed-end funds and money market mutual funds. Investments in other funds subject the Fund to additional operating and management fees and expenses. For instance, investors in the Fund will indirectly bear fees and expenses charged by the funds in which the Fund invests, in addition to the Fund’s direct fees and expenses. The Fund’s performance depends in part upon the performance of the funds’ investment advisor, the strategies and instruments used by the funds, and the Advisor's ability to select funds and effectively allocate Fund assets among them.
Control of Closed-End Funds Risk. Although the Fund and the Advisor will evaluate regularly each closed-end fund in which the Fund invests to determine whether its investment program is consistent with the Fund’s investment objective, the Advisor will not have any control over the investments made by a closed-end fund. The investment advisor to each closed- end fund may change aspects of its investment strategies at any time. The Advisor will not have the ability to control or otherwise influence the composition of the investment portfolio of a closed-end fund.
Fixed Income Securities Risk. When the closed-end funds invest in fixed income securities, the value of your investment in the Fund will fluctuate with changes in interest rates. Typically, a rise in interest rates causes a decline in the value of fixed income securities. In general, the market price of fixed income securities with longer maturities will increase or decrease more in response to changes in interest rates than shorter-term securities. Other risk factors include credit risk (the debtor may default), extension risk (an issuer may exercise its right to repay principal on a fixed rate obligation later than expected), and prepayment risk (the debtor may pay its obligation early, reducing the amount of interest payments). These risks could affect the value of a particular investment by the Fund, possibly causing the Fund's share price and total return to be reduced and fluctuate more than other types of investments.
(Continued)
Matisse Discounted Closed-End Fund Strategy
Notes to Financial Statements
As of March 31, 2023
COVID-19 and Other Infectious Illnesses Risk. The outbreak of an infectious respiratory illness caused by a novel coronavirus known as COVID-19 has resulted in travel restrictions, closed international borders, enhanced health screenings at ports of entry and elsewhere, disruption of and delays in healthcare service preparation and delivery, prolonged quarantines, cancellations, supply chain disruptions, and lower consumer demand, as well as general concern and uncertainty. The impact of COVID-19, and other infectious illness outbreaks that may arise in the future, could adversely affect the economies of many countries or the entire global economy, individual issuers and capital markets in ways that cannot necessarily be foreseen. In addition, the impact of infectious illnesses in emerging market countries may be greater due to generally less established healthcare systems. Public health crises caused by the COVID-19 outbreak, or other infectious illness outbreaks that may arise in the future, may exacerbate other pre-existing political, social and economic risks in certain countries or globally. As such, issuers of debt securities with operations, productions, offices, and/or personnel in (or other exposure to) areas affected with the virus may experience significant disruptions to their business and/or holdings. The potential impact on the credit markets may include market illiquidity, defaults and bankruptcies, among other consequences, particularly on issuers in the airline, travel and leisure and retail sectors. The extent to which COVID-19 or other infectious illnesses will affect the Fund, the Fund’s service providers’ and/or issuer’s operations and results will depend on future developments, which are highly uncertain and cannot be predicted, including new information that may emerge concerning the severity of COVID-19 or other infectious illnesses and the actions taken to contain COVID-19 or other infectious illnesses. Economies and financial markets throughout the world are becoming increasingly interconnected. As a result, whether or not the Fund invests in securities of issuers located in or with significant exposure to countries experiencing economic, political and/or financial difficulties, the value and liquidity of the Fund’s investments may be negatively affected by such events. If there is a significant decline in the value of the Fund’s portfolio, this may impact the Fund’s asset coverage levels for certain kinds of derivatives and other portfolio transactions. The duration of the COVID-19 outbreak, or any other infectious illness outbreak that may arise in the future, and its impact on the global economy cannot be determined with certainty.
Cybersecurity Risk. As part of its business, the Advisor processes, stores, and transmits large amounts of electronic information, including information relating to the transactions of the Fund. The Advisor and the Fund are therefore susceptible to cybersecurity risk. Cybersecurity failures or breaches of the Fund or its service providers have the ability to cause disruptions and impact business operations, potentially resulting in financial losses, the inability of Fund shareholders to transact business, violations of applicable privacy and other laws, regulatory fines, penalties, and/or reputational damage. The Fund and its shareholders could be negatively impacted as a result.
Equity Securities Risk. Fluctuations in the value of equity securities held by the closed-end funds will cause the NAV of the Fund to fluctuate. Equity securities may decline in price if the issuer fails to make anticipated dividend payments. Common stock is subject to greater dividend risk than preferred stocks or debt instruments of the same issuer. In addition, equity securities have experienced significantly more volatility in returns than other asset classes.
Foreign Securities Risk. The Fund may invest in foreign securities. Foreign securities involve investment risks different from those associated with domestic securities. Changes in foreign economies and political climates are more likely to affect the Fund than investments in domestic securities. The value of foreign currency denominated securities or foreign currency contracts is affected by the value of the local currency relative to the U.S. dollar. There may be less government supervision of foreign markets, resulting in non-uniform accounting practices and less publicly available information about issuers of foreign currency denominated securities. The value of foreign investments may be affected by changes in exchange control regulations, application of foreign tax laws (including withholding tax), changes in governmental administration or economic or monetary policy (in this country or abroad) or changed circumstances in dealings between nations. In addition, foreign brokerage commissions, custody fees, and other costs of investing in foreign securities are generally higher than in the United States. Investments in foreign issues could be affected by other factors not present in the United States, including expropriation, armed conflict, confiscatory taxation, and potential difficulties in enforcing contractual obligations.
ADR Risk. ADRs may be subject to some of the same risks as direct investments in foreign companies, which includes international trade, currency, political, regulator, and diplomatic risks. In a sponsored ADR arrangement, the foreign issuer assumes the obligation to pay some or all of the depository’s transaction fees. Under an unsponsored ADR arrangement, the foreign issuer assumes no obligations and the depository’s transaction fees are paid directly by the ADR holders. Because unsponsored ADR arrangements are organized independently and without the cooperation of the issuer of the underlying securities, available information concerning the foreign issuer may not be as current as for sponsored ADRs and voting rights with respect to the deposited securities are not passed through.
Matisse Discounted Closed-End Fund Strategy
Notes to Financial Statements
As of March 31, 2023
General Investment Risks. All investments in securities and other financial instruments involve a risk of financial loss. No assurance can be given that the Fund's investment program will be successful. Investors should carefully review the descriptions of the Fund's investments and their risks described in this prospectus and the Fund’s Statement of Additional Information.
Investment Advisor Risk. The Advisor’s ability to choose suitable investments has a significant impact on the ability of the Fund to achieve its investment objectives.
Quantitative Model Risk. Securities or other investments selected using quantitative methods may perform differently from the market as a whole. There can be no assurance that these methodologies will enable the Fund to achieve its objective.
Leverage Risk. The Fund may leverage or borrow money from banks to buy securities and pledge its assets in connection with the borrowing. Use of leverage tends to magnify increases and decreases in the Fund’s returns and leads to a more volatile share price. The Fund will also incur borrowing costs in connection with its use of leverage. If the interest expense of the borrowing is greater than the return on the securities bought, the use of leverage will decrease the return to shareholders in the Fund. Leveraging by both the Fund and the underlying closed-end funds, which often employ leverage, will expose the Fund to a relatively high level of leverage risk. There can be no assurance that a leveraging strategy will be successful during any period in which it is employed.
Loans Risk. Investments in loans may subject the Fund to heightened credit risks because loans may be highly leveraged and susceptible to the risks of interest deferral, default, and/or bankruptcy.
Management Style Risk. Different types of securities tend to shift into and out of favor with investors depending on market and economic conditions. The returns from the types of investments purchased by the Fund (e.g., closed-end funds which pay regular periodic cash distributions) may at times be better or worse than the returns from other types of funds. Each type of investment tends to go through cycles of performing better or worse than the market in general. The performance of the Fund may thus be better or worse than the performance of funds that focus on other types of investments, or that have a broader investment style.
Market Risk. Market risk refers to the possibility that the value of securities held by the Fund may decline due to daily fluctuations in the market. Market prices for securities change daily as a result of many factors, including developments affecting the condition of both individual companies and the market in general. The price of a security may even be affected by factors unrelated to the value or condition of its issuer, such as changes in interest rates, economic and political conditions, and general market conditions. The Fund’s performance per share will change daily in response to such factors.
Money Market Mutual Fund Risk. The Fund may invest in money market mutual funds in order to manage its cash component. An investment in a money market mutual fund is not insured or guaranteed by a Federal Deposit Insurance Corporation or any other government agency. Although such funds seek to preserve the value of the Fund’s investment at $1.00 per share, it is possible to lose money by investing in a money market mutual fund.
Portfolio Turnover Risk. The Fund may have a high turnover of the securities held in its portfolio. Increased portfolio turnover causes the Fund to incur higher brokerage costs, which may adversely affect the Fund’s performance and may produce increased taxable distributions.
7. Beneficial Ownership
The beneficial ownership, either directly or indirectly, of 25% or more of the voting securities of a fund creates a presumption of control of a fund, under Section 2(a)(9) of the Investment Company Act of 1940. As of March 31, 2023, Charles Schwab & Co. held 53.38% of the Fund. The Fund has no knowledge as to whether all or any portion of the shares of record owned by Charles Schwab & Co. are also owned beneficially.
8. Commitments and Contingencies
Under the Trust’s organizational documents, its officers and Trustees are indemnified against certain liabilities arising out of the performance of their duties to the Fund. In addition, in the normal course of business, the Trust entered into contracts with its service providers, on behalf of the Fund, and others that provide for general indemnifications. The Fund’s maximum exposure under these arrangements is unknown, as this would involve future claims that may be made against the Fund. The Fund expects risk of loss to be remote.
Matisse Discounted Closed-End Fund Strategy
Notes to Financial Statements
As of March 31, 2023
9. Borrowings
The Fund established a borrowing agreement with Interactive Brokers LLC for investment purposes subject to the limitations of the 1940 Act for borrowings by registered investment companies.
Interest is based on the Federal Funds rate plus 1.50% on the first $100,000, the Federal Funds rate plus 1.00% on the next $900,000, the Federal Funds rate plus 0.75% on balances between $1,000,000 and $50,000,000, and the Federal Funds rate plus 0.50% on balances greater than $50,000,000. During the period of September 2, 2022, when the Fund began its borrowing, through the fiscal year ended March 31, 2023, the averaging borrowing was $2,501,340, the average interest rate was 4.67%, and the maximum amount borrowing was $7,440,249.
Interest expense is charged directly to the Fund based upon actual amounts borrowed by the Fund. The Fund had $6,689,528 in borrowings as of the fiscal year ended March 31, 2023. Securities purchased with borrowings have been pledged as collateral for amounts due to broker. Total interest expense for the fiscal year was $126,327 as reflected in the Statement of Operations.
10. Subsequent Events
Ashley Lanham resigned as an Officer to the Starboard Investment Trust effective May 19, 2023. Pete McCabe, CCO at The Nottingham Company, has replaced Ms. Lanham as the Treasurer, Principal Accounting Officer, and Principal Financial Officer of the Trust.
In accordance with GAAP, management has evaluated the need for disclosures and/or adjustments resulting from subsequent events through the date of issuance of these financial statements. Management has concluded there are no additional matters, other than those noted above, requiring recognition or disclosure.
REPORT OF INDEPENDENT REGISTERED PUBLIC ACCOUNTING FIRM
To the Shareholders of Matisse Discounted Closed‐End Fund Strategy
and the Board of Trustees of Starboard Investment Trust
Opinion on the Financial Statements
We have audited the accompanying statement of assets and liabilities, including the schedule of investments, of Starboard Investment Trust comprising Matisse Discounted Closed‐End Fund Strategy (the “Fund”) as of March 31, 2023, the related statements of operations, changes in net assets, and cash flows, the related notes, and the financial highlights for the year then ended (collectively referred to as the “financial statements”). In our opinion, the financial statements present fairly, in all material respects, the financial position of the Fund as of March 31, 2023, the results of its operations, the changes in net assets, its cash flows, and the financial highlights for the year then ended, in conformity with accounting principles generally accepted in the United States of America.
The Fund’s financial statements and financial highlights for the year ended March 31, 2022, and prior, were audited by other auditors whose report dated May 30, 2022, expressed an unqualified opinion on those financial statements and financial highlights.
Basis for Opinion
These financial statements are the responsibility of the Fund’s management. Our responsibility is to express an opinion on the Fund’s financial statements based on our audit. We are a public accounting firm registered with the Public Company Accounting Oversight Board (United States) (“PCAOB”) and are required to be independent with respect to the Fund in accordance with the U.S. federal securities laws and the applicable rules and regulations of the Securities and Exchange Commission and the PCAOB.
We conducted our audit in accordance with the standards of the PCAOB. Those standards require that we plan and perform the audit to obtain reasonable assurance about whether the financial statements are free of material misstatement whether due to error or fraud.
Our audit included performing procedures to assess the risks of material misstatement of the financial statements, whether due to error or fraud, and performing procedures that respond to those risks. Such procedures included examining, on a test basis, evidence regarding the amounts and disclosures in the financial statements. Our procedures included confirmation of securities owned as of March 31, 2023, by correspondence with the custodian. Our audit also included evaluating the accounting principles used and significant estimates made by management, as well as evaluating the overall presentation of the financial statements. We believe that our audit provides a reasonable basis for our opinion.
We have served as the Fund’s auditor since 2023.
COHEN & COMPANY, LTD.
Philadelphia, Pennsylvania
June 7, 2023
C O H E N & C O M P A N Y , L T D
.800.229.1099 | 866.818.4538 fa x | cohencpa.com
Registered with the Public Company Accounting Oversight Board
Matisse Discounted Closed-End Fund Strategy
Additional Information
(Unaudited)
As of March 31, 2023
| 1. | Proxy Voting Policies and Voting Record |
A copy of the Advisor’s Proxy Voting and Disclosure Policy is included as Appendix B to the Fund’s Statement of Additional Information and is available, without charge, upon request, by calling 800-773-3863, and on the website of the Securities and Exchange Commission (“SEC”) at http://www.sec.gov. Information regarding how the Fund voted proxies relating to portfolio securities during the most recent 12-month period ended June 30 is available (1) without charge, upon request, by calling the Fund at the number above and (2) on the SEC’s website at http://www.sec.gov.
| 2. | Quarterly Portfolio Holdings |
The Fund files its complete schedule of portfolio holdings with the SEC for the first and third quarters of each fiscal year on Form N-PORT. The Fund’s Forms N-PORT are available on the SEC’s website at http://www.sec.gov. You may also obtain copies without charge, upon request, by calling the Fund at 800-773-3863.
We are required to advise you within 60-days of the Fund’s fiscal year-end regarding federal tax status of certain distributions received by shareholders during each fiscal year. The following information is provided for the Fund’s fiscal year ended March 31, 2023.
During the fiscal year ended March 31, 2023, the Fund paid $3,260,391 in income distributions and $2,052,343 in return of capital, but no long-term capital gain distributions.
Dividend and distributions received by retirement plans such as IRAs, Keogh-type plans, and 403(b) plans need not be reported as taxable income. However, many retirement plans may need this information for their annual information meeting.
| 4. | Schedule of Shareholder Expenses |
As a shareholder of the Fund, you incur ongoing costs, including management fees and other Fund expenses. This Example is intended to help you understand your ongoing costs (in dollars) of investing in the Fund and to compare these costs with the ongoing costs of investing in other mutual funds.
The Example is based on an investment of $1,000 invested at the beginning of the period and held for the entire period from October 1, 2022 through March 31, 2023.
Actual Expenses – The first line of the table below provides information about actual account values and actual expenses. You may use the information in this line, together with the amount you invested, to estimate the expenses that you paid over the period. Simply divide your account value by $1,000 (e.g., an $8,600 account value divided by $1,000 = 8.6), then multiply the result by the number in the first line under the heading entitled “Expenses Paid During Period” to estimate the expenses you paid on your account during this period.
Hypothetical Example for Comparison Purposes – The second line of the table below provides information about hypothetical account values and hypothetical expenses based on the Fund’s actual expense ratio and an assumed rate of return of 5% per year before expenses, which is not the Fund’s actual return. The hypothetical account values and expenses may not be used to estimate the actual ending account balance or expenses you paid for the period. You may use this information to compare the ongoing costs of investing in the Fund and other funds. To do so, compare this 5% hypothetical example with the 5% hypothetical examples that appear in the shareholder reports of the other funds.
Please note that the expenses shown in the table are meant to highlight your ongoing costs only and do not reflect any transactional costs, such as sales charges (loads), redemption fees, or exchange fees. Therefore, the second line of the table is useful in comparing ongoing costs only and will not help you determine the relative total costs of owning different funds. In addition, if these transactional costs were included, your costs would have been higher.
Matisse Discounted Closed-End Fund Strategy
Additional Information
(Unaudited)
As of March 31, 2023
| Institutional Class Shares | Beginning Account Value October 1, 2022 | Ending Account Value March 31, 2023 | Expenses Paid During Period* |
Actual Hypothetical (5% annual return before expenses) | | | |
| $1,000.00 | $1,124.50 | $6.62 |
| $1,000.00 | $1,018.70 | $6.29 |
*Expenses, excluding interest expense, are equal to the average account value over the period multiplied by the Fund’s annualized net expense ratio of 1.25%, multiplied by the number of days in the most recent period divided by the number of days in the fiscal year (to reflect the six-month period).
5. Information about Trustees and Officers
The business and affairs of the Fund and the Trust are managed under the direction of the Board of Trustees of the Trust. Information concerning the Trustees and officers of the Trust and Fund is set forth below. Generally, each Trustee and officer serves an indefinite term or until certain circumstances such as their resignation, death, or otherwise as specified in the Trust’s organizational documents. Any Trustee may be removed at a meeting of shareholders by a vote meeting the requirements of the Trust’s organizational documents. The Statement of Additional Information of the Fund includes additional information about the Trustees and officers and is available, without charge, upon request by calling the Fund toll-free at 800-773-3863. The address of each Trustee and officer, unless otherwise indicated below, is 116 South Franklin Street, Rocky Mount, North Carolina 27804. The Independent Trustees received aggregate compensation of $8,723 during the fiscal year ended March 31, 2023, from the Fund for their services to the Fund and Trust.
Name and
Date of Birth | Position
held with
Funds or Trust | Length
of Time Served | Principal Occupation
During Past 5 Years | Number of Portfolios in Fund Complex Overseen by Trustee | Other Directorships
Held by Trustee
During Past 5 Years |
| Independent Trustees |
James H. Speed, Jr.
(06/1953) | Chairman and Independent Trustee | Trustee since 7/09, Chair since 5/12 | Retired Executive/Private Investor | 13 | Independent Trustee of the Brown Capital Management Mutual Funds for all its series from 2001 to present, Centaur Mutual Funds Trust for all its series from 2009 to present, WST Investment Trust for all its series from 2013 to present, and Chesapeake Investment Trust for all its series from 2016 to present (all registered investment companies). Member of Board of Directors of Communities in Schools of N.C. from 2001 to present. Member of Board of Directors of Investors Title Company from 2010 to present. Member of Board of Directors of AAA Carolinas/Auto Club from 2011 to present. Previously, Independent Trustee of the Hillman Capital Management Trust from 2009 to 2021. Previously, Independent Trustee of the Leeward Investment Trust from 2018 to 2020. Previously, member of Board of Directors of M&F Bancorp Mechanics & Farmers Bank from 2009 to 2019. |
Theo H. Pitt, Jr.
(04/1936) | Independent Trustee | Since 9/10 | Senior Partner, Community Financial Institutions Consulting (financial consulting) since 1999. | 13 | Independent Trustee of Hillman Capital Management Investment Trust for all its series from 2000 to present, Chesapeake Investment Trust for all its series from 2002 to present, World Funds Trust for all its series from 2013 to present, ETF Opportunities Trust for all its series from 2019 to present, and Kingsham Parallel Income Trust form 2022 to present (all registered investment companies). Senior Partner of Community Financial Institutions Consulting from 1997 to present. Previously, Independent Trustee of the Leeward Investment Trust from 2011 to 2021. |
Michael G. Mosley*
(01/1953) | Independent Trustee | Since 7/10 | Owner of Commercial Realty Services (real estate) since 2004. | 13 | None. |
J. Buckley Strandberg
(03/1960) | Independent Trustee | Since 7/09 | President of Standard Insurance and Realty since 1982. | 13 | None. |
*Michael Mosley resigned as an Independent Trustees to the Starboard Investment Trust effective March 9, 2023.
(Continued)
Matisse Discounted Closed-End Fund Strategy
Additional Information
(Unaudited)
As of March 31, 2023
Name and
Date of Birth | Position held with
Funds or Trust | Length
of Time Served | Principal Occupation
During Past 5 Years |
| Officers |
Katherine M. Honey
(09/1973) | President and Principal Executive Officer | Since 05/15 | President of The Nottingham Company since 2018. EVP of The Nottingham Company from 2008 to 2018. |
Ashley H. Lanham** (03/1984) | Treasurer, Assistant Secretary, Principal Accounting Officer, and Principal Financial Officer | Since 05/15 | Managing Director of Fund Administration, The Nottingham Company since 2008. |
Tracie A. Coop
(12/1976) | Secretary | Since 12/19 | General Counsel, The Nottingham Company since 2019. Formerly, Vice President and Managing Counsel, State Street Bank and Trust Company from 2015 to 2019. |
Andrea M. Knoth
(09/1983) | Chief Compliance Officer | Since 06/2022 | Director of Compliance, The Nottingham Company since 2022. Formerly, Senior Fund Compliance Administrator, Ultimus Fund Solutions from 2019 to 2022. Formerly, Associate Director of Operational Compliance, Barings from 2018 to 2019. Formerly, Senior Fund Compliance Administrator, Gemini Fund Services from 2012 to 2018. |
**Ashley Lanham resigned as an Officer to the Starboard Investment Trust effective May 19, 2023. Pete McCabe, CCO at The Nottingham Company, has replaced Ms. Lanham as the Treasurer, Principal Accounting Officer, and Principal Financial Officer for the Trust.
6. Change of Independent Registered Public Accounting Firm
Effective March 6, 2023, BBD LLP (“BBD”) ceased to serve as the independent registered public accounting firm for the Starboard Investment Trust, The Audit Committee of the Board of Directors approved the replacement of BBD as a result of Cohen & Company, Ltd.’s (“Cohen”) acquisition of BBD’s investment management group. On March 9, 2023, the Audit Committee of the Board of Directors also recommend and approved the appointment of Cohen as the Fund’s independent registered public accounting firm for the fiscal year ending March 31, 2023.
Matisse Discounted Closed-End Fund Strategy
Additional Information
(Unaudited)
As of March 31, 2023
The reports of BBD, LLP on the Fund’s financial statements for the last fiscal year contained no adverse opinion or disclaimer of opinion and were not qualified or modified as to uncertainty, audit scope, or accounting principles.
During the Funds’ most recent fiscal year, and through March 9, 2023, there were no disagreements with BBD, LLP on any matter of accounting principles or practices, financial statement disclosure, or auditing scope or procedure, which disagreements, if not resolved to the satisfaction of BBD, LLP, would have caused them to make reference to the subject matter of the disagreements in connection with their reports on the Fund’s financial statements for such years. During the most recent fiscal year, and through March 9, 2023, there were no reportable events as defined in Item 304(a)(1)(v) of Regulation S-K promulgated by the SEC.
The Fund requested BBD, LLP to furnish them with a letter addressed to the SEC stating whether or not it agrees with the above statements. A copy of such letter will be filed as an Exhibit to the Form N-CSRs filing to be made on or before June 9, 2023.
7. Liquidity Risk Management Program
Rule 22e-4, or the “Liquidity Rule,” under the Investment Company Act of 1940 requires a mutual fund to adopt a liquidity risk management program (“Program”) and disclose information about the operation and effectiveness of its Program in its reports to shareholders.
Under the Program, each of the Fund’s portfolio investments are classified into one of four liquidity categories defined by the SEC: highly liquid, moderately liquid, less liquid, and illiquid. Liquidity classifications take into account a variety of market, trading, and investment factors, including the Fund’s reasonably anticipated trade size, and the Program Administrator has engaged a third-party vendor to assist with the classification of portfolio investments.
In accordance with the Liquidity Rule, the Program Administrator prepared, and the Fund’s Board of Trustees reviewed, a report regarding the operation and effectiveness of the Program for the period from December 1, 2021, through November 30, 2022. During the period, there were no liquidity events that materially impacted the Fund’s ability to timely meet redemptions without significantly diluting remaining investors’ interests. The report concluded that the Program remains reasonably designed to assess and manage the Fund’s liquidity risk, and that during the period the Program was implemented effectively.
(Unaudited)
Dear MDFIX Shareholder:
Enclosed please find the Annual Report for the Matisse Discounted Bond CEF Strategy (“MDFIX or the “Fund”) for the period ending March 31, 2023. The Fund launched on April 30, 2020.
As you can see from the nearby table, the Fund declined for the period, and underperformed its non CEF‐benchmarks. Here are the major factors that contributed to the Fund’s performance from 4/1/22 to 3/31/23:
1.
| Most closed‐end fund discounts widened, and most NAVs decreased. For the 12‐month period, the average Bond CEFs’ discount widened by 3.6%. Our trading and fund selection, however, aided the Fund’s performance against this headwind, as discount movement/capture withi the Fund contributed 0.7% to our total return (the underlying NAV returns of the Bond CEFs we owned, however, more than offset this positive factor, leading to a net decline for the Fund). |
| | |
| 2. | Our exposure to lower‐rated bonds helped (relative) returns during the period, as the High Yield benchmark (see nearby table) lost only 3.89%, outpacing investment‐grade bonds, where, for example, the Bloomberg US Aggregate Bond Index lost 4.78%. Note that, although we typically maintain a portfolio with more investment‐grade bonds than non‐investment‐grade bonds (and did so throughout the period), we believe non‐investment‐grade bonds played, and will continue to play, an important role in our results. |
| | |
| 3. | Our positions in Municipal Bond CEFs, generally, detracted from absolute and relative returns, as a broad rise in interest rates (with the ten‐year Treasury yield rising from 2.3% to 3.5%) hurt longer duration investments. Interestingly, both Taxable CEFs and Muni Bond CEFs lost 9.6% on average from 4/1/22‐3/31/23. |
| | |
| 4. | We carried some cash in the Fund at the beginning of the period, which helped cushion us a bit from the first part of the bond market decline. |
| | |
5.
| The cash collected by the Fund from its underlying closed‐end funds totaled about 8.2% during the 12‐ month period. This is an important, and steady, driver of alpha for the Fund, since we collect this cash effectively “at‐NAV” from closed‐end funds purchased at substantial discounts to NAV. Even in the absence of discount movement, therefore, this factor can potentially add alpha.
|
We believe that the Fund’s since‐inception performance has been good, well ahead of benchmarks, on the strength of our disciplined approach to seeking alpha from CEF discount movement. By the time you read this, the Fund will have celebrated its third anniversary.
Average Annual Total Returns
Period ended March 31, 2023 | One Year | Annualized Since Inception 4/30/2020 |
| MDFIX | ‐6.27% | +7.01% |
| Bloomberg US Aggregate Bond Index | ‐4.72% | ‐3.43% |
| Bloomberg VLI High Yield Index | ‐3.85% | +3.57% |
| FT Taxable Fixed Income CEF Index | ‐9.89% | +4.96% |
Returns longer than one year are annualized. The performance information quoted represents past performance, which is not a guarantee of future results. Investment return and principal value of an investment will fluctuate so that an investor’s shares, when redeemed, may be worth more or less than their original cost. Current performance may be lower or higher than the performance data quoted. For performance current to most recent month‐end, please send a request to info@matissecap.com, or call Shareholder Services at 1‐800‐773‐3863. Total return measures net investment income and capital gain or loss from portfolio investments. All performance shown assumes reinvestment of dividends and capital gains distributions. There is no guarantee that the Fund will pay or continue to pay distributions.
The Total Annual Fund Operating Expense for the Fund as disclosed in the prospectus dated August 1, 2022 is 3.10%. The Total Annual Fund Operating Expense is required to include expenses incurred indirectly by the Fund through its investments in closed‐end funds and other investment companies. The Advisor has entered into an expense limitation agreement with the Fund under which it has agreed to waive or reduce its management fees and assume other expenses of the Fund in an amount that limits the Fund’s Total Annual Fund Operating Expenses (exclusive of (i) any front‐end or contingent deferred loads; (ii) brokerage fees and commissions, (iii) acquired fund fees and expenses; (iv) fees and expenses associated with investments in other collective investment vehicles or derivative instruments (including, for example, option and swap fees and expenses); (v) borrowing costs (such as interest and dividend expense on securities sold short); (vi) taxes; and (vii) extraordinary expenses, such as litigation expenses (which may include indemnification of Fund officers and Trustees and contractual indemnification of Fund service providers (other than the Advisor)) to not more than 0.99% of the average daily net assets of the Fund. This contractual arrangement is in effect through July 31, 2023, unless terminated by the Board of Trustees of the Fund (the “Board” or the “Trustees”) at any time. “Acquired Fund Fees and Expenses” include expenses incurred indirectly by the Fund through its investments in closed‐end funds and other investment companies, do not affect a Fund’s actual operating costs, and therefore are not included in the Fund’s financial statements, which provide a clearer picture of a Fund’s actual operating costs. The Advisor cannot recoup from the Fund any amounts paid by the Advisor under the Expense Limitation Agreement.
State of the Bond CEF Market
Stock markets have recovered so far this year, and overall volatility is down, but Closed‐End Fund discounts‐‐‐ especially Bond CEFs‐‐‐have widened dramatically over the past year, creating broad opportunities. In a rare moment, for example, the average Municipal Bond CEF discount hit double‐digits in late March, prompting us to tactically increase our muni bond exposure to 50% within the Fund. A perfect storm of Fed rate hikes, inflation and bank failures that led to sharp (temporary) short‐term borrowing rate increases for leveraged Muni Bond CEFs combined to create this discount opportunity, as we discussed in a recent Barron's article.
Typically, Muni Bond CEFs trade at more like a 4% discount. The only previous times when Muni Bond CEF discounts averaged more than 9% occurred near the end of 2008, 2013, and 2018 (all which turned out to be excellent entry points for Municipal Bond CEF investors).
Besides the sharp discount widening, bond investors have suffered from continued Fed rate increases, and generally rising long‐term interest rates. (The price of a bond moves inversely to the direction of interest rates.) It’s less usual for bonds to decline for twelve‐month periods than for stocks, and the bond market has now turned in two consecutive such declines (4/1/21‐3/31/22 and 4/1/22‐3/31/23). A summary of the pain:
Over the past 2 years (4/1/21‐3/31/23):
• Bond markets declined significantly across the board
o The Bloomberg US Aggregate Bond Index lost 8.74%
o The FT Taxable Fixed Income CEF Index declined 12.55%
o The FT Municipal CEF Index fell 17.36%
• Bond CEF discounts widened by 621 bps on average
• Interest rates rose
o The 2‐year US Treasury rate went from 0.16% to 4.03%
◾ In March 2023 it hit a 15‐year high of 5.1%
o The 10‐year US Treasury rate went from 1.74% to 3.47%
◾ In October 2022 it hit a 15‐year high of 4.3%
It all sounds a little scary for bond investors, who have experienced the types of losses most have not seen in their investing lifetimes! Investing, while fearful, however, is often the smart move, and, in the bond market, the disease carries its own cure‐‐‐current high interest rates are the starting point for go‐forward returns. In other words, if your bond yields 5% and doesn’t default, its value has to decline by more than 5% over the next year for you to lose money.
We also take into account that two of the possible resolutions to the interest rate vs. inflation vs. economy quandary we are currently in (a “soft landing” where inflation eases and the Fed stops raising rates; or a sharp economic downturn) are likely to benefit bonds, and some of the other possible resolutions (economic reacceleration with continued Fed hikes, for example) could narrow at least some types of CEF discounts and help Floating Rate Bond CEFs (which also feature in the Fund).
Considerations like these have led us to take on modest leverage within the Fund in order to take advantage of buying opportunities in both Municipal Bond CEFs and Taxable Bond CEFs. We are very optimistic about the current portfolio of MDFIX. At quarter‐end, our portfolio was 49% Municipal, 26% Foreign Bond, and 25% US Taxable Bond, diversified across 62 CEFs (and subsequently thousands of individual bonds on a lookthrough basis). We are finding attractively discounted CEFs across the entire Bond CEF universe. The weighted average discount to NAV of the underlying CEF holdings in MDFIX stood at 13.9% at quarter‐end. The weighted average indicated cash distribution yield of the underlying CEF holdings in MDFIX was 7.8% at quarter‐end. As has been the case thus far, going forward we expect a majority of the Fund’s assets to be invested in investment grade bonds (bonds rated BBB or higher by Standard & Poor’s Rating Services or other equivalent by Moody’s Investor Service, Inc. or Fitch, Inc.).
We appreciate your interest in, and investment in, the Fund. We’ll continue to keep you updated on the important developments we see in the misunderstood, retail‐dominated world of closed‐end funds. Check out https://www.matissecap.com/funds/ for updates, and feel free to contact us at 503‐210‐3005 to discuss the Matisse Discounted Bond CEF Strategy (MDFIX) and our investment approach.
Sign Up for Matisse Funds Emails
To receive future communications on our funds (including performance updates and market commentary) make sure to sign up for our email list here.
Sincerely,

Eric Boughton, CFA
| Bryn Torkelson
|
Portfolio Manager & Chief Analyst
| President & CIO
|
Matisse Capital
| Matisse Capital
|
(RCMAT0423009)
| Matisse Discounted Bond CEF Strategy | | | | | | | | | | | |
| Institutional Class Shares | | | | | | | | | | | |
| | | | | | | | | | | | | | | | | | |
| Performance Update (Unaudited) | | | | | | | | | | | |
| | | | | | | | | | | | | | | | | | |
| For the period from April 30, 2020 (Date of Initial Public Investment) through March 31, 2023 |
| | | | | | | | | | | | | | | | | | |
| Comparison of the Change in Value of a $10,000 Investment | | | | | | | | |
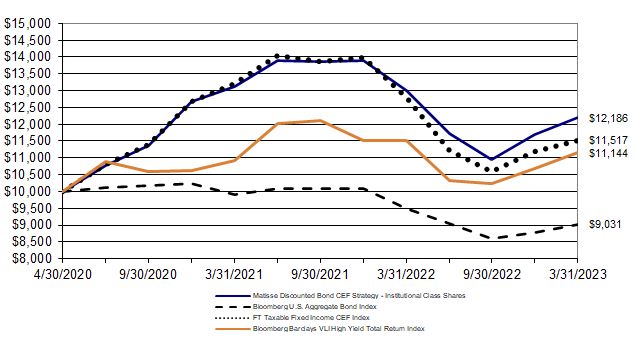
| This graph assumes an initial investment of $10,000 at April 30, 2020 (Date of Initial Public Investment). All dividends and distributions are reinvested. This graph depicts the performance of the Matisse Discounted Bond CEF Strategy versus the Fund's benchmark index, the Bloomberg Barclays VLI High Yield Total Return Index. Other indices shown are the Bloomberg U.S. Aggregate Bond Index and the FT Taxable Fixed Income CEF Index. It is important to note that the Fund is a professionally managed mutual fund while the indices are not available for investment and are unmanaged. The comparison is shown for illustrative purposes only. |
| | | | | | | | | | | | | | | | | | | |
| | Average Total Returns | |
| | | | | | | | | | | | | | | | | | | |
| | | For the Fiscal Period Ended | | | | | | | | | One | | Since | |
| | | March 31, 2023 | | | | | | | | | | Year | | Inception* | |
| | | Institutional Class Shares | | | | | | | -6.27% | | 7.01% | |
| | | Bloomberg U.S. Aggregate Bond Index | | | | | | | -4.72% | | -3.43% | |
| | | Bloomberg Barclays VLI High Yield Total Return Index | | | | | | -3.85% | | 3.57% | |
| | | FT Taxable Fixed Income CEF Index | | | | | | | | -9.89% | | 4.96% | |
| | | | | | | | | | | | | | | | | | | |
| | * | The Inception Date of the Fund is April 30, 2020. | | | | | | | | | |
| Matisse Discounted Bond CEF Strategy | | | | | | | | | | | |
| Institutional Class Shares | | | | | | | | | | | |
| | | | | | | | | | | | | | | | | | |
| Performance Update (Unaudited) | | | | | | | | | | | |
| | | | | | | | | | | | | | | | | | |
| For the period from April 30, 2020 (Date of Initial Public Investment) through March 31, 2023 |
Performance quoted in the previous graph represents past performance, which is no guarantee of future results. Investment return and principal value will fluctuate so that shares, when redeemed, may be worth more or less than their original cost. Current performance may be lower or higher than the performance data quoted. The Advisor has entered into an Expense Limitation Agreement with the Trust, on behalf of the Fund, under which it has agreed to waive or reduce its fees and to assume other expenses of the Fund, if necessary, in amounts that limit the Fund’s total operating expenses (exclusive of (i) any front-end or contingent deferred loads; (ii) brokerage fees and commissions; (iii) acquired fund fees and expenses; (iv) fees and expenses associated with investments in other collective investment vehicles or derivative instruments (including, for example, option and swap fees and expenses); (v) borrowing costs (such as interest and dividend expense on securities sold short); (vi) taxes and (vii) extraordinary expenses, such as litigation expenses (which may include indemnification of Fund officers and Trustees and contractual indemnification of Fund service providers (other than the Advisor)) to not more than 0.99% of the average daily net assets of the Fund for the current fiscal year. The Expense Limitation Agreement remains in effect through July 31, 2023. The Expense Limitation Agreement may be terminated by the Board of Trustees of the Trust at any time. Without the waiver, the estimated expenses would be 2.48% per the Fund’s most recent prospectus dated August 1, 2022. An investor may obtain performance data, current to the most recent month-end, by visiting ncfunds.com. |
| | | | | | | | | | | | | | | | | | |
| | | | | | | | | | | | | | | | | | |
| The graph and table do not reflect the deduction of taxes that a shareholder would pay on Fund distributions or the redemption of Fund shares. Average annual total returns are historical in nature and measure net investment income and capital gain or loss from portfolio investments assuming reinvestments of distributions. |
| | | | | | | | | | | | | | | | | | |
| | | | | | | | | | | | | | | | | | |
| Matisse Discounted Bond CEF Strategy | | | | | |
| | | | | | | | | | |
| Schedule of Investments | | | | | | |
| | | | | | | | | | |
| As of March 31, 2023 | | | | | | |
| | | | | | | | Shares | | Value (Note 1) |
| | | | | | | | | | |
| CLOSED-END FUNDS (b) - 111.64% | | | | | | |
| | Aberdeen Asia-Pacific Income Fund, Inc. | | | 570,000 | $ | 1,516,200 |
| | Angel Oak Financial Strategies Income Term Trust | | | 80,000 | | 986,400 |
| | Apollo Tactical Income Fund, Inc. | | | | 68,837 | | 834,304 |
| | Ares Dynamic Credit Allocation Fund, Inc. | | | 41,071 | | 491,620 |
| | BlackRock MuniHoldings California Quality Fund, Inc. | | 78,600 | | 869,316 |
| | BlackRock MuniHoldings New Jersey Quality Fund, Inc. | | 94,443 | | 1,081,372 |
| | BlackRock MuniHoldings New York Quality Fund, Inc. | | 8,037 | | 85,514 |
| | BlackRock MuniYield Michigan Quality Fund, Inc. | | | 49,487 | | 553,760 |
| | BlackRock MuniYield New York Quality Fund, Inc. | | | 33,064 | | 335,600 |
| | BlackRock MuniYield Pennsylvania Quality Fund | | | 125,000 | | 1,467,500 |
| | BlackRock New York Municipal Income Trust | | | 72,521 | | 754,218 |
| (a) | Blackstone Long-Short Credit Income Fund | | | 69,365 | | 756,772 |
| | Blackstone Strategic Credit 2027 Term Fund | | | 854 | | 9,095 |
| | BNY Mellon Municipal Income, Inc. | | | | 37,322 | | 242,220 |
| | BNY Mellon Strategic Municipal Bond Fund | | | 26,474 | | 159,109 |
| (a) | BrandywineGLOBAL Global Income Opportunities Fund, Inc. | | 140,000 | | 1,114,400 |
| | Credit Suisse High Yield Bond Fund | | | | 13,610 | | 25,723 |
| | DWS Strategic Municipal Income Trust | | | 22,808 | | 193,412 |
| | Eaton Vance California Municipal Bond Fund | | | 18,170 | | 163,893 |
| | Eaton Vance California Municipal Income Trust | | | 107,178 | | 1,096,431 |
| | Eaton Vance New York Municipal Bond Fund | | | 114,287 | | 1,110,870 |
| (a) | Federated Hermes Premier Municipal Income Fund | | | 44,588 | | 482,442 |
| | First Trust Aberdeen Global Opportunity Fund | | | 187,356 | | 1,122,262 |
| | First Trust High Yield Opportunities 2027 Term Fund | | | 26,877 | | 375,203 |
| | First Trust Senior Floating Rate Income Fund II | | | 136,900 | | 1,362,155 |
| | Franklin Ltd. Duration Income Trust | | | | 159,668 | | 986,748 |
| | FS Credit Opportunities Corp. | | | | 320,000 | | 1,420,800 |
| | Invesco California Value Municipal Income Trust | | | 26,088 | | 265,315 |
| | Invesco Pennsylvania Value Municipal Income Trust | | | 60,552 | | 607,942 |
| | Invesco Trust for Investment Grade New York Municipals | | 35,794 | | 374,405 |
| (a) | MFS High Yield Municipal Trust | | | | 385,623 | | 1,237,850 |
| | MFS Investment Grade Municipal Trust | | | 113,651 | | 839,881 |
| (a) | Morgan Stanley Emerging Markets Debt Fund, Inc. | | | 117,137 | | 754,362 |
| (a) | Morgan Stanley Emerging Markets Domestic Debt Fund, Inc. | | 306,290 | | 1,384,431 |
| (a) | Neuberger Berman California Municipal Fund, Inc. | | | 66,646 | | 741,104 |
| | Neuberger Berman Municipal Fund, Inc. | | | 7,657 | | 83,844 |
| | Neuberger Berman New York Municipal Fund, Inc. | | | 50,964 | | 490,274 |
| | Nuveen AMT-Free Municipal Credit Income Fund | | | 110,000 | | 1,295,800 |
| | Nuveen Core Plus Impact Fund | | | | 130,000 | | 1,328,600 |
| | Nuveen Floating Rate Income Opportunity Fund | | | 5,802 | | 46,532 |
| | Nuveen Massachusetts Quality Municipal Income Fund | | 72,634 | | 772,826 |
| (a) | Nuveen Mortgage and Income Fund | | | | 84,000 | | 1,340,640 |
| (a) | Nuveen Ohio Quality Municipal Income Fund | | | 112,900 | | 1,434,959 |
| | Nuveen Pennsylvania Quality Municipal Income Fund | | 34,675 | | 396,335 |
| | Nuveen Senior Income Fund | | | | 5,537 | | 25,526 |
| | Nuveen Short Duration Credit Opportunities Fund | | | 12,135 | | 142,344 |
| | | | | | | | | | (Continued) |
| Matisse Discounted Bond CEF Strategy | | | | | |
| | | | | | | | | | |
| Schedule of Investments - Continued | | | | | | |
| | | | | | | | | | |
| As of March 31, 2023 | | | | | | |
| | | | | | | | Shares | | Value (Note 1) |
| | | | | | | | | | |
| CLOSED-END FUNDS (b) - Continued | | | | | | |
| | Nuveen Variable Rate Preferred & Income Fund | | 12,608 | $ | 199,711 |
| (a) | Pioneer Floating Rate Fund, Inc. | | | | 121,814 | | 1,059,782 |
| | Pioneer High Income Fund, Inc. | | | | 27,064 | | 179,434 |
| | Pioneer Municipal High Income Advantage Fund, Inc. | | 9,452 | | 77,790 |
| | Pioneer Municipal High Income Fund Trust | | | 11,368 | | 101,061 |
| | Pioneer Municipal High Income Opportunities Fund, Inc. | | 110,000 | | 1,201,200 |
| | RiverNorth DoubleLine Strategic Opportunity Fund, Inc. | | 160,000 | | 1,369,600 |
| | RiverNorth Managed Duration Municipal Income Fund II, Inc. | | 1,400 | | 21,098 |
| | The New America High Income Fund, Inc. | | | 38,684 | | 263,438 |
| | Virtus Global Multi-Sector Income Fund | | | 145,000 | | 1,123,750 |
| (a) | Western Asset Diversified Income Fund | | | 110,000 | | 1,463,000 |
| | Western Asset Emerging Markets Debt Fund, Inc. | | | 80,347 | | 690,181 |
| | Western Asset Inflation-Linked Opportunities & Income Fund | | 110,000 | | 1,006,500 |
| | Western Asset Intermediate Muni Fund, Inc. | | | 4,147 | | 32,789 |
| (a) | Western Asset Mortgage Opportunity Fund, Inc. | | | 130,000 | | 1,358,500 |
| | Western Asset Municipal Partners Fund, Inc. | | | 31,435 | | 380,363 |
| | | | | | | | | | |
| | | Total Closed-End Funds (Cost $47,176,358) | | | | | 43,688,506 |
| | | | | | | | | | |
| Investments, at Value (Cost $47,176,358) - 111.64% | | | | $ | 43,688,506 |
| | | | | | | | | | |
| Liabilities in Excess of Other Assets - (11.64)% | | | | | (4,555,780) |
| | | | | | | | | | |
| | Net Assets - 100.00% | | | | | $ | 39,132,726 |
| | | | | | | | | | |
| | (a) | Securities pledged as collateral for margin/borrowings. | | | | |
| | (b) | Each underlying fund's shareholder report and registration statement are available free of charge on the SEC's website at https://www.sec.gov. |
| | |
| | | | | | |
| | | | | | | | | | |
| | | | Summary of Investments | | | | | |
| | | | | % of Net |
| | | | |
| | | | | Assets | Value | |
| | |
| | | | Closed-End Funds | 111.64% | $
| 43,688,506 |
|
| | |
| | | | Liabilities in Excess of Other Assets | -11.64% |
| (4,555,780) |
|
| | |
| | | | Total Net Assets | 100.00% | $
| 39,132,726 |
|
| | |
| | | | | | | | | | |
| | | | | | | | | | |
| | | | | | | | | | |
| | | | | | | | | | |
| | | | | | | | | | |
| | | | | | | | | | |
| | | | | | | | | | |
| See Notes to Financial Statements | | | | | | |
| Matisse Discounted Bond CEF Strategy | | |
| | | | |
| Statement of Assets and Liabilities | | |
| | | | |
| As of March 31, 2023 | | |
| | | | |
| Assets: | | |
| Investments, at value (cost $47,176,358) | $ | 43,688,506 |
| Receivables: | | |
| Fund shares sold | | 135,071 |
| Dividends and interest | | 140,742 |
| Prepaid Expenses: | | |
| Registration and filing expenses | | 12,164 |
| | | | |
| Total Assets | | 43,976,483 |
| | | | |
| Liabilities: | | |
| Due to custodian | | 111,626 |
| Due to broker | | 4,683,175 |
| Accrued expenses: | | |
| Interest expenses | | 16,174 |
| Advisory fees | | 14,822 |
| Custody fees | | 6,120 |
| Professional fees | | 4,509 |
| Shareholder fulfillment expenses | | 3,476 |
| Compliance fees | | 2,387 |
| Administration fees | | 471 |
| Security pricing fees | | 323 |
| Trustee fees and meeting expenses | | 307 |
| Insurance fees | | 205 |
| Miscellaneous expenses | | 151 |
| Fund accounting fees | | 12 |
| | | | |
| Total Liabilities | | 4,843,757 |
| | | | |
| Net Assets | $ | 39,132,726 |
| | | | |
| Net Assets Consist of: | | |
| Paid in Capital | $ | 43,929,296 |
| Accumulated Losses | | (4,796,570) |
| | | | |
| Net Assets | $ | 39,132,726 |
| | | | |
| Institutional Class shares outstanding, no par value (unlimited authorized shares) | | 3,986,989 |
| Net Assets | $ | 39,132,726 |
| Net Asset Value, Maximum Offering Price, and Redemption Price Per Share | $ | 9.82 |
| | | | |
| | | | |
| | | | |
| | | | |
| See Notes to Financial Statements | | |
| Matisse Discounted Bond CEF Strategy | | |
| | | | |
| Statement of Operations | | |
| | | | |
| For the fiscal year ended March 31, 2023 | | |
| | | | |
| Investment Income: | | |
| Dividends | $ | 2,477,299 |
| | | | |
| Total Investment Income | | 2,477,299 |
| | | | |
| Expenses: | | |
Advisory fees (note 2) | | 256,958 |
| Interest expense (Note 9) | | 99,278 |
Administration fees (note 2) | | 41,691 |
Fund accounting fees (note 2) | | 34,343 |
| Registration and filing expenses | | 30,304 |
| Professional fees | | 27,431 |
Transfer agent fees (note 2) | | 21,001 |
| Shareholder fulfillment expenses | | 12,612 |
Compliance fees (note 2) | | 10,776 |
Custody fees (note 2) | | 10,548 |
Trustee fees and meeting expenses (note 3) | | 8,888 |
| Security pricing fees | | 6,901 |
| Insurance fees | | 3,286 |
Miscellaneous expenses (note 2) | | 1,740 |
| | | | |
| Total Expenses | | 565,757 |
| | | | |
Expenses waived by the Advisor (note 2) | | (103,067) |
| | | | |
| Net Expenses | | 462,690 |
| | | | |
| Net Investment Income | | 2,014,609 |
| | | | |
| Realized and Unrealized Gain (Loss) on Investments: | | |
| | | | |
| Net realized gain (loss) from: | | |
| | Investments | | (1,327,372) |
| | Capital gain distributions from underlying funds | | 18,654 |
| Total net realized loss | | (1,308,718) |
| | | | |
| Net change in unrealized appreciation (depreciation) on investments | | (2,377,230) |
| | | | |
| Net Realized and Unrealized Loss on Investments | | (3,685,948) |
| | | | |
| Net Decrease in Net Assets Resulting from Operations | $ | (1,671,339) |
| | | | |
| | | | |
| | | | |
| See Notes to Financial Statements | | |
| Matisse Discounted Bond CEF Strategy | | | | | |
| | | | | | | | | | | |
| Statements of Changes in Net Assets | | | | | | |
| | | | | | | | | | | |
| For the fiscal years ended March 31, | | | | 2023 | | 2022 |
| | | | | | | | | | | |
| Operations: | | | | | | | |
| Net investment income | | | $ | 2,014,609 | $
| 778,463 |
| Net realized gain (loss) from investment transactions | | (1,327,372) | | 1,801,695 |
| Capital gain distributions from underlying funds | | 18,654 | | 93,476 |
| Net change in unrealized appreciation (depreciation) on | | | | |
| | investments | | | | (2,377,230) | | (3,356,266) |
| | | | | | | | | | | |
| Net Decrease in Net Assets Resulting from Operations | | (1,671,339) | | (682,632) |
| | | | | | | | | | | |
| Distributions to Shareholders: | | | | | | |
| | Investment Income | | | | (2,331,603) | | (2,710,373) |
| | Return of Capital | | | | (260,053) | | - |
| | | | | | | | | | | |
| Decrease in Net Assets Resulting from Distributions | | (2,591,656) | | (2,710,373) |
| | | | | | | | | | | |
| Beneficial Interest Transactions: | | | | | | |
| Shares sold | | | | | 22,869,039 | | 11,071,797 |
| Reinvested dividends and distributions | | | | 2,480,925 | | 2,617,659 |
| Shares repurchased | | | | (14,139,607) | | (2,753,370) |
| | | | | | | | | | | |
| Increase in Net Assets from Beneficial Interest Transactions | 11,210,357 | | 10,936,086 |
| | | | | | | | | | | |
| Net Increase in Net Assets | | | | 6,947,362 | | 7,543,081 |
| | | | | | | | | | | |
| Net Assets: | | | | | | | |
| Beginning of Year | | | | 32,185,364 | | 24,642,283 |
| End of Year | | | | | $39,132,726 | | $32,185,364 |
| | | | | | | | | | | |
| | | | | | | March 31, 2023 | March 31, 2022 |
| Share Information: | | | | | | |
| | Institutional Class Shares | | Shares | | Amount | Shares | Amount |
| | | Shares sold | | 2,276,606 |
| $
| 22,869,039 | 873,910 | $ | 11,071,797 |
| | | Reinvested dividends and distributions | | 258,454 |
| 2,480,925 | 214,678 | 2,617,659 |
| | | Shares repurchased | | (1,397,710) |
| (14,139,607) | (221,218) | (2,753,370) |
| | | Net Increase in Shares of | | |
| | | |
| | | Beneficial Interest | | 1,137,350 |
| $
| 11,210,357 | 867,370 | $ | 10,936,086 |
| | | | | | | | | | | |
| | | | | | | | | | | |
| | | | | | | | | | | |
| | | | | | | | | | | |
| | | | | | | | | | | |
| | | | | | | | | | | |
| | | | | | | | | | | |
| | | | | | | | | | | |
| See Notes to Financial Statements | | | | | | |
| Matisse Discounted Bond CEF Strategy | | | | |
| | | | | | | | | |
Statement of Cash Flows | | | | | |
| | | | | | | | | |
| For the fiscal year ended March 31, 2023 | | | |
| | | | | | | | | |
| Cash flows from operating activities: | | | | | |
| | Net decrease in net assets resulting from operations | $ | (1,671,339) |
| | | | | | | | | |
| | Adjustments to reconcile net decrease in net assets resulting | |
| | from operations to net cash used in operating activities: | | |
| | | Purchases of investments | | | | (37,680,280) |
| | | Net proceeds from short term investments | | 21,625 |
| | | Proceeds from sale of investments | | | 22,274,537 |
| | | Net realized loss from investments | | | 1,327,372 |
| | | Change in net unrealized depreciation on investments | 2,377,230 |
| | | | | | | | | |
| | Changes in Assets: | | | | | |
| | | Decrease in investments sold receivable | | 432,809 |
| | | Increase in fund shares sold receivable | | | (99,531) |
| | | Increase in dividend and interest receivable | | (40,949) |
| | | Increase prepaid registration and filing expenses | | (1,979) |
| | | | | | | | | |
| | Changes in Liabilities: | | | | | |
| | | Decrease in payable for securities purchased | | (352,900) |
| | | Increase in interest expense | | | | 16,174 |
| | | Decrease accrued advisory fees | | | (3,522) |
| | | Decrease in professional fees | | | (22,387) |
| | | Decrease in shareholder fulfillment expenses | | (1,971) |
| | | Increase in custody fees | | | | 924 |
| | | Increase in compliance fees | | | | 2,387 |
| | | Increase in trustee fees and meeting expenses | | 39 |
| | | Increase in security pricing fees | | | 271 |
| | | Increase accrued administration fees | | | 39 |
| | | Decrease accrued insurance fees | | | (283) |
| | | Decrease accrued miscellaneous expenses | | (63) |
| | | Increase accrued fund accounting fees | | | 13 |
| | Net cash used in operating activities | | | | (13,421,784) |
| | | | | | | | | |
| Cash flows provided by financing activities: | | | | |
| | | | | | | | | |
| | Fund shares sold | | | | | | 22,869,039 |
| | Fund shares redeemed | | | | | (14,139,607) |
| | Distributions paid | | | | | | (110,731) |
| | Net proceeds borrowed from broker | | | | 4,683,175 |
| | Net cash provided by financing activities | | | 13,301,876 |
| | | | | | | | | |
| | Net decrease in cash and cash equivalents | | | (119,908) |
| | | | | | | | | |
| Cash & Cash Equivalents: | | | | | | |
| | | | | | | | | |
| | Beginning of year | | | | | | 8,282 |
| | End of year | | | | | $ | (111,626) |
| | | | | | | | | |
| Non-cash flow financing activity | | | | | |
| | Reinvested dividends and distributions | | | $ | 2,480,925 |
| | Cash paid during the year for interest expense | | $ | 83,104 |
| | | | | | | | | |
| See Notes to Financial Statements | | | | | |
| | | | | | | | | |
| Matisse Discounted Bond CEF Strategy | | | | | | | |
| | | | | | | | | | | | |
| Financial Highlights | | | | | | | |
| | | | | | | | | | | | |
| For a share outstanding during the period | | Institutional Class Shares |
| or fiscal year ended March 31, | | 2023 | | 2022 | | 2021 | (f) |
| | | | | | | | | | | | |
| Net Asset Value, Beginning of Period | | $
| 11.29 | | $
| 12.43 | | $
| 10.00 | |
| | | | | | | | | | | | |
| Income from Investment Operations | | | | | | | |
| Net investment income (e) | | 0.55 | | 0.32 | | 0.51 | |
| Net realized and unrealized gain (loss) | | | | | | | |
| | on investments | | (1.29) | | (0.39) | | 2.56 | |
| | | | | | | | | | | | |
| Total from Investment Operations | | (0.74) | | (0.07) | | 3.07 | |
| | | | | | | | | | | | |
| Less Distributions: | | | | | | | |
| Dividends (from net investment income) | | (0.57) | | (0.52) | | (0.64) | |
| Capital gains | | | (0.09) | | (0.55) | | - | |
| Return of capital | | (0.07) | | - | | - | |
| | | | | | | | | | | | |
| Total Distributions | | (0.73) | | (1.07) | | (0.64) | |
| | | | | | | | | | | | |
| Net Asset Value, End of Period | | $
| 9.82 | | $
| 11.29 | | $
| 12.43 | |
| | | | | | | | | | | | |
| Total Return | | | (6.27)% | | (1.02)% | | 31.34% | (c) |
| | | | | | | | | | | | |
| Net Assets, End of Period (in thousands) | | $
| 39,133 | | $
| 32,185 | | $
| 24,642 | |
| | | | | | | | | | | | |
| Ratios of: | | | | | | | | | |
| Gross Expenses to Average Net Assets (d)(h) | | 1.54% | | 1.38% | | 2.00% | (b) |
| Net Expenses to Average Net Assets (d)(h) | | 1.26% | | 0.99% | | 1.00% | (b) |
| Net Investment Income to Average | | | | | | | |
| | 5.49% | | 2.56% | | 4.71% | (b) |
| | | | | | | | | | | | |
| Portfolio turnover rate | | 57.99% | | 70.40% | | 37.27% | (c) |
| | | | | | | | | | | | |
| | | | | | | | | | | | |
| (a) | Recognition of net investment income by the Fund is affected by the timing of declaration of dividends by the underlying investment companies in which the Fund invests. | |
| (b) | Annualized. | | | | | | | | |
| (c) | Not annualized. | | | | | | | |
| (d) | Includes interest expense of 0.27%, 0.00%(g), and 0.01% for the fiscal years/period ended March 31, 2023, 2022, and 2021, respectively. | |
| (e) | Calculated using the average shares method. | | | | | | |
| (f) | For the period April 30, 2020 (Date of Initial Public Investment) through March 31, 2021. | |
| (g) | Less than 0.01% of average net assets. | | | | | | | |
| (h) | The expenses of the underlying funds are excluded from the Fund's expense ratio. | | |
| | | | | | | | | | | | |
| | | | | | | | | | | | |
| | | | | | | | | | | | |
| See Notes to Financial Statements | | | | | | | |
| | | | | | | | | | | | |
Matisse Discounted Bond CEF Strategy
Notes to Financial Statements
1. Organization and Significant Accounting Policies
The Matisse Discounted Bond CEF Strategy (“Fund”) is a series of the Starboard Investment Trust (“Trust”). The Trust is organized as a Delaware statutory trust and is registered under the Investment Company Act of 1940, as amended (the “1940 Act”), as an open-end management investment company. The Fund is a separate diversified series of the Trust.
The Fund’s investment advisor, Deschutes Portfolio Strategies, LLC, dba Matisse Capital, (the “Advisor”), seeks to achieve the Fund’s investment objective of total return with an emphasis on providing current income by principally investing in unaffiliated closed-end funds that are registered under the Investment Company Act of 1940. The Fund will invest, under normal circumstances, at least 80% of its net assets, plus any borrowing for investment purposes, in discounted closed-end funds that primarily invest in bonds.
The following is a summary of significant accounting policies consistently followed by the Fund. The policies are in conformity with accounting principles generally accepted in the United States of America (“GAAP”). The Fund follows the accounting and reporting guidance in the Financial Accounting Standards Board (“FASB”) Accounting Standards Codification Topic 946 “Financial Services – Investment Companies,” and Financial Accounting Standards Update (“ASU”) 2013-08.
Investment Valuation
The Fund’s investments in securities are carried at fair value. Securities listed on an exchange or quoted on a national market system are valued at the last sales price as of 4:00 p.m. Eastern Time. Securities traded in the NASDAQ over-the- counter market are generally valued at the NASDAQ Official Closing Price. Other securities traded in the over-the-counter market and listed securities for which no sale was reported on that date are valued at the mean of the most recent bid and ask prices. Instruments with maturities of 60 days or less are valued at amortized cost, which approximates market value. Investments in open-end investment companies are valued at their respective net asset values as reported by such investment companies. Securities and assets for which representative market quotations are not readily available (e.g., if the exchange on which the security is principally traded closes early or if trading of the particular security is halted during the day and does not resume prior to the Fund’s net asset value calculation) or which cannot be accurately valued using the Fund’s normal pricing procedures are valued at fair value as determined in good faith under policies approved by the Trustees. A security’s “fair value” price may differ from the price next available for that security using the Fund’s normal pricing procedures. The shares of many closed-end investment companies, after their initial public offering, frequently trade at a price per share, which is different than the net asset value per share. The difference represents a market premium or market discount of such shares. There can be no assurances that the market discount or market premium on shares of any closed- end investment company purchased by the Funds will not change.
Fair Value Measurement
Various inputs are used in determining the value of the Fund's investments. These inputs are summarized in the three broad levels listed below:
Level 1: Unadjusted quoted prices in active markets for identical securities
Level 2: Other significant observable inputs (including quoted prices for similar securities, interest rates, credit risk, etc.)
Level 3: Significant unobservable inputs (including the Fund’s own assumptions in determining fair value of investments)
The availability of observable inputs can vary from security to security and is affected by a wide variety of factors, including, for example, the type of security, whether the security is new and not yet established in the marketplace, the liquidity of markets, and other characteristics particular to the security. To the extent that valuation is based on models or inputs that are less observable or unobservable in the market, the determination of fair value requires more judgment. Accordingly, the degree of judgment exercised in determining fair value is greatest for instruments categorized in Level 3.
The inputs used to measure fair value may fall into different levels of the fair value hierarchy. In such cases, for disclosure purposes, the level in the fair value hierarchy within which the fair value measurement falls in its entirety, is determined based on the lowest level input that is significant to the fair value measurement in its entirety.
The inputs or methodology used for valuing securities are not necessarily an indication of the risk associated with investing in those securities. The following table summarizes the inputs as of March 31, 2023, for the Fund’s investments measured at fair value:
(Continued)
5. Federal Income Tax
Distributions are determined in accordance with Federal income tax regulations, which may differ from GAAP, and, therefore, may differ significantly in amount or character from net investment income and realized gains for financial reporting purposes. The general ledger is adjusted for permanent book/tax differences to reflect tax character but is not adjusted for temporary differences.
Management has reviewed the Fund’s tax positions to be taken on the federal income tax returns during the open period/year ended March 31, 2021 through March 31, 2023 and determined that the Fund does not have a liability for uncertain tax positions. The Fund recognizes interest and penalties, if any, related to unrecognized tax benefits as income tax expense in the Statement of Operations. During the fiscal year, the Fund did not incur any interest or penalties.
Distributions during the years ended were characterized for tax purposes as follows:
| | March 31, 2023
| March 31, 2022 |
Ordinary Income
| | $1,528,962 | $1,933,501 |
| | 260,053 | - |
| Tax-Exempt Income | | 485,647 | 204,237 |
| Long-Term Capital Gain | | 316,994 | 572,635 |
| Total Distribution | | $2,591,656 | $2,710,373 |
The following reclassification relates primarily to differing book/tax treatment of taxable overdistributions and has no impact on the net assets of the Fund:
| $1,127 |
Paid in Capital
| (1,127) |
Matisse Discounted Bond CEF Strategy
Notes to Financial Statements
| Cost of Investments | $ | |
| | |
| Unrealized Appreciation | | 659,455 |
| Unrealized Depreciation | | (4,162,329) |
| Net Unrealized Depreciation | $ | (3,502,874) |
| | |
|
| Capital Loss Carryforward | | (1,293,696) |
| Accumulated Losses | $ | (4,796,570) |
| | | |
The difference between book-basis and tax-basis unrealized appreciation and depreciation is primarily attributable to tax deferral of losses on wash sales.
Capital Loss Carryforwards Accumulated capital losses noted above represent net capital loss carryovers as of March 31, 2023 that are available to offset future realized capital gains, if any, and thereby reduce future taxable gain distributions. Fund has a capital loss carryforward of $1,293,696, of which $598,335 is short-term in nature and $695,361 is long-term in nature. The capital loss carryforwards have no expiration date.
6. Risks
Control of Closed-End Funds Risk. Although the Fund and the Advisor will evaluate regularly each closed-end fund in which the Fund invests to determine whether its investment program is consistent with the Fund’s investment objective, the Advisor will not have any control over the investments made by a closed-end fund. The investment advisor to each closed-end fund may change aspects of its investment strategies at any time. The Advisor will not have the ability to control or otherwise influence the composition of the investment portfolio of a closed-end fund.
Convertible Securities Risk. Convertible securities subject the Fund to the risks associated with both fixed- income securities and equity securities. The risks of fixed income securities and equity securities are described below. If a convertible security’s investment value is greater than its conversion value, its price will likely increase when interest rates fall and decrease when interest rates rise. If the conversion value exceeds the investment value, the price of the convertible security will tend to fluctuate directly with the price of the underlying equity security.
COVID-19 and Other Infectious Illnesses Risk. The outbreak of an infectious respiratory illness caused by a novel coronavirus known as COVID-19 has resulted in travel restrictions, closed international borders, enhanced health screenings at ports of entry and elsewhere, disruption of and delays in healthcare service preparation and delivery, prolonged quarantines, cancellations, supply chain disruptions, and lower consumer demand, as well as general concern and uncertainty. The impact of COVID-19, and other infectious illness outbreaks that may arise in the future, could adversely affect the economies of many countries or the entire global economy, individual issuers and capital markets in ways that cannot necessarily be foreseen. In addition, the impact of infectious illnesses in emerging market countries may be greater due to generally less established healthcare systems. Public health crises caused by the COVID-19 outbreak may exacerbate other pre-existing political, social and economic risks in certain countries or globally. As such, issuers of debt securities with operations, productions, offices, and/or personnel in (or other exposure to) areas affected with the virus may experience significant disruptions to their business and/or holdings. The potential impact on the credit markets may include market illiquidity, defaults and bankruptcies, among other consequences, particularly on issuers in the airline, travel and leisure and retail sectors. The extent to which COVID-19 will affect the Fund, the Fund’s service providers’ and/or issuer’s operations and results will depend on future developments, which are highly uncertain and cannot be predicted, including new information that may emerge concerning the severity of COVID-19 and the actions taken to contain COVID-19. Economies and financial markets throughout the world are becoming increasingly interconnected. As a result, whether or not the Fund invests in securities of issuers located in or with significant exposure to countries experiencing economic, political and/or financial difficulties, the value and liquidity of the Fund’s investments may be negatively affected by such events. If there is a significant decline in the value of the Fund’s portfolio, this may impact the Fund’s asset coverage levels for certain kinds of derivatives and other portfolio transactions. The duration of the COVID-19 outbreak and its impact on the global economy cannot be determined with certainty.
(Continued)
Matisse Discounted Bond CEF Strategy
Notes to Financial Statements
Credit Risk. Credit risk is the possibility that an issuer may default on a security by failing to pay interest or principal when due. If an issuer defaults, a closed-end fund will lose money. Many fixed income securities receive credit ratings from NRSROs, which assign ratings to securities by assessing the likelihood of issuer default. Lower credit ratings correspond to higher credit risk. Fixed income securities generally compensate for greater credit risk by paying interest at a higher rate. The difference between the yield of a security and the yield of a U.S. Treasury security with a comparable maturity (the spread) measures the additional interest paid for risk. Spreads may increase generally in response to adverse economic or market conditions. A security’s spread may also increase if the security’s rating is lowered or the security is perceived to have an increased credit risk. An increase in the spread will cause the price of the security to decline.
Cybersecurity Risk. As part of its business, the Advisor processes, stores, and transmits large amounts of electronic information, including information relating to the transactions of the Fund. The Advisor and the Fund are therefore susceptible to cybersecurity risk. Cyber-attacks include, among other behaviors, stealing or corrupting data maintained online or digitally, denial of service attacks on websites, the unauthorized release of confidential information and causing operational disruption. Successful cyber-attacks against, or security breakdowns of, the Fund or its advisor, custodians, fund accountant, fund administrator, transfer agent, pricing vendors and/or other third-party service providers may adversely impact the Fund and its shareholders. For instance, cyber-attacks may interfere with the processing of shareholder transactions, impact the Fund’s ability to calculate its NAV, cause the release of private shareholder information or confidential Fund information, impede trading, cause reputational damage, and subject the Fund to regulatory fines, penalties or financial losses, reimbursement or other compensation costs, and/or additional compliance costs. The Fund also may incur substantial costs for cybersecurity risk management in order to guard against any cyber incidents in the future. The Fund and its shareholders could be negatively impacted as a result.
Derivatives Risk. The closed-end funds held by the Fund may use derivative instruments, which derive their value from the value of an underlying security, currency, or index. The closed-end fund’s use of derivatives may involve risks different from, or greater than, the risks associated with investing in more traditional investments, such as stocks and bonds. Derivatives can be highly complex and may perform in ways unanticipated by the closed-end fund’s investment advisor and may not be available at the time or price desired. The closed-end funds’ use of derivatives involves the risk that the other party to the derivative contract will fail to make required payments or otherwise to comply with the terms of the contract. In the event the counterparty to a derivative instrument becomes insolvent, the closed-end fund potentially could lose all or a large portion of its investment in the derivative instrument. Derivatives transactions can create investment leverage and may be highly volatile, and the closed-end fund could lose more than the amount it invests. In addition, derivatives transactions can increase the closed-end fund’s transaction costs. Derivatives may be difficult to value and highly illiquid, and the closed- end fund may not be able to close out or sell a derivative position at a particular time or at an anticipated price. Derivative positions may also be improperly executed or constructed. Use of derivatives may affect the amount the timing and the character of distributions to shareholders and, therefore, may increase the amount of taxes payable by shareholders.
When a closed-end fund enters into a derivatives transaction as a substitute for or alternative to a direct cash investment, the closed-end fund is exposed to the risk that the derivative transaction may not provide a return that corresponds precisely or at all with that of the underlying investment.
The regulation of the derivatives markets has increased over the past several years and additional future regulation of the derivatives markets may make derivatives more costly, may limit the availability or liquidity of derivatives, or may otherwise adversely affect the value or performance of derivatives. Any such adverse developments could impair the effectiveness of a closed-end fund’s derivatives transactions and cause a closed-end fund to lose value. For instance, in December 2015, the SEC proposed a new rule that would change the regulation of the use of derivatives by registered investment companies. If adopted as proposed, these regulations could significantly limit or impact a closed-end fund’s ability to invest in derivatives and other instruments, limit a closed-end fund’s ability to employ certain strategies that use derivatives, and adversely affect a closed-end fund’s performance, efficiency in implementing its strategy, liquidity and ability to pursue its investment objective.
Equity Securities Risk. Fluctuations in the value of equity securities will cause the NAV of the Fund to fluctuate. Equity securities may decline in price if the issuer fails to make anticipated dividend payments. Common stock is subject to greater dividend risk than preferred stocks or debt instruments of the same issuer. In addition, equity securities have experienced significantly more volatility in returns than other asset classes.
(Continued)
Matisse Discounted Bond CEF Strategy
Notes to Financial Statements
● Preferred Stock Risks. Generally, preferred stockholders have no voting rights with respect to the issuing company unless certain events occur. In addition, preferred stock will be subject to greater credit risk than debt instruments of an issuer and could be subject to interest rate risk like fixed income securities, as described below. An issuer’s board of directors is generally not under any obligation to pay a dividend (even if dividends have accrued) and may suspend payment of dividends on preferred stock at any time. There is also a risk that the issuer will default and fail to make scheduled dividend payments on the preferred stock held by the closed-end funds.
Fixed-Income Securities Risk. Fixed income risk factors include credit risk (the debtor may default) and prepayment risk (the debtor may pay its obligation early or later than expected, potentially reducing the amount of interest payments or extending time to principal repayment). These risks could affect the value of a particular investment possibly causing the Fund's share price and total return to be reduced and fluctuate more than other types of investments. When the closed- end fund invests in fixed income securities the value of your investment in the Fund will fluctuate with changes in interest rates. Typically, a rise in interest rates causes a decline in the value of fixed income securities. In general, the market price of debt securities with longer maturities will increase or decrease more in response to changes in interest rates than shorter-term securities. If the U.S. Federal Reserve’s Federal Open Market Committee raises the federal funds interest rate target, interest rates across the U.S. financial system may rise. However, the magnitude of rate changes across maturities and borrower sectors is uncertain. Rising rates may decrease liquidity and increase volatility, which may make portfolio management more difficult and costly to the Fund and its shareholders. Additionally, default risk increases if issuers must borrow at higher rates. Generally, these changing market conditions may cause the Fund’s share price to fluctuate or decline more than other types of investments.
Foreign Securities Risk. The Fund may invest in foreign securities. Foreign securities involve investment risks different from those associated with domestic securities. Changes in foreign economies and political climates are more likely to affect the Fund than investments in domestic securities. The value of foreign currency denominated securities or foreign currency contracts is affected by the value of the local currency relative to the U.S. dollar. There may be less government supervision of foreign markets, resulting in non-uniform accounting practices and less publicly available information about issuers of foreign currency denominated securities. The value of foreign investments may be affected by changes in exchange control regulations, application of foreign tax laws (including withholding tax), changes in governmental administration or economic or monetary policy (in this country or abroad), or changed circumstances in dealings between nations. In addition, foreign brokerage commissions, custody fees, and other costs of investing in foreign securities are generally higher than in the United States. Investments in foreign issues could be affected by other factors not present in the United States, including expropriation, armed conflict, confiscatory taxation, and potential difficulties in enforcing contractual obligations.
ADR Risk. ADRs may be subject to some of the same risks as direct investments in foreign companies, which includes international trade, currency, political, regulator, and diplomatic risks. In a sponsored ADR arrangement, the foreign issuer assumes the obligation to pay some or all of the depository’s transaction fees. Under an unsponsored ADR arrangement, the foreign issuer assumes no obligations and the depository’s transaction fees are paid directly by the ADR holders. Because unsponsored ADR arrangements are organized independently and without the cooperation of the issuer of the underlying securities, available information concerning the foreign issuer may not be as current as for sponsored ADRs and voting rights with respect to the deposited securities are not passed through.
Fund of Funds Risk. The Fund is a “fund of funds.” The term “fund of funds” is typically used to describe investment companies, such as the Fund, whose principal investment strategy involves investing in other investment companies, including closed-end funds and money market mutual funds. Investments in other funds subject the Fund to additional operating and management fees and expenses. For instance, investors in the Fund will indirectly bear fees and expenses charged by the funds in which the Fund invests, in addition to the Fund’s direct fees and expenses. The Fund’s performance depends in part upon the performance of the funds’ investment advisor, the strategies and instruments used by the funds, and the Advisor's ability to select funds and effectively allocate Fund assets among them.
General Investment Risks. All investments in securities and other financial instruments involve a risk of financial loss. No assurance can be given that the Fund's investment program will be successful. Investors should carefully review the descriptions of the Fund's investments and their risks described in this prospectus and the Fund’s Statement of Additional Information.
Interest Rate Risk. Interest rate risk is the risk that fixed income prices overall will decline over short or even long periods of time due to rising interest rates. Securities with longer maturities and durations tend to be more sensitive to interest rates than securities with shorter maturities and durations. For example, (a) if interest rates go up by 1.0%, the price of a 4% coupon bond will decrease by approximately 1.0% for a bond with 1 year to maturity and approximately 4.4% for a bond with 5 years to maturity and (b) the price of a portfolio with a duration of 5 years would be expected to fall approximately 5.0% if interest rates rose by 1.0% and a portfolio with a duration of 2 years would be expected to fall approximately 2.0% if interest rates rose by 1.0%.
(Continued)
Matisse Discounted Bond CEF Strategy
Notes to Financial Statements
Investment Advisor Risk. The Advisor’s ability to choose suitable investments has a significant impact on the ability of the Fund to achieve its investment objectives.
Junk Bond Risk. Lower-quality bonds, known as "high yield" or "junk" bonds, present a significant risk for loss of principal and interest. These bonds offer the potential for higher return, but also involve greater risk than bonds of higher quality, including an increased possibility that the bond's issuer, obligor, or guarantor may not be able to make its payments of interest and principal (credit quality risk). If that happens, the value of the bond may decrease, the Fund's share price may decrease, and its income distribution may be reduced. An economic downturn or period of rising interest rates (interest rate risk) could adversely affect the market for these bonds and reduce a closed-end fund’s ability to sell its bonds (liquidity risk). The lack of a liquid market for these bonds could decrease the Fund's share price.
Leverage Risk. The Fund may leverage or borrow money from banks to buy securities and pledge its assets in connection with the borrowing. Use of leverage tends to magnify increases and decreases in the Fund’s returns and leads to a more volatile share price. The Fund will also incur borrowing costs in connection with its use of leverage. If the interest expense of the borrowing is greater than the return on the securities bought, the use of leverage will decrease the return to shareholders in the Fund. Leveraging by both the Fund and the underlying closed-end funds, which often employ leverage, will expose the Fund to a relatively high level of leverage risk. There can be no assurance that a leveraging strategy will be successful during any period in which it is employed.
Limited History of Operations Risk. The Fund has a limited history of operations for investors to evaluate.
Loans Risk. Investments in loans may subject the Fund to heightened credit risks because loans may be highly leveraged and susceptible to the risks of interest deferral, default and/or bankruptcy. An economic downturn would generally lead to a higher non-payment rate, and a loan may lose significant market value before a default occurs. Moreover, any specific collateral used to secure a collateralized loan may decline in value or become illiquid, which would adversely affect the loan’s value. Unlike the securities markets, there is no central clearinghouse for loan trades and the loan market has not established enforceable settlement standards or remedies for failure to settle. Therefore, portfolio transactions in loans may have uncertain settlement time periods.
Management Style Risk. Different types of securities tend to shift into and out of favor with investors depending on market and economic conditions. The returns from the types of investments purchased by the Fund (e.g., closed-end funds which pay regular periodic cash distributions) may at times be better or worse than the returns from other types of funds. Each type of investment tends to go through cycles of performing better or worse than the market in general. The performance of the Fund may thus be better or worse than the performance of funds that focus on other types of investments, or that have a broader investment style.
Market Risk. Market risk refers to the possibility that the value of securities held by the Fund may decline due to daily fluctuations in the market. Market prices for securities change daily as a result of many factors, including developments affecting the condition of both individual companies and the market in general. The price of a security may even be affected by factors unrelated to the value or condition of its issuer, such as changes in interest rates, economic and political conditions, and general market conditions. The Fund’s performance per share will change daily in response to such factors.
Money Market Mutual Fund Risk. The Fund may invest in money market mutual funds in order to manage its cash component. An investment in a money market mutual fund is not insured or guaranteed by a Federal Deposit Insurance Corporation or any other government agency. Although such funds seek to preserve the value of the Fund’s investment at $1.00 per share, it is possible to lose money by investing in a money market mutual fund.
Portfolio Turnover Risk. The Advisor will sell portfolio securities when it is in the interests of the Fund and its shareholders to do so without regard to the length of time they have been held. As portfolio turnover may involve paying brokerage commissions and other transaction costs, there could be additional expenses for the Fund and those expenses may adversely affect the Fund’s performance. High rates of portfolio turnover may also result in the realization of short-term capital gains and losses. Any distributions resulting from such gains will be considered ordinary income for federal income tax purposes.
(Continued)
Matisse Discounted Bond CEF Strategy
Notes to Financial Statements
As of March 31, 2023
Prepayment Risk. Prepayment risk occurs when the issuer of a security can repay principal prior to the security’s maturity. This is more likely to occur when interest rates fall. Prepayment may shorten the effective maturities of these securities, reducing their yield and market value. The prepayment of principal can adversely affect the return of the closed-end fund since it may have to reinvest the proceeds in securities that pay a lower interest rate.
Quantitative Model Risk. Securities or other investments selected using quantitative methods may perform differently from the market as a whole. There can be no assurance that these methodologies will enable the Fund to achieve its objective.
7. Beneficial Ownership
The beneficial ownership, either directly or indirectly, of 25% or more of the voting securities of a fund creates a presumption of control of a fund, under Section 2(a)(9) of the Investment Company Act of 1940. As of March 31, 2023, Charles Schwab & Co., Inc. held 72.92% of the Fund. The Fund has no knowledge as to whether all or any portion of the shares of record owned by Charles Schwab & Co., Inc. are also owned beneficially.
8. Commitments and Contingencies
Under the Trust’s organizational documents, its officers and Trustees are indemnified against certain liabilities arising out of the performance of their duties to the Fund. In addition, in the normal course of business, the Trust entered into contracts with its service providers, on behalf of the Fund, and others that provide for general indemnifications. The Fund’s maximum exposure under these arrangements is unknown, as this would involve future claims that may be made against the Fund. The Fund expects risk of loss to be remote.
9. Borrowings
The Fund established a borrowing agreement with Interactive Brokers LLC for investment purposes subject to the limitations of the 1940 Act for borrowings by registered investment companies.
Interest is based on the Federal Funds rate plus 1.50% on the first $100,000, the Federal Funds rate plus 1.00% on the next $900,000, the Federal Funds rate plus 0.75% on balances between $1,000,000 and $50,000,000, and the Federal Funds rate plus 0.50% on balances greater than $50,000,000. During period of September 7, 2022, when the fund began its borrowing, through the fiscal year ended March 31, 2023, the average borrowing was $2,018,948, the average interest rate during was 4.70%, and the maximum amount borrowing was $5,844,007.
Interest expense is charged directly to the Fund based upon actual amounts borrowed by the Fund. The Fund had $4,683,175 in borrowings outstanding as of the fiscal year ended March 31, 2023. Securities purchased with borrowings have been pledged as collateral for amounts due to broker. Total interest expense for the fiscal year was $99,278 as reflected in the Statement of Operations.
10. Subsequent Events
Ashley Lanham resigned as an Officer to the Starboard Investment Trust effective May 19, 2023. Pete McCabe, COO at The Nottingham Company, has replaced Ms. Lanham as the Treasurer, Principal Accounting Officer and Principal Financial Officer of the Trust.
In accordance with GAAP, management has evaluated the need for disclosures and/or adjustments resulting from subsequent events through the date of issuance of these financial statements. Management has concluded there are no additional matters, other than those noted above, requiring recognition or disclosure.
REPORT OF INDEPENDENT REGISTERED PUBLIC ACCOUNTING FIRM
To the Shareholders of Matisse Discounted Bond CEF Strategy and the Board of Trustees of Starboard Investment Trust
Opinion on the Financial Statements
We have audited the accompanying statement of assets and liabilities, including the schedule of investments, of Starboard Investment Trust comprising Matisse Discounted Bond CEF Strategy (the “Fund”) as of March 31, 2023, the related statements of operations, changes in net assets, and cash flows, the related notes, and the financial highlights for the year then ended (collectively referred to as the “financial statements”). In our opinion, the financial statements present fairly, in all material respects, the financial position of the Fund as of March 31, 2023, the results of its operations, the changes in net assets, its cash flows, and the financial highlights for the year then ended, in conformity with accounting principles generally accepted in the United States of America.
The Fund’s financial statements and financial highlights for the year ended March 31, 2022, and prior, were audited by other auditors whose report dated May 30, 2022, expressed an unqualified opinion on those financial statements and financial highlights.
Basis for Opinion
These financial statements are the responsibility of the Fund’s management. Our responsibility is to express an opinion on the Fund’s financial statements based on our audit. We are a public accounting firm registered with the Public Company Accounting Oversight Board (United States) (“PCAOB”) and are required to be independent with respect to the Fund in accordance with the U.S. federal securities laws and the applicable rules and regulations of the Securities and Exchange Commission and the PCAOB.
We conducted our audit in accordance with the standards of the PCAOB. Those standards require that we plan and perform the audit to obtain reasonable assurance about whether the financial statements are free of material misstatement whether due to error or fraud.
Our audit included performing procedures to assess the risks of material misstatement of the financial statements, whether due to error or fraud, and performing procedures that respond to those risks. Such procedures included examining, on a test basis, evidence regarding the amounts and disclosures in the financial statements. Our procedures included confirmation of securities owned as of March 31, 2023, by correspondence with the custodian. Our audit also included evaluating the accounting principles used and significant estimates made by management, as well as evaluating the overall presentation of the financial statements. We believe that our audit provides a reasonable basis for our opinion.
We have served as the Fund’s auditor since 2023.
COHEN & COMPANY, LTD.
Philadelphia, Pennsylvania
June 7, 2023
C O H E N & C O M P A N Y , L T D .
800.229.1099 | 866.818.4538 fa x | cohencpa.com
Registered with the Public Company Accounting Oversight Board
Matisse Discounted Bond CEF Strategy
Additional Information
(Unaudited)
1. Proxy Voting Policies and Voting Record
A copy of the Advisor’s Proxy Voting and Disclosure Policy is included as Appendix B to the Fund’s Statement of Additional Information and is available, without charge, upon request, by calling 800-773-3863, and on the website of the Securities and Exchange Commission (“SEC”) at http://www.sec.gov. Information regarding how the Fund voted proxies relating to portfolio securities during the most recent 12-month period ended June 30 is available (1) without charge, upon request, by calling the Fund at the number above and (2) on the SEC’s website at http://www.sec.gov.
2. Quarterly Portfolio Holdings
The Fund files its complete schedule of portfolio holdings with the SEC for the first and third quarters of each fiscal year on Form N-PORT. The Fund’s Forms N-PORT are available on the SEC’s website at http://www.sec.gov. You may also obtain copies without charge, upon request, by calling the Fund at 800-773-3863.
3. Tax Information
We are required to advise you within 60-days of the Fund’s fiscal year-end regarding federal tax status of certain distributions received by shareholders during each fiscal year. The following information is provided for the Fund’s fiscal year ended March 31, 2023.
During the fiscal year ended March 31, 2023, the Fund paid $1,528,962 in ordinary income distributions, $260,053 as return of capital, $485,647 in tax-exempt income distributions, and $316,994 in long-term capital gain distributions.
Dividend and distributions received by retirement plans such as IRAs, Keogh-type plans, and 403(b) plans need not be reported as taxable income. However, many retirement plans may need this information for their annual information meeting.
4. Schedule of Shareholder Expenses
As a shareholder of the Fund, you incur ongoing costs, including management fees and other Fund expenses. This Example is intended to help you understand your ongoing costs (in dollars) of investing in the Fund and to compare these costs with the ongoing costs of investing in other mutual funds.
The Example is based on an investment of $1,000 invested at the beginning of the period and held for the entire period from October 1, 2022 through March 31, 2023.
Actual Expenses – The first line of the table below provides information about actual account values and actual expenses. You may use the information in this line, together with the amount you invested, to estimate the expenses that you paid over the period. Simply divide your account value by $1,000 (e.g., an $8,600 account value divided by $1,000 = 8.6), then multiply the result by the number in the first line under the heading entitled “Expenses Paid During Period” to estimate the expenses you paid on your account during this period.
Hypothetical Example for Comparison Purposes – The second line of the table below provides information about hypothetical account values and hypothetical expenses based on the Fund’s actual expense ratio and an assumed rate of return of 5% per year before expenses, which is not the Fund’s actual return. The hypothetical account values and expenses may not be used to estimate the actual ending account balance or expenses you paid for the period. You may use this information to compare the ongoing costs of investing in the Fund and other funds. To do so, compare this 5% hypothetical example with the 5% hypothetical examples that appear in the shareholder reports of the other funds.
Please note that the expenses shown in the table are meant to highlight your ongoing costs only and do not reflect any transactional costs, such as sales charges (loads), redemption fees, or exchange fees. Therefore, the second line of the table is useful in comparing ongoing costs only and will not help you determine the relative total costs of owning different funds. In addition, if these transactional costs were included, your costs would have been higher.
(Continued)
Matisse Discounted Bond CEF Strategy
Additional Information
(Unaudited)
| Institutional Class Shares | Beginning Account Value October 1, 2022 | Ending Account Value March 31, 2023 | Expenses Paid During Period* |
Actual Hypothetical (5% annual return before expenses) | | | |
| $1,000.00 | $1,112.70 | $5.21 |
| $1,000.00 | $1,020.00 | $4.99 |
*Expenses, excluding interest expense, are equal to the average account value over the period multiplied by the Fund’s annualized net expense ratio of 0.99%, multiplied by the number of days in the initial period divided by the number of days in the fiscal year (to reflect the six-month period).
5. Information about Trustees and Officers
The business and affairs of the Fund and the Trust are managed under the direction of the Board of Trustees of the Trust. Information concerning the Trustees and officers of the Trust and Fund is set forth below. Generally, each Trustee and officer serves an indefinite term or until certain circumstances such as their resignation, death, or otherwise as specified in the Trust’s organizational documents. Any Trustee may be removed at a meeting of shareholders by a vote meeting the requirements of the Trust’s organizational documents. The Statement of Additional Information of the Fund includes additional information about the Trustees and officers and is available, without charge, upon request by calling the Fund toll-free at 800-773-3863. The address of each Trustee and officer, unless otherwise indicated below, is 116 South Franklin Street, Rocky Mount, North Carolina 27804. The Independent Trustees received aggregate compensation of $8,723 during the fiscal year ended March 31, 2023 from the Fund for their services to the Fund and Trust.
Name and
Date of Birth | Position
held with
Funds or Trust | Length
of Time Served | Principal Occupation
During Past 5 Years | Number of Portfolios in Fund Complex Overseen by Trustee | Other Directorships
Held by Trustee
During Past 5 Years |
| Independent Trustees |
James H. Speed, Jr.
(06/1953) | Chairman and Independent Trustee | Trustee since 7/09, Chair since 5/12 | Retired Executive/Private Investor | 13 | Independent Trustee of the Brown Capital Management Mutual Funds for all its series from 2001 to present, Centaur Mutual Funds Trust for all its series from 2009 to present, WST Investment Trust for all its series from 2013 to present, and Chesapeake Investment Trust for all its series from 2016 to present (all registered investment companies). Member of Board of Directors of Communities in Schools of N.C. from 2001 to present. Member of Board of Directors of Investors Title Company from 2010 to present. Member of Board of Directors of AAA Carolinas/Auto Club from 2011 to present. Previously, Independent Trustee of the Hillman Capital Management Trust from 2009 to 2021. Previously, Independent Trustee of the Leeward Investment Trust from 2018 to 2020. Previously, member of Board of Directors of M&F Bancorp Mechanics & Farmers Bank from 2009 to 2019. |
Theo H. Pitt, Jr.
(04/1936) | Independent Trustee | Since 9/10 | Senior Partner, Community Financial Institutions Consulting (financial consulting) since 1999. | 13 | Independent Trustee of Hillman Capital Management Investment Trust for all its series from 2000 to present, Chesapeake Investment Trust for all its series from 2002 to present, World Funds Trust for all its series from 2013 to present, ETF Opportunities Trust for all its series from 2019 to present, and Kingsham Parallel Income Trust form 2022 to present (all registered investment companies). Senior Partner of Community Financial Institutions Consulting from 1997 to present. Previously, Independent Trustee of the Leeward Investment Trust from 2011 to 2021. |
Michael G. Mosley*
(01/1953) | Independent Trustee | Since 7/10 | Owner of Commercial Realty Services (real estate) since 2004. | 13 | None. |
J. Buckley Strandberg
(03/1960) | Independent Trustee | Since 7/09 | President of Standard Insurance and Realty since 1982. | 13 | None. |
*Michael Mosley resigned as an Independent Trustees to the Starboard Investment Trust effective March 9, 2023.
(Continued)
Matisse Discounted Bond CEF Strategy
Additional Information
(Unaudited)
Name and
Date of Birth | Position held with
Funds or Trust | Length
of Time Served | Principal Occupation
During Past 5 Years |
| Officers |
Katherine M. Honey
(09/1973) | President and Principal Executive Officer | Since 05/15 | President of The Nottingham Company since 2018. EVP of The Nottingham Company from 2008 to 2018. |
Ashley H. Lanham** (03/1984) | Treasurer, Assistant Secretary, Principal Accounting Officer, and Principal Financial Officer | Since 05/15 | Managing Director of Fund Administration, The Nottingham Company since 2008. |
Tracie A. Coop
(12/1976) | Secretary | Since 12/19 | General Counsel, The Nottingham Company since 2019. Formerly, Vice President and Managing Counsel, State Street Bank and Trust Company from 2015 to 2019. |
Andrea M. Knoth
(09/1983) | Chief Compliance Officer | Since 06/2022 | Director of Compliance, The Nottingham Company since 2022. Formerly, Senior Fund Compliance Administrator, Ultimus Fund Solutions from 2019 to 2022. Formerly, Associate Director of Operational Compliance, Barings from 2018 to 2019. Formerly, Senior Fund Compliance Administrator, Gemini Fund Services from 2012 to 2018. |
**Ashley Lanham resigned as an Officer to the Starboard Investment Trust effective May 19, 2023. Pete McCabe, COO at The Nottingham Company, has replaced Ms. Lanham as the Treasurer, Principal Accounting Officer and Principal Financial Officer of the Trust.
6. Change of Independent Registered Public Accounting Firm
Effective March 6, 2023, BBD LLP (“BBD”) ceased to serve as the independent registered public accounting firm for the Starboard Investment Trust. The Audit Committee of the Board of Directors approved the replacement of BBD as a result of Cohen & Company, Ltd.’s (“Cohen”) acquisition of BBD’s investment management group. On March 9, 2023, the Audit Committee of the Board of Directors also recommended and approved the appointment of Cohen as the Fund’s independent registered public accounting firm for the fiscal year ending March 31, 2023.
(Continued)
Matisse Discounted Bond CEF Strategy
Additional Information
(Unaudited)
The reports of BBD, LLP on the Fund’s financial statements for the last fiscal year contained no adverse opinion or disclaimer of opinion and were not qualified or modified as to uncertainty, audit scope, or accounting principles.
During the Fund’s most recent fiscal year, and through March 9, 2023, there were no disagreements with BBD, LLP on any matter of accounting principles or practices, financial statement disclosure, or auditing scope or procedure, which disagreements, if not resolved to the satisfaction of BBD, LLP, would have caused them to make reference to the subject matter of the disagreements in connection with their reports on the Fund’s financial statements for such years. During the most recent fiscal year, and through March 9, 2023, there were no reportable events as defined in Item 304(a)(1)(v) of Regulation S-K promulgated by the SEC.
The Fund requested BBD, LLP to furnish them with a letter addressed to the SEC stating whether or not it agrees with the above statements. A copy of such letter will be filed as an Exhibit to the Form N-CSRs filing to be made on or before June 9, 2023.
7. Liquidity Risk Management Program
Rule 22e-4, or the “Liquidity Rule,” under the Investment Company Act of 1940 requires a mutual fund to adopt a liquidity risk management program (“Program”) and disclose information about the operation and effectiveness of its Program in its reports to shareholders.
Under the Program, each of the Fund’s portfolio investments are classified into one of four liquidity categories defined by the SEC: highly liquid, moderately liquid, less liquid, and illiquid. Liquidity classifications take into account a variety of market, trading, and investment factors, including the Fund’s reasonably anticipated trade size, and the Program Administrator has engaged a third-party vendor to assist with the classification of portfolio investments.
In accordance with the Liquidity Rule, the Program Administrator prepared, and the Fund’s Board of Trustees reviewed, a report regarding the operation and effectiveness of the Program for the period from December 1, 2021, through November 30, 2022. During the period, there were no liquidity events that materially impacted the Fund’s ability to timely meet redemptions without significantly diluting remaining investors’ interests. The report concluded that the Program remains reasonably designed to assess and manage the Fund’s liquidity risk, and that during the period the Program was implemented effectively.
Matisse Discounted Bond CEF Strategy
is a series of
The Starboard Investment Trust
For Shareholder Service Inquiries:
| For Investment Advisor Inquiries: |
| Nottingham Shareholder Services | Deschutes Portfolio Strategies |
| 116 South Franklin Street | 4949 Meadows Road |
Post Office Box 69 Rocky Mount, North Carolina 27802-0069 | Suite 200 Lake Oswego, Oregon 97035
|
Telephone:
800-773-3863 | Telephone:
503-210-3001 |
World Wide Web @:
ncfunds.com | World Wide Web @:
|