Paracorp Inc.
Item 1. REPORTS TO STOCKHOLDERS.
Annual Report
As of September 30, 2023
This report and the financial statements contained herein are submitted for the general information of the shareholders of the Sector Rotation Fund (the “Fund”). The Fund’s shares are not deposits or obligations of, or guaranteed by, any depository institution. The Fund’s shares are not insured by the FDIC, Federal Reserve Board or any other agency, and are subject to investment risks, including possible loss of principal amount invested. Neither the Fund nor the Fund’s distributor is a bank.
The Sector Rotation Fund is distributed by Capital Investment Group, Inc., Member FINRA/SIPC, 100 E. Six Forks Road, Suite 200, Raleigh, NC 27609. There is no affiliation between the Sector Rotation Fund, including its principals, and Capital Investment Group, Inc..
Table of Contents
| |
| Letter to Shareholders | ……………………………………………………………………………… | 1 |
| Performance Update | ……………………………………………………………………………… | 3 |
| Schedule of Investments | ……………………………………………………………………………… | 4 |
| Statement of Assets and Liabilities | ……………………………………………………………………………… | 5 |
| Statement of Operations | ……………………………………………………………………………… | 6 |
| Statements of Changes in Net Assets | ……………………………………………………………………………… | 7 |
| Notes to Financial Statements | ……………………………………………………………………………… | 9 |
| Additional Information | ……………………………………………………………………………… | 16 |
Statements in this Annual Report that reflect projections or expectations of future financial or economic performance of the Sector Rotation Fund (the “Fund”) and of the market in general and statements of the Fund’s plans and objectives for future operations are forward-looking statements. No assurance can be given that actual results or events will not differ materially from those projected, estimated, assumed or anticipated in any such forward-looking statements. Important factors that could result in such differences, in addition to the other factors noted with such forward-looking statements, include, without limitation, general economic conditions such as inflation, recession and interest rates. Past performance is not a guarantee of future results.
An investor should consider the investment objectives, risks, and charges and expenses of the Fund carefully before investing. The prospectus contains this and other information about the Fund. A copy of the prospectus is available at https://fundinfopages.com/NAVFX or by calling Shareholder Services at 800-773-3863. The prospectus should be read carefully before investing. |
For More Information on the Sector Rotation Fund:
See Our Web site @ ncfunds.com
or
Call Our Shareholder Services Group at 800-773-3863.
Letter to Investors
(Unaudited)
“Don’t be afraid to see what you see.” President Ronald Reagan
These days, it seems like people don’t always mean what they say or say what they mean — and I’m here to set the record straight. You might not like it, but changing the facts to fit our feelings leads us down a dangerous path.
So, let’s get straight to it.
Historically, economists have defined a recession as two consecutive quarters of significant economic decline, which is represented by declining real gross domestic product (“GDP”), which is a measurement of the total goods and services produced by the U.S. economy as reported on a quarterly basis. It’s been that way for as long as I can remember, and I’ve been on this earth quite a few years.
And according to that definition, we’re in a recession. On an annualized basis, U.S. GDP fell 1.6% in first quarter 2022 and 0.9% in the second quarter.
So why aren’t the headlines screaming that we’re in a recession and telling the stories of the working-class families who can’t make ends meet? Surely, you remember those stories (and images) from the last time we had a recession.
The Fed printed massive amounts of money during the pandemic and again more recently to provide aid to Ukraine. Just to be clear, “printing” money doesn’t just refer to physical cash. It can also refer to the money supply the Fed creates via a computer — i.e., the non-paper money it injects into the financial system.
Increasing the money supply in this way inevitably leads to inflation. When the government prints money, consumers have more cash to spend. If the amount of goods stays the same (or falls due to supply chain disruptions, cough cough), that extra cash drives up prices. As Milton Friedman said, “Inflation is caused by too much money chasing after too few goods.”
So here we are. I could break down the components for you, but I’m sure you already know what I’d say. You feel inflation when you fill up your gas tank; you feel inflation when you go to the grocery store. Wait until it’s time to pay your heating bills this winter. In some countries — like the United Kingdom — the situation is dire.
In 2021, the government officials called the increase in inflation “transitory” as opposed to systematic. Labor disruptions were limiting supply, they said, which increases demand and, thus, prices. Remember what I wrote about that in this letter a year ago?
“I said (mostly) hogwash to that. The government has good reason to pay the ‘transitory’ card: It created this mess! All of those bailout packages increased the money supply and diluted the value of each dollar in circulation.”
Hogwash it is, and here we are.
Now, to curtail the inflation it created, the government has increased the fed funds rate seven times in 2022 and five in 2023 thru September 30th 20231. That’s really hurting homebuyers. Buying a $400,000 home in 2021 — assuming you put 20% down — would give you a monthly payment of around $1,349 thanks to a 30-year fixed interest rate of about 3%. Today, that payment would be $2,348. And it’s only going to worsen.
I hope some of you listened in 2021when I wrote, “We will have inflation to contend with. A lot of inflation, in my opinion — so best to get those fixed-rate loans now.”
So, where are we headed? Well, the same pundits and economists who said inflation was transitory are now saying the housing market is strong.
Excuse me?
Once again, people don’t always mean what they say or say what they mean, and I’m going to set the record straight: The housing market is going to slow down significantly if not totally crash. It’s common sense, not economic tomfoolery. As interest rates rise, homes will become less affordable, and people will stop buying homes.
This could potentially lead to general economic mayhem, because at the same time, people with variable-rate mortgages will see their monthly costs increase. At first, they may stop buying unnecessary goods. Eventually, though, we believe many people will default on their mortgages.
It all sounds eerily familiar, doesn’t it? Well, at least there are no “too-big-to-fail” financial institutions on the brink of collapse.
Oh.
1 Federal Funds Rate History 1990 to 2023 – Forbes Advisor
Since the economy didn’t unfold the way many of the pundits thought it would, it was critical for the Advisor’s macro-economic forecast to be correct in 2022-2023. In 2022, the Advisor’s positions were not heavily weighted towards a “growth” stance as was the consensus forecast. This meant much of the tech-heavy sectors that lost the most in 2022 were trimmed. In 2023, the market forecast flipped to recession while the Advisor’s output was for growth and positioned the Fund’s portfolio accordingly.
The Fund had a positive net return of 17.32% for the one-year period thru September 30, 2023. This compares with its category (Mixed-Asset Target Allocation Growth Funds) which gained 13.15% during the same period. There were several sectors such as Information Technology (VGT) and Consumer Discretionary (VCR) that had a relative performance below that of the overall Fund but above category. However, the Fund plans to maintain a position in both sectors due to the historical performance both sectors have when an economy is coming out of a recession. The consumer staples (VDC) and health care sectors (VHT) both had a net positive total return however, both sectors underperformed both the overall Fund and category.
So, what are we in for in 2024 and beyond?
You heard it here first:
The most important number as we enter 2024 is not 270, which is the number of electoral college votes needed to win the presidency. The one number I will be focused on is 2.0. Why? Because that is the Federal Reserve’s inflation goal before it goes into a “pause” mode on interest rates2. As of September 30, 2023, the annual inflation rate is reported to be 3.70%3. Yes that’s way below the high of 2022 of 8.90%4, but it is nowhere near 2.0%. If I could ask Jay Powell, the Fed Chairman, one question it would be: Mr. Chairman is 2.9% considered 2.0%? Or is 2.0% your goal? His answer to that question would move markets dramatically. It would certainly impact how I allocated the Fund going forward.
I predict a top issue for the 2024 U.S. Presidential election will be the massive wealth gap in the country. Why? Two reasons: First, because Uncle Sam spent trillions of dollars in 2020-2022 during the Covid-19 pandemic. Where did that money go? Yes, money flows up very little of it trickles down. Second, inflation and higher interest rates pull money from the bottom and deliver it easy to the top.
Well, we can take COVID out of the equation. It appears to be finished. Yes, there will be new variants, and new calls for masking and lockdowns and vaccinations, but the American people have, for the most part, said “enough.”
But -- just as consumers began resuming activity in previously shut-down sectors — spending their pent-up savings on entertainment and travel — inflation took off. And now interest rates are rising. And people are worrying. I don’t know about you, but I’m hunkering down — more hamburgers, fewer steaks. More walks in the park, fewer movies.
In terms of investing, be careful. These are perhaps the most troubling times I’ve seen in recent years. The investments that satisfied investors over the past one to five years likely won’t satisfy investors over the next one to five years. That’s why I’m always looking at the economy and markets from five miles up. This broad view helps me identify sectors that show the strongest signs of growth over the next three to 12 months at any point in time.
As always, I appreciate the trust you have placed in me. I will continue to work hard every day to maintain that trust.
Mark Anthony Grimaldi,
Portfolio Manager and Author
RCSEC1123001
2 The Fed - Why does the Federal Reserve aim for inflation of 2 percent over the longer run?
3 Annual Inflation Updates to the Annual Cap on Patient Engagement Tools and Supports Under 42 CFR § 1001.952(hh) | Office of Inspector General | Government Oversight | U.S. Department of Health and Human Services (hhs.gov)
4 Which US regions have the highest inflation rate? (usafacts.org)
| Sector Rotation Fund |
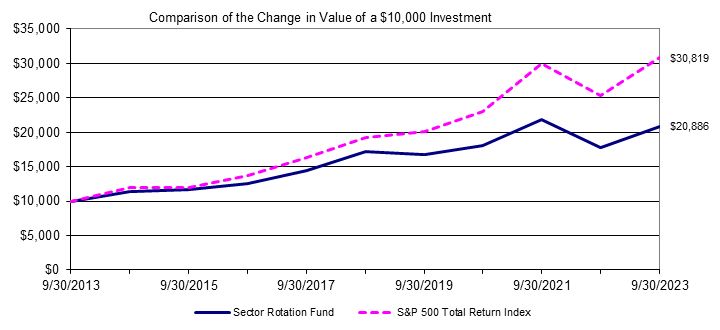
| Performance Update (Unaudited) |
| For the period from September 30, 2013 through September 30, 2023 |
| The graph above assumes an initial $10,000 investment and the reinvestment of dividends and capital gains distributions. This graph depicts the performance of the Sector Rotation Fund (the “Fund”) versus the S&P 500 Total Return Index. It is important to note that the Fund is a professionally managed mutual fund while the indices are not available for investment and are unmanaged. The comparison is shown for illustrative purposes only. | |
| Average Annual Total Returns | |
| | As of | One | Five | Ten | |
| | September 30, 2023 | Year | Year | Year | |
| | Sector Rotation Fund | 17.32% | 3.96% | 7.64% | |
| | S&P 500 Total Return Index | 21.62% | 9.92% | 11.91% | |
Performance quoted in the previous graph represents past performance, which is no guarantee of future results. Investment return and principal value will fluctuate so that shares, when redeemed, may be worth more or less than their original cost. Current performance may be lower or higher than the performance data quoted. The Advisor has entered into an Expense Limitation Agreement with the Trust, on behalf of the Fund, under which it has agreed to waive or reduce its fees and to assume other expenses of the Fund, if necessary, in amounts that limit the Fund’s total operating expenses (exclusive of (i) any front-end or contingent deferred loads; (ii) brokerage fees and commissions, (iii) acquired fund fees and expenses; (iv) fees and expenses associated with investments in other collective investment vehicles or derivative instruments (including, for example, option and swap fees and expenses); (v) borrowing costs (such as interest and dividend expense on securities sold short); (vi) taxes; and (vii) extraordinary expenses, such as litigation expenses (which may include indemnification of Fund officers and Trustees and contractual indemnification of Fund service providers (other than the Advisor)) to not more than 2.14% of the average daily net assets of the Fund for the current fiscal year. The Expense Limitation Agreement remains in effect through January 31, 2024. The Expense Limitation Agreement may be terminated by the Board of Trustees of the Trust at any time. The Fund’s expense ratio per the Fund’s most recent prospectus dated February 1, 2023 was 2.10%. An investor may obtain performance data, current to the most recent month-end, by visiting ncfunds.com.
The graph and table do not reflect the deduction of taxes that a shareholder would pay on Fund distributions or the redemption of Fund shares. Average annual total returns are historical in nature and measure net investment income and capital gain or loss from portfolio investments assuming reinvestment of distributions.
| Sector Rotation Fund |
| Schedule of Investments |
| As of September 30, 2023 |
| | | | | | Shares | | Value
(Note 1) | |
| | | | | | | | | |
| Exchange-Traded Funds - 80.70% | | | | | |
| | Communication Services - 16.08% | | | | | | |
| | | Vanguard Communication Services ETF | | | 45,000 | | $ 4,733,550 | |
| | Consumer Discretionary - 14.76% | | | | | | |
| | | SPDR S&P Retail ETF | | | 5,000 | | 304,300 | |
| | | Vanguard Consumer Discretionary ETF | | | 15,000 | | 4,040,550 | |
| | | | | | | | 4,344,850 | |
| | Financials - 6.82% | | | | | | |
| | | Vanguard Financials ETF | | | 25,000 | | 2,008,000 | |
| | Health Care - 8.78% | | | | | | |
| | | Vanguard Health Care ETF | | | 11,000 | | 2,586,100 | |
| | Industrials - 16.55% | | | | | | |
| | | Vanguard Industrials ETF | | | 25,000 | | 4,874,500 | |
| | Technology - 14.09% | | | | | | |
| | | Vanguard Information Technology ETF | | | 10,000 | | 4,149,000 | |
| | Utilities - 2.17% | | | | | | |
| | | Vanguard Utilities ETF | | | 5,000 | | 637,700 | |
| | Large-Cap - 1.45% | | | | | | |
| | | SPDR S&P 500 ETF Trust | | | 1,000 | | 427,480 | |
| | | Total Exchange-Traded Funds (Cost $18,246,152) | | | | 23,761,180 | |
| Short-Term Investment - 19.15% | | | |
| | | Fidelity Treasury Portfolio, 5.22%(a) (Cost $5,640,377) | | | 5,640,377 | | 5,640,377 | |
| Investments, at Value (Cost $23,886,529) - 99.85% | | | | 29,401,557 | |
| Other Assets Less Liabilities - 0.15% | | | | 43,363 | |
| Net Assets - 100.00% | | | | $ 29,444,920 | |
| | | | | | | | | |
| (a) | Represents 7-day effective yield as of September 30, 2023. |
| Summary of Investments by Sector | % of Net Assets | | Value |
| Exchange-Traded Funds | | | |
| Communication Services | 16.08% | | $ 4,733,550 |
| Consumer Discretionary | 14.76% | | 4,344,850 |
| Financials | 6.82% | | 2,008,000 |
| Health Care | 8.78% | | 2,586,100 |
| Industrials | 16.55% | | 4,874,500 |
| Technology | 14.09% | | 4,149,000 |
| Utilities | 2.17% | | 637,700 |
| Large-Cap | 1.45% | | 427,480 |
| Short-Term Investment | 19.15% | | 5,640,377 |
| Other Assets Less Liabilities | 0.15% | | 43,363 |
| Total Net Assets | 100.00% | | $ 29,444,920 |
| Sector Rotation Fund |
| Statement of Assets and Liabilities |
| As of September 30, 2023 | | |
| Assets: | |
| | Investments, at value (cost $23,886,529) | $ 29,401,557 | |
| | Dividends receivable | 81,914 | |
| | Interest receivable | 19,269 | |
| | Fund shares sold receivable | 100 | |
| | Prepaid insurance | 1,761 | |
| | Total assets | 29,504,601 | |
| Liabilities: | | |
| | Fund shares purchased payable | 6,052 | |
| | Accrued expenses: | | |
| | | Advisory Fees | 24,768 | |
| | | Professional fees | 18,292 | |
| | | Distribution and service fees | 2,831 | |
| | | Administration fees | 1,460 | |
| | | Fund accounting fees | 236 | |
| | | Transfer agent fees | 92 | |
| | | Trustee fees | 1,001 | |
| | | Compliance fees | 701 | |
| | | Operational expenses | 4,248 | |
| | Total liabilities | 59,681 | |
| Total Net Assets | $ 29,444,920 | |
| Net Assets Consist of: | | |
| | Paid in capital | $ 23,574,546 | |
| | Accumulated earnings | 5,870,374 | |
| Total Net Assets | $ 29,444,920 | |
| Capital Shares Outstanding, no par value | | |
| | (unlimited authorized shares) | 2,279,354 | |
| Net Asset Value, Per Share | $12.92 | |
| Sector Rotation Fund |
| Statement of Operations |
| For the fiscal year ended September 30, 2023 | 245 |
| Investment Income: | |
| | Dividends | $ 366,944 | |
| | Interest | 106,411 | |
| | Total Investment Income | 473,355 | |
| Expenses: | | |
| | Advisory fees (note 2) | 284,531 | |
| | Distribution and service fees (note 4) | 71,133 | |
| | Administration fees (note 2) | 37,677 | |
| | Professional fees | 33,905 | |
| | Registration and filing expenses | 31,226 | |
| | Fund accounting fees (note 2) | 31,102 | |
| | Transfer agent fees (note 2) | 21,802 | |
| | Compliance fees (note 2) | 19,298 | |
| | Shareholder fulfillment fees | 18,839 | |
| | Custody fees | 10,549 | |
| | Trustee fees and meeting expenses (note 3) | 9,145 | |
| | Insurance fees | 3,952 | |
| | Security pricing fees | 2,577 | |
| | Miscellaneous expenses | 4,562 | |
| | Net Expenses | 580,298 | |
| Net Investment Loss | (106,943 | ) |
| Realized and Unrealized Gain on Investments: | | |
| | Net realized gain from investment transactions | 785,516 | |
| | Net change in unrealized appreciation on investments | 3,746,026 | |
| Net Realized and Unrealized Gain on Investments | 4,531,542 | |
| Net Increase in Net Assets Resulting from Operations | $ 4,424,599 | |
| Sector Rotation Fund |
| Statements of Changes in Net Assets | | | | | |
| For the fiscal year ended September 30, | 245 | | | | |
| | 2023 | | 2022 |
| Operations: | | | | | |
| | Net investment loss | $ (106,943 | ) | $ (205,122 | ) |
| | Net realized gain from investment transactions | 785,516 | | | 1,752,650 | |
| | Net change in unrealized appreciation (depreciation) on investments | 3,746,026 | | | (7,395,333 | ) |
| Net Increase (Decrease) in Net Assets Resulting from Operations | 4,424,599 | | | (5,847,805 | ) |
| Distributions to Shareholders from Distributable Earnings | (1,924,950 | ) | | (1,680,501 | ) |
| Capital Share Transactions: | | | | | |
| | | Shares sold | 1,862,698 | | | 2,353,195 | |
| | | Reinvested dividends and distributions | 1,921,648 | | | 1,677,686 | |
| | | Shares repurchased | (2,726,631 | ) | | (2,651,849 | ) |
| Net Increase in Net Assets Resulting from Capital Share Transactions | 1,057,715 | | | 1,379,032 | |
| Net Increase (Decrease) in Net Assets | 3,557,364 | | | (6,149,274 | ) |
| Net Assets: | | | | | |
| | Beginning of Year | 25,887,556 | | | 32,036,830 | |
| | End of Year | $ 29,444,920 | | | $ 25,887,556 | |
| Share Information: | | | | | |
| | | Shares sold | 149,991 | | | 162,325 | |
| | | Shares from reinvested dividends and distributions | 164,807 | | | 111,326 | |
| | | Shares repurchased | (216,898 | ) | | (189,921 | ) |
| Net Increase in Capital Shares | 97,900 | | | 83,730 | |
| Sector Rotation Fund |
| Financial Highlights |
| | September 30, |
| For a share outstanding during the fiscal years ended | 2023 | | 2022 | | 2021 | | 2020 | | 2019 | |
| Net Asset Value, Beginning of Year | $ 11.87 | | $ 15.27 | | $ 12.87 | | $ 12.94 | | $ 14.58 | |
| | | | | | | | | | | | |
| Income (Loss) from Investment Operations: | | | | | | | | | | |
| | Net investment loss (a) | (0.05) | | (0.09) | | (0.14) | | (0.07) | | (0.05) | |
| | Net realized and unrealized gain (loss) on investments | 2.01 | | (2.52) | | 2.70 | | 1.08 | | (0.46) | |
| | | | | | | | | | | | |
| Total from Investment Operations | 1.96 | | (2.61) | | 2.56 | | 1.01 | | (0.51) | |
| | | | | | | | | | | | |
| Less Distributions From: | | | | | | | | | | |
| | Net investment income | - | | - | | - | | - | | (0.38) | |
| | Net realized gains | (0.91) | | (0.79) | | (0.16) | | (1.08) | | (0.75) | |
| | | | | | | | | | | | |
| Total Distributions | (0.91) | | (0.79) | | (0.16) | | (1.08) | | (1.13) | |
| | | | | | | | | | | | |
| Net Asset Value, End of Year | $ 12.92 | | $ 11.87 | | $ 15.27 | | $ 12.87 | | $ 12.94 | |
| | | | | | | | | | | | |
| Total Return | 17.32% | | (18.20)% | | 20.03% | | 8.04% | | (2.41)% | |
| | | | | | | | | | | | |
| Net Assets, End of Year (in thousands) | $ 29,445 | | $ 25,888 | | $ 32,037 | | $ 25,589 | | $24,941 | |
| Ratios of: | | | | | | | | | | |
| Gross Expenses to Average Net Assets (b) | 2.04% | | 1.97% | | 1.95% | | 2.10% | | 2.05% | |
| Net Expenses to Average Net Assets (b) | 2.04% | | 1.97% | | 1.95% | | 2.10% | | 2.02% | |
| Net Investment Loss to Average Net Assets (b)(c) | (0.38)% | | (0.67)% | | (0.95)% | | (0.57)% | | (0.38)% | |
| Portfolio turnover rate | 234.10% | | 426.15% | | 211.18% | | 274.61% | | 184.39% | |
| (a) | Calculated using the average shares method. |
| (b) | Does not include expenses of the investment companies in which the Fund invests. |
| (c) | Recognition of net investment income (loss) by the Fund is affected by the timing of the declaration of dividends by the underlying investment companies in which the Fund invests. |
Sector Rotation Fund |
Notes to Financial Statements |
| As of September 30, 2023 |
| 1. | Organization and Significant Accounting Policies |
The Sector Rotation Fund (“Fund”) is a series of the Starboard Investment Trust (“Trust”). The Trust is organized as a Delaware statutory trust and is registered under the Investment Company Act of 1940, as amended (“1940 Act”), as an open-end management investment company. The Fund is a separate, non-diversified series of the Trust.
The Fund commenced operations on December 31, 2009 as a series of the World Funds Trust (“WFT”). Shareholders approved the reorganization of the Fund as a series of the Trust at a special meeting on June 22, 2011. The reorganization occurred on June 27, 2011. Effective November 29, 2010, the Fund changed its name from the Navigator Fund to the Sector Rotation Fund.
The investment objective of the Fund is to seek to achieve capital appreciation. The Fund utilizes a sector rotation strategy which evaluates the relative strength and momentum of different sectors of the economy in order to identify short-term investment opportunities. Under normal circumstances, the Fund invests in exchange-traded funds (“ETFs”). An ETF is an open-end investment company that holds a portfolio of investments designed to track a particular market segment or underlying index.
The following is a summary of significant accounting policies consistently followed by the Fund. The policies are in conformity with accounting principles generally accepted in the United States of America (“GAAP”). The Fund follows the accounting and reporting guidance in the Financial Accounting Standards Board (“FASB”) Accounting Standards Codification 946 “Financial Services – Investment Companies,” and Financial Accounting Standards Update (“ASU”) 2013-08.
Investment Valuation
The Fund’s investments in securities are carried at fair value. Securities listed on an exchange or quoted on a national market system are valued at the last sales price as of 4:00 p.m. Eastern Time. Securities traded in the NASDAQ over-the-counter market are generally valued at the NASDAQ Official Closing Price. Other securities traded in the over-the-counter market and listed securities for which no sale was reported on that date are valued at the most recent bid price. Instruments with maturities of 60 days or less are valued at amortized cost, which approximates market value. Securities and assets for which representative market quotations are not readily available (e.g., (i) an exchange-traded portfolio security is so thinly traded that there have been no transactions for that security over an extended period of time or the validity of a market quotation received is questionable; (ii) the exchange on which the portfolio security is principally traded closes early; or (iii) trading of the portfolio security is halted during the day and does not resume prior to the Fund’s NAV calculation) or which cannot be accurately valued using the Fund’s normal pricing procedures are valued at fair value as determined in good faith under policies approved by the Trustees. A security’s “fair value” price may differ from the price next available for that security using the Fund’s normal pricing procedures.
Fair Value Measurement
The Fund has adopted ASC Topic 820, Fair Value Measurements. ASC Topic 820 defines fair value, establishes a framework for measuring fair value and expands disclosure about fair value measurements.
Various inputs are used in determining the value of the Fund’s investments. These inputs are summarized in the three broad levels listed below:
| Level 1: | Unadjusted quoted prices in active markets for identical securities assets or liabilities that the funds have the ability to access. |
| Level 2: | Observable inputs other than quoted prices included in Level 1 that are observable for the asset or liability, either directly or indirectly. These inputs may include quoted prices for the identical instrument on an inactive market, prices for similar instruments, interest rates, credit spreads, yield curves, and market-collaborated input. |
| Level 3: | Unobservable inputs for the asset or liability to the extent that observable inputs are not available, representing the assumptions that a market participant would use in valuing the asset or liability at the measurement date; they would be based on the best information available, which may include the funds’ own data. |
The availability of observable inputs can vary from security to security and is affected by a wide variety of factors, including, for example, the type of security, whether the security is new and not yet established in the marketplace, the liquidity of markets, and other characteristics particular to the security. To the extent that valuation is based on models or inputs that are less observable or unobservable in the market, the determination of fair value requires more judgment. Accordingly, the degree of judgment exercised in determining fair value is greatest for instruments categorized in Level 3.
The inputs used to measure fair value may fall into different levels of the fair value hierarchy. In such cases, for disclosure purposes, the level in the fair value hierarchy within which the fair value measurement falls in its entirety, is determined based on the lowest level input that is significant to the fair value measurement in its entirety.
Sector Rotation Fund |
Notes to Financial Statements |
| As of September 30, 2023 |
In accordance with the Trust’s valuation policies and procedures and pursuant to Rule 2a-5 under the 1940 Act, the Board has appointed the Advisor as the valuation designee (the “Valuation Designee”). The Valuation Designee is required to consider all appropriate factors relevant to the value of securities for which it has determined other pricing sources are not available or reliable as described above. No single method exists for determining fair value because fair value depends upon the circumstances of each individual case.
The inputs or methodology used for valuing securities are not necessarily an indication of the risk associated with investing in those securities. The following table summarizes the inputs as of September 30, 2023 for the Fund’s assets measured at fair value:
| | Total | | Level 1 | | Level 2 | | Level 3 (a) |
| Assets | | | | | | | |
| Exchange-Traded Funds (b) | $ 23,761,180 | | $ 23,761,180 | | $ - | | $ - |
| Short-Term Investment | 5,640,377 | | 5,640,377 | | - | | - |
| Total Assets | $ 29,401,557 | | $ 29,401,557 | | $ - | | $ - |
| | | | | | | | |
| (a) | The Fund had no Level 3 securities during the fiscal year ended September 30, 2023. |
| (b) | Refer to Schedule of Investments for breakdown by sector. |
Investment Transactions and Investment Income
Investment transactions are accounted for as of the date purchased or sold (trade date). Dividend income is recorded on the ex-dividend date. Certain dividends from foreign securities will be recorded as soon as the Fund is informed of the dividend if such information is obtained subsequent to the ex-dividend date. Interest income is recorded on the accrual basis and includes accretion of discounts and amortization of premiums. Gains and losses are determined on the identified cost basis, which is the same basis used for federal income tax purposes.
Expenses
The Fund is responsible for all expenses incurred specifically on its behalf as well as a portion of Trust level expenses, which are allocated according to methods reviewed annually by the Trustees.
Distributions
The Fund may declare and distribute dividends from net investment income (if any) annually. Distributions from capital gains (if any) are generally declared and distributed annually. Dividends and distributions to shareholders are recorded on ex-date.
Estimates
The preparation of financial statements in conformity with GAAP requires management to make estimates and assumptions that affect the reported amounts of assets and liabilities and disclosure of contingent assets and liabilities at the date of the financial statements and the reported amounts of increases and decreases in the net assets from operations during the reported period. Actual results could differ from those estimates.
Federal Income Taxes
No provision for income taxes is included in the accompanying financial statements, as the Fund intends to distribute to shareholders all taxable investment income and realized gains and otherwise comply with Subchapter M of the Internal Revenue Code applicable to regulated investment companies.
| 2. | Transactions with Related Parties and Service Providers |
Advisor
The Fund pays a monthly fee to Grimaldi Portfolio Solutions, Inc. (the “Advisor”) calculated at the annual rate of 1.00% of the Fund’s average daily net assets.
The Advisor has entered into a contractual agreement (the “Expense Limitation Agreement”) with the Trust, on behalf of the Fund, under which it has agreed to waive or reduce its fees and to assume other expenses of the Fund, if necessary, in amounts that limit the Fund’s total operating expenses (exclusive of (i) any front-end or contingent deferred loads; (ii) brokerage fees and commissions; (iii) acquired fund fees and expenses; (iv) fees and expenses associated with investments in other collective investment vehicles or derivative instruments (including, for example, option and swap fees and expenses); (v) borrowing costs (such as interest and dividend expense on securities sold short); (vi) taxes and (vii) extraordinary expenses, such as litigation expenses (which may include indemnification of Fund officers and Trustees and contractual indemnification of Fund service providers (other than the Advisor)) to not more than 2.14%. The Expense Limitation Agreement runs through January 31, 2024 and may be terminated by the Board at any time. The Advisor cannot recoup from the Fund any amounts paid by the Advisor under the Expense Limitation Agreement.
Sector Rotation Fund |
Notes to Financial Statements |
| As of September 30, 2023 |
For the fiscal year ended September 30, 2023, $284,531 in advisory fees were incurred, and no fees were waived by the Advisor.
Administrator
The Fund pays customary fees to The Nottingham Company (the “Administrator”) for its services as Fund Administrator and Fund Accountant. Certain officers of the Administrator are also officers of the Trust.
Compliance Services
The Nottingham Company, Inc. serves as the Trust’s compliance services provider including services as the Trust’s Chief Compliance Officer. The Nottingham Company, Inc. is entitled to receive customary fees from the Fund for its services pursuant to the Compliance Services Agreement with the Fund.
Transfer Agent
Nottingham Shareholder Services, LLC (“Transfer Agent”) serves as transfer, dividend paying, and shareholder servicing agent for the Fund. For its services, the Transfer Agent is entitled to receive compensation from the Fund pursuant to the Transfer Agent’s fee arrangements with the Fund.
The Trust is governed by the Board of Trustees, which is responsible for the management and supervision of the Fund. The Trustees meet periodically throughout the year to review contractual agreements with companies that furnish services to the Fund; review performance of the Advisor and the Fund; and oversee activities of the Fund. Officers of the Trust and Trustees who are interested persons of the Trust or the Advisor will receive no salary or fees from the Trust. Each Trustee who is not an “interested person” of the Trust or the Advisor within the meaning of the Investment Company Act of 1940, as amended (the “Independent Trustee”) receives $2,400 per series per year, $400 per meeting attended, $200 per committee meeting attended, and $1,000 per special meeting attended. The Trust reimburses each Trustee and officer of the Trust for his or her travel and other expenses related to attendance of Board meetings. Prior to April 1, 2023, each Trustee who was not an “interested person” of the Trust or the Advisor within the meaning of the Investment Company Act of 1940, as amended (the “Independent Trustee”) received $2,000 per series per year, $200 per meeting attended, and $500 per series per special meeting related to contract renewal issues. Additional fees were incurred during the year as special meetings were necessary in addition to the regularly scheduled meetings of the Board of Trustees.
Certain officers of the Trust may also be officers of the Administrator.
| 4. | Distribution and Service Fees |
The Trustees, including a majority of the Trustees who are not “interested persons” of the Trust as defined in the 1940 Act and who have no direct or indirect financial interest in such plan or in any agreement related to such plan, adopted a distribution plan pursuant to Rule 12b-1 of the 1940 Act (the “Plan”). The 1940 Act regulates the manner in which a regulated investment company may assume expenses of distributing and promoting the sales of its shares and servicing of its shareholder accounts. The Plan provides that the Fund may incur certain expenses, which may not exceed 0.25% per annum of the average daily net assets of the Fund for each year elapsed subsequent to adoption of the Plan, for payment to the Distributor and others for items such as advertising expenses, selling expenses, commissions, travel or other expenses reasonably intended to result in sales of shares of the Fund or support servicing of shareholder accounts. For the fiscal year ended September 30, 2023, $71,133 in distribution and service fees were incurred by the Fund.
| 5. | Purchases and Sales of Investment Securities |
For the fiscal year ended September 30, 2023, the aggregate cost of purchases and proceeds from sales of investment securities (excluding short-term securities) were as follows:
Purchases of Non-U.S. Government Securities | | Proceeds from Sales of Non- U.S. Government Securities | | Purchases of U.S. Government Securities | | Proceeds from Sales of U.S. Government Securities | |
| $ 61,176,022 | | $ 63,950,813 | | $ - | | $ - | |
Cybersecurity Risk. As part of its business, the Advisor processes, stores and transmits large amounts of electronic information, including information relating to the transactions of the Fund. The Advisor and the Fund are therefore susceptible to cybersecurity risk. Cyber-attacks include, among other behaviors, stealing or corrupting data maintained online or digitally, denial of service attacks on websites, the unauthorized release of confidential information and causing operational disruption. Successful cyber-attacks against, or security breakdowns of, the Fund or its advisor, custodians, fund accountant, fund administrator, transfer agent, pricing vendors and/or other third-party service providers may adversely impact the Fund and its shareholders. For instance, cyber-attacks may interfere with the processing of shareholder transactions, impact the Fund’s ability to calculate its NAV, cause the release of private shareholder information or confidential Fund information, impede trading, cause reputational damage, and subject the Fund to regulatory fines, penalties or financial losses, reimbursement or other compensation costs, and/or additional compliance costs. The Fund also may incur substantial costs for cybersecurity risk management in order to guard against any cyber incidents in the future. The Fund and its shareholders could be negatively impacted as a result.
Sector Rotation Fund |
Notes to Financial Statements |
| As of September 30, 2023 |
COVID-19 Risk. The outbreak of an infectious respiratory illness caused by a novel coronavirus known as COVID-19 has resulted in travel restrictions, closed international borders, enhanced health screenings at ports of entry and elsewhere, disruption of and delays in healthcare service preparation and delivery, prolonged quarantines, cancellations, supply chain disruptions, and lower consumer demand, as well as general concern and uncertainty. The impact of COVID-19, and other infectious illness outbreaks that may arise in the future, could adversely affect the economies of many countries or the entire global economy, individual issuers and capital markets in ways that cannot necessarily be foreseen. In addition, the impact of infectious illnesses in emerging market countries may be greater due to generally less established healthcare systems. Public health crises caused by the COVID-19 outbreak may exacerbate other pre-existing political, social and economic risks in certain countries or globally. As such, issuers of debt securities with operations, productions, offices, and/or personnel in (or other exposure to) areas affected with the virus may experience significant disruptions to their business and/or holdings. The potential impact on the credit markets may include market illiquidity, defaults and bankruptcies, among other consequences, particularly on issuers in the airline, travel and leisure and retail sectors. The extent to which COVID-19 will affect the Fund, the Fund’s service providers’ and/or issuer’s operations and results will depend on future developments, which are highly uncertain and cannot be predicted, including new information that may emerge concerning the severity of COVID-19 and the actions taken to contain COVID-19. Economies and financial markets throughout the world are becoming increasingly interconnected. As a result, whether or not the Fund invests in securities of issuers located in or with significant exposure to countries experiencing economic, political and/or financial difficulties, the value and liquidity of the Fund’s investments may be negatively affected by such events. If there is a significant decline in the value of the Fund’s portfolio, this may impact the Fund’s asset coverage levels for certain kinds of derivatives and other portfolio transactions. The duration of the COVID-19 outbreak and its impact on the global economy cannot be determined with certainty.
Foreign Securities Risk. The ETFs held by the Fund may have significant investments in foreign securities. Foreign securities involve investment risks different from those associated with domestic securities. Changes in foreign economies and political climates are more likely to affect the Fund than a mutual fund that invests exclusively in domestic securities. The value of foreign currency denominated securities or foreign currency contracts is affected by the value of the local currency relative to the U.S. dollar. There may be less government supervision of foreign markets, resulting in non-uniform accounting practices and less publicly available information about issuers of foreign currency denominated securities. The value of foreign investments may be affected by changes in exchange control regulations, application of foreign tax laws (including withholding tax), changes in governmental administration or economic or monetary policy (in this country or abroad) or changed circumstances in dealings between nations. In addition, foreign brokerage commissions, custody fees, and other costs of investing in foreign securities are generally higher than in the United States. Investments in foreign issues could be affected by other factors not present in the United States, including expropriation, armed conflict, confiscatory taxation, and potential difficulties in enforcing contractual obligations.
Investments in ETFs. Since the Fund invests in ETFs, the Fund will be subject to substantially the same risks as those associated with the direct ownership of the securities comprising the index on which the ETF is based, and the value of the Fund’s investment will fluctuate in response to the performance of the underlying index. ETFs typically incur fees that are separate from those of the Fund. Accordingly, the Fund’s investments in ETFs will result in the layering of expenses such that shareholders will indirectly bear a proportionate share of the ETFs’ operating expenses, in addition to paying Fund expenses. ETFs are subject to the following risks that do not apply to traditional mutual funds: (i) an ETF’s shares may trade at a market price that is above or below its NAV; (ii) an active trading market for an ETF’s shares may not develop or be maintained; (iii) the ETF may employ an investment strategy that utilizes high leverage ratios; or (iv) trading of an ETF’s shares may be halted if the listing exchange’s officials deem such action appropriate, the shares are de-listed from the exchange, or the activation of market-wide “circuit breakers” (which are tied to large decreases in stock prices) halts stock trading generally.
Leveraged or Inverse ETFs. The Fund may invest in leveraged and/or inverse ETFs, including multiple inverse (or ultra-short) ETFs. These ETFs are subject to additional risk not generally associated with traditional ETFs. Leveraged ETFs seek to multiply the performance of the particular benchmark that is tracked (which may be an index, a currency or other benchmark). Inverse ETFs seek to negatively correlate to the performance of the benchmark. These ETFs seek to achieve their returns by using various forms of derivative transactions, including by short-selling the underlying index. Ultra-short ETFs seek to multiply the negative return of the tracked index (e.g., twice the inverse return). As a result, an investment in an inverse ETF will decrease in value when the value of the underlying index rises. For example, an inverse ETF tracking the S&P 500 Index will gain 1% when the S&P falls 1% (if it is an ultra-short ETF that seeks twice the inverse return, it will gain 2%), and will lose 1% if the S&P 500 gains 1% (if an ultra-short ETF that seeks twice the inverse return, it would lose 2%). By investing in ultra-short ETFs and gaining magnified short exposure to a particular index, the Fund can commit less assets to the investment in the securities represented on the index than would otherwise be required.
Sector Rotation Fund |
Notes to Financial Statements |
| As of September 30, 2023 |
Manager Risk. The Advisor’s ability to choose suitable investments has a significant impact on the ability of the Fund to achieve its investment objectives.
Market Risk. Market risk refers to the possibility that the value of securities held by the Fund may decline due to daily fluctuations in the securities markets. Stock prices change daily as a result of many factors, including developments affecting the condition of both individual companies and the market in general. The price of a stock may even be affected by factors unrelated to the value or condition of its issuer, such as changes in interest rates, national and international economic and/or political conditions and general equity market conditions. In a declining stock market, prices for all companies (including those in the Fund’s portfolio) may decline regardless of their long-term prospects. The Fund’s performance per share will change daily in response to such factors.
Portfolio Turnover Risk. The Advisor may sell portfolio securities without regard to the length of time they have been held in order to take advantage of new investment opportunities or changing market conditions. As portfolio turnover may involve paying brokerage commissions and other transaction costs, there could be additional expenses for the Fund. High rates of portfolio turnover may also result in the realization of short-term capital gains and losses. The payment of taxes on gains could adversely affect the Fund’s performance. Any distributions resulting from such gains will be considered ordinary income for federal income tax purposes.
Sector Focus Risk. Because the Fund’s investments may, from time to time, be more heavily invested in particular sectors, the value of its shares may be especially sensitive to factors and economic risks that specifically affect those sectors. As a result, the Fund’s share price may fluctuate more widely than the value of shares of a mutual fund that invests in a broader range of industries. The specific risks for each of the sectors in which the Fund may focus its investments include the additional risks described below:
| • | Consumer Discretionary. Companies in this sector may be adversely affected by negative changes in the domestic and international economies, interest rates, competition, consumer confidence, disposable household income, and consumer spending. These companies are also subject to severe competition and changes in demographics and consumer tastes, which may have an adverse effect on the performance of these companies. |
| • | Consumer Staples. Companies in this sector may be adversely affected by negative changes in the domestic and international economies, interest rates, competition, consumer confidence, and consumer spending. These companies also are subject to the risk that government regulation could affect the permissibility of using various production methods and food additives, which regulations could affect company profitability. The success of food, household, and personal product companies may be strongly affected by consumer tastes, marketing campaigns, and other factors affecting supply and demand. |
| • | Industrials. Companies in this sector are affected by supply and demand both for their specific product or service and for industrial sector products in general. Government regulation, world events, and economic conditions will affect the performance of these companies. These companies can also be cyclical, subject to sharp price movements, and significantly affected by government spending policies. |
| • | Information Technology. The performance of companies in this sector may be adversely affected by intense competition both domestically and internationally; limited product lines, markets, financial resources, or personnel; rapid product obsolescence and frequent new product introduction; dramatic and unpredictable changes in growth rates; and dependence on patent and intellectual property rights. |
Small-Cap and Mid-Cap Securities Risk. The Fund or ETFs held by the Fund may invest in securities of small-cap and mid-cap companies, which involve greater volatility than investing in larger and more established companies. Small-cap and mid-cap companies can be subject to more abrupt or erratic share price changes than larger, more established companies. Securities of these types of companies have limited market liquidity, and their prices may be more volatile. You should expect that the value of the Fund’s shares will be more volatile than a fund that invests exclusively in large-capitalization companies.
Sector Rotation Fund |
Notes to Financial Statements |
| As of September 30, 2023 |
Distributions are determined in accordance with Federal income tax regulations, which differ from GAAP, and, therefore, may differ significantly in amount or character from net investment income and realized gains for financial reporting purposes. The general ledger is adjusted for permanent book/tax differences to reflect tax character but is not adjusted for temporary differences.
Management has reviewed the Fund’s tax positions to be taken on the federal income tax returns for the fiscal years ended September 30, 2020 through September 30, 2023 and determined that the Fund does not have a liability for uncertain tax positions. The Fund recognizes interest and penalties, if any, related to unrecognized tax benefits as income tax expense in the Statement of Operations. During the fiscal year ended September 30, 2023, the Fund did not incur any interest or penalties.
Distributions during the fiscal years ended September 30 were characterized for tax purposes as follows:
| | | September 30, 2023 | September 30, 2022 |
| Ordinary Income | | - | $906,061 |
| Capital Gains | | $1,924,950 | $774,440 |
At September 30, 2023, the tax-basis cost of investments and components of accumulated deficit were as follows:
| Cost of Investments | | $23,886,529 |
| | | |
| Gross Unrealized Appreciation | | 5,566,257 |
| Gross Unrealized Depreciation | | (51,229) |
| Net Unrealized Appreciation | | 5,515,028 |
| | | |
| Undistributed Ordinary Income | | 114,128 |
| Undistributed Capital Gains | | 241,218 |
| Accumulated Earnings | | $ 5,870,374 |
| | | |
The beneficial ownership, either directly or indirectly, of 25% or more of the voting securities of a fund creates a presumption of control of a fund, under Section 2(a)(9) of the Investment Company Act of 1940. As of September 30, 2023, Charles Schwab held 90.01% of the Fund. The Fund has no knowledge as to whether all or any portion of the shares owned of record by Charles Schwab or NFS are also owned beneficially.
| 9. | Commitments and Contingencies |
Under the Trust’s organizational documents, its officers and Trustees are indemnified against certain liabilities arising out of the performance of their duties to the Fund. In addition, in the normal course of business, the Trust entered into contracts with its service providers, on behalf of the Fund, and others that provide for general indemnifications. The Fund’s maximum exposure under these arrangements is unknown, as this would involve future claims that may be made against the Fund. The Fund expects risk of loss to be remote.
In accordance with GAAP, management has evaluated the need for disclosures and/or adjustments resulting from subsequent events through the date of issuance of the financial statements. This evaluation did not result in any subsequent events that necessitated disclosures and/or adjustments.
REPORT OF INDEPENDENT REGISTERED PUBLIC ACCOUNTING FIRM
To the Shareholders of Sector Rotation Fund
and Board of Trustees of Starboard Investment Trust
Opinion on the Financial Statements
We have audited the accompanying statement of assets and liabilities, including the schedule of investments, of Sector Rotation Fund (the “Fund”), a series of Starboard Investment Trust, as of September 30, 2023, the related statements of operations and changes in net assets, the related notes, and the financial highlights for the year then ended (collectively referred to as the “financial statements”). In our opinion, the financial statements present fairly, in all material respects, the financial position of the Fund as of September 30, 2023, the results of its operations, changes in net assets, and the financial highlights for the year then ended, in conformity with accounting principles generally accepted in the United States of America.
The Fund’s financial statements and financial highlights for the year ended September 30, 2022, and prior, were audited by other auditors whose report dated November 21, 2022, expressed an unqualified opinion on those financial statements and financial highlights.
Basis for Opinion
These financial statements are the responsibility of the Fund’s management. Our responsibility is to express an opinion on the Fund’s financial statements based on our audit. We are a public accounting firm registered with the Public Company Accounting Oversight Board (United States) (“PCAOB”) and are required to be independent with respect to the Fund in accordance with the U.S. federal securities laws and the applicable rules and regulations of the Securities and Exchange Commission and the PCAOB.
We conducted our audit in accordance with the standards of the PCAOB. Those standards require that we plan and perform the audit to obtain reasonable assurance about whether the financial statements are free of material misstatement whether due to error or fraud.
Our audit included performing procedures to assess the risks of material misstatement of the financial statements, whether due to error or fraud, and performing procedures that respond to those risks. Such procedures included examining, on a test basis, evidence regarding the amounts and disclosures in the financial statements. Our procedures included confirmation of securities owned as of September 30, 2023 by correspondence with the custodian. Our audit also included evaluating the accounting principles used and significant estimates made by management, as well as evaluating the overall presentation of the financial statements. We believe that our audit provides a reasonable basis for our opinion.
We have served as the Fund’s auditor since 2023.
COHEN & COMPANY, LTD.
Philadelphia, Pennsylvania
November 29, 2023
Sector Rotation Fund |
Additional Information (Unaudited)
|
| As of September 30, 2023 |
| 1. | Proxy Voting Policies and Voting Record |
A copy of the Advisor’s Proxy and Corporate Action Voting Policies and Procedures is included as Appendix B to the Fund’s Statement of Additional Information and is available, without charge, upon request, by calling 800-773-3863, and on the website of the Securities and Exchange Commission (“SEC”) at http://www.sec.gov. Information regarding how the Fund voted proxies relating to portfolio securities during the most recent 12-month period ended June 30, is available (1) without charge, upon request, by calling the Fund at the number above and (2) on the SEC’s website at http://www.sec.gov.
| 2. | Quarterly Portfolio Holdings |
The Fund files its complete schedule of portfolio holdings with the SEC for the first and third quarters of each fiscal year on Form N-PORT. The Fund’s Form N-PORT is available on the SEC’s website at http://www.sec.gov. You may also obtain copies without charge, upon request, by calling the Fund at 800-773-3863.
We are required to advise you within 60 days of the Fund’s fiscal year-end regarding the federal tax status of certain distributions received by shareholders during each fiscal year. The following information is provided for the Fund’s fiscal year ended September 30, 2023.
During the fiscal year, the Fund paid $1,924,950 in long-term capital distributions.
| 4. | Schedule of Shareholder Expenses |
As a shareholder of the Fund, you incur ongoing costs, including management fees and other Fund expenses. This Example is intended to help you understand your ongoing costs (in dollars) of investing in the Fund and to compare these costs with the ongoing costs of investing in other mutual funds.
The Example is based on an investment of $1,000 invested at the beginning of the period and held for the fiscal period from April 1, 2023 through September 30, 2023.
Actual Expenses – The first line of the table below provides information about actual account values and actual expenses. You may use the information in this line, together with the amount you invested, to estimate the expenses that you paid over the period. Simply divide your account value by $1,000 (e.g., an $8,600 account value divided by $1,000 = 8.6), then multiply the result by the number in the first line under the heading entitled “Expenses Paid During Period” to estimate the expenses you paid on your account during this period.
Hypothetical Example for Comparison Purposes – The second line of the table below provides information about hypothetical account values and hypothetical expenses based on the Fund’s actual expense ratio and an assumed rate of return of 5% per year before expenses, which is not the Fund’s actual return. The hypothetical account values and expenses may not be used to estimate the actual ending account balance or expenses you paid for the period. You may use this information to compare the ongoing costs of investing in the Fund and other funds. To do so, compare this 5% hypothetical example with the 5% hypothetical examples that appear in the shareholder reports of the other funds.
Please note that the expenses shown in the table are meant to highlight your ongoing costs only and do not reflect any transactional costs, such as sales charges (loads), redemption fees, or exchange fees. Therefore, the second line of the table is useful in comparing ongoing costs only and will not help you determine the relative total costs of owning different funds. In addition, if these transactional costs were included, your costs would have been higher.
| | Beginning Value 4/1/2023 | Ending Value 9/30/2023 | Expense Paid During Period* | Annualized Expense Ratio* |
| Actual | $1,000.00 | $1,036.10 | $10.46 | 2.04% |
| Hypothetical | 1,000.00 | 1,029.61 | 10.43 | 2.04% |
*Expenses are equal to the average account value over the period multiplied by the Fund’s annualized expense ratio, multiplied by the number of days in the most recent period, divided by the number of days in the fiscal year (to reflect the six month period).
| 5. | Approval of Investment Advisory Agreement |
In connection with the regular Board meeting held on March 9, 2023, the Board, including a majority of the Independent Trustees, discussed the approval of a management agreement between the Trust and the Advisor, with respect to the Fund (the "Investment Advisory Agreement"). The Trustees were assisted by legal counsel throughout the review process. The Trustees relied upon the advice of legal counsel and their own business judgment in determining the material factors to be considered in evaluating the Investment Advisory Agreement and the weight to be given to each factor considered. The conclusions reached by the Trustees were based on a comprehensive evaluation of all of the information provided and were not the result of any one factor. Moreover, each Trustee may have afforded different weight to the various factors in reaching his conclusions with respect to the approval of the Investment Advisory Agreement. In connection with their deliberations regarding approval of the Investment Advisory Agreement, the Trustees reviewed materials prepared by the Advisor.
Sector Rotation Fund |
Additional Information (Unaudited)
|
| As of September 30, 2023 |
In deciding on whether to approve the renewal of the Investment Advisory Agreement, the Trustees considered numerous factors, including:
| (i) | Nature, Extent, and Quality of Services. The Trustees considered the responsibilities of the Advisor under the Investment Advisory Agreement. The Trustees reviewed the services being provided by the Advisor to the Fund including, without limitation, the quality of its investment advisory services since the Advisor began managing the Fund (including research and recommendations with respect to portfolio securities); its procedures for formulating investment recommendations and assuring compliance with the Fund’s investment objectives, policies and limitations; its coordination of services for the Fund among the Fund’s service providers; and its efforts to promote the Fund, grow the Fund’s assets, and assist in the distribution of Fund shares (although no portion of the investment advisory fee was targeted to pay distribution expenses). The Trustees evaluated the Advisor’s staffing, personnel, and methods of operating; the education and experience of the Advisor’s personnel; compliance program; and the financial condition of the Advisor. It was noted that there had been no change in personnel. |
After reviewing the foregoing information and further information in the memorandum from the Advisor (e.g., descriptions of the Advisor’s business, compliance program, and Form ADV), the Board concluded that the nature, extent, and quality of the services provided by the Advisor were satisfactory and adequate for the Fund.
| (ii) | Performance. The Trustees compared the performance of the Fund with the performance of comparable funds with similar strategies managed by other investment advisers, and applicable peer group data (e.g., Morningstar/Lipper peer group average). The Trustees also considered the consistency of the Advisor’s management of the Fund with its investment objective, policies, and limitations. It was noted that the Fund outperformed the peer group but underperformed the category for the 5-year period, and outperformed the peer group and the category for the 10-year period. The Fund underperformed the peer group and the category for the 1-year and since inception period. The Trustees noted that the Fund underperformed its benchmark index for all periods Ecept the 1-year period. |
After reviewing the investment performance of the Fund, the Advisor’s experience managing the Fund, the historical investment performance, and other factors, the Board concluded that the investment performance of the Fund and the Advisor was satisfactory.
| (iii) | Fees and Expenses. The Trustees noted the management fees for the Fund under the Investment Advisory Agreement. The Trustees then compared the advisory fee and expense ratio of the Fund to other comparable funds, noting that the management fee and the expense ratio were higher than the average of the peer group and category and noted the Advisor’s explanation that this was likely due to the small relative size of the Fund compared to its peers and other funds in its category. |
Following this comparison, and upon further consideration and discussion of the foregoing, the Board concluded that the fees to be paid to the Advisor were not unreasonable in relation to the nature and quality of the services provided by the Advisor and that they reflected charges that were within a range of what could have been negotiated at arm’s length.
| (iv) | Profitability. The Board reviewed the Advisor’s profitability analysis in connection with its management of the Fund over the past twelve months. The Board noted that the Advisor realized a moderate profit for the prior twelve months of operations. After discussion, the trustees concluded that the Advisor’s level of profitability was not excessive. The Board considered the quality of the Advisor’s service to the Fund, and after further discussion, concluded that the Advisor’s level of profitability was not excessive. |
| (v) | Economies of Scale. In this regard, the Trustees reviewed the Fund’s operational history and noted that the size of the Fund has not provided an opportunity to realize economies of scale. The Trustees then reviewed the Fund’s fee arrangements for breakpoints or other provisions that would allow the Fund’s shareholders to benefit from economies of scale in the future as the Fund grows. The Trustees determined that the maximum management fee would stay the same regardless of the Fund’s asset levels but noted the Advisor’s willingness to consider the breakpoints in the future as assets grow. |
Conclusion. Having reviewed and discussed in depth such information from the Advisor as the Trustees believed to be reasonably necessary to evaluate the terms of the Investment Advisory Agreement and as assisted by the advice of legal counsel, the Trustees concluded that renewal of the Investment Advisory Agreement was fair and reasonable and in the best interest of the shareholders of the Fund.
Sector Rotation Fund |
Additional Information (Unaudited)
|
| As of September 30, 2023 |
| 6. | Information about Trustees and Officers |
The business and affairs of the Fund and the Trust are managed under the direction of the Board of Trustees of the Trust. Information concerning the Trustees and officers of the Trust and Fund is set forth below. Generally, each Trustee and officer serves an indefinite term or until certain circumstances such as their resignation, death, or otherwise as specified in the Trust’s organizational documents. Any Trustee may be removed at a meeting of shareholders by a vote meeting the requirements of the Trust’s organizational documents. The Statement of Additional Information of the Fund includes additional information about the Trustees and officers and is available, without charge, upon request by calling the Fund toll-free at 800-773-3863. The address of each Trustee and officer, unless otherwise indicated below, is 116 South Franklin Street, Rocky Mount, North Carolina 27804. The Independent Trustees received aggregate compensation of 8,537 during the fiscal year ended September 30, 2023, from the Fund for their services to the Fund and Trust.
Name and
Date of Birth | Position
held with
Funds or Trust | Length
of Time Served | Principal Occupation
During Past 5 Years | Number of Portfolios in Fund Complex Overseen by Trustee | Other Directorships
Held by Trustee
During Past 5 Years |
| Independent Trustees |
James H. Speed, Jr.
(06/1953) | Chairman and Independent Trustee | Trustee since 7/09, Chair since 5/12 | Retired Executive/Private Investor | 10 | Independent Trustee of the Brown Capital Management Mutual Funds for all its series from 2001 to present, Centaur Mutual Funds Trust for all its series from 2009 to present, WST Investment Trust for all its series from 2013 to present, and Chesapeake Investment Trust for all its series from 2016 to present (all registered investment companies). Member of Board of Directors of Communities in Schools of N.C. from 2001 to present. Member of Board of Directors of Investors Title Company from 2010 to present. Member of Board of Directors of AAA Carolinas/Auto Club Group from 2011 to present. Previously, Independent Trustee of the Hillman Capital Management Investment Trust from 2009 to 2021. Previously, Independent Trustee of the Leeward Investment Trust from 2018 to 2020. Previously, member of Board of Directors of M&F Bancorp and Mechanics & Farmers Bank from 2009 to 2019. |
Theo H. Pitt, Jr.
(04/1936) | Independent Trustee | Since 9/10 | Senior Partner, Community Financial Institutions Consulting (financial consulting) since 1999. | 10 | Independent Trustee of Hillman Capital Management Investment Trust for all its series from 2000 to present, Chesapeake Investment Trust for all its series from 2002 to present, World Funds Trust for all its series from 2013 to present, ETF Opportunities Trust for all its series from 2019 to present, and Kingsham Parallel Income Trust from 2022 to present (all registered investment companies). Senior Partner of Community Financial Institutions Consulting from 1997 to present. Previously, Independent Trustee of the Leeward Investment Trust from 2011 to 2021. |
J. Buckley Strandberg
(03/1960) | Independent Trustee | Since 7/09 | President of Standard Insurance and Realty since 1982. | 10 | None. |
Sector Rotation Fund |
Additional Information (Unaudited)
|
| As of September 30, 2023 |
Name and
Date of Birth | Position held with
Funds or Trust | Length
of Time Served | Principal Occupation
During Past 5 Years |
Officers
|
Katherine M. Honey
(09/1973) | President and Principal Executive Officer | Since 05/15 | President of The Nottingham Company since 2018. |
Pete McCabe
(09/1972) | Treasurer, Principal Accounting Officer, and Principal Financial Officer | Since 05/23 | Chief Operating Officer, The Nottingham Company since 2018. |
Tracie A. Coop
(12/1976) | Secretary | Since 12/19 | General Counsel, The Nottingham Company since 2019. Formerly, Vice President and Managing Counsel, State Street Bank and Trust Company from 2015 to 2019. |
Andrea M. Knoth
(09/1983) | Chief Compliance Officer | Since 06/22 | Director of Compliance, The Nottingham Company since 2022. Formerly, Senior Fund Compliance Administrator, Ultimus Fund Solutions from 2019 to 2022. Formerly, Associate Director of Operational Compliance, Barings from 2018 to 2019. |
Sector Rotation Fund
is a series of
The Starboard Investment Trust
For Shareholder Service Inquiries:
| For Investment Advisor Inquiries:
|
|
|
Nottingham Shareholder Services 116 South Franklin Street Post Office Box 69 Rocky Mount, North Carolina 27802-0069 | Grimaldi Portfolio Solutions, Inc. Executive Park 1207 Route 9, Suite 10 Wappingers Falls, New York 12590 |
|
|
Telephone:
| Telephone:
|
|
|
800-773-3863
| 845-297-3500 |
|
|
| World Wide Web @: | World Wide Web @: |
|
|
ncfunds.com
| ncfunds.com |
The registrant’s Board of Trustees has determined that there is at least one member who qualifies as an audit committee financial expert, as that term is defined under Item 3(b) of Form N-CSR, serving on its audit committee.
As of the date of this report, the registrant’s audit committee financial expert is Mr. James H. Speed, Jr. Mr. Speed is “independent” for purposes of Item 3 of Form N-CSR.
For the fiscal year ended September 30, 2022, these amounts represent aggregate fees billed for professional services rendered by the registrant’s independent accountant, BBD, LLP (“Former Accountant”), in connection with the annual audit of the registrant’s financial statements and for services that are normally provided by the Former Accountant in connection with the registrant’s statutory and regulatory filings or engagements for those fiscal years.
For the fiscal year ended September 30, 2023, these amounts represent aggregate fees billed for professional services rendered by the registrant’s independent accountant, Cohen & Company, Ltd. (“Accountant”), in connection with the annual audit of the registrant’s financial statements and for services that are normally provided by the Accountant in connection with the registrant’s statutory and regulatory filings or engagements for those fiscal years.
There were no additional fees billed in the fiscal year ended September 30, 2023, for assurance and related services by the Accountant that were reasonably related to the performance of the audit of the Fund’s financial statements and that were not reported under paragraph (a) of this Item.
For the fiscal year ended September 30, 2022, these amounts represent professional services rendered by the Former Accountant for tax compliance, tax advice, and tax planning. These services were for the completion of the Fund’s federal and state income tax returns, excise tax returns, and assistance with distribution calculations.
For the fiscal year ended September 30, 2023, these amounts represent professional services rendered by the Accountant for tax compliance, tax advice, and tax planning. These services were for the completion of the Fund’s federal and state income tax returns, excise tax returns, and assistance with distribution calculations.
There were no other fees billed in the fiscal year ended September 30, 2023, for products and services provided by the Accountant, other than the services reported in paragraphs (a) through (c) of this item
Aggregate non-audit fees billed by the Accountant to the Fund for services rendered for the fiscal year ended September 30, 2023, were $3,000. There were no fees billed by the Accountant for non-audit services rendered to the Fund’s investment adviser, or any other entity controlling, controlled by, or under common control with the Fund’s investment adviser.
Not applicable.
A copy of the schedule of investments of unaffiliated issuers as of the close of the reporting period is included as part of the report to shareholders filed under Item 1 of this Form.
Not applicable.
Not applicable.
Not applicable.
None.
Not applicable.
Pursuant to the requirements of the Securities Exchange Act of 1934 and the Investment Company Act of 1940, the registrant has duly caused this report to be signed on its behalf by the undersigned, thereunto duly authorized.
Pursuant to the requirements of the Securities Exchange Act of 1934 and the Investment Company Act of 1940, this report has been signed below by the following persons on behalf of the registrant and in the capacities and on the dates indicated.