UNITED STATES
SECURITIES AND EXCHANGE COMMISSION
Washington, D.C. 20549
FORM N-CSR
CERTIFIED SHAREHOLDER REPORT OF REGISTERED
MANAGEMENT INVESTMENT COMPANIES
Investment Company Act file number 811-22298
Starboard Investment Trust
(Exact name of registrant as specified in charter)
116 South Franklin Street, Rocky Mount, North Carolina 27802
(Address of principal executive offices) (Zip code)
Paracorp Inc.
2140 South Dupont Hwy., Camden, DE 19934
(Name and address of agent for service)
Registrant's telephone number, including area code: 252-972-9922
Date of fiscal year end: May 31
Date of reporting period: May 31, 2024
Item 1. REPORTS TO STOCKHOLDERS.
Adaptive ETFs
ANNUAL REPORT
For the Fiscal Year Ended May 31, 2024
Adaptive Alpha Opportunities ETF
Adaptive Hedged Multi-Asset Income ETF
RH Tactical Outlook ETF
RH Tactical Rotation ETF
This report and the financial statements contained herein are submitted for the general information of the shareholders of the Adaptive ETFs (the “ETFs”). The ETFs’ shares are not deposits or obligations of, or guaranteed by, any depository institution. The ETFs’ shares are not insured by the FDIC, Federal Reserve Board or any other agency, and are subject to investment risks, including possible loss of principal amount invested. Neither the ETFs nor the ETFs’ distributor is a bank.
The ETFs are distributed by Capital Investment Group, Inc., Member FINRA/SIPC, 100 E. Six Forks Road, Suite 200, Raleigh, NC, 27609. There is no affiliation between the ETFs, including their principals, and Capital Investment Group, Inc.
| Table of Contents | |
Letter to Shareholders | ……………………………………………………………………………… | 1 |
| Performance Update | ……………………………………………………………………………… | 3 |
| Schedule of Investments | ……………………………………………………………………………… | 7 |
| Statement of Assets and Liabilities | ……………………………………………………………………………… | 17 |
| Statement of Operations | ……………………………………………………………………………… | 18 |
| Statements of Changes in Net Assets | ……………………………………………………………………………… | 19 |
| Notes to Financial Statements | ……………………………………………………………………………… | 25 |
| Additional Information | ……………………………………………………………………………… | 46 |
Statements in this Annual Report that reflect projections or expectations of future financial or economic performance of the ETFs) and of the market in general and statements of the ETFs’ plans and objectives for future operations are forward-looking statements. No assurance can be given that actual results or events will not differ materially from those projected, estimated, assumed or anticipated in any such forward-looking statements. Important factors that could result in such differences, in addition to the other factors noted with such forward-looking statements, include, without limitation, general economic conditions such as inflation, recession and interest rates. Past performance is not a guarantee of future results. An investor should consider the investment objectives, risks, charges and expenses of the ETFs carefully before investing. The prospectus contains this and other information about the ETFs. A copy of the prospectus is available at https://docs.nottinghamco.com/Adaptive or by calling Shareholder Services at 800-773-3863. The prospectus should be read carefully before investing. |
For More Information on the Funds:
See Our Web site @ adaptivefunds.com
or
Call Our Shareholder Services Group at 800-773-3863.
(Unaudited)
Dear Investor,
We appreciate the opportunity to present the annual report for the fiscal year ended May 31, 2024.
Macro Commentary
As we reflect on the past year, we have seen a significant turnaround in global equity markets. On the strength of the S&P 500 closing at 4,769.81 on December 31, 2023, marking a significant recovery from the previous year, the first half of 2024 has shown resilience. We believe this resilience was attributed to declining inflationary pressures, positive global economic growth, low US unemployment rate, and the pause of an interest rate hiking cycle by the US Federal Reserve and other global central banks.
We feel the overall market sentiment has improved as investors anticipate the peak of inflationary levels. The US economy has remained robust, with consumer prices and inflationary trends slowing down1. The Federal Reserve has maintained the overnight federal funds target interest rate within a range of 5.25-5.50%; however, inflation remains well above the Fed’s long-term goal of 2.00%1. Despite the positive market sentiment, we foresee potential equity and fixed income market risks as investors forecast a soft-landing environment where the Federal Reserve may begin one or more of a series of Federal Fund interest rate cuts in 2024. However, we believe the path for the Federal Reserve reducing interest rates has become clouded as the solid job market and low unemployment rates in the first half of 2024 continue to act as a headwind for lower inflation1. Additionally, gross domestic product (GDP) remains positive and heavy fiscal deficits have offset much of the restrictive monetary policy, thus, creating challenges for the FOMC and path of lowering interest rates2.
Despite the solid job market and low unemployment rates, we believe that other leading economic data are pointing to a potential slowdown. We feel the largest headwinds, for the next several quarters, include the risk of Federal Reserve maintaining ‘higher for longer’ stance on interest rates with tighter lending standards by commercial banks and subsequent slowing leading economic data. Higher interest rates and an inverted yield curve have put pressure on banks’ net margins and lending capacity3. Additionally, higher interest rates have put pressure on the consumer with increasing credit card defaults and mortgage interest rates that remained elevated4. Geopolitical risks through the first half of 2024 have also reinforced persistent inflation pressures5. Ongoing tensions in the Gulf, particularly due to the Gaza war, have posed a high risk to disrupting supply chains and escalations between Israel and Iran could have global implications and US inflationary pressures5. So far in 2024 elevated interest rates, persistent inflation, and heightened geopolitical risks have been tempered. Our view is the US economy will end the first half of 2024 without entering a recession, and corporate earnings will remain strong; however, risks are elevated for the remainder of 2024.
Despite the complex landscape characterized by heightened risks and uncertainties, we remain steadfast in our commitment to navigating these challenges. By staying vigilant, maintaining discipline, and adapting to evolving market dynamics, we strive to fulfill our mission of delivering value and fostering long-term success for our investors.
Thank you for your continued trust and support.
Market and Fund Performance Recap
Recapping market performance, the US large-cap equity market, as measured by the S&P 500 Index, was up 28.19%, and the US fixed income market, as measured by the Bloomberg US Aggregate Bond Index, was up 1.31% for the one-year period ending May 31, 2024. US Small Cap equities, as measured by the Russell 2000 Index, underperformed Large Cap equities at 20.12%. Value, as measured by the S&P 500 Index, underperformed Growth, as measured by the Russell 1000 Growth Index, at 28.19% and 33.60%, respectively, during the same period. The Russell 1000 Growth Index was up 33.60% vs Russell 1000 Value index up 21.71% for the one-year period ending May 31, 2024. The International developed markets have been positive with the S&P Global BMI up 23.45% for the one-year period ending May 31, 2024.
The performance of each Adaptive Fund is shown below. Adaptive’s Risk Management Models have been indicating an environment favorable for higher equity market risk since Q3 2023, and portfolio performance generally reflects a more “risk on” environment. During the 12-month reporting period ended May 31, 2024, Adaptive Alpha Opportunities, Adaptive Hedged Multi Asset Income, and RH Tactical Rotation used put and call options for hedging and income purposes.
1 Minutes of the Federal Open Market Committee, March 19-20, 2024
2 International Monetary Fund, Executive Summary dated April 2024
3 2023 FDIC Risk Review
4 Bloomberg, May 31, 2024
5 BlackRock “Geopolitical risk dashboard”, April 25, 2024
All four Adaptive Funds had options exposure during the reporting period. Adaptive Alpha Opportunities held long and short calls and puts, both for leverage and hedging risk against common stock/ETF positions. Expressed as an approximate monthly average, Adaptive Alpha opportunities options activity impacted monthly performance an average of (0.21%). Adaptive Multi Asset Income held mostly covered calls against common positions for income generation. Expressed as an approximate monthly average, Adaptive Multi Asset Income options activity impacted monthly performance an average of (0.07%).
RH Tactical Rotation held a mixture of long and short calls and puts, as well as some covered call writing against common positions. These positions hedged risk as well as generated income. Expressed as an approximate monthly average, RH Tactical Rotation options activity impacted monthly performance an average of (1.07%).
RH Tactical Outlook had minimal options activity during the reporting period. Expressed as an approximate monthly average, RH Tactical Outlook options activity had an immaterial negative impact on monthly performance.
Adaptive Alpha Opportunities ETF
Adaptive Alpha Opportunities ETF outperformed the Morningstar Moderate Aggressive Target Return Index as the Fund maintained diversification across various US sectors, industries, and international ETFs. For the fiscal year ended May 31, 2024, in the Adaptive Alpha Opportunities ETF, the one-year return on the ETF was 20.01%. This compared to
17.14% for the Morningstar Moderate Aggressive Target Risk TR Index over the same period. The gross expense ratio, as of the Fund’s most recent prospectus dated October 1, 2023, is 1.54%.
Adaptive Hedged Multi-Asset Income ETF
Adaptive Hedged Multi-Asst Income ETF outperformed the iShares Core U.S. Aggregate Bond Index as allocations to covered calls and commodities supported total return. For the fiscal year ended May 31, 2024, in the Adaptive Hedged Multi-Asset Income ETF, the one-year return on the ETF was 9.01%. This compared to 1.31% for the iShares Core US Aggregate Bond Index over the same period. The gross expense ratio, as of the Fund’s most recent prospectus dated October 1, 2023, is 1.68%.
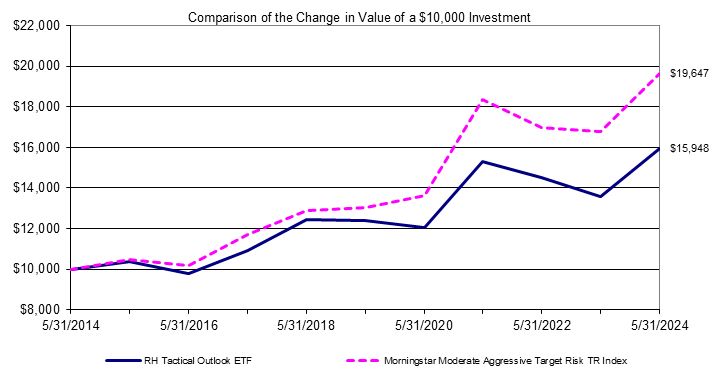
RH Tactical Outlook ETF
RH Tactical Outlook ETF positioned across Large cap, Mid cap, Small Cap, and allocations to Mid and Small caps resulted in slight outperformance vs. Morningstar Moderate Aggressive Target Return Index. For the fiscal year ended May 31, 2024, in the RH Tactical Outlook ETF, the one-year return on the ETF was 17.38%. This compared to 17.14% for the Morningstar Moderate Aggressive Target Risk TR Index over the same time period. The gross expense ratio, as of the Fund’s most recent prospectus dated October 1, 2023, is 1.91%.
RH Tactical Rotation ETF
RH Tactical Rotation ETF maintained a balance of growth and value. A tilt towards growth sectors enhanced performance vs. Morningstar Moderate Aggressive Target Return Index during the period. For the fiscal year ended May 31, 2024, in the RH Tactical Rotation ETF, the one-year return on the ETF was 24.95%. This compared to 17.14% for the Morningstar Moderate Aggressive Target Risk TR Index over the same time period. The gross expense ratio, as of the Fund’s most recent prospectus dated October 1, 2023, is 1.93%.
Thank you for the continued opportunity to serve you.
Greg Rutherford Adaptive Investments | Scott Wetherington Adaptive Investments |
RCADP0624001
| Adaptive Alpha Opportunities ETF |
Performance Update (unaudited) |
| For the period from May 31, 2014 through May 31, 2024 |
| The graph above assumes an initial $10,000 investment and the reinvestment of dividends and capital gains distributions. This graph depicts the performance of Adaptive Alpha Opportunities ETF versus the Morningstar Moderate Aggressive Target Risk TR Index. It is important to note that the ETF is a professionally managed exchange-traded fund while the index is not available for investment and is unmanaged. The comparison is shown for illustrative purposes only. |
| Average Annual Total Returns | |
| | As of | One | Five | Ten | |
| | May 31, 2024 | Year | Year | Year | |
| | Adaptive Alpha Opportunities ETF (a) | 20.01% | 13.46% | 9.88% | |
| | Morningstar Moderate Aggressive Target Risk TR Index | 17.14% | 8.55% | 6.99% | |
| | (a) NAV Return shown. | |
Performance quoted in the previous graph represents past performance, which is no guarantee of future results. Investment return and principal value will fluctuate so that shares, when redeemed, may be worth more or less than their original cost. Current performance may be lower or higher than the performance data quoted. The Advisor has entered into an Expense Limitation Agreement with the Fund under which it has agreed to waive or reduce its fees and assume other expenses of the Fund, if necessary, in an amount that limits the Fund’s annual operating expenses (exclusive of: (i) any front-end or contingent deferred loads; (ii) brokerage fees and commissions, (iii) fees and expenses associated with investments in other collective investment vehicles or derivative instruments (including for example option and swap fees and expenses); (iv) borrowing costs (such as interest and dividend expense on securities sold short); (v) taxes; and (vii) extraordinary expenses, such as litigation expenses (which may include indemnification of Fund officers and Trustees and contractual indemnification of Fund service providers (other than the Advisor)) to not more than 1.39% of the average daily net assets of the Fund. The expense limitation agreement runs through September 30, 2024, and may be terminated by the Board at any time. Without the waiver, the expenses would be 1.54% per the Fund’s most recent prospectus dated October 1, 2023. An investor may obtain performance data, current to the most recent month-end, by visiting ncfunds.com.
The graph and table do not reflect the deduction of taxes that a shareholder would pay on Fund distributions or the redemption of Fund shares. Average annual total returns are historical in nature and measure net investment income and capital gain or loss from portfolio investments assuming reinvestment of distributions.
| Adaptive Hedged Multi-Asset Income ETF |
Performance Update (unaudited) |
| For the period from May 31, 2014 through May 31, 2024 |
| The graph above assumes an initial $10,000 investment and the reinvestment of dividends and capital gains distributions. This graph depicts the performance of Adaptive Hedged Multi-Asset Income ETF versus the Bloomberg Capital US Aggregate Bond Index. It is important to note that the ETF is a professionally managed exchange-traded fund while the index is not available for investment and is unmanaged. The comparison is shown for illustrative purposes only. | |
| |
| Average Annual Total Returns | |
| | As of | One | Five | Ten | |
| | May 31, 2024 | Year | Year | Year | |
| | Adaptive Hedged Multi-Asset Income ETF (a) | 9.01% | 0.39% | 1.93% | |
| | Bloomberg Capital US Aggregate Bond Index | 1.31% | (0.17)% | 1.26% | |
| | (a) NAV Return shown. | |
Performance quoted in the previous graph represents past performance, which is no guarantee of future results. Investment return and principal value will fluctuate so that shares, when redeemed, may be worth more or less than their original cost. Current performance may be lower or higher than the performance data quoted. The Advisor has entered into an Expense Limitation Agreement with the Fund under which it has agreed to waive or reduce its fees and assume other expenses of the Fund, if necessary, in an amount that limits the Fund’s annual operating expenses (exclusive of: (i) any front-end or contingent deferred loads; (ii) brokerage fees and commissions, (iii)fees and expenses associated with investments in other collective investment vehicles or derivative instruments (including for example option and swap fees and expenses); (iv) borrowing costs (such as interest and dividend expense on securities sold short); (v) taxes; and (vi) extraordinary expenses, such as litigation expenses (which may include indemnification of Fund officers and Trustees and contractual indemnification of Fund service providers (other than the Advisor)) to not more than 1.29% of the average daily net assets of the Fund. The expense limitation agreement runs through September 30, 2024, and may be terminated by the Board at any time. Without the waiver, the expenses would be 1.68% per the Fund’s most recent prospectus dated October 1, 2023. An investor may obtain performance data, current to the most recent month-end, by visiting ncfunds.com.
The graph and table do not reflect the deduction of taxes that a shareholder would pay on Fund distributions or the redemption of Fund shares. Average annual total returns are historical in nature and measure net investment income and capital gain or loss from portfolio investments assuming reinvestment of distributions.
| RH Tactical Outlook ETF |
Performance Update (unaudited) |
| For the period from May 31, 2014 through May 31, 2024 |
The graph above assumes an initial $10,000 investment and the reinvestment of dividends and capital gains distributions. This graph depicts the performance of RH Tactical Outlook ETF versus the Morningstar Moderate Aggressive Target Risk TR Index. It is important to note that the ETF is a professionally managed exchange-traded fund while the index is not available for investment and is unmanaged. The comparison is shown for illustrative purposes only.
| |
| |
| Average Annual Total Returns | |
| | As of | One | Five | Ten | |
| | May 31, 2024 | Year | Year | Year | |
| | RH Tactical Outlook ETF (a) | 17.38% | 5.19% | 4.77% | |
| | Morningstar Moderate Aggressive Target Risk TR Index | 17.14% | 8.55% | 6.99% | |
| | (a) NAV Return shown. | |
Performance quoted in the previous graph represents past performance, which is no guarantee of future results. Investment return and principal value will fluctuate so that shares, when redeemed, may be worth more or less than their original cost. Current performance may be lower or higher than the performance data quoted. The Advisor has entered into an Expense Limitation Agreement with the Fund under which it has agreed to waive or reduce its fees and to assume other expenses of the Fund, if necessary, in an amount that limits the Fund's annual operating expenses (exclusive of (i) any front-end or contingent deferred loads; (ii) brokerage fees and commissions; (iii) acquired fund fees and expenses; (iv) fees and expenses associated with investments in other collective investment vehicles or derivative instruments (including, for example, option and swap fees and expenses); (v) borrowing costs (such as interest and dividend expense on securities sold short); (vi) taxes and (vii) extraordinary expenses, such as litigation expenses (which may include indemnification of Fund officers and Trustees and contractual indemnification of Fund service providers) (other than the Advisor)) to not more than 1.25% of the average daily net assets of the Fund through September 30, 2024. The Expense Limitation Agreement may be terminated by the Board of Trustees of the Trust at any time. Without the waiver, the expenses would be 1.91% per the Fund’s most recent prospectus dated October 1, 2023. An investor may obtain performance data, current to the most recent month-end, by visiting ncfunds.com.
The graph and table do not reflect the deduction of taxes that a shareholder would pay on Fund distributions or the redemption of Fund shares. Average annual total returns are historical in nature and measure net investment income and capital gain or loss from portfolio investments assuming reinvestment of distributions.
|
Performance Update (unaudited) |
| For the period from May 31, 2014 through May 31, 2024 |
| The graph above assumes an initial $10,000 investment and the reinvestment of dividends and capital gains distributions. This graph depicts the performance of RH Tactical Rotation ETF versus the Morningstar Moderate Aggressive Target Risk TR Index. It is important to note that the ETF is a professionally managed exchange-traded fund while the index is not available for investment and is unmanaged. The comparison is shown for illustrative purposes only. | |
| |
| | |
| Average Annual Total Returns | |
| | As of | One | Five | Ten | |
| | May 31, 2024 | Year | Year | Year | |
| | RH Tactical Rotation ETF (a) | 24.95% | 5.83% | 5.00% | |
| | Morningstar Moderate Aggressive Target Risk TR Index | 17.14% | 8.55% | 6.99% | |
| | (a) NAV Return shown. | |
Performance quoted in the previous graph represents past performance, which is no guarantee of future results. Investment return and principal value will fluctuate so that shares, when redeemed, may be worth more or less than their original cost. Current performance may be lower or higher than the performance data quoted. The Advisor has entered into an Expense Limitation Agreement with the Fund under which it has agreed to waive or reduce its fees and to assume other expenses of the Fund, if necessary, in an amount that limits the Fund's annual operating expenses (exclusive of (i) any front-end or contingent deferred loads; (ii) brokerage fees and commissions; (iii) acquired fund fees and expenses; (iv) fees and expenses associated with investments in other collective investment vehicles or derivative instruments (including, for example, option and swap fees and expenses); (v) borrowing costs (such as interest and dividend expense on securities sold short); (vi) taxes and (vii) extraordinary expenses, such as litigation expenses (which may include indemnification of Fund officers and Trustees and contractual indemnification of Fund service providers) (other than the Advisor)) to not more than 1.25% of the average daily net assets of the Fund through
September 30, 2024. The Expense Limitation Agreement may be terminated by the Board of Trustees of the Trust at any time. Without the waiver, the expenses would be 1.93% per the Fund’s most recent prospectus dated October 1, 2023. An investor may obtain performance data, current to the most recent month-end, by visiting ncfunds.com.
The graph and table do not reflect the deduction of taxes that a shareholder would pay on Fund distributions or the redemption of Fund shares. Average annual total returns are historical in nature and measure net investment income and capital gain or loss from portfolio investments assuming reinvestment of distributions.
| Adaptive Alpha Opportunities ETF |
| Schedule of Investments |
| As of May 31, 2024 |
| | | | | | | | | | Shares | | Value
(Note 1) | |
| Common Stocks - 55.23% | | | | | |
| | Communications - 4.29% | | | | | |
| | | AT&T Inc | | | | | | | 110,184 | | $ 2,007,552 | |
| | | Booking Holdings Inc | | | | | | | 1,782 | | 6,729,456 | |
| | | Meta Platforms Inc | | | | | | | 6,002 | | 2,801,914 | |
| | | | | | | | | | | | 11,538,922 | |
| | Consumer Discretionary - 4.26% | | | | | | | | | | |
| | | Amazon.com Inc (a) | | | | | | | 20,000 | | 3,528,800 | |
| | | Copart Inc (a) | | | | | | | 46,030 | | 2,442,352 | |
| | | Deckers Outdoor Corp (a) | | | | | | | 3,283 | | 3,591,339 | |
| | | Green Brick Partners Inc (a) | | | | | | | 10,775 | | 588,315 | |
| | | Tri Pointe Homes Inc (a) | | | | | | | 18,850 | | 730,061 | |
| | | Winmark Corp | | | | | | | 1,611 | | 573,355 | |
| | | | | | | | | | | | 11,454,222 | |
| | Consumer Staples - 0.40% | | | | | | | | | | |
| | | elf Beauty Inc (a) | | | | | | | 5,738 | | 1,072,490 | |
| | | | | | | | | | | | | |
| | Energy - 0.03% | | | | | | | | | | |
| | | Exxon Mobil Corp | | | | | | | 410 | | 48,076 | |
| | | Marathon Petroleum Corp | | | | | | | 180 | | 31,790 | |
| | | | | | | | | | | | 79,866 | |
| | Financials - 3.28% | | | | | | | | | | |
| | | Ameriprise Financial Inc | | | | | | | 2,451 | | 1,070,131 | |
| | | Bank of America Corp | | | | | | | 16,074 | | 642,799 | |
| | | Cboe Global Markets Inc | | | | | | | 8,604 | | 1,488,406 | |
| | | Charles Schwab Corp/The | | | | | | | 9,090 | | 666,115 | |
| | | JPMorgan Chase & Co | | | | | | | 4,174 | | 845,778 | |
| | | Progressive Corp/The | | | | | | | 15,325 | | 3,236,333 | |
| | | Raymond James Financial Inc | | | | | | | 7,234 | | 887,974 | |
| | | | | | | | | | | | 8,837,536 | |
| | Health Care - 8.52% | | | | | | | | | | |
| | | Bio-Rad Laboratories Inc (a) | | | | | | | 3 | | 860 | |
| | | Boston Scientific Corp (a) | | | | | | | 66,446 | | 5,021,324 | |
| | | Eli Lilly & Co | | | | | | | 10,326 | | 8,470,831 | |
| | | Novo Nordisk A/S | | | | | | | 10,949 | | 1,481,181 | |
| | | Regeneron Pharmaceuticals Inc (a) | | | | | | | 4,825 | | 4,729,272 | |
| | | Sage Therapeutics Inc (a) | | | | | | | 11,007 | | 122,288 | |
| | | Vertex Pharmaceuticals Inc (a) | | | | | | | 6,799 | | 3,095,857 | |
| | | | | | | | | | | | 22,921,613 | |
| | Industrials - 9.34% | | | | | | | | | | |
| | | Badger Meter Inc | | | | | | | 11,958 | | 2,307,416 | |
| | | Eaton Corp PLC | | | | | | | 7,072 | | 2,353,915 | |
| | | Federal Signal Corp | | | | | | | 9,631 | | 886,244 | |
| | | General Electric Co | | | | | | | 20,000 | | 3,302,800 | |
| | | Howmet Aerospace Inc | | | | | | | 60,669 | | 5,135,631 | |
| | | Hubbell Inc | | | | | | | 1,765 | | 686,391 | |
| | | Ingersoll Rand Inc | | | | | | | 13,062 | | 1,215,419 | |
| | | Moog Inc | | | | | | | 5,525 | | 936,101 | |
| | | Quanta Services Inc | | | | | | | 1,217 | | 335,819 | |
| | | Terex Corp | | | | | | | 10,469 | | 624,685 | |
| | | TransDigm Group Inc | | | | | | | 1,823 | | 2,448,708 | |
| | | Vertiv Holdings Co | | | | | | | 20,228 | | 1,983,760 | |
See Notes to Financial Statements
| Adaptive Alpha Opportunities ETF |
Schedule of Investments (continued) |
| As of May 31, 2024 |
| | | | | | | | | | Shares | | Value
(Note 1) | |
| | Industrials (continued) | | | | | | | | | | |
| | | WESCO International Inc | | | | | | | 3,457 | | $ 620,497 | |
| | | WW Grainger Inc | | | | | | | 2,491 | | 2,295,357 | |
| | | | | | | | | | | | 25,132,743 | |
| | Materials - 0.29% | | | | | | | | | | |
| | | Ecolab Inc | | | | | | | 3,331 | | 773,458 | |
| | | | | | | | | | | | | |
| | Technology - 23.17% | | | | | | | | | | |
| | | Advanced Micro Devices Inc (a) | | | | | | | 32,147 | | 5,365,334 | |
| | | Analog Devices Inc | | | | | | | 121 | | 28,373 | |
| | | Appfolio Inc (a) | | | | | | | 10,649 | | 2,431,380 | |
| | | Apple Inc | | | | | | | 20,954 | | 4,028,407 | |
| | | Axcelis Technologies Inc (a) | | | | | | | 10,997 | | 1,237,053 | |
| | | Broadcom Inc | | | | | | | 1,668 | | 2,216,021 | |
| | | C3.ai Inc (a) | | | | | | | 31,572 | | 933,584 | |
| | | Cadence Design Systems Inc (a) | | | | | | | 4,991 | | 1,428,973 | |
| | | Fair Isaac Corp (a) | | | | | | | 1,499 | | 1,933,605 | |
| | | Manhattan Associates Inc (a) | | | | | | | 2,105 | | 462,132 | |
| | | Maximus Inc | | | | | | | 21,132 | | 1,819,465 | |
| | | Microsoft Corp | | | | | | | 15,959 | | 6,625,060 | |
| | | NVIDIA Corp | | | | | | | 16,461 | | 18,046,688 | |
| | | Oracle Corp | | | | | | | 161 | | 18,868 | |
| | | Salesforce Inc | | | | | | | 15,185 | | 3,559,971 | |
| | | Skyworks Solutions Inc | | | | | | | 6,458 | | 598,398 | |
| | | SPS Commerce Inc (a) | | | | | | | 9,926 | | 1,866,981 | |
| | | Super Micro Computer Inc (a) | | | | | | | 5,025 | | 3,942,163 | |
| | | Synopsys Inc (a) | | | | | | | 3,831 | | 2,148,425 | |
| | | Tyler Technologies Inc (a) | | | | | | | 1,449 | | 696,042 | |
| | | Verisk Analytics Inc | | | | | | | 11,649 | | 2,944,634 | |
| | | | | | | | | | | | 62,331,557 | |
| | Utilities - 1.65% | | | | | | | | | | |
| | | Constellation Energy Corp | | | | | | | 20,400 | | 4,431,900 | |
| | | | | | | | | | | | | |
| | | Total Common Stocks (Cost $124,923,612) | | | | 148,574,307 | |
| | | | | | | | | | | | | |
| Exchange-Traded Products - 35.59% | | | | | | | | | | |
| | Energy - 2.00% | | | | | | | | | | |
| | | Energy Select Sector SPDR Fund | | | | | | | 57,858 | | 5,392,366 | |
| | | | | | | | | | | | Spacer | |
| | Financials - 3.97% | | | | | | | | | | |
| | | Financial Select Sector SPDR Fund | | | | | | | 37,691 | | 1,569,453 | |
| | | iShares U.S. Broker-Dealers & Securities Exchanges ETF | | | | | | 1 | | 117 | |
| | | SPDR S&P Capital Markets ETF | | | | | | | 26,328 | | 2,926,936 | |
| | | SPDR S&P Regional Banking ETF | | | | | | | 216 | | 10,552 | |
| | | Vanguard Financials ETF | | | | | | | 61,000 | | 6,161,610 | |
| | | | | | | | | | | | 10,668,668 | |
| | Global - 0.48% | | | | | | | | | | |
| | | Global X MSCI Argentina ETF | | | | | | | 20,661 | | 1,296,684 | |
| | | | | | | | | | | | Spacer | |
| | Health Care - 0.01% | | | | | | | | | | |
| | | iShares U.S. Medical Devices ETF | | | | | | | 276 | | 15,326 | |
| | | | | | | | | | | | | |
See Notes to Financial Statements
| Adaptive Alpha Opportunities ETF |
Schedule of Investments (continued) |
| As of May 31, 2024 |
| | | | | | | | | | Shares | | Value
(Note 1) | |
Exchange-Traded Products (continued) | | | | | |
| | Industrials - 0.84% | | | | | | | | | | |
| | | Industrial Select Sector SPDR Fund | | | | | | | 2,164 | | $ 267,276 | |
| | | SPDR S&P Aerospace & Defense ETF | | | | | | | 13,804 | | 1,981,840 | |
| | | | | | | | | | | | 2,249,116 | |
| | Real Estate - 0.00% | | | | | | | | | | |
| | | SPDR S&P Homebuilders ETF | | | | | | | 100 | | 10,530 | |
| | | | | | | | | | | | | |
| | Technology - 28.29% | | | | | | | | | | |
| | | ALPS O'Shares Global Internet Giants ETF (a) | | | | | | | 318 | | 11,801 | |
| | | Invesco QQQ Trust Series 1 | | | | | | | 34,945 | | 15,750,061 | |
| | | Invesco S&P 500 Equal Weight Technology ETF | | | | | | | 152,430 | | 5,315,234 | |
| | | Technology Select Sector SPDR Fund | | | | | | | 113,359 | | 23,823,527 | |
| | | VanEck Semiconductor ETF (a) | | | | | | | 129,713 | | 31,193,382 | |
| | | | | | | | | | | | 76,094,005 | |
| | | Total Exchange-Traded Products (Cost $75,510,317) | | | | 95,726,695 | |
| | | | | | | | | | | | | |
| | | | Number of Contracts | | Exercise Price | | Exercise Date | | Notional Value | | | |
| Call Options Purchased - 10.63% | | | | | | | | | | |
| | | Advanced Micro Devices Inc | 100 | | $145 | | 6/21/2024 | | $ 1,450,000 | | 233,500 | |
| | | Advanced Micro Devices Inc | 100 | | 180 | | 6/21/2024 | | 1,800,000 | | 25,550 | |
| | | Apple Inc | 300 | | 170 | | 6/21/2024 | | 5,100,000 | | 702,750 | |
| | | Constellation Energy Corp | 600 | | 220 | | 6/21/2024 | | 13,200,000 | | 381,000 | |
| | | Eli Lilly & Co | 150 | | 815 | | 6/21/2024 | | 12,225,000 | | 333,852 | |
| | | Energy Select Sector SPDR Fund | 500 | | 98 | | 6/21/2024 | | 4,900,000 | | 10,500 | |
| | | Fair Isaac Corp | 50 | | 1,470 | | 6/21/2024 | | 7,350,000 | | 14,625 | |
| | | Howmet Aerospace Inc | 500 | | 85 | | 6/21/2024 | | 4,250,000 | | 83,750 | |
| | | Invesco QQQ Trust Series 1 | 200 | | 455 | | 6/21/2024 | | 9,100,000 | | 105,300 | |
| | | Invesco QQQ Trust Series 1 | 200 | | 460 | | 6/21/2024 | | 9,200,000 | | 61,900 | |
| | | Novo Nordisk A/S | 100 | | 130 | | 6/21/2024 | | 1,300,000 | | 73,000 | |
| | | NVIDIA Corp | 200 | | 940 | | 6/7/2024 | | 18,800,000 | | 3,155,000 | |
| | | NVIDIA Corp | 100 | | 1,105 | | 6/7/2024 | | 11,050,000 | | 257,000 | |
| | | NVIDIA Corp | 200 | | 1,120 | | 6/7/2024 | | 22,400,000 | | 398,500 | |
| | | NVIDIA Corp | 100 | | 945 | | 6/14/2024 | | 9,450,000 | | 1,569,250 | |
| | | NVIDIA Corp | 100 | | 850 | | 6/21/2024 | | 8,500,000 | | 2,508,500 | |
| | | NVIDIA Corp | 339 | | 900 | | 6/21/2024 | | 30,510,000 | | 6,860,513 | |
| | | NVIDIA Corp | 300 | | 930 | | 6/21/2024 | | 27,900,000 | | 5,229,000 | |
| | | NVIDIA Corp | 100 | | 1,060 | | 6/21/2024 | | 10,600,000 | | 714,750 | |
| | | NVIDIA Corp | 100 | | 1,120 | | 6/21/2024 | | 11,200,000 | | 390,250 | |
| | | NVIDIA Corp | 200 | | 1,135 | | 6/21/2024 | | 22,700,000 | | 704,500 | |
| | | NVIDIA Corp | 200 | | 1,140 | | 6/21/2024 | | 22,800,000 | | 668,500 | |
| | | NVIDIA Corp | 100 | | 1,130 | | 7/19/2024 | | 11,300,000 | | 594,000 | |
| | | Super Micro Computer Inc | 50 | | 775 | | 6/7/2024 | | 3,875,000 | | 154,365 | |
| | | Super Micro Computer Inc | 50 | | 825 | | 6/14/2024 | | 4,125,000 | | 134,500 | |
| | | Super Micro Computer Inc | 50 | | 760 | | 6/21/2024 | | 3,800,000 | | 270,391 | |
| | | Super Micro Computer Inc | 100 | | 880 | | 6/21/2024 | | 8,800,000 | | 195,000 | |
| | | Super Micro Computer Inc | 50 | | 905 | | 6/21/2024 | | 4,525,000 | | 75,000 | |
| | | Technology Select Sector SPDR Fund | 86 | | 195 | | 6/21/2024 | | 1,677,000 | | 138,030 | |
| | | Technology Select Sector SPDR Fund | 300 | | 210 | | 6/21/2024 | | 6,300,000 | | 116,250 | |
| | | Tesla Inc | 200 | | 150 | | 6/21/2024 | | 3,000,000 | | 585,000 | |
See Notes to Financial Statements
| Adaptive Alpha Opportunities ETF |
Schedule of Investments (continued) |
| As of May 31, 2024 |
| | | | Number of Contracts | | Exercise Price | | Exercise Date | | Notional Value | | Value
(Note 1) | |
Call Options Purchased (continued) | | | | | |
| | | VanEck Semiconductor ETF | 200 | | $ 225 | | 6/21/2024 | | $ 4,500,000 | | $ 348,000 | |
| | | VanEck Semiconductor ETF | 500 | | 235 | | 6/21/2024 | | 11,750,000 | | 497,500 | |
| | | VanEck Semiconductor ETF | 500 | | 240 | | 6/21/2024 | | 12,000,000 | | 345,000 | |
| | | VanEck Semiconductor ETF | 300 | | 245 | | 6/21/2024 | | 7,350,000 | | 135,000 | |
| | | Vertiv Holdings Co | 200 | | 95 | | 6/21/2024 | | 1,900,000 | | 96,800 | |
| | | Vistra Corp | 100 | | 88 | | 6/21/2024 | | 880,000 | | 117,000 | |
| | | Vistra Corp | 500 | | 95 | | 6/21/2024 | | 4,750,000 | | 300,000 | |
| | | Call Options Purchased (Premium Paid $18,161,822) | | | | 28,583,326 | |
| | | | | | | | | | | | | |
| Put Options Purchased - 3.07% | | | | | | | | | | |
| | | Advanced Micro Devices Inc | 200 | | 165 | | 6/21/2024 | | 3,300,000 | | 110,000 | |
| | | AT&T Inc | 500 | | 18 | | 6/21/2024 | | 900,000 | | 14,500 | |
| | | AT&T Inc | 500 | | 18 | | 7/19/2024 | | 900,000 | | 27,000 | |
| | | Booking Holdings Inc | 25 | | 3,420 | | 6/21/2024 | | 8,550,000 | | 9,250 | |
| | | Eli Lilly & Co | 150 | | 810 | | 6/21/2024 | | 12,150,000 | | 262,848 | |
| | | Howmet Aerospace Inc | 500 | | 65 | | 6/21/2024 | | 3,250,000 | | 53,750 | |
| | | Meta Platforms Inc | 100 | | 490 | | 6/21/2024 | | 4,900,000 | | 264,500 | |
| | | Novo Nordisk A/S | 100 | | 125 | | 6/21/2024 | | 1,250,000 | | 4,150 | |
| | | NVIDIA Corp | 500 | | 925 | | 6/7/2024 | | 46,250,000 | | 30,500 | |
| | | NVIDIA Corp | 100 | | 935 | | 6/7/2024 | | 9,350,000 | | 7,250 | |
| | | NVIDIA Corp | 300 | | 945 | | 6/7/2024 | | 28,350,000 | | 26,100 | |
| | | NVIDIA Corp | 200 | | 1,045 | | 6/7/2024 | | 20,900,000 | | 197,500 | |
| | | NVIDIA Corp | 400 | | 1,055 | | 6/7/2024 | | 42,200,000 | | 448,000 | |
| | | NVIDIA Corp | 200 | | 1,120 | | 6/7/2024 | | 22,400,000 | | 846,000 | |
| | | NVIDIA Corp | 300 | | 875 | | 6/21/2024 | | 26,250,000 | | 72,450 | |
| | | NVIDIA Corp | 200 | | 900 | | 6/21/2024 | | 18,000,000 | | 64,000 | |
| | | NVIDIA Corp | 600 | | 945 | | 6/21/2024 | | 56,700,000 | | 307,500 | |
| | | NVIDIA Corp | 300 | | 950 | | 6/21/2024 | | 28,500,000 | | 204,000 | |
| | | NVIDIA Corp | 100 | | 1,120 | | 6/21/2024 | | 11,200,000 | | 604,250 | |
| | | NVIDIA Corp | 300 | | 1,135 | | 6/21/2024 | | 34,050,000 | | 2,092,500 | |
| | | NVIDIA Corp | 100 | | 1,140 | | 6/21/2024 | | 11,400,000 | | 725,000 | |
| | | NVIDIA Corp | 100 | | 1,130 | | 7/19/2024 | | 11,300,000 | | 849,750 | |
| | | Regeneron Pharmaceuticals Inc | 25 | | 900 | | 6/21/2024 | | 2,250,000 | | 9,375 | |
| | | SPDR S&P 500 ETF Trust | 300 | | 500 | | 6/21/2024 | | 15,000,000 | | 19,800 | |
| | | SPDR S&P 500 ETF Trust | 500 | | 502 | | 6/21/2024 | | 25,100,000 | | 37,750 | |
| | | Super Micro Computer Inc | 50 | | 905 | | 6/21/2024 | | 4,525,000 | | 652,000 | |
| | | Technology Select Sector SPDR Fund | 200 | | 205 | | 6/21/2024 | | 4,100,000 | | 29,600 | |
| | | VanEck Semiconductor ETF | 200 | | 235 | | 6/7/2024 | | 4,700,000 | | 30,200 | |
| | | VanEck Semiconductor ETF | 100 | | 235 | | 6/21/2024 | | 2,350,000 | | 38,000 | |
| | | VanEck Semiconductor ETF | 200 | | 250 | | 6/21/2024 | | 5,000,000 | | 214,000 | |
| | | Vistra Corp | 100 | | 88 | | 6/21/2024 | | 880,000 | | 8,000 | |
| | | Total Put Options Purchased (Premiums Paid $19,167,365) | | | | 8,259,523 | |
| | | | | | | | | | | | | |
| Investments, at Value (Cost $237,763,116) - 104.52% | | | | $281,143,851 | |
| Options Written (Premiums Received $10,598,518) - (6.48)% | | | | (17,436,711) |
|
| Other Assets Less Liabilities - 1.96% | | | | 5,284,240 | |
| Net Assets - 100.00% | | | | $268,991,380 | |
| | | | | | | | | | | | | |
| (a) | Non-income producing investment |
See Notes to Financial Statements
| Adaptive Alpha Opportunities ETF |
| Schedule of Options Written |
| As of May 31, 2024 |
| | | Number of Contracts | | Exercise Price | | Exercise Date | | Notional Value | | Value
(Note 1) | |
| Call Options Written - (5.88)% | | | | | | | | | | |
| | Apple Inc | (300 | ) | $ 190 | | 6/21/2024 | | $ (5,700,000 | ) | $ (173,250 | ) |
| | Booking Holdings Inc | (25 | ) | 3,800 | | 6/21/2024 | | (9,500,000 | ) | (167,375 | ) |
| | Constellation Energy Corp | (300 | ) | 280 | | 8/16/2024 | | (8,400,000 | ) | (46,874 | ) |
| | Eli Lilly & Co | (100 | ) | 880 | | 7/19/2024 | | (8,800,000 | ) | (109,283 | ) |
| | Microsoft Corp | (100 | ) | 450 | | 6/21/2024 | | (4,500,000 | ) | (3,050 | ) |
| | NVIDIA Corp | (200 | ) | 1,050 | | 6/21/2024 | | (21,000,000 | ) | (1,532,000 | ) |
| | NVIDIA Corp | (400 | ) | 1,150 | | 6/21/2024 | | (46,000,000 | ) | (1,148,000 | ) |
| | NVIDIA Corp | (200 | ) | 1,170 | | 6/21/2024 | | (23,400,000 | ) | (460,500 | ) |
| | NVIDIA Corp | (500 | ) | 1,200 | | 6/21/2024 | | (60,000,000 | ) | (826,250 | ) |
| | NVIDIA Corp | (250 | ) | 1,100 | | 7/19/2024 | | (27,500,000 | ) | (1,867,500 | ) |
| | NVIDIA Corp | (600 | ) | 1,250 | | 7/19/2024 | | (75,000,000 | ) | (1,531,500 | ) |
| | NVIDIA Corp | (100 | ) | 1,300 | | 7/19/2024 | | (13,000,000 | ) | (168,000 | ) |
| | NVIDIA Corp | (100 | ) | 1,350 | | 7/19/2024 | | (13,500,000 | ) | (114,000 | ) |
| | Regeneron Pharmaceuticals Inc | (25 | ) | 980 | | 6/21/2024 | | (2,450,000 | ) | (52,625 | ) |
| | Super Micro Computer Inc | (50 | ) | 840 | | 6/21/2024 | | (4,200,000 | ) | (149,000 | ) |
| | Super Micro Computer Inc | (50 | ) | 900 | | 6/21/2024 | | (4,500,000 | ) | (73,555 | ) |
| | Super Micro Computer Inc | (150 | ) | 1,050 | | 6/21/2024 | | (15,750,000 | ) | (49,500 | ) |
| | Super Micro Computer Inc | (100 | ) | 1,100 | | 6/21/2024 | | (11,000,000 | ) | (21,500 | ) |
| | Super Micro Computer Inc | (50 | ) | 1,000 | | 6/28/2024 | | (5,000,000 | ) | (42,500 | ) |
| | Super Micro Computer Inc | (50 | ) | 1,000 | | 7/19/2024 | | (5,000,000 | ) | (96,788 | ) |
| | Technology Select Sector SPDR Fund | (100 | ) | 180 | | 6/21/2024 | | (1,800,000 | ) | (309,000 | ) |
| | Technology Select Sector SPDR Fund | (200 | ) | 200 | | 6/21/2024 | | (4,000,000 | ) | (232,500 | ) |
| | Tesla Inc | (200 | ) | 195 | | 6/21/2024 | | (3,900,000 | ) | (47,200 | ) |
| | VanEck Semiconductor ETF | (100 | ) | 160 | | 6/21/2024 | | (1,600,000 | ) | (785,500 | ) |
| | VanEck Semiconductor ETF | (400 | ) | 175 | | 6/21/2024 | | (7,000,000 | ) | (2,544,000 | ) |
| | VanEck Semiconductor ETF | (400 | ) | 180 | | 6/21/2024 | | (7,200,000 | ) | (2,346,000 | ) |
| | VanEck Semiconductor ETF | (200 | ) | 195 | | 6/21/2024 | | (3,900,000 | ) | (880,000 | ) |
| | Vertiv Holdings Co | (200 | ) | 110 | | 7/19/2024 | | (2,200,000 | ) | (49,199 | ) |
| | Call Options Written (Premium Received $6,262,643) | | | | (15,826,448 | ) |
| | | | | | | | | | | | |
| Put Options Written - (0.60)% | | | | | | | | | | |
| | Booking Holdings Inc | (25 | ) | 3,100 | | 6/21/2024 | | (7,750,000 | ) | (5,625 | ) |
| | Eli Lilly & Co | (100 | ) | 730 | | 7/19/2024 | | (7,300,000 | ) | (42,913 | ) |
| | Meta Platforms Inc | (100 | ) | 420 | | 6/21/2024 | | (4,200,000 | ) | (11,050 | ) |
| | NVIDIA Corp | (100 | ) | 650 | | 6/21/2024 | | (6,500,000 | ) | (3,250 | ) |
| | NVIDIA Corp | (100 | ) | 700 | | 6/21/2024 | | (7,000,000 | ) | (5,250 | ) |
| | NVIDIA Corp | (100 | ) | 720 | | 6/21/2024 | | (7,200,000 | ) | (6,150 | ) |
| | NVIDIA Corp | (100 | ) | 750 | | 6/21/2024 | | (7,500,000 | ) | (7,900 | ) |
| | NVIDIA Corp | (400 | ) | 780 | | 6/21/2024 | | (31,200,000 | ) | (41,000 | ) |
| | NVIDIA Corp | (100 | ) | 785 | | 6/21/2024 | | (7,850,000 | ) | (10,600 | ) |
| | NVIDIA Corp | (400 | ) | 790 | | 6/21/2024 | | (31,600,000 | ) | (44,600 | ) |
| | NVIDIA Corp | (400 | ) | 960 | | 6/21/2024 | | (38,400,000 | ) | (316,000 | ) |
| | NVIDIA Corp | (100 | ) | 1,060 | | 6/21/2024 | | (10,600,000 | ) | (320,000 | ) |
| | NVIDIA Corp | (250 | ) | 750 | | 7/19/2024 | | (18,750,000 | ) | (50,625 | ) |
| | NVIDIA Corp | (300 | ) | 900 | | 7/19/2024 | | (27,000,000 | ) | (295,500 | ) |
| | NVIDIA Corp | (100 | ) | 975 | | 7/19/2024 | | (9,750,000 | ) | (231,000 | ) |
| | Regeneron Pharmaceuticals Inc | (25 | ) | 840 | | 6/21/2024 | | (2,100,000 | ) | (6,000 | ) |
| | Super Micro Computer Inc | (100 | ) | 700 | | 6/21/2024 | | (7,000,000 | ) | (164,000 | ) |
| | VanEck Semiconductor ETF | (200 | ) | 230 | | 6/21/2024 | | (4,600,000 | ) | (48,800 | ) |
| | Put Options Written (Premium Received $4,335,875) | | | | (1,610,263 | ) |
| Total Options Written (Premiums Received $10,598,518) - (6.48)% | | $ (17,436,711 | ) |
See Notes to Financial Statements
| Adaptive Alpha Opportunities ETF |
| Summary of Investments by Sector |
| As of May 31, 2024 |
| | % of Net Assets | | Value | |
| Common Stocks: | | | | |
| Communications | 4.29% | | $ 11,538,922 | |
| Consumer Discretionary | 4.26% | | 11,454,222 | |
| Consumer Staples | 0.40% | | 1,072,490 | |
| Energy | 0.03% | | 79,866 | |
| Financials | 3.28% | | 8,837,536 | |
| Health Care | 8.52% | | 22,921,613 | |
| Industrials | 9.34% | | 25,132,743 | |
| Materials | 0.29% | | 773,458 | |
| Technology | 23.17% | | 62,331,557 | |
| Utilities | 1.65% | | 4,431,900 | |
| Exchange-Traded Products: | | | | |
| Energy Fund | 2.00% | | 5,392,366 | |
| Financials | 3.97% | | 10,668,668 | |
| Global | 0.48% | | 1,296,684 | |
| Health Care | 0.01% | | 15,326 | |
| Industrial | 0.84% | | 2,249,116 | |
| Real Estate | 0.00% | | 10,530 | |
| Technology | 28.29% | | 76,094,005 | |
| Call Options Purchased | 10.63% | | 28,583,326 | |
| Put Options Purchased | 3.07% | | 8,259,523 | |
| Options Written | (6.48)% | | (17,436,711 | ) |
| Other Assets Less Liabilities | 1.96% | | 5,284,240 | |
| Total Net Assets | 100.00% | | $268,991,380 | |
See Notes to Financial Statements
| Adaptive Hedged Multi-Asset Income ETF |
| Consolidated Schedule of Investments | |
| As of May 31, 2024 |
| | | | | | | | | | Shares | | Value
(Note 1) | |
| Exchange-Traded Products - 88.57% | | | | | | | | | | |
| | Commodity Funds - 25.30% | | | | | | | | | | |
| | | Credit Suisse X-Links Gold Shares Covered Call ETN | | | | | | | 26,487 | | $ 3,929,611 | |
| | | United States Oil Fund LP (a) | | | | | | | 11,664 | | 872,701 | |
| | | | | | | | | | | | 4,802,312 | |
| | Debt Funds - 18.75% | | | | | | | | | | |
| | | iShares 20+ Year Treasury Bond ETF | | | | | | | 39,352 | | 3,559,388 | |
| | | | | | | | | | | | | |
| | Large-Cap Funds - 40.01% | | | | | | | | | | |
| | | Invesco QQQ Trust Series 1 | | | | | | | 8,502 | | 3,831,937 | |
| | | SPDR S&P 500 ETF Trust | | | | | | | 7,136 | | 3,763,312 | |
| | | | | | | | | | | | 7,595,249 | |
| | Small-Cap Funds - 4.51% | | | | | | | | | | |
| | | iShares Russell 2000 ETF | | | | | | | 4,156 | | 855,180 | |
| | | Exchange-Traded Products (Cost $16,678,857) | | | | | | | | | 16,812,129 | |
| | | | | | | | | | | | | |
| | | | Number of Contracts | | Exercise Price | | Exercise Date | | Notional Value | | | |
| Call Options Purchased - 0.08% | | | | | | | | | | |
| | | SPDR S&P 500 ETF Trust | 71 | | $550 | | 7/31/2024 | | $3,905,000 | | 14,697 | |
| | | | | | | | | | | | | |
| Put Options Purchased - 0.28% | | | | | | | | | | |
| | | SPDR S&P 500 ETF Trust | 71 | | 525 | | 7/31/2024 | | 3,727,500 | | 53,428 | |
| | | | | | | | | | | | | |
| Collateralized Mortgage Obligations - 1.88% | | | Principal | | Interest Rate | | Maturity Date | | | |
| | | Alternative Loan Trust 2005-J11 | | | $88,704 | | 5.000% | | 11/25/2020 | | 67,937 | |
| | | Alternative Loan Trust 2006-28CB | | | 528,323 | | 6.500% | | 10/25/2036 | | 170,724 | |
| | | American Home Mortgage Investment Trust 2004-1 | | | 142,851 | | 7.737% | | 4/25/2044 | | 119,082 | |
| | | Total Collateralized Mortgage Obligations (Cost $452,582) | | | | | | | | 357,743 | |
| | | | | | | | | | | | | |
| Short-Term Investment - 0.59% | | | | | | | | | | |
| | | Fidelity Government Portfolio, 5.20% (b) | | | | | | | Shares | | | |
| | | (Cost $111,524) | | | | | | | 111,524 | | 111,524 | |
| | | | | | | | | | | | | |
| Investments, at Value (Cost $17,311,324) - 91.40% | | | | | | | | | $17,349,521 | |
| Options Written (Premiums Received $46,837) - (0.25)% | | | | | | | | | (47,429) |
|
| Other Assets Less Liabilities - 8.85% | | | | | | | | | 1,679,984 | |
| Net Assets - 100.00% | | | | | | | | | $18,982,076 | |
| | | | | | | | | | | | | |
| (a) | Non-income producing |
| (b) | Represents 7-day effective SEC yield as of November 30, 2023. |
See Notes to Financial Statements
| | Adaptive Hedged Multi-Asset Income ETF |
| | Consolidated Schedule of Options Written |
| | As of May 31, 2024 |
| | | | Number of Contracts | | Exercise Price | | Exercise Date | | Notional Value | | | Value
(Note 1) | |
| Call Options Written - (0.25)% | | | | | | | | | | | |
| | | Invesco QQQ Trust Series 1 | (85) |
| $462 | | 6/3/2024 | | $(3,927,000) |
| | $ (85 | ) |
| | | iShares 20+ Year Treasury Bond ETF | (390) |
| 90 | | 6/5/2024 | | (3,510,000) |
| | (23,985 | ) |
| | | SPDR S&P 500 ETF Trust | (71) |
| 545 | | 7/31/2024 | | (3,869,500) |
| | (23,359 | ) |
| | | Call Options Written (Premium Received $46,837) | | | | | $(47,429 | ) |
| Summary of Investments by Sector | % of Net Assets | | Value | |
| Exchange-Traded Products | | | | |
| Commodity Funds | 25.30% | | $ 4,802,312 | |
| Debt Fund | 18.75% | | 3,559,388 | |
| Large-Cap Funds | 40.01% | | 7,595,249 | |
| Small-Cap Fund | 4.51% | | 855,180 | |
| Call Options Purchased | 0.08% | | 14,697 | |
| Put Options Purchased | 0.28% | | 53,428 | |
| Collateralized Mortgage Obligations | 1.88% | | 357,743 | |
| Short-Term Investment | 0.59% | | 111,524 | |
| Options Written | (0.25)% | | (47,429 | ) |
| Other Assets Less Liabilities | 8.85% | | 1,679,984 | |
| Total Net Assets | 100.00% | | $18,982,076 | |
See Notes to Financial Statements
| RH Tactical Outlook ETF | |
| Schedule of Investments | |
| As of May 31, 2024 | |
| | | | | | | | | | Shares | | Value
(Note 1) | | |
| Exchange-Traded Products - 99.87% | | | | | | | | | | | |
| | Commodity Funds - 8.53% | | | | | | | | | | | |
| | | iShares Silver Trust (a) | | | | | | | 14,064 | | $ 390,417 | | |
| | | SPDR Gold Shares (a) | | | | | | | 1,966 | | 423,280 | | |
| | | | | | | | | | | | 813,697 | | |
| | Large-Cap Funds - 50.79% | | | | | | | | | | | |
| | | SPDR S&P 500 ETF Trust | | | | | | | 9,188 | | 4,845,475 | | |
| | | | | | | | | | | | | | |
| | Mid-Cap Funds - 30.22% | | | | | | | | | | | |
| | | SPDR Portfolio S&P 400 Mid Cap ETF | | | | | | | 55,052 | | 2,883,624 | | |
| | | | | | | | | | | | | | |
| | Small-Cap Funds - 10.33% | | | | | | | | | | | |
| | | iShares Russell 2000 ETF | | | | | | | 4,790 | | 985,638 | | |
| | | | | | | | | | | | | | |
| Investments, at Value (Cost $8,111,066) - 99.87% | | $9,528,434 | | |
| Other Assets Less Liabilities - 0.13% | | 12,221 | | |
| Net Assets - 100.00% | | $9,540,655 | | |
| (a) | Non-income producing |
| Summary of Investments by Sector | % of Net Assets | | Value | |
| Exchange-Traded Products | | | | |
| Commodity Funds | 8.53% | | $ 813,697 | |
| Large-Cap Funds | 50.79% | | 4,845,475 | |
| Mid-Cap Funds | 30.22% | | 2,883,624 | |
| Small-Cap Funds | 10.33% | | 985,638 | |
| Other Assets Less Liabilities | 0.13% | | 12,221 | |
| Total Net Assets | 100.00% | | $9,540,655 | |
See Notes to Financial Statements
| RH Tactical Rotation ETF |
| Schedule of Investments |
| As of May 31, 2024 |
| | | | | | | | | | Shares | | Value
(Note 1) | |
| Exchange-Traded Products - 100.59% | | | | | | | | | | |
| | Communications - 15.08% | | | | | | | | | | |
| | | Communication Services Select Sector SPDR Fund | | 26,020 | | $ 2,166,425 | |
| | | | | | | | | | | | | |
| | Large-Cap Funds - 49.82% | | | | | | | | | | |
| | | SPDR Portfolio S&P 500 Growth ETF | | 38,768 | | 2,907,988 | |
| | | SPDR S&P 500 ETF Trust | | 8,057 | | 4,249,020 | |
| | | | | | | | | | | | 7,157,008 | |
| | Technology - 35.69% | | | | | | | | | | |
| | | Technology Select Sector SPDR Fund | | 10,644 | | 2,236,943 | |
| | | VanEck Semiconductor ETF | | 12,022 | | 2,891,051 | |
| | | | | | | | | | | | 5,127,994 | |
| | | Total Exchange-Traded Products (Cost $12,072,075) | | | | 14,451,427 | |
| | | | Number of Contracts | | Exercise Price | | Exercise Date | | Notional Value | | | |
| Call Options Purchased - 0.11% | | | | | | | | | | |
| | | SPDR S&P 500 ETF Trust (Premiums Paid $20,660) | 80 | | $550 | | 7/31/2024 | | $4,400,000 | | 16,560 | |
| | | | | | | | | | | | | |
| Put Options Purchased - 0.42% | | | | | | | | | | |
| | | SPDR S&P 500 ETF Trust (Premiums Paid $56,366) | 80 | | 525 | | 7/31/2024 | | 4,200,000 | | 60,200 | |
| | | | | | | | | | | | | |
| Investments, at Value (Cost $12,149,100) - 101.12% | | $14,528,187 | |
| Options Written (Premiums Received $31,124) - (0.18)% | | (26,320) |
|
| Liabilities in Excess of Other Assets - (0.94)% | | (134,803) |
|
| Net Assets - 100.00% | | $14,367,064 | |
| | | | | | | | | | | | | |
| RH Tactical Rotation ETF |
| Schedule of Options Written |
| As of May 31, 2024 |
| | | | Number of Contracts | | Exercise Price | | Exercise Date | | Notional Value | | Value
(Note 1) | |
| Call Options Written - (0.18)% | | | | | | | | | | |
| | | SPDR S&P 500 ETF Trust (Premium Received $31,124) | (80) |
| $545 | | 7/31/2024 | | $(4,360,000) |
| $ (26,320 | ) | |
| Summary of Investments by Sector | % of Net Assets | | Value | |
| Exchange-Traded Products | | | | |
| Communications Fund | 15.08% | | $ 2,166,425 | |
| Large-Cap Fund | 49.82% | | 7,157,008 | |
| Technology Funds | 35.69% | | 5,127,994 | |
| Call Options Purchased | 0.11% | | 16,560 | |
| Put Options Purchased | 0.42% | | 60,200 | |
| Options Written | (0.18)% | | (26,320 | ) |
| Liabilities in Excess of Other Assets | (0.94%) | | (134,803 | ) |
| Total Net Assets | 100.00% | | $14,367,064 | |
See Notes to Financial Statements
|
| Statement of Assets and Liabilities |
| As of May 31, 2024 | | | | | | | | | | | | |
| | | | | Adaptive Alpha Opportunities ETF | | Adaptive Hedged Multi-Asset Income ETF (a) | | | RH Tactical Outlook ETF | | RH Tactical Rotation ETF |
| Assets: | | | | | | | | |
| | Investments, at value | | $281,143,851 | | | $17,349,521 | | | $ 9,528,434 | | | $14,528,187 | |
| | Cash | | - | | | 1,711,597 | | | 40,170 | | | - | |
| | Receivables: | | | | | | | | | | | | |
| | | Investment sold | | 101,679,258 | | | 996 | | | - | | | - | |
| | | Dividends | | 53,913 | | | - | | | - | | | - | |
| | | Interest | | 28,644 | | | 4,300 | | | - | | | - | |
| | | Due from Advisor | | - | | | 326 | | | 124 | | | - | |
| | | Prepaid expenses | | 5,215 | | | 3,600 | | | 3,117 | | | 3,104 | |
| | Total assets | | 382,910,881 | | | 19,070,340 | | | 9,571,845 | | | 14,531,291 | |
| Liabilities: | | | | | | | | | | | | |
| | Options written, at value | | 17,436,711 | | | 47,429 | | | - | | | 26,320 | |
| | | Due to custodian | | 6,232,695 | | | - | | | - | | | 96,492 | |
| | Payables: | | | | | | | | | | | | |
| | | Investments purchased | | 90,178,756 | | | - | | | - | | | - | |
| | Accrued expenses: | | | | | | | | | | | | |
| | | Advisory fees | | 14,787 | | | - | | | - | | | 255 | |
| | | Professional fees | | 20,508 | | | 21,237 | | | 17,446 | | | 18,352 | |
| | | Trustee fees and meeting expenses | | 2,007 | | | 2,225 | | | 2,097 | | | 2,069 | |
| | | Operational expenses | | 33,845 | | | 17,184 | | | 11,453 | | | 20,540 | |
| | | Other expenses | | 192 | | | 189 | | | 194 | | | 199 | |
| | Total liabilities | | 113,919,501 | | | 88,264 | | | 31,190 | | | 164,227 | |
| Total Net Assets | | $268,991,380 | | | $18,982,076 | | | $9,540,655 | | | $14,367,064 | |
| Net Assets Consist of: | | | | | | | | | | | | |
| | Paid in capital | | $250,346,138 | | | $27,742,481 | | | $12,567,135 | | | $19,387,538 | |
| | Accumulated earnings (deficit) | | 18,645,242 | | | (8,760,405 | ) | (3,026,480 | ) | (5,020,474 | ) |
| Total Net Assets | | $268,991,380 | | | $18,982,076 | | | $ 9,540,655 | | | $14,367,064 | |
| ETF Shares Outstanding, no par value | | | | | | | | | | | | |
| | (unlimited authorized shares) | | 10,173,738 | | | 2,400,546 | | | 633,586 | | | 967,274 | |
| Net Asset Value, Per Share | | $26.44 | | | $7.91 | | | $15.06 | | | $14.85 | |
| | Investments, at cost | | $237,763,116 | | | $17,311,324 | | | $ 8,111,066 | | | $12,149,100 | |
| | Options written, premiums received | | 10,598,518 | | | 46,837 | | | - | | | 31,124 | |
(a) Consolidated
See Notes to Financial Statements
|
| Statement of Operations |
| For the fiscal year ended May 31, 2024 | | | | | | | | | | | | |
| | | Adaptive Alpha Opportunities ETF | | Adaptive Hedged Multi-Asset Income ETF (a) | | RH Tactical Outlook ETF | | RH Tactical Rotation ETF |
| Investment Income: | | | | | | | | |
| | Dividends (net of withholding tax of $2,705, $0, $0, and $0) | | $ 2,555,706 | | | $ 779,738 | | | $ 192,466 | | | $ 187,993 | |
| | Interest | | 431,591 | | | 67,101 | | | 734 | | | - | |
| | Total Investment Income | | 2,987,297 | | | 846,839 | | | 193,200 | | | 187,993 | |
| Expenses: | | | | | | | | | | | | |
| | Advisory fees (note 2) | | 2,290,706 | | | 248,433 | | | 136,600 | | | 165,198 | |
| | Administration fees | | 227,024 | | | 45,342 | | | 24,523 | | | 26,800 | |
| | Professional fees | | 44,488 | | | 90,650 | | | 44,103 | | | 49,145 | |
| | Custody fees | | 58,515 | | | 21,071 | | | 11,500 | | | 10,865 | |
| | Distribution fees | | 21,302 | | | 23,688 | | | 21,594 | | | 21,078 | |
| | Compliance fees | | 42,515 | | | 12,662 | | | 9,531 | | | 11,729 | |
| | Fund Accounting Fee | | 18,820 | | | 18,764 | | | 18,824 | | | 18,824 | |
| | Transfer agent fees | | 24,042 | | | 16,579 | | | 12,761 | | | 12,904 | |
| | Shareholder fulfillment fees | | 33,712 | | | 9,790 | | | 4,174 | | | 2,920 | |
| | Trustee fees and meeting expenses (note 3) | | 8,280 | | | 8,488 | | | 8,362 | | | 8,362 | |
| | Security pricing fees | | 16,227 | | | 3,710 | | | 2,774 | | | 2,210 | |
| | Insurance fees | | 8,908 | | | 4,220 | | | 3,660 | | | 3,660 | |
| | Registration and filing expenses | | 4,806 | | | 3,294 | | | 1,098 | | | 1,404 | |
| | Other expenses | | 1,978 | | | 1,974 | | | 1,978 | | | 1,978 | |
| | | | | | | | | | | | | |
| | Total Expenses | | 2,801,323 | | | 508,665 | | | 301,482 | | | 337,077 | |
| | Fees waived by Advisor (note 2) | | - | | | (192,223 | ) | (130,732 | ) | (130,579 | ) |
| | Net Expenses | | 2,801,323 | | | 316,442 | | | 170,750 | | | 206,498 | |
| Net Investment Income (Loss) | | 185,974 | | | 530,397 | | | 22,450 | | | (18,505 | ) |
| Realized and Unrealized Gain (Loss) on Investments: | | | | | | | | | | | | |
| | Net realized gain (loss) from: | | | | | | | | | | | | |
| | | Investment transactions | | (9,072,550 | ) | (294,499 | ) | 17,325 | | | 255,209 | |
| | | Options written | | 5,470,057 | | | 900,266 | | | (133,666 | ) | (207,740 | ) |
| | | In-kind transactions | | 4,363,737 | | | 196,565 | | | 500,844 | | | 911,033 | |
| | Total realized gain (loss) | | 761,244 | | | 802,332 | | 384,503 | | | 958,502 | |
| | | | | | | | | | | | | |
| | Net change in unrealized appreciation (depreciation) on: | | | | | | | | | | | | |
| | | Investment transactions | | 48,856,426 | | | 665,377 | | | 1,371,685 | | | 2,401,566 | |
| | | Options written | | (7,009,017 | ) | | 48,609 | | | - | | | 35,972 | |
| | Total change in unrealized appreciation | | 41,847,409 | | | 713,986 | | | 1,371,685 | | | 2,437,538 | |
| Net Realized and Unrealized Gain (Loss) on Investments | | 42,608,653 | | | 1,516,318 | | 1,756,188 | | | 3,396,040 | |
| Net Increase in Net Assets Resulting from Operations | | $42,794,627 | | | $2,046,715 | | | $1,778,638 | | | $3,377,535 | |
(a) Consolidated
See Notes to Financial Statements
| | | | | | |
| Statements of Changes in Net Assets | | | | | | |
| For the fiscal years ended | | | | | | |
| | Adaptive Alpha Opportunities ETF | | |
| | May 31, 2024 | | | May 31, 2023 | | |
| Operations: | | | | | | |
| | Net investment income (loss) | $ 185,974 | | | $ 650,891 | | |
| | Net realized gain (loss) from investment transactions | (9,072,550 | ) | | (10,251,294 | ) |
| | Net realized gain (loss) from options written | 5,470,057 | | | 112,741 | | |
| | Net realized gain (loss) from in-kind transactions | 4,363,737 | | | 5,599,013 | | |
| | Capital gain distributions from underlying funds | - | | | 406,502 | | |
| | Net change in unrealized appreciation (depreciation) on investments | 41,847,409 | | | (205,584 | ) |
| Net Increase (Decrease) in Net Assets Resulting from Operations | 42,794,627 | | | (3,687,731 | ) |
| Distributions to Shareholders From: | | | | | | |
| | Distributable Earnings | (614,635 | ) | | (333,815 | ) |
| | Return of Capital | - | | | - | | |
| Net Decrease in Net Assets Resulting from Distributions | (614,635 | ) | | (333,815 | ) |
| Capital Share Transactions: | | | | | | |
| | Shares sold | 84,385,059 | | | 58,957,432 | | |
| | Shares repurchased | (53,128,852 | ) | | (71,230,077 | ) |
| Net Increase (Decrease) in Net Assets Resulting from Capital Share Transactions | 31,256,207 | | | (12,272,645 | ) |
| Net Increase (Decrease) in Net Assets | 73,436,199 | | | (16,294,191 | ) |
| Net Assets: | | | | | | |
| | Beginning of Year | 195,555,181 | | | 211,849,372 | | |
| | End of Year | $268,991,380 | | | $195,555,181 | | |
| Share Information: | | | | | | |
| | Shares sold | 3,550,000 | | | 2,760,000 | | |
| | Shares repurchased | (2,230,000 | ) | | (3,410,000 | ) |
| Net Increase (Decrease) in Capital Shares | 1,320,000 | | | (650,000 | ) |
(a) Consolidated
See Notes to Financial Statements
| Adaptive ETFs |
| Statements of Changes in Net Assets |
| For the fiscal years ended |
| | Adaptive Hedged Multi-Asset Income ETF | | | RH Tactical Outlook ETF | | | RH Tactical Rotation ETF | |
| | May 31, 2024 (a) | | | May 31, 2023 | | | May 31, 2024 | | | May 31, 2023 | | | May 31, 2024 | | | May 31, 2023 | |
| Operations: |
| | $ 530,397 | | | $ 1,684,618 | | | $ 22,450 | | | $ (55,466 | ) | $ (18,505 | ) | | $ 26,327 | |
| | (294,499 | ) | | (5,971,503 | ) | 17,325 | | | (2,027,942 | ) | 255,209 | | | (2,418,586 | ) |
| | 900,266 | | | 476,011 | | | (133,666 | ) | | - | | | (207,740 | ) | | 293,157 | |
| | 196,565 | | | (95,651 | ) | 500,844 | | | 334,357 | | | 911,033 | | | (30,876 | ) |
| | - | | | - | | | - | | | - | | | - | | | - | |
| | 713,986 | | | 3,311,468 | | | 1,371,685 | | | (95,741 | ) | 2,437,538 | | | 296,484 | |
| | 2,046,715 | | | (595,057 | ) | 1,778,638 | | | (1,844,792 | ) | 3,377,535 | | | (1,833,494 | ) |
| Distributions to Shareholders From: |
| | (527,681 | ) | | (1,552,215 | ) | - | | | - | | | - | | | - | |
| | (1,694,662 | ) | | (1,977,724 | ) | - | | | - | | | - | | | - | |
| | (2,222,343 | ) | | (3,529,939 | ) | - | | | - | | | - | | | - | |
| Capital Share Transactions: |
| | 14,758,931 | | | 12,243,981 | | | 817,232 | | | 4,586,940 | | | 10,311,601 | | | 1,542,248 | |
| | (43,581,321 | ) | | (8,850,005 | ) | (13,755,553 | ) | | (9,646,738 | | | (18,546,957 | ) | | (7,967,898 | |
| | (28,822,390 | ) | | 3,393,976 | | | (12,938,321 | ) | | (5,059,798 | ) | (8,235,356 | ) | | (6,425,650 | ) |
| | (28,998,018 | ) | | (731,020 | ) | (11,159,683 | ) | | (6,904,590 | ) | (4,857,821 | ) | | (8,259,144 | ) |
| Net Assets: |
| | 47,980,094 | | | 48,711,114 | | | 20,700,338 | | | 27,604,928 | | | 19,224,885 | | | 27,484,029 | |
| | $ 18,982,076 | | | $47,980,094 | | | $ 9,540,655 | | | $20,700,338 | | | $ 14,367,064 | | | $19,224,885 | |
| Share Information: |
| | 1,970,000 | | | 1,560,000 | | | 60,000 | | | 350,000 | | | 810,000 | | | 130,000 | |
| | (5,740,000 | ) | | (1,120,000 | ) | (1,040,000 | ) | | (750,000 | ) | (1,460,000 | ) | | (670,000 | ) |
| | (3,770,000 | ) | | 440,000 | | | (980,000 | ) | | (400,000 | ) | (650,000 | ) | | (540,000 | ) |
See Notes to Financial Statements
| Adaptive Alpha Opportunities ETF |
| Financial Highlights |
| | May 31, |
| For a share outstanding during each fiscal year ended | 2024 | | 2023 | | 2022 | | 2021 | | 2020 | |
| Net Asset Value, Beginning of Period | $22.09 | | $22.29 | | $25.77 | | $17.78 | | $15.55 | |
| | | | | | | | | | | | |
| Income (Loss) from Investment Operations: | | | | | | | | | | |
| | Net investment income (loss) (a) | 0.02 | | 0.08 | | (0.01) | | (0.17) | | 0.01 | |
| | Net realized and unrealized gain (loss) | | | | | | | | | | |
| | on investments | 4.40 | | (0.24) | | (1.85) | | 8.36 | | 2.69 | |
| | | | | | | | | | | | |
| Total from Investment Operations | 4.42 | | (0.16) | | (1.86) | | 8.19 | | 2.70 | |
| | | | | | | | | | | | |
| Less Distributions From: | | | | | | | | | | |
| | Net investment income | (0.07) | | (0.04) | | (0.05) | | (0.02) | | - | |
| | Net realized gains | - | | - | | (1.57) | | (0.18) | | (0.47) | |
| | | | | | | | | | | | |
| Total Distributions | (0.07) | | (0.04) | | (1.62) | | (0.20) | | (0.47) | |
| | | | | | | | | | | | |
| Net Asset Value, End of Period | $26.44 | | $22.09 | | $22.29 | | $25.77 | | $17.78 | |
| | | | | | | | | | | | |
| Total Return | 20.01% | | (0.71)% | | (8.05)% | | 46.18% | | 17.50% | |
| | | | | | | | | | | | |
| Net Assets, End of Period (in thousands) | $268,991 | | $195,555 | | $211,849 | | $153,188 | | $59,869 | |
| | | | | | | | | | | | |
| Ratios of: | | | | | | | | | | |
| Gross Expenses to Average Net Assets (b) | 1.22% | | 1.19% | | 1.18% | | 1.45% | (c) | 1.58% | (c) |
| Net Expenses to Average Net Assets (b) | 1.22% | | 1.19% | | 1.18% | | 1.26% | (c) | 1.26% | (c) |
| Net Investment Income (Loss) to Average Net Assets (b) | 0.08% | | 0.36% | | (0.02)% | | (0.75)% | | 0.07% | |
| Portfolio turnover rate | 368.05% | (d) | 22.32% | (d) | 25.74% | (d) | 94.33% | (d) | 319.85% | |
| (a) | Calculated using the average shares method. |
| (b) | Does not include expenses of the investment companies in which the Fund invests. |
| (c) | Includes interest expense of 0.01% for the fiscal years ended May 31, 2021 and 2020. |
| (d) | Excludes securities received or delivered in-kind. |
See Notes to Financial Statements
| Adaptive Hedged Multi-Asset Income ETF | |
| Financial Highlights | |
| | May 31, | |
| For a share outstanding during each fiscal year ended | 2024 (f) | | 2023 | | 2022 | | 2021 | | 2020 | |
| Net Asset Value, Beginning of Period | $7.78 | | $8.50 | | $9.83 | | $9.79 | | $10.29 | |
| | | | | | | | | | | | |
| Income (Loss) from Investment Operations: | | | | | | | | | | |
| | Net investment income (loss) (a) | 0.13 | | 0.62 | | 0.73 | | 0.26 | | 0.31 | |
| | Net realized and unrealized gain (loss) on investments | 0.54 | | (0.72) | | (1.38) | | 0.06 | | (0.47) | |
| | | | | | | | | | | | |
| Total from Investment Operations | 0.67 | | (0.10) | | (0.65) | | 0.32 | | (0.16) | |
| | | | | | | | | | | | |
| Less Distributions From: | | | | | | | | | | |
| | Net investment income | (0.13) | | (0.27) | | (0.68) | | (0.28) | | (0.34) | |
| | Return of Capital | (0.41) | | (0.35) | | - | | - | | - | |
| | | | | | | | | | | | |
| Total Distributions | (0.54) | | (0.62) | | (0.68) | | (0.28) | | (0.34) | |
| | | | | | | | | | | | |
| Net Asset Value, End of Period | $7.91 | | $7.78 | | $8.50 | | $9.83 | | $9.79 | |
| | | | | | | | | | | | |
| Total Return | 9.01% | | (1.06)% | | (6.98)% | (c) | 3.29% | | (1.62)% | |
| | | | | | | | | | | | |
| Net Assets, End of Period (in thousands) | $18,982 | | $47,980 | | $48,711 | | $18,911 | | $42,354 | |
| | | | | | | | | | | | |
| Ratios of: | | | | | | | | | | |
| Gross Expenses to Average Net Assets (b) | 1.64% | | 1.27% | | 2.29% | (d) | 1.86% | | 1.83% | |
| Net Expenses to Average Net Assets (b) | 1.02% | | 0.85% | | 1.74% | (d) | 1.25% | | 1.25% | |
| Net Investment Income to Average Net Assets (b) | 1.71% | | 7.88% | | 7.83% | (d) | 2.58% | | 3.04% | |
| Portfolio turnover rate | 596.01% | (e) | 155.15% | (e) | 225.13% | (e) | 148.62% | | 9.52% | |
| (a) | Calculated using the average shares method. | |
| (b) | Does not include expenses of the investment companies in which the Fund invests. | |
| (c) | The total return includes tax expenses. The impact on total returns was (0.44)% | |
| (d) | Gross expenses, net expenses, and net investment income include tax expenses. The impact on the ratios is 0.78%. | |
| (e) | Excludes securities received or delivered in-kind. | |
| (f) | Consolidated | |
See Notes to Financial Statements
| RH Tactical Outlook ETF |
| Financial Highlights |
| | May 31, |
| For a share outstanding during each fiscal year ended | 2024 | | 2023 | | 2022 | | 2021 | | 2020 | |
| Net Asset Value, Beginning of Period | $12.83 | | $13.71 | | $14.44 | | $11.36 | | $11.84 | |
| | | | | | | | | | | | |
| Income (Loss) from Investment Operations: | | | | | | | | | | |
| | Net investment income (loss) (a) | 0.02 | | (0.03) | | (0.03) | | 0.00 | (c) | 0.08 | |
| | Net realized and unrealized gain (loss) on investments | 2.21 | | (0.85) | | (0.70) | | 3.08 | | (0.39) | |
| Total from Investment Operations | 2.23 | | (0.88) | | (0.73) | | 3.08 | | (0.31) | |
| Less Distributions From: | | | | | | | | | | |
| | Net investment income | - | | - | | - | | - | | (0.17) | |
| Total Distributions | - | | - | | - | | - | | (0.17) | |
| | | | | | | | | | | | |
| Net Asset Value, End of Period | $15.06 | | $12.83 | | $13.71 | | $14.44 | | $11.36 | |
| | | | | | | | | | | | |
| Total Return | 17.38% | | (6.43)% | | (5.05)% | | 27.11% | | (2.84)% | |
| Net Assets, End of Period (in thousands) | $9,541 | | $20,700 | | $27,605 | | $10,816 | | $15,339 | |
| Ratios of: | | | | | | | | | | |
| Gross Expenses to Average Net Assets (b) | 2.21% | | 1.78% | | 2.01% | | 2.92% | | 2.50% | |
| Net Expenses to Average Net Assets (b) | 1.25% | | 1.25% | | 1.26% | | 1.25% | | 1.25% | |
| Net Investment Income (Loss) to Average Net Assets (b) | 0.16% | | (0.23)% | | (0.20)% | | (0.01)% | | 0.62% | |
| Portfolio turnover rate | 88.96% | (d) | 164.54% | (d) | 120.07% | (d) | 143.64% | | 141.55% | |
| (a) | Calculated using the average shares method. |
| (b) | Does not include expenses of the investment companies in which the Fund invests. |
| (c) | Less than $0.01 per share. |
| (d) | Excludes securities received or delivered in-kind. |
See Notes to Financial Statements
| RH Tactical Rotation ETF |
| Financial Highlights |
| | May 31, |
| For a share outstanding during each fiscal year ended | 2024 | | 2023 | | 2022 | | 2021 | | 2020 | |
| Net Asset Value, Beginning of Period | $11.89 | | $12.74 | | $13.36 | | $10.40 | | $11.61 | |
| Income (Loss) from Investment Operations: | | | | | | | | | | |
| | Net investment income (loss) (a) | (0.01) | | 0.01 | | (0.02) | | - | | 0.06 | |
| | Net realized and unrealized gain (loss) on investments | 2.97 | | (0.86) | | (0.60) | | 3.09 | | (0.94) | |
| Total from Investment Operations | 2.96 | | (0.85) | | (0.62) | | 3.09 | | (0.88) | |
| Less Distributions From: | | | | | | | | | | |
| | Net investment income | - | | - | | - | | (0.13) | | (0.33) | |
| Total Distributions | - | | - | | - | | (0.13) | | (0.33) | |
| | | | | | | | | | | | |
| Net Asset Value, End of Period | $14.85 | | $11.89 | | $12.74 | | $13.36 | | $10.40 | |
| | | | | | | | | | | | |
| Total Return | 24.95% | | (6.69)% | | (4.64)% | | 29.80% | | (7.98)% | |
| Net Assets, End of Period (in thousands) | $14,367 | | $19,225 | | $27,484 | | $19,021 | | $19,027 | |
| Ratios of: | | | | | | | | | | |
| Gross Expenses to Average Net Assets (b) | 2.04% | | 1.82% | | 1.74% | | 2.34% | | 1.80% | (c) |
| Net Expenses to Average Net Assets (b) | 1.25% | | 1.24% | | 1.25% | | 1.25% | | 1.25% | (c) |
| Net Investment Income (Loss) to Average Net Assets (b) | (0.11)% | | 0.11% | | (0.18)% | | 0.06% | | 0.49% | |
| Portfolio turnover rate | 243.76% | (d) | 78.83% | (d) | 293.36% | (d) | 529.41% | | 624.45% | |
| (a) | Calculated using the average shares method. |
| (b) | Does not include expenses of the investment companies in which the Fund invests. |
| (c) | Includes interest expense of less than 0.005% for the fiscal years ended May 31, 2020. |
| (d) | Excludes securities received or delivered in-kind. |
See Notes to Financial Statements
Adaptive ETFs
Notes to Financial Statements (consolidated with respect to the Adaptive Hedged Multi-Asset Income ETF)
As of May 31, 2024
| 1. | Organization and Significant Accounting Policies |
The Adaptive ETFs (the “Funds”) are each a series of the Starboard Investment Trust (“Trust”). The Trust is organized as a Delaware statutory trust and is registered under the Investment Company Act of 1940, as amended (the “1940 Act”), as an open-end management investment company. Each Fund is a separate, diversified series of the Trust. Each Fund is actively managed and does not seek to replicate the performance of an index.
The Adaptive Alpha Opportunities ETF seeks to achieve its investment objective of capital appreciation by investing primarily in exchange-traded funds that are registered under the 1940 Act and not affiliated with the Fund (“Portfolio Funds”) that invest in equity securities of any market capitalization of issuers from a number of countries throughout the world, including emerging market countries. In addition to its indirect investments, the Adaptive Alpha Opportunities ETF may also invest directly in individual large cap equities and fixed income securities, as well as put and call options on index ETFs, individual equities, and cash and cash equivalents as part of its risk management strategy.
The Adaptive Hedged Multi-Asset Income ETF, previously the RH Hedged Multi-Asset Income ETF, seeks to achieve its investment objective of total return through a combination of capital appreciation and current income by investing in Portfolio Funds or by making direct investments. The Fund’s portfolio will consist of a mix of direct and indirect investments through Portfolio Funds and each may be all of the Fund’s portfolio or none of the Fund’s portfolio at any given time. In addition, the Fund may also invest directly in put and call options on index ETFs, sector ETFs, individual equities, and cash and cash equivalents as part of its risk management strategy. The Fund intends to invest up to 25% of its total assets in a wholly-owned and controlled subsidiary (the “Subsidiary”). The Subsidiary will invest its assets in ETNs and ETFs that provide exposure to commodities.
The RH Tactical Outlook ETF seeks to achieve its investment objective of total return through a combination of capital appreciation and current income, with a secondary goal of downside protection by investing in Portfolio Funds. In addition to its indirect investments, the Fund may also invest directly in put and call options on index ETFs, sector ETFs, individual equities, and cash and cash equivalents as part of its risk management strategy. The strategy will follow an asset allocation strategy under which the Advisor selects ETFs that invest in equity securities and fixed income securities.
The RH Tactical Rotation ETF seeks to achieve its investment objective of capital appreciation by investing in Portfolio Funds. In addition to its indirect investments, the Fund may also invest directly in put and call options on index ETFs, sector ETFs, individual equities, and cash and cash equivalents as part of its risk management strategy.
The Trust will issue and redeem shares at Net Asset Value (“NAV”) only in a large, specified number of shares called a “Creation Unit” or multiples thereof. A Creation Unit consists of 10,000 shares. Creation Unit transactions are typically conducted in exchange for the deposit or delivery of in-kind securities and/or cash. As a practical matter, only authorized participants may purchase or redeem these Creation Units. Except when aggregated in Creation Units, the shares are not redeemable securities of the Funds. The prices at which creations and redemptions occur are based on the next calculation of NAV after an order is received in proper form by Capital Investment Group, Inc. (the “Distributor”). Individual shares of the Funds may only be purchased and sold in secondary market transactions through brokers. Shares of the Funds are listed for trading on NYSE Arca under the trading symbols of each Fund listed in the table below, and because shares will trade at market prices rather than NAV, shares of the Funds may trade at a price greater than or less than NAV.
| Fund Name | Trading Symbol (Ticker) |
| Adaptive Alpha Opportunities ETF | AGOX |
| Adaptive Hedged Multi-Asset Income ETF | AMAX |
| RH Tactical Outlook ETF | RHTX |
| RH Tactical Rotation ETF | RHRX |
Transaction Fees
The consideration for the purchase of Creation Units of the Funds generally consists of the in-kind deposit of a designated portfolio of securities and a specified amount of cash. The Funds may be offered in Creation Units solely or partially for cash in U.S. dollars. Investors purchasing and redeeming Creation Units may pay a purchase transaction fee and a redemption transaction fee directly to Clear Street LLC or UMB Bank, the Funds’ custodians, to offset transfer and other transaction costs associated with the issuance and redemption of Creation Units, including Creation Units for cash. Investors transacting in Creation Units for cash may also pay an additional variable charge to compensate the relevant fund for certain transaction costs (i.e., stamp taxes, taxes on currency or other financial transactions, and brokerage costs) and market impact expenses relating to investing in portfolio securities.
Adaptive ETFs
Notes to Financial Statements (consolidated with respect to the Adaptive Hedged Multi-Asset Income ETF)
As of May 31, 2024
Collateral
When the Funds are awaiting settlements on in-kind transactions, they may receive collateral consisting of cash or cash equivalents, or securities issued or guaranteed by the U.S. Government or one of its agencies or instrumentalities, or any combination thereof. Nevertheless, the Funds risk a delay in the recovery of the collateral, or even the loss of rights in the collateral deposited by the borrower if the borrower should fail financially. In addition, there is a possibility that the in-kind transaction will not settle in the usual manner and cause unintended market exposure and additional trade and other expenses to the Funds. As well, any investments made with the collateral received are subject to the risks associated with such investments. If such investments lose value, the Funds will have to cover the loss when repaying the collateral.
The Date of Initial Public Investment for each Fund:
| ETF | |
| Adaptive Alpha Opportunities ETF | September 20, 2012 |
| Adaptive Hedged Multi-Asset Income ETF | October 2, 2009 |
| RH Tactical Outlook ETF | September 20, 2012 |
| RH Tactical Rotation ETF | September 20, 2012 |
The following is a summary of significant accounting policies consistently followed by the Funds. The policies are in conformity with accounting principles generally accepted in the United States of America (“GAAP”). The Funds follow the accounting and reporting guidance in the Financial Accounting Standards Board (“FASB”) Accounting Standards Codification 946 “Financial Services – Investment Companies.”
Investment Valuation
Each Fund’s securities and investments are carried at fair value. Equity securities listed on an exchange or quoted on a national market system are valued at the last quoted sales price provided by a third-party pricing service at the time the valuation is made (generally 4:00 p.m. Eastern Time) or, if there are no sales, at the mean of the most recent bid and asked prices. Price information on listed securities is taken from the exchange where the security is primarily traded by the Funds. Equity securities traded in the over-the-counter markets are generally valued at the NASDAQ Official Closing Price at the close of regular trading on the exchange on the day the security is valued or, if there are no sales, at the mean of the most recent bid and asked prices. Fixed income securities are valued at market value. Market value generally means a valuation (i) obtained from an exchange, a pricing service or a major market maker (or dealer), (ii) based on a price quotation or other equivalent indication of value supplied by an exchange, a pricing service or a major market maker (or dealer), or (iii) based on amortized cost. Instruments with maturities of 60 days or less are valued at amortized cost, which approximates market value. Unlisted securities for which market quotations are readily available are valued at the latest quoted sales price, if available, at the time of valuation, otherwise, at the latest quoted bid price. Options are valued at the mean of the last quoted bid and ask prices provided by a third-party pricing service from the primary exchange or the board of trade on which such options are traded. Foreign securities listed on foreign exchanges are valued with quotations from the primary market in which they are traded and are translated from the local currency into U.S. dollars using current exchange rates. Securities and assets for which representative market quotations are not readily available (e.g., if the exchange on which the portfolio security is principally traded closes early or if trading of the particular portfolio security is halted during the day and does not resume prior to each Fund’s net asset value calculation) or which cannot be accurately valued using each Fund’s normal pricing procedures are valued at fair value as determined in good faith under policies approved by the Board of Trustees (the “Trustees”). A portfolio security’s “fair value” price may differ from the price next available for that portfolio security using each Fund’s normal pricing procedures.
Underlying Funds
Open-End Funds - Open-end funds value securities in their portfolios for which market quotations are readily available at their market values (generally the last reported sale price) and all other securities and assets at their fair value to the methods established by the boards of directors of the open-end funds. Open-end funds are valued at their respective net asset values as reported by such investment companies.
Fair Value Measurement
Each Fund has adopted ASC Topic 820, Fair Value Measurements. ASC Topic 820 defines fair value, establishes a framework for measuring fair value and expands disclosure about fair value measurements.
Various inputs are used in determining the value of each Fund's investments. These inputs are summarized in the three broad levels listed below:
| Level 1: | Unadjusted quoted prices in active markets for identical securities assets or liabilities that the funds have the ability to access. |
Adaptive ETFs
Notes to Financial Statements (consolidated with respect to the Adaptive Hedged Multi-Asset Income ETF)
As of May 31, 2024
| Level 2: | Observable inputs other than quoted prices included in Level 1 that are observable for the asset or liability, either directly or indirectly. These inputs may include quoted prices for the identical instrument on an inactive market, prices for similar instruments, interest rates, credit spreads, yield curves, and market-collaborated input. |
| Level 3: | Unobservable inputs for the asset or liability to the extent that observable inputs are not available, representing the assumptions that a market participant would use in valuing the asset or liability at the measurement date; they would be based on the best information available, which may include the funds’ own data. |
The availability of observable inputs can vary from security to security and is affected by a wide variety of factors, including, for example, the type of security, whether the security is new and not yet established in the marketplace, the liquidity of markets, and other characteristics particular to the security. To the extent that valuation is based on models or inputs that are less observable or unobservable in the market, the determination of fair value requires more judgment. Accordingly, the degree of judgment exercised in determining fair value is greatest for instruments categorized in Level 3.
The inputs used to measure fair value may fall into different levels of the fair value hierarchy. In such cases, for disclosure purposes, the level in the fair value hierarchy within which the fair value measurement falls in its entirety, is determined based on the lowest level input that is significant to the fair value measurement in its entirety.
The inputs or methodology used for valuing securities are not necessarily an indication of the risk associated with investing in those securities. The following tables summarize the inputs as of May 31, 2024 for each Fund’s investments measured at fair value:
| Adaptive Alpha Opportunities ETF (a) |
| | Total | | Level 1 | | Level 2 | | Level 3 |
| Assets | | | | | | | |
| Common Stocks* | $148,574,307 | | $148,574,307 | | $ - | | $- |
| Exchange-Traded Products* | 95,726,695 | | 95,726,695 | | - | | - |
| Options Purchased | 36,842,849 | | - | | 36,842,849 | | - |
| Total Assets | $281,143,851 | | $244,301,002 | | $36,842,849 | | $- |
| | | | | | | | |
| Liabilities | | | | | | | |
| Options Written | $(17,436,711) | | $- | | $(17,436,711) | | $- |
| Total Liabilities | $(17,436,711) | | $- | | $(17,436,711) | | $- |
| | | | | | | | |
| Adaptive Hedged Multi-Asset Income ETF |
| | Total | | Level 1 | | Level 2 | | Level 3(b) |
| Assets | | | | | | | |
| Exchange-Traded Products* | $16,812,129 | | $16,812,129 | | $ - | | $- |
| Options Purchased | $68,125 | | - | | 68,125 | | - |
| Collateralized Mortgage Obligations | 357,743 | | - | | 357,743 | | - |
| Short-Term Investment | 111,524 | | 111,524 | | - | | - |
| Total Assets | $17,349,521 | | $16,923,653 | | $425,868 | | $- |
| | | | | | | | |
| Liabilities | | | | | | | |
| Options Written | $(47,429) | | $- | | $(47,429) | | $- |
| Total Liabilities | $(47,429) | | $- | | $(47,429) | | $- |
| | | | | | | | |
The table below presents a reconciliation of all Level 3 fair value measurements existing at May 31, 2024:
| | Value |
| Opening Balance | $ 98,184 |
| Transferred out of Level 3 to Level 2 | (98,184) |
| Ending Balance | $ - |
| | |
| RH Tactical Outlook ETF (a) |
| Assets | Total | | Level 1 | | Level 2 | | Level 3 |
| Exchange-Traded Products* | $9,528,434 | | $9,528,434 | | $- | | $- |
| Total Assets | $9,528,434 | | $9,528,434 | | $- | | $- |
| | | | | | | | |
Adaptive ETFs
Notes to Financial Statements (consolidated with respect to the Adaptive Hedged Multi-Asset Income ETF)
As of May 31, 2024
| RH Tactical Rotation ETF (a) |
| | Total | | Level 1 | | Level 2 | | Level 3 |
| Assets | | | | | | | |
| Exchange-Traded Products* | $14,451,427 | | $14,451,427 | | $ - | | $- |
| Options Purchased | 76,760 | | - | | 76,760 | | - |
| Total Assets | $14,528,187 | | $14,451,427 | | $76,760 | | $- |
| | | | | | | | |
| Liabilities | | | | | | | |
| Options Written | $(26,320) | | $- | | $(26,320) | | $- |
| Total Liabilities | $(26,320) | | $- | | $(26,320) | | $- |
| | | | | | | | |
*Refer to the Schedules of Investments for a breakdown by sector.
| (a) | The Funds held no Level 3 securities during the fiscal year ended May 31, 2024. |
| (b) | For the year ended May 31, 2024, this investment was valued in accordance with procedures approved by the Board of Trustees. This investment did not have a material impact on the Fund’s net assets and, therefore, disclosure of unobservable inputs used in formulating valuations is not presented. |
Purchased Options
When the Funds purchase an option, an amount equal to the premium paid by the Funds is recorded as an investment and is subsequently adjusted to the current value of the option purchased. If an option expires on the stipulated expiration date or if the Funds enter into a closing sale transaction, a gain or loss is realized. If a call option is exercised, the cost of the security acquired is increased by the premium paid for the call. If a put option is exercised, a gain or loss is realized from the sale of the underlying security, and the proceeds from such sale are decreased by the premium originally paid. Purchased options are non-income producing securities.
Written Options
When the Funds write an option, an amount equal to the premium received by the Funds is recorded as a liability and is subsequently adjusted to the current fair value of the option written. Premiums received from writing options that expire unexercised are treated by the Funds on the expiration date as realized gains from options written. The difference between the premium and the amount paid on effecting a closing purchase transaction, including brokerage commissions, is also treated as a realized gain or loss (depending on if the premium is less than the amount paid for the closing purchase transaction). If a call option is exercised, the premium is added to the proceeds from the sale of the underlying security in determining whether the Funds have realized a gain or loss. If a put option is exercised, the premium reduces the cost basis of the securities purchased by the Funds. The Funds, as the writer of an option, bears the market risk of an unfavorable change in the price of the security underlying the written option. Written options are non-income producing securities.
Derivative Financial Instruments
The Funds may invest in derivative financial instruments (derivatives) in order to manage risk or gain exposure to various other investments or markets. During the fiscal year ended May 31, 2024, Adaptive Alpha Opportunities, Adaptive Hedged Multi Asset Income, and RH Tactical Rotation used put and call options for hedging and income purposes. Derivatives may contain various risks including the potential inability of the counterparty to fulfill their obligations under the terms of the contract, the potential for an illiquid secondary market, and the potential for market movements which may expose the Funds to gains or losses in excess of the amounts shown on each Fund’s Statement of Assets and Liabilities.
Derivatives are marked to market daily based upon quotations from market makers or the Funds’ independent pricing services and the Funds’ net benefit or obligation under the contract, as measured by the fair market value of the contract, is included in Investments, at value on the Statement of Assets and Liabilities for options purchased. Net realized gains and losses and net change in unrealized appreciation and depreciation on these contracts for the year are included in the Realized and Unrealized Gain on Investments on each Fund’s Statement of Operations for options purchased.
The following table sets forth the effect of the derivative instruments on the Statement of Assets and Liabilities as of May 31, 2024:
| ETF | Derivative Type | Location | Value |
| Adaptive Alpha Opportunities | Purchased options - Equity risk | Assets - Investments, at value | $ 36,842,849 |
| | Written options - Equity risk | Liabilities - Options written, at value | (17,436,711) |
| | | | |
| Adaptive Hedged Multi-Asset Income | Purchased options - Equity risk | Assets - Investments, at value | 68,125 |
| | Written options - Equity risk | Liabilities - Options written, at value | (47,429) |
| | | | |
| RH Tactical Rotation | Purchased options - Equity risk | Assets - Investments, at value | 76,760 |
| | Written options - Equity risk | Liabilities - Options written, at value | (26,320) |
Adaptive ETFs
Notes to Financial Statements (consolidated with respect to the Adaptive Hedged Multi-Asset Income ETF)
As of May 31, 2024
The following tables set forth the effect of derivative instruments on the Statements of Operations for the fiscal year ended May 31, 2024 for the Funds as follows:
| Adaptive Alpha Opportunities ETF |
| Derivative Type | Location | Gains/(Losses) |
| Purchased Equity Options | Net realized gain (loss) from investment transactions | $(36,614,785) |
| Purchased Equity Options | Net change in unrealized appreciation (depreciation) on investments | (331,103) |
| Written Equity Options | Net realized gain (loss) from options written | 5,470,057 |
| Written Equity Options | Net change in unrealized appreciation (depreciation) on options written | (7,009,017) |
| Adaptive Hedged Multi-Asset Income ETF |
| Derivative Type | Location | Gains/(Losses) |
| Purchased Equity Options | Net realized gain (loss) from investment transactions | $ - |
| Purchased Equity Options | Net change in unrealized appreciation (depreciation) on investments | (236) |
| Written Equity Options | Net realized gain (loss) from options written | 900,266 |
| Written Equity Options | Net change in unrealized appreciation (depreciation) on options written | 48,609 |
| RH Tactical Outlook ETF |
| Derivative Type | Location | Gains/(Losses) |
| Purchased Equity Options | Net realized gain (loss) from investment transactions | $(219,570) |
| Purchased Equity Options | Net change in unrealized appreciation (depreciation) on investments | - |
| Written Equity Options | Net realized gain (loss) from options written | (133,666) |
| Written Equity Options | Net change in unrealized appreciation (depreciation) on options written | - |
| RH Tactical Rotation ETF |
| Derivative Type | Location | Gains/(Losses) |
| Purchased Equity Options | Net realized gain (loss) from investment transactions | $(612,566) |
| Purchased Equity Options | Net change in unrealized appreciation (depreciation) on investments | 396,628 |
| Written Equity Options | Net realized gain (loss) from options written | (207,740) |
| Written Equity Options | Net change in unrealized appreciation (depreciation) on options written | 35,972 |
The following table represents the average quarterly notional values on options, which serve as an indicator of volume for options during the fiscal year ended May 31, 2024:
| ETF | Derivative Type | Type | Average Notional |
| Adaptive Alpha Opportunities ETF | Purchased options – Equity risk | Premiums Paid | $ 503,074,020 |
| | Written options – Equity risk | Premiums Received | (521,874,708) |
| Adaptive Hedged Multi-Asset Income ETF | Purchased options – Equity risk | Premiums Paid | 1,402,889 |
| | Written options – Equity risk | Premiums Received | (31,653,918) |
| RH Tactical Outlook ETF | Purchased options – Equity risk | Premiums Paid | 1,926,503 |
| | Written options – Equity risk | Premiums Received | (3,704,813) |
| RH Tactical Rotation ETF | Purchased options – Equity risk | Premiums Paid | 3,349,151 |
| | Written options – Equity risk | Premiums Received | (4,327,221) |
Investment Transactions and Investment Income
Investment transactions are accounted for as of the date purchased or sold (trade date). Dividend income is recorded on the ex-dividend date. Certain dividends from foreign securities will be recorded as soon as a Fund is informed of the dividend if such information is obtained subsequent to the ex-dividend date. Interest income is recorded on the accrual basis and includes accretion and amortization of discounts and premiums. Gains and losses are determined on the identified cost basis, which is the same basis used for federal income tax purposes.
Expenses
Each Fund bears expenses incurred specifically on its behalf as well as a portion of general expenses, which are allocated according to methods reviewed annually by the Trustees.
Adaptive ETFs
Notes to Financial Statements (consolidated with respect to the Adaptive Hedged Multi-Asset Income ETF)
As of May 31, 2024
Distributions
The Fund pays out substantially all its net earnings to its shareholders as “distributions.” Income dividends, if any, are distributed to shareholders annually. Net capital gains are distributed annually. Dividends may be declared and paid more frequently.
Estimates
The preparation of financial statements in conformity with GAAP requires management to make estimates and assumptions that affect the reported amounts of assets and liabilities and disclosure of contingent assets and liabilities at the date of the financial statements and the reported amounts of increases and decreases in the net assets from operations during the reporting period. Actual results could differ from those estimates.
Federal Income Taxes
No provision for income taxes is included in the accompanying financial statements, as each Fund intends to distribute to shareholders all taxable investment income and realized gains and otherwise continue to comply with Subchapter M of the Internal Revenue Code applicable to regulated investment companies.
| 2. | Transactions with Related Parties and Service Providers |
Advisor
Each Fund pays a monthly advisory fee to Cavalier Investments, LLC d/b/a Adaptive Investments, LLC (the “Advisor”), based upon the average daily net assets and calculated at an annual rate.
See the table below for the advisory fee rates and amounts earned by the Advisor from each Fund during fiscal year ended May 31, 2024:
| ETF | Advisory Fee Rate | Amount Earned | Amount Waived by Advisor | Expenses Reimbursed by Advisor |
| Adaptive Alpha Opportunities ETF | 1.00% | $2,290,706 | $ - | $ - |
| Adaptive Hedged Multi-Asset Income ETF | 0.80% | 248,433 | 173,183 | 19,040 |
| RH Tactical Outlook ETF | 1.00% | 136,600 | 112,423 | 18,309 |
| RH Tactical Rotation ETF | 1.00% | 165,198 | 130,362 | 217 |
| (a) | Waivers and expense reimbursements are not subject to recoupment. |
The Advisor engaged a sub-advisor to provide day to day portfolio management for the Adaptive Alpha Opportunities ETF throughout the period. The sub-advisor is paid directly by the Advisor out of the advisor fee based upon the average daily net assets and calculated at an annual rate. See the table below for the sub-advisory fee rates and amount paid by the Advisor to the Sub-Advisor for the sub-advised Fund during the fiscal year ended May 31, 2024:
| ETF | Sub-Advisor | Sub-Advisory Fee Rate | Sub-Advisory Fee Paid |
| Adaptive Alpha Opportunities ETF | Bluestone Capital Management LLC | 0.15% (on AUM $20M-$40M); and 0.30% (on AUM over $40M) | $597,819 |
Expense Limitation
The Advisor has entered into an expense limitation agreement with the Trust with respect to the Adaptive Alpha Opportunities ETF and the Adaptive Hedged Multi-Asset Income ETF, pursuant to which the Advisor has agreed to waive or reduce its fees and to assume other expenses so that the total annual operating expenses of each Fund (exclusive of (i) any front-end or contingent deferred loads; (ii) brokerage fees and commissions, (iii) fees and expenses associated with investments in other collective investment vehicles or derivative instruments (including for example option and swap fees and expenses); (iv) borrowing costs (such as interest and dividend expense on securities sold short); (v) taxes; and (vi) extraordinary expenses, such as litigation expenses (which may include indemnification of Fund officers and Trustees and contractual indemnification of Fund service providers (other than the Advisor)) to not more than the percentage of the average daily net assets of the Funds as follows:
| ETF | Expenses Limitation |
| Adaptive Alpha Opportunities ETF | 1.39% |
| Adaptive Hedged Multi-Asset Income ETF | 1.29% |
The Advisor has entered into an expense limitation agreement with the Trust with respect to the RH Tactical Outlook ETF and the RH Tactical Rotation ETF, pursuant to which the Advisor has agreed to waive or reduce its fees and to assume other expenses so that the total annual operating expenses of each Fund (exclusive of (i) any front-end or contingent deferred loads; (ii) brokerage fees and commissions, (iii) acquired fund fees and expenses; (iv) fees and expenses associated with investments in other collective investment vehicles or derivative instruments (including for example option and swap fees and expenses); (v) borrowing costs (such as interest and dividend expense on securities sold short); (vi) taxes; and (vii) extraordinary expenses, such as litigation expenses (which may include indemnification of Fund officers and Trustees and contractual indemnification of Fund service providers (other than the Advisor)) to not more than the percentage of the average daily net assets of the Funds as follows:
Adaptive ETFs
Notes to Financial Statements (consolidated with respect to the Adaptive Hedged Multi-Asset Income ETF)
As of May 31, 2024
| ETF | Expenses Limitation |
| RH Tactical Outlook ETF | 1.25% |
| RH Tactical Rotation ETF | 1.25% |
Administrator
The Funds pays customary fees to The Nottingham Company (the “Administrator”) for its services as Fund Administrator and Fund Accountant. Certain officers of the Administrator are also officers of the Trust.
Compliance Services
The Nottingham Company, Inc. serves as the Trust’s compliance services provider including services as the Trust’s Chief Compliance Officer. The Nottingham Company, Inc. is entitled to receive customary fees from the Funds for its services pursuant to the Compliance Services Agreement with the Funds.
Transfer Agent
Nottingham Shareholder Services, LLC (“Transfer Agent”), an affiliate of the Administrator, serves as transfer, dividend paying, and shareholder servicing agent for the Funds. For its services, the Transfer Agent is entitled to receive compensation from the Funds pursuant to the Transfer Agent’s fee arrangements with the Funds.
Distributor
Capital Investment Group, Inc. (the “Distributor”) serves as the Funds’ principal underwriter and distributor. For its services, the Distributor is entitled to receive compensation from the Funds pursuant to the Funds’ fee arrangements with the Distributor.
The Trust is governed by the Board of Trustees, which is responsible for the management and supervision of the Funds. The Trustees meet periodically throughout the year to review contractual agreements with companies that furnish services to the Funds; review performance of the Advisor and the Funds; and oversee activities of the Funds. Officers of the Trust and Trustees who are interested persons of the Trust or the Advisor will receive no salary or fees from the Trust. Each Trustee who is not an “interested person” of the Trust or the Advisor within the meaning of the Investment Company Act of 1940, as amended (the “Independent Trustees”) will receive $2,400 per series per year plus $400 for each quarterly meeting, $200 for each Committee meeting held outside of the quarterly Board meetings, and $1,000 per special meeting. The Trust reimburses each Independent Trustee and officer of the Trust for his or her travel and other expenses related to attendance of Board meetings. Additional fees were incurred during the period as special meetings were necessary in addition to the regularly scheduled meetings of the Board of Trustees.
Certain officers of the Trust may also be officers of the Administrator.
| 4. | Purchases and Sales of Investment Securities |
For the fiscal year ended May 31, 2024, the aggregate cost of purchases and proceeds from sales of investment securities (excluding short-term securities) were as follows:
| ETF | Purchases of Securities | Proceeds from Sales of Securities | In-Kind Purchases | In-Kind Sales |
| Adaptive Alpha Opportunities ETF | $817,472,527 | $865,292,401 | $46,591,594 | $38,483,451 |
| Adaptive Hedged Multi-Asset Income ETF | 159,693,923 | 167,041,621 | 4,238,392 | 13,792,651 |
| RH Tactical Outlook ETF | 11,828,014 | 14,032,120 | 813,305 | 7,743,662 |
| RH Tactical Rotation ETF | 38,238,429 | 39,469,197 | 6,486,093 | 8,716,751 |
There were no long-term purchases or sales of U.S. Government Obligations during the fiscal year ended May 31, 2024.
Distributions are determined in accordance with Federal income tax regulations, which may differ from GAAP, and, therefore, may differ significantly in amount or character from net investment income and realized gains for financial reporting purposes. Financial reporting records are adjusted for permanent book/tax differences to reflect tax character but are not adjusted for temporary differences.
Adaptive ETFs
Notes to Financial Statements (consolidated with respect to the Adaptive Hedged Multi-Asset Income ETF)
As of May 31, 2024
Management has reviewed all taxable years/periods that are open for examination (i.e., not barred by the applicable statute of limitations) by taxing authorities of all major jurisdictions, including the Internal Revenue Service. As of May 31, 2024 open taxable years consisted of the taxable years ended May 31, 2021 through May 31, 2023 and what is expected to be filed in 2024. No examination of tax returns is currently in progress for any of the Funds.
Distributions during the fiscal year ended May 31, 2024 were characterized for tax purposes as follows:
| ETF | Ordinary Income | Return of Capital |
| Adaptive Alpha Opportunities ETF | $ 614,635 | $ - |
| Adaptive Hedged Multi-Asset Income ETF | 527,681 | 1,694,662 |
Distributions during the fiscal year ended May 31, 2023 were characterized for tax purposes as follows:
| ETF | Ordinary Income | Return of Capital |
| Adaptive Alpha Opportunities ETF | $ 333,815 | $ - |
| Adaptive Hedged Multi-Asset Income ETF | 1,552,215 | 1,977,724 |
Reclassifications relate primarily to differing book/tax treatment of ordinary net investment losses and taxable overdistributions and have no impact on the net assets of the Funds.
For the year ended May 31, 2024, the following reclassifications were necessary:
| ETF | Accumulated Surplus (Deficit) | Paid in Capital |
| Adaptive Alpha Opportunities ETF | $(4,276,682) | $4,276,682 |
| Adaptive Hedged Multi-Asset Income ETF | (327,365) | 327,365 |
| RH Tactical Outlook ETF | (468,169) | 468,169 |
| RH Tactical Rotation ETF | (904,679) | 904,679 |
At May 31, 2024 the tax-basis cost of investments and components of distributable earnings were as follows:
| | Adaptive Alpha Opportunities ETF | | Adaptive Hedged Multi-Asset Income ETF | | RH Tactical Outlook ETF | | RH Tactical Rotation ETF |
| Cost of Investments | $ 229,333,390 | | $ 17,692,982 | | $ 8,111,066 | | $ 12,166,855 |
| | | | | | | | |
| Gross Unrealized Appreciation | 66,153,720 | | 308,759 | | 1,417,368 | | 2,387,990 |
| Gross Unrealized Depreciation | (31,779,970) | | (699,649) | | - | | (52,978) |
| Net Unrealized Appreciation (Depreciation) | 34,373,750 | | (390,890) | | 1,417,368 | | 2,335,012 |
| | | | | | | | |
| Short Term Capital Loss Carryforward | - | | (2,347,761) | | (3,695,229) | | (6,629,655) |
| Long Term Capital Loss Carryforward | (15,196,100) | | (6,021,754) | | (726,743) | | (680,977) |
| Late Year Loss | (532,408) | | - | | (21,876) | | (44,854) |
| Distributable Earnings (Accumulated Deficit) | 18,645,242 | | (8,760,405) | | (3,026,480) | | (5,020,474) |
The difference between book-basis and tax-basis net unrealized appreciation (depreciation) is attributable to the deferral of losses from wash sales.
Capital Loss Carryforwards
Accumulated capital losses noted above represent net capital loss carryovers as of May 31, 2024, that are available to offset future realized capital gains, if any, and thereby reduce future taxable gain distributions. The capital loss carryforwards have no expiration date. Adaptive Hedged Multi-Asset Income ETF and RH Tactical Rotation ETF utilized capital loss carryovers in the amount of $20,506 and $88,319 respectively.
Late Year Loss Deferrals
For tax purposes, the current late year losses above were incurred during the period from January 1, 2024 through May 31, 2024. These losses will be recognized for tax purposes on the first business day of the Fund’s next fiscal year, June 1, 2024.
Adaptive ETFs
Notes to Financial Statements (consolidated with respect to the Adaptive Hedged Multi-Asset Income ETF)
As of May 31, 2024
| 6. | Risk Considerations (unaudited) |
Investments in the Funds are subject to the following risks:
| | Adaptive Alpha Opportunities ETF | Adaptive Hedged
Multi-Asset Income ETF | RH Tactical
Outlook ETF | RH Tactical Rotation ETF |
Asset-Backed Securities Investment | | X | | |
Authorized Participant | X | X | X | X |
Cash and Cash Equivalents | X | X | | |
Commodities | | X | X | |
Common Stock | X | | X | X |
Control of Portfolio Funds | X | X | X | X |
Convertible Securities | | X | | X |
Corporate Debt Securities | | X | | |
Counterparty Credit | X | X | X | X |
Credit | | X | | |
Cybersecurity | X | X | X | X |
Early Close/Trading Halt | X | X | X | X |
Equity Securities | X | | X | X |
ETF Investing | X | X | X | X |
ETF Structure | X | X | X | X |
ETN | | X | | X |
Fixed Income | X | X | X | |
Foreign Securities and Emerging Markets | X | X | | |
Fund Investing | X | X | X | X |
Hedging | | X | | |
High-Yield | | X | | |
Inflation | | X | | |
Interest Rate | | X | | |
Inverse ETF Risk | | X | | |
Investment Advisor | X | X | X | X |
Large-Cap Securities | X | | X | X |
Leveraged and Inverse ETFs | | X | | X |
Adaptive ETFs
Notes to Financial Statements (consolidated with respect to the Adaptive Hedged Multi-Asset Income ETF)
As of May 31, 2024
| | Adaptive Alpha Opportunities ETF | Adaptive Hedged
Multi-Asset Income ETF | RH Tactical
Outlook ETF | RH Tactical Rotation ETF |
LIBOR | | X | | |
Liquidity | | X | | |
Managed Volatility | X | X | X | X |
Management | X | X | X | X |
Market | X | X | X | X |
Mortgage-Backed Securities | | X | | |
Pandemic | X | X | X | X |
Portfolio Turnover | X | | X | X |
Preferred Equity | | X | | X |
Quantitative | X | X | | X |
Rating Agencies | | X | | |
REIT | | X | X | |
Risks from Purchasing Options | X | X | X | X |
Risks from Selling or Writing Options | X | X | X | X |
Subsidiary | | X | | |
Small-Cap and Mid-Cap Securities | X | | X | X |
Tax | | X | | |
U.S. Government Securities | | X | | |
Asset-Backed Securities Investment Risk. Asset-backed investments tend to increase in value less than other debt securities when interest rates decline but are subject to similar risk of decline in market value during periods of rising interest rates. In a period of declining interest rates, the Fund may be required to reinvest more frequent prepayments on asset-backed investments in lower-yielding investments. Asset-backed securities in the Fund invests may have underlying assets. There is a risk that borrowers may default on their obligations in respect of those underlying obligations. Certain assets underlying asset-backed securities are subject to prepayment, which may reduce the overall return to asset-backed security holders. Holders also may experience delays in payment or losses on the securities if the full amounts due on underlying sales contracts or receivables are not realized because of unanticipated legal or administrative costs of enforcing the contracts or because of depreciation or damage to the collateral securing certain contracts, or other factors. The value of asset-backed securities may be substantially dependent on the servicing of the underlying asset pools and are therefore subject to risks associated with the negligence or malfeasance by their servicers and to the credit risk of their servicers. The impairment of the value of collateral or other assets underlying an asset-backed security, such as a result of non-payment of loans or non-performance of other collateral or underlying assets, may result in a reduction in the value of such asset-backed securities and losses to the Fund. It is possible that many, or all asset-backed securities will fall out of favor at any time or over time with investors, affecting adversely the values and liquidity of the securities.
Authorized Participant Risk. Only an Authorized Participant may engage in creation or redemption transactions directly with the Fund. The Fund has a limited number of institutions that may act as Authorized Participants on an agency basis (i.e., on behalf of other market participants). Authorized Participant concentration risk may be heightened for exchange-traded funds (ETFs), such as the Fund, that invest in securities issued by non-U.S. issuers or other securities or instruments that have lower trading volumes.
Adaptive ETFs
Notes to Financial Statements (consolidated with respect to the Adaptive Hedged Multi-Asset Income ETF)
As of May 31, 2024
Cash and Cash Equivalents Risk. At any time, the Fund may have significant investments in cash or cash equivalents. When a substantial portion of a portfolio is held in cash or cash equivalents, there is the risk that the value of the cash account, including interest, will not keep pace with inflation, thus reducing purchasing power over time.
Commodities Risk. The Fund and Portfolio Funds may have exposure to the commodities markets, subjecting the Fund to risks not associated with investments in traditional securities. The value of commodities related investments may be affected by changes in overall market movements, commodity index volatility, changes in interest rates, or factors affecting a particular industry or commodity, including drought, floods, weather, livestock disease, embargoes, and tariffs. The prices of industrial metals, precious metals, agriculture, and livestock commodities may fluctuate widely due to changes in value, supply and demand, and governmental regulatory policies.
Common Stock Risk. Investments by the Fund and Portfolio Funds in shares of common stock may fluctuate in value response to many factors, including the activities of the individual issuers whose securities the Fund or Portfolio Fund owns, general market and economic conditions, interest rates, and specific industry changes. Such price fluctuations subject the Fund to potential losses. In addition, regardless of any one company’s particular prospects, a declining stock market may produce a decline in prices for all equity securities, which could also result in losses for the Fund. Market declines may continue for an indefinite period of time, and investors should understand that during temporary or extended bear markets, the value of common stocks will decline.
Control of Portfolio Funds Risk. The Portfolio Funds each have their own unique investment objective, strategies, and risks. There is no guarantee that the Portfolio Funds will achieve their investment objectives and the Fund has exposure to the investment risks of the Portfolio Funds in direct proportion to the allocation of assets among the funds. The investment policies of the Portfolio Funds may differ from the Fund’s policies.
Although the Fund and the Advisor will evaluate regularly each Portfolio Fund to determine whether its investment program is consistent with the Fund’s investment objective, the Advisor will not have any control over the investments made by a Portfolio Fund. Even though each Portfolio Fund is subject to certain constraints, the investment advisor of each Portfolio Fund may change aspects of its investment strategies at any time. The Advisor will not have the ability to control or otherwise influence the composition of the investment portfolio of a Portfolio Fund.
Convertible Securities Risk. Convertible securities are fixed income securities that the Fund or a Portfolio Fund has the option to exchange for equity securities at a specified conversion price. The option allows the Fund or Portfolio Fund to realize additional returns if the market price of the equity securities exceeds the conversion price. For example, the Portfolio Fund may hold fixed income securities that are convertible into shares of common stock at a conversion price of $10 per share. If the market value of the shares of common stock reached $12, the Portfolio Fund could realize an additional $2 per share by converting its fixed income securities. Convertible securities have lower yields than comparable fixed income securities. In addition, at the time a convertible security is issued the conversion price exceeds the market value of the underlying equity securities. Thus, convertible securities may provide lower returns than non-convertible fixed income securities or equity securities depending upon changes in the price of the underlying equity securities. However, convertible securities permit the Fund or Portfolio Fund to realize some of the potential appreciation of the underlying equity securities with less risk of losing its initial investment.
Corporate Debt Securities Risk. The Fund and Portfolio Funds may invest in corporate debt securities. Corporate debt securities are fixed income securities issued by businesses. Notes, bonds, debentures, and commercial paper are the most prevalent types of corporate debt securities. The credit risks of corporate debt securities vary widely among issuers. In addition, the credit risk of an issuer’s debt security may vary based on its priority for repayment. Higher ranking (senior) debt securities have a higher priority than lower ranking (subordinated) securities. This means that the issuer might not make payments on subordinated securities while continuing to make payments on senior securities. In addition, in the event of bankruptcy, holders of senior securities may receive amounts otherwise payable to the holders of subordinated securities. Some subordinated securities, like trust preferred and capital securities notes, also permit the issuer to defer payments under certain circumstances. Insurance companies issue securities known as surplus notes that permit the insurance company to defer any payment that would reduce its capital below regulatory requirements.
Counterparty Credit Risk. The stability and liquidity of many derivative transactions depends in large part on the creditworthiness of the parties to the transactions. If a counterparty to such a transaction defaults, exercising contractual rights may involve delays or costs for the Fund. Furthermore, there is a risk that a counterparty could become the subject of insolvency proceedings, and that the recovery of securities and other assets from such counterparty will be delayed or be of a value less than the value of the securities or assets originally entrusted to such counterparty.
Adaptive ETFs
Notes to Financial Statements (consolidated with respect to the Adaptive Hedged Multi-Asset Income ETF)
As of May 31, 2024
Credit Risk. Credit risk refers to the risk that an issuer or counterparty will fail to pay its obligations to the Fund when they are due. As a result, the Fund’s income might be reduced, the value of the Fund’s investment might fall, and/or the Fund could lose the entire amount of its investment. Changes in the financial condition of an issuer or counterparty, changes in specific economic, social, or political conditions that affect a particular type of security or other instrument or an issuer, and changes in economic, social, or political conditions generally can increase the risk of default by an issuer or counterparty, which can affect a security’s or other instrument’s credit quality or value and an issuer’s or counterparty’s ability to pay interest and principal when due. The values of lower-quality debt securities (commonly known as “junk bonds”) tend to be particularly sensitive to these changes.
Cybersecurity Risk. As part of its business, the Advisor processes, stores, and transmits large amounts of electronic information, including information relating to the transactions of the Fund. The Advisor and the Fund are therefore susceptible to cybersecurity risk. Cyber-attacks include, among other behaviors, stealing or corrupting data maintained online or digitally, denial of service attacks on websites, the unauthorized release of confidential information, and causing operational disruption. Successful cyber-attacks against, or security breakdowns of, the Fund or its advisor, custodians, fund accountant, fund administrator, transfer agent, pricing vendors, and/or other third-party service providers may adversely impact the Fund and its shareholders. For instance, cyber-attacks may interfere with the processing of shareholder transactions, impact the Fund’s ability to calculate its NAV, cause the release of private shareholder information or confidential Fund information, impede trading, cause reputational damage, and subject the Fund to regulatory fines, penalties or financial losses, reimbursement or other compensation costs, and/or additional compliance costs. The Fund also may incur substantial costs for cybersecurity risk management in order to guard against any cyber incidents in the future. The Fund and its shareholders could be negatively impacted as a result.
Early Close/Trading Halt Risk. An exchange or market may close or issue trading halts on specific securities, or the ability to buy or sell certain securities or financial instruments may be restricted, which may prevent the Fund from buying or selling certain securities or financial instruments. In these circumstances, the Fund may be unable to rebalance its portfolio, may be unable to accurately price its investments and may incur substantial trading losses.
Equity Securities Risk. Investments by the Portfolio Funds in equity securities may fluctuate in value response to many factors, including the activities of the individual issuers whose securities the Portfolio Fund owns, general market and economic conditions, interest rates, and specific industry changes. Such price fluctuations subject the Fund to potential losses. During temporary or extended bear markets, the value of equity securities will decline, which could also result in losses for the Fund.
ETF Investing Risk. An investment in an ETF is an investment in another investment company and therefore the Fund’s shareholders will indirectly bear its proportionate share of any fees and expenses of the ETFs in which the Fund invests in addition to the Fund’s own fees and expenses. As a result, the cost of investing will be higher than the cost of investing directly in the ETFs and may be higher than mutual funds that invest directly in stocks and bonds. ETFs are subject to the following risks: (i) the market price of an ETF’s shares may trade above or below its NAV; (ii) an active trading market for an ETF’s shares may not develop or be maintained; (iii) trading of an underlying ETF’s shares may be halted if the listing exchange’s officials deem such action appropriate, the shares are delisted from the exchange, or the activation of market wide “circuit breakers” (which are tied to large decreases in stock prices) halts stock trading generally; or (iv) the ETF may fail to achieve close correlation with the index that it tracks due to a variety of factors, such as rounding of prices and changes to the index and/or regulatory policies, resulting in the deviation of the ETF’s returns from that of its corresponding index. Some ETFs may be thinly traded, and the resulting higher costs associated with respect to purchasing and selling the ETFs in the Fund’s portfolio will be borne by the Fund.
ETF Structure Risks. The Fund is structured as an ETF and as a result is subject to the special risks, including:
| o | Not Individually Redeemable. Shares are not individually redeemable and may be redeemed by the Fund at NAV only in large blocks known as “Creation Units.” You may incur brokerage costs purchasing enough Shares to constitute a Creation Unit. |
| o | Trading Issues. An active trading market for the Shares may not be developed or maintained. Trading in Shares on the Exchange may be halted due to market conditions or for reasons that, in the view of the Exchange, make trading in Shares inadvisable, such as extraordinary market volatility. There can be no assurance that Shares will continue to meet the listing requirements of the Exchange. If the Shares are traded outside a collateralized settlement system, the number of financial institutions that can act as authorized participants that can post collateral on an agency basis is limited, which may limit the market for the Shares. Any absence of an active trading market. In turn, lead to a heightened risk of a difference between the market price of the Shares and the value of the Shares, which would be reflected in a wider bid-ask spread. |
Adaptive ETFs
Notes to Financial Statements (consolidated with respect to the Adaptive Hedged Multi-Asset Income ETF)
As of May 31, 2024
| o | Cash purchases. To the extent Creation Units are purchased by APs in cash instead of in-kind, the Fund will incur certain costs such as brokerage expenses and taxable gains and losses. These costs could be imposed on the Fund and impact the NAV if not fully offset by transaction fees paid by the APs. |
| o | Market Price Variance Risk. The market prices of Shares will fluctuate in response to changes in NAV and supply and demand for Shares and will include a “bid-ask spread” charged by the exchange specialists, market makers or other participants that trade the particular security. A bid-ask spread is the difference between the price quoted in the market for an immediate sale (bid) and an immediate purchase (ask) of the ETF’s shares. There may be times when the market price and the NAV vary significantly. This means that Shares may trade at a discount to NAV, and the bid-ask spread could widen. |
| ◾ | In times of market stress, market makers may step away from their role market making in shares of ETFs and in executing trades, which can lead to differences between the market value of Shares and the NAV, and the bid-ask spread could widen. |
| ◾ | To the extent authorized participants exit the business or are unable to process creations or redemptions and no other AP can step in to do so, there may be a significantly reduced trading market in the Shares, which can lead to differences between the market value of Shares and the NAV, and the bid-ask spread could widen. |
| ◾ | The market price for the Shares may deviate from the NAV, particularly during times of market stress, with the result that investors may pay significantly more or receive significantly less for Shares than the NAV, which is reflected in the bid and ask price for Shares or in the closing price. |
| ◾ | When all or a portion of an ETFs underlying securities trade in a market that is closed when the market for the Shares is open, there may be changes from the last quote of the closed market and the quote from the Fund’s domestic trading day, which could lead to differences between the market value of the Shares and the NAV, and the bid-ask spread could widen. |
| ◾ | In stressed market conditions, the market for the Shares may become less liquid in response to the deteriorating liquidity of the Fund’s portfolio. This adverse effect on the liquidity of the Shares may, in turn, lead to differences between the market value of the Shares and the NAV, and the bid-ask spread could widen. |
ETN Risk. Similar to ETFs, owning an ETN generally reflects the risks of owning the assets that comprise the underlying market benchmark or strategy that the ETN is designed to reflect. ETNs also are subject to issuer and fixed-income risk. ETN holders are exposed to an issuer’s credit risk, which does not affect ETF holders. ETNs are senior unsecured obligations of the issuer. The repayment of the principal and any applicable return at maturity or upon repurchase by the issuer are dependent on that issuer's ability to pay.
Fixed Income Risk. Fixed income risk factors include credit risk (the debtor may default) and prepayment risk (the debtor may pay its obligation early or later than expected, potentially reducing the amount of interest payments or extending time to principal repayment). These risks could affect the value of a particular investment possibly causing the Fund's share price and total return to be reduced and fluctuate more than other types of investments. When the Fund invests in fixed income securities the value of your investment in the Fund will fluctuate with changes in interest rates. Typically, a rise in interest rates causes a decline in the value of fixed income securities. Interest rates are currently at historical lows, which may impact the Fund’s risk profile. In general, the market price of debt securities with longer maturities will increase or decrease more in response to changes in interest rates than shorter-term securities. If the U.S. Federal Reserve’s Federal Open Market Committee (“FOMC”) raises the federal funds interest rate target, interest rates across the U.S. financial system may rise. However, the magnitude of rate changes across maturities and borrower sectors is uncertain. Rising rates may decrease liquidity and increase volatility, which may make portfolio management more difficult and costly to the Fund and its shareholders. Additionally, default risk increases if issuers must borrow at higher rates. Generally, these changing market conditions may cause the Fund’s share price to fluctuate or decline more than other types of equity investments.
Foreign Securities and Emerging Markets Risk. Foreign securities have investment risks different from those associated with domestic securities. Changes in foreign economies and political climates are more likely to affect the Fund or a Portfolio Fund with significant investments in foreign securities than another fund that invests exclusively in domestic securities. The value of foreign currency denominated securities or foreign currency contracts is affected by the value of the local currency relative to the U.S. dollar. There may be less government supervision of foreign markets, resulting in non-uniform accounting practices and less publicly available information about issuers of foreign securities. The value of foreign investments may be affected by changes in exchange control regulations, application of foreign tax laws (including withholding tax), changes in governmental economic or monetary policy (in this country or abroad) or changed circumstances in dealings between nations. In addition, foreign brokerage commissions, custody fees, and other costs of investing in foreign securities are often higher than in the United States. Investments in foreign issues could be affected by other factors not present in the United States, including expropriation, armed conflict, confiscatory taxation, and potential difficulties in enforcing contractual obligations.
Adaptive ETFs
Notes to Financial Statements (consolidated with respect to the Adaptive Hedged Multi-Asset Income ETF)
As of May 31, 2024
The Fund and Portfolio Funds may also invest in emerging markets, which are markets of countries in the initial stages of industrialization and have low per capital income. In addition to the risks of foreign securities in general, countries in emerging markets are more volatile and can have relatively unstable governments, social and legal systems that do not protect shareholders, economies based on only a few industries, there may be greater market manipulation, and securities markets that trade a small number of issues which could reduce liquidity. There is also less publicly available information on emerging market companies due to differences in regulation, accounting, auditing, and financial recordkeeping requirements, and the information available may be unreliable or outdated.
Fund Investing Risk. Investments in other investment companies subject the Fund to additional operating and management fees and expenses. Investors in the Fund will indirectly bear fees and expenses charged by the funds in which the Fund invests, in addition to the Fund’s direct fees and expenses. As a result, the cost of investing in the Fund will be higher than the cost of investing directly in the Portfolio Funds and also may be higher than other funds that invest directly in securities. The Fund’s performance depends in part upon the performance of the investment advisor to each Portfolio Fund, the strategies and instruments used by the Portfolio Funds, and the Advisor's ability to select Portfolio Funds and effectively allocate fund assets among them. Furthermore, the use of a fund of funds structure could affect the timing, amount, and character of distributions and therefore may increase the amount of taxes payable by you.
Hedging Risk.
Techniques used by Advisor to hedge the Fund’s investments carry the risks that such techniques may not protect against market declines. The techniques may also limit the Fund’s participation in market gains. Further, such techniques may increase portfolio transaction costs, which could result in losses or reduced gains. They also may not be successful as the techniques are subject to the Advisor’s ability to correctly analyze and implement the hedging techniques in a timely manner.
High-Yield Risk. The Fund and Portfolio Funds may invest in junk bonds, including bonds of issuers in default, and other fixed income securities that are rated below investment grade. Securities in this rating category are speculative and are usually issued by companies without long track records of sales and earnings, or by those companies with questionable credit strength.
Credit risk is greater for junk bonds, particularly for bonds of issuers in default, than for investment grade bonds, which is the risk that issuers will not make payments on fixed income securities held by the Fund, resulting in losses to the Fund. Changes in economic conditions or other circumstances may have a greater effect on the ability of issuers of these securities to make principal and interest payments than they do on issuers of higher-grade securities. The retail secondary market for junk bonds may be less liquid than that of higher-rated securities and adverse conditions could make it difficult at times to sell certain securities or could result in lower prices. Additionally, these instruments are unsecured and may be subordinated to other creditor’s claims.
Inflation Risk. Fixed income securities held by the Fund and Portfolio Funds are subject to inflation risk. Because inflation reduces the purchasing power of income produced by existing fixed income securities, the prices at which fixed income securities trade will be reduced to compensate for the fact that the income they produce is worth less. This potential decrease in market value of fixed income securities would result in a loss in the value of the Fund’s portfolio.
Interest Rate Risk. Interest rates may rise resulting in a decrease in the value of the fixed income securities held by the Fund and Portfolio Funds or may fall resulting in an increase in the value of such securities. Interest rates are currently at historic lows due to the various federal government stimulus programs as a result of the COVID-19 pandemic. Fixed income securities with longer maturities involve greater risk than those with shorter maturities.
Inverse ETF Risk. Investing in inverse ETFs may result in increased volatility due to the inverse ETF’s possible use of short sales of securities and derivatives such as options and futures. The use of leverage by an ETF increases risk to the Fund. The more a fund invests in leveraged instruments, the more the leverage will magnify any gains or losses on those investments. During periods of increased volatility, inverse ETFs may not perform in the manner they are designed.
Investment Advisor Risk. The Advisor’s ability to choose suitable investments has a significant impact on the ability of the Fund to achieve its investment objectives.
Large-Cap Securities Risk. Stocks of large companies as a group can fall out of favor with the market, causing the Fund to underperform investments that have a greater focus on mid-cap or small-cap stocks. Larger, more established companies may be slow to respond to challenges and may grow more slowly than smaller companies.
Adaptive ETFs
Notes to Financial Statements (consolidated with respect to the Adaptive Hedged Multi-Asset Income ETF)
As of May 31, 2024
Leveraged and Inverse ETFs. Investing in leveraged ETFs will amplify the Fund’s gains and losses. Most leveraged ETFs “reset” daily. Due to the effect of compounding, their performance over longer periods of time can differ significantly from the performance of their underlying index or benchmark during the same period of time. Investing in inverse ETFs may result in increased volatility due to the funds’ possible use of short sales of securities and derivatives such as options and futures. The use of leverage by an ETF increases risk to the Fund. The more a fund invests in leveraged instruments, the more the leverage will magnify any gains or losses on those investments. During periods of increased volatility, inverse ETFs may not perform in the manner they are designed.
Libor Risk. Certain of the Fund’s or Portfolio Funds’ investments may use a floating rate based on the London Interbank Offered Rate (“LIBOR”), which is the offered rate for short-term Eurodollar deposits between major international banks. As of December 31, 2021, the United Kingdom Financial Conduct Authority (“FCA”) and LIBOR’s administrator, ICE Benchmark Administration, have ceased the publication of all non-U.S. dollar LIBOR and the one-week and two-month U.S. dollar LIBOR rates, but the most widely used U.S. dollar LIBOR settings will continue to be published until June 30, 2023. Further, on March 15, 2022, the Consolidated Appropriations Act of 2022, which includes the Adjustable Interest Rate (LIBOR) Act, was signed into law in the United States. This legislation establishes a uniform benchmark replacement process for financial contracts that mature after June 30, 2023, that do not contain clearly defined or practicable fallback provisions.
The U.S. Federal Reserve, based on the recommendations of the New York Federal Reserve’s Alternative Reference Rate Committee (comprised of major derivative market participants and their regulators), has begun publishing the Secured Overnight Financing Rate (referred to as “SOFR”), which is their preferred alternative rate for U.S. dollar LIBOR. Proposals for alternative reference rates for other currencies have also been announced or have already begun publication. Markets are in the process of developing in response to these new rates. Although financial regulators and industry working groups have suggested alternative reference rates, such as the European Interbank Offer Rate, the Sterling Overnight Interbank Average Rate and SOFR, there has been no global consensus as to an alternative rate and the process for amending existing contracts or instruments to transition away from LIBOR remains incomplete.
The elimination of LIBOR or changes to other reference rates or any other changes or reforms to the determination or supervision of reference rates could have an adverse impact on the market for, or value of, any securities or payments linked to those reference rates, which may adversely affect Fund performance and/or net asset value. Uncertainty and risk also remain regarding the willingness and ability of issuers and lenders to include revised provisions in new and existing contracts or instruments. Consequently, the transition away from LIBOR to other reference rates may lead to increased volatility and illiquidity in markets that are tied to LIBOR, fluctuations in values of LIBOR-related investments or investments in issuers that utilize LIBOR, increased difficulty in borrowing or refinancing and diminished effectiveness of hedging strategies, potentially adversely affecting Fund performance. Furthermore, the risks associated with the expected discontinuation of LIBOR and transition to alternative rates may be exacerbated if the work necessary to effect an orderly transition to an alternative reference rate is not completed in a timely manner.
Liquidity Risk. Liquidity risk exists when particular investments of the Fund would be difficult to purchase or sell, possibly preventing the Fund from selling such illiquid securities at an advantageous time or price, or possibly requiring the Fund to dispose of other investments at unfavorable times or prices in order to satisfy its obligations.
Illiquid investments may be difficult to dispose of at a fair price at the times when the Fund believes it is desirable to do so. The market price of illiquid investments generally is more volatile than that of more liquid investments, which may adversely affect the price that the Fund pays for or recovers upon the sale of such investments. Illiquid investments are also more difficult to value, especially in challenging markets. The Advisor’s judgment may play a greater role in the valuation process. Investment of the Fund’s assets in illiquid securities may restrict the Fund’s ability to take advantage of market opportunities.
Managed Volatility Risk. Techniques used by the Advisor to manage the volatility of the Fund’s investments carry the risks that such techniques may not protect against market declines. The techniques may also limit the Fund’s participation in market gains, particularly during periods where market values are increasing but market volatility is high. Further, such techniques may increase portfolio transaction costs, which could result in losses or reduced gains. They also may not be successful as the techniques are subject to the Advisor’s ability to correctly analyze and implement the volatility management techniques in a timely manner.
Management Risk. The Fund is subject to management risk because it is an actively managed portfolio. In managing the Fund’s portfolio securities, the Advisor will apply investment techniques and risk analyses in making investment decisions for the Fund, but there can be no guarantee that these will produce the desired results.
Market Risk. Market risk refers to the possibility that the value of securities held by the Fund may decline due to daily fluctuations in the market. Market prices for securities change daily as a result of many factors, including developments affecting the condition of both individual companies and the market in general. The price of a security may even be affected by factors unrelated to the value or condition of its issuer, including changes in interest rates, economic and political conditions, and general market conditions. The Fund’s performance per share will change daily in response to such factors.
Adaptive ETFs
Notes to Financial Statements (consolidated with respect to the Adaptive Hedged Multi-Asset Income ETF)
As of May 31, 2024
Mortgage-Backed Securities Risk. Investments by the Fund in fixed rate and floating rate mortgage-backed securities will entail credit risks (i.e., the risk of non-payment of interest and principal) and market risks (i.e., the risk that interest rates and other factors could cause the value of the instrument to decline). Many issuers or servicers of mortgage-backed securities guarantee timely payment of interest and principal on the securities, whether or not payments are made when due on the underlying mortgages. This kind of guarantee generally increases the quality of a security but does not mean that the security’s market value and yield will not change. The values of mortgage-backed securities may change because of changes in the market’s perception of the credit quality of the assets held by the issuer of the mortgage-backed securities or an entity, if any, providing credit support in respect of the mortgage-backed securities. In addition, an unexpectedly high rate of defaults on the mortgages held by a mortgage pool may limit substantially the pool’s ability to make payments of principal or interest to the Fund as a holder of such securities, reducing the values of those securities or in some cases rendering them worthless. The Fund also may purchase securities that are not guaranteed or subject to any credit support. An investment in a privately issued mortgage-backed security may be less liquid and subject to greater credit risks than an investment in a mortgage-backed security that is issued or otherwise guaranteed by a federal government agency. The liquidity of mortgage-backed securities can change significantly over time. Like bond investments, the value of fixed rate mortgage-backed securities will tend to rise when interest rates fall and fall when rates rise. Floating rate mortgage-backed securities generally tend to have more moderate changes in price when interest rates rise or fall, but their current yield will be affected. In addition, the mortgage-backed securities market in general may be adversely affected by changes in governmental legislation or regulation. Factors that could affect the value of a mortgage-backed security include, among other things, the types and amounts of insurance which an individual mortgage or that specific mortgage-backed security carries, the default and delinquency rate of the mortgage pool, the amount of time the mortgage loan has been outstanding, the loan-to-value ratio of each mortgage, and the amount of overcollateralization or undercollateralization of a mortgage pool.
The residential mortgage market in the United States has experienced difficulties that may adversely affect the performance and market value of certain of the Fund’s mortgage-related investments. Delinquencies and losses on residential mortgage loans generally increased in the last decade and potentially could begin to increase again. Ongoing developments in the residential mortgage market may have additional consequences to the market for mortgage-backed securities.
In addition, the liquidity of mortgage-backed securities varies by type of security; at certain times a Fund may be unable to dispose of such investments at a desirable time or at the value the Fund has placed on the investment. Because mortgage-backed securities may be less liquid than other securities, the Funds may be more susceptible to liquidity risks than funds that invest in other securities. In the past, in stressed markets, certain types of mortgage-backed securities suffered periods of illiquidity if disfavored by the market.
Commercial mortgage-backed securities (“CMBS”) include securities that reflect an interest in, or are secured by, mortgage loans on commercial real property. Many of the risks of investing in commercial mortgage-backed securities reflect the risks of investing in the real estate securing the underlying mortgage loans. These risks reflect the effects of local and other economic U.S. conditions on real estate markets, the ability of tenants to make loan payments, and the ability of a property to attract and retain tenants. Commercial mortgage-backed securities may be less liquid and exhibit greater price volatility than other types of mortgage- or asset-backed securities.
Pandemic Risk. There is an ongoing global outbreak of COVID-19, which has spread to over 200 countries and territories, including the United States. The general uncertainty surrounding the dangers and impact of COVID-19 has created significant disruption in global supply chains and economic activity, increasing rates of unemployment and adversely impacting many industries. The outbreak could have a continued adverse impact on economic and market conditions and trigger a period of global economic slowdown. The outbreak of the COVID-19 pandemic has, at times, had, and is expected to continue to pose a risk of having, a material adverse impact on the Fund’s market price, NAV and portfolio liquidity among other factors. These impacts will likely continue to some extent as the outbreak persists and potentially even longer. The rapid development and fluidity of this situation precludes any prediction as to the ultimate adverse impact of COVID-19 on economic and market conditions, and, as a result, present material uncertainty and risk with respect to the Fund and the performance of its investments. COVID-19 and the current financial, economic and capital markets environment, and future developments in these and other areas present uncertainty and risk with respect to the Fund’s performance, portfolio liquidity, ability to pay distributions and make share repurchases.
Portfolio Turnover Risk. The Advisor will sell Portfolio Funds and other securities when it is in the best interest of the Fund and its shareholders to do so without regard to the length of time they have been held. As portfolio turnover may involve paying brokerage commissions and other transaction costs, there could be additional expenses for the Fund. High rates of portfolio turnover may also result in the realization of short-term capital gains and losses. Any distributions resulting from such gains will be considered ordinary income for federal income tax purposes.
Adaptive ETFs
Notes to Financial Statements (consolidated with respect to the Adaptive Hedged Multi-Asset Income ETF)
As of May 31, 2024
Preferred Equity Risk. Preferred equity’s right to dividends and liquidation proceeds is junior to the rights of a company’s debt securities. The value of preferred equity may be subject to factors that affect fixed income and equity securities, including changes in interest rates and in a company’s creditworthiness. The value of preferred equity tends to vary more with fluctuations in the underlying common equity and less with fluctuations in interest rates and tends to exhibit greater volatility. Shareholders of preferred equity may suffer a loss of value if dividends are not paid and have limited voting rights.
Quantitative Risk. Securities or other investments selected using quantitative methods may perform differently from the market as a whole for many reasons, including the factors used in building the quantitative analytical framework, the weights placed on each factor, and changing sources of market returns, among others. There can be no assurance that these methodologies will enable the Fund to achieve its objective.
Rating Agencies Risks. Ratings are not an absolute standard of quality, but rather general indicators that reflect only the view of the originating rating agencies from which an explanation of the significance of such ratings may be obtained. There is no assurance that a particular rating will continue for any given period of time or that any such rating will not be revised downward or withdrawn entirely. Such changes may negatively affect the liquidity or market price of the securities in which the Fund invests. The ratings of securitized assets may not adequately reflect the credit risk of those assets due to their structure.
REIT Risk. Investing in REITs involves certain unique risks in addition to those associated with the real estate sector generally, including poor performance by the REIT’s manager, adverse changes to the tax laws, and the possible failure by the REIT to qualify for the favorable tax treatment available to REITs under the Internal Revenue Code of 1986, as amended, or the exemption from registration under the 1940 Act. REITs are not diversified and are heavily dependent on cash flow. REITs whose underlying properties are concentrated in a particular industry or region are also subject to risks affecting such industries and regions. REITs (especially mortgage REITs) are also subject to interest rate risks. By investing in REITs through the Fund, a shareholder will bear expenses of the REITs in addition to Fund expenses.
Risks from Purchasing Options. If a call or put option purchased by the Fund is not sold when it has remaining value and if the market price of the underlying security, in the case of a call, remains less than or equal to the exercise price, or, in the case of a put, remains equal to or greater than the exercise price, the Fund will lose its entire investment in the option. Since many factors influence the value of an option, including the price of the underlying security, the exercise price, the time to expiration, the interest rate, and the dividend rate of the underlying security, the Advisor’s success in implementing the Fund’s strategy may depend on an ability to predict movements in the prices of individual securities, fluctuations in markets, and movements in interest rates. There is no assurance that a liquid market will exist when the Fund seeks to close out an option position. Where a position in a purchased option is used as a hedge against price movements in a related position, the price of the option may move more or less than the price of the related position.
Risks from Selling or Writing Options. Writing option contracts can result in losses that exceed the Fund’s initial investment and may lead to additional turnover and higher tax liability. The risk involved in writing a call option is that there could be an increase in the market value of the security. If this occurred, the option could be exercised and the underlying security would then be sold by the Fund at a lower price than its current market value or in the case of cash settled options, the Fund would be required to purchase the option at a price that is higher than the original sales price for such option. Similarly, while writing call options can reduce the risk of owning stocks, such a strategy limits the opportunity of the Fund to profit from an increase in the market value of stocks in exchange for up-front cash at the time of selling the call option. The risk involved in writing a put option is that there could be a decrease in the market value of the underlying security. If this occurred, the option could be exercised and the underlying security would then be sold to the Fund at a higher price than its current market value or in the case of cash settled options, the Fund would be required to purchase the option at a price that is higher than the original sales price for such option.
There is no assurance that a liquid market will exist when the Fund seeks to close out an option position. Where a position in a written option is used as a hedge against price movements in a related position, the price of the option may move more or less than the price of the related position.
Subsidiary Risk. By investing in the Subsidiary, the Fund is indirectly exposed to the risks associated with the Subsidiary’s investments. There can be no assurance that the investment objective of the Subsidiary will be achieved. The Subsidiary is not registered under the 1940 Act, and, unless otherwise noted in this Prospectus, is not subject to all the investor protections of the 1940 Act. However, the Fund wholly owns and controls the Subsidiary, and the Fund and its Subsidiary are both managed by the Advisor and sub-advised by the Sub-Advisor, making it unlikely that the Subsidiary will take action contrary to the interests of the Fund and its shareholders. The Board has oversight responsibility for the investment activities of the Fund, including its investment in the Subsidiary, and the Fund’s role as sole shareholder of the Subsidiary. To the extent applicable to the investment activities of the Subsidiary, the Subsidiary will be subject to the same investment restrictions and limitations, and follow the same compliance policies and procedures, as its parent fund. Unlike the Fund, the Subsidiary will not seek to qualify as a regulated investment company under Subchapter M of the Code.
Adaptive ETFs
Notes to Financial Statements (consolidated with respect to the Adaptive Hedged Multi-Asset Income ETF)
As of May 31, 2024
There is a risk that the Internal Revenue Service could assert that the annual net profit realized by the Subsidiary and imputed for income tax purposes to the Fund will not be considered “qualifying income” for purposes of the Fund remaining qualified as a regulated investment company for U.S. federal income tax purposes. Changes in the laws of the United States and/or the Cayman Islands could result in the inability of the Fund and/or its Subsidiary to operate as described in this Prospectus and the SAI and could adversely affect the Fund. For example, the Cayman Islands does not currently impose any income, corporate or capital gains tax, estate duty, inheritance tax, gift tax, or withholding tax on the Subsidiary. If Cayman Islands law changes such that the Subsidiary must pay Cayman Islands taxes, the Fund’s shareholders would likely suffer decreased investment returns.
Small-Cap and Mid-Cap Securities Risk. The Fund and Portfolio Funds may invest in securities of small-cap and mid-cap companies, which involves greater risk than investing in larger and more established companies. This greater risk is, in part, attributable to the fact that the securities of these companies are usually less marketable and, therefore, more volatile than securities of larger, more established companies or the market in general. Because these companies normally have fewer shares outstanding than larger companies, it may be more difficult to buy or sell significant amounts of such shares without an unfavorable impact on prevailing prices. Another risk factor is that these companies often have limited product lines, markets, or financial resources and may lack management depth. Small-cap and mid-cap companies are typically subject to greater changes in earnings and business prospects than are larger, more established companies. These companies may be more vulnerable than larger companies to adverse business or economic developments, the risk exists that the companies will not succeed, and the prices of the companies’ shares could dramatically decline in value. You should expect that the value of the Shares will be more volatile than a fund that invests exclusively in large-capitalization companies.
Tax Risk. By investing in commodities indirectly through the Subsidiary, the Fund will obtain exposure to the commodities markets within the federal tax requirements that apply to the Fund. However, because the Subsidiary is a controlled foreign corporation, any income received from its investments will be passed through to the Fund as ordinary income, which may be taxed at less favorable rates than capital gains.
U.S. Government Securities Risk. Some U.S. Government securities, such as Treasury bills, notes, and bonds and mortgage-backed securities guaranteed by the Government National Mortgage Association (Ginnie Mae), are supported by the full faith and credit of the United States; others are supported by the right of the issuer to borrow from the U.S. Treasury; others are supported by the discretionary authority of the U.S. Government to purchase the agency’s obligations; still others are supported only by the credit of the issuing agency, instrumentality, or enterprise. Although U.S. Government-sponsored enterprises may be chartered or sponsored by Congress, they are not funded by Congressional appropriations, their securities are not issued by the U.S. Treasury, their obligations are not supported by the full faith and credit of the U.S. Government, and so investments in their securities or obligations issued by them involve greater risk than investments in other types of U.S. Government securities. In addition, certain governmental entities have been subject to regulatory scrutiny regarding their accounting policies and practices and other concerns that may result in legislation, changes in regulatory oversight and/or other consequences that could adversely affect the credit quality, availability or investment character of securities issued or guaranteed by these entities.
The beneficial ownership, either directly or indirectly, of 25% or more of the voting securities of a fund creates a presumption of control of a fund, under Section 2(a)(9) of the Investment Company Act of 1940. Although the Funds do not have information concerning the beneficial ownership of shares held in the names of Depository Trust Company (“DTC”) participants, as of May 31, 2024, to the Trust’s knowledge, the following shareholders owned of record or beneficially 5% or more of the outstanding Fund Shares were as follows:
Adaptive Alpha Opportunities ETF |
Charles Schwab & Co. | 34.24% |
National Financial Services, LLC | 29.06% |
Adaptive Hedged Multi-Asset Income ETF |
National Financial Services, LLC | 35.66% |
Charles Schwab & Co. | 27.66% |
Adaptive ETFs
Notes to Financial Statements (consolidated with respect to the Adaptive Hedged Multi-Asset Income ETF)
As of May 31, 2024
RH Tactical Outlook ETF |
Charles Schwab & Co. | 35.67% |
Pershing, LLC | 31.38% |
RH Tactical Rotation ETF |
Pershing, LLC | 38.28% |
Charles Schwab & Co. | 33.59% |
The RH Tactical Outlook ETF currently invests a significant portion of its assets in the SPDR S&P 500 ETF Trust (“SPY”) and the SPDR Portfolio S&P 400 Mid Cap ETF (“SPMD”). The RH Tactical Outlook ETF may redeem its investment from SPY and SPMD at any time if the Advisor determines that it is in the best interest of the RH Tactical Outlook ETF and its shareholders to do so. The performance of the RH Tactical Outlook ETF may be directly affected by the performance of SPY and/or SPMD. The financial statements of SPY and SPMD, including the portfolio of investments, can be found at www.ssga.com or www.sec.gov, and should be read in conjunction with the RH Tactical Outlook ETF’s financial statements. As of May 31, 2024, the RH Tactical Outlook ETF’s net assets invested in SPY and SPMD were 50.79% and 30.22%, respectively.
The RH Tactical Rotation ETF currently invests a significant portion of its assets in the SPDR S&P 500 ETF Trust (“SPY”). The RH Tactical Rotation ETF may redeem its investment from SPY at any time if the Advisor determines that it is in the best interest of the RH Tactical Rotation ETF and its shareholders to do so. The performance of the RH Tactical Rotation ETF may be directly affected by the performance of SPY. The financial statements of SPY, including the portfolio of investments, can be found at www.ssga.com or www.sec.gov, and should be read in conjunction with the RH Tactical Rotation ETF’s financial statements. As of May 31, 2024, the RH Tactical Rotation ETF’s net assets invested in SPY was 29.57%.
| 9. | Commitments and Contingencies |
Under the Trust’s organizational documents, its officers and Trustees are indemnified against certain liabilities arising out of the performance of their duties to the Funds. In addition, in the normal course of business, the Trust entered into contracts with its service providers, on behalf of the Funds, and others that provide for general indemnifications. The Funds’ maximum exposure under these arrangements is unknown, as this would involve future claims that may be made against the Funds. The Funds expect the risk of loss to be remote.
Distributions
Per share distributions during the subsequent period were as follows:
| ETF | Record date | Ex-Date | Payable Date | Ordinary Income |
| Adaptive Hedged Multi-Asset Income ETF | 6/28/24 | 6/28/24 | 7/1/23 | $0.0535 |
In accordance with GAAP, management has evaluated the need for disclosures and/or adjustments resulting from subsequent events through the date of issuance of these financial statements. Management has concluded there are no additional matters, other than those noted above, requiring recognition or disclosure.
REPORT OF INDEPENDENT REGISTERED PUBLIC ACCOUNTING FIRM
To the Board of Trustees of
Starboard Investment Trust
and Shareholders of Adaptive Alpha Opportunities ETF, Adaptive Hedged Multi-Asset Income ETF, RH Tactical Outlook ETF and RH Tactical Rotation ETF
Opinion on the Financial Statements
We have audited the accompanying statements of assets and liabilities of Adaptive Alpha Opportunities ETF, Adaptive Hedged Multi-Asset Income ETF, RH Tactical Outlook ETF and RH Tactical Rotation ETF (the “Funds”), each a series of Starboard Investment Trust, including the schedules of investments, as of May 31, 2024, the related statements of operations, the statements of changes in net assets and financial highlights for the year ended May 31, 2024, and the related notes (consolidated for 2024 with respect to the Adaptive Hedged Multi-Asset Income ETF) (collectively referred to as the “financial statements”). In our opinion, the financial statements present fairly, in all material respects, the financial position of the Funds as of May 31, 2024, the results of their operations, the changes in their net assets and their financial highlights for the year then ended (consolidated for 2024 with respect to the Adaptive Hedged Multi-Asset Income ETF), in conformity with accounting principles generally accepted in the United States of America.
The Funds’ statements of changes in net assets for the year ended May 31, 2023 and the financial highlights for each of the four years in the period ended May 31, 2023, have been audited by other auditors, whose reports dated July 28, 2023 and August 5, 2022, expressed an unqualified opinion on such financial statements and financial highlights.
Basis for Opinion
These financial statements are the responsibility of the Funds’ management. Our responsibility is to express an opinion on the Funds’ financial statements based on our audits. We are a public accounting firm registered with the Public Company Accounting Oversight Board (United States) (“PCAOB”) and are required to be independent with respect to the Funds in accordance with the U.S. federal securities laws and the applicable rules and regulations of the Securities and Exchange Commission and the PCAOB. We have served as the Funds’ auditor since 2024.
We conducted our audits in accordance with the standards of the PCAOB. Those standards require that we plan and perform the audit to obtain reasonable assurance about whether the financial statements are free of material misstatement, whether due to error or fraud. The Funds are not required to have, nor were we engaged to perform, an audit of its internal control over financial reporting. As part of our audits, we are required to obtain an understanding of internal control over financial reporting, but not for the purpose of expressing an opinion on the effectiveness of the Funds’ internal control over financial reporting. Accordingly, we express no such opinion.
Our audits included performing procedures to assess the risks of material misstatement of the financial statements, whether due to error or fraud, and performing procedures that respond to those risks. Such procedures included examining, on a test basis, evidence regarding the amounts and disclosures in the financial statements. Our audits also included evaluating the accounting principles used and significant estimates made by management, as well as evaluating the overall presentation of the financial statements. Our procedures included confirmation of securities owned as of May 31, 2024, by correspondence with the custodian and brokers; when replies were not received from brokers, we performed other auditing procedures. We believe that our audits provide a reasonable basis for our opinion.
TAIT, WELLER & BAKER LLP
Philadelphia, Pennsylvania
July 16, 2024
Adaptive ETFs
Additional Information (unaudited)
As of May 31, 2024
| 1. | Proxy Voting Policies and Voting Record |
A copy of the Advisor’s and Sub-Advisor’s Proxy Voting Policy are included as Appendix B to the Funds’ Statement of Additional Information and are available, without charge, upon request, by calling 800-773-3863, and on the website of the Securities and Exchange Commission (“SEC”) at http://www.sec.gov. Information regarding how each Fund voted proxies relating to portfolio securities during the most recent twelve-month period ended June 30, is available (1) without charge, upon request, by calling the Funds at the number above and (2) on the SEC’s website at http://www.sec.gov.
| 2. | Quarterly Portfolio Holdings |
Each Fund files its complete schedule of portfolio holdings with the SEC for the first and third quarters of each fiscal year on Form N-PORT. Each Fund’s Form N-PORT is available on the SEC’s website at http://www.sec.gov. You may also obtain copies without charge, upon request, by calling the Fund at 800-773-3863.
We are required to advise you within 60-days of each Fund’s fiscal period end regarding the federal tax status of certain distributions received by shareholders during each fiscal period.
Each of the Funds listed below had the following distribution information for the fiscal year ended May 31, 2024.
| ETF | Ordinary Income | Return of Capital |
| Adaptive Alpha Opportunities ETF | $ 614,635 | $ - |
| Adaptive Hedged Multi-Asset Income ETF | 2,222,343 | - |
Dividend and distributions received by retirement plans such as IRAs, Keogh-type plans, and 403(b) plans need not be reported as taxable income. However, many retirement plans may need this information for their annual information meeting.
| 4. | Schedule of Shareholder Expenses |
As a shareholder of the Funds, you incur ongoing costs, including management fees and other Fund expenses. The Examples are intended to help you understand your ongoing costs (in dollars) of investing in the Funds and to compare these costs with the ongoing costs of investing in other mutual funds and/or exchange-traded products.
The Example is based on an investment of $1,000 invested at the beginning of the period and held for the entire period from November 1, 2023 through May 31, 2024.
Actual Expenses Table– This table below provides information about actual account values and actual expenses. You may use the information in this line, together with the amount you invested, to estimate the expenses that you paid over the period. Simply divide your account value by $1,000 (e.g., an $8,600 account value divided by $1,000 = 8.6), then multiply the result by the number in the first line under the heading entitled “Expenses Paid During Period” to estimate the expenses you paid on your account during this period.
Hypothetical Example for Comparison Purposes – This table below provides information about hypothetical account values and hypothetical expenses based on the Fund’s actual expense ratio and an assumed rate of return of 5% per year before expenses, which is not the Fund’s actual return. The hypothetical account values and expenses may not be used to estimate the actual ending account balance or expenses you paid for the period. You may use this information to compare the ongoing costs of investing in the Fund and other funds. To do so, compare this 5% hypothetical example with the 5% hypothetical examples that appear in the shareholder reports of the other funds.
Please note that the expenses shown in the table are meant to highlight your ongoing costs only and do not reflect any transactional costs, such as sales charges (loads), redemption fees, or exchange fees. Therefore, the second table is useful in comparing ongoing costs only and will not help you determine the relative total costs of owning different funds. In addition, if these transactional costs were included, your costs would have been higher.
| Actual Return | | | | |
| Fund | Beginning Value 06/1/2024 | Ending Value 11/30/2024 | Expense Paid During Period* | Annualized Expense Ratio* |
| Adaptive Alpha Opportunities ETF | $1,000.00 | $1,112.90 | $6.29 | 1.19% |
| Adaptive Hedged Multi-Asset Income ETF | 1,000.00 | 1,102.60 | 4.47 | 0.85% |
| RH Tactical Outlook ETF | 1,000.00 | 1,129.50 | 6.65 | 1.25% |
| RH Tactical Rotation ETF | 1,000.00 | 1,194.20 | 6.80 | 1.24% |
| | | | | |
Adaptive ETFs
Additional Information (unaudited)
As of May 31, 2024
| Hypothetical Return | | | | |
| Fund | Beginning Value 06/1/2024 | Ending Value 11/30/2024 | Expense Paid During Period* | Annualized Expense Ratio* |
| Adaptive Alpha Opportunities ETF | $1,000.00 | $1,038.10 | $6.06 | 1.19% |
| Adaptive Hedged Multi-Asset Income ETF | 1,000.00 | 1,041.50 | 4.34 | 0.85% |
| RH Tactical Outlook ETF | 1,000.00 | 1,037.50 | 6.37 | 1.25% |
| RH Tactical Rotation ETF | 1,000.00 | 1,037.60 | 6.32 | 1.24% |
*Expenses are equal to the Fund’s annualized expense ratio multiplied by the average account value over the period, multiplied by 183/366 (to reflect the one-half year period).
| 5. | Approval of Investment Advisory Agreement |
Investment Advisory Agreement with the Advisor
In connection with the regular Board meeting held on December 7, 2023, the Board, including a majority of the Independent Trustees, discussed the approval of a management agreement between the Trust and the Advisor, with respect to the Funds (the "Investment Advisory Agreement").
The Trustees were assisted by legal counsel throughout the review process. The Trustees relied upon the advice of legal counsel and their own business judgment in determining the material factors to be considered in evaluating the Investment Advisory Agreement and the weight to be given to each factor considered. The conclusions reached by the Trustees were based on a comprehensive evaluation of all of the information provided and were not the result of any one factor. Moreover, each Trustee may have afforded different weight to the various factors in reaching his conclusions with respect to the approval of the Investment Advisory Agreement. In connection with their deliberations regarding approval of the Investment Advisory Agreement, the Trustees reviewed materials prepared by the Advisor.
In deciding on whether to approve the Investment Advisory Agreement, the Trustees considered numerous factors, including:
(i) Nature, Extent, and Quality of Services. The Trustees considered the responsibilities of the Advisor under the Investment Advisory Agreement. The Trustees reviewed the services being provided by the Advisor to the Funds including, without limitation, the quality of its investment advisory services since the Funds’ inception (including research and recommendations with respect to portfolio securities); its procedures for formulating investment recommendations and assuring compliance with the Funds’ investment objectives, policies and limitations; its coordination of services for the Funds among the Funds’ service providers; and its efforts to promote the Funds, grow the Funds’ assets, and assist in the distribution of Fund shares. The Trustees evaluated: the Advisor’s staffing, personnel, and methods of operating; the education and experience of the Advisor’s personnel; the Advisor’s compliance program; and the financial condition of the Advisor. It was noted there had been a change in personnel replacing the chief compliance officer of the Advisor.
The Board concluded that the nature, extent, and quality of the services to be provided by the Advisor were satisfactory and adequate for the Funds.
(ii) Performance. The Trustees compared the performance of the Funds with the performance of applicable peer group data (e.g., Morningstar/Lipper peer group average) and the Funds’ benchmark indices.
Adaptive Alpha Opportunities ETF: The Trustees noted that the Fund outperformed the peer group and category average for all periods shown.
Adaptive Hedged Multi-Asset Income ETF: The Trustees noted that the Fund had outperformed the peer group for all periods shown. The Fund outperformed the category averages for the one-year period but underperformed for all remaining periods. The Trustees noted that the Advisor believed that the underperformance was due to the Fund being more conservatively allocated than the category and index which resulted in the loss of potential market performance.
RH Tactical Outlook ETF: The Trustees noted that the Fund underperformed the peer group and category average for all periods shown. The Trustees noted that the Advisor believed the underperformance was due to the defensive solutions employed by the Advisor, which could cause under performance in up market periods.
RH Tactical Rotation ETF. The Trustees noted that the Fund outperformed the peer group for the one-year period and underperformed the peer group for all remaining periods shown. The Fund underperformed the category averages for all periods shown. The Trustees noted that the Advisor believed that the underperformance was due to the defensive solutions employed by the Advisor, which can cause underperformance in up market periods.
Adaptive ETFs
Additional Information (unaudited)
As of May 31, 2024
After reviewing the investment performance of the Funds, the Advisor’s experience managing the Funds, the Advisor’s historical investment performance, and other factors, the Board concluded that the investment performance of the Funds and the Advisor was satisfactory.
(iii) Fees and Expenses. The Trustees first noted the management fee for the Funds under the Investment Advisory Agreement. The Trustees then compared the advisory fee and expense ratio of the Funds to other comparable funds, noting the management fee for each Fund was above the peer group and category averages. The Trustees considered the Advisor’s explanation that firm was much smaller than the peer group and category firms, making it hard to match their cost structures. The Trustees considered the unique strategies of the Funds.
Following this comparison, and upon further consideration and discussion of the foregoing, the Board concluded that the fees to be paid to the Advisor by the Funds were not unreasonable in relation to the nature and quality of the services to be provided by the Advisor and that they reflected charges that were within a range of what could have been negotiated at arm's length.
(iv) Profitability. The Board reviewed the Advisor’s profitability analysis in connection with its management of the Funds over the past twelve months. The Board noted that the Advisor realized a profit for the prior twelve months of operations for the Adaptive Alpha Opportunities ETF and a loss on the other Funds. The Board considered the quality of the Advisor’s service to the Funds, and after further discussion, concluded that the Advisor’s level of profitability was not excessive.
(v) Economies of Scale. In this regard, the Trustees reviewed the Fund’s operational history and noted that the size of the Funds had not provided an opportunity to realize economies of scale. The Trustees then reviewed the Funds’ fee arrangements for breakpoints or other provisions that would allow the Funds’ shareholders to benefit from economies of scale in the future as the Funds grow. The Trustees determined that the maximum management fee would remain the same regardless of the Funds’ asset levels. It was pointed out that breakpoints in the advisory fee could be reconsidered in the future as the Funds grow.
Conclusion. Having reviewed and discussed in depth such information from the Advisor as the Trustees believed to be reasonably necessary to evaluate the terms of the proposed Investment Advisory Agreement and as assisted by the advice of legal counsel, the Trustees concluded that approval of the Investment Advisory Agreement was in the best interest of the shareholders of the Funds.
| 6. | Approval of Investment Sub-Advisory Agreement |
Investment Advisory Agreement with the Sub-Advisor
In connection with the regular Board meeting held on December 7, 2023, the Board, including a majority of the Independent Trustees, discussed the approval of the proposed new investment sub-advisory agreement (“New Agreement”) between the Advisor and Bluestone Capital Management, LLC (the “Sub-Advisor”), with respect the Adaptive Alpha Opportunities ETF (referred to in this section as the “Fund”) due to a pending change of control of the Sub-Advisor’s parent company. The Sub-Advisor confirmed there would be no changes in the portfolio management, current compliance policies and procedures, or other services provided to the Fund by the Sub-Advisor as a result of the change of control nor in the sub-advisory fee charged for its services. It was noted that the contemplated change of control would result in the termination of the existing investment sub-advisory agreement (“Existing Agreement”) between the Advisor and Sub-Advisor under the 1940 Act. It was noted that the change of control would result in the need to consider the New Agreement, which was presented to the Board for consideration.
The Trustees were assisted by legal counsel throughout the review process. The Trustees relied upon the advice of legal counsel and their own business judgment in determining the material factors to be considered in evaluating the Sub-Advisory Agreement and the weight to be given to each factor considered. The conclusions reached by the Trustees were based on a comprehensive evaluation of all of the information provided and were not the result of any one factor. Moreover, each Trustee may have afforded different weight to the various factors in reaching his conclusions with respect to the approval of the Sub-Advisory Agreement. In connection with their deliberations regarding approval of the Sub-Advisory Agreement, the Trustees reviewed materials prepared by Bluestone.
In deciding on whether to approve the Sub-Advisory Agreement, the Trustees considered numerous factors, including:
(i) Nature, Extent, and Quality of Services. The Trustees considered the responsibilities of the Sub-Advisor under the New Agreement. The Trustees reviewed the services to be provided by the Sub-Advisor to the Fund including, without limitation, the quality of its investment advisory services since the Fund’s inception (including research and recommendations with respect to portfolio securities); its procedures for formulating investment recommendations and assuring compliance with the Fund’s investment objectives, policies and limitations; its coordination of services for the Fund among the Fund’s service providers; and its efforts to promote the Fund, grow the Fund’s assets, and assist in the distribution of Fund shares. The Trustees evaluated the Sub-Advisor’s staffing, personnel, and methods of operating; the education and experience of the Sub-Advisor’s personnel; compliance program; and financial condition of the Sub-Advisor. It was noted there had been a change in personnel since the last renewal, which consisted of the replacement of an officer of the firm.
Adaptive ETFs
Additional Information (unaudited)
As of May 31, 2024
After reviewing the foregoing information and other information provided by the Sub-Advisor (e.g., descriptions of the Sub-Advisor’s business, compliance program and Form ADV), the Board concluded that the nature, extent, and quality of the services to be provided by the Sub-Advisor were satisfactory and adequate for the Fund.
(ii) Performance. The Trustees compared the performance of the Fund with the performance of applicable peer group data (e.g., Morningstar/Lipper peer group averages) and the Fund’s benchmark indices. The Trustees noted that the Fund outperformed the peer group and category averages for all periods shown. After reviewing the investment performance of the Fund, the Sub-Advisor’s experience managing the Fund, the Sub-Advisor’s historical investment performance, and other factors, the Board concluded that the investment performance of the Fund and the Sub-Advisor was satisfactory.
(iii) Fees and Expenses. The Trustees first noted the sub-advisory fee for the Fund under the New Agreement. The Trustees then compared the sub-advisory fee and expense ratio of the Fund to other comparable funds, noting the sub-advisory fee remained below that charged by the Sub-Advisor to comparable accounts. The Trustees considered the Sub-Advisor’s unique research and investment process in evaluating the fairness and reasonableness of its management fees. Following the comparison, and upon further consideration and discussion of the foregoing, the Board concluded that the fees to be paid to the Sub-Advisor were not unreasonable in relation to the nature and quality of the services provided by the Sub-Advisor and that they reflected charges that were within a range of what could have been negotiated at arm’s length.
(iv) Profitability. The Board reviewed the Sub-Advisor’s profitability analysis in connection with its management of the Fund over the past twelve months. The Board noted that the Sub-Advisor realized a small profit for the prior twelve months of operations. The Board considered the quality of the Sub-Advisor’s service to the Fund, and after further discussion, concluded that the Sub-Advisor’s level of profitability was not excessive.
(v) Economies of Scale. In this regard, the Trustees reviewed the Fund’s operational history and noted that the size of the Fund had not provided an opportunity to realize economies of scale. The Trustees then reviewed the Fund’s fee arrangements for breakpoints or other provisions that would allow the Fund’s shareholders to benefit from economies of scale in the future as the Fund grows. The Trustees determined that the maximum management fee would stay the same regardless of the Fund’s asset levels. The Trustees noted that the Fund was a relatively small size and economies of scale were unlikely to be achievable in the near future. It was pointed out that breakpoints in the sub-advisory fee could be reconsidered in the future as the Fund grows.
Conclusion. Having reviewed and discussed in depth such information from the Sub-Advisor as the Trustees believed to be reasonably necessary to evaluate the terms of the New Agreement and as assisted by the advice of legal counsel, the Trustees concluded that approval of the New Agreement was in the best interest of the shareholders of the Funds.
| 7. | Liquidity Risk Management Program |
Rule 22e-4, or the “Liquidity Rule,” under the Investment Company Act of 1940 requires a mutual fund to adopt a liquidity risk management program (“Program”) and disclose information about the operation and effectiveness of its Program in its reports to shareholders.
Under the Program, each of the Funds’ portfolio investments is classified into one of four liquidity categories defined by the SEC: highly liquid, moderately liquid, less liquid, and illiquid. Liquidity classifications take into account a variety of market, trading, and investment factors, including the Funds’ reasonably anticipated trade size, and the Program Administrator has engaged a third-party vendor to assist with the classification of portfolio investments.
In accordance with the Liquidity Rule, the Program Administrator prepared, and the Funds’ Board of Trustees reviewed, a report regarding the operation and effectiveness of the Program for the period from December 1, 2022 through November 30, 2023. During the period, there were no liquidity events that materially impacted the Funds’ ability to timely meet redemptions without significantly diluting remaining investors’ interests. The report concluded that the Program remains reasonably designed to assess and manage the Funds’ liquidity risk, and that during the period the Program was implemented effectively.
| 8. | Information about Trustees and Officers |
The business and affairs of the Funds and the Trust are managed under the direction of the Board of Trustees of the Trust. Information concerning the Trustees and officers of the Trust and Funds is set forth below. Generally, each Trustee and officer serves an indefinite term or until certain circumstances such as their resignation, death, or otherwise as specified in the Trust’s organizational documents. Any Trustee may be removed at a meeting of shareholders by a vote meeting the requirements of the Trust’s organizational documents. The Statement of Additional Information of the Funds includes additional information about the Trustees and officers and is available, without charge, upon request by calling the Funds toll-free at 1-800-773-3863. The address of each Trustee and officer, unless otherwise indicated below, is 116 South Franklin Street, Rocky Mount, North Carolina 27804. The Independent Trustees received aggregate compensation of $8,595 during the fiscal year ended May 31, 2024 for their services to the Funds and Trust.
Adaptive ETFs
Additional Information (unaudited)
As of May 31, 2024
Name and
Date of Birth | Position
held with
Funds or Trust | Length
of Time Served | Principal Occupation
During Past 5 Years | Number of Portfolios in Fund Complex Overseen by Trustee | Other Directorships
Held by Trustee
During Past 5 Years |
Independent Trustees |
James H. Speed, Jr.
(06/1953) | Chairman and Independent Trustee | Trustee since 7/09, Chair since 5/12 | Retired Executive/Private Investor | 8 | Independent Trustee of the Brown Capital Management Mutual Funds for all its series from 2001 to present, Centaur Mutual Funds Trust for all its series from 2009 to present, WST Investment Trust for all its series from 2013 to present, and Chesapeake Investment Trust for all its series from 2016 to present (all registered investment companies). Member of Board of Directors of Communities in Schools of N.C. from 2001 to present. Member of Board of Directors of Investors Title Company from 2010 to present. Member of Board of Directors of AAA Carolinas/Auto Club Group from 2011 to present. Previously, Independent Trustee of the Hillman Capital Management Trust from 2009 to 2021. Previously, Independent Trustee of the Leeward Investment Trust from 2018 to 2020. |
Theo H. Pitt, Jr.
(04/1936) | Independent Trustee | Since 9/10 | Senior Partner, Community Financial Institutions Consulting (financial consulting) since 1999. | 8 | Independent Trustee of Hillman Capital Management Investment Trust for all its series from 2000 to present, Chesapeake Investment Trust for all its series from 2002 to present, World Funds Trust for all its series from 2013 to present, ETF Opportunities Trust for all its series from 2019 to present, and Kingsbarn Parallel Income Trust from 2022 to present (all registered investment companies). Senior Partner of Community Financial Institutions Consulting from 1997 to present. Previously, Independent Trustee of the Leeward Investment Trust from 2011 to 2021. |
J. Buckley Strandberg
(03/1960) | Independent Trustee | Since 7/09 | President of Standard Insurance and Realty since 1982. | 8 | None. |
Adaptive ETFs
Additional Information (unaudited)
As of May 31, 2024
Name and
Date of Birth | Position held with
Funds or Trust | Length
of Time Served | Principal Occupation
During Past 5 Years |
Officers |
Katherine M. Honey
(09/1973) | President and Principal Executive Officer | Since 05/15 | President of The Nottingham Company since 2018. |
Pete McCabe
(09/1972) | Treasurer, Assistant Secretary, Principal Accounting Officer, and Principal Financial Officer | Since 05/23 | Chief Operating Officer of The Nottingham Company since 2018. |
Tracie A. Coop
(12/1976) | Secretary | Since 12/19 | General Counsel, The Nottingham Company since 2019. |
Andrea M. Knoth
(09/1983) | Chief Compliance Officer | Since 06/22 | Director of Compliance, The Nottingham Company since 2022. Formerly, Senior Fund Compliance Administrator, Ultimus Fund Solutions from 2019 to 2022. |
| 9. | Change of Independent Registered Public Accounting Firm |
On January 30, 2024, Cohen & Company, Ltd. (“Cohen”) was dismissed as the independent registered public accounting firm for the Funds. At a meeting held on March 7, 2024, based on the recommendation and approval of the Audit Committee, the Board of Trustees approved the appointment of Tait, Weller & Baker, LLP (“Tait Weller”) as the Funds’ independent registered public accounting firm for the fiscal year ending May 31, 2024.
Cohen’s audit reports on the Funds’ financial statements for the fiscal years ended May 31, 2023, did not contain any adverse opinion or disclaimer of opinion, and was not qualified or modified as to uncertainty, audit scope, or accounting principles.
During the fiscal year ended May 31, 2023 and for the interim period ended January 30, 2024, there were no disagreements (as defined in Item 304(a)(1)(iv) of Regulation S-K and related instructions) with Cohen on any matter of accounting principles or practices, financial statement disclosure or auditing scope or procedure, which disagreements, if not resolved to the satisfaction of Cohen, would have caused it to make a reference in connection with its opinion to the subject matter of the disagreement.
The registrant requested that Cohen furnish it with a letter addressed to the U.S. Securities and Exchange Commission stating that it agrees with the above statements. A copy of such letter is filed as an exhibit to Form N-CSR.
During the fiscal periods ended May 31, 2022, May 31, 2023, and for the interim period ended March 7, 2024, neither the Funds, nor anyone on the Funds’ behalf, consulted with Tait Weller with respect to: (i) the application of accounting principles to a specified transaction, either completed or proposed, or the type of audit opinion that might have been rendered on the Funds’ financial statements, and no written report or oral advice was provided that Tait Weller concluded was an important factor considered by the Funds in reaching a decision as to any accounting, auditing, or financial reporting issue; or (ii) any matter that was either the subject of a “disagreement” (as defined in Item 304(a)(1)(iv) of Regulation S-K and related instructions) or a “reportable event” (as defined in Item 304(a)(1)(v) of Regulation S-K).
The Adaptive ETFs are a series of
The Starboard Investment Trust
For Shareholder Service Inquiries:
| For Investment Advisor Inquiries: |
| |
Nottingham Shareholder Services
| Adaptive Investments, LLC |
116 South Franklin Street
| 12600 Deerfield Parkway |
Post Office Box 69
| Suite #100 |
| Rocky Mount, North Carolina 27802-0069 | Alpharetta, GA 30004 |
| |
Telephone:
| Telephone: |
| | |
| 800-773-3863 | 770-777-8277 |
| |
|
World Wide Web @:
| World Wide Web @: |
| | |
| ncfunds.com | adaptivefunds.com |
| (b) | Not applicable. |
| | |
| Item 2. | Code of Ethics |
| (a) | The registrant, as of the end of the period covered by this report, has adopted a code of ethics that applies to the registrant’s principal executive officer, principal accounting officer or controller, and principal financial officer, or persons performing similar functions, regardless of whether these individuals are employed by the registrant or a third party (the “Code of Ethics”). |
| (c) | During the period covered by this report, there have been no substantive amendments to the provisions of the Code of Ethics. |
| | |
| (d) | During the period covered by this report, the registrant did not grant any waivers to the provisions of the Code of Ethics. |
| | |
| (f)(1) | A copy of the Code of Ethics is filed with this Form N-CSR as Exhibit 13(a)(1). |
| Item 3. | Audit Committee Financial Expert |
| | The registrant’s Board of Trustees has determined that there is at least one member who qualifies as an audit committee financial expert, as that term is defined under Item 3(b) of Form N-CSR, serving on its audit committee. As of the date of this report, the registrant’s audit committee financial expert is Mr. James H. Speed, Jr. Mr. Speed is “independent” for purposes of Item 3 of Form N-CSR. |
| Item 4. | Principal Accountant Fees And Services |
| | Audit Fees – Audit fees billed for the Adaptive Alpha Opportunities ETF, Adaptive Hedged Multi-Asset Income ETF, RH Tactical Outlook ETF, and RH Tactical Rotation ETF (the “Funds”), each a series of the Trust, for the last two fiscal years are reflected in the table below. |
| | |
| | For the fiscal year ended May 31, 2023, these amounts represent aggregate fees billed for professional services rendered by the registrant’s independent accountant, Cohen & Company, Ltd. (“Former Accountant”), in connection with the annual audit of the registrants’ financial statements and for services that are normally provided by the Accountant in connection with the registrant’s statutory and regulatory filings for those fiscal years. |
Funds | May 31, 2023 |
Adaptive Alpha Opportunities ETF | $12,500 |
Adaptive Hedged Multi-Asset Income ETF | $18,000 |
RH Tactical Outlook ETF | $12,500 |
RH Tactical Rotation ETF | $12,500 |
| | For the fiscal year ended May 31, 2024, these amounts represent aggregate fees billed for professional services rendered by the registrant’s independent accountant, Tait, Weller & Baker, LLP (“Accountant”), in connection with the annual audit of the registrants’ financial statements and for services that are normally provided by the Accountant in connection with the registrants’ statutory and regulatory filings for those fiscal years. |
Funds | May 31, 2024 |
Adaptive Alpha Opportunities ETF | $12,000 |
Adaptive Hedged Multi-Asset Income ETF | $14,500 |
RH Tactical Outlook ETF | $12,000 |
RH Tactical Rotation ETF | $12,000 |
| | Audit-Related Fees – The audit-related fees billed for the Funds for the fiscal year ended May 31, 2023, for professional services rendered by the registrant’s Former Accountant, in connection with two semi-annual examinations and a surprise examination of the 17f-1 security counts, are reflected in the table below. |
Funds | May 31, 2023 |
Adaptive Alpha Opportunities ETF | $5,500 |
Adaptive Hedged Multi-Asset Income ETF | $5,500 |
RH Tactical Outlook ETF | $5,500 |
RH Tactical Rotation ETF | $5,500 |
| | Audit-Related Fees – The audit-related fees billed for the Funds for the fiscal year ended May 31, 2024, for professional services rendered by the registrant’s Accountant, in connection with two semi-annual examinations and a surprise examination of the 17f-1 security counts, are reflected in the table below. |
Funds | May 31, 2024 |
Adaptive Alpha Opportunities ETF | $5,500 |
Adaptive Hedged Multi-Asset Income ETF | $5,500 |
RH Tactical Outlook ETF | $5,500 |
RH Tactical Rotation ETF | $5,500 |
| | Tax Fees – The tax fees billed in the fiscal year ended May 31, 2023, for professional services rendered by the Former Accountant for tax compliance, tax advice, and tax planning are reflected in the table below. These services were for the completion of the Funds’ federal and state income tax returns, excise tax returns, and assistance with distribution calculations. |
Funds | May 31, 2023 |
Adaptive Alpha Opportunities ETF | $3,000 |
Adaptive Hedged Multi-Asset Income ETF | $3,000 |
RH Tactical Outlook ETF | $3,000 |
RH Tactical Rotation ETF | $3,000 |
| | Tax Fees – The tax fees billed in the fiscal year ended May 31, 2024, for professional services rendered by the Accountant for tax compliance, tax advice, and tax planning are reflected in the table below. These services were for the completion of the Funds’ federal and state income tax returns, excise tax returns, and assistance with distribution calculations |
Funds | May 31, 2024 |
Adaptive Alpha Opportunities ETF | $3,000 |
Adaptive Hedged Multi-Asset Income ETF | $3,000 |
RH Tactical Outlook ETF | $3,000 |
RH Tactical Rotation ETF | $3,000 |
| (a) | All Other Fees – There were no other fees billed in each of the fiscal years ended May 31, 2023, for products and services provided by the Former Accountant, other than the services reported in paragraphs (a) through (c) of this item. For the fiscal year ended May 31, 2024, the Former Accountant billed an additional amount for the facilitation and review of the Former Accountant’s workpapers by the Accountant as reflected in the table below. |
Funds | |
Adaptive Alpha Opportunities ETF | $1,250 |
Adaptive Hedged Multi-Asset Income ETF | $1,250 |
RH Tactical Outlook ETF | $1,250 |
RH Tactical Rotation ETF | $1,250 |
| | There were no other fees billed for the fiscal year ended May 31, 2024, for products and services provided by the Accountant, other than the services reported in paragraphs (a) through (c) of this item. |
| | |
| (e)(1) | The registrant’s Board of Trustees pre-approved the engagement of the Former Accountant for the last fiscal year ended May 31, 2023, at an audit committee meeting of the Board of Trustees called for such purpose. The registrants’ Board of Trustees pre-approved the engagement of the Accountant for the fiscal year ended May 31, 2024, at an audit committee meeting of the Board of Trustees called for such purpose; and will pre-approve the Accountant for each fiscal year thereafter at an audit committee meeting called for such purpose. The charter of the audit committee states that the audit committee should pre-approve any audit services and, when appropriate, evaluate and pre-approve any non-audit services provided by the Accountant to the registrant and to pre-approve, when appropriate, any non-audit services provided by the Accountant to the registrant’s investment adviser, or any entity controlling, controlled by, or under common control with the investment adviser that provides ongoing services to the registrant if the engagement relates directly to the operations and financial reporting of the registrant. |
| | |
| (2) | There were no services as described in each of paragraph (b) through (d) of this Item that were approved by the audit committee pursuant to paragraph (c)(7)(i)(C) of Rule 2-01 of Regulation S-X. |
| | |
| (f) | Not applicable. |
| | |
| (g) | Aggregate non-audit fees billed by the Former Accountant to the Funds for services rendered for the fiscal year ended May 31, 2023, for services rendered are reflected in the table below. There were no fees billed by the Former Accountant for non-audit services rendered to the Funds’ investment adviser, or any other entity controlling, controlled by, or under common control with the Funds’ investment adviser for the fiscal year ended May 31, 2023. |
Funds | May 31, 2023 |
Adaptive Alpha Opportunities ETF | $3,000 |
Adaptive Hedged Multi-Asset Income ETF | $3,000 |
RH Tactical Outlook ETF | $3,000 |
RH Tactical Rotation ETF | $3,000 |
Aggregate non-audit fees billed by the Accountant to the Funds for services rendered for the fiscal year ended May 31, 2024, for services rendered are reflected in the table below. There were no fees billed by the Accountant for non-audit services rendered to the Funds’ investment adviser, or any other entity controlling, controlled by, or under common control with the Funds’ investment adviser for the fiscal year ended May 31, 2024.
Funds | May 31, 2024 |
Adaptive Alpha Opportunities ETF | $3,000 |
Adaptive Hedged Multi-Asset Income ETF | $3,000 |
RH Tactical Outlook ETF | $3,000 |
RH Tactical Rotation ETF | $3,000 |
| (h) | Not applicable. |
| | |
| (i) | Not applicable. |
| | |
| (j) | Not applicable. |
| Item 5. | Audit Committee Of Listed Registrants |
| | |
| (a) | The registrant is a listed issuer as defined in Rule 10A-3 under the Exchange Act of 1934 and has a separately designated standing audit committee established in accordance with Section 3(a)(58)(A) of the Exchange Act of 1934. The registrant's audit committee members are James H. Speed, Jr., J. Buckley Strandberg, and Theo H. Pitt, Jr. |
| | |
| (b) | Not applicable. |
| Item 6. | Investments |
| | |
| (a) | A copy of the schedule of investments of unaffiliated issuers as of the close of the reporting period is included as part of the report to shareholders filed under Item 1 of this Form. |
| | |
| (b) | Not applicable. |
| | |
| Item 7. | Disclosure Of Proxy Voting Policies And Procedures For Closed-End Management Investment Companies |
| | |
| | Not applicable.
|
| Item 8. | Portfolio Managers Of Closed-End Management Investment Companies |
| | |
| | Not applicable. |
| | |
| Item 9. | Purchases Of Equity Securities By Closed-End Management Investment Company And Affiliated Purchasers |
| | |
| | Not applicable. |
| Item 10. | Submission Of Matters To A Vote Of Security Holders |
| | |
| | None. |
| Item 11. | Controls And Procedures |
| | |
| (a) | The President and Principal Executive Officer and the Treasurer, Principal Accounting Officer, and Principal Financial Officer have concluded that the registrant’s disclosure controls and procedures (as defined in Rule 30a-3(c) under the Investment Company Act of 1940) are effective based on their evaluation of these disclosure controls and procedures required by Rule 30a-3(b) under the Investment Company Act of 1940 and Rules 13a-15(b) or 15d-15(b) under the Exchange Act of 1934, as of a date within 90 days of the filing of this report. |
| | |
| (b) | There were no changes in the registrant's internal control over financial reporting (as defined in Rule 30a-3(d) under the Investment Company Act of 1940) that occurred during the period covered by this report that have materially affected, or are reasonably likely to materially affect, the registrant’s internal control over financial reporting. |
| Item 12. | Disclosure Of Securities Lending Activities For Closed-End Management Investment Companies |
| | |
| | Not applicable. |
| Item 13. | Exhibits |
| | |
| (a)(1) | Code of Ethics required by Item 2 of Form N-CSR is filed herewith. |
| | |
| (a)(2) | Certifications pursuant to Rule 30a-2(a) under the Investment Company Act of 1940 are filed herewith. |
| | |
| (a)(3) | Not applicable. |
| | |
| (a)(4) | Change in Registrant’s independent registered public accountant is filed herewith. |
| | |
| (b) | Certifications pursuant to Rule 30a-2(b) under the Investment Company Act of 1940 and Section 906 of the Sarbanes-Oxley Act of 2002 are filed herewith. |
SIGNATURES
Pursuant to the requirements of the Securities Exchange Act of 1934 and the Investment Company Act of 1940, the registrant has duly caused this report to be signed on its behalf by the undersigned, thereunto duly authorized.
| | | Starboard Investment Trust |
| | | |
|
| | | | |
| | | | |
| Date: July 19, 2024 | By: | /s/ Katherine M. Honey |
| | | | Katherine M. Honey President and Principal Executive Officer |
Pursuant to the requirements of the Securities Exchange Act of 1934 and the Investment Company Act of 1940, this report has been signed below by the following persons on behalf of the registrant and in the capacities and on the dates indicated.
| | | | |
| | | | |
| Date: July 19, 2024 | By: | /s/ Katherine M. Honey
|
| | | | Katherine M. Honey President and Principal Executive Officer |
| | | | |
| | | |
|
| | | | |
| | | | |
| Date: July 19, 2024 | By: | /s/ Peter McCabe
|
| | | | Peter McCabe Treasurer, Principal Accounting Officer, and Principal Financial Officer |