UNITED STATES
SECURITIES AND EXCHANGE COMMISSION
Washington, D.C. 20549
FORM N-CSR
CERTIFIED SHAREHOLDER REPORT OF REGISTERED
MANAGEMENT INVESTMENT COMPANIES
Investment Company Act file number 811-22298
Starboard Investment Trust
(Exact name of registrant as specified in charter)
116 South Franklin Street, Rocky Mount, North Carolina 27804
(Address of principal executive offices) (Zip code)
Paracorp Inc.
2140 South Dupont Hwy., Camden, DE 19934
(Name and address of agent for service)
Registrant’s telephone number, including area code: 252-972-9922
Date of fiscal year end: May 31
Date of reporting period: November 30, 2024
| Item 1. | Report to Stockholders |
(a)
Adaptive Alpha Opportunities ETF Tailored Shareholder Report
Adaptive Alpha Opportunities ETF
Ticker: AGOX
Exchange: NYSE Arca
Semi-Annual Shareholder Report November 30, 2024
This semi-annual shareholder report contains important information about Adaptive Alpha Opportunities ETF for the period June 1, 2024 to November 30, 2024. You can find additional information about the Fund at https://etfpages.com/AGOX. You can also request this information by contacting us at (800) 773-3863.
What were the Fund costs for the past six months?
(based on a hypothetical $10,000 investment)
Fund Name | Costs of a $10,000 investment | Costs paid as a percentage of a $10,000 investment |
|---|
AGOX | $63 | 1.19% |
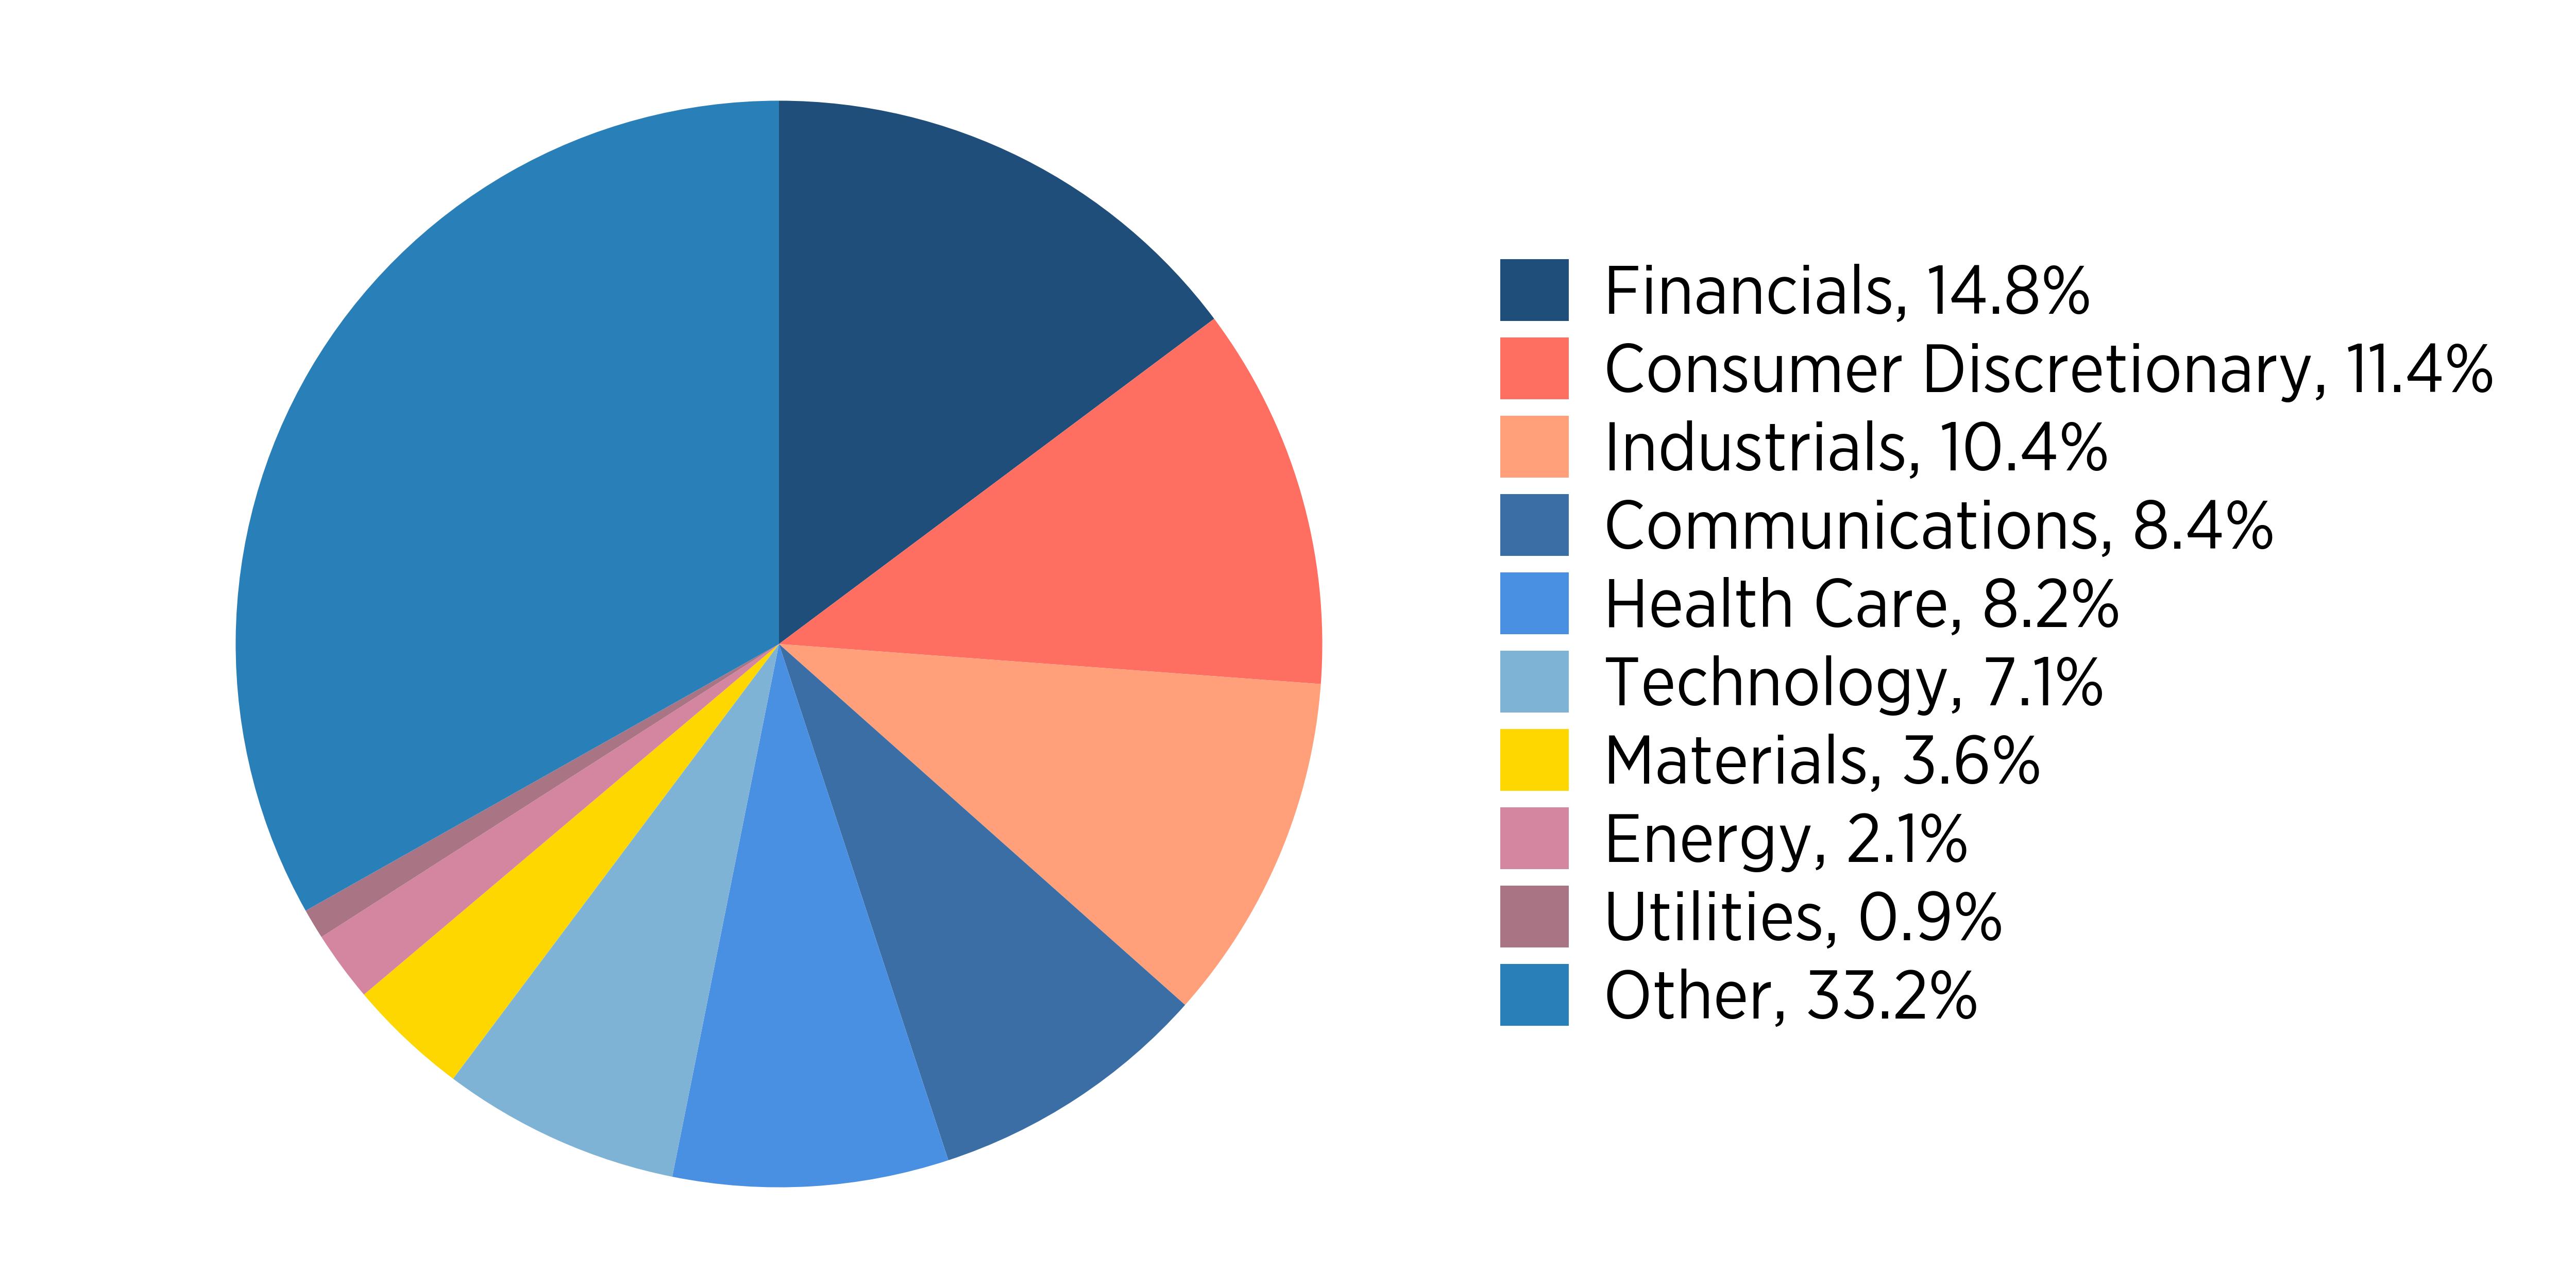
What did the Fund invest in?
(as of November 30, 2024)
Sector Breakdown (% of net assets)
Sector | % |
Financials | 0.148 |
Consumer Discretionary | 0.114 |
Industrials | 0.104 |
Communications | 0.084 |
Health Care | 0.082 |
Technology | 0.071 |
Materials | 0.036 |
Energy | 0.021 |
Utilities | 0.009 |
Other | 0.332 |
Top Ten Holdings | (% of net assets) |
|---|
Invesco QQQ Trust Series 1 | 22.4% |
iShares Russell 2000 ETF | 8.1% |
Amazon.com Inc | 7.8% |
Communication Services Select Sector SPDR Fund | 6.9% |
Boston Scientific Corp | 4.8% |
Carpenter Technology Corp | 3.3% |
Vanguard Financials ETF | 2.6% |
Howmet Aerospace Inc | 2.4% |
Technology Select Sector SPDR Fund | 2.1% |
Energy Select Sector SPDR Fund | 1.8% |
Key Fund Statistics
(as of November 30, 2024)
| |
|---|
Net Assets | $329,467,301 |
Number of Holdings | 251 |
Portfolio Turnover | 274.94% |
For additional information about the Fund; including its prospectus, financial information, holdings and proxy voting information, visit https://etfpages.com/AGOX.
Adaptive Alpha Opportunities ETF Tailored Shareholder Report
Adaptive Hedged Multi-Asset Income ETF Tailored Shareholder Report
Adaptive Hedged Multi-Asset Income ETF
Ticker: AMAX
Exchange: NYSE Arca
Semi-Annual Shareholder Report November 30, 2024
This semi-annual shareholder report contains important information about Adaptive Hedged Multi-Asset Income ETF for the period June 1, 2024 to November 30, 2024. You can find additional information about the Fund at https://etfpages.com/AMAX. You can also request this information by contacting us at (800) 773-3863.
What were the Fund costs for the past six months?
(based on a hypothetical $10,000 investment)
Fund Name | Costs of a $10,000 investment | Costs paid as a percentage of a $10,000 investment |
|---|
AMAX | $44 | 0.85% |
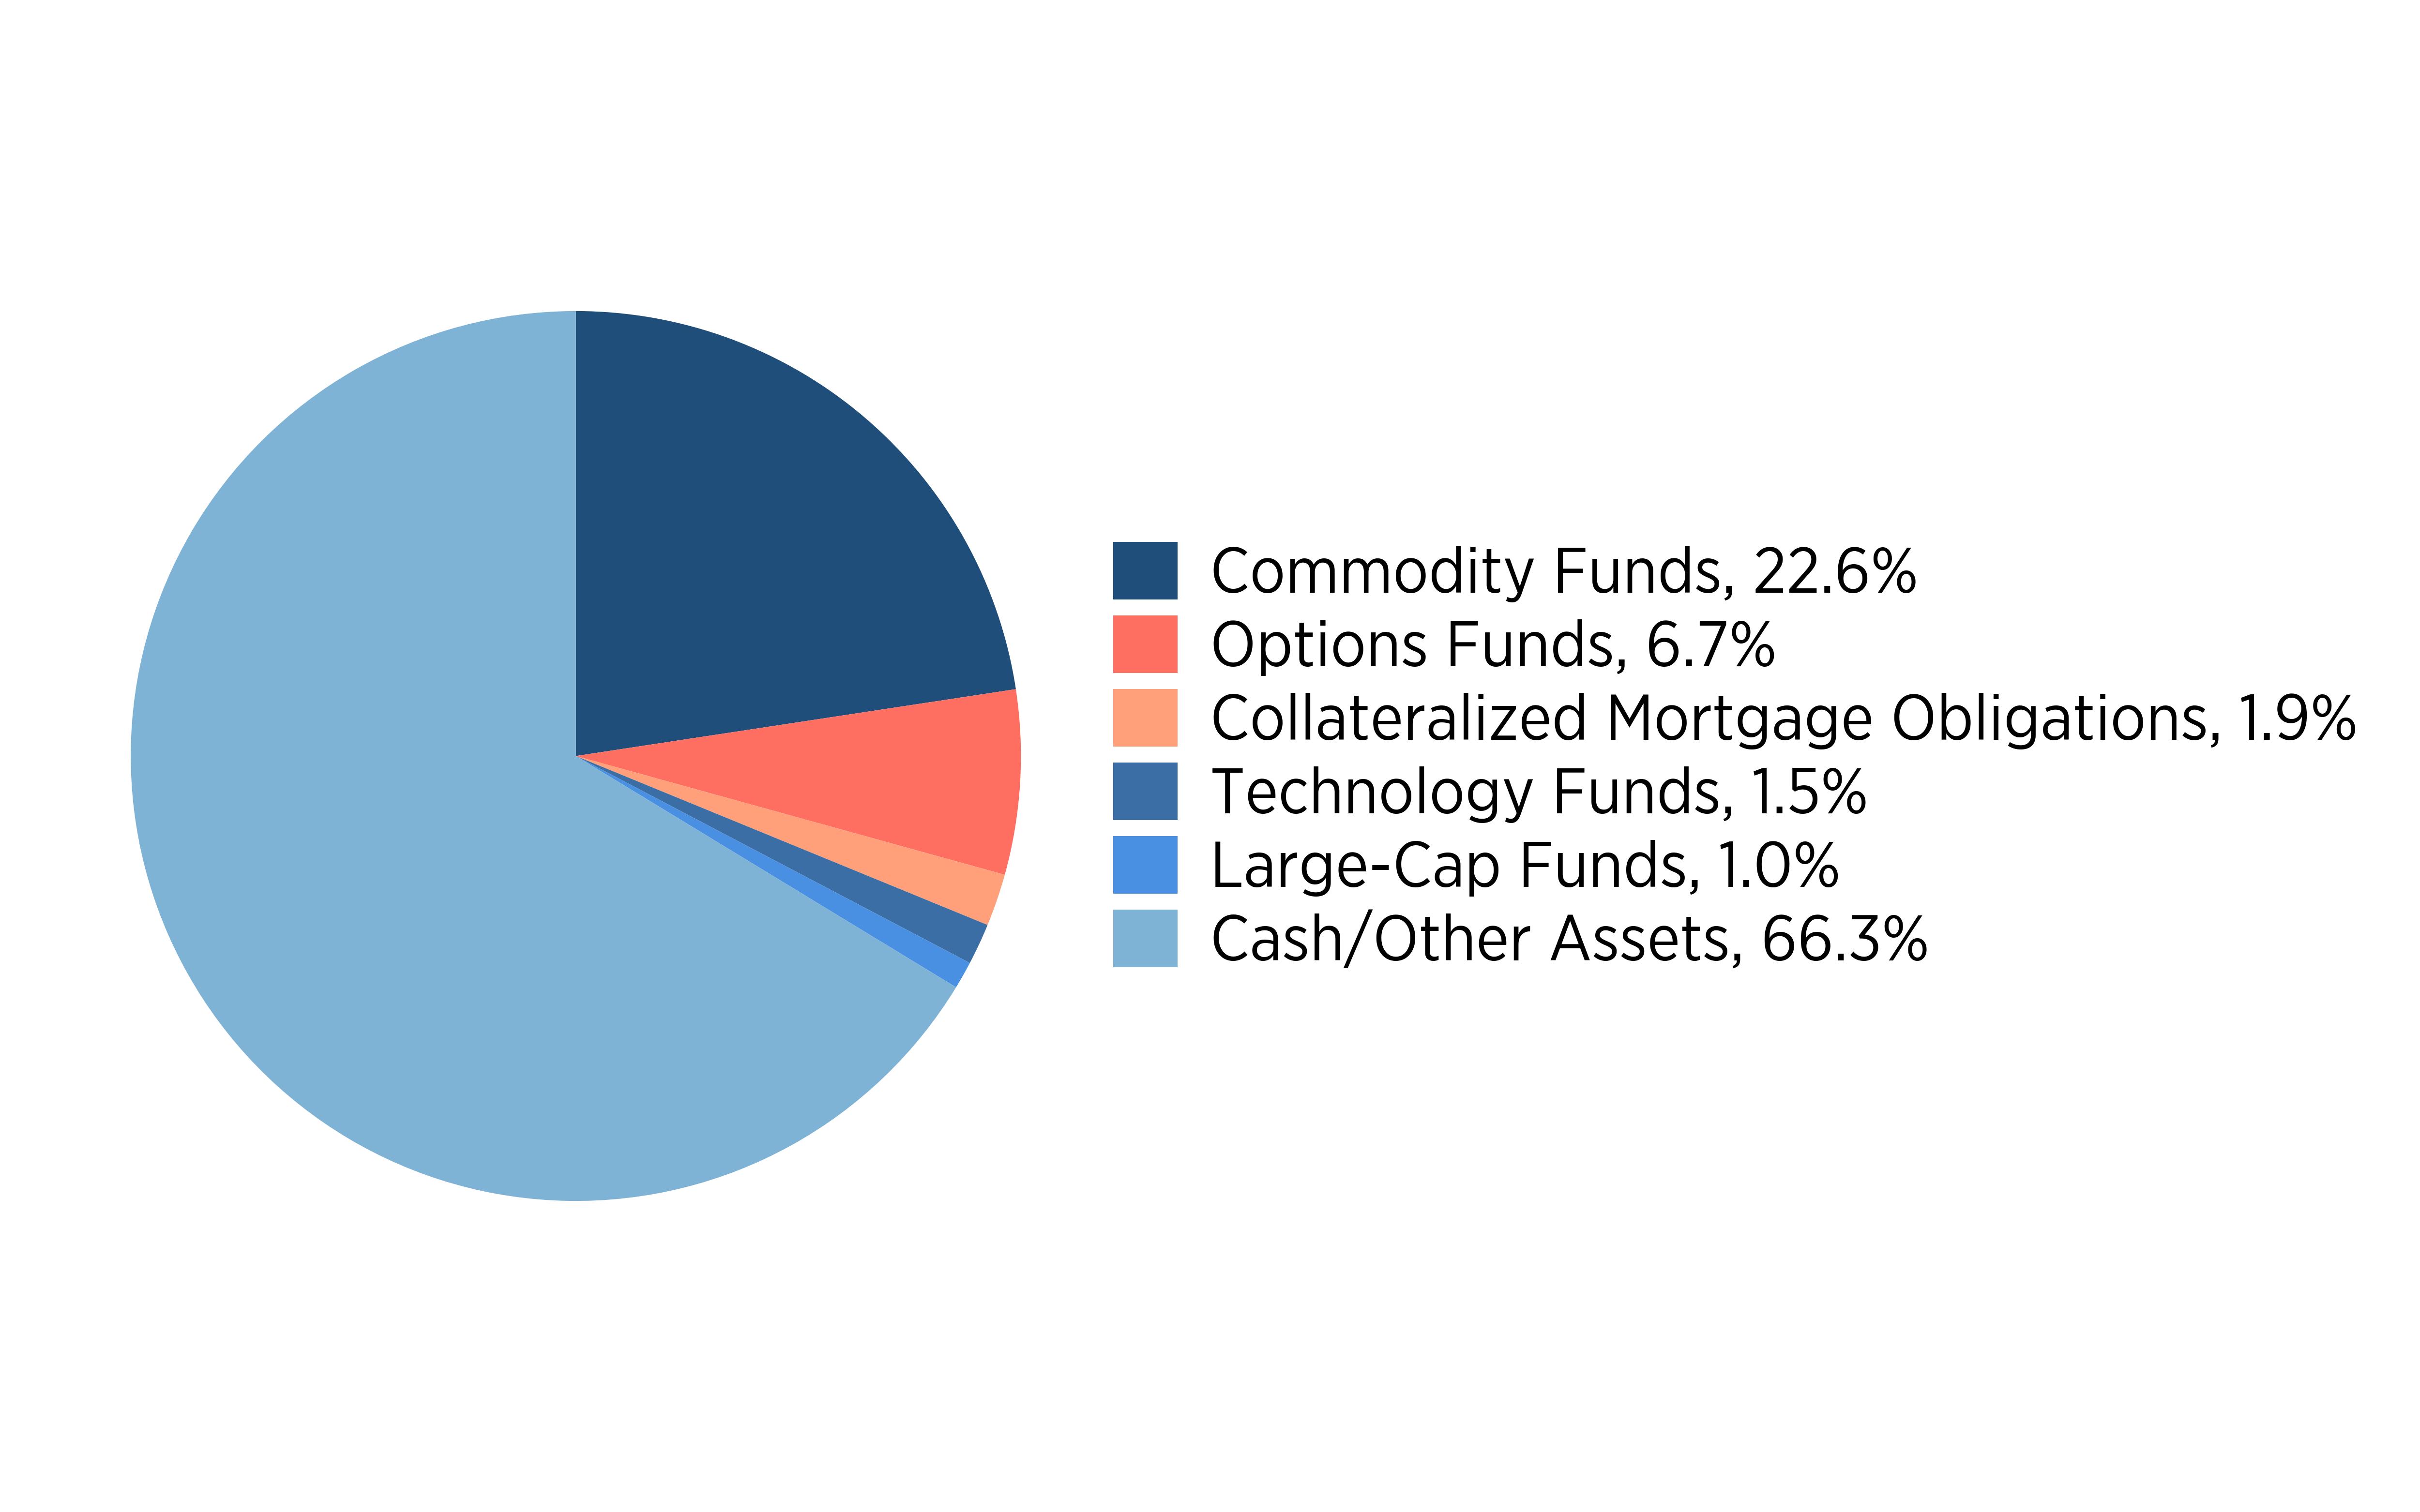
What did the Fund invest in?
(as of November 30, 2024)
Sector Breakdown (% of net assets)
Sector | % |
Commodity Funds | 0.226 |
Options Funds | 0.067 |
Collateralized Mortgage Obligations | 0.019 |
Technology Funds | 0.015 |
Large-Cap Funds | 0.01 |
Cash/Other Assets | 0.663 |
Top Ten Holdings | (% of net assets) |
|---|
UBS ETRACS Gold Shares Covered Call ETN | 18.7% |
Invesco QQQ Trust Series 1 | 10.5% |
iShares Russell 2000 ETF | 6.7% |
United States Oil Fund LP | 3.9% |
YieldMax AAPL Option Income Strategy ETF | 1.5% |
Yieldmax META Option Income Strategy ETF | 1.5% |
YieldMax MSFT Option Income Strategy ETF | 1.5% |
Yieldmax TSLA Option Income ETF | 1.5% |
YieldMax NVDA Option Income Strategy ETF | 1.5% |
Yieldmax AMZN Option Income ETF | 1.4% |
Key Fund Statistics
(as of November 30, 2024)
| |
|---|
Net Assets | $21,933,071 |
Number of Holdings | 16 |
Portfolio Turnover | 350.47% |
For additional information about the Fund; including its prospectus, financial information, holdings and proxy voting information, visit https://etfpages.com/AMAX.
Adaptive Hedged Multi-Asset Income ETF Tailored Shareholder Report
RH Tactical Outlook ETF Tailored Shareholder Report
RH Tactical Outlook ETF
Ticker: RHTX
Exchange: NYSE Arca
Semi-Annual Shareholder Report November 30, 2024
This semi-annual shareholder report contains important information about RH Tactical Outlook ETF for the period June 1, 2024 to November 30, 2024. You can find additional information about the Fund at https://etfpages.com/RHTX. You can also request this information by contacting us at (800) 773-3863.
What were the Fund costs for the past six months?
(based on a hypothetical $10,000 investment)
Fund Name | Costs of a $10,000 investment | Costs paid as a percentage of a $10,000 investment |
|---|
RHTX | $70 | 1.25% |
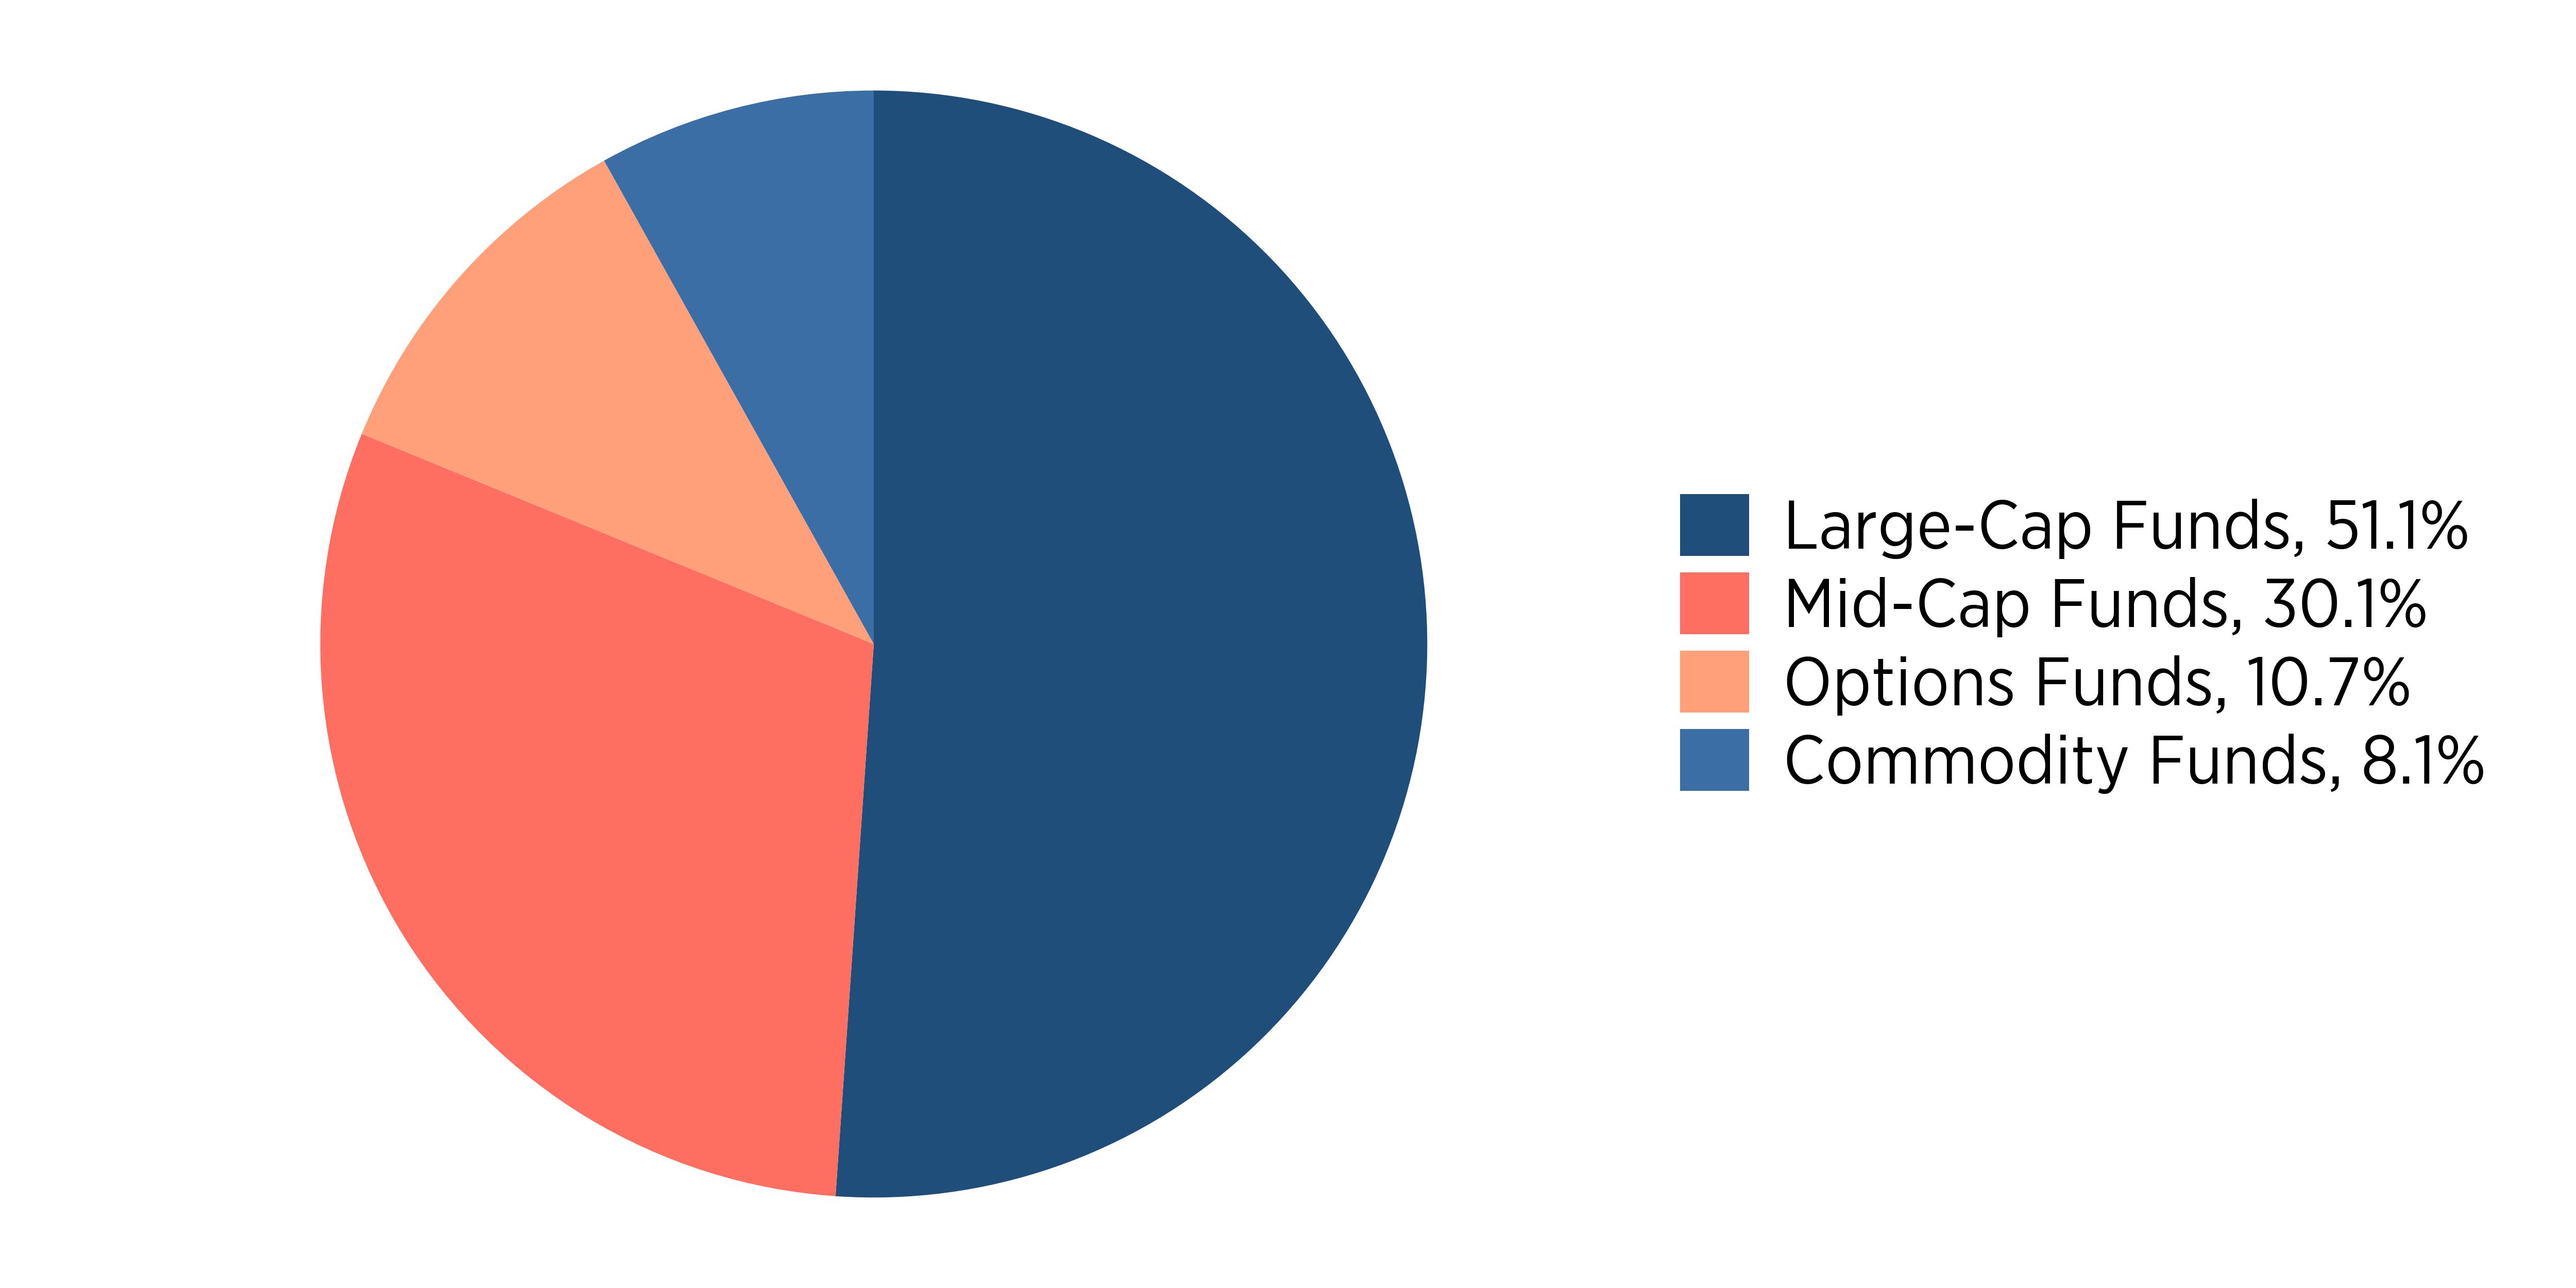
What did the Fund invest in?
(as of November 30, 2024)
Sector Breakdown (% of net assets)
Sector | % |
Large-Cap Funds | 0.511 |
Mid-Cap Funds | 0.301 |
Options Funds | 0.107 |
Commodity Funds | 0.081 |
Top Holdings | (% of net assets) |
|---|
SPDR S&P 500 ETF Trust | 51.1% |
SPDR Portfolio S&P 400 Mid Cap ETF | 30.1% |
iShares Russell 2000 ETF | 10.7% |
SPDR Gold Shares | 4.5% |
iShares Silver Trust | 3.6% |
Key Fund Statistics
(as of November 30, 2024)
| |
|---|
Net Assets | $9,295,232 |
Number of Holdings | 5 |
Portfolio Turnover | 0.00% |
For additional information about the Fund; including its prospectus, financial information, holdings and proxy voting information, visit https://etfpages.com/RHTX.
RH Tactical Outlook ETF Tailored Shareholder Report
RH Tactical Rotation ETF Tailored Shareholder Report
RH Tactical Rotation ETF
Ticker: RHRX
Exchange: NYSE Arca
Semi-Annual Shareholder Report November 30, 2024
This semi-annual shareholder report contains important information about RH Tactical Rotation ETF for the period June 1, 2024 to November 30, 2024. You can find additional information about the Fund at https://etfpages.com/RHRX. You can also request this information by contacting us at (800) 773-3863.
What were the Fund costs for the past six months?
(based on a hypothetical $10,000 investment)
Fund Name | Costs of a $10,000 investment | Costs paid as a percentage of a $10,000 investment |
|---|
RHRX | $67 | 1.24% |
Key Fund Statistics
(as of November 30, 2024)
| |
|---|
Net Assets | $16,356,611.24 |
Number of Holdings | 5 |
Portfolio Turnover | 95.76% |
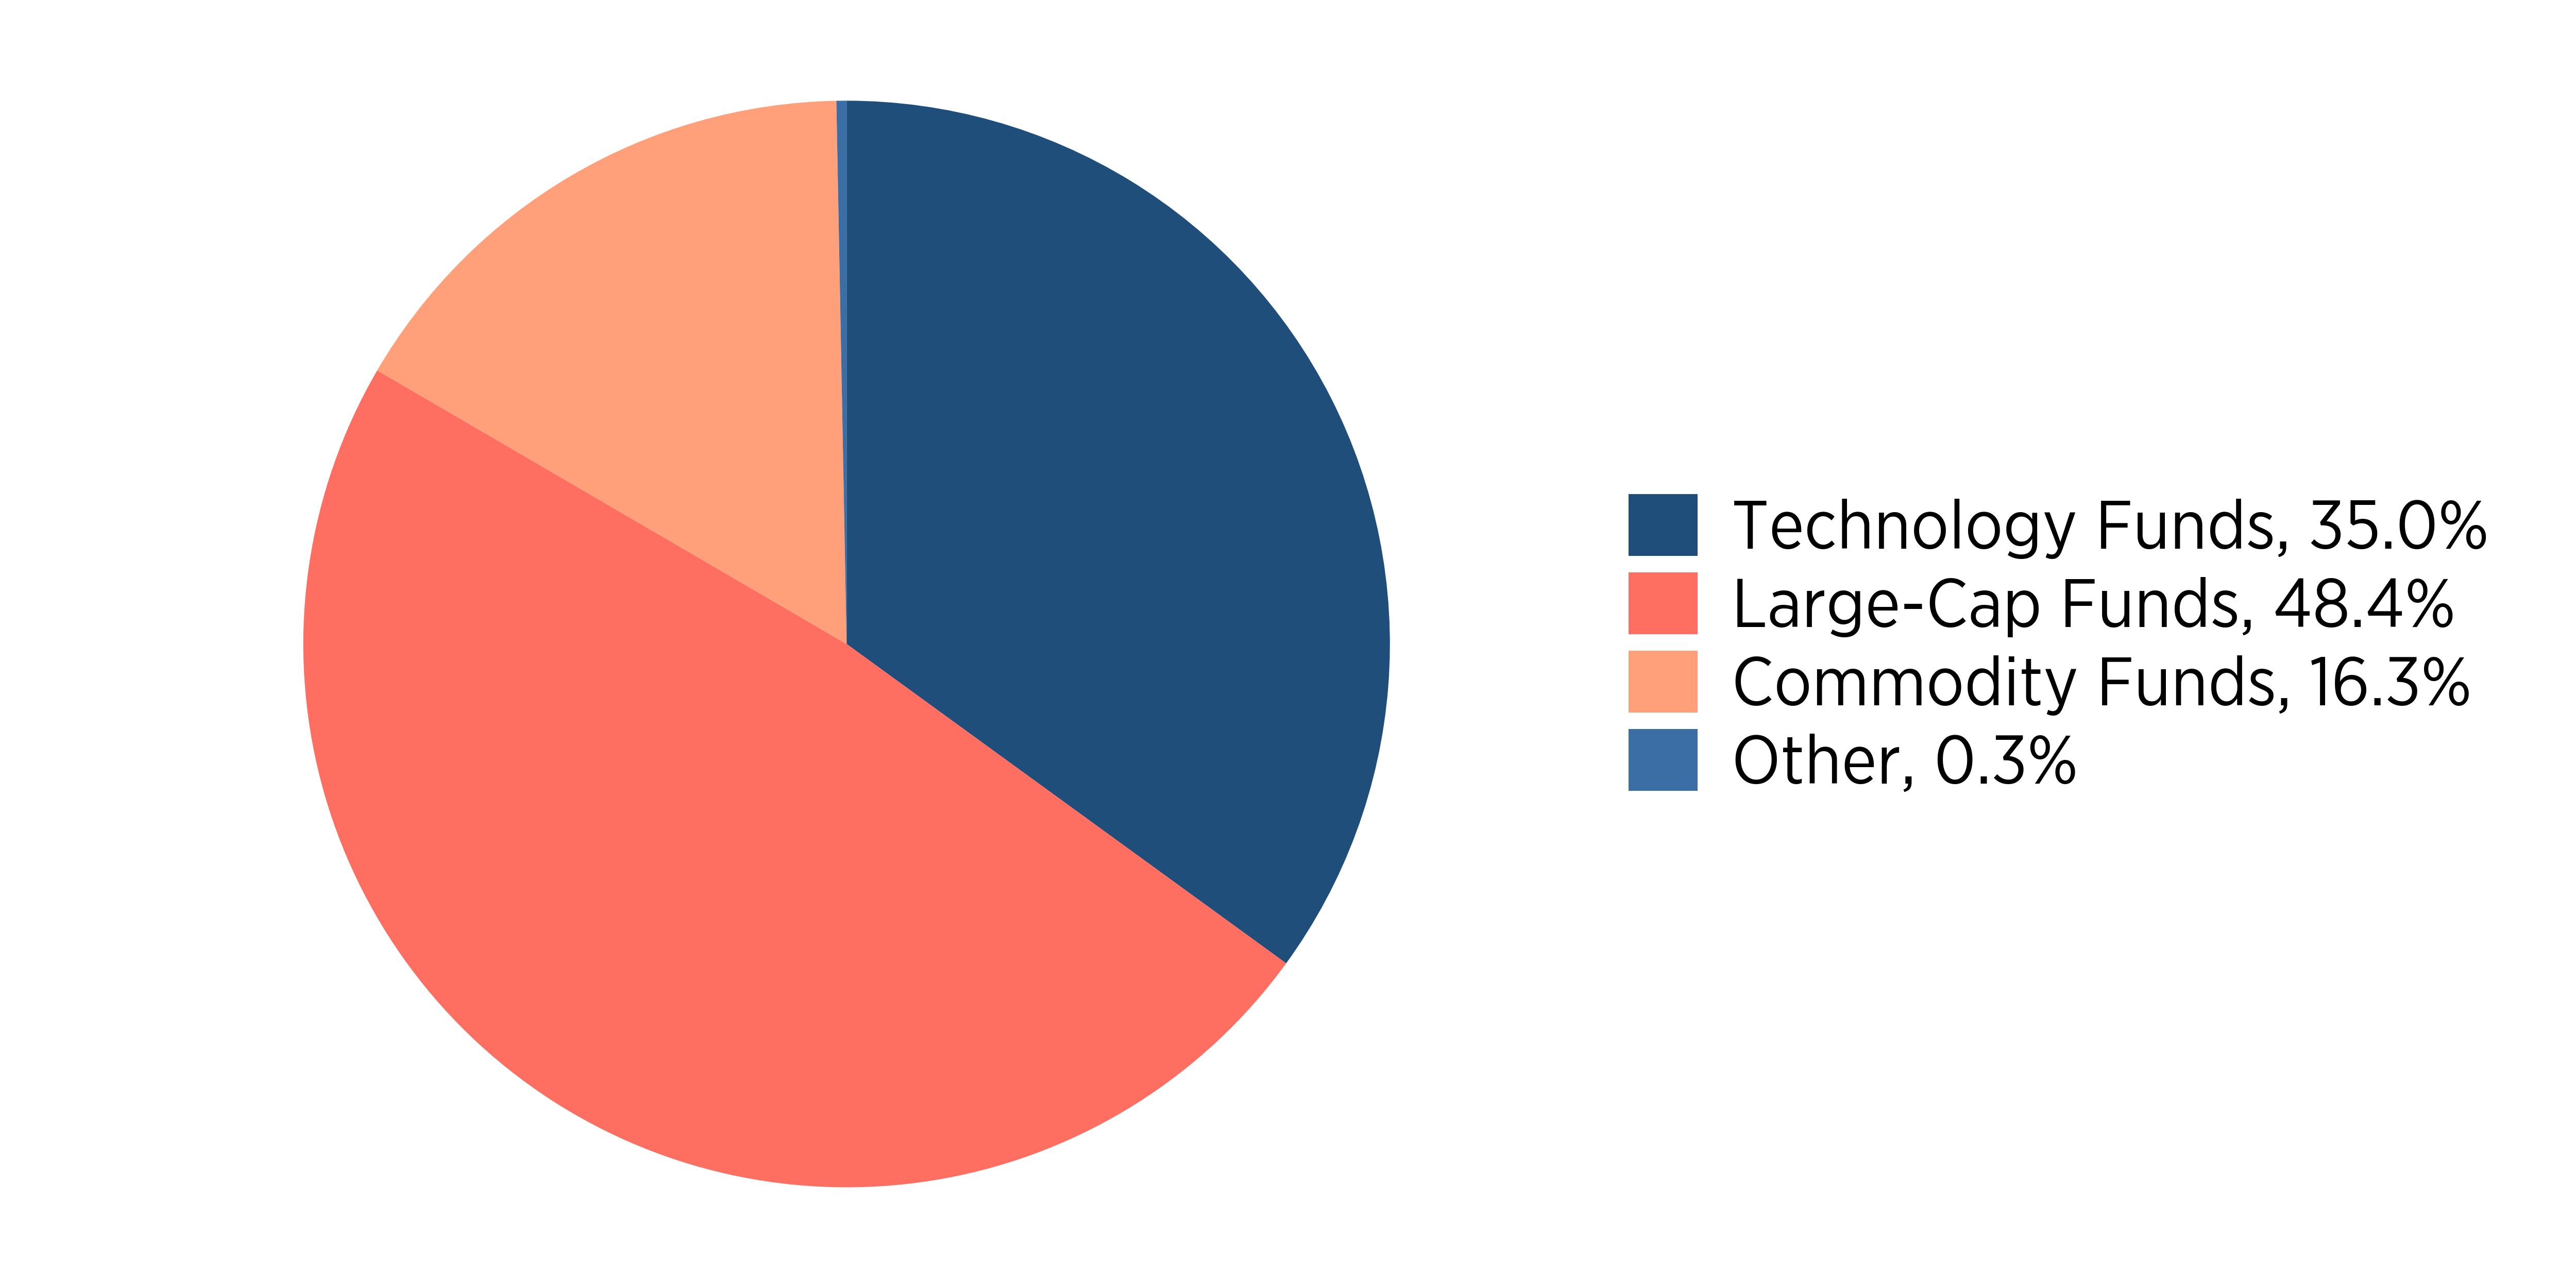
What did the Fund invest in?
(as of November 30, 2024)
Sector Breakdown (% of net assets)
Sector | % |
Technology Funds | 0.35 |
Large-Cap Funds | 0.484 |
Commodity Funds | 0.163 |
Other | 0.003 |
Top Holdings | (% of net assets) |
|---|
SPDR S&P 500 ETF Trust | 30.9% |
VanEck Semiconductor ETF | 18.5% |
SPDR Portfolio S&P 500 Growth ETF | 17.5% |
Financial Select Sector SPDR Fund | 16.5% |
Communication Services Select Sector SPDR Fund | 16.3% |
For additional information about the Fund; including its prospectus, financial information, holdings and proxy voting information, visit https://etfpages.com/RHRX.
RH Tactical Rotation ETF Tailored Shareholder Report
Not applicable.
| ITEM 3. | Audit Committee Financial Expert. |
Not applicable.
| ITEM 4. | Principal Fees and Services. |
Not applicable.
| ITEM 5. | Audit Committee of Listed Registrants. |
Not applicable.
| (a) | A copy of Schedule I - Investments in securities of unaffiliated issuers as of the close of the reporting period is included in the financial statements filed under Item 7 of this Form. |
| ITEM 7. | Financial Statements and Financial Highlights for Open-End Management Investment Companies. |
Semi-Annual Financial Statements
As of November 30, 2024
Adaptive ETFs
Adaptive Alpha Opportunities ETF
Adaptive Hedged Multi-Asset Income ETF
RH Tactical Outlook ETF
RH Tactical Rotation ETF
The financial statements and other information contained herein are submitted for the general information of the shareholders of the Adaptive ETFs (the “ETFs”). The ETFs’ shares are not deposits or obligations of, or guaranteed by, any depository institution. The ETFs’ shares are not insured by the FDIC, Federal Reserve Board or any other agency, and are subject to investment risks, including possible loss of principal amount invested. Neither the ETFs nor the ETFs’ distributor is a bank.
The ETFs are distributed by Capital Investment Group, Inc., Member FINRA/SIPC, 100 E. Six Forks Road, Suite 200, Raleigh, NC, 27609. There is no affiliation between the ETFs, including their principals, and Capital Investment Group, Inc.
TABLE OF CONTENTS
Adaptive Alpha Opportunities ETF
Schedule of Investments (unaudited)
As of November 30, 2024
| | | Shares | | | Value | |
| Common Stocks - 48.50% | | | | | | | | |
| Communications - 1.54% | | | | | | | | |
| AT&T Inc | | | 121,470 | | | $ | 2,813,245 | |
| Booking Holdings Inc | | | 296 | | | | 1,539,786 | |
| Meta Platforms Inc | | | 1,319 | | | | 757,528 | |
| | | | | | | | 5,110,559 | |
| Consumer Discretionary - 11.31% | | | | | | | | |
| Abercrombie & Fitch Co (a) | | | 10,621 | | | | 1,589,858 | |
| Amazon.com Inc (a) | | | 124,179 | | | | 25,815,572 | |
| Copart Inc (a) | | | 50,755 | | | | 3,217,359 | |
| Deckers Outdoor Corp (a) | | | 21,618 | | | | 4,236,263 | |
| Green Brick Partners Inc (a) | | | 11,825 | | | | 845,015 | |
| Tesla Inc (a) | | | 631 | | | | 217,796 | |
| Tri Pointe Homes Inc (a) | | | 20,740 | | | | 902,812 | |
| Winmark Corp | | | 1,716 | | | | 706,863 | |
| | | | | | | | 37,531,538 | |
| Energy - 0.26% | | | | | | | | |
| Archrock Inc | | | 31,932 | | | | 818,098 | |
| Exxon Mobil Corp | | | 410 | | | | 48,363 | |
| | | | | | | | 866,461 | |
| Financials - 5.48% | | | | | | | | |
| Ameriprise Financial Inc | | | 2,661 | | | | 1,527,334 | |
| Bank of America Corp | | | 75 | | | | 3,563 | |
| Cboe Global Markets Inc | | | 9,444 | | | | 2,038,488 | |
| Fair Isaac Corp (a) | | | 1,604 | | | | 3,809,548 | |
| JPMorgan Chase & Co | | | 4,594 | | | | 1,147,214 | |
| Progressive Corp/The | | | 16,900 | | | | 4,544,072 | |
| Raymond James Financial Inc | | | 7,969 | | | | 1,348,992 | |
| Verisk Analytics Inc | | | 12,804 | | | | 3,767,065 | |
| | | | | | | | 18,186,276 | |
| Health Care - 8.14% | | | | | | | | |
| Boston Scientific Corp (a) | | | 174,427 | | | | 15,813,552 | |
| Eli Lilly & Co | | | 966 | | | | 768,308 | |
| Madrigal Pharmaceuticals Inc (a) | | | 3,707 | | | | 1,216,600 | |
| Novo Nordisk A/S | | | 22,909 | | | | 2,446,681 | |
| Protagonist Therapeutics Inc (a) | | | 30,550 | | | | 1,338,090 | |
| Regeneron Pharmaceuticals Inc (a) | | | 2,563 | | | | 1,922,814 | |
| Vertex Pharmaceuticals Inc (a) | | | 7,429 | | | | 3,477,738 | |
| | | | | | | | 26,983,783 | |
| Industrials - 10.35% | | | | | | | | |
| Badger Meter Inc | | | 13,113 | | | | 2,843,161 | |
| Eaton Corp PLC | | | 7,702 | | | | 2,891,485 | |
| Federal Signal Corp | | | 10,576 | | | | 1,030,208 | |
| General Electric Co | | | 21,995 | | | | 4,006,609 | |
| Howmet Aerospace Inc | | | 66,864 | | | | 7,915,360 | |
| Hubbell Inc | | | 1,870 | | | | 860,368 | |
| IES Holdings Inc (a) | | | 5,560 | | | | 1,722,794 | |
| Ingersoll Rand Inc | | | 14,322 | | | | 1,491,923 | |
| Moog Inc | | | 6,050 | | | | 1,338,684 | |
| Quanta Services Inc | | | 1,322 | | | | 455,456 | |
| TransDigm Group Inc | | | 1,928 | | | | 2,415,726 | |
| Vertiv Holdings Co | | | 32,032 | | | | 4,087,283 | |
| WW Grainger Inc | | | 2,701 | | | | 3,255,623 | |
| | | | | | | | 34,314,680 | |
See Notes to Financial Statements
Adaptive Alpha Opportunities ETF
Schedule of Investments (unaudited) (continued)
As of November 30, 2024
| | | Shares | | | Value | |
| Common Stocks (continued) | | | |
| Materials - 3.55% | | | |
| Carpenter Technology Corp | | | 55,931 | | | $ | 10,852,851 | |
| Ecolab Inc | | | 3,646 | | | | 907,016 | |
| | | | | | | | 11,759,867 | |
| Technology - 7.01% | | | | | | | | |
| Advanced Micro Devices Inc (a) | | | 8,388 | | | | 1,150,624 | |
| Apple Inc | | | 3,197 | | | | 758,744 | |
| Broadcom Inc | | | 2,282 | | | | 369,867 | |
| C3.ai Inc (a) | | | 34,773 | | | | 1,292,860 | |
| Intel Corp | | | 102,160 | | | | 2,456,948 | |
| Manhattan Associates Inc (a) | | | 2,315 | | | | 660,794 | |
| Maximus Inc | | | 23,232 | | | | 1,730,784 | |
| Microsoft Corp | | | 12,079 | | | | 5,114,973 | |
| NVIDIA Corp | | | 3,581 | | | | 495,073 | |
| Oracle Corp | | | 161 | | | | 29,759 | |
| Salesforce Inc | | | 16,655 | | | | 5,495,984 | |
| Skyworks Solutions Inc | | | 7,088 | | | | 620,838 | |
| SPS Commerce Inc (a) | | | 10,871 | | | | 2,098,864 | |
| Tyler Technologies Inc (a) | | | 1,554 | | | | 977,730 | |
| | | | | | | | 23,253,842 | |
| Utilities - 0.86% | | | | | | | | |
| Constellation Energy Corp | | | 11,164 | | | | 2,864,236 | |
| Total Common Stocks (Cost $123,751,169) | | | | | | | 160,871,242 | |
| | | | | | | | | |
| Exchange-Traded Products - 47.33% | | | | | | | | |
| Aerospace & Defense Fund - 0.73% | | | | | | | | |
| SPDR S&P Aerospace & Defense ETF | | | 13,804 | | | | 2,436,682 | |
| | | | | | | | Spacer | |
| Communication Funds – 6.82% | | | | | | | | |
| Communication Services Select Sector SPDR Fund | | | 229,739 | | | | 22,606,317 | |
| | | | | | | | | |
| Consumer Discretionary Funds - 0.00% | | | | | | | | |
| SPDR S&P Homebuilders ETF | | | 100 | | | | 12,289 | |
| | | | | | | | Spacer | |
| Country Funds - 0.57% | | | | | | | | |
| Global X MSCI Argentina ETF | | | 22,761 | | | | 1,900,999 | |
| | | | | | | | | |
| Energy Funds - 1.84% | | | | | | | | |
| Energy Select Sector SPDR Fund | | | 63,738 | | | | 6,088,891 | |
| | | | | | | | | |
| Industrial Funds - 0.00% | | | | | | | | |
| Industrial Select Sector SPDR Fund | | | 8 | | | | 1,152 | |
| | | | | | | | | |
| Large-Cap Funds - 1.18% | | | | | | | | |
| SPDR S&P Capital Markets ETF | | | 26,328 | | | | 3,898,124 | |
| | | | | | | | | |
| Options Funds - 8.03% | | | | | | | | |
| iShares Russell 2000 ETF | | | 110,110 | | | | 26,632,306 | |
| | | | | | | | | |
| Technology Funds - 28.16% | | | | | | | | |
| ALPS O’Shares Global Internet Giants ETF (a) | | | 318 | | | | 15,072 | |
| Financial Select Sector SPDR Fund | | | 41,522 | | | | 2,131,739 | |
| Invesco QQQ Trust Series 1 | | | 144,871 | | | | 73,846,544 | |
| Technology Select Sector SPDR Fund | | | 29,420 | | | | 6,876,337 | |
See Notes to Financial Statements
Adaptive Alpha Opportunities ETF
Schedule of Investments (unaudited) (continued)
As of November 30, 2024
| | | | | | | | | | | Shares | | | Value | |
| Exchange-Traded Products (continued) | | | | | | | | | | | | | | | | | | |
| Technology Funds (continued) | | | | | | | | | | | | | | | | | | |
| VanEck Semiconductor ETF (a) | | | | | | | | | | | | | 8,532 | | | $ | 2,065,853 | |
| Vanguard Financials ETF | | | | | | | | | | | | | 67,195 | | | | 8,480,009 | |
| | | | | | | | | | | | | | | | | | 93,415,554 | |
| Total Exchange-Traded Products (Cost $141,216,330) | | | | | | | 156,992,314 | |
| | | | | | | | | |
| | | Number of
Contracts | | | Exercise
Price | | Exercise
Date | | Notional
Value | | | | | |
| Call Options Purchased - 7.31% | | | | | | | | | | | | | | | | | | |
| Advanced Micro Devices Inc | | | 1,000 | | | $ | 145 | | | 12/20/2024 | | $ | 14,500,000 | | | | 204,000 | |
| Axon Enterprise, Inc. | | | 100 | | | | 600 | | | 1/17/2025 | | | 6,000,000 | | | | 619,000 | |
| Broadcom Inc | | | 750 | | | | 165 | | | 12/13/2024 | | | 12,375,000 | | | | 405,000 | |
| Carpenter Technology Corp | | | 5 | | | | 160 | | | 12/20/2024 | | | 80,000 | | | | 17,450 | |
| CommScope Holding Company, Inc. | | | 2,000 | | | | 5 | | | 12/20/2024 | | | 1,000,000 | | | | 60,000 | |
| Frontdoor, Inc. | | | 1,309 | | | | 55 | | | 12/20/2024 | | | 7,199,500 | | | | 582,505 | |
| Goosehead Insurance, Inc | | | 366 | | | | 120 | | | 12/20/2024 | | | 4,392,000 | | | | 347,700 | |
| Howmet Aerospace Inc | | | 207 | | | | 115 | | | 12/20/2024 | | | 2,380,500 | | | | 106,605 | |
| IonQ, Inc. | | | 1,000 | | | | 30 | | | 1/3/2025 | | | 3,000,000 | | | | 877,500 | |
| iShares Russell 2000 ETF | | | 1,000 | | | | 250 | | | 12/20/2024 | | | 25,000,000 | | | | 219,500 | |
| Lumen Technologies, Inc. | | | 3,000 | | | | 8 | | | 12/27/2024 | | | 2,400,000 | | | | 180,000 | |
| Mueller Industries, Inc. | | | 174 | | | | 85 | | | 1/17/2025 | | | 1,479,000 | | | | 30,450 | |
| NVIDIA Corp | | | 1,000 | | | | 143 | | | 12/6/2024 | | | 14,300,000 | | | | 99,500 | |
| NVIDIA Corp | | | 2,000 | | | | 146 | | | 12/6/2024 | | | 29,200,000 | | | | 93,000 | |
| NVIDIA Corp | | | 2,000 | | | | 150 | | | 12/6/2024 | | | 30,000,000 | | | | 33,000 | |
| NVIDIA Corp | | | 1,000 | | | | 146 | | | 12/13/2024 | | | 14,600,000 | | | | 136,500 | |
| NVIDIA Corp | | | 1,000 | | | | 136 | | | 12/20/2024 | | | 13,600,000 | | | | 635,000 | |
| NVIDIA Corp | | | 500 | | | | 137 | | | 12/20/2024 | | | 6,850,000 | | | | 290,000 | |
| NVIDIA Corp | | | 1,000 | | | | 141 | | | 12/20/2024 | | | 14,100,000 | | | | 392,500 | |
| NVIDIA Corp | | | 1,000 | | | | 142 | | | 12/20/2024 | | | 14,200,000 | | | | 352,500 | |
| NVIDIA Corp | | | 1,000 | | | | 144 | | | 12/20/2024 | | | 14,400,000 | | | | 284,000 | |
| NVIDIA Corp | | | 1,000 | | | | 145 | | | 12/20/2024 | | | 14,500,000 | | | | 254,000 | |
| NVIDIA Corp | | | 1,000 | | | | 146 | | | 12/20/2024 | | | 14,600,000 | | | | 227,000 | |
| NVIDIA Corp | | | 2,000 | | | | 150 | | | 12/20/2024 | | | 30,000,000 | | | | 286,000 | |
| NVIDIA Corp | | | 1,000 | | | | 155 | | | 12/20/2024 | | | 15,500,000 | | | | 80,500 | |
| NVIDIA Corp | | | 1,000 | | | | 153 | | | 12/27/2024 | | | 15,300,000 | | | | 142,000 | |
| NVIDIA Corp | | | 2,000 | | | | 145 | | | 1/17/2025 | | | 29,000,000 | | | | 1,160,000 | |
| NVIDIA Corp | | | 1,000 | | | | 142 | | | 2/21/2025 | | | 14,200,000 | | | | 1,020,000 | |
| NVIDIA Corp | | | 1,000 | | | | 145 | | | 2/21/2025 | | | 14,500,000 | | | | 895,000 | |
| NVIDIA Corp | | | 500 | | | | 143 | | | 3/21/2025 | | | 7,150,000 | | | | 673,750 | |
| Palantir Technologies Inc. | | | 1,000 | | | | 62 | | | 12/6/2024 | | | 6,200,000 | | | | 540,000 | |
| Palantir Technologies Inc. | | | 1,000 | | | | 55 | | | 1/17/2025 | | | 5,500,000 | | | | 1,335,000 | |
| Palantir Technologies Inc. | | | 1,000 | | | | 65 | | | 1/17/2025 | | | 6,500,000 | | | | 625,000 | |
| Smith & Wesson Brands, Inc. | | | 523 | | | | 13 | | | 3/21/2025 | | | 679,900 | | | | 94,140 | |
| Tesla Inc | | | 200 | | | | 355 | | | 12/20/2024 | | | 7,100,000 | | | | 258,500 | |
| Tesla Inc | | | 250 | | | | 245 | | | 1/17/2025 | | | 6,125,000 | | | | 2,588,750 | |
| Tesla Inc | | | 200 | | | | 290 | | | 1/17/2025 | | | 5,800,000 | | | | 1,260,500 | |
| Tesla Inc | | | 500 | | | | 350 | | | 1/17/2025 | | | 17,500,000 | | | | 1,268,750 | |
| Tesla Inc | | | 250 | | | | 320 | | | 2/21/2025 | | | 8,000,000 | | | | 1,285,000 | |
| VanEck Semiconductor ETF | | | 2,000 | | | | 240 | | | 12/6/2024 | | | 48,000,000 | | | | 970,000 | |
| VanEck Semiconductor ETF | | | 1,590 | | | | 253 | | | 12/13/2024 | | | 40,227,000 | | | | 276,660 | |
| VanEck Semiconductor ETF | | | 1,000 | | | | 270 | | | 12/20/2024 | | | 27,000,000 | | | | 54,000 | |
| VanEck Semiconductor ETF | | | 2,000 | | | | 240 | | | 1/17/2025 | | | 48,000,000 | | | | 2,330,000 | |
| Zeta Global Holdings Corp. | | | 2,000 | | | | 20 | | | 1/17/2025 | | | 4,000,000 | | | | 660,000 | |
| Call Options Purchased (Premium Paid $34,994,788) | | | | | | | 24,250,260 | |
See Notes to Financial Statements
Adaptive Alpha Opportunities ETF
Schedule of Investments (unaudited) (continued)
As of November 30, 2024
| | | Number of
Contracts | | | Exercise
Price | | | Exercise
Date | | | Notional
Value | | | Value | |
| Put Options Purchased - 5.59% | | | | | | | | | | | | | | | | | | | | |
| Amazon.com Inc | | | 553 | | | $ | 190 | | | | 1/17/2025 | | | $ | 10,507,000 | | | $ | 94,286 | |
| Amazon.com Inc | | | 747 | | | | 200 | | | | 1/17/2025 | | | | 14,940,000 | | | | 285,728 | |
| Boston Scientific Corp | | | 500 | | | | 77 | | | | 12/13/2024 | | | | 3,850,000 | | | | 8,750 | |
| Boston Scientific Corp | | | 500 | | | | 83 | | | | 12/13/2024 | | | | 4,150,000 | | | | 3,750 | |
| Broadcom Inc | | | 500 | | | | 163 | | | | 12/6/2024 | | | | 8,150,000 | | | | 158,750 | |
| Communication Services Select Sector SPDR Fund | | | 1,000 | | | | 90 | | | | 1/17/2025 | | | | 9,000,000 | | | | 32,500 | |
| Communication Services Select Sector SPDR Fund | | | 1,000 | | | | 93 | | | | 1/17/2025 | | | | 9,300,000 | | | | 187,500 | |
| Howmet Aerospace Inc | | | 207 | | | | 110 | | | | 12/20/2024 | | | | 2,277,000 | | | | 11,385 | |
| Howmet Aerospace Inc | | | 93 | | | | 98 | | | | 1/17/2025 | | | | 911,400 | | | | 1,395 | |
| Invesco QQQ Trust Series 1 | | | 500 | | | | 515 | | | | 12/20/2024 | | | | 25,750,000 | | | | 454,000 | |
| Invesco QQQ Trust Series 1 | | | 1,000 | | | | 495 | | | | 1/17/2025 | | | | 49,500,000 | | | | 570,000 | |
| iShares Russell 2000 ETF | | | 1,000 | | | | 228 | | | | 12/20/2024 | | | | 22,800,000 | | | | 128,500 | |
| NVIDIA Corp | | | 3,000 | | | | 136 | | | | 12/20/2024 | | | | 40,800,000 | | | | 1,102,500 | |
| NVIDIA Corp | | | 1,000 | | | | 145 | | | | 12/20/2024 | | | | 14,500,000 | | | | 887,500 | |
| NVIDIA Corp | | | 1,000 | | | | 138 | | | | 1/17/2025 | | | | 13,800,000 | | | | 745,000 | |
| NVIDIA Corp | | | 1,000 | | | | 144 | | | | 1/17/2025 | | | | 14,400,000 | | | | 1,082,500 | |
| NVIDIA Corp | | | 2,000 | | | | 145 | | | | 1/17/2025 | | | | 29,000,000 | | | | 2,295,000 | |
| NVIDIA Corp | | | 3,000 | | | | 148 | | | | 1/17/2025 | | | | 44,400,000 | | | | 4,042,500 | |
| NVIDIA Corp | | | 1,000 | | | | 145 | | | | 2/21/2025 | | | | 14,500,000 | | | | 1,392,500 | |
| VanEck Semiconductor ETF | | | 1,500 | | | | 220 | | | | 12/13/2024 | | | | 33,000,000 | | | | 84,000 | |
| VanEck Semiconductor ETF | | | 1,000 | | | | 240 | | | | 2/21/2025 | | | | 24,000,000 | | | | 1,210,000 | |
| VanEck Semiconductor ETF | | | 1,000 | | | | 240 | | | | 3/21/2025 | | | | 24,000,000 | | | | 1,435,000 | |
| VanEck Semiconductor ETF | | | 1,000 | | | | 250 | | | | 3/21/2025 | | | | 25,000,000 | | | | 1,940,000 | |
| Vertiv Holdings Co | | | 300 | | | | 140 | | | | 12/20/2024 | | | | 4,200,000 | | | | 405,000 | |
| Total Put Options Purchased (Premiums Paid $22,419,386) | | | | | | | 18,558,044 | |
| | | | | | | | | | | | | | | | | | | | | |
| Short-Term Investment - 2.96% | | | | | | | | | | | | | | Shares | | | | | |
| Dreyfus Treasury Securities Cash Management, 4.45% (b) (Cost $9,815,284) | | | | 9,815,284 | | | | 9,815,284 | |
| | | | | | | | | | | | | | | | | | | | | |
| Investments, at Value (Cost $332,196,957) - 111.69% | | | | | | | $ | 370,487,144 | |
| Options Written (Premiums Received $57,347,875) - (11.70)% | | | | | | | | (38,795,744 | ) |
| Other Assets Less Liabilities - 0.01% | | | | | | | | 21,051 | |
| Net Assets - 100.00% | | | | | | | $ | 331,712,451 | |
| (a) | Non-income producing investment |
| (b) | Represents 7-day effective SEC yield as of November 30, 2024. |
See Notes to Financial Statements
Adaptive Alpha Opportunities ETF
Schedule of Options Written (unaudited)
As of November 30, 2024
| | | Number of
Contracts | | | Exercise
Price | | | Exercise
Date | | | Notional
Value | | | Value | |
| Call Options Written - (7.12)% | | | | | | | | | | | | | | | | | | | | |
| C3.ai Inc | | | (350 | ) | | $ | 30 | | | | 12/20/2024 | | | $ | (1,050,000 | ) | | $ | (273,000 | ) |
| Advanced Micro Devices Inc | | | (1,000 | ) | | | 170 | | | | 12/20/2024 | | | | (17,000,000 | ) | | | (23,500 | ) |
| Amazon.com Inc | | | (1,300 | ) | | | 220 | | | | 3/21/2025 | | | | (28,600,000 | ) | | | (1,257,750 | ) |
| Broadcom Inc | | | (750 | ) | | | 195 | | | | 1/17/2025 | | | | (14,625,000 | ) | | | (130,875 | ) |
| Broadcom Inc | | | (500 | ) | | | 200 | | | | 1/17/2025 | | | | (10,000,000 | ) | | | (66,000 | ) |
| Axon Enterprise, Inc. | | | (100 | ) | | | 750 | | | | 3/21/2025 | | | | (7,500,000 | ) | | | (276,500 | ) |
| Carpenter Technology Corp | | | (155 | ) | | | 165 | | | | 12/20/2024 | | | | (2,557,500 | ) | | | (463,450 | ) |
| Carpenter Technology Corp | | | (5 | ) | | | 200 | | | | 12/20/2024 | | | | (100,000 | ) | | | (2,525 | ) |
| Deckers Outdoor Corp | | | (200 | ) | | | 185 | | | | 12/20/2024 | | | | (3,700,000 | ) | | | (244,000 | ) |
| Goosehead Insurance, Inc | | | (366 | ) | | | 130 | | | | 1/17/2025 | | | | (4,758,000 | ) | | | (206,790 | ) |
| Howmet Aerospace Inc | | | (507 | ) | | | 130 | | | | 4/17/2025 | | | | (6,591,000 | ) | | | (261,105 | ) |
| IonQ, Inc. | | | (1,000 | ) | | | 45 | | | | 1/17/2025 | | | | (4,500,000 | ) | | | (330,000 | ) |
| iShares Russell 2000 ETF | | | (1,000 | ) | | | 250 | | | | 3/21/2025 | | | | (25,000,000 | ) | | | (884,000 | ) |
| iShares Russell 2000 ETF | | | (1,000 | ) | | | 270 | | | | 3/21/2025 | | | | (27,000,000 | ) | | | (309,500 | ) |
| Eli Lilly & Co | | | (100 | ) | | | 870 | | | | 12/20/2024 | | | | (8,700,000 | ) | | | (49,750 | ) |
| Lumen Technologies, Inc. | | | (3,000 | ) | | | 9 | | | | 1/17/2025 | | | | (2,700,000 | ) | | | (117,000 | ) |
| Meta Platforms Inc | | | (150 | ) | | | 610 | | | | 12/20/2024 | | | | (9,150,000 | ) | | | (53,250 | ) |
| Meta Platforms Inc | | | (100 | ) | | | 650 | | | | 12/20/2024 | | | | (6,500,000 | ) | | | (7,050 | ) |
| Meta Platforms Inc | | | (200 | ) | | | 670 | | | | 12/20/2024 | | | | (13,400,000 | ) | | | (7,700 | ) |
| Meta Platforms Inc | | | (100 | ) | | | 690 | | | | 2/21/2025 | | | | (6,900,000 | ) | | | (79,000 | ) |
| Mueller Industries, Inc. | | | (174 | ) | | | 100 | | | | 3/21/2025 | | | | (1,740,000 | ) | | | (16,530 | ) |
| Microsoft Corp | | | (100 | ) | | | 480 | | | | 12/20/2024 | | | | (4,800,000 | ) | | | (850 | ) |
| NVIDIA Corp | | | (1,000 | ) | | | 165 | | | | 12/13/2024 | | | | (16,500,000 | ) | | | (10,500 | ) |
| NVIDIA Corp | | | (1,000 | ) | | | 160 | | | | 12/20/2024 | | | | (16,000,000 | ) | | | (46,500 | ) |
| NVIDIA Corp | | | (1,000 | ) | | | 165 | | | | 12/20/2024 | | | | (16,500,000 | ) | | | (28,500 | ) |
| NVIDIA Corp | | | (2,000 | ) | | | 170 | | | | 12/20/2024 | | | | (34,000,000 | ) | | | (37,000 | ) |
| NVIDIA Corp | | | (3,000 | ) | | | 172 | | | | 12/20/2024 | | | | (51,600,000 | ) | | | (46,500 | ) |
| NVIDIA Corp | | | (2,000 | ) | | | 180 | | | | 12/20/2024 | | | | (36,000,000 | ) | | | (19,000 | ) |
| NVIDIA Corp | | | (2,000 | ) | | | 165 | | | | 12/27/2024 | | | | (33,000,000 | ) | | | (76,000 | ) |
| NVIDIA Corp | | | (1,000 | ) | | | 170 | | | | 12/27/2024 | | | | (17,000,000 | ) | | | (24,500 | ) |
| NVIDIA Corp | | | (500 | ) | | | 150 | | | | 1/3/2025 | | | | (7,500,000 | ) | | | (124,000 | ) |
| NVIDIA Corp | | | (1,000 | ) | | | 160 | | | | 1/17/2025 | | | | (16,000,000 | ) | | | (216,500 | ) |
| NVIDIA Corp | | | (3,000 | ) | | | 170 | | | | 1/17/2025 | | | | (51,000,000 | ) | | | (333,000 | ) |
| NVIDIA Corp | | | (1,000 | ) | | | 176 | | | | 1/17/2025 | | | | (17,600,000 | ) | | | (78,500 | ) |
| NVIDIA Corp | | | (1,000 | ) | | | 160 | | | | 2/21/2025 | | | | (16,000,000 | ) | | | (450,000 | ) |
| NVIDIA Corp | | | (1,000 | ) | | | 170 | | | | 2/21/2025 | | | | (17,000,000 | ) | | | (280,500 | ) |
| NVIDIA Corp | | | (4,000 | ) | | | 175 | | | | 2/21/2025 | | | | (70,000,000 | ) | | | (896,000 | ) |
| NVIDIA Corp | | | (1,000 | ) | | | 179 | | | | 2/21/2025 | | | | (17,900,000 | ) | | | (184,000 | ) |
| NVIDIA Corp | | | (3,000 | ) | | | 160 | | | | 3/21/2025 | | | | (48,000,000 | ) | | | (2,310,000 | ) |
| NVIDIA Corp | | | (500 | ) | | | 165 | | | | 3/21/2025 | | | | (8,250,000 | ) | | | (325,000 | ) |
| NVIDIA Corp | | | (1,000 | ) | | | 175 | | | | 3/21/2025 | | | | (17,500,000 | ) | | | (457,500 | ) |
| NVIDIA Corp | | | (1,500 | ) | | | 180 | | | | 3/21/2025 | | | | (27,000,000 | ) | | | (577,500 | ) |
| Palantir Technologies Inc. | | | (1,000 | ) | | | 75 | | | | 1/17/2025 | | | | (7,500,000 | ) | | | (245,500 | ) |
| Palantir Technologies Inc. | | | (1,000 | ) | | | 65 | | | | 2/21/2025 | | | | (6,500,000 | ) | | | (912,500 | ) |
| Palantir Technologies Inc. | | | (1,000 | ) | | | 80 | | | | 2/21/2025 | | | | (8,000,000 | ) | | | (390,000 | ) |
| Invesco QQQ Trust Series 1 | | | (1,000 | ) | | | 540 | | | | 2/28/2025 | | | | (54,000,000 | ) | | | (632,500 | ) |
| Invesco QQQ Trust Series 1 | | | (500 | ) | | | 550 | | | | 2/28/2025 | | | | (27,500,000 | ) | | | (195,000 | ) |
| VanEck Semiconductor ETF | | | (1,000 | ) | | | 260 | | | | 12/13/2024 | | | | (26,000,000 | ) | | | (69,000 | ) |
| VanEck Semiconductor ETF | | | (1,000 | ) | | | 270 | | | | 12/13/2024 | | | | (27,000,000 | ) | | | (20,000 | ) |
| VanEck Semiconductor ETF | | | (1,000 | ) | | | 280 | | | | 12/13/2024 | | | | (28,000,000 | ) | | | (6,000 | ) |
| VanEck Semiconductor ETF | | | (1,000 | ) | | | 265 | | | | 12/20/2024 | | | | (26,500,000 | ) | | | (90,000 | ) |
| VanEck Semiconductor ETF | | | (1,000 | ) | | | 280 | | | | 12/20/2024 | | | | (28,000,000 | ) | | | (21,000 | ) |
See Notes to Financial Statements
Adaptive Alpha Opportunities ETF
Schedule of Options Written (unaudited) (continued)
As of November 30, 2024
| | | Number of
Contracts | | | Exercise
Price | | | Exercise
Date | | | Notional
Value | | | Value | |
| Call Options Written (continued) | | | | | | | | | | | | | | | | | | | | |
| VanEck Semiconductor ETF | | | (1,500 | ) | | $ | 285 | | | | 12/20/2024 | | | $ | (42,750,000 | ) | | $ | (21,000 | ) |
| VanEck Semiconductor ETF | | | (2,590 | ) | | | 265 | | | | 1/17/2025 | | | | (68,635,000 | ) | | | (727,790 | ) |
| VanEck Semiconductor ETF | | | (1,500 | ) | | | 270 | | | | 1/17/2025 | | | | (40,500,000 | ) | | | (304,500 | ) |
| VanEck Semiconductor ETF | | | (1,000 | ) | | | 280 | | | | 1/17/2025 | | | | (28,000,000 | ) | | | (104,000 | ) |
| VanEck Semiconductor ETF | | | (3,000 | ) | | | 280 | | | | 3/21/2025 | | | | (84,000,000 | ) | | | (1,440,000 | ) |
| VanEck Semiconductor ETF | | | (3,179 | ) | | | 290 | | | | 3/21/2025 | | | | (92,191,000 | ) | | | (1,033,175 | ) |
| Tesla Inc | | | (200 | ) | | | 375 | | | | 1/17/2025 | | | | (7,500,000 | ) | | | (331,000 | ) |
| Tesla Inc | | | (500 | ) | | | 300 | | | | 2/21/2025 | | | | (15,000,000 | ) | | | (3,190,000 | ) |
| Tesla Inc | | | (200 | ) | | | 350 | | | | 2/21/2025 | | | | (7,000,000 | ) | | | (731,500 | ) |
| Tesla Inc | | | (500 | ) | | | 400 | | | | 2/21/2025 | | | | (20,000,000 | ) | | | (1,023,750 | ) |
| Vertiv Holdings Co | | | (300 | ) | | | 165 | | | | 1/17/2025 | | | | (4,950,000 | ) | | | (24,000 | ) |
| Communication Services Select Sector SPDR Fund | | | (1,000 | ) | | | 102 | | | | 3/21/2025 | | | | (10,200,000 | ) | | | (217,500 | ) |
| Zeta Global Holdings Corp. | | | (2,000 | ) | | | 30 | | | | 3/21/2025 | | | | (6,000,000 | ) | | | (300,000 | ) |
| Call Options Written (Premium Received $35,990,475) | | | | | | | | (23,610,840 | ) |
| | | | | | | | | | | | | | | | | | | | | |
| Put Options Written - (4.58)% | | | | | | | | | | | | | | | | | | | | |
| Apple Inc | | | (300 | ) | | | 210 | | | | 12/6/2024 | | | | (6,300,000 | ) | | | (1,800 | ) |
| Amazon.com Inc | | | (553 | ) | | | 160 | | | | 3/21/2025 | | | | (8,848,000 | ) | | | (66,084 | ) |
| Amazon.com Inc | | | (747 | ) | | | 180 | | | | 3/21/2025 | | | | (13,446,000 | ) | | | (239,040 | ) |
| Broadcom Inc | | | (500 | ) | | | 140 | | | | 1/17/2025 | | | | (7,000,000 | ) | | | (125,500 | ) |
| Broadcom Inc | | | (750 | ) | | | 155 | | | | 1/17/2025 | | | | (11,625,000 | ) | | | (504,375 | ) |
| Axon Enterprise, Inc. | | | (100 | ) | | | 450 | | | | 3/21/2025 | | | | (4,500,000 | ) | | | (38,250 | ) |
| Carpenter Technology Corp | | | (2 | ) | | | 140 | | | | 12/20/2024 | | | | (28,000 | ) | | | (145 | ) |
| Deckers Outdoor Corp | | | (200 | ) | | | 150 | | | | 12/20/2024 | | | | (3,000,000 | ) | | | (2,500 | ) |
| Howmet Aerospace Inc | | | (300 | ) | | | 80 | | | | 4/17/2025 | | | | (2,400,000 | ) | | | (10,500 | ) |
| IonQ, Inc. | | | (1,000 | ) | | | 25 | | | | 1/17/2025 | | | | (2,500,000 | ) | | | (128,000 | ) |
| iShares Russell 2000 ETF | | | (1,000 | ) | | | 202 | | | | 2/21/2025 | | | | (20,200,000 | ) | | | (108,500 | ) |
| Meta Platforms Inc | | | (100 | ) | | | 520 | | | | 12/20/2024 | | | | (5,200,000 | ) | | | (12,950 | ) |
| Meta Platforms Inc | | | (200 | ) | | | 525 | | | | 1/17/2025 | | | | (10,500,000 | ) | | | (104,000 | ) |
| Meta Platforms Inc | | | (100 | ) | | | 450 | | | | 2/21/2025 | | | | (4,500,000 | ) | | | (33,500 | ) |
| Mueller Industries, Inc. | | | (174 | ) | | | 75 | | | | 3/21/2025 | | | | (1,305,000 | ) | | | (50,460 | ) |
| Microsoft Corp | | | (100 | ) | | | 400 | | | | 12/20/2024 | | | | (4,000,000 | ) | | | (10,550 | ) |
| NVIDIA Corp | | | (2,000 | ) | | | 110 | | | | 12/20/2024 | | | | (22,000,000 | ) | | | (32,000 | ) |
| NVIDIA Corp | | | (1,000 | ) | | | 115 | | | | 12/20/2024 | | | | (11,500,000 | ) | | | (25,000 | ) |
| NVIDIA Corp | | | (1,000 | ) | | | 120 | | | | 12/20/2024 | | | | (12,000,000 | ) | | | (45,000 | ) |
| NVIDIA Corp | | | (3,000 | ) | | | 130 | | | | 12/27/2024 | | | | (39,000,000 | ) | | | (639,000 | ) |
| NVIDIA Corp | | | (500 | ) | | | 125 | | | | 1/3/2025 | | | | (6,250,000 | ) | | | (77,000 | ) |
| NVIDIA Corp | | | (1,000 | ) | | | 123 | | | | 1/17/2025 | | | | (12,300,000 | ) | | | (233,000 | ) |
| NVIDIA Corp | | | (2,000 | ) | | | 125 | | | | 1/17/2025 | | | | (25,000,000 | ) | | | (554,000 | ) |
| NVIDIA Corp | | | (1,000 | ) | | | 110 | | | | 2/21/2025 | | | | (11,000,000 | ) | | | (171,500 | ) |
| NVIDIA Corp | | | (1,000 | ) | | | 115 | | | | 2/21/2025 | | | | (11,500,000 | ) | | | (245,000 | ) |
| NVIDIA Corp | | | (1,000 | ) | | | 120 | | | | 2/21/2025 | | | | (12,000,000 | ) | | | (345,000 | ) |
| NVIDIA Corp | | | (2,000 | ) | | | 125 | | | | 2/21/2025 | | | | (25,000,000 | ) | | | (960,000 | ) |
| NVIDIA Corp | | | (2,000 | ) | | | 140 | | | | 2/21/2025 | | | | (28,000,000 | ) | | | (2,210,000 | ) |
| NVIDIA Corp | | | (2,000 | ) | | | 120 | | | | 3/21/2025 | | | | (24,000,000 | ) | | | (1,160,000 | ) |
| NVIDIA Corp | | | (2,000 | ) | | | 130 | | | | 3/21/2025 | | | | (26,000,000 | ) | | | (1,880,000 | ) |
| Invesco QQQ Trust Series 1 | | | (500 | ) | | | 445 | | | | 1/17/2025 | | | | (22,250,000 | ) | | | (55,000 | ) |
| Invesco QQQ Trust Series 1 | | | (500 | ) | | | 450 | | | | 2/28/2025 | | | | (22,500,000 | ) | | | (163,000 | ) |
| Invesco QQQ Trust Series 1 | | | (500 | ) | | | 470 | | | | 2/28/2025 | | | | (23,500,000 | ) | | | (261,000 | ) |
| Invesco QQQ Trust Series 1 | | | (500 | ) | | | 442 | | | | 3/21/2025 | | | | (22,100,000 | ) | | | (185,000 | ) |
| VanEck Semiconductor ETF | | | (1,500 | ) | | | 210 | | | | 12/20/2024 | | | | (31,500,000 | ) | | | (82,500 | ) |
| VanEck Semiconductor ETF | | | (2,000 | ) | | | 205 | | | | 1/17/2025 | | | | (41,000,000 | ) | | | (266,000 | ) |
| VanEck Semiconductor ETF | | | (1,000 | ) | | | 210 | | | | 1/17/2025 | | | | (21,000,000 | ) | | | (175,000 | ) |
See Notes to Financial Statements
Adaptive Alpha Opportunities ETF
Schedule of Options Written (unaudited) (continued)
As of November 30, 2024
| | | Number of
Contracts | | | Exercise
Price | | | Exercise
Date | | | Notional
Value | | | Value | |
| Put Options Written (continued) | | | | | | | | | | | | | | | | | | | | |
| VanEck Semiconductor ETF | | | (2,000 | ) | | $ | 205 | | | | 3/21/2025 | | | $ | (41,000,000 | ) | | $ | (790,000 | ) |
| VanEck Semiconductor ETF | | | (1,000 | ) | | | 210 | | | | 3/21/2025 | | | | (21,000,000 | ) | | | (485,000 | ) |
| VanEck Semiconductor ETF | | | (2,000 | ) | | | 225 | | | | 3/21/2025 | | | | (45,000,000 | ) | | | (1,720,000 | ) |
| Tesla Inc | | | (500 | ) | | | 270 | | | | 2/21/2025 | | | | (13,500,000 | ) | | | (371,250 | ) |
| Vertiv Holdings Co | | | (300 | ) | | | 120 | | | | 1/17/2025 | | | | (3,600,000 | ) | | | (141,000 | ) |
| Communication Services Select Sector SPDR Fund | | | (1,000 | ) | | | 82 | | | | 3/21/2025 | | | | (8,200,000 | ) | | | (52,500 | ) |
| Communication Services Select Sector SPDR Fund | | | (1,000 | ) | | | 85 | | | | 3/21/2025 | | | | (8,500,000 | ) | | | (205,000 | ) |
| Zeta Global Holdings Corp. | | | (2,000 | ) | | | 15 | | | | 3/21/2025 | | | | (3,000,000 | ) | | | (220,000 | ) |
| Put Options Written (Premium Received $21,357,400) | | | | | | | | (15,184,904 | ) |
| Total Options Written (Premiums Received $57,347,875) - (11.70)% | | | | | | | $ | (38,795,744 | ) |
See Notes to Financial Statements
| Adaptive Hedged Multi-Asset Income ETF |
| Consolidated Schedule of Investments (unaudited) |
| As of November 30, 2024 |
| | | Shares | | | Value
(Note 1) | |
| Exchange-Traded Products - 51.01% | | | | | | | | |
| Commodity Funds - 22.34% | | | | | | | | |
| United States Oil Fund LP (a) | | | 12,022 | | | $ | 860,895 | |
| UBS ETRACS Gold Shares Covered Call ETN (a) | | | 26,487 | | | | 4,098,069 | |
| | | | | | | | 4,958,964 | |
| Debt Funds - 0.71% | | | | | | | | |
| iShares 20+ Year Treasury Bond ETF (a) | | | 1,686 | | | | 158,433 | |
| | | | | | | | | |
| Large-Cap Funds - 0.96% | | | | | | | | |
| SPDR S&P 500 ETF Trust | | | 355 | | | | 213,905 | |
| | | | | | | | | |
| Technology Funds - 0.00% | | | | | | | | |
| Invesco QQQ Trust Series 1 | | | 4,507 | | | | 2,297,398 | |
| YieldMax MSFT Option Income Strategy ETF | | | 16,950 | | | | 319,338 | |
| YieldMax NVDA Option Income Strategy ETF | | | 12,605 | | | | 318,402 | |
| Yieldmax TSLA Option Income ETF | | | 22,072 | | | | 318,720 | |
| YieldMax AAPL Option Income Strategy ETF | | | 18,785 | | | | 336,252 | |
| Yieldmax AMZN Option Income ETF | | | 15,976 | | | | 305,781 | |
| YieldMax GOOGL Option Income Strategy ETF (a) | | | 21,079 | | | | 300,797 | |
| Yieldmax META Option Income Strategy ETF (a) | | | 17,065 | | | | 324,406 | |
| | | | | | | | 4,521,094 | |
| Options Funds - 6.63% | | | | | | | | |
| iShares Russell 2000 ETF (a) | | | 6,083 | | | | 1,471,295 | |
| Total Exchange-Traded Products (Cost $10,819,530) | | | | | | | 11,323,691 | |
| | | | | | | | | |
| | | Number of Contracts | | | Exercise Price | | | Exercise Date | | | Notional Value | | | | |
| Put Options Purchased - 0.25% | | | | | | | | | | | | | | | | | | | | |
| UBS ETRACS Gold Shares Covered Call ETN | | | 250 | | | $ | 239 | | | | 12/31/2024 | | | $ | 5,975,000 | | | | 38,500 | |
| Invesco QQQ Trust Series 1 | | | 86 | | | | 470 | | | | 12/31/2024 | | | | 4,042,000 | | | | 10,406 | |
| SPDR S&P 500 ETF Trust | | | 70 | | | | 555 | | | | 12/31/2024 | | | | 3,885,000 | | | | 6,405 | |
| Total Put Options Purchased (Premiums Paid $370,974) | | | | | | | | | | | | | | | | | | | 55,311 | |
| Collateralized Mortgage Obligations - 1.86% | | Principal | | | Interest Rate | | | | Maturity Date | | | | |
| Alternative Loan Trust 2006-28CB | | $ | 526,488 | | | | 6.500 | % | | | 10/25/2036 | | | | 209,515 | |
| Alternative Loan Trust 2005-J11 | | | 88,704 | | | | 5.000 | % | | | 11/25/2020 | | | | 87,391 | |
| American Home Mortgage Investment Trust 2004-1 | | | 136,154 | | | | 6.853 | % | | | 4/25/2044 | | | | 115,618 | |
| Total Collateralized Mortgage Obligations (Cost $449,702) | | | | | | | | | | | | | | | 412,524 | |
| | | | | | | | | | | | | | | | | |
| Short-Term Investment - 0.64% | | Shares | | | | |
| Fidelity Government Portfolio, 4.38% (b) (Cost $143,511) | | | 143,511 | | | | 143,511 | |
| | | | | | | | | |
| Investments, at Value (Cost $11,783,717) - 53.76% | | | | | | | 11,935,037 | |
| Other Assets Less Liabilities - 46.24% | | | | | | | 10,263,656 | |
| Net Assets - 100.00% | | | | | | $ | 22,198,693 | |
| (a) | Non-income producing |
| (b) | Represents 7-day effective SEC yield as of November 30, 2024. |
See Notes to Financial Statements
| RH Tactical Outlook ETF |
| Schedule of Investments (unaudited) |
| As of November 30, 2024 |
| | | Shares | | | Value | |
| Exchange-Traded Products - 99.95% | | | | | | | | |
| Commodity Funds - 8.08% | | | | | | | | |
| iShares Silver Trust (a) | | | 12,068 | | | $ | 336,939 | |
| SPDR Gold Shares (a) | | | 1,687 | | | | 414,310 | |
| | | | | | | | 751,249 | |
| Large-Cap Funds - 51.10% | | | | | | | | |
| SPDR S&P 500 ETF Trust (a) | | | 7,883 | | | | 4,749,901 | |
| | | | | | | | | |
| Mid-Cap Funds - 30.06% | | | | | | | | |
| SPDR Portfolio S&P 400 Mid Cap ETF (a) | | | 47,240 | | | | 2,793,774 | |
| | | | | | | | | |
| Options Funds - 10.71% | | | | | | | | |
| iShares Russell 2000 ETF (a) | | | 4,115 | | | | 995,295 | |
| Investments, at Value (Cost $7,002,422) - 99.95% | | | | | | | 9,290,219 | |
| Other Assets Less Liabilities - 0.05% | | | | | | | 5,013 | |
| Net Assets - 100.00% | | | | | | $ | 9,295,232 | |
See Notes to Financial Statements
| RH Tactical Rotation ETF |
| Schedule of Investments (unaudited) |
| As of November 30, 2024 |
| | | Shares | | | Value
(Note 1) | |
| Exchange-Traded Products - 99.73% | | | | | | | | |
| Communication Funds - 16.30% | | | | | | | | |
| Communication Services Select Sector SPDR Fund (a) | | | 27,096 | | | $ | 2,666,246 | |
| | | | | | | | | |
| Large-Cap Funds - 48.42% | | | | | | | | |
| SPDR Portfolio S&P 500 Growth ETF | | | 32,796 | | | | 2,865,059 | |
| SPDR S&P 500 ETF Trust (a) | | | 8,389 | | | | 5,054,792 | |
| | | | | | | | 7,919,851 | |
| Technology Funds - 35.01% | | | | | | | | |
| Financial Select Sector SPDR Fund (a) | | | 52,518 | | | | 2,696,274 | |
| VanEck Semiconductor ETF (a) | | | 12,518 | | | | 3,030,983 | |
| | | | | | | | 5,727,257 | |
| Total Exchange-Traded Products (Cost $13,210,442) | | | | | | | 16,313,354 | |
| | | Number of Contracts | | | Exercise Price | | | Exercise Date | | | Notional Value | | | | |
| Put Options Purchased - 0.48% | | | | | | | | | | | | | | | | | | | | |
| Invesco QQQ Trust ETF | | | 122 | | | $ | 480 | | | | 12/31/2024 | | | $ | 5,856,000 | | | | 22,204 | |
| VanEck Semiconductor ETF | | | 130 | | | | 235 | | | | 12/20/2024 | | | | 3,055,000 | | | | 48,100 | |
| SPDR S&P 500 ETF Trust | | | 88 | | | | 555 | | | | 12/31/2024 | | | | 4,884,000 | | | | 8,052 | |
| Total Put Options Purchased (Premiums Paid $414,550) | | | | | | | | | | | | | | | | | | | 78,356 | |
| | | | | | | | | | | | | | | | | | | | | |
| Investments, at Value (Cost $13,624,992) - 100.21% | | | | | | | | | | | | | | | | | | | 16,391,710 | |
| Liabilities in Excess of Other Assets - (0.21)% | | | | | | | | | | | | | | | | | | | (35,099 | ) |
| Net Assets - 100.00% | | | | | | | | | | | | | | | | | | $ | 16,356,611 | |
See Notes to Financial Statements
| Statement of Assets and Liabilities (unaudited) |
| As of November 30, 2024 |
| | | Adaptive Alpha Opportunities ETF | | Adaptive Hedged Multi-Asset Income ETF (a) | | RH Tactical Outlook ETF | | RH Tactical Rotation ETF |
| Assets: | | | | | | | | | |
| Investments, at value | | $ | 370,487,144 | | | $ | 11,935,037 | | | $ | 9,290,219 | | | $ | 16,391,710 | |
| Cash | | | 25,000 | | | | 1,721,122 | | | | 28,518 | | | | 1,375 | |
| Receivables: | | | | | | | | | | | | | | | | |
| Investment sold | | | 12,848 | | | | 8,537,089 | | | | — | | | | — | |
| Dividends | | | 48,969 | | | | 32,949 | | | | — | | | | — | |
| Interest | | | 30,701 | | | | 4,056 | | | | — | | | | — | |
| Due from Advisor | | | — | | | | — | | | | 216 | | | | — | |
| Prepaid expenses | | | 2,485 | | | | 1,780 | | | | 1,297 | | | | 1,616 | |
| Total assets | | | 370,607,147 | | | | 22,232,033 | | | | 9,320,250 | | | | 16,394,701 | |
| Liabilities: | | | | | | | | | | | | | | | | |
| Options written, at value | | | 38,795,744 | | | | — | | | | — | | | | — | |
| Accrued expenses: | | | | | | | | | | | | | | | | |
| Advisory fees | | | 27,118 | | | | 270 | | | | — | | | | 223 | |
| Professional fees | | | 6,711 | | | | 6,202 | | | | 2,174 | | | | 1,610 | |
| Trustee fees and meeting expenses | | | — | | | | 531 | | | | 403 | | | | 375 | |
| Operational expenses | | | 64,841 | | | | 26,059 | | | | 22,159 | | | | 35,594 | |
| Other expenses | | | 282 | | | | 278 | | | | 282 | | | | 288 | |
| Total liabilities | | | 38,894,696 | | | | 33,340 | | | | 25,018 | | | | 38,090 | |
| Total Net Assets | | $ | 331,712,451 | | | $ | 22,198,693 | | | $ | 9,295,232 | | | $ | 16,356,611 | |
| Net Assets Consist of: | | | | | | | | | | | | | | | | |
| Paid in capital | | $ | 279,491,516 | | | $ | 30,633,794 | | | $ | 11,120,472 | | | $ | 19,995,307 | |
| Accumulated earnings (deficit) | | | 52,220,935 | | | | (8,435,101 | ) | | | (1,825,240 | ) | | | (3,638,696 | ) |
| Total Net Assets | | $ | 331,712,451 | | | $ | 22,198,693 | | | $ | 9,295,232 | | | $ | 16,356,611 | |
| ETF Shares Outstanding, no par value | | | | | | | | | | | | | | | | |
| (unlimited authorized shares) | | | 11,263,738 | | | | 2,790,546 | | | | 543,586 | | | | 1,007,274 | |
| Net Asset Value, Per Share | | $ | 29.45 | | | $ | 7.95 | | | $ | 17.10 | | | $ | 16.24 | |
| Investments, at cost | | $ | 332,196,957 | | | $ | 11,783,717 | | | $ | 7,002,422 | | | $ | 13,624,992 | |
| Options written, premiums received | | | 57,347,875 | | | | — | | | | — | | | | — | |
See Notes to Financial Statements
| Statement of Operations (unaudited) |
| For the six months ended November 30, 2024 |
| | | Adaptive Alpha Opportunities ETF | | Adaptive Hedged Multi-Asset Income ETF (a) | | RH Tactical Outlook ETF | | RH Tactical Rotation ETF |
| Investment Income: | | | | | | | | | | | | | | | | |
| Dividends (net of withholding tax of $4,852, $0, $0, and $0) | | $ | 993,472 | | | $ | 475,176 | | | $ | 59,352 | | | $ | 87,819 | |
| Interest | | | 365,637 | | | | 28,864 | | | | — | | | | — | |
| Total Investment Income | | | 1,359,109 | | | | 504,040 | | | | 59,352 | | | | 87,819 | |
| Expenses: | | | | | | | | | | | | | | | | |
| Advisory fees (note 2) | | | 1,522,486 | | | | 79,294 | | | | 47,771 | | | | 80,173 | |
| Administration fees | | | 144,998 | | | | 11,952 | | | | 7,102 | | | | 10,556 | |
| Professional fees | | | 24,394 | | | | 38,237 | | | | 21,625 | | | | 23,432 | |
| Custody fees | | | 51,423 | | | | 11,196 | | | | 5,884 | | | | 5,021 | |
| Distribution fees | | | 10,457 | | | | 10,500 | | | | 10,414 | | | | 10,265 | |
| Compliance fees | | | 25,980 | | | | 7,518 | | | | 6,463 | | | | 10,846 | |
| Fund Accounting Fee | | | 11,648 | | | | 11,648 | | | | 11,648 | | | | 11,648 | |
| Transfer agent fees | | | 14,346 | | | | 8,868 | | | | 6,973 | | | | 7,135 | |
| Shareholder fulfillment fees | | | 11,102 | | | | 4,368 | | | | 1,830 | | | | 2,166 | |
| Trustee fees and meeting expenses (note 3) | | | 5,230 | | | | 4,368 | | | | 4,368 | | | | 4,368 | |
| Security pricing fees | | | 24,704 | | | | 2,441 | | | | 1,274 | | | | 1,350 | |
| Insurance fees | | | 2,730 | | | | 1,820 | | | | 1,820 | | | | 1,488 | |
| Registration and filing expenses | | | 2,548 | | | | 981 | | | | 550 | | | | 545 | |
| Other expenses | | | 1,092 | | | | 1,092 | | | | 1,093 | | | | 1,093 | |
| Total Expenses | | | 1,853,138 | | | | 194,283 | | | | 128,815 | | | | 170,086 | |
| Fees waived by Advisor (note 2) | | | — | | | | (80,238 | ) | | | (66,701 | ) | | | (69,869 | ) |
| Net Expenses | | | 1,853,138 | | | | 114,045 | | | | 62,114 | | | | 100,217 | |
| Net Investment Income (Loss) | | | (494,029 | ) | | | 389,995 | | | | (2,762 | ) | | | (12,398 | ) |
| Realized and Unrealized Gain (Loss) on Investments: | | | | | | | | | | | | | | | | |
| Net realized gain (loss) from: | | | | | | | | | | | | | | | | |
| Investment transactions | | | (34,585,656 | ) | | | (174,131 | ) | | | — | | | | 820,059 | |
| Options written | | | 45,677,738 | | | | 550,674 | | | | — | | | | 27,546 | |
| In-kind transactions | | | 1,171,772 | | | | 11,953 | | | | 333,573 | | | | 163,742 | |
| Total realized gain | | | 12,263,854 | | | | 388,496 | | | | 333,573 | | | | 1,011,347 | |
| Net change in unrealized appreciation (depreciation) on: | | | | | | | | | | | | | | | | |
| Investment transactions | | | 1,747,644 | | | | 936,930 | | | | 870,430 | | | | 382,829 | |
| Options written | | | 18,552,132 | | | | — | | | | — | | | | — | |
| Total change in unrealized appreciation | | | 20,299,776 | | | | 936,930 | | | | 870,430 | | | | 382,829 | |
| Net Realized and Unrealized Gain (Loss) on Investments | | | 32,563,630 | | | | 1,325,426 | | | | 1,204,003 | | | | 1,394,176 | |
| Net Increase in Net Assets Resulting from Operations | | $ | 32,069,601 | | | $ | 1,715,421 | | | $ | 1,201,241 | | | $ | 1,381,778 | |
See Notes to Financial Statements
| Statements of Changes in Net Assets |
| For the period and fiscal year ended |
| | | Adaptive Alpha Opportunities ETF |
| | | November 30, 2024(a) | | May 31,
2024 |
| Operations: | | | | | | | | |
| Net investment income (loss) | | ($ | 494,029 | ) | | $ | 185,974 | |
| Net realized gain (loss) from investment transactions | | | (34,585,656 | ) | | | (9,072,550 | ) |
| Net realized gain (loss) from options written | | | 45,677,738 | | | | 5,470,057 | |
| Net realized gain from in-kind transactions | | | 1,171,772 | | | | 4,363,737 | |
| Capital gain distributions from underlying funds | | | — | | | | — | |
| Net change in unrealized appreciation on investments | | | 20,299,776 | | | | 41,847,409 | |
| Net Increase in Net Assets Resulting from Operations | | | 32,069,601 | | | | 42,794,627 | |
| Distributions to Shareholders From: | | | | | | | | |
| Distributable Earnings | | | — | | | | (614,635 | ) |
| Return of Capital | | | — | | | | — | |
| Net Decrease in Net Assets Resulting from Distributions | | | — | | | | (614,635 | ) |
| Capital Share Transactions: | | | | | | | | |
| Shares sold | | | 35,909,818 | | | | 84,385,059 | |
| Shares repurchased | | | (5,258,348 | ) | | | (53,128,852 | ) |
| Net Increase (Decrease) in Net Assets Resulting from Capital Share Transactions | | | 30,651,470 | | | | 31,256,207 | |
| Net Increase (Decrease) in Net Assets | | | 62,721,071 | | | | 73,436,199 | |
| Net Assets: | | | | | | | | |
| Beginning of Year | | | 268,991,380 | | | | 195,555,181 | |
| End of Year | | $ | 331,712,451 | | | $ | 268,991,380 | |
| Share Information: | | | | | | | | |
| Shares sold | | | 1,270,000 | | | | 3,550,000 | |
| Shares repurchased | | | (180,000 | ) | | | (2,230,000 | ) |
| Net Increase (Decrease) in Capital Shares | | | 1,090,000 | | | | 1,320,000 | |
| | | | | | | | | |
| (a) Unaudited | | | | | | | | |
| (b) Consolidated | | | | | | | | |
See Notes to Financial Statements
| | | | | | | | | | | |
| | | | | | | | | | | |
| Adaptive Hedged Multi-Asset Income ETF | | RH Tactical Outlook ETF | | RH Tactical Rotation ETF |
| November 30, 2024(a) | | May 31, 2024 | | November 30, 2024(a) | | May 31, 2024 | | November 30, 2024(a) | | May 31, 2024 |
| | | | | | | | | | | | | | | | | | | | | | | |
| $ | 389,995 | | | $ | 530,397 | | | $ | (2,762 | ) | | $ | 22,450 | | | $ | (12,398 | ) | | $ | (18,505 | ) |
| | (174,131 | ) | | | (294,499 | ) | | | — | | | | 17,325 | | | | 820,059 | | | | 255,209 | |
| | 550,674 | | | | 900,266 | | | | — | | | | (133,666 | ) | | | 27,546 | | | | (207,740 | ) |
| | 11,953 | | | | 196,565 | | | | 333,573 | | | | 500,844 | | | | 163,742 | | | | 911,033 | |
| | — | | | | — | | | | — | | | | — | | | | — | | | | — | |
| | 936,930 | | | | 713,986 | | | | 870,430 | | | | 1,371,685 | | | | 382,829 | | | | 2,437,538 | |
| | 1,715,421 | | | | 2,046,715 | | | | 1,201,241 | | | | 1,778,638 | | | | 1,381,778 | | | | 3,377,535 | |
| | | | | | | | | | | | | | | | | | | | | | | |
| | (806,498 | ) | | | (527,681 | ) | | | — | | | | — | | | | — | | | | — | |
| | — | | | | (1,694,662 | ) | | | — | | | | — | | | | — | | | | — | |
| | (806,498 | ) | | | (2,222,343 | ) | | | — | | | | — | | | | — | | | | — | |
| | | | | | | | | | | | | | | | | | | | | | | |
| | 3,689,948 | | | | 14,758,931 | | | | — | | | | 817,232 | | | | 1,396,813 | | | | 10,311,601 | |
| | (1,382,254 | ) | | | (43,581,321 | ) | | | (1,446,664 | ) | | | (13,755,553 | | | | (789,044 | ) | | | (18,546,957 | |
| | 2,307,694 | | | | (28,822,390 | ) | | | (1,446,664 | ) | | | (12,938,321 | ) | | | 607,769 | | | | (8,235,356 | ) |
| | 3,216,617 | | | | (28,998,018 | ) | | | (245,423 | ) | | | (11,159,683 | ) | | | 1,989,547 | | | | (4,857,821 | ) |
| | | | | | | | | | | | | | | | | | | | | | | |
| | 18,982,076 | | | | 47,980,094 | | | | 9,540,655 | | | | 20,700,338 | | | | 14,367,064 | | | | 19,224,885 | |
| $ | 22,198,693 | | | $ | 18,982,076 | | | $ | 9,295,232 | | | $ | 9,540,655 | | | $ | 16,356,611 | | | $ | 14,367,064 | |
| | | | | | | | | | | | | | | | | | | | | | | |
| | 460,000 | | | | 1,970,000 | | | | — | | | | 60,000 | | | | 90,000 | | | | 810,000 | |
| | (70,000 | ) | | | (5,740,000 | ) | | | (90,000 | ) | | | (1,040,000 | ) | | | (50,000 | ) | | | (1,460,000 | ) |
| | 390,000 | | | | (3,770,000 | ) | | | (90,000 | ) | | | (980,000 | ) | | | 40,000 | | | | (650,000 | ) |
See Notes to Financial Statements
| Adaptive Alpha Opportunities ETF |
| Financial Highlights |
| | | Nov. 30 | | | May 31, | |
| For a share outstanding during each fiscal period ended | | 2024(e) | | | 2024 | | | 2023 | | | 2022 | | | 2021 | | | 2020 | |
| Net Asset Value, Beginning of Period | | $ | 26.44 | | | $ | 22.09 | | | $ | 22.29 | | | $ | 25.77 | | | $ | 17.78 | | | $ | 15.55 | |
| Income (Loss) from Investment Operations: | | | | | | | | | | | | | | | | | | | | | | | | |
| Net investment income (loss) (a) | | | (0.05 | ) | | | 0.02 | | | | 0.08 | | | | (0.01 | ) | | | (0.17 | ) | | | 0.01 | |
| Net realized and unrealized gain (loss) on investments | | | 3.06 | | | | 4.40 | | | | (0.24 | ) | | | (1.85 | ) | | | 8.36 | | | | 2.69 | |
| Total from Investment Operations | | | 3.01 | | | | 4.42 | | | | (0.16 | ) | | | (1.86 | ) | | | 8.19 | | | | 2.70 | |
| Less Distributions From: | | | | | | | | | | | | | | | | | | | | | | | | |
| Net investment income | | | — | | | | (0.07 | ) | | | (0.04 | ) | | | (0.05 | ) | | | (0.02 | ) | | | — | |
| Net realized gains | | | — | | | | — | | | | — | | | | (1.57 | ) | | | (0.18 | ) | | | (0.47 | ) |
| Total Distributions | | | — | | | | (0.07 | ) | | | (0.04 | ) | | | (1.62 | ) | | | (0.20 | ) | | | (0.47 | ) |
| | | | | | | | | | | | | | | | | | | | | | | | | |
| Net Asset Value, End of Period | | $ | 29.45 | | | $ | 26.44 | | | $ | 22.09 | | | $ | 22.29 | | | $ | 25.77 | | | $ | 17.78 | |
| | | | | | | | | | | | | | | | | | | | | | | | | |
| Total Return | | | 11.40 | % | | | 20.01 | % | | | (0.71 | )% | | | (8.05 | )% | | | 46.18 | % | | | 17.50 | % |
| Net Assets, End of Period (in thousands) | | $ | 331,712 | | | $ | 268,991 | | | $ | 195,555 | | | $ | 211,849 | | | $ | 153,188 | | | $ | 59,869 | |
| Ratios of: | | | | | | | | | | | | | | | | | | | | | | | | |
| Gross Expenses to Average Net Assets(b) | | | 1.21 | %(f) | | | 1.22 | % | | | 1.19 | % | | | 1.18 | % | | | 1.45 | %(c) | | | 1.58 | %(c) |
| Net Expenses to Average Net Assets(b) | | | 1.21 | %(f) | | | 1.22 | % | | | 1.19 | % | | | 1.18 | % | | | 1.26 | %(c) | | | 1.26 | %(c) |
| Net Investment Income (Loss) to Average Net Assets(b) | | | (0.32 | )%(f) | | | 0.08 | % | | | 0.36 | % | | | (0.02 | )% | | | (0.75 | )% | | | 0.07 | % |
| Portfolio turnover rate(d) | | | 274.94 | %(g) | | | 368.05 | % | | | 22.32 | % | | | 25.74 | % | | | 94.33 | % | | | 319.85 | % |
| (a) | Calculated using the average shares method. |
| (b) | Does not include expenses of the investment companies in which the Fund invests. |
| (c) | Includes interest expense of 0.01% for the fiscal years ended May 31, 2021 and 2020. |
| (d) | Excludes securities received or delivered in-kind. |
| (e) | Unaudited |
| (f) | Annualized |
| (g) | Not annualized |
See Notes to Financial Statements
| Adaptive Hedged Multi-Asset Income ETF |
| Financial Highlights |
| | | Nov. 30, | | | May 31, | |
| For a share outstanding during each fiscal period ended | | 2024(a)(g) | | | 2024(a) | | | 2023 | | | 2022 | | | 2021 | | | 2020 | |
| Net Asset Value, Beginning of Period | | $ | 7.91 | | | $ | 7.78 | | | $ | 8.50 | | | $ | 9.83 | | | $ | 9.79 | | | $ | 10.29 | |
| Income (Loss) from Investment Operations: | | | | | | | | | | | | | | | | | | | | | | | | |
| Net investment income (loss) (b) | | | 0.16 | | | | 0.13 | | | | 0.62 | | | | 0.73 | | | | 0.26 | | | | 0.31 | |
| Net realized and unrealized gain (loss) on investments | | | 0.20 | | | | 0.54 | | | | (0.72 | ) | | | (1.38 | ) | | | 0.06 | | | | (0.47 | ) |
| Total from Investment Operations | | | 0.36 | | | | 0.67 | | | | (0.10 | ) | | | (0.65 | ) | | | 0.32 | | | | (0.16 | ) |
| Less Distributions From: | | | | | | | | | | | | | | | | | | | | | | | | |
| Net investment income | | | (0.32 | ) | | | (0.13 | ) | | | (0.27 | ) | | | (0.68 | ) | | | (0.28 | ) | | | (0.34 | ) |
| Return of Capital | | | — | | | | (0.41 | ) | | | (0.35 | ) | | | — | | | | — | | | | — | |
| Total Distributions | | | (0.32 | ) | | | (0.54 | ) | | | (0.62 | ) | | | (0.68 | ) | | | (0.28 | ) | | | (0.34 | ) |
| | | | | | | | | | �� | | | | | | | | | | | | | | | |
| Net Asset Value, End of Period | | $ | 7.95 | | | $ | 7.91 | | | $ | 7.78 | | | $ | 8.50 | | | $ | 9.83 | | | $ | 9.79 | |
| | | | | | | | | | | | | | | | | | | | | | | | | |
| Total Return | | | 4.64 | % | | | 9.01 | % | | | (1.06 | )% | | | (6.98 | )%(c) | | | 3.29 | % | | | (1.62 | )% |
| Net Assets, End of Period (in thousands) | | $ | 22,199 | | | $ | 18,982 | | | $ | 47,980 | | | $ | 48,711 | | | $ | 18,911 | | | $ | 42,354 | |
| Ratios of: | | | | | | | | | | | | | | | | | | | | | | | | |
| Gross Expenses to Average Net Assets (c) | | | 1.95 | %(h) | | | 1.64 | % | | | 1.27 | % | | | 2.29 | %(d) | | | 1.86 | % | | | 1.83 | % |
| Net Expenses to Average Net Assets (c) | | | 1.15 | %(h) | | | 1.02 | % | | | 0.85 | % | | | 1.74 | %(d) | | | 1.25 | % | | | 1.25 | % |
| Net Investment Income to Average Net Assets (c) | | | 3.92 | %(h) | | | 1.71 | % | | | 7.88 | % | | | 7.83 | %(d) | | | 2.58 | % | | | 3.04 | % |
| Portfolio turnover rate (f) | | | 350.47 | %(i) | | | 596.01 | %(e) | | | 155.15 | %(e) | | | 225.13 | %(e) | | | 148.62 | % | | | 9.52 | % |
| (a) | Consolidated |
| (b) | Calculated using the average shares method. |
| (c) | Does not include expenses of the investment companies in which the Fund invests. |
| (d) | The total return includes tax expenses. The impact on total returns was (0.44)% |
| (e) | Gross expenses, net expenses, and net investment income include tax expenses. The impact on the ratios is 0.78%. |
| (f) | Excludes securities received or delivered in-kind. |
| (g) | Unaudited |
| (h) | Annualized |
| (i) | Not annualized |
See Notes to Financial Statements
| RH Tactical Outlook ETF |
| Financial Highlights |
| | | Nov. 30, | | | May 31, | |
| For a share outstanding during each fiscal period ended | | 2024(e) | | | 2024 | | | 2023 | | | 2022 | | | 2021 | | | 2020 | |
| Net Asset Value, Beginning of Period | | $ | 15.06 | | | $ | 12.83 | | | $ | 13.71 | | | $ | 14.44 | | | $ | 11.36 | | | $ | 11.84 | |
| Income (Loss) from Investment Operations: | | | | | | | | | | | | | | | | | | | | | | | | |
| Net investment income (loss) (a) | | | — | | | | 0.02 | | | | (0.03 | ) | | | (0.03 | ) | | | 0.00 | (c) | | | 0.08 | |
| Net realized and unrealized gain (loss) on investments | | | 2.04 | | | | 2.21 | | | | (0.85 | ) | | | (0.70 | ) | | | 3.08 | | | | (0.39 | ) |
| Total from Investment Operations | | | 2.04 | | | | 2.23 | | | | (0.88 | ) | | | (0.73 | ) | | | 3.08 | | | | (0.31 | ) |
| Less Distributions From: | | | | | | | | | | | | | | | | | | | | | | | | |
| Net investment income | | | — | | | | — | | | | — | | | | — | | | | — | | | | (0.17 | ) |
| Total Distributions | | | — | | | | — | | | | — | | | | — | | | | — | | | | (0.17 | ) |
| | | | | | | | | | | | | | | | | | | | | | | | | |
| Net Asset Value, End of Period | | $ | 17.10 | | | $ | 15.06 | | | $ | 12.83 | | | $ | 13.71 | | | $ | 14.44 | | | $ | 11.36 | |
| | | | | | | | | | | | | | | | | | | | | | | | | |
| Total Return | | | 13.56 | % | | | 17.38 | % | | | (6.43 | )% | | | (5.05 | )% | | | 27.11 | % | | | (2.84 | )% |
| Net Assets, End of Period (in thousands) | | $ | 9,295 | | | $ | 9,541 | | | $ | 20,700 | | | $ | 27,605 | | | $ | 10,816 | | | $ | 15,339 | |
| Ratios of: | | | | | | | | | | | | | | | | | | | | | | | | |
| Gross Expenses to Average Net Assets (b) | | | 2.69 | %(f) | | | 2.21 | % | | | 1.78 | % | | | 2.01 | % | | | 2.92 | % | | | 2.50 | % |
| Net Expenses to Average Net Assets (b) | | | 1.30 | %(f) | | | 1.25 | % | | | 1.25 | % | | | 1.26 | % | | | 1.25 | % | | | 1.25 | % |
| Net Investment Income (Loss) to Average Net Assets (b) | | | (0.06 | )%(f) | | | 0.16 | % | | | (0.23 | )% | | | (0.20 | )% | | | (0.01 | )% | | | 0.62 | % |
| Portfolio turnover rate (d) | | | 0.00 | %(g) | | | 88.96 | % | | | 164.54 | % | | | 120.07 | % | | | 143.64 | % | | | 141.55 | % |
| (a) | Calculated using the average shares method. |
| (b) | Does not include expenses of the investment companies in which the Fund invests. |
| (c) | Less than $0.01 per share. |
| (d) | Excludes securities received or delivered in-kind. |
| (e) | Unaudited |
| (f) | Annualized |
| (g) | Not annualized |
See Notes to Financial Statements
| RH Tactical Rotation ETF |
| Financial Highlights |
| | | Nov. 30, | | | May 31, | |
| For a share outstanding during each fiscal period ended | | 2024(e) | | | 2024 | | | 2023 | | | 2022 | | | 2021 | | | 2020 | |
| Net Asset Value, Beginning of Period | | $ | 14.85 | | | $ | 11.89 | | | $ | 12.74 | | | $ | 13.36 | | | $ | 10.40 | | | $ | 11.61 | |
| Income (Loss) from Investment Operations: | | | | | | | | | | | | | | | | | | | | | | | | |
| Net investment income (loss) (a) | | | — | | | | (0.01 | ) | | | 0.01 | | | | (0.02 | ) | | | — | | | | 0.06 | |
| Net realized and unrealized gain (loss) on investments | | | 1.39 | | | | 2.97 | | | | (0.86 | ) | | | (0.60 | ) | | | 3.09 | | | | (0.94 | ) |
| Total from Investment Operations | | | 1.39 | | | | 2.96 | | | | (0.85 | ) | | | (0.62 | ) | | | 3.09 | | | | (0.88 | ) |
| Less Distributions From: | | | | | | | | | | | | | | | | | | | | | | | | |
| Net investment income | | | — | | | | — | | | | — | | | | — | | | | (0.13 | ) | | | (0.33 | ) |
| Total Distributions | | | — | | | | — | | | | — | | | | — | | | | (0.13 | ) | | | (0.33 | ) |
| | | | | | | | | | | | | | | | | | | | | | | | | |
| Net Asset Value, End of Period | | $ | 16.24 | | | $ | 14.85 | | | $ | 11.89 | | | $ | 12.74 | | | $ | 13.36 | | | $ | 10.40 | |
| | | | | | | | | | | | | | | | | | | | | | | | | |
| Total Return | | | 9.33 | % | | | 24.95 | % | | | (6.69 | )% | | | (4.64 | )% | | | 29.80 | % | | | (7.98 | )% |
| Net Assets, End of Period (in thousands) | | $ | 16,357 | | | $ | 14,367 | | | $ | 19,225 | | | $ | 27,484 | | | $ | 19,021 | | | $ | 19,027 | |
| Ratios of: | | | | | | | | | | | | | | | | | | | | | | | | |
| Gross Expenses to Average Net Assets (b) | | | 2.11 | %(f) | | | 2.04 | % | | | 1.82 | % | | | 1.74 | % | | | 2.34 | % | | | 1.80 | %(c) |
| Net Expenses to Average Net Assets (b) | | | 1.25 | %(f) | | | 1.25 | % | | | 1.24 | % | | | 1.25 | % | | | 1.25 | % | | | 1.25 | %(c) |
| Net Investment Income (Loss) to Average Net Assets (b) | | | (0.15 | )%(f) | | | (0.11 | )% | | | 0.11 | % | | | (0.18 | )% | | | 0.06 | % | | | 0.49 | % |
| Portfolio turnover rate | | | 95.76 | %(g) | | | 243.76 | %(d) | | | 78.83 | %(d) | | | 293.36 | %(d) | | | 529.41 | % | | | 624.45 | % |
| (a) | Calculated using the average shares method. |
| (b) | Does not include expenses of the investment companies in which the Fund invests. |
| (c) | Includes interest expense of less than 0.005% for the fiscal years ended May 31, 2020. |
| (d) | Excludes securities received or delivered in-kind. |
| (e) | Unaudited |
| (f) | Annualized |
| (g) | Not annualized |
See Notes to Financial Statements
Adaptive ETFs
Notes to Financial Statements (unaudited)
As of November 30, 2024
| 1. | Organization and Significant Accounting Policies |
The Adaptive ETFs (the “ETFs”) are series of the Starboard Investment Trust (“Trust”). The Trust is organized as a Delaware statutory trust and is registered under the Investment Company Act of 1940, as amended (the “1940 Act”), as an open-end management investment company. Each ETF is a separate, diversified series of the Trust.
The Adaptive Alpha Opportunities ETF seeks to achieve its investment objective of capital appreciation by investing primarily in exchange-traded funds that are registered under the Investment Company Act of 1940 (the “1940 Act”) and not affiliated with the ETF that invest in equity securities of any market capitalization of issuers from a number of countries throughout the world, including emerging market countries.
The Adaptive Hedged Multi-Asset Income ETF seeks to achieve its investment objective of total return by investing in other investment companies, including mutual funds and ETFs that are registered under the 1940 Act and not affiliated with the ETF, or by making direct investments.
The RH Tactical Outlook ETF seeks to achieve its investment objective of total return by investing in ETFs that are registered under the 1940 Act and not affiliated with the ETF.
The RH Tactical Rotation ETF seeks to achieve its investment objective of capital appreciation by investing in ETFs that are registered under the 1940 Act and not affiliated with the ETF.
The Trust will issue and redeem shares at Net Asset Value (“NAV”) only in a large, specified number of shares called a “Creation Unit” or multiples thereof. A Creation Unit consists of 10,000 shares. Creation Unit transactions are typically conducted in exchange for the deposit or delivery of in-kind securities and/or cash. As a practical matter, only authorized participants may purchase or redeem these Creation Units. Except when aggregated in Creation Units, the shares are not redeemable securities of the ETFs. The prices at which creations and redemptions occur are based on the next calculation of NAV after an order is received in proper form by Capital Investment Group, Inc. (the “Distributor”). Individual shares of the ETFs may only be purchased and sold in secondary market transactions through brokers. Shares of the ETFs are listed for trading on NYSE Arca under the trading symbols of each ETF listed in the table below, and because shares will trade at market prices rather than NAV, shares of the ETFs may trade at a price greater than or less than NAV.
| ETF Name | Trading Symbol (Ticker) |
| Adaptive Alpha Opportunities ETF | AGOX |
| Adaptive Hedged Multi-Asset Income ETF | AMAX |
| RH Tactical Outlook ETF | RHTX |
| RH Tactical Rotation ETF | RHRX |
Transaction Fees
The consideration for the purchase of Creation Units of the ETFs generally consists of the in-kind deposit of a designated portfolio of securities and a specified amount of cash. The ETFs may be offered in Creation Units solely or partially for cash in U.S. dollars. Investors purchasing and redeeming Creation Units may pay a purchase transaction fee and a redemption transaction fee directly to Clear Street LLC, one of the ETFs’ custodians, to offset transfer and other transaction costs associated with the issuance and redemption of Creation Units, including Creation Units for cash. Investors transacting in Creation Units for cash may also pay an additional variable charge to compensate the relevant fund for certain transaction costs (i.e., stamp taxes, taxes on currency or other financial transactions, and brokerage costs) and market impact expenses relating to investing in portfolio securities.
Collateral
When the ETFs are awaiting settlements on in-kind transactions, they may receive collateral consisting of cash or cash equivalents, or securities issued or guaranteed by the U.S. Government or one of its agencies or instrumentalities, or any combination thereof. Nevertheless, the ETFs risk a delay in the recovery of the collateral, or even the loss of rights in the collateral deposited by the borrower if the borrower should fail financially. In addition, there is a possibility that the in-kind transaction will not settle in the usual manner and cause unintended market exposure and additional trade and other expenses to the ETFs. As well, any investments made with the collateral received are subject to the risks associated with such investments. If such investments lose value, the ETFs will have to cover the loss when repaying the collateral.
The following is a summary of significant accounting policies consistently followed by the ETF. The policies are in conformity with accounting principles generally accepted in the United States of America (“GAAP”). The ETF follows the accounting and reporting guidance in the Financial Accounting Standards Board (“FASB”) Accounting Standards Codification 946 “Financial Services – Investment Companies.”
Adaptive ETFs
Notes to Financial Statements (unaudited)
As of November 30, 2024
The Date of Initial Public Investment for each ETF:
| ETF | |
| Adaptive Alpha Opportunities ETF | September 20, 2012 |
| Adaptive Hedged Multi-Asset Income ETF | October 2, 2009 |
| RH Tactical Outlook ETF | September 20, 2012 |
| RH Tactical Rotation ETF | September 20, 2012 |
The following is a summary of significant accounting policies consistently followed by the ETFs. The policies are in conformity with accounting principles generally accepted in the United States of America (“GAAP”). The ETFs follow the accounting and reporting guidance in the Financial Accounting Standards Board (“FASB”) Accounting Standards Codification 946 “Financial Services – Investment Companies.”
Investment Valuation
Each ETF’s securities and investments are carried at fair value. Equity securities listed on an exchange or quoted on a national market system are valued at the last quoted sales price provided by a third-party pricing service at the time the valuation is made (generally 4:00 p.m. Eastern Time), or, if there are no sales, at the mean of the most recent bid and asked prices. Price information on listed securities is taken from the exchange where the security is primarily traded by the ETFs. Equity securities traded in the over-the-counter markets are generally valued at the NASDAQ Official Closing Price at the close of regular trading or the exchange on the day the security is valued or, if there are no sales, at the mean of the most recent bid and asked prices. Fixed income securities are valued at market value. Market value generally means a valuation (i) obtained from an exchange, a pricing service, or a major market maker (or dealer), (ii) based on a price quotation or other equivalent indication of value supplied by an exchange, a pricing service, or a major market maker (or dealer), or (iii) based on amortized cost. Instruments with maturities of 60 days or less are valued at amortized cost, which approximates market value. Unlisted securities for which market quotations are readily available are valued at the latest quoted sales price, if available, at the time of valuation, otherwise, at the latest quoted bid price. Options are valued at the mean of the last quoted bid and ask prices provided by a third-party pricing service from the primary exchange or the board of trade on which such options are traded. Foreign securities listed on foreign exchanges are valued with quotations from the primary market in which they are traded and are translated from the local currency into U.S. dollars using current exchange rates. Securities and assets for which representative market quotations are not readily available (e.g., if the exchange on which the portfolio security is principally traded closes early or if trading of the particular portfolio security is halted during the day and does not resume prior to each ETF’s net asset value calculation) or which cannot be accurately valued using each ETF’s normal pricing procedures are valued at fair value as determined in good faith under policies approved by the Board of Trustees (the “Trustees”). A portfolio security’s “fair value” price may differ from the price next available for that portfolio security using each ETF’s normal pricing procedures.
Underlying Funds
Open-End Funds - Open-end funds value securities in their portfolios for which market quotations are readily available at their market values (generally the last reported sale price) and all other securities and assets at their fair value to the methods established by the boards of directors of the open-end funds. Open-end funds are valued at their respective net asset values as reported by such investment companies.
Fair Value Measurement
Each ETF has adopted ASC Topic 820, Fair Value Measurements. ASC Topic 820 defines fair value, establishes a framework for measuring fair value and expands disclosure about fair value measurements.
Various inputs are used in determining the value of each ETF's investments. These inputs are summarized in the three broad levels listed below:
| Level 1: | Unadjusted quoted prices in active markets for identical securities assets or liabilities that the funds have the ability to access. |
| Level 2: | Observable inputs other than quoted prices included in Level 1 that are observable for the asset or liability, either directly or indirectly. These inputs may include quoted prices for the identical instrument on an inactive market, prices for similar instruments, interest rates, credit spreads, yield curves, and market-collaborated input. |
| Level 3: | Unobservable inputs for the asset or liability to the extent that observable inputs are not available, representing the assumptions that a market participant would use in valuing the asset or liability at the measurement date; they would be based on the best information available, which may include the funds’ own data. |
The availability of observable inputs can vary from security to security and is affected by a wide variety of factors, including, for example, the type of security, whether the security is new and not yet established in the marketplace, the liquidity of markets, and other characteristics particular to the security. To the extent that valuation is based on models or inputs that are less observable or unobservable in the market, the determination of fair value requires more judgment. Accordingly, the degree of judgment exercised in determining fair value is greatest for instruments categorized in Level 3.
Adaptive ETFs
Notes to Financial Statements (unaudited)
As of November 30, 2024
The inputs used to measure fair value may fall into different levels of the fair value hierarchy. In such cases, for disclosure purposes, the level in the fair value hierarchy within which the fair value measurement falls in its entirety, is determined based on the lowest level input that is significant to the fair value measurement in its entirety.
The inputs or methodology used for valuing securities are not necessarily an indication of the risk associated with investing in those securities. The following tables summarize the inputs as of November 30, 2024, for each ETF’s investments measured at fair value:
| Adaptive Alpha Opportunities ETF | | | | | | | | | | | | | | | | |
| | | | Total | | | | Level 1 | | | | Level 2 | | | | Level 3 | |
| Assets | | | | | | | | | | | | | | | | |
| Common Stocks* | | $ | 160,871,242 | | | $ | 160,871,242 | | | $ | — | | | $ | — | |
| Exchange-Traded Products* | | | 156,992,314 | | | | 156,992,314 | | | | — | | | | — | |
| Options Purchased | | | 42,808,304 | | | | — | | | | 42,808,304 | | | | — | |
| Short-Term Investment | | | 9,815,284 | | | | 9,815,284 | | | | — | | | | — | |
| Total Assets | | $ | 370,487,144 | | | $ | 327,678,840 | | | $ | 42,808,304 | | | $ | — | |
| Liabilities | | | | | | | | | | | | | | | | |
| Options Written | | $ | (38,795,744 | ) | | $ | — | | | $ | (38,795,744 | ) | | $ | — | |
| Total Liabilities | | $ | (38,795,744 | ) | | $ | — | | | $ | (38,795,744 | ) | | $ | — | |
| | | | | | | | | | | | | | | | | |
| Adaptive Hedged Multi-Asset Income ETF | | | | | | | | | | | | | | | | |
| | | | Total | | | | Level 1 | | | | Level 2 | | | | Level 3 | |
| Assets | | | | | | | | | | | | | | | | |
| Exchange-Traded Products* | | $ | 11,323,691 | | | $ | 11,323,691 | | | $ | — | | | $ | — | |
| Options Purchased | | | 55,311 | | | | — | | | | 55,311 | | | | — | |
| Collateralized Mortgage Obligations | | | 412,524 | | | | — | | | | 412,524 | | | | — | |
| Short-Term Investment | | | 143,511 | | | | 143,511 | | | | — | | | | — | |
| Total Assets | | $ | 11,935,037 | | | $ | 11,467,202 | | | $ | 467,835 | | | $ | — | |
| | | | | | | | | | | | | | | | | |
| RH Tactical Outlook ETF | | | | | | | | | | | | | | | | |
| Assets | | | Total | | | | Level 1 | | | | Level 2 | | | | Level 3 | |
| Exchange-Traded Products* | | $ | 9,290,219 | | | $ | 9,290,219 | | | $ | — | | | $ | — | |
| Total Assets | | $ | 9,290,219 | | | $ | 9,290,219 | | | $ | — | | | $ | — | |
| | | | | | | | | | | | | | | | | |
| RH Tactical Rotation ETF | | | | | | | | | | | | | | | | |
| | | | Total | | | | Level 1 | | | | Level 2 | | | | Level 3 | |
| Assets | | | | | | | | | | | | | | | | |
| Exchange-Traded Products* | | $ | 16,313,354 | | | $ | 16,313,354 | | | $ | — | | | $ | — | |
| Options Purchased | | | 78,356 | | | | — | | | | 78,356 | | | | — | |
| Total Assets | | $ | 16,391,710 | | | $ | 16,313,354 | | | $ | 78,356 | | | $ | — | |
| | | | | | | | | | | | | | | | | |
*Refer to the Schedules of Investments for a breakdown by sector.
Purchased Options
When the ETFs purchase an option, an amount equal to the premium paid by the ETFs is recorded as an investment and is subsequently adjusted to the current value of the option purchased. If an option expires on the stipulated expiration date or if the ETFs enter into a closing sale transaction, a gain or loss is realized. If a call option is exercised, the cost of the security acquired is increased by the premium paid for the call. If a put option is exercised, a gain or loss is realized from the sale of the underlying security, and the proceeds from such sale are decreased by the premium originally paid. Purchased options are non-income producing securities.
Written Options
When the ETFs write an option, an amount equal to the premium received by the ETFs is recorded as a liability and is subsequently adjusted to the current fair value of the option written. Premiums received from writing options that expire unexercised are treated by the ETFs on the expiration date as realized gains from options written. The difference between the premium and the amount paid on effecting a closing purchase transaction, including brokerage commissions, is also treated as a realized gain or loss (depending on if the premium is less than the amount paid for the closing purchase transaction). If a call option is exercised, the premium is added to the proceeds from the sale of the underlying security in determining whether the ETFs have realized a gain or loss. If a put option is exercised, the premium reduces the cost basis of the securities purchased by the ETFs. The ETFs, as the writer of an option, bears the market risk of an unfavorable change in the price of the security underlying the written option. Written options are non-income producing securities.
Adaptive ETFs
Notes to Financial Statements (unaudited)
As of November 30, 2024
Derivative Financial Instruments
The ETFs may invest in derivative financial instruments (derivatives) in order to manage risk or gain exposure to various other investments or markets. During the fiscal period ended November 30, 2024, ETFs used put and call options for hedging and income purposes. Derivatives may contain various risks including the potential inability of the counterparty to fulfill their obligations under the terms of the contract, the potential for an illiquid secondary market, and the potential for market movements which may expose the ETFs to gains or losses in excess of the amounts shown on each ETF’s Statement of Assets and Liabilities.
Derivatives are marked to market daily based upon quotations from market makers or the ETFs’ independent pricing services and the ETFs’ net benefit or obligation under the contract, as measured by the fair market value of the contract, is included in Investments, at value on the Statement of Assets and Liabilities for options purchased. Net realized gains and losses and net change in unrealized appreciation and depreciation on these contracts for the year are included in the Realized and Unrealized Gain on Investments on each ETF’s Statement of Operations for options purchased.
The following table sets forth the effect of the derivative instruments on the Statement of Assets and Liabilities as of November 30, 2024:
| ETF | Derivative Type | Location | Value |
| Adaptive Alpha Opportunities ETF | Purchased options - Equity risk | Assets - Investments, at value | $ | 42,808,304 |
| | Written options - Equity risk | Liabilities - Options written, at value | (38,795,744) |
| | | | |
| Adaptive Hedged Multi-Asset Income ETF | Purchased options - Equity risk | Assets - Investments, at value | 55,311 |
| | Written options - Equity risk | Liabilities - Options written, at value | — |
| | | | |
| RH Tactical Rotation ETF | Purchased options - Equity risk | Assets - Investments, at value | 78,356 |
| | Written options - Equity risk | Liabilities - Options written, at value | — |
The following tables set forth the effect of derivative instruments on the Statements of Operations for the period ended November 30, 2024, for the ETFs as follows:
| Adaptive Alpha Opportunities ETF |
| Derivative Type | Location | Gains/
(Losses) |
| Purchased Equity Options | Net realized gain (loss) from investment transactions | $ | (97,087,216) |
| Purchased Equity Options | Net change in unrealized appreciation (depreciation) on investments | (14,450,635) |
| Written Equity Options | Net realized gain (loss) from options written | 45,677,738 |
| Written Equity Options | Net change in unrealized appreciation (depreciation) on options written | 18,381,308 |
| Adaptive Hedged Multi-Asset Income ETF |
| Derivative Type | Location | Gains/
(Losses) |
| Purchased Equity Options | Net realized gain (loss) from investment transactions | $ | (50,024) |
| Purchased Equity Options | Net change in unrealized appreciation (depreciation) on investments | (315,663) |
| Written Equity Options | Net realized gain (loss) from options written | 550,674 |
| Written Equity Options | Net change in unrealized appreciation (depreciation) on options written | 49,201 |
| RH Tactical Rotation ETF |
| Derivative Type | Location | Gains/
(Losses) |
| Purchased Equity Options | Net realized gain (loss) from investment transactions | $ | (56,366) |
| Purchased Equity Options | Net change in unrealized appreciation (depreciation) on investments | 60,700 |
| Written Equity Options | Net realized gain (loss) from options written | 27,546 |
| Written Equity Options | Net change in unrealized appreciation (depreciation) on options written | 31,168 |
Adaptive ETFs
Notes to Financial Statements (unaudited)
As of November 30, 2024
The following table represents the average notional values on options, which serve as an indicator of volume for options during the period ended November 30, 2024:
| ETF | Derivative Type | Type | Average Notional |
| Adaptive Alpha Opportunities ETF | Purchased options – Equity risk | Premiums Paid | $ | 1,021,048,000 |
| | Written options – Equity risk | Premiums Received | (1,635,250,250) |
| Adaptive Hedged Multi-Asset Income ETF | Purchased options – Equity risk | Premiums Paid | 7,927,000 |
| | Written options – Equity risk | Premiums Received | — |
| RH Tactical Rotation ETF | Purchased options – Equity risk | Premiums Paid | 10,867,000 |
| | Written options – Equity risk | Premiums Received | (622,409) |
Investment Transactions and Investment Income
Investment transactions are accounted for as of the date purchased or sold (trade date). Dividend income is recorded on the ex-dividend date. Certain dividends from foreign securities will be recorded as soon as an ETF is informed of the dividend if such information is obtained subsequent to the ex-dividend date. Interest income is recorded on the accrual basis and includes accretion and amortization of discounts and premiums. Gains and losses are determined on the identified cost basis, which is the same basis used for federal income tax purposes.
Expenses
Each ETF bears expenses incurred specifically on its behalf as well as a portion of general expenses, which are allocated according to methods reviewed annually by the Trustees.
Distributions
The ETFs may declare and distribute dividends from net investment income (if any) monthly. Distributions from capital gains (if any) are generally declared and distributed annually. Dividends and distributions to shareholders are recorded on ex-date.
Estimates
The preparation of financial statements in conformity with GAAP requires management to make estimates and assumptions that affect the reported amounts of assets and liabilities and disclosure of contingent assets and liabilities at the date of the financial statements and the reported amounts of increases and decreases in the net assets from operations during the reporting period. Actual results could differ from those estimates.
Federal Income Taxes
No provision for income taxes is included in the accompanying financial statements, as each ETF intends to distribute to shareholders all taxable investment income and realized gains and otherwise continue to comply with Subchapter M of the Internal Revenue Code applicable to regulated investment companies.
| 2. | Transactions with Related Parties and Service Providers |
Advisor
Each ETF pays a monthly advisory fee to Cavalier Investments, LLC d/b/a Adaptive Investments (the “Advisor”), based upon the average daily net assets and calculated at an annual rate.
See the table below for the advisory fee rates and amounts earned by the Advisor from each ETF during period ended November 30, 2024:
| ETF | | Advisory
Fee Rate | | | Amount
Earned | | | Amount
Waived by
Advisor | | | Expenses
Reimbursed by
Advisor | |
| Adaptive Alpha Opportunities ETF | | | 1.00 | % | | $ | 1,522,486 | | | $ | — | | | $ | — | |
| Adaptive Hedged Multi-Asset Income ETF | | | 0.80 | % | | | 79,294 | | | | 75,645 | | | | 4,593 | |
| RH Tactical Outlook ETF | | | 1.00 | % | | | 47,771 | | | | 47,771 | | | | 18,929 | |
| RH Tactical Rotation ETF | | | 1.00 | % | | | 80,173 | | | | 69,829 | | | | 40 | |
| (a) | Waivers and expense reimbursements are not subject to recoupment. |
The Advisor engaged a sub-advisor to provide day to day portfolio management for some of the ETFs throughout the period. The sub-advisor is paid directly by the Advisor based upon the average daily net assets and calculated at an annual rate. See the table below for the sub-advisory fee rates and amount paid by the Advisor to the Sub-Advisor for the sub-advised ETF during the period ended November 30, 2024:
| ETF | Sub-Advisor | Sub-Advisory Fee Rate | Sub-Advisory
Fee Received |
| Adaptive Alpha Opportunities ETF | Bluestone Capital Management LLC | 0.15% (on AUM $20M-$40M); and 0.30% (on AUM over $40M) | $413,731 |
Adaptive ETFs
Notes to Financial Statements (unaudited)
As of November 30, 2024
Expense Limitation
The Advisor has entered into a contractual agreement (the “Expense Limitation Agreement”) with the Trust, on behalf of the ETFs, under which it has agreed to waive or reduce its fees and to assume other expenses of the ETFs, if necessary, in amounts that limit the ETFs’ total operating expenses (exclusive of (i) any front-end or contingent deferred loads; (ii) brokerage fees and commissions; (iii) acquired fund fees and expenses; (iv) fees and expenses associated with investments in other collective investment vehicles or derivative instruments (including, for example, option and swap fees and expenses); (v) borrowing costs (such as interest and dividend expense on securities sold short); (vi) taxes and (vii) extraordinary expenses, such as litigation expenses (which may include indemnification of ETF officers and Trustees and contractual indemnification of ETF service providers (other than the Advisor)) to not more than the following percentages of the average daily net assets of each ETF.
| ETF | Expenses Limitation |
| Adaptive Alpha Opportunities ETF | 1.25% |
| Adaptive Hedged Multi-Asset Income ETF | 1.15% |
| RH Tactical Outlook ETF | 1.40% |
| RH Tactical Rotation ETF | 1.25% |
These fee waivers and expense reimbursements are subject to possible recoupment from the ETFs in future years (within the three years from the date the fees had been waived or reimbursed), if such recoupment can be achieved within the lesser of the foregoing expense limit or those in place at the time of recoupment.
Administrator
The ETFs pays customary fees to The Nottingham Company (the “Administrator”) for its services as Fund Administrator and Fund Accountant. Certain officers of the Administrator are also officers of the Trust.
Compliance Services
The Nottingham Company, Inc. serves as the Trust’s compliance services provider including services as the Trust’s Chief Compliance Officer. The Nottingham Company, Inc. is entitled to receive customary fees from the ETFs for its services pursuant to the Compliance Services Agreement with the ETFs.
Transfer Agent
Nottingham Shareholder Services, LLC (“Transfer Agent”), an affiliate of the Administrator, serves as transfer, dividend paying, and shareholder servicing agent for the ETFs. For its services, the Transfer Agent is entitled to receive compensation from the ETFs pursuant to the Transfer Agent’s fee arrangements with the ETFs.
Distributor
Capital Investment Group, Inc. (the “Distributor”) serves as the ETFs’ principal underwriter and distributor. For its services, the Distributor is entitled to receive compensation from the ETFs pursuant to the ETFs’ fee arrangements with the Distributor.
The Trust is governed by the Board of Trustees, which is responsible for the management and supervision of the ETFs. The Trustees meet periodically throughout the year to review contractual agreements with companies that furnish services to the ETFs; review performance of the Advisor and the ETFs; and oversee activities of the ETFs. Officers of the Trust and Trustees who are interested persons of the Trust or the Advisor will receive no salary or fees from the Trust. Each Trustee who is not an “interested person” of the Trust or the Advisor within the meaning of the Investment Company Act of 1940, as amended (the “Independent Trustees”) will receive $2,400 per series of the Trust per year plus $400 for each quarterly meeting, $200 for each Committee meeting held outside of the quarterly Board meetings, and $1,000 per special meeting. The Trust reimburses each Independent Trustee and officer of the Trust for their travel and other expenses related to attendance of Board meetings. Additional fees were incurred during the period as special meetings were necessary in addition to the regularly scheduled meetings of the Board of Trustees.
Certain officers of the Trust may also be officers of the Administrator.
Adaptive ETFs
Notes to Financial Statements (unaudited)
As of November 30, 2024
| 4. | Purchases and Sales of Investment Securities |
For the fiscal period November 30, 2024, the aggregate cost of purchases and proceeds from sales of investment securities (excluding short-term securities) were as follows:
| ETF | | Purchases of
Securities | | | Proceeds from
Sales of Securities | | | In-Kind Purchases | | | In-Kind
Sales | |
| Adaptive Alpha Opportunities ETF | | $ | 956,351,235 | | | $ | 994,886,701 | | | $ | 27,582,461 | | | $ | 4,087,069 | |
| Adaptive Hedged Multi-Asset Income ETF | | | 55,914,632 | | | | 65,917,177 | | | | 864,436 | | | | 163,901 | |
| RH Tactical Outlook ETF | | | — | | | | — | | | | — | | | | 1,442,217 | |
| RH Tactical Rotation ETF | | | 15,398,755 | | | | 16,029,428 | | | | 1,405,401 | | | | 697,188 | |
There were no long-term purchases or sales of U.S. Government Obligations during the fiscal period ended November 30, 2024.
Distributions are determined in accordance with Federal income tax regulations, which may differ from GAAP, and, therefore, may differ significantly in amount or character from net investment income and realized gains for financial reporting purposes. Financial reporting records are adjusted for permanent book/tax differences to reflect tax character but are not adjusted for temporary differences.
Management has reviewed all taxable years/periods that are open for examination (i.e., not barred by the applicable statute of limitations) by taxing authorities of all major jurisdictions, including the Internal Revenue Service. As of November 30, 2023, open taxable years consisted of the taxable years ended May 31, 2021, through May 31, 2024, and as of and during the fiscal period ended November 30, 2024. No examination of tax returns is currently in progress for any of the ETFs.
| | | Adaptive Alpha
Opportunities
ETF | | | Adaptive
Hedged Multi-
Asset Income
ETF | | | RH Tactical
Outlook ETF | | | RH Tactical
Rotation ETF | |
| Cost of Investments | | $ | 332,196,957 | | | $ | 11,783,717 | | | $ | 7,002,422 | | | $ | 13,624,992 | |
| | | | | | | | | | | | | | | | | |
| Gross Unrealized Appreciation | | | 85,351,459 | | | | 1,435,421 | | | | — | | | | 3,102,912 | |
| Gross Unrealized Depreciation | | | (28,509,141 | ) | | | (460,885 | ) | | | 2,287,798 | | | | (336,194 | ) |
| Net Unrealized Appreciation (Depreciation) | | | 56,842,318 | | | | 974,536 | | | | 2,287,798 | | | | 2,766,718 | |
Investments in the ETFs are subject to the following risks:
| | Adaptive Alpha
Opportunities ETF | Adaptive Hedged
Multi-Asset
Income ETF | RH Tactical
Outlook ETF | RH Tactical Rotation ETF |
| Asset-Backed Securities Investment | | X | | |
| Authorized Participant | X | X | X | X |
| Cash and Cash Equivalents | X | X | X | X |
| Commodities | | X | X | |
| Common Stock | X | | X | X |
| Control of Portfolio Funds | X | X | X | X |
| Convertible Securities | | X | | X |
| Corporate Debt Securities | | X | | |
| Counterparty Credit | X | X | X | X |
Adaptive ETFs
Notes to Financial Statements (unaudited)
As of November 30, 2024
| | Adaptive Alpha
Opportunities ETF | Adaptive Hedged
Multi-Asset
Income ETF | RH Tactical
Outlook ETF | RH Tactical Rotation ETF |
| Credit | | X | | |
| Cybersecurity | X | X | X | X |
| Early Close/Trading Halt | X | X | X | X |
| Equity Securities | X | | X | X |
| ETF Investing | X | X | X | X |
| ETF Structure | X | X | X | X |
| ETN | | X | | X |
| Fixed Income | X | X | X | |
| Foreign Securities and Emerging Markets | X | X | X | |
| Fund Investing | X | X | X | X |
| Hedging | | X | | |
| High-Yield | | X | | |
| Inflation | | X | | |
| Interest Rate | | X | | |
| Inverse ETF Risk | X | X | X | |
| Investment Risk | X | X | X | |
| Investment Advisor | X | X | X | X |
| Large-Cap Securities | X | | X | X |
| Leveraged and Inverse ETFs | | X | | X |
| LIBOR | | X | | |
| Liquidity | | X | | |
| Managed Volatility | X | X | X | X |
| Management | X | X | X | X |
| Market | X | X | X | X |
| Mortgage-Backed Securities | | X | | |
| Portfolio Turnover | X | | X | X |
| Preferred Equity | | X | | X |
| Quantitative | X | X | | X |
Adaptive ETFs
Notes to Financial Statements (unaudited)
As of November 30, 2024
| | Adaptive Alpha
Opportunities ETF | Adaptive Hedged
Multi-Asset
Income ETF | RH Tactical
Outlook ETF | RH Tactical Rotation ETF |
| Rating Agencies | | X | | |
| REIT | | X | X | |
| Risks from Purchasing Options | X | X | X | X |
| Risks from Selling or Writing Options | X | X | X | X |
| Subsidiary Risk | | X | | |
| Small-Cap and Mid-Cap Securities | X | | X | X |
| Tax | | X | | |
| U.S. Government Securities | | X | | |
Asset-Backed Securities Investment Risk. Asset-backed investments tend to increase in value less than other debt securities when interest rates decline but are subject to similar risk of decline in market value during periods of rising interest rates. In a period of declining interest rates, the Fund may be required to reinvest more frequent prepayments on asset-backed investments in lower-yielding investments. Asset-backed securities in the Fund invests may have underlying assets. There is a risk that borrowers may default on their obligations in respect of those underlying obligations. Certain assets underlying asset-backed securities are subject to prepayment, which may reduce the overall return to asset-backed security holders. Holders also may experience delays in payment or losses on the securities if the full amounts due on underlying sales contracts or receivables are not realized because of unanticipated legal or administrative costs of enforcing the contracts or because of depreciation or damage to the collateral securing certain contracts, or other factors. The value of asset-backed securities may be substantially dependent on the servicing of the underlying asset pools and are therefore subject to risks associated with the negligence or malfeasance by their servicers and to the credit risk of their servicers. The impairment of the value of collateral or other assets underlying an asset-backed security, such as a result of non-payment of loans or non-performance of other collateral or underlying assets, may result in a reduction in the value of such asset-backed securities and losses to the Fund. It is possible that many or all asset-backed securities will fall out of favor at any time or over time with investors, affecting adversely the values and liquidity of the securities.
Authorized Participant Risk. Only an Authorized Participant may engage in creation or redemption transactions directly with the Fund. The Fund has a limited number of institutions that may act as Authorized Participants on an agency basis (i.e., on behalf of other market participants). Authorized Participant concentration risk may be heightened for exchange-traded funds (ETFs), such as the Fund, that invest in securities issued by non-U.S. issuers or other securities or instruments that have lower trading volumes.
Cash and Cash Equivalents Risk. At any time, the Fund may have significant investments in cash or cash equivalents. When a substantial portion of a portfolio is held in cash or cash equivalents, there is the risk that the value of the cash account, including interest, will not keep pace with inflation, thus reducing purchasing power over time.
Commodities Risk. The Fund and Portfolio Funds may have exposure to the commodities markets, subjecting the Fund to risks not associated with investments in traditional securities. The value of commodities related investments may be affected by changes in overall market movements, commodity index volatility, changes in interest rates, or factors affecting a particular industry or commodity, including drought, floods, weather, livestock disease, embargoes, and tariffs. The prices of industrial metals, precious metals, agriculture, and livestock commodities may fluctuate widely due to changes in value, supply and demand, and governmental regulatory policies.
Common Stock Risk. Investments by the Fund and Portfolio Funds in shares of common stock may fluctuate in value response to many factors, including the activities of the individual issuers whose securities the Fund or Portfolio Fund owns, general market and economic conditions, interest rates, and specific industry changes. Such price fluctuations subject the Fund to potential losses. In addition, regardless of any one company’s particular prospects, a declining stock market may produce a decline in prices for all equity securities, which could also result in losses for the Fund. Market declines may continue for an indefinite period of time, and investors should understand that during temporary or extended bear markets, the value of common stocks will decline.
Adaptive ETFs
Notes to Financial Statements (unaudited)
As of November 30, 2024
Control of Portfolio Funds Risk. The Portfolio Funds each have their own unique investment objective, strategies, and risks. There is no guarantee that the Portfolio Funds will achieve their investment objectives and the Fund has exposure to the investment risks of the Portfolio Funds in direct proportion to the allocation of assets among the funds. The investment policies of the Portfolio Funds may differ from the Fund’s policies.
Although the Fund and the Advisor will evaluate regularly each Portfolio Fund to determine whether its investment program is consistent with the Fund’s investment objective, the Advisor will not have any control over the investments made by a Portfolio Fund. Even though each Portfolio Fund is subject to certain constraints, the investment advisor of each Portfolio Fund may change aspects of its investment strategies at any time. The Advisor will not have the ability to control or otherwise influence the composition of the investment portfolio of a Portfolio Fund.
Convertible Securities Risk. Convertible securities are fixed income securities that the Fund or a Portfolio Fund has the option to exchange for equity securities at a specified conversion price. The option allows the Fund or Portfolio Fund to realize additional returns if the market price of the equity securities exceeds the conversion price. For example, the Portfolio Fund may hold fixed income securities that are convertible into shares of common stock at a conversion price of $10 per share. If the market value of the shares of common stock reached $12, the Portfolio Fund could realize an additional $2 per share by converting its fixed income securities. Convertible securities have lower yields than comparable fixed income securities. In addition, at the time a convertible security is issued the conversion price exceeds the market value of the underlying equity securities. Thus, convertible securities may provide lower returns than non-convertible fixed income securities or equity securities depending upon changes in the price of the underlying equity securities. However, convertible securities permit the Fund or Portfolio Fund to realize some of the potential appreciation of the underlying equity securities with less risk of losing its initial investment.
Corporate Debt Securities Risk. The Fund and Portfolio Funds may invest in corporate debt securities. Corporate debt securities are fixed income securities issued by businesses. Notes, bonds, debentures, and commercial paper are the most prevalent types of corporate debt securities. The credit risks of corporate debt securities vary widely among issuers. In addition, the credit risk of an issuer’s debt security may vary based on its priority for repayment. Higher ranking (senior) debt securities have a higher priority than lower ranking (subordinated) securities. This means that the issuer might not make payments on subordinated securities while continuing to make payments on senior securities. In addition, in the event of bankruptcy, holders of senior securities may receive amounts otherwise payable to the holders of subordinated securities. Some subordinated securities, like trust preferred and capital securities notes, also permit the issuer to defer payments under certain circumstances. Insurance companies issue securities known as surplus notes that permit the insurance company to defer any payment that would reduce its capital below regulatory requirements.
Counterparty Credit Risk. The stability and liquidity of many derivative transactions depends in large part on the creditworthiness of the parties to the transactions. If a counterparty to such a transaction defaults, exercising contractual rights may involve delays or costs for the Fund. Furthermore, there is a risk that a counterparty could become the subject of insolvency proceedings, and that the recovery of securities and other assets from such counterparty will be delayed or be of a value less than the value of the securities or assets originally entrusted to such counterparty.
Credit Risk. Credit risk refers to the risk that an issuer or counterparty will fail to pay its obligations to the Fund when they are due. As a result, the Fund’s income might be reduced, the value of the Fund’s investment might fall, and/or the Fund could lose the entire amount of its investment. Changes in the financial condition of an issuer or counterparty, changes in specific economic, social, or political conditions that affect a particular type of security or other instrument or an issuer, and changes in economic, social, or political conditions generally can increase the risk of default by an issuer or counterparty, which can affect a security’s or other instrument’s credit quality or value and an issuer’s or counterparty’s ability to pay interest and principal when due. The values of lower-quality debt securities (commonly known as “junk bonds”) tend to be particularly sensitive to these changes.
Cybersecurity Risk. As part of its business, the Advisor processes, stores, and transmits large amounts of electronic information, including information relating to the transactions of the Fund. The Advisor and the Fund are therefore susceptible to cybersecurity risk. Cyber-attacks include, among other behaviors, stealing or corrupting data maintained online or digitally, denial of service attacks on websites, the unauthorized release of confidential information, and causing operational disruption. Successful cyber-attacks against, or security breakdowns of, the Fund or its advisor, custodians, fund accountant, fund administrator, transfer agent, pricing vendors, and/or other third-party service providers may adversely impact the Fund and its shareholders. For instance, cyber-attacks may interfere with the processing of shareholder transactions, impact the Fund’s ability to calculate its NAV, cause the release of private shareholder information or confidential Fund information, impede trading, cause reputational damage, and subject the Fund to regulatory fines, penalties or financial losses, reimbursement or other compensation costs, and/or additional compliance costs. The Fund also may incur substantial costs for cybersecurity risk management in order to guard against any cyber incidents in the future. The Fund and its shareholders could be negatively impacted as a result.
Adaptive ETFs
Notes to Financial Statements (unaudited)
As of November 30, 2024
Early Close/Trading Halt Risk. An exchange or market may close or issue trading halts on specific securities, or the ability to buy or sell certain securities or financial instruments may be restricted, which may prevent the Fund from buying or selling certain securities or financial instruments. In these circumstances, the Fund may be unable to rebalance its portfolio, may be unable to accurately price its investments and may incur substantial trading losses.
Equity Securities Risk. Investments by the Portfolio Funds in equity securities may fluctuate in value response to many factors, including the activities of the individual issuers whose securities the Portfolio Fund owns, general market and economic conditions, interest rates, and specific industry changes. Such price fluctuations subject the Fund to potential losses. During temporary or extended bear markets, the value of equity securities will decline, which could also result in losses for the Fund.
ETF Investing Risk. An investment in an ETF is an investment in another investment company and therefore the Fund’s shareholders will indirectly bear its proportionate share of any fees and expenses of the ETFs in which the Fund invests in addition to the Fund’s own fees and expenses. As a result, the cost of investing will be higher than the cost of investing directly in the ETFs and may be higher than mutual funds that invest directly in stocks and bonds. ETFs are subject to the following risks: (i) the market price of an ETF’s shares may trade above or below its NAV; (ii) an active trading market for an ETF’s shares may not develop or be maintained; (iii) trading of an underlying ETF’s shares may be halted if the listing exchange’s officials deem such action appropriate, the shares are delisted from the exchange, or the activation of market wide “circuit breakers” (which are tied to large decreases in stock prices) halts stock trading generally; or (iv) the ETF may fail to achieve close correlation with the index that it tracks due to a variety of factors, such as rounding of prices and changes to the index and/or regulatory policies, resulting in the deviation of the ETF’s returns from that of its corresponding index. Some ETFs may be thinly traded, and the resulting higher costs associated with respect to purchasing and selling the ETFs in the Fund’s portfolio will be borne by the Fund.
ETF Structure Risks. The Fund is structured as an ETF and as a result is subject to the special risks, including:
| ○ | Not Individually Redeemable. Shares are not individually redeemable and may be redeemed by the Fund at NAV only in large blocks known as “Creation Units.” You may incur brokerage costs purchasing enough Shares to constitute a Creation Unit. |
| ○ | Trading Issues. An active trading market for the Shares may not be developed or maintained. Trading in Shares on the Exchange may be halted due to market conditions or for reasons that, in the view of the Exchange, make trading in Shares inadvisable, such as extraordinary market volatility. There can be no assurance that Shares will continue to meet the listing requirements of the Exchange. If the Shares are traded outside a collateralized settlement system, the number of financial institutions that can act as authorized participants that can post collateral on an agency basis is limited, which may limit the market for the Shares. Any absence of an active trading market. In turn, lead to a heightened risk of a difference between the market price of the Shares and the value of the Shares, which would be reflected in a wider bid-ask spread. |
| ○ | Cash purchases. To the extent Creation Units are purchased by APs in cash instead of in-kind, the Fund will incur certain costs such as brokerage expenses and taxable gains and losses. These costs could be imposed on the Fund and impact the NAV if not fully offset by transaction fees paid by the APs. |
| ○ | Market Price Variance Risk. The market prices of Shares will fluctuate in response to changes in NAV and supply and demand for Shares and will include a “bid-ask spread” charged by the exchange specialists, market makers or other participants that trade the particular security. A bid-ask spread is the difference between the price quoted in the market for an immediate sale (bid) and an immediate purchase (ask) of the ETF’s shares. There may be times when the market price and the NAV vary significantly. This means that Shares may trade at a discount to NAV, and the bid-ask spread could widen. |
| ▪ | In times of market stress, market makers may step away from their role market making in shares of ETFs and in executing trades, which can lead to differences between the market value of Shares and the NAV, and the bid-ask spread could widen. |
| ▪ | To the extent authorized participants exit the business or are unable to process creations or redemptions and no other AP can step in to do so, there may be a significantly reduced trading market in the Shares, which can lead to differences between the market value of Shares and the NAV, and the bid-ask spread could widen. |
| ▪ | The market price for the Shares may deviate from the NAV, particularly during times of market stress, with the result that investors may pay significantly more or receive significantly less for Shares than the NAV, which is reflected in the bid and ask price for Shares or in the closing price. |
Adaptive ETFs
Notes to Financial Statements (unaudited)
As of November 30, 2024
| ▪ | When all or a portion of an ETFs underlying securities trade in a market that is closed when the market for the Shares is open, there may be changes from the last quote of the closed market and the quote from the Fund’s domestic trading day, which could lead to differences between the market value of the Shares and the NAV, and the bid-ask spread could widen. |
| ▪ | In stressed market conditions, the market for the Shares may become less liquid in response to the deteriorating liquidity of the Fund’s portfolio. This adverse effect on the liquidity of the Shares may, in turn, lead to differences between the market value of the Shares and the NAV, and the bid-ask spread could widen. |
ETN Risk. Similar to ETFs, owning an ETN generally reflects the risks of owning the assets that comprise the underlying market benchmark or strategy that the ETN is designed to reflect. ETNs also are subject to issuer and fixed-income risk. ETN holders are exposed to an issuer’s credit risk, which does not affect ETF holders. ETNs are senior unsecured obligations of the issuer. The repayment of the principal and any applicable return at maturity or upon repurchase by the issuer are dependent on that issuer's ability to pay.
Fixed Income Risk. Fixed income risk factors include credit risk (the debtor may default) and prepayment risk (the debtor may pay its obligation early or later than expected, potentially reducing the amount of interest payments or extending time to principal repayment). These risks could affect the value of a particular investment possibly causing the Fund's share price and total return to be reduced and fluctuate more than other types of investments. When the Fund invests in fixed income securities the value of your investment in the Fund will fluctuate with changes in interest rates. Typically, a rise in interest rates causes a decline in the value of fixed income securities. In general, the market price of debt securities with longer maturities will increase or decrease more in response to changes in interest rates than shorter-term securities. If the U.S. Federal Reserve’s Federal Open Market Committee (“FOMC”) raises the federal funds interest rate target, interest rates across the U.S. financial system may rise. However, the magnitude of rate changes across maturities and borrower sectors is uncertain. Rising rates may decrease liquidity and increase volatility, which may make portfolio management more difficult and costly to the Fund and its shareholders. Additionally, default risk increases if issuers must borrow at higher rates. Generally, these changing market conditions may cause the Fund’s share price to fluctuate or decline more than other types of equity investments.
Foreign Securities and Emerging Markets Risk. Foreign securities have investment risks different from those associated with domestic securities. Changes in foreign economies and political climates are more likely to affect the Fund or a Portfolio Fund with significant investments in foreign securities than another fund that invests exclusively in domestic securities. The value of foreign currency denominated securities or foreign currency contracts is affected by the value of the local currency relative to the U.S. dollar. There may be less government supervision of foreign markets, resulting in non-uniform accounting practices and less publicly available information about issuers of foreign securities. The value of foreign investments may be affected by changes in exchange control regulations, application of foreign tax laws (including withholding tax), changes in governmental economic or monetary policy (in this country or abroad) or changed circumstances in dealings between nations. In addition, foreign brokerage commissions, custody fees, and other costs of investing in foreign securities are often higher than in the United States. Investments in foreign issues could be affected by other factors not present in the United States, including expropriation, armed conflict, confiscatory taxation, and potential difficulties in enforcing contractual obligations.
The Fund and Portfolio Funds may also invest in emerging markets, which are markets of countries in the initial stages of industrialization and have low per capital income. In addition to the risks of foreign securities in general, countries in emerging markets are more volatile and can have relatively unstable governments, social and legal systems that do not protect shareholders, economies based on only a few industries, there may be greater market manipulation, and securities markets that trade a small number of issues which could reduce liquidity. There is also less publicly available information on emerging market companies due to differences in regulation, accounting, auditing, and financial recordkeeping requirements, and the information available may be unreliable or outdated.
Fund Investing Risk. Investments in other investment companies subject the Fund to additional operating and management fees and expenses. Investors in the Fund will indirectly bear fees and expenses charged by the funds in which the Fund invests, in addition to the Fund’s direct fees and expenses. As a result, the cost of investing in the Fund will be higher than the cost of investing directly in the Portfolio Funds and also may be higher than other funds that invest directly in securities. The Fund’s performance depends in part upon the performance of the investment advisor to each Portfolio Fund, the strategies and instruments used by the Portfolio Funds, and the Advisor's ability to select Portfolio Funds and effectively allocate fund assets among them. Furthermore, the use of a fund of funds structure could affect the timing, amount, and character of distributions and therefore may increase the amount of taxes payable by you.
Hedging Risk. Techniques used by Advisor to hedge the Fund’s investments carry the risks that such techniques may not protect against market declines. The techniques may also limit the Fund’s participation in market gains. Further, such techniques may increase portfolio transaction costs, which could result in losses or reduced gains. They also may not be successful as the techniques are subject to the Advisor’s ability to correctly analyze and implement the hedging techniques in a timely manner.
Adaptive ETFs
Notes to Financial Statements (unaudited)
As of November 30, 2024
High-Yield Risk. The Fund and Portfolio Funds may invest in junk bonds, including bonds of issuers in default, and other fixed income securities that are rated below investment grade. Securities in this rating category are speculative and are usually issued by companies without long track records of sales and earnings, or by those companies with questionable credit strength. Credit risk is greater for junk bonds, particularly for bonds of issuers in default, than for investment grade bonds, which is the risk that issuers will not make payments on fixed income securities held by the Fund, resulting in losses to the Fund. Changes in economic conditions or other circumstances may have a greater effect on the ability of issuers of these securities to make principal and interest payments than they do on issuers of higher-grade securities. The retail secondary market for junk bonds may be less liquid than that of higher-rated securities and adverse conditions could make it difficult at times to sell certain securities or could result in lower prices. Additionally, these instruments are unsecured and may be subordinated to other creditor’s claims.
Inflation Risk. Fixed income securities held by the Fund and Portfolio Funds are subject to inflation risk. Because inflation reduces the purchasing power of income produced by existing fixed income securities, the prices at which fixed income securities trade will be reduced to compensate for the fact that the income they produce is worth less. This potential decrease in market value of fixed income securities would result in a loss in the value of the Fund’s portfolio.
Interest Rate Risk. Interest rates may rise resulting in a decrease in the value of the fixed income securities held by the Fund and Portfolio Funds or may fall resulting in an increase in the value of such securities. Fixed income securities with longer maturities involve greater risk than those with shorter maturities.
Inverse ETF Risk. Investing in inverse ETFs may result in increased volatility due to the inverse ETF’s possible use of short sales of securities and derivatives such as options and futures. The use of leverage by an ETF increases risk to the Fund. The more a fund invests in leveraged instruments, the more the leverage will magnify any gains or losses on those investments. During periods of increased volatility, inverse ETFs may not perform in the manner they are designed.
Investment Risk. The value of the Fund’s investments, like other market investments, may move up or down, sometimes rapidly and unpredictably. All investments involve risks, including the risk that the entire amount invested may be lost. No guarantee or representation is made that the Fund’s investment objectives will be achieved.
Various sectors of the global financial markets have been experiencing an extended period of adverse conditions. Market uncertainty has increased dramatically, particularly in the United States and Europe, and adverse market conditions have expanded to other markets. These conditions have resulted in disruption of markets, periods of reduced liquidity, greater volatility, general volatility of spreads, an acute contraction in the availability of credit and a lack of price transparency. These volatile and often difficult global market conditions have episodically adversely affected the market values of many securities, and this volatility may continue, and conditions could even deteriorate further. Some of the largest banks and companies across many sectors of the economy in the United States and Europe have declared bankruptcy, entered into insolvency, administration or similar proceedings, been nationalized by government authorities, and/or agreed to merge with or be acquired by other banks or companies that had been considered their peers. The long-term impact of these events is uncertain but could continue to have a material effect on general economic conditions, consumer and business confidence, and market liquidity.
Major public health issues, such as COVID-19, have at times, and may in the future impact the Fund. The COVID-19 pandemic caused substantial market volatility and global business disruption and impacted the global economy in significant and unforeseen ways. Any public health emergency, including the COVID-19 pandemic or any outbreak of other existing or new epidemic diseases or the threat thereof, and the resulting financial and economic market uncertainty, could have a material adverse impact on the Fund or its investments. Moreover, changes in interest rates, travel advisories, quarantines and restrictions, disrupted supply chains and industries, impact on labor markets, reduced liquidity or a slowdown in U.S. or global economic conditions resulting from a future public health crisis may also adversely affect the Fund or its investments. COVID-19, or any other health crisis and the current or any resulting financial, economic and capital markets environment, and future developments in these and other areas present uncertainty and risk with respect to the Fund’s NAV, performance, financial condition, results of operations, ability to pay distributions, make share repurchases and portfolio liquidity, among other factors.
Economic problems in a single country are increasingly affecting other markets and economies, and a continuation of this trend could adversely affect global economic conditions and world markets. Uncertainty and volatility in the financial markets and political systems of the U.S. or any other country, including volatility as a result of the ongoing conflicts between Russia and Ukraine and Israel and Hamas and the rapidly evolving measures in response, may have adverse spill-over effects into the global financial markets generally.
Adaptive ETFs
Notes to Financial Statements (unaudited)
As of November 30, 2024
Investment Advisor Risk. The Advisor’s ability to choose suitable investments has a significant impact on the ability of the Fund to achieve its investment objectives.
Large-Cap Securities Risk. Stocks of large companies as a group can fall out of favor with the market, causing the Fund to underperform investments that have a greater focus on mid-cap or small-cap stocks. Larger, more established companies may be slow to respond to challenges and may grow more slowly than smaller companies.
Leveraged and Inverse ETFs. Investing in leveraged ETFs will amplify the Fund’s gains and losses. Most leveraged ETFs “reset” daily. Due to the effect of compounding, their performance over longer periods of time can differ significantly from the performance of their underlying index or benchmark during the same period of time. Investing in inverse ETFs may result in increased volatility due to the funds’ possible use of short sales of securities and derivatives such as options and futures. The use of leverage by an ETF increases risk to the Fund. The more a fund invests in leveraged instruments, the more the leverage will magnify any gains or losses on those investments. During periods of increased volatility, inverse ETFs may not perform in the manner they are designed.
Libor Risk. Certain of the Fund’s or Portfolio Funds’ investments may use a floating rate based on the London Interbank Offered Rate (“LIBOR”), which is the offered rate for short-term Eurodollar deposits between major international banks. As of December 31, 2021, the United Kingdom Financial Conduct Authority (“FCA”) and LIBOR’s administrator, ICE Benchmark Administration, have ceased the publication of all non-U.S. dollar LIBOR and the one-week and two-month U.S. dollar LIBOR rates, but the most widely used U.S. dollar LIBOR settings will continue to be published until June 30, 2023. Further, on March 15, 2022, the Consolidated Appropriations Act of 2022, which includes the Adjustable Interest Rate (LIBOR) Act, was signed into law in the United States. This legislation establishes a uniform benchmark replacement process for financial contracts that mature after June 30, 2023, that do not contain clearly defined or practicable fallback provisions.
The U.S. Federal Reserve, based on the recommendations of the New York Federal Reserve’s Alternative Reference Rate Committee (comprised of major derivative market participants and their regulators), has begun publishing the Secured Overnight Financing Rate (referred to as “SOFR”), which is their preferred alternative rate for U.S. dollar LIBOR. Proposals for alternative reference rates for other currencies have also been announced or have already begun publication. Markets are in the process of developing in response to these new rates. Although financial regulators and industry working groups have suggested alternative reference rates, such as the European Interbank Offer Rate, the Sterling Overnight Interbank Average Rate and SOFR, there has been no global consensus as to an alternative rate and the process for amending existing contracts or instruments to transition away from LIBOR remains incomplete.
The elimination of LIBOR or changes to other reference rates or any other changes or reforms to the determination or supervision of reference rates could have an adverse impact on the market for, or value of, any securities or payments linked to those reference rates, which may adversely affect Fund performance and/or net asset value. Uncertainty and risk also remain regarding the willingness and ability of issuers and lenders to include revised provisions in new and existing contracts or instruments. Consequently, the transition away from LIBOR to other reference rates may lead to increased volatility and illiquidity in markets that are tied to LIBOR, fluctuations in values of LIBOR-related investments or investments in issuers that utilize LIBOR, increased difficulty in borrowing or refinancing and diminished effectiveness of hedging strategies, potentially adversely affecting Fund performance. Furthermore, the risks associated with the expected discontinuation of LIBOR and transition to alternative rates may be exacerbated if the work necessary to effect an orderly transition to an alternative reference rate is not completed in a timely manner.
Liquidity Risk. Liquidity risk exists when particular investments of the Fund would be difficult to purchase or sell, possibly preventing the Fund from selling such illiquid securities at an advantageous time or price, or possibly requiring the Fund to dispose of other investments at unfavorable times or prices in order to satisfy its obligations.
Illiquid investments may be difficult to dispose of at a fair price at the times when the Fund believes it is desirable to do so. The market price of illiquid investments generally is more volatile than that of more liquid investments, which may adversely affect the price that the Fund pays for or recovers upon the sale of such investments. Illiquid investments are also more difficult to value, especially in challenging markets. The Advisor’s judgment may play a greater role in the valuation process. Investment of the Fund’s assets in illiquid securities may restrict the Fund’s ability to take advantage of market opportunities.
Managed Volatility Risk. Techniques used by the Advisor to manage the volatility of the Fund’s investments carry the risks that such techniques may not protect against market declines. The techniques may also limit the Fund’s participation in market gains, particularly during periods where market values are increasing but market volatility is high. Further, such techniques may increase portfolio transaction costs, which could result in losses or reduced gains. They also may not be successful as the techniques are subject to the Advisor’s ability to correctly analyze and implement the volatility management techniques in a timely manner.
Adaptive ETFs
Notes to Financial Statements (unaudited)
As of November 30, 2024
Management Risk. The Fund is subject to management risk because it is an actively managed portfolio. In managing the Fund’s portfolio securities, the Advisor will apply investment techniques and risk analyses in making investment decisions for the Fund, but there can be no guarantee that these will produce the desired results.
Market Risk. Market risk refers to the possibility that the value of securities held by the Fund may decline due to daily fluctuations in the market. Market prices for securities change daily as a result of many factors, including developments affecting the condition of both individual companies and the market in general. The price of a security may even be affected by factors unrelated to the value or condition of its issuer, including changes in interest rates, economic and political conditions, and general market conditions. The Fund’s performance per share will change daily in response to such factors.
Mortgage-Backed Securities Risk. Investments by the Fund in fixed rate and floating rate mortgage-backed securities will entail credit risks (i.e., the risk of non-payment of interest and principal) and market risks (i.e., the risk that interest rates and other factors could cause the value of the instrument to decline). Many issuers or servicers of mortgage-backed securities guarantee timely payment of interest and principal on the securities, whether or not payments are made when due on the underlying mortgages. This kind of guarantee generally increases the quality of a security but does not mean that the security’s market value and yield will not change. The values of mortgage-backed securities may change because of changes in the market’s perception of the credit quality of the assets held by the issuer of the mortgage-backed securities or an entity, if any, providing credit support in respect of the mortgage-backed securities. In addition, an unexpectedly high rate of defaults on the mortgages held by a mortgage pool may limit substantially the pool’s ability to make payments of principal or interest to the Fund as a holder of such securities, reducing the values of those securities or in some cases rendering them worthless. The Fund also may purchase securities that are not guaranteed or subject to any credit support. An investment in a privately issued mortgage-backed security may be less liquid and subject to greater credit risks than an investment in a mortgage-backed security that is issued or otherwise guaranteed by a federal government agency. The liquidity of mortgage-backed securities can change significantly over time. Like bond investments, the value of fixed rate mortgage-backed securities will tend to rise when interest rates fall and fall when rates rise. Floating rate mortgage-backed securities generally tend to have more moderate changes in price when interest rates rise or fall, but their current yield will be affected. In addition, the mortgage-backed securities market in general may be adversely affected by changes in governmental legislation or regulation. Factors that could affect the value of a mortgage-backed security include, among other things, the types and amounts of insurance which an individual mortgage or that specific mortgage-backed security carries, the default and delinquency rate of the mortgage pool, the amount of time the mortgage loan has been outstanding, the loan-to-value ratio of each mortgage, and the amount of overcollateralization or undercollateralization of a mortgage pool.
The residential mortgage market in the United States has experienced difficulties that may adversely affect the performance and market value of certain of the Fund’s mortgage-related investments. Delinquencies and losses on residential mortgage loans generally increased in the last decade and potentially could begin to increase again. Ongoing developments in the residential mortgage market may have additional consequences to the market for mortgage-backed securities.
In addition, the liquidity of mortgage-backed securities varies by type of security; at certain times a Fund may be unable to dispose of such investments at a desirable time or at the value the Fund has placed on the investment. Because mortgage-backed securities may be less liquid than other securities, the Funds may be more susceptible to liquidity risks than funds that invest in other securities. In the past, in stressed markets, certain types of mortgage-backed securities suffered periods of illiquidity if disfavored by the market.
Commercial mortgage-backed securities (“CMBS”) include securities that reflect an interest in, or are secured by, mortgage loans on commercial real property. Many of the risks of investing in commercial mortgage-backed securities reflect the risks of investing in the real estate securing the underlying mortgage loans. These risks reflect the effects of local and other economic U.S. conditions on real estate markets, the ability of tenants to make loan payments, and the ability of a property to attract and retain tenants. Commercial mortgage-backed securities may be less liquid and exhibit greater price volatility than other types of mortgage- or asset-backed securities.
Portfolio Turnover Risk. The Advisor will sell Portfolio Funds and other securities when it is in the best interest of the Fund and its shareholders to do so without regard to the length of time they have been held. As portfolio turnover may involve paying brokerage commissions and other transaction costs, there could be additional expenses for the Fund. High rates of portfolio turnover may also result in the realization of short-term capital gains and losses. Any distributions resulting from such gains will be considered ordinary income for federal income tax purposes.
Preferred Equity Risk. Preferred equity’s right to dividends and liquidation proceeds is junior to the rights of a company’s debt securities. The value of preferred equity may be subject to factors that affect fixed income and equity securities, including changes in interest rates and in a company’s creditworthiness. The value of preferred equity tends to vary more with fluctuations in the underlying common equity and less with fluctuations in interest rates and tends to exhibit greater volatility. Shareholders of preferred equity may suffer a loss of value if dividends are not paid and have limited voting rights.
Adaptive ETFs
Notes to Financial Statements (unaudited)
As of November 30, 2024
Quantitative Risk. Securities or other investments selected using quantitative methods may perform differently from the market as a whole for many reasons, including the factors used in building the quantitative analytical framework, the weights placed on each factor, and changing sources of market returns, among others. There can be no assurance that these methodologies will enable the Fund to achieve its objective.
Rating Agencies Risks. Ratings are not an absolute standard of quality, but rather general indicators that reflect only the view of the originating rating agencies from which an explanation of the significance of such ratings may be obtained. There is no assurance that a particular rating will continue for any given period of time or that any such rating will not be revised downward or withdrawn entirely. Such changes may negatively affect the liquidity or market price of the securities in which the Fund invests. The ratings of securitized assets may not adequately reflect the credit risk of those assets due to their structure.
REIT Risk. Investing in REITs involves certain unique risks in addition to those associated with the real estate sector generally, including poor performance by the REIT’s manager, adverse changes to the tax laws, and the possible failure by the REIT to qualify for the favorable tax treatment available to REITs under the Internal Revenue Code of 1986, as amended, or the exemption from registration under the 1940 Act. REITs are not diversified and are heavily dependent on cash flow. REITs whose underlying properties are concentrated in a particular industry or region are also subject to risks affecting such industries and regions. REITs (especially mortgage REITs) are also subject to interest rate risks. By investing in REITs through the Fund, a shareholder will bear expenses of the REITs in addition to Fund expenses.
Risks from Purchasing Options. If a call or put option purchased by the Fund is not sold when it has remaining value and if the market price of the underlying security, in the case of a call, remains less than or equal to the exercise price, or, in the case of a put, remains equal to or greater than the exercise price, the Fund will lose its entire investment in the option. Since many factors influence the value of an option, including the price of the underlying security, the exercise price, the time to expiration, the interest rate, and the dividend rate of the underlying security, the Advisor’s success in implementing the Fund’s strategy may depend on an ability to predict movements in the prices of individual securities, fluctuations in markets, and movements in interest rates. There is no assurance that a liquid market will exist when the Fund seeks to close out an option position. Where a position in a purchased option is used as a hedge against price movements in a related position, the price of the option may move more or less than the price of the related position.
Risks from Selling or Writing Options. Writing option contracts can result in losses that exceed the Fund’s initial investment and may lead to additional turnover and higher tax liability. The risk involved in writing a call option is that there could be an increase in the market value of the security. If this occurred, the option could be exercised and the underlying security would then be sold by the Fund at a lower price than its current market value or in the case of cash settled options, the Fund would be required to purchase the option at a price that is higher than the original sales price for such option. Similarly, while writing call options can reduce the risk of owning stocks, such a strategy limits the opportunity of the Fund to profit from an increase in the market value of stocks in exchange for up-front cash at the time of selling the call option. The risk involved in writing a put option is that there could be a decrease in the market value of the underlying security. If this occurred, the option could be exercised and the underlying security would then be sold to the Fund at a higher price than its current market value or in the case of cash settled options, the Fund would be required to purchase the option at a price that is higher than the original sales price for such option.
There is no assurance that a liquid market will exist when the Fund seeks to close out an option position. Where a position in a written option is used as a hedge against price movements in a related position, the price of the option may move more or less than the price of the related position.
Subsidiary Risk. By investing in the Subsidiary, the Fund is indirectly exposed to the risks associated with the Subsidiary’s investments. There can be no assurance that the investment objective of the Subsidiary will be achieved. The Subsidiary is not registered under the 1940 Act, and, unless otherwise noted in this Prospectus, is not subject to all the investor protections of the 1940 Act. However, the Fund wholly owns and controls the Subsidiary, and the Fund and its Subsidiary are both managed by the Advisor and sub-advised by the Sub-Advisor, making it unlikely that the Subsidiary will take action contrary to the interests of the Fund and its shareholders. The Board has oversight responsibility for the investment activities of the Fund, including its investment in the Subsidiary, and the Fund’s role as sole shareholder of the Subsidiary. To the extent applicable to the investment activities of the Subsidiary, the Subsidiary will be subject to the same investment restrictions and limitations, and follow the same compliance policies and procedures, as its parent fund. Unlike the Fund, the Subsidiary will not seek to qualify as a regulated investment company under Subchapter M of the Code.
There is a risk that the Internal Revenue Service could assert that the annual net profit realized by the Subsidiary and imputed for income tax purposes to the Fund will not be considered “qualifying income” for purposes of the Fund remaining qualified as a regulated investment company for U.S. federal income tax purposes. Changes in the laws of the United States and/or the Cayman Islands could result in the inability of the Fund and/or its Subsidiary to operate as described in this Prospectus and the SAI and could adversely affect the Fund. For example, the Cayman Islands does not currently impose any income, corporate or capital gains tax, estate duty, inheritance tax, gift tax, or withholding tax on the Subsidiary. If Cayman Islands law changes such that the Subsidiary must pay Cayman Islands taxes, the Fund’s shareholders would likely suffer decreased investment returns.
Adaptive ETFs
Notes to Financial Statements (unaudited)
As of November 30, 2024
Small-Cap and Mid-Cap Securities Risk. The Fund and Portfolio Funds may invest in securities of small-cap and mid-cap companies, which involves greater risk than investing in larger and more established companies. This greater risk is, in part, attributable to the fact that the securities of these companies are usually less marketable and, therefore, more volatile than securities of larger, more established companies or the market in general. Because these companies normally have fewer shares outstanding than larger companies, it may be more difficult to buy or sell significant amounts of such shares without an unfavorable impact on prevailing prices. Another risk factor is that these companies often have limited product lines, markets, or financial resources and may lack management depth. Small-cap and mid-cap companies are typically subject to greater changes in earnings and business prospects than are larger, more established companies. These companies may be more vulnerable than larger companies to adverse business or economic developments, the risk exists that the companies will not succeed, and the prices of the companies’ shares could dramatically decline in value. You should expect that the value of the Shares will be more volatile than a fund that invests exclusively in large-capitalization companies.
Tax Risk. By investing in commodities indirectly through the Subsidiary, the Fund will obtain exposure to the commodities markets within the federal tax requirements that apply to the Fund. However, because the Subsidiary is a controlled foreign corporation, any income received from its investments will be passed through to the Fund as ordinary income, which may be taxed at less favorable rates than capital gains.
U.S. Government Securities Risk. Some U.S. Government securities, such as Treasury bills, notes, and bonds and mortgage-backed securities guaranteed by the Government National Mortgage Association (Ginnie Mae), are supported by the full faith and credit of the United States; others are supported by the right of the issuer to borrow from the U.S. Treasury; others are supported by the discretionary authority of the U.S. Government to purchase the agency’s obligations; still others are supported only by the credit of the issuing agency, instrumentality, or enterprise. Although U.S. Government-sponsored enterprises may be chartered or sponsored by Congress, they are not funded by Congressional appropriations, their securities are not issued by the U.S. Treasury, their obligations are not supported by the full faith and credit of the U.S. Government, and so investments in their securities or obligations issued by them involve greater risk than investments in other types of U.S. Government securities. In addition, certain governmental entities have been subject to regulatory scrutiny regarding their accounting policies and practices and other concerns that may result in legislation, changes in regulatory oversight and/or other consequences that could adversely affect the credit quality, availability or investment character of securities issued or guaranteed by these entities.
7. Beneficial Ownership
The beneficial ownership, either directly or indirectly, of 25% or more of the voting securities of a fund creates a presumption of control of a fund, under Section 2(a)(9) of the Investment Company Act of 1940. As of November 30, 2024, the ETFs had no knowledge of any beneficial owners of 25% of more in any of the ETFs.
8. Concentration of Risk
The RH Tactical Outlook ETF currently invests a significant portion of its assets in the SPDR S&P 500 ETF Trust (“SPY”) and the SPDR Portfolio S&P 400 Mid Cap ETF (“SPMD”). The RH Tactical Outlook ETF may redeem its investment from SPY and SPMD at any time if the Advisor determines that it is in the best interest of the RH Tactical Outlook ETF and its shareholders to do so. The performance of the RH Tactical Outlook ETF may be directly affected by the performance of SPY and/or SPMD. The financial statements of SPY and SPMD, including the portfolio of investments, can be found at www.ssga.com or www.sec.gov, and should be read in conjunction with the RH Tactical Outlook ETF’s financial statements. As of November 30, 2024, the RH Tactical Outlook ETF’s net assets invested in SPY and SPMD were 51.10% and 30.06%, respectively.
The RH Tactical Rotation ETF currently invests a significant portion of its assets in the SPY. The RH Tactical Rotation ETF may redeem its investment from SPY at any time if the Advisor determines that it is in the best interest of the RH Tactical Rotation ETF and its shareholders to do so. The performance of the RH Tactical Rotation ETF may be directly affected by the performance of SPY. The financial statements of SPY, including the portfolio of investments, can be found at www.ssga.com or www.sec.gov, and should be read in conjunction with the RH Tactical Rotation ETF’s financial statements. As of November 30, 2024, the RH Tactical Rotation ETF’s net assets invested in SPDR were 30.90%.
Adaptive ETFs
Notes to Financial Statements (unaudited)
As of November 30, 2024
9. Commitments and Contingencies
Under the Trust’s organizational documents, its officers and Trustees are indemnified against certain liabilities arising out of the performance of their duties to the ETFs. In addition, in the normal course of business, the Trust entered into contracts with its service providers, on behalf of the ETFs, and others that provide for general indemnifications. The ETFs’ maximum exposure under these arrangements is unknown, as this would involve future claims that may be made against the ETFs. The ETFs expect the risk of loss to be remote.
10. Subsequent Events
Distributions
Per share distributions during the subsequent period were as follows:
| ETF | Record date | Ex-Date | Payable Date | Ordinary Income |
| Adaptive Alpha Opportunities ETF | 12/20/24 | 12/20/24 | 12/23/24 | $1.07080 |
| Adaptive Hedged Multi-Asset Income ETF | 12/30/23 | 12/30/23 | 12/31/24 | $0.05250 |
In accordance with GAAP, management has evaluated the need for disclosures and/or adjustments resulting from subsequent events through the date of issuance of these financial statements. Management has concluded there are no additional matters, other than those noted above, requiring recognition or disclosure.
Adaptive ETFs
Additional Information (unaudited)
As of November 30, 2024
Changes In and Disagreements with Accountants
No changes during the period.
Matters Submitted for Shareholder Vote
Not applicable
Remuneration Paid to Directors, Officers and Others
Refer to the information in the financial statements.
Approval of Investment Advisory Agreement
Not applicable for the period
Approval of Investment Sub-Advisory Agreement
Not applicable for the period
The Adaptive ETFs
P.O. Box 69
Rocky Mount, NC 27802-0069
An investor should consider the investment objectives, risks, charges and expenses of the ETFs carefully before investing. The prospectus and summary prospectus, which contain this and other information, are available at http://www.adaptiveetfs.com or by calling 800-773-3863. The prospectus should be read carefully before investing.
| ITEM 8. | Changes in and Disagreements with Accountants for Open-End Management Investment Companies. |
No changes during the period.
| ITEM 9. | Proxy Disclosure For Open-End Management Investment Companies. |
Not applicable.
| ITEM 10. | Remuneration Paid to Directors, Officers, and Others of Open-End Management Investment Companies. |
Included under Item 7 of this Form.
| ITEM 11. | Statement Regarding Basis for Approval of Investment Advisory Contract. |
Included under Item 7 of this Form.
| ITEM 12. | Disclosure of Proxy Voting Policies and Procedures for Closed-End Management Investment Companies. |
Not applicable.
| ITEM 13. | Portfolio Managers of Closed-End Management Investment Companies. |
Not applicable.
| ITEM 14. | Purchases of Equity Securities by Closed-End Management Investment Company and Affiliated Purchasers. |
Not applicable.
| ITEM 15. | Submission of Matters to a Vote of Security Holders. |
None.
| ITEM 16. | Controls and Procedures. |
| (a) | The President and Principal Executive Officer and the Treasurer, Principal Accounting Officer, and Principal Financial Officer have concluded that the registrant’s disclosure controls and procedures (as defined in Rule 30a-3(c) under the Investment Company Act of 1940) are effective based on their evaluation of these disclosure controls and procedures required by Rule 30a-3(b) under the Investment Company Act of 1940 and Rules 13a-15(b) or 15d-15(b) under the Securities Exchange Act of 1934, as of a date within 90 days of the filing of this report. |
| (b) | There were no changes in the registrant’s internal control over financial reporting (as defined in Rule 30a-3(d) under the Investment Company Act of 1940) that occurred during the period covered by this report that have materially affected, or are reasonably likely to materially affect, the registrant’s internal control over financial reporting. |
| ITEM 17. | Disclosure of Securities Lending Activities for Closed-End Management Investment Companies. |
Not applicable.
| ITEM 18. | Recovery of Erroneously Awarded Compensation. |
| (a)(1) | Any code of ethics, or amendment thereto, that is the subject of the disclosure required by Item 2, to the extent that the registrant intends to satisfy the Item 2 requirements through filing of an exhibit. |
Not applicable.
| (a)(2) | Any policy required by the listing standards adopted pursuant to Rule 10D-1 under the Exchange Act by the registered national securities exchange or registered national securities association upon which the registrant’s securities are listed. |
Not applicable.
| (a)(3) | A separate certification for each principal executive and principal financial officer of the registrant as required by Rule 30a-2(a) under the Act. |
Filed herewith.
| (a)(4) | Any written solicitation to purchase securities under Rule 23c-1 under the Act sent or given during the period covered by the report or on behalf of the registrant to 10 or more persons. |
Not applicable.
| (a)(5) | Change in the registrant’s independent public accountant. |
Not applicable.
| (b) | Certifications pursuant to Section 906 of the Sarbanes-Oxley Act of 2002. |
Filed herewith.
SIGNATURES
Pursuant to the requirements of the Securities Exchange Act of 1934 and the Investment Company Act of 1940, the registrant has duly caused this report to be signed on its behalf by the undersigned, thereunto duly authorized.
| | Starboard Investment Trust | |
| | | | |
| | By: | /s/ Katherine M. Honey | |
| | | Katherine M. Honey
President and Principal Executive Officer | |
| | | | |
| | Date: | February 6, 2025 | |
Pursuant to the requirements of the Securities Exchange Act of 1934 and the Investment Company Act of 1940, this report has been signed below by the following persons on behalf of the registrant and in the capacities and on the dates indicated.
| | By: | /s/ Katherine M. Honey | |
| | | Katherine M. Honey
President and Principal Executive Officer | |
| | | | |
| | Date: | February 6, 2025 | |
| | | | |
| | By: | /s/ Peter McCabe | |
| | | Peter McCabe
Treasurer, Principal Accounting Officer, Principal Financial Officer | |
| | | | |
| | Date: | February 6, 2025 | |